Form 8-K COVETRUS, INC. For: Jan 12

J.P. Morgan Healthcare Conference January 12, 2022 Presenters: Ben Wolin, President and CEO Matthew Foulston, EVP and CFO
2 Safe harbor provision and non-GAAP reconciliation Forward-Looking Statements This presentation contains certain statements that are forward-looking within the meaning of Section 27A of the Securities Act of 1933, as amended, and Section 21E of the Securities Exchange Act of 1934, as amended. We may, in some cases use terms such as "predicts," "believes," "potential," "continue," "anticipates," "estimates," "expects," "plans," "intends," "may," "could," "might," "likely," "will," "should," or other words that convey uncertainty of the future events or outcomes to identify these forward-looking statements. Such statements are subject to numerous risks and uncertainties, and actual results could differ materially from those anticipated due to a number of factors including, but not limited to, the effect of health epidemics, including the COVID-19 pandemic, on our business and the success of any measures we have taken or may take in the future in response thereto, including vaccine mandates which may be required in certain jurisdictions where we operate and increased turnover rates and absenteeism of our labor force resulting from those mandates which may impact our ability to continue operations at our distribution centers and pharmacies; the ability to successfully integrate acquisitions, operations and employees; the ability to continue to execute on our strategic plan; the ability to attract and retain key personnel; the ability to achieve performance targets, including managing our growth effectively; the ability to manage relationships with our supplier and distributor network, including negotiating acceptable pricing and other terms with these partners; the ability to attract and retain customers in a price sensitive environment; the ability to maintain quality standards in our technology product offerings as well as associated customer service interactions to minimize loss of existing Customers and attract new Customers; access to financial markets along with changes in interest rates and foreign currency exchange rates; changes in the legislative landscape in which we operate, including potential corporate tax reform, and our ability to adapt to those changes as well as adaptation by the third-parties we are dependent upon for supply and distribution; the impact of litigation; the impact of accounting pronouncements, seasonality of our business, leases, expenses, interest expense, and debt; sufficiency of cash and access to liquidity; cybersecurity risks, including risk associated with our dependence on third party service providers as a large portion of our workforce is working from home; and those additional risks discussed under the heading "Risk Factors" in our Annual Report on Form 10-K filed on March 1, 2021, our Quarterly Report on Form 10-Q filed on November 4, 2021, and in our other SEC filings. Our forward-looking statements are based on current beliefs and expectations of our management team and, except as required by law, we undertake no obligations to make any revisions to the forward-looking statements contained in this presentation or to update them to reflect events or circumstances occurring after the date of this presentation, whether as a result of new information, future developments or otherwise. Investors are cautioned not to place undue reliance on these forward-looking statements. Non-GAAP Reconciliation This presentation contains non-GAAP financial measures. Management uses these measures in the management of our business and believes that they are useful to investors in evaluating our ongoing operating results and trends. These non-GAAP financial measures have limitations as an analytic tool and should not be considered in isolation or as a substitute for net income or any other measure of financial performance reported in accordance with GAAP. Covetrus’ non-GAAP measures may be calculated differently than similarly named measures reported by other companies. In addition, using non-GAAP measures may have limited value as they exclude certain items that may have a material impact on reported financial results and cash flows. Reconciliation of these non-GAAP measures to the most comparable GAAP measures are included in the Appendix to this presentation. When analyzing Covetrus' performance, it is important to evaluate each adjustment in the reconciliation tables and use adjusted measures in addition to, and not as an alternative to, GAAP measures. This presentation also contains certain forward-looking non-GAAP financial measures. We have not reconciled our non-GAAP adjusted EBITDA guidance to GAAP net income because the reconciling items between such GAAP and non-GAAP financial measures, including share-based compensation expense, separation program costs, foreign exchange and other special items tied to the formation of Covetrus, cannot be reasonably predicted due to the uncertainty and inherent difficulty predicting the occurrence, the financial impact, and the periods in which the non-GAAP adjustments may be recognized and therefore is not available without unreasonable effort. We have not reconciled our non-GAAP organic net sales growth guidance because the extent to which certain items would be expected to impact GAAP measures but would not impact non-GAAP measures cannot be predicted with a reasonable degree of certainty, including the effect of acquisitions, divestitures, and the foreign exchange fluctuations, and accordingly the reconciliation is not available without unreasonable efforts. The information needed to reconcile these metrics could have a material impact on the related projections. For more information regarding the non-GAAP financial measures discussed in this presentation please see the Appendix.
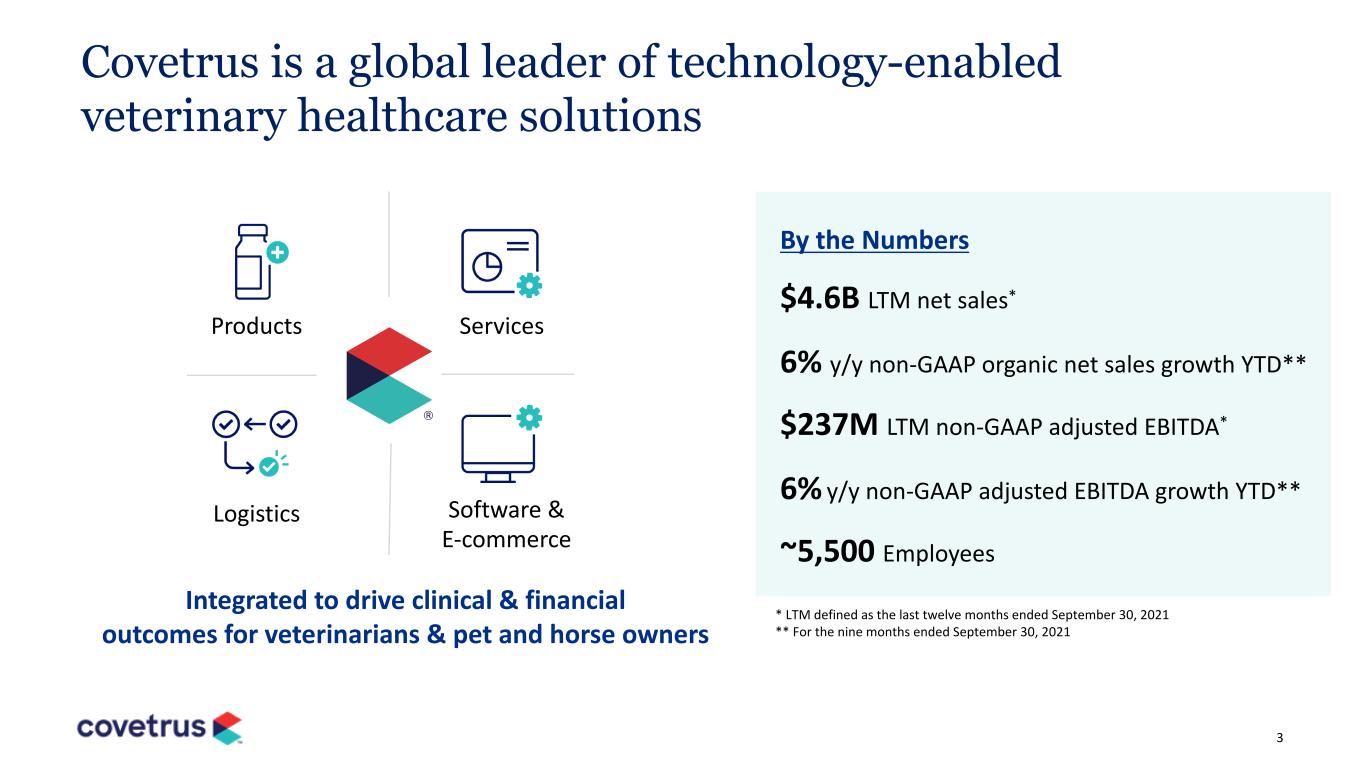
3 Covetrus is a global leader of technology-enabled veterinary healthcare solutions By the Numbers Products Logistics Software & E-commerce Services Integrated to drive clinical & financial outcomes for veterinarians & pet and horse owners $4.6B LTM net sales* 6% y/y non-GAAP organic net sales growth YTD** $237M LTM non-GAAP adjusted EBITDA* 6% y/y non-GAAP adjusted EBITDA growth YTD** ~5,500 Employees * LTM defined as the last twelve months ended September 30, 2021 ** For the nine months ended September 30, 2021

4 Our companion animal end-market is attractive, poised for continued growth A $150B+ global animal health industry with mid-single digit growth* Global economic development and increasing pet ownership The ongoing “humanization” of pets, further enhanced by COVID-19 Customers and manufacturers leveraging insights and technologies to accelerate demand *Analyst estimates; includes both companion animal and production animal and is not indicative of the total available market to Covetrus

5 Our unique set of services helps veterinarians deliver better health and business outcomes Membership Organizations Software & E-commerce Wellness / Care Plans Proprietary Brands Logistics & In-Clinic Supply Prescription ManagementVeterinarian

6 Our global veterinary footprint is unrivaled ~$450M in LTM net sales* 9% y/y non-GAAP organic net sales growth YTD** ~$2.7B in LTM net sales* 15% y/y non-GAAP organic net sales growth YTD** North America APAC & Emerging Markets * LTM defined as the last twelve months ended September 30, 2021 ** For the nine months ended September 30, 2021 Europe ~$1.5B in LTM net sales* (7)% y/y non-GAAP organic net sales growth YTD or 9% y/y growth ex-the U.K. and Germany**

7 Our scale and leadership position enables us to be a strong, effective partner across the industry… Veterinarians • Holistic operating system to eliminate work and create better outcomes • Aligned incentive model • Complete product portfolio to meet in clinic and online needs Pet and Horse Owners • Software and services to strengthen bond with Veterinarian • Insights into pet health and Rx needs • Solutions to make managing animal health easier and affordable Manufacturers • Strategic access to veterinary practices and pet owners • Data to drive insights and performance • Omnichannel to generate demand, shift share, and create efficiencies

8 … and our technology strategy sets us apart Empowering veterinarians to strengthen their relationship with consumers and improve clinical & business outcomes Prescription Management Appointment Management & Client Comms PIMS + Payments Care Plans + Consumer ~$750M LTM net sales** ~$90M LTM non-GAAP adjusted EBITDA** By the Numbers* #1 PIMS market share in the U.S., U.K. and ANZ >4.5M unique LTM buyers on Rx Management** >400K pets on VCP wellness / care plans * Technology and e-commerce portfolio includes prescription management, global software services, and SmartPak ** LTM defined as the last twelve months ended September 30, 2021

9 Prescription Management Smart Inventory B2B E-commerce Practice Whiteboard Payment Processing Workforce Management Increased future focus Current offering Practice Management Wellness / Care Plans Diagnostics Integration Appointment Management Client Comms Telemedicine / Tele-triage Actionable Analytics Introducing the industry-first veterinary operating system (vOS) Electronic Medical Records • Covetrus Pulse is a complete cloud solution delivering a seamless, unified user experience • Data and systems’ interoperability improves practice operations efficiency • Future integrations continue to deliver flexibility and control while driving new revenue opportunities and strengthened vet-2-pet relationship • Additional value creation through M&A, including VCP and AppointMaster

10 Strategic priorities for 2022 Optimizing our integrated value proposition to deliver above market net sales growth Consumer marketing and technology on behalf of veterinarians Profitable European growth and the restructuring of U.K. and Germany businesses New products and dedicated leadership to drive proprietary brand strategy Significant operating leverage in the business as corporate costs level off Significant acceleration in software net sales growth and 20+% net sales growth in Rx management
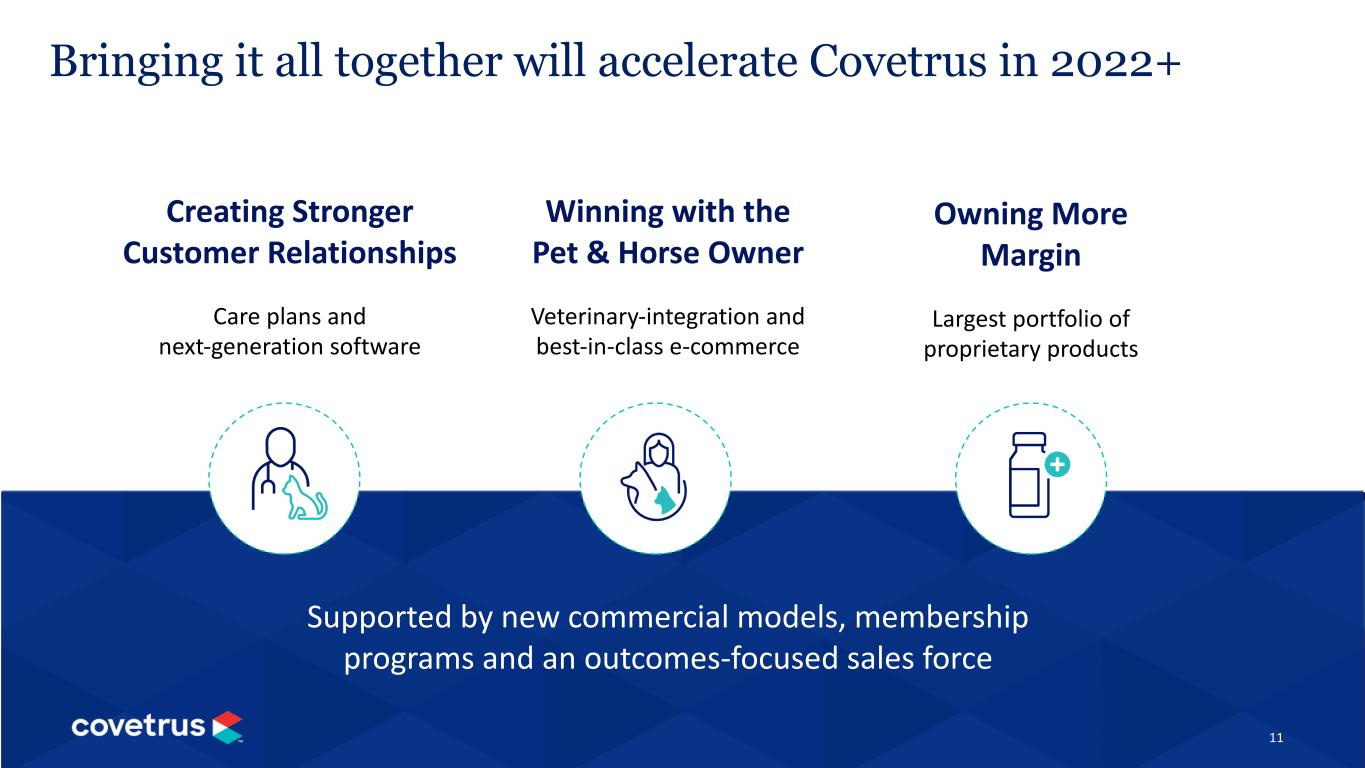
11 Bringing it all together will accelerate Covetrus in 2022+ Winning with the Pet & Horse Owner Veterinary-integration and best-in-class e-commerce Creating Stronger Customer Relationships Care plans and next-generation software Supported by new commercial models, membership programs and an outcomes-focused sales force Owning More Margin Largest portfolio of proprietary products

Financial Overview

1322 Healthy growth in Segment net sales and adjusted EBITDA For the Nine Months Ended September 30, 2021 Net Sales Non-GAAP Adjusted EBITDA Non-GAAP Adjusted EBITDA Margin Actual ($ in Millions) Y/Y Non-GAAP Organic Growth (Percentage) Actual ($ in Millions) Year-over-Year (Percentage) Actual (Percentage) Year-over-Year (Basis Points) North America $2,045 15% $166 18% 8.1% 10 bps Europe $1,080 (7)% $57 8% 5.3% 80 bps APAC & Emerging Markets $342 9% $29 45% 8.5% 160 bps Segment Highlights for the Nine Months Ended September 30, 2021: • North America: strong growth and contribution from prescription management and above market growth in distribution • Europe: double digit growth in proprietary brands offset by previously disclosed challenges in the U.K. and Germany • APAC & Emerging Markets: continued strong net sales growth and gross margin expansion

14 Continued positive shift towards our higher margin businesses Increasing gross profit dollar contribution tied to technology, e-commerce and proprietary products and services* * Technology, e-commerce and proprietary products and services includes prescription management, software services, SmartPak and Covetrus-branded products and proprietary brands (Kruuse, Vi, and Calibra). Distribution of Third-Party Products includes global distribution of third-party products. ** Excluding scil animal care contribution, which was divested on April 1, 2020. $ in millions $351 $367 $235 $279 $0 $100 $200 $300 $400 $500 $600 $700 Nine Months Ended September 30, 2020** Nine Months Ended September 30, 2021 Gross Profit from Technology, E-Commerce and Proprietary Products and Services Gross Profit from Distribution of Third-Party Products $646 18.7% GM 43% of total 57% of total 39% of total 43% of total 31% of total 29% of total 29% of total $586 18.4% GM 60% of total 40% of total 19% y/y, +300 bps • 40 bps of y/y gross margin expansion through the nine months ended September 30, 2021 - Driven by double-digit growth in technology, e-commerce and proprietary products and services • 25% prescription management y/y net sales growth or 27% excluding accounting change • Further progress in increasing penetration of Covetrus-branded and proprietary products - This collection of assets now represents 24% of net sales and 43% of gross profit (+300 bps y/y) • Opportunity for technology, e-commerce and proprietary products and services to be >50% of Covetrus gross profit over the next 24 months

15 ($7) $1 $23 ($10) $0 $10 $20 $30 $40 $50 2018 2019 2020 2021E North America Prescription Management delivered another year of healthy growth in 2021 Prescription Management year-end practices on the platform Prescription Management y/y net sales growth Prescription Management non-GAAP adjusted EBITDA $ in millions * y/y growth excluding accounting change normalizes for our change in corporate policy in 2021 related to how we recognize and report certain manufacturer incentives which are now included as a reduction to cost of goods sold ** 2018 information is standalone Vets First Choice prior to the formation of Covetrus and 2019 data is pro forma to reflect a full year contribution of Vets First Choice * 0 2,000 4,000 6,000 8,000 10,000 12,000 14,000 2018 2019 2020 2021E ~11,100 ~11,800 ~7,500 ~10,200 >$40 Prescription Management net sales $203 $270 $406 >$500 $0 $100 $200 $300 $400 $500 $600 2018 2019 2020 2021E $ in millions 33% 19% 24% ~22% 36% 22% 26% ~25% 0% 10% 20% 30% 40% Q1 2021 Q2 2021 Q3 2021 Q4 2021E Y/Y Growth Y/Y Growth Ex-Accounting Change* ** ** ** ** **

1622 Recent corporate actions to enhance our outlook in Europe • Announced new Northern European leadership team • Unified commercial approach to better service our customers in these markets • Implemented certain restructuring activities to drive operational efficiencies in the U.K. and Germany, with expected completion by the end of Q1 2022 • Creating a DACH headquarters in Dusseldorf to concentrate strengths of Germany, Austria and Switzerland-based teams along with the Company’s other Central European locations • Anticipating return to profitable growth in the U.K. and Germany beginning in Q2 2022 - Of note, Germany delivered positive y/y growth in non-GAAP organic net sales in Q4 2021

17 Initial 2022 guidance calls for acceleration in growth Initial 2022 Considerations: Assumes no material incremental COVID-19 impact Tailwinds • Healthy end-market trends • Continued strength in Prescription Management • Restore European growth • Increased focus on proprietary brands • Corporate costs planned flat y/y Headwinds • Higher supply chain costs, including increased shipping / freight expense • Above average wage inflation • T&E reinstatement • Stronger U.S. dollar We are establishing initial 2022 non-GAAP adjusted EBITDA guidance in the range of $270M to $280M, which represents approximately 12% y/y growth at the mid-point vs. anticipated 2021E levels $200 $226 $270 $150 $175 $200 $225 $250 $275 $300 2019A 2020A 2021 Guidance* Initial 2022 Guidance $255 $245 $280 * As issued on November 4, 2021 Expecting to be at or around the low- end of our previous 2021 guidance driven by additional negative impact from the strengthening U.S. dollar and certain supply chain challenges $ in millions

18 Attractive Net Sales Growth • Healthy end-market and share gains • Continued platform engagement and adoption • Omnichannel approach with manufacturers • Consumer growth opportunities Expanding Non- GAAP Adjusted EBITDA Margins • Stable core and mix shift towards higher- margin solutions • Margin expansion in Prescription Management as we continue to scale the business • European restructure and minimal growth in corporate costs Growing Non-GAAP Free Cash Flow • Declining one-time cash outlays in 2022 and growing adjusted EBITDA • Modest increase in 2022 CAPEX given planned innovation and new facilities • 30-40% non-GAAP adjusted EBITDA to non-GAAP FCF conversion long-term Capital Allocation Flexibility • Long-term target of 3.0-3.5x net debt to LTM non-GAAP adjusted EBITDA • Modest near-term debt obligations • Strategic, tuck-in M&A with a primary focus on technology, proprietary products, e-commerce and compounding Drivers of long-term value creation
19 Looking ahead in 2022 and beyond Delivering sustainable growth and value for all stakeholders Committed to above market net sales growth and non-GAAP adjusted EBITDA margin expansion Driving market share gains through our differentiated and integrated value proposition Accelerating investment in technology roadmap to deliver enhanced value to our customers Increasing mix of technology, e-commerce and proprietary products and services Streamlining operations to support future growth

Questions & Answers January 12, 2022
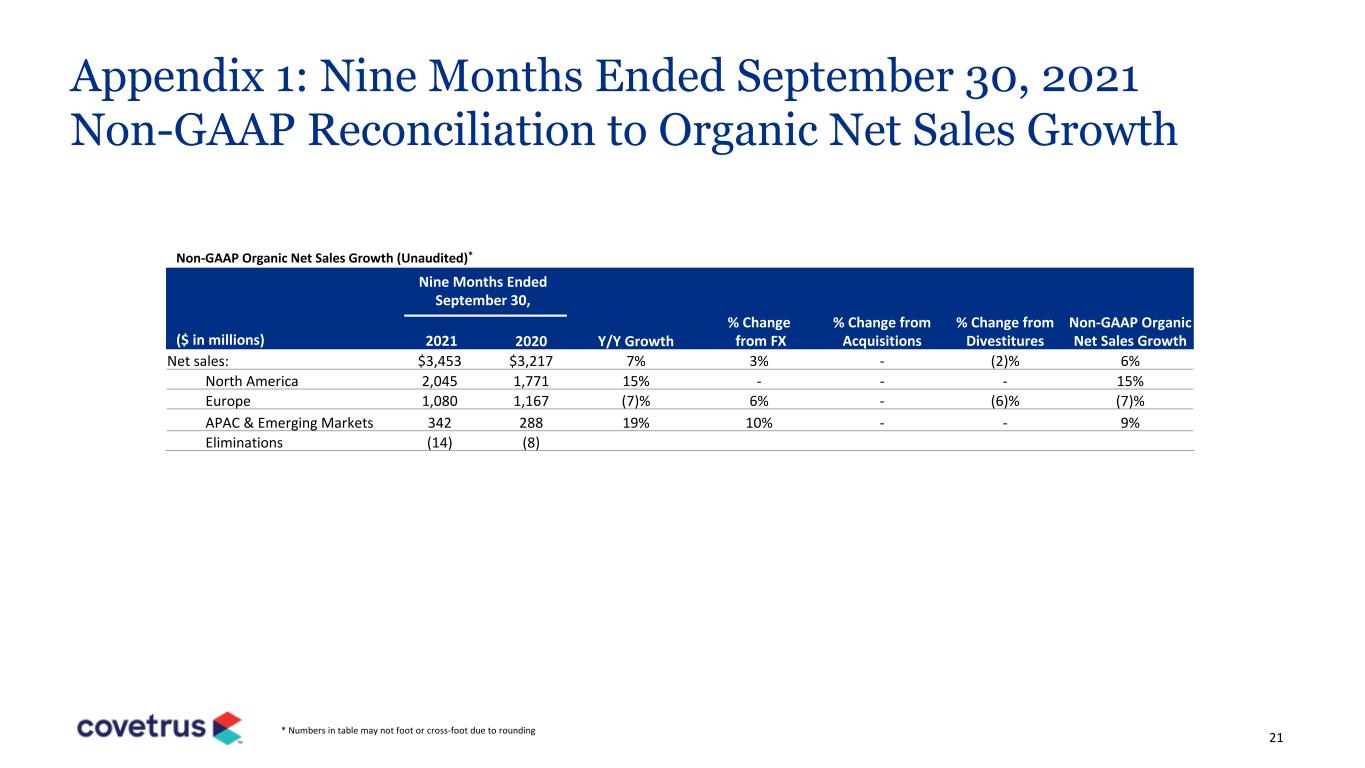
21 Appendix 1: Nine Months Ended September 30, 2021 Non-GAAP Reconciliation to Organic Net Sales Growth * Numbers in table may not foot or cross-foot due to rounding Nine Months Ended September 30, ($ in millions) 2021 2020 Y/Y Growth % Change from FX % Change from Acquisitions % Change from Divestitures Non-GAAP Organic Net Sales Growth Net sales: $3,453 $3,217 7% 3% - (2)% 6% North America 2,045 1,771 15% - - - 15% Europe 1,080 1,167 (7)% 6% - (6)% (7)% APAC & Emerging Markets 342 288 19% 10% - - 9% Eliminations (14) (8) Non-GAAP Organic Net Sales Growth (Unaudited)*

22 ($ in millions) Nine Months Ended September 30, 2021 Net income (loss) attributable to Covetrus, Inc. $(51) Plus: Depreciation and amortization 128 Plus: Interest expense, net 26 Plus: Income tax expense 7 EBITDA $110 Plus: Share-based compensation 39 Plus: Strategic consulting (a) 16 Plus: Transaction costs (b) 3 Plus: Separation programs and executive severance 5 Plus: Formation of Covetrus (c) 2 Plus: Equity method investment and non-consolidated affiliates (d) 2 Plus: Other items, net 4 Non-GAAP Adjusted EBITDA $181 Appendix 2: Nine Months Ended September 30, 2021 Non-GAAP Reconciliation to Adjusted EBITDA * Numbers in table may not foot or cross-foot due to rounding (a) Related to third-party consulting services. Included within this line item are variable performance fees earned for services rendered under a third-party consulting agreement which was amended in April 2021 and in connection with the contract amendment the services were completed and fees were fully accrued for as of June 30, 2021 (b) Includes legal, accounting, tax, and other professional fees incurred in connection with acquisitions and divestitures (c) Includes professional and consulting fees, and other costs incurred in connection with the separation from Former Parent and establishing Covetrus as an independent public company (d) Includes the proportionate share of the adjustments to EBITDA of consolidated and non-consolidated affiliates where Covetrus ownership is less than 100%

23 Appendix 3: Nine Months Ended September 30, 2020 Non-GAAP Reconciliation to Adjusted EBITDA * Numbers in table may not foot or cross-foot due to rounding (a) Includes third-party consulting services (b) Includes legal, accounting, tax, and other professional fees incurred in connection with acquisitions and divestitures (c) Includes professional and consulting fees, duplicative costs associated with transition service agreements, and other costs incurred in connection with the separation from Former Parent and establishing Covetrus as an independent public company (d) Includes the proportionate share of the adjustments to EBITDA of consolidated and non-consolidated affiliates where Covetrus ownership is less than 100% (e) Includes a $7 million of severance and $1 million of other costs (f) Includes a $72 million gain on the divestiture of scil and a $1 million gain on the deconsolidation of SAHS ($ in millions) Nine Months Ended September 30, 2020 Net income attributable to Covetrus, Inc. $(15) Plus: Depreciation and amortization 124 Plus: Interest expense, net 37 Plus: Income tax expense 6 EBITDA $152 Plus: Share-based compensation 30 Plus: Strategic consulting (a) 13 Plus: Transaction costs (b) 8 Plus: Separation programs and executive severance 4 Plus: IT infrastructure 3 Plus: Formation of Covetrus (c) 17 Plus: Capital structure 2 Plus: Equity method and non-consolidated affiliates (d) 1 Plus: Operating lease right-of-use impairment 8 Plus: France managed exit (e) 8 Plus: Other (income) expense items, net (f) (76) Non-GAAP Adjusted EBITDA $170

24 Appendix 4: Non-GAAP Free Cash Flow * Numbers in table may not foot or cross-foot due to rounding Nine Months Ended September 30, ($ in millions) 2021 2020 Net cash provided by (used for) operating activities $58 $11 Less: Purchases of property and equipment (38) (40) Non-GAAP Free Cash Flow $20 $(29)

25 ($ in millions) Twelve Months Ended December 31, 2020 Net income (loss) attributable to Covetrus, Inc. $(19) Plus: Depreciation and amortization 166 Plus: Interest expense, net 47 Plus: Income tax expense (7) EBITDA $187 Plus: Share-based compensation 40 Plus: Strategic consulting 20 Plus: Transaction costs (a) 8 Plus: Separation programs and executive severance 11 Plus: IT infrastructure 4 Plus: Formation of Covetrus (b) 19 Plus: Capital structure 2 Plus: Equity method investment and non-consolidated affiliates (c) 2 Plus: Operating lease right-of-use asset impairment 8 Plus: France managed exit (d) 7 Plus (Less): Other items, net (e) (82) Non-GAAP Adjusted EBITDA $226 Appendix 5: 2020 Non-GAAP reconciliation to adjusted EBITDA * Numbers in table may not foot or cross-foot due to rounding (a) Includes legal, accounting, tax, and other professional fees incurred in connection with acquisitions and divestitures. (b) Includes professional and consulting fees, duplicative costs associated with transition service agreements, and other costs incurred in connection with the separation from Former Parent and establishing Covetrus as an independent public company. (c) Includes the proportionate-share of the adjustments to EBITDA of consolidated and non-consolidated affiliates where Covetrus ownership is less than 100%. (d) Includes $6 million of severance and $1 million of other costs. (e) Includes a pre-tax gain of $73 million from the sale of scil, a $6 million mark-to-market adjustment for our Distrivet options, and a $1 million gain on the deconsolidation of SAHS.

26 Twelve Months Ended December 31, 2019 ($ in millions) Covetrus Vets First Choice (Jan. 1 to Feb. 7) Spin-Off and Other Pro Forma Adjustments Purchase Price and Related Pro Forma Adjustments Pro Forma Covetrus Net income (loss) attributable to Covetrus, Inc. $(980) $(9) $(5) $ (4) $(998) Plus: Depreciation and amortization 155 2 - 9 166 Plus: Interest expense, net 53 1 6 - 60 Plus: Income tax expense (46) - (1) (2) (49) EBITDA (818) (6) - 3 (821) Plus: Share-based compensation 46 - - 3 49 Plus: Strategic consulting 2 - - - 2 Plus: Transaction costs (a) 2 6 - (6) 2 Plus: Formation of Covetrus (b) 31 - - - 31 Plus: Separation programs and executive severance 11 - - - 11 Plus: Carve-out operating expenses 5 - - - 5 Plus: IT infrastructure 6 - - - 6 Plus: Goodwill impairment 938 - - - 938 Plus: Equity method investment and non-consolidated affiliates (c) (4) - - - (4) Plus (Less): Other items, net (d) (19) (2) - - (21) Non-GAAP Adjusted EBITDA $200 $(2) $ - $ - $198 Appendix 6: 2019 Non-GAAP reconciliation to adjusted EBITDA and pro forma adjusted EBITDA * Numbers in table may not foot or cross-foot due to rounding (a) Includes legal, accounting, tax, and other professional fees incurred in connection with acquisitions and divestitures. (b) Includes professional and consulting fees, duplicative costs associated with transition service agreements, and other costs incurred in connection with the separation from Former Parent and establishing Covetrus as an independent public company. (c) Includes the proportionate-share of the adjustments to EBITDA of consolidated and non-consolidated affiliates where Covetrus ownership is less than 100%. (d) Includes $15 million in gains associated with acquisitions in Romania and France, $2 million gain on a legacy investment, and $1 million government grant income

Serious News for Serious Traders! Try StreetInsider.com Premium Free!
You May Also Be Interested In
- NovaBay Pharmaceuticals Receives a NYSE American Notice Regarding Stockholder Equity
- Atlas Salt Inc. Announces Release with Conditions under the Environmental Protection Act for the Great Atlantic Salt Project
- LS Cable & System Welcomes $99 Million Investment Tax Credit Under Section 48C of the Inflation Reduction Act
Create E-mail Alert Related Categories
SEC FilingsSign up for StreetInsider Free!
Receive full access to all new and archived articles, unlimited portfolio tracking, e-mail alerts, custom newswires and RSS feeds - and more!


 Tweet
Tweet Share
Share