

Form 8-K COMMUNITY TRUST BANCORP For: Mar 31
 Tweet
Tweet Share
ShareExhibit 99.1


Directors CTBI DirectorsM. Lynn Parrish, ChairmanMark A. Gooch, Vice ChairmanCharles J. BairdFranklin H.
Farris, Jr.Eugenia “Crit” LuallenIna Michelle MatthewsJames E. McGhee IIFranky MinnifieldAnthony St. CharlesChad C. Street 2 CTB DirectorsMark A. Gooch, ChairmanFranklin H. Farris, Jr.Ina Michelle MatthewsJames E. McGhee IIRichard W. NewsomChad
C. Street CTIC DirectorsMark A. Gooch, ChairmanCharles BairdFranklin H. Farris, Jr.E.B. Lowman IIEugenia “Crit” LuallenJames E. McGhee IIAndy Waters

Executive Officers 3 Mark A. Gooch Vice Chairman, President, and CEORichard W. Newsom CTB PresidentAndy
Waters CTIC President and CEOKevin J. Stumbo EVP/Chief Financial OfficerSteven E. Jameson EVP/Chief Internal Audit and Risk OfficerJames J. Gartner EVP/Chief Credit OfficerJames B. Draughn EVP/OperationsC. Wayne Hancock EVP/Senior Staff
AttorneyLarry W. Jones EVP/Central Region PresidentDavid Tackett EVP/Eastern Region PresidentRicky Sparkman EVP/South Central Region PresidentD. Andrew Jones EVP/Northeastern Region President
Cautionary Statement Information provided herein by CTBI contains “forward-looking” information. CTBI
cautions that any forward-looking statements made are not guarantees of future performance and that actual results may differ materially from those in the forward-looking statements. Please refer to CTBI’s 2021 Annual Report on Form 10-K,
Cautionary Statement Regarding Forward Looking Statements for additional information. 4

2021 Key Metrics Total Assets $5.4 billionMarket Capitalization $778.1 millionCash Dividend Yield 3.67%P/E
Ratio 8.8xPrice to Book Value 1.1xPrice to Tangible Book Value 1.2xTangible Common Equity Ratio 11.82%Competitive Position3rd largest Kentucky domiciled bank holding company 3rd in Kentucky in deposit market share of all Kentucky domiciled FDIC
insured institutions 8th largest bank in Kentucky in terms of deposit market share of all FDIC insured institutions 5 Financial data as of December 31, 2021Deposit market share as of June 30, 2021

Our Banking Franchise Central Region Eastern Region Northeastern RegionLoans - $756 million Loans - $931
million Loans - $394 millionDeposits - $1.2 billion Deposits - $1.8 billion Deposits - $616 million• Danville • Floyd/Knott/Johnson • Advantage Valley• Lexington • Hazard • Ashland• Mt. Sterling • Pikeville • Flemingsburg• Richmond • Tug Valley •
Summersville• Versailles • Whitesburg• WinchesterSouth Central Region Indirect LendingLoans - $705 million Loans - $621 million Deposits - $975 million CTIC• Campbellsville Assets Under Management - $3.6 billion (including $1.5 billion CTB)•
LaFollette Revenues - $17.0 million • Middlesboro • Mt. Vernon • Ashland• Williamsburg • Danville • LaFollette • Lexington • Pikeville Financial data as of December 31, 2021 6

Trust Assets Under Management & Trust Revenue Includes CTB portfolio Assets in billionsRevenue in
millions 7

2021 Performance
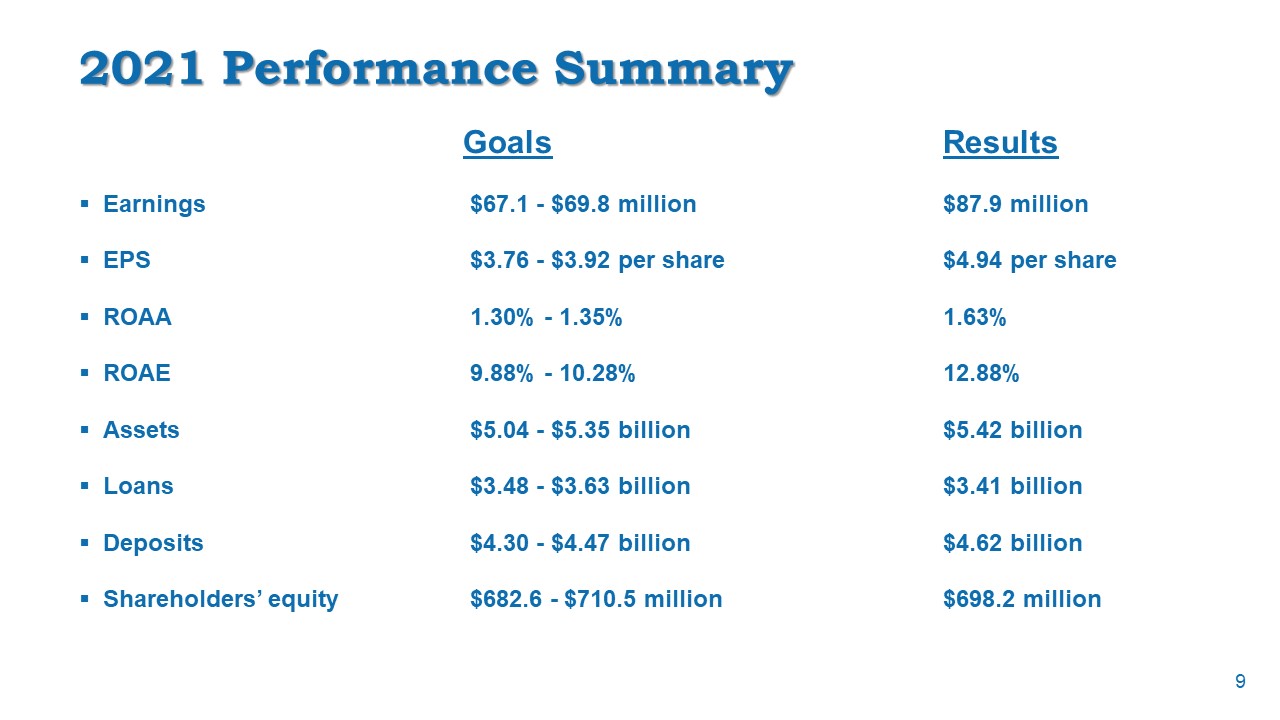
2021 Performance Summary Goals ResultsEarnings $67.1 - $69.8 million $87.9 millionEPS $3.76 - $3.92 per
share $4.94 per shareROAA 1.30% - 1.35% 1.63%ROAE 9.88% - 10.28% 12.88%Assets $5.04 - $5.35 billion $5.42 billionLoans $3.48 - $3.63 billion $3.41 billionDeposits $4.30 - $4.47 billion $4.62 billionShareholders’ equity $682.6 - $710.5 million
$698.2 million 9

Shareholder Value

Dividends Per Share 2020 cash dividends increased 2.6%Dividend payout ratio for 2021 was 31.8%; however,
the 10 year average dividend payout ratio has been 44.31%Desired level between 40% and 50%December 31, 2021 cash dividend yield was 3.67%Cash dividend increased to $0.40 per share effective October 1, 2021 11

Shareholders’ Equity Shareholders’ equity has increased 31.6% during the past five years6.7% compound
growth rate for the past five years (in millions) 12 6.7%

Book Value Per Share Tangible Common Equity/Assets 13

Total Market Capitalization Peer data obtained from S&P Global; peer group consists of publicly traded
regional bank holding companies with comparative assets, as defined in our Proxy Statement. (in millions) 14 Price to Tangible Book Value 2017 2018 2019 2020 2021 CTBI 1.79x 1.41x 1.51x 1.12x 1.23x Peer 2.17x 1.93x 1.85x 1.73x 1.81x
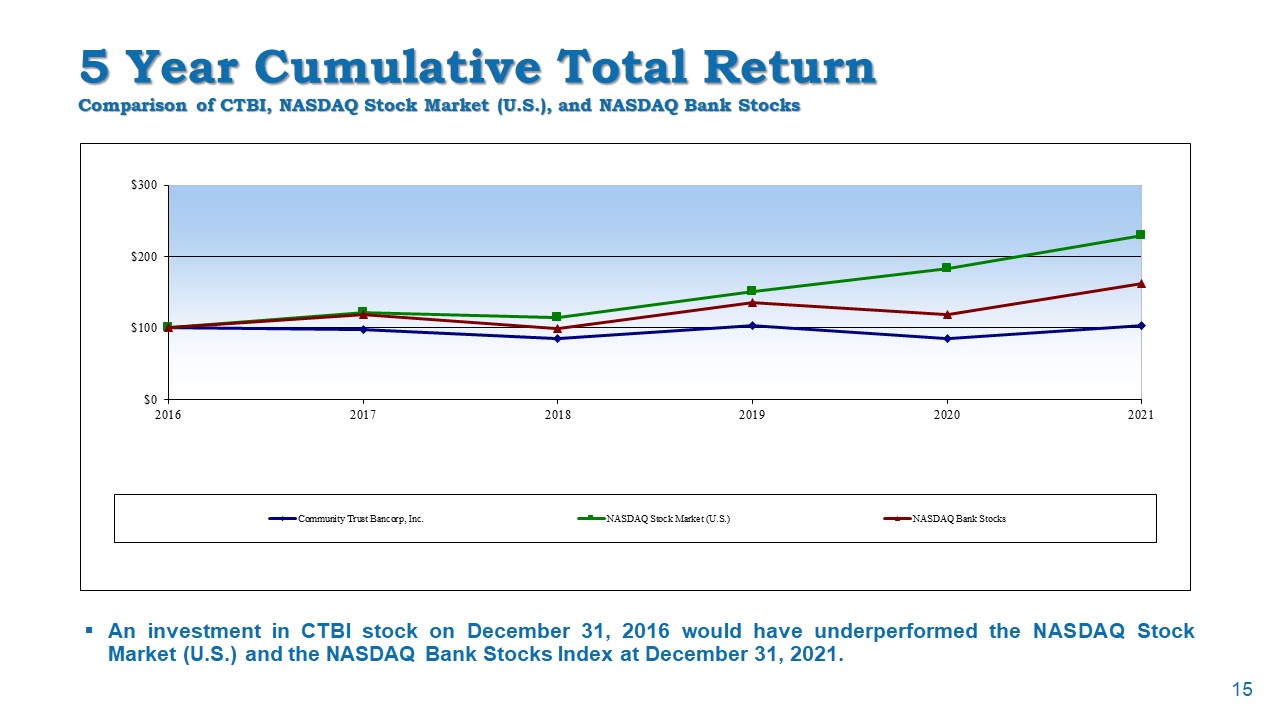
5 Year Cumulative Total ReturnComparison of CTBI, NASDAQ Stock Market (U.S.), and NASDAQ Bank Stocks An
investment in CTBI stock on December 31, 2016 would have underperformed the NASDAQ Stock Market (U.S.) and the NASDAQ Bank Stocks Index at December 31, 2021. 15

Comparison to Russell 2000 Indexof Small Cap Companies 3-, 5-, and 10-year total returns
annualized Return to Investors December 31, 2021 16

Core Value Long-Term Investment 12 stock splits and 10 stock dividends41 years of consecutive increases in
cash dividends5-year compound growth rate of cash dividends 4.5%Stock included in the NASDAQ Global Select Market, NASDAQ Dividend Achievers Index, and NASDAQ Bank Stock IndexCTBI shareholders include220 institutional investors (including CTIC –
9.83%) hold 10.7 million shares (56.4%)328 mutual funds hold 5.7 million shares (31.8%) Data as of December 31, 2021 17

CTBI’s Franchise Value History of solid investor returnsHistorically strong capital positionInvestor
focused dividend policyDividend Achievers IndexConsistent financial performanceCommunity banking strategyEconomic diversity in the markets we serveStrong experienced management team and nearly 1,000 dedicated employeesOur shareholders 18

Earnings Review

Earnings Per Share EPS increased 47.5% from 2020 to 2021 20

Return on Average Assets Peer data obtained from the Federal Reserve Bank Holding Company Performance
Report as of 12/31/2021 for bank holding companies with consolidated assets of $3 billion to $10 billion. 21
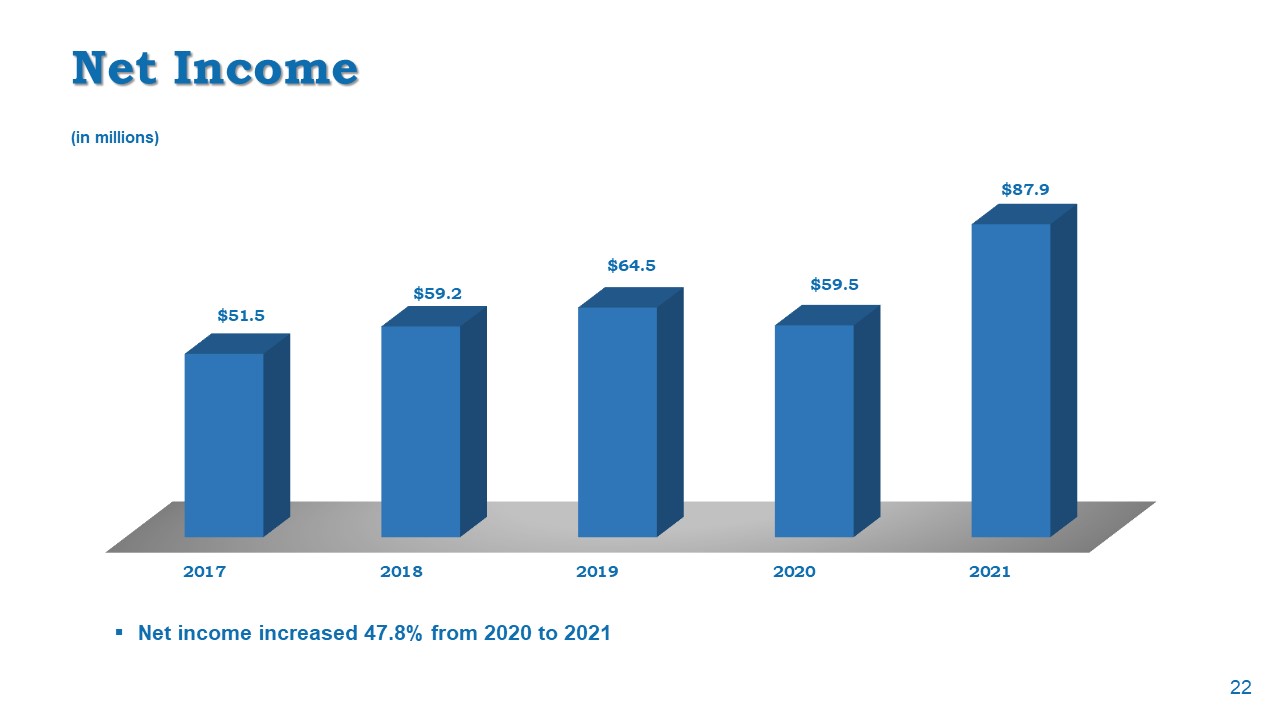
Net Income Net income increased 47.8% from 2020 to 2021 (in millions) 22

Revenues 2021 revenues increased 8.8% from 2020 (in millions) 23

Noninterest Incomeas a % of Total Revenue 2021 noninterest income increased 10.8% from 2020Increases in
deposit service charges, trust revenue, loan related fees, brokerage revenue, bank owned life insurance revenue, and net gains on other real estate owned (in millions) 24
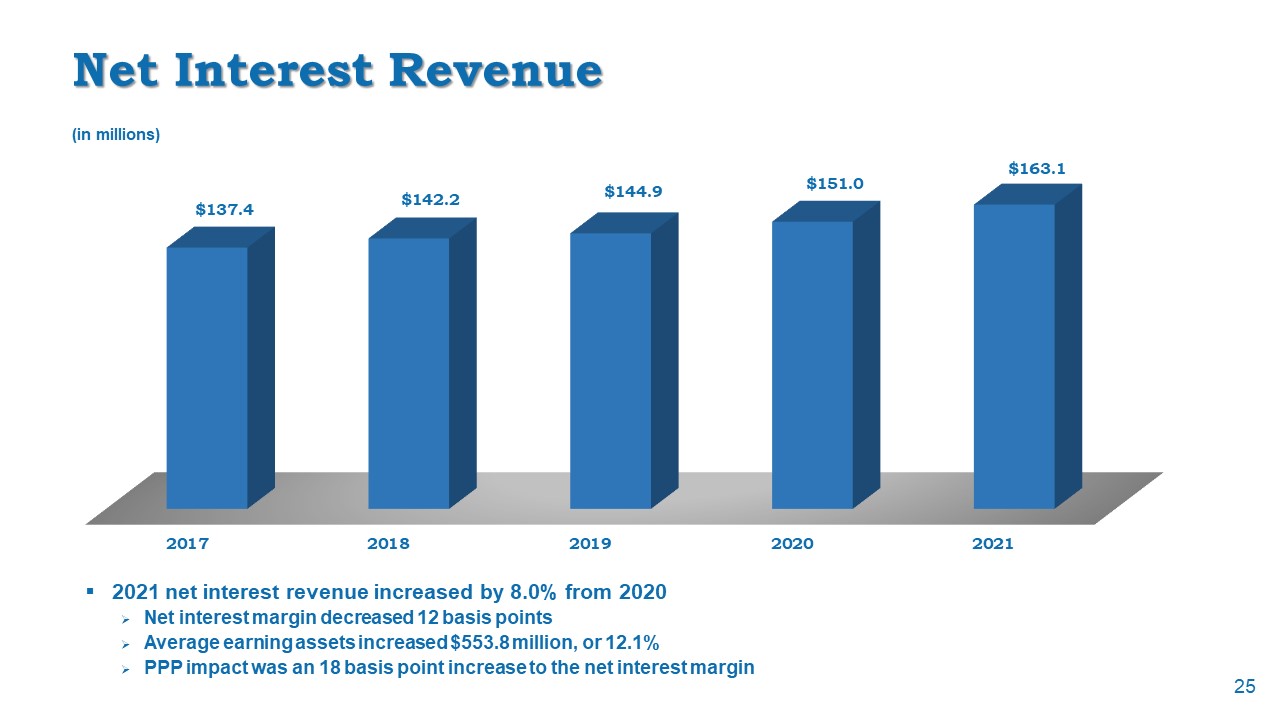
Net Interest Revenue 2021 net interest revenue increased by 8.0% from 2020Net interest margin decreased 12
basis pointsAverage earning assets increased $553.8 million, or 12.1%PPP impact was an 18 basis point increase to the net interest margin (in millions) 25
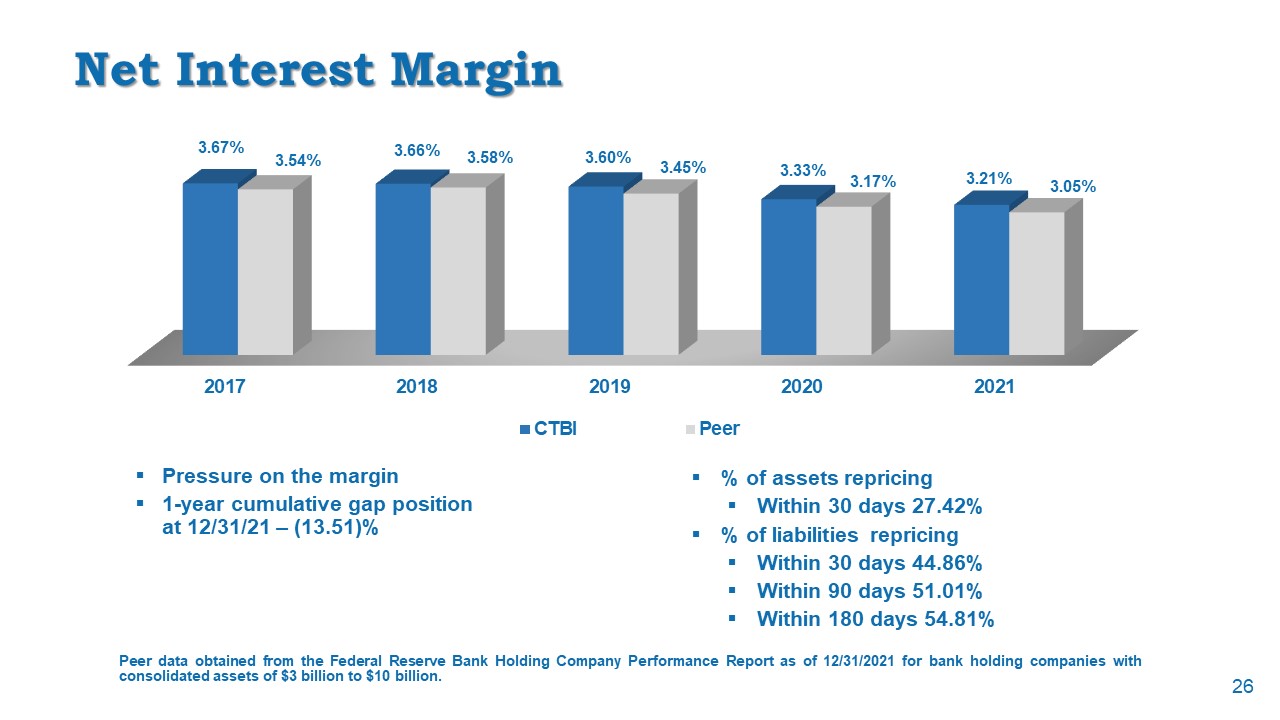
Net Interest Margin Pressure on the margin1-year cumulative gap position at 12/31/21 – (13.51)% Peer data
obtained from the Federal Reserve Bank Holding Company Performance Report as of 12/31/2021 for bank holding companies with consolidated assets of $3 billion to $10 billion. % of assets repricingWithin 30 days 27.42%% of liabilities repricing
Within 30 days 44.86%Within 90 days 51.01%Within 180 days 54.81% 26

Net Noninterest Expenseas a % of Average Earning Assets Peer data obtained from the Federal Reserve Bank
Holding Company Performance Report as of 12/31/2021 for bank holding companies with consolidated assets of $3 billion to $10 billion. (in millions) Noninterest Expense & Efficiency Ratio (in millions) 27

Balance Sheet Review

Total Assets Total assets at 12/31/21 increased $279.1 million, or 5.4%, from 12/31/20Loans decreased
$145.4 million or 4.1%Investment portfolio increased $457.9 million or 45.8%Deposits increased $243.4 million or 5.6% (in billions) 29
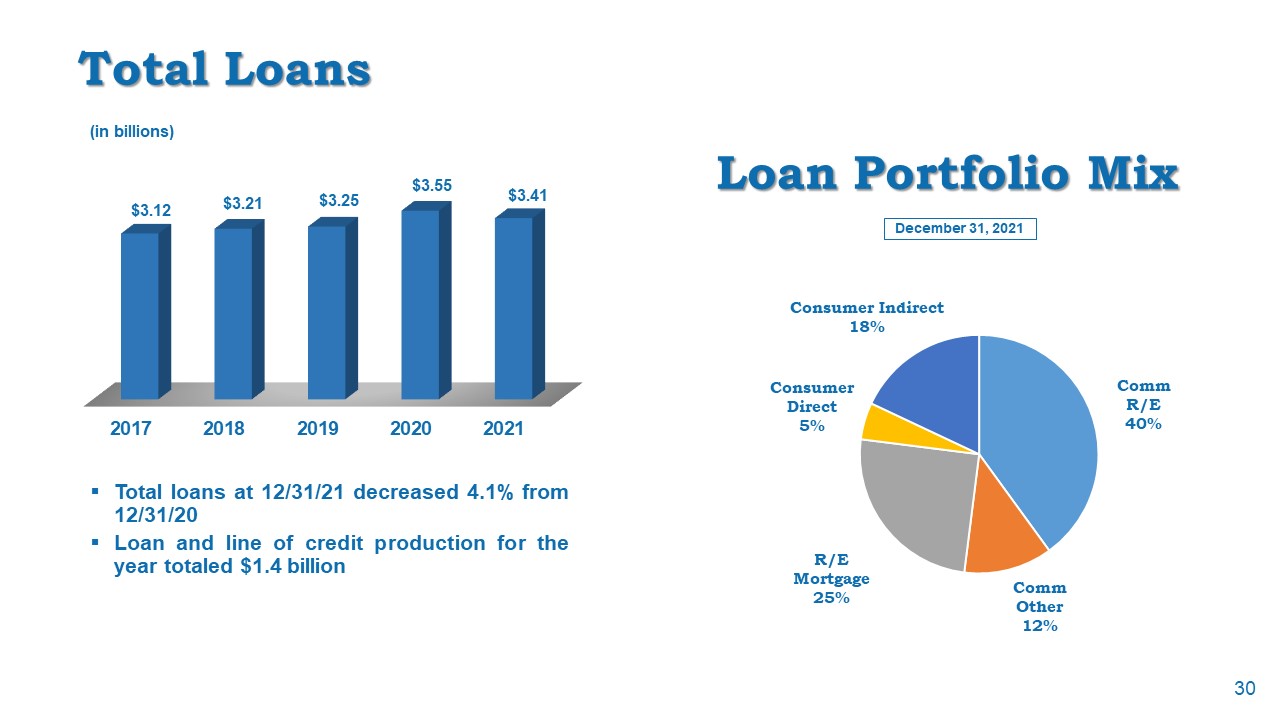
Total Loans Total loans at 12/31/21 decreased 4.1% from 12/31/20Loan and line of credit production for the
year totaled $1.4 billion (in billions) 30 Loan Portfolio Mix December 31, 2021

PPP Loans As of December 31, 2021, we have closed 6,312 PPP loans totaling $401.3 million 3,352 loans
totaling $124.3 million stemming from the Consolidated Appropriations Act 2021 (second round)Through December 31, 2021, we have had 5,543 of our PPP loans totaling $351.8 million forgiven by the SBA 2,608 loans totaling $76.1 million were from
the second round 31
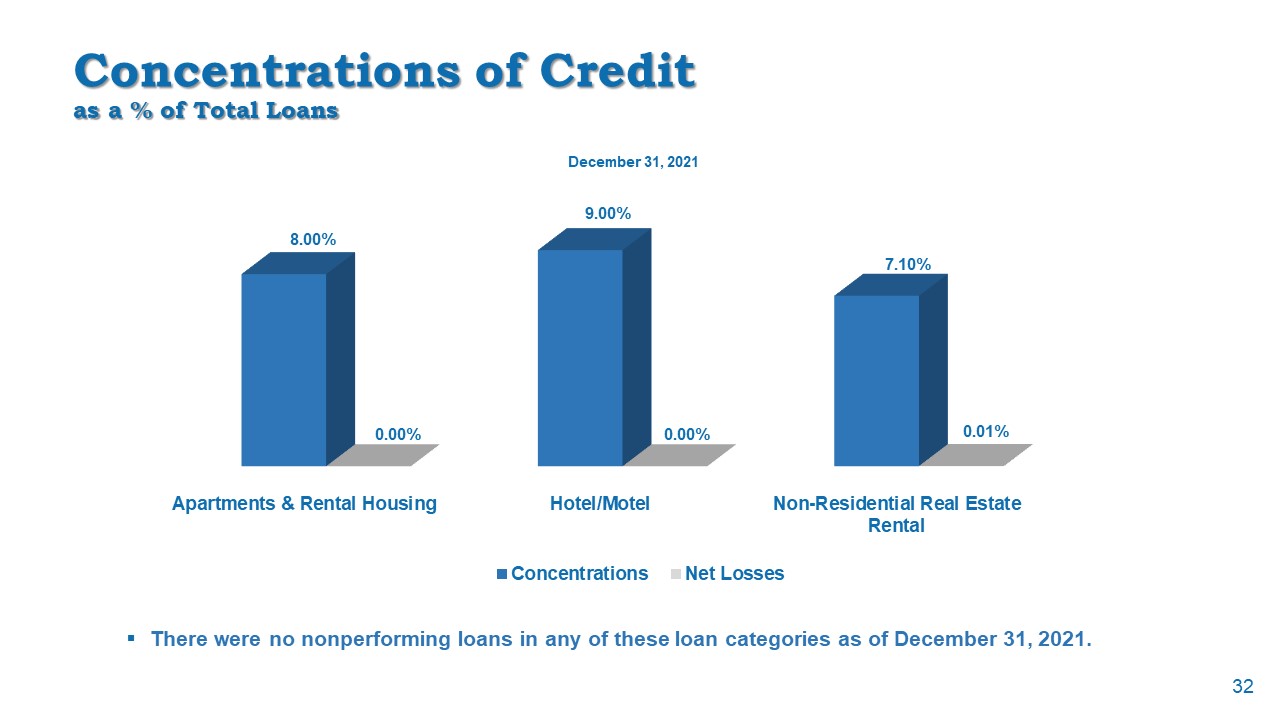
Concentrations of Creditas a % of Total Loans December 31, 2021 There were no nonperforming loans in any
of these loan categories as of December 31, 2021. 32
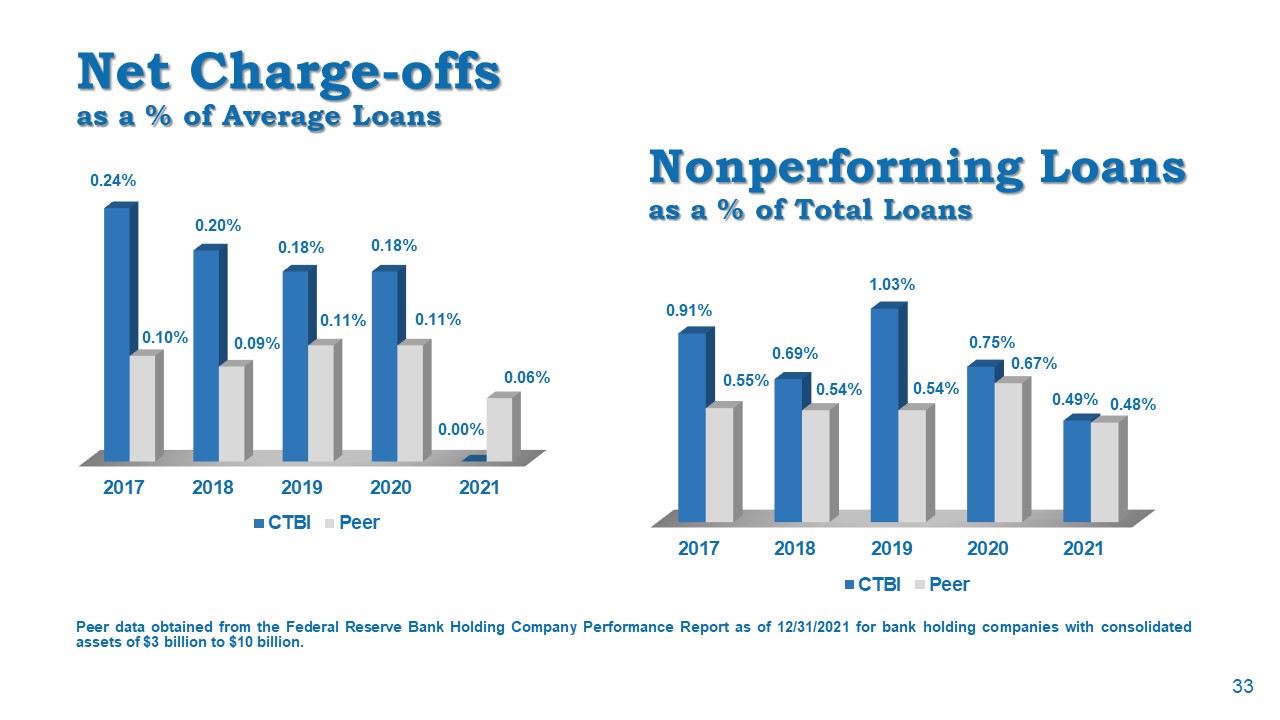
Net Charge-offsas a % of Average Loans Peer data obtained from the Federal Reserve Bank Holding Company
Performance Report as of 12/31/2021 for bank holding companies with consolidated assets of $3 billion to $10 billion. Nonperforming Loansas a % of Total Loans 33

Nonperforming Assetsas a % of Total Assets $3.5 million in other real estate owned Loan Loss Reserveas a
% of Net Loans Peer data obtained from the Federal Reserve Bank Holding Company Performance Report as of 3/31/2021 for bank holding companies with consolidated assets of $3 billion to $10 billion. Loan loss reserve excluding PPP loans –
1.24% 34

Allowance for Credit Losses 4Q19 Probable Incurred Losses January 1, 2020 CECL Adoption March 31,
2020 CECL December 31, 2021 CECL (dollars in thousands) Amount % of Portfolio Amount % of Portfolio Amount % of Portfolio Amount % of Portfolio Allowance for loan and lease losses transitioned to allowance for credit
losses: Commercial $21,683 1.30% $21,680 1.30% $30,030 1.79% $23,808 1.35% Residential mortgage 5,501 0.61% 7,319 0.81% 7,850 0.86% 8,503 0.97% Consumer
direct 1,711 1.16% 1,671 1.13% 2,200 1.51% 1,863 1.19% Consumer indirect 6,201 1.18% 7,467 1.42% 9,365 1.69% 1,951 0.31% Total allowance for loan and lease losses/allowance for credit
losses $35,096 1.08% 38,137 1.17% $49,445 1.50% $41,756 1.22% Reserve for unfunded lending commitments $274 $386 $404 $432 35
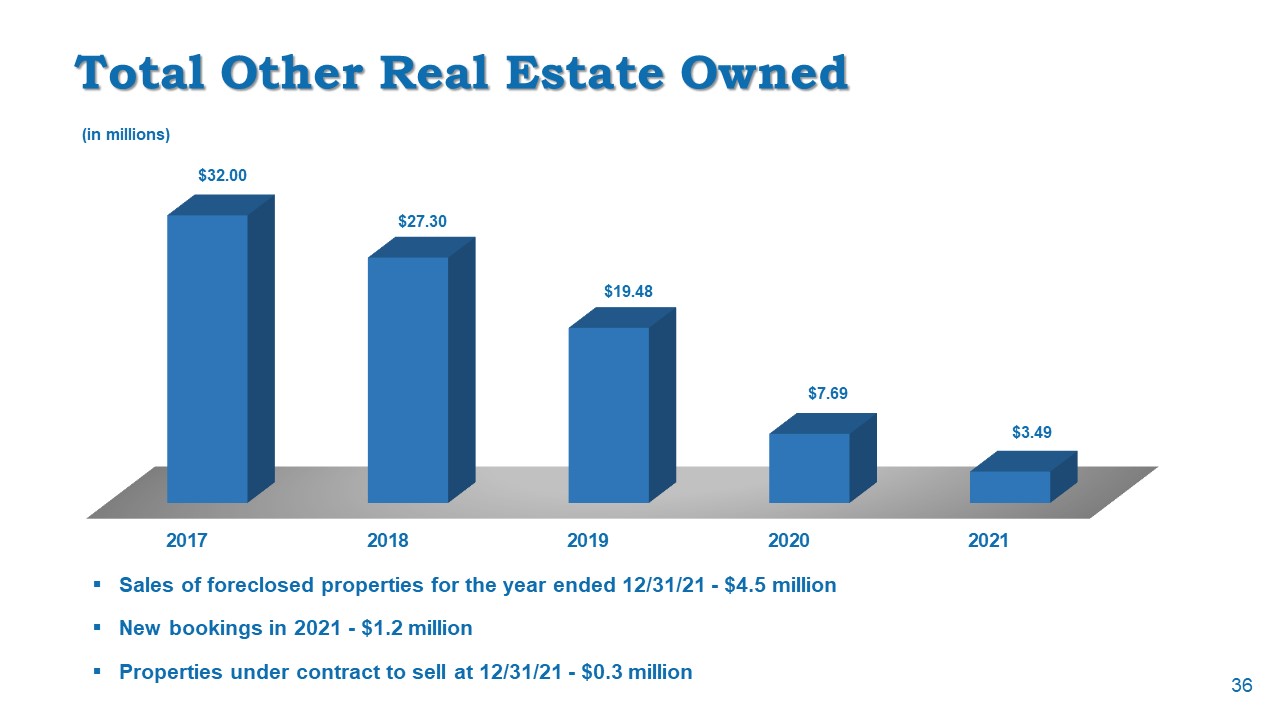
Total Other Real Estate Owned Sales of foreclosed properties for the year ended 12/31/21 - $4.5 millionNew
bookings in 2021 - $1.2 millionProperties under contract to sell at 12/31/21 - $0.3 million (in millions) 36

Total Depositsincluding Repurchase Agreements (in billions) December 31, 2021 37

1st Quarter 2022 Review

Key Metrics – 1st Quarter 2022 Total Assets $5.4 billionMarket Capitalization $736.8 millionCash Dividend
Yield 3.88%P/E Ratio 9.15xPrice to Book Value 1.1xPrice to Tangible Book Value 1.3xTangible Common Equity Ratio 10.93% Financial data as of March 31, 2022 39
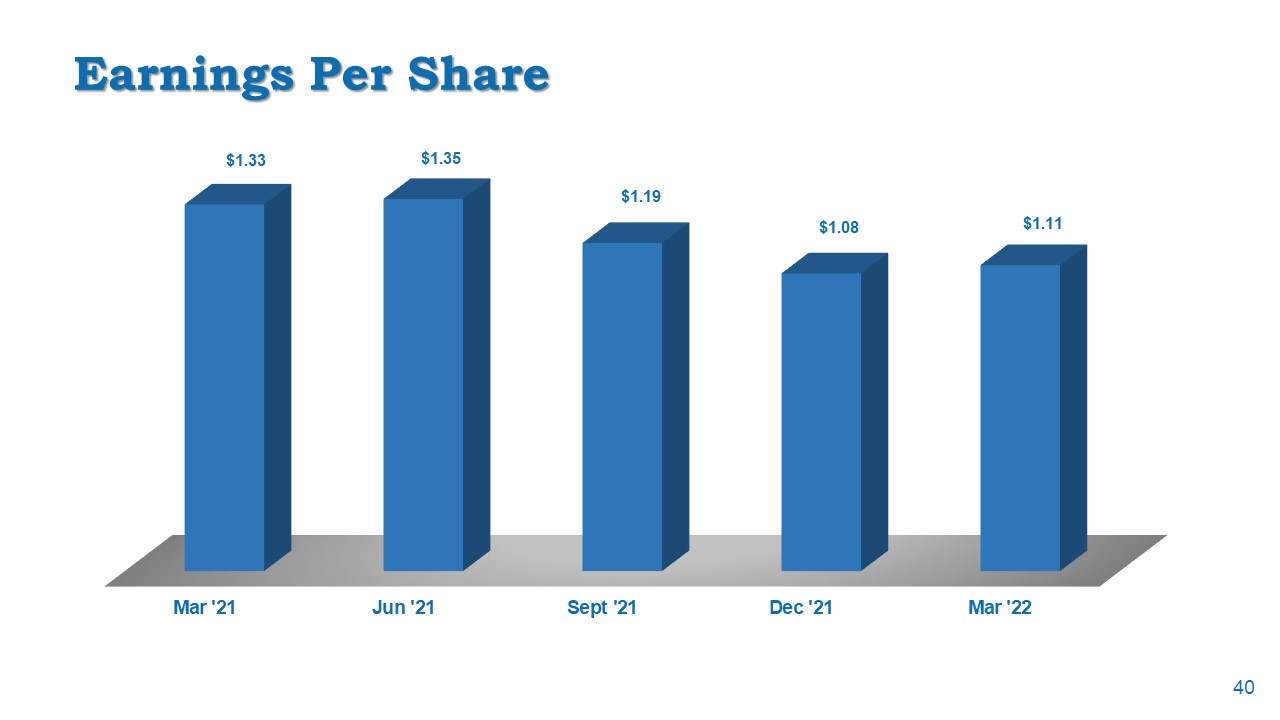
Earnings Per Share 40

Net Income 41 (in millions)

Earnings Net interest income for the quarter of $40.0 million was $0.8 million, or 1.9%, below prior
quarter and $0.2 million, or 0.5%, below first quarter 2021. Provision for loan losses for the quarter was $0.9 million, compared to provision of $0.5 million for the quarter ended December 31, 2021 and a recovery of provision of $2.5 million for
the first quarter 2021.Noninterest income for the quarter ended March 31, 2022 of $15.0 million remained relatively flat to prior quarter, but decreased $0.6 million, or 3.9%, from prior year same quarter.Noninterest expense for the quarter ended
March 31, 2022 of $29.4 million decreased $1.8 million, or 5.7%, from prior quarter, but increased $1.0 million, or 3.7%, from prior year same quarter. 42

Noninterest Income Q-O-Q decreases in gains on sales of loans and deposit related fees, offset by
increases in loan related fees and securities gainsY-O-Y decreases in gains on sales of loans and loan related fees, partially offset by increases in deposit related fees, trust revenue and securities gains (in millions) 43
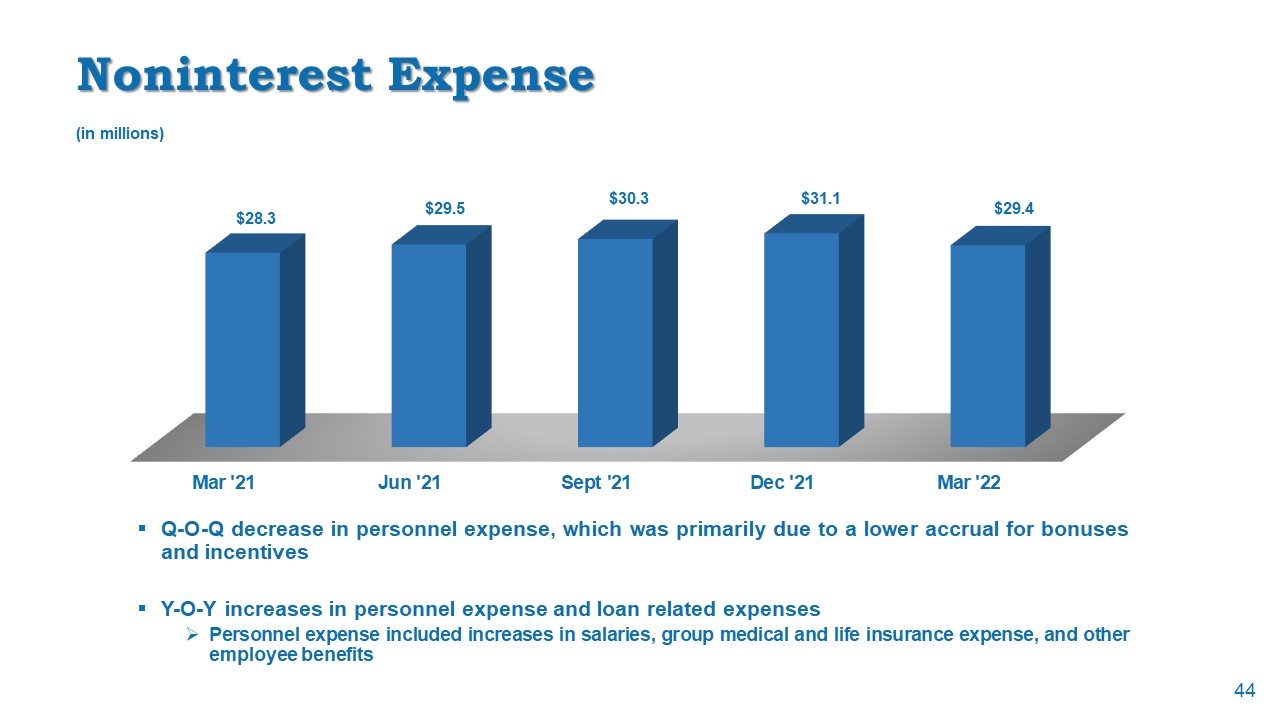
Noninterest Expense Q-O-Q decrease in personnel expense, which was primarily due to a lower accrual for
bonuses and incentivesY-O-Y increases in personnel expense and loan related expensesPersonnel expense included increases in salaries, group medical and life insurance expense, and other employee benefits 44 (in millions)

Total Assets Total assets at 3/31/22 increased $24.9 million, or an annualized 1.9%, during the first
quarterLoans increased $106.7 millionInvestment portfolio increased $47.8 millionDeposits in other banks decreased $159.1 million to fund loan growth and additional investments in available-for-sale securities.Deposits, including repurchase
agreements, increased $67.5 million 45 (in millions)

Total Loans Loan portfolio increased at an annualized rate of 12.7% during the quarterLoans decrease from
prior year first quarter 0.7% 46 (in millions)

Nonperforming Loansas a % of Total Loans 47
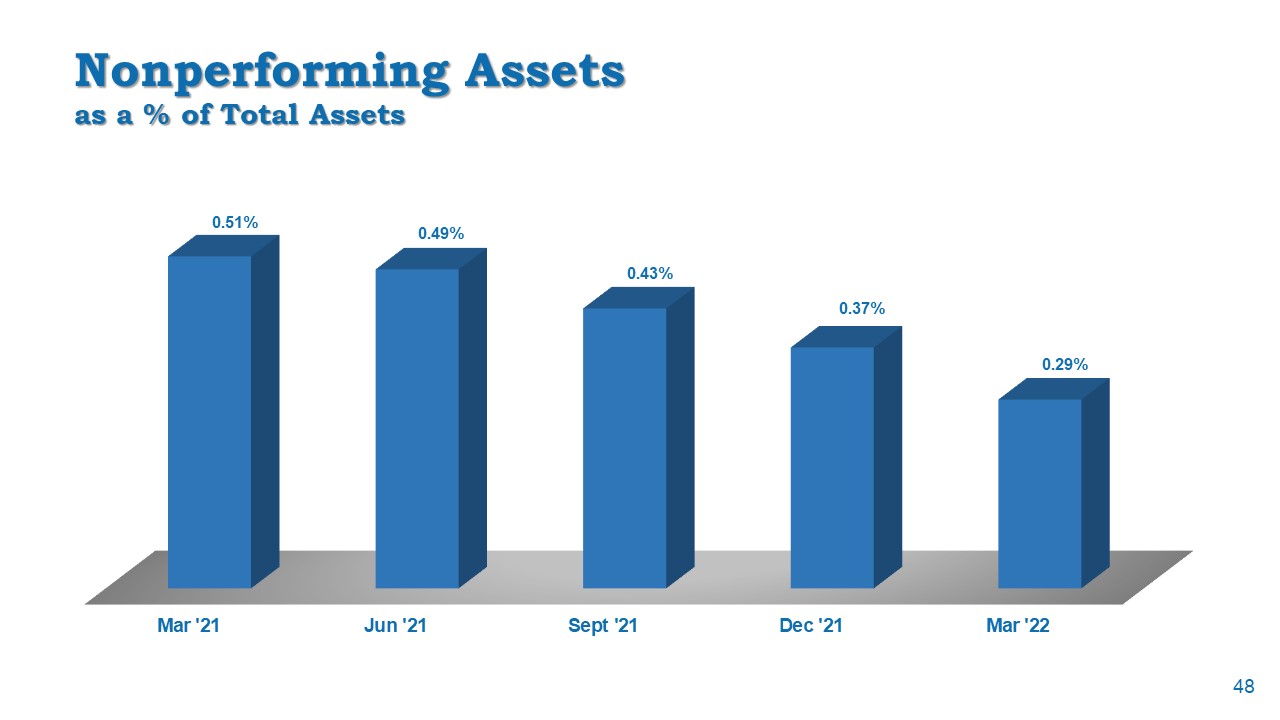
Nonperforming Assetsas a % of Total Assets 48

Net Charge-offsas a % of Average Loans (annualized) 49
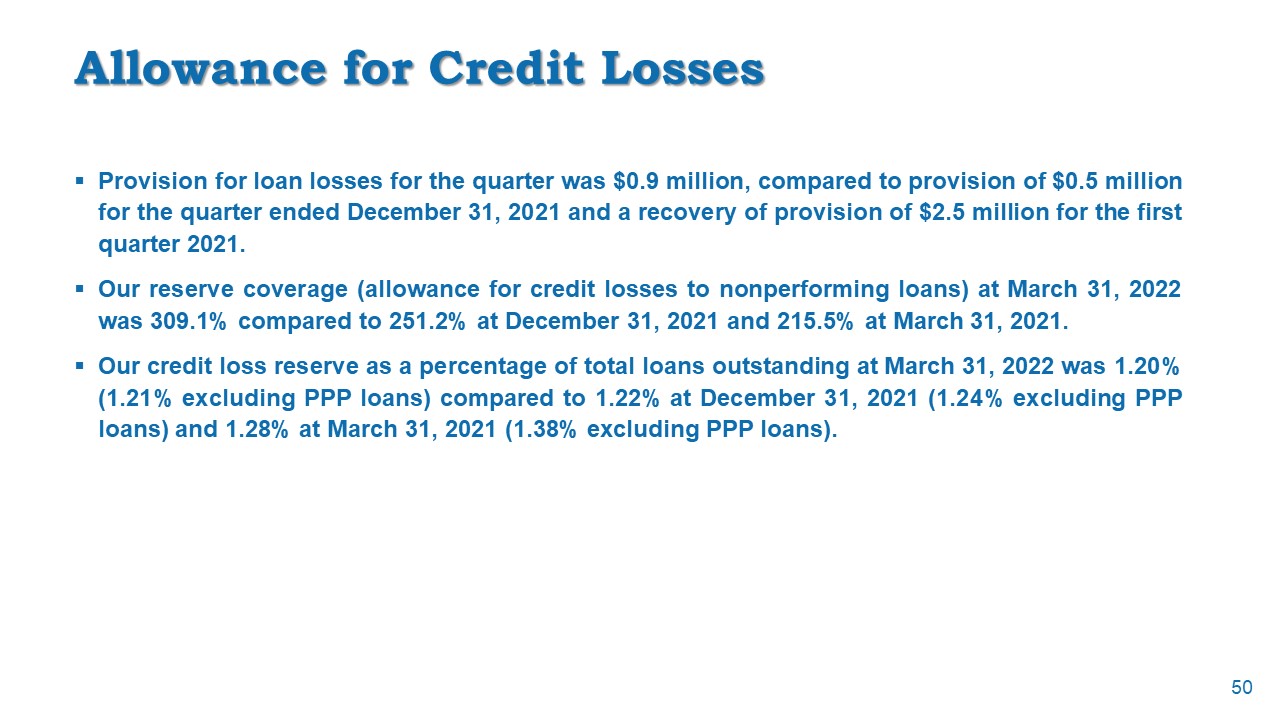
Allowance for Credit Losses Provision for loan losses for the quarter was $0.9 million, compared to
provision of $0.5 million for the quarter ended December 31, 2021 and a recovery of provision of $2.5 million for the first quarter 2021.Our reserve coverage (allowance for credit losses to nonperforming loans) at March 31, 2022 was 309.1%
compared to 251.2% at December 31, 2021 and 215.5% at March 31, 2021.Our credit loss reserve as a percentage of total loans outstanding at March 31, 2022 was 1.20% (1.21% excluding PPP loans) compared to 1.22% at December 31, 2021 (1.24%
excluding PPP loans) and 1.28% at March 31, 2021 (1.38% excluding PPP loans). 50

Total Depositsincluding Repurchase Agreements Deposits, including repurchase agreements, increased an
annualized 5.9% from prior quarter and 2.1% from prior year first quarter 51 (in billions)

Efficiency Ratio 52

Key Strategic Initiatives

Operational Priorities Build core earnings capacityQuality loan growthLow cost deposit growthExpansion and
growth through acquisitions and new branchesManage net interest margin Operational efficiencyExpense controlNoninterest revenue growthCompliance managementIncrease noninterest incomeTrust and wealth managementBrokerageContinuing focus on
improving asset quality Continuing liquidation of other real estate owned portfolio 54
To Our Shareholders Your management has a Strategic Plan for the performance and operations of your
company. Success will be attained by the execution of this plan, not just by management, but by approximately 1,000 employees. The continuing support by you, our shareholders, by referring your friends, neighbors, and business associates to do
business with your bank, is invaluable to the execution of our plans for the performance of your Company. 55

Serious News for Serious Traders! Try StreetInsider.com Premium Free!
You May Also Be Interested In
- Community Trust Bancorp (CTBI) Declares $0.46 Quarterly Dividend; 4.3% Yield
- Fingerprint Cards AB (publ) publishes annual report for 2023
- Unlocking Insights: Nourish Food Marketing and HRA Global Collaborate on Exclusive Webinar Exploring Food Trends Across North America and Europe
Create E-mail Alert Related Categories
SEC FilingsSign up for StreetInsider Free!
Receive full access to all new and archived articles, unlimited portfolio tracking, e-mail alerts, custom newswires and RSS feeds - and more!
