

Form 8-K COMMUNITY FINANCIAL CORP For: Mar 17
 Tweet
Tweet Share
ShareExhibit 99.1

1 Investor Presentation Fourth Quarter 2020 Financial Update March 2021 (NASDAQ: “TCFC”)

Disclaimer 2 This investor presentation contains, and future oral and written statements of The Community Financial Corporation (the “Company” or “TCFC”) and its wholly - owned banking subsidiary, Community Bank of the Chesapeake (the “Bank”), and its management may contain, statements about future events that constitute forward - looking statements within the meaning of the Private Securities Litigation Reform Act of 1995 . Forward - looking statements can generally be identified by the fact that they do not relate strictly to historical or current facts . They often include words like “believe,” “expect,” “anticipate,” “estimate,” and “intend” or future or conditional verbs such as “will,” “would,” “should,” “could,” or “may . ” Statements in this investor presentation that are not strictly historical are forward - looking and are based upon current expectations that may differ materially from actual results . These forward - looking statements include without limitation, those relating to the Company’s and the Bank’s future growth and management’s outlook or expectations for revenue, asset quality, profitability, business prospects, net interest margin, non - interest revenue, allowance for loan losses, the level of credit losses from lending, liquidity levels, capital levels, or future financial or business performance strategies or expectations, and any statements of the plans and objectives of management for future operations, products or services, including the expected benefits from and/or the execution of integration plans relating to any acquisition we have undertaking or that we undertake in the future ; plans and cost savings regarding branch closings or consolidation ; any statement of expectation or belief ; projections related to certain financial metrics ; and any statement of assumptions underlying the foregoing . These forward - looking statements express management’s current expectations or forecasts of future events, results and conditions, and by their nature are subject to and involve risks and uncertainties that could cause actual results to differ materially from those anticipated by the statements made herein . Factors that might cause actual results to differ materially from those made in such statements include, but are not limited to : risks, uncertainties and other factors relating to the COVID - 19 pandemic, (including the length of time that the pandemic continues, the ability of states and local governments to successfully implement the lifting of restrictions on movement and the potential imposition of further restrictions on movement and travel in the future, the effect of the pandemic on the general economy and on the businesses of our borrowers and their ability to make payments on their obligations ; the remedial actions and stimulus measures adopted by federal, state and local governments, and the inability of employees to work due to illness, quarantine, or government mandates) ; the synergies and other expected financial benefits from any acquisition that we have undertaken or may undertake in the future, may or may not be realized within the expected time frames ; changes in the Company’s or Bank’s strategy ; costs or difficulties related to integration matters might be greater than expected ; availability of and costs associated with obtaining adequate and timely sources of liquidity ; the ability to maintain credit quality ; general economic trends ; changes in interest rates ; loss of deposits and loan demand to other financial institutions ; substantial changes in financial markets ; changes in real estate value and the real estate market ; the impact of government shutdowns or sequestration ; the possibility of unforeseen events affecting the industry generally ; the uncertainties associated with newly developed or acquired operations ; the outcome of pending or threatened litigation, or of matters before regulatory agencies, whether currently existing or commencing in the future ; market disruptions and other effects of terrorist activities ; and the matters described in “Item 1 A Risk Factors” in the Company’s Annual Report on Form 10 - K for the Year Ended December 31 , 2020 and in its other Reports filed with the Securities and Exchange Commission (the “SEC”) . The Company’s forward - looking statements may also be subject to other risks and uncertainties, including those that it may discuss elsewhere in this news release or in its filings with the SEC, accessible on the SEC’s Web site at www . sec . gov . The Company undertakes no obligation to update these forward - looking statements to reflect events or circumstances after the date hereof or to reflect the occurrence of unforeseen events, except as required under the rules and regulations of the SEC . This investor presentation has been prepared by the Company solely for informational purposes based on its own information, as well as information from public sources . Certain of the information contained herein may be derived from information provided by industry sources . The Company believes such information is accurate and that the sources from which it has been obtained are reliable . However, the Company has not independently verified such information and cannot guarantee the accuracy of such information . This investor presentation has been prepared to assist interested parties in making their own evaluation of the Company and does not purport to contain all of the information that may be relevant . In all cases, interested parties should conduct their own investigation and analysis of the Company and the data set forth in the investor presentation and other information provided by or on behalf of the Company . This investor presentation is not an offer to sell securities and it is not soliciting an offer to buy securities in any state where the offer or sale is not permitted . Neither the SEC nor any other regulatory body has approved or disapproved of the securities of the Company or passed upon the accuracy or adequacy of this presentation . Any representation to the contrary is a criminal offense . Pro Forma and Projected Information This investor presentation contains certain pro forma and projected information, including projected pro forma information that reflects the Company’s current expectations and assumptions . This pro forma information does not purport to present the results that the Company will ultimately realize . Non - GAAP Financials This investor presentation includes certain non - GAAP financial measures intended to supplement, not substitute for, comparable GAAP measures and the Company’s reported results prepared in accordance with GAAP . Reconciliations of non - GAAP financial measures to GAAP financial measures are provided at the end of the presentation . Numbers in this presentation may not sum due to rounding .

The Community Financial Corporation 3 x The Community Financial Corporation (NASDAQ: TCFC) is the bank holding company for Community Bank of the Chesapeake x $2.0 billion in assets at December 31,2020 and market capitalization of approximately $201.9 Million (1) x Headquartered in Waldorf, MD with 14 office locations in Maryland and Virginia • 12 Branches: 11 in the Southern Maryland counties of Calvert, Charles and St. Mary’s and 1 in Virginia in the City of Fredericksburg • 4 Loan Production Offices (LPOs): 3 in Maryland (La Plata, Prince Frederick and Leonardtown) and 1 in Virginia (Fredericksburg) (2) x Average branch size of greater than $140 million significantly exceeds industry average x Relationship banking focus; high touch with direct access to senior decision makers x Current platform has capacity to support future organic growth 1 ) 2 ) Market data as of 03/11/2021. Two LPOs are located within branch offices.

#1 Market Share Position in Southern Maryland (1) Existing Franchise T C FC (12 ) x Total FDIC insured deposits in Southern Maryland and Fredericksburg, VA were $7.8 billion at June 30, 2020 1) Source: Federal Deposit Insurance Corporation website. Deposit market share data as of 6/30/20. Southern Maryland includes the counties of Calvert, Charles, and Saint Mary’s, MD. The Bank also maintains a branch in Fredericksburg, VA. x Rank Deposit Market Share – Sout Institution (ST) hern Maryla Depos i t s i n Market ($mm) nd M arket Share (%) 1 $1,605 25.8% 2 PNC Financial Services Group Inc. 1,218 19.6% 3 Bank of America Corp. 1,158 18.7% 4 Truist (formerly BB&T/Suntrust) 961 15.5% 5 WesBanco (formerly Old Line Bank) 616 9.9% 6 M&T Bank Corp. 278 4.5% 7 Capital One Financial Corp. 171 2.8% 8 Wells Fargo & Co. 109 1.7% 9 Virginia Partners Bank (MD) 58 0.9% 10 SONABANK 37 0.6% FDIC Deposits in Southern Maryland Fredericksburg, VA market share improv $6,213 ed from 3.3% 100% at June 30, 2019 to 4.2% at June 30, 2020 as deposits increased $21.5 million to $68.2 million TCFC (12 branches) TCFC (4 LPOs) Waldorf La Plata 4
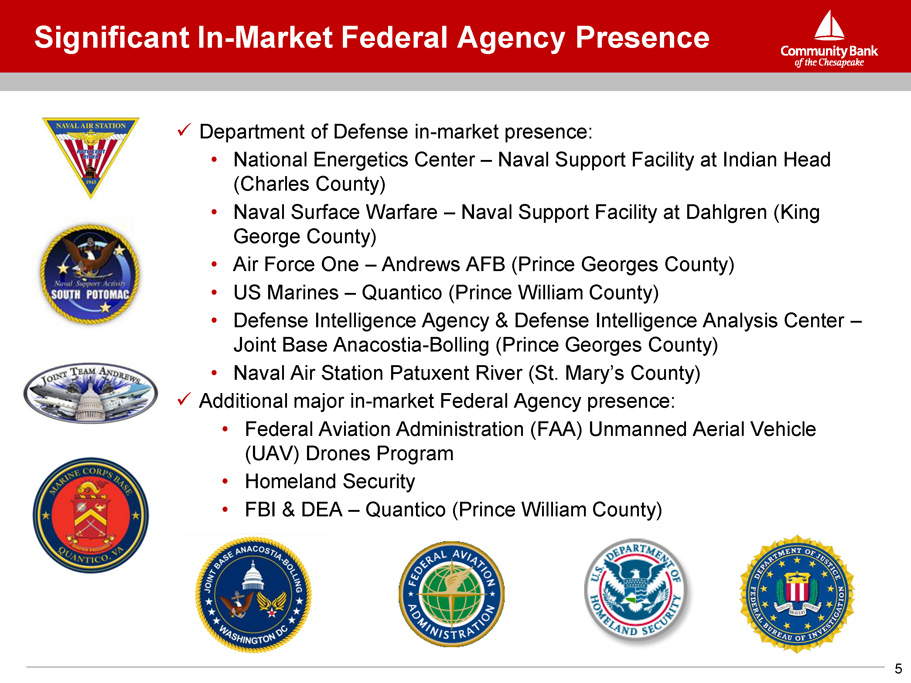
Significant In - Market Federal Agency Presence x Department of Defense in - market presence: • National Energetics Center – Naval Support Facility at Indian Head (Charles County) • Naval Surface Warfare – Naval Support Facility at Dahlgren (King George County) • Air Force One – Andrews AFB (Prince Georges County) • US Marines – Quantico (Prince William County) • Defense Intelligence Agency & Defense Intelligence Analysis Center – Joint Base Anacostia - Bolling (Prince Georges County) • Naval Air Station Patuxent River (St. Mary’s County) x Additional major in - market Federal Agency presence: • Federal Aviation Administration (FAA) Unmanned Aerial Vehicle (UAV) Drones Program • Homeland Security • FBI & DEA – Quantico (Prince William County) 5
Investment Highlights 6 x More than 30 consecutive years of profitability x Strong, Experienced Management Team positioned for growth x Increased Profitability Momentum x COVID - 19: • Deferred loans decreased to $35.4 million and 1.75% of assets or 2.35% of gross portfolio loans (1) at December 31, 2020. • The Bank is participating in the U.S. Small Business Administration Payroll Protection Program loan (“PPP Loans”) Program. • Increased provisions to respond to COVID - 19; reserve/gross loans increased from 0.75% at 12/31/19 to 1.29% (1) at 12/31/2021 x Positioned in Demographically Attractive Markets x Strong Market Share Position in Core Market. The Bank is focused on: • Continuing to improve funding costs while maintaining expense control discipline • Opportunistic growth from market disruption (e.g., WesBanco – Old Line acquisition) • Increasing market share in Fredericksburg, VA and the Greater Fredericksburg Area 1) Excludes PPP loans

Financial Highlights Highlights x 46% or $2.7 million increase to noninterest income in 2020 compared to 2019 x 2020 NIM expansion compared to Prior Year x Strong expense control x Net deferred fees of $2.4 million at 12/31/20 for PPP loans x Raised $20.0 million in Sub - debt at 4.75% in October 2020 x Paid off $23.0 million of 6.25% Sub - debt in February 2020 x Improved earnings in 2019 due to changes in the Bank’s funding composition, the control of operating expenses and organic loan growth x Issued $10.6 million of common stock in December 2019 1) Non - GAAP financial measures. Refer to Appendix to this presentation for a reconciliation. 2) Operating results are non - GAAP financial measures. Refer to Appendix to this presentation for a reconciliation. ($000s except per share) 201 6 F Y 201 7 F Y 201 8 F Y 2019 F Y 2020 F Y B a l a n c e S h ee t $1 , 334 , 25 7 1 , 088 , 98 2 $1 , 405 , 96 1 1 , 150 , 04 4 $1 , 689 , 22 7 1 , 346 , 92 2 $1 , 797 , 53 6 1 , 454 , 17 2 - - - - 1 , 038 , 82 5 104,426 1 , 106 , 23 7 109,957 1 , 429 , 62 9 140,841 1 , 511 , 83 7 168,541 $2 , 026 , 43 9 1 , 504 , 27 5 110,320 1,745,602 185,651 Total Assets Gross Portfolio Loans ("GPLs") U . S. S B A P P P Loan s Deposits T angibl e Co mm o n E q ui t y ( 1 ) C on s olid a t e d C a pi t a l ( % ) % % % % % 7 . 8 3 9 . 0 2 10 . 6 2 13 . 6 0 22 . 5 4 7 . 8 2 8 . 7 9 10 . 5 3 13 . 4 0 23 . 6 5 8 . 4 1 9 . 5 0 11 . 2 3 13 . 6 8 25 . 2 5 9 . 4 4 10 . 0 8 11 . 9 1 14 . 1 6 28 . 5 7 9 . 2 2 9 . 5 6 12 . 2 3 14 . 6 9 31 . 4 5 T ang . Co mm o n E q ui t y / T ang . A ss e t s ( 1 ) Leverage Ratio Tier 1 Risk Based Ratio Risk - Based Capital Ratio T BV P e r S h a re ( 1 ) A sse t Q u a li ty ( % ) % % % % % 1 . 9 9 0 . 1 0 2 . 4 2 52 . 4 1 . 7 1 0 . 0 3 2 . 0 7 71 . 5 2 . 0 2 0 . 0 7 2 . 5 1 42 . 3 1 . 4 6 0 . 1 6 1 . 8 0 59 . 1 1 . 0 8 0 . 1 4 1 . 4 5 103 . 4 NPAs/Assets (3) NCOs/Avg Portfolio Loans N P L s ( 3 ) + O R E O / G P L s + O R EO Re s e r v e s / N P L s ( 3 ) Profitability % % % % % Ne t I n c o m e ROAA R O A A ( O pe r a t ing ) ( 2 ) Pr e - t a x Pr e - P r o v i s io n ( " P T P P " ) R O A A ( 1 ) ROATCE R O A T C E ( O pe r a t ing ) ( 2 ) P T PP R O A T C E ( 1 ) Ne t I n t e r e s t M a r gi n E f f i c ien cy Ra t i o ( 1 ) Non - Interest Exp / Avg Assets (Operating) (2) Net Operating Exp / Avg Assets (Operating) (2) Diluted EPS Diluted EPS (Operating) (2) $7 , 33 1 0 . 6 0 0 . 6 0 1 . 1 5 7 . 0 9 7 . 0 9 13 . 6 4 3 . 4 8 64 . 8 2 . 3 0 2 . 0 0 $1 . 5 9 1 . 5 9 $7 , 20 8 0 . 5 2 0 . 7 8 1 . 2 6 6 . 5 5 9 . 7 0 15 . 8 0 3 . 3 7 60 . 4 2 . 0 7 1 . 7 9 $1 . 5 6 2 . 3 1 $11 , 22 8 0.70 0.87 1.05 8.29 10.28 12.40 3.43 61.5 2.11 1.85 $2 . 0 2 2 . 5 1 $15 , 27 2 0.88 0.88 1.32 10.14 10.14 15.31 3.31 59.8 2.02 1.71 $2 . 7 5 2 . 7 5 $16 , 13 6 0.81 0.81 1.58 9.06 9.06 17.60 3.36 51.3 1.75 1.40 $2 . 7 4 2 . 7 4 3) NPLs include nonaccrual loans, loans 90+ days past due and accruing TDRs. NPAs include NPLs and OREO. 7
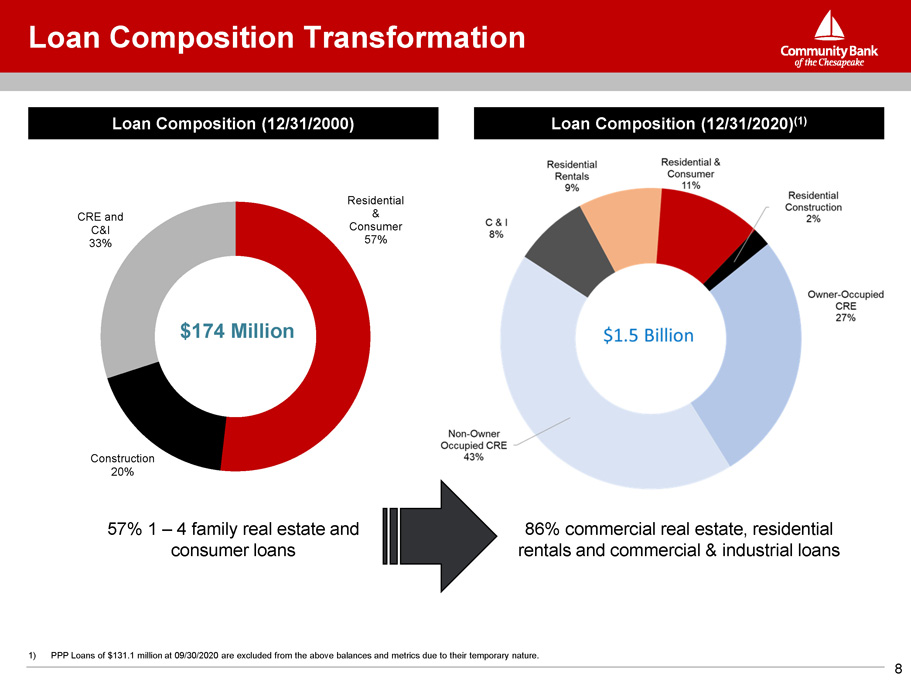
Loan Composition (12/31/2000) Loan Composition (12/31/2020) (1) 57% 1 – 4 family real estate and consumer loans 86% commercial real estate, residential rentals and commercial & industrial loans Loan Composition Transformation Re s iden t i al & Consumer 57% Con s tru c t i on 20% C R E and C&I 33% $174 Million 1) PPP Loans of $131.1 million at 09/30/2020 are excluded from the above balances and metrics due to their temporary nature. 8

x U.S. Small Business Administration Payroll Protection Program loans of $110.3 million at December 31, 2020 are excluded from the above balances and metrics due to their temporary nature. x Commercial loan portfolios were 86% of loans at September 30, 2020. Historical Loan Growth Since 2015 ($mm) (1) Loan Composition (12/31/2020) (1) YTD Yield (1) : 4.33% Loan Composition 1) PPP Loans of $110.3 million at 12/31/2020 are excluded from the above balances and metrics due to their temporary nature. 9

COVID - 19 Impacts 10 Customer and Employee Impacts x Minimal disruption in customer service levels - - branch lobbies re - opened on June 8, 2020 x Shifted workforce to remote work as needed x Investments in technology platforms during last several years performed well in challenging operating environment x Implemented various HR related aspects of CARES Act and developed response plans for employee illness US SBA PPP Loans x In 2020 • Originated 971 loans totaling $140.9 million with an average loan amount of $145,000 • 98% were for two - year term • Approximately 80% existing customers / 20% new customers • Balances of $110.3 million as of December 31, 2020 x In Q1 2021 we are assisting with forgiveness applications for outstanding loans and processing new loan applications. As of March 11, 2021, the Bank has approved and funded $44.3 million of new PPP loans. x Federal Reserve PPLF Credit Facility provides favorable rate (35bps) and capital treatment • The Company paid off the balance ($85.9 million) of the PPLF facility in Q4 2020

x Deferred loans decreased from $251.5 million at September 30, 2020 to $35.4 million and 1.75% of assets or 2.35% of gross portfolio loans at December 31, 2020 x Q4 deferred loans in lower range of management’s Q4 estimate between 2% to 4% x Overall improvement has been driven by the resilience of our local economy which is tied to the federal government x Additional deferrals granted in Q4 2020 into 2021 were to customers in industries that continue to require support to weather the pandemic COVID - 19 Deferred Loans by NAICS Industry COVID - 19 Deferred Loans % of Deferred (dollars in thousands) December 31, 2020 Number of Loans Loans % of Gross P o r t f o l i o L o a n s Real Estate Rental and Leasing $ 8,639 5 24.41% 0.57% Accommodation and Food Services 17,210 5 48.64% 1.14% Arts, Entertainment, and Recreation 3,716 4 10.50% 0.25% Transportation and Warehousing 3,505 11 9.91% 0.23% Retail Trade 395 5 1.12% 0.03% Other Industries, Residential Mortgages and Consumer 1,919 4 5.42% 0.13% Total $ 35,384 34 100.00% 2.35% 11
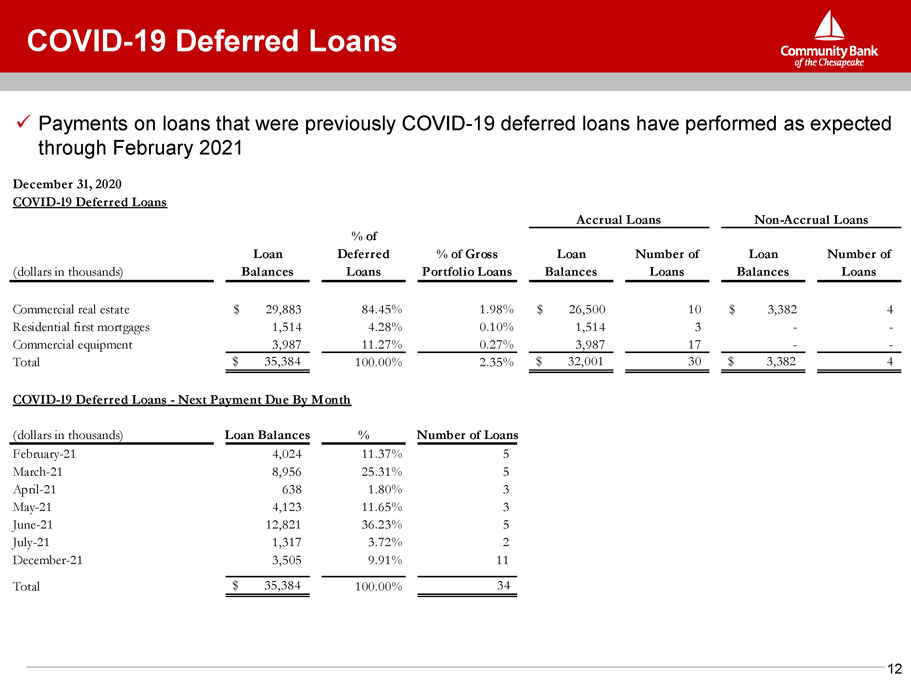
x Payments on loans that were previously COVID - 19 deferred loans have performed as expected through February 2021 December 31, 2020 COVID - 19 Deferred Loans Accrual Loans Non - Accrual Loans COVID - 19 Deferred Loans (dollars in thousands) Loan B a l a nce s % of D efe rr e d Loans % of Gross P o r t f o l i o L o a n s Loan B a l a nce s Number of Loans Loan B a l a nce s Number of Loans Commercial real estate $ 29,883 84.45% 1.98% $ 26,500 10 $ 3,382 4 Residential first mortgages 1,514 4.28% 0.10% 1,514 3 - - Commercial equipment 3,987 11.27% 0.27% 3,987 17 - - Total $ 35,384 100.00% 2.35% $ 32,001 30 $ 3,382 4 COVID - 19 Deferred Loans - Next Payment Due By Month (dollars in thousands) Loan Balances % Number of Loans February - 21 4,024 11.37% 5 March - 21 8,956 25.31% 5 April - 21 638 1.80% 3 May - 21 4,123 11.65% 3 June - 21 12,821 36.23% 5 July - 21 1,317 3.72% 2 December - 21 3,505 9.91% 11 Total $ 35,384 100.00% 34 12

Asset Quality – Classified and Non - Performing Assets x 73%, or $59.5 million, reduction in classified assets (1) since their peak in Q3 2011 from $81.9 million to $22.4 million at Q4 2020 x NPLs (2) + OREO/Gross Portfolio Loans (3) + OREO have decreased from 2.51% at Q4 2018, 1.80% at Q4 2019 to 1.45% at Q4 2020 Source: Management and company filings. (1) Classified assets include loans graded as substandard, doubtful or loss, non - investment grade securities and OREO. (2) NPLs include nonaccrual loans, loans 90+ days past due and accruing TDRs. NPAs include NPLs and OREO. (3) U.S. SBA PPP of $110.3 million at 12/31/2020 are excluded from the above balances and metrics due to their temporary nature. Classified Asset (1) Trends as a Percentage of Assets Nonperforming Asset Composition (“NPAs’) (12/31/2020) 3 . 7 9% 2 . 9 4% 3 . 5 8% 2 . 4 2% 1 . 9 3% 1 . 1 0% 12/31/2015 12/31/2016 12/31/2017 12/31/2018 12/31/2019 12/31/2020 Total Classified Loans Other Real Estate Owned Non - Accrual $ 1 8.2 83% 13 A c c ruing TDRs $ 0 .6 3% OREO $3.1 14% $21.9 Million 1.08% of Assets
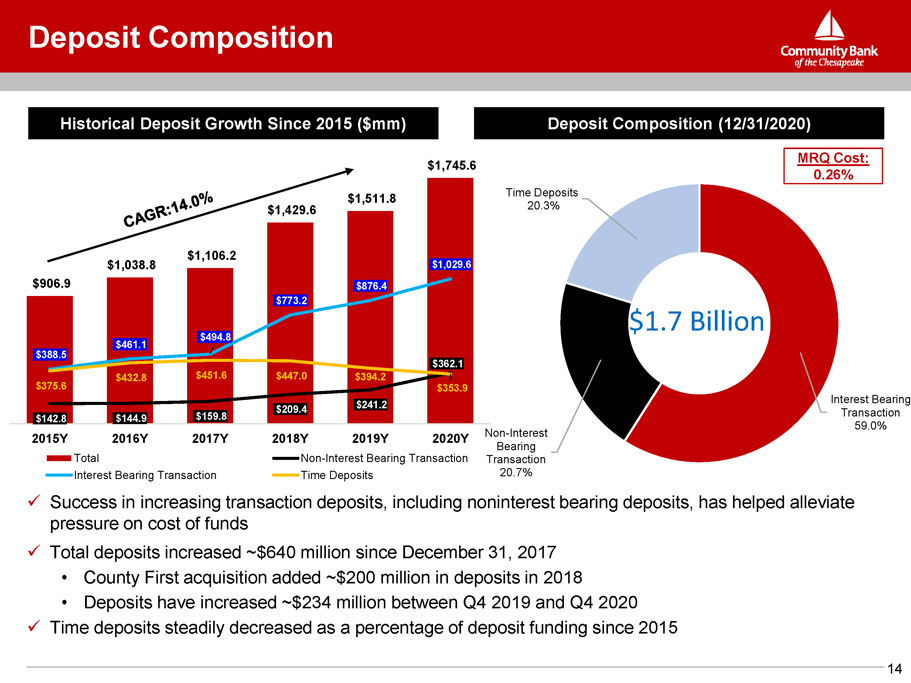
x Success in increasing transaction deposits, including noninterest bearing deposits, has helped alleviate pressure on cost of funds x Total deposits increased ~$640 million since December 31, 2017 • County First acquisition added ~$200 million in deposits in 2018 • Deposits have increased ~$234 million between Q4 2019 and Q4 2020 x Time deposits steadily decreased as a percentage of deposit funding since 2015 Historical Deposit Growth Since 2015 ($mm) Deposit Composition (12/31/2020) M R Q C o s t: 0.26% Deposit Composition $906.9 $1,038.8 $1,106.2 $1,429.6 $1,511.8 $1,745.6 $142 .8 $144 .9 $159 .8 $209 .4 $241 .2 $362 .1 $388 .5 $461 .1 $494.8 $773 .2 $876 .4 $1,029.6 $375.6 $432.8 $451.6 $447 .0 $394 .2 $353.9 2 0 1 5 Y 2 0 1 6 Y 2 0 1 7 Y Total Interest Bearing Transaction 2 0 1 8 Y 2 0 1 9 Y 2 0 2 0 Y Non - Interest Bearing Transaction Time Deposits Inte re s t Bearing Transaction 59.0% 14 No n - Inte re s t Bearing Transaction 20.7% T i m e Depo s i ts 20.3% $1.7 Billion

Net Interest Margin vs. Cost of Funding Cost of Funding and Net Interest Margin 3 . 2 1% 3 . 3 1% 3 . 5 6% 3 . 6 8% 3 . 6 0% 3.4 8 % 3 . 3 7% 3 . 4 3% 3 . 3 1% 3 . 3 6% 1 . 5 9% 1 . 2 1% 0 . 8 8% 0 . 7 4% 0 . 7 5% 0 . 7 3% 0 . 8 1% 0 . 9 9% 1 . 2 2% 0 . 5 7% 1 . 4 3% 1 . 0 5% 0 . 7 1% 0 . 8 0% 1.0 6 % 0.56% 0.48% 0.48% 0.56% 0.47% 2011 2012 2013 2014 2015 2016 2017 2018 2019 2020 Net Interest Margin Cost of Funds Cost of Deposits 15
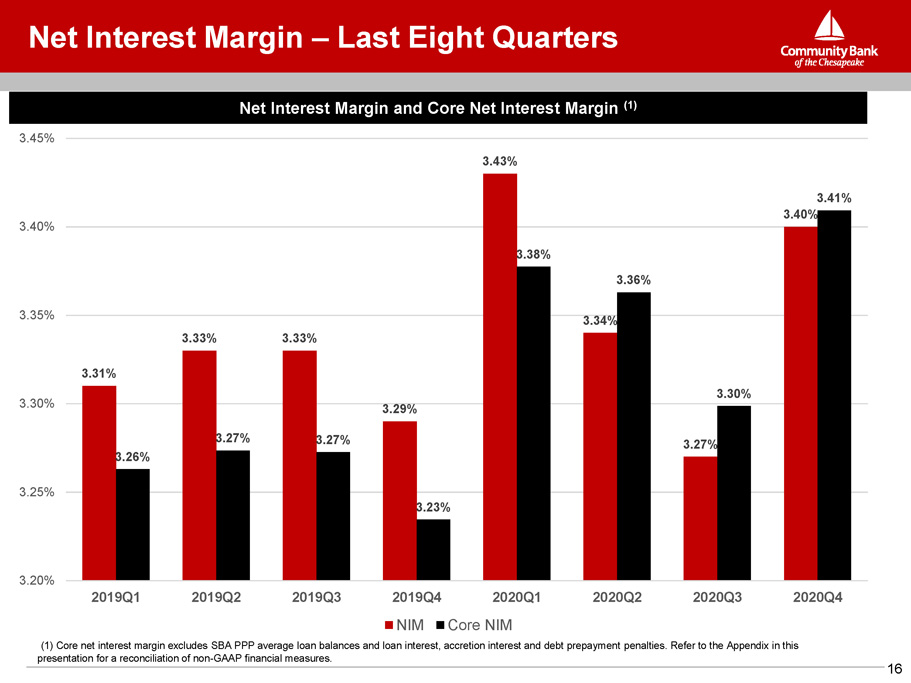
Net Interest Margin and Core Net Interest Margin (1) Net Interest Margin – Last Eight Quarters (1) Core net interest margin excludes SBA PPP average loan balances and loan interest, accretion interest and debt prepayment penalties. Refer to the Appendix in this presentation for a reconciliation of non - GAAP financial measures. 3.31% 3.33% 3.33% 3.29% 3.43% 3 . 34 % 3.27% 3.27% 3.27% 3.23% 3.38% 3.36% 3.30% 3.41% 3.40% 3.26% 3.25% 3 . 2 0 % 3 . 3 0 % 3 . 3 5 % 3 . 4 0 % 3 . 4 5 % 2 0 1 9 Q 1 2 0 1 9 Q 2 2 0 1 9 Q 3 2 0 2 0 Q 2 2 0 2 0 Q 3 2 0 2 0 Q 4 2 0 1 9 Q 4 2 0 2 0 Q 1 NIM Core NIM 16

x The combination of improved expense discipline, continued organic growth and increased noninterest income have produced steady improvement in performance x Closed four of five County First locations during May 2018. Net of one branch (La Plata) added to branch network Return on Average Assets (%) PTPP = Pre - tax Pre - provision Income (1) Increasing Profitability – ROAA 1) Operating results are non - GAAP financial measures. Refer to Appendix to this presentation for a reconciliation. 17

Return on Average Tangible Common Equity (%) PTPP = Pre - tax Pre - provision Income Increasing Profitability – ROATCE 1) Tangible common equity and operating results related measures are non - GAAP financial measures. Refer to Appendix to this presentation for a reconciliation. (1) 18

x Expense control remains a top priority through the COVID - 19 crisis x Increased noninterest income and net interest income in 2020 while maintaining expenses has increased efficiency and PTPP x Ongoing review of operating expense base for specific savings initiatives, including closure of underperforming branches x Efficiency ratio and net operating expense below peer institutions Efficiency & Net Operating Expenses Efficiency Ratio (1) 1) Operating results are non - GAAP financial measures. Refer to Appendix to this presentation for a reconciliation. Net Operating Expense / Avg. Assets (1) 19
Appe n dix 20
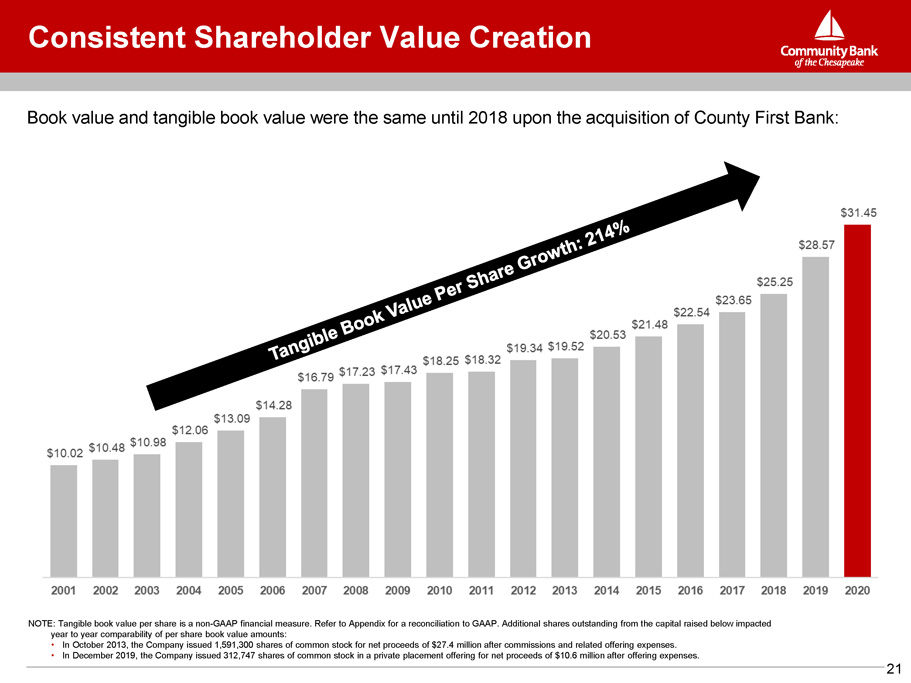
Consistent Shareholder Value Creation NOTE: Tangible book value per share is a non - GAAP financial measure. Refer to Appendix for a reconciliation to GAAP. Additional shares outstanding from the capital raised below impacted year to year comparability of per share book value amounts: • In October 2013, the Company issued 1,591,300 shares of common stock for net proceeds of $27.4 million after commissions and related offering expenses. • In December 2019, the Company issued 312,747 shares of common stock in a private placement offering for net proceeds of $10.6 million after offering expenses. Book value and tangible book value were the same until 2018 upon the acquisition of County First Bank: 21

Non - GAAP Reconciliation Tangible Book Value Per Share & Tangible Common Equity / Tangible Assets ‘‘Tangible book value per share’’ is defined as tangible stockholders’ equity less preferred equity and intangible assets divided by total common shares outstanding . We believe that this measure is important to many investors in the marketplace who are interested in changes from period to period in book value per common share exclusive of changes in intangible assets . (dollars in thousands, except share data) For the Years Ended 2001 2002 2003 2004 2005 2006 2007 2008 2009 2010 2011 S t o ck holde r s ' E qui t y $ 25,586 $ 26,873 $ 27,912 $ 31,124 $ 34,578 $ 37,729 $ 48,847 $ 67,114 $ 68,190 $ 71,105 $ 75,454 Intangible Assets - - - - - - - - - - - Preferred Equity - - - - - - - (16,317) (16,317) (16,317) (20,000) Tangible Common Equity $ 25,586 $ 26,873 $ 27,912 $ 31,124 $ 34,578 $ 37,729 $ 48,847 $ 50,797 $ 51,873 $ 54,788 $ 55,454 Shares Outstanding 2,554,218 2,564,252 2,542,314 2,580,444 2,641,487 2,642,288 2,909,974 2,947,759 2,976,041 3,002,616 3,026,557 Tangible Book Value per Share $ 10.02 $ 10.48 $ 10.98 $ 12.06 $ 13.09 $ 14.28 $ 16.79 $ 17.23 $ 17.43 $ 18.25 $ 18.32 (dollars in thousands, except share data) For the Years Ended 2012 2013 2014 2015 2016 2017 2018 2019 2020 S t o ck holde r s ' E qui t y $ 79,047 $ 110,730 $ 116,559 $ 99,783 $ 104,426 $ 109,957 $ 154,482 $ 181,494 $ 198,013 Intangible Assets - - - - - - (13,641) (12,953) (12,362) Preferred Equity (20,000) (20,000) (20,000) - - - - - - Tangible Common Equity $ 59,047 $ 90,730 $ 96,559 $ 99,783 $ 104,426 $ 109,957 $ 140,841 $ 168,541 $ 185,651 Total Assets $ 981,639 $1,023,824 $1,082,878 $1,143,332 $1,334,257 $1,405,961 $1,689,227 $1,797,536 $2,026,439 Intangible Assets - - - - - - (13,641) (12,953) (12,362) Tangible Assets $ 981,639 $1,023,824 $1,082,878 $1,143,332 $1,334,257 $1,405,961 $1,675,586 $1,784,583 $2,014,077 Shares Outstanding 3,052,416 4,647,407 4,702,715 4,645,429 4,633,868 4,649,658 5,577,559 5,900,249 5,903,613 Tangible Book Value per Share $ 19.34 $ 19.52 $ 20.53 $ 21.48 $ 22.54 $ 23.65 $ 25.25 $ 28.57 $ 31.45 Tangible Common Equity/Tangible Assets 6.02% 8.86% 8.92% 8.73% 7.83% 7.82% 8.41% 9.44% 9.22% G AA P B oo k V alu e $ 25.90 $ 23.83 $ 24.79 $ 21.48 $ 22.54 $ 23.65 $ 27.70 $ 30.76 $ 33.54 22

Non - GAAP Reconciliation 23 Efficiency Ratio & Noninterest Expense and Net Operating Expense to Average Assets 1) Net operating expense is non - interest expense offset by non - interest income. ‘‘Efficiency ratio” is defined as recurring non - interest expense less foreclosed real estate (OREO) expenses and valuation allowances, less merger and acquisition costs, less amortization of intangible assets divided by operating revenue. Operating revenue is equal to net interest income plus non - interest income excluding gains and losses on securities and foreclosed real estate. In our judgment, the adjustments made to non - interest expense and operating revenue allow investors and analysts to better assess our operating expenses in relation to our core operating revenue by removing the volatility that is associated with certain one - time items and other discrete items that are unrelated to our core business. “Efficiency ratio as reported” is defined as non - interest expense divided by operating revenue. This is the ratio that appears in the Company’s SEC filings. (dollars in thousands, except share data) For the Years Ended 2015 2016 2017 2018 2019 2020 Non - I n t e r e s t E x pen s e $ 28,418 $ 29,159 $ 30,097 $ 38,149 $ 36,233 $ 38,003 O R EO V alua t io n A llowan ce & E x pen s e s (1,059) (861) (746) (657) (963) (3,200) Merger Costs - - (829) (3,625) - - Adjusted Non - Interest Expense (Numerator) $ 27,359 $ 28,298 $ 28,522 $ 33,867 $ 35,270 $ 34,803 Net Interest Income $ 36,528 $ 39,905 $ 43,388 $ 50,887 $ 53,534 $ 60,917 Non - I n t e r e s t I n c o m e 3,299 3,360 4,084 4,068 5,766 8,416 ( G ain s ) / Lo ss e s o n O R EO Di s po s al s 20 436 (43) 8 - - Realized (Gains) Losses on Other Assets 407 (12) (47) (1) 1 (6) Un r eali z e d ( G ain s ) Lo ss e s o n E qui t y S e c u r i t ie s - - - 81 (134) (101) Realized (Gains) Losses on Securities (4) (31) (175) - (226) (1,384) Operaing Revenue (Denominator) $ 40,250 $ 43,658 $ 47,207 $ 55,043 $ 58,941 $ 67,842 Average Assets $1,092,906 $1,229,470 $1,376,983 $1,603,393 $1,743,448 $1,985,275 Repo r t e d E ff i c ien cy Ra t i o 71.4% 67.4% 63.4% 69.4% 61.1% 54.8% E ff i c ien cy Ra t i o 68.0% 64.8% 60.4% 61.5% 59.8% 51.3% Reported Non - interest Expense/Avg Assets 2.60% 2.37% 2.19% 2.38% 2.08% 1.91% Operating Non - interest Expense/Avg Assets 2.50% 2.30% 2.07% 2.11% 2.02% 1.75% Repo r t e d Ne t O pe r a t in g E x pen s e / Av g A ss e t s ( 1 ) 2.30% 2.10% 1.89% 2.13% 1.75% 1.49% O pe r a t in g Ne t O pe r a t in g E x pen s e / Av g A ss e t s ( 1 ) 2.16% 2.00% 1.79% 1.85% 1.71% 1.40%

Non - GAAP Reconciliation 24 Operating Metrics – Excluding the Impact of the Tax Cuts and Jobs Act & One - Time Merger Costs During 2017 and 2018, our operating results were impacted by one - time expenses related to our acquisition of County First Bank. During 2017, the Tax Cut and Jobs Act of 2017 had a one - time impact to earnings in the fourth quarter of 2017. We believe that investors would benefit from analyzing our profitability and expense metrics excluding these one - time items. (dollars in thousands, except share data) For the Years Ended 2016 2017 2018 2019 2020 Net Income (as reported) $ 7,331 $ 7,208 $ 11,228 $ 15,272 $ 16,136 T a x Cu t s an d J ob s A ct ( ne t o f t a x ) - 2,740 - - - Merger Costs (net of tax) - 724 2,693 - - Non - GAAP Operating Net Income $ 7,331 $ 10,672 $ 13,921 $ 15,272 $ 16,136 Reported Return on Average Assets 0.60% 0.52% 0.70% 0.88% 0.81% Operating Return on Average Assets 0.60% 0.78% 0.87% 0.88% 0.81% Reported Return on Average Common Equity 7.09% 6.55% 7.53% 9.32% 8.46% Operating Return on Average Common Equity 7.09% 9.70% 9.33% 9.32% 8.46% Reported Return on Average Tangible Common Equity 7.09% 6.55% 8.29% 10.14% 9.06% Operating Return on Average Tangible Common Equity 7.09% 9.70% 10.28% 10.14% 9.06% Reported Diluted Earnings Per Share $ 1.59 $ 1.56 $ 2.02 $ 2.75 $ 2.74 Operating Diluted Earnings Per Share $ 1.59 $ 2.31 $ 2.51 $ 2.75 $ 2.74 Average Assets $1,229,470 $1,376,983 $1,603,393 $1,743,448 $1,985,275 Average Equity $ 103,397 $ 109,979 $ 149,128 $ 163,936 $ 190,720 Average Tangible Common Equity $ 103,397 $ 109,979 $ 135,480 $ 150,622 $ 178,048 Weighted Average Common Shares Outstanding 4,599,502 4,629,228 5,550,510 5,560,588 5,893,559

Non - GAAP Reconciliation 25 Net Interest Margin and Core Net Interest Margin We believe core net interest margin, which reflects our net interest margin before the impact of U.S. SBA PPP loan interest and average balances, accretion interest on acquired loans and prepayment penalties of long - term debt, allows investors to better assess our net interest margin in relation to our core net interest margin by removing the volatility associated with volatility and temporary interest income and interest expense for comparable institutions. We also believe that during a crisis such as the COVID - 19 pandemic, this information is useful as the impact of the pandemic on net interest income of various institutions will likely vary based on the geography of the communities served by a particular institution. For the Three Months Ended 2019Q1 2019Q2 2019Q3 2019Q4 2020Q1 2020Q2 2020Q3 2020Q4 Average Interest - Earning Assets ("IEAs") 1,577,089 1,594,616 1,623,561 1,666,172 1,673,608 1,820,775 1,882,718 1,881,581 Less: Average SBA PPP Loans - - - - - (90,132 ) (127,092 ) (120,473 ) Adjusted Average IEAs 1,577,089 1,594,616 1,623,561 1,666,172 1,673,608 1,730,643 1,755,626 1,761,108 Net Interest Income 13,037 13,259 13,525 13,713 14,353 15,224 15,368 15,972 Less: Accretion Interest (172) (209) (242) (240) (222) (181) (111) (96) Less: PPP Income - - - - - (493) (902) (1,308) A dd : F H L B P r e p a y m e n t P e n a l t y - - - - - - 123 442 Adjusted Net Interest Income 12,865 13,050 13,283 13,473 14,131 14,550 14,478 15,010 Net Interest Margin 3.31% 3.33% 3.33% 3.29% 3.43% 3.34% 3.27% 3.40% Core Net Interest Margin 3.26% 3.27% 3.27% 3.23% 3.38% 3.36% 3.30% 3.41%

Non - GAAP Reconciliation Pre - Tax Pre - Provision (“PTPP”) Income ROAA, ROACE and ROATCE We believe that pre - tax pre - provision income, which reflects our profitability before income taxes and loan loss provisions, allows investors to better assess our operating income and expenses in relation to our core operating revenue by removing the volatility that is associated with credit provisions and different state income tax rates for comparable institutions. We also believe that during a crisis such as the COVID - 19 pandemic, this information is useful as the impact of the pandemic on the loan loss provisions of various institutions will likely vary based on the geography of the communities served by a particular institution. 2016 2017 2018 2019 2020 Net Income (as reported) $ 7,331 $ 7,208 $ 11,228 $ 15,272 $ 16,136 Loan Loss Provision 2,359 1,010 1,405 2,130 10,700 Income Taxes 4,416 9,157 4,173 5,665 4,494 Non - GAAP PTPP Income $ 14,106 $ 17,375 $ 16,806 $ 23,067 $ 31,330 PTPP ROAA 1.15% 1.26% 1.05% 1.32% 1.58% PTPP ROACE 13.64% 15.80% 11.27% 14.07% 16.43% PTPP ROATCE 13.64% 15.80% 12.40% 15.31% 17.60% Average Assets $ 1 , 229 , 47 1 $ 1 , 376 , 98 3 $ 1 , 603 , 39 3 $ 1 , 743 , 44 8 $ 1 , 985 , 27 5 Average Equity $ 103,397 $ 109,979 $ 149,128 $ 163,936 $ 190,720 Average Tangible Common Equity $ 103,397 $ 109,979 $ 135,480 $ 150,622 $ 178,048 26 (dollars in thousands) For the Years Ended
Serious News for Serious Traders! Try StreetInsider.com Premium Free!
You May Also Be Interested In
- AUTODESK ALERT: Bragar Eagel & Squire, P.C. Announces that a Class Action Lawsuit Has Been Filed Against Autodesk, Inc. and Encourages Investors to Contact the Firm
- Wright Electric Announces First Steps of Electric Propulsion Testing
- Marex Group plc Announces Pricing of Initial Public Offering
Create E-mail Alert Related Categories
SEC FilingsSign up for StreetInsider Free!
Receive full access to all new and archived articles, unlimited portfolio tracking, e-mail alerts, custom newswires and RSS feeds - and more!
