

Form 8-K CION Investment Corp For: Sep 24
 Tweet
Tweet Share
Share
UNITED STATES
SECURITIES AND EXCHANGE COMMISSION
WASHINGTON, D.C. 20549
____________________
FORM 8-K
CURRENT REPORT
Pursuant to Section 13 or 15(d) of the
Securities Exchange Act of 1934
Date of Report (Date of earliest event reported): September 24, 2021
CĪON Investment Corporation
(Exact Name of Registrant as Specified in Charter)
| Maryland | 000-54755 | 45-3058280 | ||
| (State or Other Jurisdiction of Incorporation) | (Commission File Number) | (I.R.S. Employer Identification No.) |
3 Park Avenue, 36th Floor New York, New York 10016 |
||
| (Address of Principal Executive Offices) |
| (212) 418-4700 | ||
| (Registrant’s telephone number, including area code) |
| Not applicable | ||
| (Former name or former address, if changed since last report) |
Check the appropriate box below if the Form 8-K filing is intended to simultaneously satisfy the filing obligation of the registrant under any of the following provisions:
¨ Written communications pursuant to Rule 425 under the Securities Act (17 CFR 230.425)
¨ Soliciting material pursuant to Rule 14a-12 under the Exchange Act (17 CFR 240.14a-12)
¨ Pre-commencement communications pursuant to Rule 14d-2(b) under the Exchange Act (17 CFR 240.14d-2(b))
¨ Pre-commencement communications pursuant to Rule 13e-4(c) under the Exchange Act (17 CFR 240.13e-4(c))
Securities registered pursuant to Section 12(b) of the Act:
| Title of each class | Trading symbol(s) | Name of each exchange on which registered | ||
| None | Not applicable | Not applicable |
Indicate by check mark whether the registrant is an emerging growth company as defined in Rule 405 of the Securities Act of 1933 (§230.405 of this chapter) or Rule 12b-2 of the Securities Exchange Act of 1934 (§240.12b-2 of this chapter).
Emerging growth company ¨
If an emerging growth company, indicate by check mark if the registrant has elected not to use the extended transition period for complying with any new or revised financial accounting standards provided pursuant to Section 13(a) of the Exchange Act. ¨
Item 7.01. Regulation FD Disclosure.
CĪON Investment Corporation (“CIC”) expects to make presentations on and after September 24, 2021 to certain institutions and prospective investors. The presentation is attached hereto as Exhibit 99.1.
The information in this Item 7.01 and Exhibit 99.1 attached hereto shall not be deemed “filed” for purposes of Section 18 of the Securities Exchange Act of 1934, as amended (“Exchange Act”), or otherwise subject to the liabilities of that section, nor shall such information be deemed incorporated by reference in any filing under the Securities Act of 1933, as amended, or the Exchange Act, except as shall be expressly set forth by specific reference in such a filing.
Item 9.01. Financial Statements and Exhibits.
| (d) | Exhibits. |
| 99.1 | Presentation dated September 24, 2021. |
| SIGNATURES |
Pursuant to the requirements of the Securities Exchange Act of 1934, as amended, the Registrant has duly caused this report to be signed on its behalf by the undersigned hereunto duly authorized.
CĪON Investment Corporation
| ||
| Date: | September 24, 2021 | By: /s/ Michael A. Reisner |
| Co-Chief Executive Officer |
EXHIBIT LIST
| EXHIBIT NUMBER |
DESCRIPTION |
| 99.1 | Presentation dated September 24, 2021 |
Exhibit 99.1

CION Investment Corporation (CION) Investor Presentation September 2021

Disclosures 2 This presentation has been prepared by CĪON Investment Corporation (the “Company” or “CION”) and may be used for information purposes only . This presentation shall not constitute an offer to sell or the solicitation of any offer to buy any securities . Any such offering of securities will be made only by means of a registration statement (including a prospectus) filed with the U . S . Securities and Exchange Commission (the “SEC”), and only after such registration statement has become effective . No such registration statement has been filed or become effective as of the date of this presentation . The information contained herein remains subject to further updating, revision, and amendment without notice . It should not be relied upon as the basis for making any investment decision, entering into any transaction or for any other purpose . This information is not, and under no circumstances is to be construed as, a prospectus or an offering memorandum as defined under applicable securities legislation . The information contained herein does not set forth all of the terms, conditions and risks of the Company . An investment in the Company is speculative and involves a high degree of risk, which may not be suitable for all investors . Risks and limitations include, but are not limited to, the following : investment instruments may be susceptible to economic downturns ; most of the underlying credit instruments are rated (or would be rated, if rated) below investment grade and considered speculative ; Company’s business and operations may be impacted by fluctuations in the capital markets ; the Company has limited liquidity and there is no guarantee that shareholders will be able to liquidate their investment in the Company to the extent desired or at all . The Company, its investment adviser and their respective subsidiaries and affiliates and their respective employees, officers and agents make no representations as to the completeness and accuracy of any information contained within this written material . As such, they are not responsible for errors and/or omissions with respect to the information contained herein except and as required by law . In considering investment performance information contained in this presentation, bear in mind that past performance is not necessarily indicative of future results and there can be no assurance that the Company will achieve comparable results . Actual realized value of currently unrealized investments will depend on, among other factors, future operating results, the value of the assets and market conditions at the time of disposition, any related transaction costs and the timing and manner of sale, all of which may differ from the assumptions and circumstances on which the current unrealized valuations are based . Accordingly, the actual realized values of unrealized investments may differ materially from the values indicated herein . Certain information contained in this presentation has been obtained from published and non - published sources and/or prepared by third parties and in certain cases has not been updated through the date hereof . Such information has not been independently verified by the Company and the Company does not assume responsibility for the accuracy of such information (or updating the presentation based on facts learned following its issuance) . Forward - Looking Statements This presentation may contain “forward - looking statements” within the meaning of the Private Securities Litigation Reform Act of 1995 . Statements other than statements of historical facts included in this presentation may constitute forward - looking statements and are not guarantees of future performance or results and involve a number of risks and uncertainties . Actual results may differ materially from those in the forward - looking statements as a result of a number of factors, including those described from time to time in filings with the SEC . The Company undertakes no duty to update any forward - looking statement made herein . All forward - looking statements speak only as of the date of this presentation .

• 17 years of investing experience • Co - Founder, CION Investment Group, LLC • Co - CEO, CION Investment Corporation • Co - CEO, CION Ares Diversified Credit Fund Mark Gatto Co - Chief Executive Officer • Attorney, private practice in NJ • B.A., Montclair State University; J.D. and M.B.A, Seton Hall University • 17 years of investing experience • Co - Founder, CION Investment Group, LLC • Co - CEO, CION Investment Corporation • Co - CEO, CION Ares Diversified Credit Fund Michael A. Reisner Co - Chief Executive Officer • Attorney, private practice in NY • B.A., University of Vermont; J.D., cum laude, New York Law School 3 CION’s Executive Team • 25+ years of banking and investing experience • Wasserstein Perella, Bankers Trust, BT Alex.Brown, Deutsche Bank, Briscoe Capital, and Plainfield Asset Management • B.S., magna cum laude, Rensselaer Polytechnic Institute; M.B.A, Columbia University • Chartered Financial Analyst® Gregg Bresner President & Chief Investment Officer • 25+ years of corporate finance and operations experience • E&Y LLP audit and business advisory practice, SMART Business Advisory and Consulting, LLP, Voxx International Corp. • B.S., Binghamton University • Certified Public Accountant; FINRA Licensed Series 27 FinOp • Member of American Institute of Certified Public Accountants (AICPA) • NYS Society of CPAs (NYSSCPA) Keith Franz Chief Financial Officer & Treasurer • 25 years of banking and investing experience • Credit Suisse First Boston, Deutsche Bank, Bankers Trust Company, Royal Bank of Scotland and BNP Paribas • Formerly a CPA at KPMG • B.S., Villanova University; M.B.A, Columbia University Geoff Manna Senior Managing Director, Originations • 16 years experience • Guggenheim Partners in the Corporate Credit Group, LBC Credit Partners • Restructuring consultant at both FTI and E&Y • B.S., University of Pennsylvania, M.B.A., Columbia University Joe Elsabee Managing Director, Originations and Credit

Subject to market conditions and final Board of Directors and NYSE approvals Anticipated Timing 1.50% management fee on average gross assets, 1.00% on average gross assets will apply to any amount of assets attributable to leverage decreasing CION’s asset coverage ratio below 200% 17.5% incentive fee on income; subject to 6.5% hurdle 17.5% incentive fee on capital gains; net of all unrealized and realized losses Fee Structure upon Listing 1 $8.17 2 ($16.34 after giving effect to the two - to - one reverse stock split effective on September 21, 2021) Net Asset Value per Share NYSE: CION Exchange / Ticker CION Investment Corporation Company Name Shares Outstanding 113,297,189 2 ( 56,958,440 after giving effect to the two - to - one reverse stock split effective on September 21, 2021); all shares will be listed Post - Listing Transferability A shareholder can transfer: • up to one - third of the shares held by such shareholder commencing on the listing; • up to two - thirds of the shares held by such shareholder commencing 180 days following the listing; and • all of the shares held by such shareholder commencing 270 days following the listing. (1) With fee amendments, following shareholder and board approval and a listing event. (2) Data as of June 30, 2021. 4 CION Listing Details Up to $50 million share repurchase program upon Board of Directors approval Share Repurchase Program

$4 $105 $362 $670 $1,089 $1,714 $1,865 $1,765 $1,569 $1,724 Total Portfolio Investments ($ in Millions, at Fair Value) Jan - 19: Follow - on continuous public offering ends FY’19 FY’17 FY’16 FY’14 FY’15 FY’12 FY’13 FY’18 FY’20 FY’21 Dec - 12: CION officially commences operations 5 CION is a leading middle market lender and business development company focused on senior secured debt of U.S. middle market companies with <$75 million of annual EBITDA Source: Company Filings. Note: Financial data as of June 30, 2021. (1) Represents cumulative return before sales charge, 58.9% or an annualized return of 5.6% with sales charge. (2) The cumulative annualized loss rate as of June 30, 2021 is calculated as the aggregate investment cost at write - off less (i) any economic benefit realized (interest and fees) and (ii) any economic recovery over total Invested Capital. Evolution of CION Investment Corporation 2012 Inception Year $1.15B Total Equity Raised 76.6% Cumulative Return Since Inception 1 30+ Advisor Years of Experience 0.09% Annualized Loss Rate Since Inception 2 6.9% Annualized Return Since Inception 1

CIM appoints Gregg Bresner as Senior Managing Director and Chief Investment Officer • CION Investment Group, LLC (“CION Investment Group”) is a vertically integrated alternative investment manager and retail distribution organization with over $4B in AUM as of June 30, 2021 • Direct access to alternative investment products that are not readily available to individual investors through traditional investment managers • CION Investment Group’s platform offers premier asset management, differentiated strategies, and investor - first structures • CION Investment Group is supported by 73 employees • CION Investment Corporation is managed by CION Investment Management, LLC (“CIM”), a subsidiary of CION Investment Group 6 Note: Unless otherwise indicated, all data as of June 30, 2021. CION Investment Group Overview KEY MILESTONES - CION INVESTMENT GROUP & CION CION Investment Group CION Investment Corporation CION Investment Group is formed CION Investment Corporation is launched 2012 2013 2014 2015 2016 2018 2020 2021 2011 CION terminates AIM sub - advisory relationship and AIM and CION Investment Group enter into Joint Venture CION Investment Group launches interval fund with Ares Management Interval Fund reaches $1B in Total Managed Assets CION issues $125M of Unsecured Notes, private IG rating CION reaches $1B in capital raises CION announces acquisition of Credit Suisse Park View BDC, Inc. CION ends continuous follow - on offering CION enters into $30M unsecured Term Loan Agreement with More Provident Funds Ltd. Legend: Apollo Investment Management (“AIM”) engaged as sub - advisor, Apollo affiliates execute Private Placement CION Investment Group launches CR Student Housing Fund CION Investment Group proposed Joint Venture with international real estate manager 2019 2017

• Rigorous in - house underwriting is an effective “filter” for top - quality origination • Top - tier institutional relationships; including PE firms, asset managers, investment banks, and other middle market lenders • 2,500+ transactions closed and $6.7B capital deployed since inception, providing deep experience in a range of industries Differentiated approach to origination & investment pipeline • Risk management is core to CION’s investment philosophy, no individual investment >2.4% of portfolio • Focused on constructing a highly diversified portfolio: 132 portfolio companies across 22 industries • High degree of selectivity, closed on only approximately 5% of loans reviewed Deal sourcing anchored to rigorous credit culture • Commenced operations in 2012 and grown to $1.7B in investments, with cumulative total return of 76.6% (annualized return of 6.88%) from inception through June 30, 2021 1 • Experienced management team, with >100 years of combined financial market experience • Robust 18 - person team at CION Investment Management, with 11 investment professionals Experienced team with consistent and resilient credit performance • Focus on direct or club first lien investments at the top of the borrowers’ capital stack • 93% senior secured loans and 97% of portfolio companies with PE and financial institution sponsorship • Minimum exposure to cyclical industries, with a cumulative annualized loss rate of only 0.09% 2 High - quality portfolio focused on senior secured loans • With leverage of 0.87x, among the lowest in the sector, CION has generated a 9.0% NII return on equity 3 • Attractive return on NAV at current < 1x debt - to - equity levels and predominantly first lien portfolio • More than $350mm of incremental leverage capacity if 150% asset coverage approved by shareholders 4 Conservative leverage, with potential meaningful increase 7 CION Investment Corporation Highlights Source: Company filings. Note: All financial data as of June 30, 2021. (1) For initial shareholders who subscribed to the off eri ng in December 2012 with an initial investment of $10,000 and an initial purchase price equal to $9.00 per share (public offering price excluding sales load). (2) The cumulative annualized loss rate as of June 30, 2021 is calculated as th e a ggregate investment cost at write - off less (i) any economic benefit realized (interest and fees) and (ii) any economic recovery over total Invested Capital. (3) Calculated as of June 30, 2021 using TTM NII to average net assets. (4) If CION’s l eve rage does increase, shareholders would bear the burden of any increase in CION’s expenses as a result of such additional leverage, including interest expense, and any increase in the advisory fees payable to CIM. In addition, if the va lue of CION’s assets decreases, increased leverage would cause net asset value and net investment income to decline more rapidly and to a greater extent than they otherwise would have had CION not incurred increased leverage, which would neg ati vely affect CION’s ability to pay distributions to shareholders. 1 2 3 4 5
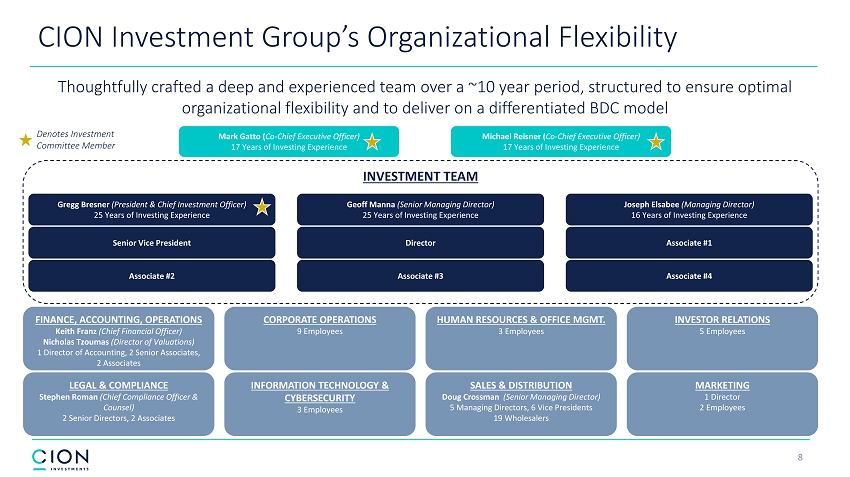
FINANCE, ACCOUNTING, OPERATIONS Keith Franz (Chief Financial Officer) Nicholas Tzoumas (Director of Valuations) 1 Director of Accounting, 2 Senior Associates, 2 Associates LEGAL & COMPLIANCE Stephen Roman (Chief Compliance Officer & Counsel) 2 Senior Directors, 2 Associates CORPORATE OPERATIONS 9 Employees HUMAN RESOURCES & OFFICE MGMT. 3 Employees INVESTOR RELATIONS 5 Employees INFORMATION TECHNOLOGY & CYBERSECURITY 3 Employees MARKETING 1 Director 2 Employees SALES & DISTRIBUTION Doug Crossman (Senior Managing Director) 5 Managing Directors, 6 Vice Presidents 19 Wholesalers 8 CION Investment Group’s Organizational Flexibility Thoughtfully crafted a deep and experienced team over a ~10 year period, structured to ensure optimal organizational flexibility and to deliver on a differentiated BDC model INVESTMENT TEAM Mark Gatto ( Co - Chief Executive Officer) 17 Years of Investing Experience Michael Reisner ( Co - Chief Executive Officer) 17 Years of Investing Experience Gregg Bresner (President & Chief Investment Officer) 25 Years of Investing Experience Geoff Manna (Senior Managing Director) 25 Years of Investing Experience Joseph Elsabee (Managing Director) 16 Years of Investing Experience Denotes Investment Committee Member Senior Vice President Director Associate #1 Associate #2 Associate #3 Associate #4

9 How does CION Differentiate Itself in the Market? Exclusive Focus of Investment Team Organizational Flexibility Provides a Competitive Advantage Robust Sourcing Approach that is Differentiated and Scaled Fund Flexibility and Scale are Highly Advantageous INVESTMENT PLATFORM Target First Lien Market for Special Situation/Higher Yielding Opportunities Underwriting Anchored with Rigorous Credit Culture Drive Investor Returns through First Lien Investment Focus Commitment to Portfolio and Sourcing Diversification INVESTMENT STRATEGY

10 The BDC is the Exclusive Focus of CIM’s Investment Team Single BDC strategy provides a tremendous focus and efficiency to sourcing, underwriting and portfolio management ▪ Unlike many listed BDC peers, CION’s investment team focuses solely on one fund and not an entire platform, which provides tremendous focus and efficiency in sourcing, underwriting and portfolio management ▪ Investment team unequivocally understands the investment criteria acceptable to the Investment Committee - Empowers team to be focused and efficient in evaluating opportunities, particularly at the pre - screening stage ▪ Many benefits of scaling a $1.8 billion fund with an exclusive focus: - Target highly attainable $20 million initial hold sizes – impactful investor in the market, but not a burdensome allocation amou nt to club partners and capital markets desks (i.e. don’t need at least $50 million to satisfy the “platform”) - Not required to satisfy the inherent conflicts associated with differing investment objectives and legal/regulatory considera tio ns of multiple feeder funds on the platform - Highly advantageous in situations where amendments / follow - on capital are needed – not having to confront the differing objecti ves, technical requirements and requests of multiple fund managers across a platform INVESTMENT PLATFORM ADVANTAGES

11 Organizational Flexibility Provides a Competitive Advantage INVESTMENT PLATFORM ADVANTAGES Flat organizational structure and highly involved Investment Committee results in efficient, dynamic culture ▪ Highly iterative approach enhances underwriting, execution and monitoring and enables team to provide more timely feedback/responses to borrowers and partners ▪ Emphasize pre - screening and “front - loading” of critical underwriting issues ▪ Transactions staffed by industry specialization and investment team assumes ownership of investments from sourcing through ex it — highly beneficial for staff development ▪ Integrated approach provides transaction and relationship continuity, and portfolio monitoring synergies ▪ Efficient, three - person investment committee (Gatto, Reisner, Bresner)

12 Highly Inclusive Sourcing Approach Avoiding Traditional Sponsor Coverage Model INVESTMENT PLATFORM ADVANTAGES Highly inclusive sourcing approach is accretive to both the size of the investment opportunity funnel and returns ▪ Focus on direct first lien club investments with a deep and diverse network of like - minded partners - Club partner relationships often date back for decades; proven to be recurring and scalable - Familiarity leads to efficient vetting, evaluation and diligence x Partners know exactly the investment characteristics we prefer x More streamlined processes with higher probabilities of success x California Lending License provides competitive advantage as originator and club member - Indirectly benefit from resources of club partners – more “boots on the ground” – and reduces our opportunity cost of sourcing e fforts ▪ Focus on a select group of private sponsors where we have deep, long - term personal relationships and successful track records of performance and portfolio support - Except for a limited set of syndicated transactions, rarely invest with large cap PE sponsors that typically demand large con cen tration commitments, tighter economics and relatively loose credit documents ▪ Avoid the traditional sponsor coverage model that has inherently lower probability of closing - Requires the need to win two distinct processes (sponsor acquisition and financing) which we believe represents a 2% - 3% implie d success rate, i.e. 1/10 sponsor win combined with 1/3 to 1/5 win of sponsor financing

Robust Sourcing Approach that is Differentiated and Scaled 13 CION generates deal flow from an extensive network of 100+ partners SELECT KEY PARTNERS THAT CION HAS TRANSACTED WITH

CIM maintains consistently strong deal flow yet remains highly selective and efficient in evaluating investment opportunities 2021 YTD as of 6/30/21 Number of Deals % of Total Deals Sourced 288 100% 70 25% 30 10% 28 < 10% Strong Origination Funnel with Disciplined Underwriting 14 Deal Sourced Final Investment Committee Approval Deal Closed Investment Pre - Screened

15 CION has Consistently Originated Premium 1 st Lien Yields vs. the Overall Loan Market 4.92% 5.90% 6.66% 5.56% 4.53% 7.59% 9.17% 9.77% 9.02% 8.37% 6.36% 7.06% 8.07% 7.44% 5.98% 2017 2018 2019 2020 YTD 2021 S&P Middle-Market Index (> $50 million of EBITDA) CION 1st Lien Origination S&P Middle-Market Index (<= $50 million of EBITDA) $118 $45 $74 $63 $56 2017 2018 2019 2020 YTD 2021 Wtd. Avg. Portfolio Company EBITDA at Time of Origination CION 1ST LIEN ORIGINATION YIELDS VS. S&P MIDDLE MARKET LOAN INDICES 1, 2 CION AVG. PORTFOLIO COMPANY EBITDA AT TIME OF ORIGINATION 3 ($ in Millions) (1) S&P LCD new - issue yield data for Middle Market volume for tranche sizes of $350 million or below. (2) Represents the weighted average yield maturity at investment closing for CION originated 1 st lien loans (excluding revolvers and delayed draw tranches). (3) Represents the weighted average portfolio company EBITDA at investment closing for the loans included in the CION yield calcu lat ion.

16 Select CION Investments Case Study 1 CION was invited to join a club formed to finance the acquisition of one of the largest tax - preparation services in the United States, responsible for preparing over 2 million federal, state, and local income - tax returns each year . Summary Terms: Structure 1 st Lien Tranche Size $175 million Maturity 5 years Coupon L + 6.25%, Floor: 1.00% Price 98.0 Covenants Yes Call Protection 102/101/PAR Case Study 2 CION was invited to provide growth financing to a leading provider of maintenance and support services for the $ 28 B market for mission critical enterprise software . The borrower services nearly 1 , 300 customers, including many Fortune 500 companies, and was a special situation due to litigation risk . Summary Terms: Structure 1 st Lien Tranche Size $125 million Maturity 4 years Coupon 12% Cash/3% PIK Price 98.0 Covenants Yes Call Protection MWP - 3/103/102/101/PAR plus exit fee Organizational flexibility, execution efficiencies, and ability to provide flexible solutions differentiates CION as a lender with borrowers and partners Summary Terms: Structure 1 st Lien Tranche Size $60 million Maturity 5 years Coupon L + 8.00%, Floor: 1.00% Price 97.0 Covenants Yes Call Protection 103/102/101 Case Study 3 CION led the refinancing for one of the largest independent producers/distributors of first - run syndicated TV programming, which owned seven 24 - hour HD cable television networks serving nearly 70 million subscribers . Case Study 4 CION and certain of its partners provided (i) club financing for the acquisition of a major cable channel by one of the largest independent producers/distributors of first - run syndicated TV programming, which owned seven 24 - hour HD cable television networks serving nearly 70 million subscribers, and (ii) the refinancing of the previous CION - led facility . Summary Terms: Structure 1 st Lien Tranche Size $315 million Maturity 7 years Coupon L + 9.25%, Floor: 1.00% Price 97.5 Covenants Yes Call Protection MWP/103/102/101/PAR

17 Select CION Investments (Cont’d) In addition, CION is able to lead deals and maintains unique relationships with key borrowers Case Study 5 CION led the financing for the acquisition of a leading North American supplier of custom mechanical and manufacturing solutions for leading Fortune 500 technology - driven companies, whose capabilities include custom prototyping, engineering and tooling, precision manufacturing and assembly and finishing . Summary Terms: Structure 1 st Lien Tranche Size $32 million Maturity 5 years Coupon L + 10%, plus equity warrants Price 98.0 Covenants Yes Call Protection 101/PAR Summary Terms: Structure Participating Preferred Tranche Size $25.4 million Maturity 10 Years Coupon 12% PIK Price Par Covenants Yes Call Protection 103 plus common equity Case Study 7 CION acquired the second lien term loan of a borrower that provides specialized medical communication services to the oncology pharmaceutical and biotechnology industry, as part of CION’s acquisition of the CS Parkview BDC . CION exchanged its 2 L holding into participating preferred equity . Summary Terms: Structure 1 st Lien Tranche Size $35 milion Maturity 5 years Coupon 12% Fixed Price 97.0 Covenants Yes Call Protection 103/102/101/PAR plus warrants Case Study 6 CION and its partner provided growth financing for a company that provides software that helps to simplify the solar panel installation process and panel monitoring process for independent sales personnel, homeowners, and independent build partners .

$1.7B Total Portfolio at Fair Value 132 Portfolio Companies 0.4% Investments on Non - Accrual Status, Fair Value $49.0mm Median Annual Portfolio Company EBITDA 18 Source: Company Filings. Note: Financial data as of June 30, 2021. Numbers may not sum to 100% due to rounding. (1) Represents gross annual portfolio yield on debt investments based upon purchase price. 93% Senior Secured Debt Investments PORTFOLIO BY SECURITY TYPE (% of Total Portfolio, Fair Value) PORTFOLIO BY OBLIGOR (% of Total Portfolio, Fair Value) PORTFOLIO BY INTEREST RATE TYPE (% of Total Portfolio, Fair Value) 84.0% 8.5% 6.4% 0.8% 0.3% ▪ Senior Secured First Lien Debt ▪ Senior Secured Second Lien Debt ▪ Equity ▪ Collateralized Securities & Structured Products: Equity ▪ Unsecured Debt ▪ Floating Interest Rate Investments ▪ Fixed Interest Rate Investments ▪ Non - Income Producing Equity ▪ Other Income Producing Investments High Quality Portfolio Focused on Senior Secured Loans 8.8% Average Yield on Debt Investments 1 92.5% Senior Secured Debt Investments 80.8% 2.4% 2.2% 2.2% 2.0% 2.0% 1.9% 1.7% 1.7% 1.7% 1.5% All other Investments Coyote Buyer, LLC Conisus Holdings, Inc. Cadence Aerospace, LLC Instant Web, LLC Foundation Consumer Healthcare, LLC Lift Brands, Inc. Volta Charging, LLC LAV Gear Holdings, Inc. CircusTrix Holdings, LLC Optio Rx, LLC

19 Benefits of “Dollar One” Investing at the Top of the Capital Structure Senior Secured – Second Lien Unsecured High Yield Product Mezzanine Preferred Equity Equity Highe s t Lo w e s t Senior Secured – First Lien Investing in First lien tranche of the Borrower: Credit Facility Avg. Debt Advance Rates: 50% - 75% CION’s Cost of Debt Capital: 3.9% Targeted Leveraged Net Portfolio Yield: 14% to 20% SENIORITY As compared to: Investing in second lien, subordinated and equity investments that yield less than 12% and carry substantially higher volatility, default rates and credit losses

Cumulative Annualized Loss/ (Gain) Rate: 0.11 % 3 Total Number of Investments: 744 2 Total Invested Capital: $5.3B 1 FIRST LIEN Total Number of Investments: 144 2 Cumulative Annualized Loss/(Gain) Rate: (0.02%) 3 Total Invested Capital: $1.2B 1 SECOND LIEN 20 (1) Invested capital represents the cost of all senior debt investments (either first lien or second lien and equity) from Decemb er 17, 2012 through June 30, 2021 net of any original issue discount (OID). With respect to revolver and delayed draw term loan investments, the invested capital amount includes the maximum commitment amount to be fun ded . (2) Specific to unique investment purchases, which exclude incremental purchases such as add - on investments and incremental term loa ns to existing portfolio companies. (3) Cumulative annualized loss/(gain) rate calculated as the aggregate investment cost at write - off less (i) any economic benefit re alized (interest and fees) and (ii) any economic recovery over total Invested Capital. Track Record Managing First & Second Lien Loans

96.8% 96.5% 93.8% 92.6% 92.5% 87.7% 87.7% 86.7% 86.2% 86.1% 83.3% 77.4% 77.2% 73.3% 70.1% 67.0% 51.3% BDC 1 BDC 2 BDC 3 BDC 4 BDC 5 BDC 6 BDC 7 BDC 8 BDC 9 BDC 10 BDC 11 BDC 12 BDC 13 BDC 14 BDC 15 BDC 16 0.58x 0.78x 0.83x 0.85x 0.86x 0.87x 0.97x 1.01x 1.07x 1.08x 1.09x 1.16x 1.19x 1.21x 1.39x 1.40x 1.43x BDC 15 BDC 16 BDC 2 BDC 7 BDC 8 BDC 1 BDC 14 BDC 3 BDC 10 BDC 4 BDC 12 BDC 9 BDC 6 BDC 13 BDC 11 BDC 5 21 Asset & Leverage Profile vs. Listed BDC Peers CION maintains a clear strategic focus on senior secured loans to U.S. middle market companies with one of the lowest current leverage levels among Listed BDC peers 1 SENIOR SECURED DEBT MIX (% of Total Portfolio, Fair Value) 2 TOTAL LEVERAGE (Debt - to - Equity) Source: Company Filings, FactSet, SNL Financial. Note: Financial data as of June 30, 2021. (1) Listed BDC peers consist of all publicly traded and externally - managed BDCs with $500mm or greater market capitalization. (2) Senior Secured Debt Portfolio includes the following classifications: Senior Secured Loans, First Lien, One - Stop/Unitranche, Sec ond Lien, First Lien Last Out, Other Senior Secured, and Senior Loan Fund/JV.

22 Total Committed Amount Principal Amount Outstanding Interest Rate Maturity Date JPM Credit Facility $575 $550 L + 3.10% 5/15/2024 UBS Facility 150 100 L + 3.375% 11/19/2023 Unsecured Notes, 2026 125 125 4.50% 2/11/2026 Unsecured Term Loan 30 30 5.20% 9/30/2024 Total Debt $880 $805 3.9% Source: Company Filings Note: Financial data as of June 30, 2021. . Debt Summary DEBT MATURITIES ($ in millions) DEBT SCHEDULE ($ in millions) $75 million in available capacity within existing facilities and demonstrated access to unsecured debt markets $100 $550 $0 $0 $50 $25 $0 $125 $30 2021 2022 2023 2024 2025 2026 Drawn Credit Facility Undrawn Credit Facility Unsecured Notes Unsecured Term Loan

23 Potential Increased Leverage Capacity Current maximum regulatory leverage • Following a listing, CION intends to seek shareholder approval to reduce its asset coverage ratio from 200% to 150%. Neither sha reholder approval nor the ability to obtain additional financing on attractive terms are guaranteed and CION’s leverage may not increase from current levels even if shar eho lder approval is obtained 1 • 16 of 16 externally - managed listed BDCs with greater than $500mm of market capitalization have approval for 150% asset coverage • If approved, CION would unlock more than $350mm in incremental borrowing capacity to support investment income growth Total Leverage (Debt / Equity) Listed Senior Secured BDC peers target leverage levels 2 Key Benefits of Reduced Asset Coverage Requirement • Incremental increase in current leverage to a target leverage range more aligned with listed BDC peers ( 1 - 1 . 25 x) • Senior secured portfolio orientation remains unchanged • Rigorous underwriting approach remains unchanged • Operate with increased cushion relative to the regulatory limit, reducing risk • Management Fee reduced to 1 . 00 % on assets financed with leverage over 1 . 00 x Debt / Equity • Potential to generate meaningful incremental investment income growth , enhancing returns for shareholders ILLUSTRATIVE TOTAL INVESTMENTS ($ in Millions, at Fair Value) Source: Company filings, select BDC earnings call transcripts/earnings releases. Note: Financial data as of June 30, 2021. In cre mental leverage capacity calculations subject to shareholder and/or Board of Directors approval of the application of minimum as set coverage ratio of 150%, as set forth in Section 61(a)(2) of the 1940 Act, as amended by the Small Business Credit Availability Act. Future outcomes may var y and there is no certainty related to achieving shareholder approval of lower asset coverage ratio of 150%. (1) If CION’s leverage does increase, shareholders would bear the burden of any increase in CION’s expenses as a result of such a ddi tional leverage, including interest expense, and any increase in the advisory fees payable to CIM. In addition, if the value of CION’s assets decreases, increased leverage would cause net asset value and net investment income to decline more rapidly and to a greater extent than th ey otherwise would have had CION not incurred increased leverage, which would negatively affect CION’s ability to pay distrib uti ons to shareholders. (2) Represents upper end of median target leverage ranges for externally - managed BDCs with greater than $500mm of market capitalizat ion and also disclose such targets. $1,724 $121 $1,845 $231 $2,076 Current Debt-to-Equity (0.87x) 1.00x Debt-to-Equity Senior Secured Peer BDC Target Debt-to-Equity (1.25x)

24 Base Management Fee: 1.50% (1.00% on assets financed below 200% asset coverage) Incentive Fee: 17.5% Hurdle Rate: 6.5% Leverage (Debt - to - Equity): 1.00x - 1.25x ( Representative senior secured lending peer target range) Source: Company Filings. Note: Financial data as of June 30, 2021. Data reflects historical financial information adjusted for the proposed post - listing fee structure and non - recurring listing expenses and various levels of illustrative leverage (Debt - to - Equity). There can be no guarantees that CION will obtain shareholder approval for a reduction in asset coverage to 150%. Listing is subject to market conditions and Board of Directors approval. Illustrative Pro Forma Business Economics KEY ASSUMPTIONS: ILLUSTRATIVE NET INVESTMENT INCOME YIELD AT VARIOUS LEVERAGE LEVELS (Normalized TTM NII and Assumes Post - Listing Fee Structure) Current Leverage (0.87x Debt - to - Equity) 1.00x Debt - to - Equity 1.25x Debt - to - Equity Listed Senior Secured BDC peers target leverage levels

Final Q&A

26 Consistent focus on senior secured investments at the top of the capital structure Source: Company Filings. Note: Financial data as of June 30, 2021. Total Investment Portfolio includes Total Return Swaps, at fair value. (1) Calculated as total debt plus unamortized debt issuance costs divided by equity. In 2013 to 2016, calculation includes the di ffe rence of the notional amount of underlying loans in Total Return Swaps and cash collateral. (2) Portfolio turnover rate is calculated using the lesser of year - to - date sales or purchases over the average of the invested asset s at fair value, excluding short term investments, and is not annualized. 2 Historical Portfolio Activity NET PORTFOLIO ACTIVITY ROLLFORWARD ($ in Millions; Excludes Short - Term Investments) 1 NEW INVESTMENT FUNDINGS ($ in Millions, at Cost; Excludes Short - Term Investments) $94.3 $403.7 $438.2 $569.9 $1,423.5 $1,280.2 $563.9 $359.6 $405.7 2013 2014 2015 2016 2017 2018 2019 2020 Q2 2021 YTD END OF PERIOD INVESTMENTS ($ in Millions, at Fair Value) $145 $490 $896 $1,233 $1,714 $1,865 $1,765 $1,569 $1,724 2013 2014 2015 2016 2017 2018 2019 2020 Q2 2021 1 2

CION has demonstrated a strong and consistent financial profile 27 Financial Profile Source: Company Filings. Note: Financial data as of June 30, 2021. (1) NII Yield calculated as TTM net investment income divided by the average quarterly NAV for the respective periods. (2) Distribution Yield calculated as TTM distributions divided by the average quarterly NAV for the respective periods. (3) Annualized Return on Equity calculated as the net change in net assets from operations multiplied by 4 divided by NAV per sha re for the respective period.

28 Historical Income Statement Source: Company Filings. Note: Financial data as of June 30, 2021. (in thousands, except share and per share amounts) For the Three Months Ended 6/30/2020 9/30/2020 12/31/2020 3/31/2021 6/30/2021 Investment Income Total investment income $35,808 $38,887 $45,748 $36,303 $38,021 Operating expenses Management fees $7,929 $7,780 $8,451 $7,783 $8,243 Administrative services expense 806 593 394 684 697 Subordinated incentive fee on income - - 3,308 - - General and administrative 1,715 1,524 1,470 2,689 2,567 Interest expense 11,442 7,570 10,464 7,548 7,828 Total operating expenses $21,892 $17,467 $24,087 $18,704 $19,335 Net investment income $13,916 $21,420 $21,661 $17,599 $18,686 Realized and unrealized gains (losses) Net realized gains (losses) on: Non-controlled, non-affiliated investments ($10,980) ($42,543) ($3,983) $26 $445 Non-controlled, affiliated investments - - (211) (1,080) - Controlled investments - - - (3,067) - Foreign currency (6) 32 (2) (7) (4) Net realized losses ($10,986) ($42,511) ($4,196) ($4,128) $441 Net change in unrealized appreciation (depreciation) on: Non-controlled, non-affiliated investments 13,543 58,572 (110,726) 19,238 5,957 Non-controlled, affiliated investments (709) (7,401) (7,837) 13,938 2,885 Controlled investments 823 1,007 (4,814) 3,067 - Net change in unrealized appreciation (depreciation) 13,657 52,178 (123,377) 36,243 8,842 Net realized and unrealized gains (losses) 2,671 9,667 (127,573) 32,115 9,283 Net increase (decrease) in net assets resulting from operations $16,587 $31,087 ($105,912) $49,714 $27,969 Per share information-basic and diluted Net increase (decrease) in net assets per share resulting from operations $0.15 $0.27 ($0.93) $0.44 $0.25 Weighted average shares of common stock outstanding 113,311,656 113,415,564 113,635,682 113,509,925 113,495,366

29 Historical Balance Sheet Source: Company Filings. Note: Financial data as of June 30, 2021. (1) Calculated as total debt plus unamortized debt issuance costs divided by equity. As of 6/30/2020 9/30/2020 12/31/2020 3/31/2021 6/30/2021 Assets Total Investments, at fair value $1,571,728 $1,569,905 $1,569,371 $1,621,641 $1,724,038 Cash 1,688 4,214 19,914 1,641 1,496 Due from counterparty - - - - - Interest receivable on investments 20,850 18,666 17,484 17,101 20,279 Receivable due on investments sold and repaid 1,906 7,273 6,193 39,915 8,888 Dividends receivable on investments 2,516 1,706 45 315 187 Prepaid expenses and other assets 552 1,368 1,788 667 426 Total assets $1,599,240 $1,603,132 $1,614,795 $1,681,280 $1,755,314 Liabilities Financing arrangements $739,918 $719,419 $719,956 $716,311 $796,003 Payable for investments purchased 1,568 4,956 133 40,217 17,938 Accounts payable and accrued expenses 875 775 694 921 2,160 Interest payable 2,479 2,395 2,500 2,717 4,185 Accrued management fees 7,929 7,779 7,668 7,783 8,243 Accrued subordinated incentive fee on income 3,308 - 4,323 - - Accrued administrative services expense 733 589 1,265 389 905 Total liabilities $756,810 $735,913 $736,539 $768,338 $829,434 Shareholder's Equity Common stock 113 114 113 113 113 Capital in excess of par value 1,054,898 1,058,610 1,054,911 1,054,912 1,054,881 Accumulated distributable losses (212,581) (191,505) (176,768) (142,083) (129,114) Total shareholders' equity 842,430 867,219 878,256 912,942 925,880 Total liabilities and shareholders' equity $1,599,240 $1,603,132 $1,614,795 $1,681,280 $1,755,314 Key Metrics Weighted Average Common Shares Outstanding 113,311,656 113,415,564 113,635,682 113,509,925 113,495,366 NAV Per Share $7.43 $7.62 $7.75 $8.06 $8.17 Debt to Equity 1 0.89x 0.84x 0.83x 0.79x 0.87x Asset Coverage 2.13x 2.20x 2.21x 2.26x 2.15x (in thousands, except share and per share amounts)

Serious News for Serious Traders! Try StreetInsider.com Premium Free!
You May Also Be Interested In
- Realfinity and OnCourse Learning to Make Dual-Licensing a Reality for Real Estate Professionals
- First Majestic Produces 5.2 Million AgEq Oz in Q1 2024
- Star Royalties Reports Audited Financial Results for 2023
Create E-mail Alert Related Categories
SEC FilingsSign up for StreetInsider Free!
Receive full access to all new and archived articles, unlimited portfolio tracking, e-mail alerts, custom newswires and RSS feeds - and more!
