

Form 8-K CIM Commercial Trust For: Mar 16
 Tweet
Tweet Share
ShareExhibit 99.1

CIM Commercial Trust Corporation Reports 2020 Fourth Quarter Results
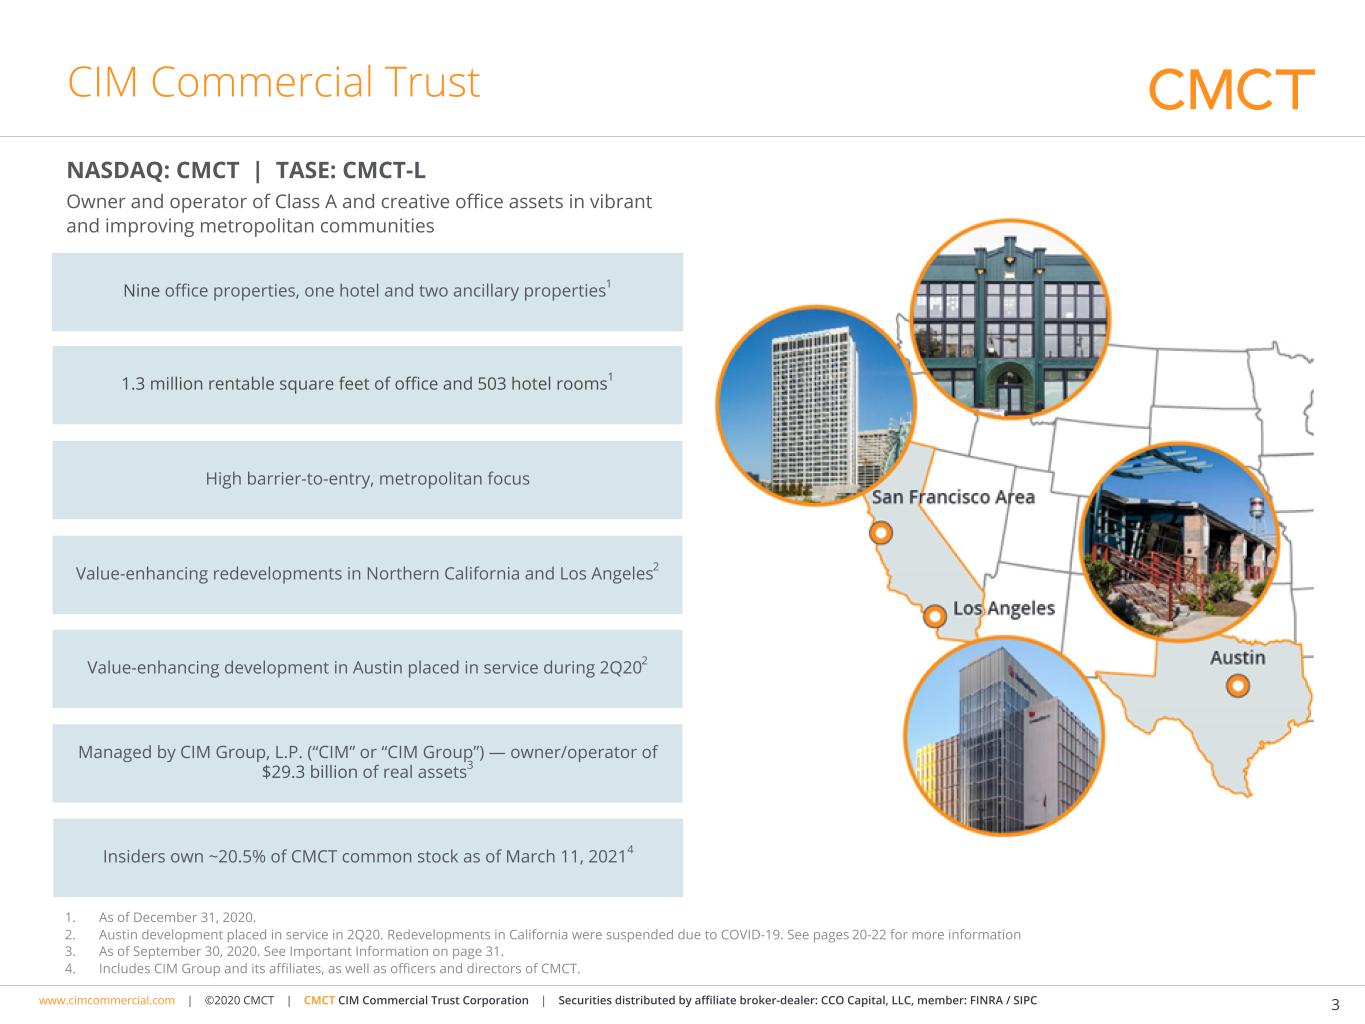
Dallas — (March 16, 2021) CIM Commercial Trust Corporation (NASDAQ: CMCT and TASE: CMCT-L) (“we”, “our”, “CMCT”, “CIM Commercial”, or the “Company”), a real estate investment trust (“REIT”) that primarily acquires, owns, and operates Class A and creative office assets in vibrant and improving metropolitan communities throughout the United States (including improving and developing such assets), today reported operating results for the three months and year ended December 31, 2020.
Fourth Quarter 2020 Highlights
•Annualized rent per occupied square foot(1) on a same-store(2) basis increased 5.8% to $50.96 as of December 31, 2020 compared to $48.18 as of December 31, 2019.
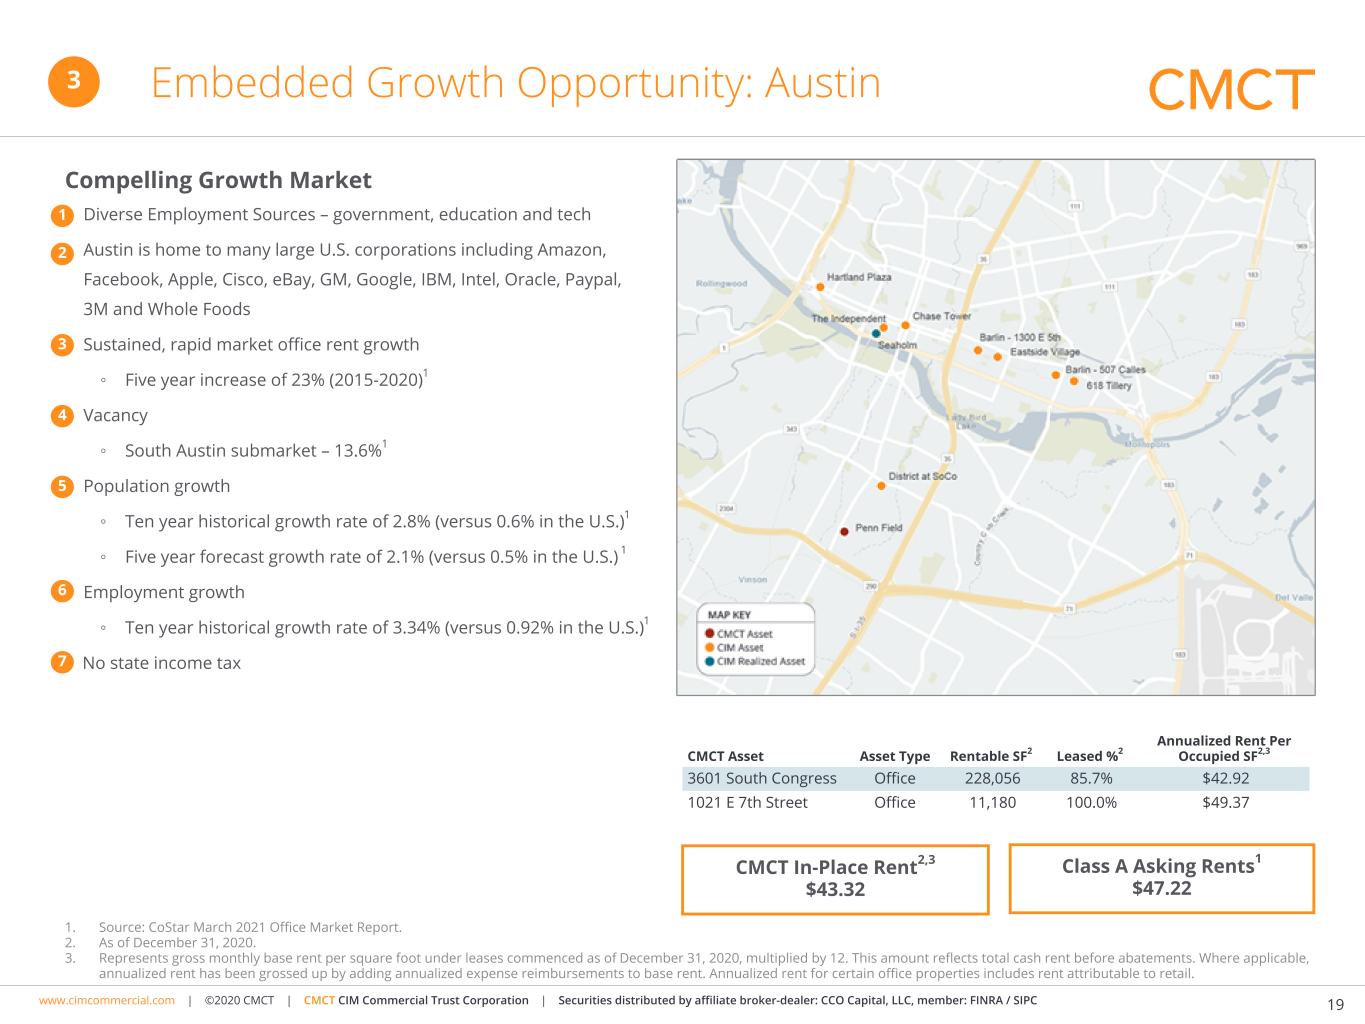
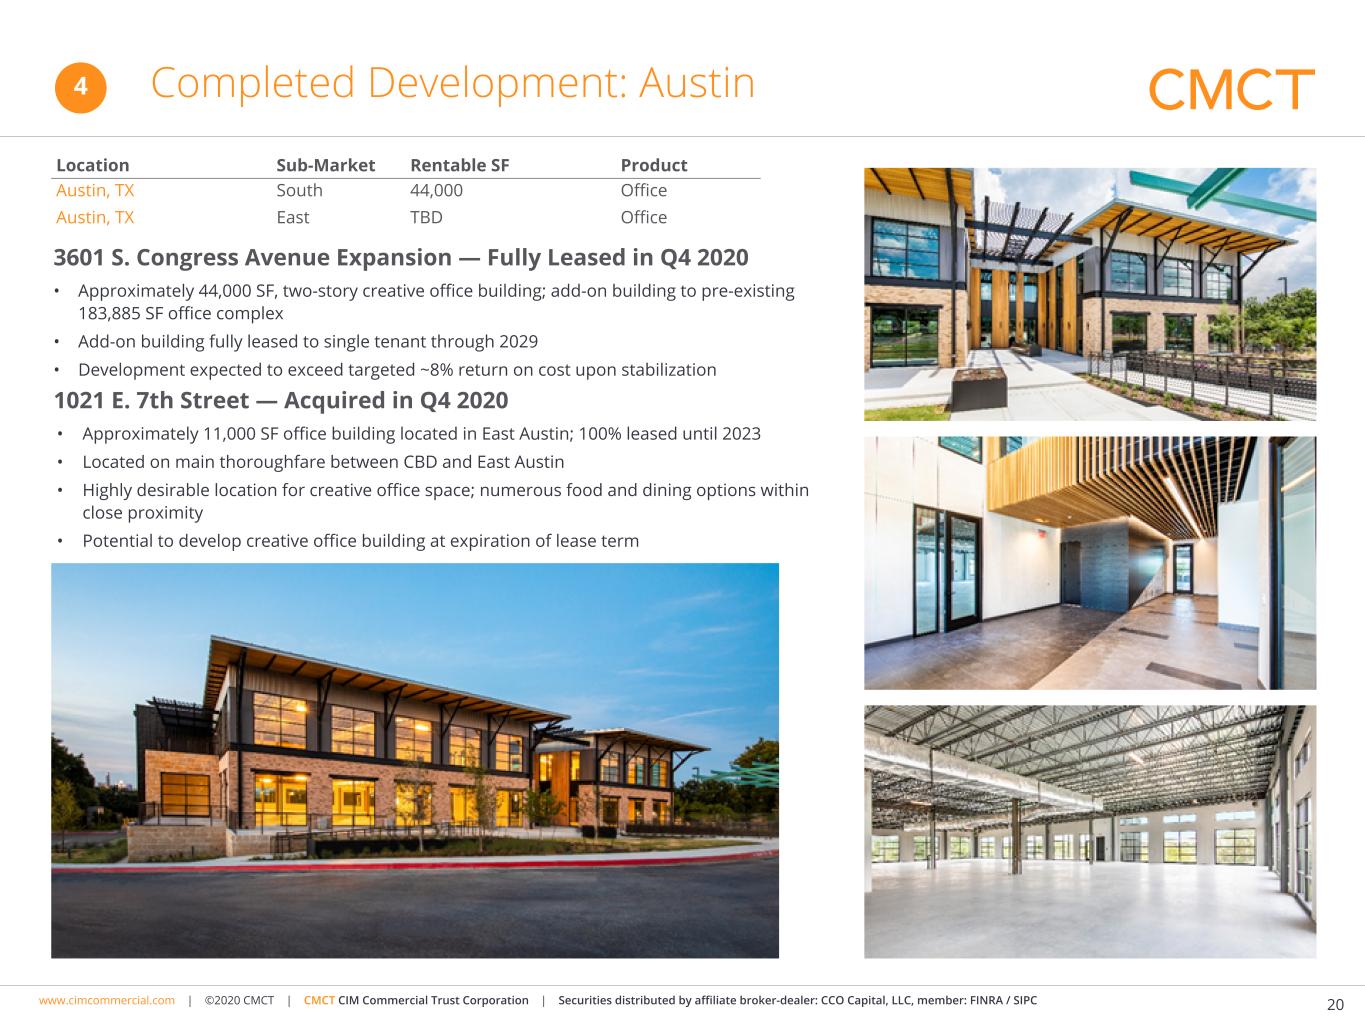
•Our same-store(2) office portfolio was 80.3% leased as of December 31, 2020 compared to 87.0% as of December 31, 2019. In December 2020, we executed a lease for the entire newly constructed two-story office building of approximately 44,000 square feet, located at our Penn Field office campus located at 3601 South Congress Avenue in Austin.
•During the fourth quarter of 2020, we executed 67,112 square feet of leases with terms longer than 12 months, of which 22,941 square feet were recurring leases executed at our same-store(2) office portfolio, representing same-store(2) cash rent growth per square foot of 3.9%.
•Net loss attributable to common stockholders was $8.9 million, or $(0.60) per diluted share, for the fourth quarter of 2020 compared to $11.6 million, or $(0.79) per diluted share, for the fourth quarter of 2019.
•Same-store(2) office segment net operating income(3) (“NOI”) decreased 8.9%, while same-store(2) office cash NOI(4) increased 2.2%, for the fourth quarter of 2020 as compared to the corresponding period in 2019. The increase in same-store(2) office cash NOI(4) is primarily due to the expiration of a free rent period during the year ended December 31, 2020 at an office property in Los Angeles, California.
•Funds from operations (“FFO”) attributable to common stockholders(5) was $(3.2) million, or $(0.21) per diluted share, for the fourth quarter of 2020 compared to $(6.2) million, or $(0.42) per diluted share, for the fourth quarter of 2019.
•Core FFO attributable to common stockholders(6) was $(3.1) million, or $(0.21) per diluted share, for the fourth quarter of 2020 compared to $(346,000), or $(0.02) per diluted share, for the fourth quarter of 2019.
Management Commentary
“While the pandemic continues to impact our near-term results, we believe we have a significant opportunity to increase same-store net operating income over the next several years.” said David Thompson, Chief Executive Officer of CIM Commercial.
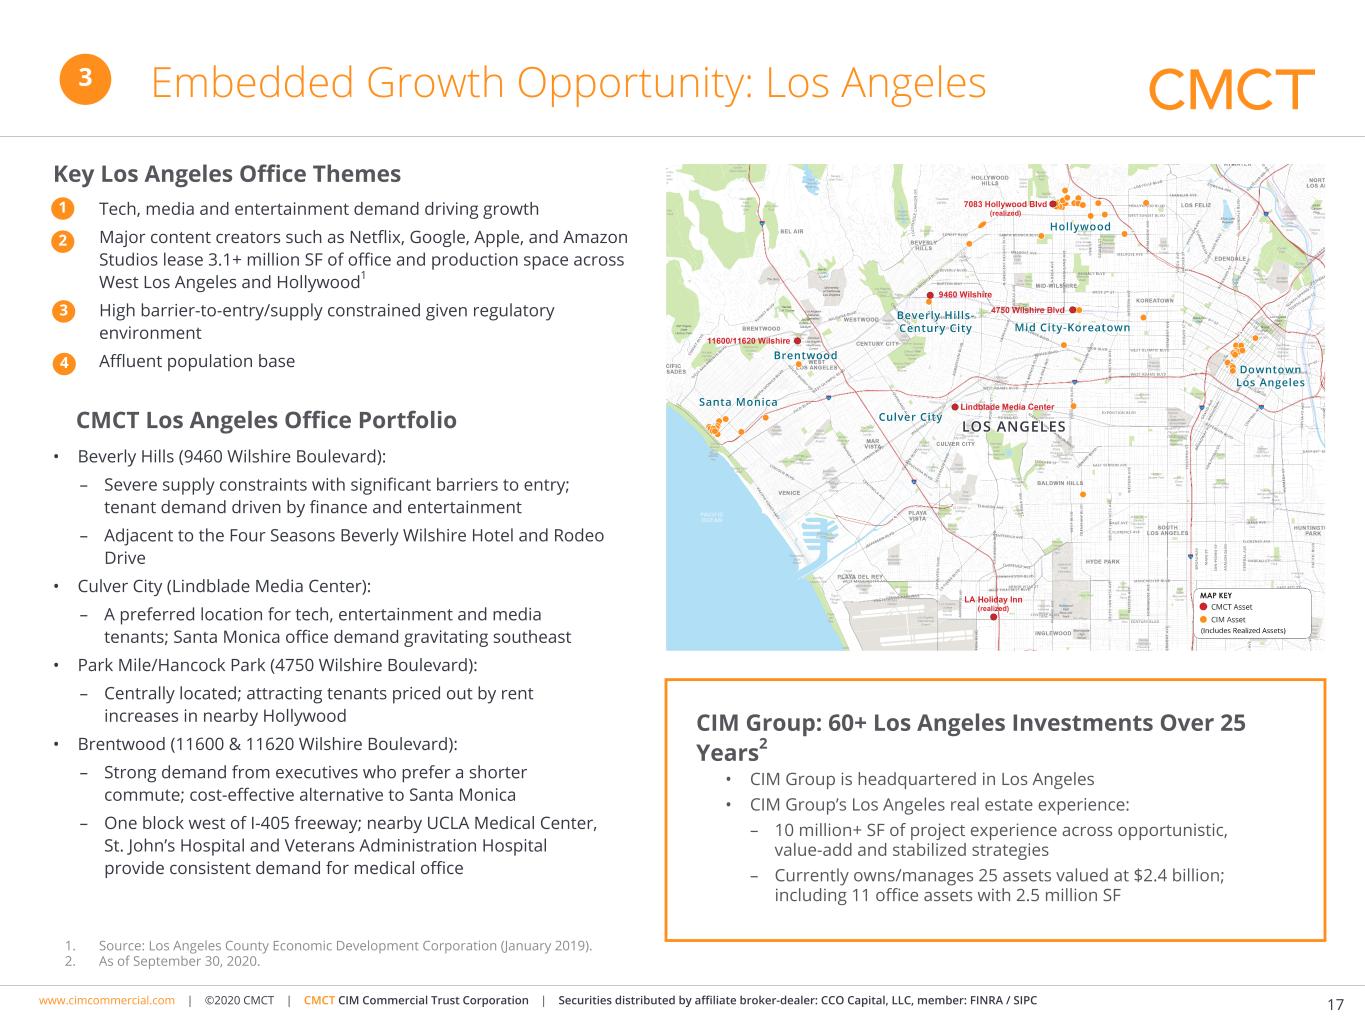
“In December 2020, we executed a lease for our entire newly constructed office building in Austin at rents that exceed our previously disclosed return on cost target of 8%. We utilized the broad expertise of CIM Group’s vertically-integrated team to collaborate on the development and leasing of this asset. We believe we have an opportunity to continue to grow our Austin operations. We also expect to benefit from a recovery at our hotel in Sacramento, a pickup in origination activity in our lending business and the lease up of our office assets in Los Angeles. In addition to our focus on optimizing the cash flows of our high-quality portfolio, we will continue to explore ways to improve scale in order to create value for our shareholders.”
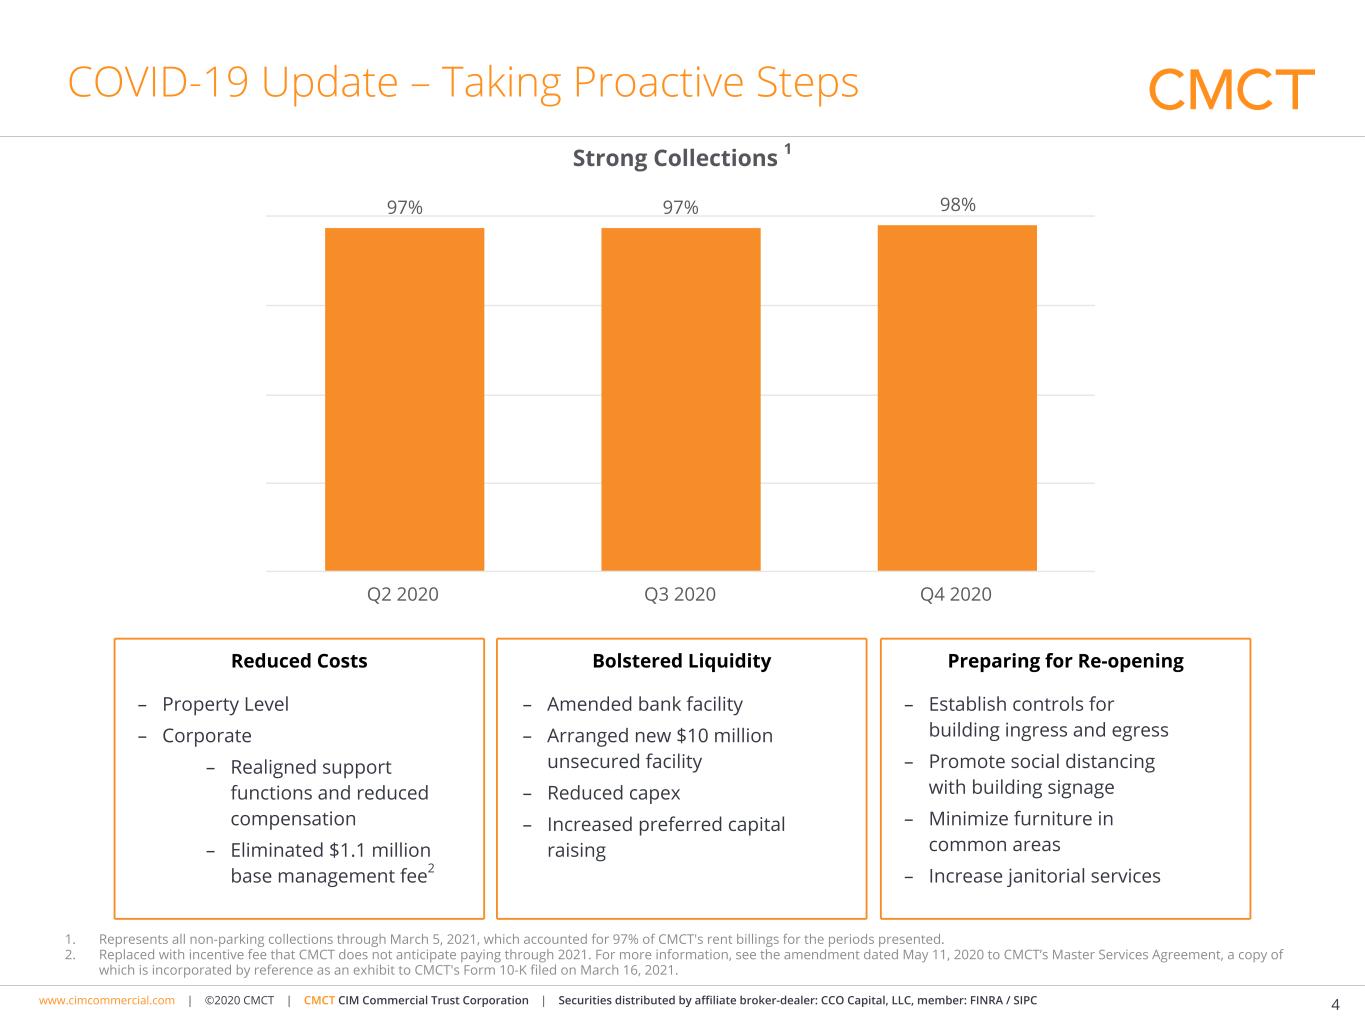
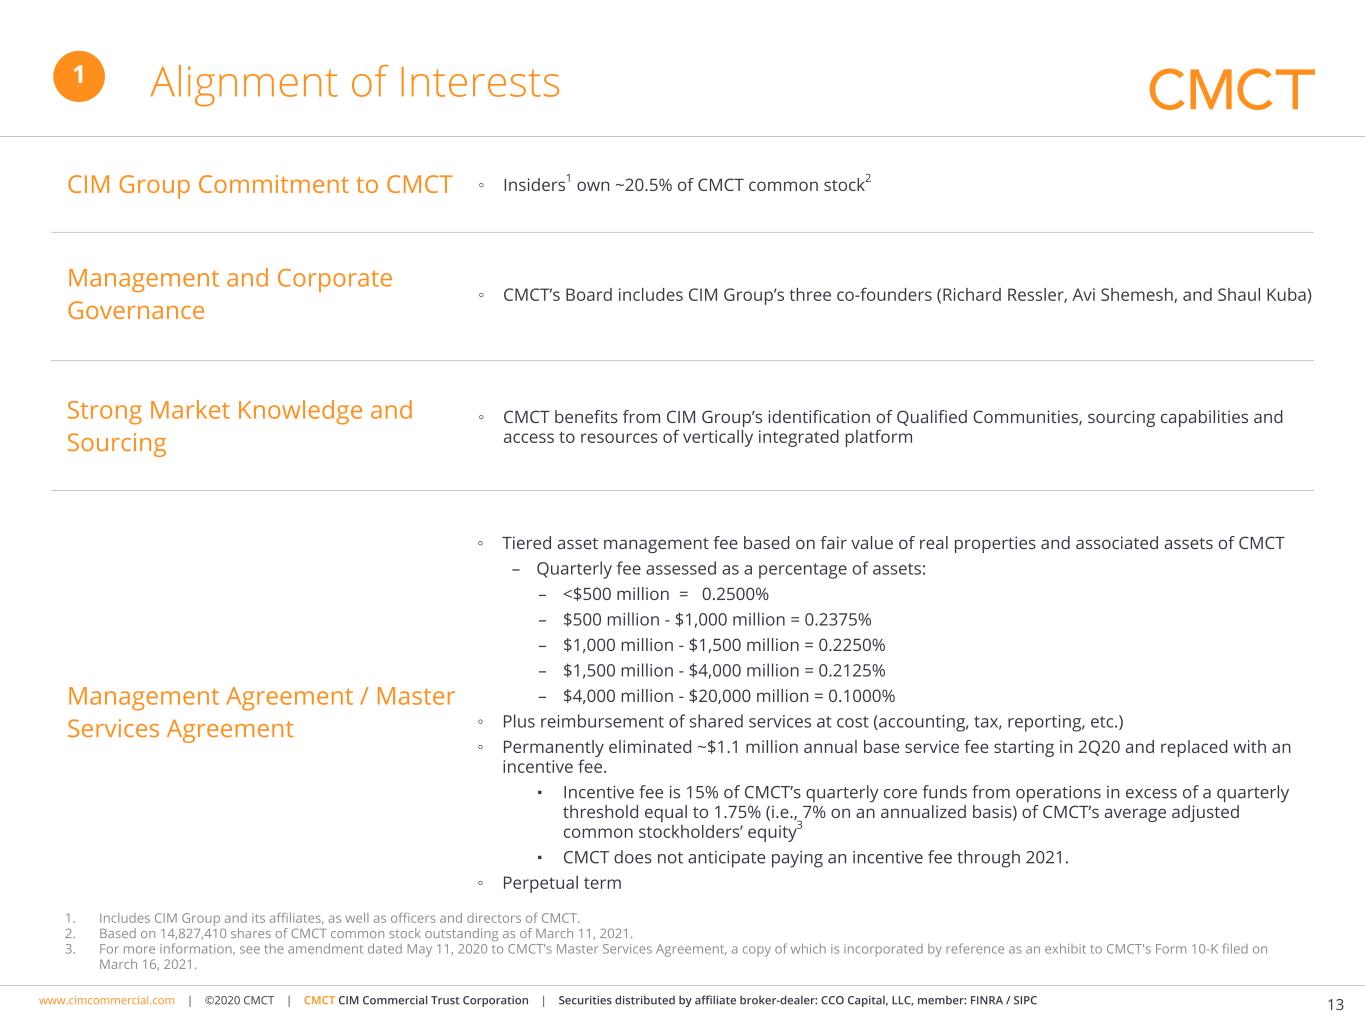
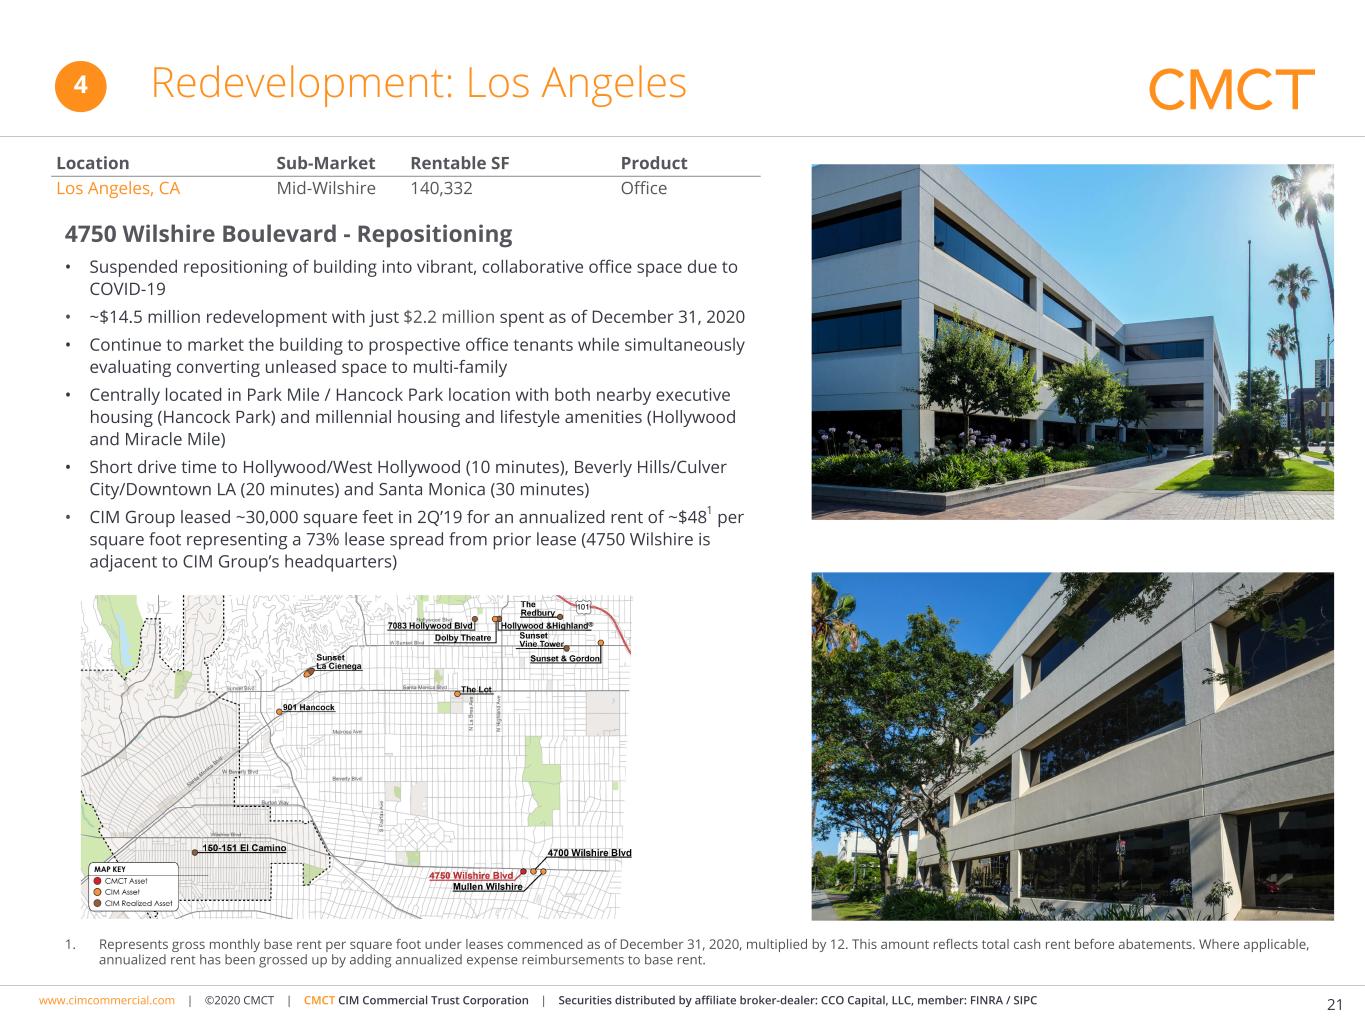
The steps we took in 2020 to adapt to the difficult business environment in which we operate and to strengthen our business to position it to thrive post COVID-19 include (i) reducing our corporate overhead expenses by realigning certain support functions and reducing employee compensation at CIM Group, including not appointing a replacement for our President who retired during the third quarter, (ii) focusing on appropriate cost-reduction measures at our properties, (iii) temporarily suspending the vast majority of activities related to the repositioning of our office building at 4750 Wilshire Boulevard in Los Angeles, California and renovations at the Sheraton Grand Hotel in Sacramento, California, (iv) increasing liquidity by entering into a new unsecured revolving credit facility in May, accessing the Federal Reserve Paycheck Protection Program Liquidity Facility in June and entering into an amendment to our existing revolving credit facility in September, and (v) amending our Master Services Agreement to replace the base service fee with an incentive fee.
1
Financial Highlights
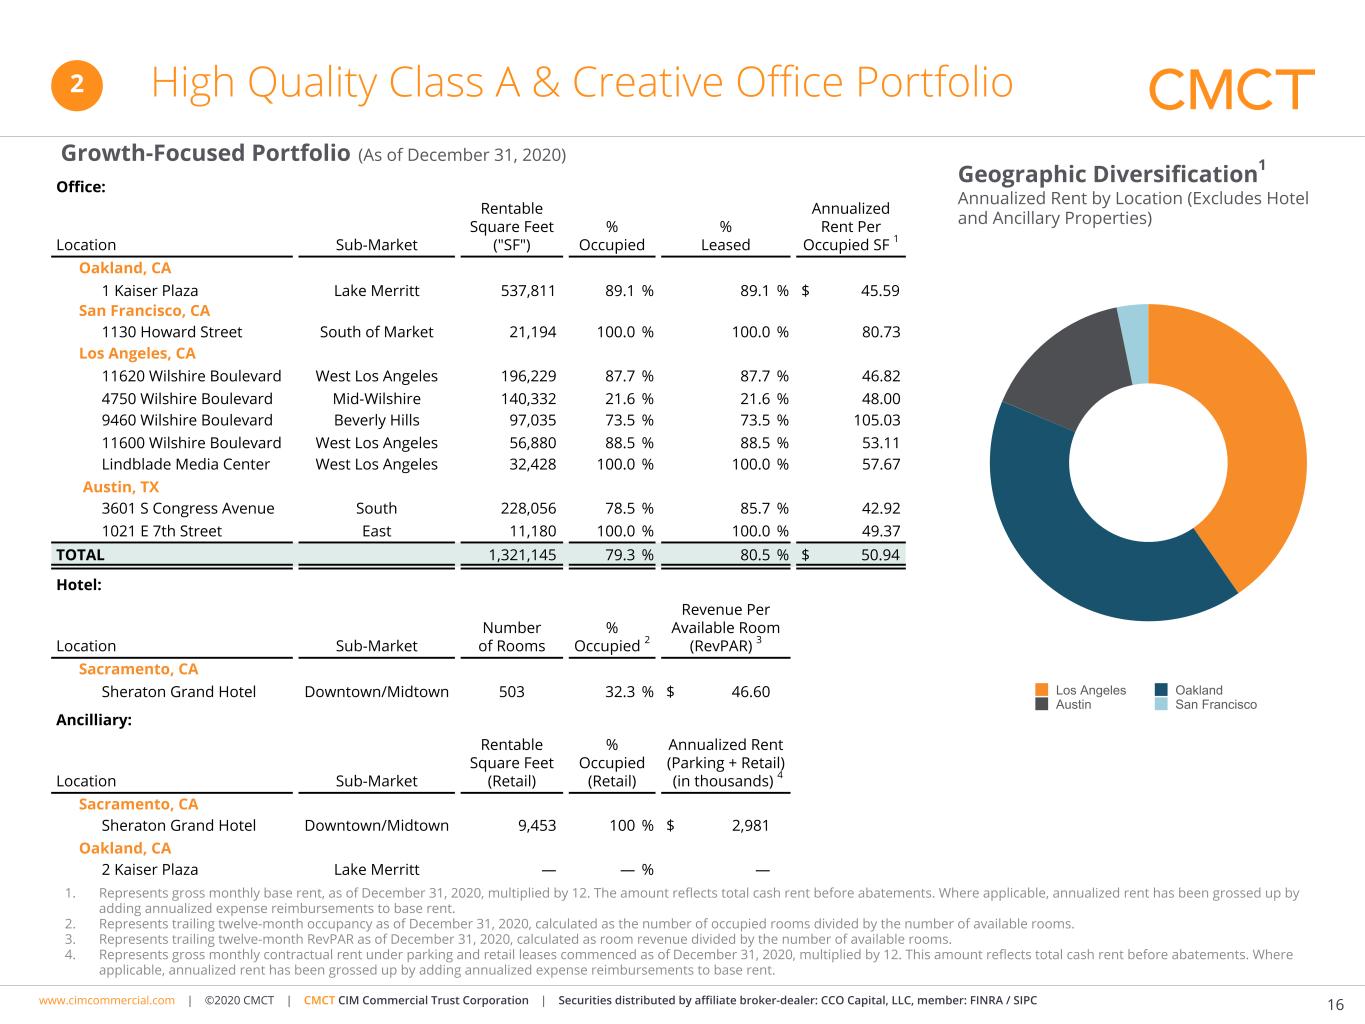
As of December 31, 2020, our real estate portfolio consisted of 12 assets, all of which were fee-simple properties. The portfolio included nine office properties and one development site, which is being used as a parking lot, totaling approximately 1.3 million rentable square feet, and one 503-room hotel with an ancillary parking garage. We also own and operate a lending business.
Fourth Quarter 2020
Net loss attributable to common stockholders was $8.9 million, or $(0.60) per diluted share of common stock, for the three months ended December 31, 2020, compared to $11.6 million, or $(0.79) per diluted share of common stock, for the three months ended December 31, 2019. The decrease is primarily attributable to a decrease of $5.9 million in redeemable preferred stock redemptions related to the Series L Preferred Stock tender offer that was completed in November 2019 and a decrease of $804,000 in expense reimbursements to related parties—corporate, partially offset by a decrease of $4.1 million in segment NOI(3) (primarily as a result of the adverse impact of COVID-19).
FFO attributable to common stockholders(5) was $(3.2) million, or $(0.21) per diluted share of common stock, for the three months ended December 31, 2020, compared to $(6.2) million, or $(0.42) per diluted share of common stock, for the three months ended December 31, 2019. The increase in FFO attributable to common stockholders(5) is primarily attributable to a decrease of $5.9 million in redeemable preferred stock redemptions related to the Series L Preferred Stock tender offer that was completed in November 2019 and a decrease of $804,000 in expense reimbursements to related parties—corporate (primarily as a result of cost-cutting measures implemented by CMCT’s operator), partially offset by a decrease of $4.1 million in segment NOI(3) (primarily as a result of the adverse impact of COVID-19).
Core FFO attributable to common stockholders(6) was $(3.1) million, or $(0.21) per diluted share of common stock, for the three months ended December 31, 2020, compared to $(346,000), or $(0.02) per diluted share of common stock, for the three months ended December 31, 2019. The decrease in core FFO attributable to common stockholders(6) is primarily attributable to a decrease of $4.1 million in segment NOI(3) (primarily as a result of the adverse impact of COVID-19), partially offset by a decrease of $804,000 in expense reimbursements to related parties—corporate (primarily as a result of cost-cutting measures implemented by CMCT’s operator).
Year Ended 2020
Net loss attributable to common stockholders was $33.5 million, or $(2.27) per diluted share of common stock, for the year ended December 31, 2020, compared to net income attributable to common stockholders of $322.7 million, or $19.74 per diluted share of common stock, for the year ended December 31, 2019.
FFO attributable to common stockholders(5) was $(12.1) million, or $(0.82) per diluted share of common stock, for the year ended December 31, 2020, compared to $(14.0) million, or $(0.96) per diluted share of common stock, for the year ended December 31, 2019.
Core FFO attributable to common stockholders(6) was $(11.3) million, or $(0.77) per diluted share of common stock, for the year ended December 31, 2020, compared to $20.9 million, or $1.44 per diluted share of common stock, for the year ended December 31, 2019.
Segment Information
Our reportable segments during the three months ended December 31, 2020 and 2019 consisted of two types of commercial real estate properties, namely, office and hotel, as well as a segment for our lending business. Net loss attributable to common stockholders was $8.9 million, or $(0.60) per diluted share of common stock, for the three months ended December 31, 2020, compared to $11.6 million, or $(0.79) per diluted share of common stock, for the three months ended December 31, 2019. Total segment NOI(3) was $7.4 million for the three months ended December 31, 2020, compared to $11.5 million for the three months ended December 31, 2019.
Office
Same-Store
Same-store(2) office segment NOI(3) decreased 8.9% while same store-store(2) office cash NOI(4) increased 2.2% for the three months ended December 31, 2020 compared to the three months ended December 31, 2019. The decrease in same-store(2) office segment NOI(3) is primarily due to lower revenues due to decreased occupancy at an office property in Beverly Hills, California and an office property in Austin, Texas, partially offset by decreased administrative expenses at an office property in Los Angeles, California.
2
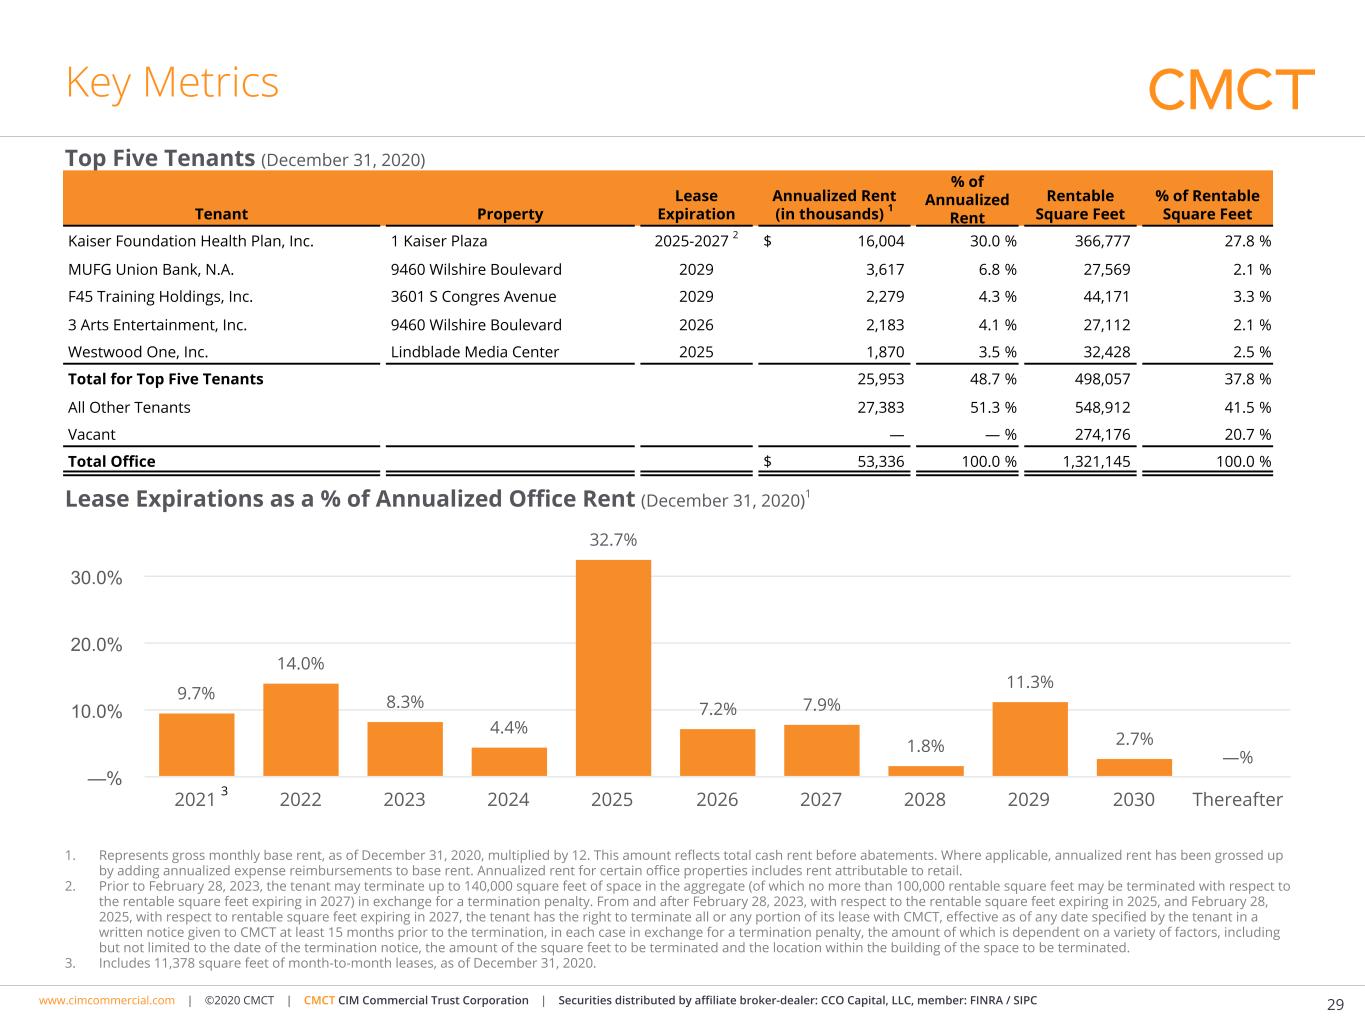
At December 31, 2020, the Company’s same-store(2) office portfolio was 79.1% occupied, a decrease of 760 basis points year-over-year on a same-store(2) basis, and 80.3% leased, a decrease of 670 basis points year-over-year on a same-store(2) basis. The annualized rent per occupied square foot(1) on a same-store(2) basis was $50.96 at December 31, 2020 compared to $48.18 at December 31, 2019. During the three months ended December 31, 2020, the Company executed 22,941 square feet of recurring leases at our same-store(2) office portfolio, representing same-store(2) cash rent growth per square foot of 3.9%.
Total
Office segment NOI(3) decreased to $7.0 million for the three months ended December 31, 2020, from $7.5 million for the three months ended December 31, 2019. The decrease is primarily due to lower revenues as a result of decreased occupancy at an office property in Beverly Hills, California and an office property in Austin, Texas, partially offset by decreased administrative expenses at an office property in Los Angeles, California.
Hotel
Hotel segment NOI(3) decreased to $(393,000) for the three months ended December 31, 2020, from $2.5 million for the three months ended December 31, 2019, due to a decrease in occupancy, average daily rate, and food, beverage, and other sundry hotel services as a result of the outbreak of COVID-19.
Lending
Our lending segment primarily consists of our SBA 7(a) lending platform, which is a national lender that primarily originates loans to small businesses in the hospitality industry. Lending segment NOI(3) was $787,000 for the three months ended December 31, 2020, compared to $1.5 million for the three months ended December 31, 2019. The decrease is due to a decrease in interest income resulting from a decrease in the prime rate.
Debt and Equity
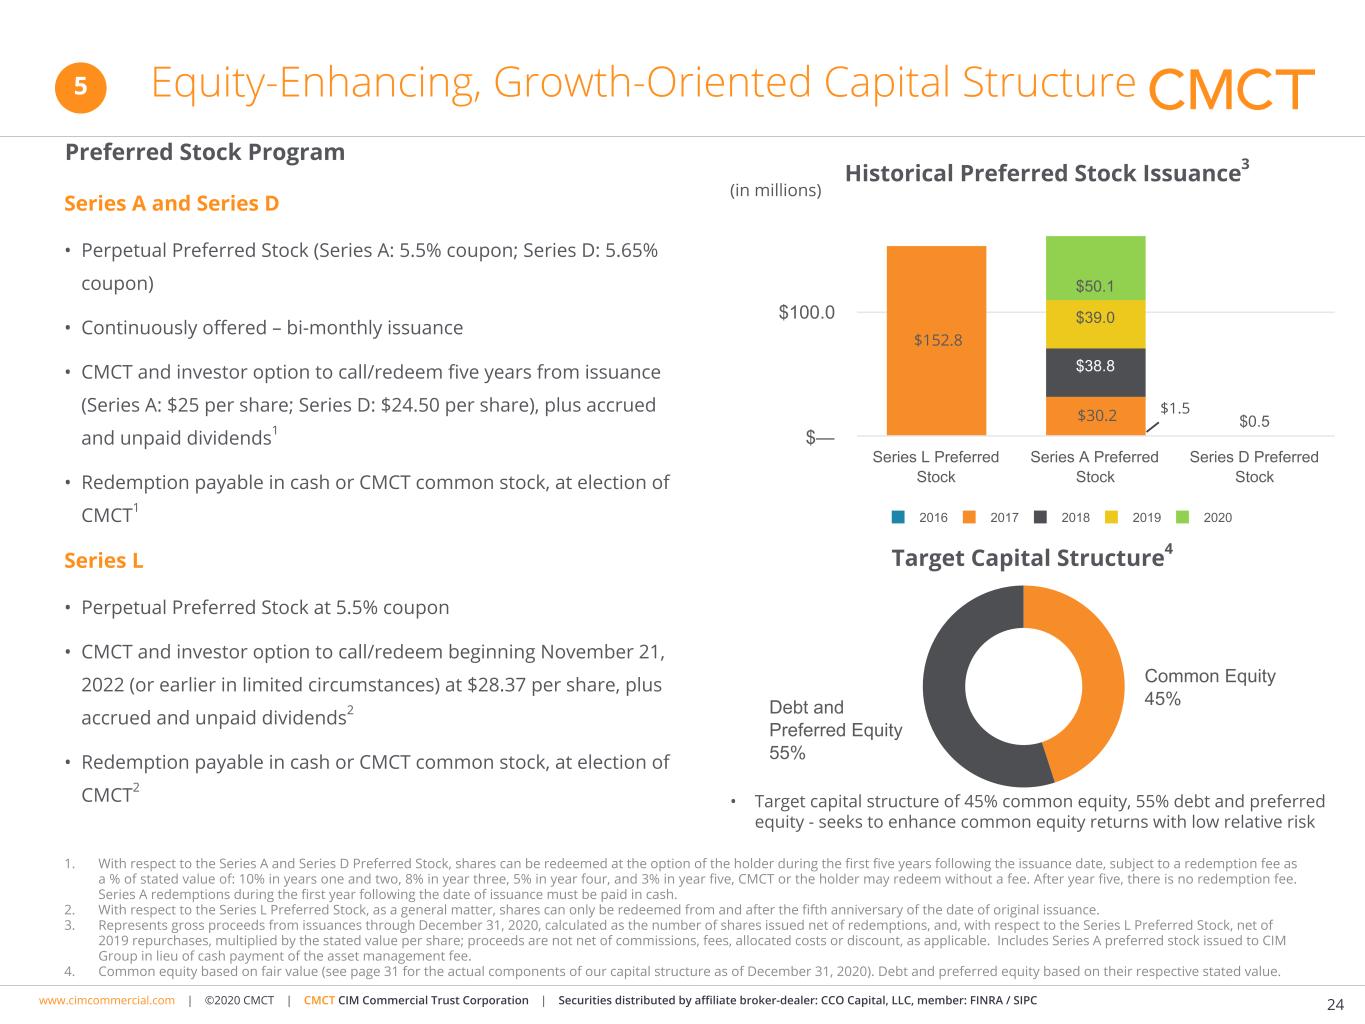
During the three months ended December 31, 2020, we issued 394,364 shares of Series A Preferred Stock and 408 shares of Series D Preferred Stock for aggregate net proceeds of approximately $9.1 million. Net proceeds represent gross proceeds offset by costs specifically identifiable to the offering of Series A Preferred Stock and Series D Preferred Stock, such as commissions, dealer manager fees, and other offering fees and expenses.
Dividends
On December 2, 2020, we declared a quarterly cash dividend of $0.0750 per share of our common stock, which was paid on December 29, 2020 to stockholders of record at the close of business on December 14, 2020.
In addition, we declared an annual cash dividend of $1.56035 per share of our Series L Preferred Stock, which was paid on January 19, 2021 to stockholders of record at the close of business on December 31, 2020.
On December 2, 2020, we declared a quarterly cash dividend of $0.34375 per share of our Series A Preferred Stock, or portion thereof for issuances during the period from January 1, 2021 to March 30, 2021. As a result, $0.114583 per share was paid on February 16, 2021 to holders of record of Series A Preferred Stock at the close of business on February 5, 2021, $0.114583 per share was paid on March 15, 2021 to holders of record of Series A Preferred Stock at the close of business on March 5, 2021, and $0.1145833 per share will be paid on April 15, 2021 to holders of record of Series A Preferred Stock at the close of business on April 5, 2021.
On December 2, 2020, we declared a quarterly cash dividend of $0.35313 per share of our Series D Preferred Stock, or portion thereof for issuances during the period from January 1, 2021 to March 30, 2021. As a result, $0.117708 per share was paid on February 16, 2021 to holders of record of Series D Preferred Stock at the close of business on February 5, 2021, $0.117708 per share was paid on March 15, 2021 to holders of record of Series D Preferred Stock at the close of business on March 5, 2021, and $0.117708 per share will be paid on April 15, 2021 to holders of record of Series D Preferred Stock at the close of business on April 5, 2021.
About CIM Commercial
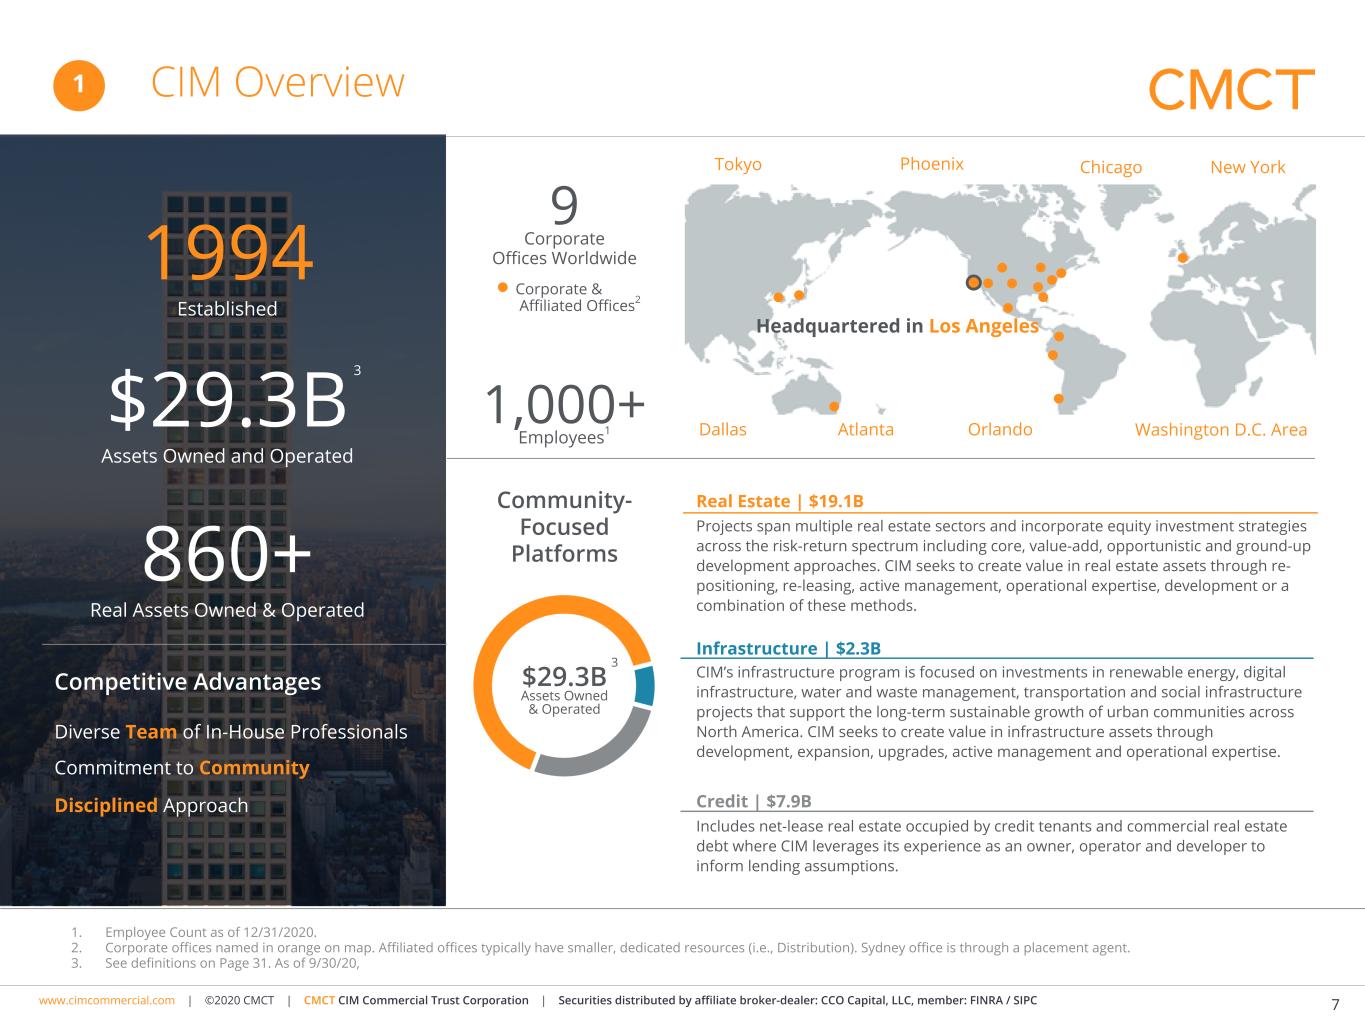
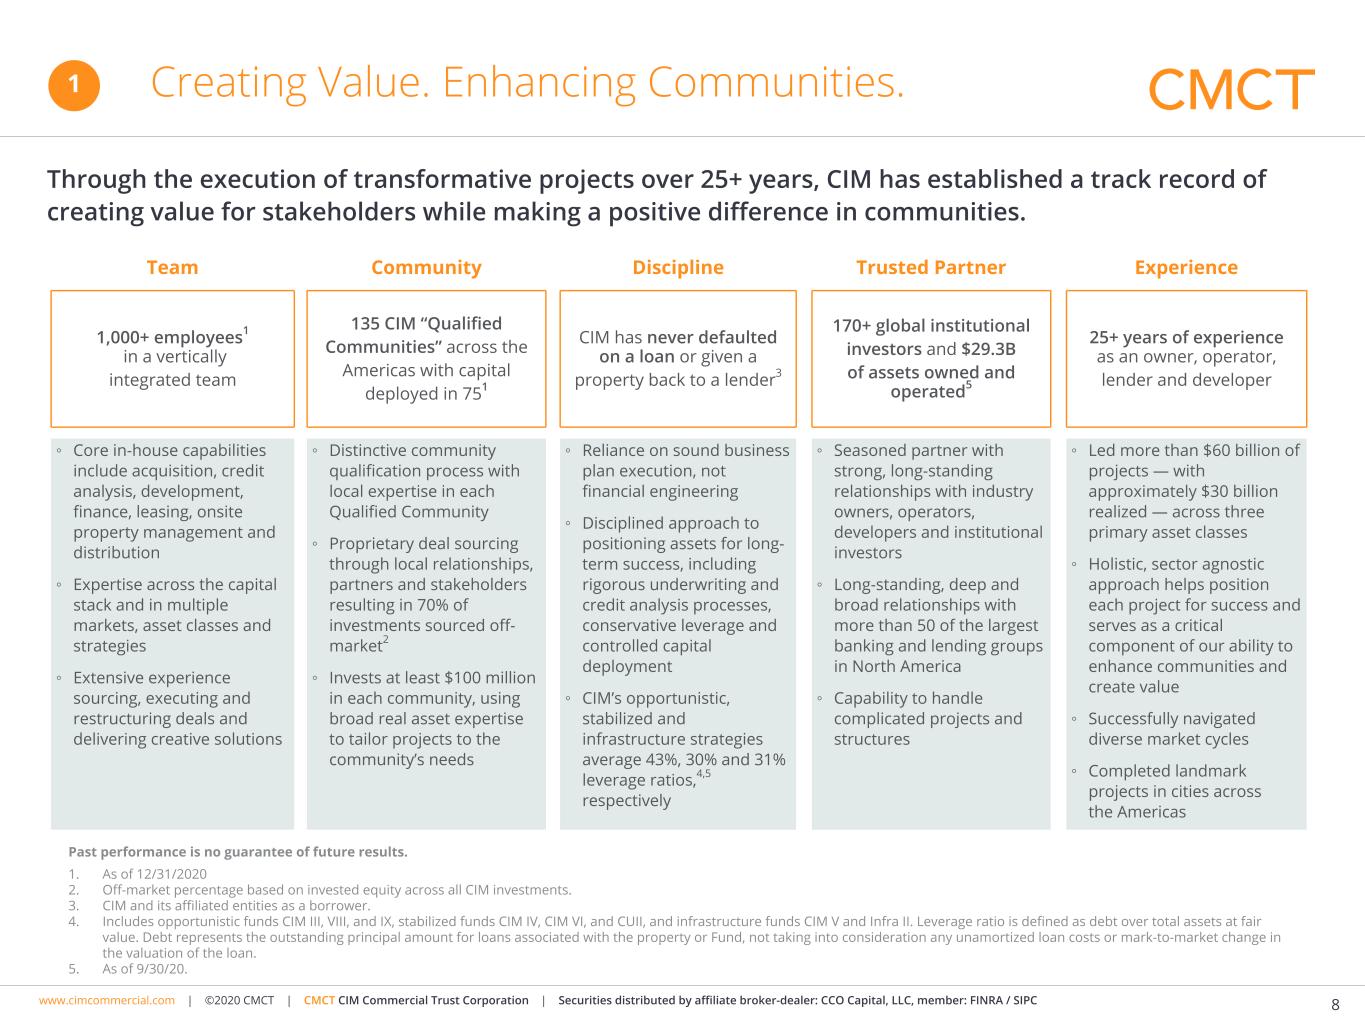
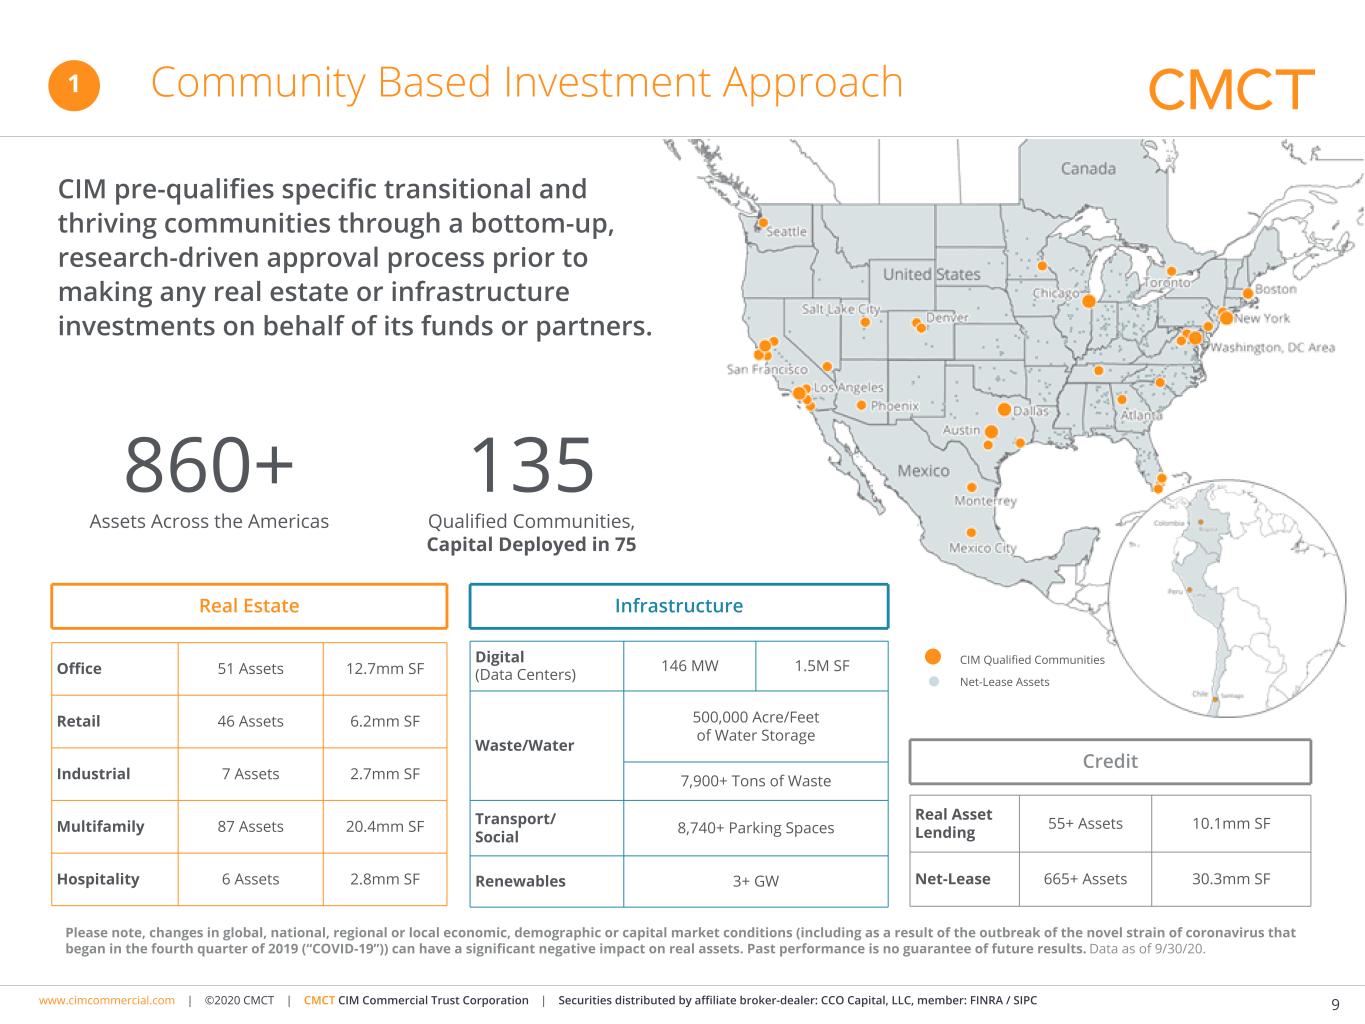
CIM Commercial is a real estate investment trust that primarily acquires, owns, and operates Class A and creative office assets in vibrant and improving metropolitan communities throughout the United States. Its properties are primarily located in Los Angeles and the San Francisco Bay Area. CIM Commercial is operated by affiliates of CIM Group, L.P., a vertically-integrated owner and operator of real assets with multi-disciplinary expertise and in-house research, acquisition, credit analysis, development, finance, leasing, and onsite property management capabilities (www.cimcommercial.com).
3
Definitions
(1)Annualized rent per occupied square foot represents gross monthly base rent under leases commenced as of the specified periods, multiplied by twelve. This amount reflects total cash rent before abatements. Where applicable, annualized rent has been grossed up by adding annualized expense reimbursements to base rent. Annualized rent for certain office properties includes rent attributable to retail.
(2)Same-store properties are properties that we have owned and operated in a consistent manner and reported in our consolidated results during the entire span of the periods being reported. We excluded from our same-store property set this quarter any properties (i) acquired on or after October 1, 2019; (ii) sold or otherwise removed from our consolidated financial statements on or before December 31, 2020; or (iii) that underwent a major repositioning project we believed significantly affected its results at any point during the period commencing on October 1, 2019 and ending on December 31, 2020. When determining our same-store properties as of December 31, 2020, one property was excluded pursuant to (i), ten properties were excluded pursuant to (ii) above, and no properties were excluded pursuant to (iii) above.
(3)Segment net operating income (“segment NOI”): for our real estate segments represents rental and other property income and expense reimbursements less property related expenses and excludes non-property income and expenses, interest expense, depreciation and amortization, corporate related general and administrative expenses, gain (loss) on sale of real estate, gain (loss) on early extinguishment of debt, impairment of real estate, transaction costs, and provision for income taxes. For our lending segment, segment NOI represents interest income net of interest expense and general overhead expenses. Please see our reconciliations of office, hotel, lending, and total cash NOI to segment NOI and net income (loss) attributable to common stockholders starting on page 11.
(4)Cash net operating income (“cash NOI”): for our real estate segments represents segment NOI adjusted to exclude the effect of the straight lining of rents, acquired above/below market lease amortization and other adjustments required by generally accepted accounting principles (“GAAP”). For our lending segment, there is no distinction between cash NOI and segment NOI. Please see our reconciliations of office, hotel, lending, and total cash NOI to segment NOI and net income (loss) attributable to common stockholders starting on page 11.
(5)FFO attributable to common stockholders represents net income (loss) attributable to common stockholders, computed in accordance with GAAP, which reflects the deduction of redeemable preferred stock dividends accumulated, excluding gains (or losses) from sales of real estate, impairment of real estate, and real estate depreciation and amortization. We calculate FFO in accordance with the standards established by the National Association of Real Estate Investment Trusts (the “NAREIT”). Please see our reconciliations of net income (loss) attributable to common stockholders to FFO attributable to common stockholders starting on page 9, and the discussion of the benefits and limitations of FFO as a supplemental measure of operating performance.
(6)Core FFO attributable to common stockholders (“core FFO”) represents FFO attributable to common stockholders (computed as described above), excluding gain (loss) on early extinguishment of debt, redeemable preferred stock redemptions, gain (loss) on termination of interest rate swaps, and transaction costs. Please see our reconciliations of net income (loss) attributable to common stockholders to core FFO starting on page 10, and the discussion of the benefits and limitations of core FFO as a supplemental measure of operating performance.
4
FORWARD-LOOKING STATEMENTS
This press release contains certain “forward-looking statements” within the meaning of Section 27A of the Securities Act of 1933 and Section 21E of the Securities Exchange Act of 1934 (the “Exchange Act”), which are intended to be covered by the safe harbors created thereby. Such forward-looking statements can be identified by the use of forward-looking terminology such as “may,” “will,” “project,” “target,” “expect,” “intend,” “might,” “believe,” “anticipate,” “estimate,” “could,” “would,” “continue,” “pursue,” “potential,” “forecast,” “seek,” “plan,” or “should” or the negative thereof or other variations or similar words or phrases. Such forward-looking statements include, among others, statements about CMCT’s plans and objectives relating to future growth and availability of funds, and the trading liquidity of CMCT's common stock. Such forward-looking statements are based on particular assumptions that management of CMCT has made in light of its experience, as well as its perception of expected future developments and other factors that it believes are appropriate under the circumstances. Forward-looking statements are necessarily estimates reflecting the judgment of CMCT’s management and involve a number of risks and uncertainties that could cause actual results to differ materially from those suggested by the forward-looking statements. These risks and uncertainties include those associated with (i) the scope, severity and duration of the current pandemic of COVID-19, and actions taken to contain the pandemic or mitigate its impact, (ii) the adverse effect of COVID-19 on the financial condition, results of operations, cash flows and performance of CMCT and its tenants and business partners, the real estate market and the global economy and financial markets, among others, (iii) the timing, form, and operational effects of CMCT’s development activities, (iv) the ability of CMCT to raise in place rents to existing market rents and to maintain or increase occupancy levels, (v) fluctuations in market rents, including as a result of COVID-19, and (vi) general economic, market and other conditions. Additional important factors that could cause CMCT’s actual results to differ materially from CMCT’s expectations are discussed under the section “Risk Factors” in CMCT’s Annual Report on Form 10-K for the year ended December 31, 2020. The forward-looking statements included herein are based on current expectations and there can be no assurance that these expectations will be attained. Assumptions relating to the foregoing involve judgments with respect to, among other things, future economic, competitive and market conditions and future business decisions, all of which are difficult or impossible to predict accurately and many of which are beyond CMCT’s control. Although we believe that the assumptions underlying the forward-looking statements are reasonable, any of the assumptions could be inaccurate and, therefore, there can be no assurance that the forward-looking statements included herein will prove to be accurate. In light of the significant uncertainties inherent in the forward-looking statements included herein, the inclusion of such information should not be regarded as a representation by CMCT or any other person that CMCT’s objectives and plans will be achieved. Readers are cautioned not to place undue reliance on forward-looking statements. Forward-looking statements speak only as of the date they are made. CMCT does not undertake to update them to reflect changes that occur after the date they are made.
For CIM Commercial Trust Corporation
Media Relations:
Bill Mendel, 212-397-1030
bill@mendelcommunications.com
Bill Mendel, 212-397-1030
bill@mendelcommunications.com
or
Shareholder Relations:
Steve Altebrando, 646-652-8473
shareholders@cimcommercial.com
shareholders@cimcommercial.com
5
CIM COMMERCIAL TRUST CORPORATION AND SUBSIDIARIES
Consolidated Balance Sheets
(Unaudited and in thousands, except share and per share amounts)
| December 31, | ||||||||||||||
| 2020 | 2019 | |||||||||||||
| ASSETS | ||||||||||||||
| Investments in real estate, net | $ | 506,040 | $ | 508,707 | ||||||||||
| Cash and cash equivalents | 33,636 | 23,801 | ||||||||||||
| Restricted cash | 10,013 | 12,146 | ||||||||||||
| Loans receivable, net | 83,135 | 68,079 | ||||||||||||
| Accounts receivable, net | 1,737 | 3,520 | ||||||||||||
| Deferred rent receivable and charges, net | 35,956 | 34,857 | ||||||||||||
| Other intangible assets, net | 6,313 | 7,260 | ||||||||||||
| Loan servicing asset, net and other assets | 8,787 | 9,222 | ||||||||||||
| TOTAL ASSETS | $ | 685,617 | $ | 667,592 | ||||||||||
| LIABILITIES, REDEEMABLE PREFERRED STOCK, AND EQUITY | ||||||||||||||
| LIABILITIES: | ||||||||||||||
| Debt, net | $ | 324,313 | $ | 307,421 | ||||||||||
| Accounts payable and accrued expenses | 20,327 | 24,309 | ||||||||||||
| Intangible liabilities, net | 587 | 1,282 | ||||||||||||
| Due to related parties | 6,706 | 9,431 | ||||||||||||
| Other liabilities | 9,733 | 10,113 | ||||||||||||
| Total liabilities | 361,666 | 352,556 | ||||||||||||
| COMMITMENTS AND CONTINGENCIES | ||||||||||||||
| REDEEMABLE PREFERRED STOCK: Series A cumulative redeemable preferred stock, $0.001 par value; 36,000,000 shares authorized; 2,008,256 and 2,007,856 shares issued and outstanding, respectively, as of December 31, 2020 and 1,630,821 and 1,630,421 shares issued and outstanding, respectively, as of December 31, 2019; liquidation preference of $25.00 per share, subject to adjustment | 45,837 | 36,841 | ||||||||||||
| EQUITY: | ||||||||||||||
| Series A cumulative redeemable preferred stock, $0.001 par value; 36,000,000 shares authorized; 4,484,376 and 4,377,762 shares issued and outstanding, respectively, as of December 31, 2020 and 2,853,555 and 2,837,094 shares issued and outstanding, respectively, as of December 31, 2019; liquidation preference of $25.00 per share, subject to adjustment | 108,729 | 70,633 | ||||||||||||
| Series D cumulative redeemable preferred stock, $0.001 par value; 32,000,000 shares authorized; 19,145 shares issued and outstanding as of December 31, 2020 and no shares issued and outstanding as of December 31, 2019; liquidation preference of $25.00 per share, subject to adjustment | 473 | — | ||||||||||||
| Series L cumulative redeemable preferred stock, $0.001 par value; 9,000,000 shares authorized; 8,080,740 and 5,387,160 shares issued and outstanding, respectively, as of December 31, 2020 and 8,080,740 and 5,387,160 shares issued and outstanding as of December 31, 2019; liquidation preference of $28.37 per share, subject to adjustment | 152,834 | 152,834 | ||||||||||||
| Common stock, $0.001 par value; 900,000,000 shares authorized; 14,827,410 and 14,602,149 shares issued and outstanding as of December 31, 2020 and December 31, 2019, respectively | 15 | 15 | ||||||||||||
| Additional paid-in capital | 794,127 | 794,825 | ||||||||||||
| Distributions in excess of earnings | (778,519) | (740,617) | ||||||||||||
| Total stockholders’ equity | 277,659 | 277,690 | ||||||||||||
| Noncontrolling interests | 455 | 505 | ||||||||||||
| Total equity | 278,114 | 278,195 | ||||||||||||
| TOTAL LIABILITIES, REDEEMABLE PREFERRED STOCK, AND EQUITY | $ | 685,617 | $ | 667,592 | ||||||||||
6
CIM COMMERCIAL TRUST CORPORATION AND SUBSIDIARIES
Consolidated Statements of Operations
(Unaudited and in thousands, except per share amounts)
| Three Months Ended | Year Ended | |||||||||||||||||||||||||
| December 31, | December 31, | |||||||||||||||||||||||||
| 2020 | 2019 | 2020 | 2019 | |||||||||||||||||||||||
| REVENUES: | ||||||||||||||||||||||||||
| Rental and other property income | $ | 13,407 | $ | 15,025 | $ | 54,823 | $ | 88,331 | ||||||||||||||||||
| Hotel income | 1,729 | 8,546 | 11,882 | 35,633 | ||||||||||||||||||||||
| Interest and other income | 2,693 | 3,070 | 10,503 | 16,025 | ||||||||||||||||||||||
| Total Revenues | 17,829 | 26,641 | 77,208 | 139,989 | ||||||||||||||||||||||
| EXPENSES: | ||||||||||||||||||||||||||
| Rental and other property operating | 8,715 | 13,731 | 37,544 | 62,928 | ||||||||||||||||||||||
| Asset management and other fees to related parties | 2,385 | 2,625 | 9,793 | 13,121 | ||||||||||||||||||||||
| Expense reimbursements to related parties—corporate | 177 | 981 | 2,243 | 2,800 | ||||||||||||||||||||||
| Expense reimbursements to related parties—lending segment | 910 | 542 | 3,491 | 2,382 | ||||||||||||||||||||||
| Interest | 2,709 | 3,177 | 11,415 | 12,175 | ||||||||||||||||||||||
| General and administrative | 1,634 | 1,561 | 6,772 | 6,354 | ||||||||||||||||||||||
| Transaction costs | — | (26) | — | 574 | ||||||||||||||||||||||
| Depreciation and amortization | 5,678 | 5,379 | 21,406 | 27,374 | ||||||||||||||||||||||
| Loss on early extinguishment of debt | — | — | 281 | 29,982 | ||||||||||||||||||||||
| Impairment of real estate | — | — | — | 69,000 | ||||||||||||||||||||||
| 22,208 | 27,970 | 92,945 | 226,690 | |||||||||||||||||||||||
| Gain on sale of real estate | — | — | — | 433,104 | ||||||||||||||||||||||
| (LOSS) INCOME BEFORE (BENEFIT) PROVISION FOR INCOME TAXES | (4,379) | (1,329) | (15,737) | 346,403 | ||||||||||||||||||||||
| Provision (benefit) for income taxes | 9 | 196 | (722) | 882 | ||||||||||||||||||||||
| NET (LOSS) INCOME | (4,388) | (1,525) | (15,015) | 345,521 | ||||||||||||||||||||||
| Net (income) loss attributable to noncontrolling interests | (2) | (13) | (1) | 152 | ||||||||||||||||||||||
| NET (LOSS) INCOME ATTRIBUTABLE TO THE COMPANY | (4,390) | (1,538) | (15,016) | 345,673 | ||||||||||||||||||||||
| Redeemable preferred stock dividends declared or accumulated | (4,389) | (4,161) | (18,002) | (17,095) | ||||||||||||||||||||||
| Redeemable preferred stock deemed dividends | (77) | — | (377) | — | ||||||||||||||||||||||
| Redeemable preferred stock redemptions | (5) | (5,874) | (72) | (5,882) | ||||||||||||||||||||||
| NET (LOSS) INCOME ATTRIBUTABLE TO COMMON STOCKHOLDERS | $ | (8,861) | $ | (11,573) | $ | (33,467) | $ | 322,696 | ||||||||||||||||||
| NET (LOSS) INCOME ATTRIBUTABLE TO COMMON STOCKHOLDERS PER SHARE: (a) | ||||||||||||||||||||||||||
| Basic | $ | (0.60) | $ | (0.79) | $ | (2.27) | $ | 22.11 | ||||||||||||||||||
| Diluted | $ | (0.60) | $ | (0.79) | $ | (2.27) | $ | 19.74 | ||||||||||||||||||
| WEIGHTED AVERAGE SHARES OF COMMON STOCK OUTSTANDING: (a) | ||||||||||||||||||||||||||
| Basic | 14,805 | 14,598 | 14,748 | 14,598 | ||||||||||||||||||||||
| Diluted | 14,805 | 14,599 | 14,748 | 16,493 | ||||||||||||||||||||||
(a)All share and per share amounts have been adjusted to give retroactive effect to the one-for-three reverse stock split of our common stock effected on September 3, 2019.
7
CIM COMMERCIAL TRUST CORPORATION AND SUBSIDIARIES
Earnings Per Share
(Unaudited and in thousands, except per share amounts)
Earnings per share (“EPS”) for the year-to-date period may differ from the sum of quarterly EPS amounts due to the required method for computing EPS for the respective periods. In addition, EPS is calculated independently for each component and may not be additive due to rounding. The following table reconciles the numerator and denominator used in computing our basic and diluted per-share amounts for net (loss) income attributable to common stockholders for the three months and the years ended December 31, 2020 and 2019:
| Three Months Ended | Year Ended | ||||||||||||||||||||||
| December 31, | December 31, | ||||||||||||||||||||||
| 2020 | 2019 | 2020 | 2019 | ||||||||||||||||||||
| Numerator: | |||||||||||||||||||||||
| Net (loss) income attributable to common stockholders | $ | (8,861) | $ | (11,573) | $ | (33,467) | $ | 322,696 | |||||||||||||||
| Redeemable preferred stock dividends declared on dilutive shares (a) | — | (2) | (1) | 2,804 | |||||||||||||||||||
| Diluted net (loss) income attributable to common stockholders | $ | (8,861) | $ | (11,575) | $ | (33,468) | $ | 325,500 | |||||||||||||||
| Denominator: (b) | |||||||||||||||||||||||
| Basic weighted average shares of common stock outstanding | 14,805 | 14,598 | 14,748 | 14,598 | |||||||||||||||||||
| Effect of dilutive securities—contingently issuable shares (a) | — | 1 | — | 1,895 | |||||||||||||||||||
| Diluted weighted average shares and common stock equivalents outstanding | 14,805 | 14,599 | 14,748 | 16,493 | |||||||||||||||||||
| Net (loss) income attributable to common stockholders per share: (b) | |||||||||||||||||||||||
| Basic | $ | (0.60) | $ | (0.79) | $ | (2.27) | $ | 22.11 | |||||||||||||||
| Diluted | $ | (0.60) | $ | (0.79) | $ | (2.27) | $ | 19.74 | |||||||||||||||
(a)For the three months ended December 31, 2020 and the three months and year ended December 31, 2019, the effect of certain shares of redeemable preferred stock were excluded from the computation of diluted net income (loss) attributable to common stockholders and the diluted weighted average shares and common stock equivalents outstanding as such inclusion would be anti-dilutive.
(b)All share and per share amounts have been adjusted to give retroactive effect to the one-for-three reverse stock split of our common stock effected on September 3, 2019.
8
CIM COMMERCIAL TRUST CORPORATION AND SUBSIDIARIES
Funds from Operations
(Unaudited and in thousands, except per share amounts)
We believe that FFO attributable to common stockholders is a widely recognized and appropriate measure of the performance of a REIT and that it is frequently used by securities analysts, investors and other interested parties in the evaluation of REITs, many of which present FFO attributable to common stockholders when reporting their results. FFO attributable to common stockholders represents net income (loss) attributable to common stockholders, computed in accordance with GAAP, which reflects the deduction of redeemable preferred stock dividends accumulated, excluding gains (or losses) from sales of real estate, impairment of real estate, and real estate depreciation and amortization. We calculate FFO attributable to common stockholders in accordance with the standards established by the NAREIT.
Like any metric, FFO attributable to common stockholders should not be used as the only measure of our performance because it excludes depreciation and amortization and captures neither the changes in the value of our real estate properties that result from use or market conditions nor the level of capital expenditures and leasing commissions necessary to maintain the operating performance of our properties, all of which have real economic effect and could materially impact our operating results. Other REITs may not calculate FFO attributable to common stockholders in accordance with the standards established by the NAREIT; accordingly, our FFO attributable to common stockholders may not be comparable to the FFO attributable to common stockholders of other REITs. Therefore, FFO attributable to common stockholders should be considered only as a supplement to net income (loss) as a measure of our performance and should not be used as a supplement to or substitute measure for cash flows from operating activities computed in accordance with GAAP. FFO attributable to common stockholders should not be used as a measure of our liquidity, nor is it indicative of funds available to fund our cash needs, including our ability to pay dividends. The following table sets forth a reconciliation of net income (loss) attributable to common stockholders to FFO attributable to common stockholders for the three months and the years ended December 31, 2020 and 2019:
| Three Months Ended | Year Ended | |||||||||||||||||||||||||
| December 31, | December 31, | |||||||||||||||||||||||||
| 2020 | 2019 | 2020 | 2019 | |||||||||||||||||||||||
| Numerator: | ||||||||||||||||||||||||||
| Net (loss) income attributable to common stockholders | $ | (8,861) | $ | (11,573) | $ | (33,467) | $ | 322,696 | ||||||||||||||||||
| Depreciation and amortization | 5,678 | 5,379 | 21,406 | 27,374 | ||||||||||||||||||||||
| Impairment of real estate | — | — | — | 69,000 | ||||||||||||||||||||||
| Gain on sale of depreciable assets | — | — | — | (433,104) | ||||||||||||||||||||||
| FFO attributable to common stockholders | $ | (3,183) | $ | (6,194) | $ | (12,061) | $ | (14,034) | ||||||||||||||||||
| Redeemable preferred stock dividends declared on dilutive shares (a) | — | (2) | (1) | (3) | ||||||||||||||||||||||
| Dilutive FFO attributable to common stockholders | $ | (3,183) | $ | (6,196) | $ | (12,062) | $ | (14,037) | ||||||||||||||||||
| Denominator (b): | ||||||||||||||||||||||||||
| Basic weighted average shares of common stock outstanding | 14,805 | 14,598 | 14,748 | 14,598 | ||||||||||||||||||||||
| Effect of dilutive securities-contingently issuable shares (a) | — | 1 | — | 1 | ||||||||||||||||||||||
| Diluted weighted average shares and common stock equivalents outstanding | 14,805 | 14,599 | 14,748 | 14,599 | ||||||||||||||||||||||
| FFO attributable to common stockholders per share (b) | ||||||||||||||||||||||||||
| Basic | $ | (0.21) | $ | (0.42) | $ | (0.82) | $ | (0.96) | ||||||||||||||||||
| Diluted | $ | (0.21) | $ | (0.42) | $ | (0.82) | $ | (0.96) | ||||||||||||||||||
(a)For the three months and the years ended December 31, 2020 and 2019, the effect of certain shares of redeemable preferred stock were excluded from the computation of diluted FFO attributable to common stockholders and the diluted weighted average shares and common stock equivalents outstanding as such inclusion would be anti-dilutive.
(b)All share and per share amounts have been adjusted to give retroactive effect to the one-for-three reverse stock split of our common stock effected on September 3, 2019.
9
CIM COMMERCIAL TRUST CORPORATION AND SUBSIDIARIES
Core Funds from Operations
(Unaudited and in thousands, except per share amounts)
In addition to calculating FFO attributable to common stockholders in accordance with the standards established by NAREIT, we also calculate a supplemental FFO metric we call core FFO attributable to common stockholders. Core FFO attributable to common stockholders represents FFO attributable to common stockholders, computed in accordance with NAREIT's standards, excluding losses (or gains) on early extinguishment of debt, redeemable preferred stock redemptions, gains (or losses) on termination of interest rate swaps, and transaction costs. We believe that core FFO is a useful metric for securities analysts, investors and other interested parties in the evaluation of our Company as it excludes from FFO the effect of certain amounts that we believe are non-recurring, are non-operating in nature as they relate to the manner in which we finance our operations, or transactions outside of the ordinary course of business.
Like any metric, core FFO should not be used as the only measure of our performance because, in addition to excluding those items prescribed by NAREIT when calculating FFO, it excludes amounts incurred in connection with non-recurring special projects, prepaying or defeasing our debt and repurchasing our preferred stock, all of which have real economic effect and could materially impact our operating results. Other REITs may not calculate core FFO in the same manner as we do, or at all; accordingly, our core FFO may not be comparable to the core FFOs of other REITs that calculate such a metric. Therefore, core FFO should be considered only as a supplement to net (loss) income as a measure of our performance and should not be used as a supplement to or substitute measure for cash flows from operating activities computed in accordance with GAAP. Core FFO should not be used as a measure of our liquidity, nor is it indicative of funds available to fund our cash needs, including our ability to pay dividends. The following table sets forth a reconciliation of net (loss) income attributable to common stockholders to core FFO attributable to common stockholders for the three months and the years ended December 31, 2020 and 2019:
| Three Months Ended | Year Ended | |||||||||||||||||||||||||
| December 31, | December 31, | |||||||||||||||||||||||||
| 2020 | 2019 | 2020 | 2019 | |||||||||||||||||||||||
| Numerator: | ||||||||||||||||||||||||||
| Net (loss) income attributable to common stockholders | $ | (8,861) | $ | (11,573) | $ | (33,467) | $ | 322,696 | ||||||||||||||||||
| Depreciation and amortization | 5,678 | 5,379 | 21,406 | 27,374 | ||||||||||||||||||||||
| Impairment of real estate | — | — | — | 69,000 | ||||||||||||||||||||||
| Gain on sale of depreciable assets | — | — | — | (433,104) | ||||||||||||||||||||||
| FFO attributable to common stockholders | $ | (3,183) | $ | (6,194) | $ | (12,061) | $ | (14,034) | ||||||||||||||||||
| Loss on early extinguishment of debt | — | — | 281 | 29,982 | ||||||||||||||||||||||
| Redeemable preferred stock redemptions | 5 | 5,874 | 72 | 5,882 | ||||||||||||||||||||||
| Redeemable preferred stock deemed dividends | 77 | — | 377 | — | ||||||||||||||||||||||
| (Gain) loss on termination of interest rate swaps | — | — | — | (1,486) | ||||||||||||||||||||||
| Transaction costs | — | (26) | — | 574 | ||||||||||||||||||||||
| Core FFO attributable to common stockholders | $ | (3,101) | $ | (346) | $ | (11,331) | $ | 20,918 | ||||||||||||||||||
| Redeemable preferred stock dividends declared on dilutive shares (a) | — | (2) | (1) | 2,803 | ||||||||||||||||||||||
| Dilutive Core FFO attributable to common stockholders | $ | (3,101) | $ | (348) | $ | (11,332) | $ | 23,721 | ||||||||||||||||||
| Denominator (b): | ||||||||||||||||||||||||||
| Basic weighted average shares of common stock outstanding | 14,805 | 14,598 | 14,748 | 14,598 | ||||||||||||||||||||||
| Effect of dilutive securities-contingently issuable shares (a) | — | 1 | — | 1,894 | ||||||||||||||||||||||
| Diluted weighted average shares and common stock equivalents outstanding | 14,805 | 14,599 | 14,748 | 16,492 | ||||||||||||||||||||||
| Core FFO attributable to common stockholders per share (b): | ||||||||||||||||||||||||||
| Basic | $ | (0.21) | $ | (0.02) | $ | (0.77) | $ | 1.43 | ||||||||||||||||||
| Diluted | $ | (0.21) | $ | (0.02) | $ | (0.77) | $ | 1.44 | ||||||||||||||||||
(a)For the three months and the years ended December 31, 2020 and 2019, the effect of certain shares of redeemable preferred stock were excluded from the computation of diluted FFO attributable to common stockholders and the diluted weighted average shares and common stock equivalents outstanding as such inclusion would be anti-dilutive.
(b)All share and per share amounts have been adjusted to give retroactive effect to the one-for-three reverse stock split of our common stock effected on September 3, 2019.
10
CIM COMMERCIAL TRUST CORPORATION AND SUBSIDIARIES
Reconciliation of Net Operating Income
(Unaudited and in thousands)
We internally evaluate the operating performance and financial results of our real estate segments based on segment NOI, which is defined as rental and other property income and expense reimbursements less property related expenses and excludes non-property income and expenses, interest expense, depreciation and amortization, corporate related general and administrative expenses, gain (loss) on sale of real estate, gain (loss) on early extinguishment of debt, impairment of real estate, transaction costs, and provision for income taxes. For our lending segment, we define segment NOI as interest income net of interest expense and general overhead expenses. We also evaluate the operating performance and financial results of our operating segments using cash basis NOI, or "cash NOI". For our real estate segments, we define cash NOI as segment NOI adjusted to exclude the effect of the straight lining of rents, acquired above/below market lease amortization and other adjustments required by GAAP.
Segment NOI and cash NOI are not measures of operating results or cash flows from operating activities as measured by GAAP and should not be considered alternatives to income from continuing operations, or to cash flows as a measure of liquidity, or as an indication of our performance or of our ability to pay dividends. Companies may not calculate segment NOI or cash NOI in the same manner. We consider segment NOI and cash NOI to be useful performance measures to investors and management because, when compared across periods, they reflect the revenues and expenses directly associated with owning and operating our properties and the impact to operations from trends in occupancy rates, rental rates and operating costs, providing a perspective not immediately apparent from income from continuing operations. Additionally, we believe that cash NOI is helpful to investors because it eliminates straight line rent and other non-cash adjustments to revenue and expenses.
Below is a reconciliation of cash NOI to segment NOI and net income (loss) attributable to the Company for the three months ended December 31, 2020 and 2019:
| Three Months Ended December 31, 2020 | ||||||||||||||||||||||||||||||||||||||
| Same-Store Office | Non-Same-Store Office | Total Office | Hotel | Lending | Total | |||||||||||||||||||||||||||||||||
| Cash net operating income (loss) excluding lease termination income | $ | 7,148 | $ | 20 | $ | 7,168 | $ | (391) | $ | 787 | $ | 7,564 | ||||||||||||||||||||||||||
| Cash lease termination income | — | — | — | — | — | — | ||||||||||||||||||||||||||||||||
| Cash net operating income (loss) | 7,148 | 20 | 7,168 | (391) | 787 | 7,564 | ||||||||||||||||||||||||||||||||
| Deferred rent and amortization of intangible assets, liabilities, and lease inducements | (206) | (1) | (207) | (2) | — | (209) | ||||||||||||||||||||||||||||||||
| Straight line lease termination income | 78 | — | 78 | — | — | 78 | ||||||||||||||||||||||||||||||||
| Segment net operating income (loss) | 7,020 | 19 | 7,039 | (393) | 787 | 7,433 | ||||||||||||||||||||||||||||||||
| Interest and other income | 6 | |||||||||||||||||||||||||||||||||||||
| Asset management and other fees to related parties | (2,385) | |||||||||||||||||||||||||||||||||||||
| Expense reimbursements to related parties — corporate | (177) | |||||||||||||||||||||||||||||||||||||
| Interest expense | (2,491) | |||||||||||||||||||||||||||||||||||||
| General and administrative | (1,087) | |||||||||||||||||||||||||||||||||||||
| Transaction costs | — | |||||||||||||||||||||||||||||||||||||
| Depreciation and amortization | (5,678) | |||||||||||||||||||||||||||||||||||||
| Loss before provision for income taxes | (4,379) | |||||||||||||||||||||||||||||||||||||
| Provision for income taxes | (9) | |||||||||||||||||||||||||||||||||||||
| Net loss | (4,388) | |||||||||||||||||||||||||||||||||||||
| Net income attributable to noncontrolling interests | (2) | |||||||||||||||||||||||||||||||||||||
| Net loss attributable to the Company | $ | (4,390) | ||||||||||||||||||||||||||||||||||||
11
CIM COMMERCIAL TRUST CORPORATION AND SUBSIDIARIES
Reconciliation of Net Operating Income (Continued)
(Unaudited and in thousands)
| Three Months Ended December 31, 2019 | ||||||||||||||||||||||||||||||||||||||
| Same-Store Office | Non-Same-Store Office | Total Office | Hotel | Lending | Total | |||||||||||||||||||||||||||||||||
| Cash net operating income (loss) excluding lease termination income | $ | 6,995 | $ | (220) | $ | 6,775 | $ | 2,522 | $ | 1,492 | $ | 10,789 | ||||||||||||||||||||||||||
| Cash lease termination income | — | — | — | — | — | — | ||||||||||||||||||||||||||||||||
| Cash net operating income (loss) | 6,995 | (220) | 6,775 | 2,522 | 1,492 | 10,789 | ||||||||||||||||||||||||||||||||
| Deferred rent and amortization of intangible assets, liabilities, and lease inducements | 708 | — | 708 | — | — | 708 | ||||||||||||||||||||||||||||||||
| Segment net operating income (loss) | 7,703 | (220) | 7,483 | 2,522 | 1,492 | 11,497 | ||||||||||||||||||||||||||||||||
| Interest and other income | 103 | |||||||||||||||||||||||||||||||||||||
| Asset management and other fees to related parties | (2,625) | |||||||||||||||||||||||||||||||||||||
| Expense reimbursements to related parties — corporate | (981) | |||||||||||||||||||||||||||||||||||||
| Interest expense | (2,846) | |||||||||||||||||||||||||||||||||||||
| General and administrative | (1,124) | |||||||||||||||||||||||||||||||||||||
| Transaction costs | 26 | |||||||||||||||||||||||||||||||||||||
| Depreciation and amortization | (5,379) | |||||||||||||||||||||||||||||||||||||
| Loss before provision for income taxes | (1,329) | |||||||||||||||||||||||||||||||||||||
| Provision for income taxes | (196) | |||||||||||||||||||||||||||||||||||||
| Net loss | (1,525) | |||||||||||||||||||||||||||||||||||||
| Net income attributable to noncontrolling interests | (13) | |||||||||||||||||||||||||||||||||||||
| Net loss attributable to the Company | $ | (1,538) | ||||||||||||||||||||||||||||||||||||
12
Exhibit 99.2

Important Disclosures
Free Writing Prospectus | CIM Commercial Trust Corporation Investor Presentation Q4 2020
Filed Pursuant to Rule 433 | Dated March 16, 2021 | Registration Statement No. 333-233255
CIM Commercial Trust Corporation (“CMCT”) has filed a registration statement (including a base prospectus) with the Securities and Exchange Commission (the “SEC”) for the offering of Series A Preferred Stock and Series D Preferred Stock to which this communication relates. Before you invest, you should read the base prospectus, dated December 4, 2019, in that registration statement, the prospectus supplement for the Series A Preferred Stock and Series D Preferred Stock, dated January 28, 2020, as supplemented by Supplement No. 5, thereto, dated January 29, 2021 and other documents CMCT has filed with the SEC for more complete information about CMCT and the offering. You may request to receive a prospectus by calling toll-free at 1-866-341-2653.
Reverse Stock Split
On September 3, 2019, CMCT effected a 1-for-3 reverse stock split (the “Reverse Stock Split”) on its common stock, par value $0.001 per share. Unless otherwise specified, all CMCT common stock and CMCT common stock per share amounts set forth in this presentation have been adjusted to give retroactive effect to the Reverse Stock Split.
www.cimcommercial.com | ©2020 CMCT | CMCT CIM Commercial Trust Corporation | Securities distributed by affiliate broker-dealer: CCO Capital, LLC, member: FINRA / SIPC


Serious News for Serious Traders! Try StreetInsider.com Premium Free!
You May Also Be Interested In
- SageSpring Wealth Partners Celebrates Deborah Jenkins' Retirement and Welcomes Brad Clayton as Chief Compliance Officer
- ABB E-mobility fast EV chargers open for vehicles at Vermont's first NEVI site
- Truist shareholders elect Laurence Stein to board of directors
Create E-mail Alert Related Categories
SEC FilingsSign up for StreetInsider Free!
Receive full access to all new and archived articles, unlimited portfolio tracking, e-mail alerts, custom newswires and RSS feeds - and more!
