

Form 8-K CF Corp For: Jun 05
 Tweet
Tweet Share
Share
UNITED
STATES
SECURITIES AND EXCHANGE COMMISSION
Washington, D.C. 20549
FORM 8-K
CURRENT REPORT
PURSUANT
TO SECTION 13 OR 15(d) OF THE
SECURITIES EXCHANGE ACT OF 1934
Date of Report (Date of earliest event reported): June 5, 2017
CF Corporation
(Exact name of registrant as specified in its charter)
| Cayman Islands | 001-37779 | 98-1354810 |
| (State or other jurisdiction of incorporation) |
(Commission File Number) |
(IRS Employer Identification No.) |
1701 Village Center Circle
Las Vegas, Nevada 89134
(Address of principal executive offices, including zip code)
Registrant’s telephone number, including area code: (702) 323-7331
Not Applicable
(Former name or former address, if changed since last report)
Check the appropriate box below if the Form 8-K filing is intended to simultaneously satisfy the filing obligation of the registrant under any of the following provisions:
| ¨ | Written communications pursuant to Rule 425 under the Securities Act (17 CFR 230.425) |
| x | Soliciting material pursuant to Rule 14a-12 under the Exchange Act (17 CFR 240.14a-12) |
| ¨ | Pre-commencement communications pursuant to Rule 14d-2(b) under the Exchange Act (17 CFR 240.14d-2(b)) |
| ¨ | Pre-commencement communications pursuant to Rule 13e-4(c) under the Exchange Act (17 CFR 240.13e-4(c)) |
Indicate by check mark whether the registrant is an emerging growth company as defined in Rule 405 of the Securities Act of 1933 (§230.405 of this chapter) or Rule 12b-2 of the Securities Exchange Act of 1934 (§240.12b-2 of this chapter).
Emerging growth company x
If an emerging growth company, indicate by check mark if the registrant has elected not to use the extended transition period for complying with any new or revised financial accounting standards provided pursuant to Section 13(a) of the Exchange Act. ¨
| Item 7.01. | Regulation FD Disclosure. |
Furnished herewith as Exhibit 99.1 is a copy of an investor presentation that CF Corporation (the “Company”) plans to use in connection with meetings with current and potential investors relating to the previously announced business combination between the Company and Fidelity & Guaranty Life (the “Business Combination”).
The information in this Item 7.01 and Exhibit 99.1 attached hereto shall not be deemed “filed” for purposes of Section 18 of the Securities Exchange Act of 1934, as amended (the “Exchange Act”), or otherwise subject to the liabilities of that section, nor shall it be deemed incorporated by reference in any filing under the Securities Act of 1933, as amended (the “Securities Act”), or the Exchange Act, except as expressly set forth by specific reference in such filing.
Additional Information About the Business Combination
In connection with the proposed Business Combination, the Company intends to file a preliminary proxy statement and a definitive proxy statement with the United States Securities and Exchange Commission (“SEC”). The Company’s shareholders and other interested persons are advised to read, when available, the preliminary proxy statement and the amendments thereto and the definitive proxy statement and documents incorporated by reference therein as these materials will contain important information about FGL, the Company and the Business Combination. When available, the definitive proxy statement and other relevant materials will be mailed to shareholders of the Company as of a record date to be established for voting on the Business Combination. Shareholders will also be able to obtain copies of the preliminary proxy statement, the definitive proxy statement and other documents filed with the SEC that will be incorporated by reference therein, without charge, once available, at the SEC’s web site at www.sec.gov, or by directing a request to: CF Corporation, 1701 Village Center Circle, Las Vegas, Nevada 89134, Attention: Douglas B. Newton, Chief Financial Officer (212) 355-5515.
Participants in the Solicitation
The Company and its directors and executive officers may be deemed participants in the solicitation of proxies from the Company’s shareholders with respect to the Business Combination. A list of the names of those directors and executive officers and a description of their interests in the Company is contained in the Company’s Annual Report on Form 10-K for the fiscal year ended December 31, 2016, which was filed with the SEC and is available free of charge at the SEC’s web site at www.sec.gov, or by directing a request to CF Corporation, 1701 Village Center Circle, Las Vegas, Nevada 89134, Attention: Douglas B. Newton, Chief Financial Officer, (212) 355-5515. Additional information regarding the interests of such participants will be contained in the proxy statement for the Business Combination when available.
FGL and its directors and executive officers may also be deemed to be participants in the solicitation of proxies from the shareholders of the Company in connection with the Business Combination. A list of the names of such directors and executive officers and information regarding their interests in the Business Combination will be included in the proxy statement for the Business Combination when available.
Disclaimer
This communication shall not constitute a solicitation of a proxy, consent or authorization with respect to any vote in any jurisdiction in respect of the Business Combination. This communication shall also not constitute an offer to sell or the solicitation of an offer to buy any securities, nor shall there by any sale of securities in any states or jurisdictions in which such offer, solicitation or sale would be unlawful prior to registration or qualification under the securities laws of any such jurisdiction. No offering of securities shall be made except by means of a prospectus meeting the requirements of section 10 of the Securities Act.
| Item 9.01 | Financial Statements and Exhibits. |
(d) Exhibits
The Company incorporates by reference the Exhibit Index following the signature page to this Current Report on Form 8-K.
SIGNATURE
Pursuant to the requirements of the Securities Exchange Act of 1934, the registrant has duly caused this report to be signed on its behalf by the undersigned hereunto duly authorized.
| CF CORPORATION | ||
| By: | /s/ Douglas B. Newton | |
| Name: Douglas B. Newton | ||
| Title: Chief Financial Officer | ||
| Dated: June 5, 2017 | ||
EXHIBIT INDEX
| Exhibit No. | Description | |
| 99.1 | Investor Presentation, dated June 5, 2017. |
Exhibit 99.1

CF Corporation to Acquire Fidelity & Guaranty Life June 2017 Investor Presentation

Important Information This investor presentation (“Investor Presentation”) is for informational purposes only and does not constitute an offer to s ell , a solicitation of an offer to buy, or a recommendation to purchase any equity, debt or other financial instruments of CF Corporation (“CF Corp.”) or Fidelity & Guaranty Life (“F&G”) or any of CF Corp.’s or F&G’s affiliates. The Investor Presentation has been prepared to assist parties in making their own evaluation with respect to the proposed business combination (the “Business Combination”), as contemplated in the Agreement and Plan of Merge r ( the “Merger Agreement”), of CF Corp. and F&G and for no other purpose. It is not intended to form the basis of any investment decision or any other decision in respect of the Business Combination. The information co nta ined herein does not purport to be all - inclusive. The data contained herein is derived from various internal and external sources. No representation is made as to the reasonableness of the assumptions made within or t he accuracy or completeness of any projections or modeling or any other information contained herein. Any data on past performance or modeling contained herein is not an indication as to future performance. CF Corp. and F&G assume no obligation to update the information in this Investor Presentation. Important Information About the Business Combination and Where to Find It In connection with the proposed Business Combination, CF Corp. intends to file a preliminary proxy statement and a definitive pr oxy statement with the United States Securities and Exchange Commission (“SEC”). CF Corp.’s shareholders and other interested persons are advised to read, when available, the preliminary proxy statement and the amendm ent s thereto and the definitive proxy statement and documents incorporated by reference therein as these materials will contain important information about F&G, CF Corp. and the Business Combination. When available, the definitive proxy statement and other relevant materials will be mailed to shareholders of CF Corp. as of a record date to be established for voting on the Business Combination. Shareholders will also be able to obta in copies of the preliminary proxy statement, the definitive proxy statement and other documents filed with the SEC that will be incorporated by reference therein, without charge, once available, at the SEC’s web site at w ww. sec.gov, or by directing a request to: CF Corporation, 1701 Village Center Circle, Las Vegas, Nevada 89134, Attention: Douglas B. Newton, Chief Financial Officer (212) 355 - 5515 or by accessing CF Corp.’s website at www.cfcorpandfidelity.com. Participants in the Solicitation CF Corp. and its directors and executive officers may be deemed participants in the solicitation of proxies from CF Corp.’s s har eholders with respect to the Business Combination. A list of the names of those directors and executive officers and a description of their interests in CF Corp. is contained in CF Corp.’s annual report on Form 10 - K for th e fiscal year ended December 31, 2016, which was filed with the SEC and is available free of charge at the SEC’s web site at www.sec.gov, or by directing a request to CF Corporation, 1701 Village Center Circle, Las Vegas, Nevada 89 134, Attention: Douglas B. Newton, Chief Financial Officer (212) 355 - 5515. Additional information regarding the interests of such participants will be contained in the proxy statement for the Business Combination when avail abl e . F&G and its directors and executive officers may also be deemed to be participants in the solicitation of proxies from the shareh old ers of CF Corp. in connection with the Business Combination. A list of the names of such directors and executive officers and information regarding their interests in the Business Combination will be included in th e p roxy statement for the Business Combination when available. Forward - Looking Statements This presentation includes “forward - looking statements” within the meaning of the “safe harbor” provisions of the Private Securi ties Litigation Reform Act of 1995. CF Corp.’s and F&G’s actual results may differ from their expectations, estimates and projections and consequently, you should not rely on these forward looking statements as predicti ons of future events. Words such as “expect,” “estimate,” “project,” “budget,” “forecast,” “anticipate,” “intend,” “plan,” “may,” “will,” “could,” “should,” “believes,” “predicts,” “potential,” “continue,” and simila r expressions, and references to FY1, are intended to identify such forward - looking statements. These forward - looking statements include, without limitation, CF Corp.’s and F&G’s expectations and projections with respect to future performance and anticipated financial impacts of the Business Combination, the satisfaction of the closing conditions to the Business Combination and the timing of the completion of the Business Combination. These forwar d - l ooking statements involve significant risks and uncertainties (including without limitation regarding value creation, share price appreciation and return on equity) that could cause the actual results to differ materially from the expected results. Most of these factors are outside CF Corp.’s a nd F&G’s control and are difficult to predict. Factors that may cause such differences include, but are not limited to: (1) the occurrence of any even t, change or other circumstances that could give rise to the termination of the Merger Agreement; (2) the outcome of any legal proceedings that may be instituted against CF Corp. and/or F&G following the announcement of the Merger Agreement and the transactions contemplated therein; (3) the inability to comple te the Business Combination, including due to failure to obtain approval of the shareholders of CF Corp. or other conditions to closing in th e M erger Agreement; (4) delays in obtaining, adverse conditions contained in, or the inability to obtain necessary regulatory approvals (including approval from in insurance regulators) required to complete the transactions contem pla ted by the Merger Agreement; ( 5) the inability to achieve tax efficiencies or to achieve incremental investment returns from asset management; (6) the inability to identify and consummate accretive, value - added acquisitions; (7) the inability to obtain or maintain the listing of the post - acquisition company’s ordinary shares on a stock exchange following the business combination; ( 8) the risk that the Business Combination disrupts current plans and operations as a result of the announcement and consummation of the Business Combination; (9) the ability to recognize the anticipated benefits of the Business Combination, which may be affected by, amo ng other things, competition, the ability of the combined company to grow and manage growth profitably and retain its key employees; (10) costs related to the Business Combination; (11) changes in applicable laws or r egu lations; (12) the possibility that F&G or the combined company may be adversely affected by other economic, business, and/or competitive factors; (13) the risks set forth under this Investor Presentation; and (14) other risks and uncertainties indicated from time to time in the proxy statement relating to the Business Combination, including those under “Risk Factors” therein, and in CF Corp.’s other filings with the SEC. CF Corp. cautions th at the foregoing list of factors is not exclusive. CF Corp. cautions readers not to place undue reliance upon any forward - looking statements, which speak only as of the date made. CF Corp. does not undertake or accept any obligation or undertaking to release publicly any updates or revisions to any forward - looking statements to reflect any change in its expectations or any change in events, conditions or circumstances on which any such statement is ba sed . No Offer or Solicitation This presentation shall not constitute a solicitation of a proxy, consent or authorization with respect to any securities or in respect of the Business Combination. This presentation shall also not constitute an offer to sell or the solicitation of an offer to buy any securities, nor shall there be any sale of securities in any states or jurisdictions in w hic h such offer, solicitation or sale would be unlawful prior to registration or qualification under the securities laws of any such jurisdiction. No offering of securities shall be made except by means of a prospectus meeting the requiremen ts of section 10 of the Securities Act of 1933, as amended. Industry and Market Data In this presentation, we rely on and refer to information and statistics regarding market participants in the sectors in whic h F &G competes and other industry data. We obtained this information and statistics from third - party sources, including reports by market research firms, and company filings . 2

Introduction 3

Today’s Presenters 4 Chinh Chu Founder and Co - Chairman, CF Corporation Chris Littlefield CEO, Fidelity & Guaranty Life Dennis Vigneau CFO, Fidelity & Guaranty Life
Transaction Overview 5

CF Corporation 6 CF Corporation (“CF Corp.”) is a publicly - listed company founded by Chinh Chu and William Foley which raised, and obtained commitments for, an aggregate of $1.2 billion of proceeds to acquire a high quality operating company Primary objective is to build a high quality, enduring business by using permanent capital, a core tenet of the CF Corp. structure One of the largest U.S. - listed special purpose acquisition companies (“ SPAC”) Large founder co - investment ($71 million); results in alignment of interests CF Corp. raised capital from blue - chip, long - term investors Well - respected reputations Operational expertise Stewards of all stakeholders’ interests History of strategic investments with long - term horizon CF Corp. Founders Track record of delivering stability and value Broad and deep insurance industry expertise William P. Foley II Founder and Co - Chairman (30 + Years Experience) $54 billion of public market value creation 3 separate multi - billion dollar public market platforms, with over 100 acquisitions across all platforms Chairman of the Board of Fidelity National Financial (“FNF”) Vice - Chairman of the Board of Fidelity National Information Services (“FIS”) Chinh E. Chu Founder and Co - Chairman (25+ Years Experience) Previously a Senior Managing Director at Blackstone and member of Blackstone’s Executive Committee • Longest tenured partner aside from Stephen Schwarzman Served on Boards of Kronos, NCR, SunGard, London Financial Futures Exchange, BankUnited , Stearns Mortgage, Celanese, Nalco, Catalent , Nycomed , Stiefel , Allied Barton, and Graham Packaging
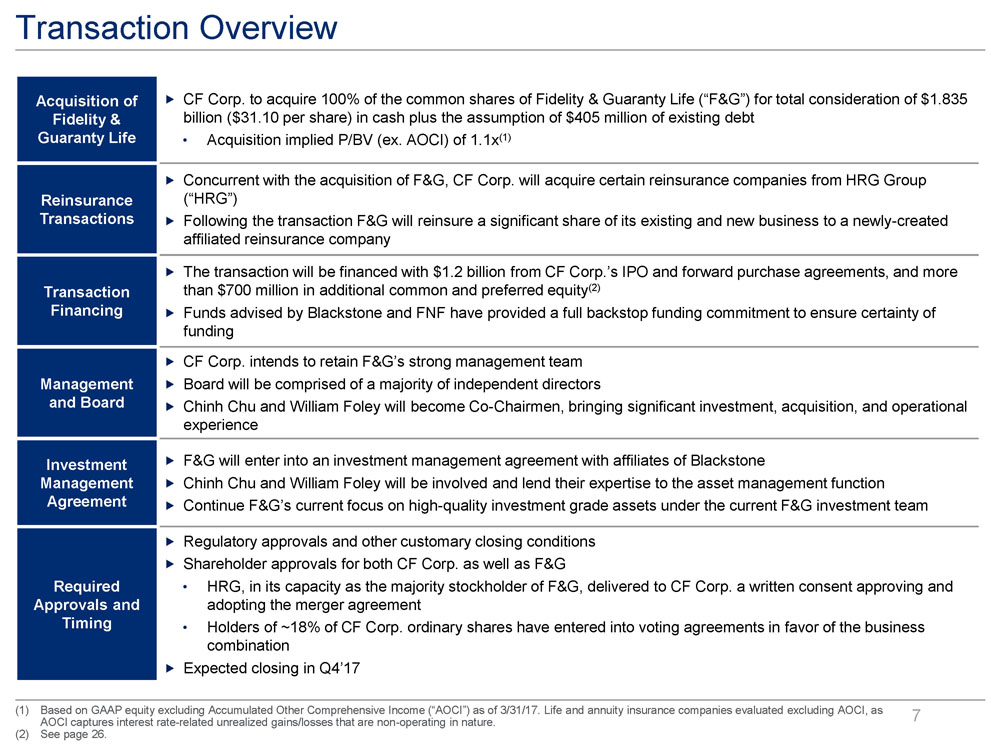
Transaction Overview 7 Acquisition of Fidelity & Guaranty Life CF Corp. to acquire 100% of the common shares of Fidelity & Guaranty Life (“F&G”) for total consideration of $1.835 billion ($31.10 per share) in cash plus the assumption of $405 million of existing debt • Acquisition implied P/BV (ex. AOCI) of 1.1x (1) Reinsurance Transactions Concurrent with the acquisition of F&G, CF Corp. will acquire certain reinsurance companies from HRG Group (“HRG”) Following the transaction F&G will reinsure a significant share of its existing and new business to a newly - created affiliated reinsurance company Transaction Financing The transaction will be financed with $1.2 billion from CF Corp.’s IPO and forward purchase agreements, and more than $700 million in additional common and preferred equity (2) Funds advised by Blackstone and FNF have provided a full backstop funding commitment to ensure certainty of funding Management and Board CF Corp. intends to retain F&G’s strong management team Board will be comprised of a majority of independent directors Chinh Chu and William Foley will become Co - Chairmen, bringing significant investment, acquisition, and operational experience Investment Management Agreement F&G will enter into an investment management agreement with affiliates of Blackstone Chinh Chu and William Foley will be involved and lend their expertise to the asset management function Continue F&G’s current focus on high - quality investment grade assets under the current F&G investment team Required Approvals and Timing Regulatory approvals and other customary closing conditions Shareholder approvals for both CF Corp. as well as F&G • HRG, in its capacity as the majority stockholder of F&G, delivered to CF Corp. a written consent approving and adopting the merger agreement • Holders of ~18% of CF Corp. ordinary shares have entered into voting agreements in favor of the business combination Expected closing in Q4’17 (1) Based on GAAP equity excluding Accumulated Other Comprehensive Income (“AOCI”) as of 3/31/17. Life and annuity insurance companies evaluated excluding AOCI, as AOCI captures interest rate - related unrealized gains/losses that are non - operating in nature. (2) See page 26.

Expected Transaction Value Creation 8 $10.00 F&G Status Quo Reinsurance Structure Asset Management Multiple Re-Rating Additional Acquisitions +$2.00 +$2.50 +$1.50 - $4.50 (1.0 - 3.0x Multiple Uplift) Implementation of expected reinsurance structure to drive meaningful and structural earnings uplift Proven Reinsurance Structure 1 Blackstone and CF Founders will manage the $23 billion investment portfolio (5) Assumes 40bps net portfolio yield enhancement achieved out of 120bps of gross opportunity identified Optimize Asset Management 2 $2.5bn of assets can yield approximately 5 - 10% incremental equity value under new F&G structure Leverage extensive experience of CF Founders Accretive, Value - Add Acquisitions 4 +$0.50 - $3.50 ~$20.00+ Illustrative Share Price at 10.0x Price - to - Normalized Earnings Note: Assumes 186.1 million Basic Shares, 8.4 million New Warrants ($0.01 strike), and 69.4 million warrants outstanding ($11.50 Exercise, $18.00 Ceiling ). See page 26. (1) Deal fees, premium, founder promote and dilutive effect of warrants allocated pro rata across each Baseline item. (2) $ 55 to $65 million of incremental Net Income from proven reinsurance structure (3) $ 80 to $90 million of incremental Net Income from optimized asset management . (4) Range reflects acquisition of $2.5 billion to $10.0 billion of assets. Assumes target acquired at 1.0x P/BV. Assumes target s tan dalone ROE of 10% improved pro forma to 15 - 19%. (5) 9/30/17E invested assets. Immediate Near - Term Medium - Term Immediate / Near - Term Baseline Further Upside Pre - Transaction ~$14.50+ $10.00 1 2 3 4 (1) Structurally - improved ROE results in higher compounding and net income growth Selected industry comparables trade at a range of 10x to 13x P/E Multiple Re - rating 3 (2) (3) (4)

Clear Levers to Enhance Expected Return on Average Equity 9 Transformational transaction – with clear levers for expected ROE migration in the near - term +3 - 4% +4 - 5% +2 - 5% 9 - 11% ~15 - 19% F&G Status Quo Reinsurance Structure Asset Management Additional Acquisitions Run-Rate ROE Implementation of expected reinsurance structure to drive meaningful and structural earnings uplift Proven Reinsurance Structure 1 Blackstone and CF Founders will manage the $23 billion investment portfolio (4) Assumes 40bps net portfolio yield enhancement achieved out of 120bps of gross opportunity identified Optimize Asset Management 2 $2.5bn of assets can yield approximately 5 - 10% incremental equity value under new F&G structure Leverage extensive experience of CF Founders Accretive, Value - Add Acquisitions 3 (1) $55 to $65 million of incremental Net Income from proven reinsurance structure (2) $80 to $90 million of incremental Net Income from optimized asset management. (3) Range reflects acquisition of $2.5 billion to $10.0 billion of assets. Assumes target acquired at 1.0x P/BV. Assumes target standalone ROE of 10% improved pro forma to 15 - 19%. (4) 9/30/17E invested assets. (3) (1) (2) 1 2 3
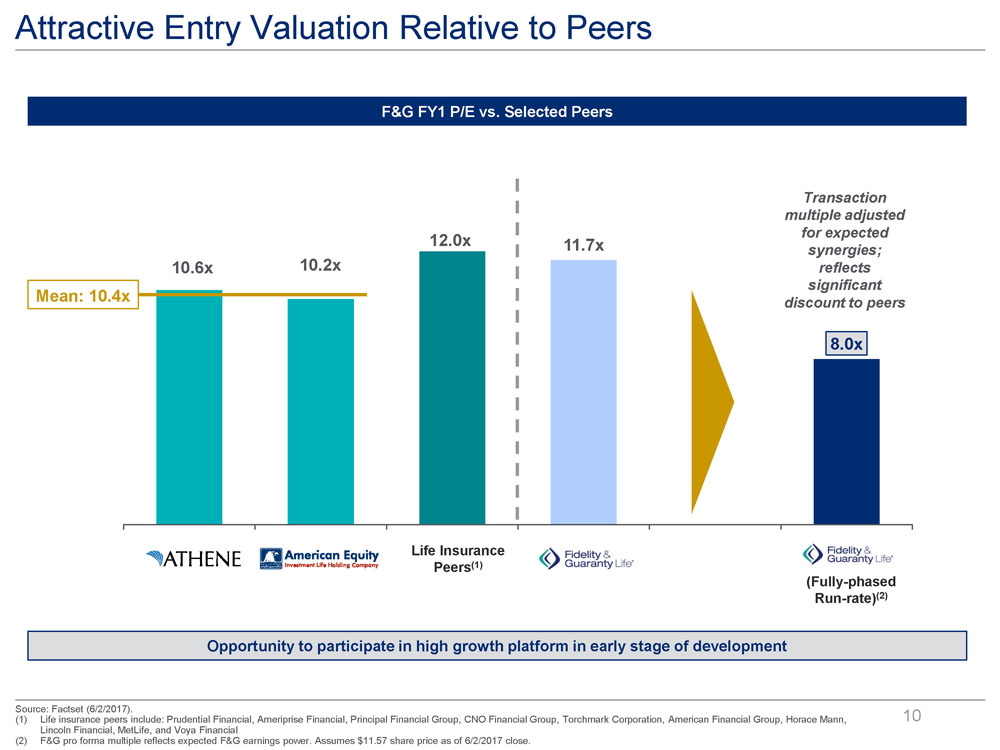
Attractive Entry Valuation Relative to Peers 10 10.6x 10.2x 12.0x 11.7x 8.0x Athene American Equity Life Insurance Peers F&G F&G F&G FY1 P/E vs. Selected Peers Mean: 10.4x Source: Factset ( 6 /2/2017). (1) Life insurance peers include: Prudential Financial, Ameriprise Financial, Principal Financial Group, CNO Financial Group, Tor chm ark Corporation, American Financial Group, Horace Mann, Lincoln Financial, MetLife, and Voya Financial (2) F&G pro forma multiple reflects expected F&G earnings power. Assumes $11.57 share price as of 6/2/2017 close. Transaction multiple adjusted for expected synergies; reflects significant discount to peers Opportunity to participate in high growth platform in early stage of development (Fully - phased Run - rate) (2) Life Insurance Peers (1)

F&G Investment Highlights and Overview 11

Investment Highlights 12 F&G Transformational transaction with meaningful value creation opportunities and a high - quality base business Accelerated earnings momentum through an efficient reinsurance structure and enhanced asset management performance through relationship with Blackstone Capabilities to pursue ongoing strategic acquisitions by leveraging the experience and professional network of CF Founders Well Defined CF Corp. Value Creation Levers 1 Primary life insurance company with a well - established Fixed Indexed Annuity (“FIA”), Fixed Rate, Multi - Year Guaranty Annuity (“MYGA”), and Indexed Universal Life (“IUL”) platform Offers a comprehensive suite of underlying product offerings through its longstanding and stable distribution relationships Established Life & Annuity Franchise 2 Favorable demographic trends and growing retirement population drives broader demand for FIA, MYGA, and IUL products F&G experienced ~10 % annual sales growth from 2012 - 2016 Attractive Sector and Company Growth 3 F&G will maintain conservative financial leverage and strong capitalization at levels consistent with those to date F&G significant underlying cash and investable assets of $ 22bn Prudent Capital Position with Significant Investable assets 4 CF Corp. Founders Chinh Chu and William Foley bring significant investment and operational expertise to F&G Total investment of $900+ million from Chinh Chu, William Foley , FNF and Blackstone demonstrates significant ongoing commitment to the franchise Strong Sponsorship with Significant Capital Investment 5 Best - In - Class management team with an average industry tenure of 26 years for executive officers Have extensive experience in the insurance sector with both large and small companies, successfully managing them through multiple economic cycles Strong Management Team 6

F&G Overview 13 Overview Fidelity & Guaranty Life is a Des Moines, Iowa - based provider of primarily: • Fixed indexed annuity (“FIA”) products (71% of FY ’16A (1) Sales; 12 th largest industry provider overall) • Multi - year guaranty annuity (“MYGA”) and similar products (27% of FY ’16A (1) Sales, 11 th largest industry provider overall) • Indexed universal life (“IUL”) products ($60mm of target in FY ’16A (1 ) ; 13 th largest industry provider overall) Distribution via long - standing relationships with Independent Marketing Organizations (“IMOs ”) • The top 10 IMOs have average relationship tenure with F&G of 16+ years • F&G is a top 5 player in the IMO distribution channel • F&G sells through network of ~100 IMOs and 30,000+ contracted agents ~ 700,000 policies in force F&G has grown sales by approximately 10% annually from 2012 to 2016, supported by its long - standing relationships with distribution partners, changing U.S. retirement demographics and an attractive product value proposition to policyholders F&G generates income by matching stable, long - term liabilities against a high - quality investment portfolio to earn a net spread Fiscal Year 2016 Sales Mix Business Mix – U.S. GAAP Net Reserves (1) (2) Fixed Indexed Annuities 65% Fixed Rate Annuities (MYGAs) 17% Immediate Annuities 13% Life (IUL and runoff life) 5% $19bn Fixed Indexed Annuities 71% Fixed Rate Annuities (3) (MYGAs) 27% Indexed Universal Life 2% $2.6bn (1) Fiscal year ended 9/30/16. (2) GAAP net reserves comprised $22b contractholder funds and future policy benefits, net of $ 3bn reinsurance recoverable . (3) Includes institutional products.

Demographics Support Retirement Market Growth Market Growth • Aging population needs retirement savings & income – Longevity risk favors lifetime guaranty – 2008 – 2009 financial crisis illustrated risk of equity market exposure during retirement • Index annuity characteristics attracting attention – Low volatility of returns – Principal protection – Upside potential versus straight fixed income – Tax deferred accumulation – Guaranteed lifetime income (with benefit rider) Growing Market Demographic • Average age of policyholder is 65 - 70 years old • Average account value of ~ $ 100 K Insufficient Retirement Savings (1) Retirement Account 55% No Retirement Account 45% 45% of all working - age households do not currently own assets in a retirement account – savings “catch up” will be necessary for retirement (1) Based on household retirement account ownership for all heads of households aged 25 – 64. National Institute of Retirement Security . (2) Issued Annuity Contracts April 2016 - April 2017. F&G data. (3) U.S. Census Bureau. 23.7% 39.5% 24.5% 12.3% < 60 60-69 70-79 80+ Percentage of New Business by Policyholder Age (2) Summary Projected Growth in Target Market (3) 0% 20% 40% 60% 80% 100% 120% 140% 0 10 20 30 40 50 60 70 80 90 2010 2020 2030 2040 2050 2060 Number of Americans Aged 65 and Older (millions) Cumulative Growth Rate of Americans Aged 65 and Older from 2010 14

F&G Business Strategy F&G has successively managed volume and profit targets through periods of corporate uncertainty, regulatory changes & increas ed competition F&G’s growth strategy leverages increasing market demand for retirement products with income and principal protection feature s Stable new shareholder base provides opportunity to optimize business performance and pursue growth opportunities Future ratings upgrade would increase growth potential via expansion into new channels (banks, broker - dealers) and IUL sales gro wth 15 How Will We Drive Growth? Strengthen the Foundation Execute foundational initiatives that strengthen the business, improve returns and provide a platform for sustainable growth Enhance the F&G Experience Create a more engaging, customer - focused experience – through accelerating the use of digital and improving the ease of doing business – for distribution partners, customers , and employees Leverage Product Capabilities for Additional Distribution Build capabilities to grow sales of USD products for international markets Grow and Diversify Through Acquisition Capture accretive opportunities for growth and diversification Execute Key Initiatives With Stable, New Shareholder Base

DOL Strategy 16 DOL Rule Background F&G Implementation Strategy Expands definition of fiduciary under ERISA to cover brokers and insurance agents Agent must comply with impartial conduct standards when selling qualified financial products Agent must disclose compensation and conflicts of interests, receive only reasonable compensation and act in best interests of client Worked closely with key IMOs over past year to prepare for implementation Most IMOs have affiliated with RIAs or BDs to serve as required FI F&G will serve as FI if IMO does not have affiliated RIA or BD relationship F&G will accept qualified business from select IMOs who implement compensation structure changes, supervise agent sales and conduct transaction review F&G will accelerate its digital strategy to simplify new business process and assist with compliance DOL Rule does not detract from fundamental demand for guaranteed income retirement products Independent distribution will adapt to new requirements to continue to serve their clients Adoption of technology solutions and compliance automation contribute to operational efficiency efforts Current Status Effective June 9, agents must comply with impartial conduct standards under PTE 84 - 24 Effective January 1, financial institution (FI) must enter into best interest contract (BIC) with agent and customer FIAs and VAs subject to BIC, while FAs and MYGAs subject to PTE 84 - 24

$15.7 $18.7 $20.0 2013 2016 1H17 F&G Historical Financial Performance Net Investment Income (1) Average Assets Under Management (AAUM) (1) GAAP Net Income (1) ($ in billions) Consistent asset growth at 7% CAGR driven by sales and stable retention trends and proactive in - force management Highly rated, diversified and liquid investment portfolio Asset duration well - matched to liabilities Portfolio well - positioned for upside from both rising rates and further diversification NII increasing both from AAUM growth and active re - positioning of portfolio to drive earnings Earned yield has risen meaningfully over last 3 years from 4.31% to 4.88% Impairments continue to run below pricing at ~15 bps per yr. Steady growth in adjusted operating income, net of notable items -- CAGR of ~20% since 2013 driven by: AUM growth with disciplined new business pricing In - force management Stable operating expenses ($ in millions) ($ in millions) $708 $923 $487 2013 2016 1H17 2013 2016 1H17 17 GAAP Net Income $348 $97 $130 Adjusted Operating Income $138 $77 $162 (1) Fiscal year ended 9/30.

492 bps 226 bps 203 bps 146 bps 86 bps 265 bps 23 bps 57 bps 60 bps 226 bps 203 bps 146 bps 86 bps Investment Yield Interest Credited and Option Cost Other liability Cost Operating Expenses Interest Expense and Tax Adjusted Operating Return on Average AUM Stable Legacy Business With Significant ROE Expansion Upside F&G generates returns by earning a spread between low - cost, stable liabilities matched with a conservatively managed asset portfolio Note: Operating metrics calculated based on average AUM (amortized cost). (1) Includes other adjustment due to convention of calculating cost of crediting based on reserves. 18 Net investment spread of 227 bps / ~290 bps FIA only ROE (ex. AOCI) : 11.1% (1) Business Model for Fiscal Year Ended September 30, 2016 Investment Leverage: 13.8x Current Pro Forma with CF Corp. Enhancements ROE ( ex. AOCI) : 15% - 19%

High quality investment portfolio with focus on NAIC 1 and 2 rated securities; broadly diversified by sector and geography Current portfolio earned yield = 4.92%; room for yield enhancement given current modest exposure to alternatives Conservative ALM profile with Asset/Liability gap of ~ 0.2 years (4) ; large exposure to floating rate assets provide incremental investment flexibility in changing rate environment Ability to focus on structural complexity and less liquid situations allows for incremental spread opportunities to enhance p ort folio yields Income - oriented total return mandate is supportive of long - term portfolio and product economics High Quality & Well Diversified Portfolio 19 Investment Philosophy Investment Portfolio by Asset Class (1) Investment Portfolio by NAIC Designation (1) Corporates 45% Structured Securities 25% Municipal 8% Pfd/Hybrid 9% EMD 5% Cash 1% Treasury 3% Gov't 2% Options & Other 2% $20b (3) NAIC 1 (A & above) 52% NAIC 2 (BBB) 38% NAIC 3 (BB) 4% NAIC 4 (B) 1% NAIC 5 & 6 (CCC and below) <1% Unrated (2) 2% Cash & Cash Equivalents 3% $20b (3) (1) GAAP book values as of 9/30/16. (2) Unrated consists of cash, U.S. treasuries, equity securities, options, and other. (3) GAAP investment portfolio totals $20bn investments, including related party loans and cash/cash equivalents; chart is net of $1bn Front Street Re funds withheld (FWH) assets (4) Data as of 12/31/16.
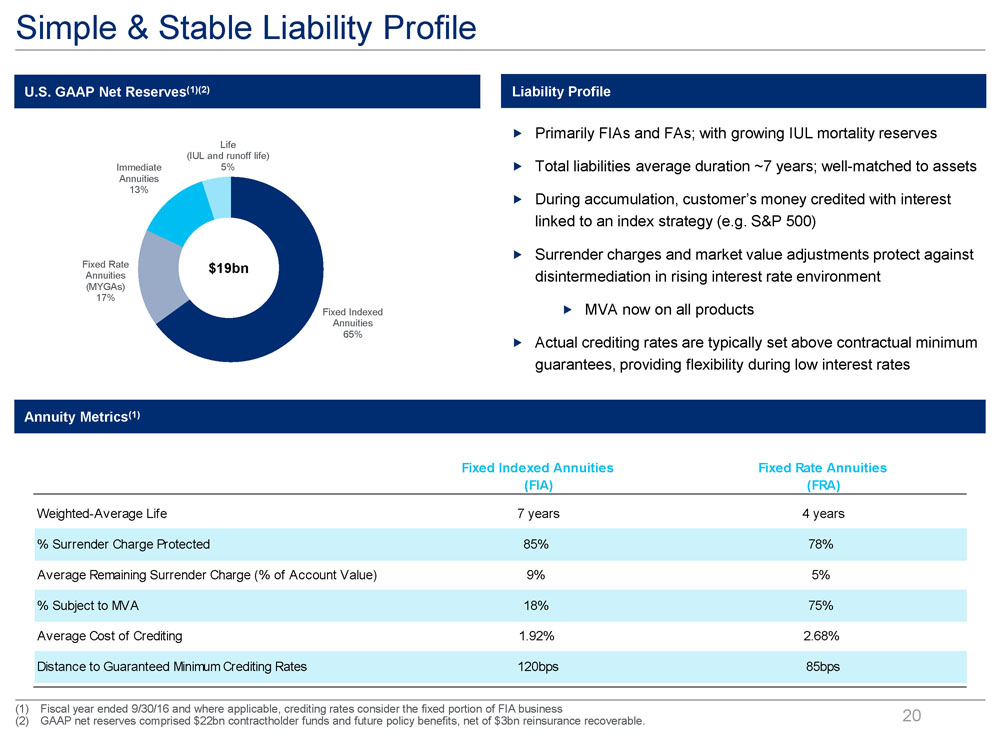
Simple & Stable Liability Profile 20 (1) Fiscal year ended 9/30/16 and where applicable, crediting rates consider the fixed portion of FIA business (2) GAAP net reserves comprised $ 22bn contractholder funds and future policy benefits, net of $ 3bn reinsurance recoverable . Primarily FIAs and FAs; with growing IUL mortality reserves Total liabilities average duration ~7 years; well - matched to assets During accumulation, customer’s money credited with interest linked to an index strategy (e.g. S&P 500) Surrender charges and market value adjustments protect against disintermediation in rising interest rate environment MVA now on all products Actual crediting rates are typically set above contractual minimum guarantees, providing flexibility during low interest rates Fixed Indexed Annuities 65% Fixed Rate Annuities (MYGAs) 17% Immediate Annuities 13% Life (IUL and runoff life) 5% $19bn Liability Profile U.S. GAAP Net Reserves (1)(2) Annuity Metrics (1) Fixed Indexed Annuities (FIA) Fixed Rate Annuities (FRA) Weighted-Average Life 7 years 4 years % Surrender Charge Protected 85% 78% Average Remaining Surrender Charge (% of Account Value) 9% 5% % Subject to MVA 18% 75% Average Cost of Crediting 1.92% 2.68% Distance to Guaranteed Minimum Crediting Rates 120bps 85bps
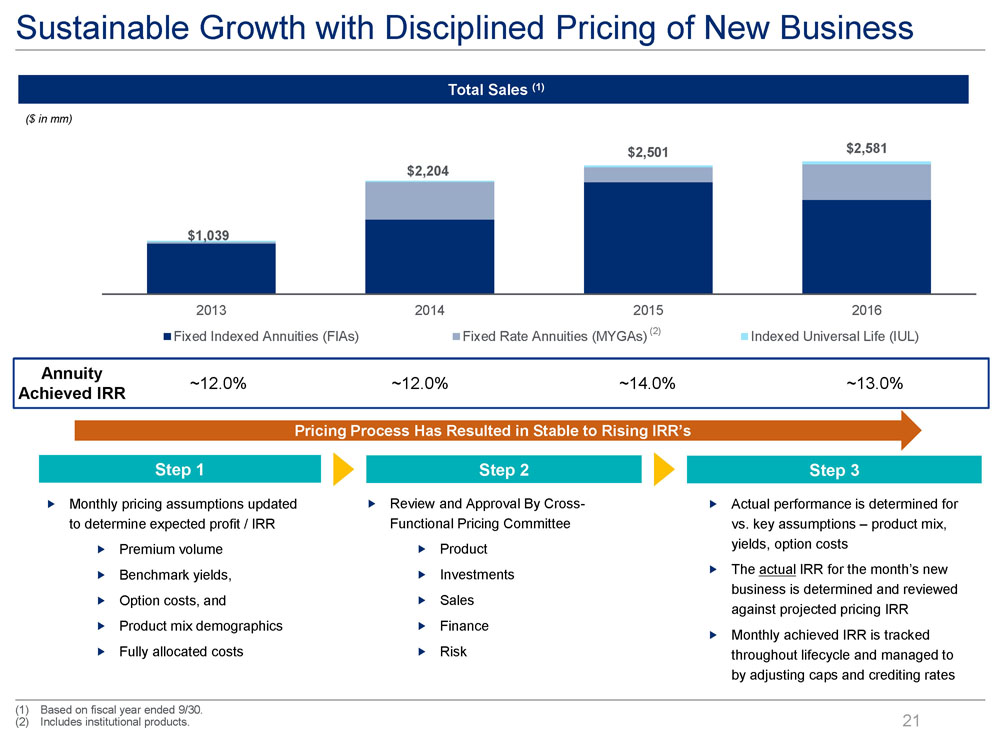
Sustainable Growth with Disciplined Pricing of New Business 21 Total Sales (1) ($ in mm) Step 1 Monthly pricing assumptions updated to determine expected profit / IRR Premium volume Benchmark yields , O ption costs, and Product mix demographics Fully allocated costs Step 3 Actual performance is determined for vs. key assumptions – product mix, yields , option costs The actual IRR for the month’s new business is determined and reviewed against projected pricing IRR Monthly achieved IRR is tracked throughout lifecycle and managed to by adjusting caps and crediting rates Step 2 Review and Approval By Cross - Functional Pricing Committee Product Investments Sales Finance Risk Pricing Process Has Resulted in Stable to Rising IRR’s Annuity Achieved IRR ~12.0% ~12.0% ~14.0% ~13.0% $1,039 $2,204 $2,501 $2,581 2013 2014 2015 2016 Fixed Indexed Annuities (FIAs) Fixed Rate Annuities (MYGAs) Indexed Universal Life (IUL) (1) Based on fiscal year ended 9/30. (2) Includes institutional products. (2)

Closing Remarks 22
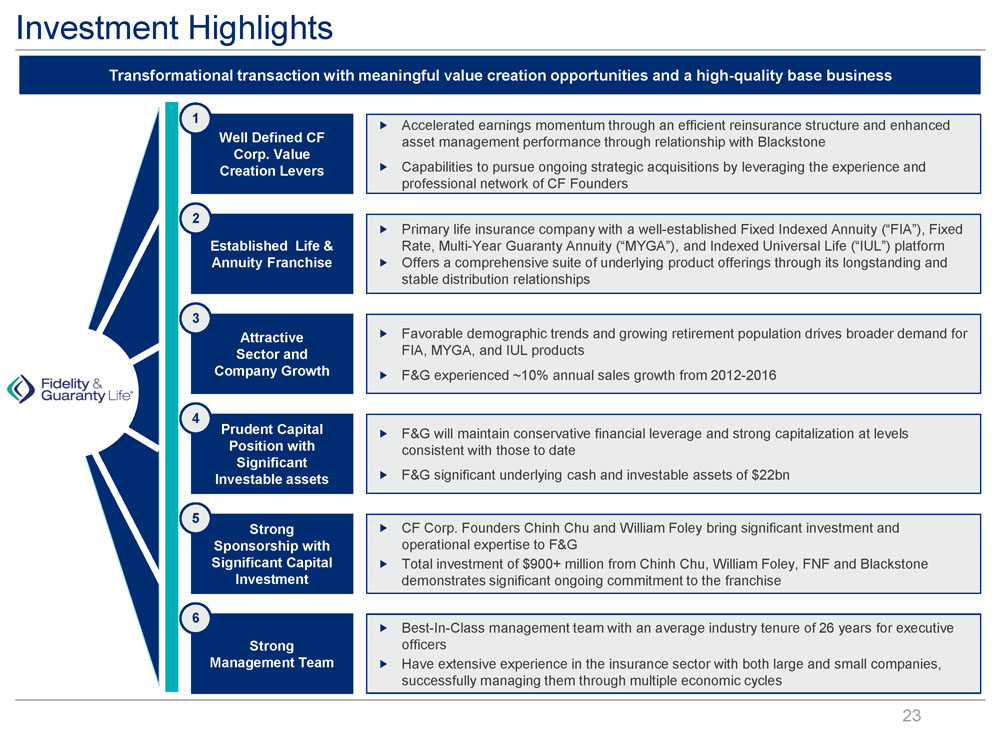
Investment Highlights 23 F&G Transformational transaction with meaningful value creation opportunities and a high - quality base business Accelerated earnings momentum through an efficient reinsurance structure and enhanced asset management performance through relationship with Blackstone Capabilities to pursue ongoing strategic acquisitions by leveraging the experience and professional network of CF Founders Well Defined CF Corp. Value Creation Levers 1 Primary life insurance company with a well - established Fixed Indexed Annuity (“FIA”), Fixed Rate, Multi - Year Guaranty Annuity (“MYGA”), and Indexed Universal Life (“IUL”) platform Offers a comprehensive suite of underlying product offerings through its longstanding and stable distribution relationships Established Life & Annuity Franchise 2 Favorable demographic trends and growing retirement population drives broader demand for FIA, MYGA, and IUL products F&G experienced ~10 % annual sales growth from 2012 - 2016 Attractive Sector and Company Growth 3 F&G will maintain conservative financial leverage and strong capitalization at levels consistent with those to date F&G significant underlying cash and investable assets of $ 22bn Prudent Capital Position with Significant Investable assets 4 CF Corp. Founders Chinh Chu and William Foley bring significant investment and operational expertise to F&G Total investment of $900+ million from Chinh Chu, William Foley , FNF and Blackstone demonstrates significant ongoing commitment to the franchise Strong Sponsorship with Significant Capital Investment 5 Best - In - Class management team with an average industry tenure of 26 years for executive officers Have extensive experience in the insurance sector with both large and small companies, successfully managing them through multiple economic cycles Strong Management Team 6

Key Milestones to Transaction Closing 24 Key Process Milestones Announce Transaction 5/24/2017 F&G Shareholder Approval 5/24/2017 CF Corp. Shareholder Vote Obtain Required Regulatory Approvals Transaction Target Closing Q4'17

Appendix 25

26 (1) Fees and capital structure are subject to change partly depending on the level of redemptions, if any, and the level of capitalization as determined by CF Corp. and Management. (2) Based on common equity excluding other comprehensive income. (3) Debt excludes preferred equity. (4) Consolidated insurance and reinsurance affiliate companies . (5) Data as of 12/31/2016 . (6) 7.5 % PIK coupon . (7) $ 0.01 strike price. (8) $ 11.50 Exercise, $18.00 Ceiling. (9) Assuming no redemption of public shares. (10) Including affiliates. Transaction Overview (cont’d) Transaction Sources and Uses (1) Sources and Uses ($ in mm, except for per share data) CF Corp. Founders (9) 20 - 25% Blackstone 20 - 25% Other Shareholders (Incl. Management) 50 - 60% Total 100% Pro Forma Common Equity Ownership of CF Corp . (10) (6) (5) Transaction Setup Historical & Pro Forma Capital Structure ($ in mm) F&G % of Pro Forma % of (3/31/2017) Total (12/31/17E) Total Purchase Price per Share $31.10 Debt $405 20% $405 17% X Fully Diluted Shares Outstanding 59 Preferred Equity 0 0% 375 16% F&G Equity Purchase Price $1,836 CF Corp. Common Equity 0 0% 1,200 51% Acquisition of Reinsurance Affiliates, Fees & Other Adj. 99 Common Equity(2) 1,617 80% 360 15% Rollover Existing Debt 405 Total Equity(2) $1,617 80% 1,935 83% Total Uses $2,340 Total Capital(2) $2,022 100% $2,340 100% Debt / Capital(3) 20% 17% Risk Based Capital Ratio(4) 412% > 400% Total Common Shares 186.0 Total New Warrants(7) 8.4 Total SPAC Warrants(8) 69.4 * * * * * * * Fees and other adjustments are estimates and currently are expected to total approximately $110 million as of the closing. In addition, the company may choose to raise up to an additional $200 million of common equity from now until closing for a number of purposes including: (1) the satisfaction of any redemptions, if any, and any funding needed to complete the transaction; (2) to strengthen the balance sheet for purposes of regulatory approval; and (3) for general purposes including gro wth and expansion. Such equity, if raised, shall be funded at $ 10.00 per share by the Anchor Investors pursuant to the ROFO.
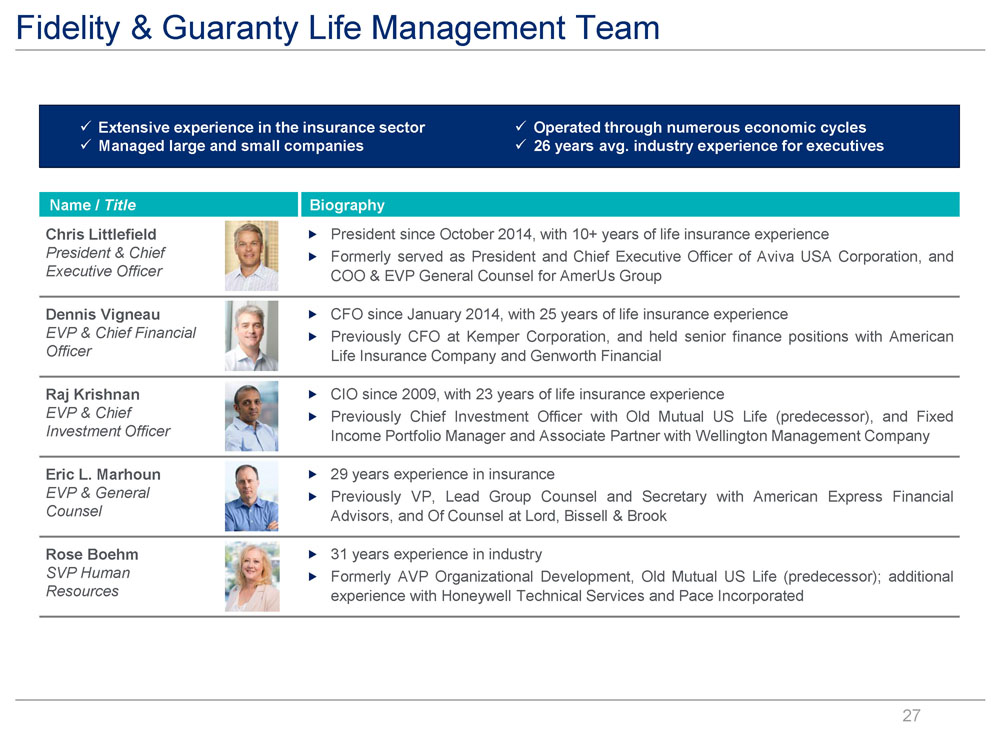
Fidelity & Guaranty Life Management Team x Extensive experience in the insurance sector x Managed large and small companies x Operated through numerous economic cycles x 26 years avg. industry experience for executives 27 Name / Title Biography Chris Littlefield President & Chief Executive Officer President since October 2014 , with 10 + years of life insurance experience Formerly served as President and Chief Executive Officer of Aviva USA Corporation, and COO & EVP General Counsel for AmerUs Group Dennis Vigneau EVP & Chief Financial Officer CFO since January 2014 , with 25 years of life insurance experience Previously CFO at Kemper Corporation, and held senior finance positions with American Life Insurance Company and Genworth Financial Raj Krishnan EVP & Chief Investment Officer CIO since 2009 , with 23 years of life insurance experience Previously Chief Investment Officer with Old Mutual US Life (predecessor), and Fixed Income Portfolio Manager and Associate Partner with Wellington Management Company Eric L. Marhoun EVP & General Counsel 29 years experience in insurance Previously VP, Lead Group Counsel and Secretary with American Express Financial Advisors, and Of Counsel at Lord, Bissell & Brook Rose Boehm SVP Human Resources 31 years experience in industry Formerly AVP Organizational Development, Old Mutual US Life (predecessor) ; additional experience with Honeywell Technical Services and Pace Incorporated

Fidelity & Guaranty Life Management Team (Cont’d) x Extensive experience in the insurance sector x Managed large and small companies x Operated through numerous economic cycles x 26 years avg. industry experience for executives 28 Name / Title Biography John Currier SVP & Chief Actuary 27 years actuarial experience in life insurance Formerly served as EVP – Chief Actuary of Aviva USA, Chief Product Officer for AmerUs Group, and Chief Actuary – Life Companies for Farm Bureau Financial Services Chris Fleming SVP Operations & IT 21 years experience in insurance industry Previously Head of Life Strategic Planning & Six Sigma for ING, and held executive positions with ING Central Europe Insurance and AIG John O’Shaughnessy SVP Business Development International 32 years experience in life insurance Previously SVP & Chief Actuary for FGL, and actuarial positions at Great American Financial, Lincoln Financial, Travelers, and Nationwide Financial John Phelps SVP & Chief Distribution Officer 35 years experience in insurance Formerly SVP Life & Fixed Annuity Distribution, Old Mutual US Life (predecessor) ; additional experience with Executive Marketing Insurers and Conseco Life Insurance Co Wendy Young SVP & Chief Risk Officer 31 years experience in insurance Formerly VP Financial Planning & Analysis, Old Mutual US Life (predecessor) ; additional actuarial experience with The Acacia Group and Ernst & Young LLP

William Foley: Preeminent Operator 29 0.0 10.0 20.0 30.0 40.0 $50.0 Jan 96 Apr 00 Jul 04 Oct 08 Feb 13 May 17 One dollar invested in FNF in January 1996 has produced 3x compounded returns vs. the S&P 500 $54 billion in public market value creation Operational expertise building market share leaders Industry consolidator, with over 100 strategic acquisitions Consistent track record of exceeding cost synergy targets Delivered superior shareholder returns Market Capitalization ($ billion) • Leading provider of title insurance, technology and transaction services to the real estate and mortgage industries (~$14 billion enterprise value) • Utilized disciplined strategy to complete over 80 acquisitions • Leader in operational efficiency with ~500 basis points better margins than its competitor's • Global leader in financial services technology, with a focus on retail and institutional banking, payments, asset and wealth management, risk and compliance, consulting, and outsourcing solutions (~$37 billion enterprise value) • Spun out of FNF in 2004 • Has completed over 15 acquisitions, including Certegy, Metavante and recently announced SunGard • Industry leading margins • Leading provider of integrated technology, data and analytics solutions that facilitate and automate many of the business processes across the mortgage lifecycle (~$8 billion in enterprise value) • More than doubled acquisition equity value of $2.9 billion (May 2013 acquisition of LPS ) $0.4bn 20x 8x 6x FNF BRK S&P 500 15% $54bn 10% 9% CAGR Source: FactSet, SNL Financial, public filings, company management. Market Data as of 5/23/2017. (1) Market capitalization adjusted for dividends reinvested. Takes into account FNF stock dividends. Includes FNFV, JAX, and REM Y. (1)
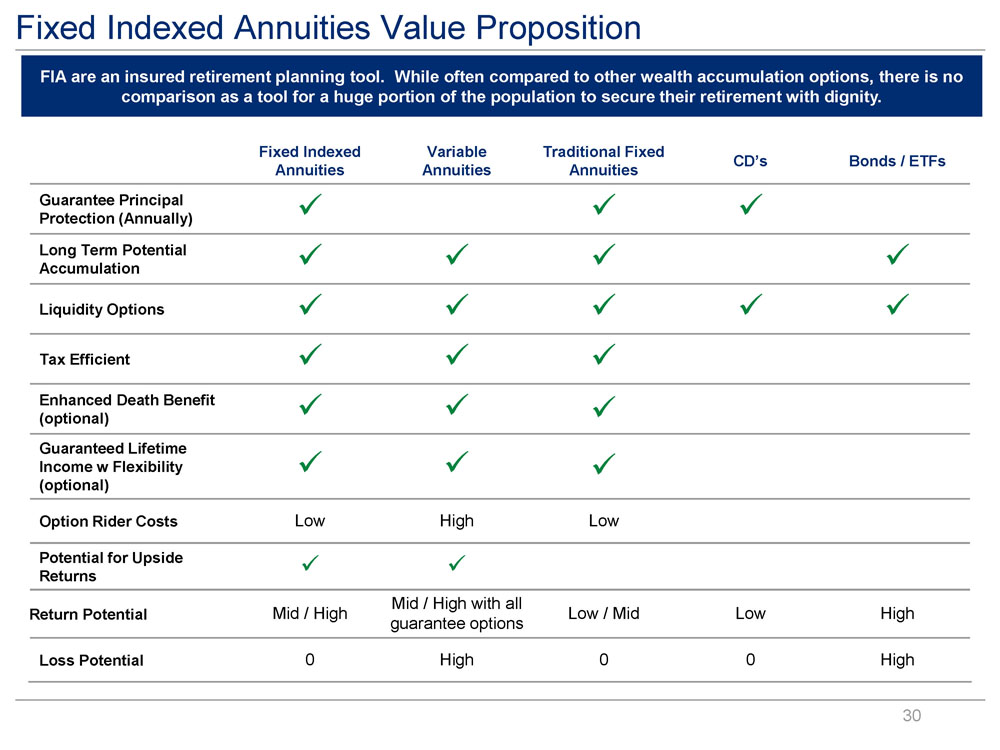
30 Fixed Indexed Annuities Value Proposition FIA are an insured retirement planning tool. While often compared to other wealth accumulation options, there is no comparison as a tool for a huge portion of the population to secure their retirement with dignity. Fixed Indexed Annuities Variable Annuities Traditional Fixed Annuities CD’s Bonds / ETFs Guarantee Principal Protection (Annually) x x x Long Term Potential Accumulation x x x x Liquidity Options x x x x x Tax Efficient x x x Enhanced Death Benefit (optional) x x x Guaranteed Lifetime Income w Flexibility (optional) x x x Option Rider Costs Low High Low Potential for Upside Returns x x Return Potential Mid / High Mid / High with all guarantee options Low / Mid Low High Loss Potential 0 High 0 0 High
Serious News for Serious Traders! Try StreetInsider.com Premium Free!
You May Also Be Interested In
- Beyond Benign and Dow Expand Collaboration to Advance Green Chemistry Education
- Breezeline Employees Volunteer to Fight Food Insecurity in South Florida
- Hop-on Re-Schedules Annual Shareholders Meeting Using Our Own Proprietary Digitalage Streams(TM) Worldwide Broadcasting Technology
Create E-mail Alert Related Categories
SEC FilingsSign up for StreetInsider Free!
Receive full access to all new and archived articles, unlimited portfolio tracking, e-mail alerts, custom newswires and RSS feeds - and more!
