

Form 8-K CARRIAGE SERVICES INC For: Mar 16
 Tweet
Tweet Share
ShareUNITED STATES
SECURITIES AND EXCHANGE COMMISSION
Washington, D.C. 20549
FORM 8-K
CURRENT REPORT
Pursuant to Section 13 or 15(d)
of the Securities Exchange Act of 1934
Date of Report (Date of earliest event reported): March 16, 2015
Carriage Services, Inc.
(Exact name of registrant as specified in its charter)
Delaware (State or other jurisdiction of incorporation or organization) | 1-11961 (Commission File Number) | 76-0423828 (I.R.S. Employer Identification No.) |
3040 Post Oak Boulevard, Suite 300
Houston, Texas 77056
(713) 332-8400
(Address of Principal Executive Offices, Including Zip Code)
Not Applicable.
(Former name or former address, if changed since last report)
Check the appropriate box below if the Form 8-K filing is intended to simultaneously satisfy the filing obligation of the registrant under any of the following provisions (see General Instruction A.2. below):
¨ | Written communication pursuant to Rule 425 under the Securities Act (17 CFR 230.425) |
¨ | Soliciting material pursuant to Rule 14a-12 under the Exchange Act (17 CFR 240.14a-12) |
¨ | Pre-commencement communications pursuant to Rule 14d-2(b) under the Exchange Act (17 CFR 240.14d-2(b)) |
¨ | Pre-commencement communications pursuant to Rule 13e-4(c) under the Exchange Act (17 CFR 240.13e-4(c)) |
Item 7.01 Regulation FD
On March 16, 2015, Mel Payne, our Chief Executive Officer, sent a letter to certain institutional shareholders regarding their investment in Carriage Services, Inc. for communication purposes only. The letter and corresponding enclosures are attached as Exhibit 99.1 to this Form 8-K.
In accordance with General Instruction B.2 of Form 8-K, the information presented herein under Item 7.01 and set forth in the attached Exhibit 99.1 is deemed to be “furnished” solely pursuant to Item 7.01 of this report and shall not be deemed “filed” for purposes of Section 18 of the Securities Exchange Act of 1934, as amended (the “Exchange Act”), or otherwise subject to the liabilities of that section, nor shall such information or the exhibit be deemed incorporated by reference into any filing under the Securities Act of 1933, as amended, or the Exchange Act.
CAUTIONARY NOTE REGARDING FORWARD-LOOKING STATEMENTS
Certain statements and information in this Current Report on Form 8-K may constitute “forward-looking statements” intended to qualify for the safe harbors from liability established by the Private Securities Litigation Reform Act of 1995, Section 27A of the Securities Act of 1933, as amended, and Section 21E of the Securities Exchange Act of 1934, as amended. These forward-looking statements are subject to a number of risks and uncertainties, many of which are beyond our control. All statements regarding the consummation of the Asset Sale Agreement and all statements other than statements of historical facts included or incorporated herein may constitute forward-looking statements. The words “could,” “believe,” “anticipate,” “intend,” “plan,” “estimate,” “expect,” “may,” “continue,” “predict,” “potential,” “project” and similar expressions are intended to identify forward-looking statements, although not all forward-looking statements contain such identifying words. Actual results could vary significantly from those expressed or implied in such statements and are subject to a number of risks and uncertainties. Although we believe that the expectations reflected in the forward-looking statements are reasonable, we can give no assurance that such expectations will prove to be correct. The forward-looking statements involve risks and uncertainties that affect our operations, financial performance, and other factors as discussed in our filings with the Securities and Exchange Commission. Among the factors that could cause results to differ materially are those risks discussed in the periodic reports we file with the Securities and Exchange Commission, including our Annual Report on Form 10-K for the year ended December 31, 2014. You are urged to carefully review and consider the cautionary statements and other disclosures made in those filings, specifically those under the heading “Risk Factors.” We do not undertake any duty to update any forward-looking statement except as required by law.
Item 9.01 Financial Statements and Exhibits.
(d) Exhibits
Exhibit No. | Description of Exhibit | |
99.1 | Shareholder Letter Template and corresponding enclosures dated March 16, 2015. | |
SIGNATURE
Pursuant to the requirements of the Securities Exchange Act of 1934, the Registrant has duly caused this report to be signed on its behalf by the undersigned thereunto duly authorized.
CARRIAGE SERVICES, INC. | ||
Date: | March 16, 2015 | /s/ L. William Heiligbrodt |
L. William Heiligbrodt | ||
Executive Vice President and Secretary | ||
EXHIBIT INDEX
Exhibit No. | Description of Exhibit | |
99.1 | Shareholder Letter Template and corresponding enclosures dated March 16, 2015. | |

MELVIN C. PAYNE
CHAIRMAN AND CEO
(713) 332-8440 (Office)
(713) 332-8444 (Voice Mail)
March 16, 2015
As the Co-founder, Chairman and Chief Executive Officer of Carriage Services, Inc. (Carriage), I am writing you personally to inform you more completely beyond public press releases and filings about your investment in Carriage and to open the line of communication up for any past or future issues or questions you might have of me. The investor relations function has been handled very expertly and professionally since September 2011 by Bill Heiligbrodt and Robert Prescott, so this initial outreach letter by me is in no way a substitute, but rather an addition to their continuing activities to keep our shareholders informed about the progress of our company.
I am enclosing with this letter seven attachments bound in a Carriage Investor Reference Book for your retention and review, on each of which I will offer executive summary editorial comments because I believe each has substantive investment merit you would appreciate learning about. The seven attachments are:
▪ | 2014 Full Year Performance Press Release / 2015 Outlook; |
▪ | Five Year and Five Quarter Trend Reports ending December 31, 2014; |
▪ | Carriage Good To Great Journey annual theme letters / Good To Great Study Stock Returns; |
▪ | 2013 Good To Great Annual Report Shareholder Letter Wrap; |
▪ | Company and Investment Profile as of December 31, 2014; |
▪ | Memorandum on High Performance Culture Organizational Structure dated January 22, 2015; |
▪ | Letter on Carriage Executive Compensation Strategy, Policy and Peers from Marsha Cameron, CEO and Founder of Paradox Compensation Advisors. |
First, a little personal history. When I co-founded Carriage on June 1, 1991, it was a dream come true and a conscious choice to embark on a company building journey in the funeral industry that entailed huge risks of failure since I had literally no knowledge of or experience in operating or consolidating funeral home businesses. Yet I personally guaranteed all the debt until it was repaid at our IPO in August 1996. After a career in corporate lending with Prudential and then Texas Commerce Bank, followed by ten years of turnaround and financial restructuring work, I was ready to build something “My Way” from scratch guided only by Five Guiding Principles which I had always relied on to build my career and reputation. Moreover, I wanted to build a company that would “Be The Best,” not the biggest, since that spot had already been claimed and long occupied by Service Corporation International (SCI) going back to the early 1960’s when consolidation of highly fragmented industries began to conceptually get attention from investors (deathcare, waste, food distribution, etc.).
I always thought about the Carriage journey would be more akin to a marathon than a sprint, and was I ever right about this analogy. The highs and lows of the Carriage journey as a public deathcare company have been many, i.e. a brief two to three year early high, followed by almost twelve years of deathcare industry down cycle learning from mistakes followed by innovation, evolution and
3040 Post Oak Boulevard Suite 300 Houston, Texas 77056 (713) 332-8400 Main (713) 332-5444 Fax
and continuous improvement while market expectations were low. The brutal but wonderful Darwinian “adapt or die” nature of the learning journey was reflected in our stock price, which peaked in the 1990’s consolidation mania up cycle at $29.25 in January 1999 and twice almost hit $1 per share, first in late 2000 when everyone except me thought we would go bankrupt, and again in February/March 2009 in the midst of the financial market crash.
The first time we hit the $1 per share price bottom we were way over leveraged and had negative Free Cash Flow (FCF), but the second time we were ready with no debt maturities for six years and rapidly increasing FCF, so we acquired 3.1 million shares equal to a little over 15% of Carriage shares outstanding out of FCF for only $10 million ($3.19 per share). I was accused on a quarterly conference call of “driving the company off a cliff” for not hoarding cash, but I saw this share repurchase program out of FCF as an incredible opportunity for me and all other remaining shareholders to own 15% more of a company that was getting better fast. Since then we have evolved into what I refer to as a “High Performance Culture Company” that just happens to be in the deathcare business.
When I co-founded Carriage on June 1, 1991 as its visionary and CEO, I received 650,000 unregistered founder’s shares. Over the years I began to acquire more shares at every opportunity I had, including market purchases after our IPO in August 1996 and many other times over the years, plus through equity and option grants, while only selling fully owned shares twice, once in the early 2000s when I sold about 30,000 shares to capture a tax loss to shelter phantom income from a failed real estate tax shelter from the 80s, and again in 2011 when I sold approximately 167,000 shares at prices between $5 to $6 per share (that was painful!) to pay down real estate and margin loans to a local bank in order to release 601,000 CSV shares pledged as collateral.
Contrary to expert advice about diversification from numerous financial and estate advisors, I have long had “all of my eggs in the Carriage basket”, believing that at some point our enterprise valuation would reflect the uniquely wonderful consolidation and operating framework that had been created and evolved through trial and error. I now own almost 1.5 million shares directly, and hold options on 363,000 shares, all of which are currently in the money, meaning that my total direct holdings are 1,863,000 shares equal to almost 10% of fully diluted Carriage shares outstanding. I cannot possibly know how much shareholder value will be created at Carriage over the next ten years, but I believe it will be huge compared to the past twenty-four years, especially if death rates begin to increase because of Baby Boomer demographics.
I turned 72 years of age recently and am in excellent health. My personal and professional plan is always developed and then updated annually around a ten year timeframe horizon predicated on the blessing of continued good health, which I work hard at maintaining. I plan to remain as Chairman and CEO of Carriage for another five years and then remain as Executive Chairman for another five years to age 82, assuming of course that our Board, shareholders and other Carriage 4E Leaders and employees continue to see high performance inspiration and “trend is our friend” value creation from my 4E Leadership.
My role models for investment philosophy and corporate leadership characteristics are Warren Buffett and Jack Welch, respectively. Warren Buffet at 84 years of age recently wrote in his shareholder letter that he and Charlie Munger believe there are two capable CEO successor candidates within Berkshire Hathaway, either of which would offer a smooth transition to CEO when Warren is no longer available. When the day comes for me to step down as CEO, I hope to have two worthy candidates to pick from as well. But that time is not now, as the most invigorating and healthy thing for me these days is coming to work each morning with a passion to be with our team of high performance leaders and employees on the Carriage Good To Great Journey.
The two words used most often to describe my leadership by other leaders and employees throughout Carriage are “integrity and passion”, which ironically are the two 4E bookend words used by Jack Welch when he created the 4E Leadership Model at GE while CEO in the 1990’s. To be sure, no one who really knows me doubts my 4E Leadership E’s of personal Energy, ability to Energize others toward a common goal or vision, the Edge to make lonely, difficult decisions (especially about people), and the ability to Execute the production of high and sustainable performance results.
Hopefully, the above personal history will offer a better perspective and framework for your understanding of the seven attachments enclosed and bound as an Investor Reference Book with this letter, starting with our full year 2014 results released on Wednesday, February 25, 2015. My comments in the press release speak to Carriage having reached an “earning power sweet spot”, as we grew full year 2014 Adjusted Diluted EPS by 36.7% to $1.34 per share on a relatively modest increase in revenues of 6.1%, and raised our Rolling Four Quarter Outlook for Adjusted Diluted EPS to a “roughly right range” of $1.55 - $1.59.
Also attached is one of our favorite innovations in transparent Non-GAAP and Non-SEC sector reporting, which are our Five Year and Five Quarter Trend Reports. Since 2010 we have grown revenue by only $50 million or 28% to $226.1 million in 2014 from $176.1 million in 2010 (6.5% CAGR), but have grown Adjusted Diluted EPS by 168% from $0.50 per share in 2010 to $1.34 per share in 2014 (28% CAGR). Our stock price has responded accordingly by increasing 433% over the last five years from $3.93 on December 31, 2009 to $20.95 on December 31, 2014 (40% CAGR). Moreover, our stock price has increased by another 14.4% during the first two plus months of 2015 to $23.97 as of Tuesday, March 3, 2015, and has been one of the top Total Shareholder Return (TSR) small capitalization performances in the Russell 2000/3000 indexes over the last three years.
Throughout this letter I reference the bestselling business book Good To Great by Jim Collins, published in 2001, from which we have taken a few Good To Great High Performance Concepts and customized and integrated them into the Carriage High Performance Culture Framework and language. When we finalized a major Board and Executive / Senior Management Reorganization on November 4, 2011, we then launched a Five Year Carriage Good To Great Journey starting with the first annual theme of Carriage Services 2012 - A NEW BEGINNING! I have enclosed for your review four annual theme letters including the new one for 2015. These are published at the beginning of each year and sent to our field and home office leaders and employees along with other materials that we use internally to educate and inspire for high and sustainable performance and the linked higher enterprise valuation over time. Also attached is last year’s Good To Great Annual Report Shareholder Letter Wrap in which I explain in detail all elements of our extraordinarily innovative High Performance Culture Framework for operating and consolidating the deathcare industry.
Attached is an updated Company and Investment Profile which we began to publish years ago because the ideas and concepts in our High Performance Culture Framework were not easy for investors to understand with only quarterly releases, filings and roadshow investor presentations. The Company and Investment Profile will be updated quarterly on our company investor website and will contain a more comprehensive Five Year Scenario of “roughly right range” results as we execute our three models over five year timeframes.
You may be surprised to learn that there has been no pure common equity (common shares only - not paired with a yield security) raised publicly by a consolidation company in the deathcare industry since a Stewart Enterprises offering in August 1999, so Carriage has had to learn how to create internal financing for new growth the old fashioned way, i.e. from retained earnings and Free Cash Flow. I
believe we have learned to do so exceedingly well to the huge benefit over time to our shareholders, as we can mostly self-finance a modest 8% revenue growth strategy by acquisition that produces 10% - 15% compound Adjusted Diluted EPS returns over time, which in turn drives shareholder value creation. For example, our normalized cash earning power reached an all-time record in 2014 as defined by Adjusted Consolidated EBITDA Margin of 27.3%, and over the next five years, outlined more completely in our Company and Investment Profile, we have a goal of growing revenues at least 8% annually while achieving Adjusted Consolidated EBITDA Margins of 30%, which has never been done in the deathcare industry.
Which brings me to the subject of Carriage’s Executive and Director Compensation, and Comparison To Peers and Benchmarking. You may be aware that in early August 2012, when our stock price was $7.99 per share, we issued 1.6 million conditional option performance shares (right to purchase each share at $9.00 capturing the $12.50 per share spread to Target Price) to senior leaders and Directors and announced a Good To Great Target Price vesting goal for the option performance shares of $21.50 within five years, equal to a 22% compound annual rate of share price appreciation over the full five years. If we did not achieve the Target Price during the five year timeframe, the conditional option shares would have been cancelled. As stated in the press release dated August 6, 2012:
“This new stock award program links all of our field leadership above the business unit level as well as our Houston support leaders and key employees into the five year Good To Great Vision and recognizes and rewards them for their important contribution to the value creation process. It also links each outside member of our Board of Directors into a greater engagement and understanding of Carriage as an investment platform.”
Since co-founding Carriage, I have tried many compensation strategies including equity grants and stock options on leaders and Board members with the intent of creating an ownership mindset that fosters high financial performance and shareholder value creation. I even split half my founders’ shares with two Management Co-Founders (each received 325,000 shares) who never developed an “owner mindset” that produced high and sustainable “ownership value”. Gifting people stock to create an ownership mindset followed by high performance simply doesn’t work, so we now focus relentlessly on getting the Right Who leadership aligned with our Guiding Principles and producing collaborative team high performance BEFORE sharing the precious ownership of our company with them. We call this idea First Who, Then What which is a Good To Great High Performance Culture Concept central to everything we do.
The new young Carriage leaders from a major management reorganization on November 4, 2011 and our relatively new Directors (all since February 2009) included in the Good To Great Program suddenly were more engaged both as individuals and as teams like never before in our history because they had already committed to and were executing on our Carriage Being The Best Vision and Good To Great Journey with high and sustainable operating and financial performance that realized the stated goal of making Carriage a superior value creation investment platform. In other words, we got the “First Who Right”, Then the “Right Who” produced the “What” High and Sustainable Operating and Financial Performance. The Good To Great Program therefore accomplished its intended purpose of unifying our Executive and Senior Leadership Team along with our Board around the idea of High Performance through One Team, One Vision. Therefore, this program “Will Not Be Repeated in the Future”.
The attached Memorandum dated January 22, 2015 with a new “No TITLES for Nobody” organizational structure describes perfectly the highly effective leadership team dynamic in place today for which the Good To Great Program served as the major catalyst. The Operations and Strategic Growth Leadership
Team (OSGLT) in this new structure meets each Friday at 10:00 AM in our Houston office and you would be welcome to join us as a special guest on any Friday.
After launching the Good To Great Program, our operating and financial performance took off and so did our stock price, rising 171% in only eight months from $7.99 per share on August 3, 2012 to $21.63 on April 10, 2013, after which our stock price began a necessary consolidation over the balance of 2013, then rose again briefly in early 2014 to $21.92, followed by another range bound consolidation between $16 - $20 per share. As we entered 2014, our Executive Team recommended and our Board agreed that the Good To Great Program should be settled early in cash at a 20% discount of $10 per option share, saving the company over $4 million cash and “dilution confusion” amongst our shareholders, as the Good To Great Program had succeeded in creating shareholder value beyond what any of us could have expected and had become an obstacle with regard to refinancing our Tides $90 million 7% coupon convertible security (conversion price of $20.44 per share).
We were subsequently successful with refinancing the highly dilutive Tides security (convertible into 4.4 million shares equal to 24% dilution above conversion price of $20.44) with a new $143.75 million, 2.75% coupon subordinated convertible security which is convertible at $22.56 per share but with highly favorable net cash settlement features and options that limit future dilution to only 20% and then only at very high share prices (see dilution / price chart and explanation in full year 2014 earnings release).
Since the 1.6 million option shares in the Good To Great Program were cancelled after the early cash settlement and added back to our key employee Equity Incentive Plan, we had plenty of key employee equity plan capacity for at least two more years, but we mistakenly and unnecessarily asked for a new plan in our 2013 proxy (voted on in May 2014), supported by our compensation consultant at the time. Reflecting back on the decision to ask for a new key employee equity plan, I for the life of me cannot recall anything said by anyone or any reasons that make any sense in hindsight. It was a “really stupid” thing to do, but in no way reflected the far worse human characteristic of “greed”. It was the kind of decision that causes me to call myself internally the Chief Mistake Maker (CMM) of Carriage, a title I have repeatedly earned over many years and that others should not want to take away from me!
We were highly criticized by Institutional Shareholder Services (ISS) for the Good To Great Program in general as well as our “Say on Pay” Proposals, and specifically in the ISS “Pay for Performance Evaluation”, although no one from ISS to my knowledge ever reached out to anyone at Carriage including me about their critical and factually incorrect view of our actions, especially on Pay for Performance. ISS wrongly concluded that Carriage management and Directors took the “unearned” Good To Great cash, implying that shareholders then suffered a loss in the value of their holdings when the stock price subsequently declined below $20 per share into the $16-$20 consolidation range mentioned above.
As the overall third largest but largest individual shareholder of Carriage, I never suffered any realized loss because of the temporary share price decline in our stock because the company continued to get better throughout 2014, and rather than sell any shares (only way to realize a loss is to sell shares below the acquired purchase price), I bought another 30,000 shares in the $16 - $17 per share range when Carriage was “on sale by Mr. Market!” Nonetheless, we had our “Say on Pay” Proposal and new Equity Incentive Plan rejected by a vote of shareholders, which was the first time in my career I’ve received a vote of no confidence from someone I didn’t know for reasons I didn’t understand at the time.
A copy of this letter and the Carriage Investor Reference Book will also be sent to ISS to inform them before our 2014 Proxy is published about our outreach to you and all other shareholders about matters that impact future shareholder value creation. If ISS is offering to evaluate whether Carriage, its Board Members and its Executive Team Leadership including me, believe in the concept of “Performance Before Pay”, ISS representatives should at least prepare themselves by reading this letter and all the enclosures. Then someone from ISS should give me a call and schedule a visit to discuss any matter related to Carriage on which they intend to offer our shareholders an opinion. I am always open to constructive input that has the potential to make our company better.
If there is a group devoted solely to proxy voting matters that is separate from security selection and portfolio management decisions, I would greatly appreciate you conveying this letter and enclosed materials to them with any collaborative and helpful input from you about the matters covered in my letter. If separate outreach to them by me would also be helpful, please let me know their name and contact information and it will be done.
As CEO of a public company, I learned a valuable “know thy shareholders” leadership lesson from the self-inflicted mistake with last year’s proxy proposals, which is the reason for my personal outreach to you and other fellow shareholders. Accordingly, we retained a new compensation consultant, Marsha Cameron with Paradox Compensation Advisors, whose recommendations in the attached letter to our Compensation Committee are already being implemented. I would welcome any input or questions from you about anything at any time, including our Governance and Compensation policies. I will never be too busy or inaccessible to take a call or visit with fellow shareholders who have entrusted their precious capital with our company and its leaders as fiduciaries. I commit to always live up to our First Guiding Principle, which is by far the most important:
Honesty, Integrity and Quality in All that We Do.
Best personal regards,

Melvin C. Payne
 | |
CARRIAGE SERVICES ANNOUNCES RECORD 2014 ANNUAL RESULTS
RAISES ROLLING FOUR QUARTER OUTLOOK
HOUSTON – February 25, 2015 – Carriage Services, Inc. (NYSE: CSV) today announced record results for the year ending December 31, 2014.
Mel Payne, Chief Executive Officer, stated, “Our 2014 full year performance was an earning power milestone record with Adjusted Net Income of $24.8 million equal to Adjusted Diluted EPS of $1.34 and Adjusted Net Income Margin of 11.0% on record revenues of $226.1 million, made possible by an extraordinarily strong fourth quarter finish of Adjusted Diluted EPS of $0.38 on record revenues of $59.4 million. Carriage as a consolidation and operating platform for funeral homes and cemeteries has reached an “earning power sweet spot” in maturity and size, as reflected by the leveraging of a 12.9% total revenue increase in the fourth quarter into much larger increases of 25.6% in Total Field EBITDA, 27.8% in Adjusted Consolidated EBITDA, and 52.0% in Adjusted Diluted EPS.
We fully expect this sustainable earning power trend from existing operations and the value creation leveraging dynamics to continue into 2015 and thereafter and to be supplemented by new, high quality acquisitions from our growing pipeline of top quality acquisition candidates in strategic markets. We are therefore raising our Rolling Four Quarter Outlook range on revenue to $244 - $248 million and Adjusted Diluted EPS to $1.55 - $1.59.
The 2014 year was the third year in our defined Five Year Carriage Good To Great Journey with an annual theme of Carriage Services 2014: Being the Best - One Team, One Vision! Highlights of the year were as follows:
1. | Dave DeCarlo joined Bill Heiligbrodt and me in March as a member of the Executive Team with the primary responsibility of growing the Company by selective, strategic acquisitions; |
2. | Entered two large, new strategic markets, New Orleans and Washington, D.C., with the acquisition from SCI in May of five funeral homes and one combination business; |
3. | Completed the refinancing in May of all the old high rate components of our balance sheet with low rate $325 million syndicated five year bank credit facilities and $143.75 million seven year convertible subordinated notes; |
4. | Established a highly collaborative Operations and Strategic Growth Leadership Team (OSGLT) comprised of the Executive Team and twelve senior leaders representing field operations and Houston Support teams. This group operates informally as owner leaders without titles, direct reports, etc., and addresses all important Carriage value creation matters consistent with One Team, One Vision; |
5. | Updated and revised Strategic Acquisition Model criteria and methodologies to directly align with Standards Operating and 4E Leadership Models, and began building a new Strategic Development Team under Dave's leadership focused on building relationships with top quality acquisition candidates in large and medium strategic markets and areas. |
Year Ended December 31, 2014
• | Total Revenue of $226.1 million, an increase of 6.1%; |
• | Adjusted Consolidated EBITDA of $61.7 million, an increase of 10.1%; |
• | Adjusted Consolidated EBITDA Margin up 100 basis points to 27.3%; |
• | Adjusted Diluted Earnings Per Share of $1.34, an increase of 36.7%; and |
• | Adjusted Free Cash Flow of $34.2 million, an increase of 2.8%. |
Three Months Ended December 31, 2014
• | Total Revenue of $59.4 million, an increase of 12.9%; |
• | Adjusted Consolidated EBITDA of $17.1 million, an increase of 27.8%; |
• | Adjusted Consolidated EBITDA Margin up 330 basis points to 28.7%; |
• | Adjusted Diluted Earnings Per Share of $0.38, an increase of 52.0%; and |
• | Adjusted Free Cash Flow of $7.0 million, an increase of 4.0% |
We begin the fourth year of our defined Five Year Carriage Good To Great Journey with a company that is materially better in all areas than one year ago. While we understand that public investors must rely on our reported quantitative financial results covering a recent short period of time to judge our progress, the internal qualitative drivers of our increasing quantitative success are our Five Guiding Principles, three innovative operating, leadership and growth models, High Performance Standards, relentless focus on 4E Leadership and Right Quality of Staff and the collaboration dynamic across all field operations and Houston Support teams. Linked together, these ideas and concepts form our High Performance Culture Framework of value creation, which we believe will produce superior quantitative results over the next several years that will attract the best acquisition candidates and talent in our industry to join and contribute to the Carriage Good To Great Journey.
As we successfully execute our three models (Standards Operating, Strategic Acquisition and 4E Leadership) over this year and next to complete our Five Year Good to Great Journey, we fully expect to accelerate the earning power of our Carriage Consolidation and Operating Platform. However, by the end of 2016 we will also have redefined our Carriage Good to Great Journey over a new five year timeframe with new goals, always keeping our Mission of Being The Best and Five Guiding Principles together with shareholder value creation uppermost in mind. Lastly and importantly for our company leadership and employees, I am extremely proud to publicly announce our Good To Great annual theme for this year,” concluded Mr. Payne.
“Carriage Services 2015: High Performance through Passion and Partnership!”
TOTAL FIELD OPERATIONS
For the Year Ended December 31, 2014 compared to Year Ended December 31, 2013
• | Total Field Revenue increased 6.1% to $226.1 million; |
• | Total Field EBITDA increased 7.0% to $90.4 million; |
• | Total Field EBITDA Margin increased 40 basis points to 40.0%; |
• | Total Funeral Operating Revenue increased 6.8% to $164.3 million; |
• | Same Store Funeral Revenue decreased 0.7% with same store volume decreasing 1.2%; |
• | Acquisition Funeral Revenue increased 33.5% with acquisition volume increasing 26.9%; |
• | Total Funeral Field EBITDA increased 9.0% to $60.5 million; |
• | Total Funeral Field EBITDA Margin increased 80 basis points to 36.8%; |
• | Total Cemetery Operating Revenue increased 5.9% to $42.9 million; |
• | Cemetery preneed property sale contracts increased 5.5% to 7,408; |
• | Preneed property revenue recognized increased 5.4% and At-need revenue increased 10.8%; |
• | Total Cemetery Field EBITDA increased 4.1% to $12.2 million; |
• | Total Cemetery Field EBITDA Margin decreased 40 basis points to 28.5%; |
• | Total Financial Revenue increased 1.5% to $19.0 million; |
• | Funeral Financial Revenue increased 2.7% to $9.5 million; |
• | Cemetery Financial Revenue remained flat at $9.5 million; |
• | Total Financial EBITDA increased 2.2% to $17.7 million; |
• | Total Financial EBITDA Margin increased 70 basis points to 93.0%. |
ADJUSTED FREE CASH FLOW
Carriage produced Adjusted Free Cash Flow from operations for the year ended December 31, 2014 of $34.2 million compared to $33.2 million for the corresponding period in 2013. The sources and uses of cash for the year ended December 31, 2013 and 2014 consisted of the following (in millions):
Three Months Ended December 31, | Twelve Months Ended December 31, | ||||||||||||||
2013 | 2014 | 2013 | 2014 | ||||||||||||
Cash flow provided by operations | $ | 8.6 | $ | 8.9 | $ | 39.8 | $ | 36.6 | |||||||
Adjustment for tax benefit from Good to Great stock awards | — | — | — | 4.8 | |||||||||||
Cash used for maintenance capital expenditures | (1.9 | ) | (1.9 | ) | (6.6 | ) | (7.2 | ) | |||||||
Adjusted Free Cash Flow | $ | 6.7 | $ | 7.0 | $ | 33.2 | $ | 34.2 | |||||||
Cash at beginning of period | 0.9 | 3.0 | 1.7 | 1.4 | |||||||||||
Acquisitions and land for new construction | (13.7 | ) | (1.0 | ) | (19.7 | ) | (57.9 | ) | |||||||
Net proceeds from sale of businesses and other assets | 1.9 | 0.3 | 10.2 | 2.2 | |||||||||||
Net (payments) borrowings on our revolving credit facility, term loan and long-term debt obligations | 7.6 | (4.3 | ) | (19.0 | ) | 6.1 | |||||||||
Proceeds from issuance of convertible subordinated notes | — | — | — | 143.7 | |||||||||||
Payment of debt issuance costs related to the convertible subordinated notes | — | — | — | (4.7 | ) | ||||||||||
Payment of loan origination costs related to the credit facility | — | — | (0.6 | ) | (0.8 | ) | |||||||||
Redemption of convertible junior subordinated debentures | — | — | — | (89.7 | ) | ||||||||||
Payments for performance-based stock awards | — | — | — | (16.2 | ) | ||||||||||
Cash used for growth capital expenditures | (1.3 | ) | (3.6 | ) | (4.1 | ) | (16.5 | ) | |||||||
Dividends on common stock | (0.5 | ) | (0.5 | ) | (1.8 | ) | (1.8 | ) | |||||||
Excess tax benefit of equity compensation, net of benefit from Good to Great stock awards | (0.4 | ) | (0.6 | ) | 0.6 | (0.8 | ) | ||||||||
Other investing and financing activities | 0.2 | 0.1 | 0.9 | 1.2 | |||||||||||
Cash at end of period | $ | 1.4 | $ | 0.4 | $ | 1.4 | $ | 0.4 | |||||||
ROLLING FOUR QUARTER OUTLOOK RAISED
The Rolling Four Quarter Outlook (“Outlook”) reflects management’s opinion on the performance of our existing portfolio of businesses for the rolling four quarter period ending December 31, 2015, the performance of the trusts, and our view of the activity within the industry acquisition landscape. This Outlook is not intended to be management estimates or forecasts of our future performance, as we believe such precise rolling estimates will be precisely wrong all the time. Rather our intent and goal is to reflect a “roughly right range” most of the time of future Rolling Four Quarter Outlook performance as we execute our Standards Operating, Strategic Acquisition and 4E Leadership Models over time.
ROLLING FOUR QUARTER OUTLOOK – Period Ending December 31, 2015
Range (in millions, except per share amounts) | |
Revenues | $244 - $248 |
Adjusted Consolidated EBITDA | $70 - $72 |
Adjusted Net Income | $28 - $30 |
Adjusted Diluted Earnings Per Share(1) | $1.55 - $1.59 |
Factors affecting our analysis include, among others, number, size and timing of closing of acquisitions, funeral contract volumes, average revenue per funeral service, cemetery interment volumes, preneed cemetery sales, capital expenditures, execution of our funeral and cemetery Standards Operating Model, Strategic Acquisition Model, Withdrawable Trust Income and changes in Federal Reserve monetary policy. Revenues, Adjusted Consolidated EBITDA, Adjusted Net Income and Adjusted Diluted Earnings Per Share for the four quarter period ending December 31, 2015 are expected to improve relative to the same period in the previous period for the following reasons:
• | Increases in Acquired Funeral Revenue and Acquired Funeral Field EBITDA; |
• | Increases in Acquired Cemetery Revenue and Acquired Cemetery Field EBITDA; |
• | Modest increases in Same Store Funeral Revenue and Same Store Funeral Field EBITDA; |
• | Increases in Same Store Cemetery Revenue and Same Store Cemetery Field EBITDA; |
• | Increases in Financial Revenue and Financial EBITDA from trust funds; and |
• | Reduced interest expense in conjunction with the fourth and fifth amendments to our bank credit facilities and the $143.75 2.75% Convertible Notes, including the add-back to Adjusted Diluted EPS of non-tax deductible accretion on the Convertible Notes to reflect the Non-GAAP normalized earning power of the Company. |
(1) | The Rolling Four Quarter Outlook on Adjusted Diluted Earnings Per Share does not include any changes to our fully diluted share count that could occur related to a share price increase and EPS dilution calculations related to our new convertible notes, as explained more fully on page 6 in this press release. |
CONFERENCE CALL AND INVESTOR RELATIONS CONTACT
Carriage Services has scheduled a conference call for tomorrow, February 26, 2015 at 9:30 a.m. CT. To participate in the call, please dial 866-516-3867 (ID-67804537) and ask for the Carriage Services conference call. A replay of the conference call will be available through March 2, 2015 and may be accessed by dialing 855-859-2056 (ID-67804537). The conference call will also be available at www.carriageservices.com. For any investor relations questions, please contact Bill Heiligbrodt at 713-332-8553.
TRUST FUND PERFORMANCE
For the year ended December 31, 2014, Carriage’s discretionary trust funds gained 8.3% compared to our 70/30 index benchmark of 5.8%. Over the same period in the discretionary portfolio, the fixed income return was 6.9%, beating the High Yield Index of 2.5% while the equity return was 7.6%, underperforming the S&P 500 at 13.7%. The current yield on Carriage's discretionary fixed income portfolio, which comprises 72% of discretionary trust assets, is 8.5% and the estimated annual income for the discretionary portfolio is approximately $10.8 million.
Shown below are consolidated performance metrics for the combined trust fund portfolios (preneed funeral, cemetery merchandise and services and cemetery perpetual care) at key dates.
Investment Performance | ||||||||||||
Investment Performance(1) | Index Performance | |||||||||||
Discretionary | Total Trust | S&P 500 Stock Index | High Yield Index | 70/30 index Benchmark(2) | ||||||||
1 year ended 12/31/14 | 8.3 | % | 7.9 | % | 13.7 | % | 2.5 | % | 5.8 | % | ||
2 years ended 12/31/14 | 23.8 | % | 22.7 | % | 50.4 | % | 10.1 | % | 22.2 | % | ||
3 years ended 12/31/14 | 48.9 | % | 43.7 | % | 74.5 | % | 27.5 | % | 41.6 | % | ||
4 years ended 12/31/14 | 44.6 | % | 41.0 | % | 78.1 | % | 33.8 | % | 47.1 | % | ||
5 years ended 12/31/14 | 74.5 | % | 66.6 | % | 105.0 | % | 54.1 | % | 69.3 | % | ||
(1) | Investment performance includes realized income and unrealized appreciation (depreciation). |
(2) | The 70/30 Benchmark is 70% weighted to the High Yield Index and 30% weighted to the S&P 500 Stock Index. |
Asset Allocation as of December 31, 2014 (in thousands) | ||||||||||||||
Discretionary Trust Funds | Total Trust Funds | |||||||||||||
Asset Class | MV | % | MV | % | ||||||||||
Cash | $ | 13,628 | 7 | % | $ | 29,366 | 12 | % | ||||||
Equities | 36,232 | 19 | % | 54,035 | 23 | % | ||||||||
Fixed Income | 134,107 | 72 | % | 149,622 | 63 | % | ||||||||
Other/Insurance | 3,386 | 2 | % | 3,629 | 2 | % | ||||||||
Total Portfolios | $ | 187,353 | 100 | % | $ | 236,652 | 100 | % | ||||||
CONVERTIBLE NOTES
On March 13, 2014, when our common stock closed at $17.03 per share, we executed a new seven year convertible subordinated debenture (new convertible notes) in the amount of $143.75 million with a coupon of 2.75% and 32.5% conversion premium equal to a conversion price of $22.56 per share. We used a majority of the proceeds to refinance a traditional 7% coupon, $90 million convertible security due in 2029 (Tides convertible) with a conversion price of $20.44, which was adding 4.4 million shares to our reported fully diluted EPS calculation (24% dilution) when our stock price traded “in the money” above $20.44 even though none of these securities were ever converted into common stock.
In most traditional convertible securities issued prior to the last ten years (including in our refinanced Tides security issued in 1999), full dilution kicks in to the calculation of EPS once the stock price rises above the conversion price (in the money). That will not be the case with our new convertible notes because of highly favorable anti-dilution features (net share settlement). The in the money option value can be settled in cash using any form of financing at our discretion, meaning that depending on the amount of net share settlement need at any time and the financing method selected by management, the actual number of new shares outstanding in the future may differ materially from the technical calculation of EPS pursuant to the share count mechanics of the new convertible notes.
While the mechanics of the in the money payment features on our new convertible notes are somewhat complex, the main points are that dilution is restricted to under 20% of outstanding shares as of the March 19, 2014 issue date (about 3.6 million shares). The new convertible notes become eligible for conversion at $29.33 per share and reach the maximum potential 20% dilution at a price of $54 per share, as the New York Stock Exchange rules restrict the maximum dilution of an unregistered convertible to 20% for any listed member such as Carriage.
We had about 18 million fully diluted shares outstanding when the new convertible notes were issued in March 2014, so it is easy using the chart below to determine the EPS share count dilution calculation as our share price increases over time. For example, at a share price of $26, the threshold of 5% dilution is reached, so 5% of 18 million or 900,000 shares are added to the weighted average number of fully diluted shares for the period whose EPS performance is covered. Likewise, a share price of $32 triggers the 10% dilution threshold or 1.8 million added shares, a share price of $40 triggers the 15% dilution threshold or 2.7 million additional shares, and a $54 share price triggers the 20% dilution maximum threshold adding 3.6 million shares to our EPS calculation for the EPS period covered.

CARRIAGE SERVICES, INC. | |||||||||||||||||
OPERATING AND FINANCIAL TREND REPORT | |||||||||||||||||
FROM CONTINUING OPERATIONS (IN THOUSANDS - EXCEPT PER SHARE AMOUNTS) | |||||||||||||||||
Three Months Ended December 31, | Twelve Months Ended December 31, | ||||||||||||||||
2013 | 2014 | % Change | 2013 | 2014 | % Change | ||||||||||||
Same Store Contracts | |||||||||||||||||
Atneed Contracts | 4,400 | 4,578 | 4.0 | % | 18,149 | 18,133 | -0.1 | % | |||||||||
Preneed Contracts | 1,188 | 1,193 | 0.4 | % | 4,908 | 4,641 | -5.4 | % | |||||||||
Total Same Store Funeral Contracts | 5,588 | 5,771 | 3.3 | % | 23,057 | 22,774 | -1.2 | % | |||||||||
Acquisition Contracts | |||||||||||||||||
Atneed Contracts | 1,513 | 2,079 | 37.4 | % | 5,689 | 7,260 | 27.6 | % | |||||||||
Preneed Contracts | 280 | 387 | 38.2 | % | 1,108 | 1,368 | 23.5 | % | |||||||||
Total Acquisition Funeral Contracts | 1,793 | 2,466 | 37.5 | % | 6,797 | 8,628 | 26.9 | % | |||||||||
Total Funeral Contracts | 7,381 | 8,237 | 11.6 | % | 29,854 | 31,402 | 5.2 | % | |||||||||
Funeral Operating Revenue | |||||||||||||||||
Same Store Revenue | $ | 29,563 | $ | 30,619 | 3.6 | % | $ | 120,191 | $ | 119,322 | -0.7 | % | |||||
Acquisition Revenue | 8,880 | 12,841 | 44.6 | % | 33,660 | 44,930 | 33.5 | % | |||||||||
Total Funeral Operating Revenue | $ | 38,443 | $ | 43,460 | 13.1 | % | $ | 153,851 | $ | 164,252 | 6.8 | % | |||||
Cemetery Operating Revenue | |||||||||||||||||
Same Store Revenue | $ | 9,695 | $ | 10,624 | 9.6 | % | $ | 40,181 | $ | 41,257 | 2.7 | % | |||||
Acquisition Revenue | 66 | 565 | 756.1 | % | 298 | 1,599 | 436.6 | % | |||||||||
Total Cemetery Operating Revenue | $ | 9,761 | $ | 11,189 | 14.6 | % | $ | 40,479 | $ | 42,856 | 5.9 | % | |||||
Financial Revenue | |||||||||||||||||
Preneed Funeral Commission Income | $ | 418 | $ | 400 | -4.3 | % | $ | 1,853 | $ | 2,036 | 9.9 | % | |||||
Preneed Funeral Trust Earnings | 1,794 | 1,949 | 8.6 | % | 7,378 | 7,447 | 0.9 | % | |||||||||
Cemetery Trust Earnings | 1,875 | 2,051 | 9.4 | % | 8,095 | 8,123 | 0.3 | % | |||||||||
Preneed Cemetery Finance Charges | 348 | 370 | 6.3 | % | 1,418 | 1,410 | -0.6 | % | |||||||||
Total Financial Revenue | $ | 4,435 | $ | 4,770 | 7.6 | % | $ | 18,744 | $ | 19,016 | 1.5 | % | |||||
Total Revenue | $ | 52,639 | $ | 59,419 | 12.9 | % | $ | 213,074 | $ | 226,124 | 6.1 | % | |||||
Field EBITDA | |||||||||||||||||
Same Store Funeral Field EBITDA | $ | 10,004 | $ | 12,050 | 20.5 | % | $ | 44,973 | $ | 44,756 | -0.5 | % | |||||
Same Store Funeral Field EBITDA Margin | 33.8 | % | 39.4 | % | 560 bp | 37.4 | % | 37.5 | % | 10 bp | |||||||
Acquisition Funeral Field EBITDA | 2,743 | 4,711 | 71.7 | % | 10,486 | 15,718 | 49.9 | % | |||||||||
Acquisition Funeral Field EBITDA Margin | 30.9 | % | 36.7 | % | 580 bp | 31.2 | % | 35.0 | % | 380 bp | |||||||
Total Funeral Field EBITDA | $ | 12,747 | $ | 16,761 | 31.5 | % | $ | 55,459 | $ | 60,474 | 9.0 | % | |||||
Total Funeral Field EBITDA Margin | 33.2 | % | 38.6 | % | 540 bp | 36.0 | % | 36.8 | % | 80 bp | |||||||
Same Store Cemetery Field EBITDA | $ | 2,684 | $ | 3,290 | 22.6 | % | $ | 11,757 | $ | 11,845 | 0.7 | % | |||||
Same Store Cemetery Field EBITDA Margin | 27.7 | % | 31.0 | % | 330 bp | 29.3 | % | 28.7 | % | -60 bp | |||||||
Acquisition Cemetery Field EBITDA | (10 | ) | 112 | 1,220.0 | % | (43 | ) | 351 | 916.3 | % | |||||||
Acquisition Cemetery Field EBITDA Margin | -15.2 | % | 19.8 | % | 3,500 bp | -14.4 | % | 22.0 | % | 3,640 bp | |||||||
Total Cemetery Field EBITDA | $ | 2,674 | $ | 3,402 | 27.2 | % | $ | 11,714 | $ | 12,196 | 4.1 | % | |||||
Total Cemetery Field EBITDA Margin | 27.4 | % | 30.4 | % | 300 bp | 28.9 | % | 28.5 | % | -40 bp | |||||||
Funeral Financial EBITDA | $ | 1,958 | $ | 2,041 | 4.2 | % | $ | 7,966 | $ | 8,348 | 4.8 | % | |||||
Cemetery Financial EBITDA | 2,179 | 2,358 | 8.2 | % | 9,338 | 9,341 | — | % | |||||||||
Total Financial EBITDA | $ | 4,137 | $ | 4,399 | 6.3 | % | $ | 17,304 | $ | 17,689 | 2.2 | % | |||||
Total Financial EBITDA Margin | 93.3 | % | 92.2 | % | -110 bp | 92.3 | % | 93.0 | % | 70 bp | |||||||
Total Field EBITDA | $ | 19,558 | $ | 24,562 | 25.6 | % | $ | 84,477 | $ | 90,359 | 7.0 | % | |||||
Total Field EBITDA Margin | 37.2 | % | 41.3 | % | 410 bp | 39.6 | % | 40.0 | % | 40 bp | |||||||
OPERATING AND FINANCIAL TREND REPORT | |||||||||||||||||
FROM CONTINUING OPERATIONS (IN THOUSANDS - EXCEPT PER SHARE AMOUNTS) | |||||||||||||||||
Three Months Ended December 31, | Twelve Months Ended December 31, | ||||||||||||||||
2013 | 2014 | % Change | 2013 | 2014 | % Change | ||||||||||||
Overhead | |||||||||||||||||
Total Variable Overhead | $ | 1,944 | $ | 2,425 | 24.7 | % | $ | 8,845 | $ | 10,764 | 21.7 | % | |||||
Total Regional Fixed Overhead | 538 | 758 | 40.9 | % | 3,346 | 3,136 | -6.3 | % | |||||||||
Total Corporate Fixed Overhead | 4,819 | 4,902 | 1.7 | % | 20,829 | 20,227 | -2.9 | % | |||||||||
Total Overhead | $ | 7,301 | $ | 8,085 | 10.7 | % | $ | 33,020 | $ | 34,127 | 3.4 | % | |||||
Overhead as a percent of sales | 13.9 | % | 13.6 | % | -30 bp | 15.5 | % | 15.1 | % | -40 bp | |||||||
Consolidated EBITDA | $ | 12,257 | $ | 16,477 | 34.4 | % | $ | 51,457 | $ | 56,232 | 9.3 | % | |||||
Consolidated EBITDA Margin | 23.3 | % | 27.7 | % | 440 bp | 24.1 | % | 24.9 | % | 80 bp | |||||||
Other Expenses and Interest | |||||||||||||||||
Property Depreciation & Amortization | $ | 2,823 | $ | 3,142 | 11.3 | % | $ | 11,635 | $ | 11,923 | 2.5 | % | |||||
Non Cash Stock Compensation | 617 | 920 | 49.1 | % | 2,916 | 3,832 | 31.4 | % | |||||||||
Interest Expense | 3,066 | 2,593 | -15.4 | % | 13,437 | 10,308 | -23.3 | % | |||||||||
Accretion on Convertible Subordinated Notes | — | 805 | — | 2,452 | |||||||||||||
Loss on Early Extinguishment of Debt | — | — | — | 1,042 | |||||||||||||
Loss on Redemption of Convertible Junior Subordinated Debentures | — | — | — | 3,779 | |||||||||||||
Other, Net | — | 571 | (896 | ) | 195 | -121.8 | % | ||||||||||
Pretax Income | $ | 5,751 | $ | 8,446 | 46.9 | % | $ | 24,365 | $ | 22,701 | -6.8 | % | |||||
Net Tax Provision | 1,519 | 3,079 | 9,245 | 7,255 | |||||||||||||
GAAP Net Income | $ | 4,232 | $ | 5,367 | 26.8 | % | $ | 15,120 | $ | 15,446 | 2.2 | % | |||||
Special Items, Net of tax except for ** | |||||||||||||||||
Withdrawable Trust Income | $ | 281 | $ | 198 | $ | 960 | $ | 1,181 | |||||||||
Acquisition and Divestiture Expenses | 246 | 49 | 496 | 764 | |||||||||||||
Severance Costs | 105 | 101 | 965 | 697 | |||||||||||||
Consulting Fees | 90 | 41 | 368 | 277 | |||||||||||||
Other Incentive Compensation | — | — | — | 660 | |||||||||||||
Accretion on Convertible Subordinated Notes ** | — | 805 | — | 2,452 | |||||||||||||
Costs Related to Credit Facility | — | — | 248 | 688 | |||||||||||||
Loss on Redemption of Convertible Junior Subordinated Debentures | — | — | — | 2,493 | |||||||||||||
Loss (Gain) on Asset Purchase | — | 379 | — | (367 | ) | ||||||||||||
Securities Transaction Expenses | — | — | 160 | — | |||||||||||||
Other Special Items | — | — | (484 | ) | 503 | ||||||||||||
Tax Adjustment from Prior Period ** | (338 | ) | — | 260 | — | ||||||||||||
Sum of Special Items, Net of tax | $ | 384 | $ | 1,573 | 309.6 | % | $ | 2,973 | $ | 9,348 | 214.4 | % | |||||
Adjusted Net Income | $ | 4,616 | $ | 6,940 | 50.3 | % | $ | 18,093 | $ | 24,794 | 37.0 | % | |||||
Adjusted Net Profit Margin | 8.8 | % | 11.7 | % | 290 bp | 8.5 | % | 11.0 | % | 250 bp | |||||||
Adjusted Basic Earnings Per Share | $ | 0.25 | $ | 0.38 | 52.0 | % | $ | 1.00 | $ | 1.35 | 35.0 | % | |||||
Adjusted Diluted Earnings Per Share | $ | 0.25 | $ | 0.38 | 52.0 | % | $ | 0.98 | $ | 1.34 | 36.7 | % | |||||
GAAP Basic Earnings Per Share | $ | 0.23 | $ | 0.29 | 26.1 | % | $ | 0.83 | $ | 0.84 | 1.2 | % | |||||
GAAP Diluted Earnings Per Share | $ | 0.23 | $ | 0.29 | 26.1 | % | $ | 0.82 | $ | 0.83 | 1.2 | % | |||||
Effective Tax Rate | 26.4 | % | 36.5 | % | 37.9 | % | 32.0 | % | |||||||||
Reconciliation to Adjusted Consolidated EBITDA | |||||||||||||||||
Consolidated EBITDA | $ | 12,257 | $ | 16,477 | 34.4 | % | $ | 51,457 | $ | 56,232 | 9.3 | % | |||||
Withdrawable Trust Income | 426 | 300 | 1,454 | 1,788 | |||||||||||||
Acquisition and Divestiture Expenses | 372 | 74 | 752 | 1,158 | |||||||||||||
Severance Costs | 158 | 153 | 1,462 | 1,056 | |||||||||||||
Consulting Fees | 136 | 62 | 557 | 419 | |||||||||||||
Securities Transaction Expenses | — | — | 242 | — | |||||||||||||
Other Incentive Compensation | — | — | — | 1,000 | |||||||||||||
Other Special Items | — | — | 83 | — | |||||||||||||
Adjusted Consolidated EBITDA | $ | 13,349 | $ | 17,066 | 27.8 | % | $ | 56,007 | $ | 61,653 | 10.1 | % | |||||
Adjusted Consolidated EBITDA Margin | 25.4 | % | 28.7 | % | 330 bp | 26.3 | % | 27.3 | % | 100 bp | |||||||
CARRIAGE SERVICES, INC.
CONDENSED CONSOLIDATED BALANCE SHEETS
(in thousands)
December 31, | |||||||
2013 | 2014 | ||||||
ASSETS | |||||||
Current assets: | |||||||
Cash and cash equivalents | $ | 1,377 | $ | 413 | |||
Accounts receivable, net | 17,950 | 19,264 | |||||
Assets held for sale | 3,544 | — | |||||
Inventories | 5,300 | 5,294 | |||||
Prepaid expenses | 4,421 | 4,590 | |||||
Other current assets | 3,525 | 7,144 | |||||
Total current assets | 36,117 | 36,705 | |||||
Preneed cemetery trust investments | 68,341 | 71,972 | |||||
Preneed funeral trust investments | 97,144 | 97,607 | |||||
Preneed receivables, net | 24,521 | 26,284 | |||||
Receivables from preneed trusts | 11,166 | 12,809 | |||||
Property, plant and equipment, net | 160,690 | 186,211 | |||||
Cemetery property | 72,911 | 75,564 | |||||
Goodwill | 221,087 | 257,442 | |||||
Deferred charges and other non-current assets | 12,280 | 14,264 | |||||
Cemetery perpetual care trust investments | 42,342 | 48,670 | |||||
Total assets | $ | 746,599 | $ | 827,528 | |||
LIABILITIES AND STOCKHOLDERS’ EQUITY | |||||||
Current liabilities: | |||||||
Current portion of long-term debt and capital lease obligations | $ | 13,424 | $ | 9,838 | |||
Accounts payable | 7,046 | 6,472 | |||||
Other liabilities | 9,939 | 1,437 | |||||
Accrued liabilities | 12,854 | 15,203 | |||||
Liabilities associated with assets held for sale | 4,357 | — | |||||
Total current liabilities | 47,620 | 32,950 | |||||
Long-term debt, net of current portion | 105,642 | 111,887 | |||||
Revolving credit facility | 36,900 | 40,500 | |||||
Convertible junior subordinated debentures due in 2029 to an affiliate | 89,770 | — | |||||
Convertible subordinated notes due 2021 | — | 114,542 | |||||
Obligations under capital leases, net of current portion | 3,786 | 3,098 | |||||
Deferred preneed cemetery revenue | 55,479 | 56,875 | |||||
Deferred preneed funeral revenue | 30,588 | 31,265 | |||||
Deferred tax liability | 11,915 | 36,414 | |||||
Other long-term liabilities | 1,548 | 2,401 | |||||
Deferred preneed cemetery receipts held in trust | 68,341 | 71,972 | |||||
Deferred preneed funeral receipts held in trust | 97,144 | 97,607 | |||||
Care trusts’ corpus | 41,893 | 48,142 | |||||
Total liabilities | 590,626 | 647,653 | |||||
Commitments and contingencies: | |||||||
Stockholders’ equity: | |||||||
Common stock, $.01 par value; 80,000,000 shares authorized; 22,183,000 and 22,434,000 issued as of December 31, 2013 and 2014, respectively | 222 | 224 | |||||
Additional paid-in capital | 204,324 | 212,386 | |||||
Accumulated deficit | (33,306 | ) | (17,468 | ) | |||
Treasury stock, at cost; 3,922,000 shares at December 31, 2013 and 2014 | (15,267 | ) | (15,267 | ) | |||
Total stockholders’ equity | 155,973 | 179,875 | |||||
Total liabilities and stockholders’ equity | $ | 746,599 | $ | 827,528 | |||
CARRIAGE SERVICES, INC.
CONDENSED CONSOLIDATED STATEMENTS OF OPERATIONS
(in thousands, except share and per share data)
(unaudited) | |||||||||||||||
For the Three Months Ended December 31, | For the Twelve Months Ended December 31, | ||||||||||||||
2013 | 2014 | 2013 | 2014 | ||||||||||||
Revenues | $ | 52,639 | $ | 59,419 | $ | 213,074 | $ | 226,124 | |||||||
Field costs and expenses | 38,239 | 40,492 | 148,789 | 156,116 | |||||||||||
Gross profit | $ | 14,400 | $ | 18,927 | $ | 64,285 | $ | 70,008 | |||||||
General and administrative expenses | 5,583 | 6,512 | 27,379 | 30,293 | |||||||||||
Operating income | $ | 8,817 | $ | 12,415 | $ | 36,906 | $ | 39,715 | |||||||
Interest expense, net | (3,066 | ) | (2,593 | ) | (12,622 | ) | (10,308 | ) | |||||||
Accretion of discount on convertible subordinated notes | — | (805 | ) | — | (2,452 | ) | |||||||||
Loss on early extinguishment of debt and other costs | — | — | — | (1,042 | ) | ||||||||||
Loss on redemption of convertible junior subordinated debentures | — | — | — | (3,779 | ) | ||||||||||
Other, net | — | (571 | ) | 81 | 567 | ||||||||||
Income from continuing operations before income taxes | $ | 5,751 | $ | 8,446 | $ | 24,365 | $ | 22,701 | |||||||
Net provision for income taxes | (1,519 | ) | (3,079 | ) | (9,245 | ) | (7,255 | ) | |||||||
Net income from continuing operations | $ | 4,232 | $ | 5,367 | $ | 15,120 | $ | 15,446 | |||||||
Net income (loss) from discontinued operations, net of tax | (233 | ) | 11 | 4,176 | 392 | ||||||||||
Net income | $ | 3,999 | $ | 5,378 | $ | 19,296 | $ | 15,838 | |||||||
Preferred stock dividend | — | — | (4 | ) | — | ||||||||||
Net income available to common stockholders | $ | 3,999 | $ | 5,378 | $ | 19,292 | $ | 15,838 | |||||||
Basic earnings per common share: | |||||||||||||||
Continuing operations | $ | 0.23 | $ | 0.29 | $ | 0.83 | $ | 0.84 | |||||||
Discontinued operations | (0.01 | ) | — | 0.23 | 0.02 | ||||||||||
Basic earnings per common share | $ | 0.22 | $ | 0.29 | $ | 1.06 | $ | 0.86 | |||||||
Diluted earnings per common share: | |||||||||||||||
Continuing operations | $ | 0.23 | $ | 0.29 | $ | 0.82 | $ | 0.83 | |||||||
Discontinued operations | (0.01 | ) | — | 0.18 | 0.02 | ||||||||||
Diluted earnings per common share | $ | 0.22 | $ | 0.29 | $ | 1.00 | $ | 0.85 | |||||||
Dividends declared per common share | $ | 0.025 | $ | 0.025 | $ | 0.100 | $ | 0.100 | |||||||
Weighted average number of common and common equivalent shares outstanding: | |||||||||||||||
Basic | 17,920 | 18,170 | 17,826 | 18,108 | |||||||||||
Diluted | 22,488 | 18,358 | 22,393 | 18,257 | |||||||||||
The GAAP Diluted EPS and Adjusted Diluted EPS for the three and twelve months ended December 31, 2013 includes 4.4 million shares that would be issued upon conversion of our convertible subordinated debentures (TIDES) as a result of the if-converted method prescribed by accounting standards.
On August 1, 2014, we received notification that the Internal Revenue Service completed its examination of our tax year ended December 31, 2011 citing no change. As a result, we have re-measured our tax liability for unrecognized tax benefits related to personal goodwill which resulted in a tax benefit recognized of $1.7 million and an increase to Deferred tax liability of $5.6 million. The tax benefit reduced the effective tax rate for the year ended December 31, 2014. Additionally, we recognized a credit to interest expense of $0.6 million related to the settled portion of the uncertain tax position.
CARRIAGE SERVICES, INC.
CONSOLIDATED STATEMENTS OF CASH FLOWS
(in thousands)
For the Years Ended December 31, | ||||||||
2013 | 2014 | |||||||
Cash flows from operating activities: | ||||||||
Net income | $ | 19,296 | $ | 15,838 | ||||
Adjustments to reconcile net income to net cash provided by operating activities: | ||||||||
Depreciation and amortization | 11,748 | 11,945 | ||||||
Gain on sale of businesses and purchase of assets | (6,091 | ) | (2,150 | ) | ||||
Impairment of goodwill | 100 | 1,180 | ||||||
Loss on early extinguishment of debt and other costs | — | 1,042 | ||||||
Amortization of deferred financing costs | 362 | 908 | ||||||
Accretion of discount on convertible subordinated notes | — | 2,452 | ||||||
Provision for losses on accounts receivable | 2,005 | 2,877 | ||||||
Stock-based compensation expense | 3,583 | 4,622 | ||||||
Deferred income tax expense | 12,572 | 5,295 | ||||||
Loss on redemption of convertible junior subordinated debentures | — | 2,932 | ||||||
Other | 85 | — | ||||||
Changes in operating assets and liabilities that provided (required) cash: | ||||||||
Accounts and preneed receivables | (3,329 | ) | (4,146 | ) | ||||
Inventories and other current assets | (337 | ) | (2,590 | ) | ||||
Deferred charges and other | (35 | ) | (165 | ) | ||||
Preneed funeral and cemetery trust investments | (1,415 | ) | (203 | ) | ||||
Accounts payable | 1,142 | (562 | ) | |||||
Accrued and other liabilities | (3,294 | ) | (1,529 | ) | ||||
Deferred preneed funeral and cemetery revenue | 1,187 | 303 | ||||||
Deferred preneed funeral and cemetery receipts held in trust | 2,266 | (1,484 | ) | |||||
Net cash provided by operating activities | 39,845 | 36,565 | ||||||
Cash flows from investing activities: | ||||||||
Acquisitions and land for new construction | (19,701 | ) | (57,874 | ) | ||||
Net proceeds from sale of businesses and other assets | 10,184 | 2,192 | ||||||
Capital expenditures | (10,695 | ) | (23,675 | ) | ||||
Net cash used in investing activities | (20,212 | ) | (79,357 | ) | ||||
Cash flows from financing activities: | ||||||||
Net borrowings (payments) on the revolving credit facility | (7,800 | ) | 3,600 | |||||
Net borrowings on the term loan | — | 3,313 | ||||||
Proceeds from the issuance of convertible subordinated notes | — | 143,750 | ||||||
Payment of debt issuance costs related to the convertible subordinated notes | — | (4,650 | ) | |||||
Payments on long-term debt and obligations under capital leases | (11,219 | ) | (840 | ) | ||||
Redemption of convertible junior subordinated debentures | — | (89,748 | ) | |||||
Payments for performance-based stock awards | — | (16,150 | ) | |||||
Proceeds from the exercise of stock options and employee stock purchase plan contributions | 894 | 1,228 | ||||||
Dividends on common stock | (1,817 | ) | (1,840 | ) | ||||
Dividends on redeemable preferred stock | (4 | ) | — | |||||
Payment of loan origination costs | (621 | ) | (825 | ) | ||||
Excess tax benefit of equity compensation | 613 | 3,990 | ||||||
Net cash provided by (used in) financing activities | (19,954 | ) | 41,828 | |||||
Net decrease in cash and cash equivalents | (321 | ) | (964 | ) | ||||
Cash and cash equivalents at beginning of year | 1,698 | 1,377 | ||||||
Cash and cash equivalents at end of year | $ | 1,377 | $ | 413 | ||||
CARRIAGE SERVICES, INC.
CALCULATION OF EARNINGS PER SHARE
(in thousands, except share and per share data)
Year Ended December 31, | |||||||
2013 | 2014 | ||||||
Numerator for basic earnings per share: | |||||||
Numerator from continuing operations | |||||||
Income from continuing operations | $ | 15,120 | $ | 15,446 | |||
Less: Earnings allocated to unvested restricted stock | (314 | ) | (295 | ) | |||
Income attributable to continuing operations | $ | 14,806 | $ | 15,151 | |||
Numerator from discontinued operations | |||||||
Income from discontinued operations | $ | 4,176 | $ | 392 | |||
Less: Earnings allocated to unvested restricted stock | (85 | ) | (8 | ) | |||
Income attributable to discontinued operations | $ | 4,091 | $ | 384 | |||
Numerator for diluted earnings per share: | |||||||
Adjustment for diluted earnings per share: | |||||||
Interest on convertible junior subordinated debentures, net of tax | 3,454 | — | |||||
$ | 3,454 | $ | — | ||||
Income attributable to continuing operations | $ | 18,260 | $ | 15,151 | |||
Income attributable to discontinuing operations | $ | 4,091 | $ | 384 | |||
Denominator | |||||||
Denominator for basic earnings per common share - weighted average shares outstanding | 17,826 | 18,108 | |||||
Effect of dilutive securities: | |||||||
Stock options | 175 | 149 | |||||
Convertible junior subordinated debentures | 4,392 | — | |||||
Denominator for diluted earnings per common share - weighted average shares outstanding | 22,393 | 18,257 | |||||
Basic earnings per common share: | |||||||
Continuing operations | $ | 0.83 | $ | 0.84 | |||
Discontinued operations | 0.23 | 0.02 | |||||
Basic earnings per common share | $ | 1.06 | $ | 0.86 | |||
Diluted earnings per common share: | |||||||
Continuing operations | $ | 0.82 | $ | 0.83 | |||
Discontinued operations | 0.18 | 0.02 | |||||
Diluted earnings per common share | $ | 1.00 | $ | 0.85 | |||
NON-GAAP FINANCIAL MEASURES
This press release uses Non-GAAP financial measures to present the financial performance of the Company. Non-GAAP financial measures should be viewed in addition to, and not as an alternative for, the Company’s reported operating results or cash flow from operations or any other measure of performance as determined in accordance with GAAP. We believe the Non-GAAP results are useful to investors because such results help investors compare our results to previous periods and provide insights into underlying trends in our business. The Company’s GAAP financial statements accompany this release. Reconciliations of the Non-GAAP financial measures to GAAP measures are provided in this press release.
The Non-GAAP financial measures include “Adjusted Net Income”, “Adjusted Basic Earnings Per Share”, “Adjusted Diluted Earnings Per Share”, “Consolidated EBITDA”, “Adjusted Consolidated EBITDA”, “Adjusted Free Cash Flow”, “Funeral, Cemetery and Financial EBITDA”, “Total Field EBITDA” and “Special Items” in this press release. These financial measurements are defined as similar GAAP items adjusted for Special Items and are reconciled to GAAP in this press release. In addition, the Company’s presentation of these measures may not be comparable to similarly titled measures in other companies’ reports. The definitions used by the Company for our internal management purposes and in this press release are as follows:
• | Adjusted Net Income is defined as net income from continuing operations plus adjustments for special items and other non-recurring expenses or credits. |
• | Consolidated EBITDA is defined as net income from continuing operations before income taxes, interest expenses, non-cash stock compensation, depreciation and amortization, and interest income and other, net. |
• | Adjusted Consolidated EBITDA is defined as Consolidated EBITDA plus adjustments for special items and non-recurring expenses or credits. |
• | Adjusted Free Cash Flow is defined as net cash provided by operations, adjusted by special items as deemed necessary, less cash for maintenance capital expenditures. |
• | Funeral Field EBITDA is defined as Funeral Gross Profit less depreciation and amortization, regional and unallocated overhead expenses and net financial income. |
• | Cemetery Field EBITDA is defined as Cemetery Gross Profit less depreciation and amortization, regional and unallocated overhead expenses and net financial income. |
• | Financial EBITDA is defined as Financial Revenue less Financial Expenses. |
• | Total Field EBITDA is defined as Gross Profit less depreciation and amortization, regional and unallocated overhead expenses. |
• | Special Items is defined as charges or credits that are deemed as Non-GAAP items such as withdrawable trust income, acquisition and divestiture expenses, severance costs, loss on early retirement of debt and other costs, discrete tax items and other non-recurring amounts. Special items are taxed at the federal statutory rate of 34 percent for the three and twelve months ended December 31, 2013 and 2014, except for the accretion of the discount on Convertible Notes as this is a non-tax deductible item and the tax adjustment from prior period. |
• | Adjusted Basic Earnings Per Share is defined as GAAP Basic Earnings Per Share, adjusted for special items. |
• | Adjusted Diluted Earnings Per Share is defined as GAAP Diluted Earnings Per Share, adjusted for special items. |
Certain state regulations allow the withdrawal of financial income from preneed cemetery merchandise and services trust funds when realized in the trust. Under current generally accepted accounting principles, trust income is only recognized in the Company’s financial statements at a later time when the related merchandise and services sold on the preneed contract is delivered at the time of death. Carriage has provided financial income from the trusts, termed “Withdrawable Trust Income” and reported on a Non-GAAP proforma basis within Special Items in the accompanying Operating and Financial Trend Report (a Non-GAAP Unaudited Income Statement), to reflect
the current cash results. Management believes that the Withdrawable Trust Income provides useful information to investors because it presents income and cash flow when earned by the trusts.
Reconciliation of Non-GAAP Financial Measures:
This press release includes the use of certain financial measures that are not GAAP measures. The Non-GAAP financial measures are presented for additional information and are reconciled to their most comparable GAAP measures below.
Reconciliation of Net Income from continuing operations to Adjusted Net Income for the three and twelve months ended December 31, 2013 and 2014 (in thousands):
Three Months Ended December 31, | Twelve Months Ended December 31, | ||||||||||||||
2013 | 2014 | 2013 | 2014 | ||||||||||||
Net Income from continuing operations | $ | 4,232 | $ | 5,367 | $ | 15,120 | $ | 15,446 | |||||||
Special items, net of tax except for ** | |||||||||||||||
Withdrawable Trust Income | 281 | 198 | 960 | 1,181 | |||||||||||
Acquisition and Divestiture Expenses | 246 | 49 | 496 | 764 | |||||||||||
Severance Costs | 105 | 101 | 965 | 697 | |||||||||||
Consulting Fees | 90 | 41 | 368 | 277 | |||||||||||
Other Incentive Compensation | — | — | — | 660 | |||||||||||
Securities Transaction Expenses | — | — | 160 | — | |||||||||||
Accretion of Discount on Convertible Subordinated Notes ** | — | 805 | — | 2,452 | |||||||||||
Costs Related to the Credit Facility | — | — | 248 | 688 | |||||||||||
Loss on Redemption of Convertible Junior Subordinated Debentures | — | — | — | 2,493 | |||||||||||
Loss (gain) on Asset Purchase | — | 379 | — | (367 | ) | ||||||||||
Other Special Items | — | — | (484 | ) | 503 | ||||||||||
Tax Adjustment from Prior Period ** | (338 | ) | — | 260 | — | ||||||||||
Total Special items affecting net income | $ | 384 | $ | 1,573 | $ | 2,973 | $ | 9,348 | |||||||
Adjusted Net Income | $ | 4,616 | $ | 6,940 | $ | 18,093 | $ | 24,794 | |||||||
Reconciliation of Net Income from continuing operations to Consolidated EBITDA and Adjusted Consolidated EBITDA for the three and twelve months ended December 31, 2013 and 2014 (in thousands):
Three Months Ended December 31, | Twelve Months Ended December 31, | ||||||||||||||
2013 | 2014 | 2013 | 2014 | ||||||||||||
Net income from continuing operations | $ | 4,232 | $ | 5,367 | $ | 15,120 | $ | 15,446 | |||||||
Net provision for income taxes | 1,519 | 3,079 | 9,245 | 7,255 | |||||||||||
Pre-tax earnings from continuing operations | $ | 5,751 | $ | 8,446 | $ | 24,365 | $ | 22,701 | |||||||
Interest expense | 3,066 | 2,593 | 13,437 | 10,308 | |||||||||||
Accretion of discount on convertible subordinated notes | — | 805 | — | 2,452 | |||||||||||
Loss on early extinguishment of debt and other costs | — | — | — | 1,042 | |||||||||||
Loss on redemption of convertible junior subordinated debentures | — | — | — | 3,779 | |||||||||||
Non-cash stock compensation | 617 | 920 | 2,916 | 3,832 | |||||||||||
Depreciation & amortization | 2,823 | 3,142 | 11,635 | 11,923 | |||||||||||
Other, net | — | 571 | (896 | ) | 195 | ||||||||||
Consolidated EBITDA | $ | 12,257 | $ | 16,477 | $ | 51,457 | $ | 56,232 | |||||||
Adjusted For: | |||||||||||||||
Withdrawable Trust Income | $ | 426 | $ | 300 | $ | 1,454 | $ | 1,788 | |||||||
Acquisition and Divestiture Expenses | 372 | 74 | 752 | 1,158 | |||||||||||
Severance Costs | 158 | 153 | 1,462 | 1,056 | |||||||||||
Consulting Fees | 136 | 62 | 557 | 419 | |||||||||||
Other Incentive Compensation | — | — | — | 1,000 | |||||||||||
Securities Transaction Expenses | — | — | 242 | — | |||||||||||
Other Special Items | — | — | 83 | — | |||||||||||
Adjusted Consolidated EBITDA | $ | 13,349 | $ | 17,066 | $ | 56,007 | $ | 61,653 | |||||||
Revenue | $ | 52,639 | $ | 59,419 | $ | 213,074 | $ | 226,124 | |||||||
Adjusted Consolidated EBITDA Margin | 25.4 | % | 28.7 | % | 26.3 | % | 27.3 | % | |||||||
Reconciliation of funeral and cemetery income before income taxes to Field EBITDA for the three and twelve months ended December 31, 2013 and 2014 (in thousands):
Funeral Field EBITDA | Three Months Ended December 31, | Twelve Months Ended December 31, | |||||||||||||
2013 | 2014 | 2013 | 2014 | ||||||||||||
Gross Profit (GAAP) | $ | 11,057 | $ | 14,537 | $ | 48,874 | $ | 54,102 | |||||||
Depreciation & amortization | 1,771 | 1,782 | 6,440 | 6,841 | |||||||||||
Regional & unallocated costs | 1,877 | 2,483 | 8,111 | 7,879 | |||||||||||
Net financial income | (1,958 | ) | (2,041 | ) | (7,966 | ) | (8,348 | ) | |||||||
Funeral Field EBITDA | $ | 12,747 | $ | 16,761 | $ | 55,459 | $ | 60,474 | |||||||
Funeral Field Operating Revenue | $ | 38,443 | $ | 43,460 | $ | 153,851 | $ | 164,252 | |||||||
Funeral Field EBITDA Margin | 33.2 | % | 38.6 | % | 36.0 | % | 36.8 | % | |||||||
Cemetery Field EBITDA | Three Months Ended December 31, | Twelve Months Ended December 31, | |||||||||||||
2013 | 2014 | 2013 | 2014 | ||||||||||||
Gross Profit (GAAP) | $ | 3,343 | $ | 4,390 | $ | 15,411 | $ | 15,906 | |||||||
Depreciation & amortization | 1,166 | 1,019 | 3,739 | 3,704 | |||||||||||
Regional & unallocated costs | 344 | 351 | 1,902 | 1,927 | |||||||||||
Net financial income | (2,179 | ) | (2,358 | ) | (9,338 | ) | (9,341 | ) | |||||||
Cemetery Field EBITDA | $ | 2,674 | $ | 3,402 | $ | 11,714 | $ | 12,196 | |||||||
Cemetery Field Operating Revenue | $ | 9,761 | $ | 11,189 | $ | 40,479 | $ | 42,856 | |||||||
Cemetery Field EBITDA Margin | 27.4 | % | 30.4 | % | 28.9 | % | 28.5 | % | |||||||
Total Field EBITDA | Three Months Ended December 31, | Twelve Months Ended December 31, | |||||||||||||
2013 | 2014 | 2013 | 2014 | ||||||||||||
Funeral Field EBITDA | $ | 12,747 | $ | 16,761 | $ | 55,459 | $ | 60,474 | |||||||
Cemetery Field EBITDA | 2,674 | 3,402 | 11,714 | 12,196 | |||||||||||
Funeral Financial EBITDA | 1,958 | 2,041 | 7,966 | 8,348 | |||||||||||
Cemetery Financial EBITDA | 2,179 | 2,358 | 9,338 | 9,341 | |||||||||||
Total Field EBITDA | $ | 19,558 | $ | 24,562 | $ | 84,477 | $ | 90,359 | |||||||
Reconciliation of cash provided by operating activities to Adjusted Free Cash Flow from operations for the three and twelve months ended December 31, 2013 and 2014 (in thousands):
Three Months Ended December 31, | Twelve Months Ended December 31, | ||||||||||||||
2013 | 2014 | 2013 | 2014 | ||||||||||||
Cash flow provided by operations | $ | 8,629 | $ | 8,916 | $ | 39,845 | $ | 36,565 | |||||||
Adjustment for tax benefit from Good to Great stock awards | — | — | — | 4,802 | |||||||||||
Cash used for maintenance capital expenditures | (1,888 | ) | (1,904 | ) | (6,615 | ) | (7,211 | ) | |||||||
Adjusted Free Cash Flow | $ | 6,741 | $ | 7,012 | $ | 33,230 | $ | 34,156 | |||||||
Reconciliation of GAAP basic earnings per share to Adjusted basic earnings per share for the three and twelve months ended December 31, 2013 and 2014:
Three Months Ended December 31, | Twelve Months Ended December 31, | ||||||||||||||
2013 | 2014 | 2013 | 2014 | ||||||||||||
GAAP basic earnings per share from continuing operations | $ | 0.23 | $ | 0.29 | $ | 0.83 | $ | 0.84 | |||||||
Special items affecting net income | 0.02 | 0.09 | 0.17 | 0.51 | |||||||||||
Adjusted basic earnings per share | $ | 0.25 | $ | 0.38 | $ | 1.00 | $ | 1.35 | |||||||
Reconciliation of GAAP diluted earnings per share to Adjusted diluted earnings per share for the three and twelve months ended December 31, 2013 and 2014:
Three Months Ended December 31, | Twelve Months Ended December 31, | ||||||||||||||
2013 | 2014 | 2013 | 2014 | ||||||||||||
GAAP diluted earnings per share from continuing operations | $ | 0.23 | $ | 0.29 | $ | 0.82 | $ | 0.83 | |||||||
Special items affecting net income | 0.02 | 0.09 | 0.13 | 0.51 | |||||||||||
Dilution effect of convertible junior subordinated debentures | — | — | 0.03 | — | |||||||||||
Adjusted diluted earnings per share | $ | 0.25 | $ | 0.38 | $ | 0.98 | $ | 1.34 | |||||||
CAUTIONARY STATEMENT ON FORWARD-LOOKING STATEMENTS
Certain statements made herein or elsewhere by, or on behalf of, the Company that are not historical facts are intended to be forward-looking statements within the meaning of Section 27A of the Securities Act of 1933, as amended, and Section 21E of the Securities Exchange Act of 1934, as amended. In addition to historical information, this Press Release contains certain statements and information that may constitute forward-looking statements within the safe harbor provisions of the Private Securities Litigation Reform Act of 1995. These statements include statements regarding the consummation of the SCI acquisition, any projections of earnings, revenues, asset sales, cash flow, debt levels or other financial items; any statements of the plans, strategies and objectives of management for future operations; any statements regarding future economic conditions or performance; any statements of belief; and any statements of assumptions underlying any of the foregoing and are based on our current expectations and beliefs concerning future developments and their potential effect on us. The words “may”, “will”, “estimate”, “intend”, “believe”, “expect”, “project”, “forecast”, “foresee”, “should”, “would”, “could”, “plan”, “anticipate” and other similar words or expressions are intended to identify forward-looking statements, which are generally not historical in nature. While management believes that these forward-looking statements are reasonable as and when made, there can be no assurance that future developments affecting us will be those that we anticipate. All comments concerning our expectations for future revenues and operating results are based on our forecasts for our existing operations and do not include the potential impact of any future acquisitions. Our forward-looking statements involve significant risks and uncertainties (some of which are beyond our control) and assumptions that could cause actual results to differ materially from our historical experience and our present expectations or projections. Important factors that could cause actual results to differ materially from those in the forward-looking statements include, but are not limited to, those summarized below:
• | the execution of our Standards Operating Model; |
• | changes in the number of deaths in our markets; |
• | changes in consumer preferences; |
• | ability to find and retain skilled personnel; |
• | the effects of competition; |
• | the investment performance of our funeral and cemetery trust funds; |
• | fluctuations in interest rates; |
• | our ability to obtain debt or equity financing on satisfactory terms to fund additional acquisitions, expansion projects, working capital requirements and the repayment or refinancing of indebtedness; |
• | death benefits related to preneed funeral contracts funded through life insurance contracts; |
• | our ability to generate preneed sales; |
• | the financial condition of third-party insurance companies that fund our preneed funeral contracts; |
• | increased or unanticipated costs, such as insurance or taxes; |
• | effects of the application of applicable laws and regulations, including changes in such regulations or the interpretation thereof; |
• | consolidation of the deathcare industry; and |
• | other factors and uncertainties inherent in the deathcare industry. |
For additional information regarding known material factors that could cause our actual results to differ from our projected results, please see “Risk Factors” in our most recent Annual Report on Form 10-K. Readers are cautioned not to place undue reliance on forward-looking statements, which speak only as of the date hereof. We undertake no obligation to publicly update or revise any forward-looking statements after the date they are made, whether as a result of new information, future events or otherwise. A copy of the Company’s Form 10-K, other Carriage Services information and news releases are available at www.carriageservices.com.
This press release includes the use of certain financial measures that are not GAAP measures. The Non-GAAP financial measures are presented for additional information and are reconciled to their most comparable GAAP measures in the tables presented above.
FIVE YEAR OPERATING AND FINANCIAL TREND REPORT | |||||||||||||||
(IN THOUSANDS - EXCEPT PER SHARE AMOUNTS) | |||||||||||||||
2010 | 2011 | 2012 | 2013 | 2014 | |||||||||||
Same Store Contracts | |||||||||||||||
Atneed Contracts | 18,505 | 17,975 | 17,934 | 18,149 | 18,133 | ||||||||||
Preneed Contracts | 4,784 | 5,066 | 4,779 | 4,908 | 4,641 | ||||||||||
Total Same Store Funeral Contracts | 23,289 | 23,041 | 22,713 | 23,057 | 22,774 | ||||||||||
Acquisition Contracts | |||||||||||||||
Atneed Contracts | 961 | 2,742 | 4,436 | 5,689 | 7,260 | ||||||||||
Preneed Contracts | 153 | 462 | 715 | 1,108 | 1,368 | ||||||||||
Total Acquisition Funeral Contracts | 1,114 | 3,204 | 5,151 | 6,797 | 8,628 | ||||||||||
Total Funeral Contracts | 24,403 | 26,245 | 27,864 | 29,854 | 31,402 | ||||||||||
Funeral Operating Revenue | |||||||||||||||
Same Store Revenue | $ | 120,882 | $ | 120,139 | $ | 119,891 | $ | 120,191 | $ | 119,322 | |||||
Acquisition Revenue | 3,282 | 11,720 | 23,317 | 33,660 | 44,930 | ||||||||||
Total Funeral Operating Revenue | $ | 124,164 | $ | 131,859 | $ | 143,208 | $ | 153,851 | $ | 164,252 | |||||
Cemetery Operating Revenue | |||||||||||||||
Same Store Revenue | $ | 37,797 | $ | 36,481 | $ | 38,113 | $ | 40,181 | $ | 41,257 | |||||
Acquisition Revenue | — | — | 166 | 298 | 1,599 | ||||||||||
Total Cemetery Operating Revenue | $ | 37,797 | $ | 36,481 | $ | 38,279 | $ | 40,479 | $ | 42,856 | |||||
Financial Revenue | |||||||||||||||
Preneed Funeral Commission Income | $ | 2,265 | $ | 1,811 | $ | 1,711 | $ | 1,853 | $ | 2,036 | |||||
Preneed Funeral Trust Earnings | 5,880 | 6,241 | 5,884 | 7,378 | 7,447 | ||||||||||
Cemetery Trust Earnings | 4,507 | 4,627 | 7,647 | 8,095 | 8,123 | ||||||||||
Preneed Cemetery Finance Charges | 1,479 | 1,294 | 1,462 | 1,418 | 1,410 | ||||||||||
Total Financial Revenue | $ | 14,131 | $ | 13,973 | $ | 16,704 | $ | 18,744 | $ | 19,016 | |||||
Total Revenue | $ | 176,092 | $ | 182,313 | $ | 198,191 | $ | 213,074 | $ | 226,124 | |||||
Field EBITDA | |||||||||||||||
Same Store Funeral Field EBITDA | $ | 39,776 | $ | 42,963 | $ | 45,968 | $ | 44,973 | $ | 44,756 | |||||
Same Store Funeral Field EBITDA Margin | 32.9 | % | 35.8 | % | 38.3 | % | 37.4 | % | 37.5 | % | |||||
Acquisition Funeral Field EBITDA | 388 | 3,130 | 7,585 | 10,486 | 15,718 | ||||||||||
Acquisition Funeral Field EBITDA Margin | 11.8 | % | 26.7 | % | 32.5 | % | 31.2 | % | 35.0 | % | |||||
Total Funeral Field EBITDA | $ | 40,164 | $ | 46,093 | $ | 53,553 | $ | 55,459 | $ | 60,474 | |||||
Total Funeral Field EBITDA Margin | 32.3 | % | 35.0 | % | 37.4 | % | 36.0 | % | 36.8 | % | |||||
Same Store Cemetery Field EBITDA | $ | 8,938 | $ | 9,370 | $ | 9,897 | $ | 11,757 | $ | 11,845 | |||||
Same Store Cemetery Field EBITDA Margin | 23.6 | % | 25.7 | % | 26.0 | % | 29.3 | % | 28.7 | % | |||||
Acquisition Cemetery Field EBITDA | — | — | (76 | ) | (43 | ) | 351 | ||||||||
Acquisition Cemetery Field EBITDA Margin | — | % | — | % | -45.8 | % | -14.4 | % | 22.0 | % | |||||
Total Cemetery Field EBITDA | $ | 8,938 | $ | 9,370 | $ | 9,821 | $ | 11,714 | $ | 12,196 | |||||
Total Cemetery Field EBITDA Margin | 23.6 | % | 25.7 | % | 25.7 | % | 28.9 | % | 28.5 | % | |||||
Funeral Financial EBITDA | $ | 6,778 | $ | 6,681 | $ | 6,195 | $ | 7,966 | $ | 8,348 | |||||
Cemetery Financial EBITDA | 5,986 | 5,921 | 9,060 | 9,338 | 9,341 | ||||||||||
Total Financial EBITDA | $ | 12,764 | $ | 12,602 | $ | 15,255 | $ | 17,304 | $ | 17,689 | |||||
Total Financial EBITDA Margin | 90.3 | % | 90.2 | % | 91.3 | % | 92.3 | % | 93.0 | % | |||||
Total Field EBITDA | $ | 61,866 | $ | 68,065 | $ | 78,629 | $ | 84,477 | $ | 90,359 | |||||
Total Field EBITDA Margin | 35.1 | % | 37.3 | % | 39.7 | % | 39.6 | % | 40.0 | % | |||||
Overhead | |||||||||||||||
Total Variable Overhead | $ | 3,555 | $ | 9,422 | $ | 9,623 | $ | 8,845 | $ | 10,764 | |||||
Total Regional Fixed Overhead | 2,868 | 3,028 | 2,581 | 3,346 | 3,136 | ||||||||||
Total Corporate Fixed Overhead | 14,794 | 16,436 | 18,068 | 20,829 | 20,227 | ||||||||||
Total Overhead | $ | 21,217 | $ | 28,886 | $ | 30,272 | $ | 33,020 | $ | 34,127 | |||||
Overhead as a percent of sales | 12.0 | % | 15.8 | % | 15.3 | % | 15.5 | % | 15.1 | % | |||||
Consolidated EBITDA | $ | 40,649 | $ | 39,179 | $ | 48,357 | $ | 51,457 | $ | 56,232 | |||||
Consolidated EBITDA Margin | 23.1 | % | 21.5 | % | 24.4 | % | 24.1 | % | 24.9 | % | |||||
FIVE YEAR OPERATING AND FINANCIAL TREND REPORT | |||||||||||||||
(IN THOUSANDS - EXCEPT PER SHARE AMOUNTS) | |||||||||||||||
2010 | 2011 | 2012 | 2013 | 2014 | |||||||||||
Other Expenses and Interest | |||||||||||||||
Property Depreciation & Amortization | $ | 9,819 | $ | 9,450 | $ | 9,916 | $ | 11,635 | $ | 11,923 | |||||
Non Cash Stock Compensation | 1,722 | 1,870 | 2,174 | 2,916 | 3,832 | ||||||||||
Interest Expense | 18,246 | 18,089 | 17,088 | 13,437 | 10,308 | ||||||||||
Accretion of Discount on Convertible Subordinated Notes | — | — | — | — | 2,452 | ||||||||||
Loss on Extinguishment of Debt and Other Costs | — | 201 | 3,031 | — | 1,042 | ||||||||||
Loss on Redemption of Convertible Jr Subordinated Debentures | — | — | — | — | 3,779 | ||||||||||
Other, Net | (1,068 | ) | (898 | ) | (963 | ) | (896 | ) | 195 | ||||||
Pretax Income | $ | 11,930 | $ | 10,467 | $ | 17,111 | $ | 24,365 | $ | 22,701 | |||||
Tax Provision | 4,760 | 4,448 | 6,794 | 9,245 | 8,995 | ||||||||||
Tax Benefit Related to Uncertain Tax Positions | — | — | — | — | (1,740 | ) | |||||||||
Net Tax Provision | $ | 4,760 | $ | 4,448 | $ | 6,794 | $ | 9,245 | $ | 7,255 | |||||
GAAP Net Income | $ | 7,170 | $ | 6,019 | $ | 10,317 | $ | 15,120 | $ | 15,446 | |||||
Effective Tax Rate | 39.9% | 42.5% | 39.7% | 37.9% | 32.0% | ||||||||||
Special Items, Net of tax except for ** | |||||||||||||||
Withdrawable Trust Income | $ | 2,269 | $ | 2,979 | $ | 1,265 | $ | 960 | $ | 1,181 | |||||
Acquisition and Divestiture Expenses | 440 | 816 | 884 | 496 | 764 | ||||||||||
Severance Costs | 156 | 1,278 | 529 | 965 | 697 | ||||||||||
Consulting Fees | — | — | — | 368 | 277 | ||||||||||
Litigation Settlements and Other Related Costs | (450 | ) | — | (465 | ) | — | — | ||||||||
Other Incentive Compensation | — | — | — | — | 660 | ||||||||||
Securities Transaction Expenses | — | 333 | — | 160 | — | ||||||||||
Accretion of Discount on Convertible Subordinated Notes ** | — | — | — | — | 2,452 | ||||||||||
Costs Related to Credit Facility | — | 133 | 2,000 | 248 | 688 | ||||||||||
Gain on Redemption of Convertible Jr Subordinated Debentures | (209 | ) | (558 | ) | — | — | — | ||||||||
Loss on Redemption of Convertible Jr Subordinated Debentures | — | — | — | — | 2,493 | ||||||||||
(Gain)/Loss on Asset Purchase/Sale | — | — | — | — | (367 | ) | |||||||||
Net Gain on Disposal of Assets | (337 | ) | — | — | — | — | |||||||||
Other Special Items | — | 795 | — | (484 | ) | 503 | |||||||||
Tax Adjustment from Prior Period ** | — | — | — | 260 | — | ||||||||||
Sum of Special Items, Net of tax | $ | 1,869 | $ | 5,776 | $ | 4,213 | $ | 2,973 | $ | 9,348 | |||||
Adjusted Net Income | $ | 9,039 | $ | 11,795 | $ | 14,530 | $ | 18,093 | $ | 24,794 | |||||
Adjusted Net Profit Margin | 5.1 | % | 6.5 | % | 7.3 | % | 8.5 | % | 11.0 | % | |||||
Adjusted Basic Earnings Per Share | $ | 0.51 | $ | 0.64 | $ | 0.80 | $ | 1.00 | $ | 1.35 | |||||
Adjusted Diluted Earnings Per Share | $ | 0.50 | $ | 0.64 | $ | 0.80 | $ | 0.98 | $ | 1.34 | |||||
GAAP Basic Earnings Per Share | $ | 0.41 | $ | 0.33 | $ | 0.57 | $ | 0.83 | $ | 0.84 | |||||
GAAP Diluted Earnings Per Share | $ | 0.40 | $ | 0.33 | $ | 0.57 | $ | 0.82 | $ | 0.83 | |||||
Average Number of Basic Shares Outstanding | 17,635 | 18,359 | 18,126 | 17,826 | 18,108 | ||||||||||
Average Number of Diluted Shares Outstanding | 17,938 | 18,397 | 18,226 | 22,393 | 18,257 | ||||||||||
Reconciliation to Adjusted Consolidated EBITDA | |||||||||||||||
Consolidated EBITDA | $ | 40,649 | $ | 39,179 | $ | 48,357 | $ | 51,457 | $ | 56,232 | |||||
Withdrawable Trust Income | 3,438 | 4,513 | 1,916 | 1,454 | 1,788 | ||||||||||
Acquisition and Divestiture Expenses | 667 | 1,237 | 1,340 | 752 | 1,158 | ||||||||||
Severance Costs | 237 | 1,936 | 802 | 1,462 | 1,056 | ||||||||||
Consulting Fees | — | — | — | 557 | 419 | ||||||||||
Litigation Settlements and Other Related Costs | (682 | ) | — | 195 | — | — | |||||||||
Other Incentive Compensation | — | — | — | — | 1,000 | ||||||||||
Securities Transaction Expenses | — | 504 | — | 242 | — | ||||||||||
Other Special Items | — | 1,205 | — | 83 | — | ||||||||||
Adjusted Consolidated EBITDA | $ | 44,309 | $ | 48,574 | $ | 52,610 | $ | 56,007 | $ | 61,653 | |||||
Adjusted Consolidated EBITDA Margin | 25.2 | % | 26.6 | % | 26.5 | % | 26.3 | % | 27.3 | % | |||||
FIVE QUARTER OPERATING AND FINANCIAL TREND REPORT | |||||||||||||||
(IN THOUSANDS - EXCEPT PER SHARE AMOUNTS) | |||||||||||||||
QTR 4 | QTR 1 | QTR 2 | QTR 3 | QTR 4 | |||||||||||
2013 | 2014 | 2014 | 2014 | 2014 | |||||||||||
Same Store Contracts | |||||||||||||||
Atneed Contracts | 4,400 | 4,795 | 4,428 | 4,332 | 4,578 | ||||||||||
Preneed Contracts | 1,188 | 1,217 | 1,136 | 1,095 | 1,193 | ||||||||||
Total Same Store Funeral Contracts | 5,588 | 6,012 | 5,564 | 5,427 | 5,771 | ||||||||||
Acquisition Contracts | |||||||||||||||
Atneed Contracts | 1,513 | 1,659 | 1,712 | 1,810 | 2,079 | ||||||||||
Preneed Contracts | 280 | 304 | 321 | 356 | 387 | ||||||||||
Total Acquisition Funeral Contracts | 1,793 | 1,963 | 2,033 | 2,166 | 2,466 | ||||||||||
Total Funeral Contracts | 7,381 | 7,975 | 7,597 | 7,593 | 8,237 | ||||||||||
Funeral Operating Revenue | |||||||||||||||
Same Store Revenue | $ | 29,563 | $ | 31,306 | $ | 29,163 | $ | 28,234 | $ | 30,619 | |||||
Acquisition Revenue | 8,880 | 10,178 | 10,657 | 11,254 | 12,841 | ||||||||||
Total Funeral Operating Revenue | $ | 38,443 | $ | 41,484 | $ | 39,820 | $ | 39,488 | $ | 43,460 | |||||
Cemetery Operating Revenue | |||||||||||||||
Same Store Revenue | $ | 9,695 | $ | 9,712 | $ | 11,382 | $ | 9,539 | $ | 10,624 | |||||
Acquisition Revenue | 66 | 55 | 334 | 645 | 565 | ||||||||||
Total Cemetery Operating Revenue | $ | 9,761 | $ | 9,767 | $ | 11,716 | $ | 10,184 | $ | 11,189 | |||||
Financial Revenue | |||||||||||||||
Preneed Funeral Commission Income | $ | 418 | $ | 564 | $ | 563 | $ | 509 | $ | 400 | |||||
Preneed Funeral Trust Earnings | 1,794 | 1,916 | 1,809 | 1,773 | 1,949 | ||||||||||
Cemetery Trust Earnings | 1,875 | 1,584 | 2,276 | 2,212 | 2,051 | ||||||||||
Preneed Cemetery Finance Charges | 348 | 337 | 320 | 383 | 370 | ||||||||||
Total Financial Revenue | $ | 4,435 | $ | 4,401 | $ | 4,968 | $ | 4,877 | $ | 4,770 | |||||
Total Revenue | $ | 52,639 | $ | 55,652 | $ | 56,504 | $ | 54,549 | $ | 59,419 | |||||
Field EBITDA | |||||||||||||||
Same Store Funeral Field EBITDA | $ | 10,004 | $ | 12,083 | $ | 10,388 | $ | 10,235 | $ | 12,050 | |||||
Same Store Funeral Field EBITDA Margin | 33.8 | % | 38.6 | % | 35.6 | % | 36.3 | % | 39.4 | % | |||||
Acquisition Funeral Field EBITDA | 2,743 | 3,772 | 3,632 | 3,603 | 4,711 | ||||||||||
Acquisition Funeral Field EBITDA Margin | 30.9 | % | 37.1 | % | 34.1 | % | 32.0 | % | 36.7 | % | |||||
Total Funeral Field EBITDA | $ | 12,747 | $ | 15,855 | $ | 14,020 | $ | 13,838 | $ | 16,761 | |||||
Total Funeral Field EBITDA Margin | 33.2 | % | 38.2 | % | 35.2 | % | 35.0 | % | 38.6 | % | |||||
Same Store Cemetery Field EBITDA | $ | 2,684 | $ | 2,839 | $ | 3,568 | $ | 2,148 | $ | 3,290 | |||||
Same Store Cemetery Field EBITDA Margin | 27.7 | % | 29.2 | % | 31.3 | % | 22.5 | % | 31.0 | % | |||||
Acquisition Cemetery Field EBITDA | (10 | ) | (9 | ) | 134 | 114 | 112 | ||||||||
Acquisition Cemetery Field EBITDA Margin | -15.2 | % | -16.4 | % | 40.1 | % | 17.7 | % | 19.8 | % | |||||
Total Cemetery Field EBITDA | $ | 2,674 | $ | 2,830 | $ | 3,702 | $ | 2,262 | $ | 3,402 | |||||
Total Cemetery Field EBITDA Margin | 27.4 | % | 29.0 | % | 31.6 | % | 22.2 | % | 30.4 | % | |||||
Funeral Financial EBITDA | $ | 1,958 | $ | 2,226 | $ | 2,079 | $ | 2,002 | $ | 2,041 | |||||
Cemetery Financial EBITDA | 2,179 | 1,898 | 2,556 | 2,529 | 2,358 | ||||||||||
Total Financial EBITDA | $ | 4,137 | $ | 4,124 | $ | 4,635 | $ | 4,531 | $ | 4,399 | |||||
Total Financial EBITDA Margin | 93.3 | % | 93.7 | % | 93.3 | % | 92.9 | % | 92.2 | % | |||||
Total Field EBITDA | $ | 19,558 | $ | 22,809 | $ | 22,357 | $ | 20,631 | $ | 24,562 | |||||
Total Field EBITDA Margin | 37.2 | % | 41.0 | % | 39.6 | % | 37.8 | % | 41.3 | % | |||||
Overhead | |||||||||||||||
Total Variable Overhead | $ | 1,944 | $ | 3,863 | $ | 1,411 | $ | 3,065 | $ | 2,425 | |||||
Total Regional Fixed Overhead | 538 | 786 | 781 | 811 | 758 | ||||||||||
Total Corporate Fixed Overhead | 4,819 | 5,574 | 5,085 | 4,666 | 4,902 | ||||||||||
Total Overhead | $ | 7,301 | $ | 10,223 | $ | 7,277 | $ | 8,542 | $ | 8,085 | |||||
Overhead as a percent of sales | 13.9 | % | 18.4 | % | 12.9 | % | 15.7 | % | 13.6 | % | |||||
Consolidated EBITDA | $ | 12,257 | $ | 12,586 | $ | 15,080 | $ | 12,089 | $ | 16,477 | |||||
Consolidated EBITDA Margin | 23.3 | % | 22.6 | % | 26.7 | % | 22.2 | % | 27.7 | % | |||||
FIVE QUARTER OPERATING AND FINANCIAL TREND REPORT | |||||||||||||||
(IN THOUSANDS - EXCEPT PER SHARE AMOUNTS) | |||||||||||||||
QTR 4 | QTR 1 | QTR 2 | QTR 3 | QTR 4 | |||||||||||
2013 | 2014 | 2014 | 2014 | 2014 | |||||||||||
Other Expenses and Interest | |||||||||||||||
Property Depreciation & Amortization | $ | 2,823 | $ | 2,757 | $ | 3,029 | $ | 2,995 | $ | 3,142 | |||||
Non Cash Stock Compensation | 617 | 729 | 1,263 | 920 | 920 | ||||||||||
Interest Expense | 3,066 | 2,844 | 2,691 | 2,180 | 2,593 | ||||||||||
Accretion of Discount on Convertible Subordinated Notes | — | 171 | 694 | 782 | 805 | ||||||||||
Loss on Extinguishment of Debt and Other Costs | — | — | 1,042 | — | — | ||||||||||
Loss on Redemption of Convertible Jr Subordinated Debentures | — | 3,779 | — | — | — | ||||||||||
Other, Net | — | (368 | ) | (5 | ) | (3 | ) | 571 | |||||||
Pretax Income | $ | 5,751 | $ | 2,674 | $ | 6,366 | $ | 5,215 | $ | 8,446 | |||||
Tax Provision | 1,519 | 1,043 | 2,483 | 2,390 | 3,079 | ||||||||||
Tax Benefit Related to Uncertain Tax Positions | — | — | — | (1,740 | ) | — | |||||||||
Net Tax Provision | $ | 1,519 | $ | 1,043 | $ | 2,483 | $ | 650 | $ | 3,079 | |||||
GAAP Net Income | $ | 4,232 | $ | 1,631 | $ | 3,883 | $ | 4,565 | $ | 5,367 | |||||
Effective Tax Rate | 26.4% | 39.0% | 39.0% | 12.5% | 36.5% | ||||||||||
Special Items, Net of tax except for ** | |||||||||||||||
Withdrawable Trust Income | $ | 281 | $ | 149 | $ | 366 | $ | 468 | $ | 198 | |||||
Acquisition and Divestiture Expenses | 246 | 491 | 168 | 56 | 49 | ||||||||||
Severance Costs | 105 | 209 | 268 | 119 | 101 | ||||||||||
Consulting Fees | 90 | 159 | 6 | 71 | 41 | ||||||||||
Other Incentive Compensation | — | 660 | — | — | — | ||||||||||
Accretion of Discount on Convertible Subordinated Notes ** | — | 171 | 694 | 782 | 805 | ||||||||||
Costs Related to Credit Facility | — | — | 688 | — | — | ||||||||||
Loss on Redemption of Convertible Jr Subordinated Debentures | — | 2,493 | — | — | — | ||||||||||
(Gain)/Loss on Asset Purchase/Sale | — | (746 | ) | — | — | 379 | |||||||||
Other Special Items | — | 503 | — | — | — | ||||||||||
Tax Adjustment from Prior Period ** | (338 | ) | — | — | — | — | |||||||||
Sum of Special Items, Net of tax | $ | 384 | $ | 4,089 | $ | 2,190 | $ | 1,496 | $ | 1,573 | |||||
Adjusted Net Income | $ | 4,616 | $ | 5,720 | $ | 6,073 | $ | 6,061 | $ | 6,940 | |||||
Adjusted Net Profit Margin | 8.8 | % | 10.3 | % | 10.7 | % | 11.1 | % | 11.7 | % | |||||
Adjusted Basic Earnings Per Share | $ | 0.25 | $ | 0.31 | $ | 0.33 | $ | 0.33 | $ | 0.38 | |||||
Adjusted Diluted Earnings Per Share | $ | 0.25 | $ | 0.31 | $ | 0.33 | $ | 0.32 | $ | 0.38 | |||||
GAAP Basic Earnings Per Share | $ | 0.23 | $ | 0.09 | $ | 0.21 | $ | 0.25 | $ | 0.29 | |||||
GAAP Diluted Earnings Per Share | $ | 0.23 | $ | 0.09 | $ | 0.21 | $ | 0.24 | $ | 0.29 | |||||
Average Number of Basic Shares Outstanding | 17,920 | 17,984 | 18,123 | 18,150 | 18,170 | ||||||||||
Average Number of Diluted Shares Outstanding | 22,488 | 18,143 | 18,247 | 18,276 | 18,358 | ||||||||||
Reconciliation to Adjusted Consolidated EBITDA | |||||||||||||||
Consolidated EBITDA | $ | 12,257 | $ | 12,586 | $ | 15,080 | $ | 12,089 | $ | 16,477 | |||||
Withdrawable Trust Income | 426 | 225 | 554 | 709 | 300 | ||||||||||
Acquisition and Divestiture Expenses | 372 | 744 | 255 | 85 | 74 | ||||||||||
Severance Costs | 158 | 317 | 406 | 180 | 153 | ||||||||||
Consulting Fees | 136 | 241 | 9 | 107 | 62 | ||||||||||
Other Incentive Compensation | — | 1,000 | — | — | — | ||||||||||
Securities Transaction Expenses | — | — | — | — | — | ||||||||||
Other Special Items | — | — | — | — | — | ||||||||||
Adjusted Consolidated EBITDA | $ | 13,349 | $ | 15,113 | $ | 16,304 | $ | 13,170 | $ | 17,066 | |||||
Adjusted Consolidated EBITDA Margin | 25.4 | % | 27.2 | % | 28.9 | % | 24.1 | % | 28.7 | % | |||||


Carriage Services 2012 - A NEW BEGINNING
No company in the history of our industry has created as innovative a framework for consolidating the deathcare industry by acquiring great local family businesses, and then supporting them effectively to make them even better. Our Vision over the next five years is to become home to the best remaining independents in the industry and a company where the best talent wants to spend a career.
Our Vision is dependent on your future operating and financial performance as we close out the 20th year since Carriage’s founding on June 1, 1991. Only with you and our other Managing Partners performing at a very high level of Standards Achievement beginning on January 1, 2012, will Carriage move from a Good to a Great company. And only when we sustain a great performance over the next five years will Carriage become a company that was BUILT TO LAST!
We are embarking on a Good To Great journey that is rare in the business world and has never been done in the funeral and cemetery industry. I am personally committed to leading this journey with like-minded leaders and employees until we complete our Mission of Being The Best. It is critical to our future destiny that each of you commit to do the same. It will not be easy, as there will be continuous challenges and difficult decisions, but it will be possible if you harness all of your 4E Leadership Skills and Energize your staff around this common Being The Best Vision for your business and for Carriage.
I leave you with this thought:
“Greatness is not a function of circumstance. Greatness, it turns out, is largely a matter of conscious choice.” Jim Collins, Author of Good to Great, 2001 and Co-Author of Built to Last, 1994.
I choose Greatness.
Mel
We recently asked all of our employees and leaders for their ideas on a Carriage theme for 2013, the second full year of our five year Good To Great journey. Our company theme for 2013 is proudly and boldly:
Carriage Services 2013 - Raising the Standard - ALL IN!!
We congratulate Alex Crider, our Sales Manager from Conejo Mountain Memorial Park, Camarillo, California, for his winning theme, which he explained in his submission as follows, “Has multiple connotations; could mean at location level or anywhere within the company. Also is a great reference to our “Standards” and ties well with our company’s trend of continued growth, i.e. to go from Good To Great you have to be committed to raising your current Standards”. Outstandingly and simply put, join me in thanking Alex for his creativity and the inspiring theme for this year. It was Paul Elliott’s idea to add “ALL IN“ to Alex’s theme, making it clear that each leader and employee with Carriage is important and responsible for pushing on our Good To Great flywheel.
Last year I challenged our entire organization by ending my letter with a quote from Jim Collins, author of Good To Great, which was:
“Greatness is not a function of circumstance. Greatness, it turns out, is largely a matter of conscious choice.”
It is obvious from our record 2012 operating performance that you and our Carriage employees (First Who, Then What), made a conscious choice at the end of 2011 to join me and our senior management team on the journey of a lifetime to take our company from a Good company in 2012 to one that is recognized as Great by the end of 2016. As a public company, the “market” during 2012 began to vote in favor of Carriage being a winning investment in the future, as our stock price increased 112% from $5.60 per share at year-end 2011 to $11.87 per share at year-end 2012. Already in the first two weeks of 2013, our stock price has increased another 10.2% to $13.08 per share at yesterday’s close.
If you or your employees were participants in our Employee Stock Purchase Plan at year-end 2011, then you were able to purchase Carriage stock via payroll deduction all during 2012 at $4.68 per share, which would have yielded a gain of $7.19 per share, or 151.9% by year-end 2012. As our Good To Great journey continues during 2013 and thereafter, I encourage you and your hard working employees to participate in this stock ownership program. The public market is finally waking up to the fact that Carriage is the best kept secret in the deathcare industry, so I expect our company valuation to continue to rise as our performance increases and we continue our strategic growth by acquisition of only the best remaining independents in our industry.
A truly Great company will have a high and sustainable performance over many years, resulting in a very high valuation compared to sector peers. I believe that after 16 years as a public company, Carriage began a long term breakout from our sector during 2012, thanks to your performance. While we will pause briefly to celebrate and recognize many of you for your outstanding performance in 2012, the journey ahead is long and challenging, which is what makes it so special and meaningful to each of us individually and as a team. I am honored and personally humbled to be your leader.
So please join me as we make 2013 another huge leap toward Carriage becoming a Great company with the theme . . . Carriage Services 2013 - Raising the Standard - ALL IN!!
Mel

We previously announced on March 5, 2014 our Good To Great Journey annual theme for 2014:
Carriage Services 2014: Being The Best - One Team, One Vision!
When we first launched our five year Good To Great Journey in 2012 with Carriage Services 2012 - A NEW BEGINNING!, I said that the journey would be long and we would each be faced with continuous challenges and difficult decisions. That is a profoundly true statement today as we all gather in Houston for our Annual Managing Partners Meeting.
Although we continue to have many Managing Partner performance heroes within our portfolio of businesses, our field funeral and cemetery operating and financial performance in total has trended down beginning in the second half of 2013 and continuing through the first four months of 2014 into May. While some of this recent relatively weaker performance can be attributed to lower death rates and therefore weaker funeral contract and cemetery interment volumes, over which we have little short term control, much of the weaker performance is a direct result of less revenue flowing through our portfolio of businesses because of declining funeral cremation revenue averages and weak preneed property sales in too many of our larger cemeteries. We will therefore focus heavily during the Managing Partners Meeting on rising to the challenge of higher revenue in these two areas for the balance of 2014 and thereafter.
Our Annual Report cover for 2013 was themed Good To Great and is dedicated to the many high performance heroes in our portfolio of funeral and cemetery businesses across the country. It is now time to take our Good To Great Journey to a higher level of sustainable operating and financial performance through strong 4E Leadership applied to every position in our company, especially our funeral arrangers and sales counselors. The high performance concept of FIRST WHO, THEN WHAT means making difficult and necessary decisions about our people either being the Right Who or the Wrong Who if we are to adequately address the difficult revenue challenges we face. Only by facing the “brutal facts” will we live up to the bold statement about the bright future for our company and the importance of our dedication to a Being The Best Vision.
As always, I leave you with this thought:
“Greatness is not a function of circumstance. Greatness, it turns out, is largely a matter of conscious choice.”1
Once again, I choose Greatness - - - because I want to be on the Good To Great Journey with you!!
Mel
1Jim Collins, Author of Good to Great, 2001 and Co-Author of Built to Last, 1994.

Carriage Services 2015: High Performance through Passion and Partnership!
Over the last twelve years it became increasingly evident that 4E Leadership characteristics in a Managing Partner were required to then achieve Right Quality of Staff and Continuous Upgrading of Staff. We began to think of each business as a Good To Great Bus within the framework of Carriage as a Good To Great Consolidation and Operational Support Company Bus. Over time we had to get the Right People on each bus, the Wrong People off each bus, and the Right People in the Right Seats on each bus BEFORE we could determine whether each bus and Carriage as a company could be driven somewhere Great through High and Sustainable Performance as defined by our Being The Best Funeral Standards. We now use the short version of this Good To Great concept with the phrase “First Who, Then What”. Again, these high performance ideas and concepts align perfectly with all five of our Guiding Principles.
If Carriage is to successfully meet the challenge of high and sustainable funeral revenue and profit performance through high and sustainable Being The Best Funeral Standards Achievement, it will be because we and you focus relentlessly and effectively on improving the quality and skills of our funeral arrangers over time. We now serve 14,860 cremation families compared to 14,068 burial families and the ARPC difference is $5,355 ($8,493 burial versus $3,138 cremation), meaning the “trend is not our friend” and we are becoming more “commoditized” like the industry at large, which is not consistent with our view of funeral service as a “high value personal service business” or with our Five Guiding Principles. The only way to close the $5,355 gap is through higher quality people with the right attitudes and skills driven by 4E Leader Managing Partners supported by 4E Leader Directors of Support and 4E Leader Houston Support Teams.
Since 75% of our revenue derives from funeral operations, how we deal with the cremation revenue and service challenge and trend is likely to be our greatest opportunity to define the Carriage Good To Great status and recognition. And because revenue growth from existing operations is critical so as not to rely only upon new acquisitions, how each 4E Leader Managing Partner and 4E Team of High Performance Employees meet this cremation revenue and service challenge will hugely impact the future Carriage valuation and become a wonderful opportunity for achieving our goal of being a Built To Last Carriage.
When we launched the Five Year Carriage Good To Great Journey at the end of 2011 starting with the annual theme of Carriage Services 2012: A NEW BEGINNING!, I stated that we were embarking on a journey so rare in any business or industry that we each would look back at some point and find amazing joy and meaning individually and as teams in achieving what we could not have dreamed was possible. However, as the cremation revenue challenge and cemetery burial trends make clear, we never said it would be anything but challenging and difficult. If this were easy, then anyone could do it and the journey of learning, continuous improvement and collaboration with others that are like-minded toward Being The Best would have no meaning at all.
I have total confidence in each of you, as we have never had our company so populated with 4E Leaders and employees committed to our Vision of Being The Best on a Carriage Good To
Great Journey. This past year had many milestone achievements, but none greater than coming together throughout all field operations and support Houston departments as Carriage Services 2014: One Team, One Vision!
I personally believe that 2015, the fourth year in our defined five year Good To Great Journey, will be a critical year for this journey to be “Sustained High Performance” and produce an increasing and sustainable high valuation Built To Last Carriage. So we are establishing a Being The Best Funeral Standards Achievement Goal of 70% and a Cemetery Being The Best Standards Achievement Goal of 70%, both goals that I believe are absolutely possible through 4E Leadership at all levels. The theme for 2015 was suggested by Anjana Jackson of our Houston Accounting and Tax Team. Anjana, thank you on behalf of all of our leaders and employees for the awesome theme:
Carriage Services 2015: High Performance through Passion and Partnership!
As always, I leave you with this thought:
“Greatness is not a function of circumstance. Greatness, it turns out, is largely a matter of conscious choice.”(1)
And as always, I CHOOSE GREATNESS because I want to be on the Carriage Good To Great Journey with you!
Mel
(1)Quote from Jim Collins, Author of Good To Great, 2001 and Co-Author of Built To Last, 1994.


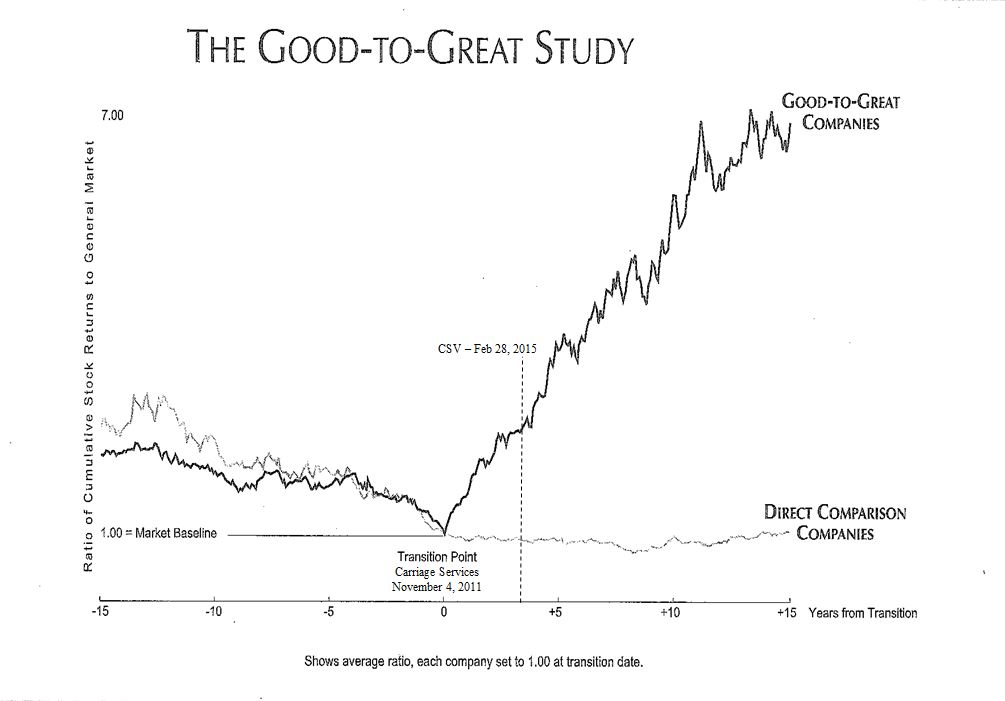

Company & Investment Profile March 2015

3040 Post Oak Boulevard Suite 300 Houston, TX 77056
Phone: (713) 332-8400 Fax: (713) 332-8401
www.carriageservices.com | ||
Company Highlights |  | |
Ÿ | Founded in 1991; public in 1996; one of the largest funeral home and cemetery consolidators in a highly fragmented industry. | |
Ÿ | Industry consolidation landscape is highly favorable for Carriage, especially since SCI acquired Stewart Enterprises in late 2013. | |
Ÿ | Total Shareholder Return of 280% and Adjusted EPS compound annual growth of 28% since launch of Carriage’s Good To Great journey in 2012. | |
Ÿ | Achieved 6 consecutive years of annual record setting Revenues, Field EBITDA, Adjusted Consolidated EBITDA and Adjusted Diluted EPS. | |
Ÿ | Corporate strategy defined by three models: Standards Operating Model for both funeral & cemetery segments, 4E Leadership Model, and Strategic Acquisition Model. | |
Ÿ | Decentralized, entrepreneurial Standards Operating Model and linked incentive compensation attracts best in class industry talent and acquisition candidates. | |
Ÿ | Improved Capital Structure and low Cost of Capital enable growing Free Cash Flow from Operations to finance majority of acquisition growth pursuant to our Strategic Acquisition Model, while improving the credit profile of Carriage. | |
Ÿ | Long-term shareholder value created though modest Revenue growth leveraged into faster growth in Field EBITDA, Adjusted Consolidated EBITDA and Adjusted Diluted EPS. | |
Ÿ | Industry leading Adjusted Consolidated EBITDA Margin of 27.3% in 2014. | |
Carriage Services, Inc. ©2015 Carriage Services, Inc. All rights reserved.
Forward-looking statements contained herein are subject to certain risks and uncertainties as further described at the end of this Company & Investment Profile. Please refer to the section Disclosure of Non-GAAP Performance Measures on page 23 that discusses non-GAAP financial measures to GAAP financial measures.
Company & Investment Profile March 2015
Table of Contents | ||||
SECTION | PAGE | |
Ÿ | Company Highlights | 1 |
Ÿ | 2013 and 2014 Record Performances | 3 |
Ÿ | Mission Statement & Guiding Principles | 4 |
Ÿ | Ten Year Vision and Strategy/Carriage Models | 4/5 |
Ÿ | Leveraged Investment Returns | 5 |
Ÿ | High Performance Culture Framework | 6 |
Ÿ | New Financing Strategy | 7 |
Ÿ | Trend Reports | 8 |
Ÿ | Income Statement - Annual Trend | 9/10 |
Ÿ | Income Statement - Quarterly Trend | 11/12 |
Ÿ | Five Year Outlook | 13 |
Ÿ | Five Year Revenue & Cash Flow Scenario | 14 |
Ÿ | Five Year Capital Structure Scenario | 15 |
Ÿ | Carriage Models - Standards Operating, 4E Leadership, Strategic Acquisition | 16-18 |
Ÿ | Preneed Funeral and Cemetery Strategy | 18 |
Ÿ | Preneed Trust Fund Investment Performance | 19 |
Ÿ | Executive Team | 20 |
Ÿ | Independent Directors | 20/21 |
Ÿ | Regional Partners | 21 |
Ÿ | Operations and Strategic Growth Leadership Team | 22 |
Ÿ | Cautionary Statement on Forward Looking Statements | 23 |
Ÿ | Disclosure of Non-GAAP Performance Measures | 23 |
This Investment Profile is being published by Carriage Services in continuation of the Company’s stated goal to provide more disclosure and transparency to the investment community regarding Carriage’s operations, strategies and industry conditions. It is Carriage’s intent to take responsibility for communicating with the investment community and provide greater operating and financial transparency. | ||||
Carriage Services, Inc. ©2015 Carriage Services, Inc. All rights reserved.
Forward-looking statements contained herein are subject to certain risks and uncertainties as further described at the end of this Company & Investment Profile. Please refer to the section Disclosure of Non-GAAP Performance Measures on page 23 that discusses non-GAAP financial measures to GAAP financial measures.
Company & Investment Profile March 2015
History of Record Performance
(in millions, except EPS) | 2010 | 2011 | 2012 | 2013 | 2014 | CAGR |
Revenue | $176.1 | $182.3 | $198.2 | $213.1 | $226.1 | 6.4% |
Total Field EBITDA | $61.9 | $68.1 | $78.6 | $84.5 | $90.4 | 9.9% |
Adjusted Consolidated EBITDA | $44.3 | $48.6 | $52.6 | $56.0 | $61.7 | 8.6% |
Adjusted Consolidated EBITDA Margin % | 25.2% | 26.7% | 26.5% | 26.3% | 27.3% | |
Adjusted Net Income | $9.1 | $11.8 | $14.5 | $18.1 | $24.8 | 28.5% |
Adjusted Diluted EPS | $0.50 | $0.64 | $0.80 | $0.98 | $1.34 | 27.9% |
Free Cash Flow | $18.6 | $24.2 | $20.8 | $33.2 | $34.2 | 16.4% |
2013 RECORD PERFORMANCE*
For the year ended December 31, 2013, Carriage completed one acquisition and reported the following results compared to the comparable period of 2012 (Press Release March 5, 2014 - FY 2013 Results):
• | Record Total Revenue of $214.0 million, an increase of 7.3% compared to $199.4 million in 2012. |
• | Record Total Field EBITDA of $84.6 million, an increase of 7.0% compared to $79.1 million in 2012. |
• | Record Non-GAAP Adjusted Consolidated EBITDA of $56.1 million, an increase of 5.8% compared to $53.1 million in 2012. |
• | Record Non-GAAP Adjusted Diluted EPS of $1.00, an increase of 23.5% compared to Non-GAAP EPS of $0.81 per diluted share in 2012. |
• | Record Adjusted Free Cash Flow of $33.2 million, an increase of 59.6% compared to $20.8 million in 2012. |
2014 RECORD PERFORMANCE
For the year ended December 31, 2014, Carriage completed an acquisition of six businesses and reported the following results compared to the comparable period of 2013 (Press Release February 25, 2015 - FY 2014 Results):
• | Record Total Revenue of $226.1 million, an increase of 6.1% compared to $213.1 million in 2013. |
• | Record Total Field EBITDA of $90.4 million, an increase of 7.0% compared to $84.5 million in 2013. |
• | Record Non-GAAP Adjusted Consolidated EBITDA of $61.7 million, an increase of 10.1% compared to $56.0 million in 2013. |
• | Record Non-GAAP Adjusted Diluted EPS of $1.34, an increase of 36.7% compared to EPS of $0.98 in 2013. |
• | Record Adjusted Free Cash Flow of $34.2 million, an increase of 3.0% compared to $33.2 million in 2013. |
*Differences between year-over-year performances due to divested businesses.
This
Carriage Services, Inc. ©2015 Carriage Services, Inc. All rights reserved.
Forward-looking statements contained herein are subject to certain risks and uncertainties as further described at the end of this Company & Investment Profile. Please refer to the section Disclosure of Non-GAAP Performance Measures on page 23 that discusses non-GAAP financial measures to GAAP financial measures.
Company & Investment Profile March 2015
MISSION STATEMENT: We are committed to being the most professional, ethical, and highest quality funeral and cemetery service organization in our industry. GUIDING PRINCIPLES: Ÿ Honesty, integrity and quality in all that we do; Ÿ Hard work, pride of accomplishment and shared success through employee ownership; Ÿ Belief in the power of people through individual initiative and teamwork; Ÿ Outstanding service and Profitability go hand-in-hand; Ÿ Growth of the Company is driven by decentralization and partnership. | ||||
TEN YEAR VISION AND STRATEGY
Our Vision for Carriage over the next ten years is to affiliate with many of the best remaining independent funeral home and cemetery operators in approximately 15-20 large and 10-15 medium strategic markets where the potential for future revenue growth is the highest. After almost fifty years of consolidation, the funeral and cemetery industry remains highly fragmented with the top three public consolidators accounting for only 20% industry revenue. Succession planning issues for independent owners and their families has become more difficult and complex than ever.
Carriage offers a highly attractive succession planning option for independent owners who want their legacy family business to remain operationally prosperous in their local communities, and our decentralized operating framework comprised of our three models will continue to attract the best and most entrepreneurial talent in our industry.
Standards Operating Model
• | The Standards Operating Model is comprised of eight Funeral and Cemetery Standards that Carriage has observed as being the drivers of sustainable high performance in the funeral and cemetery industry. |
• | The Standards are designed around three major areas related to market share, people and financial metrics (Being The Best Standards) that drive long-term operating and financial performance. |
• | They are designed and weighted to grow funeral contracts/cemetery internments and average revenue per contract/internment modestly over time at high and sustainable profit margins. |
• | The Standards align one-year (Being The Best) and five-year (Good To Great) financial incentives for Managing Partners of each business with 4E Leadership skills and their teams who consistently achieve a high level of Standards. |
4E Leadership Model
• | The Standards Operating Model requires strong leadership to grow an entrepreneurial, high value, personal service business at high and sustainable Field EBITDA Margins. |
• | 4E Leaders have a winning, competitive spirit and want to make a difference not only in their business but in Carriage’s performance and reputation within the funeral and cemetery industry. |
• | 4E Leaders are motivated by the recognition and rewards related to achievement of our Being The Best Standards, including League Table rankings, service on Regional Standards Councils, and our Annual Being The Best and Five Year Good To Great Managing Partner Incentive Bonus Programs. |
Carriage Services, Inc. ©2015 Carriage Services, Inc. All rights reserved.
Forward-looking statements contained herein are subject to certain risks and uncertainties as further described at the end of this Company & Investment Profile. Please refer to the section Disclosure of Non-GAAP Performance Measures on page 23 that discusses non-GAAP financial measures to GAAP financial measures.
Company & Investment Profile March 2015
Strategic Acquisition Model
• | The updated Model is used to assess strategic acquisition candidates based on a number of specific criteria including: market size and demographic trends, client family revenue profile, institutional brand strength, long term (10 years) contract volume and revenue per contract (3 years) trends. |
• | The Model allows Carriage to evaluate potential acquisition candidates on a pro forma basis using our Standards Operating and 4E Leadership Models to determine alignment with our operating strategy. |
• | The selective ranking and valuation of acquisition candidates is based on local market dynamics that are evaluated by the Operations and Strategic Growth Leadership Team. The Model allows for differentiating enterprise valuations and the flexibility for Carriage to customize acquisition transactions to ensure appropriate Return on Invested Capital. |
• | Carriage’s goal over the next ten years is to acquire larger and higher margin funeral home and cemetery businesses in strategic markets. Through the disciplined execution of the Model, the acquisitions will lead to incremental increases in the growth profile and sustainable earnings power of Carriage. |
LEVERAGED INVESTMENT RETURNS
Execution of these three Carriage Models should produce superior long-term shareholder returns driven by a combination of unique and simultaneous financial leveraging dynamics as follows:
Operating Leverage
• | Modest growth in same store revenues and modest increases in Field EBITDA Margins over time produce a higher growth rate (versus revenue) in same store Field EBITDA. |
• | Execution of our Standards Operating Model and higher death rates caused by the aging of the “baby boom” generation should increase same store volumes and revenues in the intermediate and long term, which will cause higher compound growth rates of Field EBITDA. |
Overhead Leverage
• | Fixed Regional and Corporate Overhead infrastructure costs will increase over time at a slower rate than revenues. |
• | Variable Overhead, primarily incentive compensation related to all three organizational levels (Field, Regional, and Corporate) and expenses related to acquisitions will increase relative to higher operating and financial performance. |
Capital Structure Leverage
• | Since the second quarter of 2012, Carriage has taken advantage of the current low interest rate environment to refinance senior unsecured high yield notes with a bank term loan and replace 7% convertible junior subordinated debt with a new 2.75% convertible subordinated note offering. |
• | These transactions, along with the expansion of our bank credit facility at competitive rates, have lowered interest expense, improved cost of capital and provided substantial financial flexibility. |
• | Annual cash interest expense of $8.5 million is easily covered by Adjusted Consolidated EBITDA, resulting in substantial Adjusted Consolidated Free Cash Flow that will be used to fund strategic acquisitions and for internal growth projects, such as cemetery inventory development and local business expansion. |
• | Low share count enables approximately $300,000 of incremental Field EBITDA to produce an additional $0.01 of Earnings Per Share. |
Consolidation Platform Leverage
• | Acquired Field EBITDA from acquisitions will substantially add to Adjusted Consolidated EBITDA and Free Cash Flow and will be highly accretive to EPS. |
• | Consolidated Free Cash Flow after fixed interest and maintenance capital expenditures will grow at a faster rate than revenues, a financial benefit that will accrue directly to common shareholders. |
Carriage Services, Inc. ©2015 Carriage Services, Inc. All rights reserved.
Forward-looking statements contained herein are subject to certain risks and uncertainties as further described at the end of this Company & Investment Profile. Please refer to the section Disclosure of Non-GAAP Performance Measures on page 23 that discusses non-GAAP financial measures to GAAP financial measures.
Company & Investment Profile March 2015
HIGH PERFORMANCE CULTURE FRAMEWORK
The visual schematic shown below outlines how Carriage’s High Performance Culture Framework links to our Mission Statement, Five Guiding Principles and the application of Good to Great leadership and people concepts. The consistent execution of our three models creates high and sustainable financial performance, which in turn drives the value creation dynamics that make Carriage a compelling investment vehicle for our shareholders and employees.

Carriage Services, Inc. ©2015 Carriage Services, Inc. All rights reserved.
Forward-looking statements contained herein are subject to certain risks and uncertainties as further described at the end of this Company & Investment Profile. Please refer to the section Disclosure of Non-GAAP Performance Measures on page 23 that discusses non-GAAP financial measures to GAAP financial measures.
Company & Investment Profile March 2015
NEW FINANCING STRATEGY
In 2014, Carriage refinanced $90 million of 7% convertible junior subordinated debt with $143.75 million of new 2.75% convertible subordinated debt and amended our current bank credit facility to support our operating and acquisition strategy.
Capital Structure Debt Components | Committed | Outstanding |
2.75% Convertible Subordinated Notes | $143.8 | $143.8 |
Bank Term Loan (Libor + 250 bps) | $125.0 | $120.3 |
Bank Revolving Credit (Libor + 250 bps) | $200.0 | $40.5 |
Total | $468.8 | $304.6 |
In millions as of December 31, 2014 | ||
The successful completion of this financing strategy has materially reduced our cost of debt capital and therefore our total cost of capital and has been immediately accretive to earnings.
Convertible Subordinated Notes
(CSV 8-K March 13, 2014, Press Release March 19, 2014 )
• | Issued $143.75 million 2.75% Convertible Subordinated Notes due 2021, (the “Notes”) through a private offering, on March 13, 2014. |
• | Due to investor demand, the initial purchasers exercised their option to purchase an additional $18.75 million of Notes. |
• | Unsecured obligations are subordinated in right of payment to all of our existing and future senior indebtedness. |
• | Mature on March 15, 2021, unless earlier converted or purchased via a tender by Carriage; no call provision. |
• | Initial conversion rate of the Notes is 44.3169 shares of our common stock per $1,000 principal amount of notes equal to conversion price of $22.56 per share. The Notes are eligible for conversion at $29.33. |
• | Upon conversion, Carriage will pay cash up to the aggregate principal amount of the Notes being converted and pay cash, shares of our common stock or a combination thereof, at our election, of the remainder of the conversion obligation. |
• | The total number of common shares issued due to conversion is limited to less than 20% of shares outstanding at time of issuance (NYSE share cap). Carriage is not required to pay cash in lieu of shares that are subject to the NYSE share cap. |
• | Due to net share settlement provision, dilution occurs slowly for the in the money option value of the Convertible Notes. To recognize the full 19.99% dilution under the NYSE cap, Carriage common stock price would be approximately $54. |
• | Please see our Press Release dated February 25, 2015 for further details of the mechanics of the Convertible Notes. |
Fifth Amendment to the Credit Facility
(Press Release May 15, 2014)
• | Entered into Fifth Amendment of our current credit facility in May 2014. |
• | Increased commitments under revolving credit facility from $125 million to $200 million. |
• | Entered into new bank term loan of $125 million with new amortization schedule (1-2 year: 7.5%, 3-4 years: 10%, 12.5% thereafter). |
• | Extended maturity to March 31, 2019 (5 years). |
• | Credit facility consists of 9 leading financial institutions and is administered by Bank of America. |
Carriage Services, Inc. ©2015 Carriage Services, Inc. All rights reserved.
Forward-looking statements contained herein are subject to certain risks and uncertainties as further described at the end of this Company & Investment Profile. Please refer to the section Disclosure of Non-GAAP Performance Measures on page 23 that discusses non-GAAP financial measures to GAAP financial measures.
Company & Investment Profile March 2015
TREND REPORTS
In order for management and investors to evaluate, with full transparency, the effective execution of our three models over long periods of time, we decided that innovation in our public reporting was required. Beginning in 2007, we subordinated SEC segment and GAAP reporting in our public quarterly financial results and initiated Five Year and Five Quarter Trend Reports.
The Trend Reports highlight the following long and short term Operating and Financial results:
• | Same Store and Acquisition contract/internment Volumes and Operating Revenues. |
• | Field EBITDA and Margin Percentage (defined by Carriage as controllable profit and profit margin). |
• | Financial Revenue and EBITDA (Preneed Trust and Insurance earnings, Cemetery Perpetual Care Income). |
• | Fixed and Variable Corporate Overhead expenses. |
• | Consolidated EBITDA and Consolidated EBITDA Margin. |
• | Adjusted Net Income and Net Income Margin. |
• | Adjusted Consolidated EBITDA and Adjusted Consolidated EBITDA Margin. |
The Trend Reports also reflect the “bottom line” enterprise valuation metric of Adjusted Consolidated EBITDA and Adjusted Consolidated EBITDA Margin (all non-GAAP). Carriage believes that the Adjusted Consolidated EBITDA and Margin most accurately reflect the “roughly right range” of the cash earning power of the Company as an operating and consolidation platform.
Every month, the Managing Partner of each funeral home and cemetery receives an individual Standards Achievement Trend Report that mirrors the format of Carriage’s publically available Trend Reports. These reports, along with real-time data available through a customized ‘dashboard’, enable each Managing Partner to monitor their businesses operating and financial performance relative to Being The Best Standards Achievement. These tools allow our Managing Partners and Regional Leadership to quickly and proactively react to changing trends in local markets.
“Same Store” results in our Trend Reports represent Operating and Financial results of funeral and cemetery businesses that have been owned for five years. “Acquisition” is defined as funeral and cemetery businesses acquired since January 1, 2011, as of December 31, 2014. The five year trend of our Acquisitions Portfolio is important in monitoring the execution of our Strategic Acquisition Model. It also provides management and investors the ability to see the effects of the Consolidation Platform Leverage on Carriage’s operating results and the shareholder value creation over time as we execute the Strategic Acquisition Model.
The Trend Reports are presented on a Non-GAAP basis in order to report the cash withdrawn for certain trust accounts prior to a service, reported as Withdrawable Trust Income. Under GAAP accounting, Carriage will account for the cash withdrawals by increasing Cash and Deferred Revenue by the withdrawn amount. One-time and non-recurring charges will also be included on a Non-GAAP basis in the Trend Reports.
Carriage Services, Inc. ©2015 Carriage Services, Inc. All rights reserved.
Forward-looking statements contained herein are subject to certain risks and uncertainties as further described at the end of this Company & Investment Profile. Please refer to the section Disclosure of Non-GAAP Performance Measures on page 23 that discusses non-GAAP financial measures to GAAP financial measures.
Company & Investment Profile March 2015
FIVE QUARTER OPERATING AND FINANCIAL TREND REPORT | |||||||||||||||
(IN THOUSANDS - EXCEPT PER SHARE AMOUNTS) | |||||||||||||||
QTR 4 | QTR 1 | QTR 2 | QTR 3 | QTR 4 | |||||||||||
2013 | 2014 | 2014 | 2014 | 2014 | |||||||||||
Same Store Contracts | |||||||||||||||
Atneed Contracts | 4,400 | 4,795 | 4,428 | 4,332 | 4,578 | ||||||||||
Preneed Contracts | 1,188 | 1,217 | 1,136 | 1,095 | 1,193 | ||||||||||
Total Same Store Funeral Contracts | 5,588 | 6,012 | 5,564 | 5,427 | 5,771 | ||||||||||
Acquisition Contracts | |||||||||||||||
Atneed Contracts | 1,513 | 1,659 | 1,712 | 1,810 | 2,079 | ||||||||||
Preneed Contracts | 280 | 304 | 321 | 356 | 387 | ||||||||||
Total Acquisition Funeral Contracts | 1,793 | 1,963 | 2,033 | 2,166 | 2,466 | ||||||||||
Total Funeral Contracts | 7,381 | 7,975 | 7,597 | 7,593 | 8,237 | ||||||||||
Funeral Operating Revenue | |||||||||||||||
Same Store Revenue | $ | 29,563 | $ | 31,306 | $ | 29,163 | $ | 28,234 | $ | 30,619 | |||||
Acquisition Revenue | 8,880 | 10,178 | 10,657 | 11,254 | 12,841 | ||||||||||
Total Funeral Operating Revenue | $ | 38,443 | $ | 41,484 | $ | 39,820 | $ | 39,488 | $ | 43,460 | |||||
Cemetery Operating Revenue | |||||||||||||||
Same Store Revenue | $ | 9,695 | $ | 9,712 | $ | 11,382 | $ | 9,539 | $ | 10,624 | |||||
Acquisition Revenue | 66 | 55 | 334 | 645 | 565 | ||||||||||
Total Cemetery Operating Revenue | $ | 9,761 | $ | 9,767 | $ | 11,716 | $ | 10,184 | $ | 11,189 | |||||
Financial Revenue | |||||||||||||||
Preneed Funeral Commission Income | $ | 418 | $ | 564 | $ | 563 | $ | 509 | $ | 400 | |||||
Preneed Funeral Trust Earnings | 1,794 | 1,916 | 1,809 | 1,773 | 1,949 | ||||||||||
Cemetery Trust Earnings | 1,875 | 1,584 | 2,276 | 2,212 | 2,051 | ||||||||||
Preneed Cemetery Finance Charges | 348 | 337 | 320 | 383 | 370 | ||||||||||
Total Financial Revenue | $ | 4,435 | $ | 4,401 | $ | 4,968 | $ | 4,877 | $ | 4,770 | |||||
Total Revenue | $ | 52,639 | $ | 55,652 | $ | 56,504 | $ | 54,549 | $ | 59,419 | |||||
Field EBITDA | |||||||||||||||
Same Store Funeral Field EBITDA | $ | 10,004 | $ | 12,083 | $ | 10,388 | $ | 10,235 | $ | 12,050 | |||||
Same Store Funeral Field EBITDA Margin | 33.8 | % | 38.6 | % | 35.6 | % | 36.3 | % | 39.4 | % | |||||
Acquisition Funeral Field EBITDA | 2,743 | 3,772 | 3,632 | 3,603 | 4,711 | ||||||||||
Acquisition Funeral Field EBITDA Margin | 30.9 | % | 37.1 | % | 34.1 | % | 32.0 | % | 36.7 | % | |||||
Total Funeral Field EBITDA | $ | 12,747 | $ | 15,855 | $ | 14,020 | $ | 13,838 | $ | 16,761 | |||||
Total Funeral Field EBITDA Margin | 33.2 | % | 38.2 | % | 35.2 | % | 35.0 | % | 38.6 | % | |||||
Same Store Cemetery Field EBITDA | $ | 2,684 | $ | 2,839 | $ | 3,568 | $ | 2,148 | $ | 3,290 | |||||
Same Store Cemetery Field EBITDA Margin | 27.7 | % | 29.2 | % | 31.3 | % | 22.5 | % | 31.0 | % | |||||
Acquisition Cemetery Field EBITDA | (10 | ) | (9 | ) | 134 | 114 | 112 | ||||||||
Acquisition Cemetery Field EBITDA Margin | -15.2 | % | -16.4 | % | 40.1 | % | 17.7 | % | 19.8 | % | |||||
Total Cemetery Field EBITDA | $ | 2,674 | $ | 2,830 | $ | 3,702 | $ | 2,262 | $ | 3,402 | |||||
Total Cemetery Field EBITDA Margin | 27.4 | % | 29.0 | % | 31.6 | % | 22.2 | % | 30.4 | % | |||||
Funeral Financial EBITDA | $ | 1,958 | $ | 2,226 | $ | 2,079 | $ | 2,002 | $ | 2,041 | |||||
Cemetery Financial EBITDA | 2,179 | 1,898 | 2,556 | 2,529 | 2,358 | ||||||||||
Total Financial EBITDA | $ | 4,137 | $ | 4,124 | $ | 4,635 | $ | 4,531 | $ | 4,399 | |||||
Total Financial EBITDA Margin | 93.3 | % | 93.7 | % | 93.3 | % | 92.9 | % | 92.2 | % | |||||
Total Field EBITDA | $ | 19,558 | $ | 22,809 | $ | 22,357 | $ | 20,631 | $ | 24,562 | |||||
Total Field EBITDA Margin | 37.2 | % | 41.0 | % | 39.6 | % | 37.8 | % | 41.3 | % | |||||
Overhead | |||||||||||||||
Total Variable Overhead | $ | 1,944 | $ | 3,863 | $ | 1,411 | $ | 3,065 | $ | 2,425 | |||||
Total Regional Fixed Overhead | 538 | 786 | 781 | 811 | 758 | ||||||||||
Total Corporate Fixed Overhead | 4,819 | 5,574 | 5,085 | 4,666 | 4,902 | ||||||||||
Total Overhead | $ | 7,301 | $ | 10,223 | $ | 7,277 | $ | 8,542 | $ | 8,085 | |||||
Overhead as a percent of sales | 13.9 | % | 18.4 | % | 12.9 | % | 15.7 | % | 13.6 | % | |||||
Consolidated EBITDA | $ | 12,257 | $ | 12,586 | $ | 15,080 | $ | 12,089 | $ | 16,477 | |||||
Consolidated EBITDA Margin | 23.3 | % | 22.6 | % | 26.7 | % | 22.2 | % | 27.7 | % | |||||
Carriage Services, Inc. ©2015 Carriage Services, Inc. All rights reserved.
Forward-looking statements contained herein are subject to certain risks and uncertainties as further described at the end of this Company & Investment Profile. Please refer to the section Disclosure of Non-GAAP Performance Measures on page 23 that discusses non-GAAP financial measures to GAAP financial measures.
Company & Investment Profile March 2015
FIVE QUARTER OPERATING AND FINANCIAL TREND REPORT | |||||||||||||||
(IN THOUSANDS - EXCEPT PER SHARE AMOUNTS) | |||||||||||||||
QTR 4 | QTR 1 | QTR 2 | QTR 3 | QTR 4 | |||||||||||
2013 | 2014 | 2014 | 2014 | 2014 | |||||||||||
Other Expenses and Interest | |||||||||||||||
Property Depreciation & Amortization | $ | 2,823 | $ | 2,757 | $ | 3,029 | $ | 2,995 | $ | 3,142 | |||||
Non Cash Stock Compensation | 617 | 729 | 1,263 | 920 | 920 | ||||||||||
Interest Expense | 3,066 | 2,844 | 2,691 | 2,180 | 2,593 | ||||||||||
Accretion of Discount on Convertible Subordinated Notes | — | 171 | 694 | 782 | 805 | ||||||||||
Loss on Extinguishment of Debt and Other Costs | — | — | 1,042 | — | — | ||||||||||
Loss on Redemption of Convertible Junior Subordinated Debentures | — | 3,779 | — | — | — | ||||||||||
Other, Net | — | (368 | ) | (5 | ) | (3 | ) | 571 | |||||||
Pretax Income | $ | 5,751 | $ | 2,674 | $ | 6,366 | $ | 5,215 | $ | 8,446 | |||||
Tax Provision | 1,519 | 1,043 | 2,483 | 2,390 | 3,079 | ||||||||||
Tax Benefit Related to Uncertain Tax Positions | — | — | — | (1,740 | ) | — | |||||||||
Net Tax Provision | $ | 1,519 | $ | 1,043 | $ | 2,483 | $ | 650 | $ | 3,079 | |||||
GAAP Net Income | $ | 4,232 | $ | 1,631 | $ | 3,883 | $ | 4,565 | $ | 5,367 | |||||
Effective Tax Rate | 26.4% | 39.0% | 39.0% | 12.5% | 36.5% | ||||||||||
Special Items, Net of tax except for ** | |||||||||||||||
Withdrawable Trust Income | $ | 281 | $ | 149 | $ | 366 | $ | 468 | $ | 198 | |||||
Acquisition and Divestiture Expenses | 246 | 491 | 168 | 56 | 49 | ||||||||||
Severance Costs | 105 | 209 | 268 | 119 | 101 | ||||||||||
Consulting Fees | 90 | 159 | 6 | 71 | 41 | ||||||||||
Other Incentive Compensation | — | 660 | — | — | — | ||||||||||
Accretion of Discount on Convertible Subordinated Notes ** | — | 171 | 694 | 782 | 805 | ||||||||||
Costs Related to Credit Facility | — | — | 688 | — | — | ||||||||||
Loss on Redemption of Convertible Junior Subordinated Debentures | — | 2,493 | — | — | — | ||||||||||
(Gain)/Loss on Asset Purchase/Sale | — | (746 | ) | — | — | 379 | |||||||||
Other Special Items | — | 503 | — | — | — | ||||||||||
Tax Adjustment from Prior Period ** | (338 | ) | — | — | — | — | |||||||||
Sum of Special Items, Net of tax | $ | 384 | $ | 4,089 | $ | 2,190 | $ | 1,496 | $ | 1,573 | |||||
Adjusted Net Income | $ | 4,616 | $ | 5,720 | $ | 6,073 | $ | 6,061 | $ | 6,940 | |||||
Adjusted Net Profit Margin | 8.8 | % | 10.3 | % | 10.7 | % | 11.1 | % | 11.7 | % | |||||
Adjusted Basic Earnings Per Share | $ | 0.25 | $ | 0.31 | $ | 0.33 | $ | 0.33 | $ | 0.38 | |||||
Adjusted Diluted Earnings Per Share | $ | 0.25 | $ | 0.31 | $ | 0.33 | $ | 0.32 | $ | 0.38 | |||||
GAAP Basic Earnings Per Share | $ | 0.23 | $ | 0.09 | $ | 0.21 | $ | 0.25 | $ | 0.29 | |||||
GAAP Diluted Earnings Per Share | $ | 0.23 | $ | 0.09 | $ | 0.21 | $ | 0.24 | $ | 0.29 | |||||
Average Number of Basic Shares Outstanding | 17,920 | 17,984 | 18,123 | 18,150 | 18,170 | ||||||||||
Average Number of Diluted Shares Outstanding | 22,488 | 18,143 | 18,247 | 18,276 | 18,358 | ||||||||||
Reconciliation to Adjusted Consolidated EBITDA | |||||||||||||||
Consolidated EBITDA | $ | 12,257 | $ | 12,586 | $ | 15,080 | $ | 12,089 | $ | 16,477 | |||||
Withdrawable Trust Income | 426 | 225 | 554 | 709 | 300 | ||||||||||
Acquisition and Divestiture Expenses | 372 | 744 | 255 | 85 | 74 | ||||||||||
Severance Costs | 158 | 317 | 406 | 180 | 153 | ||||||||||
Consulting Fees | 136 | 241 | 9 | 107 | 62 | ||||||||||
Other Incentive Compensation | — | 1,000 | — | — | — | ||||||||||
Securities Transaction Expenses | — | — | — | — | — | ||||||||||
Other Special Items | — | — | — | — | — | ||||||||||
Adjusted Consolidated EBITDA | $ | 13,349 | $ | 15,113 | $ | 16,304 | $ | 13,170 | $ | 17,066 | |||||
Adjusted Consolidated EBITDA Margin | 25.4 | % | 27.2 | % | 28.9 | % | 24.1 | % | 28.7 | % | |||||
Carriage Services, Inc. ©2015 Carriage Services, Inc. All rights reserved.
Forward-looking statements contained herein are subject to certain risks and uncertainties as further described at the end of this Company & Investment Profile. Please refer to the section Disclosure of Non-GAAP Performance Measures on page 23 that discusses non-GAAP financial measures to GAAP financial measures.
Company & Investment Profile March 2015
FIVE YEAR OPERATING AND FINANCIAL TREND REPORT | |||||||||||||||
(IN THOUSANDS - EXCEPT PER SHARE AMOUNTS) | |||||||||||||||
2010 | 2011 | 2012 | 2013 | 2014 | |||||||||||
Same Store Contracts | |||||||||||||||
Atneed Contracts | 18,505 | 17,975 | 17,934 | 18,149 | 18,133 | ||||||||||
Preneed Contracts | 4,784 | 5,066 | 4,779 | 4,908 | 4,641 | ||||||||||
Total Same Store Funeral Contracts | 23,289 | 23,041 | 22,713 | 23,057 | 22,774 | ||||||||||
Acquisition Contracts | |||||||||||||||
Atneed Contracts | 961 | 2,742 | 4,436 | 5,689 | 7,260 | ||||||||||
Preneed Contracts | 153 | 462 | 715 | 1,108 | 1,368 | ||||||||||
Total Acquisition Funeral Contracts | 1,114 | 3,204 | 5,151 | 6,797 | 8,628 | ||||||||||
Total Funeral Contracts | 24,403 | 26,245 | 27,864 | 29,854 | 31,402 | ||||||||||
Funeral Operating Revenue | |||||||||||||||
Same Store Revenue | $ | 120,882 | $ | 120,139 | $ | 119,891 | $ | 120,191 | $ | 119,322 | |||||
Acquisition Revenue | 3,282 | 11,720 | 23,317 | 33,660 | 44,930 | ||||||||||
Total Funeral Operating Revenue | $ | 124,164 | $ | 131,859 | $ | 143,208 | $ | 153,851 | $ | 164,252 | |||||
Cemetery Operating Revenue | |||||||||||||||
Same Store Revenue | $ | 37,797 | $ | 36,481 | $ | 38,113 | $ | 40,181 | $ | 41,257 | |||||
Acquisition Revenue | — | — | 166 | 298 | 1,599 | ||||||||||
Total Cemetery Operating Revenue | $ | 37,797 | $ | 36,481 | $ | 38,279 | $ | 40,479 | $ | 42,856 | |||||
Financial Revenue | |||||||||||||||
Preneed Funeral Commission Income | $ | 2,265 | $ | 1,811 | $ | 1,711 | $ | 1,853 | $ | 2,036 | |||||
Preneed Funeral Trust Earnings | 5,880 | 6,241 | 5,884 | 7,378 | 7,447 | ||||||||||
Cemetery Trust Earnings | 4,507 | 4,627 | 7,647 | 8,095 | 8,123 | ||||||||||
Preneed Cemetery Finance Charges | 1,479 | 1,294 | 1,462 | 1,418 | 1,410 | ||||||||||
Total Financial Revenue | $ | 14,131 | $ | 13,973 | $ | 16,704 | $ | 18,744 | $ | 19,016 | |||||
Total Revenue | $ | 176,092 | $ | 182,313 | $ | 198,191 | $ | 213,074 | $ | 226,124 | |||||
Field EBITDA | |||||||||||||||
Same Store Funeral Field EBITDA | $ | 39,776 | $ | 42,963 | $ | 45,968 | $ | 44,973 | $ | 44,756 | |||||
Same Store Funeral Field EBITDA Margin | 32.9 | % | 35.8 | % | 38.3 | % | 37.4 | % | 37.5 | % | |||||
Acquisition Funeral Field EBITDA | 388 | 3,130 | 7,585 | 10,486 | 15,718 | ||||||||||
Acquisition Funeral Field EBITDA Margin | 11.8 | % | 26.7 | % | 32.5 | % | 31.2 | % | 35.0 | % | |||||
Total Funeral Field EBITDA | $ | 40,164 | $ | 46,093 | $ | 53,553 | $ | 55,459 | $ | 60,474 | |||||
Total Funeral Field EBITDA Margin | 32.3 | % | 35.0 | % | 37.4 | % | 36.0 | % | 36.8 | % | |||||
Same Store Cemetery Field EBITDA | $ | 8,938 | $ | 9,370 | $ | 9,897 | $ | 11,757 | $ | 11,845 | |||||
Same Store Cemetery Field EBITDA Margin | 23.6 | % | 25.7 | % | 26.0 | % | 29.3 | % | 28.7 | % | |||||
Acquisition Cemetery Field EBITDA | — | — | (76 | ) | (43 | ) | 351 | ||||||||
Acquisition Cemetery Field EBITDA Margin | — | % | — | % | -45.8 | % | -14.4 | % | 22.0 | % | |||||
Total Cemetery Field EBITDA | $ | 8,938 | $ | 9,370 | $ | 9,821 | $ | 11,714 | $ | 12,196 | |||||
Total Cemetery Field EBITDA Margin | 23.6 | % | 25.7 | % | 25.7 | % | 28.9 | % | 28.5 | % | |||||
Funeral Financial EBITDA | $ | 6,778 | $ | 6,681 | $ | 6,195 | $ | 7,966 | $ | 8,348 | |||||
Cemetery Financial EBITDA | 5,986 | 5,921 | 9,060 | 9,338 | 9,341 | ||||||||||
Total Financial EBITDA | $ | 12,764 | $ | 12,602 | $ | 15,255 | $ | 17,304 | $ | 17,689 | |||||
Total Financial EBITDA Margin | 90.3 | % | 90.2 | % | 91.3 | % | 92.3 | % | 93.0 | % | |||||
Total Field EBITDA | $ | 61,866 | $ | 68,065 | $ | 78,629 | $ | 84,477 | $ | 90,359 | |||||
Total Field EBITDA Margin | 35.1 | % | 37.3 | % | 39.7 | % | 39.6 | % | 40.0 | % | |||||
Overhead | |||||||||||||||
Total Variable Overhead | $ | 3,555 | $ | 9,422 | $ | 9,623 | $ | 8,845 | $ | 10,764 | |||||
Total Regional Fixed Overhead | 2,868 | 3,028 | 2,581 | 3,346 | 3,136 | ||||||||||
Total Corporate Fixed Overhead | 14,794 | 16,436 | 18,068 | 20,829 | 20,227 | ||||||||||
Total Overhead | $ | 21,217 | $ | 28,886 | $ | 30,272 | $ | 33,020 | $ | 34,127 | |||||
Overhead as a percent of sales | 12.0 | % | 15.8 | % | 15.3 | % | 15.5 | % | 15.1 | % | |||||
Consolidated EBITDA | $ | 40,649 | $ | 39,179 | $ | 48,357 | $ | 51,457 | $ | 56,232 | |||||
Consolidated EBITDA Margin | 23.1 | % | 21.5 | % | 24.4 | % | 24.1 | % | 24.9 | % | |||||
Carriage Services, Inc. ©2015 Carriage Services, Inc. All rights reserved.
Forward-looking statements contained herein are subject to certain risks and uncertainties as further described at the end of this Company & Investment Profile. Please refer to the section Disclosure of Non-GAAP Performance Measures on page 23 that discusses non-GAAP financial measures to GAAP financial measures.
Company & Investment Profile March 2015
FIVE YEAR OPERATING AND FINANCIAL TREND REPORT | |||||||||||||||
(IN THOUSANDS - EXCEPT PER SHARE AMOUNTS) | |||||||||||||||
2010 | 2011 | 2012 | 2013 | 2014 | |||||||||||
Other Expenses and Interest | |||||||||||||||
Property Depreciation & Amortization | $ | 9,819 | $ | 9,450 | $ | 9,916 | $ | 11,635 | $ | 11,923 | |||||
Non Cash Stock Compensation | 1,722 | 1,870 | 2,174 | 2,916 | 3,832 | ||||||||||
Interest Expense | 18,246 | 18,089 | 17,088 | 13,437 | 10,308 | ||||||||||
Accretion of Discount on Convertible Subordinated Notes | — | — | — | — | 2,452 | ||||||||||
Loss on Extinguishment of Debt and Other Costs | — | 201 | 3,031 | — | 1,042 | ||||||||||
Loss on Redemption of Convertible Junior Subordinated Debentures | — | — | — | — | 3,779 | ||||||||||
Other, Net | (1,068 | ) | (898 | ) | (963 | ) | (896 | ) | 195 | ||||||
Pretax Income | $ | 11,930 | $ | 10,467 | $ | 17,111 | $ | 24,365 | $ | 22,701 | |||||
Tax Provision | 4,760 | 4,448 | 6,794 | 9,245 | 8,995 | ||||||||||
Tax Benefit Related to Uncertain Tax Positions | — | — | — | — | (1,740 | ) | |||||||||
Net Tax Provision | $ | 4,760 | $ | 4,448 | $ | 6,794 | $ | 9,245 | $ | 7,255 | |||||
GAAP Net Income | $ | 7,170 | $ | 6,019 | $ | 10,317 | $ | 15,120 | $ | 15,446 | |||||
Effective Tax Rate | 39.9% | 42.5% | 39.7% | 37.9% | 32.0% | ||||||||||
Special Items, Net of tax except for ** | |||||||||||||||
Withdrawable Trust Income | $ | 2,269 | $ | 2,979 | $ | 1,265 | $ | 960 | $ | 1,181 | |||||
Acquisition and Divestiture Expenses | 440 | 816 | 884 | 496 | 764 | ||||||||||
Severance Costs | 156 | 1,278 | 529 | 965 | 697 | ||||||||||
Consulting Fees | — | — | — | 368 | 277 | ||||||||||
Litigation Settlements and Other Related Costs | (450 | ) | — | (465 | ) | — | — | ||||||||
Other Incentive Compensation | — | — | — | — | 660 | ||||||||||
Securities Transaction Expenses | — | 333 | — | 160 | — | ||||||||||
Accretion of Discount on Convertible Subordinated Notes ** | — | — | — | — | 2,452 | ||||||||||
Costs Related to Credit Facility | — | 133 | 2,000 | 248 | 688 | ||||||||||
Gain on Redemption of Convertible Junior Subordinated Debentures | (209 | ) | (558 | ) | — | — | — | ||||||||
Loss on Redemption of Convertible Junior Subordinated Debentures | — | — | — | — | 2,493 | ||||||||||
(Gain)/Loss on Asset Purchase/Sale | — | — | — | — | (367 | ) | |||||||||
Net Gain on Disposal of Assets | (337 | ) | — | — | — | — | |||||||||
Other Special Items | — | 795 | — | (484 | ) | 503 | |||||||||
Tax Adjustment from Prior Period ** | — | — | — | 260 | — | ||||||||||
Sum of Special Items, Net of tax | $ | 1,869 | $ | 5,776 | $ | 4,213 | $ | 2,973 | $ | 9,348 | |||||
Adjusted Net Income | $ | 9,039 | $ | 11,795 | $ | 14,530 | $ | 18,093 | $ | 24,794 | |||||
Adjusted Net Profit Margin | 5.1 | % | 6.5 | % | 7.3 | % | 8.5 | % | 11.0 | % | |||||
Adjusted Basic Earnings Per Share | $ | 0.51 | $ | 0.64 | $ | 0.80 | $ | 1.00 | $ | 1.35 | |||||
Adjusted Diluted Earnings Per Share | $ | 0.50 | $ | 0.64 | $ | 0.80 | $ | 0.98 | $ | 1.34 | |||||
GAAP Basic Earnings Per Share | $ | 0.41 | $ | 0.33 | $ | 0.57 | $ | 0.83 | $ | 0.84 | |||||
GAAP Diluted Earnings Per Share | $ | 0.40 | $ | 0.33 | $ | 0.57 | $ | 0.82 | $ | 0.83 | |||||
Average Number of Basic Shares Outstanding | 17,635 | 18,359 | 18,126 | 17,826 | 18,108 | ||||||||||
Average Number of Diluted Shares Outstanding | 17,938 | 18,397 | 18,226 | 22,393 | 18,257 | ||||||||||
Reconciliation to Adjusted Consolidated EBITDA | |||||||||||||||
Consolidated EBITDA | $ | 40,649 | $ | 39,179 | $ | 48,357 | $ | 51,457 | $ | 56,232 | |||||
Withdrawable Trust Income | 3,438 | 4,513 | 1,916 | 1,454 | 1,788 | ||||||||||
Acquisition and Divestiture Expenses | 667 | 1,237 | 1,340 | 752 | 1,158 | ||||||||||
Severance Costs | 237 | 1,936 | 802 | 1,462 | 1,056 | ||||||||||
Consulting Fees | — | — | — | 557 | 419 | ||||||||||
Litigation Settlements and Other Related Costs | (682 | ) | — | 195 | — | — | |||||||||
Other Incentive Compensation | — | — | — | — | 1,000 | ||||||||||
Securities Transaction Expenses | — | 504 | — | 242 | — | ||||||||||
Other Special Items | — | 1,205 | — | 83 | — | ||||||||||
Adjusted Consolidated EBITDA | $ | 44,309 | $ | 48,574 | $ | 52,610 | $ | 56,007 | $ | 61,653 | |||||
Adjusted Consolidated EBITDA Margin | 25.2 | % | 26.6 | % | 26.5 | % | 26.3 | % | 27.3 | % | |||||
Carriage Services, Inc. ©2015 Carriage Services, Inc. All rights reserved.
Forward-looking statements contained herein are subject to certain risks and uncertainties as further described at the end of this Company & Investment Profile. Please refer to the section Disclosure of Non-GAAP Performance Measures on page 23 that discusses non-GAAP financial measures to GAAP financial measures.
Company & Investment Profile March 2015
Five Year Outlook
Long term shareholder returns and an increasing amount of Free Cash Flow are driven by:
• | Consistent and improved performance in our Same Store portfolio of businesses through the application of the Standards Operating Model. |
• | The disciplined execution of the Strategic Acquisition Model. |
• | Limiting the growth of our Carriage Consolidation Platform Overhead. |
• | The low rate capital structure put into place over the past 3 years. |
These elements in combination produce high single digit Revenue growth that is leveraged into double digit rates of growth in Adjusted Diluted EPS and modest increases over time in Adjusted Consolidated EBITDA Margins. We expect Adjusted Consolidated EBITDA to Enterprise Value and EPS multiple expansion over time from current levels, as we demonstrate consistent high and sustainable performance through execution of our innovative Consolidation and Operating Platform for the funeral and cemetery industry.
Our Five Year Outlook and Strategic Plan, including acquisitions:
Long Term Outlook - Through 2019 (Base Year 2014) |
7%-9%+ Annual Revenue growth 9%-11% Annual Adjusted Consolidated EBITDA growth Adjusted Consolidated EBITDA Margin range of 27.5%-30.5% 10%-15% Annual Adjusted EPS growth |
Carriage Services, Inc. ©2015 Carriage Services, Inc. All rights reserved.
Forward-looking statements contained herein are subject to certain risks and uncertainties as further described at the end of this Company & Investment Profile. Please refer to the section Disclosure of Non-GAAP Performance Measures on page 23 that discusses non-GAAP financial measures to GAAP financial measures.
Company & Investment Profile March 2015
FIVE YEAR REVENUE & CASH FLOW SCENARIO
This five year scenario is not intended to be a Management estimate or forecast of future performance. Given the unpredictable timing of our acquisition activity, it is unlikely that these scenarios would occur so predictably year after year. This five year scenario is intended to demonstrate the operating and financial characteristics of the Carriage Operating and Consolidation Platform over time and how it leads to long term value creation for Carriage shareholders.
The intent and goal of this scenario is to reflect "roughly right" ranges of future performance over time as we execute our Standards Operating, Strategic Acquisition and 4E Leadership Models.
Annualized Revenue Scenario
in millions - except Earnings Per Share | 2014A* | 2015 | 2016 | 2017 | 2018 | 2019 | CAGR |
Same Store Revenue | $160.6 | $163.6 | $165.2 | $166.9 | $168.6 | $170.2 | |
Acquired Revenue | $46.5 | $63.0 | $81.0 | $99.0 | $117.0 | $135.0 | |
Financial Revenue | $19.0 | $19.0 | $19.2 | $19.4 | $19.6 | $19.8 | |
Total Revenue | $226.1 | $245.6 | $265.4 | $285.3 | $305.1 | $325.0 | 7.5% |
Adjusted Consolidated EBITDA | $61.7 | $70.2 | $77.2 | $84.4 | $91.8 | $99.8 | 10.1% |
Adjusted Consolidated EBITDA Margins | 27.3% | 28.6% | 29.1% | 29.6% | 30.1% | 30.7% | |
Adjusted Net Income | $24.8 | $28.3 | $31.1 | $34.0 | $37.0 | $40.9 | 10.5% |
Adjusted Diluted EPS | $1.34 | $1.55 | $1.69 | $1.84 | $1.99 | $2.18 | 10.2% |
Adjusted Free Cash Flow | $34.2 | $36.2 | $39.7 | $43.3 | $47.0 | $52.0 | 8.7% |
Five Year Take-Away Points: Ÿ The ability to substantially self-finance acquisitions Ÿ 44% increase in Revenue Ÿ 62% increase in Adjusted Consolidated EBITDA Ÿ 52% increase in Free Cash Flow Ÿ 65% increase in Net Income Ÿ 63% increase in Adjusted EPS | |||
*2014A as per SEC 10-K filing and reported Trend Report
Carriage Services, Inc. ©2015 Carriage Services, Inc. All rights reserved.
Forward-looking statements contained herein are subject to certain risks and uncertainties as further described at the end of this Company & Investment Profile. Please refer to the section Disclosure of Non-GAAP Performance Measures on page 23 that discusses non-GAAP financial measures to GAAP financial measures.
Company & Investment Profile March 2015
CAPITAL STRUCTURE FACILITATES FIVE YEAR GROWTH SCENARIO
There are four primary components in our capital structure: (1) $125 million bank term loan that has a 2019 maturity, (2) a $200 million revolving credit facility that matures in 2019, (3) $143.75 million in outstanding 2.75% convertible subordinated notes that have a 2021 maturity, and (4) common stock.
Free Cash Flow generated by our existing operations is used to selectively acquire strategic funeral home and cemetery businesses and to fund internal growth projects. Given our low amount of shares outstanding, approximately every $300,000 increase in Field EBTDA from Same Store operations or from Acquired businesses leads to a $0.01 increase in EPS.
FIVE YEAR CAPITAL STRUCTURE SCENARIO
(in millions) | 2014A* | 2015 | 2016 | 2017 | 2018 | 2019 |
Adjusted Consolidated EBITDA | $61.7 | $70.2 | $77.2 | $84.4 | $91.8 | $99.8 |
Credit Facility and Term Note | 160.8 | 166.8 | 181.6 | 194.0 | 202.9 | 209.2 |
Convertible Subordinated Notes | 143.8 | 143.8 | 143.8 | 143.8 | 143.8 | 143.8 |
Stockholder's Equity | 179.9 | 208.8 | 236.0 | 265.6 | 299.0 | 336.3 |
Enterprise Value (Book) | $484.5 | $519.4 | $561.4 | $603.4 | $645.7 | $689.3 |
Ratios | ||||||
EV/Adjusted Consolidated EBITDA | 7.9 | 7.4 | 7.3 | 7.3 | 7.2 | 7.1 |
Senior Debt/Adj. Consolidated EBITDA | 2.6 | 2.4 | 2.4 | 2.3 | 2.3 | 2.2 |
Total Debt/Equity | 1.7 | 1.5 | 1.4 | 1.3 | 1.2 | 1.0 |
Five Year Take-Away Points: Ÿ Declining Leverage over time as equity grows substantially faster than debt. Ÿ Stockholders Equity increases 87% over 5 years. | |||
*2014A as per SEC 10-K filing and reported Trend Report
Carriage Services, Inc. ©2015 Carriage Services, Inc. All rights reserved.
Forward-looking statements contained herein are subject to certain risks and uncertainties as further described at the end of this Company & Investment Profile. Please refer to the section Disclosure of Non-GAAP Performance Measures on page 23 that discusses non-GAAP financial measures to GAAP financial measures.
Company & Investment Profile March 2015
CARRIAGE’S THREE MODELS
Carriage is uniquely positioned to attract the best talent and the best remaining independent businesses to our Company because we can differentiate our strategy within the funeral and cemetery industry, as defined by the following three models:
Standards Operating Model
Our “Being The Best” Standards focus on market share, people and operating and financial metrics that drive long-term performance. The Standards consist of 8 distinct and measurable Quantitative (financial) and Qualitative (people) metrics. The Standards Operating Model allows Carriage to determine the sustainable revenue growth and earning power of our portfolio of funeral home and cemetery businesses. The standards are designed to drive longer-term performance by growing market share, producing modest revenue growth and a sustainable, increasing level of earnings and free cash flow.
The Standards are not designed to maximize short-term financial performance. Carriage does not believe such performance is sustainable over the long term without ultimately stressing the business, which often leads to declining market share, revenues and earnings.
The Standards Operating Model eliminated the use of financial budgets in the company. The elimination of budgets increased the amount of time local Managing Partners can spend on growing their local businesses and staff development.
Standards achievement is the measure by which we judge the success of each business. Carriage has developed a customized systems infrastructure to measure business performance and Quantitative Standards achievement on a real-time basis. Qualitative Standards achievement related to staff development and market share improvement is measured on a quarterly basis.
Ÿ | Standards Council - The Standards Operating Model was originally developed by a group of former owner partners and top managers (the “Standards Council”) through evaluating the key drivers of success at Carriage’s best businesses. After each fiscal year, the Standards Council members review and approve the Standards Achievement and related incentive compensation awards for each business. |  |
Ÿ | Incentives Aligned with Standards - Each Managing Partner participates in a variable annual Being The Best bonus plan whereby they earn a percentage of their business’ calendar year earnings based on their Standards Achievement. All employees at each business are eligible for an annual bonus based on Standards Achievement. | |
Ÿ | Each Managing Partner also participates in a long-term (5 year) Good To Great variable bonus plan whereby they earn a payment equal to the average | |
Being The Best annual incentive bonus over five years times a multiple of twice the compounded annual growth rate of Net Revenue (Maximum 3%). Minimum 2% compound revenue growth over 5 years is required to be eligible for the Good To Great bonus. | ||
Carriage Services, Inc. ©2015 Carriage Services, Inc. All rights reserved.
Forward-looking statements contained herein are subject to certain risks and uncertainties as further described at the end of this Company & Investment Profile. Please refer to the section Disclosure of Non-GAAP Performance Measures on page 23 that discusses non-GAAP financial measures to GAAP financial measures.
Company & Investment Profile March 2015
• | League Tables - League tables are published each month within Carriage ranking the Managing Partners and their business by percentage of Standards Achievement (maximum 100%) from top to bottom. These drive peer-to-peer performance competition for our entrepreneurial Managing Partners. |
4E Leadership Model
The Standards Operating Model requires strong leadership to grow an entrepreneurial, high-value, personal service and sales business at sustainable Field EBITDA Margins. Our 4E Leadership Model is based upon principles established by Jack Welch during his tenure at General Electric. The Leadership Model identifies 4E qualities essential to succeed in a High Performance culture: Energy to get the job done; the ability to Energize others; the Edge necessary to make difficult decisions; and the ability to Execute and produce results.
To achieve a high level of Standards in a business year after year, Carriage must have “A Players” as Managing Partners. These “A Players” have the 4E leadership skills to grow the business by hiring, training and developing highly motivated and productive teams that produce results. We currently employ the strongest group of operational leaders in the history of Carriage.
Our Managing Partners participate in variable bonus plans in which they earn a percentage of their business’ earnings based upon the actual standards achieved. We believe our Managing Partners have the opportunity to be compensated at close to the same level as if they owned the business. The Being The Best and Good To Great bonus plans foster an environment in which “A Players” can thrive, be rewarded and recognized in our High Performance culture.
In combination, the Standards Operating Model and the 4E Leadership Model promote an entrepreneurial and ownership mindset throughout the entire Company. Carriage’s decentralized Operating model and linked compensation structure are unique in the funeral home and cemetery consolidation industry, which enables Carriage to attract the best talent and best remaining operators in the industry.
Strategic Acquisition Model
The Vision for Carriage over the next ten years is to affiliate with many of the best remaining independent funeral home and cemeteries in demographically attractive strategic markets. Our goal is to allocate the majority of growth capital in larger markets where we believe future revenue growth is the highest and acquire larger businesses with margins that are consistent or higher than the best businesses within our current portfolio. Through our Strategic Market Methodology we have defined 25-30 large and medium strategic markets that we intend to focus our acquisition activity over the next ten years.
The Strategic Acquisition Model is used to assess candidates based on ten specific criteria that Carriage has observed as being critical to the evaluation of a potential acquisition. These criteria include:
• | The motivation of the seller and their alignment to our Operating and Leadership Models. |
• | The competitive standing (market share) of the business and the demographic trends of the market. |
• | The 10 year trend of contract/internment volumes. |
• | A detailed 3 year history of the average revenue per contract/internment trends to determine the client family revenue profile. |
• | The institutional strength of the funeral home or cemetery brand along with market barriers to entry. |
Each of these ten criteria are weighted within the Strategic Acquisition Model and, in combination with a pro forma business EBITDA using our Standards Operating Model, allows Carriage to determine whether we should proceed with an acquisition and assign a preliminary valuation to the candidate.
The final valuation of the acquisition candidate is then determined through the application of an appropriate after-tax cash return on investment that exceeds the Company’s cost of capital. The Strategic Acquisition Model and the evaluation process give Carriage the flexibility to structure the transaction while at the same time ensuring shareholder value creation. All evaluations of acquisition candidates, final pro forma EBITDA and business
Carriage Services, Inc. ©2015 Carriage Services, Inc. All rights reserved.
Forward-looking statements contained herein are subject to certain risks and uncertainties as further described at the end of this Company & Investment Profile. Please refer to the section Disclosure of Non-GAAP Performance Measures on page 23 that discusses non-GAAP financial measures to GAAP financial measures.
Company & Investment Profile March 2015
valuations are reviewed and approved by the Executive Team and the Operations and Strategic Growth Leadership Team prior to a letter of intent being offered.
We believe that the consistent execution of the Strategic Acquisition Model will be a primary driver for higher revenue and profits in the future. Given our current size as a company and the attractive acquisition landscape, we can execute on our ten year vision for the growth of Carriage by making a small number of quality, strategic acquisitions per year. As we make strategic acquisitions our fixed Regional and Corporate Overhead will grow at a slower rate than revenue growth, which will allow a greater portion of acquired Field EBITDA to accrue to Adjusted Consolidated EBITDA, lead to increased Free Cash Flow, and be highly accretive to earnings per share (Overhead & Consolidation Platform Leverage).
The disciplined execution of the Strategic Acquisition Model will also lead to the incremental increase in the sustained earning power of our portfolio of funeral home and cemetery businesses over time, as defined by the improvement of our industry leading Adjusted Consolidated EBITDA Margin.
CARRIAGE PRENEED FUNERAL AND CEMETERY STRATEGY
Preneed Funeral
• | Our business strategy is Being The Best in each local market at providing high value funeral services that lead to market share gains and higher average revenue per contract over time. We therefore view Preneed Funeral programs as primarily defensive in nature. |
• | Consistent with our decentralized, entrepreneurial Standards Operating Model, Carriage’s Preneed Funeral Strategy emphasizes Managing Partner leadership to develop a sales strategy that is unique to local market competitive dynamics. |
• | Approximately 20% of funeral services performed in 2014 were funded through a Preneed contract. |
• | Local Preneed selling programs are designed to primarily protect and secondarily grow future market share and offer client families the opportunity to preplan funeral services that commemorate their lives. |
• | Preneed Funeral contracts are funded by depositing client money into Trust or through an Insurance policy with leading third party companies. |
• | The majority of Preneed Insurance policies are sold through third party agents and sales organizations. Carriage is able to leverage their selling expertise in local markets while keeping selling expenses low and earning commissions on Insurance sales. |
• | Interest earned and investment growth on Preneed Funeral contracts will exceed the increase in delivery costs at the time of death which will sustain and protect gross profit and margins. |
• | Investment growth on Preneed Funeral Trust contracts will grow at a faster rate than interest earned on Insurance contracts due to Carriage’s successful trust fund investment strategy that began in 2009. |
• | As of year-end 2014, Carriage had $423.4 million of Preneed Funeral contracts held in trust or funded by insurance policies. |
Preneed Cemetery
• | Carriage’s Preneed Cemetery Strategy is to build family heritage in our cemeteries by selling property and internment rights prior to death through full time, highly motivated and entrepreneurial local sales teams. |
• | Each Carriage Cemetery employs an experienced Sales Manager who is tasked with building dynamic sales teams and developing successful sales programs in consultation with the Cemetery Managing Partner and Regional leadership. |
• | Sales programs are supported by industry leading Cemetery property development funded with internally generated Free Cash Flow. |
• | Approximately 45% of Carriage’s Cemetery revenue comes from Preneed property sales. Sales of Cemetery property are recognized as revenue once 10% of the sales price is received. |
• | Client families often purchase Cemetery merchandise, such as markers and monuments, and other Cemetery services when they purchase Cemetery property. Revenue from Preneed Cemetery Merchandise and Service contracts are recognized at the time of death and the funds are placed into trust accounts until that time. |
Carriage Services, Inc. ©2015 Carriage Services, Inc. All rights reserved.
Forward-looking statements contained herein are subject to certain risks and uncertainties as further described at the end of this Company & Investment Profile. Please refer to the section Disclosure of Non-GAAP Performance Measures on page 23 that discusses non-GAAP financial measures to GAAP financial measures.
Company & Investment Profile March 2015
• | All states require that approximately 10% of revenue earned from the sale of Cemetery property be placed in Perpetual Care trusts. The interest income from these trusts is designated to offset the Cemetery care and maintenance expenses incurred by Carriage. |
• | Investment earnings from recognized Merchandise and Service contracts and Perpetual Care income are reported in the Cemetery Trust Earnings section of the Trend Reports. |
Preneed Trust Fund Investment Performance
Carriage took over direct management of our Discretionary Preneed Trust assets during the financial crisis in late 2008. The trust fund had previously been managed by a variety of outside money managers. We saw the financial crisis as an incredible opportunity to reposition the trust fund portfolio to align with our stated goal of Being The Best funeral home and cemetery operating company in the industry.
Since the beginning of 2009, our Discretionary Trust Portfolio has a total return of 172%, versus a total return of 159% for the S&P 500 and 141% for the High Yield Bond Index. During this same six year period, Carriage has recognized approximately $124 million in realized capital gains, interest income and dividends in the portfolio before taxes and fees. These realized capital gains and income have accrued to the underlying Preneed Funeral and Cemetery contracts. The increase in current income from the trust portfolio has allowed Carriage to recognize more income through our Cemetery perpetual care accounts, which is reported as GAAP income in current periods and is used to offset care and maintenance expenses in our cemeteries.
The repositioning of the trust fund portfolio and the subsequent management by Carriage has led to an increase Financial Revenue from $10.2 in 2009 to $19.0 million in 2014. Carriage has also been able to withdraw $13.6 million in earned income from certain Preneed Cemetery accounts in states that allow distributions of income prior to fulfillment of the preneed contract. We report the changes in available cash to be withdrawn from the accounts as Non-GAAP Withdrawable Trust Income in the Trend Reports. Carriage expects to average $100,000 in pre-tax Withdrawable Trust Income per month on a go forward basis.
In 2012, Carriage created a wholly owned, SEC registered, investment advisory subsidiary that enabled us to reduce the fees paid from the trust accounts to third parties and charge the trust portfolio 75 basis points annually for investment management services. The investment advisory subsidiary currently manages $181 million in Discretionary Trust assets, which represents 76% of Carriage’s total trust assets. The Discretionary Trust assets represent 100% of the Preneed Cemetery trusts, 100% of the Cemetery Perpetual Care trusts and 56% of the Preneed Funeral trust accounts.
Carriage Services, Inc. ©2015 Carriage Services, Inc. All rights reserved.
Forward-looking statements contained herein are subject to certain risks and uncertainties as further described at the end of this Company & Investment Profile. Please refer to the section Disclosure of Non-GAAP Performance Measures on page 23 that discusses non-GAAP financial measures to GAAP financial measures.
Company & Investment Profile March 2015
Carriage Management Team
Our management team is characterized by a dynamic High Performance culture that reacts quickly and proactively to address changing market conditions and emerging trends. This culture has been critical to our recent results and will provide a competitive advantage as the funeral and cemetery industry evolves. Our portfolio of operating businesses is organized into three Regions, each headed by a Regional Partner. The following are bios for the Executive Team, Board of Directors, Regional Partners, and members of the Operations and Strategic Growth Leadership Team.
EXECUTIVE TEAM
Melvin C. Payne is a management co-founder of Carriage and has been the Chairman of the Board and Chief Executive Officer since December 1996. Mr. Payne has been a director and Chief Executive Officer of Carriage since our inception in 1991. Prior to co-founding Carriage, Mr. Payne had extensive experience in other industries and roles including venture start-ups while spending 10 years in the private company turnaround business. Prior to his turnaround career, Mr. Payne worked 10 years in the corporate lending business, initially with Prudential Insurance Company and later with Texas Commerce Bank in Houston.
David J. DeCarlo became our President and Vice Chairman of the Board of Directors on March 3, 2014. From May 2011 to March 3, 2014, Mr. DeCarlo was an independent director of Carriage. He has had more than 24 years of experience in the death care industry, having served as an executive officer in various roles for Matthews International (“Matthews”), a leading worldwide supplier of death care products, including serving as President of the Bronze Division and Group President of the Memorialization Group. Mr. DeCarlo also served as a director of Matthews for 22 years. He retired from Matthews as Vice Chairman of the Board of Directors in 2008. Before joining Matthews in 1985, Mr. DeCarlo held diverse management and executive roles in finance, manufacturing, operations, sales, marketing and management and information systems at several Fortune 500 companies.
L. William Heiligbrodt is our Executive Vice President and Secretary. From September 2011 to March 3, 2014, Mr. Heiligbrodt was also our Vice Chairman of the Board. Mr. Heiligbrodt was an independent director of Carriage from February 2009 to September 2011. From February 2003 until his appointment on our Board, Mr. Heiligbrodt was a private investor and managing partner in a family business. Mr. Heiligbrodt was the President and Chief Operating Officer of SCI until February 1999, and, prior to holding such positions, served in various management positions with SCI beginning in February 1990. Prior to joining SCI, Mr. Heiligbrodt served as President of Provident Services, Inc. from March 1988 to February 1990. Prior to that, he served for five years as Vice Chairman and Chief Executive Officer of WEDGE Group Incorporated. Before WEDGE Group Incorporated, Mr. Heiligbrodt served as Chairman of Texas Commerce Bank, Houston and Vice Chairman of Texas Commerce Bancshares, Inc. and as a director of both companies.
INDEPENDENT DIRECTORS
Barry K. Fingerhut was elected to our Board in March 2012. Mr. Fingerhut has been the Chief Executive Officer and majority equity owner of Certification Partners, LLC, a developer and global distributor of IT certification programs, since the fall of 2010. Prior to 2010, he focused much of his career in investing in small capitalization companies in the for-profit education and training, publishing, media, consumer services, hydrocarbon, investment and financial services industries. He served as President of GeoCapital, LLC from 1981 to 2004, following two years at First Manhattan Co. and four years as a Limited Partner, then as General Partner of Weiss, Peck & Greer. In 1992, he co-founded Wheatley Partners, a venture capital partnership, specializing in investments in new technologies and services. In 2004, he formed Fingerhut Management, a family and friends investment office in New York City. In 2009, he co-founded The Caregiver Institute, LLC, formed to address the enormous challenges of aiding the work of home caregivers in the United States. Mr. Fingerhut serves as the Chairman of Carriage’s Corporate Governance Committee and also served on our Board for the period from 1995 through 1999.
Carriage Services, Inc. ©2015 Carriage Services, Inc. All rights reserved.
Forward-looking statements contained herein are subject to certain risks and uncertainties as further described at the end of this Company & Investment Profile. Please refer to the section Disclosure of Non-GAAP Performance Measures on page 23 that discusses non-GAAP financial measures to GAAP financial measures.
Company & Investment Profile March 2015
Donald D. Patteson, Jr. was elected to our Board in August 2011. Mr. Patteson founded Sovereign Business Forms, Inc. (“Sovereign”), a consolidator in the printing industry, in 1996 and served as its Chief Executive Officer until his retirement in August of 2008. He continued to serve as the Chairman of the Board of Directors of Sovereign until its sale in June 2014. Mr. Patteson also previously served as President and Chief Executive Officer of WBC Holdings, Inc., a consolidator in the rent-to-own industry, and was President and Chief Executive Officer of Temple Marine Drilling, Inc. /R.C. Chapman Drilling Co., Inc., a consolidation and workout subsidiary of GE Capital in the drilling industry. Mr. Patteson began his business career with Arthur Andersen’s management consulting practice. Mr. Patteson currently serves on the Board of Directors of Rosetta Resources, Inc. and Cal Dive International Inc. Mr. Patteson serves as chairman of Carriage’s Audit Committee.
Richard W. Scott is a seasoned financial services executive with over 30 years of capital markets experience. Since January 2009, he has served as the Senior Vice President and Chief Investment Officer of Loews Corporation, a diversified holdings company, and from 2001 to 2008 he was a senior executive in Insurance Portfolio Management with AIG Investments, a global company engaged in asset management, including service as the Chief Investment Officer-Insurance Operations. His career has included extensive executive and professional responsibility for all aspects of fixed income and insurance portfolio management on both domestic and global platforms, as well as extensive experience as a mergers and acquisitions and capital markets attorney. Mr. Scott serves as Chairman of Carriage’s Compensation Committee and also the Lead Director.
REGIONAL PARTNERS
Mark R. Bruce: Regional Partner - East Region. Prior to his appointment as Regional Partner - East Region in November 2010, Mr. Bruce served as our Director of Sales Support, Director of Support, Director of Training and Development and Regional Partner-Central. Prior to joining Carriage in 2005, Mr. Bruce served for 12 years in various sales and operational leadership roles with other public funeral and cemetery service companies.
Paul D. Elliott: Regional Partner - West Region. Prior to joining Carriage in September 2012, Mr. Elliott was Managing Director for SCI. From February 1995 to August 2012, Mr. Elliott held various management roles in sales, corporate and operations with SCI. From September 1984 to December 1994, Mr. Elliott was a partner in his family's funeral home in Kansas.
Shawn R. Phillips: Regional Partner - Central Region. Prior to his appointment as Regional Partner-Central in June 2011, Mr. Phillips served as our Regional Partner-West. Prior to joining Carriage in September 2007, Mr. Phillips served from 1983-2007 in various leadership and operational roles with other public funeral service and cemetery companies. From 1979-1983, Mr. Phillips worked for an independent funeral operator. Mr. Phillips is a licensed Funeral Director and Embalmer.
Carriage Services, Inc. ©2015 Carriage Services, Inc. All rights reserved.
Forward-looking statements contained herein are subject to certain risks and uncertainties as further described at the end of this Company & Investment Profile. Please refer to the section Disclosure of Non-GAAP Performance Measures on page 23 that discusses non-GAAP financial measures to GAAP financial measures.
Company & Investment Profile March 2015
OPERATIONS AND STRATEGIC GROWTH LEADERSHIP TEAM
The Operations and Strategic Growth Leadership Team (OSGLT) is comprised of the leaders responsible for all the functional departments supporting our Field operations. The Support departments are critical to the success of Carriage as a Consolidation Platform and play an integral role for our local businesses in achieving Standards Achievement and financial performance over the long term. The following are biographies for the OSGLT:
Viki K. Blinderman, CPA: Chief Accounting Officer. Prior to her appointment as Chief Accounting Officer in May 2013, Ms. Blinderman served as our Director of External Reporting and Internal Audit, Assistant Controller and Corporate Controller. Prior to joining Carriage in May 2002, Ms. Blinderman served as the Chief Financial Officer of a privately-held litigation support firm for three years and seven years in the practice of public accounting.
C. Benjamin Brink: Treasurer. Responsibilities include the daily cash operations and the day-to-day management of all preneed trust funds for the Company including investment research and the operation of our wholly owned SEC registered Investment Advisory subsidiary. Mr. Brink joined Carriage in January 2009 after serving as the Cash Manager for International Paper in their Corporate Treasury group.
Grae Griffin: Vice President - Human Resources & Legal. Prior to joining Carriage in May 2014, Mr. Griffin was the Executive Vice President of Human Resources at Consolidated Graphics. He previously served as an Associate Attorney for Neel, Hooper & Banes P.C. and Fisher & Phillips, LLP.
Gabriel Q. Ngo: Vice President - Operational Support. Prior to joining the Company’s operational leadership in July 2012, he was our Director of Internal Audit for six years. Before joining Carriage in 2006, Mr. Ngo had prior experience with accounting & audit consulting in the death care services, oil & gas, finance & mortgage, and technology industries as well as experience in finance & banking operations.
Brijesh K. Patel: Director - Operations, Analysis & Planning. Mr. Patel joined Carriage in September 2007 as a Senior Operational Analyst and was promoted to Director in January 2012. He previously served as a Senior Financial Analyst at Waste Management, Inc. and has had prior experience in entrepreneurship, operations and finance. Mr. Patel also served in the United States Army from 1989 to 1992.
Robert K. Prescott: Director - Corporate Finance. Prior to joining Carriage in 2011, he lived in India where he first served as the Financial Analyst and then as the Chief Financial Officer including the responsibility for the investment portfolio and member of the Board of Directors for an educational foundation. Mr. Prescott previously was a risk management consultant for ten years and worked in the Middle East and Houston for one of the largest risk management firms in the world.
Jeffrey D. Roberts: Chief Information Officer. Joined Carriage in July 2013 after previous experience in the Commercial Real Estate, Financial Services, Healthcare and Energy industries. After early career advancement in applications and database project management roles, Jeff has held executive IT leadership positions since 1996. He previously served as Chief Information Officer and Chief Technology Officer for The Situs Companies and for subsidiaries of Morgan Stanley and Goldman Sachs.
Dennis L. Smith: Managing Director - Cemetery Operations. Joined Carriage in April 2012. Mr. Smith has been a licensed embalmer and funeral director then advanced to successful sales and sales management and most recently, cemetery design, development and operations. With over thirty eight years of experience as a death care industry professional, Mr. Smith has led and developed cemetery and funeral sales teams and has been responsible for over $150 million in cemetery project development in North America.
Carriage Services, Inc. ©2015 Carriage Services, Inc. All rights reserved.
Forward-looking statements contained herein are subject to certain risks and uncertainties as further described at the end of this Company & Investment Profile. Please refer to the section Disclosure of Non-GAAP Performance Measures on page 23 that discusses non-GAAP financial measures to GAAP financial measures.
Company & Investment Profile March 2015
CAUTIONARY STATEMENT ON FORWARD LOOKING STATEMENTS
In addition to historical information, this Company & Investment Profile contains forward-looking statements within the safe harbor provisions of the Private Securities Litigation Reform Act of 1995. Such statements typically are identified by terms expressing our future expectations or projections of revenues, earnings, earnings per share, cash flow, market share, capital expenditures, effects of operating and acquisition initiatives, gross profit margin, debt levels, interest costs, tax benefits and other financial items. All forward-looking statements, although made in good faith, are based on assumptions about future events and are therefore inherently uncertain, and actual results may differ materially from those expected or projected. Forward-looking statements speak only as of the date of this report, and we undertake no obligation to update or revise such statements to reflect new circumstances or unanticipated events as they occur. Readers should carefully review the Cautionary Statements described in this and other documents we file from time to time with the Securities and Exchange Commission, including Annual Reports on Form 10-K and Current Reports on Form 8-K filed by Carriage in the future. A copy of the Company’s Form 10-K, and other Carriage Services information and news releases, are available at www.carriageservices.com.
DISCLOSURE OF NON-GAAP PERFORMANCE MEASURES
We report our financial results in accordance with generally accepted accounting principles (“GAAP”). However, this investment profile uses the following Non-GAAP financial measures: “Funeral and Cemetery Field EBITDA,” “Total Field EBITDA,” “Consolidated EBITDA or EBITDA,” “Adjusted Consolidated EBITDA,” “Non-GAAP Diluted EPS,” and “Free Cash Flow”. Both Free Cash Flow (cash provided by operating activities less maintenance capital expenditures) and EBITDA are used by investors to value common stock. The Company considers Free Cash Flow to be an important indicator of its ability to generate cash for acquisitions and other strategic investments. The Company has included EBITDA in this investment profile because it is widely used by investors to compare the Company's financial performance with the performance of other death care companies. The Company also uses Total Field EBITDA and Total Field EBITDA Margin to monitor and compare the financial performance of the individual funeral and cemetery field businesses. EBITDA does not give effect to the cash the Company must use to service its debt or pay its income taxes and thus does not reflect the funds actually available for capital expenditures. In addition, the Company’s presentation of EBITDA may not be comparable to similarly titled measures other companies report. Non-GAAP financial measures should be viewed in addition to, and not as an alternative for, the Company’s reported operating results or cash flow from operations or any other measure of performance as determined in accordance with GAAP. Pursuant to the requirements of Regulation G, the Company has provided quantitative reconciliations within the most current press release and on our Investor Relations page of the website of the non-GAAP financial measures to the most directly comparable GAAP financial measures.
Carriage Services, Inc. ©2015 Carriage Services, Inc. All rights reserved.
Forward-looking statements contained herein are subject to certain risks and uncertainties as further described at the end of this Company & Investment Profile. Please refer to the section Disclosure of Non-GAAP Performance Measures on page 23 that discusses non-GAAP financial measures to GAAP financial measures.
High Performance Culture Organizational Structure
January 22, 2015
I believe this past year moved us closer to the idea of Carriage being a High Performance Culture Company with our Independent Board Members, Executive Team and Operations and Strategic Growth Leadership Team in alignment with our First, Third and Fifth Guiding Principles:
▪ | Honesty, Integrity and Quality in All that We Do; |
▪ | Belief in the Power of People through Individual Initiative and Teamwork; and |
▪ | Growth of the Company is Driven by Decentralization and Partnership. |
Since the major management reorganization in November 2011 and then launching “Carriage Services 2012: A NEW BEGINNING!”, we have gone through three organizational advancing phases that were initiated on November 4, 2011, March 5, 2014 and January 22, 2015. I fully realize that my ideas about many things are unorthodox, but I have reached a point in my life and career where I wear such differences as they relate to Carriage as a badge of honor and could not care less (within reason) what anyone else thinks about them. I do care greatly about the high and sustainable performance that these ideas and concepts inspire and produce with our field and home office leaders and employees. I never do anything consciously that would not be in the best long term interest of Carriage.
I have attached a new organizational structure that reflects how the leadership team dynamic has actually been working over the last few months, i.e. more collaborative, communicative, cooperative, honest (about weaknesses), responsible (for all parts), accountable, and much more fun and effective across all support departments and corporate development and field operations. Yet there is still much work to do, which is why we will never reach true Greatness on our Carriage Good To Great Journey.
I have never believed in the conventional orthodoxy of titles, perks, privileges, incentive compensation biased to short term versus sustainable long term performance, bureaucratic layers and corporate ladder politics with competing cliques and personal agendas not in the best long term interest of the enterprise. I do believe in the simple idea of meritocracy where each day every individual leader and each team tries to improve their fundamental skills, knowledge, and leadership in a way that drives our high performance gradually higher over time, i.e. the “Trend becomes our Friend” and the collaboration, learning and teamwork becomes addictive! Kind of like a high performance culture leadership cult!
So please reflect on the simplicity of the proposed new organizational chart with “no titles for nobody” and no direct reports! We simply respond on a daily, weekly, monthly basis as appropriate to others both individually and in teams to achieve our high and sustainable performance and value creation goals, always looking for better ideas and opportunities to celebrate success by others in the field and home office and for ways to recognize and motivate the team to even higher levels of commitment, performance and value creation.
I believe with passionate conviction that the way our company Executive and Senior Leadership is collaborating and executing our three Models with effective 4E Leadership is broadly and deeply producing a Good To Great Flywheel Effect that will accelerate our Carriage Good To Great Journey through sustained high operating and financial performance followed by a higher enterprise valuation over time. In other words, after twenty-four years, I believe Carriage is entering its appropriate “time in the sun” as an investment platform.
Melvin C. Payne


4100 Alpha Road
Suite 215
Dallas, TX 75244
214.353.9519
February 17, 2014
Mr. Richard Scott
Chairman of the Compensation Committee
Carriage Services, Inc.
3040 Post Oak Blvd. Suite 300
Houston, TX 77056
Dear Richard,
We were recently asked by the Compensation Committee of Carriage Services’ Board to review alignment between CEO pay and company performance and to make recommendations regarding your 2015 compensation proposal shareholder vote. This letter summarizes the results of our CEO pay and performance analysis and also, documents our recent discussions regarding recommendations to improve your 2015 executive compensation advisory vote (“Say-on-Pay”).
CEO Pay and Performance Alignment
Our approach to this analysis was to compare Carriage CEO pay and performance to peer company CEO pay and performance. Carriage has very few pure industry segment peers and thus, a peer group must be selected based on broader comparisons. We conducted a completely objective analysis to develop two peer groups:
1) | Companies of comparable size that correlate best with Carriage’s total shareholder return (TSR), EBITDA and EPS growth over an extended timeframe (“Financial Peers”-18 companies) |
2) | Companies of comparable size in your two-digit, consumer services industry classification (“Industry Peers” - 19 companies) |
The only variation from these criteria is the selection of two industry comparators that otherwise would not have been included due to size and/or financial performance (SCI and Stonemor).
The chart that follows shows the relationship between total direct compensation (the sum of base salary, bonus, the fair market value of long-term incentives, and all other compensation reported) for CEOs in the Financial Peer group (as reported in the last proxy) and three-year annualized TSR growth calculated as a percent. The Carriage data point (“CSV”) is shown in red. Your direct industry competitors, SCI and Stonemor, are also highlighted.
2 | Page
Financial Peer Group Pay for Performance Alignment
(Source: Compustat Nov 2011-Nov 2014)

(Chart excludes Mobile Mini due to scale. See Exhibit 1)
When ranked among this group, Carriage’s 2013 total compensation for the CEO was at the 32nd percentile (i.e., 68% had higher pay), while Carriage annualized TSR was at the 100th percentile (the highest rank). Note that this group included companies whose financial performance best tracked with Carriage’s positive financial performance in recent years, and thus, this group has performed to a high standard on EPS growth, EBITDA growth and/or TSR.
We find a similar pattern in the following chart where the same analysis was conducted for Consumer Services peers. Carriage performed at the 95th percentile and Carriage 2013 CEO total direct compensation was at the 35th percentile.
3 | Page
Consumer Services Peer Group Pay for Performance Alignment
(Source: Compustat Nov 2011- Nov 2014)

(Chart excludes Nautilus due to scale. See Exhibit 2.)
The “Good to Great” performance equity award was paid in cash in January, 2014, and thus, was not reported as 2013 compensation. The award will be reported as part of 2014 compensation in the 2015 proxy statement. We project that the value of that award will increase the CEO’s estimated pay rank among financial peers to 3rd (with a TSR rank of first). If the value of that award is annualized over the performance cycle that it was ultimately tied to (August, 2012-January, 2014), the estimated pay rank among financial peers would be fourth.
Among Consumer Services peers, the award will raise estimated pay rank to second, with a TSR rank of second (whether annualized across the performance period or not).
The attached Exhibits provide the detailed data associated with this analysis.
In sum, prior to 2014, compensation for the Carriage CEO was considerably lower than what would have been expected given three-year TSR performance. It appears that for 2014, pay and performance were well-aligned.
Recommendations Regarding 2015 Compensation Proposal Shareholder Vote
In 2013, your advisory vote to ratify named executive officers’ compensation (“Say-on-Pay”) passed with approximately 95% support. In 2014, the management proposal failed, with about 47% support. Further, in 2013, Management’s proposal to approve the stock plan also failed. You have asked us to
4 | Page
document recommendations that we have been discussing since December to improve shareholder support of Management’s compensation proposals. As we have noted, lack of shareholder support appears to be based on specific pay practices-e.g., acceleration of the payment of the Good to Great grants and allocation of these awards to Directors, rather than level of executive pay. Our near-term recommendations have included:
a. | Conduct a shareholder outreach effort with high personal involvement by Mel Payne, your CEO and Chairman; |
b. | Provide a more thorough job explaining the Good to Great grant and pay for performance philosophy in your proxy; |
c. | Do not request additional shares until 2016 (estimate based on current share pool) |
d. | Do not make another performance-based equity grant until you have had sufficient time to study design options fully; communicate this decision in your proxy - In general, performance-based equity grants are viewed to be best practice, but more focused work needs to be conducted on possible award provisions. Further, Carriage should model the alignment between executive value and shareholder value creation under various scenarios. |
More detailed plan design recommendations will be forthcoming as we continue to work with Carriage.
************************************************************************************
Richard, I hope this letter addresses your recent questions. Please let me know if any of this commentary requires further clarification.
Sincerely,

Marsha Cameron
Partner and Co-founder
5 | Page

6 | Page

Serious News for Serious Traders! Try StreetInsider.com Premium Free!
You May Also Be Interested In
- Carriage Services Announces 2024 First Quarter Earnings Release and Conference Call Schedule
- National pharmacare will reduce access to new medicines for 27 million privately insured Canadians
- Bluerock Value Exchange Fully Subscribes $54.9 Million Diversified Industrial Portfolio II DST
Create E-mail Alert Related Categories
SEC FilingsSign up for StreetInsider Free!
Receive full access to all new and archived articles, unlimited portfolio tracking, e-mail alerts, custom newswires and RSS feeds - and more!
