

Form 8-K Block, Inc. For: May 05
 Tweet
Tweet Share
ShareExhibit 99.1

Q1’22 Highlights

|

|

| ||
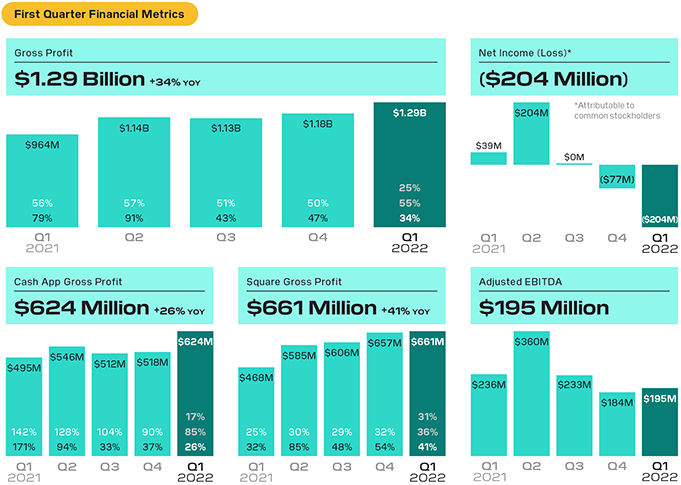
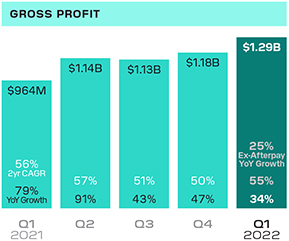
| In the first quarter of 2022, we generated gross profit of $1.29 billion, up 34% year over year. Cash App generated gross profit of $624 million, up 26% year over year. Square generated gross profit of $661 million, up 41% year over year. On January 31, we completed our acquisition of Afterpay, a global “buy now, pay later” (BNPL) platform. We have allocated 50% of Afterpay revenue and gross profit to each of Square and Cash App. | We are focused on expanding our customers’ awareness and access to bitcoin, which has allowed us to drive meaningful adoption: As of the end of the first quarter, more than 10 million Cash App accounts have bought bitcoin since the product was introduced. | We continued to grow upmarket with more complex sellers: Square’s mid-market sellers demonstrated strong momentum in the first quarter, with gross profit up 47% year over year, outpacing total Square gross profit. | ||
|
Ex-Afterpay YoY Growth
2yr CAGR
YoY Growth |
| |
| Ex-Afterpay YoY Growth
2yr CAGR
YoY Growth
|
In the first quarter of 2022, total net revenue was $3.96 billion, down 22% year over year, and, excluding bitcoin revenue, total net revenue was $2.23 billion, up 44% year over year. Excluding bitcoin revenue and Afterpay revenue, total net revenue was $2.10 billion, up 36% year over year.
The following items affected net income (loss) per share during the respective periods. In the first quarter of 2022, we recognized an unrealized gain of $50 million driven by the revaluation of equity investments, as well as Afterpay-related transaction charges of $42 million of one-time deal and integration-related expenses, $31 million of amortization of acquired intangible assets, and $66 million of one-time accelerated stock-based compensation. In the fourth quarter of 2021, we recognized a loss of $6 million driven by the adjustment to the revaluation of equity investments. In the third quarter of 2021, we recognized a loss of $7 million driven by the adjustment to the revaluation of equity investments as well as a $6 million bitcoin impairment loss. In the second quarter of 2021, we recognized a $77 million gain on our equity investments and a $45 million bitcoin impairment loss. In the first quarter of 2021, we recognized a loss of $29 million related to the mark-to-market valuation of our investment in DoorDash, as well as a $20 million bitcoin impairment loss.
A reconciliation of non-GAAP financial measures used in this letter to their nearest GAAP equivalents is provided at the end of this letter.
The compound annual growth rate (CAGR) is the mean annual growth rate over a specified time period. Given the variability in year-over-year comparisons due to COVID-19, we believe using two-year CAGRs from 2020 to 2022 better reflects underlying growth trends through the first quarter of 2022.
|
|
BLOCK Q1 2022 2 |

| SELLER HIGHLIGHT Oryza in Hobart, Tasmania uses Square Stand, Square Terminal, Square Point of Sale, and Square Online. |

| |
| To Our Shareholders | ||
| May 5, 2022 | We delivered impressive growth at scale during the first quarter of 2022. Gross profit grew 34% year over year to $1.29 billion, up 55% on a two-year compound annual growth rate (CAGR) basis. Afterpay contributed $92 million of gross profit in the months of February and March, with $46 million of gross profit recognized in each of Cash App and Square. Excluding Afterpay, gross profit was $1.20 billion, up 25% year over year and 49% on a two-year CAGR basis. Our Cash App ecosystem delivered gross profit of $624 million, an increase of 26% year over year and, excluding Afterpay, 17% year over year. Our Square ecosystem delivered gross profit of $661 million, an increase of 41% year over year and, excluding Afterpay, 31% year over year. | |
|
|
BLOCK Q1 2022 3 |

A transacting active is a Cash App account that has at least one financial transaction using any product or service within Cash App during the specified period. A transacting active for a specific Cash App product has at least one financial transaction using that product during the specified period and is referred to as an active. Certain of these accounts may share an alias identifier with one or more other transacting active accounts. This could represent, among other things, one customer with multiple accounts or multiple customers sharing one alias identifier (for example, families).
1. Piper Sandler Gen Z consumer survey, Spring 2022.
Cash App Ecosystem
Strengthening the network
Cash App has focused on strengthening its network by reaching families, a relatively new audience. While still early, Cash App has seen strong traction since offering peer-to-peer and banking capabilities to families in early November. We also started rolling out the ability for teens to deposit paper money at participating retailers like Walgreens and Walmart, which we believe can drive further inflows into Cash App. Historically teens have a higher mix of cash in their spend compared to the general population, which we believe underscores the opportunity to enable more teens to take advantage of the secular shift towards digital wallets.1
Driving engagement
We are focused on expanding our customers’ awareness and access to bitcoin, which has allowed us to drive meaningful adoption: As of the end of the first quarter, more than 10 million Cash App accounts have bought bitcoin since the product was introduced. In April, we announced that U.S. customers can now send and receive bitcoin to anyone with a compatible wallet via the Lightning Network. The Lightning Network is built to process a large number of transactions per second. Typical transactions conducted directly on the bitcoin blockchain can take upwards of 10 minutes — now it’s nearly instant with Cash App over the Lightning Network. This new feature expands our peer-to-peer capabilities and presents an opportunity to strengthen our network with bitcoin while eliminating fees and processing times from sending bitcoin through on-chain transactions.
Increasing inflows into our ecosystem
In April, we announced a new direct deposit feature that allows customers to be paid in bitcoin. Cash App customers in the U.S. with an activated Cash Card are able to receive a portion of their recurring paycheck deposit in bitcoin with no transaction fee. We have experienced growing momentum with customers bringing their paychecks into Cash App, and hope this feature will expand awareness of our direct deposit capabilities.

In April, Cash App introduced a new feature allowing customers to have a percentage of their direct deposits automatically converted into bitcoin for free.
|
|
BLOCK Q1 2022 4 |
Afterpay active sellers are defined as a seller that has transacted in one channel at least once in the last 12 months. Active sellers are counted for each sales channel in which they transact.
1. Represents sellers who funded their account with at least $50 within the month after signing up.
Square Ecosystem
Enhancing our ecosystem of products
We are focused on enabling omnichannel commerce and building innovative solutions that meet sellers and their customers wherever they are. Since integrating Afterpay’s buy now, pay later (BNPL) functionality with Square Online and eCommerce API in the U.S. and Australia, we have seen nearly 13,000 Square merchants adopt and process BNPL sales through the first quarter, which grew Afterpay active sellers by 10%. We believe this will drive greater conversion and sales for our sellers, and we plan to make the offering available for in-person payments.
In April, we introduced the newest version of Square Stand, featuring modernized hardware and a redesigned customer experience to help sellers take in-person payments and manage eCommerce sales, deliveries, and in-store orders from a single place. Square Stand now integrates tap and dip payments directly (with no additional card reader needed) for an intuitive, transparent, and streamlined commerce experience. Priced at just $149, Square Stand is our most affordable countertop product, allowing sellers to pay one transparent rate for every tap or dip transaction, with no hidden fees or long-term contracts, and free access to the Square POS app. The new Square Stand is available in all eight of our global markets, reinforcing our commitment to improve global product parity while helping sellers run their entire business — whether they are just getting started or operating growing, large businesses.
Growing upmarket
Mid-market sellers continued to show strong momentum in the first quarter, with gross profit up 47% year over year, outpacing total Square gross profit. Mid-market sellers have been leveraging Square Savings, launched in July 2021, to set aside funds for the future: In the first quarter, mid-market sellers were twice as likely to fund their account soon after opening compared to the average seller using Square Savings.1 Square Savings helps sellers simplify budgeting by automatically setting aside funds from daily sales into savings accounts.
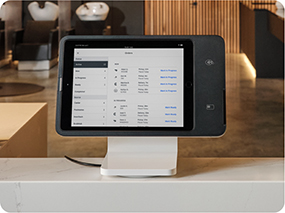
Square Stand provides sellers of any size, from boutique retailers to multi-location restaurants, with a versatile command center for their business, enabling sellers to take in-person payments and manage eCommerce sales, deliveries, and buy online, pick up in-store orders from a single place.
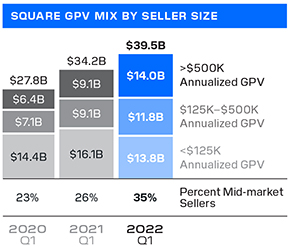
We determine seller size based on annualized GPV during the applicable quarter. A mid-market seller generates more than $500,000 in annualized GPV. Does not include contributions from Afterpay because BNPL products are recognized as subscription and services based-revenue, and not transaction-based revenue.
|
|
BLOCK Q1 2022 5 |
Expanding globally
We further strengthened our international presence by improving product parity in both new and existing markets. We expanded our offerings in Canada with the introduction of Square Loans and On-Demand Delivery (ODD). With Square Loans, we are widening access to credit for sellers in Canada, helping them manage their cash flow and grow their business while also amplifying the ecosystem of tools and services we offer in our international markets. With ODD, Square Online sellers can offer third-party delivery to customers directly from their own website, providing control of the fulfillment process and more favorable economics as compared to directly using most third-party delivery services.
In Ireland, we launched both Square Loyalty and Square Marketing in February. Square Loyalty makes it easy to set up a customized loyalty program that rewards customers both in-store and online, and we’ve found it can increase repeat visits. With Square Marketing, sellers have more tools to retain and reengage their customers through driving repeat visits, increasing buyer spend, and also growing their customer base.
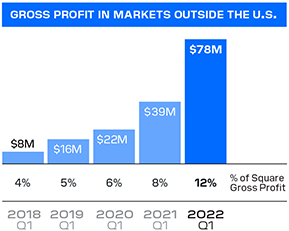
Square gross profit in markets outside the U.S. includes contributions from Afterpay during the first quarter of 2022. Excluding Afterpay, Square gross profit in markets outside the U.S. was $58 million, representing 9% of Square gross profit.
|
|
BLOCK Q1 2022 6 |
A reconciliation of non- GAAP metrics used in this letter to their nearest GAAP equivalents is provided at the end of this letter.
Financial Discussion
REVENUE AND GROSS PROFIT
Total net revenue was $3.96 billion in the first quarter of 2022, down 22% year over year, driven by a decrease in bitcoin revenue. Excluding bitcoin, total net revenue in the first quarter was $2.23 billion, up 44% year over year. Gross profit was $1.29 billion in the first quarter, up 34% year over year and up 55% on a two-year CAGR basis.
On January 31, we completed our acquisition of Afterpay, a global BNPL platform. In the first quarter of 2022, Afterpay contributed $130 million of revenue and $92 million of gross profit, which includes $9 million of amortization of acquired technology assets. Excluding bitcoin and Afterpay, revenue was $2.10 billion, up 36% year over year and up 40% on a two-year CAGR basis. Excluding Afterpay, gross profit was $1.20 billion, up 25% on a year-over-year basis and 49% on a two-year CAGR basis. We recognize Afterpay revenue as subscription and services-based revenue, and have allocated 50% of Afterpay revenue and gross profit to each of Square and Cash App.
Transaction-based revenue was $1.23 billion in the first quarter of 2022, up 28% year over year, and transaction-based gross profit was $514 million, up 19% year over year. We processed $43.5 billion in GPV in the first quarter of 2022, up 31% year over year. Transaction-based gross profit as a percentage of GPV was 1.18% in the first quarter of 2022, down 12 basis points year over year and flat quarter over quarter.
Subscription and services-based revenue was $960 million in the first quarter of 2022, up 72% year over year, and subscription and services-based gross profit was $764 million, up 63% year over year, including contributions from Afterpay. Excluding the $130 million in subscription and services-based revenue and $92 million in subscription and services-based gross profit from Afterpay, subscription and services-based revenue was $830 million, up 49% year over year, and subscription and services-based gross profit was $671 million, up 44% year over year.
Bitcoin revenue was $1.73 billion in the first quarter of 2022, down 51% year over year. Bitcoin gross profit was $43 million, or approximately 3% of bitcoin revenue.
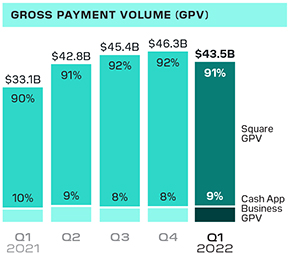
Note: Square GPV and Cash App Business GPV are represented as a percent of total GPV. Does not include contributions from Afterpay because BNPL products are recognized as subscription and services based-revenue, and not transaction-based revenue.
|
|
BLOCK Q1 2022 7 |
CASH APP ECOSYSTEM REVENUE AND GROSS PROFIT
In the first quarter of 2022, Cash App generated $2.46 billion of revenue and $624 million of gross profit. On a year-over-year basis, Cash App revenue was down 39% and gross profit was up 26%, and on a two-year CAGR basis, Cash App revenue and gross profit grew 116% and 85%, respectively. Excluding bitcoin and Afterpay, Cash App revenue was $667 million, up 26% year over year and 73% on a two-year CAGR basis.
Afterpay contributed $65 million of revenue and $46 million of gross profit to Cash App in the first quarter of 2022. Excluding Afterpay, Cash App generated $578 million of gross profit, up 17% on a year-over-year basis and 78% on a two-year CAGR basis.
We continued to drive strong engagement across our broader ecosystem of products. We saw inflows improve in February and March compared to January, driven primarily by macroeconomic recovery and the benefit of tax refunds. Year-over-year gross profit growth was negatively impacted by the significant benefit Cash App received in March 2021 from government stimulus disbursements, which did not recur in 2022.
Cash App Business GPV was $4.0 billion, up 17% year over year and up 96% on a two-year CAGR basis. Cash App Business GPV includes Cash for Business, which consists of peer-to-peer transactions received by business accounts and peer-to-peer payments sent from a credit card. Cash App generated $109 million of transaction-based revenue during the first quarter of 2022, up 19% year over year and up 98% on a two-year CAGR basis. Growth was driven by an increase in the number of business accounts and in the number of transactions.
|
|
BLOCK Q1 2022 8 |
Bitcoin revenue is the total sale amount of bitcoin to customers. Bitcoin costs are the total amount of bitcoin that we purchase. We purchase bitcoin to facilitate customers’ access to bitcoin.
Cash App generated $622 million of subscription and services-based revenue during the first quarter, up 43% year over year and 79% on a two-year CAGR basis, including contributions from Afterpay. Growth in the quarter was driven by transaction fees from both Cash Card and Instant Deposit, as well as contributions from Afterpay. Excluding $65 million in revenue from Afterpay, subscription and services-based revenue was $557 million, up 28% year over year and up 70% on a two-year CAGR basis.
Cash App generated $1.73 billion of bitcoin revenue and $43 million of bitcoin gross profit during the first quarter of 2022, down 51% and 42% year over year, respectively. On a two-year CAGR basis, bitcoin revenue and gross profit grew 138% and 155%, respectively. The year-over-year decrease in bitcoin revenue and gross profit was driven primarily by relative stability in the price of bitcoin during the quarter, which affected consumer demand and trading activity compared to the prior year period. Bitcoin revenue and gross profit were relatively consistent compared to the fourth quarter of 2021. In future quarters, bitcoin revenue and gross profit may fluctuate as a result of changes in customer demand or the market price of bitcoin.
|
|
BLOCK Q1 2022 9 |
SQUARE ECOSYSTEM REVENUE AND GROSS PROFIT
In the first quarter of 2022, Square generated $1.44 billion of revenue and $661 million of gross profit. On a year-over-year basis, Square revenue and gross profit grew 42% and 41%, respectively, and on a two-year CAGR basis, Square revenue and gross profit grew 30% and 36%, respectively.
Afterpay contributed $65 million of revenue and $46 million of gross profit to Square in the first quarter of 2022. Excluding Afterpay, Square generated $1.38 billion of revenue and $615 million of gross profit, up 35% and 31% on a year-over-year basis, respectively. On a two-year CAGR basis, Square revenue and gross profit excluding Afterpay grew 27% and 31%, respectively.
In the first quarter of 2022, Square generated $1.12 billion of transaction-based revenue, up 29% year over year and 24% on a two-year CAGR basis. We saw strong growth on a year-over-year and two-year CAGR basis driven by both in-person and online channels. In January, Square GPV growth slowed due to impacts from COVID-19, before improving in February and March. During the quarter, Square transaction-based gross profit was affected by a lower percentage of debit card transactions on a year-over-year basis.
In the first quarter of 2022, Square GPV was up 33% year over year and 27% on a two-year CAGR basis. We observed the following trends in Square GPV during the first quarter of 2022.
| • | Products: Card-present GPV achieved strong growth in the first quarter, up 41% year over year and 26% on a two-year CAGR basis. Card-not-present GPV was up 21% year over year and 27% on a two-year CAGR basis, driven primarily by growth from our online channels, including Square Online, Invoices, Virtual Terminal, and eCommerce API. |
| • | Geographies: In the first quarter, Square GPV in our U.S. market grew 31% year over year, and growth in our international markets was 49% year over year, outpacing overall Square GPV growth. GPV in both our U.S. and international markets was impacted periodically by COVID-19, particularly in January. |
|
|
BLOCK Q1 2022 10 |
Square generated $283 million of subscription and services-based revenue during the first quarter of 2022, up 133% year over year, and up 66% on a two-year CAGR basis, including contributions from Afterpay. Excluding $65 million of subscription and services-based revenue from Afterpay, subscription and services-based revenue was $218 million, up 80% year over year and 46% on a two-year CAGR basis.
| • | Banking: Revenue from seller banking products achieved strong growth on a year-over-year and two-year CAGR basis. This includes Instant Transfer, Square Card, and Square Loans, which represent most of our financial services products for sellers. |
| • | Square Loans: Square Loans achieved strong gross profit growth during the first quarter of 2022, facilitating approximately 90,000 loans totaling $756 million in originations. Square Loans gross profit benefited from Paycheck Protection Program (PPP) loan forgiveness during the first quarter, which is primarily a near-term benefit as gross profit is recognized in the period PPP loans are forgiven. |
| • | Software: Revenue from software subscriptions delivered strong growth during the quarter, and gross profit growth continued to outpace overall Square gross profit growth. |
Hardware revenue in the first quarter of 2022 was $37 million, up 30% year over year and 34% on a two-year CAGR basis, and generated a gross loss of $26 million as we use hardware as an acquisition tool. Revenue growth was driven primarily by strong unit sales of Square Register and Square Terminal.
CORPORATE AND OTHER REVENUE AND GROSS PROFIT
Corporate and Other generated $55 million in revenue and $10 million in gross profit during the first quarter of 2022, and comprised areas outside Square and Cash App, which was primarily TIDAL during the quarter.
SQUARE SUBSCRIPTION AND SERVICES-BASED REVENUE EX-PPP AND EX-AFTERPAY
| 1Q20 | 1Q21 | 1Q22 | ||||
| Square subscription and services-based revenue | $103M | $121M | $283M | |||
| PPP loan forgiveness revenue | $0M | $9M | $51M | |||
| Square subscription and services-based revenue excluding PPP forgiveness | $103M | $112M | $231M | |||
| Afterpay subscription and services-based revenue allocated to Square | $0M | $0M | $65M | |||
|
|
|
| ||||
| Square subscription and services-based revenue excluding PPP forgiveness and excluding contributions from Afterpay | $103M | $112M | $166M | |||
|
|
BLOCK Q1 2022 11 |
We discuss Cash App marketing expenses because a large portion is generated by our peer-to-peer service, which we offer free to our Cash App customers, and we consider it to be a marketing tool to encourage the use of Cash App.
OPERATING EXPENSES
Operating expenses were $1.52 billion in the first quarter of 2022, up 70% year over year, and included certain expenses related to the Afterpay transaction including $42 million of one-time deal and integration-related expenses, $16 million of amortization of customer assets, $6 million of amortization of acquired trade names, and $66 million of one-time accelerated stock-based compensation. Non-GAAP operating expenses were $1.12 billion, up 52% year over year.
Product development expenses were $485 million on a GAAP basis and $294 million on a non-GAAP basis in the first quarter of 2022, up 56% and 44% year over year, respectively, driven primarily by headcount and personnel costs related to our engineering, data science, and design teams, as well as expenses related to Afterpay product development.
Sales and marketing expenses were $502 million on a GAAP basis and $478 million on a non-GAAP basis in the first quarter of 2022, up 44% and 42% year over year, respectively.
| • | Cash App marketing expenses were up 26% year over year, driven primarily by increases in advertising, peer-to-peer transactions and related transaction losses, referrals, and incentives. |
| • | Other sales and marketing expenses, including advertising, personnel, and other costs, were up 74% year over year, driven primarily by growth in headcount as well as expenses related to Afterpay sales and marketing and increased sales and marketing spend related to Square. |
| • | Other sales and marketing expenses also include expenses related to TIDAL. |
General and administrative expenses were $444 million on a GAAP basis and $252 million on a non-GAAP basis in the first quarter of 2022, up 127% and 48% year over year, respectively. The increase was due primarily to additions to customer support, finance, legal, and compliance personnel, as well as expenses related to Afterpay, including non-recurring deal and integration-related expenses.
|
|
BLOCK Q1 2022 12 |
The accounting rules for bitcoin require us to recognize any decreases in market price below carrying value as an impairment charge, with no upward revisions recognized when the market price increases until the sale of that bitcoin. The bitcoin impairment loss is a GAAP expense. Non-GAAP operating expenses exclude bitcoin impairment losses.
Transaction, loan, and consumer receivables losses were $91 million in the first quarter of 2022, up 347% year over year. The increase was driven primarily from losses related to Afterpay consumer receivables, as well as a release of provisions for transaction losses related to Square in the prior year period. In the first quarter, loss rates for Square GPV, Square Loans, and Afterpay BNPL receivables remained consistent with historical ranges, and we will continue to monitor trends closely given the dynamic macro environment.
In the fourth quarter of 2020 and first quarter of 2021, we invested $50 million and $170 million, respectively, in bitcoin. As an indefinite-lived intangible asset, bitcoin is subject to impairment losses if the fair value of bitcoin decreases below the carrying value during the assessed period. In the first quarter of 2022, we did not recognize a bitcoin impairment loss. As of March 31, 2022, the fair value of our investment in bitcoin was $366 million based on observable market prices, which is $217 million greater than the carrying value of the investment.
|
|
BLOCK Q1 2022 13 |
EARNINGS
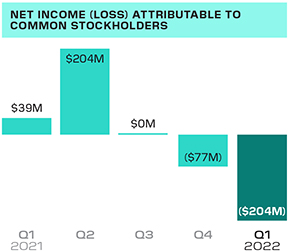
In the first quarter of 2022, net loss attributable to common stockholders was $204 million, which was impacted by certain expenses related to Afterpay including $42 million of one-time deal and integration-related expenses, $31 million of amortization of acquired intangible assets, and $66 million of one-time accelerated stock-based compensation, offset by an unrealized gain of $50 million from the revaluation of equity investments; and excluding these items, net loss was $114 million. Net loss per share attributable to common stockholders was $0.38 on a basic and diluted basis in the first quarter of 2022, based on 541 million weighted-average basic and diluted shares outstanding, including 114 million shares of Class A common stock issued in connection with the acquisition of Afterpay.
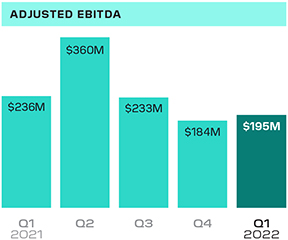
Adjusted EBITDA was $195 million in the first quarter of 2022, compared to $236 million in the first quarter of 2021. The decrease in Adjusted EBITDA compared to the prior year period was driven by an increase in operating expenses, including expenses related to Afterpay.
Adjusted Net Income Per Share (Adjusted EPS) was $0.18 on a diluted basis based on 583 million weighted-average diluted shares for the first quarter of 2022, representing a $0.23 decrease year over year. Beginning in the first quarter of 2022, we have included the tax impact of the non-GAAP adjustments in determining the Adjusted EPS. We determined the adjusted provision (benefit) for income taxes by calculating the estimated annual effective tax rate based on adjusted pre-tax income and applying it to Adjusted Net Income before income taxes.
The following items affected net income (loss) per share during the respective periods. In the first quarter of 2022, we recognized an unrealized gain of $50 million driven by the revaluation of equity investments, as well as Afterpay transaction-related charges of $42 million of one-time deal and integration-related expenses, $31 million of amortization of acquired intangible assets, and $66 million of one-time accelerated stock-based compensation. In the fourth quarter of 2021, we recognized a loss of $6 million driven by the adjustment to the revaluation of equity investments. In the third quarter of 2021, we recognized a loss of $7 million driven by the adjustment to the revaluation of equity investments as well as a $6 million bitcoin impairment loss. In the second quarter of 2021, we recognized a $77 million gain on our equity investments and a $45 million bitcoin impairment loss. In the first quarter of 2021, we recognized a loss of $29 million related to the mark-to-market valuation of our investment in DoorDash, as well as a $20 million bitcoin impairment loss.
|
|
BLOCK Q1 2022 14 |
BALANCE SHEET/CASH FLOW
We ended the first quarter of 2022 with $6.9 billion in available liquidity, with $6.3 billion in cash, cash equivalents, restricted cash, and investments in marketable debt securities, as well as $600 million available to be withdrawn from our revolving credit facility. Additionally, we had $1.6 billion available to be withdrawn under our warehouse funding facilities, to support funding of growth in our consumer receivables related to the BNPL platform.
In the first quarter of 2022, Adjusted EBITDA contributed positively to our cash balance. We also increased our cash balance by $579 million related to Afterpay’s cash balance upon acquisition, which was then more than offset by the redemption of Afterpay’s convertible notes totaling $1.1 billion. Our cash balance was also impacted by cash outflows due to net investments in marketable debt securities, repayments of PPP Liquidity Facility advances, and purchases of property and equipment.
|
|
BLOCK Q1 2022 15 |
|
|
April Trends and Forward-Looking Commentary
BUSINESS TRENDS
We wanted to provide an update on the trends in our business during the month of April. For the second quarter of 2022, we believe three-year compound annual growth rates from 2019 through 2022 will help reflect underlying trends in each ecosystem, given the variability in year-over-year comparisons due to COVID-19.
Square ecosystem
• For the month of April, in aggregate, Square GPV is expected to be up 29% year over year. On a three-year CAGR basis, GPV growth is expected to be 24% in April, compared to 22% growth in the first quarter.
Cash App ecosystem
• In April, we expect Cash App gross profit, excluding Afterpay, to grow on a year-over-year and three year CAGR basis, driven by growth in monthly transacting actives, engagement across our ecosystem, and inflows into Cash App.
OPERATING EXPENSES
We believe our Cash App and Square ecosystems are well positioned to help our customers adapt and grow based on trends we have observed during recent quarters. We intend to prioritize investments in our Cash App and Square ecosystems that we believe will drive long-term profitable growth given our historical cohort economics, including attractive paybacks and returns on investment.
For the second quarter of 2022, we expect non-GAAP operating expenses across product development, sales and marketing, general and administrative expenses, and transaction, loan and consumer receivables losses, in aggregate, to increase by approximately $245 million compared to the first quarter of 2022. Excluding contributions from Afterpay, we expect to increase overall non-GAAP operating expenses by approximately $180 million compared to the first quarter.
On a GAAP basis, we expect to incur approximately $50 million of quarterly expenses related to amortization of intangible assets due to the Afterpay transaction through the remainder of 2022 and over the next few years. We expect to recognize approximately $12 million of this expense in cost of sales and the remainder in sales and marketing.
Share-based compensation: We are continuing to invest in building out our teams, including attracting, hiring, and retaining talented employees. In the second quarter of 2022, we expect our share-based compensation expense to decrease modestly quarter over quarter on a dollar basis, given a one-time expense in the first quarter related to the Afterpay transaction. These share-based compensation expenses are not included in non-GAAP operating expenses.
We have not provided the forward-looking GAAP equivalents for certain forward-looking non-GAAP operating expenses or a GAAP reconciliation as a result of the uncertainty regarding, and the potential variability of, reconciling items such as share-based compensation expense. Accordingly, a reconciliation of these non-GAAP guidance metrics to their corresponding GAAP equivalents is not available without unreasonable effort. However, it is important to note that material changes to reconciling items could have a significant effect on future GAAP results. We have provided a reconciliation of other GAAP to non-GAAP metrics in tables at the end of this letter. |
|
|
BLOCK Q1 2022 16 |
Earnings
Webcast
Block (NYSE: SQ) will host a conference call and earnings webcast at 2:00 p.m. Pacific time/5:00 p.m. Eastern time, May 5, to discuss these financial results. To register to participate in the conference call, or to listen to the live audio webcast, please visit the Events & Presentations section of Block’s Investor Relations website at investors.block.xyz. A replay will be available on the same website following the call.
We will release financial results for the second quarter of 2022 on August 4, 2022, after the market closes, and will also host a conference call and earnings webcast at 2:00 p.m. Pacific time/5:00 p.m. Eastern time on the same day to discuss those financial results.
|
|
| |
| Jack Dorsey | Amrita Ahuja |


|
|
BLOCK Q1 2022 17 |

SAFE HARBOR STATEMENT
This letter contains forward-looking statements within the meaning of the Safe Harbor provisions of the Private Securities Litigation Reform Act of 1995. All statements other than statements of historical fact could be deemed forward-looking, including, but not limited to, statements regarding the future performance of Block, Inc. and its consolidated subsidiaries (the Company); the Company’s expected financial results, guidance, and general business outlook for future periods; expected impact of the COVID-19 pandemic and related responses of governments and private industry, including the impact of reduced restrictions on businesses and individuals and reduced government stimulus and assistance programs, on the Company’s business, financial results, financial position, and liquidity; the Company’s acquisition of Afterpay, including its impact on the Company’s business and financial results; future profitability and growth in the Company’s businesses and products and the Company’s ability to drive such profitability and growth; the Company’s expectations regarding scale, economics, and the demand for or benefits from its products, product features, and services; the Company’s product development plans, including opportunities for Cash App and bitcoin; the ability of the Company’s products to attract and retain customers, particularly in new or different demographics; trends in the Company’s markets and the continuation of such trends; the Company’s expectations regarding future expenses, including future transaction and loan losses and the Company’s estimated reserves for such losses; and the Company’s bitcoin investments and strategy as well as the potential financial impact and volatility; and management’s statements related to business strategy, plans, investments, opportunities, and objectives for future operations. In some cases, forward-looking statements can be identified by terms such as “may,” “will,” “appears,” “should,” “expects,” “plans,” “anticipates,” “could,” “intends,” “target,” “projects,” “contemplates,” “believes,” “estimates,” “predicts,” “potential,” or “continue,” or the negative of these words or other similar terms or expressions that concern our expectations, strategy, plans, or intentions. Such statements are subject to a number of known and unknown risks, uncertainties, assumptions, and other factors that may cause the Company’s actual results, performance, or achievements to differ materially from results expressed or implied in this letter. Investors are cautioned not to place undue reliance on these statements, and reported results should not be considered as an indication of future performance.
Risks that contribute to the uncertain nature of the forward-looking statements include, among others, uncertainty around the COVID-19 pandemic and the related effects of government and other measures; an economic downturn in the United States and in other countries around the world; the Company’s investments in its business and ability to maintain profitability; the Company’s efforts to expand its product portfolio and market reach; the Company’s ability to develop products and services to address the rapidly evolving market for payments and financial services; the Company’s ability to deal with the substantial and increasingly intense competition in its industry; acquisitions, strategic investments, entries into new businesses, joint ventures, divestitures, and other transactions that the Company may undertake; the integration of Afterpay; the Company’s ability to ensure the integration of its services with a variety of operating systems and the interoperability of its technology with that of third parties; the Company’s ability to retain existing customers, attract new customers, and increase sales to all customers; the Company’s dependence on payment card networks and acquiring processors; the effect of extensive regulation and oversight related to the Company’s business in a variety of areas; the effect of management changes and business initiatives; the liabilities and loss potential associated with new products, product features, and services; litigation, including intellectual property claims, government investigations or inquiries, and regulatory matters or disputes; adoption of the Company’s products and services in international markets; changes in political, business, and economic conditions; as well as other risks listed or described from time to time in the Company’s filings with the Securities and Exchange Commission (the SEC), including the Company’s Annual Report on Form 10-K for the fiscal year ended December 31, 2021, which is on file with the SEC and available on the Investor Relations page of the Company’s website. Additional information will also be set forth in the Company’s Quarterly Report on Form 10-Q for the fiscal quarter ended March 31, 2022. All forward-looking statements are based on information and estimates available to the Company at the time of this letter and are not guarantees of future performance. Except as required by law, the Company assumes no obligation to update any of the statements in this letter.
|
|
BLOCK Q1 2022 20 |
KEY OPERATING METRICS AND
NON-GAAP FINANCIAL MEASURES
To supplement our financial information presented in accordance with generally accepted accounting principles in the United States (GAAP), we consider certain operating and financial measures that are not prepared in accordance with GAAP, including Gross Payment Volume (GPV), Adjusted EBITDA, Adjusted EBITDA margin, Adjusted Net Income (Loss), Diluted Adjusted Net Income (Loss) Per Share (Adjusted EPS), and non-GAAP operating expenses as well as other measures defined in the shareholder letter such as measures excluding bitcoin, bitcoin impairment loss, measures excluding gains or losses on equity investments and measures excluding Afterpay. We believe these metrics and measures are useful to facilitate period-to-period comparisons of our business and to facilitate comparisons of our performance to that of other payments solution providers.
We define GPV as the total dollar amount of all card payments processed by sellers using Square, net of refunds, and ACH transfers. Additionally, GPV includes Cash App Business GPV, which comprises Cash App activity related to peer-to-peer transactions received by business accounts and peer-to-peer payments sent from a credit card.
Adjusted EBITDA, Adjusted EBITDA margin, Adjusted Net Income (Loss), and Diluted Adjusted Net Income (Loss) Per Share (Adjusted EPS) are non-GAAP financial measures that represent our net income (loss) and net income (loss) per share, adjusted to eliminate the effect of share-based compensation expenses; amortization of intangible assets; gain or loss on revaluation of equity investments; bitcoin impairment loss; and the gain or loss on the disposal of property and equipment, as applicable. We also exclude certain transaction and integration costs associated with business combinations, and various other costs that are not normal recurring operating expenses. Transaction costs include amounts paid to redeem acquirees’ unvested stock-based compensation awards, and legal, accounting, and due diligence costs. Integration costs include advisory and other professional services or consulting fees necessary to integrate acquired businesses. Other costs that are non-recurring operating expenses may include contingent losses, litigation, and regulatory charges. We also add back the impact of the acquired deferred revenue and deferred cost adjustment, which was written down to fair value in purchase accounting. Additionally, for purposes of calculating diluted Adjusted EPS, we add back cash interest expense on convertible senior notes, as if converted at the beginning of the period, if the impact is dilutive. In addition to the items above, Adjusted EBITDA is a non-GAAP financial measure that also excludes depreciation and amortization, interest income and expense, other income and expense, and provision or benefit from income taxes, as applicable. To calculate the diluted Adjusted EPS, we adjust the weighted-average number of shares of common stock outstanding for the dilutive effect of all potential shares of common stock. In periods when we recorded an Adjusted Net Loss, the diluted Adjusted EPS is the same as basic Adjusted EPS because the effects of potentially dilutive items were anti-dilutive given the Adjusted Net Loss position.
Non-GAAP operating expenses is a non-GAAP financial measure that represents operating expenses adjusted to remove the impact of share-based compensation, depreciation and amortization, bitcoin impairment loss, loss on disposal of property and equipment, and acquisition-related integration and other costs. Adjusted EBITDA margin is calculated as Adjusted EBITDA divided by gross profit.
We have included Adjusted EBITDA, Adjusted EPS, and non-GAAP operating expenses because they are key measures used by our management to evaluate our operating performance, generate future operating plans, and make strategic decisions, including those relating to operating expenses and the allocation of internal resources. Accordingly, we believe that Adjusted EBITDA, Adjusted EPS, and non-GAAP operating expenses provide useful information to investors and others in understanding and evaluating our operating results in the same manner as our management and board of directors. In addition, they provide useful measures for period-to-period comparisons of our business, as they remove the effect of certain non-cash items and certain variable charges. We have included measures excluding Afterpay because we believe these measures are useful in understanding the ongoing results of our operations. We have included measures excluding bitcoin revenue because our role is to facilitate customers’ access to bitcoin. When customers buy bitcoin through Cash App, we only apply a small margin to the market cost of bitcoin, which tends to be volatile and outside our control. Therefore, we believe deducting bitcoin revenue better reflects the economic benefits as well as our performance from these transactions. We have included measures excluding gains or losses on equity investments as well as bitcoin impairment losses because we believe these measures are useful in understanding our operating results without regard to gains and losses due to non-operating market fluctuations of our investments.
Adjusted EBITDA, Adjusted EPS, and non-GAAP operating expenses, as well as other measures defined in the shareholder letter, such as measures excluding Afterpay, bitcoin revenue, bitcoin impairment loss, and measures excluding gains or losses on equity investments, have limitations as financial measures, and should be considered as supplemental in nature, and are not meant as substitutes for the related financial information prepared in accordance with GAAP.
We believe that the aforementioned metrics and measures provide useful information about our operating results, enhance the overall understanding of our past performance and future prospects, and provide useful measures for period-to-period comparisons of our business, as they remove the effect of certain variable amounts. Our management uses these measures to evaluate our operating performance, generate future operating plans, and make strategic decisions, including those relating to operating expenses and the allocation of internal resources.
These non-GAAP financial measures should not be considered in isolation from, or as a substitute for, financial information prepared in accordance with GAAP. These non-GAAP financial measures are not based on any standardized methodology prescribed by GAAP. Other companies, including companies in our industry, may calculate the non-GAAP financial measures differently or not at all, which reduces their usefulness as comparative measures.
|
|
BLOCK Q1 2022 21 |
Consolidated Statements
of Operations
UNAUDITED
In thousands, except per share data
| THREE MONTHS ENDED | ||||||||
| March 31, 2022 | March 31, 2021 | |||||||
| Revenue: |
||||||||
| Transaction-based revenue |
$ | 1,232,969 | $ | 959,733 | ||||
| Subscription and services-based revenue |
959,557 | 557,681 | ||||||
| Hardware revenue |
37,326 | 28,788 | ||||||
| Bitcoin revenue |
1,730,793 | 3,511,068 | ||||||
|
|
|
|
||||||
| Total net revenue |
3,960,645 | 5,057,270 | ||||||
|
|
|
|
||||||
| Cost of revenue: |
||||||||
| Transaction-based costs |
718,700 | 526,779 | ||||||
| Subscription and services-based costs |
195,862 | 90,373 | ||||||
| Hardware costs |
63,664 | 40,482 | ||||||
| Bitcoin costs |
1,687,459 | 3,436,135 | ||||||
|
|
|
|
||||||
| Total cost of revenue |
2,665,685 | 4,093,769 | ||||||
|
|
|
|
||||||
| Gross profit |
1,294,960 | 963,501 | ||||||
|
|
|
|
||||||
| Operating expenses: |
||||||||
| Product development |
484,761 | 310,141 | ||||||
| Sales and marketing |
501,562 | 349,460 | ||||||
| General and administrative |
444,276 | 195,909 | ||||||
| Transaction, loan, and consumer receivable losses |
91,150 | 20,395 | ||||||
| Bitcoin impairment losses |
— | 19,860 | ||||||
|
|
|
|
||||||
| Total operating expenses |
1,521,749 | 895,765 | ||||||
|
|
|
|
||||||
| Operating income (loss) |
(226,789) | 67,736 | ||||||
|
|
|
|
||||||
| Interest expense, net |
15,748 | 253 | ||||||
| Other expense (income), net |
(33,472) | 27,528 | ||||||
|
|
|
|
||||||
| Income (loss) before income tax |
(209,065) | 39,955 | ||||||
|
|
|
|
||||||
| Provision (benefit) for income taxes |
(1,702) | 947 | ||||||
|
|
|
|
||||||
| Net income (loss) |
(207,363) | 39,008 | ||||||
| Less: Net loss attributable to noncontrolling interests |
(3,164) | — | ||||||
|
|
|
|
||||||
| Net income (loss) attributable to common stockholders |
$ | (204,199) | $ | 39,008 | ||||
|
|
|
|
||||||
| Net income (loss) per share attributable to common stockholders: |
||||||||
| Basic |
$ | (0.38) | $ | 0.09 | ||||
|
|
|
|
||||||
| Diluted |
$ | (0.38) | $ | 0.08 | ||||
|
|
|
|
||||||
| Weighted-average shares used to compute net income |
||||||||
| (loss) per share attributable to common stockholders: |
||||||||
| Basic |
541,435 | 454,973 | ||||||
|
|
|
|
||||||
| Diluted |
541,435 | 501,353 | ||||||
|
|
|
|
||||||
|
|
BLOCK Q1 2022 22 |
Consolidated Balance Sheets
In thousands, except share and per share data
| March 31, 2022 | Dec 31, 2021 | |||||||
| Assets | (UNAUDITED) | |||||||
| Current assets: |
||||||||
| Cash and cash equivalents |
$ | 3,993,565 | $ | 4,443,669 | ||||
| Investments in short-term debt securities |
796,749 | 869,283 | ||||||
| Settlements receivable |
1,341,852 | 1,171,612 | ||||||
| Customer funds |
3,190,905 | 2,830,995 | ||||||
| Consumer receivables, net |
1,304,300 | — | ||||||
| Loans held for sale |
357,115 | 517,940 | ||||||
| Other current assets |
876,198 | 687,429 | ||||||
|
|
|
|
||||||
| Total current assets |
11,860,684 | 10,520,928 | ||||||
|
|
|
|
||||||
| Property and equipment, net |
302,247 | 282,140 | ||||||
| Goodwill |
12,428,930 | 519,276 | ||||||
| Acquired intangible assets, net |
2,275,199 | 257,049 | ||||||
| Investments in long-term debt securities |
1,333,139 | 1,526,430 | ||||||
| Operating lease right-of-use assets |
455,914 | 449,406 | ||||||
| Other non-current assets |
471,354 | 370,535 | ||||||
|
|
|
|
||||||
| Total assets |
$ | 29,127,467 | $ | 13,925,764 | ||||
|
|
|
|
||||||
| Liabilities and Stockholders’ Equity |
||||||||
| Current liabilities: |
||||||||
| Customers payable |
$ | 4,634,657 | $ | 3,979,624 | ||||
| Settlements payable |
264,971 | 254,611 | ||||||
| Accrued expenses and other current liabilities |
934,364 | 639,309 | ||||||
| Operating lease liabilities, current |
71,393 | 64,027 | ||||||
| PPP Liquidity Facility advances |
124,636 | 497,533 | ||||||
|
|
|
|
||||||
| Total current liabilities |
6,030,021 | 5,435,104 | ||||||
|
|
|
|
||||||
| Deferred tax liabilities |
238,683 | 15,236 | ||||||
| Warehouse funding facilities |
208,141 | — | ||||||
| Long-term debt |
4,561,911 | 4,559,208 | ||||||
| Operating lease liabilities, non-current |
395,602 | 395,017 | ||||||
| Other non-current liabilities |
242,717 | 207,610 | ||||||
|
|
|
|
||||||
| Total liabilities |
11,677,075 | 10,612,175 | ||||||
|
|
|
|
||||||
| Commitments and contingencies |
||||||||
| Stockholders’ equity: |
||||||||
| Preferred stock, $0.0000001 par value: 100,000,000 shares authorized at March 31, 2022 and December 31, 2021. None issued and outstanding at March 31, 2022 and December 31, 2021. |
— | — | ||||||
| Class A common stock, $0.0000001 par value: 1,000,000,000 shares authorized at March 31, 2022 and December 31, 2021; 517,799,568 and 403,237,209 issued and outstanding at March 31, 2022 and December 31, 2021, respectively. |
— | — | ||||||
| Class B common stock, $0.0000001 par value: 500,000,000 shares authorized at March 31, 2022 and December 31, 2021; 61,696,578 and 61,706,578 issued and outstanding at March 31, 2022 and December 31, 2021, respectively. |
— | — | ||||||
| Additional paid-in capital |
17,426,629 | 3,317,255 | ||||||
| Accumulated other comprehensive income (loss) |
218,357 | (16,435) | ||||||
| Accumulated deficit |
(232,164) | (27,965) | ||||||
|
|
|
|
||||||
| Total stockholders’ equity attributable to common stockholders |
17,412,822 | 3,272,855 | ||||||
| Noncontrolling interests |
37,570 | 40,734 | ||||||
|
|
|
|
||||||
| Total stockholders’ equity |
17,450,392 | 3,313,589 | ||||||
|
|
|
|
||||||
| Total liabilities and stockholders’ equity |
$ | 29,127,467 | $ | 13,925,764 | ||||
|
|
|
|
||||||
|
|
BLOCK Q1 2022 23 |
Consolidated Statements
of Cash Flows
UNAUDITED
In thousands
| THREE MONTHS ENDED | ||||||||
| March 31, 2022 | March 31, 2021 | |||||||
| Cash Flows from Operating Activities |
||||||||
| Net income (loss) |
$ | (207,363) | $ | 39,008 | ||||
| Adjustments to reconcile net income (loss) to net cash provided by (used in) operating activities: |
||||||||
| Depreciation and amortization |
70,056 | 29,201 | ||||||
| Non-cash interest and other |
(64,351) | 5,207 | ||||||
| Non-cash lease expense |
22,696 | 20,432 | ||||||
| Share-based compensation |
275,423 | 118,623 | ||||||
| Loss (gain) on revaluation of equity investments |
(49,741) | 28,900 | ||||||
| Transaction, loan, and consumer receivable losses |
91,150 | 20,395 | ||||||
| Bitcoin impairment losses |
— | 19,860 | ||||||
| Change in deferred income taxes |
(7,653) | (60) | ||||||
| Changes in operating assets and liabilities: |
||||||||
| Settlements receivable |
(220,361) | (114,458) | ||||||
| Purchases and originations of loans |
(951,665) | (812,492) | ||||||
| Proceeds from payments and forgiveness of loans |
1,112,266 | 531,716 | ||||||
| Customers payable |
136,474 | 80,310 | ||||||
| Settlements payable |
10,360 | 24,564 | ||||||
| Other assets and liabilities |
12,132 | (20,399) | ||||||
|
|
|
|
||||||
| Net cash provided by (used in) operating activities |
229,423 | (29,193) | ||||||
|
|
|
|
||||||
| Cash Flows from Investing Activities |
||||||||
| Purchase of marketable debt securities |
(209,981) | (401,161) | ||||||
| Proceeds from maturities of marketable debt securities |
262,559 | 139,353 | ||||||
| Proceeds from sale of marketable debt securities |
178,352 | 249,342 | ||||||
| Purchase of marketable debt securities from customer funds |
— | (119,411) | ||||||
| Proceeds from maturities of marketable debt securities from customer funds |
73,000 | 187,500 | ||||||
| Proceeds from sale of marketable debt securities from customer funds |
316,576 | — | ||||||
| Originations of consumer receivables |
(1,946,468) | — | ||||||
| Principal repayments of consumer receivables |
1,943,554 | — | ||||||
| Purchase of property and equipment |
(41,187) | (34,149) | ||||||
| Purchase of bitcoin investments |
— | (170,000) | ||||||
| Purchase of other investments |
(16,495) | (28,470) | ||||||
| Proceeds from sale of equity investments |
— | 18,973 | ||||||
| Net cash acquired through business combination |
570,703 | — | ||||||
|
|
|
|
||||||
| Net cash provided by (used in) investing activities |
1,130,613 | (158,023) | ||||||
|
|
|
|
||||||
| Cash Flows from Financing Activities |
||||||||
| Proceeds from PPP Liquidity Facility advances |
— | 494,300 | ||||||
| Repayments of PPP Liquidity Facility advances |
(372,897) | (194,186) | ||||||
| Payments to redeem convertible notes |
(1,071,788) | — | ||||||
| Proceeds from warehouse facilities borrowings |
183,440 | — | ||||||
| Repayments of warehouse facilities borrowings |
(90,491) | — | ||||||
| Proceeds from the exercise of stock options and purchases under the employee stock purchase plan |
4,093 | 32,891 | ||||||
| Payments for tax withholding related to vesting of restricted stock units |
(2,456) | (152,013) | ||||||
| Net increase in non-interest bearing deposits |
21,633 | — | ||||||
| Change in customer funds, restricted from use in the Company’s operations |
359,910 | 938,596 | ||||||
|
|
|
|
||||||
| Net cash provided by (used in) financing activities |
(968,556) | 1,119,588 | ||||||
|
|
|
|
||||||
| Effect of foreign exchange rate on cash and cash equivalents |
(948) | (8,206) | ||||||
|
|
|
|
||||||
| Net increase in cash, cash equivalents, restricted cash, and customer funds |
390,532 | 924,166 | ||||||
| Cash, cash equivalents, restricted cash, and customer funds, beginning of period |
6,975,090 | 4,793,171 | ||||||
|
|
|
|
||||||
| Cash, cash equivalents, restricted cash, and customer funds, end of period |
$ | 7,365,622 | $ | 5,717,337 | ||||
|
|
|
|
||||||
|
|
BLOCK Q1 2022 24 |
Operating Segment Disclosures
UNAUDITED
Information on the reportable segments revenue and segment operating profit are
as follows (in thousands):
| THREE MONTHS ENDED | ||||||||||||||||
| MARCH 31, 2022 | ||||||||||||||||
| Cash App
|
Square
|
Corporate and Other(i) |
Total
|
|||||||||||||
| Revenue |
||||||||||||||||
| Transaction-based revenue |
$ | 109,241 | $ | 1,123,728 | $ | — | $ | 1,232,969 | ||||||||
| Subscription and services-based revenue |
622,309 | 282,650 | 54,598 | 959,557 | ||||||||||||
| Hardware revenue |
— | 37,326 | — | 37,326 | ||||||||||||
| Bitcoin revenue |
1,730,793 | — | — | 1,730,793 | ||||||||||||
|
|
|
|
|
|
|
|
|
|
||||||||
| Segment revenue (ii) |
2,462,343 | 1,443,704 | 54,598 | 3,960,645 | ||||||||||||
|
|
|
|
|
|
|
|
|
|
||||||||
| Segment gross profit (iii) |
$ | 623,659 | $ | 661,221 | $ | 10,080 | $ | 1,294,960 | ||||||||
|
|
|
|
|
|
|
|
|
|
||||||||
| THREE MONTHS ENDED | ||||||||||||||||
| MARCH 31, 2021 | ||||||||||||||||
| Cash App
|
Square
|
Corporate and Other(i) |
Total
|
|||||||||||||
| Revenue |
||||||||||||||||
| Transaction-based revenue |
$ | 91,959 | $ | 867,774 | $ | — | $ | 959,733 | ||||||||
| Subscription and services-based revenue |
436,589 | 121,092 | — | 557,681 | ||||||||||||
| Hardware revenue |
— | 28,788 | — | 28,788 | ||||||||||||
| Bitcoin revenue |
3,511,068 | — | — | 3,511,068 | ||||||||||||
|
|
|
|
|
|
|
|
|
|
||||||||
| Segment revenue |
4,039,616 | 1,017,654 | — | 5,057,270 | ||||||||||||
|
|
|
|
|
|
|
|
|
|
||||||||
| Segment gross profit |
$ | 495,485 | $ | 468,016 | $ | — | $ | 963,501 | ||||||||
|
|
|
|
|
|
|
|
|
|
||||||||
| THREE MONTHS ENDED | ||||||||||||||||
| MARCH 31, 2020 | ||||||||||||||||
| Cash App | Square | Corporate and Other(i) |
Total | |||||||||||||
| Revenue |
||||||||||||||||
| Transaction-based revenue |
$ | 27,819 | $ | 730,282 | $ | — | $ | 758,101 | ||||||||
| Subscription and services-based revenue |
193,725 | 102,510 | — | 296,235 | ||||||||||||
| Hardware revenue |
— | 20,675 | — | 20,675 | ||||||||||||
| Bitcoin revenue |
306,098 | — | — | 306,098 | ||||||||||||
|
|
|
|
|
|
|
|
|
|
||||||||
| Segment revenue |
527,642 | 853,467 | — | 1,381,109 | ||||||||||||
|
|
|
|
|
|
|
|
|
|
||||||||
| Segment gross profit |
$ | 182,732 | $ | 355,769 | $ | — | $ | 538,501 | ||||||||
|
|
|
|
|
|
|
|
|
|
||||||||
A reconciliation of total segment gross profit to the Company’s income (loss)
before applicable income taxes is as follows (in thousands):
| THREE MONTHS ENDED | ||||||||||||
| March 31, 2022 | March 31, 2021 | March 31, 2020 | ||||||||||
| Total segment gross profit |
$ | 1,294,960 | $ | 963,501 | $ | 538,501 | ||||||
| Less: Product development |
484,761 | 310,141 | 195,876 | |||||||||
| Less: Sales and marketing |
501,562 | 349,460 | 194,535 | |||||||||
| Less: General and administrative |
444,276 | 195,909 | 129,495 | |||||||||
| Less: Transaction, loan, and consumer receivable losses |
91,150 | 20,395 | 108,883 | |||||||||
| Less: Bitcoin impairment losses |
— | 19,860 | — | |||||||||
| Less: Amortization of acquired customer assets |
— | — | — | |||||||||
| Less: Interest expense, net |
15,748 | 253 | 9,206 | |||||||||
| Less: Other expense (income), net |
(33,472 | ) | 27,528 | 5,862 | ||||||||
|
|
|
|
|
|
||||||||
| Income (loss) before applicable income taxes |
$ | (209,065 | ) | $ | 39,955 | $ | (105,356 | ) | ||||
|
|
|
|
|
|
||||||||
(i) Corporate and other represents results related to products and services that are not assigned to a specific reportable segment. Comparable prior period amounts have not been disclosed as they were not material.
(ii) The revenue for both Cash App and Square for the three months ended March 31, 2022 includes $64.9 million each from Afterpay post-acquisition results.
(iii) The gross profit for both Cash App and Square for the three months ended March 31, 2022 includes $46.1 million each from Afterpay post-acquisition results.
|
|
BLOCK Q1 2022 25 |
Key Operating Metrics and
Non-GAAP Financial Measures
UNAUDITED
In thousands, except GPV and per share data
| THREE MONTHS ENDED | ||||||||||||
|
March 31, 2022 |
March 31, 2021 | March 31, 2020 | ||||||||||
| Gross Payment Volume (“GPV”) (in millions) |
$ | 43,504 | $ | 33,138 | $ | 25,743 | ||||||
| Adjusted EBITDA (in thousands) |
$ | 195,361 | $ | 236,249 | $ | 9,331 | ||||||
| Adjusted Net Income Per Share: |
||||||||||||
| Basic |
$ | 0.19 | $ | 0.47 | $ | (0.02) | ||||||
| Diluted |
$ | 0.18 | $ | 0.41 | $ | (0.02) | ||||||
Adjusted EBITDA
UNAUDITED
In thousands
| THREE MONTHS ENDED | ||||||||||||
|
March 31, 2022 |
March 31, 2021 | March 31, 2020 | ||||||||||
| Net income (loss) attributable to common stockholders |
$ | (204,199) | $ | 39,008 | $ | (105,891) | ||||||
| Net loss attributable to noncontrolling interests |
(3,164) | — | — | |||||||||
|
|
|
|
|
|
||||||||
| Net income (loss) |
(207,363) | 39,008 | (105,891) | |||||||||
| Share-based compensation expense |
275,423 | 118,623 | 77,303 | |||||||||
| Depreciation and amortization |
70,056 | 29,201 | 20,061 | |||||||||
| Acquisition-related, integration and other costs |
76,065 | 26 | 1,524 | |||||||||
| Interest expense, net |
15,748 | 253 | 9,206 | |||||||||
| Other expense (income), net |
(33,472) | 27,528 | 5,862 | |||||||||
| Bitcoin impairment losses |
— | 19,860 | — | |||||||||
| Provision (benefit) for income taxes |
(1,702) | 947 | 535 | |||||||||
| Loss on disposal of property and equipment |
534 | 615 | 218 | |||||||||
| Acquired deferred revenue adjustment |
118 | 252 | 657 | |||||||||
| Acquired deferred cost adjustment |
(46) | (64) | (144) | |||||||||
|
|
|
|
|
|
||||||||
| Adjusted EBITDA |
$ | 195,361 | $ | 236,249 | $ | 9,331 | ||||||
|
|
|
|
|
|
||||||||
|
|
BLOCK Q1 2022 26 |
Select Financial Results Excluding
Bitcoin and Afterpay
UNAUDITED
In thousands
| THREE MONTHS ENDED | ||||||||||||
| March 31, 2022 | March 31, 2021 | March 31, 2020 | ||||||||||
| Total net revenue (GAAP) |
$ | 3,960,645 | $ | 5,057,270 | $ | 1,381,109 | ||||||
| Less: Bitcoin contribution to total net revenue |
1,730,793 | 3,511,068 | 306,098 | |||||||||
| Less: Afterpay contribution to total net revenue |
129,764 | — | — | |||||||||
|
|
|
|
|
|
||||||||
| Total net revenue, excluding Bitcoin and Afterpay |
$ | 2,100,088 | $ | 1,546,202 | $ | 1,075,011 | ||||||
|
|
|
|
|
|
||||||||
| THREE MONTHS ENDED | ||||||||||||
| March 31, 2022 |
March 31, 2021 | March 31, 2020 | ||||||||||
| Gross profit (GAAP) |
$ | 1,294,960 | $ | 963,501 | $ | 538,501 | ||||||
| Less: Afterpay contribution to gross profit |
92,281 | — | — | |||||||||
|
|
|
|
|
|
||||||||
| Total gross profit, excluding Afterpay |
$ | 1,202,679 | $ | 963,501 | $ | 538,501 | ||||||
|
|
|
|
|
|
||||||||
| THREE MONTHS ENDED | ||||||||||||
| March 31, 2022 |
March 31, 2021 | March 31, 2020 | ||||||||||
| Cash App revenue (GAAP) |
$ | 2,462,343 | $ | 4,039,616 | $ | 527,642 | ||||||
| Less: Bitcoin contribution to Cash App revenue |
1,730,793 | 3,511,068 | 306,098 | |||||||||
| Less: Afterpay contribution to Cash App revenue |
64,882 | — | — | |||||||||
|
|
|
|
|
|
||||||||
| Total Cash App revenue, excluding Bitcoin and Afterpay |
$ | 666,668 | $ | 528,548 | $ | 221,544 | ||||||
|
|
|
|
|
|
||||||||
| THREE MONTHS ENDED | ||||||||||||
|
March 31, 2022 |
March 31, 2021 | March 31, 2020 | ||||||||||
| Square gross profit (GAAP) |
$ | 661,221 | $ | 468,016 | $ | 355,769 | ||||||
| Less: Square gross profit – U.S. |
583,234 | 429,099 | 333,911 | |||||||||
|
|
|
|
|
|
||||||||
| Total Square gross profit – International |
77,987 | 38,917 | 21,858 | |||||||||
|
|
|
|
|
|
||||||||
| Less: Afterpay contribution to Square gross profit – International |
19,280 | — | — | |||||||||
|
|
|
|
|
|
||||||||
| Total Square gross profit – International, excluding Afterpay |
$ | 58,167 | $ | 38,917 | $ | 21,858 | ||||||
|
|
|
|
|
|
||||||||
| THREE MONTHS ENDED | ||||||||||||
| March 31, 2022 |
March 31, 2021 | March 31, 2020 | ||||||||||
| Subscription and services-based revenue (GAAP) |
$ | 959,557 | $ | 557,681 | $ | 296,235 | ||||||
| Less: Afterpay contribution to subscription and services-based revenue |
129,764 | — | — | |||||||||
|
|
|
|
|
|
||||||||
| Total subscription and services-based revenue, excluding Afterpay |
829,793 | 557,681 | 296,235 | |||||||||
|
|
|
|
|
|
||||||||
| Subscription and services-based costs (GAAP) |
195,862 | 90,373 | 41,908 | |||||||||
| Less: Afterpay contribution to subscription and services-based costs |
37,482 | — | — | |||||||||
|
|
|
|
|
|
||||||||
| Total subscription and services-based costs, excluding Afterpay |
158,380 | 90,373 | 41,908 | |||||||||
|
|
|
|
|
|
||||||||
| Subscription and services-based gross profit (GAAP) |
763,695 | 467,308 | 254,327 | |||||||||
| Less: Afterpay contribution to subscription and services-based gross profit |
92,282 | — | — | |||||||||
|
|
|
|
|
|
||||||||
| Total subscription and services-based gross profit, excluding Afterpay |
$ | 671,413 | $ | 467,308 | $ | 254,327 | ||||||
|
|
|
|
|
|
||||||||
|
|
BLOCK Q1 2022 27 |
Select Financial Results Excluding
Bitcoin and Afterpay, Continued
UNAUDITED
In thousands
| THREE MONTHS ENDED | THREE MONTHS ENDED | THREE MONTHS ENDED | ||||||||||||||||||||||
| MARCH 31, 2022 | MARCH 31, 2021 | MARCH 31, 2020 | ||||||||||||||||||||||
| Cash App | Square | Cash App | Square | Cash App | Square | |||||||||||||||||||
| Segment revenue (GAAP) | $ | 2,462,343 | $ | 1,443,704 | $ | 4,039,616 | $ | 1,017,654 | $ | 527,642 | $ | 853,467 | ||||||||||||
| Less: Afterpay contribution to segment revenue | 64,882 | 64,882 | — | — | — | — | ||||||||||||||||||
|
|
|
|
|
|
|
|
|
|
|
|
||||||||||||||
| Total segment revenue, excluding Afterpay |
2,397,461 | 1,378,822 | 4,039,616 | 1,017,654 | 527,642 | 853,467 | ||||||||||||||||||
|
|
|
|
|
|
|
|
|
|
|
|
||||||||||||||
| Segment cost of revenue (GAAP) | 1,838,684 | 782,483 | 3,544,131 | 549,638 | 344,910 | 497,698 | ||||||||||||||||||
| Less: Afterpay contribution to segment cost of revenue | 18,741 | 18,741 | — | — | — | — | ||||||||||||||||||
|
|
|
|
|
|
|
|
|
|
|
|
||||||||||||||
| Total segment cost of revenue, excluding Afterpay |
1,819,943 | 763,742 | 3,544,131 | 549,638 | 344,910 | 497,698 | ||||||||||||||||||
|
|
|
|
|
|
|
|
|
|
|
|
||||||||||||||
| Segment gross profit (GAAP) |
623,659 | 661,221 | 495,485 | 468,016 | 182,732 | 355,769 | ||||||||||||||||||
| Less: Afterpay contribution to segment gross profit |
46,141 | 46,141 | — | — | — | — | ||||||||||||||||||
|
|
|
|
|
|
|
|
|
|
|
|
||||||||||||||
| Total segment gross profit, excluding Afterpay |
$ | 577,518 | $ | 615,080 | $ | 495,485 | $ | 468,016 | $ | 182,732 | $ | 355,769 | ||||||||||||
|
|
|
|
|
|
|
|
|
|
|
|
||||||||||||||
| THREE MONTHS ENDED | THREE MONTHS ENDED | THREE MONTHS ENDED | ||||||||||||||||||||||
| MARCH 31, 2022 | MARCH 31, 2021 | MARCH 31, 2020 | ||||||||||||||||||||||
| Cash App | Square | Cash App | Square | Cash App | Square | |||||||||||||||||||
| Segment revenue, subscription and services-based (GAAP) | $ | 622,309 | $ | 282,650 | $ | 436,589 | $ | 121,092 | $ | 193,725 | $ | 102,510 | ||||||||||||
| Less: Afterpay contribution to segment revenue, subscription and services-based | 64,882 | 64,882 | — | — | — | — | ||||||||||||||||||
|
|
|
|
|
|
|
|
|
|
|
|
||||||||||||||
| Total segment revenue, subscription and services-based, excluding Afterpay |
$ | 557,427 | $ | 217,768 | $ | 436,589 | $ | 121,092 | $ | 193,725 | $ | 102,510 | ||||||||||||
|
|
|
|
|
|
|
|
|
|
|
|
||||||||||||||
|
|
BLOCK Q1 2022 28 |
Adjusted Net Income
and Adjusted EPS
UNAUDITED
In thousands, except per share data
| THREE MONTHS ENDED | ||||||||||||
|
March 31, 2022 |
March 31, 2021 | March 31, 2020 | ||||||||||
| Net income (loss) attributable to common stockholders |
$ | (204,199) | $ | 39,008 | $ | (105,891) | ||||||
| Net loss attributable to noncontrolling interests |
(3,164) | — | — | |||||||||
|
|
|
|
|
|
||||||||
| Net income (loss) |
(207,363) | 39,008 | (105,891) | |||||||||
| Share-based compensation expense |
275,423 | 118,623 | 77,303 | |||||||||
| Acquisition-related, integration and other costs |
76,065 | 26 | 1,524 | |||||||||
| Amortization of intangible assets |
42,160 | 6,884 | 4,152 | |||||||||
| Amortization of debt discount and issuance costs |
3,630 | 1,832 | 12,528 | |||||||||
| Loss (gain) on revaluation of equity investments |
(49,741) | 28,900 | — | |||||||||
| Bitcoin impairment losses |
— | 19,860 | — | |||||||||
| Loss on extinguishment of long-term debt |
— | — | 990 | |||||||||
| Loss on disposal of property and equipment |
534 | 615 | 218 | |||||||||
| Acquired deferred revenue adjustment |
118 | 252 | 657 | |||||||||
| Acquired deferred cost adjustment |
(46) | (64) | (144) | |||||||||
| Tax effect of non-GAAP net income adjustments |
(38,326) | (47,537) | — | |||||||||
|
|
|
|
|
|
||||||||
| Adjusted Net Income (Loss) - basic |
$ | 102,454 | $ | 168,399 | $ | (8,663) | ||||||
|
|
|
|
|
|
||||||||
| Cash interest expense on convertible senior notes |
$ | 1,241 | $ | 1,728 | $ | 1,373 | ||||||
|
|
|
|
|
|
||||||||
| Adjusted Net Income (Loss) - diluted |
$ | 103,695 | $ | 170,127 | $ | (7,290) | ||||||
|
|
|
|
|
|
||||||||
| Weighted-average shares used to compute net income (loss) per share attributable to common stockholders: |
||||||||||||
| Basic |
541,435 | 454,973 | 434,940 | |||||||||
|
|
|
|
|
|
||||||||
| Diluted |
541,435 | 501,353 | 434,940 | |||||||||
|
|
|
|
|
|
||||||||
| Net Income (loss) per share attributable to common stockholders: |
||||||||||||
| Basic |
$ | (0.38) | $ | 0.09 | $ | (0.24) | ||||||
|
|
|
|
|
|
||||||||
| Diluted |
$ | (0.38) | $ | 0.08 | $ | (0.24) | ||||||
|
|
|
|
|
|
||||||||
| Weighted-average shares used to compute Adjusted Net Income (Loss) Per Share: |
||||||||||||
| Basic |
541,435 | 454,973 | 434,940 | |||||||||
|
|
|
|
|
|
||||||||
| Diluted |
583,452 | 524,540 | 434,940 | |||||||||
|
|
|
|
|
|
||||||||
| Adjusted Net Income (Loss) Per Share: |
||||||||||||
| Basic |
$ | 0.19 | $ | 0.47 | $ | (0.02) | ||||||
|
|
|
|
|
|
||||||||
| Diluted |
$ | 0.18 | $ | 0.41 | $ | (0.02) | ||||||
|
|
|
|
|
|
||||||||
|
|
BLOCK Q1 2022 29 |
Non-GAAP Operating Expenses
UNAUDITED
In thousands
| THREE MONTHS ENDED | ||||||||||||
|
March 31, 2022 |
March 31, 2021 | March 31, 2020 | ||||||||||
| Operating expenses |
$ | (1,521,749) | $ | (895,765) | $ | (628,789) | ||||||
| Share-based compensation |
275,314 | 118,524 | 77,227 | |||||||||
| Depreciation and amortization |
54,587 | 24,901 | 17,635 | |||||||||
| Bitcoin impairment losses |
— | 19,860 | — | |||||||||
| Loss on disposal of property and equipment |
534 | 615 | 218 | |||||||||
| Acquisition related, integration and other costs |
76,065 | 26 | 1,524 | |||||||||
|
|
|
|
|
|
||||||||
| Non-GAAP operating expenses |
$ | (1,115,249) | $ | (731,839) | $ | (532,185) | ||||||
|
|
|
|
|
|
||||||||
| Product development |
$ | (484,761) | $ | (310,141) | $ | (194,986) | ||||||
| Share-based compensation |
145,075 | 86,895 | 57,400 | |||||||||
| Depreciation and amortization |
45,744 | 18,858 | 12,336 | |||||||||
| Loss (gain) on disposal of property and equipment |
(19) | 339 | 158 | |||||||||
|
|
|
|
|
|
||||||||
| Non-GAAP product development |
$ | (293,961) | $ | (204,049) | $ | (125,092) | ||||||
|
|
|
|
|
|
||||||||
| Sales and marketing |
$ | (501,562) | $ | (349,460) | $ | (194,535) | ||||||
| Share-based compensation |
21,256 | 10,880 | 6,407 | |||||||||
| Depreciation and amortization |
1,491 | 1,273 | 964 | |||||||||
| Loss on disposal of property and equipment |
420 | — | 60 | |||||||||
|
|
|
|
|
|
||||||||
| Non-GAAP sales and marketing |
$ | (478,395) | $ | (337,307) | $ | (187,104) | ||||||
|
|
|
|
|
|
||||||||
| General and administrative |
$ | (444,276) | $ | (195,909) | $ | (129,495) | ||||||
| Share-based compensation |
108,983 | 20,749 | 13,420 | |||||||||
| Depreciation and amortization |
7,352 | 4,770 | 3,445 | |||||||||
| Loss on disposal of property and equipment |
133 | 276 | — | |||||||||
| Acquisition related, integration and other costs |
76,065 | 26 | 1,524 | |||||||||
|
|
|
|
|
|
||||||||
| Non-GAAP general and administrative |
$ | (251,743) | $ | (170,088) | $ | (111,106) | ||||||
|
|
|
|
|
|
||||||||
Depreciation and
Amortization by Function
UNAUDITED
In thousands
| THREE MONTHS ENDED | ||||||||||||
| March 31, 2022 |
March 31, 2021 | March 31, 2020 | ||||||||||
| Cost of revenue |
$ | 15,469 | $ | 4,300 | $ | 2,426 | ||||||
| Product development |
45,744 | 18,858 | 12,336 | |||||||||
| Sales and marketing |
1,491 | 1,273 | 964 | |||||||||
| General and administrative |
7,352 | 4,770 | 3,445 | |||||||||
| Amortization of acquired customer assets |
— | — | 890 | |||||||||
|
|
|
|
|
|
||||||||
| Total depreciation and amortization |
$ | 70,056 | $ | 29,201 | $ | 20,061 | ||||||
|
|
|
|
|
|
||||||||
|
|
BLOCK Q1 2022 30 |
Serious News for Serious Traders! Try StreetInsider.com Premium Free!
You May Also Be Interested In
- Block Inc. (SQ) PT Raised to $98 at Baird
- Manhattan Associates Named a Leader in 2024 Gartner® Magic Quadrant™ for Transportation Management Systems for the Sixth Consecutive Year
- Recording of LHV Group's 23 April investor webinar
Create E-mail Alert Related Categories
SEC FilingsSign up for StreetInsider Free!
Receive full access to all new and archived articles, unlimited portfolio tracking, e-mail alerts, custom newswires and RSS feeds - and more!
