

Form 8-K Black Knight, Inc. For: Aug 04
 Tweet
Tweet Share
ShareUNITED STATES
SECURITIES AND EXCHANGE COMMISSION
Washington, D.C. 20549
FORM
Current Report
Pursuant to Section 13 or 15(d) of the Securities Exchange Act of 1934
Date of Report (date of earliest event reported):
(Exact name of Registrant as Specified in its Charter)
(Commission File Number)
| ||
(State or Other Jurisdiction of | (IRS Employer Identification Number) | |
Incorporation or Organization) |
(Addresses of Principal Executive Offices)
(
(Registrant’s Telephone Number, Including Area Code)
Not Applicable
(Former Name or Former Address, if Changed Since Last Report)
Check the appropriate box below if the Form 8-K filing is intended to simultaneously satisfy the filing obligation of the registrant under any of the following provisions:
Securities registered pursuant to Section 12(b) of the Act:
Indicate by check mark whether the registrant is an emerging growth company as defined in Rule 405 of the Securities Act of 1933 (§230.405 of this chapter) or Rule 12b-2 of the Securities Exchange Act of 1934 (§240.12b-2 of this chapter).
Emerging growth company
If an emerging growth company, indicate by check mark if the registrant has elected not to use the extended transition period for complying with any new or revised financial accounting standards provided pursuant to Section 13(a) of the Exchange Act. ☐
Item 2.02. Results of Operations and Financial Condition
On August 4, 2022, Black Knight, Inc. (“Black Knight”) issued a press release announcing its financial results for the second quarter of 2022. Black Knight also posted an investor presentation regarding the second quarter 2022 financial results to its website at www.blackknightinc.com.The information in this Current Report is being furnished and shall not be deemed “filed” for the purposes of Section 18 of the Securities Exchange Act of 1934, as amended or otherwise subject to the liabilities of that Section. The information in this Current Report shall not be incorporated by reference into any registration statement or other document pursuant to the Securities Act of 1933, as amended.
The Black Knight press release and presentation are attached as Exhibit 99.1 and Exhibit 99.2, respectively.
Item 9.01. Financial Statements and Exhibits
(d) Exhibits
Exhibit |
| Description |
99.1 | Press release announcing Black Knight’s second quarter 2022 financial results | |
99.2 | Black Knight second quarter 2022 financial results presentation | |
104 | Cover Page Interactive Data File (embedded within the Inline XBRL document) |
SIGNATURES
Pursuant to the requirements of the Securities Exchange Act of 1934, the registrant has duly caused this report to be signed on its behalf by the undersigned hereunto duly authorized.
Black Knight, Inc. | ||||
Date: | August 4, 2022 | By: | /s/ Kirk T. Larsen | |
Name: | Kirk T. Larsen | |||
Title: | President and Chief Financial Officer | |||
Exhibit 99.1

Press Release
Information for Investors: | | Information for Media: |
| | |
Steve Eagerton | | Michelle Kersch |
Black Knight | | Black Knight |
904.854.3683 | | 904.854.5043 |
|
Black Knight Reports Second Quarter 2022 Financial Results
JACKSONVILLE, Fla. – August 4, 2022 - Black Knight, Inc. (NYSE: BKI), a leading provider of software, data and analytics solutions to the mortgage and consumer loan, real estate and capital markets verticals, today announced unaudited financial results for the second quarter of 2022, as compared to the prior year quarter.
Second Quarter 2022 Highlights:
| ● | Revenues of $394.5 million, an increase of 9%; Organic revenue growth of 7% |
| ● | Operating income of $77.0 million, an increase of 11%; Operating margin of 19.5% compared to 19.3% |
| ● | Earnings before equity in (losses) earnings of unconsolidated affiliates, net of tax of $40.4 million, an increase of 9% |
| ● | Net earnings attributable to Black Knight of $40.3 million compared to $39.7 million; Diluted EPS of $0.26 compared to $0.25; Net earnings margin of 10.2% compared to 8.9%; the effect of our investment in Dun & Bradstreet Holdings, Inc. (“DNB”) was a decrease in Net earnings attributable to Black Knight of $0.1 million, compared to $5.0 million |
| ● | Adjusted EBITDA of $190.7 million, an increase of 7%; Adjusted EBITDA margin was 48.3% compared to 49.1% |
| ● | Adjusted operating income of $151.0 million, an increase of 7%; Adjusted operating margin of 38.3% compared to 39.0% |
| ● | Adjusted net earnings of $100.5 million, an increase of 13%; Adjusted EPS of $0.65, an increase of 14% |
Second Quarter 2022 Segment Highlights:
Software Solutions
| ● | Revenues of $339.4 million, an increase of 11%; Organic revenue growth of 9% |
| ● | EBITDA of $190.7 million, an increase of 9%; EBITDA margin of 56.2% compared to 57.2% |
| ● | Operating income of $154.8 million, an increase of 9%; Operating margin of 45.6% compared to 46.4% |
1
Data and Analytics
| ● | Revenues of $55.1 million, a decrease of 1%; Organic revenue decrease of 2% |
| ● | EBITDA of $17.7 million, a decrease of 15%; EBITDA margin of 32.1% compared to 37.2% |
| ● | Operating income of $13.7 million, a decrease of 20%; Operating margin of 24.9% compared to 30.6% |
Commentary:
Black Knight Executive Chairman Anthony Jabbour said, “Our core performance in the second quarter was consistent with our expectations and highlights the ongoing strength and resilience of our business as we continued to expand and extend our relationships with existing clients through cross-sell and contract renewals, win new clients and deliver innovative new solutions. Our performance further demonstrates our ability to deliver results despite an uncertain economic environment.”
Black Knight Chief Executive Officer Joe Nackashi added, “During the second quarter, we achieved Revenue growth of 9%, Organic revenue growth of 7%, Adjusted EBITDA growth of 7% and Adjusted EPS growth of 14%. We are proud to deliver another solid quarter of operating results, as our team continued to execute against our long-term strategic initiatives and we are well-positioned to deliver solid results for full year 2022.”
Other Highlights:
| ● | As of June 30, 2022, we owned 18.5 million shares of DNB common stock. |
| ● | As of June 30, 2022, we had cash and cash equivalents of $38.0 million, debt of $2,770.3 million and available capacity of $353.3 million on our revolving credit facility. |
Cash Flows:
On February 15, 2022, we acquired the remaining 40% interest in Optimal Blue Holdco, LLC ("Optimal Blue") for an aggregate purchase consideration of $1.156 billion paid in a combination of 36.4 million shares of DNB common stock valued at $722.5 million and cash of $433.5 million funded with borrowings under our revolving credit facility. In the quarter ended March 31, 2022, we recognized a gain of $305.4 million, net of tax, related to this transaction. Additionally, the Tax Cuts and Jobs Act of 2017 amended Internal Revenue Code Section 174 (“Section 174”) to eliminate current-year deductibility of research and experimentation expenditures and software development costs beginning in 2022, and now requires these costs to be capitalized and amortized over a period of time. For the six months ended June 30, 2022, the change in net cash provided by operations compared to the same period in 2021 is primarily related to higher income tax payments resulting from the DNB gain recognized as part of the Optimal Blue transaction and the effect of the change in timing of deducting certain costs under Section 174.
Business Outlook
As a result of the proposed transaction with Intercontinental Exchange, Inc. (“ICE”) that was announced on May 4, 2022 (the “ICE Transaction”), Black Knight has suspended the practice of providing forward-looking guidance. In addition, Black Knight will not be hosting a conference call related to its second quarter 2022 earnings release.
Definitions of non-GAAP financial measures and the reconciliations to the most directly comparable GAAP measures are provided in subsequent sections of the press release narrative and supplemental schedules.
About Black Knight
Black Knight, Inc. (NYSE: BKI) is an award-winning software, data and analytics company that drives innovation in the mortgage lending and servicing and real estate industries, as well as the capital and secondary markets. Businesses leverage our robust, integrated solutions across the entire homeownership life cycle to help retain existing customers, gain new customers, mitigate risk and operate more effectively.
2
Our clients rely on our proven, comprehensive, scalable products and our unwavering commitment to delivering superior client support to achieve their strategic goals and better serve their customers. For more information on Black Knight, please visit www.blackknightinc.com.
Non-GAAP Financial Measures
This earnings release contains non-GAAP financial measures, including Organic revenue growth, Adjusted EBITDA, Adjusted EBITDA margin, Adjusted operating income, Adjusted operating margin, Adjusted net earnings and Adjusted EPS. These are important financial measures for us but are not financial measures as defined by generally accepted accounting principles ("GAAP"). The presentation of this financial information is not intended to be considered in isolation of or as a substitute for, or superior to, the financial information prepared and presented in accordance with GAAP.
We use these non-GAAP financial measures for financial and operational decision making and as a means to evaluate period-to-period comparisons. We believe these measures provide useful information about operating results, enhance the overall understanding of past financial performance and future prospects and allow for greater transparency with respect to key metrics used by management in its financial and operational decision making, including determining a portion of executive compensation. We also present these non-GAAP financial measures because we believe investors, analysts and rating agencies consider them useful in measuring our ability to meet our debt service obligations. By disclosing these non-GAAP financial measures, we believe we offer investors a greater understanding of, and an enhanced level of transparency into, the means by which our management operates the company.
These non-GAAP financial measures are not measures presented in accordance with GAAP, and our use of these terms may vary from that of others in our industry. These non-GAAP financial measures should not be considered as an alternative to revenues, operating income, operating margin, net earnings, net earnings per share, net earnings margin or any other measures derived in accordance with GAAP as measures of operating performance or liquidity. Reconciliations of these non-GAAP financial measures to the most directly comparable GAAP financial measures are presented in the attached schedules.
Revenues, EBITDA, EBITDA margin, Operating income and Operating margin for the Software Solutions and Data and Analytics segments are presented in conformity with Accounting Standards Codification Topic 280, Segment Reporting. These measures are reported to the chief operating decision maker for purposes of making decisions about allocating resources to the segments and assessing their performance. For these reasons, these measures are excluded from the definition of non-GAAP financial measures under the Securities and Exchange Commission’s ("SEC") Regulation G and Item 10(e) of Regulation S-K.
Organic revenue growth - We define Organic revenue growth as Revenues for the current period compared to an adjusted revenue base for the prior period, which is adjusted to add pre-acquisition revenues of acquired businesses for the portion of the prior year matching the portion of the current year that we owned the acquired businesses.
Adjusted EBITDA - We define Adjusted EBITDA as Net earnings attributable to Black Knight, with adjustments to reflect the addition or elimination of certain statement of earnings items including, but not limited to:
| ● | Depreciation and amortization; |
| ● | Impairment charges; |
| ● | Interest expense, net; |
| ● | Income tax expense; |
| ● | Other expense, net; |
| ● | Equity in losses (earnings) of unconsolidated affiliates, net of tax; |
| ● | (Gains) losses related to investments in unconsolidated affiliate, net of tax; |
| ● | Net earnings (losses) attributable to redeemable noncontrolling interests; |
| ● | equity-based compensation, including certain related payroll taxes; |
| ● | acquisition-related costs, including costs pursuant to purchase agreements; |
| ● | costs related to the ICE Transaction; and |
3
| ● | costs associated with expense reduction initiatives. |
These adjustments are reflected in Corporate and Other.
Adjusted EBITDA margin - Adjusted EBITDA margin is calculated by dividing Adjusted EBITDA by Revenues.
Adjusted operating income – We define Adjusted operating income as Operating income, with adjustments to reflect the addition or elimination of certain statement of earnings items including, but not limited to:
| ● | equity-based compensation, including certain related payroll taxes; |
| ● | acquisition-related costs, including costs pursuant to purchase agreements; |
| ● | costs related to the ICE Transaction; |
| ● | costs associated with expense reduction initiatives; and |
| ● | the net incremental depreciation and amortization adjustments associated with the application of purchase accounting. |
These adjustments are reflected in Corporate and Other.
Adjusted operating margin - Adjusted operating margin is calculated by dividing Adjusted operating income by Revenues.
Adjusted net earnings - We define Adjusted net earnings as Net earnings attributable to Black Knight with adjustments to reflect the addition or elimination of certain statement of earnings items including, but not limited to:
| ● | equity in losses (earnings) of unconsolidated affiliates, net of tax; |
| ● | (gains) losses related to investments in unconsolidated affiliate, net of tax; |
| ● | the net incremental depreciation and amortization adjustments associated with the application of purchase accounting; |
| ● | equity-based compensation, including certain related payroll taxes; |
| ● | costs associated with debt and/or equity offerings; |
| ● | acquisition-related costs, including costs pursuant to purchase agreements; |
| ● | costs related to the ICE Transaction; |
| ● | costs associated with expense reduction initiatives; |
| ● | costs and settlement (gains) losses associated with significant legal matters; |
| ● | adjustment for income tax expense primarily related to the tax effect of the non-GAAP adjustments and a discrete income tax benefit related to the establishment of a deferred tax asset as a result of our reorganization of certain wholly-owned subsidiaries; and |
| ● | adjustment for redeemable noncontrolling interests primarily related to the effect of the non-GAAP adjustments. |
Adjusted EPS - Adjusted EPS is calculated by dividing Adjusted net earnings by the diluted weighted average shares of common stock outstanding.
Forward-Looking Statements
This press release contains forward-looking statements that involve a number of risks and uncertainties. Statements that are not historical facts, including statements regarding expectations, hopes, intentions or strategies regarding the future are forward-looking statements. Forward-looking statements are based on Black Knight management’s beliefs, as well as assumptions made by, and information currently available to, them. Because such statements are based on expectations as to future financial and operating results and are not statements of fact, actual results may differ materially from those projected. Black Knight undertakes no obligation to update any forward-looking statements, whether as a result of new information, future events or otherwise.
4
The risks and uncertainties that forward-looking statements are subject to include, but are not limited to:
| ● | the occurrence of any event, change, or other circumstance that could give rise to a right in favor of ICE or us to terminate the definitive merger agreement governing the terms and conditions of the proposed transaction; |
| ● | the outcome of any legal proceedings that may be instituted against us or ICE; |
| ● | the possibility that the proposed transaction does not close when expected or at all because required regulatory, stockholder, or other approvals and other conditions to closing are not received or satisfied on a timely basis or at all (and the risk that such approvals may result in the imposition of conditions that could adversely affect ICE or us or the expected benefits of the proposed transaction); |
| ● | the diversion of management’s attention and time from ongoing business operations and opportunities on merger-related matters; |
| ● | security breaches against our information systems or breaches involving our third-party vendors; |
| ● | our ability to maintain and grow our relationships with our clients; |
| ● | our ability to comply with or changes to the laws, rules and regulations that affect our and our clients’ businesses; |
| ● | our ability to adapt our solutions to technological changes or evolving industry standards or to achieve our growth strategies; |
| ● | our ability to protect our proprietary software and information rights; |
| ● | the effect of any potential defects, development delays, installation difficulties or system failures on our business and reputation; |
| ● | changes in general economic, business, regulatory and political conditions; |
| ● | impacts to our business operations caused by the occurrence of a catastrophe or global crisis; |
| ● | the effects of our existing leverage on our ability to make acquisitions and invest in our business; |
| ● | risks associated with the recruitment and retention of our skilled workforce; |
| ● | risks associated with the availability of data; |
| ● | our ability to successfully consummate, integrate and achieve the intended benefits of acquisitions; |
| ● | risks associated with our investment in DNB; and |
| ● | other risks and uncertainties detailed in the “Statement Regarding Forward-Looking Information”, “Risk Factors” and other sections of our Annual Report on Form 10-K for the year ended December 31, 2021 and other filings with the SEC. |
IMPORTANT ADDITIONAL INFORMATION AND WHERE TO FIND IT
In connection with the ICE Transaction, on June 17, 2022, ICE filed with the SEC a Registration Statement on Form S-4 (File No. 333-265709), as amended on July 22, 2022, to register the shares of ICE common stock to be issued in connection with the ICE Transaction. The Registration Statement includes a preliminary proxy statement of ours that also constitutes a preliminary prospectus of ICE. Once the Registration Statement becomes effective and the proxy statement/prospectus is in definitive form, the definitive proxy statement/prospectus will be mailed to our stockholders seeking their approval of the ICE Transaction and other related matters.
INVESTORS AND SECURITY HOLDERS ARE URGED TO READ THE REGISTRATION STATEMENT ON FORM S-4 AND THE PROXY STATEMENT/PROSPECTUS INCLUDED WITHIN THE REGISTRATION STATEMENT ON FORM S-4, AS WELL AS ANY OTHER RELEVANT DOCUMENTS FILED OR THAT WILL BE FILED WITH THE SEC IN CONNECTION WITH THE ICE TRANSACTION OR INCORPORATED BY REFERENCE INTO THE PROXY STATEMENT/PROSPECTUS, BECAUSE THEY CONTAIN OR WILL CONTAIN IMPORTANT INFORMATION REGARDING US, ICE, THE ICE TRANSACTION AND RELATED MATTERS.
Investors and security holders may obtain free copies of these documents and other documents filed with the SEC by us or ICE through the website maintained by the SEC at http://www.sec.gov or from us at our
5
website, www.blackknightinc.com, or from ICE at its website, www.theice.com. Documents filed with the SEC by us will be available free of charge by accessing our website at www.blackknightinc.com under the tab “Investors” and then under the heading “Financials – SEC Filings” or, alternatively, by directing a request by mail or telephone to Black Knight, Inc., 601 Riverside Avenue, Jacksonville, Florida 32204, Attention: Investor Relations, (904) 854-5100, and documents filed with the SEC by ICE will be available free of charge by accessing ICE’s website at www.theice.com and following the link for “Investor Relations” or, alternatively, by directing a request by mail or telephone to Intercontinental Exchange, Inc., 5660 New Northside Drive, Third Floor, Atlanta, Georgia 30328, Attention: Investor Relations, (770) 857-4700, or by email to [email protected].
PARTICIPANTS IN THE SOLICITATION
We, ICE, and certain of our and their respective directors and executive officers may be deemed to be participants in the solicitation of proxies from our stockholders in connection with the ICE Transaction under the rules of the SEC. Information about the interests of our and ICE’s directors and executive officers and other persons who may be deemed to be participants in the solicitation of our stockholders in connection with the ICE Transaction and a description of their direct and indirect interests, by security holdings or otherwise, are contained in the preliminary proxy statement/prospectus that has been filed with the SEC and will be contained in the definitive proxy statement/prospectus related to the ICE Transaction, which will be filed with the SEC. Additional information about us, our directors and executive officers and their ownership of our common stock is also set forth in the definitive proxy statement for our 2022 Annual Meeting of Stockholders, as filed with the SEC on Schedule 14A on April 28, 2022, and other documents subsequently filed by us with the SEC. Additional information about ICE, the directors and executive officers of ICE and their ownership of ICE common stock can also be found in ICE’s definitive proxy statement in connection with its 2022 Annual Meeting of Stockholders, as filed with the SEC on March 25, 2022, and other documents subsequently filed by ICE with the SEC. Free copies of these documents may be obtained as described above.
NO OFFER OR SOLICITATION
This communication is not intended to and shall not constitute an offer to sell or the solicitation of an offer to sell or the solicitation of an offer to buy any securities or a solicitation of any vote of approval, nor shall there be any sale of securities in any jurisdiction in which such offer, solicitation or sale would be unlawful prior to registration or qualification under the securities laws of any such jurisdiction. No offer of securities shall be made except by means of a prospectus meeting the requirements of Section 10 of the Securities Act of 1933, as amended.
6
BLACK KNIGHT, INC.
Consolidated Balance Sheets
(In millions)
(Unaudited)
|
| June 30, 2022 |
| December 31, 2021 | ||
ASSETS | | |
|
| |
|
Current assets: | | |
|
| |
|
Cash and cash equivalents | | $ | 38.0 | | $ | 77.1 |
Trade receivables, net | |
| 203.2 | |
| 191.8 |
Prepaid expenses and other current assets | |
| 97.7 | |
| 83.0 |
Receivables from related parties | |
| 6.1 | |
| 0.2 |
Total current assets | |
| 345.0 | |
| 352.1 |
Property and equipment, net | |
| 146.6 | |
| 154.5 |
Software, net | |
| 469.6 | |
| 497.0 |
Other intangible assets, net | |
| 539.6 | |
| 613.2 |
Goodwill | |
| 3,817.1 | |
| 3,817.3 |
Investments in unconsolidated affiliates | |
| 171.4 | |
| 490.5 |
Deferred contract costs, net | |
| 198.0 | |
| 196.0 |
Other non-current assets | |
| 241.2 | |
| 230.3 |
Total assets | | $ | 5,928.5 | | $ | 6,350.9 |
LIABILITIES AND EQUITY | |
|
| |
|
|
Current liabilities: | |
|
| |
|
|
Trade accounts payable and other accrued liabilities | | $ | 59.8 | | $ | 64.5 |
Income taxes payable | | | 46.8 | |
| 11.8 |
Accrued compensation and benefits | |
| 75.4 | |
| 91.4 |
Current portion of debt | |
| 33.6 | |
| 32.5 |
Deferred revenues | |
| 68.8 | |
| 64.6 |
Total current liabilities | |
| 284.4 | |
| 264.8 |
Deferred revenues | |
| 62.0 | |
| 81.5 |
Deferred income taxes | |
| 241.3 | |
| 284.1 |
Long-term debt, net of current portion | |
| 2,736.7 | |
| 2,362.6 |
Other non-current liabilities | |
| 56.6 | |
| 78.7 |
Total liabilities | |
| 3,381.0 | |
| 3,071.7 |
| | | | | | |
Redeemable noncontrolling interests | |
| 47.4 | |
| 1,188.8 |
| | | | | | |
Equity: | |
|
| |
|
|
Additional paid-in capital | |
| 1,367.8 | |
| 1,410.9 |
Retained earnings | |
| 1,368.2 | |
| 968.2 |
Accumulated other comprehensive loss | |
| (5.5) | |
| (17.5) |
Treasury stock, at cost | |
| (230.4) | |
| (271.2) |
Total shareholders' equity | |
| 2,500.1 | |
| 2,090.4 |
Total liabilities, redeemable noncontrolling interests and shareholders' equity | | $ | 5,928.5 | | $ | 6,350.9 |
7
BLACK KNIGHT, INC.
Consolidated Statements of Earnings
(In millions, except per share data)
(Unaudited)
|
| Three months ended June 30, | | Six months ended June 30, | ||||||||
|
| 2022 |
| 2021 |
| 2022 |
| 2021 | ||||
Revenues | | $ | 394.5 | | $ | 361.3 | | $ | 781.7 | | $ | 711.0 |
Expenses: | |
|
| |
|
| |
|
| |
|
|
Operating expenses | |
| 216.8 | |
| 197.0 | |
| 424.7 | |
| 383.2 |
Depreciation and amortization | |
| 92.5 | |
| 90.4 | |
| 184.0 | |
| 178.2 |
Transition and integration costs | |
| 8.2 | |
| 4.3 | |
| 15.8 | |
| 12.2 |
Total expenses | |
| 317.5 | |
| 291.7 | |
| 624.5 | |
| 573.6 |
Operating income | |
| 77.0 | |
| 69.6 | |
| 157.2 | |
| 137.4 |
Other income and expense: | |
|
| |
|
| |
|
| |
|
|
Interest expense, net | |
| (22.6) | |
| (20.9) | |
| (43.7) | |
| (41.2) |
Other expense, net | |
| (2.4) | |
| (1.0) | |
| (3.6) | |
| (4.2) |
Total other expense, net | |
| (25.0) | |
| (21.9) | |
| (47.3) | |
| (45.4) |
Earnings before income taxes and equity in (losses) earnings of unconsolidated affiliates | |
| 52.0 | |
| 47.7 | |
| 109.9 | |
| 92.0 |
Income tax expense | |
| 11.6 | |
| 10.5 | |
| 10.5 | |
| 15.7 |
Earnings before equity in (losses) earnings of unconsolidated affiliates | |
| 40.4 | |
| 37.2 | |
| 99.4 | |
| 76.3 |
Equity in (losses) earnings of unconsolidated affiliates, net of tax | |
| (0.1) | |
| (5.0) | |
| 303.0 | |
| 1.4 |
Net earnings | |
| 40.3 | |
| 32.2 | |
| 402.4 | |
| 77.7 |
Net losses attributable to redeemable noncontrolling interests | |
| — | |
| 7.5 | |
| 2.5 | |
| 16.1 |
Net earnings attributable to Black Knight | | $ | 40.3 | | $ | 39.7 | | $ | 404.9 | | $ | 93.8 |
| | | | | | | | | | | | |
Net earnings per share attributable to Black Knight shareholders: | |
|
| |
|
| |
|
| |
|
|
Basic | | $ | 0.26 | | $ | 0.26 | | $ | 2.62 | | $ | 0.60 |
Diluted | | $ | 0.26 | | $ | 0.25 | | $ | 2.60 | | $ | 0.60 |
Weighted average shares of common stock outstanding: | |
|
| |
|
| |
|
| |
|
|
Basic | |
| 154.5 | |
| 155.4 | |
| 154.4 | |
| 155.5 |
Diluted | |
| 155.6 | |
| 155.7 | |
| 155.5 | |
| 155.8 |
8
BLACK KNIGHT, INC.
Consolidated Statements of Cash Flows
(In millions)
(Unaudited)
|
| Six months ended June 30, | ||||
|
| 2022 |
| 2021 | ||
Cash flows from operating activities: | | |
|
| |
|
Net earnings | | $ | 402.4 | | $ | 77.7 |
Adjustments to reconcile net earnings to net cash provided by operating activities: | |
|
| |
|
|
Depreciation and amortization | |
| 184.0 | |
| 178.2 |
Amortization of debt issuance costs and original issue discount | |
| 1.9 | |
| 2.0 |
Loss on extinguishment of debt | | | — | | | 2.5 |
Deferred income taxes, net | |
| (144.9) | |
| (3.9) |
Equity in earnings of unconsolidated affiliates, net of tax | |
| (303.0) | |
| (1.4) |
Equity-based compensation | |
| 23.6 | |
| 22.5 |
Changes in assets and liabilities, net of acquired assets and liabilities: | |
| | |
| |
Trade receivables, including receivables from related parties | |
| (17.4) | |
| (10.7) |
Prepaid expenses and other assets | |
| (28.1) | |
| (36.8) |
Deferred contract costs | |
| (21.7) | |
| (24.1) |
Deferred revenues | |
| (15.3) | |
| 6.4 |
Trade accounts payable and other liabilities | |
| 8.3 | |
| (13.2) |
Net cash provided by operating activities | |
| 89.8 | |
| 199.2 |
Cash flows from investing activities: | |
|
| |
|
|
Additions to property and equipment | |
| (11.8) | |
| (11.5) |
Additions to software | |
| (43.7) | |
| (45.4) |
Business acquisitions, net of cash acquired | |
| — | |
| (48.3) |
Asset acquisitions | |
| — | |
| (10.0) |
Other investing activities | |
| (4.0) | |
| (1.2) |
Net cash used in investing activities | |
| (59.5) | |
| (116.4) |
Cash flows from financing activities: | |
|
| |
|
|
Revolver borrowings | |
| 585.8 | |
| 260.3 |
Revolver payments | |
| (195.1) | |
| (210.0) |
Term loan borrowings | | | — | | | 1.6 |
Term loan payments | |
| (14.4) | |
| — |
Payments made for redeemable noncontrolling interests | |
| (433.5) | |
| — |
Purchases of treasury stock | |
| — | |
| (46.7) |
Tax withholding payments for restricted share vesting | |
| (11.0) | |
| (24.4) |
Finance lease payments | |
| (0.8) | |
| (2.0) |
Debt issuance costs paid | |
| — | |
| (7.6) |
Other financing activities | |
| (0.4) | |
| — |
Net cash used in financing activities | |
| (69.4) | |
| (28.8) |
Net (decrease) increase in cash and cash equivalents | |
| (39.1) | |
| 54.0 |
Cash and cash equivalents, beginning of period | |
| 77.1 | |
| 34.7 |
Cash and cash equivalents, end of period | | $ | 38.0 | | $ | 88.7 |
Supplemental cash flow information: | |
|
| |
|
|
Interest paid, net | | $ | (41.9) | | $ | (40.0) |
Income taxes paid, net | | $ | (124.3) | | $ | (42.7) |
9
BLACK KNIGHT, INC.
Segment Information
(In millions)
(Unaudited)
| | Three months ended June 30, 2022 | ||||||||||
| | Software | | Data and | | Corporate and | | | | |||
|
| Solutions |
| Analytics |
| Other |
| Total | ||||
Revenues | | $ | 339.4 |
| $ | 55.1 | | $ | — | | $ | 394.5 |
Expenses: | |
|
| |
|
| |
|
|
|
|
|
Operating expenses | |
| 148.7 | |
| 37.4 | |
| 30.7 | (1) |
| 216.8 |
Transition and integration costs | |
| — | |
| — | |
| 8.2 | (2) |
| 8.2 |
EBITDA | |
| 190.7 | |
| 17.7 | |
| (38.9) |
|
| 169.5 |
Depreciation and amortization | |
| 35.9 | |
| 4.0 | |
| 52.6 | (3) |
| 92.5 |
Operating income (loss) | |
| 154.8 | |
| 13.7 | |
| (91.5) |
|
| 77.0 |
Interest expense, net | |
|
| |
|
| |
|
|
|
| (22.6) |
Other expense, net | |
|
| |
|
| |
|
|
|
| (2.4) |
Earnings before income taxes and equity in losses of unconsolidated affiliates | |
|
| |
|
| |
|
|
|
| 52.0 |
Income tax expense | |
|
| |
|
| |
|
|
|
| 11.6 |
Earnings before equity in losses of unconsolidated affiliates | |
|
| |
|
| |
|
|
|
| 40.4 |
Equity in losses of unconsolidated affiliates, net of tax | |
|
| |
|
| |
|
|
|
| (0.1) |
Net earnings | |
|
| |
|
| |
|
|
| $ | 40.3 |
| | Three months ended June 30, 2021 | ||||||||||
| | Software |
| Data and | | Corporate and | | | | |||
|
| Solutions | | Analytics | | Other | | Total | ||||
Revenues | | $ | 305.4 | | $ | 55.9 | | $ | — | | $ | 361.3 |
Expenses: | |
|
| |
|
| |
|
|
|
|
|
Operating expenses | |
| 130.6 | |
| 35.1 | |
| 31.3 | (1) |
| 197.0 |
Transition and integration costs | |
| — | | | — | |
| 4.3 | (2) |
| 4.3 |
EBITDA | |
| 174.8 | |
| 20.8 | |
| (35.6) |
|
| 160.0 |
Depreciation and amortization | |
| 33.2 | |
| 3.7 | |
| 53.5 | (3) |
| 90.4 |
Operating income (loss) | |
| 141.6 | |
| 17.1 | |
| (89.1) |
|
| 69.6 |
Interest expense, net | |
|
| |
|
| |
|
|
|
| (20.9) |
Other expense, net | |
|
| |
|
| |
|
|
|
| (1.0) |
Earnings before income taxes and equity in losses of unconsolidated affiliates | |
|
| |
|
| |
|
|
|
| 47.7 |
Income tax expense | |
|
| |
|
| |
|
|
|
| 10.5 |
Earnings before equity in losses of unconsolidated affiliates | |
|
| |
|
| |
|
|
|
| 37.2 |
Equity in losses of unconsolidated affiliates, net of tax | |
|
| |
|
| |
|
|
|
| (5.0) |
Net earnings | | | | | | | | | | | | 32.2 |
Net losses attributable to redeemable noncontrolling interests | | | | | | | | | | | | 7.5 |
Net earnings attributable to Black Knight | |
|
| |
|
| |
|
|
| $ | 39.7 |
10
BLACK KNIGHT, INC.
Segment Information (Continued)
(In millions)
(Unaudited)
| | Six months ended June 30, 2022 | ||||||||||
| | Software |
| Data and | | Corporate and | | | | |||
|
| Solutions | | Analytics |
| Other |
| Total | ||||
Revenues | | $ | 670.1 |
| $ | 111.6 | | $ | — | | $ | 781.7 |
Expenses: | |
|
|
|
|
| |
|
|
|
|
|
Operating expenses | |
| 291.2 |
|
| 74.9 | |
| 58.6 | (1) |
| 424.7 |
Transition and integration costs | |
| — |
|
| — | |
| 15.8 | (2) |
| 15.8 |
EBITDA | |
| 378.9 | |
| 36.7 | |
| (74.4) |
|
| 341.2 |
Depreciation and amortization | |
| 71.0 |
|
| 7.8 | |
| 105.2 | (3) |
| 184.0 |
Operating income (loss) | |
| 307.9 | |
| 28.9 | |
| (179.6) |
|
| 157.2 |
Interest expense, net | |
|
|
|
|
| |
|
|
|
| (43.7) |
Other expense, net | |
|
|
|
|
| |
|
|
|
| (3.6) |
Earnings before income taxes and equity in earnings of unconsolidated affiliates | |
|
|
|
|
| |
|
|
|
| 109.9 |
Income tax expense | |
|
|
|
|
| |
|
|
|
| 10.5 |
Earnings before equity in earnings of unconsolidated affiliates | |
|
|
|
|
| |
|
|
|
| 99.4 |
Equity in earnings of unconsolidated affiliates, net of tax | |
|
|
|
|
| |
|
|
|
| 303.0 |
Net earnings | |
|
|
|
|
| |
|
|
|
| 402.4 |
Net losses attributable to redeemable noncontrolling interests | |
|
|
|
|
| |
|
|
|
| 2.5 |
Net earnings attributable to Black Knight | |
|
|
|
|
| |
|
|
| $ | 404.9 |
| | Six months ended June 30, 2021 | ||||||||||
| | Software | | Data and | | Corporate and |
| | | |||
|
| Solutions |
| Analytics |
| Other |
| Total | ||||
Revenues | | $ | 601.2 | | $ | 109.8 | | $ | — | | $ | 711.0 |
Expenses: | |
|
| |
|
| |
|
|
|
|
|
Operating expenses | |
| 255.5 | |
| 69.3 | |
| 58.4 | (1) |
| 383.2 |
Transition and integration costs | |
| — | |
| — | |
| 12.2 | (2) |
| 12.2 |
EBITDA | |
| 345.7 | |
| 40.5 | |
| (70.6) |
|
| 315.6 |
Depreciation and amortization | |
| 64.4 | |
| 7.5 | |
| 106.3 | (3) |
| 178.2 |
Operating income (loss) | |
| 281.3 | |
| 33.0 | |
| (176.9) |
|
| 137.4 |
Interest expense, net | |
|
| |
|
| |
|
|
|
| (41.2) |
Other expense, net | |
|
| |
|
| |
|
|
|
| (4.2) |
Earnings before income taxes and equity in earnings of unconsolidated affiliates | |
|
| |
|
| |
|
|
|
| 92.0 |
Income tax expense | |
|
| |
|
| |
|
|
|
| 15.7 |
Earnings before equity in earnings of unconsolidated affiliates | |
|
| |
|
| |
|
|
|
| 76.3 |
Equity in earnings of unconsolidated affiliates, net of tax | |
|
| |
|
| |
|
|
|
| 1.4 |
Net earnings | | | | | | | | | | | | 77.7 |
Net losses attributable to redeemable noncontrolling interests | | | | | | | | | | | | 16.1 |
Net earnings attributable to Black Knight | |
|
| |
|
| |
|
|
| $ | 93.8 |
| (1) | Operating expenses for Corporate and Other includes equity-based compensation, including certain related payroll taxes, of $13.0 million and $13.2 million for the three months ended June 30, 2022 and 2021, respectively, and $24.2 million and $23.7 million for the six months ended June 30, 2022 and 2021, respectively. |
| (2) | Transition and integration costs primarily consists of costs associated with acquisitions and costs related to the ICE Transaction. |
| (3) | Depreciation and amortization for Corporate and Other primarily represents net incremental depreciation and amortization adjustments associated with the application of purchase accounting recorded in accordance with GAAP. |
11
BLACK KNIGHT, INC.
Reconciliation of GAAP to Non-GAAP Financial Measures
(In millions)
(Unaudited)
Reconciliation of Revenues to Organic Revenue Growth
| | Three months ended June 30, | | |
| ||||||||||
| | 2022 | | 2021 | | Organic |
| ||||||||
| | | | | | | | Pre-acquisition | | Adjusted | | revenue |
| ||
|
| As reported |
| As reported |
| revenues(1) |
| base |
| growth |
| ||||
Servicing Software | | $ | 221.7 | | $ | 207.8 | | $ | — | | $ | 207.8 | | 7 | % |
Origination Software | | | 117.7 | (2) | | 97.6 | | | 5.7 | | | 103.3 | | 14 | % |
Software Solutions | | | 339.4 | | | 305.4 | | | 5.7 | | | 311.1 | | 9 | % |
Data and Analytics | | | 55.1 | (3) | | 55.9 | | | 0.6 | | | 56.5 | | (2) | % |
Revenues | | $ | 394.5 | | $ | 361.3 |
| $ | 6.3 | | $ | 367.6 |
| 7 | % |
Note: Amounts may not recalculate due to rounding.
| (1) | Includes pre-acquisition revenues of TOMN Holdings, Inc. (“Top of Mind”) and eMBS, Inc. (“eMBS”) for the three months ended June 30, 2021. |
| (2) | Includes revenues of $6.4 million from the acquisition of Top of Mind. |
| (3) | Includes revenues of $0.7 million from the acquisition of eMBS (4/1/22 - 5/16/22). |
| | Six months ended June 30, | | |
| ||||||||||
|
| 2022 |
| 2021 | | Organic |
| ||||||||
| | | | | | | | Pre-acquisition | | Adjusted | | revenue |
| ||
|
| As reported |
| As reported |
| revenues(1) |
| base |
| growth |
| ||||
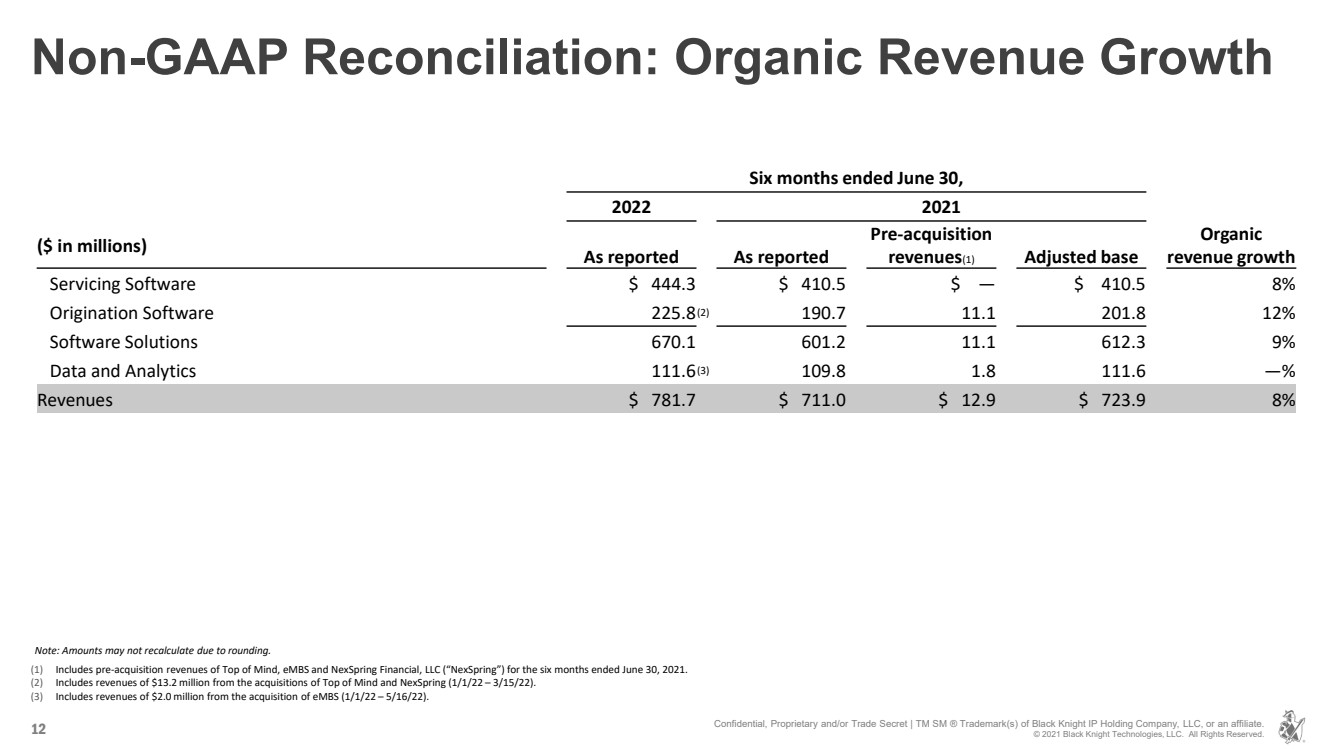
Servicing Software | | $ | 444.3 | | $ | 410.5 | | $ | — | | $ | 410.5 | | 8 | % |
Origination Software | | | 225.8 | (2) | | 190.7 | | | 11.1 | | | 201.8 | | 12 | % |
Software Solutions | | | 670.1 | | | 601.2 | | | 11.1 | | | 612.3 | | 9 | % |
Data and Analytics | | | 111.6 | (3) | | 109.8 | | | 1.8 | | | 111.6 | | — | % |
Revenues | | $ | 781.7 | | $ | 711.0 | | $ | 12.9 | | $ | 723.9 |
| 8 | % |
Note: Amounts may not recalculate due to rounding.
| (1) | Includes pre-acquisition revenues of Top of Mind, eMBS and NexSpring Financial, LLC (“NexSpring”) for the six months ended June 30, 2021. |
| (2) | Includes revenues of $13.2 million from the acquisitions of Top of Mind and NexSpring (1/1/22 - 3/15/22). |
| (3) | Includes revenues of $2.0 million from the acquisition of eMBS (1/1/22 - 5/16/22). |
12
BLACK KNIGHT, INC.
Reconciliation of GAAP to Non-GAAP Financial Measures (Continued)
(In millions)
(Unaudited)
Reconciliation of Net Earnings to Adjusted EBITDA
| | Three months ended June 30, | | Six months ended June 30, |
| ||||||||
|
| 2022 |
| 2021 |
| 2022 |
| 2021 |
| ||||
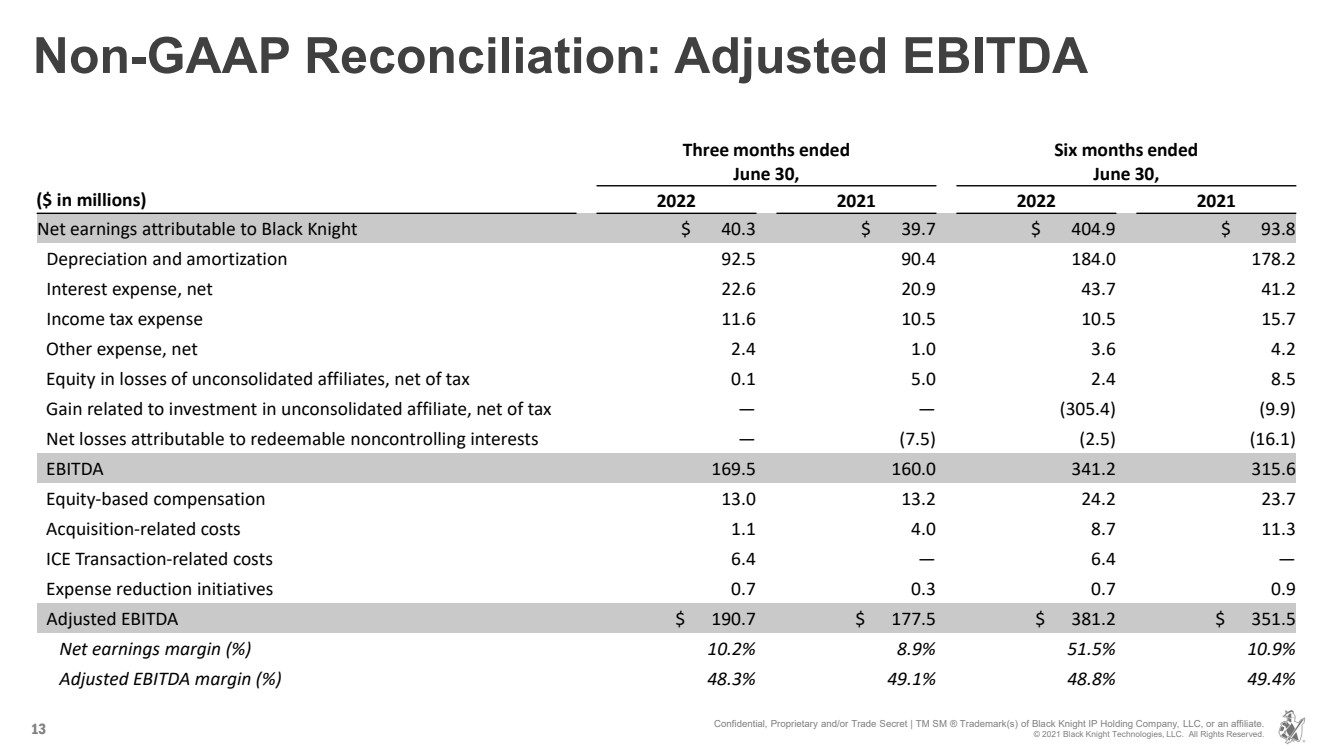
Net earnings attributable to Black Knight | | $ | 40.3 | | $ | 39.7 | | $ | 404.9 | | $ | 93.8 | |
Depreciation and amortization | |
| 92.5 | |
| 90.4 | |
| 184.0 | |
| 178.2 | |
Interest expense, net | |
| 22.6 | |
| 20.9 | |
| 43.7 | |
| 41.2 | |
Income tax expense | |
| 11.6 | |
| 10.5 | |
| 10.5 | |
| 15.7 | |
Other expense, net | |
| 2.4 | |
| 1.0 | |
| 3.6 | |
| 4.2 | |
Equity in losses of unconsolidated affiliates, net of tax | |
| 0.1 | |
| 5.0 | |
| 2.4 | |
| 8.5 | |
Gain related to investment in unconsolidated affiliate, net of tax | |
| — | |
| — | |
| (305.4) | |
| (9.9) | |
Net losses attributable to redeemable noncontrolling interests | |
| — | |
| (7.5) | |
| (2.5) | |
| (16.1) | |
EBITDA | |
| 169.5 | |
| 160.0 | |
| 341.2 | |
| 315.6 | |
Equity-based compensation | |
| 13.0 | |
| 13.2 | |
| 24.2 | |
| 23.7 | |
Acquisition-related costs | |
| 1.1 | |
| 4.0 | |
| 8.7 | |
| 11.3 | |
ICE Transaction-related costs | |
| 6.4 | |
| — | |
| 6.4 | |
| — | |
Expense reduction initiatives | |
| 0.7 | |
| 0.3 | |
| 0.7 | |
| 0.9 | |
Adjusted EBITDA | | $ | 190.7 | | $ | 177.5 | | $ | 381.2 | | $ | 351.5 | |
Net earnings margin | |
| 10.2 | % | | 8.9 | % | | 51.5 | % | | 10.9 | % |
Adjusted EBITDA margin | |
| 48.3 | % | | 49.1 | % | | 48.8 | % | | 49.4 | % |
Reconciliation of Operating Income to Adjusted Operating Income
| | Three months ended June 30, | | Six months ended June 30, | ||||||||||||
|
| 2022 | | 2021 | | 2022 | | 2021 | ||||||||
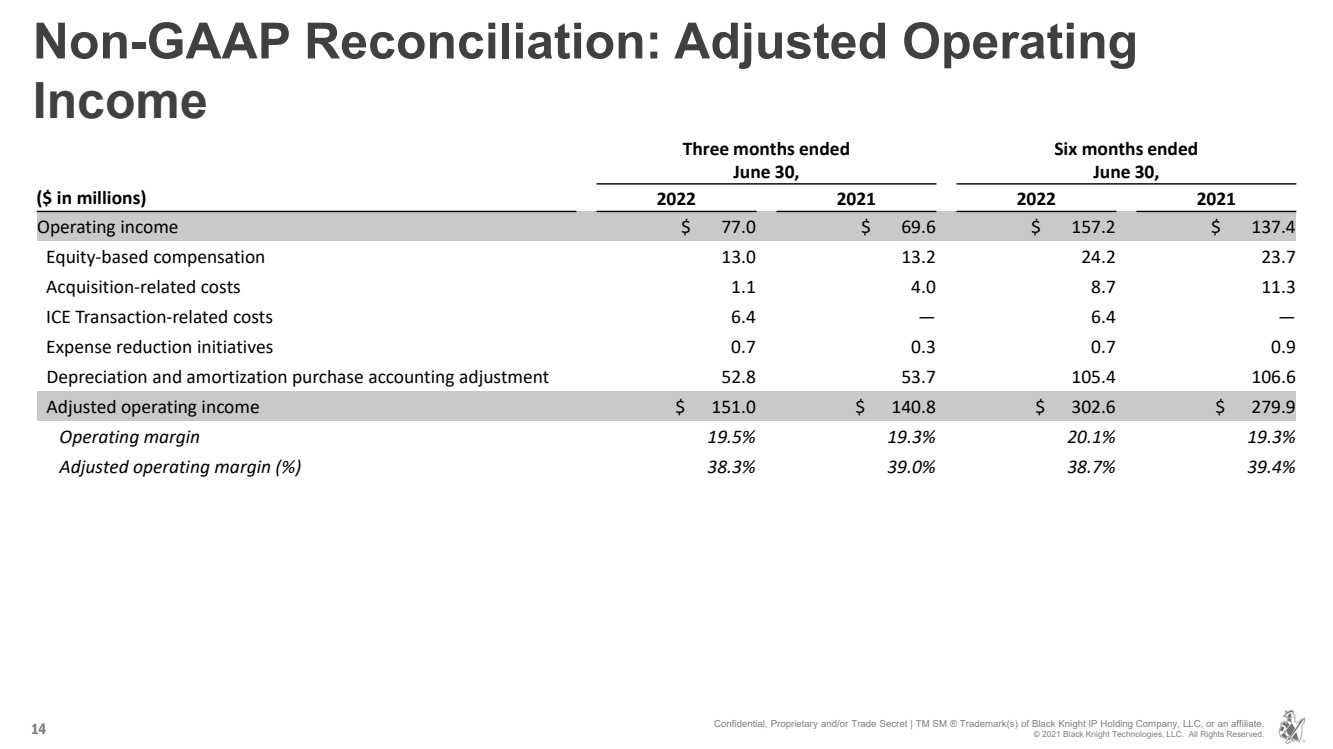
Operating income | | $ | 77.0 | | $ | 69.6 | | $ | 157.2 | | $ | 137.4 | ||||
Equity-based compensation | |
| 13.0 | |
| 13.2 | |
| 24.2 | |
| 23.7 | ||||
Acquisition-related costs | |
| 1.1 | |
| 4.0 | |
| 8.7 | |
| 11.3 | ||||
ICE Transaction-related costs | |
| 6.4 | |
| — | |
| 6.4 | |
| — | ||||
Expense reduction initiatives | |
| 0.7 | |
| 0.3 | |
| 0.7 | |
| 0.9 | ||||
Depreciation and amortization purchase accounting adjustment | |
| 52.8 | |
| 53.7 | |
| 105.4 | |
| 106.6 | ||||
Adjusted operating income | | $ | 151.0 | | $ | 140.8 | | $ | 302.6 | | $ | 279.9 | ||||
Operating margin | | | 19.5 | % | | | 19.3 | % | | | 20.1 | % | | | 19.3 | % |
Adjusted operating margin | | | 38.3 | % | | | 39.0 | % | | | 38.7 | % | | | 39.4 | % |
13
BLACK KNIGHT, INC.
Reconciliation of GAAP to Non-GAAP Financial Measures (Continued)
(In millions, except per share data)
(Unaudited)
Reconciliation of Net Earnings to Adjusted Net Earnings
|
| Three months ended June 30, | | Six months ended June 30, | ||||||||
|
| 2022 |
| 2021 |
| 2022 |
| 2021 | ||||
Net earnings attributable to Black Knight | | $ | 40.3 | | $ | 39.7 | | $ | 404.9 | | $ | 93.8 |
Equity in losses of unconsolidated affiliates, net of tax | |
| 0.1 | |
| 5.0 | |
| 2.4 | |
| 8.5 |
Gain related to investment in unconsolidated affiliate, net of tax | |
| — | |
| — | |
| (305.4) | |
| (9.9) |
Depreciation and amortization purchase accounting adjustment (1) | |
| 52.8 | | | 53.7 | | | 105.4 | | | 106.6 |
Equity-based compensation (2) | |
| 13.0 | | | 13.2 | | | 24.2 | | | 23.7 |
Debt and/or equity offering expenses | |
| — | | | 0.1 | | | — | | | 2.3 |
Acquisition-related costs | |
| 1.1 | | | 4.0 | | | 8.7 | | | 11.3 |
ICE Transaction-related costs | |
| 6.4 | | | — | | | 6.4 | | | — |
Expense reduction initiatives | |
| 0.7 | | | 0.3 | | | 0.7 | | | 0.9 |
Legal matters | |
| 2.4 | | | 1.0 | | | 3.7 | | | 1.9 |
Income tax expense adjustment (3) | |
| (16.3) | | | (15.9) | | | (47.4) | | | (38.0) |
Redeemable noncontrolling interests adjustment (4) | |
| — | | | (12.5) | | | (5.8) | | | (25.0) |
Adjusted net earnings | | $ | 100.5 | | $ | 88.6 | | $ | 197.8 | | $ | 176.1 |
| | | | | | | | | | | | |
Adjusted EPS | | $ | 0.65 | | $ | 0.57 | | $ | 1.27 | | $ | 1.13 |
Weighted average shares outstanding, diluted | |
| 155.6 | |
| 155.7 | |
| 155.5 | |
| 155.8 |
| (1) | Components of the depreciation and amortization purchase accounting adjustment are as follows: |
|
| Three months ended June 30, |
| Six months ended June 30, | ||||||||
|
| 2022 |
| 2021 |
| 2022 |
| 2021 | ||||
Other intangible assets | | $ | 36.8 | | $ | 39.1 | | $ | 73.6 | | $ | 77.9 |
Software | |
| 15.8 | | | 14.5 | | | 31.4 | | | 28.4 |
Property and equipment | |
| 0.2 | | | 0.2 | | | 0.4 | | | 0.4 |
Deferred contract costs | |
| — | | | (0.1) | | | — | | | (0.1) |
Depreciation and amortization purchase accounting adjustment | | $ | 52.8 | | $ | 53.7 | | $ | 105.4 | | $ | 106.6 |
| (2) | Includes accelerated recognition of equity-based compensation expense of $2.9 million for the three and six months ended June 20, 2021. |
| (3) | Includes a discrete income tax benefit of $14.1 million related to the establishment of a deferred tax asset as a result of our reorganization of certain wholly-owned subsidiaries for the six months ended June 30, 2022. |
| (4) | The redeemable noncontrolling interests adjustment primarily includes the effect of the net incremental depreciation and amortization adjustments associated with the application of purchase accounting. |
14
| BLACK KNIGHT, INC. Second Quarter 2022 Financial Results August 4, 2022 |

| Forward - Looking Statements This presentation contains forward - looking statements that involve a number of risks and uncertainties. Statements that are not historical facts, including statements regarding expectations, hopes, intentions or strategies regarding the future are forward - looking statements. Forward - looking statements ar e based on Black Knight management's beliefs, as well as assumptions made by, and information currently available to, them. Because such statements are based on expectations as to fu tur e financial and operating results and are not statements of fact, actual results may differ materially from those projected. Black Knight undertakes no obligation to update any forward - looking statements, whether as a result of new informatio n, future events or otherwise. The risks and uncertainties that forward - looking statements are subject to include, but are not limi ted to: the occurrence of any event, change, or other circumstance that could give rise to a right in favor of Intercontinental Exchange, Inc. (“ICE”) or us to terminate the defin iti ve merger agreement governing the terms and conditions of the proposed transaction; the outcome of any legal proceedings that may be instituted against us or ICE; the possibility that the pr oposed transaction does not close when expected or at all because required regulatory, stockholder, or other approvals and other conditions to closing are not received or satisfied on a timely basis or at all (and the risk that such approvals may result in the imposition of conditions that could adversely affect ICE or us or the expected benefits of the proposed transac tio n); the diversion of management’s attention and time from ongoing business operations and opportunities on merger - related matters; security breaches against our information systems or br eaches involving our third - party vendors; our ability to maintain and grow our relationships with our clients; our ability to comply with or changes to the laws, rules and regulations t hat affect our and our clients’ businesses; our ability to adapt our solutions to technological changes or evolving industry standards or to achieve our growth strategies; our ability to pro tec t our proprietary software and information rights; the effect of any potential defects, development delays, installation difficulties or system failures on our business and reputation; ch ang es in general economic, business, regulatory and political conditions; impacts to our business operations caused by the occurrence of a catastrophe or global crisis; the effects of our ex isting leverage on our ability to make acquisitions and invest in our business; risks associated with the recruitment and retention of our skilled workforce; risks associated with the avai lab ility of data; our ability to successfully consummate, integrate and achieve the intended benefits of acquisitions; risks associated with our investment in Dun and Bradstreet Holdings, Inc. (“D NB”); and other risks and uncertainties detailed in the “Statement Regarding Forward - Looking Information”, “Risk Factors” and other sections of our Annual Report on Form 10 - K for the y ear ended December 31, 2021 and other filings with the Securities and Exchange Commission (“SEC”). Non - GAAP Financial Measures This presentation contains non - GAAP financial measures, including Organic revenue growth, Adjusted EBITDA, Adjusted EBITDA margin, Adjusted operating income, Adjusted operating margin, Adjusted net earnings and Adjusted EPS .. These are important financial measures for us but are not financial measures as defined by generally accepted accounting principles ("GAAP") .. The presentation of this financial information is not intended to be considered in isolation of or as a substitute for, or superior to, the financial information prepared and presented in accordance with GAAP .. We use these non - GAAP financial measures for financial and operational decision making and as a means to evaluate period - to - period comparisons .. We believe these measures provide useful information about operating results, enhance the overall understanding of past financial performance and future prospects and allow for greater transparency with respect to key metrics used by management in its financial and operational decision making, including determining a portion of executive compensation .. We also present these non - GAAP financial measures because we believe investors, analysts and rating agencies consider them useful in measuring our ability to meet our debt service obligations .. By disclosing these non - GAAP financial measures, we believe we offer investors a greater understanding of, and an enhanced level of transparency into, the means by which our management operates the company .. These non - GAAP financial measures are not measures presented in accordance with GAAP, and our use of these terms may vary from that of others in our industry .. These non - GAAP financial measures should not be considered as an alternative to revenues, operating income, operating margin, net earnings, net earnings per share, net earnings margin or any other measures derived in accordance with GAAP as measures of operating performance or liquidity .. Reconciliations of these non - GAAP financial measures to the most directly comparable GAAP financial measures are presented in the attached schedules .. See the Appendix for further information .. Revenues, EBITDA and EBITDA margin, Operating income and Operating margin for the Software Solutions and Data and Analytics segments are presented in conformity with Accounting Standards Codification Topic 280 , Segment Reporting .. These measures are reported to the chief operating decision maker for purposes of making decisions about allocating resources to the segments and assessing their performance .. For these reasons, these measures are excluded from the definition of non - GAAP financial measures under the SEC's Regulation G and Item 10 (e) of Regulation S - K .. 2 Disclaimer Confidential, Proprietary and/or Trade Secret | TM SM ® Trademark(s) of Black Knight IP Holding Company, LLC, or an affiliate .. © 2021 Black Knight Technologies, LLC. All Rights Reserved. |
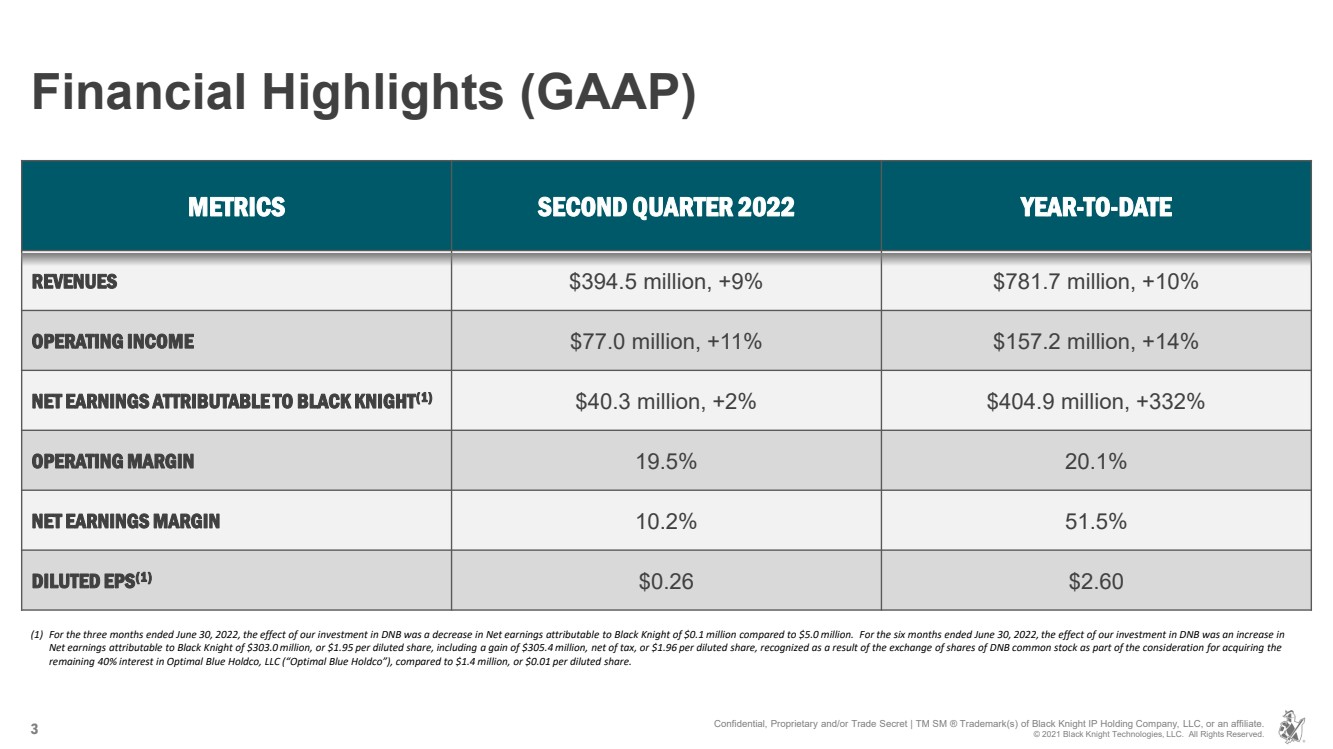
| 3 Financial Highlights (GAAP) METRICS SECOND QUARTER 2022 YEAR - TO - DATE REVENUES $394.5 million, +9% $781.7 million, +10% OPERATING INCOME $77.0 million, +11% $157.2 million, +14% NET EARNINGS ATTRIBUTABLE TO BLACK KNIGHT (1) $40.3 million, +2% $404.9 million, +332% OPERATING MARGIN 19.5% 20.1% NET EARNINGS MARGIN 10.2% 51.5% DILUTED EPS (1) $0.26 $2.60 Confidential, Proprietary and/or Trade Secret | TM SM ® Trademark(s) of Black Knight IP Holding Company, LLC, or an affiliate .. © 2021 Black Knight Technologies, LLC. All Rights Reserved. (1) For the three months ended June 30, 2022, the effect of our investment in DNB was a decrease in Net earnings attributable to Black Knight of $0.1 million compared to $5.0 million. For the six months ended June 30, 2022, the effect of our investment in DNB was an increase in Net earnings attributable to Black Knight of $303.0 million, or $1.95 per diluted share, including a gain of $305.4 million, net of tax, or $1.96 per diluted share, recognized as a result of the exchange of shares of DNB common stock as part of the consi de ration for acquiring the remaining 40% interest in Optimal Blue Holdco, LLC (“Optimal Blue Holdco”), compared to $1.4 million, or $0.01 per diluted sh are .. |
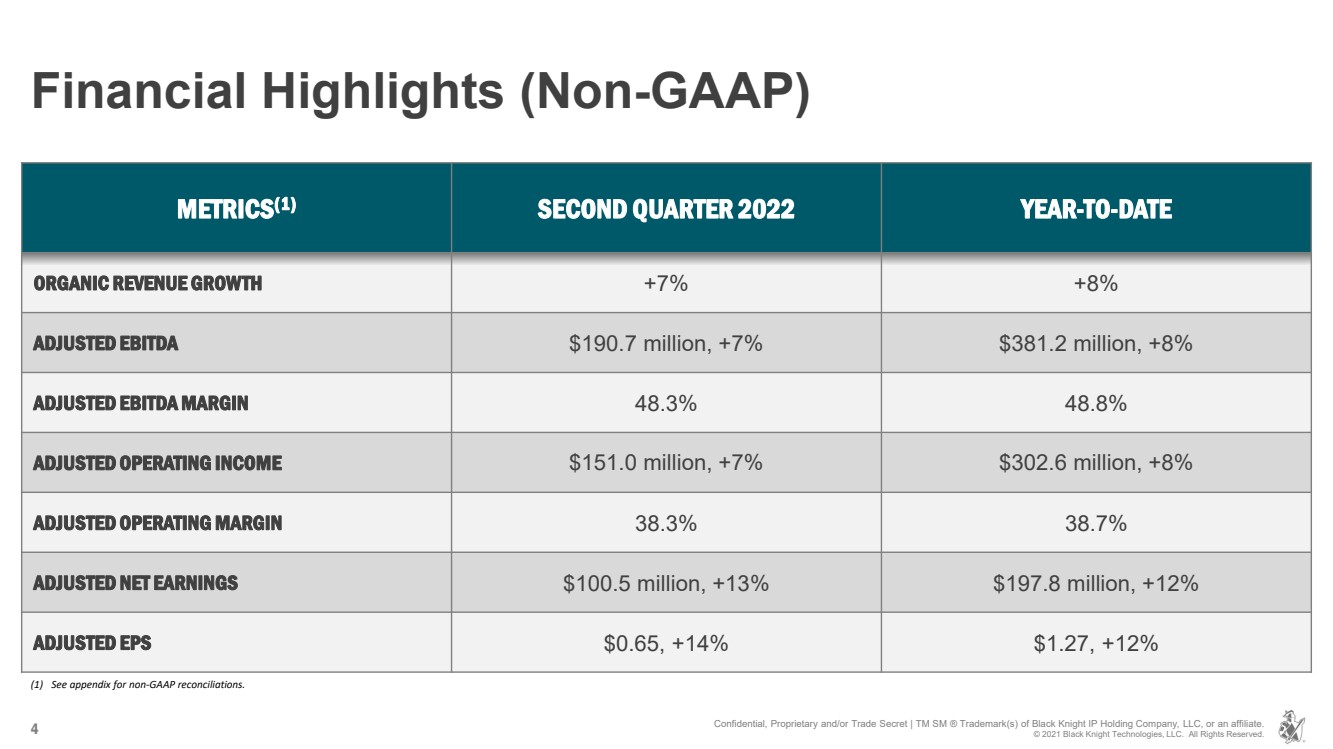
| 4 Financial Highlights (Non - GAAP) METRICS (1) SECOND QUARTER 2022 YEAR - TO - DATE ORGANIC REVENUE GROWTH +7% +8% ADJUSTED EBITDA $190.7 million, +7% $381.2 million, +8% ADJUSTED EBITDA MARGIN 48.3% 48.8% ADJUSTED OPERATING INCOME $151.0 million, +7% $302.6 million, +8% ADJUSTED OPERATING MARGIN 38.3% 38.7% ADJUSTED NET EARNINGS $100.5 million, +13% $197.8 million, +12% ADJUSTED EPS $0.65, +14% $1.27, +12% (1) See appendix for non - GAAP reconciliations. Confidential, Proprietary and/or Trade Secret | TM SM ® Trademark(s) of Black Knight IP Holding Company, LLC, or an affiliate .. © 2021 Black Knight Technologies, LLC. All Rights Reserved. |
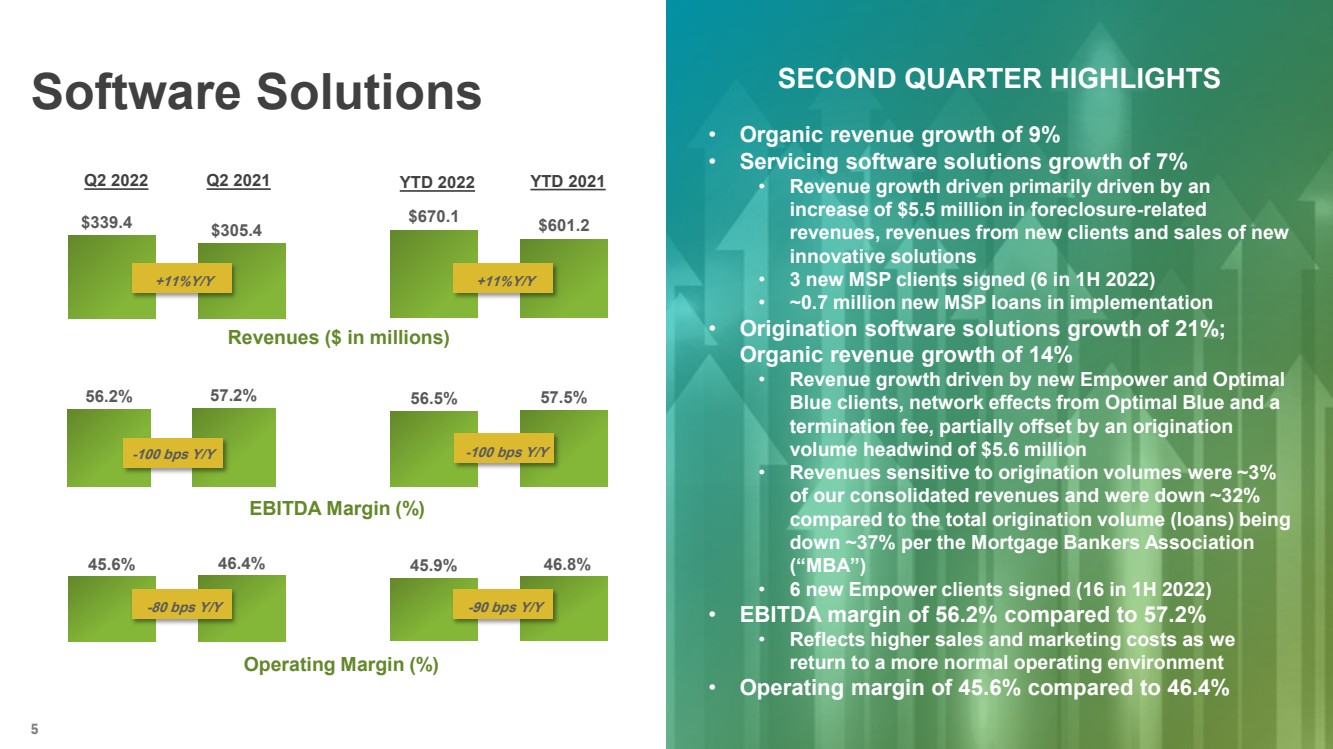
| 5 Confidential, Proprietary and/or Trade Secret | TM SM ® Trademark(s) of Black Knight IP Holding Company, LLC, or an affiliate .. © 2020 Black Knight Technologies, LLC. All Rights Reserved. Software Solutions $339.4 $305.4 $670.1 $601.2 Revenues ($ in millions) +11%Y/Y +11%Y/Y 56.2% 57.2% 56.5% 57.5% - 100 bps Y/Y - 100 bps Y/Y EBITDA Margin (%) 45.6% 46.4% 45.9% 46.8% - 80 bps Y/Y - 90 bps Y/Y Operating Margin (%) Q2 2022 Q2 2021 YTD 2022 YTD 2021 SECOND QUARTER HIGHLIGHTS • Organic revenue growth of 9% • Servicing software solutions growth of 7% • Revenue growth driven primarily driven by an increase of $5.5 million in foreclosure - related revenues, revenues from new clients and sales of new innovative solutions • 3 new MSP clients signed (6 in 1H 2022) • ~0.7 million new MSP loans in implementation • Origination software solutions growth of 21%; Organic revenue growth of 14% • Revenue growth driven by new Empower and Optimal Blue clients, network effects from Optimal Blue and a termination fee, partially offset by an origination volume headwind of $5.6 million • Revenues sensitive to origination volumes were ~3% of our consolidated revenues and were down ~32% compared to the total origination volume (loans) being down ~37% per the Mortgage Bankers Association (“MBA”) • 6 new Empower clients signed (16 in 1H 2022) • EBITDA margin of 56.2% compared to 57.2% • Reflects higher sales and marketing costs as we return to a more normal operating environment • Operating margin of 45.6% compared to 46.4% |
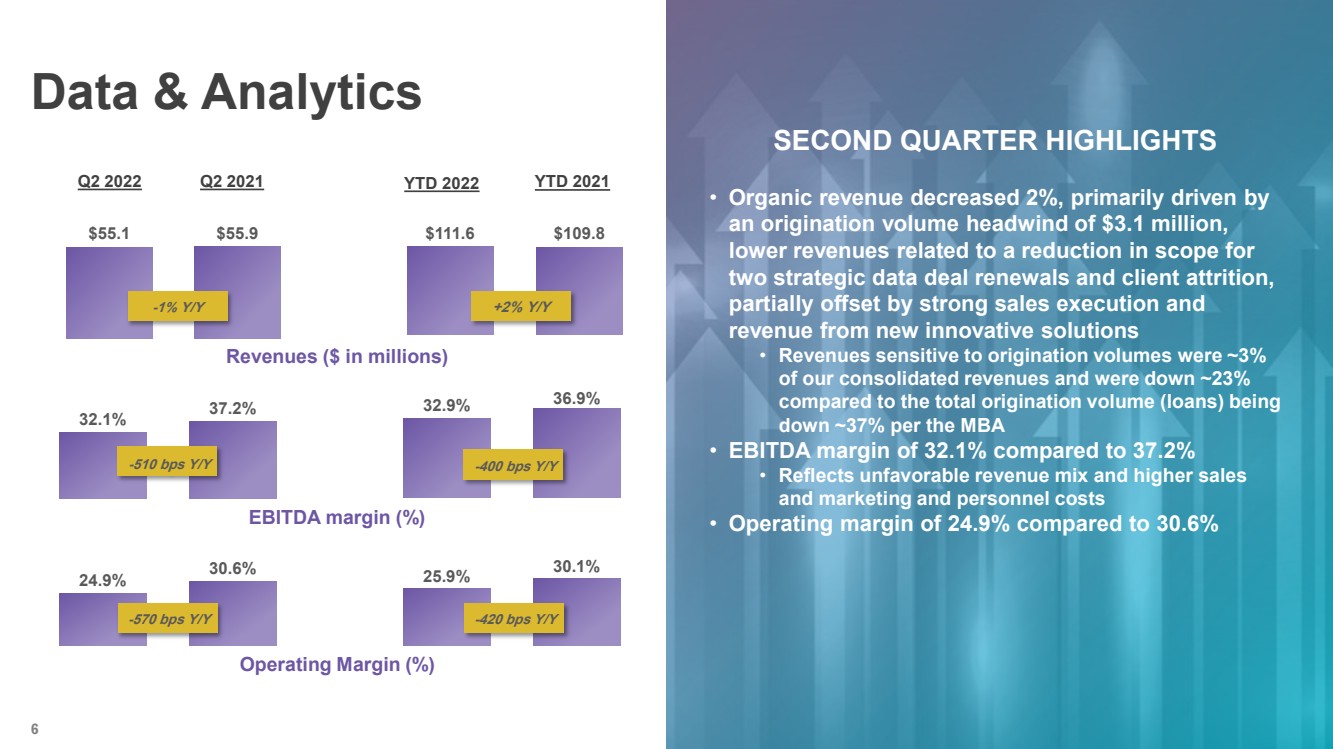
| 6 Confidential, Proprietary and/or Trade Secret | TM SM ® Trademark(s) of Black Knight IP Holding Company, LLC, or an affiliate .. © 2020 Black Knight Technologies, LLC. All Rights Reserved. Data & Analytics $55.1 $55.9 $111.6 $109.8 Revenues ($ in millions) - 1% Y/Y +2% Y/Y EBITDA margin (%) 32.1% 37.2% 32.9% 36.9% - 510 bps Y/Y - 400 bps Y/Y Operating Margin (%) 24.9% 30.6% - 570 bps Y/Y 25.9% 30.1% - 42 0 bps Y/Y Q2 2022 Q2 2021 YTD 2022 YTD 2021 SECOND QUARTER HIGHLIGHTS • Organic revenue decreased 2%, primarily driven by an origination volume headwind of $3.1 million, lower revenues related to a reduction in scope for two strategic data deal renewals and client attrition, partially offset by strong sales execution and revenue from new innovative solutions • Revenues sensitive to origination volumes were ~3% of our consolidated revenues and were down ~23% compared to the total origination volume (loans) being down ~37% per the MBA • EBITDA margin of 32.1% compared to 37.2% • Reflects unfavorable revenue mix and higher sales and marketing and personnel costs • Operating margin of 24.9% compared to 30.6% |
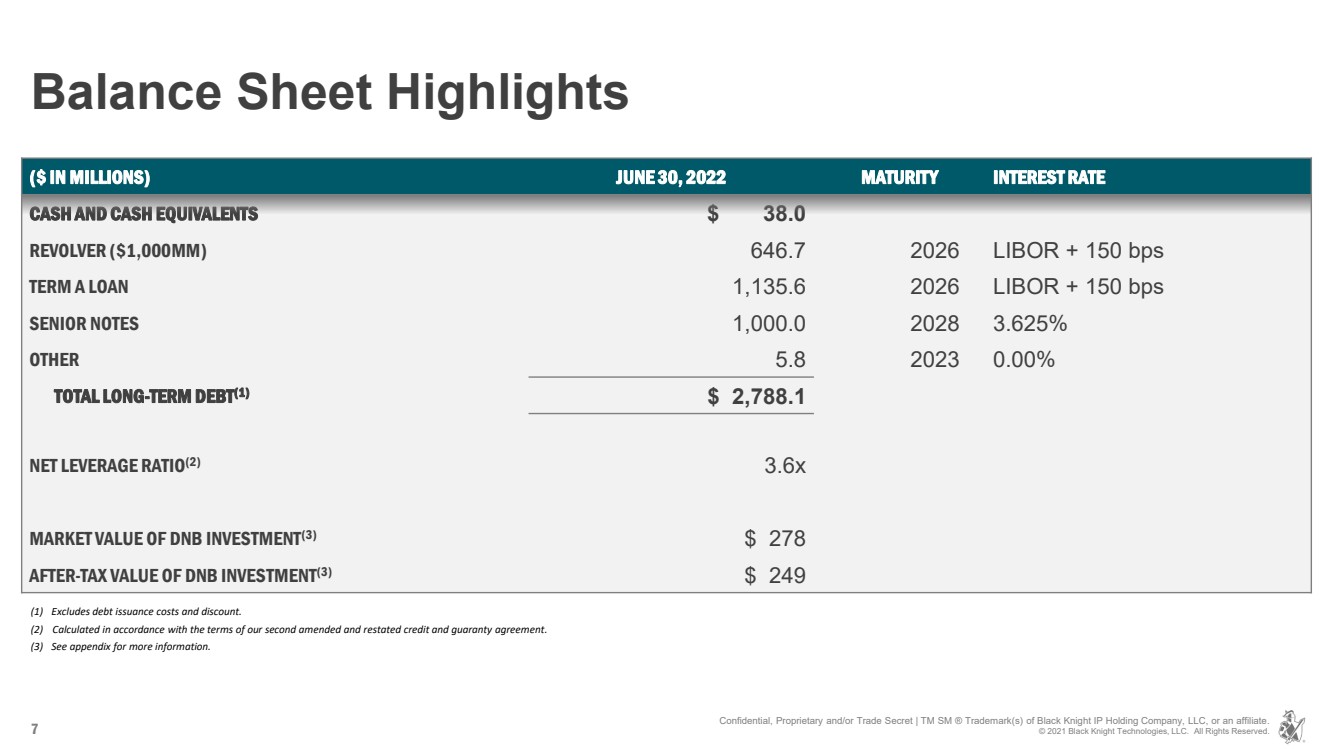
| 7 Balance Sheet Highlights ($ IN MILLIONS) JUNE 30, 2022 MATURITY INTEREST RATE CASH AND CASH EQUIVALENTS $ 38.0 REVOLVER ($1,000MM) 646.7 2026 LIBOR + 150 bps TERM A LOAN 1,135.6 2026 LIBOR + 150 bps SENIOR NOTES 1,000.0 2028 3.625% OTHER 5.8 2023 0.00% TOTAL LONG - TERM DEBT (1) $ 2,788.1 NET LEVERAGE RATIO (2) 3.6x MARKET VALUE OF DNB INVESTMENT (3) $ 278 AFTER - TAX VALUE OF DNB INVESTMENT (3) $ 249 (1) Excludes debt issuance costs and discount. (2) Calculated in accordance with the terms of our second amended and restated credit and guaranty agreement .. (3) See appendix for more information. Confidential, Proprietary and/or Trade Secret | TM SM ® Trademark(s) of Black Knight IP Holding Company, LLC, or an affiliate .. © 2021 Black Knight Technologies, LLC. All Rights Reserved. |
| 8 Other Information ($ IN MILLIONS) (ACTUAL) (OUTLOOK) MODELING DETAILS Q2 2022 1H 2022 FULL YEAR 2022 REVENUE TAILWIND FROM HIGHER FORECLOSURE VOLUMES $5.5 $13.6 $23 to $25 REVENUE HEADWIND FROM LOWER ORIGINATION VOLUMES $8.7 $15.6 $37 to $40 INTEREST EXPENSE $22.6 $43.7 ~$101 Confidential, Proprietary and/or Trade Secret | TM SM ® Trademark(s) of Black Knight IP Holding Company, LLC, or an affiliate .. © 2021 Black Knight Technologies, LLC. All Rights Reserved. Internal management expectations are based upon the following estimates and assumptions: |

| Confidential, Proprietary and/or Trade Secret | TM SM ® Trademark(s) of Black Knight IP Holding Company, LLC, or an affiliate .. © 2020 Black Knight Technologies, LLC. All Rights Reserved. APPENDIX |

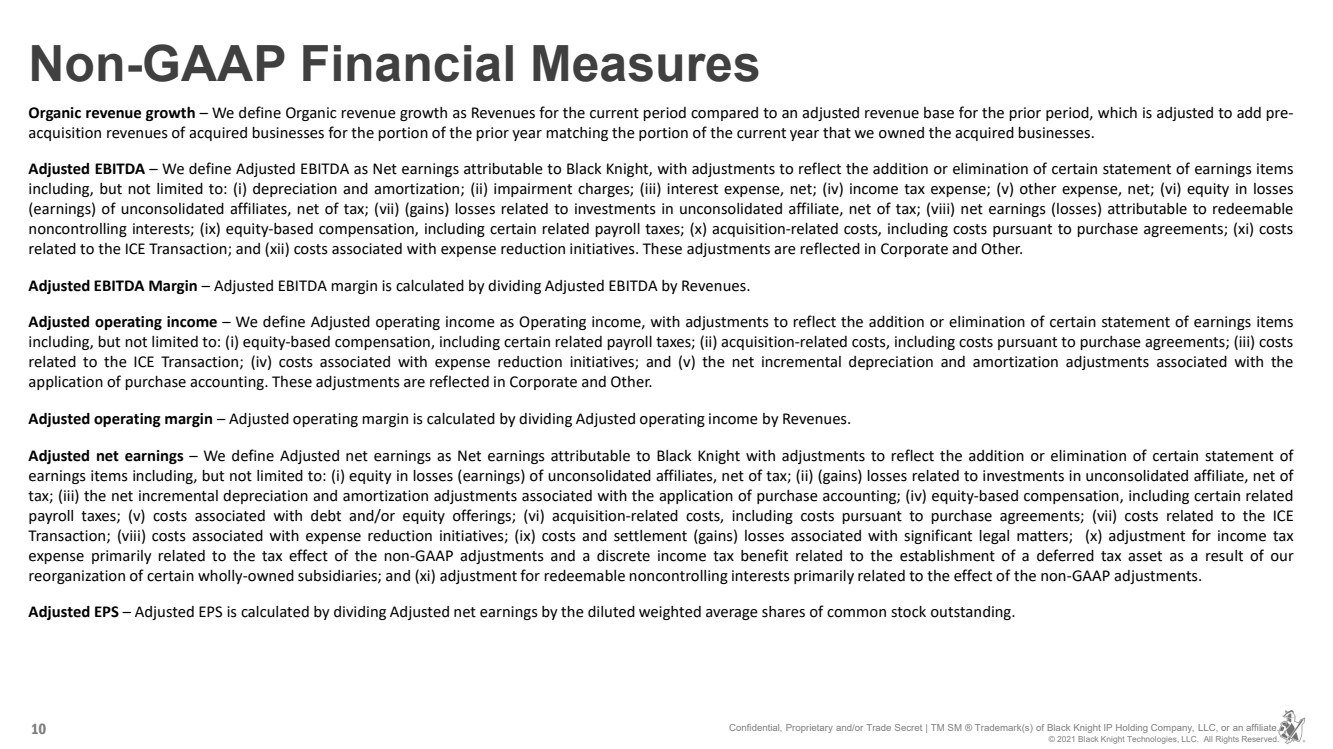
| 10 Non - GAAP Financial Measures Organic revenue growth – We define Organic revenue growth as Revenues for the current period compared to an adjusted revenue base for the prior period, which is adjusted to add pre - acquisition revenues of acquired businesses for the portion of the prior year matching the portion of the current year that we owned the acquired businesses .. Adjusted EBITDA – We define Adjusted EBITDA as Net earnings attributable to Black Knight, with adjustments to reflect the addition or elimination of certain statement of earnings items including, but not limited to : (i) depreciation and amortization ; (ii) impairment charges ; (iii) interest expense, net ; (iv) income tax expense ; (v ) other expense, net ; (vi) equity in losses (earnings) of unconsolidated affiliates, net of tax ; (vii ) (gains) losses related to investments in unconsolidated affiliate, net of tax ; (viii ) n et earnings (losses) attributable to redeemable noncontrolling interests ; (ix) equity - based compensation, including certain related payroll taxes ; (x) acquisition - related costs, including costs pursuant to purchase agreements ; (xi) costs related to the ICE Transaction ; and (xii) costs associated with expense reduction initiatives .. These adjustments are reflected in Corporate and Other .. Adjusted EBITDA Margin – Adjusted EBITDA margin is calculated by dividing Adjusted EBITDA by Revenues. Adjusted operating income – We define Adjusted operating income as Operating income, with adjustments to reflect the addition or elimination of certain statement of earnings items including, but not limited to : (i) equity - based compensation, including certain related payroll taxes ; (ii) acquisition - related costs, including costs pursuant to purchase agreements ; (iii) costs related to the ICE Transaction ; (iv) costs associated with expense reduction initiatives ; and (v) the net incremental depreciation and amortization adjustments associated with the application of purchase accounting .. These adjustments are reflected in Corporate and Other .. Adjusted operating margin – Adjusted operating margin is calculated by dividing Adjusted operating income by Revenues .. Adjusted net earnings – We define Adjusted net earnings as Net earnings attributable to Black Knight with adjustments to reflect the addition or elimination of certain statement of earnings items including, but not limited to : (i) equity in losses (earnings) of unconsolidated affiliates, net of tax ; (ii ) (gains) losses related to investments in unconsolidated affiliate, net of tax ; (iii) the net incremental depreciation and amortization adjustments associated with the application of purchase accounting ; (iv) equity - based compensation, including certain related payroll taxes ; (v) costs associated with debt and/or equity offerings ; (vi) acquisition - related costs, including costs pursuant to purchase agreements ; (vii) costs related to the ICE Transaction ; (viii) costs associated with expense reduction initiatives ; (ix) costs and settlement (gains) losses associated with significant legal matters ; (x) adjustment for income tax expense primarily related to the tax effect of the non - GAAP adjustments and a discrete income tax benefit related to the establishment of a deferred tax asset as a result of our reorganization of certain wholly - owned subsidiaries ; and (xi) adjustment for redeemable noncontrolling interests primarily related to the effect of the non - GAAP adjustments .. Adjusted EPS – Adjusted EPS is calculated by dividing Adjusted net earnings by the diluted weighted average shares of common stock outstanding .. Confidential, Proprietary and/or Trade Secret | TM SM ® Trademark(s) of Black Knight IP Holding Company, LLC, or an affiliate .. © 2021 Black Knight Technologies, LLC. All Rights Reserved. |
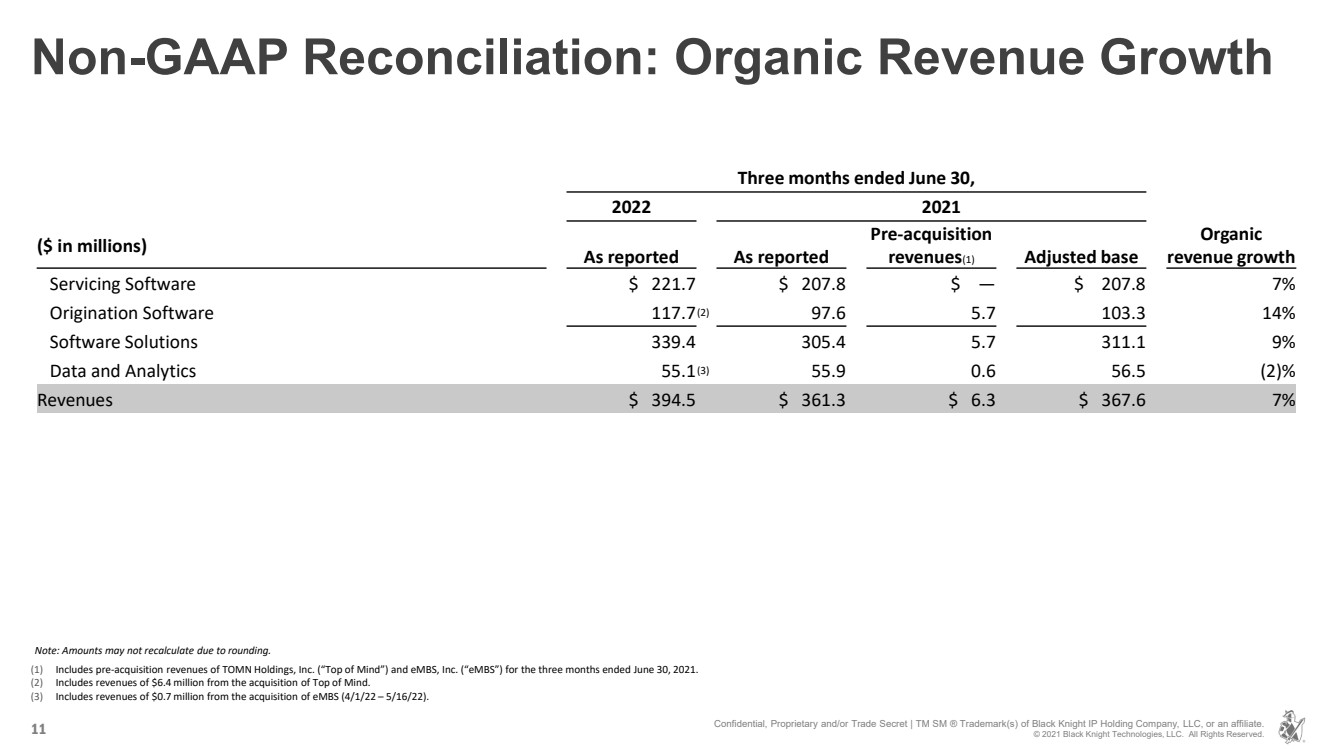
| 11 Non - GAAP Reconciliation: Organic Revenue Growth Three months ended June 30, 2022 2021 Organic revenue growth ($ in millions) As reported As reported Pre - acquisition revenues (1) Adjusted base Servicing Software $ 221.7 $ 207.8 $ — $ 207.8 7% Origination Software 117.7 (2) 97.6 5.7 103.3 14% Software Solutions 339.4 305.4 5.7 311.1 9% Data and Analytics 55.1 (3) 55.9 0.6 56.5 (2)% Revenues $ 394.5 $ 361.3 $ 6.3 $ 367.6 7% Confidential, Proprietary and/or Trade Secret | TM SM ® Trademark(s) of Black Knight IP Holding Company, LLC, or an affiliate .. © 2021 Black Knight Technologies, LLC. All Rights Reserved. (1) Includes pre - acquisition revenues of TOMN Holdings, Inc. (“Top of Mind”) and eMBS, Inc. (“eMBS”) for the three months ended June 30, 2021. (2) Includes revenues of $6.4 million from the acquisition of Top of Mind. (3) Includes revenues of $0.7 million from the acquisition of eMBS (4/1/22 – 5/16/22). Note: Amounts may not recalculate due to rounding. |
| 12 Non - GAAP Reconciliation: Organic Revenue Growth Confidential, Proprietary and/or Trade Secret | TM SM ® Trademark(s) of Black Knight IP Holding Company, LLC, or an affiliate .. © 2021 Black Knight Technologies, LLC. All Rights Reserved. Six months ended June 30, 2022 2021 Organic revenue growth ($ in millions) As reported As reported Pre - acquisition revenues (1) Adjusted base Servicing Software $ 444.3 $ 410.5 $ — $ 410.5 8% Origination Software 225.8 (2) 190.7 11.1 201.8 12% Software Solutions 670.1 601.2 11.1 612.3 9% Data and Analytics 111.6 (3) 109.8 1.8 111.6 — % Revenues $ 781.7 $ 711.0 $ 12.9 $ 723.9 8% (1) Includes pre - acquisition revenues of Top of Mind, eMBS and NexSpring Financial, LLC (“NexSpring”) for the six months ended June 30, 2021. (2) Includes revenues of $13.2 million from the acquisitions of Top of Mind and NexSpring (1/1/22 – 3/15/22). (3) Includes revenues of $2.0 million from the acquisition of eMBS (1/1/22 – 5/16/22). Note: Amounts may not recalculate due to rounding. |
| 13 Non - GAAP Reconciliation: Adjusted EBITDA Three months ended June 30, Six months ended June 30, ($ in millions) 2022 2021 2022 2021 Net earnings attributable to Black Knight $ 40.3 $ 39.7 $ 404.9 $ 93.8 Depreciation and amortization 92.5 90.4 184.0 178.2 Interest expense, net 22.6 20.9 43.7 41.2 Income tax expense 11.6 10.5 10.5 15.7 Other expense, net 2.4 1.0 3.6 4.2 Equity in losses of unconsolidated affiliates, net of tax 0.1 5.0 2.4 8.5 Gain related to investment in unconsolidated affiliate, net of tax — — (305.4) (9.9) Net losses attributable to redeemable noncontrolling interests — (7.5) (2.5) (16.1) EBITDA 169.5 160.0 341.2 315.6 Equity - based compensation 13.0 13.2 24.2 23.7 Acquisition - related costs 1.1 4.0 8.7 11.3 ICE Transaction - related costs 6.4 — 6.4 — Expense reduction initiatives 0.7 0.3 0.7 0.9 Adjusted EBITDA $ 190.7 $ 177.5 $ 381.2 $ 351.5 Net earnings margin (%) 10.2% 8.9% 51.5% 10.9% Adjusted EBITDA margin (%) 48.3% 49.1% 48.8% 49.4% Confidential, Proprietary and/or Trade Secret | TM SM ® Trademark(s) of Black Knight IP Holding Company, LLC, or an affiliate .. © 2021 Black Knight Technologies, LLC. All Rights Reserved. |
| 14 Non - GAAP Reconciliation: Adjusted Operating Income Three months ended June 30, Six months ended June 30, ($ in millions) 2022 2021 2022 2021 Operating income $ 77.0 $ 69.6 $ 157.2 $ 137.4 Equity - based compensation 13.0 13.2 24.2 23.7 Acquisition - related costs 1.1 4.0 8.7 11.3 ICE Transaction - related costs 6.4 — 6.4 — Expense reduction initiatives 0.7 0.3 0.7 0.9 Depreciation and amortization purchase accounting adjustment 52.8 53.7 105.4 106.6 Adjusted operating income $ 151.0 $ 140.8 $ 302.6 $ 279.9 Operating margin 19.5% 19.3% 20.1% 19.3% Adjusted operating margin (%) 38.3% 39.0% 38.7% 39.4% Confidential, Proprietary and/or Trade Secret | TM SM ® Trademark(s) of Black Knight IP Holding Company, LLC, or an affiliate .. © 2021 Black Knight Technologies, LLC. All Rights Reserved. |
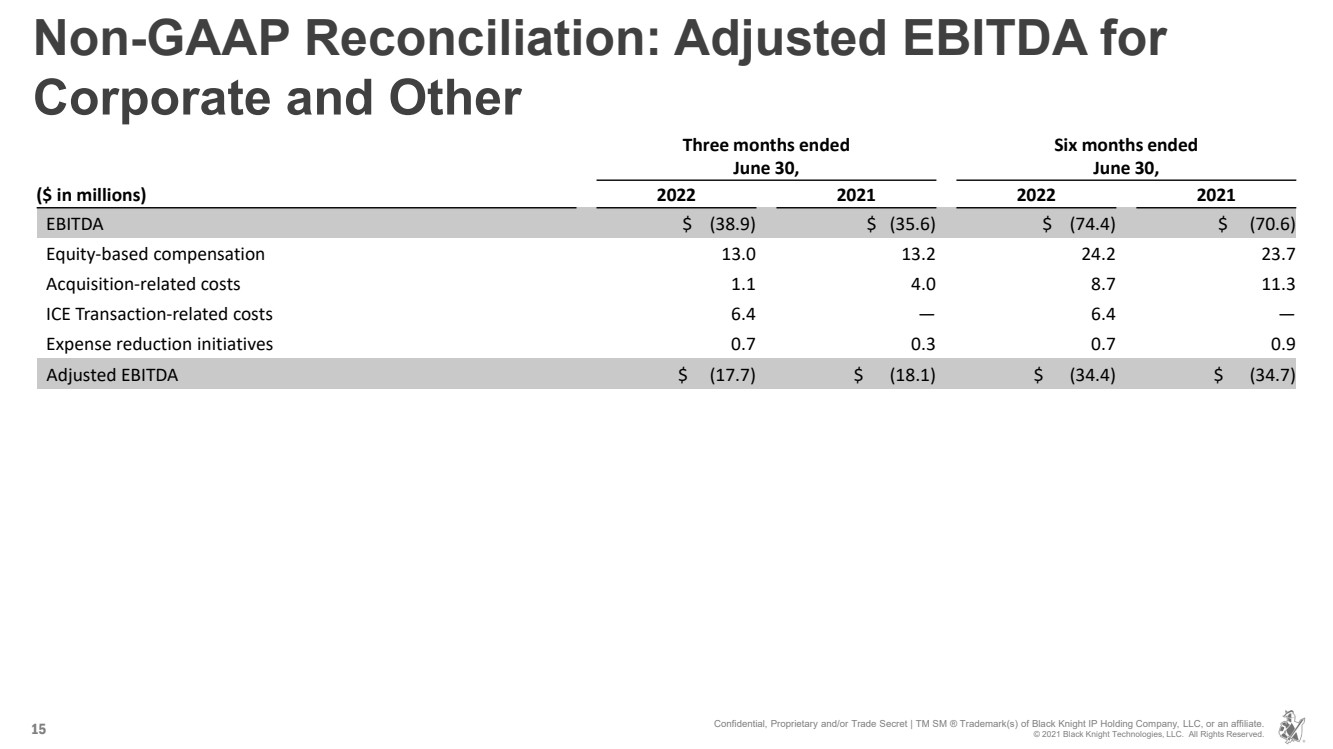
| 15 Non - GAAP Reconciliation: Adjusted EBITDA for Corporate and Other Three months ended June 30, Six months ended June 30, ($ in millions) 2022 2021 2022 2021 EBITDA $ (38.9) $ (35.6) $ (74.4) $ (70.6) Equity - based compensation 13.0 13.2 24.2 23.7 Acquisition - related costs 1.1 4.0 8.7 11.3 ICE Transaction - related costs 6.4 — 6.4 — Expense reduction initiatives 0.7 0.3 0.7 0.9 Adjusted EBITDA $ (17.7) $ (18.1) $ (34.4) $ (34.7) Confidential, Proprietary and/or Trade Secret | TM SM ® Trademark(s) of Black Knight IP Holding Company, LLC, or an affiliate .. © 2021 Black Knight Technologies, LLC. All Rights Reserved. |
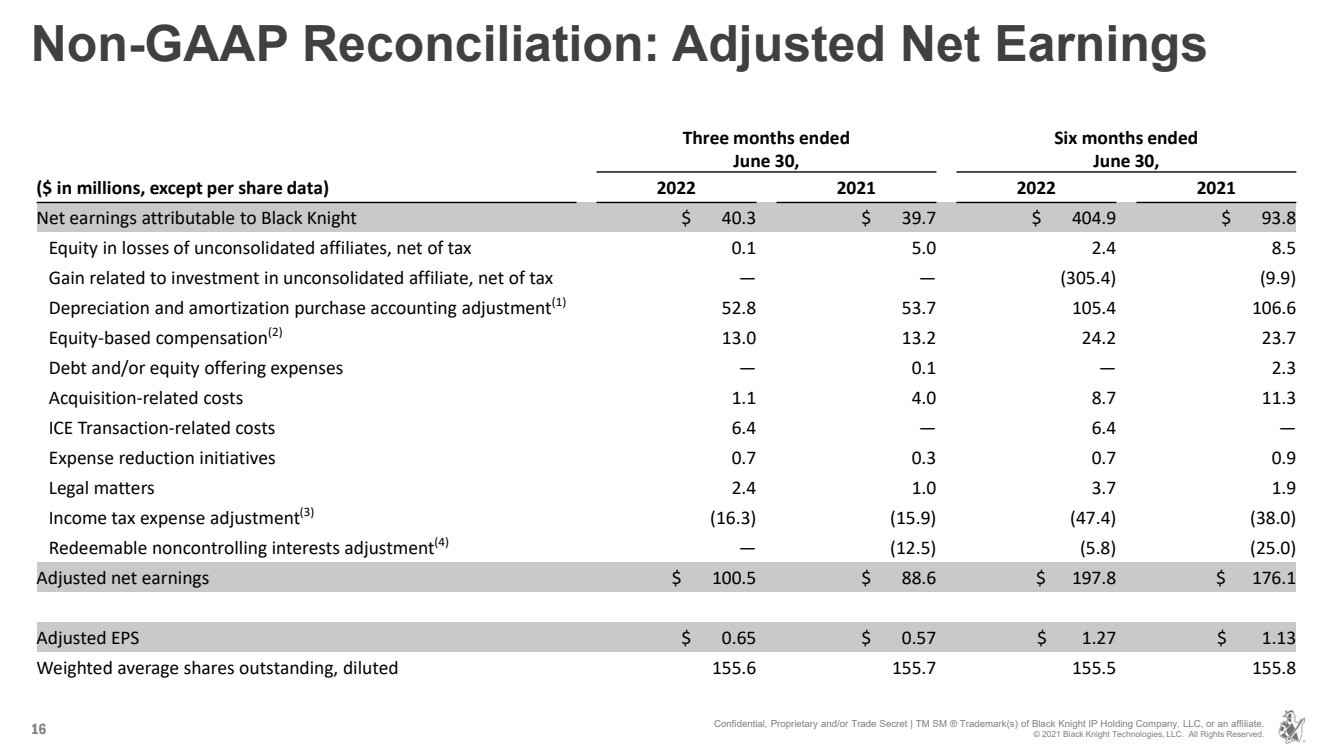
| 16 Non - GAAP Reconciliation: Adjusted Net Earnings Three months ended June 30, Six months ended June 30, ($ in millions, except per share data) 2022 2021 2022 2021 Net earnings attributable to Black Knight $ 40.3 $ 39.7 $ 404.9 $ 93.8 Equity in losses of unconsolidated affiliates, net of tax 0.1 5.0 2.4 8.5 Gain related to investment in unconsolidated affiliate, net of tax — — (305.4) (9.9) Depreciation and amortization purchase accounting adjustment (1) 52.8 53.7 105.4 106.6 Equity - based compensation (2) 13.0 13.2 24.2 23.7 Debt and/or equity offering expenses — 0.1 — 2.3 Acquisition - related costs 1.1 4.0 8.7 11.3 ICE Transaction - related costs 6.4 — 6.4 — Expense reduction initiatives 0.7 0.3 0.7 0.9 Legal matters 2.4 1.0 3.7 1.9 Income tax expense adjustment (3) (16.3) (15.9) (47.4) (38.0) Redeemable noncontrolling interests adjustment (4) — (12.5) (5.8) (25.0) Adjusted net earnings $ 100.5 $ 88.6 $ 197.8 $ 176.1 Adjusted EPS $ 0.65 $ 0.57 $ 1.27 $ 1.13 Weighted average shares outstanding, diluted 155.6 155.7 155.5 155.8 Confidential, Proprietary and/or Trade Secret | TM SM ® Trademark(s) of Black Knight IP Holding Company, LLC, or an affiliate .. © 2021 Black Knight Technologies, LLC. All Rights Reserved. |
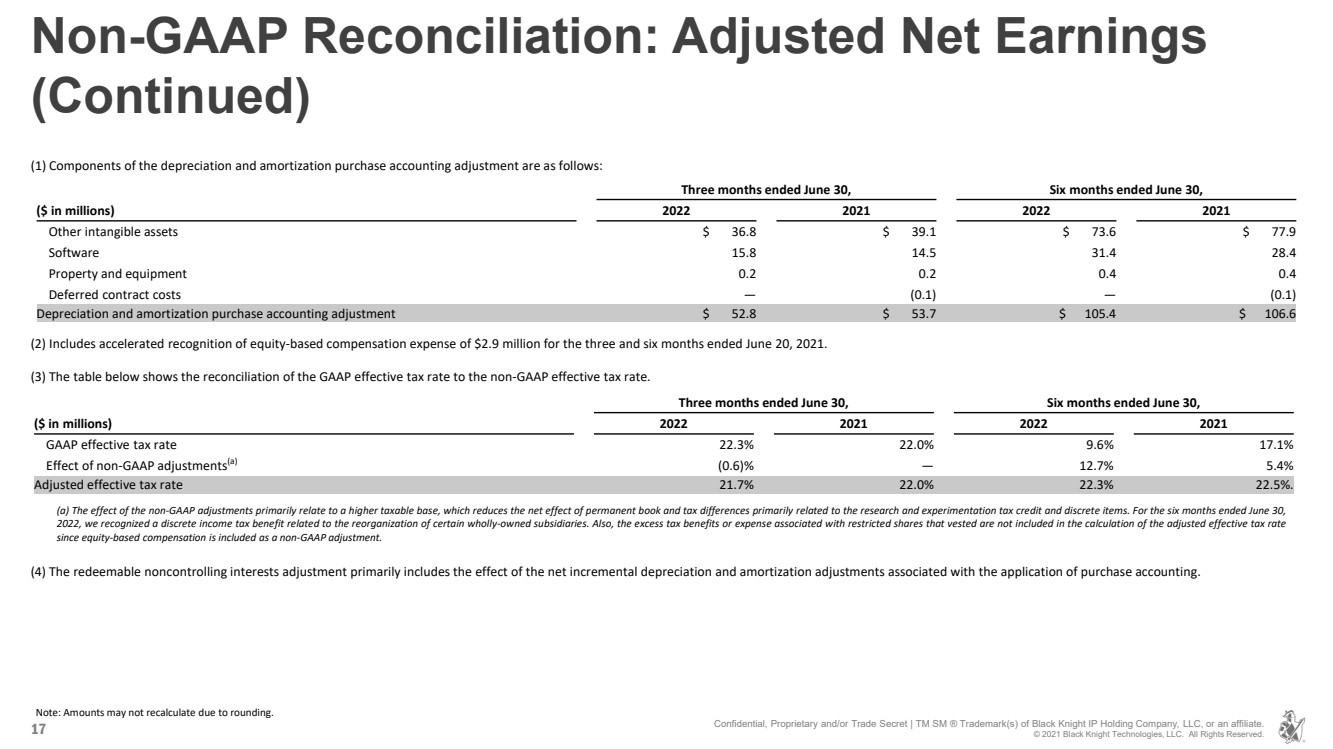
| 17 Non - GAAP Reconciliation: Adjusted Net Earnings (Continued) Three months ended June 30, Six months ended June 30, ($ in millions) 2022 2021 2022 2021 Other intangible assets $ 36.8 $ 39.1 $ 73.6 $ 77.9 Software 15.8 14.5 31.4 28.4 Property and equipment 0.2 0.2 0.4 0.4 Deferred contract costs — (0.1) — (0.1) Depreciation and amortization purchase accounting adjustment $ 52.8 $ 53.7 $ 105.4 $ 106.6 Confidential, Proprietary and/or Trade Secret | TM SM ® Trademark(s) of Black Knight IP Holding Company, LLC, or an affiliate .. © 2021 Black Knight Technologies, LLC. All Rights Reserved. ( 2 ) Includes accelerated recognition of equity - based compensation expense of $ 2 .. 9 million for the three and six months ended June 20 , 2021 .. ( 3 ) The table below shows the reconciliation of the GAAP effective tax rate to the non - GAAP effective tax rate .. (1) Components of the depreciation and amortization purchase accounting adjustment are as follows: Note: Amounts may not recalculate due to rounding. Three months ended June 30, Six months ended June 30, ($ in millions) 2022 2021 2022 2021 GAAP effective tax rate 22.3% 22.0% 9.6% 17.1% Effect of non - GAAP adjustments (a) (0.6)% — 12.7% 5.4% Adjusted effective tax rate 21.7% 22.0% 22.3% 22.5%. ( 4 ) The redeemable noncontrolling interests adjustment primarily includes the effect of the net incremental depreciation and amortization adjustments associated with the application of purchase accounting .. (a) The effect of the non - GAAP adjustments primarily relate to a higher taxable base, which reduces the net effect of permanent book and tax differences primarily related to the research and experimentation tax credit and discrete items .. For the six months ended June 30 , 2022 , we recognized a discrete income tax benefit related to the reorganization of certain wholly - owned subsidiaries .. Also, the excess tax benefits or expense associated with restricted shares that vested are not included in the calculation of the adjusted effective tax rate since equity - based compensation is included as a non - GAAP adjustment .. |
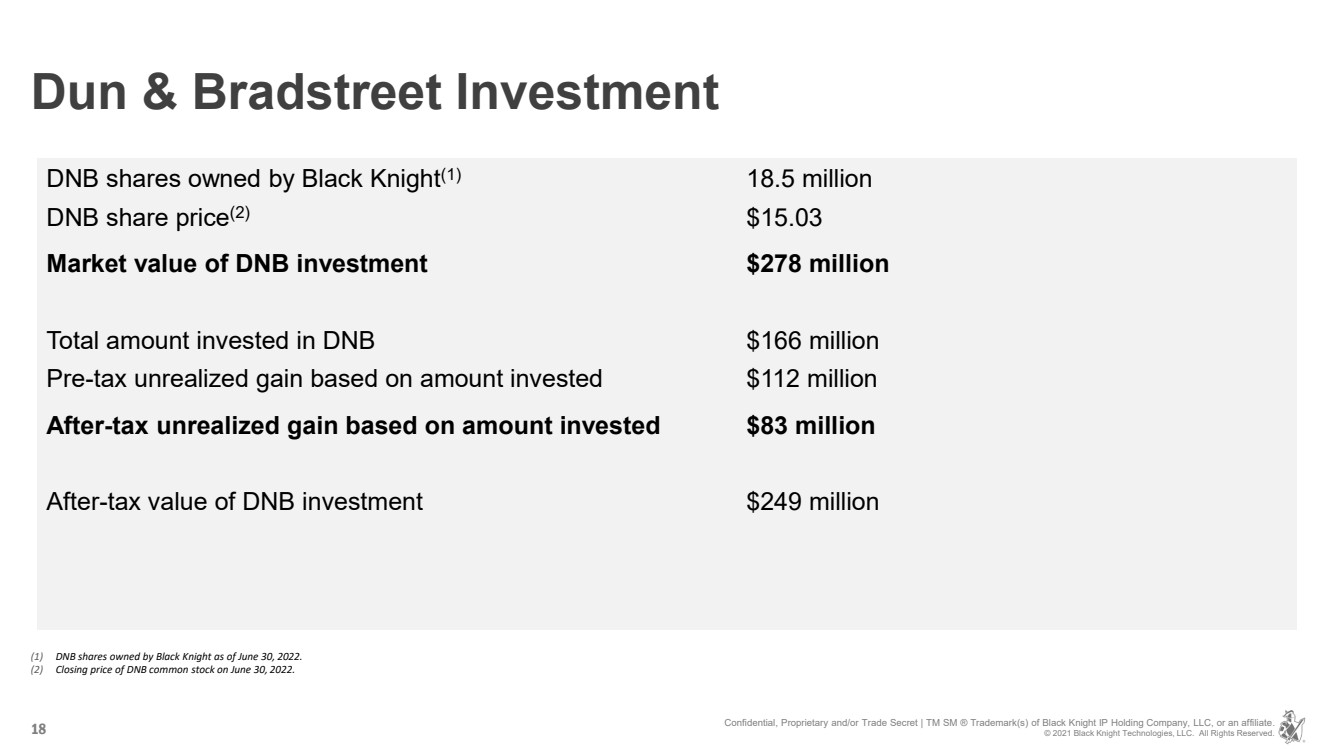
| Dun & Bradstreet Investment 18 DNB shares owned by Black Knight (1) 18.5 million DNB share price (2) $15.03 Market value of DNB investment $278 million Total amount invested in DNB $166 million Pre - tax unrealized gain based on amount invested $112 million After - tax unrealized gain based on amount invested $83 million After - tax value of DNB investment $249 million (1) DNB shares owned by Black Knight as of June 30, 2022. (2) Closing price of DNB common stock on June 30, 2022. Confidential, Proprietary and/or Trade Secret | TM SM ® Trademark(s) of Black Knight IP Holding Company, LLC, or an affiliate .. © 2021 Black Knight Technologies, LLC. All Rights Reserved. |
Serious News for Serious Traders! Try StreetInsider.com Premium Free!
You May Also Be Interested In
- Share Buyback Transaction Details April 11 – April 17, 2024
- Phoenix Motor Surpasses 55 million Zero Emission Miles Driven
- World Gourmet Implements Innovative Strategies for Culinary Excellence to Prepare Malaysia's Chefs for the Global Stage
Create E-mail Alert Related Categories
SEC FilingsSign up for StreetInsider Free!
Receive full access to all new and archived articles, unlimited portfolio tracking, e-mail alerts, custom newswires and RSS feeds - and more!
