

Form 8-K Bancorp, Inc. For: Jun 28
 Tweet
Tweet Share
ShareUNITED STATES
SECURITIES AND EXCHANGE COMMISSION
Washington, D.C. 20549
Form 8-K
Current Report
Pursuant to Section 13 or 15(d) of the Securities Exchange Act of 1934
Date of Report (Date of earliest event reported): June 28, 2018
The Bancorp, Inc.
(Exact name of registrant as specified in its charter)
Commission File Number: 000-51018
|
Delaware
|
|
23-3016517
|
|
(State or other jurisdiction of
|
|
(IRS Employer
|
|
incorporation)
|
|
Identification No.)
|
409 Silverside Road
Wilmington, DE 19809
(Address of principal executive offices, including zip code)
302-385-5000
(Registrant’s telephone number, including area code)
(Former name or former address, if changed since last report)
Check the appropriate box below if the Form 8-K filing is intended to simultaneously satisfy the filing obligation of the registrant under any of the following provisions:
[ ] Written communications pursuant to Rule 425 under the Securities Act (17 CFR 230.425)
[ ] Soliciting material pursuant to Rule 14a-12 under the Exchange Act (17 CFR 240.14a-12)
[ ] Pre-commencement communications pursuant to Rule 14d-2(b) under the Exchange Act (17 CFR 240.14d-2(b))
[ ] Pre-commencement communications pursuant to Rule 13e-4(c) under the Exchange Act (17 CFR 240.13e-4(c))
Indicate by check mark whether the registrant is an emerging growth company as defined in Rule 405 of the Securities Act of 1933 (§230.405) or Rule 12b-2 of the Securities Exchange Act of 1934 (§240.12b-2).
[ ] Emerging growth company
If an emerging growth company, indicate by check mark if the registrant has elected not to use the extended transition period for complying with any new or revised financial accounting standards provided pursuant to Section 13(a) of the Exchange Act. [ ]
Item 7.01. Regulation FD Disclosure.
The Bancorp, Inc. (the "Company"), will make available and distribute to analysts and prospective investors a slide presentation. The presentation materials include information regarding the Company's operating and growth strategies and financial performance. The presentation materials will also be posted to the Company's website. Pursuant to Regulation FD, the presentation materials are attached hereto as Exhibit 99.1.
This information, including the exhibit hereto, is being furnished and shall not be deemed "filed" for purposes of Section 18 of the Securities Exchange Act of 1934, as amended, or otherwise subject to the liabilities of that Section. This information shall not be incorporated by reference into any registration statement or other document pursuant to the Securities Act of 1933, as amended.
Item 8.01. Other Events
On June 28, 2018 the Company sold the note for the largest loan in its discontinued loan portfolio and received $35.0 million cash compared to a $36.9 million recorded fair value. There will be no financing provided by the Company. As a result of the sale, a $1.9 million loss will be reflected in discontinued operations in the Company’s second quarter financial statements. The fair value had been based upon a first quarter 2018 appraisal of related collateral which consisted of a Florida hotel under construction and a parking lot. The appraisal indicated an 80% loan to value and the loan also had personal guarantees of certain of the principals. While other dispositions of the loan may have resulted in full recovery of principal, those dispositions would have required considerable additional time. Company management believed that it was prudent to eliminate this credit exposure at the above discount to par. The above transaction will reduce the $195 million of commercial loan exposure in discontinued operations at March 31, 2018 by approximately 19%.
Forward-Looking Statements
This Current Report on Form 8-K contains certain forward-looking statements within the meaning of Section 27A of the Securities Act of 1933, as amended, and Section 21E of the Securities Exchange Act of 1934, as amended. Such forward-looking statements can generally be identified by our use of forward-looking terminology such as "may," "trend," "will," "continue," "expect," "intend," "anticipate," "estimate," "believe," "look forward" or other similar words or terms. Because such statements include risks, uncertainties and contingencies, actual results may differ materially from the expectations, intentions, beliefs, plans or predictions of the future expressed or implied by such forward-looking statements. Factors that can affect future results include, but are not limited to, those discussed under the heading "Risk Factors" and "Management's Discussion and Analysis of Financial Condition" in the Company's filings with the Securities and Exchange Commission. The Company undertakes no obligation to update or revise any forward-looking statement to reflect new or changing information or events after the date hereof or to reflect the occurrence of unanticipated events, except as may be required by law.
Item 9.01. Financial Statements and Exhibits
(d) Exhibits
SIGNATURES
Pursuant to the requirements of the Securities Exchange Act of 1934, the registrant has duly caused this report to be signed on its behalf by the undersigned hereunto duly authorized.
|
Date: June 28, 2018
|
The Bancorp, Inc.
|
|
By: /s/ Paul Frenkiel
|
|
|
Name: Paul Frenkiel
|
|
|
Title: Chief Financial Officer and
Secretary
|
Exhibit 99.1

Business Review and Plan1st Quarter 2018 June 2018

Forward Looking Statements and Other Disclosures Statements in this presentation regarding The Bancorp, Inc.’s business that are not historical facts are “forward-looking statements” that involve risks and uncertainties. These statements may be identified by the use of forward-looking terminology, including the words “may,” “believe,” “will,” “expect,” “anticipate,” “estimate,” “intend,” “plan," or similar words. These forward-looking statements are based upon the current beliefs and expectations of The Bancorp, Inc.’s management and are inherently subject to significant business, economic, regulatory, and competitive uncertainties and contingencies, many of which are difficult to predict and beyond our control. For further discussion of these risks and uncertainties, see the “risk factors” sections of The Bancorp, Inc.’s Annual Report on Form 10-K for the year ended December 31, 2017, its other public filings with the SEC and appendix on page 32. In addition, these forward-looking statements are based upon assumptions with respect to future strategies and decisions that are subject to change. Actual results may differ materially from the anticipated results discussed in these forward-looking statements. The forward-looking statements speak only as of the date of this presentation. The Bancorp, Inc. does not undertake to publicly revise or update forward-looking statements in this presentation to reflect events or circumstances that arise after the date of this presentation, except as may be required under applicable law.This presentation contains information regarding financial results that is calculated and presented on the basis of methodologies other than in accordance with accounting principles generally accepted in the United States (“GAAP”). Please refer to the footnote on slide 31 for a definition of “Adjusted Post Provision Income” and the reconciliation of the applicable GAAP financial measure.This presentation may contain statistics and other data that in some cases has been obtained from or compiled from information made available by third-party service providers. The Bancorp, Inc. makes no representation or warranty, express or implied, with respect to the accuracy, reasonableness or completeness of such information.Past performance is not indicative nor a guarantee of future results.Copies of the documents filed by The Bancorp, Inc. with the SEC are available free of charge from the website of the SEC at www.sec.gov as well as on The Bancorp, Inc.’s website at www.thebancorp.com.This document is for information purposes only and shall not constitute an offer to sell or the solicitation of an offer to buy any securities.
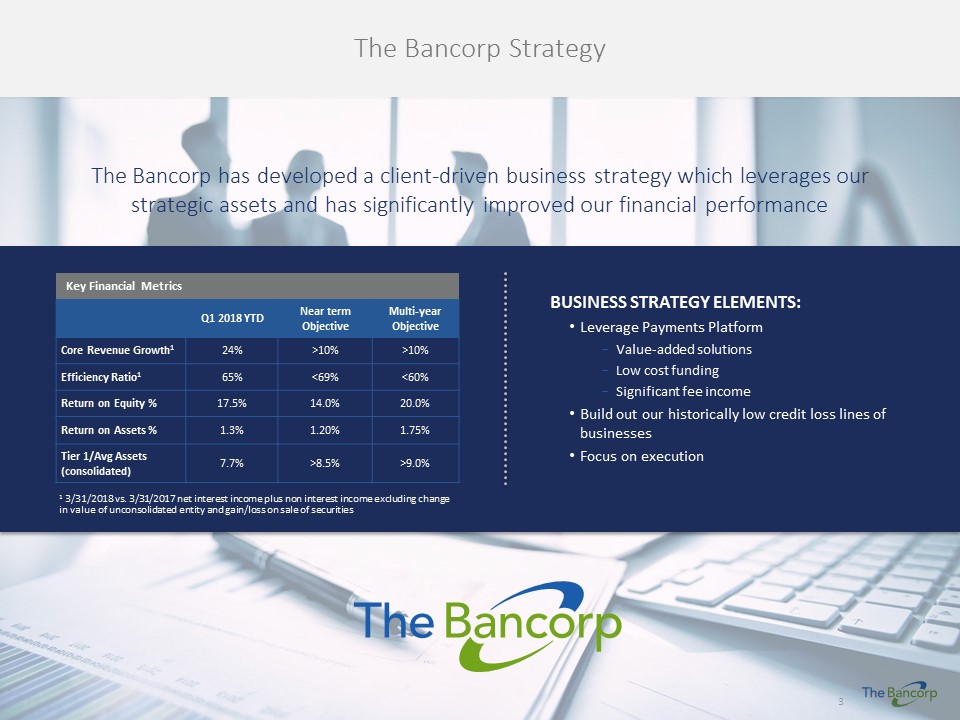
The Bancorp Strategy The Bancorp has developed a client-driven business strategy which leverages our strategic assets and has significantly improved our financial performance BUSINESS STRATEGY ELEMENTS:Leverage Payments PlatformValue-added solutionsLow cost fundingSignificant fee incomeBuild out our historically low credit loss lines of businessesFocus on execution Key Financial Metrics Q1 2018 YTD Near term Objective Multi-year Objective Core Revenue Growth1 24% >10% >10% Efficiency Ratio1 65% <69% <60% Return on Equity % 17.5% 14.0% 20.0% Return on Assets % 1.3% 1.20% 1.75% Tier 1/Avg Assets (consolidated) 7.7% >8.5% >9.0% 1 3/31/2018 vs. 3/31/2017 net interest income plus non interest income excluding change in value of unconsolidated entity and gain/loss on sale of securities

Serving the world’s most successful companies…. >100,000,000 Prepaid Cards in U.S. Distribution 1.1+ BillionMerchant Card Transactions Processed Annually $459 BillionCombined Annual Payments Processing Volume 70kMerchants served within Mastercard/Visa Networks 100+Private-Label Non-Bank Partners TOP 15Automated Clearing House (ACH) Originating Bank >200kACH Originators Sponsored Note: Information as of 3/31/2018 $4.4 Billion Total Assets

The Bancorp has a unique deposit gathering platform linked to our payments franchise …creates a stable, low cost deposit base… Deposits ($M)1 HIGHLIGHTS:Average deposit cost of 0.49% for the quarter ended 3/31/2018Payments represent the largest and fastest growing source of deposits (14% compounded annual growth rate since 2013)Decline in Other reflects the exit of HSA, Institutional Banking and other non-strategic deposit relationships 1 Based on average annual or YTD balances through 3/31/2018 Other Payments Prepaid cards

…which we are utilizing to build our lending franchise We will continue to grow our historically low losslending activities within our key business lines Loan balances ($M)1 Institutional Banking Real Estate Capital Markets Small Business Leasing 1 End of period balances Niche vehicle fleet leasing and management SBA and other small business lending Banking and lending solutions for wealth managers Commercial real estate loan origination and securitization 2018 Compound Annual Growth Rates for period 2013 – Q1 2018: Institutional Banking 25%, Small Business 32%, Leasing 20% 2 Securities-Backed Lines of Credit 2

Management Scorecard Developed multi-year business plan that was approved by The Bancorp Board of Directors Delivered positive and improving financial performance from the business Executed against Phase 1 and 2 of cost reduction plan Executing against Integrated Compliance plan to address regulatory issues and de-risk the bank Made substantial investment in our senior management teams and infrastructure Continued to reduce investments in non-strategic businesses and non-strategic assets Management Agenda Items Strategic Initiatives Achieved Maintain revenue momentum and build new sources of revenue generation Create and implement an actionable innovation framework Reengineer operating platform (Phase 3) to support innovative growth Implement ICP program and complete encyclopedia of regulatory issues Implement enhanced culture, inclusion and diversity program Integrate the automated SBLOC platform (Talea) with key partners Implement long-term liquidity and capital management program
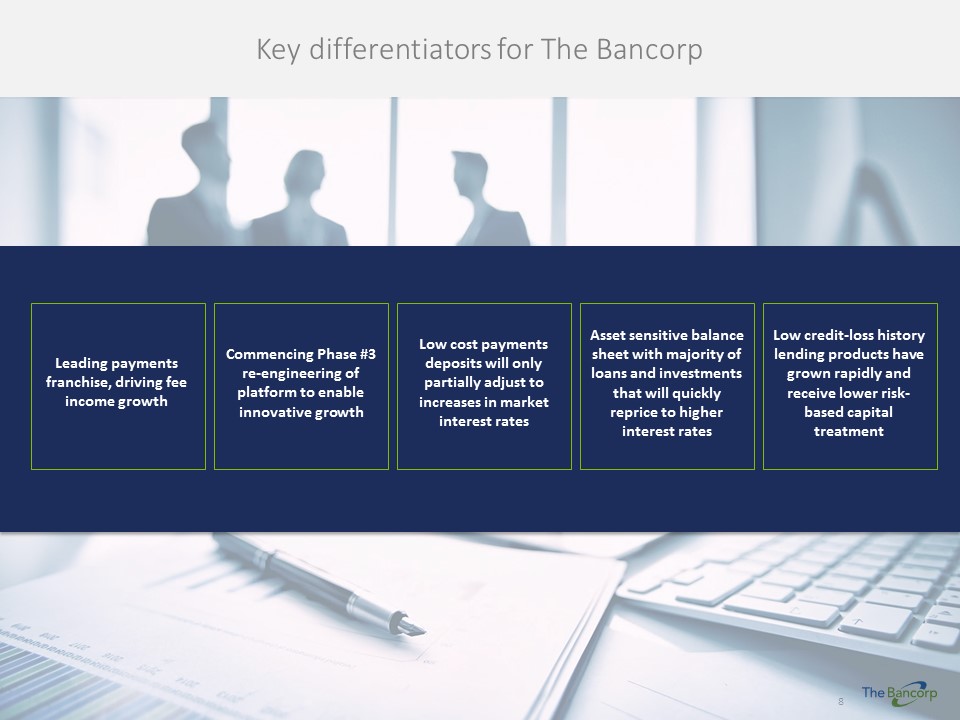
Key differentiators for The Bancorp Leading payments franchise, driving fee income growth Commencing Phase #3 re-engineering of platform to enable innovative growth Low cost payments deposits will only partially adjust to increases in market interest rates Asset sensitive balance sheet with majority of loans and investments that will quickly reprice to higher interest rates Low credit-loss history lending products have grown rapidly and receive lower risk-based capital treatment

1st Quarter 2018 Financial and Business Highlights
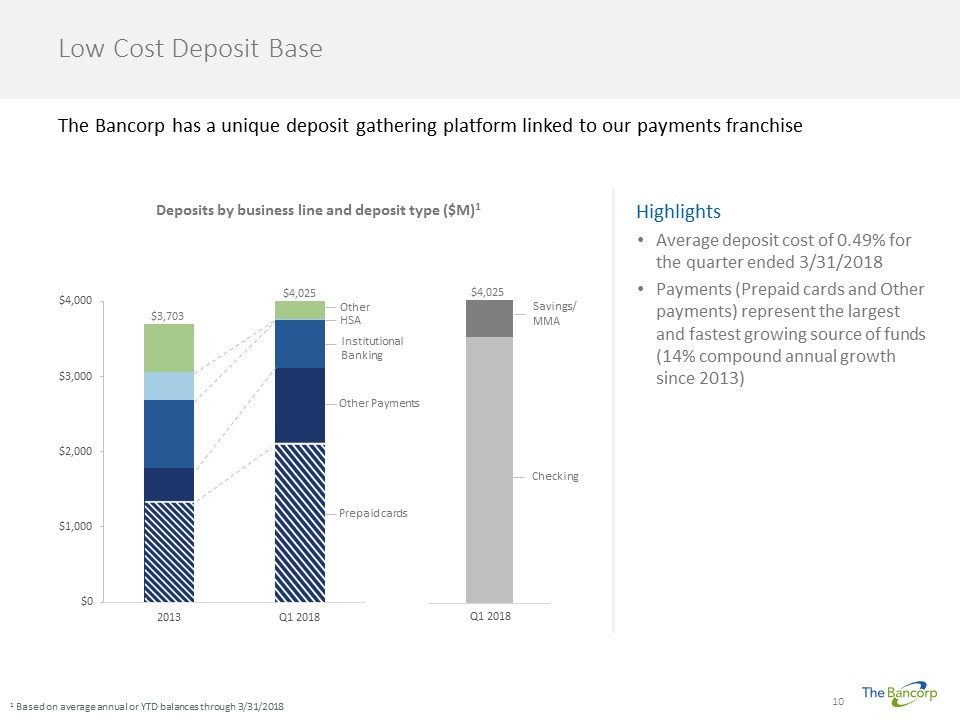
Low Cost Deposit Base 1 Based on average annual or YTD balances through 3/31/2018 The Bancorp has a unique deposit gathering platform linked to our payments franchise HighlightsAverage deposit cost of 0.49% for the quarter ended 3/31/2018Payments (Prepaid cards and Other payments) represent the largest and fastest growing source of funds (14% compound annual growth since 2013) $3,703 Other Payments HSA Institutional Banking Other Savings/MMA Checking $4,025 Deposits by business line and deposit type ($M)1 Q1 2018 $4,025 Prepaid cards

Loan Growth Across Platform We continue to grow our key lending businesses which have had low loss histories Loan balances ($M)1 Non-performing loans/total loans1 Other Leasing Small Business Real EstateCapital Markets Institutional Banking2 $1,083 $1,559 $1,878 $2,056 $2,330 $3,633 Non-performing loans ($000) 1 1 End of period balances for continuing lines of business2 Securities-Backed Lines of Credit3 Reduction in total loans resulted from real estate capital markets securitization in Q1 2018 $1,885 $4,223 Non-performing loans as % of equity capital 0.6% 0.7% 1.2% 1.3% $1,802 $6,159 1.9% 3

Consistent Generation of Non-Interest Income HighlightsPayments franchise a key generator of non-interest income51% non-interest income vs. 22% for average community banks2 1 For reconciliation of post provision income to GAAP, please see appendix (page 31)2 Based on peer group community banks. Source: UBPR The Bancorp has a healthy mix of non-interest income relative to other financial institutions of similar size Adjusted post-provision income ($M)1 53% 47% 45% 49% 51% 50% 50% Adjusted Non interest income Post provision net interest income 25% growth year over year 55% 53% 47%

Focus on Reducing Non-strategic Assets HighlightsThe Bancorp discontinued its Philadelphia-based commercial real estate operations in 2014 Significant reductions over past two yearsDisposing remainder of portfolio as soon as practical with optimal executionWhile credit risk remains, discontinued credit performance improved in 2017 and 2018 after large fair value credit marks in previous periods Significant progress has been made in stabilizing the discontinued portfolio through 2017 and Q1 2018 $626 $209 $289 $59 $230 Discontinued operations balance ($M) ($M) Exposure as of 3/31/20183 % Marks to Principal4 8 Largest relationships > $8 million $145 3% Other loans $50 17% Total discontinued commercial loan exposure $195 7% 1 Balance of Walnut Street (discontinued loan sale financed by bank in 2014) at 3/31/2018 was $70.0M2 Remaining commercial loan exposure as of 3/31/2018. Includes OREO (other real estate owned)3 See footnote 1 for discontinued loan sales financed by the bank which are reported as investment in unconsolidated entity on the balance sheet4 Current marks as a percentage of 3/31/2018 principal. Cumulative marks to original commercial loan principal are approximately 26% 1 2

High Quality Investment Securities Portfolio Highlights95% of portfolio rated A- or betterYield on securities portfolio >2.75% YTD with low duration relative to peersPortfolio managed by highly experienced internal teamHighly liquid assets2 are >45% of total assets. Peer on balance sheet liquidity <20% per UBPR 1 End of period balances2 Highly liquid assets include investment securities, balances at the Federal Reserve bank and short term assets and an FRB line of credit, collateralized by loans We have maintained our liquid securities portfolio even as our core lending businesses have grown Held for sale Held to maturity Securities portfolio ($M)1 99% 99% 96% % Investment Grade $1,380 $1,467 96%

Commitment to a Well-capitalized Balance Sheet HighlightsCapital ratios increasing with Tier 1/Average Assets approaching near term target of 8.5% with longer term target of 9.0%Risk based ratios reflect lower risk based requirements for Securities-Backed Lines of Credit, SBA loans and select investment securities as a result of lower industry wide losses 1 Consolidated capital ratios 2 Tier 1/Avg Assets (leverage ratio) for the bank at 3/31/2018 was 7.3%3 The Common Equity Tier 1 Ratio (CET1) is equivalent with a well capitalized minimum of 6.5% We are committed to maintaining a strong capital position as we grow our business 5%Well-capitalizedminimum 8%Well-capitalizedminimum 10%Well-capitalizedminimum The Bancorp capital ratios1 3 2

Implemented an Integrated Compliance Plan We are executing against our integrated compliance plan that includes BSA/AML1, Third Party Risk Management and Consumer Compliance 1 Bank Secrecy Act/Anti-Money Laundering

The Bancorp Business Plan We are focused on executing our business unit strategies while building cross-organizational enablers to implement our business plan Implement specialized business unit strategies to increase revenue growth and productivity PAYMENTS INSTITUTIONAL BANKING SMALL BUSINESS LEASING REAL ESTATE CAPITAL MARKETS BUSINESSINTEGRATION TECHNOLOGY/INNOVATION SALES/PRACTICEMANAGEMENT TALENTMANAGEMENT GOVERNANCE Build cross-organizational capabilities to enable strategy implementation and efficiency

Our Payments capability is comprised of the Payments Solutions Group (Issuance) and Payment Acceptance Group (Acceptance) Payment Solutions Group Issuing bank for leading prepaid card and debit programs Payment Acceptance Group Merchant acquiring and ACH services BUSINESS OVERVIEW Sponsorship of products and services across the payments spaceSponsorship of private label banking (e.g., checking account with a debit card) PARTNERS ACH sponsorship of large-scale payment processors (payroll, online billpay, etc)VISA/MasterCard sponsorship of large credit card acquiring ISOs1 and their merchants 1 Independent Sales Organization (ISO) Business Unit Strategies – Payments Franchise
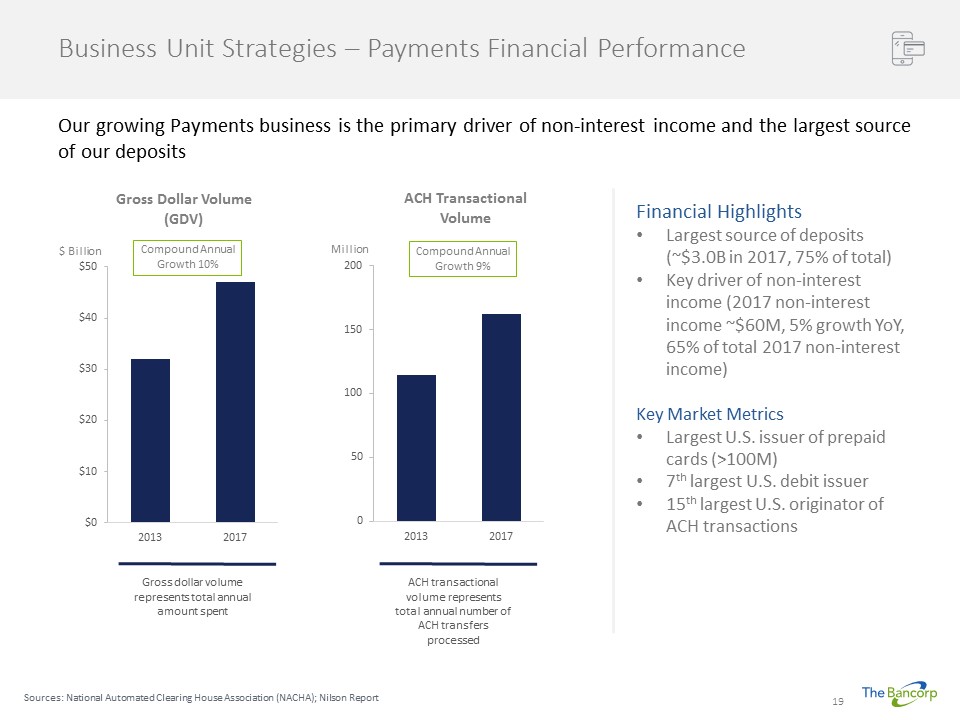
Business Unit Strategies – Payments Financial Performance Sources: National Automated Clearing House Association (NACHA); Nilson Report Our growing Payments business is the primary driver of non-interest income and the largest source of our deposits Compound Annual Growth 10% Compound Annual Growth 9% Million $ Billion Gross dollar volume represents total annual amount spent ACH transactional volume represents total annual number of ACH transfers processed Financial HighlightsLargest source of deposits (~$3.0B in 2017, 75% of total)Key driver of non-interest income (2017 non-interest income ~$60M, 5% growth YoY, 65% of total 2017 non-interest income)Key Market MetricsLargest U.S. issuer of prepaid cards (>100M)7th largest U.S. debit issuer15th largest U.S. originator of ACH transactions

Business Unit Strategies – Payments Ecosystem The Bancorp plays a key role within a highly developed marketplace ISSUANCE ACCEPTANCE Payment Network BIN1 Sponsor“Issuer” ProgramManager ISO3/ Third Party Sender Merchant/ Originator BIN Sponsor“Acquirer”/ODFI2 The BancorpWells FargoFifth Third Global PaymentsFiservBill.com Retail and ecommerce (7-Eleven, Uber) The BancorpMeta FinancialBank of the Internet PaypalIncommNetspend GalileoFIS GreenDotWestern Union Walgreens, CVS, Walmart CardholderServices Retail DistributionPartners Card Production & Fulfillment ReloadNetworks Processor MastercardVisa Typically Program Managers or 3rd Parties Typically Program Managers or 3rd Parties 1 Bank Identification Number (BIN) 2 Originating Depository Financial Institution (ODFI)3 Independent Sales Organization (ISO)

Business Unit Strategies – Payments Ecosystem (Key Roles) The Bancorp works in a highly integrated manner with our Program Managers and Processors Principal Member and conduit to card networksPrincipal oversight and control of program Facilitates the flow of and assumes fiduciary responsibility for fundsEnsures compliance with applicable law and regulatory guidanceSettles with the card networks for all transactions Issuing Bank Program Manager Processor Key Product Management roleIdentifies target client marketDesigns fee plansExecutes on implementation planKey Marketing roleDevelops marketing plansForms relationships with vendors and distributorsManages day to day product/program management functionsCustomer service and customer experienceWorks with Issuing Bank to manage processors Key FunctionsCreates card accounts, facilitates card production and package deliveryMaintains account of record (card balances, transactions, customer interaction history)Interfaces with card networksKey Risk ControlsAdministers program parameters, thresholds and rulesFacilitates transaction risk scoring “We provide the bank platform…” “…while they manage the client relationship” “…and they provide accounting and administration”

Business Unit Strategies – Payments (Market Sources of Demand) The Bancorp delivers the ability to access funds across a wide spectrum of markets General Purpose Reloadable (GPR)TravelTax RefundGift Cards Consumer Corporate Government Payroll CardsIncentives and RebatesHealthcare (FSA, HSA, HRA)Insurance CasualtyCorporate ExpenseTransit Public Benefit and Welfare ProgramsUnemployment InsuranceEmergency Assistance and Disaster ReliefPension, Social SecurityChild Support Sources of Funds

Business Unit Strategies – Payments Growth Opportunity The Bancorp has significant opportunities to grow our core payments business and expand into related markets Expanding relationships with long-term strategic clients in a consolidating marketEnhancing payment solutions offering across market segmentsDevelop new programs and partnerships as the market evolves Payment Issuance (PSG) Payment Acceptance (PAG) Credit Linkage Built and launched a direct Rapid Funds Transfer channel. Rapid Funds is a new to market Visa/MC card-based transaction type for real-time corporate disbursements and P2P paymentsAllows The Bancorp to sell a turn-key solutionGenerates incremental revenue with little incremental expenseDeepening relationships with long-term strategic clients through cross selling of supplemental payment products Pursuing opportunities to provide credit to payments partners in the business to business arenaEvaluating opportunities to expand credit sponsorship in late 2018

Business Unit Strategies – Institutional Banking Institutional Banking delivers private label lending and banking services to wealth management providers Business ModelIntegrated banking solutions for wealth managersDeposit services Lending services (Securities-Backed lines of credit and advisor acquisition lines)Payment services (debit cards and payment cards)HighlightsLoan growth rate of 25% since 2013 with significant additional market opportunityLaunched loan automation platform Talea in Q1 2018Market dynamics support business modelAdvisors shifting from large broker dealers to independent platformsSector shift to fee based accountsEmergence of new wealth management providers 30,000+ financial advisors served $2.2 trillion in partner assets under management Note: Information as of 3/31/2018

Business Unit Strategies – Small Business The Bancorp is building a focused small business lending platform in attractive regional markets and client segments Business ModelBuilding a distinct platform within the fragmented SBA marketNational portfolio lender approach allows pricing and client flexibilityHighly focused business unit allows for commitment to operational excellenceSolid credit performance over timeHighlightsFocused on building an integrated national platformClient segment strategy tailored by marketExpansion of businesses development capacityDeveloped the SBAlliance program to provide lending support to banks and financial institutions who need SBA lending capabilities $700K average7a loan size Compound growth rate of 32% since 2013 Note: Information as of 3/31/2018
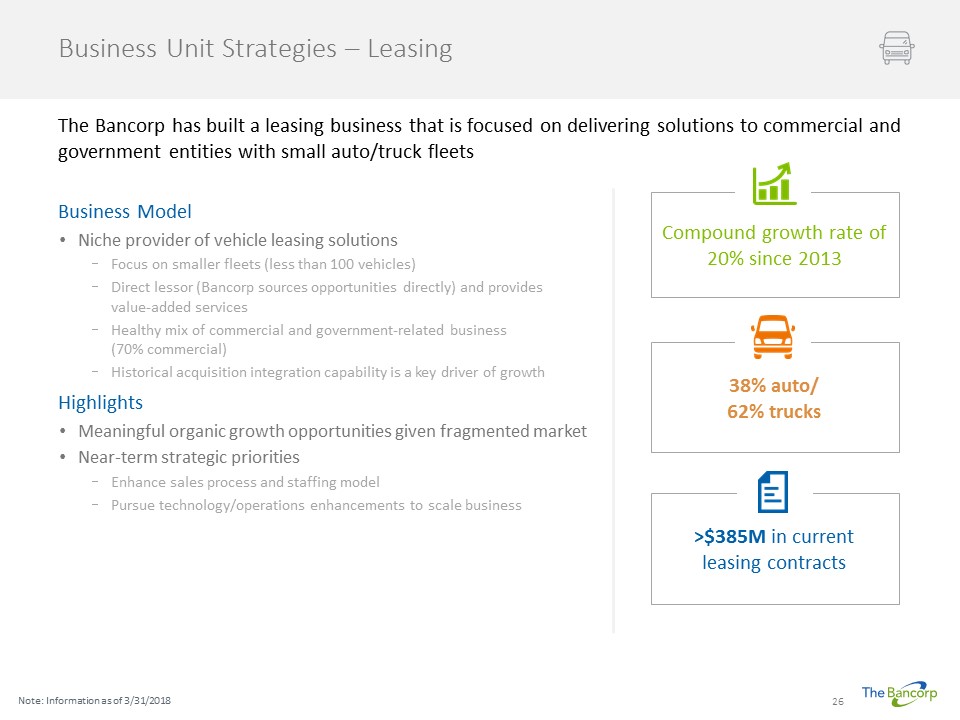
Business Unit Strategies – Leasing The Bancorp has built a leasing business that is focused on delivering solutions to commercial and government entities with small auto/truck fleets Business ModelNiche provider of vehicle leasing solutionsFocus on smaller fleets (less than 100 vehicles)Direct lessor (Bancorp sources opportunities directly) and provides value-added servicesHealthy mix of commercial and government-related business (70% commercial)Historical acquisition integration capability is a key driver of growthHighlightsMeaningful organic growth opportunities given fragmented market Near-term strategic prioritiesEnhance sales process and staffing modelPursue technology/operations enhancements to scale business Compound growth rate of 20% since 2013 38% auto/ 62% trucks >$385M in current leasing contracts Note: Information as of 3/31/2018

Business Unit Strategies – Real Estate Capital Markets The Bancorp has built a niche commercial real estate capital markets business Business ModelLaunched in 2012, we have a dedicated team focused on the commercial real estate marketOriginate floating rate transactions for saleBank balance sheet provides flexibility vs. warehouse playersOrigination focused primarily on multi-family, office and retail in primary and secondary marketsStrong credit culture and capital markets experience and expertiseHighlightsCompleted several securitizations since 2013 and most recently in Q1 2018, generating significant non-interest incomeFocus on originating commercial real estate loans to be sold in private securitizations with a target to complete 2-3 transactions per year 60-80 commercial real estate loans per year Origination of private securitization transactions Note: Information as of 3/31/2018

Appendix

Capital Ratios and Selected Financial Data - The Bancorp, Inc. As of or for the twelve months ended December 31, 2017 As of or for the three months ended March 31, 2018 Selected Capital and Asset Quality Ratios: Equity/assets 6.88% 7.55% Tier 1 capital to average assets 7.90% 7.69% Tier 1 capital to total risk-weighted assets 16.73% 18.36% Total capital to total risk-weighted assets 17.09% 18.75% Allowance for loan and lease losses to total loans 0.51% 0.50% Balance Sheet Data ($M): Total assets $4,708 $4,369 Loans, net of unearned costs (fees) $1,392 $1,463 Commercial loans held for sale $503 $350 Allowance for loan and lease losses $7.1 $7.3 Total cash and cash equivalents $909 $575 Total investments $1,381 $1,467 Deposits $4,261 $3,955 Shareholders’ equity $324 $330 Selected Ratios: Return on average assets 0.5% 1.3% Return on average common equity 7.0% 17.5% Net interest margin 3.04% 3.12% Book value per share $5.81 $5.87 1 The Common Equity Tier 1 Ratio (CET1) is equivalent 1

Loan Portfolio and Asset Quality Overview Category(000s) 2014 2015 2016 2017 Q1 2018 Balance % of Total Loans Non-accrual Loans OREO 30-89 Days Delinquent 90+ Days Delinquent Q1 2018 YTD Charge-offs (net) SBA1 $165,134 $189,893 $209,629 $229,205 $244,595 14% $2,105 $405 $658 $268 $499 SBA1 held for sale $38,704 $109,174 $154,016 $165,177 $172,030 9% - - - - - Leasing $194,464 $231,514 $346,645 $377,660 $385,467 21% - - $2.229 $2,375 ($2) Security backed lines of credit $421,862 $575,948 $630,400 $730,462 $759,369 42% - - $86 - - Other consumer lending $36,168 $23,180 $17,374 $14,133 $17,416 1% $1,411 - $69 - $14 Other specialty lending $48,625 $48,315 $11,073 $30,720 $45,729 3% - - - - - Real Estate Capital Markets $178,376 $380,764 $509,124 $338,139 $177,776 10% - - - - - Total $1,083,333 $1,558,788 $1,878,261 $1,885,496 $1,802,382 100% $3,516 $405 $3,042 $2,643 $511 1 Small Business Administration

Adjusted Post Provision Income Reconciliation1 1 Post provision income for continuing operations is calculated as follows: Net interest income less provision for loan and lease losses plus non-interest income excluding (gain)/loss on sales of investment securities and Health Savings Accounts, change in value of unconsolidated entity and sale of European payments business Category ($M) 2015 2016 2017 Q1 2017 YTD Q1 2018 YTD Interest income $83.5 $102.2 $122.0 $28.5 $35.3 Interest expense $13.6 $12.2 $15.3 $3.6 $5.2 Net interest income $69.9 $90.0 $106.7 $24.9 $30.1 Provision for loan and lease losses $2.1 $3.4 $2.9 $1.0 $0.7 Net interest income post provision $67.8 $86.6 $103.8 $23.9 $29.4 Beginning non-interest income $133.1 $42.5 $91.5 $24.2 $29.1 (Gain) on sale of investment securities ($14.4) ($3.2) ($2.2) ($0.5) - (Gain) loss on sale of Health Savings Account portfolio & European Payments Business ($33.5) - $0.9 - - Change in value of investment in unconsolidated entity ($1.7) $37.5 - - $1.2 Adjusted Non-interest income $83.5 $76.8 $90.2 $23.7 $30.4 Adjusted post provision income $151.3 $163.4 $194.0 $47.6 $59.8

Risk Factors The following risk factors, among others, could cause actual results to differ materially from the anticipated results or other expectations expressed in this presentation The risk factors discussed and identified in our Annual Report on Form 10-K for the year ended December 31, 2017, and in other of our public filings with the SEC include but are not limited to the following:an inconsistent recovery from an extended period of weak economic and slow growth conditions in the U.S. economy have had, and may in the future have, significant adverse effects on our assets and operating results, including increases in payment defaults and other credit risks, decreases in the fair value of some assets and increases in our provision for loan losses;weak economic and credit market conditions may result in a reduction in our capital base, reducing our ability to maintain deposits at current levels;operating costs may increase;adverse governmental or regulatory policies may be promulgated;management and other key personnel may be lost;competition may increase;the costs of our interest bearing liabilities, principally deposits, may increase relative to the interest received on our interest bearing assets, principally loans, thereby decreasing our net interest income;loan and investment yields may decrease resulting in a lower net interest margin; possible geographic concentration could result in our loan portfolio being adversely affected by economic factors unique to the geographic area and not reflected in other regions of the country;the market value of real estate that secures certain of our loans, principally loans we originate for sale into secondary markets, Small Business Administration loans under the 504 Fixed Asset Financing Program and our discontinued commercial loan portfolio, has been, and may continue to be, adversely affected by recent economic and market conditions, and may be affected by other conditions outside of our control such as lack of demand for real estate of the type securing our loans, natural disasters, changes in neighborhood values, competitive overbuilding, weather, casualty losses, occupancy rates and other similar factors;we must satisfy our regulators with respect to Bank Secrecy Act, Anti-Money Laundering and other regulatory mandates to prevent additional restrictions on adding customers and to remove current restrictions on adding certain customers; the loans from our discontinued operations are now held for sale and were marked to fair value based on various internal and external inputs; however, the actual sales price could differ from those third-party fair values. The reinvestment rate for the proceeds of those sales in investment securities depends on future market interest rates; andwe may not be able to sustain our historical growth rate in our loan, prepaid card and other lines of business.
Serious News for Serious Traders! Try StreetInsider.com Premium Free!
You May Also Be Interested In
- Lowey Dannenberg, P.C. is Investigating The Bancorp, Inc. (“TBBK” or the “Company”) (NASDAQ:TBBK) for Potential Violations of the Federal Securities Laws and Encourages Investors with more tha
- O-RAN ALLIANCE Global PlugFest Spring 2024 Initiated with Focus on Six Themes
- Extraordinary General Meeting of Jyske Bank A/S held on 18 April 2024
Create E-mail Alert Related Categories
SEC FilingsSign up for StreetInsider Free!
Receive full access to all new and archived articles, unlimited portfolio tracking, e-mail alerts, custom newswires and RSS feeds - and more!
