

Form 8-K Axalta Coating Systems For: May 20
 Tweet
Tweet Share
Share
UNITED
STATES
SECURITIES
AND EXCHANGE COMMISSION
WASHINGTON,
D.C. 20549
FORM
8-K
CURRENT
REPORT
PURSUANT
TO SECTION 13 OR 15(d) OF THE
SECURITIES
EXCHANGE ACT OF 1934
Date of
Report (Date of earliest event reported)
May
20, 2015
AXALTA
COATING SYSTEMS LTD.
(Exact
name of registrant as specified in its charter)
|
Bermuda |
001-36733 |
98-1073028 |
|
(State or other jurisdiction of incorporation) |
(Commission File Number) |
(IRS Employer Identification No.) |
Two Commerce Square, 2001 Market Street, Suite 3600, Philadelphia,
Pennsylvania 19103
(Address of principal executive
offices) (Zip Code)
(855) 547-1461
Registrant’s
telephone number, including area code
Not Applicable
(Former
name or former address, if changed since last report.)
Check the appropriate box below if the Form 8-K filing is intended to simultaneously satisfy the filing obligation of the registrant under any of the following provisions (see General Instruction A.2. below):
⃞ Written communications pursuant to Rule 425 under the Securities Act (17 CFR 230.425)
⃞ Soliciting material pursuant to Rule 14a-12 under the Exchange Act (17 CFR 240.14a-12)
⃞ Pre-commencement communications pursuant to Rule 14d-2(b) under the Exchange Act (17 CFR 240.14d-2(b))
⃞ Pre-commencement communications pursuant to Rule 13e-4(c) under the Exchange Act (17 CFR 240.13e-4(c))
Item 7.01 Regulation FD Disclosure.
On May 20, 2015, Axalta Coating Systems Ltd. (“Axalta”) will present at the Goldman Sachs Basic Materials Conference. The Company has posted the presentation slides to the Company’s Investor Relations website. A copy of the presentation materials is furnished hereto as Exhibit 99.1.
The information contained herein and in the accompanying exhibits shall not be deemed filed for the purposes of Section 18 of the Securities Exchange Act of 1934, as amended, or otherwise subject to the liability of that section, nor shall it be deemed incorporated by reference in any filing under the Securities Act of 1933, as amended, except as shall be expressly set forth by specific reference in such a filing.
In the presentation slides and prepared remarks during the Goldman Sachs
Basic Materials Conference, Axalta presents, and will present, certain
non-GAAP financial measures. Axalta management believes that presenting
these non-GAAP financial measures provides meaningful information to
investors in understanding operating results and may enhance investors’
ability to analyze financial and business trends. In addition, Axalta
management believes that these non-GAAP financial measures allow
investors to compare period to period more easily by excluding items
that could have a disproportionately negative or positive impact on
results in any particular period. Non-GAAP measures are not a substitute
for GAAP measures and should be considered together with the GAAP
financial measures. As calculated, our non-GAAP financial measures may
not be comparable to other similarly titled measures of other companies.
Item 9.01. Financial Statements and Exhibits
(d) Exhibits
|
Exhibit No. |
Description |
|
|
99.1 |
Axalta Investor Presentation |
SIGNATURES
Pursuant to the requirements of the Securities Exchange Act of 1934, the registrant has duly caused this report to be signed on its behalf by the undersigned hereunto duly authorized.
|
AXALTA COATING SYSTEMS LTD. |
|||
|
Registrant |
|||
|
|
|||
| Date: | May 20, 2015 | By: |
/s/ Robert W. Bryant |
|
Robert W. Bryant |
|||
|
Executive Vice President & Chief Financial Officer |
|||
EXHIBIT INDEX
|
Exhibit No. |
Description |
|
| 99.1 |
Axalta Investor Presentation |
|
|
|
Exhibit 99.1
May 20, 2015 Axalta
Investor Presentation Axalta Coating Systems
Notice Regarding Forward Looking Statements, Non-GAAP Financial Measures and Defined TermsForward-Looking Statements This presentation and the oral remarks made in connection herewith may contain “forward-looking statements” within the meaning of the U.S. Private Securities Litigation Reform Act of 1995, including those relating to 2015 net sales, Adjusted EBITDA, tax rate, capital expenditures, plant expansions and net working capital. Any forward-looking statements involve risks, uncertainties and assumptions. These statements often include words such as “believe,” “expect,” “anticipate,” “intend,” “plan,” “estimate,” “target,” “project,” “forecast,” “seek,” “will,” “may,” “should,” “could,” “would,” or similar expressions. These statements are based on certain assumptions that we have made in light of our experience in the industry and our perceptions of historical trends, current conditions, expected future developments and other factors we believe are appropriate under the circumstances as of the date hereof. Although we believe that the assumptions and analysis underlying these statements are reasonable as of the date hereof, investors are cautioned not to place undue reliance on these statements. We do not have any obligation to and do not intend to update any forward-looking statements included herein, which speak only as of the date hereof. You should understand that these statements are not guarantees of future performance or results. Actual results could differ materially from those described in any forward-looking statements contained herein or the oral remarks made in connection herewith as a result of a variety of factors, including known and unknown risks and uncertainties, many of which are beyond our control. Non-GAAP Financial Measures The historical financial information included in this presentation includes financial information that is not presented in accordance with generally accepted accounting principles in the United States (“GAAP”), including EBITDA, Adjusted EBITDA and Net Debt. Management uses these non- GAAP financial measures in the analysis of our financial and operating performance because they assist in the evaluation of underlying trends in our business. Our use of the terms EBITDA, Adjusted EBITDA and Net Debt may differ from that of others in our industry. EBITDA and Adjusted EBITDA should not be considered as alternatives to net income (loss), operating income or any other performance measures derived in accordance with GAAP as measures of operating performance or operating cash flows or as measures of liquidity. EBITDA, Adjusted EBITDA and Net Debt have important limitations as analytical tools and should be considered in conjunction with, and not as substitutes for, our results as reported under GAAP. This presentation includes a reconciliation of certain non-GAAP financial measures with the most directly comparable financial measures calculated in accordance with GAAP. Defined Terms All capitalized terms contained within this presentation have been previously defined in our filings with the United States Securities and Exchange Commission. Axalta Coating Systems
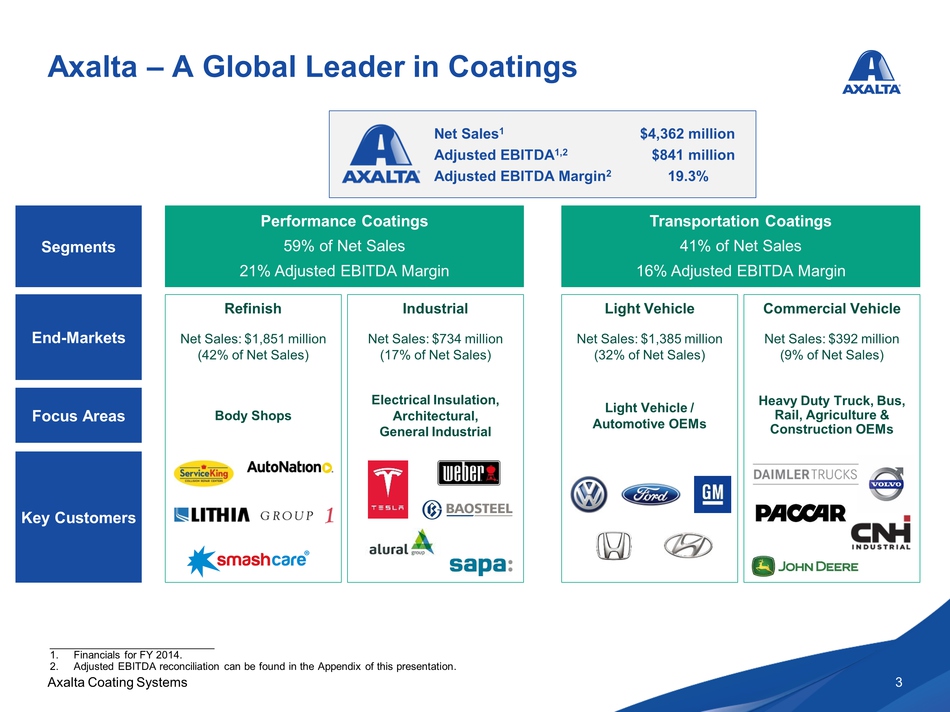
Axalta – A Global Leader in
Coatings Body Shops Electrical Insulation, Architectural, General
Industrial Net Sales1 $4,362 million Adjusted EBITDA1,2 $841 million
Adjusted EBITDA Margin2 19.3% Light Vehicle / Automotive OEMs Heavy Duty
Truck, Bus, Rail, Agriculture & Construction OEMs Net Sales: $1,851
million (42% of Net Sales) Net Sales: $734 million (17% of Net Sales)
Net Sales: $1,385 million (32% of Net Sales) Net Sales: $392 million (9%
of Net Sales) Refinish Industrial Light Vehicle Commercial Vehicle
____________________________ 1. Financials for FY 2014. 2. Adjusted
EBITDA reconciliation can be found in the Appendix of this presentation.
Axalta Coating Systems
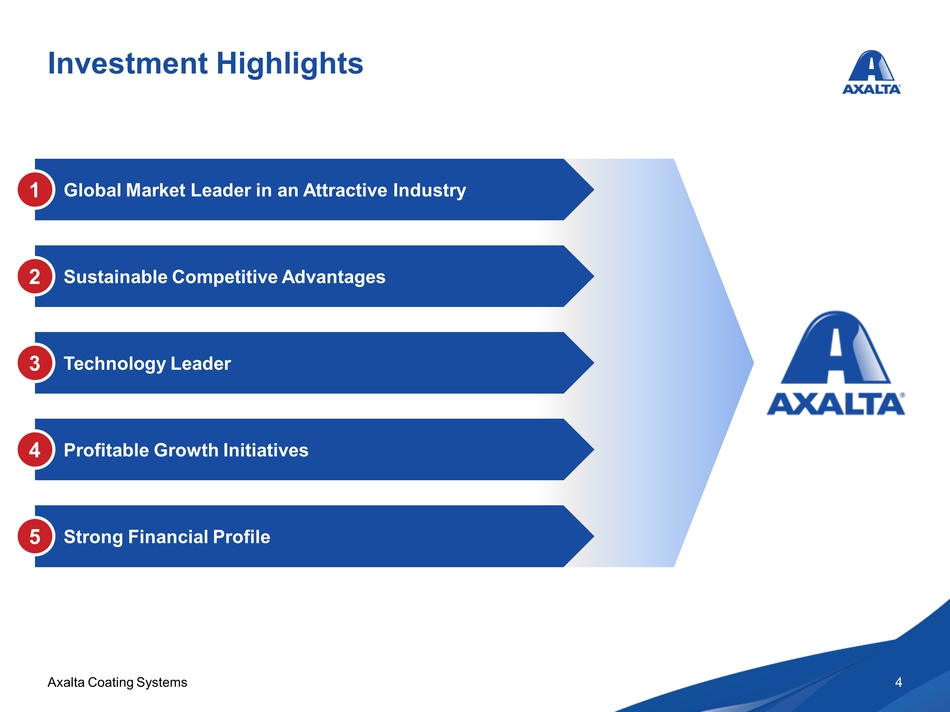
Investment Highlights
Global Market Leader in an Attractive Industry Sustainable Competitive
Advantages Technology Leader Profitable Growth Initiatives 5 Strong
Financial Profile 4 3 2 1Axalta Coating Systems
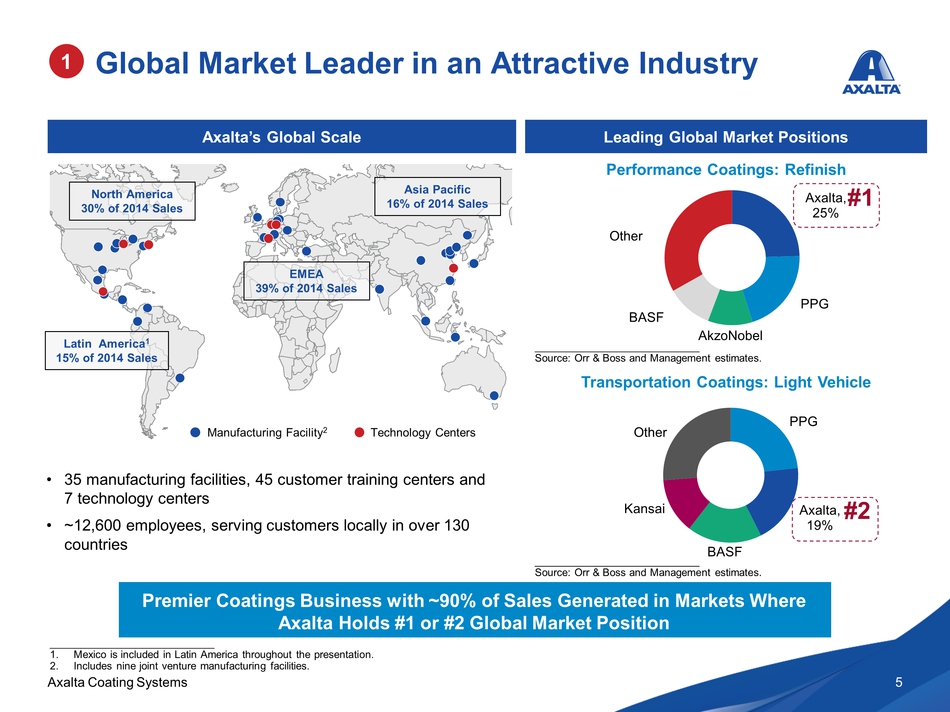
Axalta Coating Systems 5
Axalta’s Global Scale 1. Mexico is included in Latin America throughout
the presentation. 2. Includes nine joint venture manufacturing
facilities. • 35 manufacturing facilities, 45 customer training centers
and 7 technology centers • ~12,600 employees, serving customers locally
in over 130 countries Leading Global Market Positions 1 Global Market
Leader in an Attractive Industry Premier Coatings Business with ~90% of
Sales Generated in Markets Where Axalta Holds #1 or #2 Global Market
Position Axalta, 25% PPG AkzoNobel BASF Other Performance Coatings:
Refinish PPG Axalta, 19% BASF Kansai Other Transportation Coatings:
Light Vehicle #1 #2 North America 30% of 2014 Sales Latin America1 15%
of 2014 Sales Asia Pacific 16% of 2014 Sales EMEA 39% of 2014 Sales
Manufacturing Facility2 Technology Centers Source: Orr & Boss and
Management estimates. Source: Orr & Boss and Management estimates.
Axalta Coating Systems
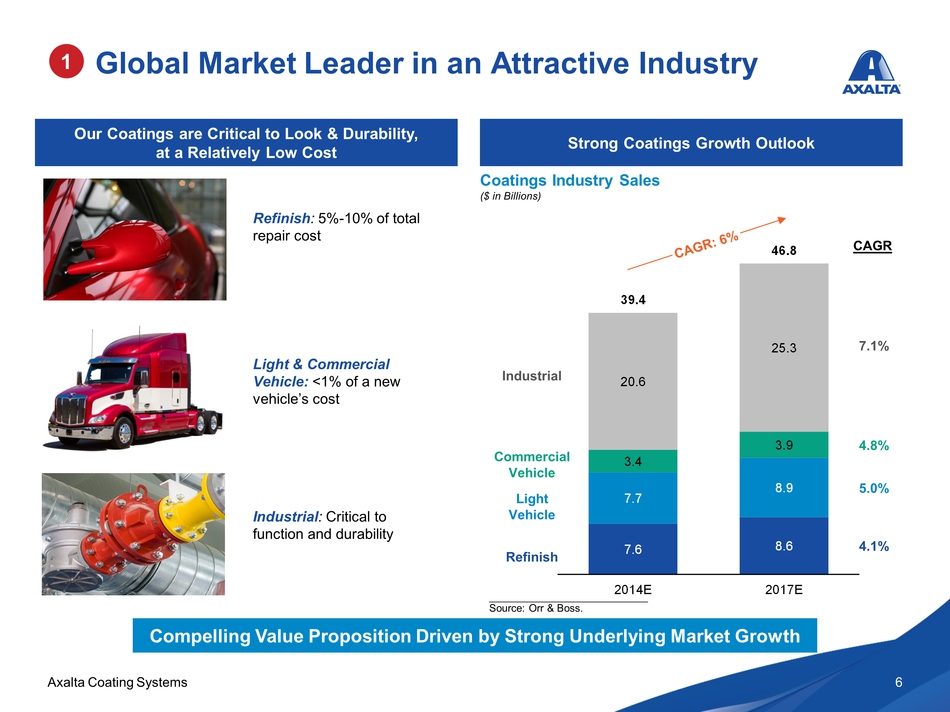
Global Market Leader in an Attractive Industry Strong Coatings Growth
Outlook 7.6 8.6 7.7 8.9 3.4 3.9 20.6 25.3 39.4 46.8 2014E 2017E
Commercial Vehicle Light Vehicle Refinish Industrial 7.1% 4.8% 5.0% 4.1%
CAGR Our Coatings are Critical to Look & Durability, at a Relatively Low
Cost 6 Coatings Industry Sales ($ in Billions) Source: Orr & Boss. 1
Compelling Value Proposition Driven by Strong Underlying Market Growth
Light & Commercial Vehicle: <1% of a new vehicle’s cost Industrial:
Critical to function and durability Refinish: 5%-10% of total repair cost
Axalta Coating Systems 7
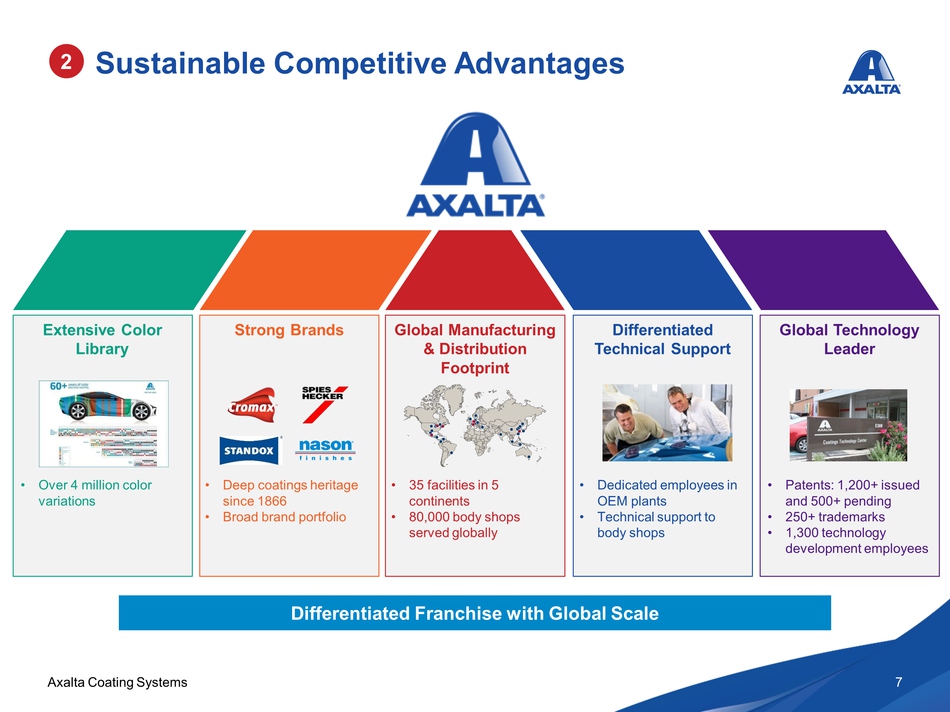
Sustainable Competitive Advantages Differentiated Technical Support
Extensive Color Strong Brands Library • Over 4 million color variations
• Deep coatings heritage since 1866 • Broad brand portfolio Global
Technology Leader • Patents: 1,200+ issued and 500+ pending • 250+
trademarks • 1,300 technology development employees Differentiated
Franchise with Global Scale 2 Global Manufacturing & Distribution
Footprint • 35 facilities in 5 continents • 80,000 body shops served
globally • Dedicated employees in OEM plants • Technical support to body
shops 7
Axalta Coating Systems
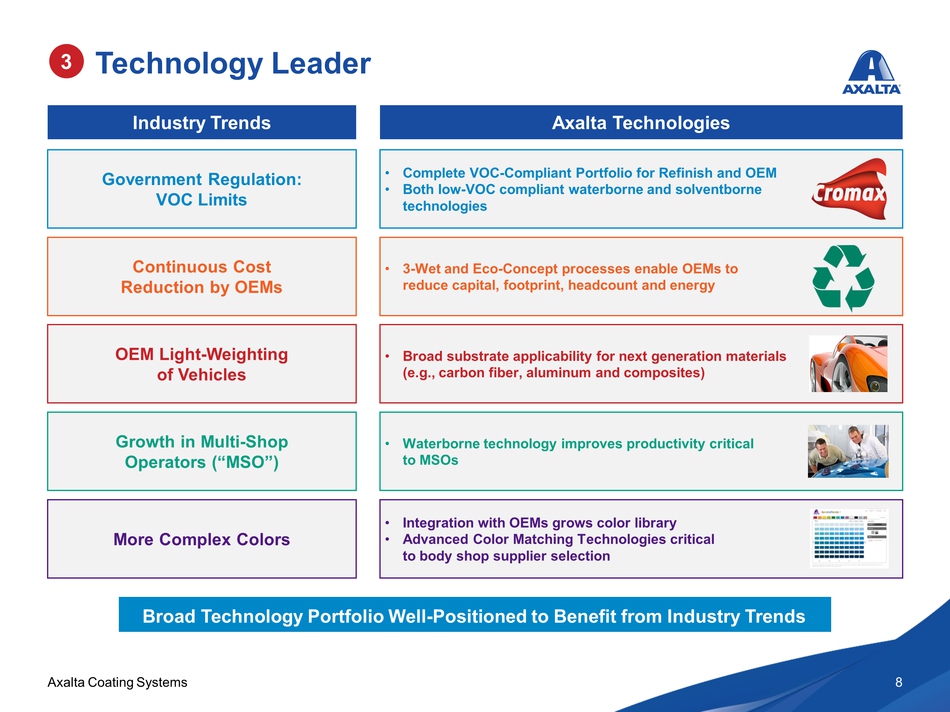
Technology Leader Industry Trends Axalta Technologies OEM
Light-Weighting of Vehicles • Broad substrate applicability for next
generation materials (e.g., carbon fiber, aluminum and composites)
Growth in Multi-Shop Operators (“MSO”) • Waterborne technology improves
productivity critical to MSOs 8 More Complex Colors • Integration with
OEMs grows color library • Advanced Color Matching Technologies critical
to body shop supplier selection • 3-Wet and Eco-Concept processes enable
OEMs to reduce capital, footprint, headcount and energy Continuous Cost
Reduction by OEMs 3 Government Regulation: VOC Limits • Complete
VOC-Compliant Portfolio for Refinish and OEM • Both low-VOC compliant
waterborne and solventborne technologies Broad Technology Portfolio
Well-Positioned to Benefit from Industry Trends 8
Axalta Coating Systems
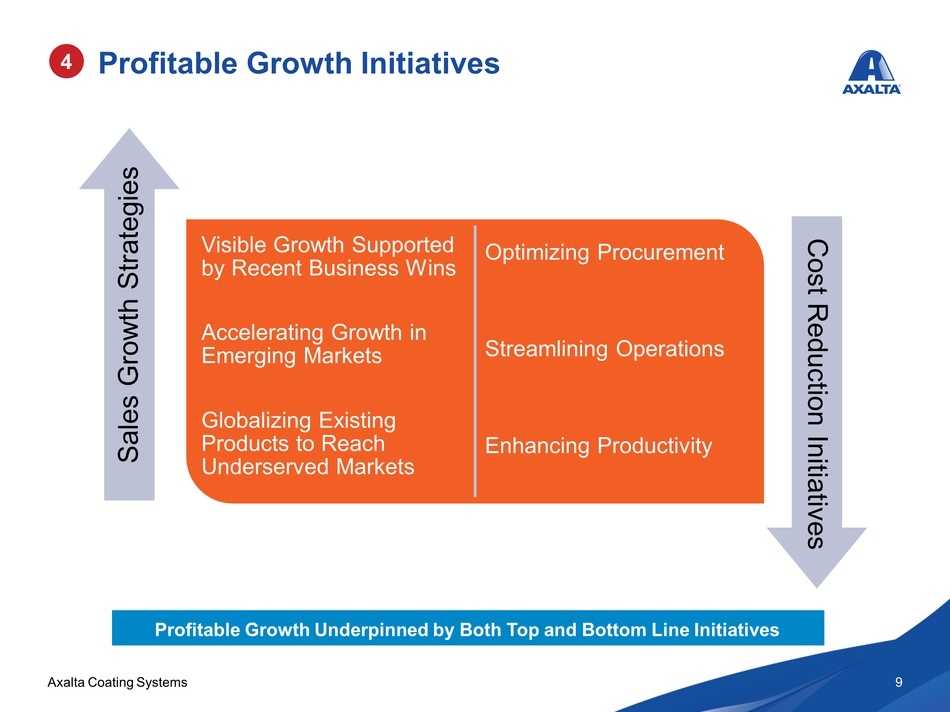
Profitable Growth Initiatives Visible Growth Supported by Recent
Business Wins Accelerating Growth in Emerging Markets Globalizing
Existing Products to Reach Underserved Markets Optimizing Procurement
Streamlining Operations Enhancing Productivity Sales Growth Strategies
Cost Reduction Initiatives 9 4 Profitable Growth Underpinned by Both Top
and Bottom Line Initiatives
Axalta Coating Systems 10
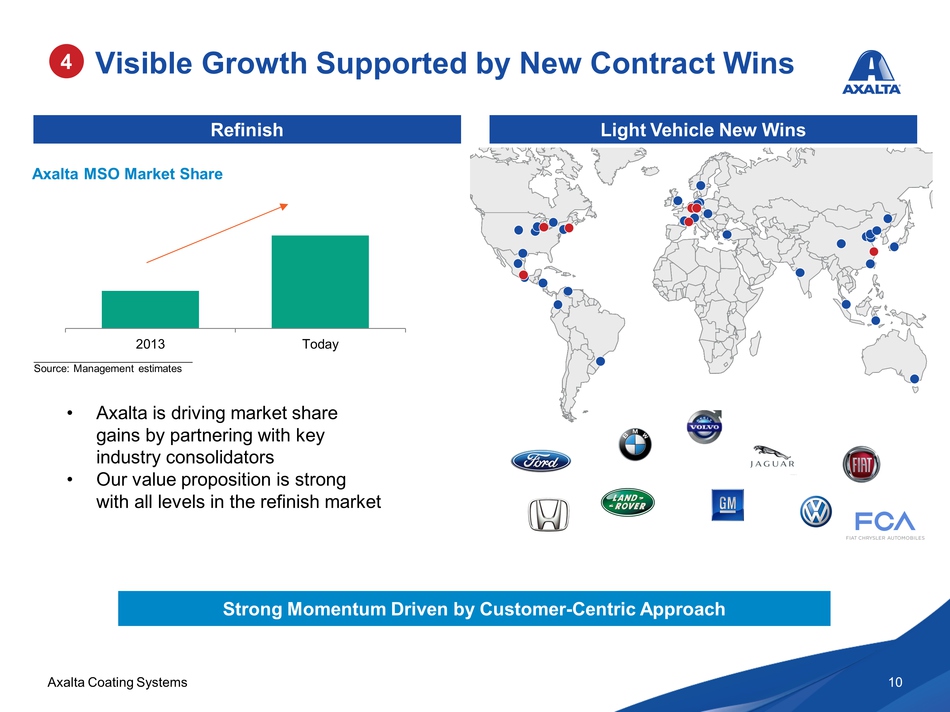
Refinish Source: Management estimates Strong Momentum Driven by
Customer-Centric Approach 4 Axalta MSO Market Share 2013 Today Light
Vehicle New Wins Visible Growth Supported by New Contract Wins • Axalta
is driving market share gains by partnering with key industry
consolidators • Our value proposition is strong with all levels in the
refinish market
Axalta Coating Systems
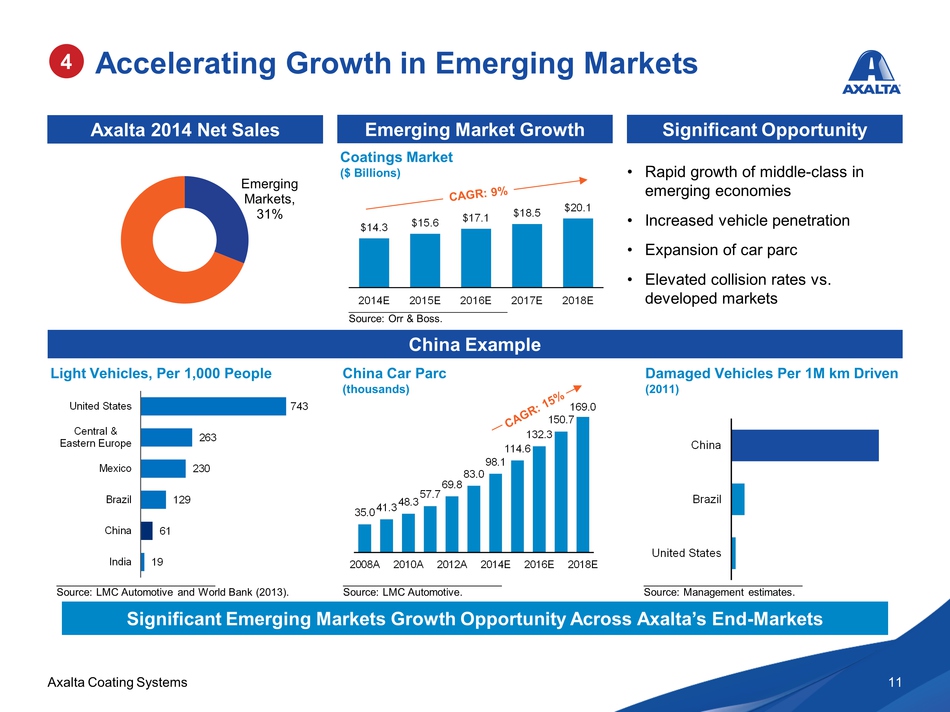
$14.3 $15.6 $17.1 $18.5 $20.1 2014E 2015E 2016E 2017E 2018E 35.0 41.3
48.3 57.7 69.8 83.0 98.1 114.6 132.3 150.7 169.0 2008A 2010A 2012A 2014E
2016E 2018E Emerging Markets, 31% Accelerating Growth in Emerging
Markets 11 4 China Example Light Vehicles, Per 1,000 People China Car
Parc (thousands) 743 263 230 129 61 19 United States Central & Eastern
Europe Mexico Brazil China India Damaged Vehicles Per 1M km Driven
(2011) Axalta 2014 Net Sales Emerging Market Growth Coatings Market ($
Billions) Significant Emerging Markets Growth Opportunity Across
Axalta’s End-Markets Significant Opportunity • Rapid growth of
middle-class in emerging economies • Increased vehicle penetration •
Expansion of car parc • Elevated collision rates vs. developed markets
United States Brazil China Source: Orr & Boss. Source: LMC Automotive
and World Bank (2013). Source: Management estimates. Source: LMC
Automotive.
Axalta Coating Systems
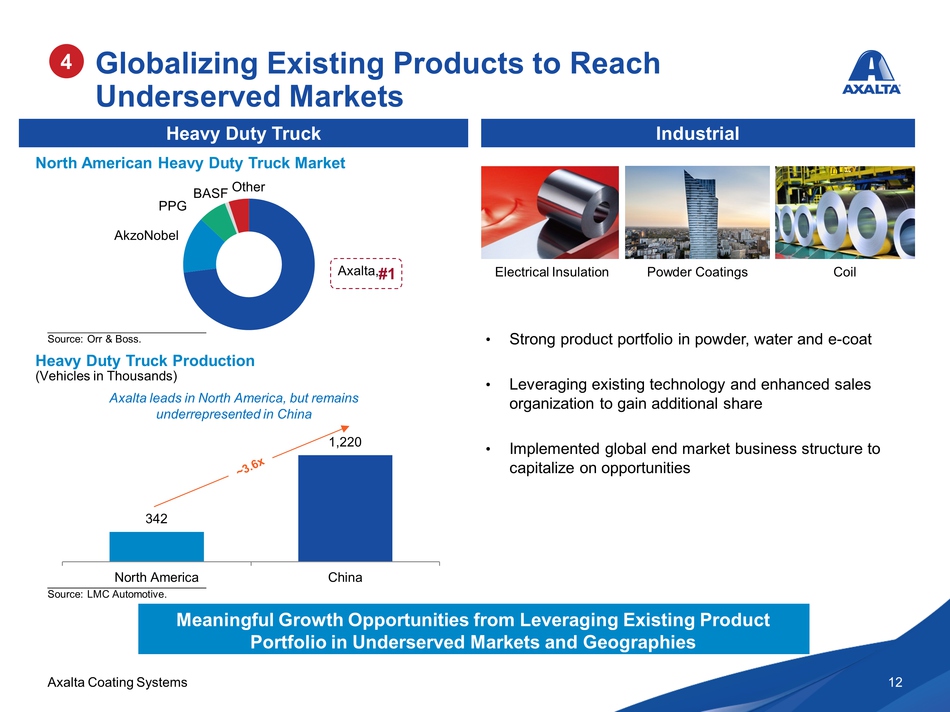
Globalizing Existing Products to Reach Underserved Markets 12 Source:
LMC Automotive. Heavy Duty Truck Axalta, AkzoNobel PPG BASF Other #1
North American Heavy Duty Truck Market 4 (Vehicles in Thousands) Heavy
Duty Truck Production 342 1,220 North America China Meaningful Growth
Opportunities from Leveraging Existing Product Portfolio in Underserved
Markets and Geographies • Strong product portfolio in powder, water and
e-coat • Leveraging existing technology and enhanced sales organization
to gain additional share • Implemented global end market business
structure to capitalize on opportunities Industrial Electrical
Insulation Powder Coatings Coil Axalta leads in North America, but
remains underrepresented in China Source: Orr & Boss.
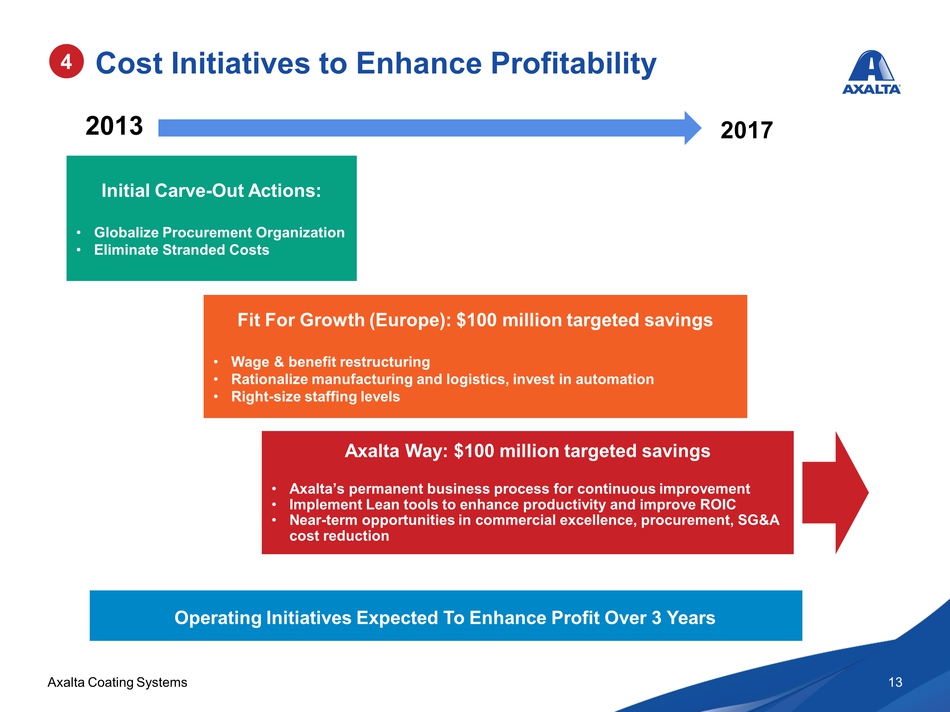
Axalta Coating Systems Cost
Initiatives to Enhance Profitability 13 Operating Initiatives Expected
To Enhance Profit Over 3 Years 4 Fit For Growth (Europe): $100 million
targeted savings • Wage & benefit restructuring • Rationalize
manufacturing and logistics, invest in automation • Right-size staffing
levels Initial Carve-Out Actions: • Globalize Procurement Organization •
Eliminate Stranded Costs Axalta Way: $100 million targeted savings •
Axalta’s permanent business process for continuous improvement •
Implement Lean tools to enhance productivity and improve ROIC •
Near-term opportunities in commercial excellence, procurement, SG&A cost
reduction 2013 2017
Axalta Coating Systems
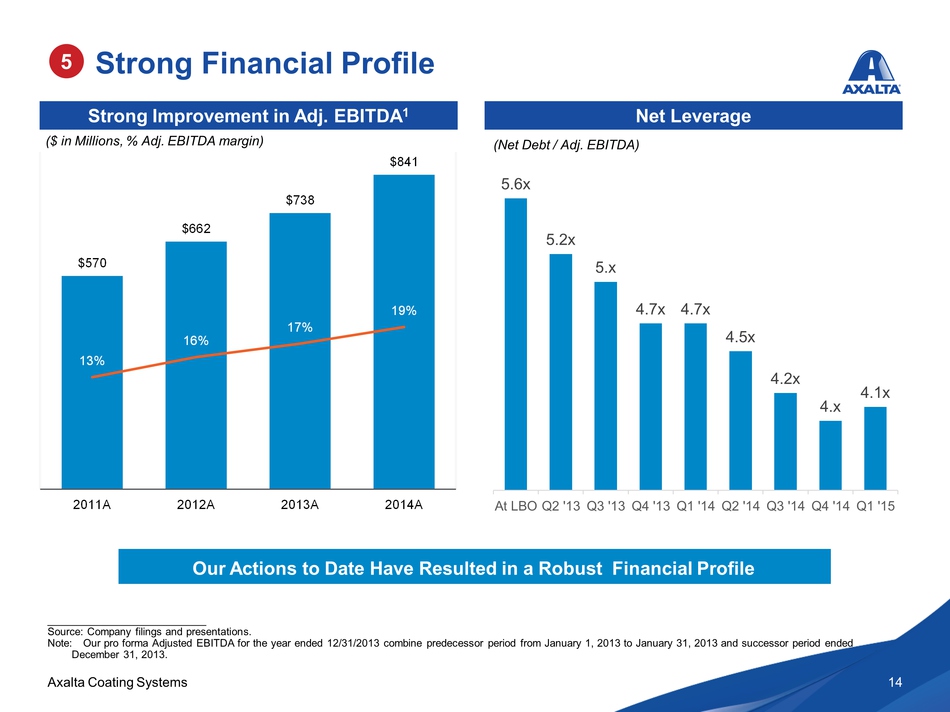
Strong Financial Profile 14 Strong Improvement in Adj. EBITDA1 Net
Leverage ($ in Millions, % Adj. EBITDA margin) $570 $662 $738 $841 13%
16% 17% 19% 2011A 2012A 2013A 2014A Source: Company filings and
presentations. Note: Our pro forma Adjusted EBITDA for the year ended
12/31/2013 combine predecessor period from January 1, 2013 to January
31, 2013 and successor period ended December 31, 2013. 5 Our Actions to
Date Have Resulted in a Robust Financial Profile 5.6x 5.2x 5.x 4.7x 4.7x
4.5x 4.2x 4.x 4.1x At LBO Q2 '13 Q3 '13 Q4 '13 Q1 '14 Q2 '14 Q3 '14 Q4
'14 Q1 '15 (Net Debt / Adj. EBITDA)
Axalta Coating Systems
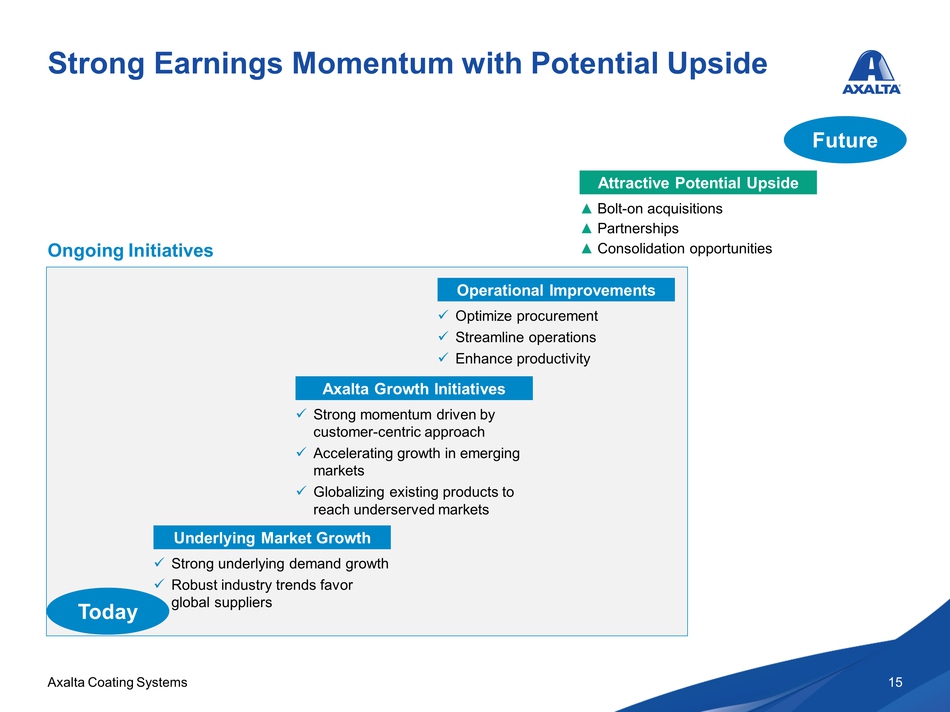
Strong Earnings Momentum with Potential Upside 15 Underlying Market
Growth Axalta Growth Initiatives Operational Improvements Attractive
Potential Upside Strong underlying demand growth Robust industry trends
favor global suppliers Strong momentum driven by customer-centric
approach Accelerating growth in emerging markets Globalizing existing
products to reach underserved markets Optimize procurement Streamline
operations Enhance productivity Bolt-on acquisitions Partnerships
Ongoing Initiatives Consolidation opportunities Future Today
Financial Overview
Axalta Coating Systems
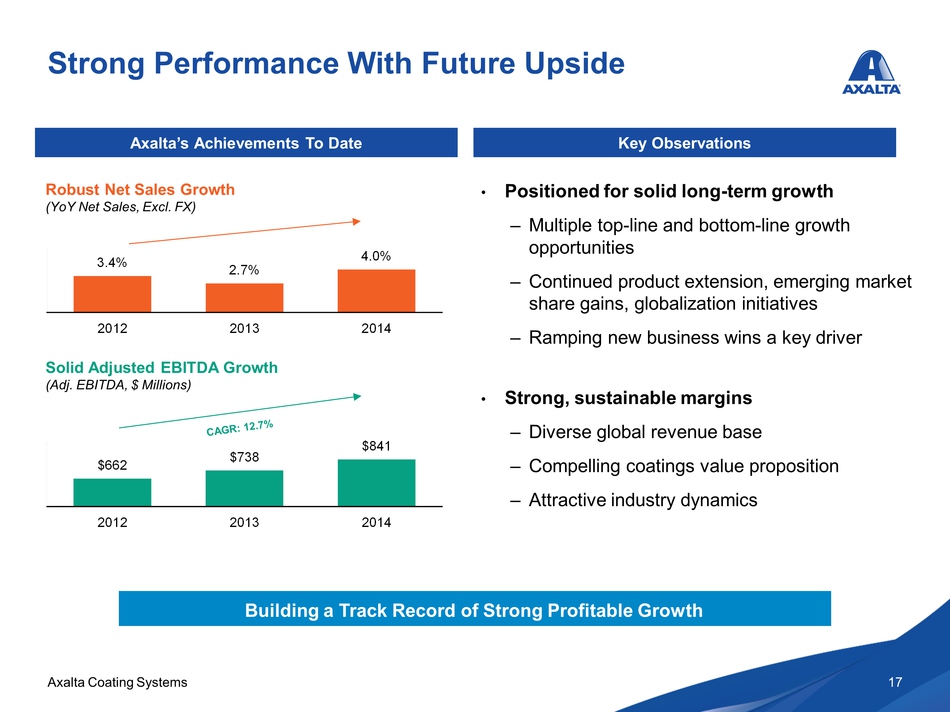
Strong Performance With Future Upside 17 Key Observations Building a
Track Record of Strong Profitable Growth Axalta’s Achievements To Date
3.4% 2.7% 4.0% 2012 2013 2014 Robust Net Sales Growth (YoY Net Sales,
Excl. FX) $662 $738 $841 2012 2013 2014 Solid Adjusted EBITDA Growth
(Adj. EBITDA, $ Millions) • Positioned for solid long-term growth –
Multiple top-line and bottom-line growth opportunities – Continued
product extension, emerging market share gains, globalization
initiatives – Ramping new business wins a key driver • Strong,
sustainable margins – Diverse global revenue base – Compelling coatings
value proposition – Attractive industry dynamics
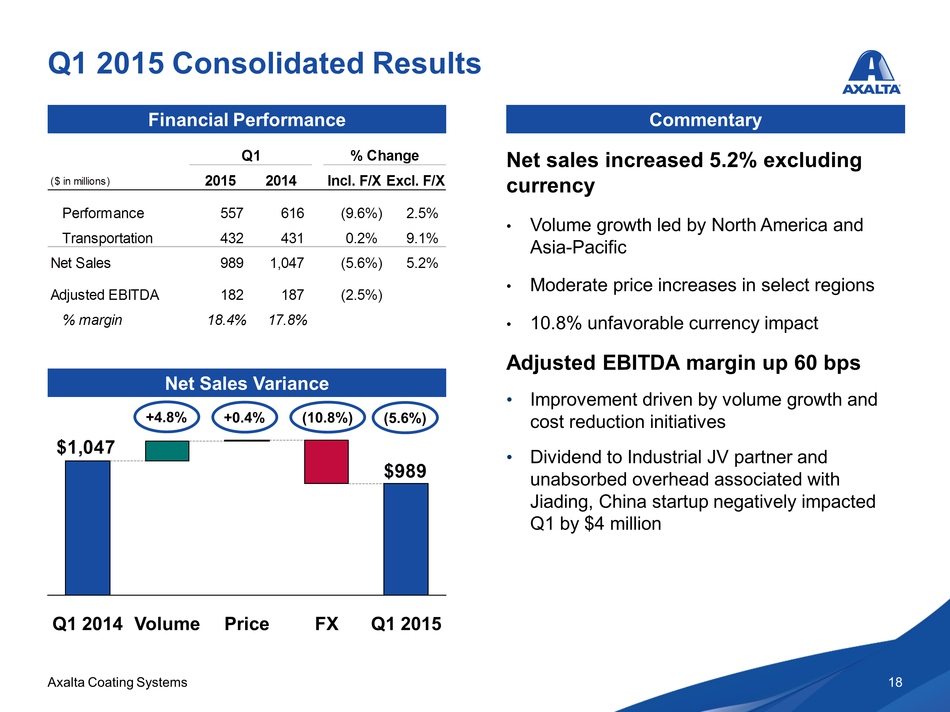
Axalta Coating Systems Q1
2015 Consolidated Results 18 Financial Performance Net sales increased
5.2% excluding currency • Volume growth led by North America and
Asia-Pacific • Moderate price increases in select regions • 10.8%
unfavorable currency impact Adjusted EBITDA margin up 60 bps •
Improvement driven by volume growth and cost reduction initiatives •
Dividend to Industrial JV partner and unabsorbed overhead associated
with Jiading, China startup negatively impacted Q1 by $4 million
Commentary Net Sales Variance +4.8% +0.4% (10.8%) (5.6%) $989 $1,047 Q1
2014 Volume Price FX Q1 2015 ($ in millions) 2015 2014 Incl. F/X Excl.
F/X Performance 5 57 616 (9.6%) 2.5% Transportation 4 32 431 0.2% 9.1%
Net Sales 9 89 1,047 (5.6%) 5.2% Adjusted EBITDA 1 82 187 (2.5%) %
margin 18.4% 17.8% Q1 % Change
Axalta Coating Systems Full
Year 2015 Guidance 19 • Net Sales Growth: + 5-7% excluding F/X; flat to
slightly down on an as-reported basis – Growth across all regions and
end-markets, excluding F/X impact, which is a significant headwind,
though primarily translational with production and sales fairly balanced
by region – Performance Coatings Drivers: Increased volumes, selective
price increases – Transportation Coatings Drivers: Light Vehicle ramp
from recent “wins”; continued strong truck production • Adjusted EBITDA:
$860-900 million – Adjusted EBITDA margin of approximately 20% –
Drivers: Ramping sales growth and savings from our optimization
initiatives – 2H 2015 ramps with new capacity coming online to serve
Light Vehicle plant wins • Tax Rate: Normalized effective @ 27-29% •
CapEx: $150 million, ~60% for growth & productivity projects • Net
working capital: 13-15% of net sales, excluding previously expensed
transition-related items
Confidential Appendix A:
Segment Overviews
Axalta Coating Systems
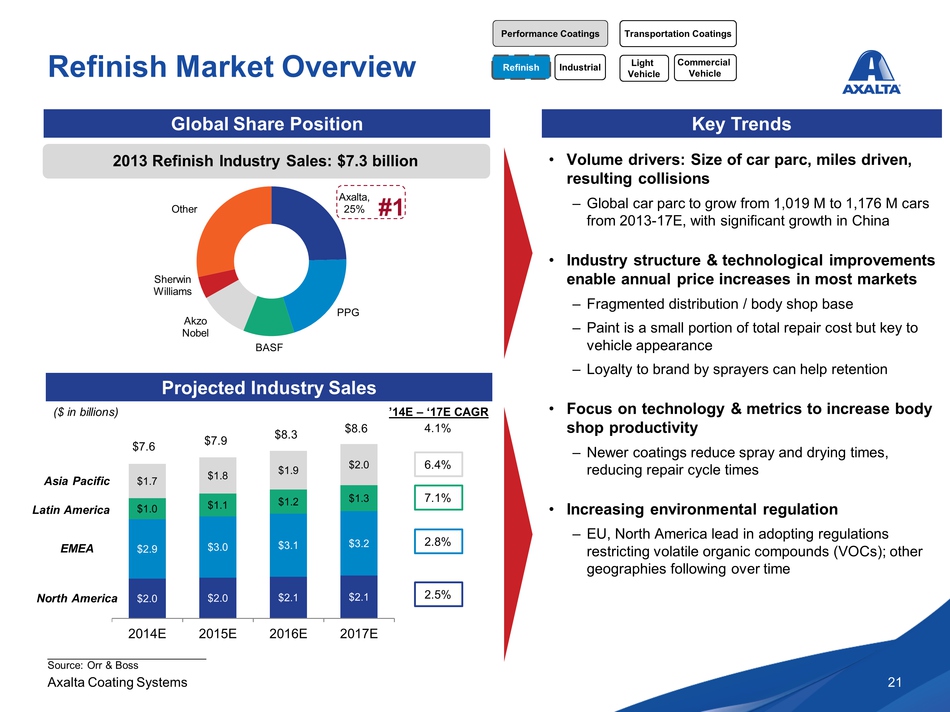
Refinish Market Overview • Volume drivers: Size of car parc, miles
driven, resulting collisions – Global car parc to grow from 1,019 M to
1,176 M cars from 2013-17E, with significant growth in China • Industry
structure & technological improvements enable annual price increases in
most markets – Fragmented distribution / body shop base – Paint is a
small portion of total repair cost but key to vehicle appearance –
Loyalty to brand by sprayers can help retention • Focus on technology &
metrics to increase body shop productivity – Newer coatings reduce spray
and drying times, reducing repair cycle times • Increasing environmental
regulation – EU, North America lead in adopting regulations restricting
volatile organic compounds (VOCs); other geographies following over time
Global Share Position Key Trends Projected Industry Sales 21 Axalta, 25%
PPG BASF Akzo Nobel Sherwin Williams Other 2013 Refinish Industry Sales:
$7.3 billion #1 ($ in billions) Asia Pacific EMEA North America 6.4%
7.1% 2.8% 2.5% 4.1% $2.0 $2.0 $2.1 $2.1 $2.9 $3.0 $3.1 $3.2 $1.0 $1.1
$1.2 $1.3 $1.7 $1.8 $1.9 $2.0 2014E 2015E 2016E 2017E $7.6 $7.9 $8.3
’14E – ‘17E CAGR $8.6 Source: Orr & Boss Latin America Refinish Light
Vehicle Industrial Commercial Vehicle Performance Coatings
Transportation Coatings
Axalta Coating Systems
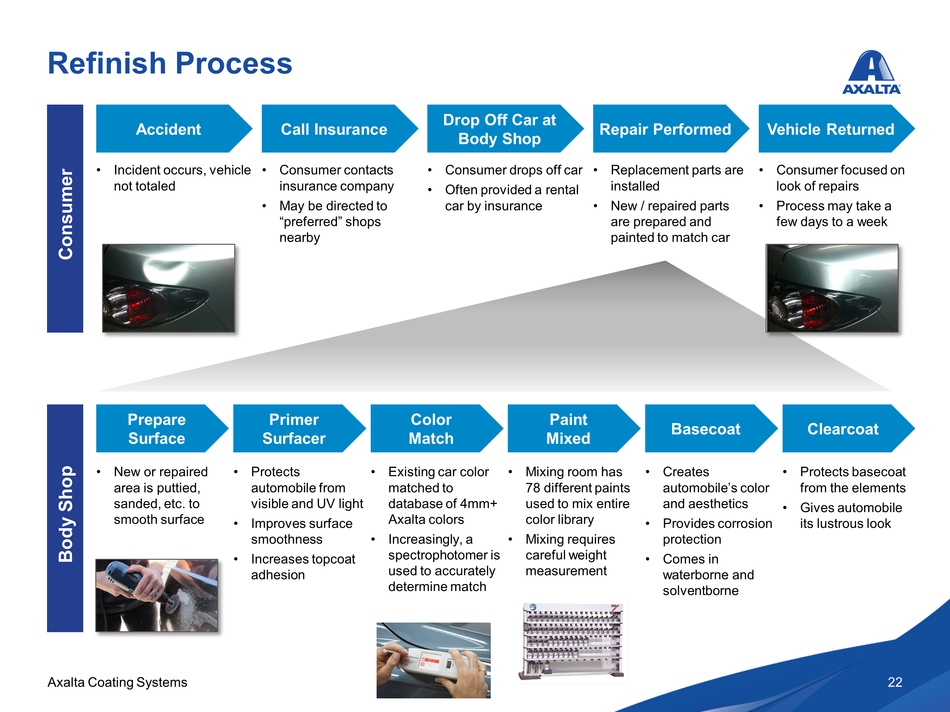
Refinish Process Consumer Body Shop • Incident occurs, vehicle not
totaled • Consumer contacts insurance company • May be directed to
“preferred” shops nearby • Consumer drops off car • Often provided a
rental car by insurance Accident Call Insurance Drop Off Car at Body
Shop Repair Performed Vehicle Returned • Replacement parts are installed
• New / repaired parts are prepared and painted to match car • Consumer
focused on look of repairs • Process may take a few days to a week
Prepare Surface Primer Surfacer Color Match Paint Mixed Basecoat
Clearcoat • New or repaired area is puttied, sanded, etc. to smooth
surface • Protects automobile from visible and UV light • Improves
surface smoothness • Increases topcoat adhesion • Existing car color
matched to database of 4mm+ Axalta colors • Increasingly, a
spectrophotomer is used to accurately determine match • Mixing room has
78 different paints used to mix entire color library • Mixing requires
careful weight measurement • Creates automobile’s color and aesthetics •
Provides corrosion protection • Comes in waterborne and solventborne •
Protects basecoat from the elements • Gives automobile its lustrous look
22
Axalta Coating Systems
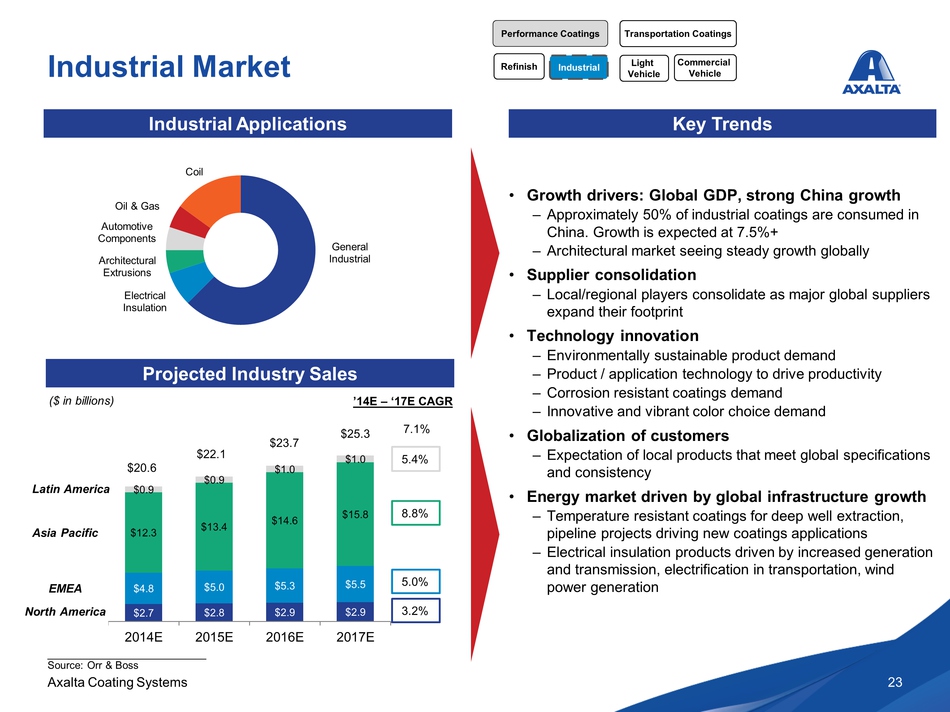
General Industrial Electrical Insulation Architectural Extrusions
Automotive Components Oil & Gas Coil Industrial Market Industrial
Applications Key Trends Projected Industry Sales 23 ($ in billions) ’14E
– ‘17E CAGR Asia Pacific EMEA North America 5.4% 8.8% 5.0% 3.2% 7.1%
$2.7 $2.8 $2.9 $2.9 $4.8 $5.0 $5.3 $5.5 $12.3 $13.4 $14.6 $15.8 $0.9
$0.9 $1.0 $1.0 2014E 2015E 2016E 2017E $20.6 $22.1 $23.7 $25.3 Source:
Orr & Boss Latin America • Growth drivers: Global GDP, strong China
growth – Approximately 50% of industrial coatings are consumed in China.
Growth is expected at 7.5%+ – Architectural market seeing steady growth
globally • Supplier consolidation – Local/regional players consolidate
as major global suppliers expand their footprint • Technology innovation
– Environmentally sustainable product demand – Product / application
technology to drive productivity – Corrosion resistant coatings demand –
Innovative and vibrant color choice demand • Globalization of customers
– Expectation of local products that meet global specifications and
consistency • Energy market driven by global infrastructure growth –
Temperature resistant coatings for deep well extraction, pipeline
projects driving new coatings applications – Electrical insulation
products driven by increased generation and transmission,
electrification in transportation, wind power generation Industrial
Light Vehicle Refinish Commercial Vehicle Performance Coatings
Transportation Coatings
Axalta Coating Systems
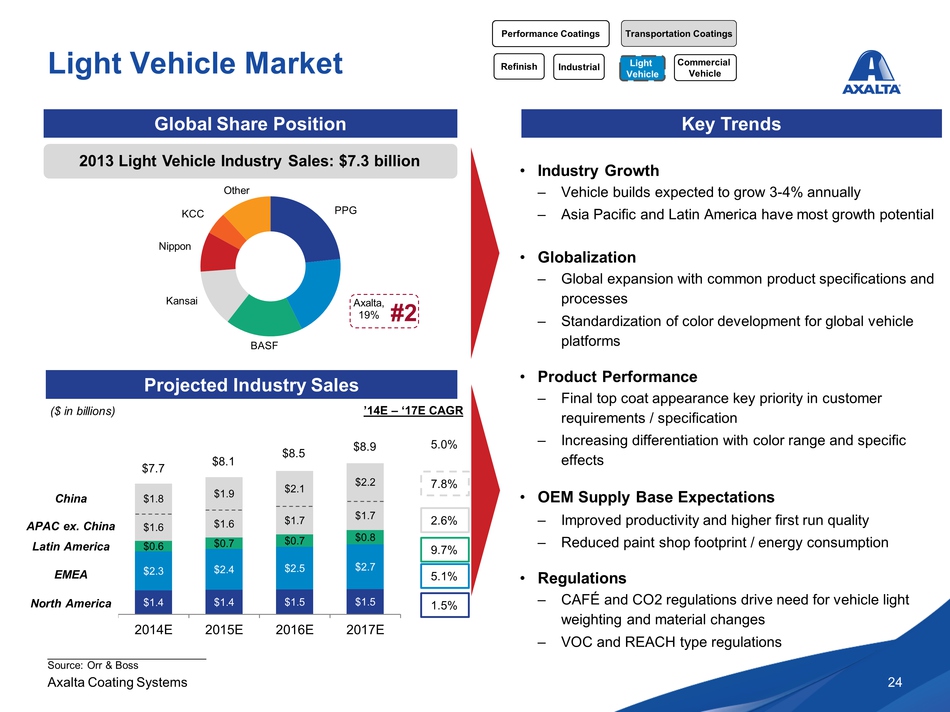
Light Vehicle Market Key Trends • Industry Growth – Vehicle builds
expected to grow 3-4% annually – Asia Pacific and Latin America have
most growth potential • Globalization – Global expansion with common
product specifications and processes – Standardization of color
development for global vehicle platforms • Product Performance – Final
top coat appearance key priority in customer requirements /
specification – Increasing differentiation with color range and specific
effects • OEM Supply Base Expectations – Improved productivity and
higher first run quality – Reduced paint shop footprint / energy
consumption • Regulations – CAFÉ and CO2 regulations drive need for
vehicle light weighting and material changes – VOC and REACH type
regulations 24 Global Share Position Projected Industry Sales Source:
Orr & Boss APAC ex. China Latin America EMEA North America 2.6% 9.7%
5.1% 1.5% 5.0% $1.4 $1.4 $1.5 $1.5 $2.3 $2.4 $2.5 $2.7 $0.6 $0.7 $0.7
$0.8 $1.6 $1.6 $1.7 $1.7 $1.8 $1.9 $2.1 $2.2 2014E 2015E 2016E 2017E
$7.7 ($ in billions) 2013 Light Vehicle Industry Sales: $7.3 billion
China 7.8% #2 PPG Axalta, 19% BASF Kansai Nippon KCC Other $8.1 $8.5
$8.9 ’14E – ‘17E CAGR Refinish Commercial Vehicle Performance Coatings
Transportation Coatings Light Vehicle Industrial
Axalta Coating Systems
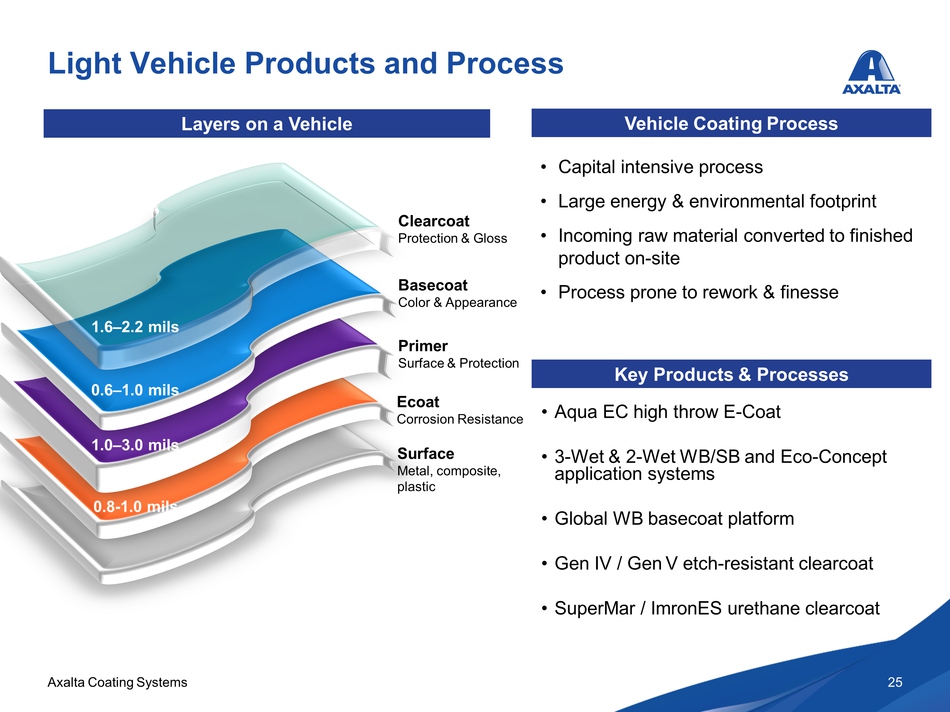
Light Vehicle Products and Process Layers on a Vehicle Key Products &
Processes 25 Vehicle Coating Process • Capital intensive process • Large
energy & environmental footprint • Incoming raw material converted to
finished product on-site • Process prone to rework & finesse Surface
Metal, composite, plastic Ecoat Corrosion Resistance Primer Surface &
Protection Basecoat Color & Appearance Clearcoat Protection & Gloss
1.6–2.2 mils 0.6–1.0 mils 1.0–3.0 mils 0.8-1.0 mils • Aqua EC high throw
E-Coat • 3-Wet & 2-Wet WB/SB and Eco-Concept application systems •
Global WB basecoat platform • Gen IV / Gen V etch-resistant clearcoat •
SuperMar / ImronES urethane clearcoat
Axalta Coating Systems
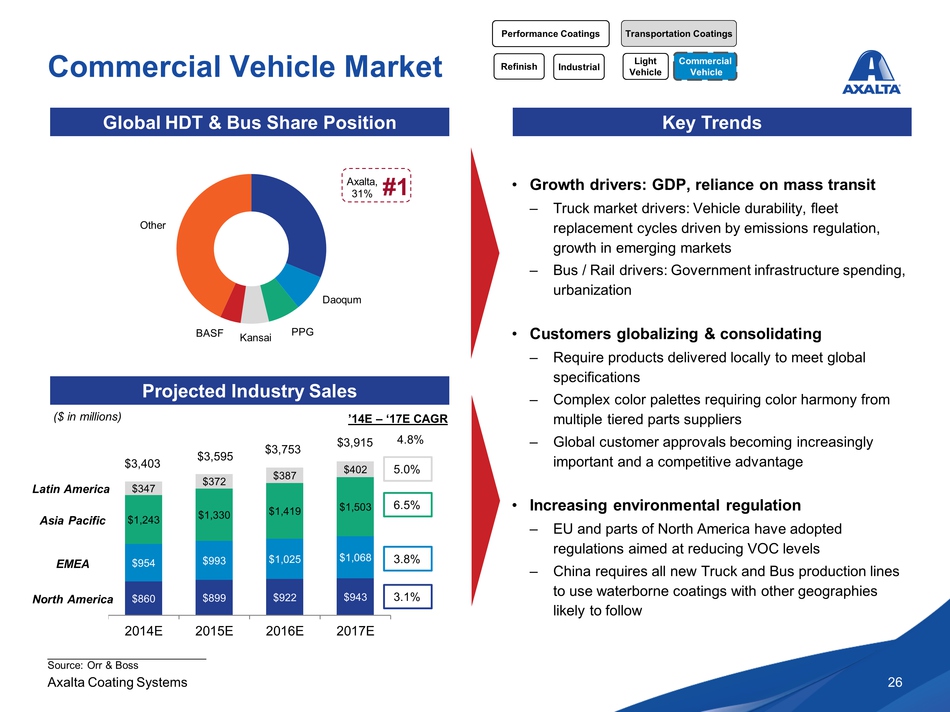
Commercial Vehicle Market 26 Global HDT & Bus Share Position Key Trends
Projected Industry Sales ($ in millions) Asia Pacific EMEA North America
5.0% 6.5% 3.8% 3.1% 4.8% $860 $899 $922 $943 $954 $993 $1,025 $1,068
$1,243 $1,330 $1,419 $1,503 $347 $372 $387 $402 2014E 2015E 2016E 2017E
$3,403 $3,595 $3,753 ’14E – ‘17E CAGR Axalta, 31% Daoqum BASF Kansai PPG
Other #1 $3,915 Source: Orr & Boss Latin America • Growth drivers: GDP,
reliance on mass transit – Truck market drivers: Vehicle durability,
fleet replacement cycles driven by emissions regulation, growth in
emerging markets – Bus / Rail drivers: Government infrastructure
spending, urbanization • Customers globalizing & consolidating – Require
products delivered locally to meet global specifications – Complex color
palettes requiring color harmony from multiple tiered parts suppliers –
Global customer approvals becoming increasingly important and a
competitive advantage • Increasing environmental regulation – EU and
parts of North America have adopted regulations aimed at reducing VOC
levels – China requires all new Truck and Bus production lines to use
waterborne coatings with other geographies likely to follow Refinish
Light Vehicle Performance Coatings Transportation Coatings Commercial
Industrial Vehicle
Axalta Coating Systems
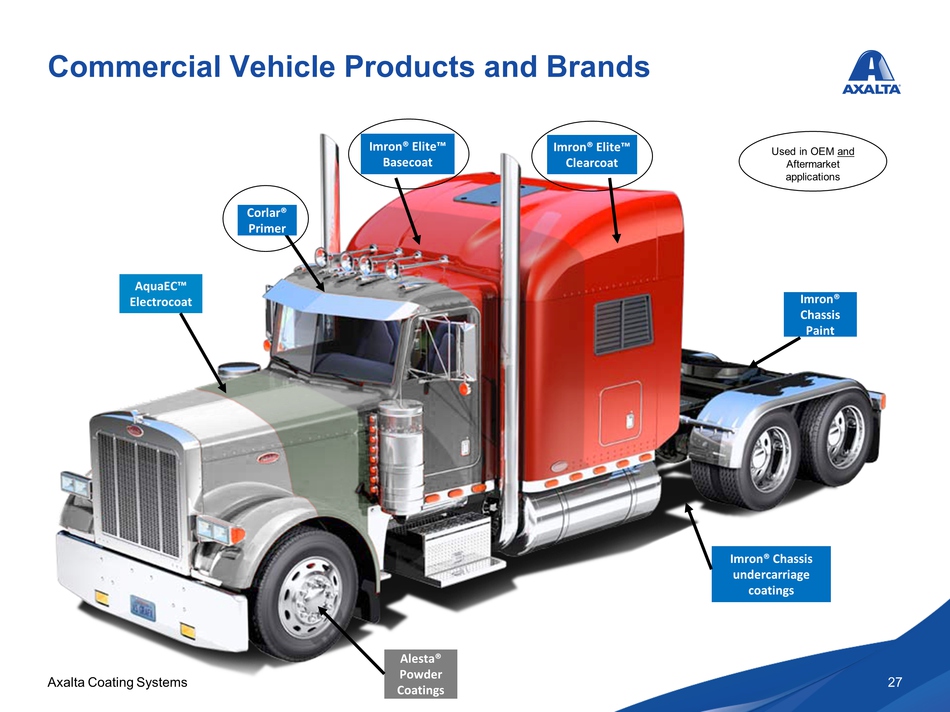
Commercial Vehicle Products and Brands 27 Imron® Elite™ Basecoat Imron®
Elite™ Clearcoat AquaEC™ Electrocoat Imron® Chassis undercarriage
coatings Imron® Chassis Paint Alesta® Powder Coatings Used in OEM and
Aftermarket applications Corlar® Primer
Confidential Appendix B:
Financial Supplement & Disclosures
Axalta Coating Systems Full
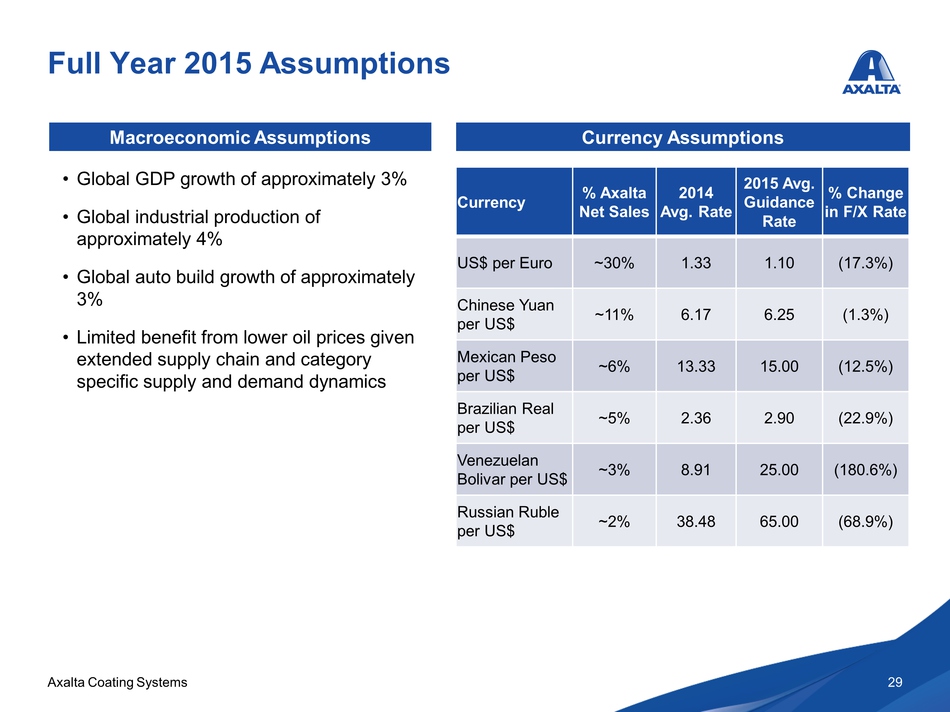
Year 2015 Assumptions 29 Currency % Axalta Net Sales 2014 Avg. Rate 2015
Avg. Guidance Rate % Change in F/X Rate US$ per Euro ~30% 1.33 1.10
(17.3%) Chinese Yuan per US$ ~11% 6.17 6.25 (1.3%) Mexican Peso per US$
~6% 13.33 15.00 (12.5%) Brazilian Real per US$ ~5% 2.36 2.90 (22.9%)
Venezuelan Bolivar per US$ ~3% 8.91 25.00 (180.6%) Russian Ruble per US$
~2% 38.48 65.00 (68.9%) • Global GDP growth of approximately 3% • Global
industrial production of approximately 4% • Global auto build growth of
approximately 3% • Limited benefit from lower oil prices given extended
supply chain and category specific supply and demand dynamics
Macroeconomic Assumptions Currency Assumptions
Axalta Coating Systems Q1
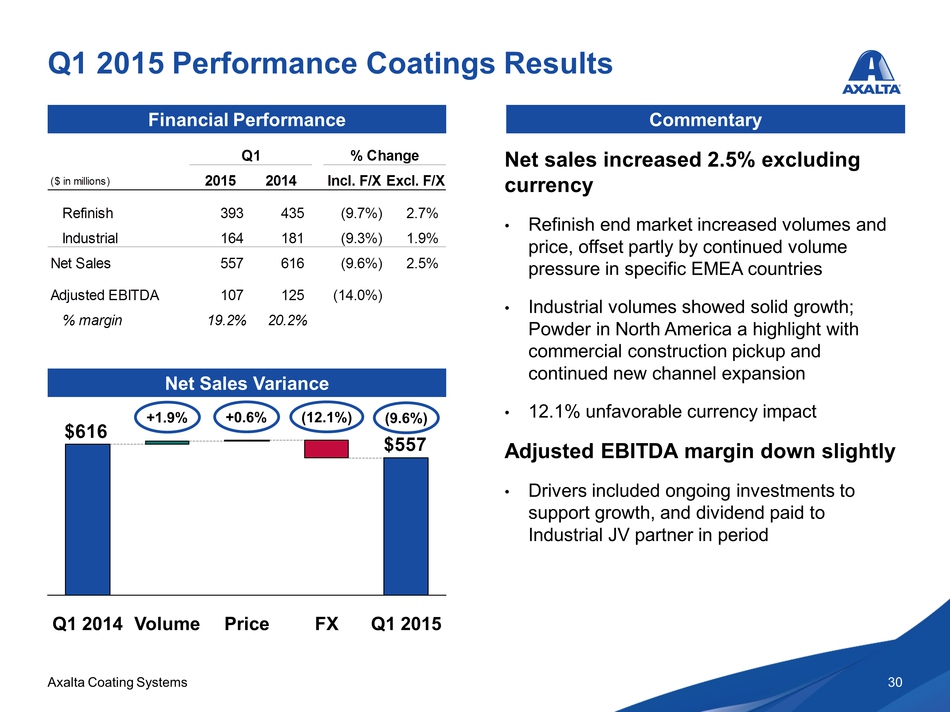
2015 Performance Coatings Results 30 Financial Performance Net sales
increased 2.5% excluding currency • Refinish end market increased
volumes and price, offset partly by continued volume pressure in
specific EMEA countries • Industrial volumes showed solid growth; Powder
in North America a highlight with commercial construction pickup and
continued new channel expansion • 12.1% unfavorable currency impact
Adjusted EBITDA margin down slightly • Drivers included ongoing
investments to support growth, and dividend paid to Industrial JV
partner in period Commentary Net Sales Variance +1.9% +0.6% (12.1%)
(9.6%) $616 $557 Q1 2014 Volume Price FX Q1 2015 ($ in millions) 2015
2014 Incl. F/X Excl. F/X Refinish 3 93 435 (9.7%) 2.7% Industrial 1 64
181 (9.3%) 1.9% Net Sales 5 57 616 (9.6%) 2.5% Adjusted EBITDA 1 07 125
(14.0%) % margin 19.2% 20.2% Q1 % Change
Axalta Coating Systems Q1
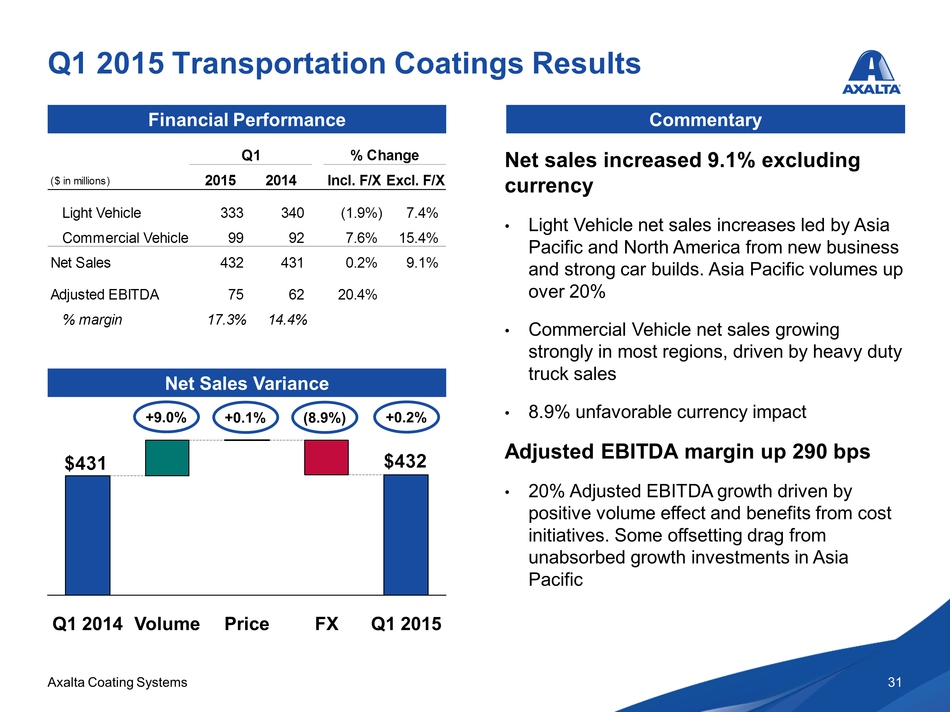
2015 Transportation Coatings Results 31 Financial Performance Commentary
Net sales increased 9.1% excluding currency • Light Vehicle net sales
increases led by Asia Pacific and North America from new business and
strong car builds. Asia Pacific volumes up over 20% • Commercial Vehicle
net sales growing strongly in most regions, driven by heavy duty truck
sales • 8.9% unfavorable currency impact Adjusted EBITDA margin up 290
bps • 20% Adjusted EBITDA growth driven by positive volume effect and
benefits from cost initiatives. Some offsetting drag from unabsorbed
growth investments in Asia Pacific Net Sales Variance +9.0% +0.1% (8.9%)
+0.2% $431 $432 Q1 2014 Volume Price FX Q1 2015 ($ in millions) 2015
2014 Incl. F/X Excl. F/X Light Vehicle 3 33 340 (1.9%) 7.4% Commercial
Vehicle 9 9 92 7.6% 15.4% Net Sales 4 32 431 0.2% 9.1% Adjusted EBITDA 7
5 62 20.4% % margin 17.3% 14.4% Q1 % Change
Axalta Coating Systems
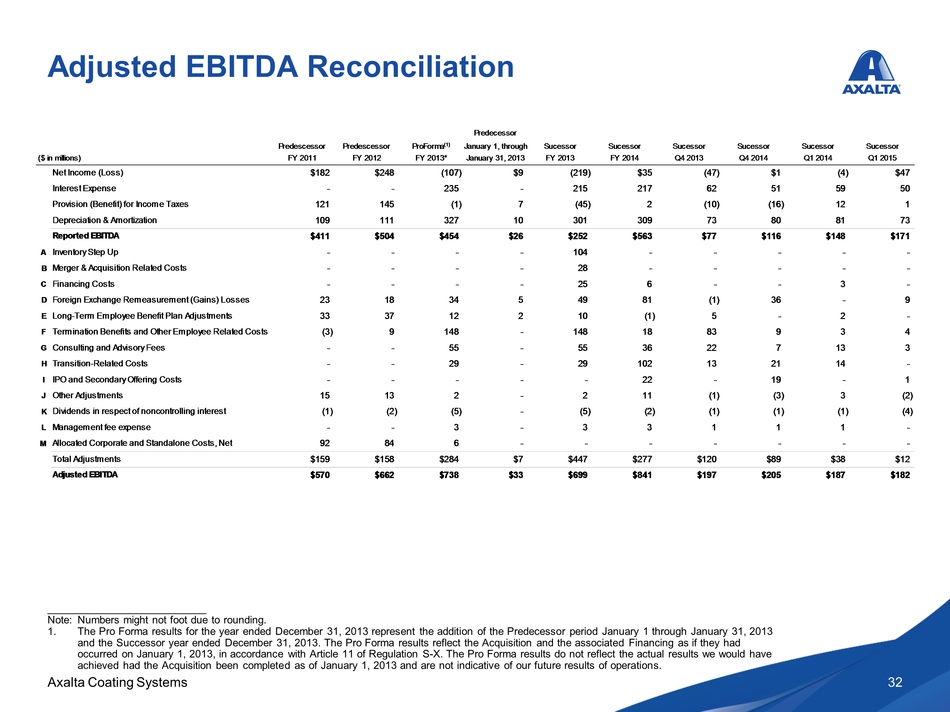
Adjusted EBITDA Reconciliation 32 Note: Numbers might not foot due to
rounding. 1. The Pro Forma results for the year ended December 31, 2013
represent the addition of the Predecessor period January 1 through
January 31, 2013 and the Successor year ended December 31, 2013. The Pro
Forma results reflect the Acquisition and the associated Financing as if
they had occurred on January 1, 2013, in accordance with Article 11 of
Regulation S-X. The Pro Forma results do not reflect the actual results
we would have achieved had the Acquisition been completed as of January
1, 2013 and are not indicative of our future results of operations.
Predecessor Predescessor Predescessor ProForma(1) January 1, through
Sucessor Sucessor Sucessor Sucessor Sucessor Sucessor ($ in millions) FY
2011 FY 2012 FY 2013* January 31, 2013 FY 2013 FY 2014 Q4 2013 Q4 2014
Q1 2014 Q1 2015 Net Income (Loss) $182 $248 (107) $9 (219) $35 (47) $1
(4) $47 Interest Expense - - 235 - 215 217 62 51 59 50 Provision
(Benefit) for Income Taxes 121 145 (1) 7 (45) 2 (10) (16) 12 1
Depreciation & Amortization 109 111 327 10 301 309 73 80 81 73 Reported
EBITDA $411 $504 $454 $26 $252 $563 $77 $116 $148 $171 A Inventory Step
Up - - - - 104 - - - - - B Merger & Acquisition Related Costs - - - - 28
- - - - - C Financing Costs - - - - 25 6 - - 3 - D Foreign Exchange
Remeasurement (Gains) Losses 23 18 34 5 49 81 (1) 36 - 9 E Long-Term
Employee Benefit Plan Adjustments 33 37 12 2 10 (1) 5 - 2 - F
Termination Benefits and Other Employee Related Costs (3) 9 148 - 148 18
83 9 3 4 G Consulting and Advisory Fees - - 55 - 55 36 22 7 13 3 H
Transition-Related Costs - - 29 - 29 102 13 21 14 - I IPO and Secondary
Offering Costs - - - - - 22 - 19 - 1 J Other Adjustments 15 13 2 - 2 11
(1) (3) 3 (2) K Dividends in respect of noncontrolling interest (1) (2)
(5) - (5) (2) (1) (1) (1) (4) L Management fee expense - - 3 - 3 3 1 1 1
- M Allocated Corporate and Standalone Costs, Net 92 84 6 - - - - - - -
Total Adjustments $159 $158 $284 $7 $447 $277 $120 $89 $38 $12 Adjusted
EBITDA $570 $662 $738 $33 $699 $841 $197 $205 $187 $182
Axalta Coating Systems 33
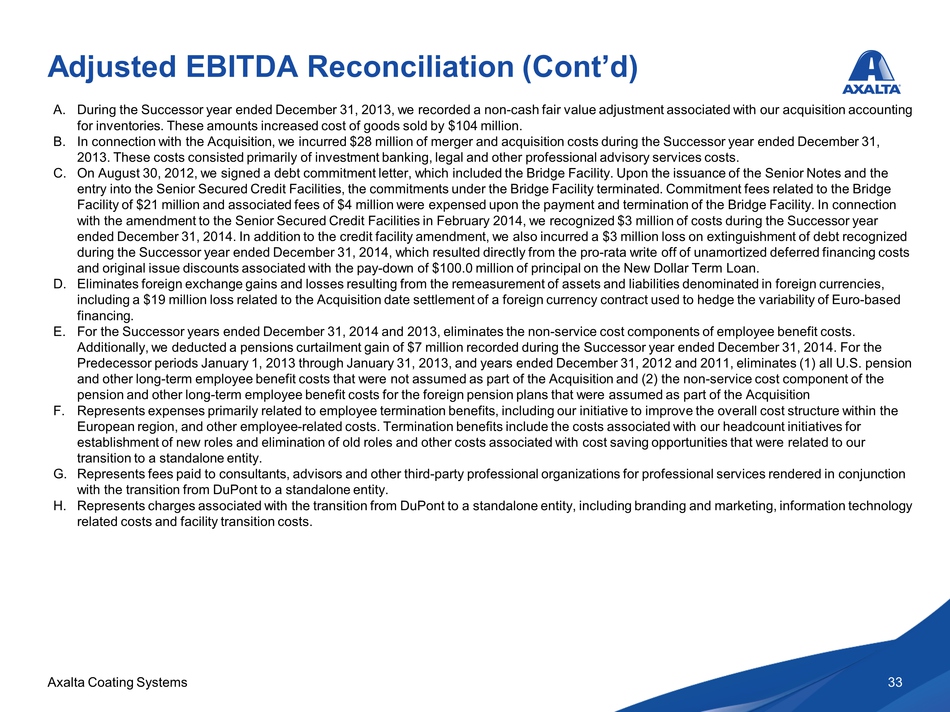
A. During the Successor year ended December 31, 2013, we recorded a
non-cash fair value adjustment associated with our acquisition
accounting for inventories. These amounts increased cost of goods sold
by $104 million. B. In connection with the Acquisition, we incurred $28
million of merger and acquisition costs during the Successor year ended
December 31, 2013. These costs consisted primarily of investment
banking, legal and other professional advisory services costs. C. On
August 30, 2012, we signed a debt commitment letter, which included the
Bridge Facility. Upon the issuance of the Senior Notes and the entry
into the Senior Secured Credit Facilities, the commitments under the
Bridge Facility terminated. Commitment fees related to the Bridge
Facility of $21 million and associated fees of $4 million were expensed
upon the payment and termination of the Bridge Facility. In connection
with the amendment to the Senior Secured Credit Facilities in February
2014, we recognized $3 million of costs during the Successor year ended
December 31, 2014. In addition to the credit facility amendment, we also
incurred a $3 million loss on extinguishment of debt recognized during
the Successor year ended December 31, 2014, which resulted directly from
the pro-rata write off of unamortized deferred financing costs and
original issue discounts associated with the pay-down of $100.0 million
of principal on the New Dollar Term Loan. D. Eliminates foreign exchange
gains and losses resulting from the remeasurement of assets and
liabilities denominated in foreign currencies, including a $19 million
loss related to the Acquisition date settlement of a foreign currency
contract used to hedge the variability of Euro-based financing. E. For
the Successor years ended December 31, 2014 and 2013, eliminates the
non-service cost components of employee benefit costs. Additionally, we
deducted a pensions curtailment gain of $7 million recorded during the
Successor year ended December 31, 2014. For the Predecessor periods
January 1, 2013 through January 31, 2013, and years ended December 31,
2012 and 2011, eliminates (1) all U.S. pension and other long-term
employee benefit costs that were not assumed as part of the Acquisition
and (2) the non-service cost component of the pension and other
long-term employee benefit costs for the foreign pension plans that were
assumed as part of the Acquisition F. Represents expenses primarily
related to employee termination benefits, including our initiative to
improve the overall cost structure within the European region, and other
employee-related costs. Termination benefits include the costs
associated with our headcount initiatives for establishment of new roles
and elimination of old roles and other costs associated with cost saving
opportunities that were related to our transition to a standalone
entity. G. Represents fees paid to consultants, advisors and other
third-party professional organizations for professional services
rendered in conjunction with the transition from DuPont to a standalone
entity. H. Represents charges associated with the transition from DuPont
to a standalone entity, including branding and marketing, information
technology related costs and facility transition costs. Adjusted EBITDA
Reconciliation (Cont’d)
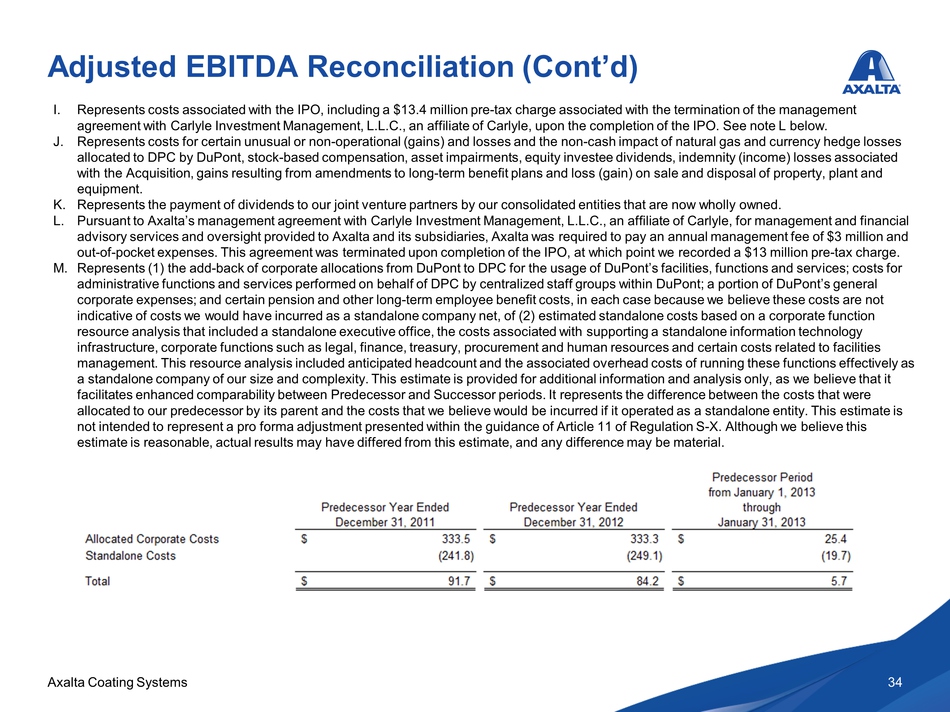
Axalta Coating Systems 34 I. Represents costs associated with the IPO, including a $13.4 million pre-tax charge associated with the termination of the management agreement with Carlyle Investment Management, L.L.C., an affiliate of Carlyle, upon the completion of the IPO. See note L below. J. Represents costs for certain unusual or non-operational (gains) and losses and the non-cash impact of natural gas and currency hedge losses allocated to DPC by DuPont, stock-based compensation, asset impairments, equity investee dividends, indemnity (income) losses associated with the Acquisition, gains resulting from amendments to long-term benefit plans and loss (gain) on sale and disposal of property, plant and equipment. K. Represents the payment of dividends to our joint venture partners by our consolidated entities that are now wholly owned. L. Pursuant to Axalta’s management agreement with Carlyle Investment Management, L.L.C., an affiliate of Carlyle, for management and financial advisory services and oversight provided to Axalta and its subsidiaries, Axalta was required to pay an annual management fee of $3 million and out-of-pocket expenses. This agreement was terminated upon completion of the IPO, at which point we recorded a $13 million pre-tax charge. M. Represents (1) the add-back of corporate allocations from DuPont to DPC for the usage of DuPont’s facilities, functions and services; costs for administrative functions and services performed on behalf of DPC by centralized staff groups within DuPont; a portion of DuPont’s general corporate expenses; and certain pension and other long-term employee benefit costs, in each case because we believe these costs are not indicative of costs we would have incurred as a standalone company net, of (2) estimated standalone costs based on a corporate function resource analysis that included a standalone executive office, the costs associated with supporting a standalone information technology infrastructure, corporate functions such as legal, finance, treasury, procurement and human resources and certain costs related to facilities management. This resource analysis included anticipated headcount and the associated overhead costs of running these functions effectively as a standalone company of our size and complexity. This estimate is provided for additional information and analysis only, as we believe that it facilitates enhanced comparability between Predecessor and Successor periods. It represents the difference between the costs that were allocated to our predecessor by its parent and the costs that we believe would be incurred if it operated as a standalone entity. This estimate is not intended to represent a pro forma adjustment presented within the guidance of Article 11 of Regulation S-X. Although we believe this estimate is reasonable, actual results may have differed from this estimate, and any difference may be material. Adjusted EBITDA Reconciliation (Cont’d)
Serious News for Serious Traders! Try StreetInsider.com Premium Free!
You May Also Be Interested In
- Axalta Irus Mix and Voltatex® 7345 A ECO Wire Enamel Win Silver 2024 Edison Awards™; Low Carbon Footprint Sustainable Coating System with Hyperdur® Primer and Chromadyne® Colorcoat Takes Bronze
- BlackRock® Canada Announces Final April Cash Distributions for the iShares® Premium Money Market ETF
- Global CIOs geared up to scale AI but organizations aren’t as ready
Create E-mail Alert Related Categories
SEC FilingsSign up for StreetInsider Free!
Receive full access to all new and archived articles, unlimited portfolio tracking, e-mail alerts, custom newswires and RSS feeds - and more!
