

Form 8-K ANGIODYNAMICS INC For: Jan 07
 Tweet
Tweet Share
ShareExhibit 99.1

PRESS RELEASE
Investor Contact:
AngioDynamics, Inc.
Stephen Trowbridge, Executive Vice President & CFO
(518) 795-1408
AngioDynamics Reports Fiscal 2021 Second Quarter Financial Results
Fiscal 2021 Second Quarter Highlights
|
•
|
Net sales of $72.8 million increased 4.0% compared to the prior-year quarter
|
|
•
|
Gross margin declined 410 basis points year over year to 55.2%
|
|
•
|
GAAP loss per share of $0.11 and adjusted earnings per share of $0.01
|
|
•
|
Cash and cash equivalents on November 30, 2020 were $58.0 million, compared to $47.9 million on August 31, 2020
|
|
•
|
The Company reaffirms its guidance of fiscal year 2021 net sales between $278 and $284 million and fiscal year 2021
adjusted earnings per share between $0.00 and $0.05
|
|
•
|
Today, the Company announced that it plans to launch its new multi-purpose mechanical aspiration thrombectomy device
in calendar year 2021.
|
Latham, New York, January 7, 2021 – AngioDynamics, Inc. (NASDAQ: ANGO), a leading
provider of innovative, minimally invasive medical devices for vascular access, peripheral vascular disease, and oncology, today announced financial results for the second quarter of fiscal year 2021, which ended November 30, 2020.
“I am very pleased with our performance in the second quarter, as sales execution and continued expense management drove strong revenue and
positive earnings,” commented Jim Clemmer, President and Chief Executive Officer of AngioDynamics, Inc. “AngioVac and Auryon performed well during the quarter, as we continue to focus on growing our key technology platforms while managing expenses
throughout the business. In the second half of the year, we expect ongoing COVID-related headwinds as
well as typical third-quarter seasonality, which is contemplated in our full-year guidance. We are excited about the planned launch of our
multi-purpose mechanical aspiration thrombectomy device in calendar 2021, as this new member of the AngioVac platform family will position us to serve the much larger addressable market of moderately complex thrombectomy cases, while AngioVac and
Uni-Fuse continue to address the complex and simple ends of the spectrum, respectively.”
Second Quarter 2021 Financial Results
Net sales for the second quarter of fiscal 2021 were $72.8 million, an increase of 4.0% compared to the prior-year quarter. Net sales in the
second quarter continued to be impacted by the disruption to procedure volumes resulting from the COVID-19 global pandemic. Foreign currency translation did not have a significant impact on the Company’s sales in the quarter.
• Vascular Interventions and Therapies (“VIT”) net sales were $33.9 million, an increase of 8.8%, compared to $31.2 million a year ago. Growth was driven by increased AngioVac sales over the
previous year, partially offset by a decline in sales of Venous products resulting from lower elective procedure volumes. Auryon sales during the quarter were $2.1 million.
• Oncology net sales were $14.9 million, a decrease of 7.0% from $16.0 million a year ago. The year-over-year decline was primarily attributable to lower capital sales, which were somewhat
offset by strong growth in sales of NanoKnife disposables, particularly in the United States.
• Vascular Access net sales were $23.9 million, an increase of 5.0% from $22.8 million a year ago.
U.S. net sales in the second quarter of fiscal 2021 were $60.7 million, an increase of 9.2% from $55.6 million a year ago. International net
sales were $12.1 million in the second quarter of fiscal 2021, a decrease of 16.3% from $14.4 million a year ago.
Gross margin for the second quarter of fiscal 2021 was 55.2%, a decline of 410 basis points compared to the second quarter of fiscal 2020. The
gross margin decline was primarily attributable to the Company’s previously discussed COVID-related operating plan. This plan included under-absorption of the Company’s manufacturing facilities related to additional COVID-related operating protocols
designed to ensure supply-chain security and employee safety. Additionally, during the second quarter, inventory was reduced by $3.2 million when compared to inventory levels on August 31, 2020. Since year end, inventory levels have been reduced by
$10.3 million.
The Company recorded a net loss of $4.3 million, or loss per share of $0.11, in the second quarter of fiscal 2021. This compares to net loss of
approximately $2.7 million, or loss per share of $0.07, a year ago.
Excluding the items shown in the non-GAAP reconciliation table below, adjusted net income for the second quarter of fiscal 2021 was $0.6 million
or adjusted earnings of $0.01 per share, compared to adjusted net income of $2.2 million, or adjusted earnings per share of $0.06, in the second quarter of fiscal 2020.
Adjusted EBITDA in the second quarter of fiscal 2021, excluding the items shown in the reconciliation table below, was $5.2 million, compared to
$6.4 million in the second quarter of fiscal 2020.
In the second quarter of fiscal 2021, the Company generated $11.5 million in operating cash and had capital expenditures of $1.4 million. As of
November 30, 2020, the Company had $58.0 million in cash and cash equivalents compared to $47.9 million in cash and cash equivalents on August 31, 2020. As of November 30, 2020, the Company had $40.0 million in debt outstanding, consistent with its
debt balance on August 31, 2020. Subsequent to quarter end, the Company repaid $10 million of its outstanding debt. Management remains focused on cash preservation amid the current environment.
Six Months Financial Results
For the six months ended November 30, 2020:
|
•
|
Net sales were $143.0 million, an increase of 5.1%, compared to $136.0 million for the same period a year ago.
|
|
•
|
The Company's net loss was $9.0 million, or a loss of $0.22 per share, compared to a net loss of $4.0 million, or a loss of $0.11 per
share, a year ago.
|
|
•
|
Gross margin decreased 550 basis points to 53.1% from 58.6% a
year ago due to the Company’s previously discussed COVID-related operating plan.
|
|
•
|
Excluding the items shown in the non-GAAP reconciliation table below, adjusted net income was $1.2 million, or $0.03 per share,
compared to adjusted net income of $5.3 million, or $0.14 per share, a year ago.
|
|
•
|
Adjusted EBITDA, excluding the items shown in the reconciliation table below, was $9.6 million, compared to $13.7 million for the same
period a year ago.
|
Fiscal Year 2021 Financial Guidance
The Company continues to expect fiscal year 2021 net sales in the range
of $278 to $284 million and fiscal year 2021 adjusted earnings per share in the range of $0.00 to $0.05.
Conference Call
The Company’s management will host a conference call today at 8:00 a.m. ET to discuss its fiscal 2021 second quarter results.
To participate in the conference call, dial 1-877-407-0784 (domestic) or +1-201-689-8560 (international) and refer to the passcode 13714154.
This conference call will also be webcast and can be accessed from the
“Investors” section of the AngioDynamics website at www.angiodynamics.com. The webcast replay of the call will be available at the same site approximately one hour after the end of the call.
A recording of the call will also be available from 11:00 a.m. ET on Thursday, January 7, 2021, until 11:59 p.m. ET on Thursday, January 14,
2021. To hear this recording, dial 1-844-512-2921 (domestic) or +1-412-317-6671 (international) and enter the passcode 13714154.
Use of Non-GAAP Measures
Management uses non-GAAP measures to establish operational goals and believes that non-GAAP measures may assist investors in analyzing the
underlying trends in AngioDynamics' business over time. Investors should consider these non-GAAP measures in addition to, not as a substitute for or as superior to, financial reporting measures prepared in accordance with GAAP. In this news release,
AngioDynamics has reported adjusted EBITDA, adjusted net income, adjusted earnings per share, and free cash flow. Management uses these measures in its internal analysis and review of operational performance. Management believes that these measures
provide investors with useful information in comparing AngioDynamics' performance over different periods. By using these non-GAAP measures, management believes that investors get a better picture of the performance of AngioDynamics' underlying
business. Management encourages investors to review AngioDynamics' financial results prepared in accordance with GAAP to understand AngioDynamics' performance taking into account all relevant factors, including those that may only occur from time to
time but have a material impact on AngioDynamics' financial results. Please see the tables that follow for a reconciliation of non-GAAP measures to measures prepared in accordance with GAAP.
About AngioDynamics, Inc.
AngioDynamics, Inc. is a leading provider of innovative, minimally
invasive medical devices used by professional healthcare providers for vascular access, peripheral vascular disease, and oncology. AngioDynamics’ diverse product lines include market-leading ablation systems, vascular access products, angiographic
products and accessories, drainage products, thrombolytic products and venous products. For more information, visit www.angiodynamics.com.
Safe Harbor
This release contains forward-looking statements within the meaning of the Private Securities Litigation Reform Act of 1995. All statements
regarding AngioDynamics' expected future financial position, results of operations, cash flows, business strategy, budgets, projected costs, capital expenditures, products, competitive positions, growth opportunities, plans and objectives of
management for future operations, as well as statements that include the words such as "expects," "reaffirms," "intends," "anticipates," "plans," "believes," "seeks," "estimates," "optimistic," or variations of such words and similar expressions, are
forward-looking statements. These forward-looking statements are not guarantees of future performance and are subject to risks and uncertainties. Investors are cautioned that actual events or results may differ from AngioDynamics' expectations.
Factors that may affect the actual results achieved by AngioDynamics include, without limitation, the scale and scope of the COVID-19 global pandemic, the ability of AngioDynamics to develop its existing and new products, technological advances and
patents attained by competitors, infringement of AngioDynamics' technology or assertions that AngioDynamics' technology infringes the technology of third parties, the ability of AngioDynamics to effectively compete against competitors that have
substantially greater resources, future actions by the FDA or other regulatory agencies, domestic and foreign health care reforms and government regulations, results of pending or future clinical trials, overall economic conditions, the results of
on-going litigation, challenges with respect to third-party distributors or joint venture partners or collaborators, the results of sales efforts, the effects of product recalls and product liability claims, changes in key personnel, the ability of
AngioDynamics to execute on strategic initiatives, the effects of economic, credit and capital market conditions, general market conditions, market acceptance, foreign currency exchange rate fluctuations, the effects on pricing from group purchasing
organizations and competition, the ability of AngioDynamics to integrate acquired businesses, as well as the risk factors listed from time to time in AngioDynamics' SEC filings, including but not limited to its Annual Report on Form 10-K for the year
ended May 31, 2020. AngioDynamics does not assume any obligation to publicly update or revise any forward-looking statements for any reason.
In the United States, the NanoKnife System has received a 510(k) clearance by the Food and Drug Administration for use in the surgical ablation
of soft tissue and is similarly approved for commercialization in Canada, the European Union, and Australia. The NanoKnife System has not been cleared for the treatment or therapy of a specific disease or condition.
|
ANGIODYNAMICS, INC. AND SUBSIDIARIES
|
|
CONSOLIDATED INCOME STATEMENTS
|
|
(in thousands, except per share data)
|
|
Three Months Ended
|
Six months ended
|
||||||||||||||
|
Nov 30, 2020
|
Nov 30, 2019
|
Nov 30, 2020
|
Nov 30, 2019
|
||||||||||||
|
(unaudited)
|
(unaudited)
|
||||||||||||||
|
Net sales
|
$
|
72,770
|
$
|
70,003
|
$
|
142,986
|
$
|
136,045
|
|||||||
|
Cost of sales (exclusive of intangible amortization)
|
32,596
|
28,459
|
67,048
|
56,284
|
|||||||||||
|
Gross profit
|
40,174
|
41,544
|
75,938
|
79,761
|
|||||||||||
|
% of net sales
|
55.2
|
%
|
59.3
|
%
|
53.1
|
%
|
58.6
|
%
|
|||||||
|
Operating expenses
|
|||||||||||||||
|
Research and development
|
9,712
|
7,764
|
18,721
|
14,055
|
|||||||||||
|
Sales and marketing
|
20,174
|
20,113
|
37,879
|
39,493
|
|||||||||||
|
General and administrative
|
9,219
|
10,994
|
17,776
|
19,448
|
|||||||||||
|
Amortization of intangibles
|
4,593
|
4,530
|
9,546
|
8,398
|
|||||||||||
|
Change in fair value of contingent consideration
|
184
|
145
|
(473)
|
(303)
|
|||||||||||
|
Acquisition, restructuring and other items, net
|
1,128
|
1,421
|
2,447
|
2,921
|
|||||||||||
|
Total operating expenses
|
45,010
|
44,967
|
85,896
|
84,012
|
|||||||||||
|
Operating loss
|
(4,836)
|
(3,423)
|
(9,958)
|
(4,251)
|
|||||||||||
|
Interest expense, net
|
(235)
|
(41)
|
(450)
|
(506)
|
|||||||||||
|
Other income (expense), net
|
(102)
|
162
|
422
|
64
|
|||||||||||
|
Total other income (expense), net
|
(337)
|
121
|
(28)
|
(442)
|
|||||||||||
|
Loss before income tax benefit
|
(5,173)
|
(3,302)
|
(9,986)
|
(4,693)
|
|||||||||||
|
Income tax benefit
|
(905)
|
(566)
|
(1,450)
|
(682)
|
|||||||||||
|
Net loss
|
$
|
(4,268)
|
$
|
(2,736)
|
$
|
(8,536)
|
$
|
(4,011)
|
|||||||
|
Loss per share
|
|||||||||||||||
|
Basic
|
$
|
(0.11)
|
$
|
(0.07)
|
$
|
(0.22)
|
$
|
(0.11)
|
|||||||
|
Diluted
|
$
|
(0.11)
|
$
|
(0.07)
|
$
|
(0.22)
|
$
|
(0.11)
|
|||||||
|
Weighted average shares outstanding
|
|||||||||||||||
|
Basic
|
38,327
|
37,992
|
38,242
|
37,887
|
|||||||||||
|
Diluted
|
38,327
|
37,992
|
38,242
|
37,887
|
|||||||||||
|
ANGIODYNAMICS, INC. AND SUBSIDIARIES
|
|
GAAP TO NON-GAAP RECONCILIATION
|
|
(in thousands, except per share data)
|
|
Reconciliation of Net Loss to non-GAAP Adjusted Net Income:
|
|||||||||||||||
|
Three Months Ended
|
Six months ended
|
||||||||||||||
|
Nov 30, 2020
|
Nov 30, 2019
|
Nov 30, 2020
|
Nov 30, 2019
|
||||||||||||
|
(unaudited)
|
(unaudited)
|
||||||||||||||
|
Net loss
|
$
|
(4,268)
|
$
|
(2,736)
|
$
|
(8,536)
|
$
|
(4,011)
|
|||||||
|
Amortization of intangibles
|
4,593
|
4,530
|
9,546
|
8,398
|
|||||||||||
|
Change in fair value of contingent consideration
|
184
|
145
|
(473)
|
(303)
|
|||||||||||
|
Acquisition, restructuring and other items, net (1)
|
1,128
|
1,421
|
2,447
|
2,921
|
|||||||||||
|
Write-off of deferred financing fees (2)
|
—
|
—
|
—
|
593
|
|||||||||||
|
Tax effect of non-GAAP items (3)
|
(1,073)
|
(1,209)
|
(1,803)
|
(2,273)
|
|||||||||||
|
Adjusted net income
|
$
|
564
|
$
|
2,151
|
$
|
1,181
|
$
|
5,325
|
|||||||
|
Reconciliation of Diluted Loss Per Share to non-GAAP Adjusted Diluted Earnings Per Share:
|
|||||||||||||||
|
Three Months Ended
|
Six months ended
|
||||||||||||||
|
Nov 30, 2020
|
Nov 30, 2019
|
Nov 30, 2020
|
Nov 30, 2019
|
||||||||||||
|
(unaudited)
|
(unaudited)
|
||||||||||||||
|
Diluted loss per share
|
$
|
(0.11)
|
$
|
(0.07)
|
$
|
(0.22)
|
$
|
(0.11)
|
|||||||
|
Amortization of intangibles
|
0.12
|
0.12
|
0.25
|
0.22
|
|||||||||||
|
Change in fair value of contingent consideration
|
—
|
—
|
(0.01)
|
(0.01)
|
|||||||||||
|
Acquisition, restructuring and other items, net (1)
|
0.03
|
0.04
|
0.06
|
0.08
|
|||||||||||
|
Write-off of deferred financing fees (2)
|
—
|
—
|
—
|
0.02
|
|||||||||||
|
Tax effect of non-GAAP items (3)
|
(0.03)
|
(0.03)
|
(0.05)
|
(0.06)
|
|||||||||||
|
Adjusted diluted earnings per share
|
$
|
0.01
|
$
|
0.06
|
$
|
0.03
|
$
|
0.14
|
|||||||
|
Adjusted diluted sharecount
|
38,473
|
38,092
|
38,503
|
38,120
|
|||||||||||
|
(1) Includes costs related to merger and acquisition activities, restructuring, and unusual items, including asset impairments and
write-offs, certain litigation, and other items.
|
|
(2) Deferred financing fees related to the old credit agreement were written off during the first quarter of fiscal year 2020.
|
|
(3) Adjustment to reflect the income tax provision on a non-GAAP basis has been calculated assuming no valuation allowance on the Company's U.S.
deferred tax assets and an effective tax rate of 23% for November 30, 2020 and 2019.
|
|
ANGIODYNAMICS, INC. AND SUBSIDIARIES
|
|
GAAP TO NON-GAAP RECONCILIATION (Continued)
|
|
(in thousands, except per share data)
|
|
Reconciliation of Net Loss to Adjusted EBITDA:
|
||||||||||||||||
|
Three Months Ended
|
Six months ended
|
|||||||||||||||
|
Nov 30, 2020
|
Nov 30, 2019
|
Nov 30, 2020
|
Nov 30, 2019
|
|||||||||||||
|
(unaudited)
|
(unaudited)
|
|||||||||||||||
|
Net loss
|
$
|
(4,268)
|
$
|
(2,736)
|
$
|
(8,536)
|
$
|
(4,011)
|
||||||||
|
Income tax benefit
|
(905)
|
(566)
|
(1,450)
|
(682)
|
||||||||||||
|
Interest expense, net
|
235
|
41
|
450
|
506
|
||||||||||||
|
Depreciation and amortization
|
6,397
|
5,863
|
12,936
|
11,033
|
||||||||||||
|
Change in fair value of contingent consideration
|
184
|
145
|
(473)
|
(303)
|
||||||||||||
|
Stock based compensation
|
2,387
|
2,242
|
4,251
|
4,226
|
||||||||||||
|
Acquisition, restructuring and other items, net (1)
|
1,128
|
1,421
|
2,447
|
2,921
|
||||||||||||
|
Adjusted EBITDA
|
$
|
5,158
|
$
|
6,410
|
$
|
9,625
|
$
|
13,690
|
||||||||
|
Per diluted share:
|
||||||||||||||||
|
Adjusted EBITDA
|
$
|
0.13
|
$
|
0.17
|
$
|
0.25
|
$
|
0.36
|
||||||||
|
(1) Includes costs related to merger and acquisition activities, restructuring, and unusual items, including asset impairments and
write-offs, certain litigation, and other items.
|
||||||||||||||||
|
ANGIODYNAMICS, INC. AND SUBSIDIARIES
|
|
NET SALES BY PRODUCT CATEGORY AND BY GEOGRAPHY
|
|
(in thousands)
|
|
Three Months Ended
|
Six months ended
|
||||||||||||||||||||||||||
|
Nov 30, 2020
|
Nov 30, 2019
|
% Growth
|
Currency Impact
|
Constant Currency Growth
|
Nov 30, 2020
|
Nov 30, 2019
|
% Growth
|
Currency Impact
|
Constant Currency Growth
|
||||||||||||||||||
|
(unaudited)
|
(unaudited)
|
||||||||||||||||||||||||||
|
Net Sales by Product Category
|
|||||||||||||||||||||||||||
|
Vascular Interventions & Therapies
|
$
|
33,900
|
$
|
31,150
|
8.8%
|
$
|
63,757
|
$
|
60,063
|
6.2%
|
|||||||||||||||||
|
Vascular Access
|
23,930
|
22,784
|
5.0%
|
52,035
|
45,943
|
13.3%
|
|||||||||||||||||||||
|
Oncology
|
14,940
|
16,069
|
(7.0)%
|
27,194
|
30,039
|
(9.5)%
|
|||||||||||||||||||||
|
$
|
72,770
|
$
|
70,003
|
4.0%
|
(0.3)%
|
3.7%
|
$
|
142,986
|
$
|
136,045
|
5.1%
|
(0.2)%
|
4.9%
|
||||||||||||||
|
—
|
—
|
||||||||||||||||||||||||||
|
Net Sales by Geography
|
|||||||||||||||||||||||||||
|
United States
|
$
|
60,684
|
$
|
55,555
|
9.2%
|
$
|
114,792
|
$
|
108,492
|
5.8%
|
|||||||||||||||||
|
International
|
12,086
|
14,448
|
(16.3)%
|
(1.3)%
|
(17.6)%
|
28,194
|
27,553
|
2.3%
|
(0.8)%
|
1.5%
|
|||||||||||||||||
|
$
|
72,770
|
$
|
70,003
|
4.0%
|
(0.3)%
|
3.7%
|
$
|
142,986
|
$
|
136,045
|
5.1%
|
(0.2)%
|
4.9%
|
||||||||||||||
|
ANGIODYNAMICS, INC. AND SUBSIDIARIES
|
|
CONSOLIDATED BALANCE SHEETS
|
|
(in thousands)
|
|
Nov 30, 2020
|
May 31, 2020
|
||||||
|
(unaudited)
|
(audited)
|
||||||
|
Assets
|
|||||||
|
Current assets:
|
|||||||
|
Cash and cash equivalents
|
$
|
58,025
|
$
|
54,435
|
|||
|
Accounts receivable, net
|
33,604
|
31,263
|
|||||
|
Inventories
|
49,582
|
59,905
|
|||||
|
Prepaid expenses and other
|
8,493
|
7,310
|
|||||
|
Total current assets
|
149,704
|
152,913
|
|||||
|
Property, plant and equipment, net
|
29,628
|
28,312
|
|||||
|
Other assets
|
17,513
|
15,338
|
|||||
|
Intangible assets, net
|
190,559
|
197,136
|
|||||
|
Goodwill
|
201,117
|
200,515
|
|||||
|
Total assets
|
$
|
588,521
|
$
|
594,214
|
|||
|
Liabilities and stockholders' equity
|
|||||||
|
Current liabilities:
|
|||||||
|
Accounts payable
|
$
|
15,979
|
$
|
19,096
|
|||
|
Accrued liabilities
|
27,610
|
29,380
|
|||||
|
Current portion of contingent consideration
|
—
|
836
|
|||||
|
Other current liabilities
|
2,223
|
2,133
|
|||||
|
Total current liabilities
|
45,812
|
51,445
|
|||||
|
Long-term debt, net of current portion
|
40,000
|
40,000
|
|||||
|
Contingent consideration, net of current portion
|
15,178
|
14,811
|
|||||
|
Deferred income taxes
|
23,018
|
24,057
|
|||||
|
Other long-term liabilities
|
10,170
|
9,029
|
|||||
|
Total liabilities
|
134,178
|
139,342
|
|||||
|
Stockholders' equity
|
454,343
|
454,872
|
|||||
|
Total Liabilities and Stockholders' Equity
|
$
|
588,521
|
$
|
594,214
|
|||
|
ANGIODYNAMICS, INC. AND SUBSIDIARIES
|
|
CONSOLIDATED STATEMENTS OF CASH FLOWS
|
|
(in thousands)
|
|
Three Months Ended
|
Six months ended
|
||||||||||||||
|
Nov 30, 2020
|
Nov 30, 2019
|
Nov 30, 2020
|
Nov 30, 2019
|
||||||||||||
|
(unaudited)
|
(unaudited)
|
||||||||||||||
|
Cash flows from operating activities:
|
|||||||||||||||
|
Net loss
|
$
|
(4,268)
|
$
|
(2,736)
|
$
|
(8,536)
|
$
|
(4,011)
|
|||||||
|
Adjustments to reconcile net loss to net cash provided by (used in) operating activities:
|
|||||||||||||||
|
Depreciation and amortization
|
6,436
|
5,903
|
13,013
|
11,110
|
|||||||||||
|
Non-cash lease expense
|
599
|
904
|
1,265
|
904
|
|||||||||||
|
Stock based compensation
|
2,387
|
2,242
|
4,251
|
4,226
|
|||||||||||
|
Change in fair value of contingent consideration
|
184
|
145
|
(473)
|
(303)
|
|||||||||||
|
Deferred income taxes
|
(933)
|
(559)
|
(1,553)
|
(734)
|
|||||||||||
|
Change in accounts receivable allowances
|
(431)
|
652
|
29
|
199
|
|||||||||||
|
Fixed and intangible asset impairments and disposals
|
90
|
270
|
180
|
369
|
|||||||||||
|
Write-off of other assets
|
—
|
—
|
—
|
593
|
|||||||||||
|
Other
|
202
|
(19)
|
(230)
|
(27)
|
|||||||||||
|
Changes in operating assets and liabilities, net of acquisitions:
|
|||||||||||||||
|
Accounts receivable
|
425
|
(2,010)
|
(2,281)
|
9,464
|
|||||||||||
|
Inventories
|
3,281
|
(4,856)
|
10,528
|
(10,009)
|
|||||||||||
|
Prepaid expenses and other
|
(2,764)
|
(2,798)
|
(6,323)
|
(3,544)
|
|||||||||||
|
Accounts payable, accrued and other liabilities
|
6,240
|
8,799
|
(3,847)
|
(8,834)
|
|||||||||||
|
Net cash provided by (used in) operating activities
|
11,448
|
5,937
|
6,023
|
(597)
|
|||||||||||
|
Cash flows from investing activities:
|
|||||||||||||||
|
Additions to property, plant and equipment
|
(1,361)
|
(2,623)
|
(3,185)
|
(4,014)
|
|||||||||||
|
Acquisition of intangibles
|
—
|
(200)
|
—
|
(350)
|
|||||||||||
|
Cash paid in acquisition
|
—
|
(45,760)
|
—
|
(45,760)
|
|||||||||||
|
Net cash used in investing activities
|
(1,361)
|
(48,583)
|
(3,185)
|
(50,124)
|
|||||||||||
|
Cash flows from financing activities:
|
|||||||||||||||
|
Repayment of long-term debt
|
—
|
—
|
—
|
(132,500)
|
|||||||||||
|
Deferred financing costs on long-term debt
|
—
|
—
|
—
|
(741)
|
|||||||||||
|
Payment of acquisition related contingent consideration
|
—
|
—
|
—
|
(1,208)
|
|||||||||||
|
Proceeds (outlays) from exercise of stock options and employee stock purchase plan
|
(10)
|
—
|
481
|
(1,300)
|
|||||||||||
|
Net cash provided by (used in) financing activities
|
(10)
|
—
|
481
|
(135,749)
|
|||||||||||
|
Effect of exchange rate changes on cash and cash equivalents
|
19
|
244
|
271
|
76
|
|||||||||||
|
Increase (decrease) in cash and cash equivalents
|
10,096
|
(42,402)
|
3,590
|
(186,394)
|
|||||||||||
|
Cash and cash equivalents at beginning of period
|
47,929
|
83,649
|
54,435
|
227,641
|
|||||||||||
|
Cash and cash equivalents at end of period
|
$
|
58,025
|
$
|
41,247
|
$
|
58,025
|
$
|
41,247
|
|||||||
|
ANGIODYNAMICS, INC. AND SUBSIDIARIES
|
|
GAAP TO NON-GAAP RECONCILIATION
|
|
(in thousands)
|
|
Reconciliation of Free Cash Flows:
|
|||||||||||||||
|
Three Months Ended
|
Six months ended
|
||||||||||||||
|
Nov 30, 2020
|
Nov 30, 2019
|
Nov 30, 2020
|
Nov 30, 2019
|
||||||||||||
|
(unaudited)
|
(unaudited)
|
||||||||||||||
|
Net cash provided by (used in) operating activities
|
$
|
11,448
|
$
|
5,937
|
$
|
6,023
|
$
|
(597)
|
|||||||
|
Additions to property, plant and equipment
|
(1,361)
|
(2,623)
|
(3,185)
|
(4,014)
|
|||||||||||
|
Free Cash Flow
|
$
|
10,087
|
$
|
3,314
|
$
|
2,838
|
$
|
(4,611)
|
|||||||
Exhibit 99.2

ANGIODYNAMICS Second Quarter 2021 Earnings PresentationJanuary 7, 2021 1

2 Forward-Looking Statement Notice Regarding Forward-Looking StatementsThis presentation contains
forward-looking statements within the meaning of the Private Securities Litigation Reform Act of 1995. All statements regarding AngioDynamics’ expected future financial position, results of operations, cash flows, business strategy, budgets,
projected costs, capital expenditures, products, competitive positions, growth opportunities, plans and objectives of management for future operations, as well as statements that include the words such as “expects,” “reaffirms,” “intends,”
“anticipates,” “plans,” “believes,” “seeks,” “estimates,” “optimistic,” or variations of such words and similar expressions, are forward-looking statements. These forward-looking statements are not guarantees of future performance and are
subject to risks and uncertainties. Investors are cautioned that actual events or results may differ from AngioDynamics’ expectations. Factors that may affect the actual results achieved by AngioDynamics include, without limitation, the scale
and scope of the COVID-19 global pandemic, the ability of AngioDynamics to develop its existing and new products, technological advances and patents attained by competitors, infringement of AngioDynamics’ technology or assertions that
AngioDynamics’ technology infringes the technology of third parties, the ability of AngioDynamics to effectively compete against competitors that have substantially greater resources, future actions by the FDA or other regulatory agencies,
domestic and foreign health care reforms and government regulations, results of pending or future clinical trials, overall economic conditions, the results of on-going litigation, challenges with respect to third-party distributors or joint
venture partners or collaborators, the results of sales efforts, the effects of product recalls and product liability claims, changes in key personnel, the ability of AngioDynamics to execute on strategic initiatives, the effects of economic,
credit and capital market conditions, general market conditions, market acceptance, foreign currency exchange rate fluctuations, the effects on pricing from group purchasing organizations and competition, the ability of AngioDynamics to
integrate acquired businesses, as well as the risk factors listed from time to time in AngioDynamics’ SEC filings, including but not limited to its Annual Report on Form 10-K for the year ended May 31, 2020. AngioDynamics does not assume any
obligation to publicly update or revise any forward-looking statements for any reason.In the United States, the NanoKnife System has received a 510(k) clearance by the Food and Drug Administration for use in the surgical ablation of soft
tissue, and is similarly approved for commercialization in Canada, the European Union and Australia. The NanoKnife System has not been cleared for the treatment or therapy of a specific disease or condition.Notice Regarding Non-GAAP Financial
MeasuresManagement uses non-GAAP measures to establish operational goals and believes that non-GAAP measures may assist investors in analyzing the underlying trends in AngioDynamics’ business over time. Investors should consider these non-GAAP
measures in addition to, not as a substitute for or as superior to, financial reporting measures prepared in accordance with GAAP. In this presentation, AngioDynamics has reported adjusted EBITDA (income before interest, taxes, depreciation and
amortization and stock-based compensation); adjusted net income; adjusted earnings per share and free cash flow. Management uses these measures in its internal analysis and review of operational performance. Management believes that these
measures provide investors with useful information in comparing AngioDynamics’ performance over different periods. By using these non-GAAP measures, management believes that investors get a better picture of the performance of AngioDynamics’
underlying business. Management encourages investors to review AngioDynamics’ financial results prepared in accordance with GAAP to understand AngioDynamics’ performance taking into account all relevant factors, including those that may only
occur from time to time but have a material impact on AngioDynamics’ financial results. Please see the tables that follow for a reconciliation of non-GAAP measures to measures prepared in accordance with GAAP.
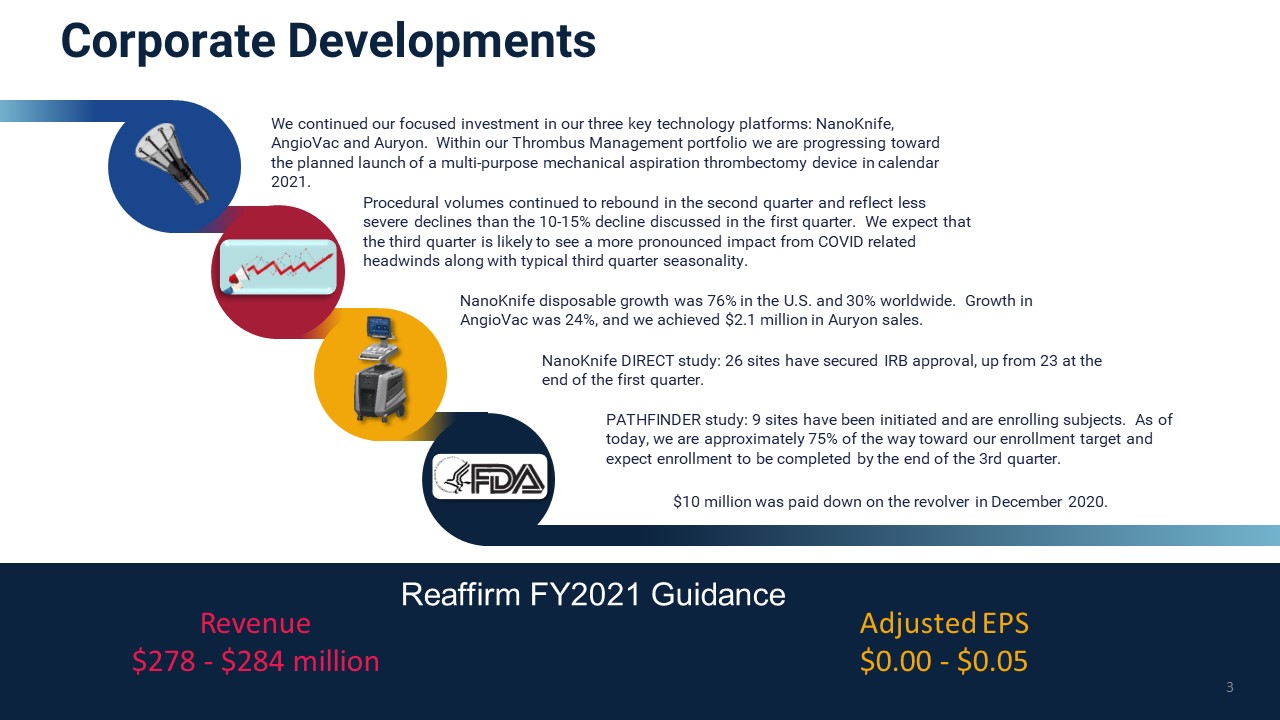
Corporate Developments FY2021 Guidance 3 NanoKnife disposable growth was 76% in the
U.S. and 30% worldwide. Growth in AngioVac was 24%, and we achieved $2.1 million in Auryon sales. Procedural volumes continued to rebound in the second quarter and reflect less severe declines than the 10-15% decline discussed in the first
quarter. We expect that the third quarter is likely to see a more pronounced impact from COVID related headwinds along with typical third quarter seasonality. We continued our focused investment in our three key technology platforms:
NanoKnife, AngioVac and Auryon. Within our Thrombus Management portfolio we are progressing toward the planned launch of a multi-purpose mechanical aspiration thrombectomy device in calendar 2021. NanoKnife DIRECT study: 26 sites have secured
IRB approval, up from 23 at the end of the first quarter. Reaffirm FY2021 Guidance Revenue$278 - $284 million Adjusted EPS$0.00 - $0.05 $10 million was paid down on the revolver in December 2020. Pathfinder study: 9 sites have been
initiated and are enrolling subjects. As of today, we are approximately 75% of the way toward our enrollment target and expect enrollment to be completed by the end of the 3rd quarter.

Second Quarter FY2021 Highlights $ in thousands (except per share data) Q2 FY2021 Q2 FY2020 YOY
Change Revenue $72,770 $70,003 4.0% Gross Margin 55.2% 59.3% (410 bps) Adjusted EPS $0.01 $0.06 ($0.05) Adjusted EBITDA $5,158 $6,410 ($1,252) Cash Provided by Operations $11,448 $5,937 $5,511 Free Cash
Flow $10,087 $3,314 $6,773 Financial Performance Vascular Interventions and Therapies Q2 FY2021 YTD FY2021 AngioVac® 24% 34% Auryon NA NA Thrombolytic 4% (2%) Core Peripheral 4% 2% Venous Insufficiency 11% (13%) Product
Family Sales Growth Vascular Access Q2 FY2021 YTD FY2021 Midlines 17% 53% C3 NA NA PICCs 2% 24% Ports 3% (1%) Dialysis 6% 2% Oncology Q2 FY2021 YTD FY2021 NanoKnife® Capital (50%) (56%) NanoKnife®
Disposables 30% 12% Solero® Microwave 7% 7% BioSentry 28% 28% Alatus and IsoLoc Balloons (22%) (27%) RadioFrequency Ablation (19%) (24%)

Second Quarter FY2021 Results (unaudited) $ in thousands (except per share data) Q2 FY2021 Q2
FY2020 Change YTD FY2021 YTD FY2020 Change Revenue Vascular Interventions and Therapies Vascular Access Oncology United States
International $72,770$33,900$23,930$14,940$60,684$12,086 $70,003$31,150$22,784$16,069$55,555$14,448 4.0%8.8%5.0%(7.0%)9.2%(16.3%) $142,986$63,757$52,035$27,194$114,792$28,194 $136,045$60,063$45,943$30,039$108,492$27,553 5.1%6.2%13.3%(9.5%)5.8%2.3% Net
LossNon-GAAP Adjusted Net Income ($4,268)$564 ($2,736)$2,151 ($1,532)($1,587) ($8,536)$1,181 ($4,011)$5,325 ($4,525)($4,144) GAAP EPSNon-GAAP Adjusted
EPS ($0.11)$0.01 ($0.07)$0.06 ($0.04)($0.05) ($0.22)$0.03 ($0.11)$0.14 ($0.11)($0.11) Gross Margin 55.2% 59.3% 410 bps 53.1% 58.6% 550 bps Adjusted EBITDA $5,158 $6,410 ($1,252) $9,625 $13,690 ($4,065) Free Cash
Flow $10,087 $3,314 $6,773 $2,838 ($4,611) $7,449 $ in thousands (except per share data) Q2 FY2021 Q4 FY2020 Change Cash $58,025 $54,435 $3,590 Debt $40,000 $40,000 $0 5

GAAP to Non-GAAP Reconciliation 6

Reconciliation of GAAP to Non-GAAP Net Income (Loss) and EPS Reconciliation of Net Loss to Adjusted
EBITDA Includes costs related to merger and acquisition activities, restructurings, and unusual items, including asset impairments and write-offs, certain litigation, and other items.Deferred financing fees related to the old credit agreement
were written off during the second quarter of fiscal year 2020.Adjustment to reflect the income tax provision on a non-GAAP basis has been calculated assuming no valuation allowance on the Company's U.S. deferred tax assets and an effective tax
rate of 23% for November 30, 2020 and 2019. 7

ANGIODYNAMICS Thrombus Management Portfolio Update 8

9 Deep Vein ThrombosisDVT + Pulmonary EmbolismPE = Venous ThromboembolismVTE A blood clot that
forms in a deep vein, usually the leg, groin or arm A DVT breaks free from a vein wall and travels to the lungs blocking some or all of the blood supply DVT and PE are collectively referred to as VTE 208,000 Iliofemoral Cases1 171,000
High-risk & intermediate-risk PE Cases1 100,000 – 300,000 VTE-Related Deaths in the USA Annually2 Stages of Clot Clot in Transit (traveling through the heart) Clot in Pulmonary Arteries (PE) 1. Plovanic, W. J., &
Furlong, C. (2020, June). Inari Medical Biomedical Devices and Services. Canaccord Genuity Capital Markets.2. “Venous Thromboembolism (VTE).” World Thrombosis Day, www.worldthrombosisday.org/issue/vte. Illustrations and Images not Produced by
AngioDynamics Include:https://www.vascularmedcure.com/disease-backgroundDVT (Blood Clot In the Leg): 7 Warning Signs and Symptoms (emedicinehealth.com)
THROMBUS
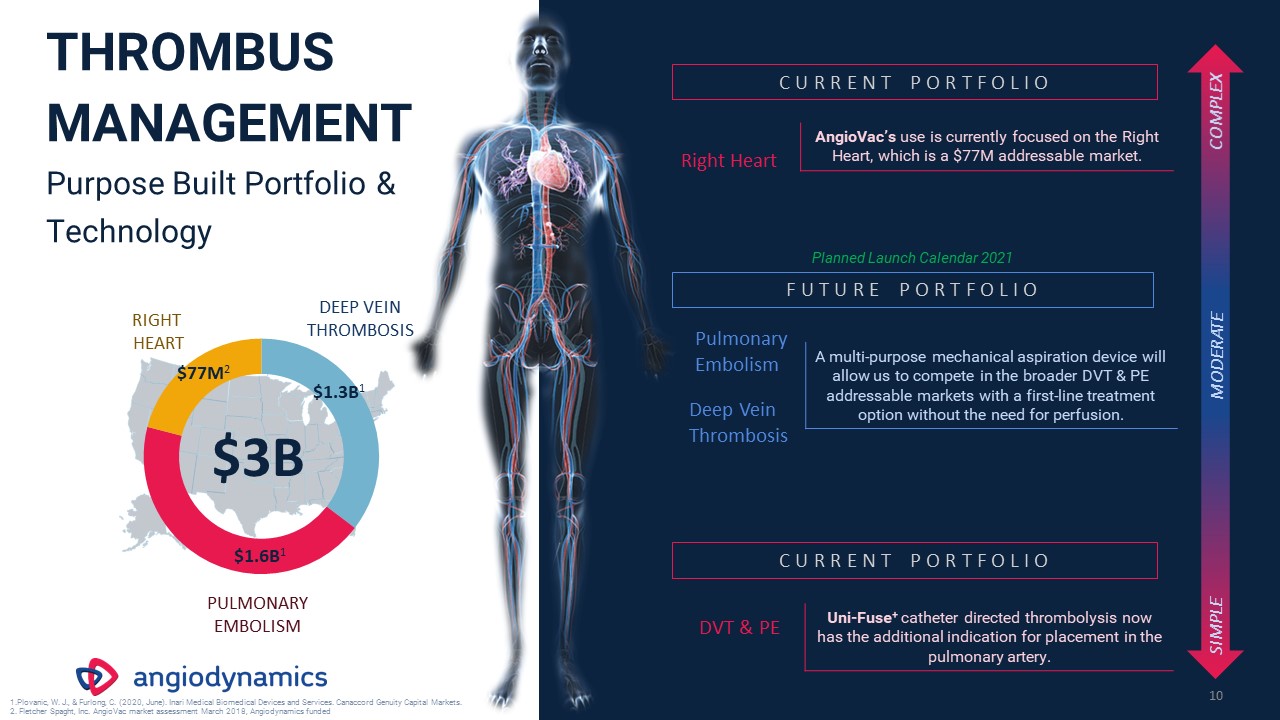
MANAGEMENTPurpose Built Portfolio & Technology 10 Right Heart AngioVac’s use is currently focused on the Right Heart, which is a $77M addressable market. Pulmonary Embolism Deep Vein Thrombosis A multi-purpose mechanical aspiration
device will allow us to compete in the broader DVT & PE addressable markets with a first-line treatment option without the need for perfusion. C U R R E N T P O R T F O L I O F U T U R E P O R T F O L I O DVT & PE Uni-Fuse+
catheter directed thrombolysis now has the additional indication for placement in the pulmonary artery. C U R R E N T P O R T F O L I O SIMPLE COMPLEX MODERATE $3B $77M2 $1.3B1 $1.6B1 PULMONARYEMBOLISM RIGHT HEART DEEP VEIN
THROMBOSIS Plovanic, W. J., & Furlong, C. (2020, June). Inari Medical Biomedical Devices and Services. Canaccord Genuity Capital Markets. Fletcher Spaght, Inc. AngioVac market assessment March 2018, Angiodynamics funded Planned Launch
Calendar 2021

The Difference The AngioVac System allows for the continuous aspiration of embolic material such as
fresh, soft thrombi or vegetation from the venous systemUtilizing a self-expanding, nitinol reinforced funnel tipSimultaneously reinfusing the patient’s own filtered blood to limit procedural blood loss Centrifugal Pump Console Waste
Collection System Filter Saline AngioVac Cannula Reinfusion Cannula AngioVac Circuit Individual experience may not be indicative of all procedure results. 11

THROMBUS MANAGEMENTPlanned Portfolio Additions & U.S. Addressable Markets
Expansion 12 $1.3B $1.6B FY 2021 FY 2022 FY 2023 FY 2025 FY 2024 Q1 Q2 Q3 Q4 Q1 Q2 Q3 Q4 Q1 Q2 Q3 Q4 Q1 Q2 Q3 Q4 Q1 Q2 Q3 Q4 $140M $700M $3.6B $1.5B 1 2 The planned portfolio additions are not guarantees of
future performance and are subject to risks and uncertainties. Investors are cautioned that actual events or results may differ from AngioDynamics’ expectations. Controlled Powerful Versatile Gen 3Right Heart, Illio-caval
DVT Multi-Purpose Mechanical Aspiration Gen 1Entry into Ilio-femoral DVT Multi-Purpose Mechanical Aspiration Gen 2Access to full Ilio-femoral DVT market Gen 4 Smaller size should drive further adoption in addressable market Multi-Purpose
Mechanical AspirationPE Indication THE NEXT PORTFOLIO INNOVATION A purpose-built, innovative product leveraging the strengths of the AngioVac cannula technology with off-circuit manual aspiration control Proven, funnel tip design allows
efficient aspiration and compression of large clot burden Designed to allow the end-user command and control of the mechanical aspiration Broadens our Thrombus Management portfolio and designed to provide an intuitive, first-line treatment
option without the need for lytics and advanced procedural support

ANGIODYNAMICS Second Quarter 2021 Earnings PresentationJanuary 7, 2021 13
Serious News for Serious Traders! Try StreetInsider.com Premium Free!
You May Also Be Interested In
- Coca-Cola Europacific Partners plc Announces Q1 Trading Update & Interim Dividend Declaration
- Tim Kirchen appointed Executive Vice President, UPM Raflatac and member of the Group Executive Team
- Prospera Energy Inc. 2024 Corporate Update
Create E-mail Alert Related Categories
SEC FilingsSign up for StreetInsider Free!
Receive full access to all new and archived articles, unlimited portfolio tracking, e-mail alerts, custom newswires and RSS feeds - and more!
