

Form 8-K ALERUS FINANCIAL CORP For: Apr 28
 Tweet
Tweet Share
Share
SECURITIES AND EXCHANGE COMMISSION
WASHINGTON, DC 20549
FORM 8-K
CURRENT REPORT PURSUANT TO
SECTION 13 OR 15(d) OF THE
SECURITIES EXCHANGE ACT OF 1934
Date of report (Date of earliest event reported): April 29, 2020
Alerus Financial Corporation
(Exact Name of Registrant as Specified in Charter)
|
Delaware |
001-39036 |
45-0375407 |
|
(State or Other Jurisdiction of Incorporation) |
(Commission File Number) |
(IRS Employer Identification No.) |
401 Demers Avenue
Grand Forks, North Dakota 58201
(Address of Principal Executive Offices) (Zip Code)
Registrant’s telephone number, including area code: (701) 795-3200
N/A
(Former Name or Former Address, if Changed Since Last Report.)
Check the appropriate box below if the Form 8-K filing is intended to simultaneously satisfy the filing obligation of the registrant under any of the following provisions (see General Instruction A.2. below):
☐Written communications pursuant to Rule 425 under the Securities Act (17 CFR 230.425)
☐Soliciting material pursuant to Rule 14a-12 under the Exchange Act (17 CFR 240.14a-12)
☐Pre-commencement communications pursuant to Rule 14d-2(b) under the Exchange Act (17 CFR 240.14d-2(b))
☐Pre-commencement communications pursuant to Rule 13e-4(c) under the Exchange Act (17 CFR 240.13e-4(c))
Securities registered pursuant to Section 12(b) of the Act:
|
Title of each class |
|
Trading symbol |
|
Name of each exchange on which registered |
|
Common Stock, $1.00 par value per share |
|
ALRS |
|
The Nasdaq Stock Market LLC |
Indicate by check mark whether the registrant is an emerging growth company as defined in Rule 405 of the Securities Act of 1933 (§ 230.405 of this chapter) or Rule 12b–2 of the Securities Exchange Act of 1934 (§ 240.12b–2 of this chapter).
Emerging growth company ☒
If an emerging growth company, indicate by check mark if the registrant has elected not to use the extended transition period for complying with any new or revised financial accounting standards provided pursuant to Section 13(a) of the Exchange Act. ☐
Item 7.01.Regulation FD Disclosure.
On April 29, 2020, Alerus Financial Corporation, (the “Company”) posted a presentation to the Company’s investor relations website, located at investors.alerus.com. The presentation is also attached hereto as Exhibit 99.1.
The information in Item 7.01 of this Current Report on Form 8-K and the related Exhibit 99.1 attached hereto is being “furnished” and will not, except to the extent required by applicable law or regulation, be deemed “filed” by the Company for purposes of Section 18 of the Securities Exchange Act of 1934, as amended, or otherwise subject to the liabilities of that section, nor will any of such information or exhibits be deemed incorporated by reference into any filing under the Securities Act of 1933, as amended, or the Securities Exchange Act of 1934, as amended.
Item 9.01.Financial Statements and Exhibits.
(d) Exhibits
|
Exhibit No. |
|
Description |
|
|
|
|
|
99.1 |
|
SIGNATURES
Pursuant to the requirements of the Securities Exchange Act of 1934, the registrant has duly caused this report to be signed on its behalf by the undersigned hereunto duly authorized.
|
Date: April 29, 2020 |
Alerus Financial Corporation |
|
|
|
|
|
|
|
|
|
|
|
By: |
/s/ Randy L. Newman |
|
|
Name: |
Randy L. Newman |
|
Title: |
||
Exhibit 99.1
| INVESTOR PRESENTATION APRIL 2020 Alerus |
| 1 Forward-Looking Statements This presentation contains “forward-looking statements” within the meaning of the safe harbor provisions of the U.S. Private Securities Litigation Reform Act of 1995. Forward-looking statements include, without limitation, statements concerning plans, estimates, calculations, forecasts and projections with respect to the anticipated future performance of Alerus Financial Corporation. These statements are often, but not always, identified by words such as “may”, “might”, “should”, “could”, “predict”, “potential”, “believe”, “expect”, “continue”, “will”, “anticipate”, “seek”, “estimate”, “intend”, “plan”, “projection”, “would”, “annualized”, “target” and “outlook”, or the negative version of those words or other comparable words of a future or forward-looking nature. Examples of forward-looking statements include, among others, statements we make regarding our projected growth, anticipated future financial performance, financial condition, credit quality, management’s long-term performance goals and the future plans and prospects of Alerus Financial Corporation. Forward-looking statements are neither historical facts nor assurances of future performance. Instead, they are based only on our current beliefs, expectations and assumptions regarding the future of our business, future plans and strategies, projections, anticipated events and trends, the economy and other future conditions. Because forward-looking statements relate to the future, they are subject to inherent uncertainties, risks and changes in circumstances that are difficult to predict and many of which are outside of our control. Our actual results and financial condition may differ materially from those indicated in the forward-looking statements. Therefore, you should not rely on any of these forward-looking statements. Important factors that could cause our actual results and financial condition to differ materially from those indicated in the forward-looking statements include, among others, the following: the effects of the COVID-19 pandemic, including its potential effects on the economic environment, our clients and our operations, as well as any changes to federal, state or local government laws, regulations or orders in connection with the pandemic; our ability to successfully manage credit risk and maintain an adequate level of allowance for loan losses; new or revised accounting standards, including as a result of the future implementation of the new Current Expected Credit Loss Standard; business and economic conditions generally and in the financial services industry, nationally and within our market areas; the overall health of the local and national real estate market; concentrations within our loan portfolio; the level of nonperforming assets on our balance sheet; our ability to implement our organic and acquisition growth strategies; the impact of economic or market conditions on our fee-based services; our ability to continue to grow our retirement and benefit services business; our ability to continue to originate a sufficient volume of residential mortgages; the occurrence of fraudulent activity, breaches or failures of our information security controls or cybersecurity related incidents; interruptions involving our information technology and telecommunications systems or third-party servicers; potential losses incurred in connection with mortgage loan repurchases; the composition of our executive management team and our ability to attract and retain key personnel; rapid technological change in the financial services industry; increased competition in the financial services industry; our ability to successfully manage liquidity risk; the effectiveness of our risk management framework; the commencement and outcome of litigation and other legal proceedings and regulatory actions against us or to which we may become subject; potential impairment to the goodwill we recorded in connection with our past acquisitions; the extensive regulatory framework that applies to us; the impact of recent and future legislative and regulatory changes; interest rate risks associated with our business; fluctuations in the values of the securities held in our securities portfolio; governmental monetary, trade and fiscal policies; severe weather, natural disasters, widespread disease or pandemics, such as the COVID-19 global pandemic, acts of war or terrorism or other adverse external events; any material weaknesses in our internal control over financial reporting; our success at managing the risks involved in the foregoing items; and any other risks described in the “Risk Factors” sections of other reports filed by Alerus Financial Corporation with the Securities and Exchange Commission. Any forward-looking statement made by us in this presentation is based only on information currently available to us and speaks only as of the date on which it is made. We undertake no obligation to publicly update any forward-looking statement, whether written or oral, that may be made from time to time, whether as a result of new information, future developments or otherwise. Non-GAAP Financial Measures This presentation includes certain ratios and amounts that do not conform to U.S. Generally Accepted Accounting Principles, or GAAP. Management uses certain non-GAAP financial measures to evaluate financial performance and business trends from period to period and believes that disclosure of these non-GAAP financial measures will help investors, rating agencies and analysts evaluate the financial performance and condition of Alerus Financial Corporation. This presentation includes a reconciliation of each non-GAAP financial measure to the most comparable GAAP equivalent. Miscellaneous Except as otherwise indicated, this presentation speaks as of the date hereof. The delivery of this presentation shall not, under any circumstances, create any implication that there has been no change in the affairs of Alerus Financial Corporation after the date hereof. Certain of the information contained herein may be derived from information provided by industry sources. We believe that such information is accurate and that the sources from which it has been obtained are reliable. We cannot guarantee the accuracy of such information, however, and we have not independently verified such information. DISCLAIMERS |
| 2 COVID-19 RESPONSE |
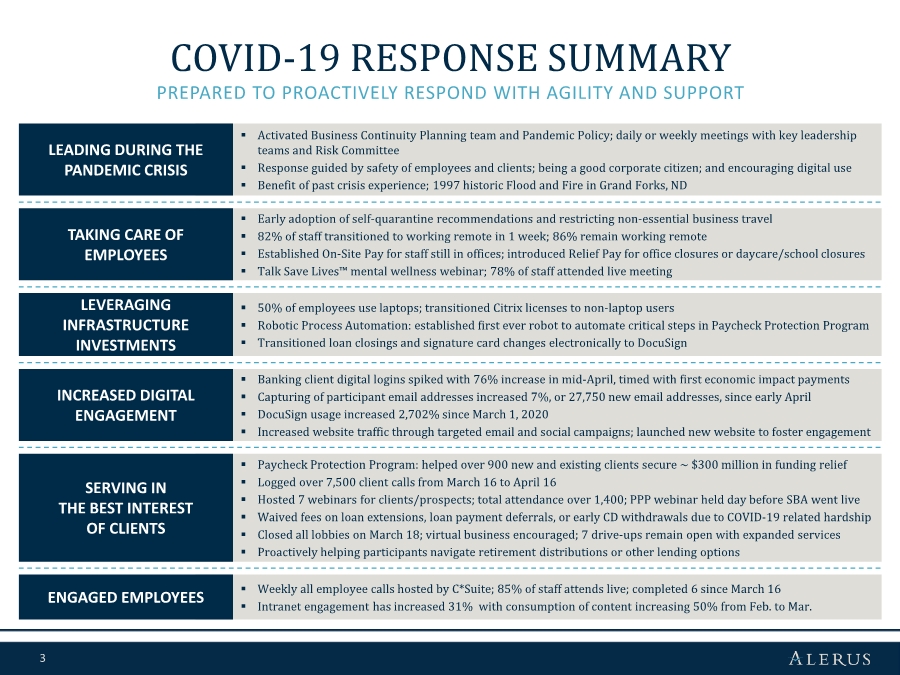
| 3 .. Activated Business Continuity Planning team and Pandemic Policy; daily or weekly meetings with key leadership teams and Risk Committee .. Response guided by safety of employees and clients; being a good corporate citizen; and encouraging digital use .. Benefit of past crisis experience; 1997 historic Flood and Fire in Grand Forks, ND .. Early adoption of self-quarantine recommendations and restricting non-essential business travel .. 82% of staff transitioned to working remote in 1 week; 86% remain working remote .. Established On-Site Pay for staff still in offices; introduced Relief Pay for office closures or daycare/school closures .. Talk Save Lives™ mental wellness webinar; 78% of staff attended live meeting .. 50% of employees use laptops; transitioned Citrix licenses to non-laptop users .. Robotic Process Automation: established first ever robot to automate critical steps in Paycheck Protection Program .. Transitioned loan closings and signature card changes electronically to DocuSign .. Banking client digital logins spiked with 76% increase in mid-April, timed with first economic impact payments .. Capturing of participant email addresses increased 7%, or 27,750 new email addresses, since early April .. DocuSign usage increased 2,702% since March 1, 2020 .. Increased website traffic through targeted email and social campaigns; launched new website to foster engagement .. Paycheck Protection Program: helped over 900 new and existing clients secure ~ $300 million in funding relief .. Logged over 7,500 client calls from March 16 to April 16 .. Hosted 7 webinars for clients/prospects; total attendance over 1,400; PPP webinar held day before SBA went live .. Waived fees on loan extensions, loan payment deferrals, or early CD withdrawals due to COVID-19 related hardship .. Closed all lobbies on March 18; virtual business encouraged; 7 drive-ups remain open with expanded services .. Proactively helping participants navigate retirement distributions or other lending options .. Weekly all employee calls hosted by C*Suite; 85% of staff attends live; completed 6 since March 16 .. Intranet engagement has increased 31% with consumption of content increasing 50% from Feb. to Mar. COVID-19 RESPONSE SUMMARY PREPARED TO PROACTIVELY RESPOND WITH AGILITY AND SUPPORT LEADING DURING THE PANDEMIC CRISIS TAKING CARE OF EMPLOYEES LEVERAGING INFRASTRUCTURE INVESTMENTS INCREASED DIGITAL ENGAGEMENT SERVING IN THE BEST INTEREST OF CLIENTS ENGAGED EMPLOYEES |
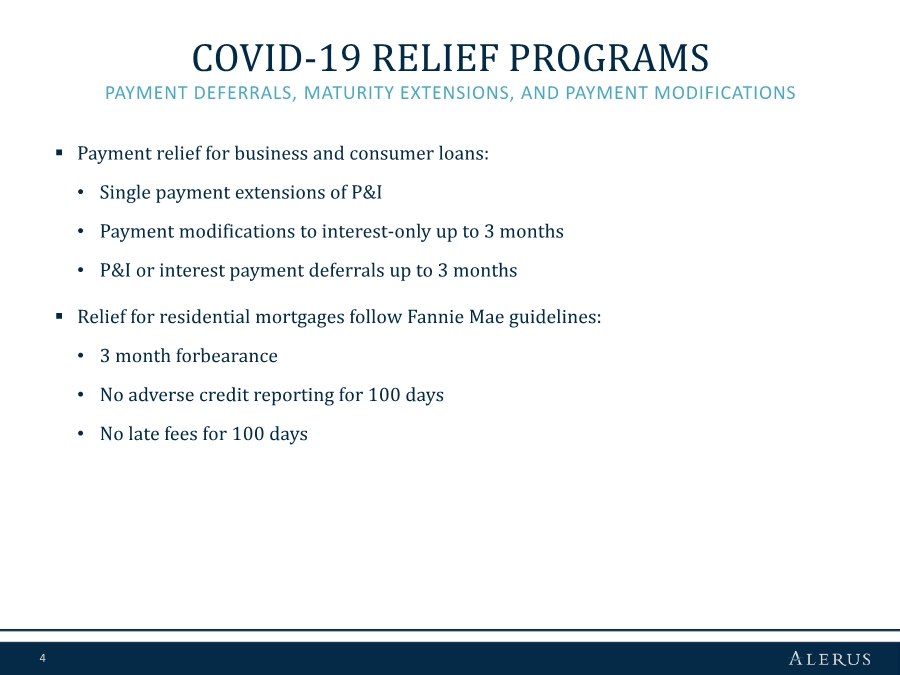
| 4 .. Payment relief for business and consumer loans: • Single payment extensions of P&I • Payment modifications to interest-only up to 3 months • P&I or interest payment deferrals up to 3 months .. Relief for residential mortgages follow Fannie Mae guidelines: • 3 month forbearance • No adverse credit reporting for 100 days • No late fees for 100 days PAYMENT DEFERRALS, MATURITY EXTENSIONS, AND PAYMENT MODIFICATIONS COVID-19 RELIEF PROGRAMS |
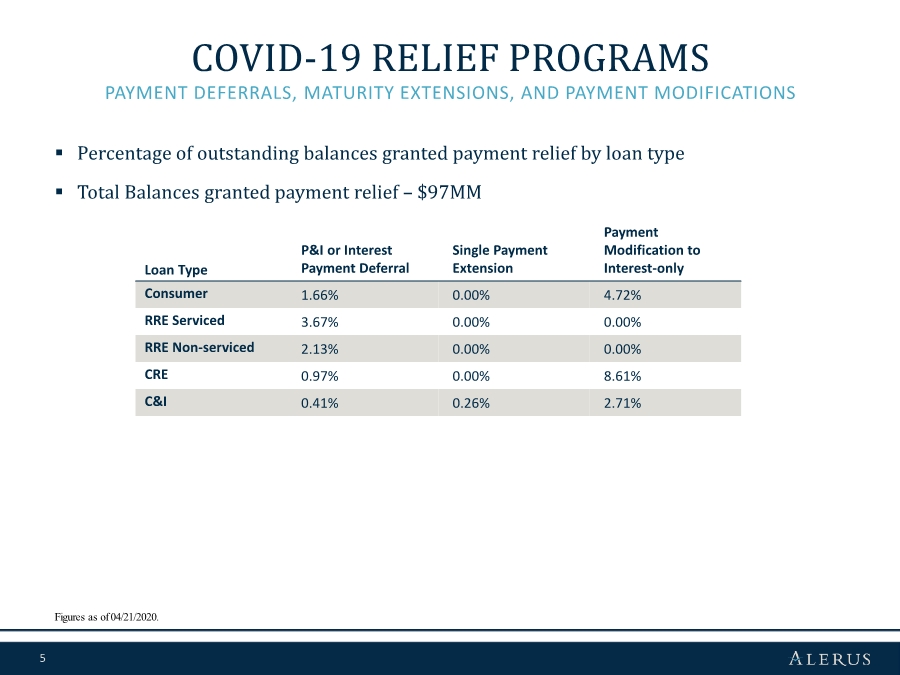
| 5 PAYMENT DEFERRALS, MATURITY EXTENSIONS, AND PAYMENT MODIFICATIONS COVID-19 RELIEF PROGRAMS Figures as of 04/21/2020. .. Percentage of outstanding balances granted payment relief by loan type .. Total Balances granted payment relief – $97MM Loan Type P&I or Interest Payment Deferral Single Payment Extension Payment Modification to Interest-only Consumer 1.66% 0.00% 4.72% RRE Serviced 3.67% 0.00% 0.00% RRE Non-serviced 2.13% 0.00% 0.00% CRE 0.97% 0.00% 8.61% C&I 0.41% 0.26% 2.71% |
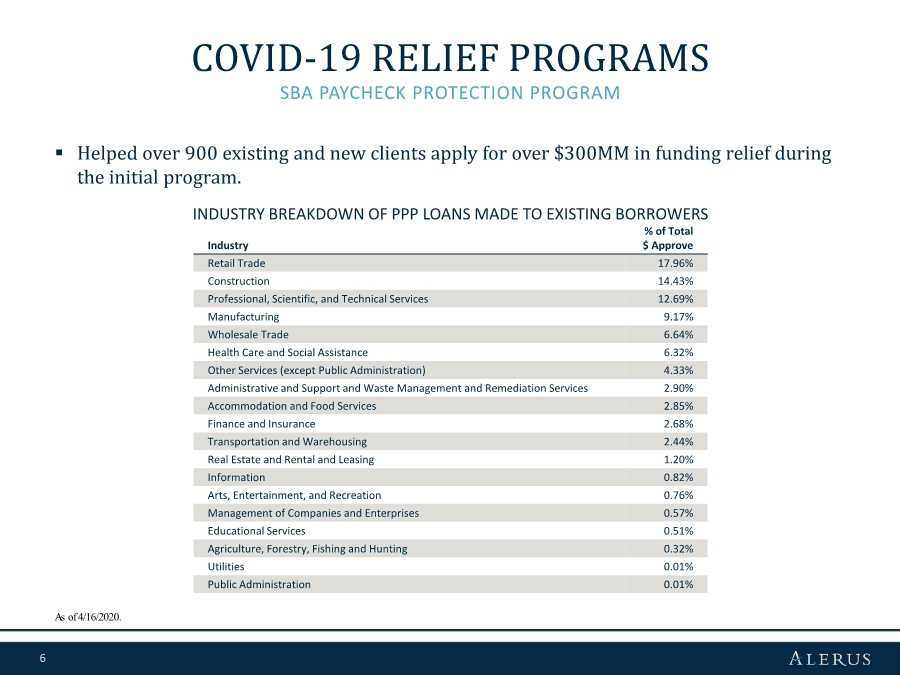
| 6 .. Helped over 900 existing and new clients apply for over $300MM in funding relief during the initial program. SBA PAYCHECK PROTECTION PROGRAM COVID-19 RELIEF PROGRAMS As of 4/16/2020. Industry % of Total $ Approve Retail Trade 17.96% Construction 14.43% Professional, Scientific, and Technical Services 12.69% Manufacturing 9.17% Wholesale Trade 6.64% Health Care and Social Assistance 6.32% Other Services (except Public Administration) 4.33% Administrative and Support and Waste Management and Remediation Services 2.90% Accommodation and Food Services 2.85% Finance and Insurance 2.68% Transportation and Warehousing 2.44% Real Estate and Rental and Leasing 1.20% Information 0.82% Arts, Entertainment, and Recreation 0.76% Management of Companies and Enterprises 0.57% Educational Services 0.51% Agriculture, Forestry, Fishing and Hunting 0.32% Utilities 0.01% Public Administration 0.01% INDUSTRY BREAKDOWN OF PPP LOANS MADE TO EXISTING BORROWERS |
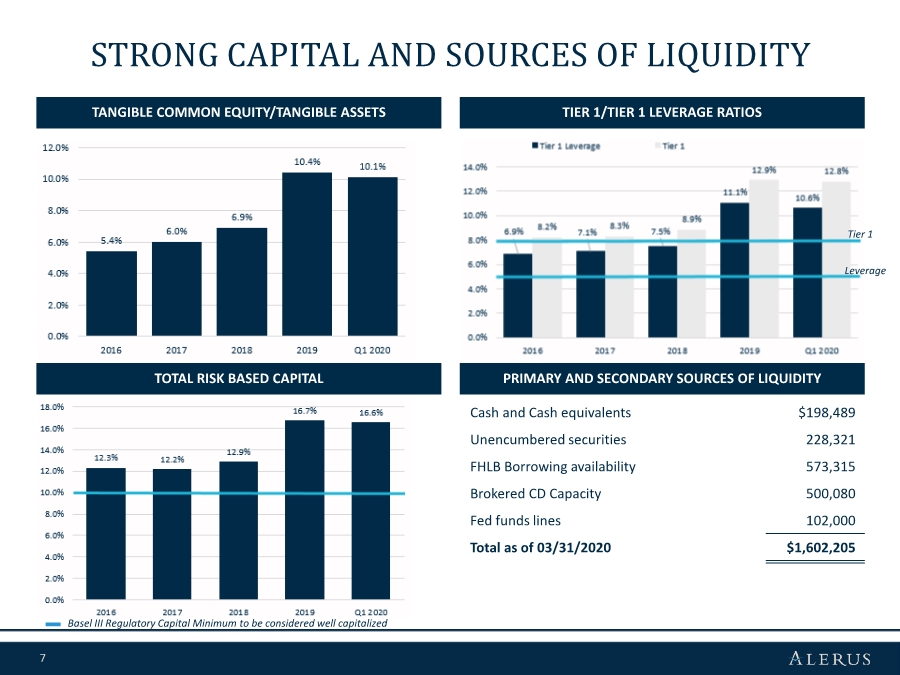
| 7 STRONG CAPITAL AND SOURCES OF LIQUIDITY TANGIBLE COMMON EQUITY/TANGIBLE ASSETS TIER 1/TIER 1 LEVERAGE RATIOS PRIMARY AND SECONDARY SOURCES OF LIQUIDITY TOTAL RISK BASED CAPITAL Basel III Regulatory Capital Minimum to be considered well capitalized Cash and Cash equivalents $198,489 Unencumbered securities 228,321 FHLB Borrowing availability 573,315 Brokered CD Capacity 500,080 Fed funds lines 102,000 Total as of 03/31/2020 $1,602,205 Tier 1 Leverage |
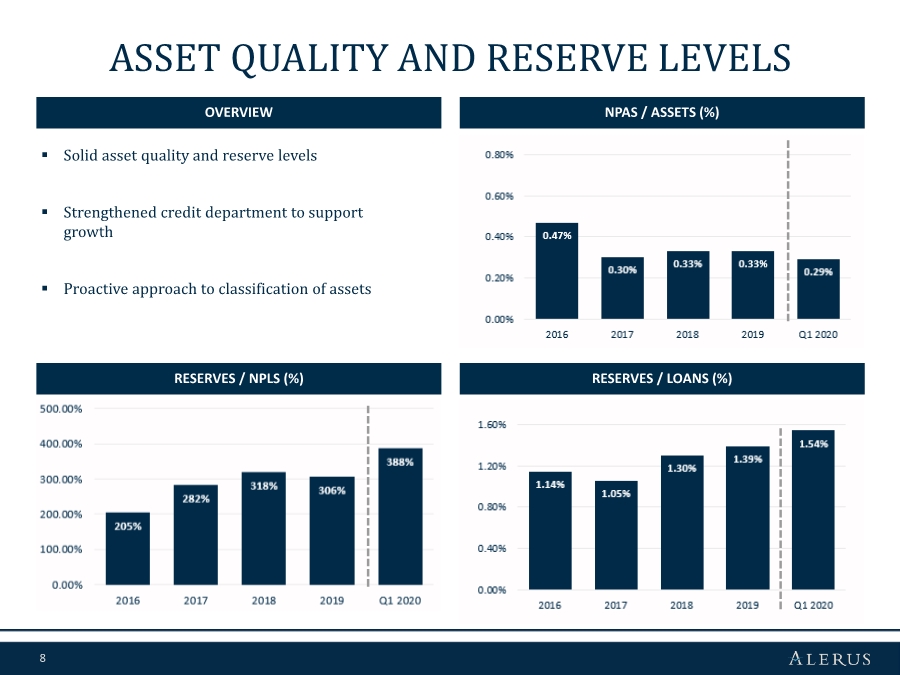
| 8 ASSET QUALITY AND RESERVE LEVELS OVERVIEW NPAS / ASSETS (%) RESERVES / LOANS (%) RESERVES / NPLS (%) .. Solid asset quality and reserve levels .. Strengthened credit department to support growth .. Proactive approach to classification of assets |
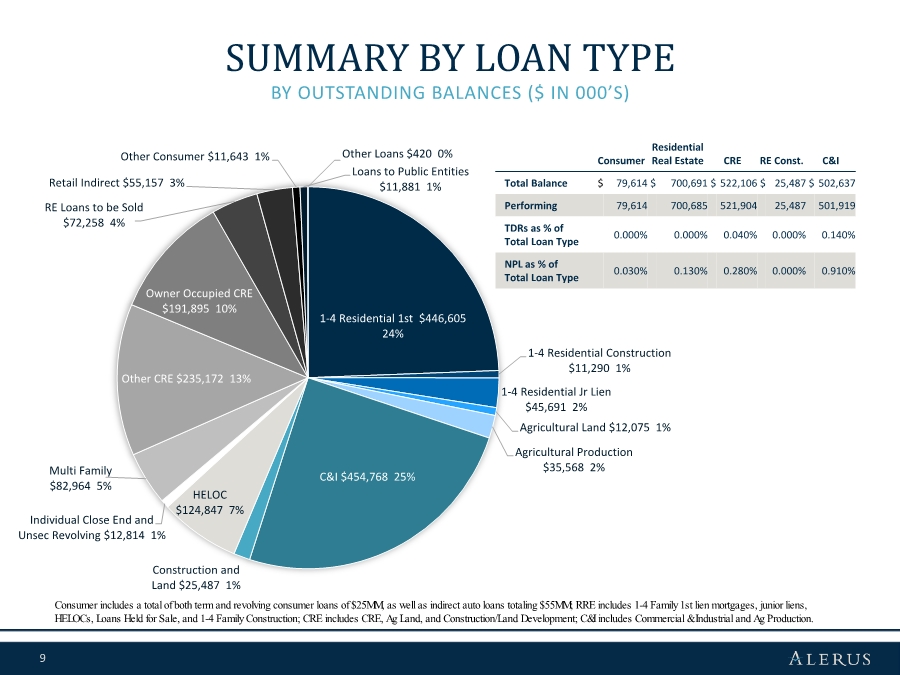
| 9 1-4 Residential 1st $446,605 24% 1-4 Residential Construction $11,290 1% 1-4 Residential Jr Lien $45,691 2% Agricultural Land $12,075 1% Agricultural Production $35,568 2% C&I $454,768 25% Construction and Land $25,487 1% HELOC $124,847 7% Individual Close End and Unsec Revolving $12,814 1% Multi Family $82,964 5% Other CRE $235,172 13% Owner Occupied CRE $191,895 10% RE Loans to be Sold $72,258 4% Retail Indirect $55,157 3% Other Consumer $11,643 1% Loans to Public Entities $11,881 1% Other Loans $420 0% BY OUTSTANDING BALANCES ($ IN 000’S) SUMMARY BY LOAN TYPE Consumer includes a total of both term and revolving consumer loans of $25MM, as well as indirect auto loans totaling $55MM; RRE includes 1-4 Family 1st lien mortgages, junior liens, HELOCs, Loans Held for Sale, and 1-4 Family Construction; CRE includes CRE, Ag Land, and Construction/Land Development; C&I includes Commercial & Industrial and Ag Production. Consumer Residential Real Estate CRE RE Const. C&I Total Balance $ 79,614 $ 700,691 $ 522,106 $ 25,487 $ 502,637 Performing 79,614 700,685 521,904 25,487 501,919 TDRs as % of Total Loan Type 0.000% 0.000% 0.040% 0.000% 0.140% NPL as % of Total Loan Type 0.030% 0.130% 0.280% 0.000% 0.910% |
| 10 FIRST QUARTER HIGHLIGHTS |

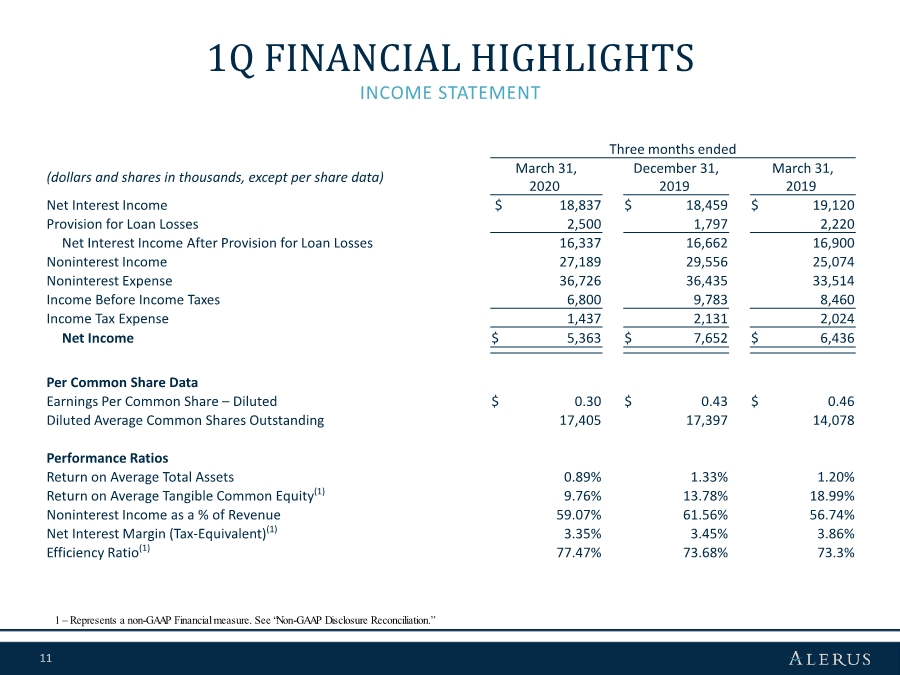
| 11 1Q FINANCIAL HIGHLIGHTS 1 – Represents a non-GAAP Financial measure. See “Non-GAAP Disclosure Reconciliation.” INCOME STATEMENT Three months ended (dollars and shares in thousands, except per share data) March 31, 2020 December 31, 2019 March 31, 2019 Net Interest Income $ 18,837 $ 18,459 $ 19,120 Provision for Loan Losses 2,500 1,797 2,220 Net Interest Income After Provision for Loan Losses 16,337 16,662 16,900 Noninterest Income 27,189 29,556 25,074 Noninterest Expense 36,726 36,435 33,514 Income Before Income Taxes 6,800 9,783 8,460 Income Tax Expense 1,437 2,131 2,024 Net Income $ 5,363 $ 7,652 $ 6,436 Per Common Share Data Earnings Per Common Share – Diluted $ 0.30 $ 0.43 $ 0.46 Diluted Average Common Shares Outstanding 17,405 17,397 14,078 Performance Ratios Return on Average Total Assets 0.89% 1.33% 1.20% Return on Average Tangible Common Equity(1) 9.76% 13.78% 18.99% Noninterest Income as a % of Revenue 59.07% 61.56% 56.74% Net Interest Margin (Tax-Equivalent)(1) 3.35% 3.45% 3.86% Efficiency Ratio(1) 77.47% 73.68% 73.3% |
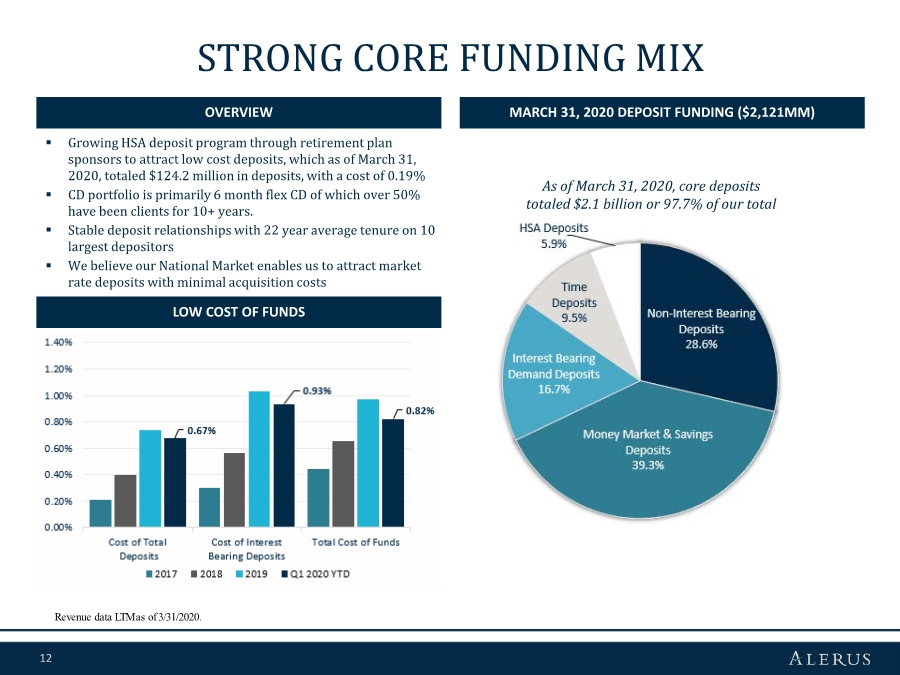
| 12 STRONG CORE FUNDING MIX .. Growing HSA deposit program through retirement plan sponsors to attract low cost deposits, which as of March 31, 2020, totaled $124.2 million in deposits, with a cost of 0.19% .. CD portfolio is primarily 6 month flex CD of which over 50% have been clients for 10+ years. .. Stable deposit relationships with 22 year average tenure on 10 largest depositors .. We believe our National Market enables us to attract market rate deposits with minimal acquisition costs As of March 31, 2020, core deposits totaled $2.1 billion or 97.7% of our total deposits OVERVIEW MARCH 31, 2020 DEPOSIT FUNDING ($2,121MM) LOW COST OF FUNDS Revenue data LTM as of 3/31/2020. |
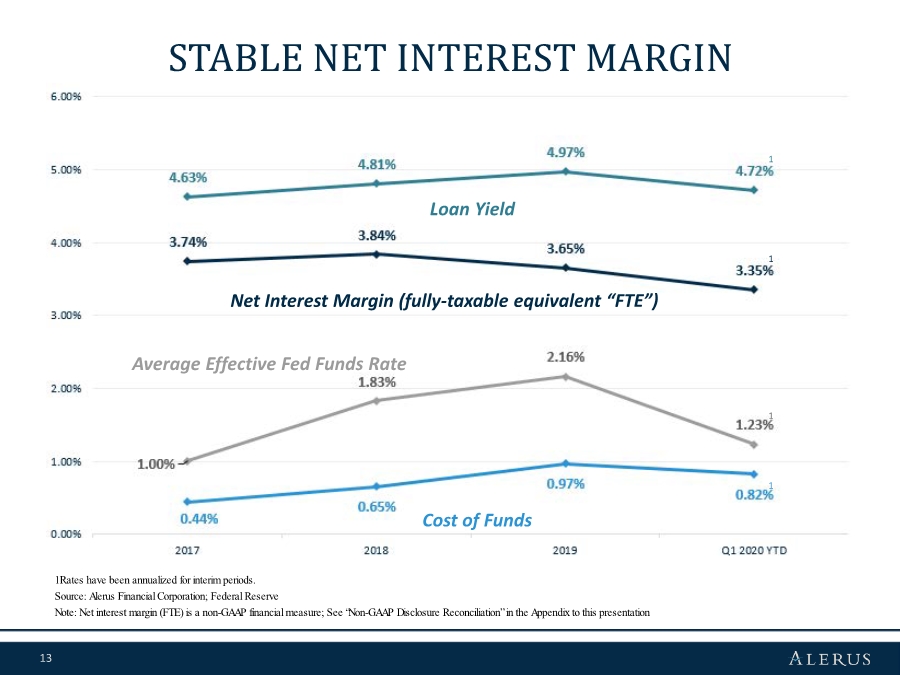
| 13 STABLE NET INTEREST MARGIN 1Rates have been annualized for interim periods. Source: Alerus Financial Corporation; Federal Reserve Note: Net interest margin (FTE) is a non-GAAP financial measure; See “Non-GAAP Disclosure Reconciliation” in the Appendix to this presentation Loan Yield Net Interest Margin (fully-taxable equivalent “FTE”) Average Effective Fed Funds Rate Cost of Funds 1 1 1 1 |
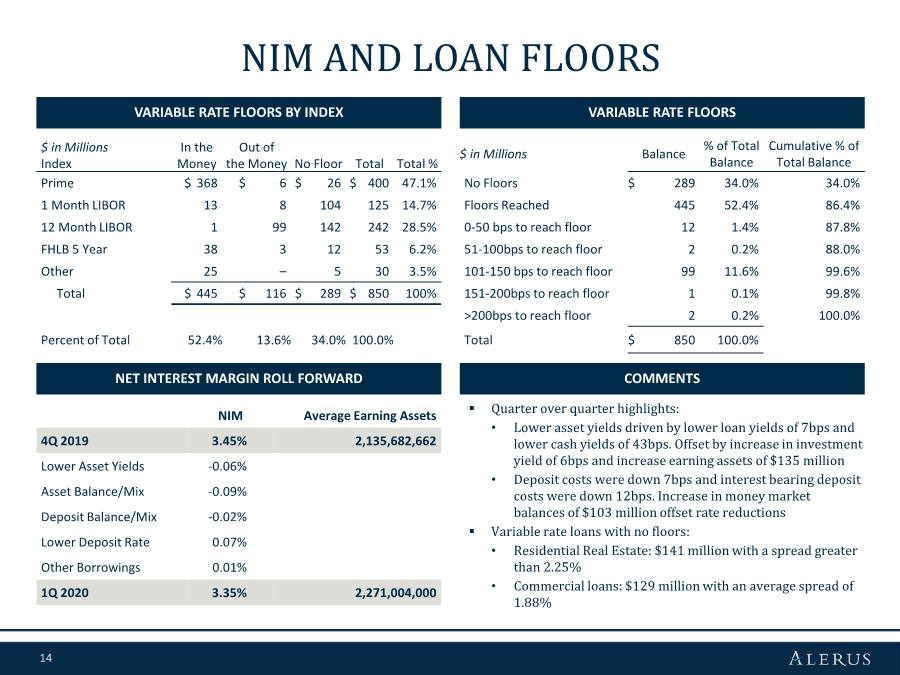
| 14 NIM AND LOAN FLOORS VARIABLE RATE FLOORS BY INDEX NET INTEREST MARGIN ROLL FORWARD VARIABLE RATE FLOORS COMMENTS NIM Average Earning Assets 4Q 2019 3.45% 2,135,682,662 Lower Asset Yields -0.06% Asset Balance/Mix -0.09% Deposit Balance/Mix -0.02% Lower Deposit Rate 0.07% Other Borrowings 0.01% 1Q 2020 3.35% 2,271,004,000 $ in Millions Balance % of Total Balance Cumulative % of Total Balance No Floors $ 289 34.0% 34.0% Floors Reached 445 52.4% 86.4% 0-50 bps to reach floor 12 1.4% 87.8% 51-100bps to reach floor 2 0.2% 88.0% 101-150 bps to reach floor 99 11.6% 99.6% 151-200bps to reach floor 1 0.1% 99.8% >200bps to reach floor 2 0.2% 100.0% Total $ 850 100.0% .. Quarter over quarter highlights: • Lower asset yields driven by lower loan yields of 7bps and lower cash yields of 43bps. Offset by increase in investment yield of 6bps and increase earning assets of $135 million • Deposit costs were down 7bps and interest bearing deposit costs were down 12bps. Increase in money market balances of $103 million offset rate reductions .. Variable rate loans with no floors: • Residential Real Estate: $141 million with a spread greater than 2.25% • Commercial loans: $129 million with an average spread of 1.88% $ in Millions Index In the Money Out of the Money No Floor Total Total % Prime $ 368 $ 6 $ 26 $ 400 47.1% 1 Month LIBOR 13 8 104 125 14.7% 12 Month LIBOR 1 99 142 242 28.5% FHLB 5 Year 38 3 12 53 6.2% Other 25 – 5 30 3.5% Total $ 445 $ 116 $ 289 $ 850 100% Percent of Total 52.4% 13.6% 34.0% 100.0% |
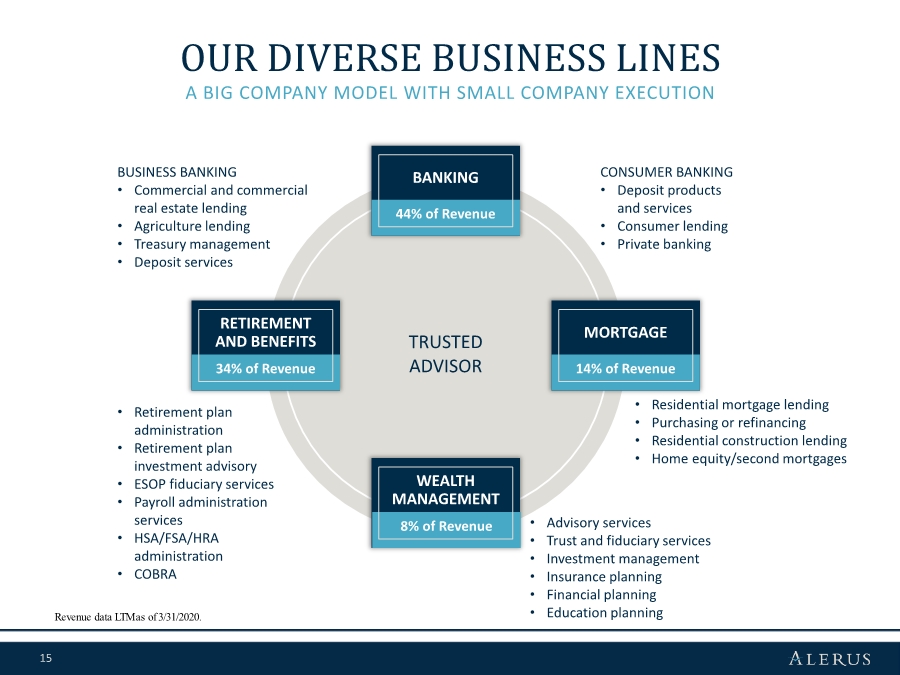
| 15 A BIG COMPANY MODEL WITH SMALL COMPANY EXECUTION OUR DIVERSE BUSINESS LINES Revenue data LTM as of 3/31/2020. TRUSTED ADVISOR BANKING WEALTH MANAGEMENT • Residential mortgage lending • Purchasing or refinancing • Residential construction lending • Home equity/second mortgages • Advisory services • Trust and fiduciary services • Investment management • Insurance planning • Financial planning • Education planning • Retirement plan administration • Retirement plan investment advisory • ESOP fiduciary services • Payroll administration services • HSA/FSA/HRA administration • COBRA BUSINESS BANKING • Commercial and commercial real estate lending • Agriculture lending • Treasury management • Deposit services CONSUMER BANKING • Deposit products and services • Consumer lending • Private banking MORTGAGE RETIREMENT AND BENEFITS 34% of Revenue 14% of Revenue 8% of Revenue 44% of Revenue |
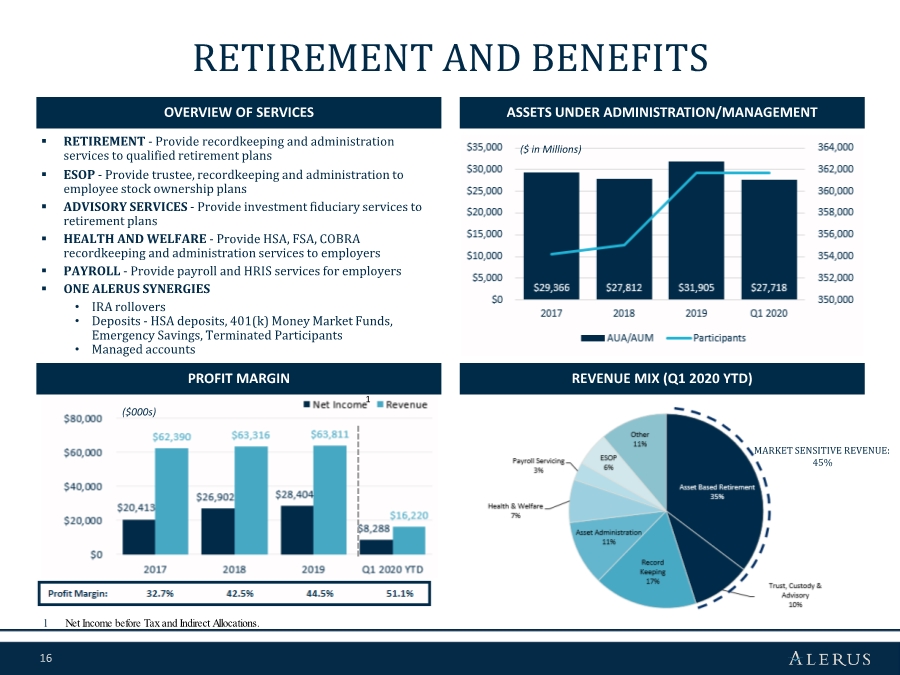
| 16 RETIREMENT AND BENEFITS OVERVIEW OF SERVICES ASSETS UNDER ADMINISTRATION/MANAGEMENT PROFIT MARGIN REVENUE MIX (Q1 2020 YTD) MARKET SENSITIVE REVENUE: 45% 1 1 Net Income before Tax and Indirect Allocations. .. RETIREMENT - Provide recordkeeping and administration services to qualified retirement plans .. ESOP - Provide trustee, recordkeeping and administration to employee stock ownership plans .. ADVISORY SERVICES - Provide investment fiduciary services to retirement plans .. HEALTH AND WELFARE - Provide HSA, FSA, COBRA recordkeeping and administration services to employers .. PAYROLL - Provide payroll and HRIS services for employers .. ONE ALERUS SYNERGIES • IRA rollovers • Deposits - HSA deposits, 401(k) Money Market Funds, Emergency Savings, Terminated Participants • Managed accounts ($ in Millions) ($000s) |
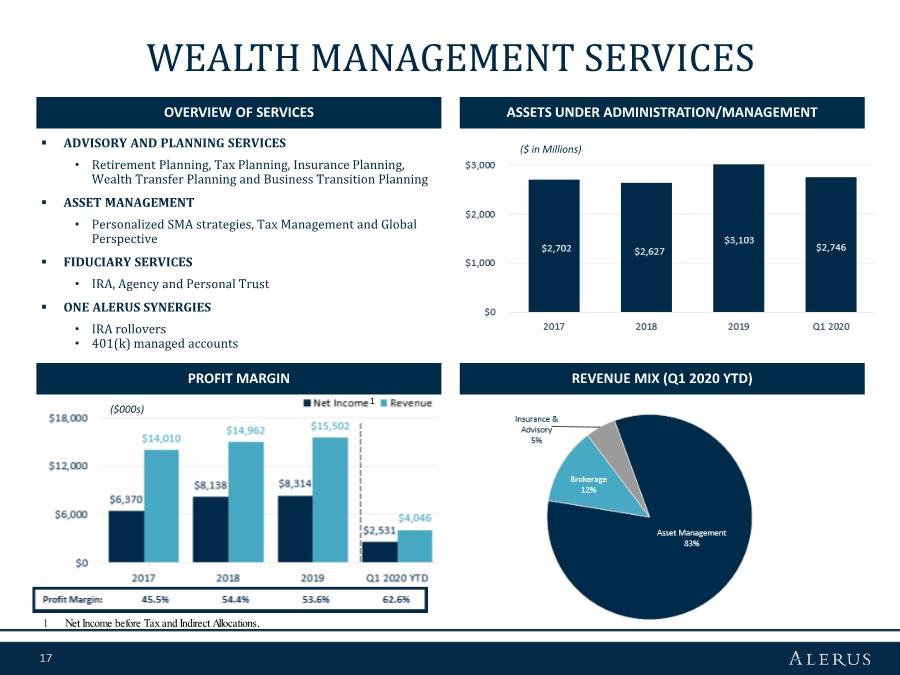
| 17 WEALTH MANAGEMENT SERVICES OVERVIEW OF SERVICES ASSETS UNDER ADMINISTRATION/MANAGEMENT PROFIT MARGIN REVENUE MIX (Q1 2020 YTD) 1 Net Income before Tax and Indirect Allocations. .. ADVISORY AND PLANNING SERVICES • Retirement Planning, Tax Planning, Insurance Planning, Wealth Transfer Planning and Business Transition Planning .. ASSET MANAGEMENT • Personalized SMA strategies, Tax Management and Global Perspective .. FIDUCIARY SERVICES • IRA, Agency and Personal Trust .. ONE ALERUS SYNERGIES • IRA rollovers • 401(k) managed accounts 1 ($ in Millions) ($000s) |
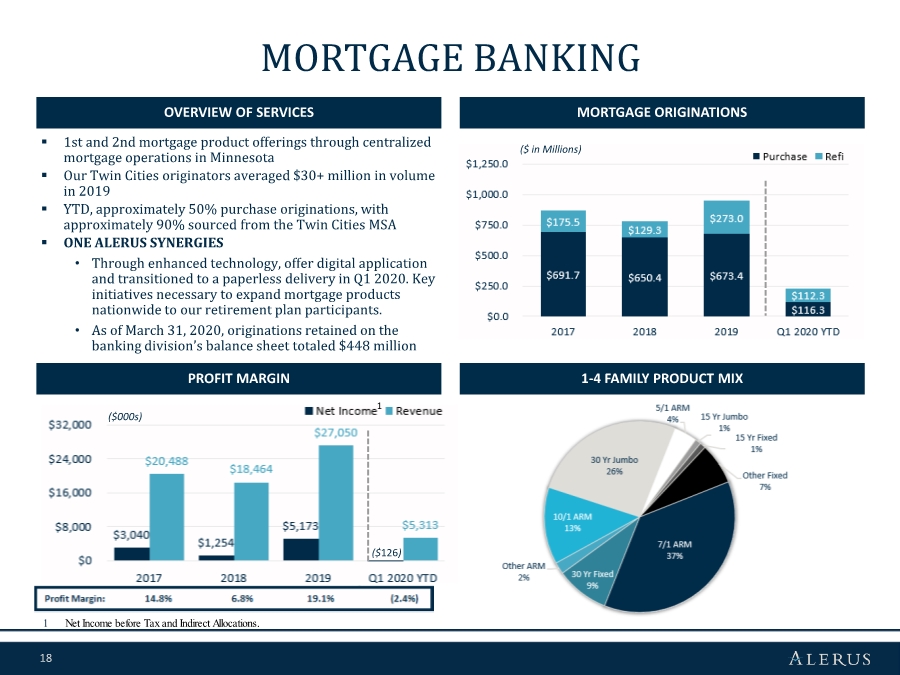
| 18 MORTGAGE BANKING OVERVIEW OF SERVICES MORTGAGE ORIGINATIONS 1-4 FAMILY PRODUCT MIX ($ in Millions) PROFIT MARGIN 1 Net Income before Tax and Indirect Allocations. 1 .. 1st and 2nd mortgage product offerings through centralized mortgage operations in Minnesota .. Our Twin Cities originators averaged $30+ million in volume in 2019 .. YTD, approximately 50% purchase originations, with approximately 90% sourced from the Twin Cities MSA .. ONE ALERUS SYNERGIES • Through enhanced technology, offer digital application and transitioned to a paperless delivery in Q1 2020. Key initiatives necessary to expand mortgage products nationwide to our retirement plan participants. • As of March 31, 2020, originations retained on the banking division’s balance sheet totaled $448 million ($000s) ($126) |
| 19 LOAN PORTFOLIO AND CREDIT QUALITY |

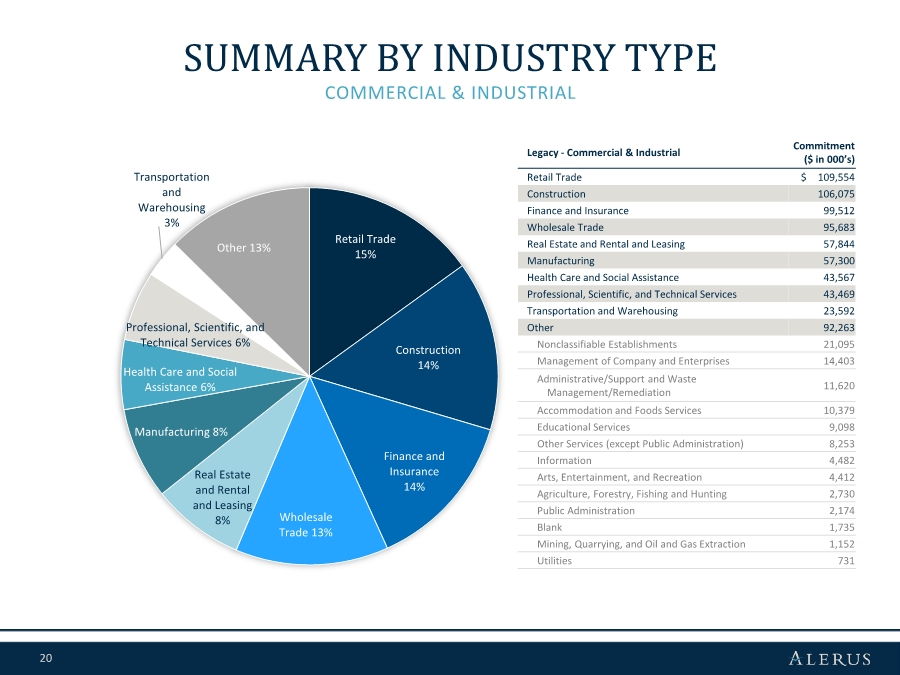
| 20 SUMMARY BY INDUSTRY TYPE COMMERCIAL & INDUSTRIAL Retail Trade 15% Construction 14% Finance and Insurance 14% Wholesale Trade 13% Real Estate and Rental and Leasing 8% Manufacturing 8% Health Care and Social Assistance 6% Professional, Scientific, and Technical Services 6% Transportation and Warehousing 3% Other 13% Legacy - Commercial & Industrial Commitment ($ in 000’s) Retail Trade $ 109,554 Construction 106,075 Finance and Insurance 99,512 Wholesale Trade 95,683 Real Estate and Rental and Leasing 57,844 Manufacturing 57,300 Health Care and Social Assistance 43,567 Professional, Scientific, and Technical Services 43,469 Transportation and Warehousing 23,592 Other 92,263 Nonclassifiable Establishments 21,095 Management of Company and Enterprises 14,403 Administrative/Support and Waste Management/Remediation 11,620 Accommodation and Foods Services 10,379 Educational Services 9,098 Other Services (except Public Administration) 8,253 Information 4,482 Arts, Entertainment, and Recreation 4,412 Agriculture, Forestry, Fishing and Hunting 2,730 Public Administration 2,174 Blank 1,735 Mining, Quarrying, and Oil and Gas Extraction 1,152 Utilities 731 |
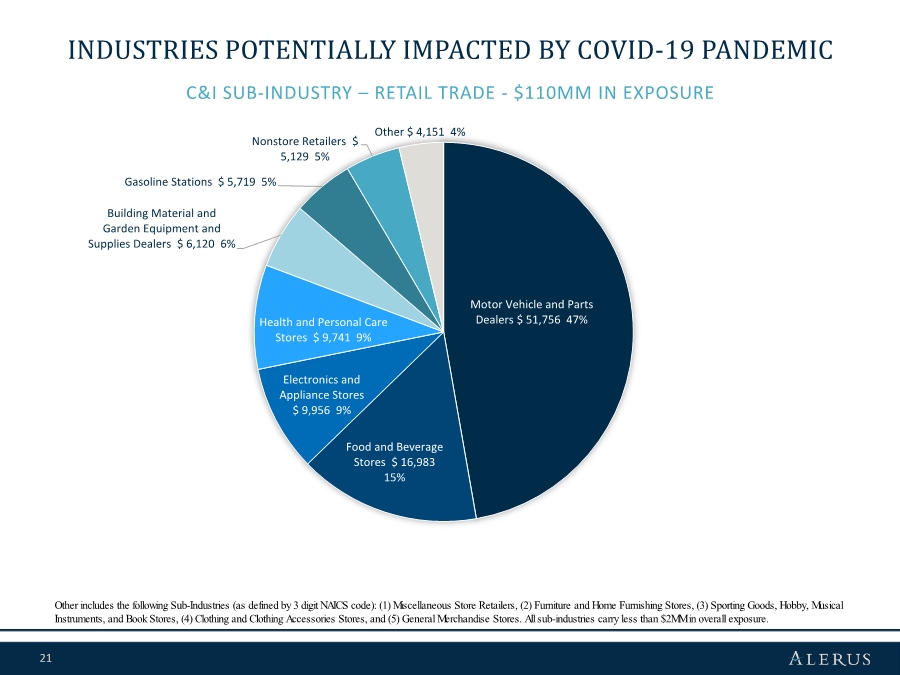
| 21 C&I SUB-INDUSTRY – RETAIL TRADE - $110MM IN EXPOSURE INDUSTRIES POTENTIALLY IMPACTED BY COVID-19 PANDEMIC Other includes the following Sub-Industries (as defined by 3 digit NAICS code): (1) Miscellaneous Store Retailers, (2) Furniture and Home Furnishing Stores, (3) Sporting Goods, Hobby, Musical Instruments, and Book Stores, (4) Clothing and Clothing Accessories Stores, and (5) General Merchandise Stores. All sub-industries carry less than $2MM in overall exposure. Motor Vehicle and Parts Dealers $ 51,756 47% Food and Beverage Stores $ 16,983 15% Electronics and Appliance Stores $ 9,956 9% Health and Personal Care Stores $ 9,741 9% Building Material and Garden Equipment and Supplies Dealers $ 6,120 6% Gasoline Stations $ 5,719 5% Nonstore Retailers $ 5,129 5% Other $ 4,151 4% |
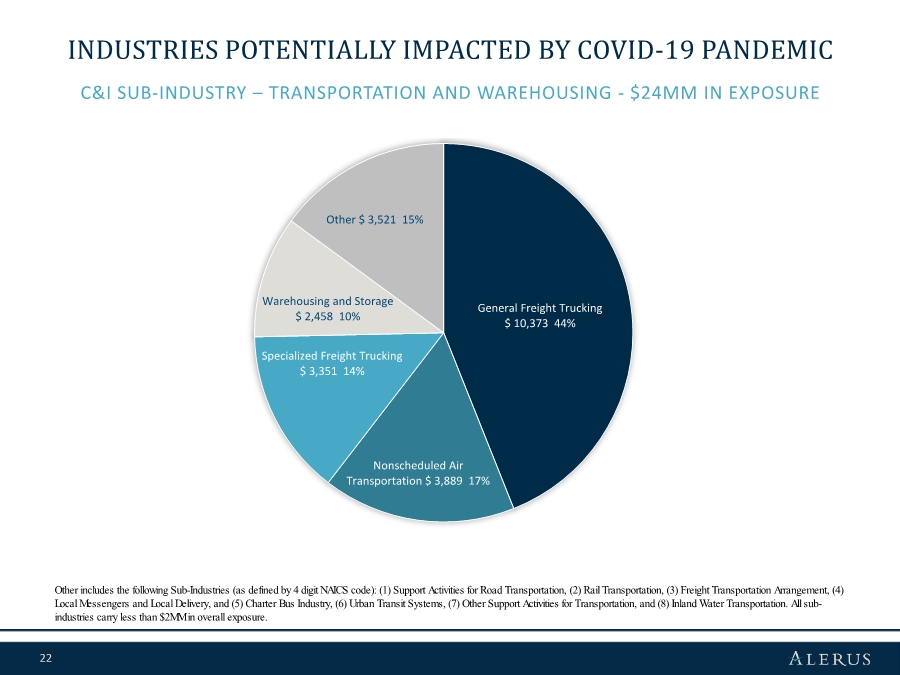
| 22 C&I SUB-INDUSTRY – TRANSPORTATION AND WAREHOUSING - $24MM IN EXPOSURE INDUSTRIES POTENTIALLY IMPACTED BY COVID-19 PANDEMIC Other includes the following Sub-Industries (as defined by 4 digit NAICS code): (1) Support Activities for Road Transportation, (2) Rail Transportation, (3) Freight Transportation Arrangement, (4) Local Messengers and Local Delivery, and (5) Charter Bus Industry, (6) Urban Transit Systems, (7) Other Support Activities for Transportation, and (8) Inland Water Transportation. All sub- industries carry less than $2MM in overall exposure. General Freight Trucking $ 10,373 44% Nonscheduled Air Transportation $ 3,889 17% Specialized Freight Trucking $ 3,351 14% Warehousing and Storage $ 2,458 10% Other $ 3,521 15% |
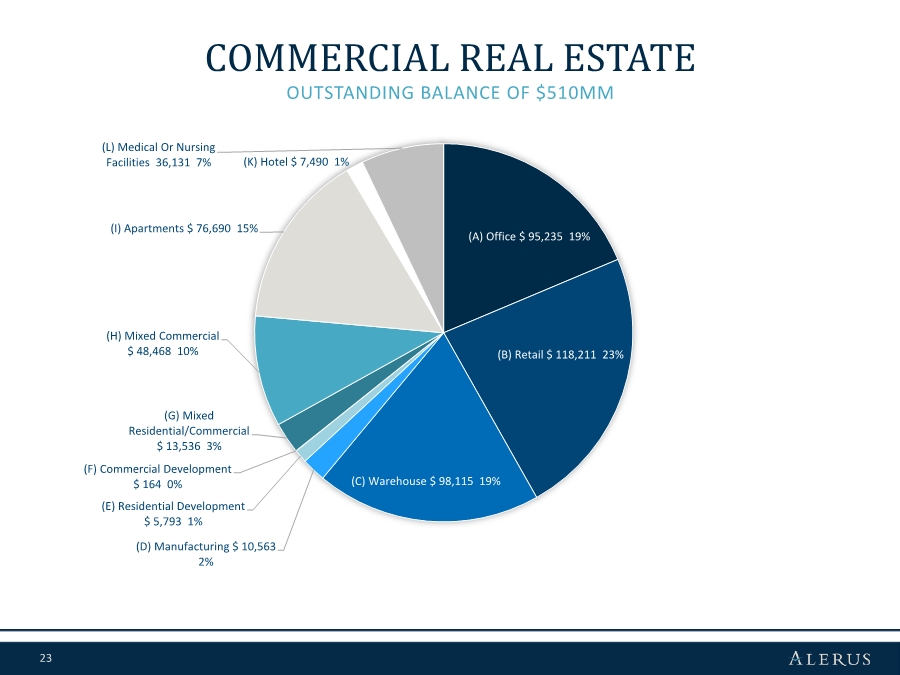
| 23 OUTSTANDING BALANCE OF $510MM COMMERCIAL REAL ESTATE (A) Office $ 95,235 19% (B) Retail $ 118,211 23% (C) Warehouse $ 98,115 19% (D) Manufacturing $ 10,563 2% (E) Residential Development $ 5,793 1% (F) Commercial Development $ 164 0% (G) Mixed Residential/Commercial $ 13,536 3% (H) Mixed Commercial $ 48,468 10% (I) Apartments $ 76,690 15% (K) Hotel $ 7,490 1% (L) Medical Or Nursing Facilities 36,131 7% |
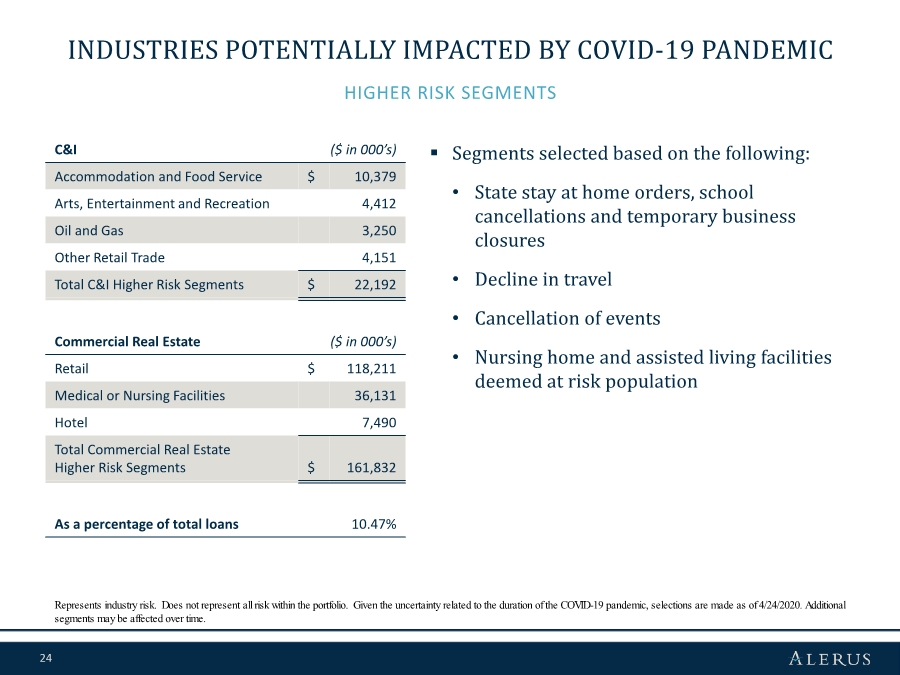
| 24 .. Segments selected based on the following: • State stay at home orders, school cancellations and temporary business closures • Decline in travel • Cancellation of events • Nursing home and assisted living facilities deemed at risk population HIGHER RISK SEGMENTS INDUSTRIES POTENTIALLY IMPACTED BY COVID-19 PANDEMIC Represents industry risk. Does not represent all risk within the portfolio. Given the uncertainty related to the duration of the COVID-19 pandemic, selections are made as of 4/24/2020. Additional segments may be affected over time. C&I ($ in 000’s) Accommodation and Food Service $ 10,379 Arts, Entertainment and Recreation 4,412 Oil and Gas 3,250 Other Retail Trade 4,151 Total C&I Higher Risk Segments $ 22,192 Commercial Real Estate ($ in 000’s) Retail $ 118,211 Medical or Nursing Facilities 36,131 Hotel 7,490 Total Commercial Real Estate Higher Risk Segments $ 161,832 As a percentage of total loans 10.47% |
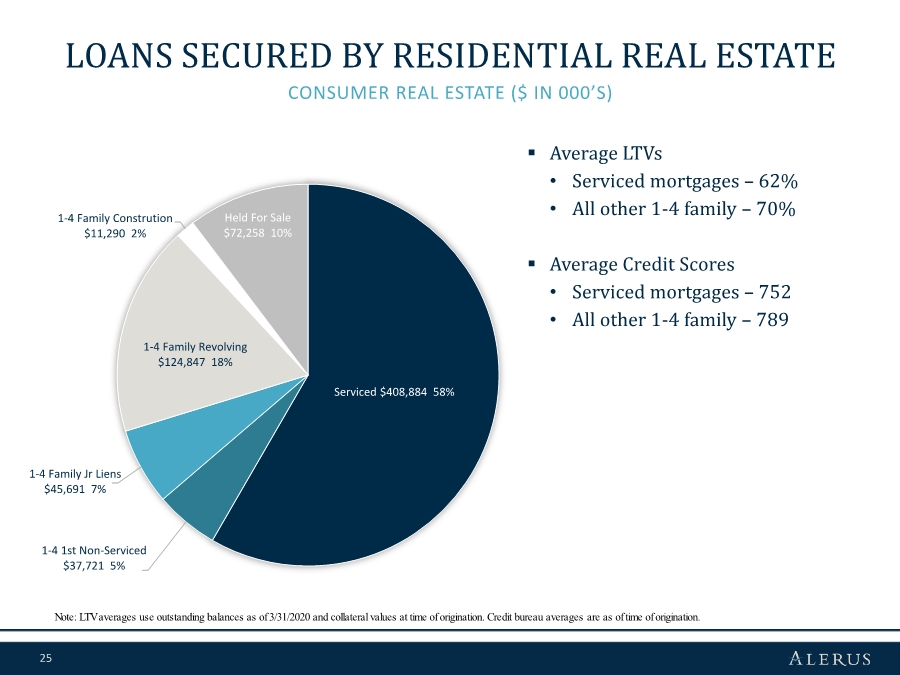
| 25 Serviced $408,884 58% 1-4 1st Non-Serviced $37,721 5% 1-4 Family Jr Liens $45,691 7% 1-4 Family Revolving $124,847 18% 1-4 Family Constrution $11,290 2% Held For Sale $72,258 10% LOANS SECURED BY RESIDENTIAL REAL ESTATE CONSUMER REAL ESTATE ($ IN 000’S) .. Average LTVs • Serviced mortgages – 62% • All other 1-4 family – 70% .. Average Credit Scores • Serviced mortgages – 752 • All other 1-4 family – 789 Note: LTV averages use outstanding balances as of 3/31/2020 and collateral values at time of origination. Credit bureau averages are as of time of origination. |
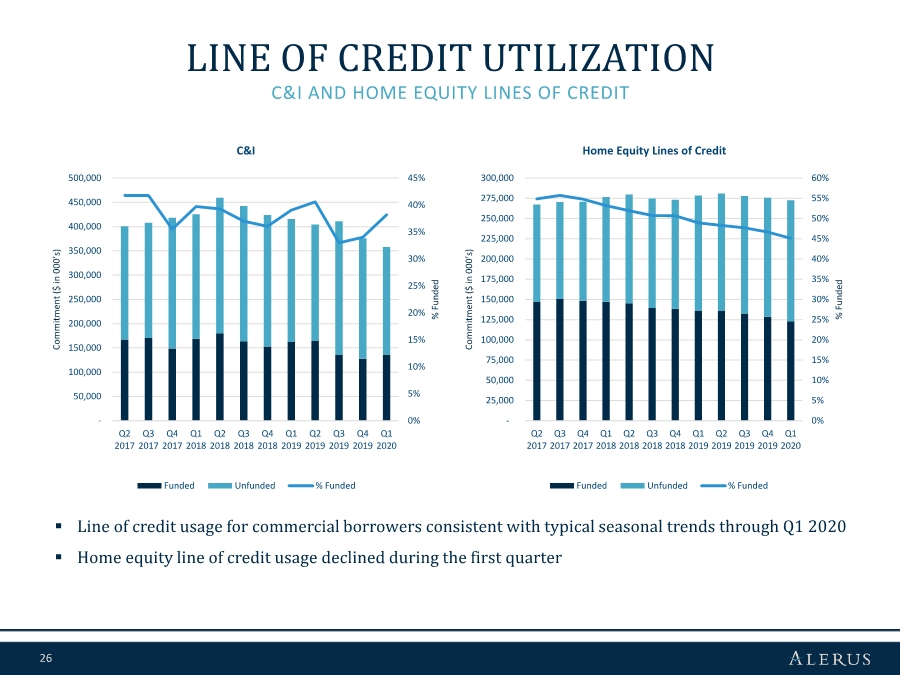
| 26 LINE OF CREDIT UTILIZATION 0% 5% 10% 15% 20% 25% 30% 35% 40% 45% - 50,000 100,000 150,000 200,000 250,000 300,000 350,000 400,000 450,000 500,000 Q2 2017 Q3 2017 Q4 2017 Q1 2018 Q2 2018 Q3 2018 Q4 2018 Q1 2019 Q2 2019 Q3 2019 Q4 2019 Q1 2020 % Funded Commitment ($ in 000’s) C&I Funded Unfunded % Funded C&I AND HOME EQUITY LINES OF CREDIT 0% 5% 10% 15% 20% 25% 30% 35% 40% 45% 50% 55% 60% - 25,000 50,000 75,000 100,000 125,000 150,000 175,000 200,000 225,000 250,000 275,000 300,000 Q2 2017 Q3 2017 Q4 2017 Q1 2018 Q2 2018 Q3 2018 Q4 2018 Q1 2019 Q2 2019 Q3 2019 Q4 2019 Q1 2020 % Funded Commitment ($ in 000’s) Home Equity Lines of Credit Funded Unfunded % Funded .. Line of credit usage for commercial borrowers consistent with typical seasonal trends through Q1 2020 .. Home equity line of credit usage declined during the first quarter |
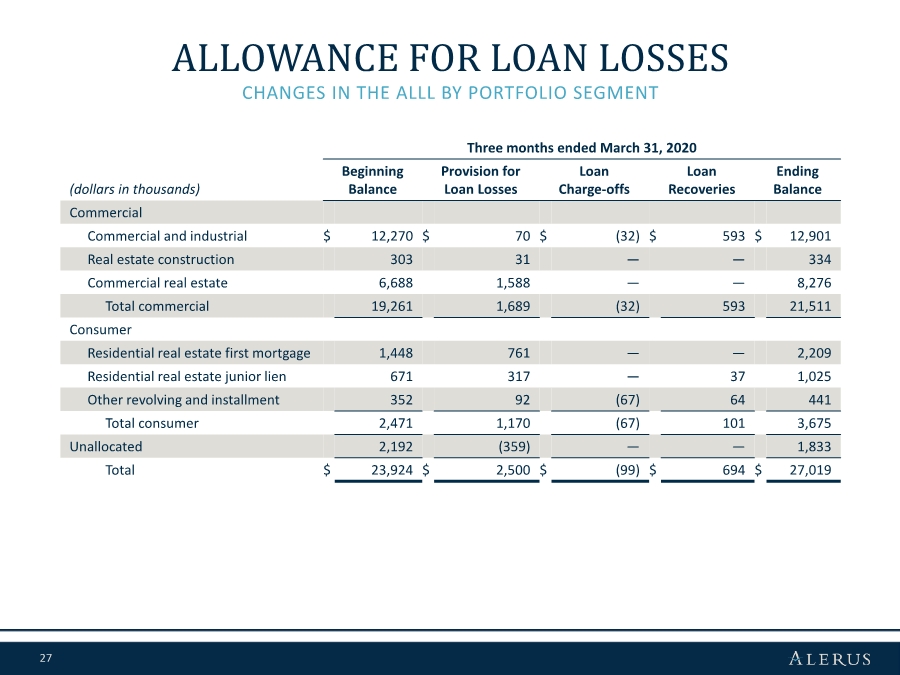
| 27 CHANGES IN THE ALLL BY PORTFOLIO SEGMENT ALLOWANCE FOR LOAN LOSSES Three months ended March 31, 2020 (dollars in thousands) Beginning Balance Provision for Loan Losses Loan Charge-offs Loan Recoveries Ending Balance Commercial Commercial and industrial $ 12,270 $ 70 $ (32) $ 593 $ 12,901 Real estate construction 303 31 — — 334 Commercial real estate 6,688 1,588 — — 8,276 Total commercial 19,261 1,689 (32) 593 21,511 Consumer Residential real estate first mortgage 1,448 761 — — 2,209 Residential real estate junior lien 671 317 — 37 1,025 Other revolving and installment 352 92 (67) 64 441 Total consumer 2,471 1,170 (67) 101 3,675 Unallocated 2,192 (359) — — 1,833 Total $ 23,924 $ 2,500 $ (99) $ 694 $ 27,019 |
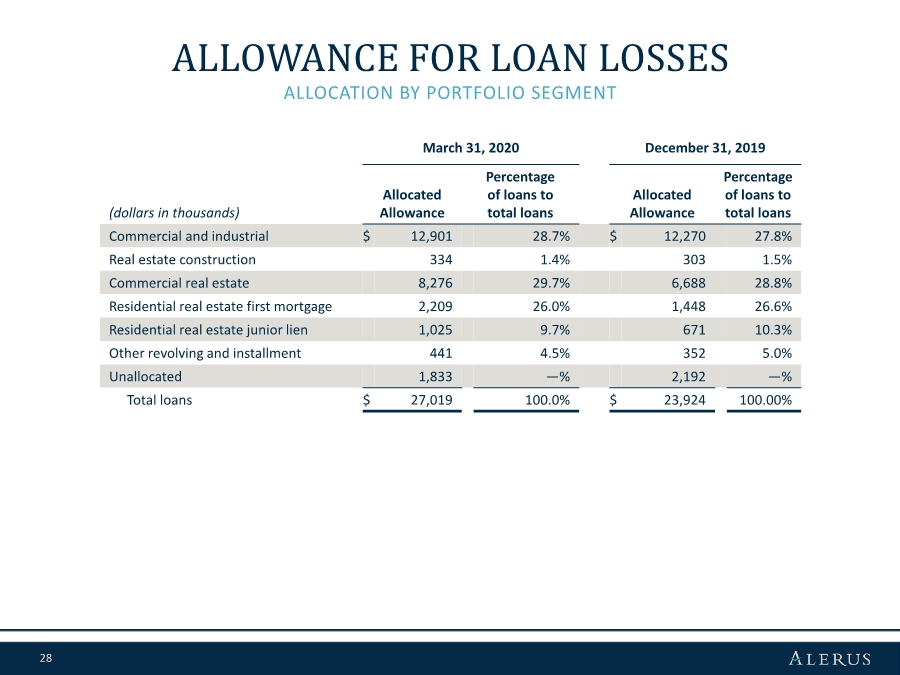
| 28 ALLOCATION BY PORTFOLIO SEGMENT ALLOWANCE FOR LOAN LOSSES March 31, 2020 December 31, 2019 (dollars in thousands) Allocated Allowance Percentage of loans to total loans Allocated Allowance Percentage of loans to total loans Commercial and industrial $ 12,901 28.7% $ 12,270 27.8% Real estate construction 334 1.4% 303 1.5% Commercial real estate 8,276 29.7% 6,688 28.8% Residential real estate first mortgage 2,209 26.0% 1,448 26.6% Residential real estate junior lien 1,025 9.7% 671 10.3% Other revolving and installment 441 4.5% 352 5.0% Unallocated 1,833 —% 2,192 —% Total loans $ 27,019 100.0% $ 23,924 100.00% |
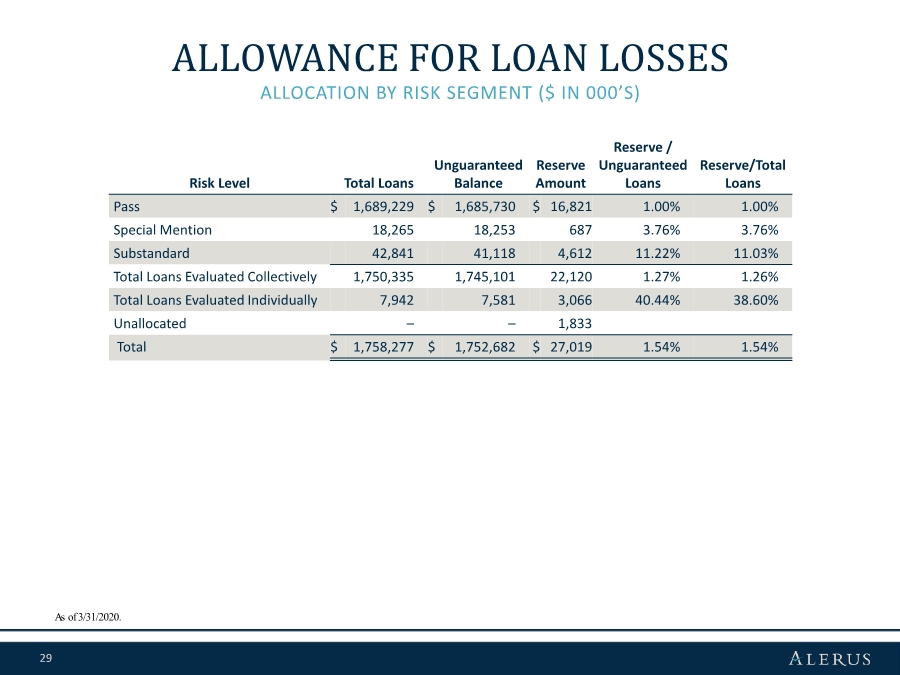
| 29 Risk Level Total Loans Unguaranteed Balance Reserve Amount Reserve / Unguaranteed Loans Reserve/Total Loans Pass $ 1,689,229 $ 1,685,730 $ 16,821 1.00% 1.00% Special Mention 18,265 18,253 687 3.76% 3.76% Substandard 42,841 41,118 4,612 11.22% 11.03% Total Loans Evaluated Collectively 1,750,335 1,745,101 22,120 1.27% 1.26% Total Loans Evaluated Individually 7,942 7,581 3,066 40.44% 38.60% Unallocated – – 1,833 Total $ 1,758,277 $ 1,752,682 $ 27,019 1.54% 1.54% ALLOCATION BY RISK SEGMENT ($ IN 000’S) ALLOWANCE FOR LOAN LOSSES As of 3/31/2020. |
| 30 APPENDIX |
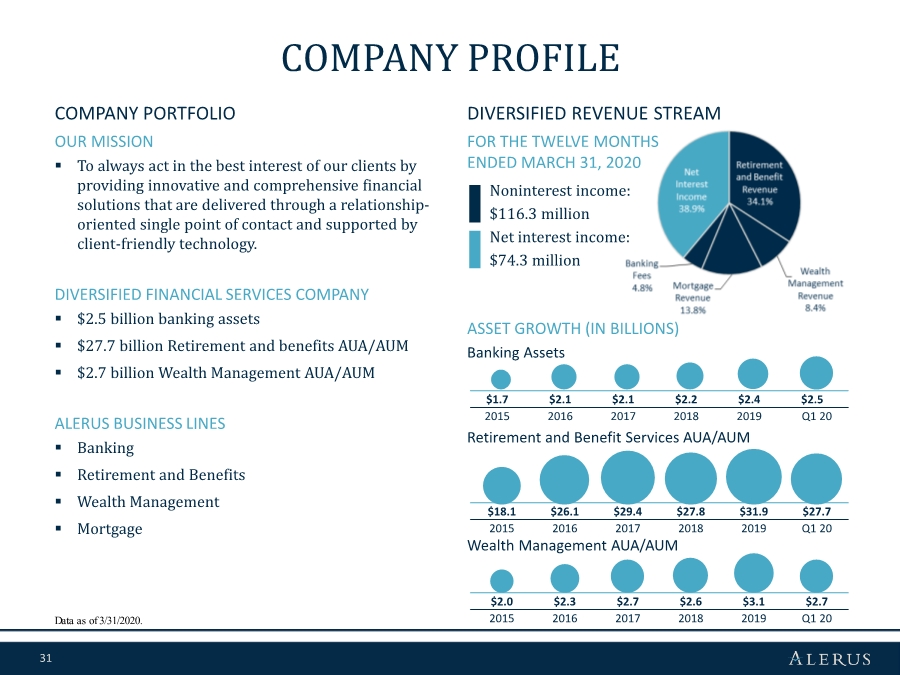
| 31 FOR THE TWELVE MONTHS ENDED MARCH 31, 2020 Noninterest income: $116.3 million Net interest income: $74.3 million $18.1 $26.1 $29.4 $27.8 $31.9 $27.7 2015 2016 2017 2018 2019 Q1 20 OUR MISSION .. To always act in the best interest of our clients by providing innovative and comprehensive financial solutions that are delivered through a relationship- oriented single point of contact and supported by client-friendly technology. DIVERSIFIED FINANCIAL SERVICES COMPANY .. $2.5 billion banking assets .. $27.7 billion Retirement and benefits AUA/AUM .. $2.7 billion Wealth Management AUA/AUM ALERUS BUSINESS LINES .. Banking .. Retirement and Benefits .. Wealth Management .. Mortgage COMPANY PROFILE Data as of 3/31/2020. COMPANY PORTFOLIO DIVERSIFIED REVENUE STREAM ASSET GROWTH (IN BILLIONS) $1.7 $2.1 $2.1 $2.2 $2.4 $2.5 2015 2016 2017 2018 2019 Q1 20 Banking Assets Retirement and Benefit Services AUA/AUM Wealth Management AUA/AUM $2.0 $2.3 $2.7 $2.6 $3.1 $2.7 2015 2016 2017 2018 2019 Q1 20 |
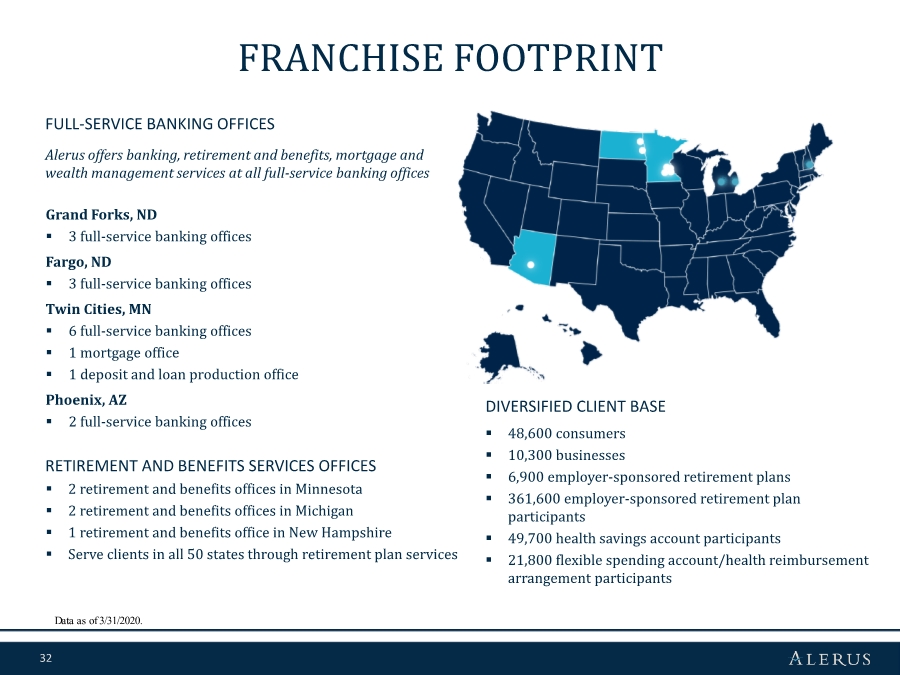
| 32 FRANCHISE FOOTPRINT Grand Forks, ND .. 3 full-service banking offices Fargo, ND .. 3 full-service banking offices Twin Cities, MN .. 6 full-service banking offices .. 1 mortgage office .. 1 deposit and loan production office Phoenix, AZ .. 2 full-service banking offices FULL-SERVICE BANKING OFFICES Alerus offers banking, retirement and benefits, mortgage and wealth management services at all full-service banking offices RETIREMENT AND BENEFITS SERVICES OFFICES .. 2 retirement and benefits offices in Minnesota .. 2 retirement and benefits offices in Michigan .. 1 retirement and benefits office in New Hampshire .. Serve clients in all 50 states through retirement plan services DIVERSIFIED CLIENT BASE .. 48,600 consumers .. 10,300 businesses .. 6,900 employer-sponsored retirement plans .. 361,600 employer-sponsored retirement plan participants .. 49,700 health savings account participants .. 21,800 flexible spending account/health reimbursement arrangement participants Data as of 3/31/2020. |
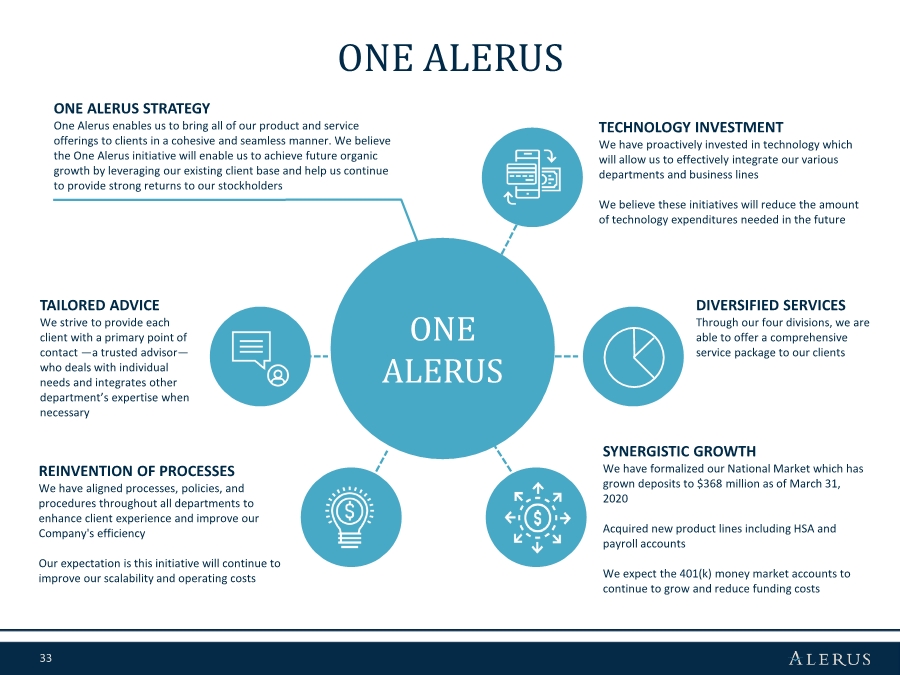
| 33 ONE ALERUS REINVENTION OF PROCESSES We have aligned processes, policies, and procedures throughout all departments to enhance client experience and improve our Company's efficiency Our expectation is this initiative will continue to improve our scalability and operating costs TAILORED ADVICE We strive to provide each client with a primary point of contact —a trusted advisor— who deals with individual needs and integrates other department’s expertise when necessary SYNERGISTIC GROWTH We have formalized our National Market which has grown deposits to $368 million as of March 31, 2020 Acquired new product lines including HSA and payroll accounts We expect the 401(k) money market accounts to continue to grow and reduce funding costs TECHNOLOGY INVESTMENT We have proactively invested in technology which will allow us to effectively integrate our various departments and business lines We believe these initiatives will reduce the amount of technology expenditures needed in the future DIVERSIFIED SERVICES Through our four divisions, we are able to offer a comprehensive service package to our clients ONE ALERUS STRATEGY One Alerus enables us to bring all of our product and service offerings to clients in a cohesive and seamless manner. We believe the One Alerus initiative will enable us to achieve future organic growth by leveraging our existing client base and help us continue to provide strong returns to our stockholders ONE ALERUS |
| 34 SKILLED ADVISORS AND FINANCIAL GUIDES .. Team is organized around consumer or business; focuses on holistic needs of clients; depth and breadth of Alerus service offering .. Proprietary Financial Fitness Playbook delivers consistency and augments Financial Workout technology .. Clients expectations driven by advice and guidance versus transactions EMPOWERING CLIENTS WITH RESPONSIVE TECHNOLOGY .. Omni-Channel Seamless experience via desktop and mobile .. Leading Account Aggregation Holistic view of entire financial life .. Single Sign On Remove friction in being an Alerus client .. Financial Wellness Score Your most current financial data is used to create easy, intuitive workouts IMPROVING CLIENTS’ FINANCIAL WELLBEING THROUGH PEOPLE + TECHNOLOGY THE PATH TO FINANCIAL CONFIDENCE - 500 1,000 1,500 2,000 2,500 3,000 3,500 4,000 4,500 5,000 September October November January February March April Debt Emergency HSA Insurance Retirement WORKOUTS COMPLETED BY CLIENTS SINCE LAUNCH |

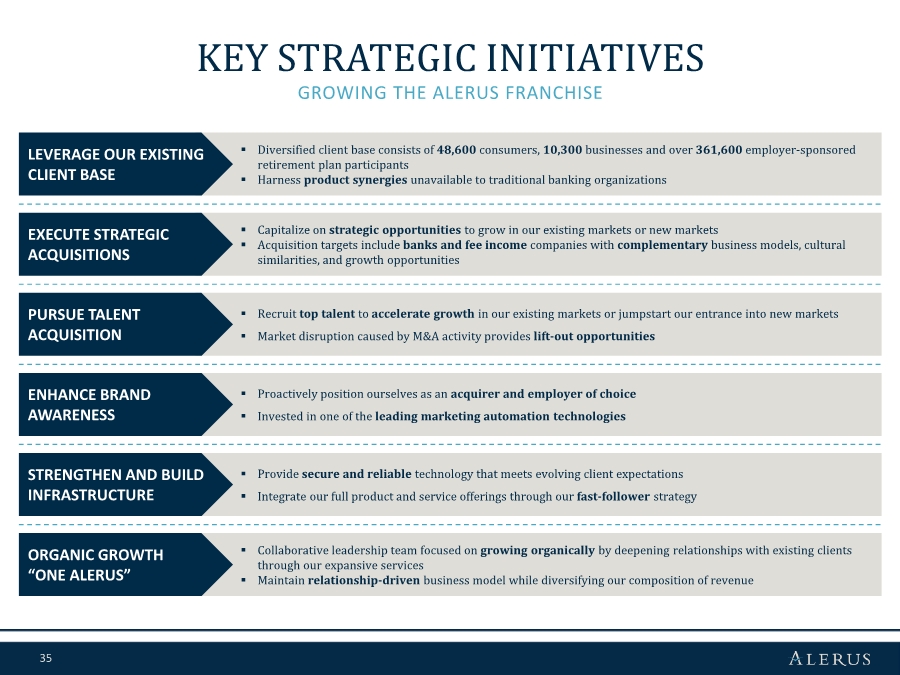
| 35 .. Diversified client base consists of 48,600 consumers, 10,300 businesses and over 361,600 employer-sponsored retirement plan participants .. Harness product synergies unavailable to traditional banking organizations .. Capitalize on strategic opportunities to grow in our existing markets or new markets .. Acquisition targets include banks and fee income companies with complementary business models, cultural similarities, and growth opportunities .. Recruit top talent to accelerate growth in our existing markets or jumpstart our entrance into new markets .. Market disruption caused by M&A activity provides lift-out opportunities .. Proactively position ourselves as an acquirer and employer of choice .. Invested in one of the leading marketing automation technologies .. Provide secure and reliable technology that meets evolving client expectations .. Integrate our full product and service offerings through our fast-follower strategy .. Collaborative leadership team focused on growing organically by deepening relationships with existing clients through our expansive services .. Maintain relationship-driven business model while diversifying our composition of revenue KEY STRATEGIC INITIATIVES GROWING THE ALERUS FRANCHISE LEVERAGE OUR EXISTING CLIENT BASE EXECUTE STRATEGIC ACQUISITIONS PURSUE TALENT ACQUISITION ENHANCE BRAND AWARENESS STRENGTHEN AND BUILD INFRASTRUCTURE ORGANIC GROWTH “ONE ALERUS” |
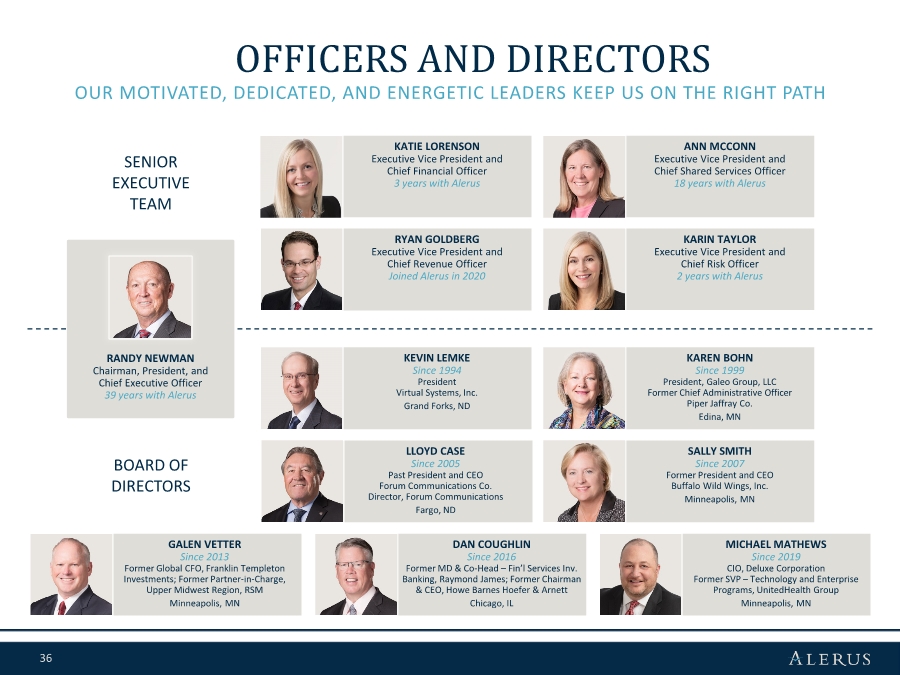
| 36 OFFICERS AND DIRECTORS OUR MOTIVATED, DEDICATED, AND ENERGETIC LEADERS KEEP US ON THE RIGHT PATH SENIOR EXECUTIVE TEAM BOARD OF DIRECTORS DAN COUGHLIN Since 2016 Former MD & Co-Head – Fin’l Services Inv. Banking, Raymond James; Former Chairman & CEO, Howe Barnes Hoefer & Arnett Chicago, IL MICHAEL MATHEWS Since 2019 CIO, Deluxe Corporation Former SVP – Technology and Enterprise Programs, UnitedHealth Group Minneapolis, MN GALEN VETTER Since 2013 Former Global CFO, Franklin Templeton Investments; Former Partner-in-Charge, Upper Midwest Region, RSM Minneapolis, MN KATIE LORENSON Executive Vice President and Chief Financial Officer 3 years with Alerus ANN MCCONN Executive Vice President and Chief Shared Services Officer 18 years with Alerus RYAN GOLDBERG Executive Vice President and Chief Revenue Officer Joined Alerus in 2020 KARIN TAYLOR Executive Vice President and Chief Risk Officer 2 years with Alerus SALLY SMITH Since 2007 Former President and CEO Buffalo Wild Wings, Inc. Minneapolis, MN LLOYD CASE Since 2005 Past President and CEO Forum Communications Co. Director, Forum Communications Fargo, ND KAREN BOHN Since 1999 President, Galeo Group, LLC Former Chief Administrative Officer Piper Jaffray Co. Edina, MN KEVIN LEMKE Since 1994 President Virtual Systems, Inc. Grand Forks, ND RANDY NEWMAN Chairman, President, and Chief Executive Officer 39 years with Alerus |
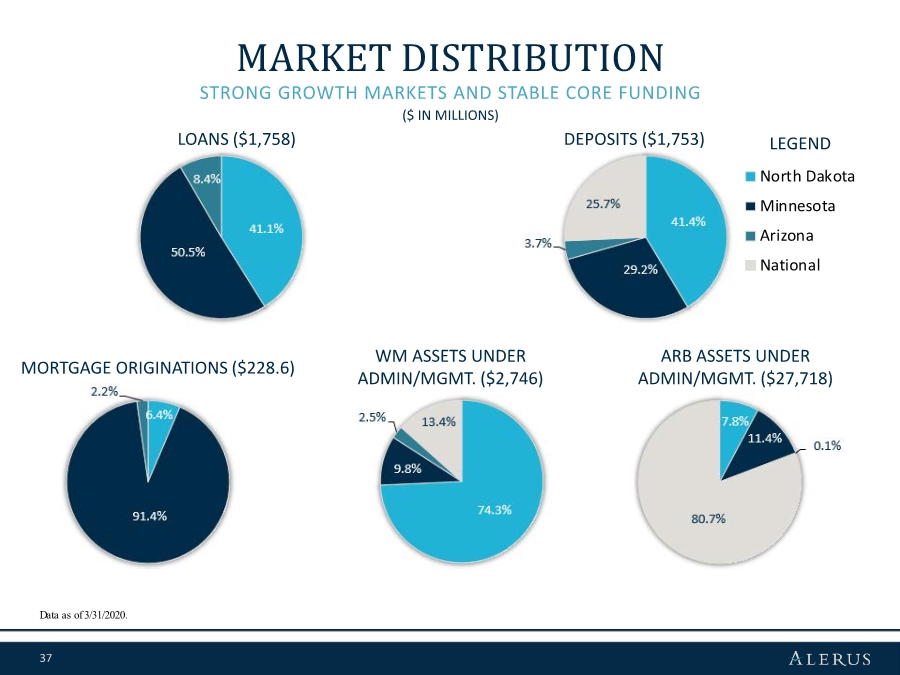
| 37 North Dakota Minnesota Arizona National STRONG GROWTH MARKETS AND STABLE CORE FUNDING MARKET DISTRIBUTION DEPOSITS ($1,753) LOANS ($1,758) ARB ASSETS UNDER ADMIN/MGMT. ($27,718) WM ASSETS UNDER ADMIN/MGMT. ($2,746) MORTGAGE ORIGINATIONS ($228.6) ($ IN MILLIONS) Data as of 3/31/2020. LEGEND |
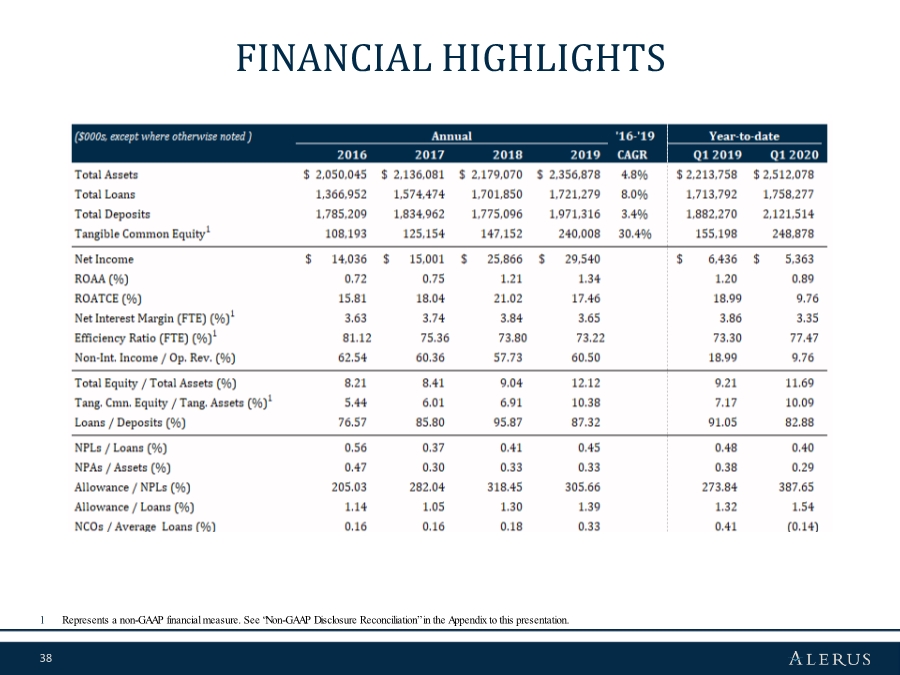
| 38 FINANCIAL HIGHLIGHTS 1 Represents a non-GAAP financial measure. See “Non-GAAP Disclosure Reconciliation” in the Appendix to this presentation. |
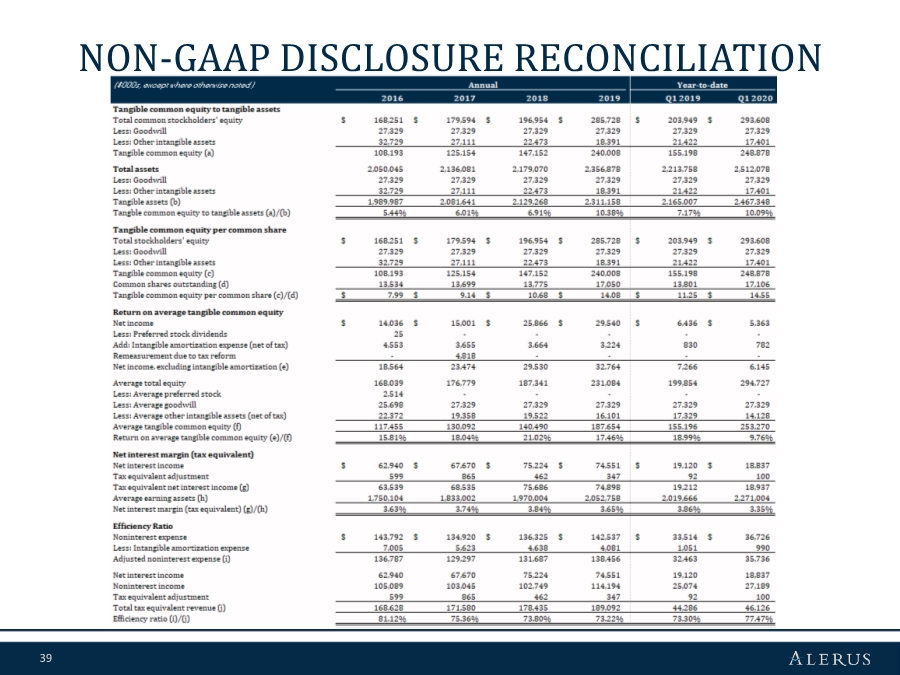
| 39 NON-GAAP DISCLOSURE RECONCILIATION |
Serious News for Serious Traders! Try StreetInsider.com Premium Free!
You May Also Be Interested In
- Alerus Financial Corporation (ALRS) Reports In-Line Q1 EPS
- Innovent to Present Clinical Data of Multiple Novel Molecules at the 2024 ASCO Annual Meeting
- UnitedAg CONNECT Conference 2024: A Resounding Success
Create E-mail Alert Related Categories
SEC FilingsSign up for StreetInsider Free!
Receive full access to all new and archived articles, unlimited portfolio tracking, e-mail alerts, custom newswires and RSS feeds - and more!
