

Form 6-K VersaBank For: Apr 30
 Tweet
Tweet Share
ShareExhibit 99.2

Management’s Discussion and Analysis
This management’s discussion and analysis (“MD&A”) of operations and financial condition for the second quarter of Fiscal 2022, dated May 30, 2022, should be read in conjunction with the unaudited interim consolidated financial statements for the period ended April 30, 2022, which have been prepared in accordance with International Financial Reporting Standards (“IFRS”). This MD&A should also be read in conjunction with VersaBank’s MD&A and Audited Consolidated Financial Statements for the year ended October 31, 2021, which are available on VersaBank’s website at www.versabank.com, SEDAR at www.sedar.com and EDGAR at https://www.sec.gov/edgar.shtml. Except as discussed below, all other factors discussed and referred to in the MD&A for the year ended October 31, 2021, remain substantially unchanged. All currency amounts in this document are in Canadian dollars unless otherwise indicated.
| Cautionary Note Regarding Forward-Looking Statements |
2 |
| About VersaBank |
3 |
| Update on Impact of COVID-19 |
3 |
| Overview of Performance |
4 |
| Selected Financial Highlights |
7 |
| Business Outlook |
8 |
| Financial Review – Earnings |
11 |
| Financial Review – Balance Sheet |
17 |
| Off-Balance Sheet Arrangements |
28 |
| Related Party Transactions |
28 |
| Capital Management and Capital Resources |
29 |
| Results of Operating Segments |
31 |
| Summary of Quarterly Results |
33 |
| Non-GAAP and Other Financial Measures |
34 |
| Significant Accounting Policies and Use of Estimates and Judgements |
36 |
| Controls and Procedures |
36 |
VersaBank – Q2 2022 MD&A
Cautionary Note Regarding Forward-Looking Statements
The statements in this management’s discussion and analysis that relate to the future are forward-looking statements. By their very nature, forward-looking statements involve inherent risks and uncertainties, both general and specific, many of which are out of VersaBank’s control. Risks exist that predictions, forecasts, projections and other forward-looking statements will not be achieved. Readers are cautioned not to place undue reliance on these forward-looking statements as a number of important factors could cause actual results to differ materially from the plans, objectives, expectations, estimates and intentions expressed in such forward-looking statements. These factors include, but are not limited to, the strength of the Canadian economy in general and the strength of the local economies within Canada in which VersaBank conducts operations; the effects of changes in monetary and fiscal policy, including changes in interest rate policies of the Bank of Canada; global commodity prices; the effects of competition in the markets in which VersaBank operates; inflation; capital market fluctuations; the timely development and introduction of new products in receptive markets; the impact of changes in the laws and regulations regulating financial services; changes in tax laws; technological changes; unexpected judicial or regulatory proceedings; unexpected changes in consumer spending and savings habits; the impact of wars or conflicts including the crisis in Ukraine and the impact of the crisis on global supply chains; the impact of new variants of COVID-19 and VersaBank’s anticipation of and success in managing the risks implicated by the foregoing. For a detailed discussion of certain key factors that may affect VersaBank’s future results, please VersaBank’s annual MD&A for the year ended October 31, 2021.
The foregoing list of important factors is not exhaustive. When relying on forward-looking statements to make decisions, investors and others should carefully consider the foregoing factors and other uncertainties and potential events. The forward-looking information contained in the management’s discussion and analysis is presented to assist VersaBank shareholders and others in understanding VersaBank financial position and may not be appropriate for any other purposes. Except as required by securities law, VersaBank does not undertake to update any forward-looking statement that is contained in this management’s discussion and analysis or made from time to time by VersaBank or on its behalf.
VersaBank – Q2 2022 MD&A
About VersaBank
VersaBank (the “Bank”) adopted an electronic branchless model in 1993, becoming the world’s first branchless financial institution. It holds a Canadian Schedule 1 chartered bank licence and obtains its deposits and the majority of its loans and leases digitally. In addition to its core Digital Banking operations, VersaBank has established cybersecurity services and banking and financial technology development operations through its wholly owned subsidiary, DRT Cyber Inc. (“DRTC”). VersaBank’s Common Shares trade on the Toronto Stock Exchange and Nasdaq under the symbol VBNK. Its Series 1 Preferred Shares trade on the Toronto Stock Exchange under the symbol VBNK.PR.A.
VersaBank continues to focus on increasing earnings by concentrating on underserved markets that support more attractive pricing for its products, leveraging existing distribution channels to deliver its financial products to these chosen markets and expanding its diverse deposit gathering network that provides efficient access to a range of low-cost deposit sources in order to maintain a low cost of funds.
The underlying drivers of VersaBank’s performance trends for the current and comparative periods are set out in the following sections of this MD&A.
Update on Impact of COVID-19
With public health restrictions being generally relaxed or removed altogether over the recent months management has commenced the implementation of VersaBank’s return-to-work strategy that is anticipated to accommodate the majority of staff transitioning from working remotely to working in a traditional office setting over the course of the third quarter of 2022.
Notwithstanding the above, VersaBank continues to monitor the data and information available related to the emergence of new variants of COVID-19 as well as attempt to anticipate the potential impact on the community, the Canadian economy and VersaBank’s business operations.
VersaBank – Q2 2022 MD&A
Overview of Performance
 |
 |
 |
 |
 |
 |
* See definition in the "Non-GAAP and Other Financial Measures" section below.
Q2 2022 vs Q1 2022
 |
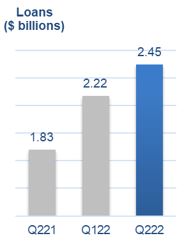
Loans increased 11% to $2.45 billion, driven by strong growth in VersaBank’s Point-of-Sale Loan and Lease Receivable (“POS Financing”) portfolio and Commercial Real Estate (“CRE”) portfolio; |
|
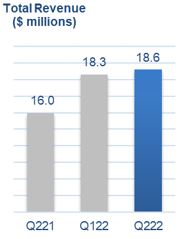
Total revenue increased 2% to $18.6 million, composed of net interest income of $17.2 million and non-interest income of $1.4 million, the latter derived primarily from DRTC (specifically Digital Boundary Group’s Cybersecurity Services); |
|
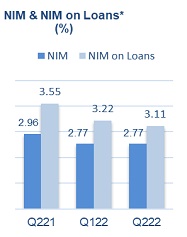
Net interest margin (NIM) was unchanged at 2.77% and NIM on loans decreased 11 bps to 3.11%, primarily the result of VersaBank’s strategy to grow its POS Financing portfolio, which generates lower average net interest margins than the CRE portfolio, and in which VersaBank was more aggressive with pricing in the second quarter of 2022 to capitalize on certain high-growth opportunities; |
VersaBank – Q2 2022 MD&A
|
Provision for credit losses was $78,000 compared to provision for credit losses of $2,000; |
|
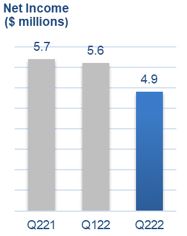
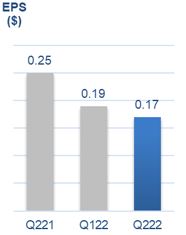
Net income and earnings per share (“EPS”) decreased 11% to $4.9 million and $0.17 per share respectively, with the decrease substantially attributable to costs related to investment in specific growth initiatives (including, but not limited to, the U.S. POS financing roll out and preparation for commercial launch of the Canadian-dollar version of VersaBank’s Digital Deposit Receipts, which has been branded as VCAD), as well as higher salary and benefits costs, and higher office expense resulting from the implementation of VersaBank’s return-to-work strategy, offset partially by higher total revenue; and, |
|
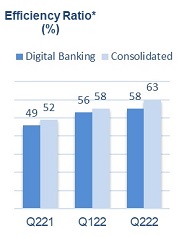
Efficiency ratio for the Digital Banking operations (excluding DRTC) increased to 58% attributable to the items noted above. |
Q2 2022 vs Q2 2021
|
Loans increased 34% driven by strong growth in VersaBank’s POS Financing and CRE portfolios; |
|
Total revenue increased 17% due to higher net interest income and higher non-interest income, the latter being generated DRTC; |
|
NIM decreased 19 bps due to lower yields earned on lending assets and higher cost of funds while NIM on loans decreased 44 bps, primarily the result of VersaBank’s strategy to grow its POS Financing portfolio, which generates lower average net interest margins than the CRE portfolio, and in which VersaBank was more aggressive with pricing in the second quarter of 2022 to capitalize on certain high-growth opportunities; |
|
Provision for credit losses was $78,000 compared with a recovery of credit loss provisions of $312,000; |
|
Net income and EPS decreased 14% and 32% respectively, with the magnitude of the EPS decrease being impacted by the issuance of 6.3 million common shares concurrent with VersaBank’s listing on Nasdaq in September, 2021; and, |
|
Efficiency ratio for the Digital Banking operations (excluding DRTC) increased to 58% attributable to the items noted above. |
Q2 YTD 2022 vs Q2 YTD 2021
|
Net income and EPS decreased 5% and 23% to $10.5 million and $0.36, respectively; |
|
NIM decreased 22 bps due to lower yields earned on assets, offset partially by lower cost of funds, primarily the result of VersaBank’s strategy to grow its POS Financing portfolio, which generates lower average net interest margins than the CRE portfolio, and in which VersaBank was more aggressive with pricing in the second quarter of 2022 to capitalize on certain high-growth opportunities; |
|
Provision for credit losses was $80,000 compared with a recovery of credit loss provisions of $255,000. |
VersaBank – Q2 2022 MD&A
Items of note
Q2 2022
| |
On March 31, 2022, VersaBank announced it entered into an agreement with its first Point-of-Sale Finance partner in the United States, a large, North American, commercial transportation financing business focused on independent owner/operators. |
|
On March 28, 2022, VersaBank announced successful completion of the independent third-party System and Organization Controls (SOC2) – Type I audit of its VersaVault®, VersaBank’s proprietary security technology for blockchain-based assets, which underpins the Bank’s revolutionary Digital Deposit Receipts. |
Q1 2022
| |
There were no material items of note in the quarter. |
Q2 2021
|
On April 30, 2021 VersaBank completed a private placement with U.S. institutional investors of non-viability contingent capital (“NVCC”) compliant fixed to floating rate subordinated notes payable (“the Notes”), in the principal amount of USD $75.0 million, equivalent to CAD $92.1 million as at April 30, 2021. The Notes will pay interest semi-annually in arrears on May 1 and November 1 of each year, beginning on November 1, 2021, at a fixed rate of 5.00% per year, until May 1, 2026. Proceeds of the Notes will be utilized to fund VersaBank’s POS Financing business in the United States, but will be held in US dollar denominated cash prior to deployment; |
|
On April 30, 2021, VersaBank redeemed all of its outstanding Non-Cumulative Series 3 preferred shares (NVCC) using cash on hand. The amount paid on redemption for each share was $10.00, and in aggregate $16.8 million. |
VersaBank – Q2 2022 MD&A
Selected Financial Highlights
|
(unaudited) |
for the three months ended |
for the six months ended |
||||||||||||||
|
April 30 |
April 30 |
April 30 |
April 30 |
|||||||||||||
|
($CDN thousands except per share amounts) |
2022 |
2021 |
2022 |
2021 |
||||||||||||
|
Results of operations |
||||||||||||||||
|
Interest income |
$ | 25,848 | $ | 21,649 | $ | 50,568 | $ | 43,164 | ||||||||
|
Net interest income |
17,242 | 15,095 | 34,127 | 29,469 | ||||||||||||
|
Non-interest income |
1,393 | 875 | 2,774 | 1,923 | ||||||||||||
|
Total revenue |
18,635 | 15,970 | 36,901 | 31,392 | ||||||||||||
|
Provision for (recovery of) credit losses |
78 | (312 | ) | 80 | (255 | ) | ||||||||||
|
Non-interest expenses |
11,767 | 8,342 | 22,403 | 16,429 | ||||||||||||
|
Digital Banking |
10,006 | 7,360 | 19,509 | 14,690 | ||||||||||||
|
DRTC |
1,803 | 1,023 | 2,977 | 1,808 | ||||||||||||
|
Net income |
4,943 | 5,744 | 10,509 | 11,034 | ||||||||||||
|
Income per common share: |
||||||||||||||||
|
Basic |
$ | 0.17 | $ | 0.25 | $ | 0.36 | $ | 0.47 | ||||||||
|
Diluted |
$ | 0.17 | $ | 0.25 | $ | 0.36 | $ | 0.47 | ||||||||
|
Dividends paid on preferred shares |
$ | 247 | $ | 542 | $ | 494 | $ | 1,084 | ||||||||
|
Dividends paid on common shares |
$ | 687 | $ | 528 | $ | 1,374 | $ | 1,056 | ||||||||
|
Yield* |
4.15 | % | 4.24 | % | 3.99 | % | 4.26 | % | ||||||||
|
Cost of funds* |
1.38 | % | 1.28 | % | 1.30 | % | 1.35 | % | ||||||||
|
Net interest margin* |
2.77 | % | 2.96 | % | 2.69 | % | 2.91 | % | ||||||||
|
Net interest margin on loans* |
3.11 | % | 3.55 | % | 3.14 | % | 3.55 | % | ||||||||
|
Return on average common equity* |
5.92 | % | 9.20 | % | 6.25 | % | 8.73 | % | ||||||||
|
Book value per common share* |
$ | 11.94 | $ | 11.06 | $ | 11.94 | $ | 11.06 | ||||||||
|
Efficiency ratio* |
63 | % | 52 | % | 61 | % | 52 | % | ||||||||
|
Efficiency ratio - Digital Banking* |
58 | % | 49 | % | 57 | % | 50 | % | ||||||||
|
Return on average total assets* |
0.75 | % | 1.02 | % | 0.79 | % | 0.98 | % | ||||||||
|
Gross impaired loans to total loans* |
0.00 | % | 0.00 | % | 0.00 | % | 0.00 | % | ||||||||
|
Provision (recovery) for credit losses as a % of average loans* |
0.01 | % | (0.07 | %) | 0.01 | % | (0.03 | %) | ||||||||
|
as at |
||||||||||||||||
|
Balance Sheet Summary |
||||||||||||||||
|
Cash |
$ | 198,157 | $ | 272,428 | $ | 198,157 | $ | 272,428 | ||||||||
|
Loans, net of allowance for credit losses |
2,450,276 | 1,829,776 | 2,450,276 | 1,829,776 | ||||||||||||
|
Average loans* |
2,332,957 | 1,811,750 | 2,276,663 | 1,742,343 | ||||||||||||
|
Total assets |
2,692,146 | 2,139,757 | 2,692,146 | 2,139,757 | ||||||||||||
|
Deposits |
2,124,916 | 1,679,273 | 2,124,916 | 1,679,273 | ||||||||||||
|
Subordinated notes payable |
98,410 | 94,392 | 98,410 | 94,392 | ||||||||||||
|
Shareholders' equity |
341,414 | 247,366 | 341,414 | 247,366 | ||||||||||||
|
Capital ratios* |
||||||||||||||||
|
Risk-weighted assets |
$ | 2,313,030 | $ | 1,763,424 | $ | 2,313,030 | $ | 1,763,424 | ||||||||
|
Common Equity Tier 1 capital |
315,963 | 220,740 | 315,963 | 220,740 | ||||||||||||
|
Total regulatory capital |
432,083 | 333,161 | 432,083 | 333,161 | ||||||||||||
|
Common Equity Tier 1 (CET1) ratio |
13.66 | % | 12.52 | % | 13.66 | % | 12.52 | % | ||||||||
|
Tier 1 capital ratio |
14.25 | % | 13.29 | % | 14.25 | % | 13.29 | % | ||||||||
|
Total capital ratio |
18.68 | % | 18.89 | % | 18.68 | % | 18.89 | % | ||||||||
|
Leverage ratio |
11.63 | % | 10.46 | % | 11.63 | % | 10.46 | % | ||||||||
|
* See definition in "Non-GAAP and Other Financial Measures" section below. |
|
** Capital management and leverage measures are in accordance with OSFI's Capital Adequacy Requirements and Basel III Accord. |
VersaBank – Q2 2022 MD&A
Business Outlook
VersaBank is active in underserved markets that support more attractive pricing for its lending products, and further, continues to develop and expand its diverse deposit gathering network that provides efficient access to a range of low-cost deposit sources. In addition, VersaBank remains highly committed to, and focused on further developing and enhancing its technology advantage, a key component of its value proposition that not only provides efficient access to VersaBank’s chosen underserved lending and deposit markets, but also delivers superior financial products and better customer service to its clients.
Management is closely monitoring the geo-political risk precipitated by the crisis in Ukraine and its potential impact on VersaBank’s business. At this time, management has not identified any material direct or indirect risk exposure to VersaBank resulting from the conflict and will continue to assess available information and evaluate the situation as it evolves.
While VersaBank does not provide guidance on specific performance metrics, the commentary provided below related to aspects of VersaBank’s business and certain expected trends related to same, in management’s view, could potentially impact future performance.
Lending Assets
|
Point-of-Sale Financing: Consumer spending in Canada is expected to remain strong as a function of a tight labour market and as excess savings continue to be deployed into a range of durable goods, including assets related to home improvements, as well as home purchases for which VersaBank’s POS loan and lease origination partners provide financing. These trends, combined with the anticipated addition of new origination partners, represent key drivers of what is expected to be strong POS Financing balance sheet growth over the course of the second half of fiscal 2022. In addition, VersaBank entered the US lending market in the second quarter of 2022 through the completion of a receivable purchase transaction with its first US-based, POS Financing origination partner, a large, North American, commercial transportation financing business focused on independent owner/operators. Management anticipates measured growth in its US POS Financing portfolio over the second half of fiscal 2022 as VersaBank continues to source and onboard new origination partners that operate with a credit risk profile that is aligned with VersaBank’s risk appetite. |
VersaBank – Q2 2022 MD&A
|
Commercial Real Estate: VersaBank anticipates continued growth in the commercial mortgage sector over the course of the second half of fiscal 2022, specifically related to financing for residential housing properties, albeit somewhat moderated relative to management’s view in the first half of fiscal 2022. Notwithstanding VersaBank’s significant risk mitigation related to this portfolio, including working with well-established, well-capitalized partners and low loan-to-value ratios, management has taken a cautionary stance with respect to the CRE portfolio due to the anticipation of volatility in CRE asset valuations in a rising interest rate environment and the potential impact of same on borrowers’ ability to service debt, as well as due to concerns related to higher commodity prices attributable to current global supply chain disruptions and a very tight labour market, both of which have the potential to drive higher construction costs. Management expects growth in the second half of 2022 to be driven primarily by real estate development in communities on the periphery of the major city centres as a result of consumers continuing to seek more affordable housing outside of the city centres, as well as the federal government’s efforts to revitalize immigration programs. Finally, management continues to pursue opportunities to develop more meaningful balance sheet exposure to the B-20 compliant conventional, uninsured mortgage financing space. |
Credit Quality
|
VersaBank lends to underserved markets that support more attractive pricing for its lending products but typically exhibit a lower-than-average risk profile generally as a function of the lower inherent risk associated with the underlying collateral assets and/or the structure of VersaBank’s offered financing arrangements; |
|
VersaBank has no loans on its balance sheet that are subject to payment deferrals, no impaired loans and no loans in arrears, however, continues to monitor its lending portfolio and the underlying borrowers as well as origination partners closely to ensure that management has good visibility on credit trends that could provide an early warning indication of the emergence of any elevated risk in the lending portfolio; |
|
Forward-looking macroeconomic and industry data remains somewhat dynamic and as a result, management anticipates that estimated expected credit loss (“ECL”) amounts may continue to exhibit modest volatility over the course of fiscal 2022, most specifically as a function of the velocity and magnitude of monetary policy tightening and the impact of same on inflation levels and consumers’ ability to service household debt, the endurance of a tight labour market, geo-political risk precipitated by the crisis in Ukraine and the impact of the conflict on global supply chains as well as the emergence and impact of new variants of COVID-19. Notwithstanding the above, management also expects that the lower risk profile of VersaBank’s lending portfolio, which is a function of VersaBank’s prudent underwriting practices, and its focus on underserved financing markets within which it has a wealth of experience will contribute to mitigating potential volatility in its forward ECL amounts; and, |
|
VersaBank has sourced credit risk modeling systems and forecast macroeconomic scenario data from Moody’s Analytics, a third-party service provider, for the purpose of computing forward-looking credit risk parameters under multiple macroeconomic scenarios that consider both market-wide and idiosyncratic factors and influences. These credit risk modeling systems are used in conjunction with VersaBank’s internally developed ECL models. Management continues to see dynamic, modestly improving trends in the macroeconomic data used as forward-looking information in VersaBank’s credit risk models and depending on the growth trajectory and composition of the lending portfolio, these improving trends could result in VersaBank recognizing lower provisions for credit losses, or potentially even recognizing further recoveries in the coming quarters. However, if the performance of the Canadian economy is not aligned with the current forecast macroeconomic trends, and further, begins to deteriorate, VersaBank’s borrowers could be exposed to credit risk that could result in loan deferrals and/or loan defaults and have an unfavourable impact on VersaBank’s estimated ECL. |
VersaBank – Q2 2022 MD&A
Funding and Liquidity
|
Management anticipates that commercial deposit volumes raised via VersaBank’s Trustee Integrated Banking (“TIB”) program will grow over the second half of fiscal 2022 as a function of an increase in the volume of consumer bankruptcy and proposal restructuring proceedings over the same timeframe attributable to the Bank of Canada continuing to tighten monetary policy over the course of the year. Further, VersaBank continues to grow and expand its well-established, diverse deposit broker network through which it sources personal deposits, consisting primarily of guaranteed investment certificates. Management expects that the combination of the operational trends set out above will mitigate the expansion of its cost of funds, despite the anticipation of the Bank of Canada instituting multiple rate increases over the course of the second half of the year; and, |
|
Management anticipates that liquidity levels will remain reasonably consistent over the course of fiscal 2022 as VersaBank continues to fund anticipated, additional balance sheet growth across each of its lines of business. |
Earnings and Capital
|
Earnings growth in fiscal 2022 will be realized as a function primarily of anticipated organic balance sheet growth and incremental earnings contributions from DRTC, offset partially by higher non-interest expenses attributable to costs related to investment in specific growth initiatives (including the U.S. POS financing roll out and preparation for commercial launch of the Canadian-dollar version of VersaBank’s Digital Deposit Receipts), as well as the costs related to the retention of staff in a very tight labour market; |
|
Net interest income growth is expected to be a function primarily of the expansion of each of VersaBank’s core business lines across key lending asset categories, disciplined liquidity management and the expectation that VersaBank will be able to continue to mitigate the expansion of its cost of funds, despite the anticipation of the Bank of Canada instituting multiple rate increases over the course of the second half of the year; |
|
Non-interest income growth will be a function primarily of DRTC, specifically Digital Boundary Group, deploying its suite of cybersecurity solutions into the market which includes financial institutions, multi-national corporations and government entities; |
|
VersaBank’s capital ratios remain comfortably in excess of regulatory minimums. Management is of the view that VersaBank’s current capital levels are sufficient to accommodate anticipated, medium term balance sheet growth, however; management will continue to closely monitor the capital markets to identify opportunities for VersaBank to raise additional regulatory capital on attractive terms in order to position VersaBank to support a potentially more robust growth profile; and, |
VersaBank – Q2 2022 MD&A
|
Management does not anticipate increasing VersaBank’s dividend rate over the course of the second half of fiscal 2022 in order to ensure that it continues to have adequate regulatory capital available to support balance sheet growth as well as specific business development initiatives for earnings growth currently contemplated over the same period and remain in compliance with its established regulatory capital ratio targets and thresholds. |
There is potential that VersaBank may not realize or achieve the anticipated performance trends set out above as a function of a number of factors and variables including, but not limited to, the strength of the Canadian economy in general and the strength of the local economies within Canada in which VersaBank conducts operations; the effects of changes in monetary and fiscal policy, including changes in the interest rate policies of the Bank of Canada; global commodity prices; the effects of competition in the markets in which VersaBank operates; inflation; capital market fluctuations; the timely development and introduction of new products in receptive markets; the ability of VersaBank to grow its business and execute its strategy in the US market; the impact of changes in the laws and regulations regulating financial services; the impact of wars or conflicts including the crisis in Ukraine; and the impact of new variants of COVID-19 on the Canadian economy. Please see “Cautionary Note Regarding Forward-Looking Statements” on page 2 of this MD&A.
Financial Review – Earnings
Total Revenue
Total revenue, which consists of net interest income and non-interest income, increased 2% to $18.6 million compared to the first quarter of 2022 and increased 17% compared to the same period a year ago. Total revenue for the six months ended April 30, 2022 increased 18% to $36.9 million compared to the same period a year ago.
Net Interest Income
|
(thousands of Canadian dollars) |
||||||||||||||||||||||||||||||||
|
For the three months ended: |
For the six months ended: |
|||||||||||||||||||||||||||||||
|
April 30 |
January 31 |
April 30 |
April 30 |
April 30 |
||||||||||||||||||||||||||||
|
2022 |
2022 |
Change |
2021 |
Change |
2022 |
2021 |
Change |
|||||||||||||||||||||||||
|
Interest income |
||||||||||||||||||||||||||||||||
|
Point-of-sale loans and leases |
$ | 16,006 | $ | 14,455 | 11 | % | $ | 11,484 | 39 | % | $ | 30,461 | $ | 22,985 | 33 | % | ||||||||||||||||
|
Commercial real estate mortgages |
9,171 | 9,753 | (6 | %) | 9,330 | (2 | %) | 18,924 | 18,440 | 3 | % | |||||||||||||||||||||
|
Commercial real estate loans |
179 | 192 | (7 | %) | 362 | (51 | %) | 371 | 704 | (47 | %) | |||||||||||||||||||||
|
Public sector and other financing |
116 | 114 | 2 | % | 125 | (7 | %) | 230 | 258 | (11 | %) | |||||||||||||||||||||
|
Other |
376 | 206 | 83 | % | 348 | 8 | % | 582 | 777 | (25 | %) | |||||||||||||||||||||
|
Interest income |
$ | 25,848 | $ | 24,720 | 5 | % | $ | 21,649 | 19 | % | $ | 50,568 | $ | 43,164 | 17 | % | ||||||||||||||||
|
Interest expense |
||||||||||||||||||||||||||||||||
|
Deposit and other |
$ | 7,239 | $ | 6,469 | 12 | % | $ | 6,414 | 13 | % | $ | 13,708 | $ | 13,428 | 2 | % | ||||||||||||||||
|
Subordinated notes |
1,367 | 1,366 | 0 | % | 140 | 876 | % | 2,733 | 267 | 924 | % | |||||||||||||||||||||
|
Interest expense |
$ | 8,606 | $ | 7,835 | 10 | % | $ | 6,554 | 31 | % | $ | 16,441 | $ | 13,695 | 20 | % | ||||||||||||||||
|
Net interest income |
$ | 17,242 | $ | 16,885 | 2 | % | $ | 15,095 | 14 | % | $ | 34,127 | $ | 29,469 | 16 | % | ||||||||||||||||
|
Non-interest income |
$ | 1,393 | $ | 1,381 | 1 | % | $ | 875 | 59 | % | $ | 2,774 | $ | 1,923 | 44 | % | ||||||||||||||||
|
Total revenue |
$ | 18,635 | $ | 18,266 | 2 | % | $ | 15,970 | 17 | % | $ | 36,901 | $ | 31,392 | 18 | % | ||||||||||||||||
VersaBank – Q2 2022 MD&A
Q2 2022 vs Q1 2022
Net interest income increased 2% to $17.2 million as a function primarily of:
|
Higher interest income earned on higher lending asset balances. |
Offset partially by:
|
Lower fees earned on VersaBank’s CRE mortgage portfolio; and, |
|
Higher interest expense attributable to higher deposit balances. |
Q2 2022 vs Q2 2021
Net interest income was up 14% as a function primarily of:
|
Higher interest income earned on higher lending asset balances. |
Offset partially by:
|
Lower fees earned on VersaBank’s CRE mortgage portfolio; |
|
Higher interest expense attributable to higher deposit balances; and, |
|
Higher interest expense attributable to the Notes. |
Q2 YTD 2022 vs Q2 YTD 2021
Net interest income was up 16% to $34.1 million a function primarily of:
|
Higher interest income earned on higher lending assets; and, |
|
Redeployment of cash into higher yielding lending assets. |
Offset partially by:
|
Higher interest expense attributable to higher deposit balances; and, |
|
Higher interest expense attributable to the Notes. |
VersaBank – Q2 2022 MD&A
Net Interest Margin
|
(thousands of Canadian dollars) |
||||||||||||||||||||||||||||||||
|
For the three months ended: |
For the six months ended: |
|||||||||||||||||||||||||||||||
|
April 30 |
January 31 |
April 30 |
April 30 |
April 30 |
||||||||||||||||||||||||||||
|
2022 |
2022 |
Change |
2021 |
Change |
2022 |
2021 |
Change |
|||||||||||||||||||||||||
|
Interest income |
$ | 25,848 | $ | 24,720 | 5 | % | $ | 21,649 | 19 | % | $ | 50,568 | $ | 43,164 | 17 | % | ||||||||||||||||
|
Interest expense |
8,606 | 7,835 | 10 | % | 6,554 | 31 | % | 16,441 | 13,695 | 20 | % | |||||||||||||||||||||
|
Net interest income |
17,242 | 16,885 | 2 | % | 15,095 | 14 | % | 34,127 | 29,469 | 16 | % | |||||||||||||||||||||
|
Average assets |
$ | 2,553,746 | $ | 2,415,216 | 6 | % | $ | 2,092,367 | 22 | % | $ | 2,553,616 | $ | 2,041,821 | 25 | % | ||||||||||||||||
|
Yield* |
4.15 | % | 4.06 | % | 2 | % | 4.24 | % | (2% | ) | 3.99 | % | 4.26 | % | (6% | ) | ||||||||||||||||
|
Cost of funds* |
1.38 | % | 1.29 | % | 7 | % | 1.28 | % | 8 | % | 1.30 | % | 1.35 | % | (4% | ) | ||||||||||||||||
|
Net interest margin* |
2.77 | % | 2.77 | % | 0 | % | 2.96 | % | (6% | ) | 2.69 | % | 2.91 | % | (8% | ) | ||||||||||||||||
|
Average gross loans |
$ | 2,325,331 | $ | 2,152,383 | 8 | % | $ | 1,806,432 | 29 | % | $ | 2,269,256 | $ | 1,737,225 | 31 | % | ||||||||||||||||
|
Net interst margin on loans* |
3.11 | % | 3.22 | % | (3% | ) | 3.55 | % | (12% | ) | 3.14 | % | 3.55 | % | (12% | ) | ||||||||||||||||
|
* See definition in "Non-GAAP and Other Financial Measures" section below. |
||||||||||||||||||||||||||||||||
Q2 2022 vs Q1 2022
Net interest margin was unchanged as a function primarily of:
| |
VersaBank’s strategy to grow its POS Financing portfolio, which generates lower average net interest margins than the CRE portfolio, and in which VersaBank was more aggressive with pricing in the second quarter of 2022 to capitalize on certain high-growth opportunities. |
Q2 2022 vs Q2 2021
Net interest margin decreased 19 bps as a function primarily of:
|
VersaBank’s strategy to grow its POS Financing portfolio, which generates lower average net interest margins than the CRE portfolio, and in which VersaBank was more aggressive with pricing in the second quarter of 2022 to capitalize on certain high-growth opportunities. |
Q2 YTD 2022 vs Q2 YTD 2021
Net interest margin decreased 22 bps as a function primarily of the items set out above.
Non-Interest Income
Non-interest income reflects the consolidation of the gross profit generated by DRTC (specifically Digital Boundary Group’s Cybersecurity Services) and income derived from miscellaneous transaction fees not directly attributable to lending assets.
Non-interest income for the quarter was $1.4 million compared to $1.4 million last quarter and $875,000 for the same period a year ago. The year over year trend was a function primarily of the comparative period reflecting scheduled client engagements being deferred to later in Fiscal 2021 due to the impact of COVID-19 on client operations.
VersaBank – Q2 2022 MD&A
Non-interest income for the six months ended April 30, 2022 was $2.8 million compared to $1.9 million for the same period a year ago. The year over year trend was a function primarily of the comparative period including only five months of operations due to the timing of the acquisition of DBG on November 30, 2020.
Provision for Credit Losses
|
(thousands of Canadian dollars) |
||||||||||||||||||||
|
For the three months ended: |
For the six months ended: |
|||||||||||||||||||
|
April 30 |
January 31 |
April 30 |
April 30 |
April 30 |
||||||||||||||||
|
2022 |
2022 |
2021 |
2022 |
2021 |
||||||||||||||||
|
Provision for (recovery of) credit losses: |
||||||||||||||||||||
|
Point-of-sale loans and leases |
$ | 49 | $ | 95 | $ | 31 | $ | 144 | $ | 23 | ||||||||||
|
Commercial real estate mortgages |
4 | (69 | ) | (205 | ) | (65 | ) | (58 | ) | |||||||||||
|
Commercial real estate loans |
4 | (9 | ) | (23 | ) | (5 | ) | (88 | ) | |||||||||||
|
Public sector and other financing |
21 | (15 | ) | (115 | ) | 6 | (132 | ) | ||||||||||||
|
Provision for (recovery of) credit losses |
$ | 78 | $ | 2 | $ | (312 | ) | $ | 80 | $ | (255 | ) | ||||||||
Q2 2022 vs Q1 2022
VersaBank recorded a provision for credit losses in the amount of $78,000 in the current quarter compared to a provision for credit losses in the amount of $2,000 in the comparative period as a function primarily of:
|
Higher lending asset balances. |
Offset partially by:
|
Changes in VersaBank’s lending asset portfolio mix; and, |
|
Changes in the forward-looking information used by VersaBank in its credit risk models in the current quarter. |
Q2 2022 vs Q2 2021
VersaBank recorded a provision for credit losses in the amount of $78,000 in the current quarter compared to a recovery of credit loss provisions in the amount of $312,000 in the comparative period as a function primarily of:
|
Higher lending asset balances. |
Offset partially by:
|
Changes in VersaBank’s lending asset portfolio mix; and, |
|
Changes in the forward-looking information used by VersaBank in its credit risk models in the current quarter. |
VersaBank – Q2 2022 MD&A
Q2 YTD 2022 vs Q2 YTD 2021
VersaBank recorded a provision for credit losses in the amount of $80,000 in the current period compared to a recovery of credit loss provisions in the amount of $255,000 in the comparative period as a function primarily of the items set out above.
Non-Interest Expenses
|
(thousands of Canadian dollars) |
||||||||||||||||||||||||||||||||
|
For the three months ended: |
For the six months ended: |
|||||||||||||||||||||||||||||||
|
April 30 |
January 31 |
April 30 |
April 30 |
April 30 |
||||||||||||||||||||||||||||
|
2022 |
2022 |
Change |
2021 |
Change |
2022 |
2021 |
Change |
|||||||||||||||||||||||||
|
Salaries and benefits |
$ | 6,726 | $ | 6,083 | 11 | % | $ | 4,953 | 36 | % | $ | 12,809 | $ | 9,983 | 28 | % | ||||||||||||||||
|
General and administrative |
4,019 | 3,624 | 11 | % | 2,383 | 69 | % | 7,643 | 4,722 | 62 | % | |||||||||||||||||||||
|
Premises and equipment |
1,022 | 929 | 10 | % | 1,006 | 2 | % | 1,951 | 1,724 | 13 | % | |||||||||||||||||||||
|
Total non-interest expenses |
$ | 11,767 | $ | 10,636 | 11 | % | $ | 8,342 | 41 | % | $ | 22,403 | $ | 16,429 | 36 | % | ||||||||||||||||
|
Efficiency Ratio |
63.14 | % | 58.23 | % | 8 | % | 52.24 | % | 21 | % | 60.71 | % | 52.33 | % | 16 | % | ||||||||||||||||
Q2 2022 vs Q1 2022
Non-interest expenses increased 11% to $11.8 million as a function primarily of:
|
Higher costs related to investment in specific growth initiatives, including the U.S. POS financing roll out and preparation for commercial launch of the Canadian-dollar version of its Digital Deposit Receipts; |
|
Higher consulting and professional fees associated with preparation and launch of VersaBank’s U.S. POS Financing business; |
|
Higher salary and benefits expense attributable to higher staffing levels to support expanded business activity across VersaBank and higher costs associated with employee retention; and, |
|
Higher office and facility related costs attributable to the implementation of VersaBank’s return-to-work strategy. |
Q2 2022 vs Q2 2021
Non-interest expenses increased 41% as a function primarily of:
|
Higher costs related to investment in specific growth initiatives, including the U.S. POS financing roll out and preparation for commercial launch of the Canadian-dollar version of its Digital Deposit Receipts; |
|
Higher consulting and professional fees associated with preparation and launch of VersaBank’s U.S. Point-of-Sale Financing business; |
|
Higher insurance premiums attributable to the Bank’s listing on the Nasdaq in September 2021; |
|
Higher salary and benefits expense attributable to higher staffing levels to support expanded business activity across VersaBank and higher costs associated with employee retention; and, |
|
Higher office and facility related costs attributable to the implementation of VersaBank’s return-to-work strategy. |
VersaBank – Q2 2022 MD&A
Q2 YTD 2022 vs Q2 YTD 2021
Non-interest expenses increased 36% as a function primarily of the items set out above and the current period including six months of operating expenses of DBG compared to five months of operating expenses included in the comparative period due to the timing of VersaBank’s acquisition of DBG on November 30, 2020.
Income Tax Provision
VersaBank’s tax rate is approximately 27%, similar to that of previous periods. The tax rate is impacted by certain items not being taxable or deductible for income tax purposes. Provision for income taxes for the current quarter was $1.8 million compared to $2.1 million last quarter and $2.2 million for the same period a year ago.
Provision for income taxes for the six months ended April 30, 2022 was $3.9 million compared to $4.2 million for the same period a year ago.
VersaBank – Q2 2022 MD&A
Financial Review – Balance Sheet
|
(thousands of Canadian dollars) |
||||||||||||||||||||
|
April 30 |
January 31 |
April 30 |
||||||||||||||||||
|
2022 |
2022 |
Change |
2021 |
Change |
||||||||||||||||
|
Total assets |
$ | 2,692,146 | $ | 2,415,346 | 11 | % | $ | 2,139,757 | 26 | % | ||||||||||
|
Cash |
198,157 | 155,239 | 28 | % | 272,428 | (27 | %) | |||||||||||||
|
Loans, net of allowance for credit losses |
2,450,276 | 2,215,638 | 11 | % | 1,829,776 | 34 | % | |||||||||||||
|
Deposits |
2,124,916 | 1,847,003 | 15 | % | 1,679,273 | 27 | % | |||||||||||||
Total Assets
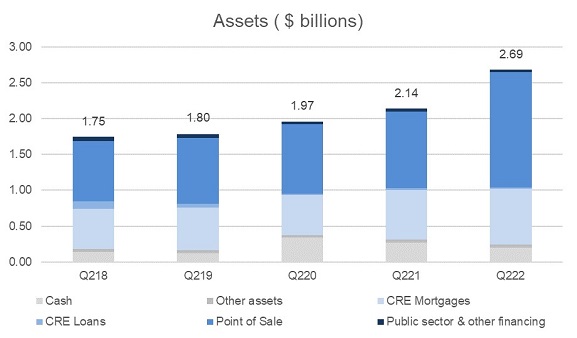
Total assets at April 30, 2022, were $2.69 billion compared to $2.42 billion last quarter and $2.14 billion a year ago. The quarter over quarter and year over year trends were a function primarily of growth in VersaBank’s POS Financing and CRE Mortgages portfolios.
VersaBank – Q2 2022 MD&A
Cash
Cash, which is held primarily for liquidity purposes, was $198.2 million or 7% of total assets at April 30, 2022, compared to $155.2 million or 6% of total assets last quarter and $272.4 million or 13% of total assets a year ago. The quarter over quarter trend was a function primarily of VersaBank increasing liquidity over the course of the current quarter in preparation to fund new loans in the pipeline. The year over year trend was a function primarily of VersaBank deploying cash into higher yielding lending assets over the course of the year offset partially by VersaBank increasing liquidity over the course of the current quarter in preparation to fund new loans in the pipeline.
Loans
|
(thousands of Canadian dollars) |
||||||||||||||||||||
|
April 30 |
January 31 |
April 30 |
||||||||||||||||||
|
2022 |
2022 |
Change |
2021 |
Change |
||||||||||||||||
|
Point-of-sale loans and leases |
$ | 1,610,336 | $ | 1,439,781 | 12 | % | $ | 1,067,135 | 51 | % | ||||||||||
|
Commercial real estate mortgages |
782,274 | 722,829 | 8 | % | 686,909 | 14 | % | |||||||||||||
|
Commercial real estate loans |
14,065 | 14,600 | (4 | %) | 34,897 | (60 | %) | |||||||||||||
|
Public sector and other financing |
35,529 | 31,247 | 14 | % | 35,362 | 0 | % | |||||||||||||
| $ | 2,442,204 | $ | 2,208,457 | 11 | % | $ | 1,824,303 | 34 | % | |||||||||||
VersaBank organizes its lending portfolio into the following four broad asset categories: Point of Sale Loans & Leases, Commercial Real Estate Mortgages, Commercial Real Estate Loans, and Public Sector and Other Financing. These categories have been established in VersaBank’s proprietary, internally developed asset management system and have been designed to catalogue individual lending assets as a function primarily of their key risk drivers, the nature of the underlying collateral, and the applicable market segment.
The Point-of-Sale Loans and Leases (“POS Financing”) asset category is comprised of Point-of-Sale Loan and Lease Receivables acquired from VersaBank’s broad network of origination and servicing partners as well as Warehouse Loans that provide bridge financing to VersaBank’s origination and servicing partners for the purpose of accumulating and seasoning practical volumes of individual loans and leases prior to VersaBank purchasing the cashflow receivables derived from same.
The Commercial Real Estate Mortgages (“CRE Mortgages”) asset category is comprised of Commercial and Residential Construction Mortgages, Commercial Term Mortgages, Commercial Insured Mortgages and Land Mortgages. While all of these loans would be considered commercial loans or business-to-business loans, the underlying credit risk exposure is diversified across both the commercial and retail market segments, and further, the portfolio benefits from diversity in its underlying security in the form of a broad range of collateral properties.
The Commercial Real Estate Loans (“CRE Loans”) asset category is comprised primarily of Condominium Corporation Financing loans.
VersaBank – Q2 2022 MD&A
The Public Sector and Other Financing (“PSOF”) asset category is comprised primarily of Public Sector Loans and Leases, a small balance of Corporate Loans and Leases and Single Family Residential Conventional and Insured Mortgages. VersaBank has de-emphasized Corporate lending and continues to monitor the public sector space in anticipation of more robust demand for Federal, Provincial and Municipal infrastructure and other project financings.
Q2 2022 vs Q1 2022
Loans increased 11% to $2.45 billion as a function primarily of:
|
Higher POS Financing portfolio balances attributable primarily to continued strong demand for home finance, auto and home improvement/HVAC receivable financing; and, |
|
Higher CRE Mortgage portfolio balances attributable primarily to growth in residential mortgage financing; and, |
|
Higher PSOF portfolio balances. |
Q2 2022 vs Q2 2021
Loans increased 34% as a function primarily of the items set out above offset partially by lower CRE Loan balances.
Residential Mortgage Exposures
In accordance with the Office of the Superintendent of Financial Institutions (“OSFI”) Guideline B-20 – Residential Mortgage Underwriting Practices and Procedures, additional information is provided regarding VersaBank’s residential mortgage exposure. For the purposes of the Guideline, a residential mortgage is defined as a loan to an individual that is secured by residential property (one-to-four-unit dwellings) and includes home equity lines of credit (HELOCs). This differs from the classification of residential mortgages used by VersaBank which also includes multi-family residential mortgages.
Under OSFI’s definition, VersaBank’s exposure to residential mortgages at April 30, 2022, was $2.4 million compared to $2.4 million last quarter and $3.8 million a year ago. VersaBank did not have any HELOC’s outstanding at April 30, 2022, last quarter or a year ago.
Credit Quality and Allowance for Credit Losses
As discussed previously, VersaBank currently has no loans on its balance sheet that are subject to payment deferrals, no impaired loans and no loans in arrears, but continues to monitor its lending portfolio, as well as the underlying borrowers and origination partners closely to ensure that management has good visibility on any credit trends that could provide an early warning indication of the emergence of any elevated risk in VersaBank’s lending portfolio.
VersaBank – Q2 2022 MD&A
Allowance for Credit Losses
VersaBank must maintain an allowance for expected credit losses or ECL allowance that is adequate, in management’s opinion, to absorb all credit related losses in VersaBank’s lending and treasury portfolios. Under IFRS 9 VersaBank’s ECL allowance is estimated using the expected credit loss methodology and is comprised of expected credit losses recognized on both performing loans, and non-performing, or impaired loans even if no actual loss event has occurred.
| (thousands of Canadian dollars) | ||||||||||||||||||||
|
April 30 |
January 31 |
April 30 |
||||||||||||||||||
|
2022 |
2022 |
Change |
2021 |
Change |
||||||||||||||||
|
ECL allowance by lending asset: |
||||||||||||||||||||
|
Point-of-sale loans and leases |
$ | 419 | $ | 370 | 13 | % | $ | 238 | 76 | % | ||||||||||
|
Commercial real estate mortgages |
1,051 | 1,045 | 1 | % | 1,308 | (20 | %) | |||||||||||||
|
Commercial real estate loans |
40 | 36 | 11 | % | 49 | (18 | %) | |||||||||||||
|
Public sector and other financing |
23 | 4 | 475 | % | 41 | (44 | %) | |||||||||||||
|
Total ECL allowance |
$ | 1,533 | $ | 1,455 | 5 | % | $ | 1,636 | (6 | %) | ||||||||||
|
(thousands of Canadian dollars) |
||||||||||||||||||||
|
April 30 |
January 31 |
April 30 |
||||||||||||||||||
|
2022 |
2022 |
Change |
2021 |
Change |
||||||||||||||||
|
ECL allowance by stage: |
||||||||||||||||||||
|
ECL allowance stage 1 |
$ | 1,431 | $ | 1,359 | 5 | % | $ | 1,407 | 2 | % | ||||||||||
|
ECL allowance stage 2 |
102 | 96 | 6 | % | 229 | (55 | %) | |||||||||||||
|
ECL allowance stage 3 |
- | - | - | |||||||||||||||||
|
Total ECL allowance |
$ | 1,533 | $ | 1,455 | 5 | % | $ | 1,636 | (6 | %) | ||||||||||
Q2 2022 vs Q1 2022
VersaBank’s ECL allowance at April 30, 2022 was $1.53 million compared to $1.46 million last quarter as a function primarily of:
| |
Higher lending asset balances. |
Offset partially by:
|
Changes in VersaBank’s lending asset portfolio mix; and, |
|
Changes in the forward-looking information used by VersaBank in its credit risk models. |
VersaBank – Q2 2022 MD&A
Q2 2022 vs Q2 2021
VersaBank’s ECL allowance at April 30, 2022 was $1.53 million compared to $1.64 million a year ago as a function primarily of:
|
Changes in VersaBank’s lending asset portfolio mix; and, |
|
Changes in the forward-looking information used by VersaBank in its credit risk models. |
Offset partially by:
|
Higher lending asset balances. |
VersaBank’s gross impaired loans at April 30, 2022 were $nil compared to $nil last quarter and $nil a year ago.
Assessment of significant increase in credit risk (“SICR”)
At each reporting date, VersaBank assesses whether or not there has been a SICR for loans since initial recognition by comparing, at the reporting date, the risk of default occurring over the remaining expected life against the risk of default at initial recognition.
SICR is a function of the loan’s internal risk rating assignment, internal watchlist status, loan review status and delinquency status which are updated as necessary in response to changes including, but not limited to, changes in macroeconomic and/or market conditions, changes in a borrower’s credit risk profile, and changes in the strength of the underlying security, including guarantor status, if a guarantor exists.
Quantitative models may not always be able to capture all reasonable and supportable information that may indicate a SICR. As a result, qualitative factors may be considered to supplement such a gap.
Examples include changes in adjudication criteria for a particular group of borrowers or asset categories or changes in portfolio composition as well as changes in Canadian macroeconomic trends attributable to changes in monetary policy, inflation, employment rates, consumer behaviour and public health advice related to the continued management of the impact of COVID-19.
Forward-Looking Information
VersaBank incorporates the impact of future economic conditions, or more specifically forward-looking information into the estimation of expected credit losses at the credit risk parameter level. This is accomplished via the credit risk parameter models and proxy datasets that VersaBank utilizes to develop probability of default, (“PD”) and loss given default, (“LGD”) term structure forecasts for its loans. VersaBank has sourced credit risk modeling systems and forecast macroeconomic scenario data from Moody’s Analytics, a third-party service provider for the purpose of computing forward-looking credit risk parameters under multiple macroeconomic scenarios that consider both market-wide and idiosyncratic factors and influences. These systems are used in conjunction with VersaBank’s internally developed ECL models. Given that VersaBank has experienced very limited historical losses and, therefore, does not have available statistically significant loss data inventory for use in developing internal, forward looking expected credit loss trends, the use of unbiased, third-party forward-looking credit risk parameter modeling systems is particularly important for VersaBank in the context of the estimation of expected credit losses.
VersaBank – Q2 2022 MD&A
VersaBank utilizes macroeconomic indicator data derived from multiple macroeconomic scenarios in order to mitigate volatility in the estimation of expected credit losses, as well as to satisfy the IFRS 9 requirement that future economic conditions are to be based on an unbiased, probability-weighted assessment of possible future outcomes. More specifically, the macroeconomic indicators set out in the macroeconomic scenarios are used as inputs for the credit risk parameter models utilized by VersaBank to sensitize the individual PD and LGD term structure forecasts to the respective macroeconomic trajectory set out in each of the scenarios (see Expected Credit Loss Sensitivity below). Currently VersaBank utilizes upside, downside and baseline forecast macroeconomic scenarios, and assigns discrete weights to each for use in the estimation of its reported ECL. VersaBank has also applied expert credit judgment, where appropriate, to reflect, amongst other items, uncertainty in the Canadian macroeconomic environment.
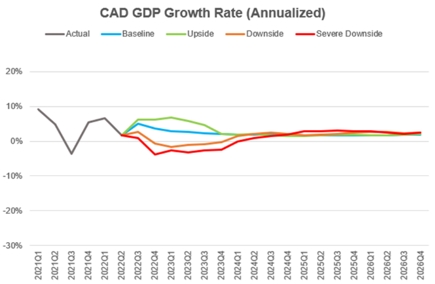
The macroeconomic indicator data utilized by VersaBank for the purpose of sensitizing PD and LGD term structure data to forward economic conditions include, but are not limited to: real GDP, the national unemployment rate, long term interest rates, the consumer price index, the S&P/TSX Index and the price of oil. These specific macroeconomic indicators were selected in an attempt to ensure that the spectrum of fundamental macroeconomic influences on the key drivers of the credit risk profile of VersaBank’s balance sheet, including: corporate, consumer and real estate market dynamics; corporate, consumer and SME borrower performance; geography; as well as collateral value volatility, are appropriately captured and incorporated into VersaBank’s forward macroeconomic sensitivity analysis.
Key assumptions driving the macroeconomic forecast trends this quarter include: the intensity of the crisis in Ukraine and the scope of the impact of same on commodity markets and global supply chains, the magnitude of the Bank of Canada’s anticipated, continued rate increases, the effectiveness of monetary policy in containing and subsequently moderating inflation, the resiliency of consumer spending and the strength of household balance sheets in a rising rate environment, the dynamics and trajectory of the labour market and the potentiality of the emergence of new variants of COVID-19 as well as the public health response to same.
Management developed ECL estimates using credit risk parameter term structure forecasts sensitized to individual baseline, upside and downside forecast macroeconomic scenarios, each weighted at 100%, and subsequently computed the variance of each to VersaBank’s reported ECL as at April 30, 2022 in order to assess the alignment of VersaBank’s reported ECL with VersaBank’s credit risk profile, and further, to assess the scope, depth and ultimate effectiveness of the credit risk mitigation strategies that VersaBank has applied to its lending portfolios (see Expected Credit Loss Sensitivity below).
VersaBank – Q2 2022 MD&A
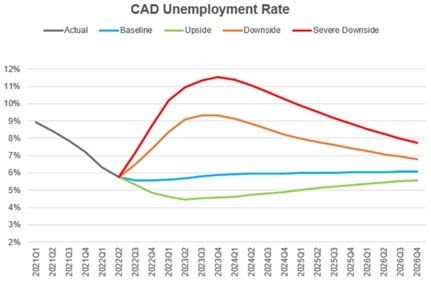
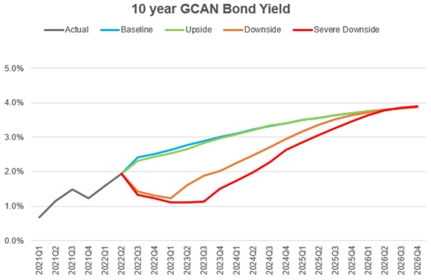
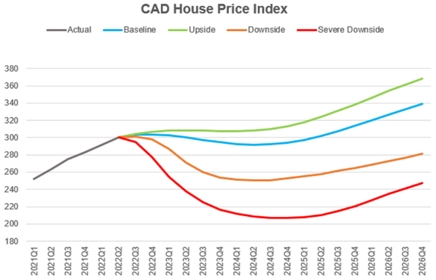
A summary of the key forecast macroeconomic indicator data trends utilized by VersaBank for the purpose of sensitizing lending asset credit risk parameter term structure forecasts to forward looking information, which in turn are used in the estimation of VersaBank’s reported ECL, as well as in the assessment of same are presented in the charts below.
 |
 |
 |
 |
Expected Credit Loss Sensitivity:
The following table presents the sensitivity of VersaBank’s estimated ECL to a range of individual forecast macroeconomic scenarios, that in isolation may not reflect VersaBank’s actual expected ECL exposure, as well as the variance of each to VersaBank’s reported ECL as at April 30, 2022:
|
(thousands of Canadian dollars) |
||||||||||||||||
|
Reported |
100 | % | 100 | % | 100 | % | ||||||||||
|
ECL |
Upside |
Baseline |
Downside |
|||||||||||||
|
Allowance for expected credit losses |
$ | 1,533 | $ | 925 | $ | 1,149 | $ | 1,549 | ||||||||
|
Variance from reported ECL |
(608 | ) | (384 | ) | 16 | |||||||||||
|
Variance from reported ECL (%) |
(40% | ) | (25% | ) | 1 | % | ||||||||||
Management is of the view that forward-looking macroeconomic and industry data will remain somewhat dynamic, specifically related to the impact of the crisis in Ukraine on commodity markets and global supply chains, tighter monetary policy and prolonged, high rates of inflation, consumer spending and the strength of the labour market. As a result, management anticipates that VersaBank’s estimated ECL amounts will continue to exhibit some volatility over the course of the second half fiscal 2022.
VersaBank – Q2 2022 MD&A
Considering the analysis set out above and based on management’s review of the loan and credit data comprising VersaBank’s lending portfolio, combined with management’s interpretation of the available forecast macroeconomic and industry data, management is of the view that its reported ECL allowance represents a reasonable proxy for potential, future losses.
Deposits
VersaBank has established three core funding channels, those being personal deposits, commercial deposits, and cash reserves retained from VersaBank’s POS Financing origination partners that are classified as other liabilities, which are discussed in the Other Assets and Liabilities section below.
|
(thousands of Canadian dollars) |
||||||||||||||||||||
|
April 30 |
January 31 |
April 30 |
||||||||||||||||||
|
2022 |
2022 |
Change |
2021 |
Change |
||||||||||||||||
|
Commercial deposits |
$ | 608,694 | $ | 596,211 | 2 | % | $ | 558,973 | 9 | % | ||||||||||
|
Personal deposits |
1,516,222 | 1,250,792 | 21 | % | 1,120,300 | 35 | % | |||||||||||||
|
Total deposits |
$ | 2,124,916 | $ | 1,847,003 | 15 | % | $ | 1,679,273 | 27 | % | ||||||||||
Personal deposits, consisting principally of guaranteed investment certificates, are sourced primarily through a well-established and well-diversified deposit broker network that VersaBank continues to grow and expand across Canada.
Commercial deposits are sourced primarily via specialized operating accounts made available to insolvency professionals (“Trustees”) in the Canadian insolvency industry. VersaBank developed customized banking software for use by Trustees that integrates banking services with the market-leading software platform used in the administration of consumer bankruptcy and proposal restructuring proceedings.
Q2 2022 vs Q1 2022
Deposits increased 15% to $2.1 billion as a function primarily of:
|
|
Higher personal deposits attributable to VersaBank increasing activity in its broker market network to fund balance sheet growth; and, |
| |
Higher commercial deposits attributable to growth in VersaBank’s TIB program |
Q2 2022 vs Q2 2021
Deposits increased 27% as a function primarily of the items set out above.
VersaBank – Q2 2022 MD&A
Subordinated Notes Payable
|
(thousands of Canadian dollars) |
||||||||||||
|
April 30 |
January 31 |
April 30 |
||||||||||
|
2022 |
2022 |
2021 |
||||||||||
|
Ten year term, unsecured, non-viability contingent capital compliant, subordinated notes payable, principal amount of $5.0 million, effective interest rate of 10.41%, maturing March 2029. |
$ | 4,903 | $ | 4,901 | $ | 4,894 | ||||||
|
Ten year term, unsecured, non-viability contingent capital compliant, subordinated notes payable, principal amount of USD $75.0 million, effective interest rate of 5.38%, maturing May 2031. |
93,507 | 92,825 | 89,498 | |||||||||
| $ | 98,410 | $ | 97,726 | $ | 94,392 | |||||||
Subordinated notes payable, net of issue costs, were $98.4 million at April 30, 2022, compared to $97.7 million last quarter and $94.4 million a year ago. The quarter over quarter and year over year trends were a function primarily of changes in the USD/CAD foreign exchange spot rate.
Other Assets and Liabilities
Other Assets
|
(thousands of Canadian dollars) |
||||||||||||||||||||
|
April 30 |
January 31 |
April 30 |
||||||||||||||||||
|
2022 |
2022 |
Change |
2021 |
Change |
||||||||||||||||
|
Accounts receivable |
$ | 3,750 | $ | 2,938 | 28 | % | $ | 1,044 | 259 | % | ||||||||||
|
Prepaid expenses and other |
16,186 | 16,881 | (4 | %) | 10,431 | 55 | % | |||||||||||||
|
Property and equipment |
6,872 | 6,905 | 0 | % | 7,462 | (8 | %) | |||||||||||||
|
Right-of-use assets |
4,470 | 4,643 | (4 | %) | 5,164 | (13 | %) | |||||||||||||
|
Deferred income tax asset |
2,315 | 2,868 | (19 | %) | 2,941 | (21 | %) | |||||||||||||
|
Investment |
953 | 953 | 0 | % | 953 | 0 | % | |||||||||||||
|
Goodwill |
5,754 | 5,754 | 0 | % | 5,754 | 0 | % | |||||||||||||
|
Intangible assets |
3,413 | 3,527 | (3 | %) | 3,804 | (10 | %) | |||||||||||||
|
Total other assets |
$ | 43,713 | $ | 44,469 | (2 | %) | $ | 37,553 | 16 | % | ||||||||||
Q2 2022 vs Q1 2022
Other assets decreased 2% to $43.7 million as a function primarily of:
|
Lower prepaid expenses attributable primarily to the normal course timing of expenses; |
|
Lower capitalized assets due to amortization; and, |
|
Draw downs on the deferred income tax asset derived from taxable income generated by VersaBank. |
Offset partially by:
|
Higher accounts receivable attributable primarily to the normal course timing of general corporate receivables. |
VersaBank – Q2 2022 MD&A
Q2 2022 vs Q2 2021
Other assets increased 16% as a function primarily of:
|
Higher prepaid expenses and other consisting primarily of higher prepaid insurance premiums attributable to VersaBank’s listing on the Nasdaq as well as the capitalization of compensation costs and various development costs related to VersaBank’s specific growth initiatives; and, |
|
Higher accounts receivable attributable primarily to the normal course timing of general corporate receivables. |
Offset partially by:
|
Lower capitalized assets due to amortization; and, |
|
Draw downs on the deferred income tax asset derived from taxable income generated by VersaBank. |
Other Liabilities
|
(thousands of Canadian dollars) |
||||||||||||||||||||
|
April 30 |
January 31 |
April 30 |
||||||||||||||||||
|
2022 |
2022 |
Change |
2021 |
Change |
||||||||||||||||
|
Accounts payable and other |
$ | 5,849 | $ | 6,155 | (5 | %) | $ | 5,506 | 6 | % | ||||||||||
|
Current income tax liability |
2,126 | 1,975 | 8 | % | 1,449 | 47 | % | |||||||||||||
|
Deferred income tax liability |
812 | 855 | (5 | %) | 862 | (6 | %) | |||||||||||||
|
Lease obligations |
4,665 | 4,944 | (6 | %) | 5,438 | (14 | %) | |||||||||||||
|
Cash collateral and amounts held in escrow |
5,833 | 5,252 | 11 | % | 3,261 | 79 | % | |||||||||||||
|
Cash reserves on loan and lease receivables |
108,121 | 114,485 | (6 | %) | 102,210 | 6 | % | |||||||||||||
|
Total other liabilities |
$ | 127,406 | $ | 133,666 | (5 | %) | $ | 118,726 | 7 | % | ||||||||||
Q2 2022 vs Q1 2022
Other liabilities decreased 5% to $127.4 million as a function primarily of:
|
Lower cash reserve balances attributable to the restructuring of the cash reserve framework of one of VersaBank’s origination and servicing partner’s combined with a higher proportion of new receivables being originated at lower intrinsic risk levels offset partially by higher POS Financing portfolio balances; and, |
|
Lower accounts payable attributable to the timing of cash payments. |
Offset partially by:
|
Higher cash collateral and amounts held in escrow; and, |
|
Higher income tax payable attributable to increase in taxable earnings. |
Q2 2022 vs Q2 2021
Other liabilities increased 7% attributable primarily to:
|
Higher cash reserves balances attributable to higher POS Financing portfolio balances; |
VersaBank – Q2 2022 MD&A
|
VersaBank recognizing higher income taxes payable after utilizing the significant income tax loss carryforwards in the prior fiscal year; |
|
Higher cash collateral and amounts held in escrow; and, |
|
General increase in accounts payable attributable to increased earning activity. |
Shareholders’ Equity
Shareholders’ equity was $341.4 million at April 30, 2022 compared to $337.0 million last quarter and $247.4 million a year ago.
Q2 2022 vs Q1 2022
Shareholders’ equity was up 1% as a function primarily of:
|
Higher retained earnings attributable to net income earned over the period. |
Offset partially by:
|
Payment of dividends. |
Q2 2022 vs Q2 2021
Shareholders’ equity was up 38% attributable primarily to:
|
The September 21, 2021 treasury offering of 6,325,000 common shares at a price of USD $10.00 per share, the equivalent of CAD $12.80 per share, for gross proceeds of approximately USD $63.3 million, (“the Common Share Offering”) after the underwriters exercised their full over-allotment option equal to 15% of the base offering of 5,500,000 common shares. Total net cash proceeds from the Common Share Offering were CAD $73.2 million, however, VersaBank’s share capital increased by CAD $75.1 million as a function of the Common Share Offering and tax effected issue costs in the amount of $5.4 million; and, |
|
Higher retained earnings attributable to net income earned over the period. |
Offset partially by:
|
Payment of dividends. |
VersaBank’s book value per common share at April 30, 2022 was $11.94 compared to $11.78 last quarter and $11.06 a year ago. The quarter over quarter trend was a function primarily of higher retained earnings attributable to net income earned in the current quarter offset partially by the payment of dividends over the same period. The year over year trend was a function of primarily of the impact of the Common Share Offering and higher retained earnings attributable to net income earned in the current period offset partially by the payment of dividends over the same timeframe.
VersaBank – Q2 2022 MD&A
See note 8 to the unaudited interim consolidated financial statements for additional information relating to share capital.
Stock-Based Compensation
Stock options are accounted for using the fair value method which recognizes the fair value of the stock option over the applicable vesting period as an increase in salaries and benefits expense with the same amount being recorded in share capital. VersaBank recognized compensation expense for the quarter totaling $424,000 compared to $196,000 last quarter and $nil for the same period a year ago, relating to the estimated fair value of stock options granted. The recognized compensation expense for the six-month period ended April 30, 2022 totaled $620,000 compared to $nil for the same period a year ago. The fair value of the 913,730 stock options granted during the first quarter of Fiscal 2022 was estimated at the grant date using the Black-Scholes valuation model and the following input assumptions: risk-free rate of 1.26%, expected option life of 3.5 years, expected volatility of 29.5%, expected annual dividends of 0.64% and a forfeiture rate of 2.0%. The fair value of each stock option granted was estimated at $3.10 per share.
As at April 30, 2022, 40,000 common share stock options were fully vested and exercisable at $7.00 per share and expire in October 2023. See note 8 to the unaudited interim consolidated financial statements for additional information relating to stock options.
Updated Share Information
As at May 30, 2022, there were no changes since April 30, 2022 in the number of common shares, Series 1 preferred shares, and common share options outstanding.
Off-Balance Sheet Arrangements
As at April 30, 2022, VersaBank did not have any significant off-balance sheet arrangements other than loan commitments and letters of credit attributable to normal course business activities. See note 11 to the unaudited interim consolidated financial statements for more information.
Related Party Transactions
VersaBank’s Board of Directors and senior executive officers represent key management personnel. See note 12 to the unaudited interim consolidated financial statements for additional information on related party transactions and balances.
VersaBank – Q2 2022 MD&A
Capital Management and Capital Resources
The table below presents VersaBank’s regulatory capital position, risk-weighted assets and regulatory capital and leverage ratios for the current and comparative periods.
|
(thousands of Canadian dollars) |
||||||||||||||||||||
|
April 30 |
January 31 |
April 30 |
||||||||||||||||||
|
2022 |
2022 |
Change |
2021 |
Change |
||||||||||||||||
|
Common Equity Tier 1 capital |
$ | 315,963 | $ | 310,825 | 2 | % | $ | 220,740 | 43 | % | ||||||||||
|
Total Tier 1 capital |
$ | 329,610 | $ | 324,472 | 2 | % | $ | 234,387 | 41 | % | ||||||||||
|
Total Tier 2 capital |
$ | 102,473 | $ | 101,765 | 1 | % | $ | 98,774 | 4 | % | ||||||||||
|
Total regulatory capital |
$ | 432,083 | $ | 426,237 | 1 | % | $ | 333,161 | 30 | % | ||||||||||
|
Total risk-weighted assets |
$ | 2,313,030 | $ | 2,095,335 | 10 | % | $ | 1,763,424 | 31 | % | ||||||||||
|
Capital ratios |
||||||||||||||||||||
|
CET1 capital ratio |
13.66 | % | 14.83 | % | (8 | %) | 12.52 | % | 9 | % | ||||||||||
|
Tier 1 capital ratio |
14.25 | % | 15.49 | % | (8 | %) | 13.29 | % | 7 | % | ||||||||||
|
Total capital ratio |
18.68 | % | 20.34 | % | (8 | %) | 18.89 | % | (1 | %) | ||||||||||
|
Leverage ratio |
11.63 | % | 12.69 | % | (8 | %) | 10.46 | % | 11 | % | ||||||||||
VersaBank reports its regulatory capital ratios using the Standardized approach for calculating risk-weighted assets, as defined under Basel III, which may require VersaBank to carry more capital for certain credit exposures compared to requirements under the Advanced Internal Ratings Based (“AIRB”) methodology. As a result, regulatory capital ratios of banks that utilize the Standardized approach are not directly comparable with the large Canadian banks that employ the AIRB methodology.
OSFI requires that all Canadian banks must comply with the Basel III standards on an “all-in” basis for purposes of determining their risk-based capital ratios. Required minimum regulatory capital ratios are a 7.0% Common Equity Tier 1 (“CET1”) capital ratio, an 8.5% Tier 1 capital ratio and a 10.5% total capital ratio, all of which include a 2.5% capital conservation buffer.
The quarter over quarter and year over year trends exhibited by VersaBank’s reported regulatory capital levels, regulatory capital ratios and leverage ratios were a function primarily of retained earnings growth and changes to VersaBank’s risk-weighted asset balances and composition. The year over year trend was also a function of the September 21, 2021 Common Share Offering.
For more information regarding capital management, please see note 13 to VersaBank’s April 30, 2022, interim Consolidated Financial Statements as well as the Capital Management and Capital Resources section of VersaBank’s MD&A for the year ended October 31, 2021.
Liquidity
The unaudited Consolidated Statement of Cash Flows for the six months ended April 30, 2022, shows cash used in operations in the amount of $72.0 million compared to cash used by operations in the amount of $36.9 million for the same period last year. The current period and comparative period trends were a function primarily of cash outflows to fund loans exceeding cash inflows from deposits raised and the use of existing liquidity to fund loans. Based on factors such as liquidity requirements and opportunities for investment in loans and securities, VersaBank may manage the amount of deposits it raises and loans it funds in ways that result in the balances of these items giving rise to either negative or positive cash flow from operations. VersaBank will continue to fund its operations and meet contractual obligations as they become due using cash on hand and by closely managing its flow of deposits.
Interest Rate Sensitivity
The table below presents the duration difference between VersaBank’s assets and liabilities and the potential after-tax impact of a 100-basis point shift in interest rates on VersaBank’s earnings during a 12-month period and the potential after-tax impact of a 100-basis point shift in interest rates on VersaBank’s shareholders’ equity over a 60-month period if no remedial actions are taken. At April 30, 2022, the duration difference between assets and liabilities was 3.1 months compared to 2.3 months at October 31, 2021, which indicates that VersaBank’s assets would reprice faster than liabilities in the event of a future change in interest rates.
|
(thousands of Canadian dollars) |
||||||||||||||||
|
April 30, 2022 |
October 31, 2021 |
|||||||||||||||
|
Increase 100 bps |
Decrease 100 bps |
Increase 100 bps |
Decrease 100 bps |
|||||||||||||
|
Increase (decrease): |
||||||||||||||||
|
Impact on projected net interest income during a 12 month period |
$ | 5,927 | $ | (6,292 | ) | $ | 4,147 | $ | (3,220 | ) | ||||||
|
Impact on reported equity during a 60 month period |
$ | 2,936 | $ | (3,008 | ) | $ | 1,603 | $ | (1,586 | ) | ||||||
|
Duration difference between assets and liabilities (months) |
3.1 | 2.3 | ||||||||||||||
Contractual Obligations
Contractual obligations as disclosed in VersaBank’s MD&A and Audited Consolidated Financial Statements for the year ended October 31, 2021, have not changed significantly as at April 30, 2022.
Results of Operating Segments
|
(thousands of Canadian dollars) |
||||||||||||||||||||||||||||||||||||||||||||||||
|
for the three months ended |
April 30, 2022 |
January 31, 2022 |
April 30, 2021 |
|||||||||||||||||||||||||||||||||||||||||||||
|
Digital Banking |
DRTC |
Eliminations/ |
Consolidated |
Digital Banking |
DRTC |
Eliminations/ |
Consolidated |
Digital Banking |
DRTC |
Eliminations/ |
Consolidated |
|||||||||||||||||||||||||||||||||||||
|
Adjustments |
Adjustments |
Adjustments |
||||||||||||||||||||||||||||||||||||||||||||||
|
Net interest income |
$ | 17,242 | $ | - | $ | - | $ | 17,242 | $ | 16,885 | $ | - | $ | - | $ | 16,885 | $ | 15,095 | $ | - | $ | - | $ | 15,095 | ||||||||||||||||||||||||
|
Non-interest income |
1 | 1,434 | (42 | ) | 1,393 | - | 1,422 | (41 | ) | 1,381 | 1 | 915 | (41 | ) | 875 | |||||||||||||||||||||||||||||||||
|
Total revenue |
17,243 | 1,434 | (42 | ) | 18,635 | 16,885 | 1,422 | (41 | ) | 18,266 | 15,096 | 915 | (41 | ) | 15,970 | |||||||||||||||||||||||||||||||||
|
Provision for (recovery of) credit losses |
78 | - | - | 78 | 2 | - | - | 2 | (312 | ) | - | - | (312 | ) | ||||||||||||||||||||||||||||||||||
| 17,165 | 1,434 | (42 | ) | 18,557 | 16,883 | 1,422 | (41 | ) | 18,264 | 15,408 | 915 | (41 | ) | 16,282 | ||||||||||||||||||||||||||||||||||
|
Non-interest expenses: |
||||||||||||||||||||||||||||||||||||||||||||||||
|
Salaries and benefits |
5,586 | 1,140 | - | 6,726 | 5,440 | 643 | - | 6,083 | 4,525 | 428 | - | 4,953 | ||||||||||||||||||||||||||||||||||||
|
General and administrative |
3,761 | 300 | (42 | ) | 4,019 | 3,482 | 183 | (41 | ) | 3,624 | 2,237 | 187 | (41 | ) | 2,383 | |||||||||||||||||||||||||||||||||
|
Premises and equipment |
659 | 363 | - | 1,022 | 582 | 347 | - | 929 | 598 | 408 | - | 1,006 | ||||||||||||||||||||||||||||||||||||
| 10,006 | 1,803 | (42 | ) | 11,767 | 9,504 | 1,173 | (41 | ) | 10,636 | 7,360 | 1,023 | (41 | ) | 8,342 | ||||||||||||||||||||||||||||||||||
|
Income (loss) before income taxes |
7,159 | (369 | ) | - | 6,790 | 7,379 | 249 | - | 7,628 | 8,048 | (108 | ) | - | 7,940 | ||||||||||||||||||||||||||||||||||
|
Income tax provision |
1,744 | 103 | - | 1,847 | 1,961 | 101 | - | 2,062 | 2,153 | 43 | - | 2,196 | ||||||||||||||||||||||||||||||||||||
|
Net income (loss) |
$ | 5,415 | $ | (472 | ) | $ | - | $ | 4,943 | $ | 5,418 | $ | 148 | $ | - | $ | 5,566 | $ | 5,895 | $ | (151 | ) | $ | - | $ | 5,744 | ||||||||||||||||||||||
|
Total assets |
$ | 2,692,510 | $ | 21,386 | $ | (21,750 | ) | $ | 2,692,146 | $ | 2,412,167 | $ | 23,767 | $ | (20,588 | ) | $ | 2,415,346 | $ | 2,139,974 | $ | 17,777 | $ | (17,994 | ) | $ | 2,139,757 | |||||||||||||||||||||
|
Total liabilities |
$ | 2,347,610 | $ | 23,727 | $ | (20,605 | ) | $ | 2,350,732 | $ | 2,072,691 | $ | 25,147 | $ | (19,443 | ) | $ | 2,078,395 | $ | 1,888,732 | $ | 20,508 | $ | (16,849 | ) | $ | 1,892,391 | |||||||||||||||||||||
|
(thousands of Canadian dollars) |
||||||||||||||||||||||||||||||||
|
for the six months ended |
April 30, 2022 |
April 30, 2021 |
||||||||||||||||||||||||||||||
|
Digital Banking |
DRTC |
Eliminations/ |
Consolidated |
Digital Banking |
DRTC |
Eliminations/ |
Consolidated |
|||||||||||||||||||||||||
|
Adjustments |
Adjustments |
|||||||||||||||||||||||||||||||
|
Net interest income |
$ | 34,127 | $ | - | $ | - | $ | 34,127 | $ | 29,469 | $ | - | $ | - | $ | 29,469 | ||||||||||||||||
|
Non-interest income |
2 | 2,855 | (83 | ) | 2,774 | (16 | ) | 2,008 | (69 | ) | 1,923 | |||||||||||||||||||||
|
Total revenue |
34,129 | 2,855 | (83 | ) | 36,901 | 29,453 | 2,008 | (69 | ) | 31,392 | ||||||||||||||||||||||
|
Provision for (recovery of) credit losses |
80 | - | - | 80 | (255 | ) | - | - | (255 | ) | ||||||||||||||||||||||
| 34,049 | 2,855 | (83 | ) | 36,821 | 29,708 | 2,008 | (69 | ) | 31,647 | |||||||||||||||||||||||
|
Non-interest expenses: |
||||||||||||||||||||||||||||||||
|
Salaries and benefits |
11,025 | 1,784 | - | 12,809 | 9,223 | 760 | - | 9,983 | ||||||||||||||||||||||||
|
General and administrative |
7,243 | 483 | (83 | ) | 7,643 | 4,299 | 492 | (69 | ) | 4,722 | ||||||||||||||||||||||
|
Premises and equipment |
1,241 | 710 | - | 1,951 | 1,168 | 556 | - | 1,724 | ||||||||||||||||||||||||
| 19,509 | 2,977 | (83 | ) | 22,403 | 14,690 | 1,808 | (69 | ) | 16,429 | |||||||||||||||||||||||
|
Income (loss) before income taxes |
14,540 | (122 | ) | - | 14,418 | 15,018 | 200 | - | 15,218 | |||||||||||||||||||||||
|
Income tax provision |
3,706 | 203 | - | 3,909 | 4,006 | 178 | - | 4,184 | ||||||||||||||||||||||||
|
Net income (loss) |
$ | 10,834 | $ | (325 | ) | $ | - | $ | 10,509 | $ | 11,012 | $ | 22 | $ | - | $ | 11,034 | |||||||||||||||
|
Total assets |
$ | 2,692,510 | $ | 21,386 | $ | (21,750 | ) | $ | 2,692,146 | $ | 2,139,974 | $ | 17,777 | $ | (17,994 | ) | $ | 2,139,757 | ||||||||||||||
|
Total liabilities |
$ | 2,347,610 | $ | 23,727 | $ | (20,605 | ) | $ | 2,350,732 | $ | 1,888,732 | $ | 20,508 | $ | (16,849 | ) | $ | 1,892,391 | ||||||||||||||
VersaBank – Q2 2022 MD&A
Digital Banking Operations
Q2 2022 vs Q1 2022
Net income was consistent quarter over quarter as a function primarily of higher revenue attributable primarily to loan growth offset by higher non-interest expense attributable to investment in specific growth initiatives, including the preparation and launch of VersaBank’s U.S. Point-of-Sale Financing business, higher salary and benefits expense and higher office expense attributable to the implementation of VersaBank’s return-to-work strategy, as well as higher provision for credit losses.
Q2 2022 vs Q2 2021
Net income decreased 8% as a function primarily of higher non-interest expense attributable to the items set out above and higher insurance premiums resulting from VersaBank’s listing on the Nasdaq as well as VersaBank recording a provision for credit losses in the amount of $78,000 in the current quarter compared to a recovery of credit loss provisions in the amount of $312,000 in the comparative period, offset partially by higher revenue attributable substantially to loan growth.
Q2 YTD 2022 vs Q2 YTD 2021
Net income decreased 2% as a function primarily of higher non-interest expense and VersaBank recording a provision for credit losses in the amount of $80,000 in the current period compared to a recovery of credit loss provisions in the amount of $255,000 in the comparative period, offset partially by higher revenue attributable substantially to loan growth.
DRTC (Cybersecurity Services and Banking and Financial Technology Development)
Q2 2022 vs Q1 2021
DRTC net loss of $472,000 in the current quarter compared to net income of $148,000 in the comparative period, with the net loss attributable to higher costs related to investment in specific growth initiatives (including the preparation for commercial launch of the Canadian-dollar version of its Digital Deposit Receipts), as well as higher salary and benefits expense and higher business development costs. DRTC services revenue and gross profit, which are generated entirely by Digital Boundary Group's (DBG) Cybersecurity Services, increased 3% and 1% to $2.4 million and $1.4 million respectively as a function of the realization of engagements in the current quarter that were deferred in the comparative quarter due to COVID-19 as well as normal course seasonality. DRTC gross profit amounts are included in non-interest income in VersaBank’s consolidated statements of income and comprehensive income.
Q2 2022 vs Q2 2021
Net loss of $472,000 in the current quarter compared to net loss of $151,000 in the comparative period was a function primarily of higher non-interest expense attributable to the items noted above, offset partially by higher revenue. DRTC revenue and gross profit increased 41% and 57% respectively as a function of higher service work volume in the current quarter.
Q2 YTD 2022 vs Q2 YTD 2021
Net loss of $325,000 in the current period compared to net income of $22,000 in the comparative period was a function primarily of higher non-interest expense, offset partially by higher revenue. DRTC revenue and gross profit increased 38% and 43% to $4.8 million and $2.9 million, respectively as a function of the items set out above as well as the comparative period including only five months of operations due to the timing of VersaBank’s acquisition of DBG on November 30, 2020.
VersaBank – Q2 2022 MD&A
Summary of Quarterly Results
|
(thousands of Canadian dollars |
||||||||||||||||||||||||||||||||
|
except per share amounts) |
2022 |
2021 |
2020 |
|||||||||||||||||||||||||||||
|
Q2 |
Q1 |
Q4 |
Q3 |
Q2 |
Q1 |
Q4 |
Q3 |
|||||||||||||||||||||||||
|
Results of operations: |
||||||||||||||||||||||||||||||||
|
Interest income |
$ | 25,848 | $ | 24,720 | $ | 23,924 | $ | 22,400 | $ | 21,649 | $ | 21,515 | $ | 21,068 | $ | 20,172 | ||||||||||||||||
|
Yield on assets (%) |
4.15 | % | 4.06 | % | 4.04 | % | 4.02 | % | 4.24 | % | 4.28 | % | 4.33 | % | 4.12 | % | ||||||||||||||||
|
Interest expense |
8,606 | 7,835 | 7,778 | 7,858 | 6,554 | 7,141 | 7,360 | 7,788 | ||||||||||||||||||||||||
|
Cost of funds (%) |
1.38 | % | 1.29 | % | 1.31 | % | 1.41 | % | 1.28 | % | 1.42 | % | 1.51 | % | 1.59 | % | ||||||||||||||||
|
Net interest income |
17,242 | 16,885 | 16,146 | 14,542 | 15,095 | 14,374 | 13,708 | 12,384 | ||||||||||||||||||||||||
|
Net interest margin (%) |
2.77 | % | 2.77 | % | 2.73 | % | 2.61 | % | 2.96 | % | 2.86 | % | 2.82 | % | 2.53 | % | ||||||||||||||||
|
Non-interest income |
1,393 | 1,381 | 2,090 | 1,187 | 875 | 1,048 | 18 | 8 | ||||||||||||||||||||||||
|
Total revenue |
18,635 | 18,266 | 18,236 | 15,729 | 15,970 | 15,422 | 13,726 | 12,392 | ||||||||||||||||||||||||
|
Provision for (recovery of) credit losses |
78 | 2 | (279 | ) | 96 | (312 | ) | 57 | (582 | ) | (44 | ) | ||||||||||||||||||||
|
Non-interest expenses |
11,767 | 10,636 | 10,377 | 8,200 | 8,342 | 8,087 | 7,763 | 6,410 | ||||||||||||||||||||||||
|
Efficiency ratio |
63 | % | 58 | % | 57 | % | 52 | % | 52 | % | 52 | % | 57 | % | 52 | % | ||||||||||||||||
|
Income before income taxes |
6,790 | 7,628 | 8,138 | 7,433 | 7,940 | 7,278 | 6,545 | 6,026 | ||||||||||||||||||||||||
|
Tax provision |
1,847 | 2,062 | 2,228 | 1,997 | 2,196 | 1,988 | 1,799 | 1,657 | ||||||||||||||||||||||||
|
Net income |
$ | 4,943 | $ | 5,566 | $ | 5,910 | $ | 5,436 | $ | 5,744 | $ | 5,290 | $ | 4,746 | $ | 4,369 | ||||||||||||||||
|
Income per share |
||||||||||||||||||||||||||||||||
|
Basic |
$ | 0.17 | $ | 0.19 | $ | 0.24 | $ | 0.25 | $ | 0.25 | $ | 0.22 | $ | 0.20 | $ | 0.18 | ||||||||||||||||
|
Diluted |
$ | 0.17 | $ | 0.19 | $ | 0.24 | $ | 0.25 | $ | 0.25 | $ | 0.22 | $ | 0.20 | $ | 0.18 | ||||||||||||||||
|
Return on common equity |
5.92 | % | 6.58 | % | 8.07 | % | 8.72 | % | 9.20 | % | 8.26 | % | 7.46 | % | 6.90 | % | ||||||||||||||||
|
Return on total assets |
0.75 | % | 0.87 | % | 0.96 | % | 0.93 | % | 1.02 | % | 0.94 | % | 0.86 | % | 0.78 | % | ||||||||||||||||
|
Gross impaired loans to total loans |
0.00 | % | 0.00 | % | 0.00 | % | 0.00 | % | 0.00 | % | 0.00 | % | 0.00 | % | 0.43 | % | ||||||||||||||||
The financial results for each of the last eight quarters are summarized above. Key drivers of VersaBank’s quarter over quarter performance trends for the current reporting period were:
|
Lending asset growth attributable to strong growth in both the POS Financing and CRE Mortgage portfolios; |
|
NIM remaining flat as a function of higher yields being offset by higher cost of funds; |
|
Higher provisions for credit losses attributable primarily to lending asset growth offset partially by changes in VersaBank’s lending asset portfolio mix; and, |
|
Higher non-interest expense as a function of higher salary and benefits expense, higher business development costs and higher office expense attributable to implementation of VersaBank’s return-to-work strategy. |
VersaBank – Q2 2022 MD&A
Non-GAAP and Other Financial Measures
Non-GAAP and other financial measures are not standardized financial measures under financial reporting framework used to prepare the financial statements of VersaBank’s to which these measures relate. These measures may not be comparable to similar financial measures disclosed by other issuers. VersaBank uses these financial measures to assess its performance and as such believes these financial measures are useful in providing readers with a better understanding of how management assesses VersaBank’s performance.
Non-GAAP Measures
Return on Average Common Equity is defined as annualized net income less amounts relating to preferred share dividends, divided by average common shareholders’ equity which is average shareholders’ equity less amounts relating to preferred shares recorded in equity.
|
for the three months ended |
for the six months ended |
|||||||||||||||
|
April 30 |
April 30 |
April 30 |
April 30 |
|||||||||||||
| (thousands of Canadian dollars) |
2022 |
2021 |
2022 |
2021 |
||||||||||||
| Return on average common equity | ||||||||||||||||
|
Net income |
$ | 4,943 | $ | 5,744 | $ | 10,509 | $ | 11,034 | ||||||||
|
Preferred share dividends |
(247 | ) | (542 | ) | (494 | ) | (1,084 | ) | ||||||||
|
Adjusted net income |
4,696 | 5,202 | 10,015 | 9,950 | ||||||||||||
|
Annualized adjusted net income |
19,259 | 21,334 | 20,196 | 20,065 | ||||||||||||
|
Average common equity |
$ | 325,536 | $ | 231,945 | $ | 323,113 | $ | 229,835 | ||||||||
| Return on average common equity | 5.92 | % | 9.20 | % | 6.25 | % | 8.73 | % | ||||||||
Book Value per Common Share is defined as Shareholders’ Equity less amounts relating to preferred shares recorded in equity, divided by the number of common shares outstanding.
|
for the three months ended |
for the six months ended |
|||||||||||||||
|
April 30 |
April 30 |
April 30 |
April 30 |
|||||||||||||
|
(thousands of Canadian dollars) |
2022 |
2021 |
2022 |
2021 |
||||||||||||
|
Book value per common share |
||||||||||||||||
|
Common equity |
$ | 327,767 | $ | 233,719 | $ | 327,767 | $ | 233,719 | ||||||||
|
Shares outstanding |
27,441,082 | 21,123,559 | 27,441,082 | 21,123,559 | ||||||||||||
|
Book value per common share |
$ | 11.94 | $ | 11.06 | $ | 11.94 | $ | 11.06 | ||||||||
Return on Average Total Assets is defined as annualized net income less amounts relating to preferred share dividends, divided by average total assets.
|
for the three months ended |
for the six months ended |
|||||||||||||||
|
April 30 |
April 30 |
April 30 |
April 30 |
|||||||||||||
|
(thousands of Canadian dollars) |
2022 |
2021 |
2022 |
2021 |
||||||||||||
|
Return on average total assets |
||||||||||||||||
|
Net income |
$ | 4,943 | $ | 5,744 | $ | 10,509 | $ | 11,034 | ||||||||
|
Preferred share dividends |
(247 | ) | (542 | ) | (494 | ) | (1,084 | ) | ||||||||
|
Adjusted net income |
4,696 | 5,202 | 10,015 | 9,950 | ||||||||||||
|
Annualized adjusted net income |
19,259 | 21,334 | 20,196 | 20,065 | ||||||||||||
|
Average Assets |
$ | 2,553,746 | $ | 2,092,367 | $ | 2,553,616 | $ | 2,041,821 | ||||||||
|
Return on average total assets |
0.75 | % | 1.02 | % | 0.79 | % | 0.98 | % | ||||||||
VersaBank – Q2 2022 MD&A
Other Financial Measures
Yield is calculated as interest income (as presented in the Consolidated Statements of Comprehensive Income) divided by average total assets. Yield does not have a standardized meaning prescribed by IFRS and, therefore, may not be comparable to similar measures presented by other financial institutions.
Cost of Funds is calculated as interest expense (as presented in the Consolidated Statements of Comprehensive Income) divided by average total assets. Cost of funds does not have a standardized meaning prescribed by IFRS and, therefore, may not be comparable to similar measures presented by other financial institutions.
Net Interest Margin or Spread are calculated as net interest income divided by average total loans. Net interest margin or spread does not have a standardized meaning prescribed by IFRS and, therefore, may not be comparable to similar measures presented by other financial institutions.
Net Interest Margin on Loans is calculated as net interest income adjusted for the impact of cash and other assets, divided by average gross loans. This metric does not have a standardized meaning prescribed by IFRS and, therefore, may not be comparable to similar measures presented by other financial institutions.
Efficiency Ratio is calculated as non-interest expenses from the Digital Banking operations as a percentage of total revenue from the Digital Banking operations (as presented in the interim Consolidated Statements of Comprehensive Income). This ratio does not have a standardized meaning prescribed by IFRS and, therefore, may not be comparable to similar measures presented by other financial institutions.
Gross Impaired Loans to Total Loans captures gross impaired loan balances as a percentage of VersaBank’s loans, net of allowance for credit losses. This percentage does not have a standardized meaning prescribed by IFRS and, therefore, may not be comparable to similar measures presented by other financial institutions.
Provision for (Recovery of) Credit Losses as a Percentage of Average Total Loans captures the provision for (recovery of) credit losses (as presented in the interim Consolidated Statements of Comprehensive Income) as a percentage of VersaBank’s average loans, net of allowance for credit losses. This percentage does not have a standardized meaning prescribed by IFRS and, therefore, may not be comparable to similar measures presented by other financial institutions.
Basel III Common Equity Tier 1, Tier 1, Total Capital Adequacy and Leverage Ratios are determined in accordance with guidelines issued by the Office of the Superintendent of Financial Institutions (Canada) (OSFI).
VersaBank – Q2 2022 MD&A
Significant Accounting Policies and Use of Estimates and Judgements
Significant accounting policies and use of estimates and judgements are detailed in note 2 and note 3 of VersaBank’s 2021 Audited Consolidated Financial Statements. There have been no material changes in accounting policies since October 31, 2021, except as noted below.
During the current quarter VersaBank updated or incorporated the following significant accounting policies:
Segment reporting
Commencing in fiscal 2022, VersaBank has opted to adopt presenting segmented information in its Consolidated Financial Statements in accordance with IFRS 8 Segment Reporting. VersaBank’s management has established two reportable operating segments, those being Digital Banking and DRTC (Cybersecurity Services and Banking and Financial Technology Development).
Controls and Procedures
During the quarter ended April 30, 2022, there were no changes in VersaBank’s internal controls over financial reporting, that have materially affected, or are reasonably likely to materially affect, VersaBank’s internal controls over financial reporting.
VersaBank – Q2 2022 MD&A
Exhibit 99.3

For Immediate Release: June 1, 2022
Attention: Business Editors
VERSABANK REPORTS CONTINUED STRONG RESULTS FOR SECOND QUARTER 2022
– Quarter Highlighted by Another Record Loan Portfolio, Led by 51% Growth in Canadian Point-of-Sale Financing Business –
All amounts are unaudited and in Canadian dollars and are based on financial statements prepared in compliance with International Accounting Standard 34 Interim Financial Reporting, unless otherwise noted. Our second quarter 2022 (“Q2 2022”) unaudited Interim Consolidated Financial Statements for the period ended April 30, 2022 and Management’s Discussion and Analysis ("MD&A"), are available online at www.versabank.com/investor-relations, SEDAR at www.sedar.com and EDGAR at www.sec.gov/edgar.shtml. Supplementary Financial Information will also be available on our website at www.versabank.com/investor-relations.
LONDON, ON/CNW – VersaBank (“VersaBank” or the “Bank”) (TSX: VBNK; NASDAQ: VBNK), a North American leader in business-to-business digital banking, as well as technology solutions for cybersecurity, today reported its results for the second quarter of 2022 ended April 30, 2022. All figures are in Canadian dollars unless otherwise stated.
CONSOLIDATED AND SEGMENTED FINANCIAL SUMMARY
|
(unaudited) |
As at or for the three months ended |
As at or for the six months ended |
||||||||||||||||||||||||||||||
| (thousands of Canadian dollars |
April 30 |
January 31 |
April 30 |
April 30 |
April 30 |
|||||||||||||||||||||||||||
|
except per share amounts) |
2022 |
2022 |
Change |
2021 |
Change |
2022 |
2021 |
Change |
||||||||||||||||||||||||
|
Financial results |
||||||||||||||||||||||||||||||||
|
Revenue |
$ | 18,635 | $ | 18,266 | 2 | % | $ | 15,970 | 17 | % | $ | 36,901 | $ | 31,392 | 18 | % | ||||||||||||||||
|
Cost of funds(1) |
1.38 | % | 1.29 | % | 7 | % | 1.28 | % | 8 | % | 1.30 | % | 1.35 | % | (4 | %) | ||||||||||||||||
|
Net interest margin(1) |
2.77 | % | 2.77 | % | 0 | % | 2.96 | % | (6 | %) | 2.69 | % | 2.91 | % | (8 | %) | ||||||||||||||||
|
Net interest margin on loans(1) |
3.11 | % | 3.22 | % | (3 | %) | 3.55 | % | (12 | %) | 3.14 | % | 3.55 | % | (12 | %) | ||||||||||||||||
|
Net income |
4,943 | 5,566 | (11 | %) | 5,744 | (14 | %) | 10,509 | 11,034 | (5 | %) | |||||||||||||||||||||
|
Net income per common share basic and diluted |
0.17 | 0.19 | (11 | %) | 0.25 | (32 | %) | 0.36 | 0.47 | (23 | %) | |||||||||||||||||||||
|
Balance sheet and capital ratios |
||||||||||||||||||||||||||||||||
|
Total assets |
$ | 2,692,146 | $ | 2,415,346 | 11 | % | $ | 2,139,757 | 26 | % | $ | 2,692,146 | $ | 2,139,757 | 26 | % | ||||||||||||||||
|
Book value per common share(1) |
11.94 | 11.78 | 1 | % | 11.06 | 8 | % | 11.94 | 11.06 | 8 | % | |||||||||||||||||||||
|
Common Equity Tier 1 (CET1) capital ratio |
13.66 | % | 14.83 | % | (8 | %) | 12.52 | % | 9 | % | 13.66 | % | 12.52 | % | 9 | % | ||||||||||||||||
|
Total capital ratio |
18.68 | % | 20.34 | % | (8 | %) | 18.89 | % | (1 | %) | 18.68 | % | 18.89 | % | (1 | %) | ||||||||||||||||
|
Leverage ratio |
11.63 | % | 12.69 | % | (8 | %) | 10.46 | % | 11 | % | 11.63 | % | 10.46 | % | 11 | % | ||||||||||||||||
|
(1) See definitions under ‘Non-GAAP and Other Financial Measures' in the Q2 2022 Management’s Discussion and Analysis. |
|
(thousands of Canadian dollars) |
||||||||||||||||||||||||||||||||||||||||||||||||
|
for the three months ended |
April 30, 2022 |
January 31, 2022 |
April 30, 2021 |
|||||||||||||||||||||||||||||||||||||||||||||
|
Digital Banking |
DRTC |
Eliminations/ |
Consolidated |
Digital Banking |
DRTC |
Eliminations/ |
Consolidated |
Digital Banking |
DRTC |
Eliminations/ |
Consolidated |
|||||||||||||||||||||||||||||||||||||
|
Adjustments |
Adjustments |
Adjustments |
||||||||||||||||||||||||||||||||||||||||||||||
|
Net interest income |
$ | 17,242 | $ | - | $ | - | $ | 17,242 | $ | 16,885 | $ | - | $ | - | $ | 16,885 | $ | 15,095 | $ | - | $ | - | $ | 15,095 | ||||||||||||||||||||||||
|
Non-interest income |
1 | 1,434 | (42 | ) | 1,393 | - | 1,422 | (41 | ) | 1,381 | 1 | 915 | (41 | ) | 875 | |||||||||||||||||||||||||||||||||
|
Total revenue |
17,243 | 1,434 | (42 | ) | 18,635 | 16,885 | 1,422 | (41 | ) | 18,266 | 15,096 | 915 | (41 | ) | 15,970 | |||||||||||||||||||||||||||||||||
|
Provision for (recovery of) credit losses |
78 | - | - | 78 | 2 | - | - | 2 | (312 | ) | - | - | (312 | ) | ||||||||||||||||||||||||||||||||||
| 17,165 | 1,434 | (42 | ) | 18,557 | 16,883 | 1,422 | (41 | ) | 18,264 | 15,408 | 915 | (41 | ) | 16,282 | ||||||||||||||||||||||||||||||||||
|
Non-interest expenses: |
||||||||||||||||||||||||||||||||||||||||||||||||
|
Salaries and benefits |
5,586 | 1,140 | - | 6,726 | 5,440 | 643 | - | 6,083 | 4,525 | 428 | - | 4,953 | ||||||||||||||||||||||||||||||||||||
|
General and administrative |
3,761 | 300 | (42 | ) | 4,019 | 3,482 | 183 | (41 | ) | 3,624 | 2,237 | 187 | (41 | ) | 2,383 | |||||||||||||||||||||||||||||||||
|
Premises and equipment |
659 | 363 | - | 1,022 | 582 | 347 | - | 929 | 598 | 408 | - | 1,006 | ||||||||||||||||||||||||||||||||||||
| 10,006 | 1,803 | (42 | ) | 11,767 | 9,504 | 1,173 | (41 | ) | 10,636 | 7,360 | 1,023 | (41 | ) | 8,342 | ||||||||||||||||||||||||||||||||||
|
Income (loss) before income taxes |
7,159 | (369 | ) | - | 6,790 | 7,379 | 249 | - | 7,628 | 8,048 | (108 | ) | - | 7,940 | ||||||||||||||||||||||||||||||||||
|
Income tax provision |
1,744 | 103 | - | 1,847 | 1,961 | 101 | - | 2,062 | 2,153 | 43 | - | 2,196 | ||||||||||||||||||||||||||||||||||||
|
Net income (loss) |
$ | 5,415 | $ | (472 | ) | $ | - | $ | 4,943 | $ | 5,418 | $ | 148 | $ | - | $ | 5,566 | $ | 5,895 | $ | (151 | ) | $ | - | $ | 5,744 | ||||||||||||||||||||||
|
Total assets |
$ | 2,692,510 | $ | 21,386 | $ | (21,750 | ) | $ | 2,692,146 | $ | 2,412,167 | $ | 23,767 | $ | (20,588 | ) | $ | 2,415,346 | $ | 2,139,974 | $ | 17,777 | $ | (17,994 | ) | $ | 2,139,757 | |||||||||||||||||||||
|
Total liabilities |
$ | 2,347,610 | $ | 23,727 | $ | (20,605 | ) | $ | 2,350,732 | $ | 2,072,691 | $ | 25,147 | $ | (19,443 | ) | $ | 2,078,395 | $ | 1,888,732 | $ | 20,508 | $ | (16,849 | ) | $ | 1,892,391 | |||||||||||||||||||||
HIGHLIGHTS FOR THE SECOND QUARTER OF 2022
Consolidated
|
● |
Consolidated revenue increased 17% year-over-year and 2% sequentially, to $18.6 million, due to higher net interest income in the Digital Banking operations (driven primarily by strong loan growth of 34% year-over-year and 11% sequentially), as well as higher non-interest income, the latter being generated by DRT Cyber Inc., (“DRTC”) VersaBank’s Cybersecurity Services and Banking and Financial Technology Development operating segment; |
|
● |
Net income decreased 14% year-over-year and decreased 11% sequentially to $4.9 million, attributable to costs related to investment in specific growth initiatives (including, but not limited to, the U.S. Point-of-Sale Loan and Lease Receivable, (“POS Financing”) roll out and preparation for commercial launch of the Canadian-dollar version of VersaBank’s Digital Deposit Receipts (branded as VCAD)), as well as higher salary and benefits costs, and higher office expense resulting from the implementation of VersaBank’s return-to-work strategy; and, |
|
● |
EPS was $0.17, a decrease of 32% year-over-year and 11% sequentially. The year-over-year trend was amplified due to a higher number of shares outstanding following the issuance of 6.3 million common shares via the Bank’s US IPO on the Nasdaq in September, 2021 (the “Common Share Offering”) in advance of deploying the capital raised into interest generating loans. |
Digital Banking Operations
|
● |
Loans increased 34% year-over-year and 11% sequentially to a record $2.45 billion, as a function of growth in the Bank’s POS Financing portfolio (51% year-over-year and 12% sequentially) and commercial real estate (“CRE”) portfolio (10% year-over-year and 8% sequentially); |
|
● |
Digital Banking revenue increased 14% year-over-year and 2% sequentially, to $17.2 million; |
|
● |
Net interest margin decreased 19 bps, or 6% year-over-year and was unchanged sequentially, at 2.77%, and net interest margin on loans decreased 44 bps, or 12%, year-over-year and decreased sequentially 11 bps, or 3%, to 3.11%, primarily the result of VersaBank’s strategy to grow its POS Financing portfolio, which generates lower average net interest margins than the CRE portfolio, and in which VersaBank was more aggressive with pricing in the second quarter of 2022 to capitalize on certain high-growth opportunities; and, |
|
● |
Provision for Credit Losses (PCLs) as a percentage of average loans was 0.01%, compared with a 12-quarter average of -0.01%, which remains amongst the lowest of the publicly traded Canadian Schedule I (federally licensed) Banks; |
|
● |
On March 28, 2022, VersaBank announced successful completion of the independent third-party System and Organization Controls (SOC2) – Type I audit of its VersaVault®, VersaBank’s proprietary security technology for blockchain-based assets, which underpins the VersaBank’s revolutionary Digital Deposit Receipts; and, |
|
● |
On March 31, 2022, VersaBank announced that it entered into an agreement with its first Point-of-Sale Finance partner in the United States, a large, North American, commercial transportation financing business focused on independent owner/operators. |
DRTC (Cybersecurity Services and Banking and Financial Technology Development)
|
● |
Revenue and gross profit, which are generated entirely by Digital Boundary Group's (DBG) Cybersecurity Services, increased 41% and 57% year-over-year and 3% and 1% sequentially, to $2.4 million and $1.4 million, respectively; and, |
|
● |
Net loss of $0.5 million compared to net loss of $0.2 million in the second quarter of 2021 and net income of $0.1 million in the first quarter of 2022, attributable to higher costs related to investment in specific growth initiatives (including preparation for commercial launch of the Canadian-dollar version of its digital deposit receipts), as well as higher salary and benefits expense and higher business development costs. |
MANAGEMENT COMMENTARY
“The second quarter was yet another quarter highlighted by a new record loan portfolio in our Digital Banking operations, with our Canadian Point-of-Sale financing business growing more than 50% year-over-year, with that strong growth momentum continuing in third quarter to date,” said David Taylor, President and Chief Executive Officer, VersaBank. “The continued growth of our Point-of-Sale business in Canada provides us with even greater confidence in the potential for this innovative and unique offering in the United States, as we add additional customers throughout 2022 and beyond.”
“Despite strong year-over-year growth, net income for the second quarter was dampened by short-term investments in a number of initiatives that we expect will contribute to accelerated growth in both the short- and long-terms, notably preparation and roll out of the Point-of-Sale business in our Digital Banking operations in the US and preparation for the commercial launch of VCAD, the Canadian-dollar version of our revolutionary Digital Deposit Receipts, including the SOC2 compliance audit, the majority of the costs of which reside in DRTC. We expect net income for the remainder of the year to be driven by continued growth in our Canadian Point-of-Sale business, along with ramp up of the U.S. Point-of-Sale business, as well as continued profitable growth in the Cybersecurity Services component of DRTC.”
FINANCIAL REVIEW
Consolidated
Net Income – Net income for the quarter was $4.9 million, or $0.17 per common share (basic and diluted), compared to $5.6 million, or $0.19 per common share (basic and diluted) last quarter and $5.7 million, or $0.25 per common share (basic and diluted), for the same period a year ago. The year-over-year and quarter-over-quarter trends were a function primarily of higher costs related to investment in specific growth initiatives (including, but not limited to, the U.S. POS financing roll out and preparation for commercial launch of the Canadian-dollar version of VersaBank’s Digital Deposit Receipts), as well as higher salary and benefits costs, and higher office expense resulting from the implementation of VersaBank’s return-to-work strategy. The year-over-year trend reflects the impact of a provision for credit losses in the current quarter compared to a recovery of credit loss provisions in the amount of $312,000 a year ago and higher insurance premiums attributable to the Bank’s listing on Nasdaq. Year-to-date net income and EPS were $10.5 million and $0.36 respectively, compared to $11.0 million and $0.47 for the same period a year ago. The year-over-year trends were a function of the same variables driving the quarterly trends as well as the impact of a provision for credit losses of $78,000 in the current period compared to a recovery of credit loss provisions in the amount of $255,000 in the comparative period and higher insurance premiums attributable to the Bank’s listing on Nasdaq. The magnitude of the EPS trend was affected notably by the impact of dilution attributable to the Common Share Offering.
Digital Banking Operations
Net Interest Margin – Net interest margin (or spread) for the quarter was 2.77% compared to 2.77% last quarter and 2.96% for the same period a year ago. Year-to-date net interest margin was 2.69% compared to 2.91% for the same period a year ago. The trends are primarily the result of VersaBank’s strategy to grow its POS Financing portfolio, which generates lower average net interest margins than the CRE portfolio, and in which VersaBank was more aggressive with pricing in the second quarter of 2022 to capitalize on certain high-growth opportunities
Net Interest Margin on Loans – Net interest margin on loans is calculated as net interest income net of the impact of cash and other assets, divided by average gross loans. Net interest margin on loans for the quarter was 3.11% compared to 3.22% last quarter and 3.55% for the same period a year ago. Year-to-date net interest margin on loans was 3.14% compared to 3.55% for the same period a year ago. The trends are primarily the result of VersaBank’s strategy to grow its POS Financing portfolio, which generates lower average net interest margins than the CRE portfolio, and in which VersaBank was more aggressive with pricing in the second quarter of 2022 to capitalize on certain high-growth opportunities.
Net Interest Income – Net interest income for the quarter was $17.2 million compared to $16.9 million last quarter and $15.1 million for the same period a year ago. The quarter-over-quarter and year-over year trends were a function primarily of higher interest income earned on higher lending assets, offset partially by lower fees earned on the Bank’s CRE mortgage portfolio and higher interest expense attributable to higher deposit balances. The year-over year trend also reflects higher interest expense in the current quarter attributable to the issuance of USD $75 million principal amount of subordinated notes payable on April 30, 2021. Year-to-date net interest income was $34.1 million compared to $29.5 million for the same period a year ago.
Non-Interest Expenses – Non-interest expenses for the quarter were $11.8 million compared to $10.6 million last quarter and $8.3 million for the same period a year ago. The quarter-over-quarter and year-over-year trends were a function primarily of higher costs related to investment in specific growth initiatives, including, but not limited to the U.S. POS financing roll out and preparation for commercial launch of the Canadian-dollar version of its Digital Deposit Receipts, higher salary and benefits expense attributable to higher staffing levels to support expanded business activity across the Bank, higher costs associated with employee retention, and higher office and facility related costs attributable to implementation of the Bank’s return-to-work strategy. The year-over-year trend also reflects higher insurance premiums attributable to the Bank’s listing on Nasdaq. Year-to-date non-interest expenses were $22.4 million compared to $16.4 million for the same period a year ago. The year-over-year trend was a function primarily of the items set out above and the current period including six months of operating expenses of Digital Boundary Group (“DBG”) compared to five months of operating expenses included in the comparative period due to the timing of the Bank’s acquisition of DBG on November 30, 2020.
Provision for/Recovery of Credit Losses – The Bank recognized a provision for credit losses in the current quarter in the amount of $78,000 compared to a provision for credit losses in the amount of $2,000 last quarter and a recovery of credit loss provisions in the amount of $312,000 for the same period a year ago. The quarter-over-quarter and year-over-year trends were a function primarily of higher lending asset balances, offset partially by changes in the Bank’s lending asset portfolio mix and changes in the forward-looking information used by the Bank in its credit risk models in the current quarter. Year-to-date, the Bank recognized a provision for credit losses in the current period in the amount of $80,000 compared to a recovery of credit loss provisions in the amount of $255,000 for the same period a year ago.
Capital – At April 30, 2022, VersaBank’s Total regulatory capital was $432 million compared to $426 million last quarter and $333 million a year ago and the Bank’s CET1 capital ratio was 13.66%, compared 14.83% last quarter and 12.52% a year ago. The quarter-over-quarter capital ratio trends were a function primarily of retained earnings growth and changes to the Bank’s risk-weighted asset balances and composition. The year-over-year trends were a function primarily of the Common Share Offering in September 2021, retained earnings growth, and changes to the Bank’s risk-weighted asset balances and composition.
Credit Quality -- Gross impaired loans at April 30, 2022 were $nil, compared to $nil a year ago. The Bank’s allowance for expected credit losses, or ECL at April 30, 2022 was $1.53 million compared to $1.46 million last quarter and $1.64 million a year ago. The quarter-over-quarter and year-over-year ECL trends were a function primarily of the factors set out in the Provision for/Recovery of Credit Losses section above. VersaBank’s Provision for Credit Losses ratio continues to be one of the lowest in the Canadian industry, reflecting the very low risk profile of the Bank’s lending portfolio, enabling it to generate superior net interest margins by offering innovative, high-value deposit and lending solutions that address unmet needs in the banking industry through a highly efficient partner model.
Lending Operations: POS Financing – Leveraging its proprietary technology, VersaBank electronically purchases small loan and lease receivables from its network of origination partners who make point of sale loans and leases, primarily for big ticket consumer purchases, throughout Canada. For the second quarter of 2022, VersaBank’s POS Financing portfolio was up 51% year-over-year and 12% sequentially to $1.6 billion as a function primarily of continued strong demand for home finance, auto and home improvement/HVAC receivable financing. Consumer spending in Canada is expected to remain strong as a function of a tight labour market and as excess savings continue to be deployed into a range of durable goods, including assets related to home improvements, as well as home purchases for which VersaBank’s POS loan and lease origination partners provide financing. These trends, combined with the anticipated addition of new origination partners, represent key drivers of what is expected to be strong POS Financing balance sheet growth over the course of the second half of fiscal 2022. In addition, VersaBank entered the US lending market in the second quarter of 2022 through the completion of a receivable purchase transaction with its first US-based, POS Financing origination partner, a large, North American, commercial transportation financing business focused on independent owner/operators. Management anticipates measured growth in its US POS Financing portfolio over the second half of fiscal 2022 as VersaBank continues to source and onboard new origination partners that operate with a credit risk profile that is aligned with VersaBank’s risk appetite.
Lending Operations: Commercial Lending – Commercial loans are originated through a well-established network of mortgage brokers and syndication partners, as well as through direct contact with VersaBank’s staff. Most of these loans are secured by real estate assets located in Ontario and certain other Canadian provinces. The portfolio increased 10% year-over-year and 8% sequentially to $832 million. VersaBank anticipates continued growth in the commercial mortgage sector over the course of the second half of fiscal 2022, specifically related to financing for residential housing properties, albeit somewhat moderated relative to management’s view in the first half of fiscal 2022.
Deposit Funding -- VersaBank continues to increase its proportion of lower-cost commercial deposits by growing its well diversified Trustee in Bankruptcy, (“TIB”) program deposit base which currently attracts a nominal interest rate. This low-cost diversified deposit channel provides VersaBank with a significant cost of funds advantage, enabling it to generate superior net interest margins while maintaining its conservative risk profile. VersaBank’s cost of funds for the second quarter of 2022 was 1.38%, up 9 bps sequentially and 10 bps year-over-year. Management anticipates that commercial deposit volumes raised via VersaBank’s Trustee Integrated Banking (“TIB”) program will grow over the second half of fiscal 2022 as a function of an increase in the volume of consumer bankruptcy and proposal restructuring proceedings over the same timeframe attributable to the Bank of Canada continuing to tighten monetary policy over the course of the year. Further, VersaBank continues to grow and expand its well-established, diverse deposit broker network through which it sources personal deposits, consisting primarily of guaranteed investment certificates. Management expects the combination of the operational trends set out above will mitigate the expansion of its cost of funds, despite the anticipation of the Bank of Canada continuing to increase interest rates over the course of the second half of the year. Commercial deposits at April 30, 2022 were $609 million, up 9% year-over-year and up 2% sequentially. The year-over-year and quarter-over-quarter trends were attributable to continued growth in the Bank’s TIB program.
DRTC (Cybersecurity Services and Banking and Financial Technology Development)
For the second quarter of 2022, DRTC recorded a net loss of $472,000 compared to net loss of $151,000 a year ago and net income of $148,000 sequentially. The year-over-year and quarter-over-quarter trends were a function primarily of higher operating expense, offset partially by higher revenue. Year-to-date, DRTC recorded a net loss of $325,000 compared to net income of $22,000 a year ago. The year-over-year trend was a function primarily of the items set out above as well as the comparative period including only five months of operations due to the timing of the Bank’s acquisition of DBG on November 30, 2020.
FINANCIAL HIGHLIGHTS
|
(unaudited) |
for the three months ended |
for the six months ended |
||||||||||||||
|
April 30 |
April 30 |
April 30 |
April 30 |
|||||||||||||
|
($CDN thousands except per share amounts) |
2022 |
2021 |
2022 |
2021 |
||||||||||||
|
Results of operations |
||||||||||||||||
|
Interest income |
$ | 25,848 | $ | 21,649 | $ | 50,568 | $ | 43,164 | ||||||||
|
Net interest income |
17,242 | 15,095 | 34,127 | 29,469 | ||||||||||||
|
Non-interest income |
1,393 | 875 | 2,774 | 1,923 | ||||||||||||
|
Total revenue |
18,635 | 15,970 | 36,901 | 31,392 | ||||||||||||
|
Provision for (recovery of) credit losses |
78 | (312 | ) | 80 | (255 | ) | ||||||||||
|
Non-interest expenses |
11,767 | 8,342 | 22,403 | 16,429 | ||||||||||||
|
Digital Banking |
10,006 | 7,360 | 19,509 | 14,690 | ||||||||||||
|
DRTC |
1,803 | 1,023 | 2,977 | 1,808 | ||||||||||||
|
Net income |
4,943 | 5,744 | 10,509 | 11,034 | ||||||||||||
|
Income per common share: |
||||||||||||||||
|
Basic |
$ | 0.17 | $ | 0.25 | $ | 0.36 | $ | 0.47 | ||||||||
|
Diluted |
$ | 0.17 | $ | 0.25 | $ | 0.36 | $ | 0.47 | ||||||||
|
Dividends paid on preferred shares |
$ | 247 | $ | 542 | $ | 494 | $ | 1,084 | ||||||||
|
Dividends paid on common shares |
$ | 687 | $ | 528 | $ | 1,374 | $ | 1,056 | ||||||||
|
Yield* |
4.15 | % | 4.24 | % | 3.99 | % | 4.26 | % | ||||||||
|
Cost of funds* |
1.38 | % | 1.28 | % | 1.30 | % | 1.35 | % | ||||||||
|
Net interest margin* |
2.77 | % | 2.96 | % | 2.69 | % | 2.91 | % | ||||||||
|
Net interest margin on loans* |
3.11 | % | 3.55 | % | 3.14 | % | 3.55 | % | ||||||||
|
Return on average common equity* |
5.92 | % | 9.20 | % | 6.25 | % | 8.73 | % | ||||||||
|
Book value per common share* |
$ | 11.94 | $ | 11.06 | $ | 11.94 | $ | 11.06 | ||||||||
|
Efficiency ratio* |
63 | % | 52 | % | 61 | % | 52 | % | ||||||||
|
Efficiency ratio - Digital Banking* |
58 | % | 49 | % | 57 | % | 50 | % | ||||||||
|
Return on average total assets* |
0.75 | % | 1.02 | % | 0.79 | % | 0.98 | % | ||||||||
|
Gross impaired loans to total loans* |
0.00 | % | 0.00 | % | 0.00 | % | 0.00 | % | ||||||||
|
Provision (recovery) for credit losses as a % of average loans* |
0.01 | % | (0.07 | %) | 0.01 | % | (0.03 | %) | ||||||||
|
as at |
||||||||||||||||
|
Balance Sheet Summary |
||||||||||||||||
|
Cash |
$ | 198,157 | $ | 272,428 | $ | 198,157 | $ | 272,428 | ||||||||
|
Loans, net of allowance for credit losses |
2,450,276 | 1,829,776 | 2,450,276 | 1,829,776 | ||||||||||||
|
Average loans* |
2,332,957 | 1,811,750 | 2,276,663 | 1,742,343 | ||||||||||||
|
Total assets |
2,692,146 | 2,139,757 | 2,692,146 | 2,139,757 | ||||||||||||
|
Deposits |
2,124,916 | 1,679,273 | 2,124,916 | 1,679,273 | ||||||||||||
|
Subordinated notes payable |
98,410 | 94,392 | 98,410 | 94,392 | ||||||||||||
|
Shareholders' equity |
341,414 | 247,366 | 341,414 | 247,366 | ||||||||||||
|
Capital ratios** |
||||||||||||||||
|
Risk-weighted assets |
$ | 2,313,030 | $ | 1,763,424 | $ | 2,313,030 | $ | 1,763,424 | ||||||||
|
Common Equity Tier 1 capital |
315,963 | 220,740 | 315,963 | 220,740 | ||||||||||||
|
Total regulatory capital |
432,083 | 333,161 | 432,083 | 333,161 | ||||||||||||
|
Common Equity Tier 1 (CET1) ratio |
13.66 | % | 12.52 | % | 13.66 | % | 12.52 | % | ||||||||
|
Tier 1 capital ratio |
14.25 | % | 13.29 | % | 14.25 | % | 13.29 | % | ||||||||
|
Total capital ratio |
18.68 | % | 18.89 | % | 18.68 | % | 18.89 | % | ||||||||
|
Leverage ratio |
11.63 | % | 10.46 | % | 11.63 | % | 10.46 | % | ||||||||
|
* See definitions under ‘Non-GAAP and Other Financial Measures' in the Q2 2022 Management’s Discussion and Analysis. |
|
** Capital management and leverage measures are in accordance with OSFI's Capital Adequacy Requirements and Basel III Accord. |
COVID-19 Update
With public health restrictions being generally relaxed or removed altogether over the recent months management has commenced the implementation of the Bank’s return-to-work strategy that is anticipated to accommodate the majority of our staff transitioning from working remotely to working in a traditional office setting over the course of the third quarter of 2022.
Notwithstanding the above, we continue to monitor the data and information available related to the emergence of new variants of COVID-19 as well as attempt to anticipate the potential impact on our community, the Canadian economy and the Bank’s business operations.
About VersaBank
VersaBank is a Canadian Schedule I chartered (federally licensed) bank with a difference. VersaBank became the world’s first fully digital financial institution when it adopted its highly efficient business-to-business model using its proprietary state-of-the-art financial technology to profitably address underserved segments of the Canadian banking market in the pursuit of superior net interest margins while mitigating risk. VersaBank obtains all of its deposits and provides the majority of its loans and leases electronically, with innovative deposit and lending solutions for financial intermediaries that allow them to excel in their core businesses. In addition, leveraging its internally developed IT security software and capabilities, VersaBank established wholly owned, Washington, DC-based subsidiary, DRT Cyber Inc. to pursue significant large-market opportunities in cyber security and develop innovative solutions to address the rapidly growing volume of cyber threats challenging financial institutions, multi-national corporations and government entities on a daily basis.
VersaBank’s Common Shares trade on the Toronto Stock Exchange (“TSX”) and Nasdaq under the symbol VBNK. Its Series 1 Preferred Shares trade on the TSX under the symbol VBNK.PR.A.
Forward-Looking Statements
The statements in this press release that relate to the future are forward-looking statements. By their very nature, forward-looking statements involve inherent risks and uncertainties, both general and specific, many of which are out of our control. Risks exist that predictions, forecasts, projections, and other forward-looking statements will not be achieved. Readers are cautioned not to place undue reliance on these forward-looking statements as several important factors could cause actual results to differ materially from the plans, objectives, expectations, estimates and intentions expressed in such forward-looking statements. These factors include, but are not limited to, the strength of the Canadian economy in general and the strength of the local economies within Canada in which we conduct operations; the effects of changes in monetary and fiscal policy, including changes in interest rate policies of the Bank of Canada; changing global commodity prices; the effects of competition in the markets in which we operate; inflation; capital market fluctuations; the timely development and introduction of new products in receptive markets; the impact of changes in the laws and regulations pertaining to financial services; changes in tax laws; technological changes; unexpected judicial or regulatory proceedings; unexpected changes in consumer spending and savings habits; the impact of wars or conflicts including the crisis in Ukraine and the impact of the crisis on global supply chains ; the impact of new variants of COVID-19 and the Bank’s anticipation of and success in managing the risks implicated by the foregoing. For a detailed discussion of certain key factors that may affect our future results, please see our annual MD&A for the year ended October 31, 2021.
The foregoing list of important factors is not exhaustive. When relying on forward-looking statements to make decisions, investors and others should carefully consider the foregoing factors and other uncertainties and potential events. The forward-looking information contained in this document and the related management’s discussion and analysis is presented to assist our shareholders and others in understanding our financial position and may not be appropriate for any other purposes. Except as required by securities law, we do not undertake to update any forward-looking statement that is contained in this document and the related management’s discussion and analysis or made from time to time by the Bank or on its behalf.
Conference Call
VersaBank will be hosting a conference call and webcast today, Wednesday, June 1, 2022, at 9:00 a.m. (EDT) to discuss its second quarter results, featuring a presentation by David Taylor, President & CEO, and other VersaBank executives, followed by a question and answer period.
Dial-in Details
| Toll-free dial-in number: | 1 (888) 664-6392 (Canada/US) |
| Local dial-in number: | (416) 764-8659 |
| Local dial-in number: | 31237349 |
Please call between 8:45 a.m. and 8:55 a.m. (EDT).
Webcast Access: For those preferring to listen to the conference call via the Internet, a webcast of Mr. Taylor’s presentation will be available via the internet, accessible here https://bit.ly/3LNOJi1 or from the Bank’s web site.
Instant Replay
| Toll-free dial-in number: | 1 (888) 390-0541 (Canada/US) |
| Local dial-in number: | (416) 764-8677 |
| Passcode: | 237349# |
| Expiry Date: | August 30th, 2022, at 11:59 p.m. (EDT) |
The archived webcast presentation will also be available via the Internet for 90 days following the live event at https://bit.ly/3LNOJi1 and on the Bank’s web site.
FOR FURTHER INFORMATION, PLEASE CONTACT:
|
LodeRock Advisors Lawrence Chamberlain (416) 519-4196 |
Visit our website at: www.versabank.com
Follow VersaBank on Facebook, Instagram, LinkedIn and Twitter
Exhibit 99.4
For Immediate Release: June 1, 2022
Attention: Business Editors
VERSABANK DECLARES DIVIDENDS
LONDON, ON/CNW - VersaBank (the “Bank”) (TSX: VBNK; NASDAQ: VBNK) today announced that cash dividends in the amount of CAD $0.025 per Common Share of the Bank and CAD $0.1693 per Series 1 Preferred Share of the Bank, have been declared for the quarter ending July 31, 2022, payable as of July 31, 2022, to shareholders of record at the close of business on July 8, 2022.
The dividends to which this notice relates are eligible dividends for tax purposes.
About VersaBank
VersaBank is a Canadian Schedule I chartered bank with a difference. VersaBank became the world’s first fully digital financial institution when it adopted its highly efficient business-to-business model using its proprietary state-of-the-art financial technology to profitably address underserved segments of the Canadian banking market in the pursuit of superior net interest margins while mitigating risk. VersaBank obtains all of its deposits and provides the majority of its loans and leases electronically, with innovative deposit and lending solutions for financial intermediaries that allow them to excel in their core businesses. In addition, leveraging its internally developed IT security software and capabilities, VersaBank established wholly owned, Washington, DC-based subsidiary, DRT Cyber Inc. to pursue significant large-market opportunities in cyber security and develop innovative solutions to address the rapidly growing volume of cyber threats challenging financial institutions, multi-national corporations and government entities on a daily basis.
VersaBank’s Common Shares trade on the Toronto Stock Exchange (“TSX”) and Nasdaq under the symbol VBNK. Its Series 1 Preferred Shares trade on the TSX under the symbol VBNK.PR.A.
FOR FURTHER INFORMATION, PLEASE CONTACT:
|
LodeRock Advisors Lawrence Chamberlain (416) 519-4196 |
Visit our website at: www.versabank.com
Follow VersaBank on Facebook, Instagram, LinkedIn and Twitter.
Exhibit 99.5
FORM 52-109F2
CERTIFICATION OF INTERIM FILINGS
FULL CERTIFICATE
I, David R. Taylor, President & Chief Executive Officer of VersaBank, certify the following:
|
1. |
Review: I have reviewed the interim financial statements and interim MD&A (together, the “interim filings”) of VersaBank (the “issuer”) for the interim period ended April 30, 2022. |
|
2. |
No misrepresentations: Based on my knowledge, having exercised reasonable diligence, the interim filings do not contain any untrue statement of a material fact or omit to state a material fact required to be stated or that is necessary to make a statement not misleading in light of the circumstances under which it was made, with respect to the period covered by the interim filings. |
|
3. |
Fair presentation: Based on my knowledge, having exercised reasonable diligence, the interim financial statements together with the other financial information included in the interim filings fairly present in all material respects the financial condition, financial performance and cash flows of the issuer, as of the date of and for the periods presented in the interim filings. |
|
4. |
Responsibility: The issuer’s other certifying officer(s) and I are responsible for establishing and maintaining disclosure controls and procedures (DC&P) and internal control over financial reporting (ICFR), as those terms are defined in National Instrument 52-109 Certification of Disclosure in Issuers’ Annual and Interim Filings, for the issuer. |
|
5. |
Design: Subject to the limitations, if any, described in paragraphs 5.2 and 5.3, the issuer’s other certifying officer(s) and I have, as at the end of the period covered by the interim filings |
|
(a) |
designed DC&P, or caused it to be designed under our supervision, to provide reasonable assurance that |
|
(i) |
material information relating to the issuer is made known to us by others, particularly during the period in which the interim filings are being prepared; and |
|
(ii) |
information required to be disclosed by the issuer in its annual filings, interim filings or other reports filed or submitted by it under securities legislation is recorded, processed, summarized and reported within the time periods specified in securities legislation; and |
|
(b) |
designed ICFR, or caused it to be designed under our supervision, to provide reasonable assurance regarding the reliability of financial reporting and the preparation of financial statements for external purposes in accordance with the issuer’s GAAP. |
|
5.1 |
Control framework: The control framework the issuer’s other certifying officer(s) and I used to design the issuer’s ICFR is Internal Control – Integrated Framework, issued by the Committee of Sponsoring Organizations of the Treadway Commission. |
|
5.2 |
N/A |
|
5.3 |
N/A |
|
6. |
Reporting changes in ICFR: The issuer has disclosed in its interim MD&A any change in the issuer’s ICFR that occurred during the period beginning on February 1, 2022 and ended on April 30, 2022 that has materially affected, or is reasonably likely to materially affect, the issuer’s ICFR. |
Date: June 1, 2022
/s/ David R. Taylor
___________________
David R. Taylor
President &
Chief Executive Officer
Exhibit 99.6
FORM 52-109F2
CERTIFICATION OF INTERIM FILINGS
FULL CERTIFICATE
I, Shawn Clarke, Chief Financial Officer of VersaBank, certify the following:
|
1. |
Review: I have reviewed the interim financial statements and interim MD&A (together, the “interim filings”) of VersaBank (the “issuer”) for the interim period ended April 30, 2022. |
|
2. |
No misrepresentations: Based on my knowledge, having exercised reasonable diligence, the interim filings do not contain any untrue statement of a material fact or omit to state a material fact required to be stated or that is necessary to make a statement not misleading in light of the circumstances under which it was made, with respect to the period covered by the interim filings. |
|
3. |
Fair presentation: Based on my knowledge, having exercised reasonable diligence, the interim financial statements together with the other financial information included in the interim filings fairly present in all material respects the financial condition, financial performance and cash flows of the issuer, as of the date of and for the periods presented in the interim filings. |
|
4. |
Responsibility: The issuer’s other certifying officer(s) and I are responsible for establishing and maintaining disclosure controls and procedures (DC&P) and internal control over financial reporting (ICFR), as those terms are defined in National Instrument 52-109 Certification of Disclosure in Issuers’ Annual and Interim Filings, for the issuer. |
|
5. |
Design: Subject to the limitations, if any, described in paragraphs 5.2 and 5.3, the issuer’s other certifying officer(s) and I have, as at the end of the period covered by the interim filings |
|
(a) |
designed DC&P, or caused it to be designed under our supervision, to provide reasonable assurance that |
|
(i) |
material information relating to the issuer is made known to us by others, particularly during the period in which the interim filings are being prepared; and |
|
(ii) |
information required to be disclosed by the issuer in its annual filings, interim filings or other reports filed or submitted by it under securities legislation is recorded, processed, summarized and reported within the time periods specified in securities legislation; and |
|
(b) |
designed ICFR, or caused it to be designed under our supervision, to provide reasonable assurance regarding the reliability of financial reporting and the preparation of financial statements for external purposes in accordance with the issuer’s GAAP. |
|
5.1 |
Control framework: The control framework the issuer’s other certifying officer(s) and I used to design the issuer’s ICFR is Internal Control – Integrated Framework, issued by the Committee of Sponsoring Organizations of the Treadway Commission. |
|
5.2 |
N/A |
|
5.3 |
N/A |
|
6. |
Reporting changes in ICFR: The issuer has disclosed in its interim MD&A any change in the issuer’s ICFR that occurred during the period beginning on February 1, 2022 and ended on April 30, 2022 that has materially affected, or is reasonably likely to materially affect, the issuer’s ICFR. |
Date: June 1, 2022
/s/ Shawn Clarke
____________________
Shawn Clarke
Chief Financial Officer
Serious News for Serious Traders! Try StreetInsider.com Premium Free!
You May Also Be Interested In
- Interim report 2024, January - March
- Annual Financial Report
- Squirrel Ai Spearheads Premier AI Event - IJCAI Symposium, Showcasing Innovative LLM Applications in Education
Create E-mail Alert Related Categories
SEC FilingsSign up for StreetInsider Free!
Receive full access to all new and archived articles, unlimited portfolio tracking, e-mail alerts, custom newswires and RSS feeds - and more!
