

Form 6-K Valens Company, Inc. For: Apr 14
 Tweet
Tweet Share
Share
UNITED STATES
SECURITIES AND EXCHANGE COMMISSION
Washington, D.C. 20549
Form 6-K
REPORT OF FOREIGN PRIVATE ISSUER
PURSUANT TO RULE 13a-16 OR 15d-16
UNDER THE SECURITIES EXCHANGE ACT OF 1934
For the month of: April 2022
Commission File Number: 001-41080
THE VALENS COMPANY INC.
(Translation of registrant’s name into English)
230 Carion Road
Kelowna, British Columbia, Canada V4V 2K5
(Address of principal executive office)
Indicate by check mark whether the registrant files or will file annual reports under cover of Form 20-F or Form 40-F.
Form 20-F ¨ Form 40-F x
Indicate by check mark if the registrant is submitting the Form 6-K in paper as permitted by Regulation S-T Rule 101(b)(1): ¨
Indicate by check mark if the registrant is submitting the Form 6-K in paper as permitted by Regulation S-T Rule 101(b)(7): ¨
SIGNATURES
Pursuant to the requirements of the Securities Exchange Act of 1934, the registrant has duly caused this report to be signed on its behalf by the undersigned, thereunto duly authorized.
| The Valens Company Inc. | ||
| (Registrant) | ||
| Date: April 14, 2022 | By: | /s/ Jeff Fallows |
| Jeff Fallows, President | ||
EXHIBIT INDEX
| Exhibit | Description |
| 99.1 | Corporate Presentation, current as of April 13, 2022, entitled “Q1 2022 Earnings” |
Exhibit 99.1
| TSX: VLNS NASDAQ:VLNS Q1 2022 EARNINGS THEVALENSCOMPANY.COM |
| NOTICE TO RECIPIENT This presentation (the “Presentation”) of The Valens Company Inc.(the “Company” or “The Valens Company” or “Valens”) is an overview only and does not contain all the information that a prospective investor may require to make investment decisions. This Presentation is for information purposes only and does not constitute an offer to sell or a solicitation to buy any securities of the Company. In making an investment decision, investors must rely on their own examination of the Company, including the merits and risks involved. This presentation is confidential and contains confidential information and distribution of this presentation may also be restricted or prohibited by law. Recipients are required to inform themselves of, and comply with, all such restrictions or prohibitions. FORWARD LOOKING STATEMENTS This Presentation contains forward-looking statements and forward-looking information (collectively, “forward-looking statements”) within the meaning of applicable Canadian securities laws. Any statements that involve discussions with respect to predictions, expectations, beliefs, plans, projections, objectives, assumptions or future events or performance (often but not always using phrases such as "expects",“ is expected", "anticipates", "plans", "budget", "scheduled", "forecasts", "estimates", "believes“ or "intends", or variations of such words and phrases (including negative and grammatical variations), or stating that certain actions, events or results "may", "could", "would", "should", "might" or "will" be taken, occur or be achieved) are not statements of historical fact and may be forward-looking statements and are intended to identify forward-looking statements. By their nature, forward-looking statements are based on assumptions and are subject to known and unknown risks, uncertainties and other factors which may cause the actual results, performance or achievements of the Company, or developments in the Company’s industry, to be materially different from any future results, performance or achievements, or industry developments, expressed or implied by the forward-looking statements and information. These risks are described in the Company’s latest Annual Information Form for the year ended November 30, 2020 and Management’s Discussion and Analysis of the Company for the three-month period ended February 28, 2021 (the “MD&A”), each as filed with the Canadian securities regulatory authorities on SEDAR at www.sedar.com. Examples of forward-looking statements include, without limitation:(A) financial forecasts of the Company;(B) the intention to grow the business and operations of the Company;(C) anticipated timing for the availability of the Company’s products to market and expected sale prices;(D) expected growth in the number of users of medical and recreational marijuana anticipated in various regional and international markets; and (E) the expansion of the Company’s business into other revenue streams. Actual results and developments are likely to differ, and may differ materially, from those expressed or implied by the forward-looking statements contained in this Presentation. Such forward-looking statements are based on a number of assumptions which may prove to be incorrect, including, but not limited to: expectations regarding the ability of the Company to raise capital and grow through acquisitions; growth strategy, joint venture and other commercial opportunities, including cannabis-related legal reform and regulatory changes with respect to the U.S. and other international markets, and the ability of the Company to capitalize on these opportunities through its stated work program; and expected sources and uses of capital. There can be no assurance that forward-looking statements will prove to be accurate, as actual results and future events could differ materially from those anticipated in such statements. Accordingly, readers should not place undue reliance on forward-looking statements. The forward-looking statements and information contained in this Presentation are expressly qualified in their entirety by this cautionary statement. The forward-looking statements and information included in this Presentation are made as of the date of this Presentation and the Company assumes no obligation to update such forward-looking statements to reflect new information, subsequent events or otherwise unless required by applicable securities legislation. TSX: VLNS | NASDAQ: VLNS 2 |
| Historical statements contained in this Presentation regarding past trends or activities should not be taken as a representation that such trends or activities will continue in the future. In this regard, certain financial information contained herein has been extracted from, or based upon, information available in the public domain and/or provided by the Company. In particular, historical results of the Company should not be taken as a representation that such trends will be replicated in the future. No statement in this document is intended to be nor may be construed as a profit forecast. CAUTIONARY NOTE REGARDING FUTURE-ORIENTED FINANCIAL INFORMATION To the extent any forward-looking statement in this Presentation constitutes “future-oriented financial information” or “financial outlooks” within the meaning of applicable Canadian securities laws, such information is being provided to demonstrate the anticipated market penetration and the reader is cautioned that this information may not be appropriate for any other purpose and the reader should not place undue reliance on such future-oriented financial information and financial outlooks. Future-oriented financial information and financial outlooks, as with forward-looking statements generally, are, without limitation, based on the assumptions and subject to risks as set out above under the heading “Forward-Looking Statements”. The Company’s actual financial position and results of operations may differ materially from management’s current expectations and, as a result, the Company’s revenue and expenses may differ materially from the revenue and expenses profiles provided in this presentation. Such information is presented for illustrative purposes only and may not be an indication of the Company’s actual financial position or results of operations. THIRD PARTY INFORMATION This Presentation includes market and industry data which was obtained from various publicly available third-party sources. In preparing this Presentation, the Company has relied upon such data from certain of these sources and other sources believed by the Company to be true. Although the Company believes it to be reliable, the Company has not independently verified any of the data or conclusions from third-party sources referred to in this presentation, or analyzed or verified the underlying reports relied upon or referred to by such sources, or ascertained the underlying assumptions relied upon by such sources. The Company does not make any representation or warranty as to the accuracy or completeness, or suitability for any given analytical purpose, of such data or conclusions and disclaims any liability to the recipient from the recipient’s use of any such report or source, or the data or conclusions therein, including those reproduced herein. USE OF NON-GAAP MEASURES Adjusted EBITDA is a non-GAAP measure used by management that does not have any standardized meaning prescribed by IFRS and may not be comparable to similar measures presented by other companies. Management defines adjusted EBITDA as loss and comprehensive loss from operations, as reported, before interest, tax, depreciation and amortization, and adjusted for removing share- based payments, unrealized gains and losses from short term investments and other one-time and non-cash items including impairment losses. Management believes adjusted EBITDA is a useful financial metric to assess its operating performance on an adjusted basis as described above.A description of these financial measures, including a reconciliation of such measures, to the extent possible, against the most directly comparable IFRS measure, can be found starting on page 7 of the MD&A for the three-month period ended February 28, 2021. Adjusted Gross Margin and Adjusted Gross Profit is a non-GAAP ratio which management utilizes this measure to provide a representation of performance in the period by excluding the inventory impairment measurement adjustments and impacts of biological asset changes as required by IFRS. It is a non-GAAP ratio, which management believes provides useful information as it represents gross profit for management purposes based on costs to manufacture, package and ship inventory sold, exclusive of any impairments due to changes in internal or external influences impacting the net realizable value of inventory and non-cash items. 3 TSX: VLNS | NASDAQ: VLNS |
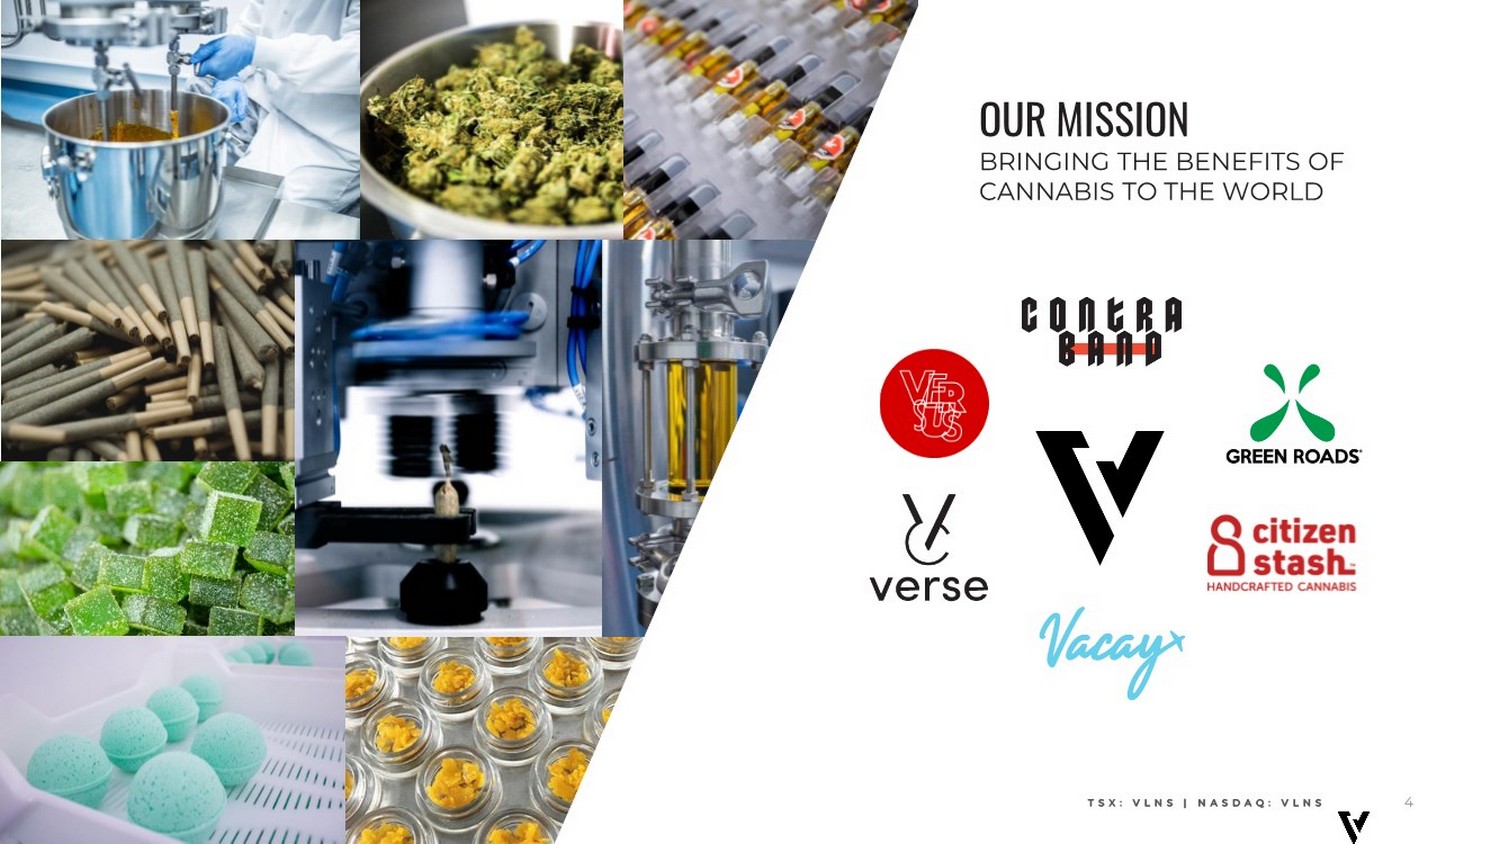
| OUR MISSION BRINGING THE BENEFITS OF CANNABIS TO THE WORLD 4 TSX: VLNS | NASDAQ: VLNS |
| 5 TABLE OF CONTENTS 1. Key Performance Indicators 2. Quarterly Highlights 3. B2C and B2B Sales 4. Q1 2022 Earnings Highlights 5. Summary and Closing Remark 6. Q&A |

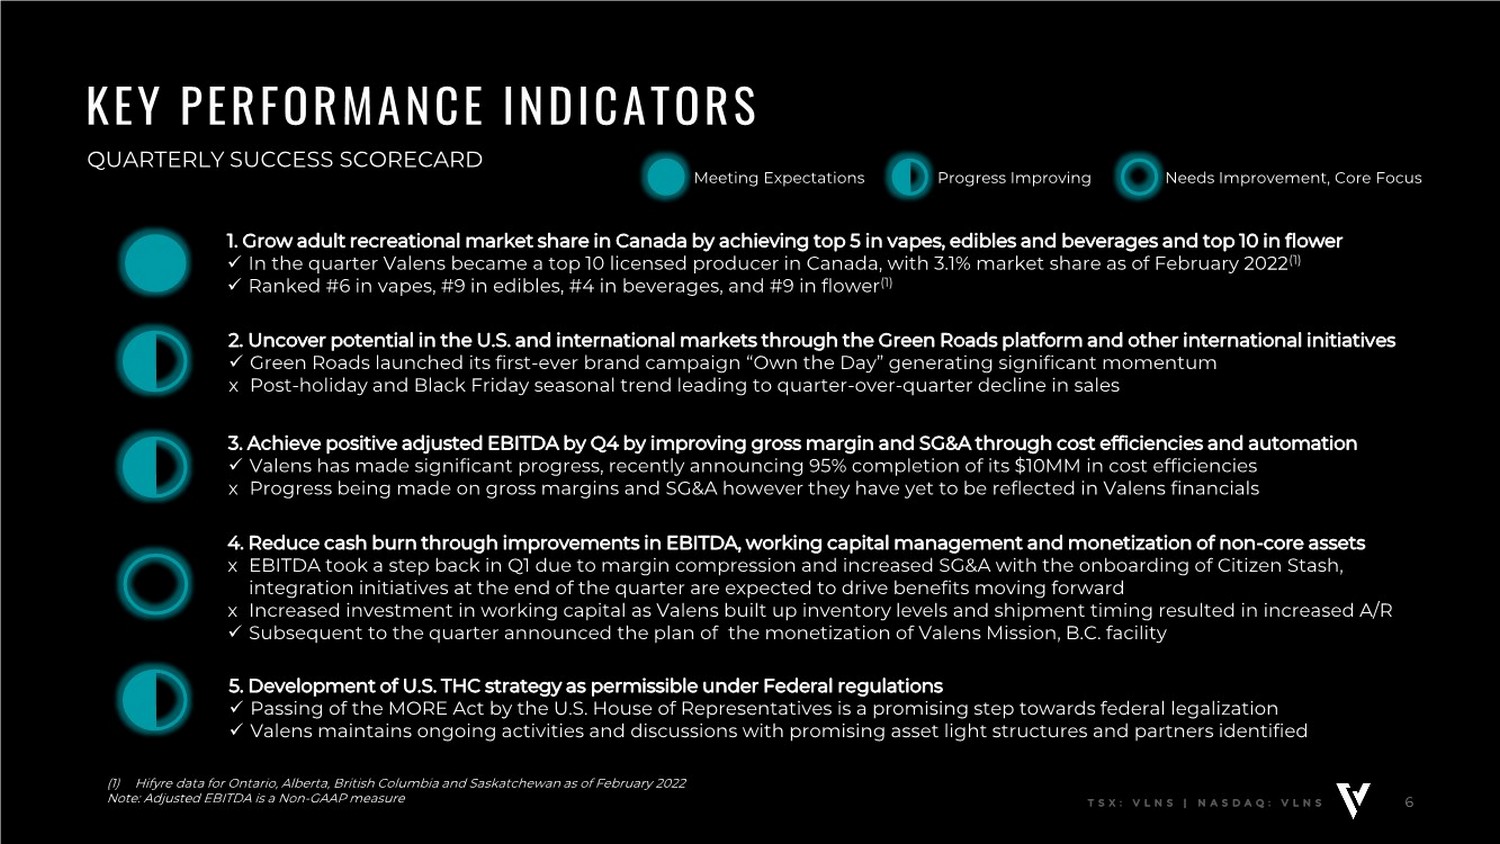
| 6 TSX: VLNS | NASDAQ: VLNS (1) Hifyre data for Ontario, Alberta, British Columbia and Saskatchewan as of February 2022 Note: Adjusted EBITDA is a Non-GAAP measure KEY PERFORMANCE INDICATORS QUARTERLY SUCCESS SCORECARD 1. Grow adult recreational market share in Canada by achieving top 5 in vapes, edibles and beverages and top 10 in flower ✓ In the quarter Valens became a top 10 licensed producer in Canada, with 3.1% market share as of February 2022(1) ✓ Ranked #6 in vapes, #9 in edibles, #4 in beverages, and #9 in flower(1) 2. Uncover potential in the U.S. and international markets through the Green Roads platform and other international initiatives ✓ Green Roads launched its first-ever brand campaign “Own the Day” generating significant momentum x Post-holiday and Black Friday seasonal trend leading to quarter-over-quarter decline in sales 3. Achieve positive adjusted EBITDA by Q4 by improving gross margin and SG&A through cost efficiencies and automation ✓ Valens has made significant progress, recently announcing 95% completion of its $10MM in cost efficiencies x Progress being made on gross margins and SG&A however they have yet to be reflected in Valens financials 4. Reduce cash burn through improvements in EBITDA, working capital management and monetization of non-core assets x EBITDA took a step back in Q1 due to margin compression and increased SG&A with the onboarding of Citizen Stash, integration initiatives at the end of the quarter are expected to drive benefits moving forward x Increased investment in working capital as Valens built up inventory levels and shipment timing resulted in increased A/R ✓ Subsequent to the quarter announced the plan of the monetization of Valens Mission, B.C. facility 5. Development of U.S. THC strategy as permissible under Federal regulations ✓ Passing of the MORE Act by the U.S. House of Representatives is a promising step towards federal legalization ✓ Valens maintains ongoing activities and discussions with promising asset light structures and partners identified Meeting Expectations Progress Improving Needs Improvement, Core Focus |
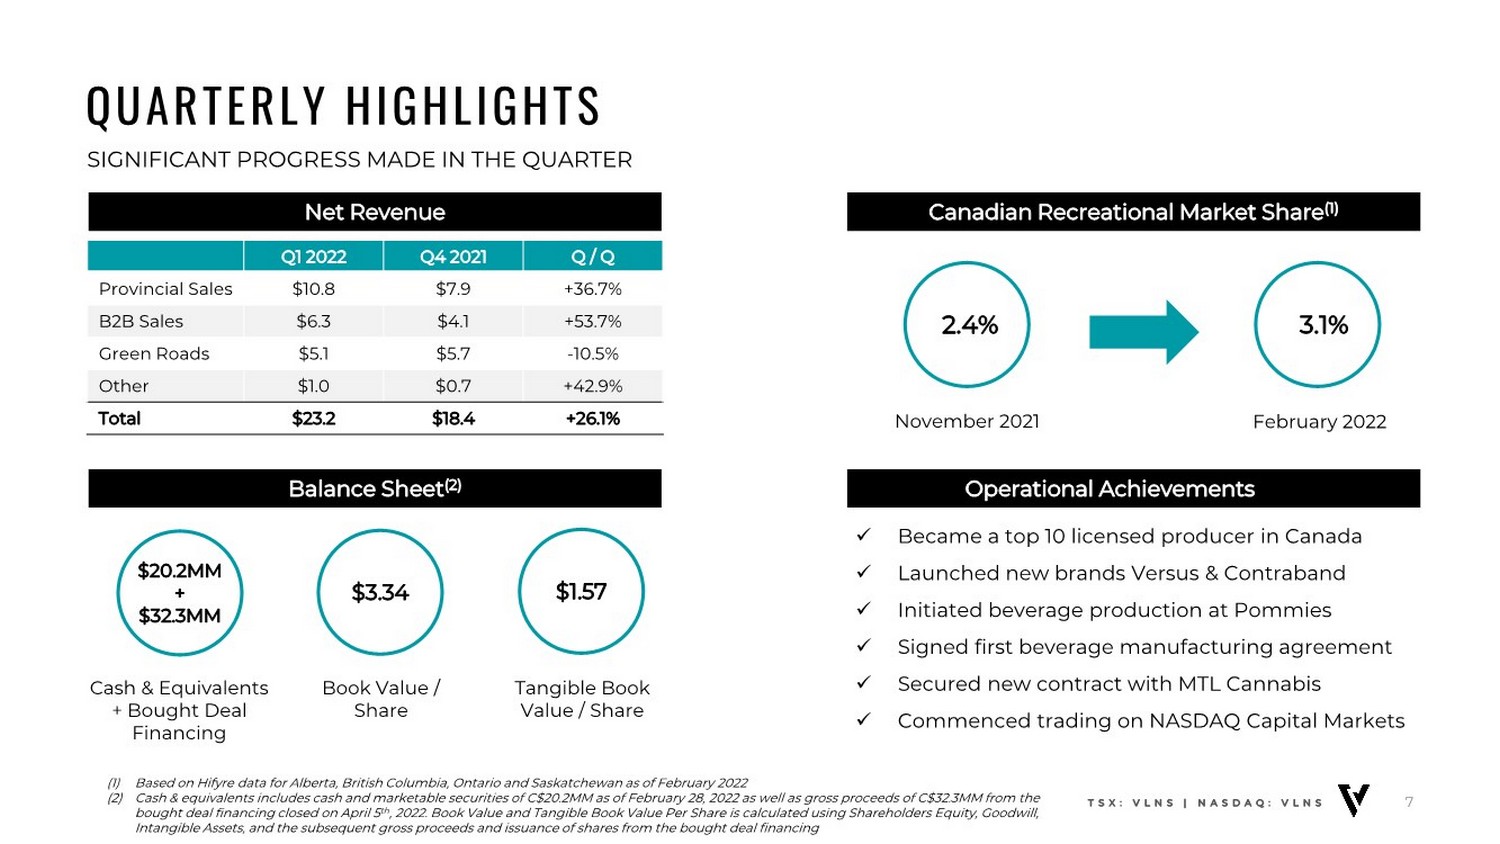
| QUARTERLY HIGHLIGHTS SIGNIFICANT PROGRESS MADE IN THE QUARTER 7 (1) Based on Hifyre data for Alberta, British Columbia, Ontario and Saskatchewan as of February 2022 (2) Cash & equivalents includes cash and marketable securities of C$20.2MM as of February 28, 2022 as well as gross proceeds of C$32.3MM from the bought deal financing closed on April 5th, 2022. Book Value and Tangible Book Value Per Share is calculated using Shareholders Equity, Goodwill, Intangible Assets, and the subsequent gross proceeds and issuance of shares from the bought deal financing TSX: VLNS | NASDAQ: VLNS Net Revenue Canadian Recreational Market Share(1) Balance Sheet(2) Operational Achievements ✓ Became a top 10 licensed producer in Canada ✓ Launched new brands Versus & Contraband ✓ Initiated beverage production at Pommies ✓ Signed first beverage manufacturing agreement ✓ Secured new contract with MTL Cannabis ✓ Commenced trading on NASDAQ Capital Markets $20.2MM + $32.3MM Cash & Equivalents + Bought Deal Financing $3.34 Book Value / Share $1.57 Tangible Book Value / Share 3.1% 2.4% February 2022 November 2021 Q1 2022 Q4 2021 Q / Q Provincial Sales $10.8 $7.9 +36.7% B2B Sales $6.3 $4.1 +53.7% Green Roads $5.1 $5.7 -10.5% Other $1.0 $0.7 +42.9% Total $23.2 $18.4 +26.1% |
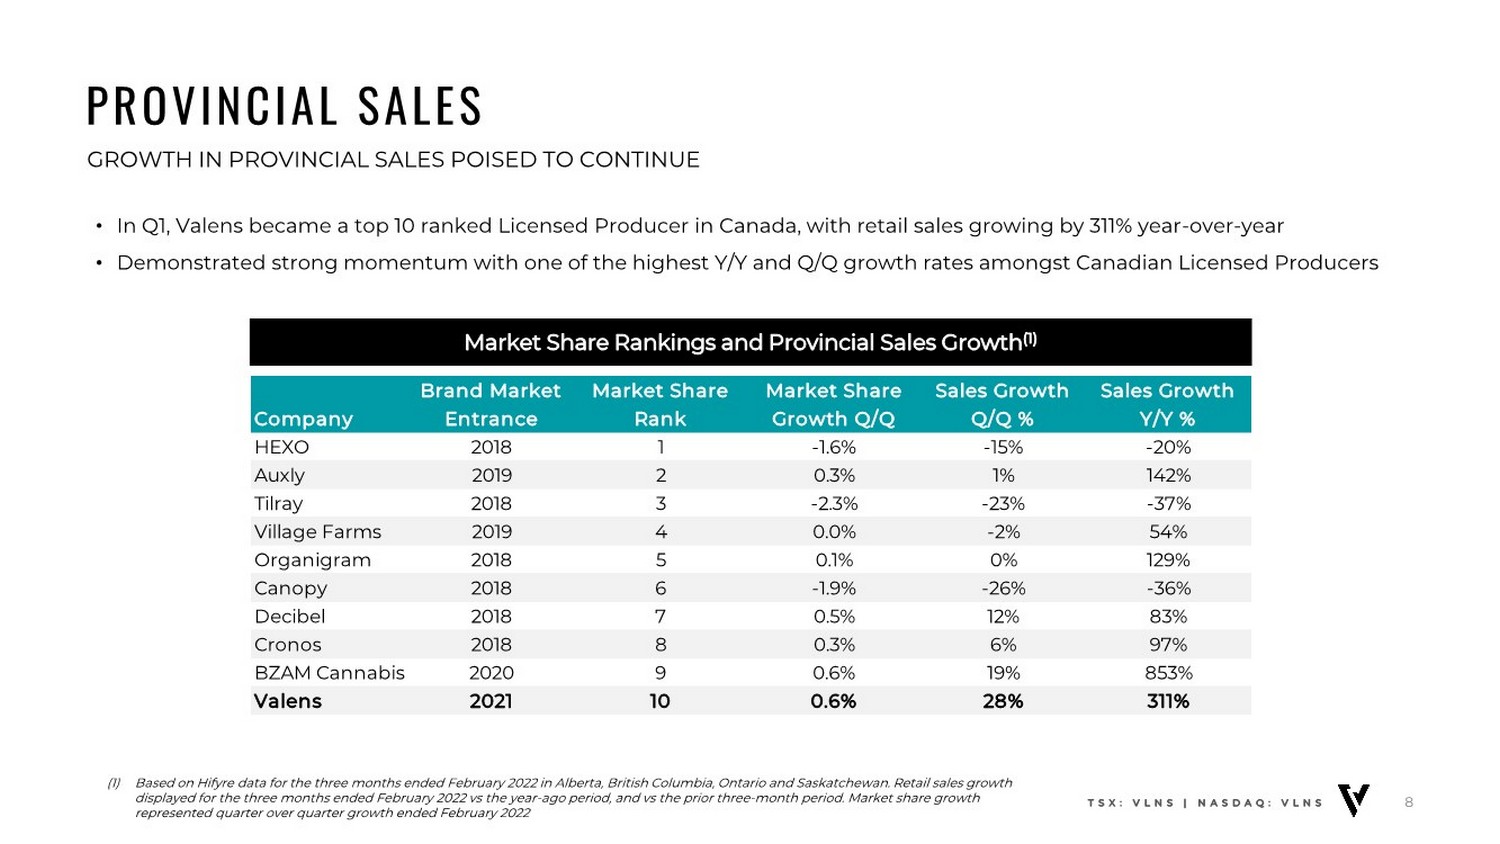
| PROVINCIAL SALES GROWTH IN PROVINCIAL SALES POISED TO CONTINUE 8 Market Share Rankings and Provincial Sales Growth(1) • In Q1, Valens became a top 10 ranked Licensed Producer in Canada, with retail sales growing by 311% year-over-year • Demonstrated strong momentum with one of the highest Y/Y and Q/Q growth rates amongst Canadian Licensed Producers TSX: VLNS | NASDAQ: VLNS Company Brand Market Entrance Market Share Rank Market Share Growth Q/Q Sales Growth Q/Q % Sales Growth Y/Y % HEXO 2018 1 -1.6% -15% -20% Auxly 2019 2 0.3% 1% 142% Tilray 2018 3 -2.3% -23% -37% Village Farms 2019 4 0.0% -2% 54% Organigram 2018 5 0.1% 0% 129% Canopy 2018 6 -1.9% -26% -36% Decibel 2018 7 0.5% 12% 83% Cronos 2018 8 0.3% 6% 97% BZAM Cannabis 2020 9 0.6% 19% 853% Valens 2021 10 0.6% 28% 311% (1) Based on Hifyre data for the three months ended February 2022 in Alberta, British Columbia, Ontario and Saskatchewan. Retail sales growth displayed for the three months ended February 2022 vs the year-ago period, and vs the prior three-month period. Market share growth represented quarter over quarter growth ended February 2022 |
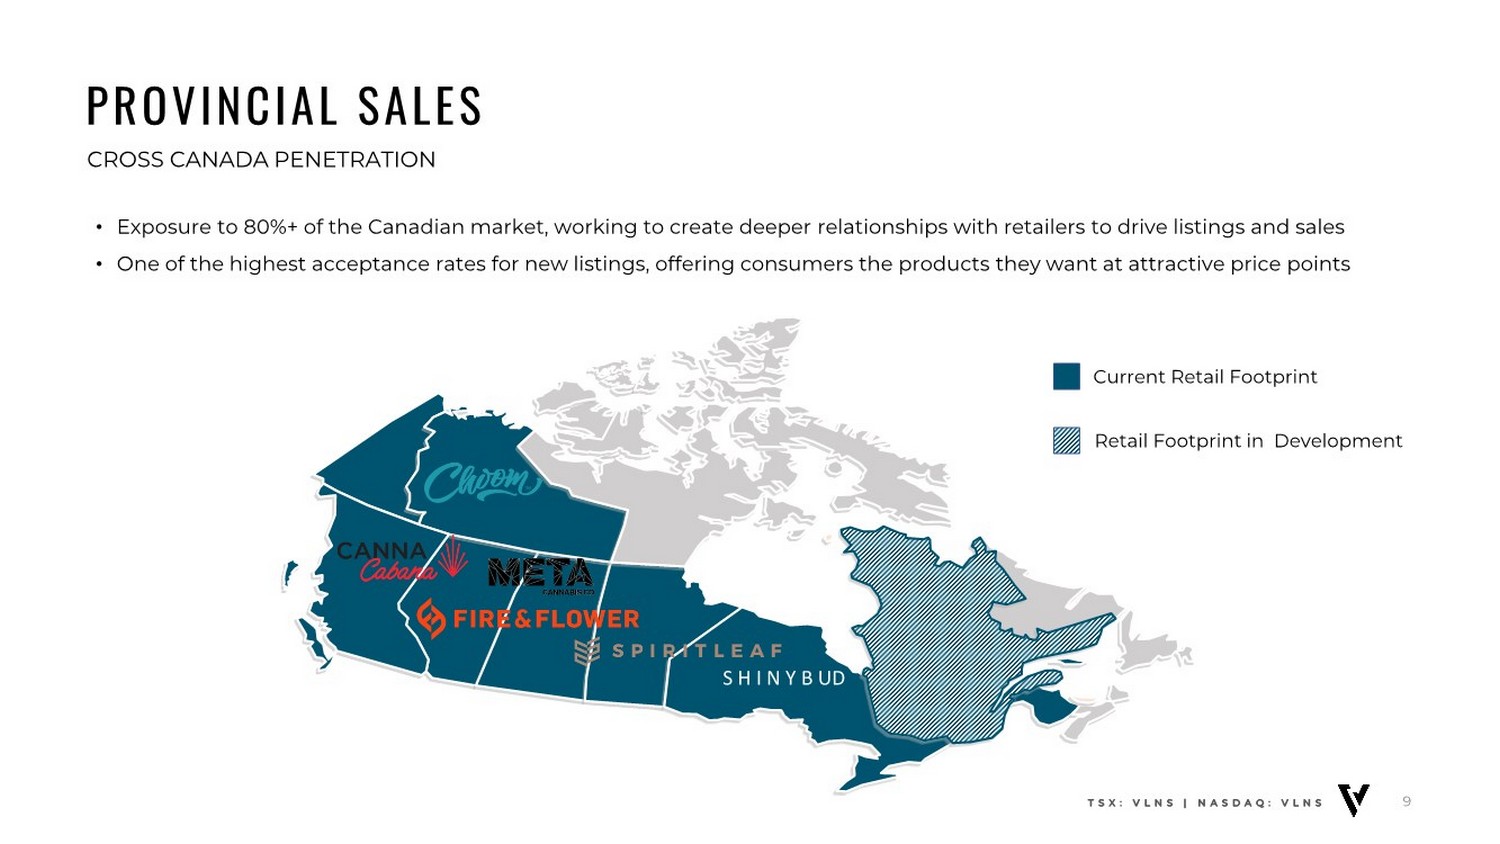
| 9 PROVINCIAL SALES CROSS CANADA PENETRATION S H I N Y B UD • Exposure to 80%+ of the Canadian market, working to create deeper relationships with retailers to drive listings and sales • One of the highest acceptance rates for new listings, offering consumers the products they want at attractive price points Current Retail Footprint Retail Footprint in Development TSX: VLNS | NASDAQ: VLNS |
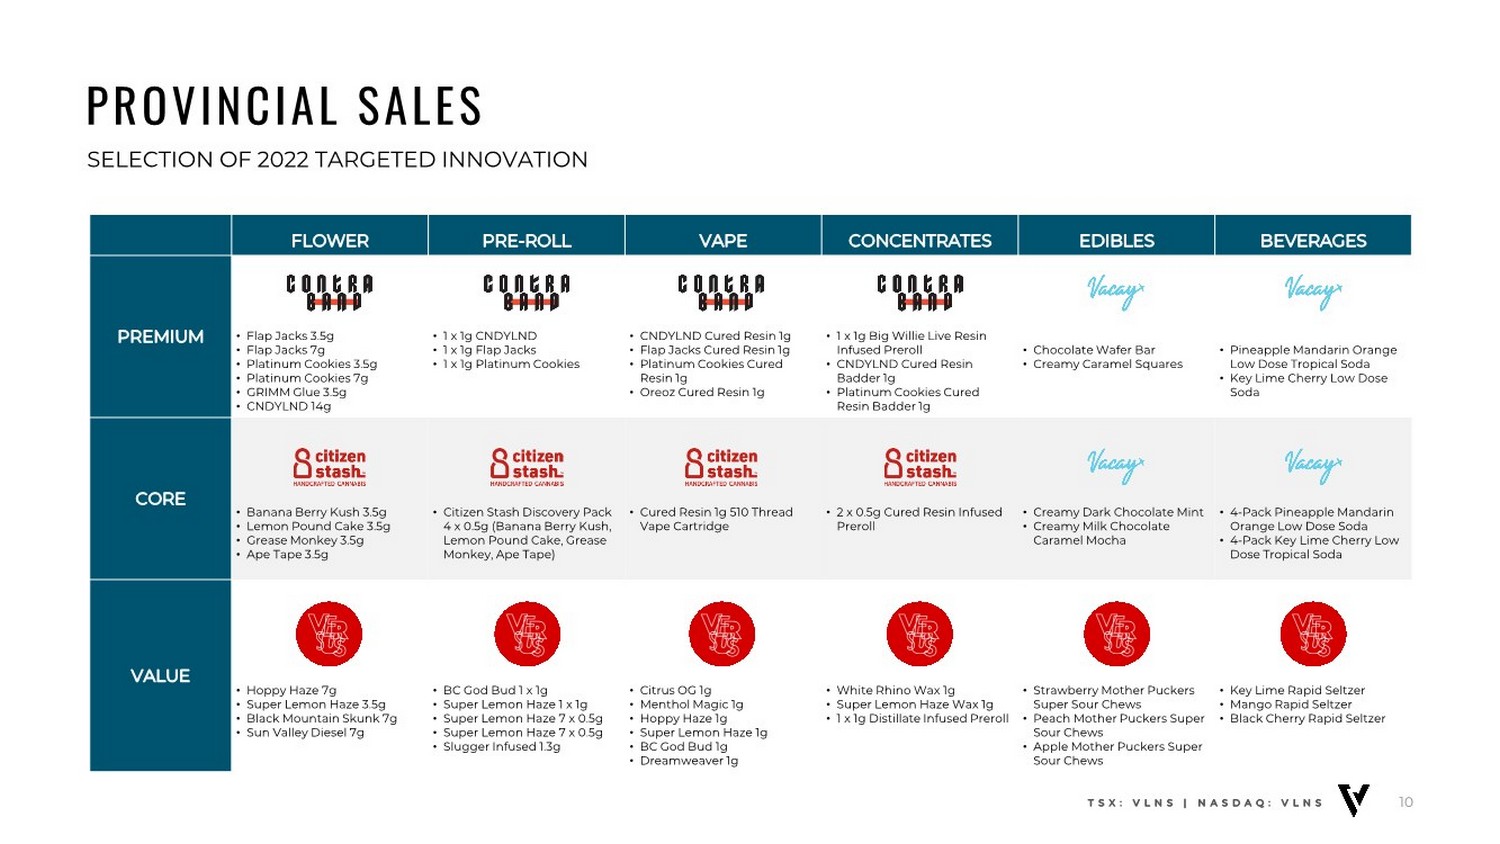
| PROVINCIAL SALES SELECTION OF 2022 TARGETED INNOVATION 10 TSX: VLNS | NASDAQ: VLNS FLOWER PRE-ROLL VAPE CONCENTRATES EDIBLES BEVERAGES PREMIUM • Flap Jacks 3.5g • Flap Jacks 7g • Platinum Cookies 3.5g • Platinum Cookies 7g • GRIMM Glue 3.5g • CNDYLND 14g • 1 x 1g CNDYLND • 1 x 1g Flap Jacks • 1 x 1g Platinum Cookies • CNDYLND Cured Resin 1g • Flap Jacks Cured Resin 1g • Platinum Cookies Cured Resin 1g • Oreoz Cured Resin 1g • 1 x 1g Big Willie Live Resin Infused Preroll • CNDYLND Cured Resin Badder 1g • Platinum Cookies Cured Resin Badder 1g • Chocolate Wafer Bar • Creamy Caramel Squares • Pineapple Mandarin Orange Low Dose Tropical Soda • Key Lime Cherry Low Dose Soda CORE • Banana Berry Kush 3.5g • Lemon Pound Cake 3.5g • Grease Monkey 3.5g • Ape Tape 3.5g • Citizen Stash Discovery Pack 4 x 0.5g (Banana Berry Kush, Lemon Pound Cake, Grease Monkey, Ape Tape) • Cured Resin 1g 510 Thread Vape Cartridge • 2 x 0.5g Cured Resin Infused Preroll • Creamy Dark Chocolate Mint • Creamy Milk Chocolate Caramel Mocha • 4-Pack Pineapple Mandarin Orange Low Dose Soda • 4-Pack Key Lime Cherry Low Dose Tropical Soda VALUE • Hoppy Haze 7g • Super Lemon Haze 3.5g • Black Mountain Skunk 7g • Sun Valley Diesel 7g • BC God Bud 1 x 1g • Super Lemon Haze 1 x 1g • Super Lemon Haze 7 x 0.5g • Super Lemon Haze 7 x 0.5g • Slugger Infused 1.3g • Citrus OG 1g • Menthol Magic 1g • Hoppy Haze 1g • Super Lemon Haze 1g • BC God Bud 1g • Dreamweaver 1g • White Rhino Wax 1g • Super Lemon Haze Wax 1g • 1 x 1g Distillate Infused Preroll • Strawberry Mother Puckers Super Sour Chews • Peach Mother Puckers Super Sour Chews • Apple Mother Puckers Super Sour Chews • Key Lime Rapid Seltzer • Mango Rapid Seltzer • Black Cherry Rapid Seltzer |
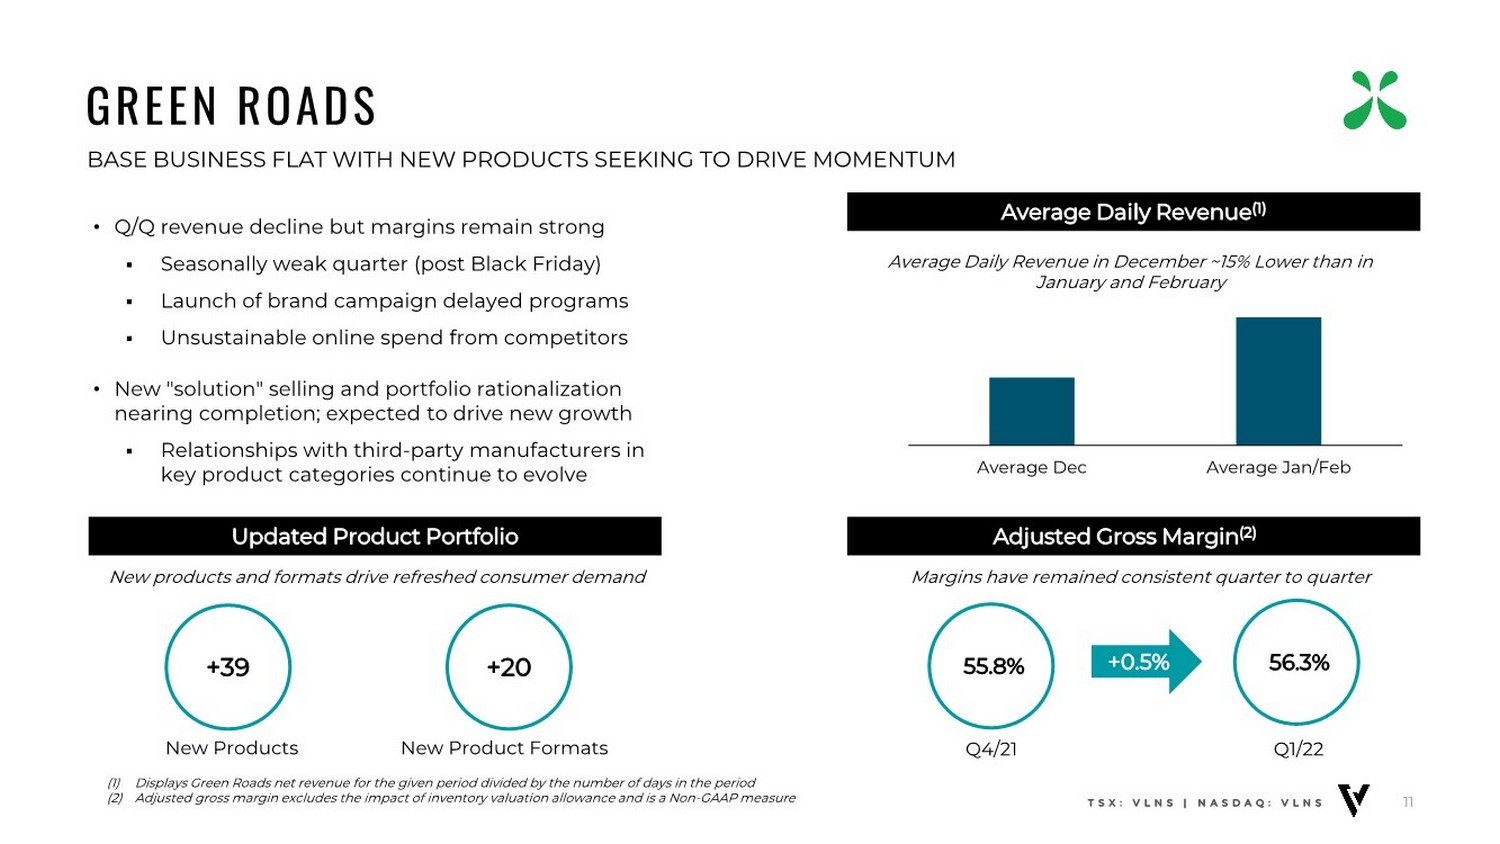
| 56.3% GREEN ROADS BASE BUSINESS FLAT WITH NEW PRODUCTS SEEKING TO DRIVE MOMENTUM 11 TSX: VLNS | NASDAQ: VLNS • Q/Q revenue decline but margins remain strong ▪ Seasonally weak quarter (post Black Friday) ▪ Launch of brand campaign delayed programs ▪ Unsustainable online spend from competitors • New "solution" selling and portfolio rationalization nearing completion; expected to drive new growth ▪ Relationships with third-party manufacturers in key product categories continue to evolve (1) Displays Green Roads net revenue for the given period divided by the number of days in the period (2) Adjusted gross margin excludes the impact of inventory valuation allowance and is a Non-GAAP measure 55.8% Q1/22 Q4/21 Average Daily Revenue(1) Adjusted Gross Margin(2) +0.5% Updated Product Portfolio +39 New Products +20 New Product Formats $40,000 $45,000 $50,000 $55,000 $60,000 $65,000 Average Dec Average Jan/Feb Average Daily Revenue in December ~15% Lower than in January and February Margins have remained consistent quarter to quarter New products and formats drive refreshed consumer demand |
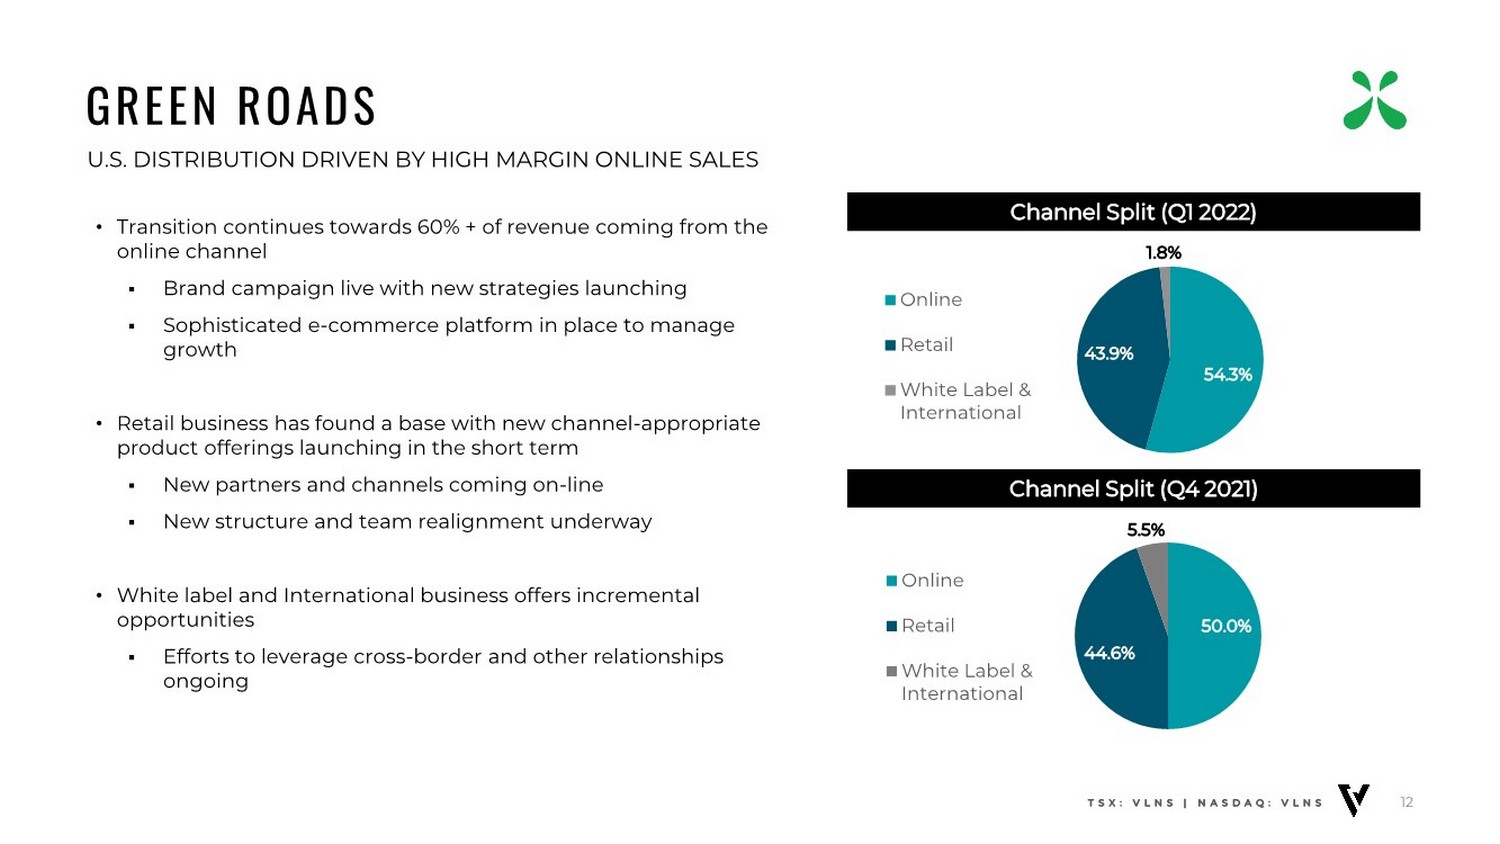
| GREEN ROADS U.S. DISTRIBUTION DRIVEN BY HIGH MARGIN ONLINE SALES 12 TSX: VLNS | NASDAQ: VLNS • Transition continues towards 60% + of revenue coming from the online channel ▪ Brand campaign live with new strategies launching ▪ Sophisticated e-commerce platform in place to manage growth • Retail business has found a base with new channel-appropriate product offerings launching in the short term ▪ New partners and channels coming on-line ▪ New structure and team realignment underway • White label and International business offers incremental opportunities ▪ Efforts to leverage cross-border and other relationships ongoing Channel Split (Q1 2022) Channel Split (Q4 2021) 50.0% 44.6% 5.5% Online Retail White Label & International 54.3% 43.9% 1.8% Online Retail White Label & International |
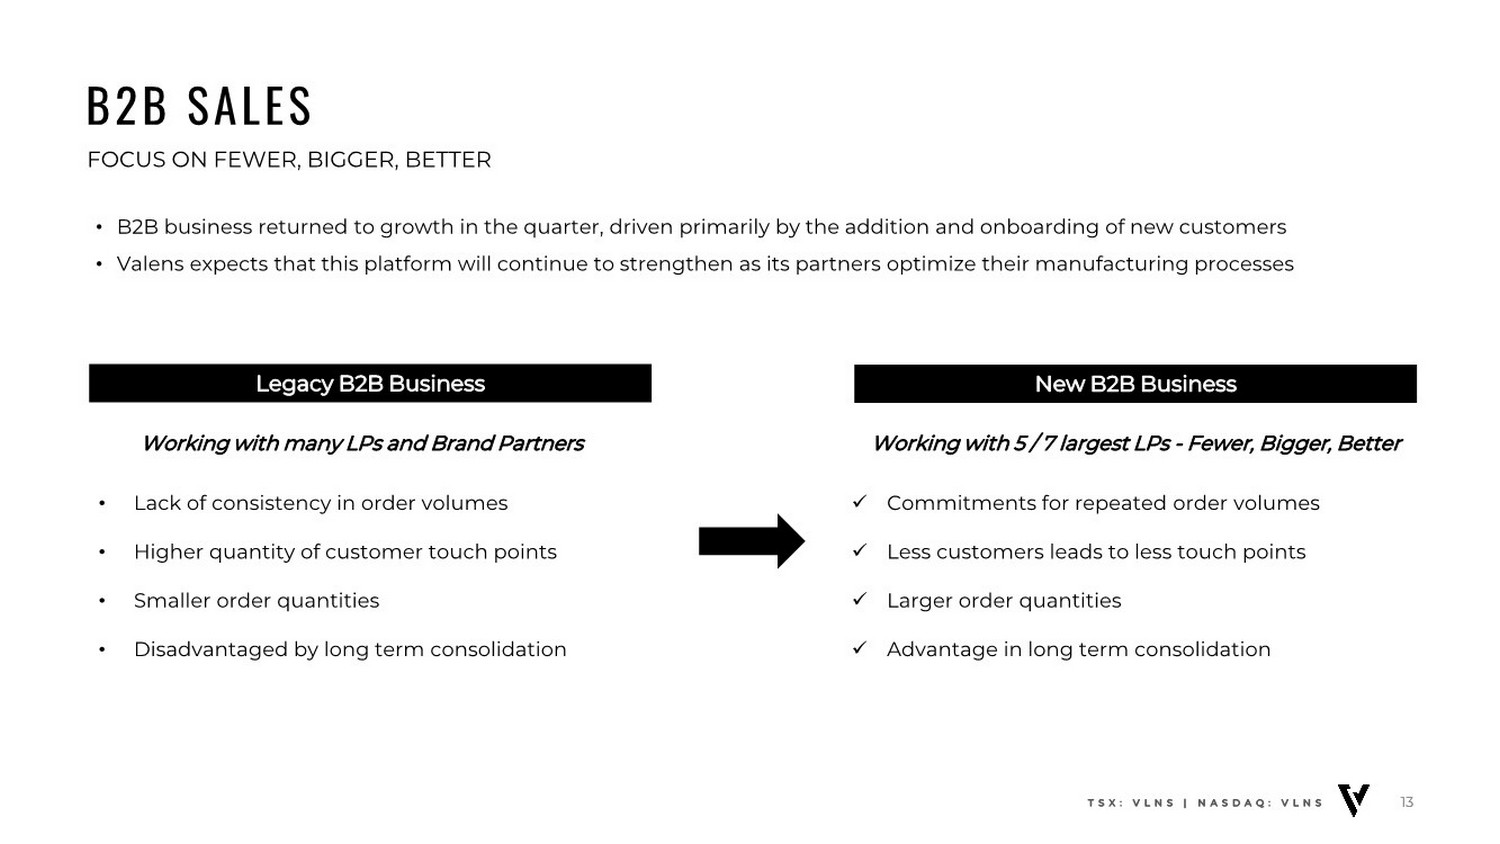
| B2B SALES FOCUS ON FEWER, BIGGER, BETTER 13 TSX: VLNS | NASDAQ: VLNS Legacy B2B Business Working with many LPs and Brand Partners • Lack of consistency in order volumes • Higher quantity of customer touch points • Smaller order quantities • Disadvantaged by long term consolidation 13 New B2B Business Working with 5 / 7 largest LPs - Fewer, Bigger, Better ✓ Commitments for repeated order volumes ✓ Less customers leads to less touch points ✓ Larger order quantities ✓ Advantage in long term consolidation • B2B business returned to growth in the quarter, driven primarily by the addition and onboarding of new customers • Valens expects that this platform will continue to strengthen as its partners optimize their manufacturing processes |
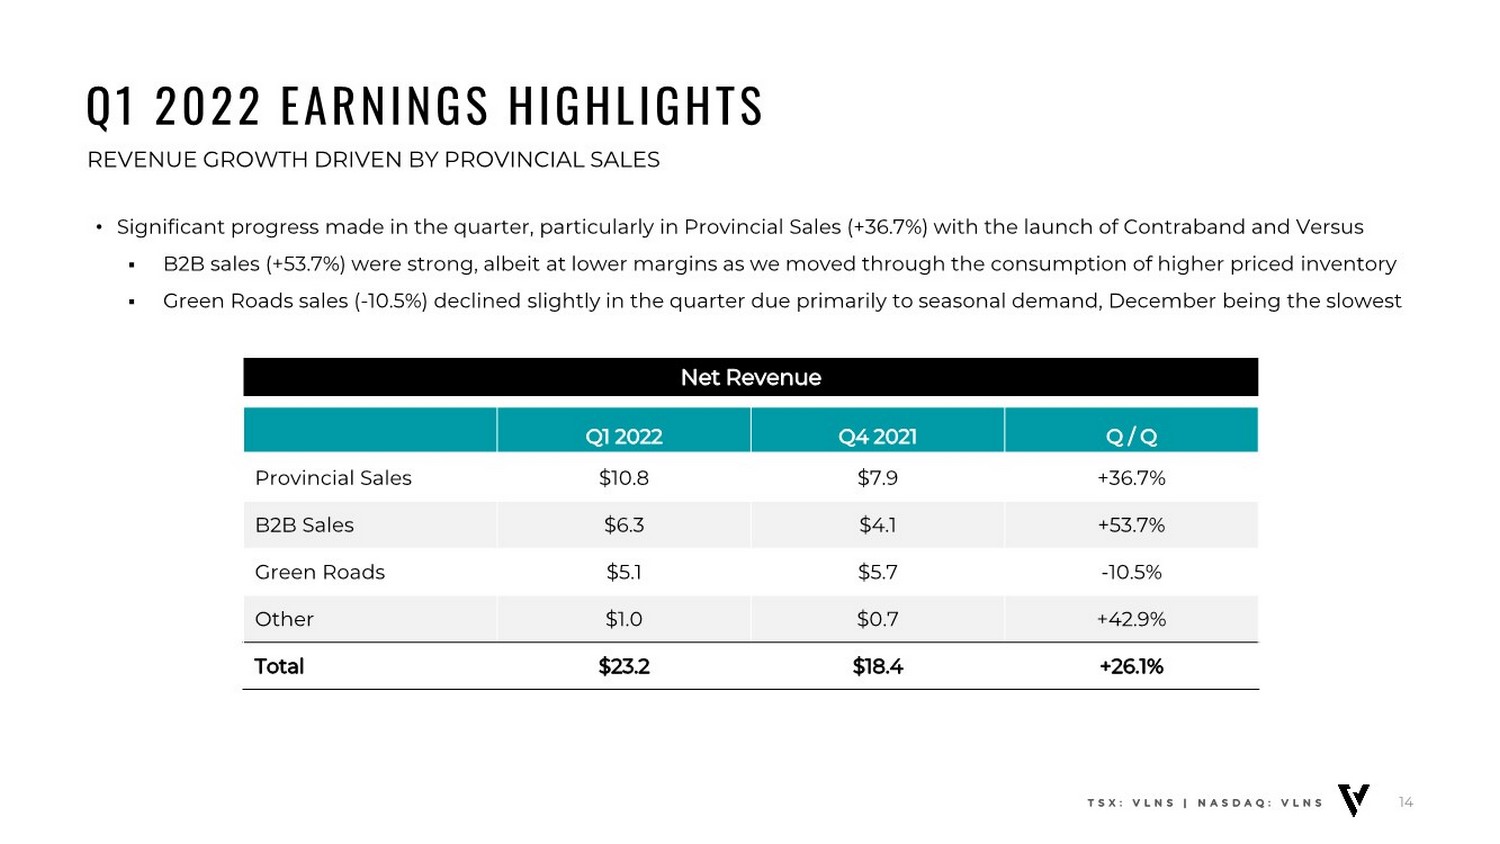
| Q1 2022 EARNINGS HIGHLIGHTS REVENUE GROWTH DRIVEN BY PROVINCIAL SALES 14 • Significant progress made in the quarter, particularly in Provincial Sales (+36.7%) with the launch of Contraband and Versus ▪ B2B sales (+53.7%) were strong, albeit at lower margins as we moved through the consumption of higher priced inventory ▪ Green Roads sales (-10.5%) declined slightly in the quarter due primarily to seasonal demand, December being the slowest TSX: VLNS | NASDAQ: VLNS Net Revenue Q1 2022 Q4 2021 Q / Q Provincial Sales $10.8 $7.9 +36.7% B2B Sales $6.3 $4.1 +53.7% Green Roads $5.1 $5.7 -10.5% Other $1.0 $0.7 +42.9% Total $23.2 $18.4 +26.1% |
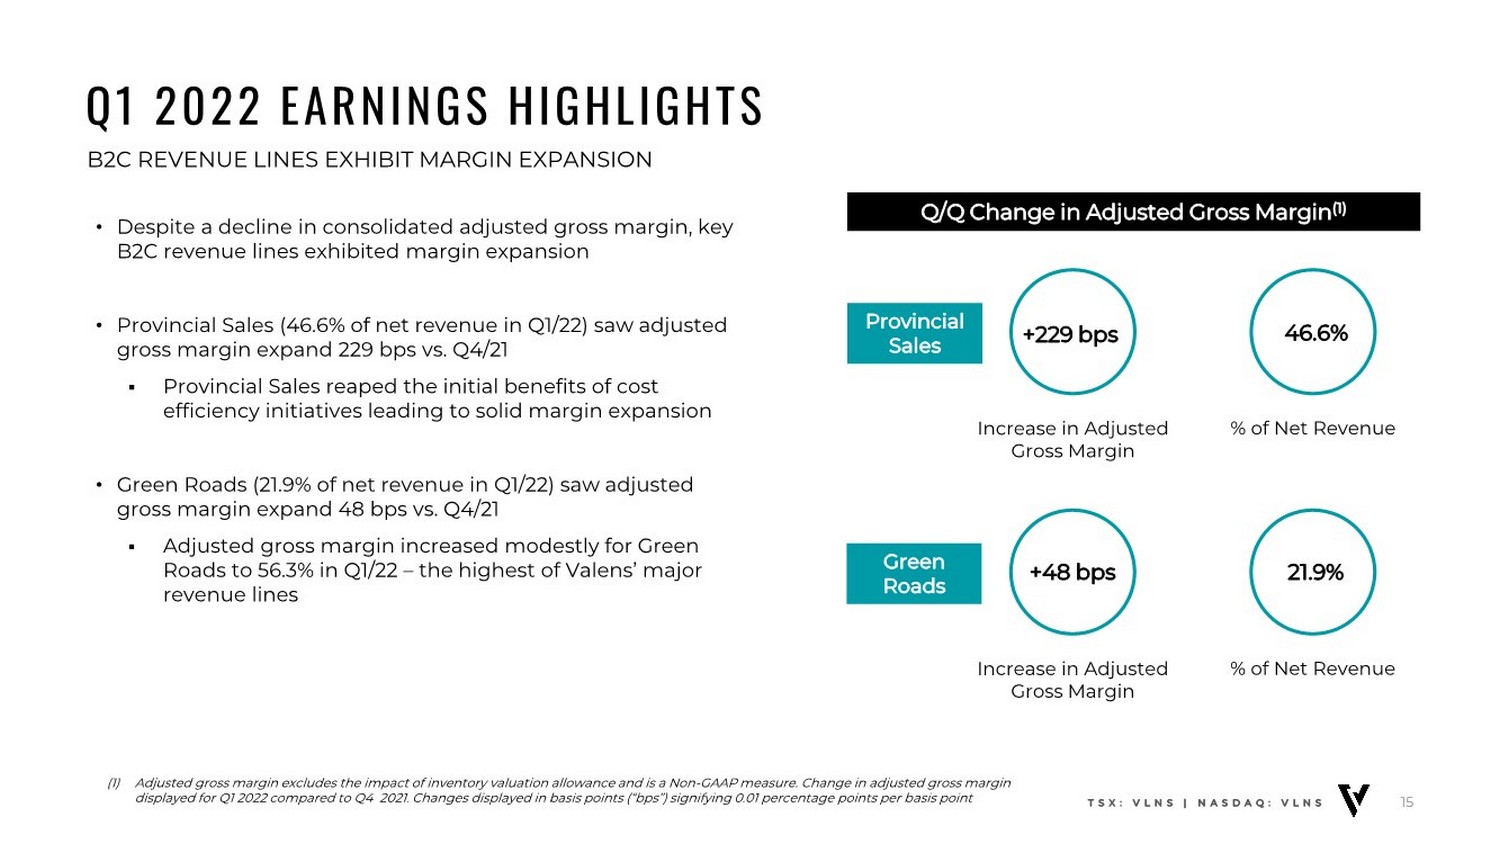
| Q1 2022 EARNINGS HIGHLIGHTS B2C REVENUE LINES EXHIBIT MARGIN EXPANSION 15 (1) Adjusted gross margin excludes the impact of inventory valuation allowance and is a Non-GAAP measure. Change in adjusted gross margin displayed for Q1 2022 compared to Q4 2021. Changes displayed in basis points (“bps”) signifying 0.01 percentage points per basis point • Despite a decline in consolidated adjusted gross margin, key B2C revenue lines exhibited margin expansion • Provincial Sales (46.6% of net revenue in Q1/22) saw adjusted gross margin expand 229 bps vs. Q4/21 ▪ Provincial Sales reaped the initial benefits of cost efficiency initiatives leading to solid margin expansion • Green Roads (21.9% of net revenue in Q1/22) saw adjusted gross margin expand 48 bps vs. Q4/21 ▪ Adjusted gross margin increased modestly for Green Roads to 56.3% in Q1/22 – the highest of Valens’ major revenue lines TSX: VLNS | NASDAQ: VLNS Q/Q Change in Adjusted Gross Margin(1) Increase in Adjusted Gross Margin Provincial Sales 46.6% % of Net Revenue +48 bps Increase in Adjusted Gross Margin Green Roads 21.9% % of Net Revenue +229 bps |
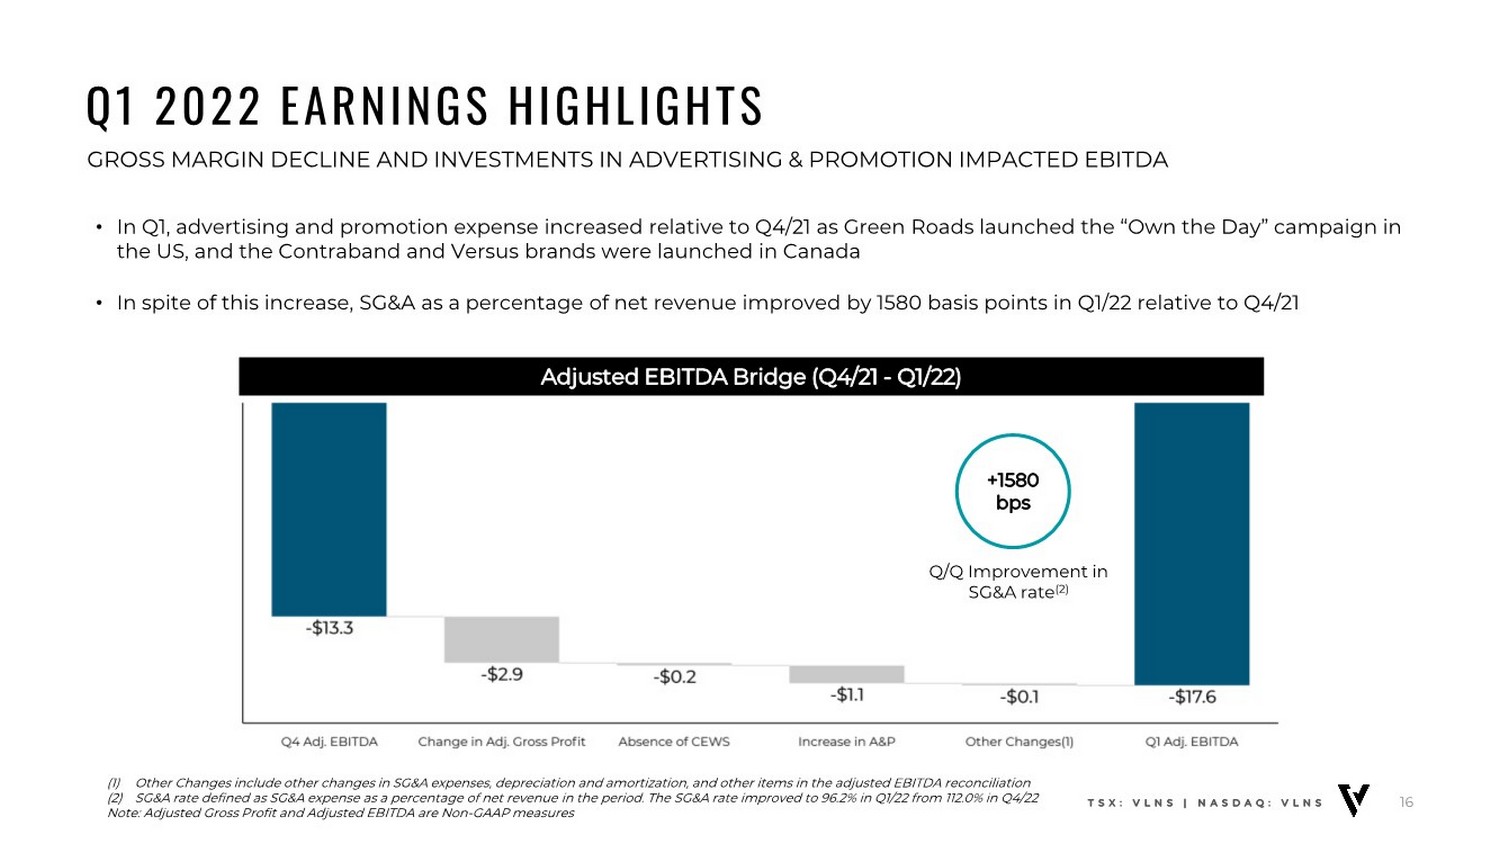
| Q1 2022 EARNINGS HIGHLIGHTS GROSS MARGIN DECLINE AND INVESTMENTS IN ADVERTISING & PROMOTION IMPACTED EBITDA 16 (1) Other Changes include other changes in SG&A expenses, depreciation and amortization, and other items in the adjusted EBITDA reconciliation (2) SG&A rate defined as SG&A expense as a percentage of net revenue in the period. The SG&A rate improved to 96.2% in Q1/22 from 112.0% in Q4/22 Note: Adjusted Gross Profit and Adjusted EBITDA are Non-GAAP measures • In Q1, advertising and promotion expense increased relative to Q4/21 as Green Roads launched the “Own the Day” campaign in the US, and the Contraband and Versus brands were launched in Canada • In spite of this increase, SG&A as a percentage of net revenue improved by 1580 basis points in Q1/22 relative to Q4/21 TSX: VLNS | NASDAQ: VLNS Adjusted EBITDA Bridge (Q4/21 - Q1/22) +1580 bps Q/Q Improvement in SG&A rate(2) |
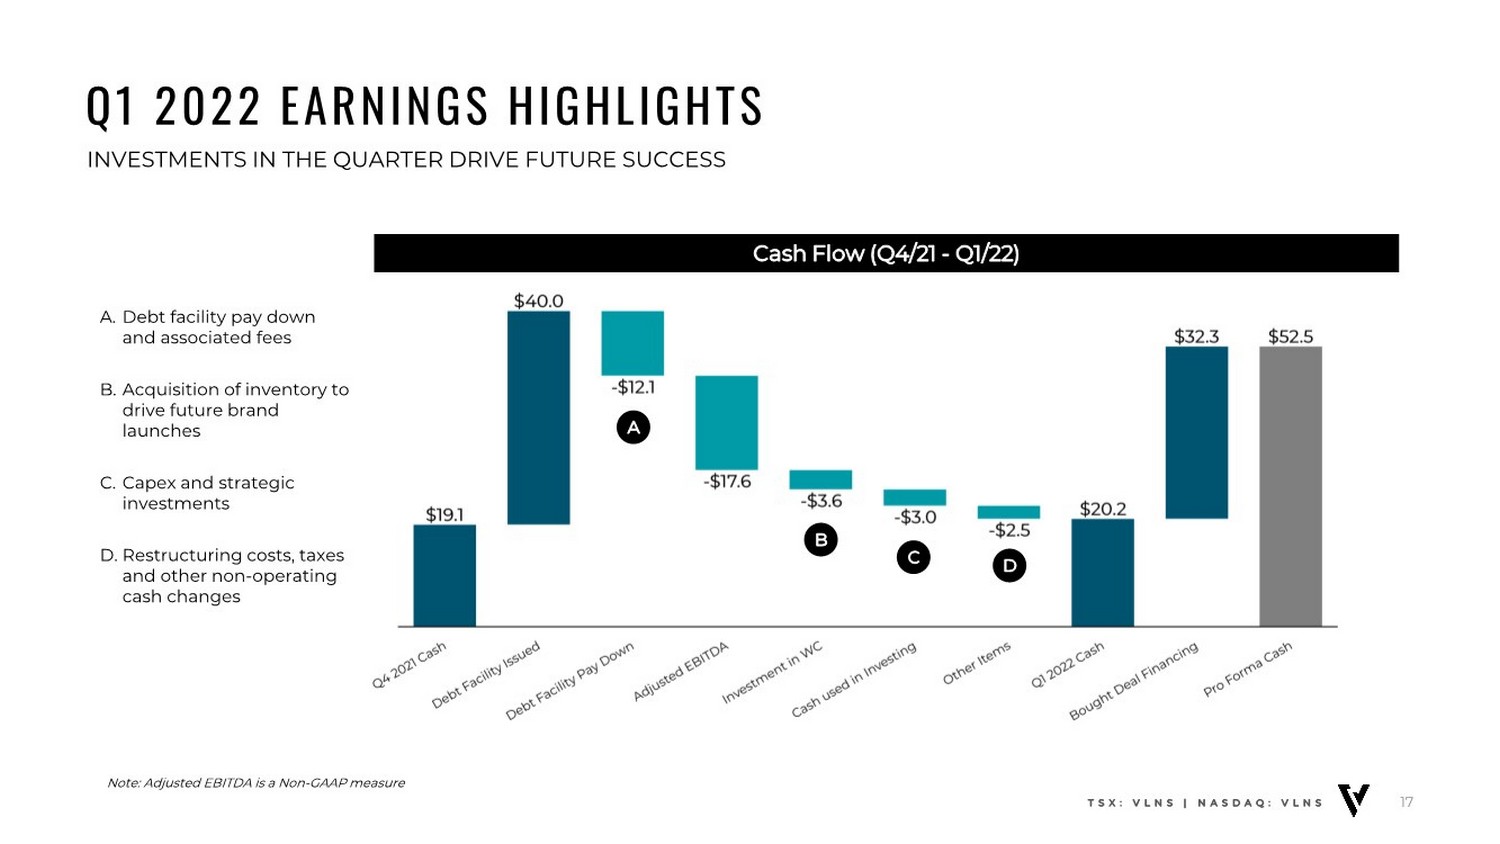
| Q1 2022 EARNINGS HIGHLIGHTS INVESTMENTS IN THE QUARTER DRIVE FUTURE SUCCESS 17 A. Debt facility pay down and associated fees B. Acquisition of inventory to drive future brand launches C. Capex and strategic investments D. Restructuring costs, taxes and other non-operating cash changes TSX: VLNS | NASDAQ: VLNS Cash Flow (Q4/21 - Q1/22) A B CD Note: Adjusted EBITDA is a Non-GAAP measure |
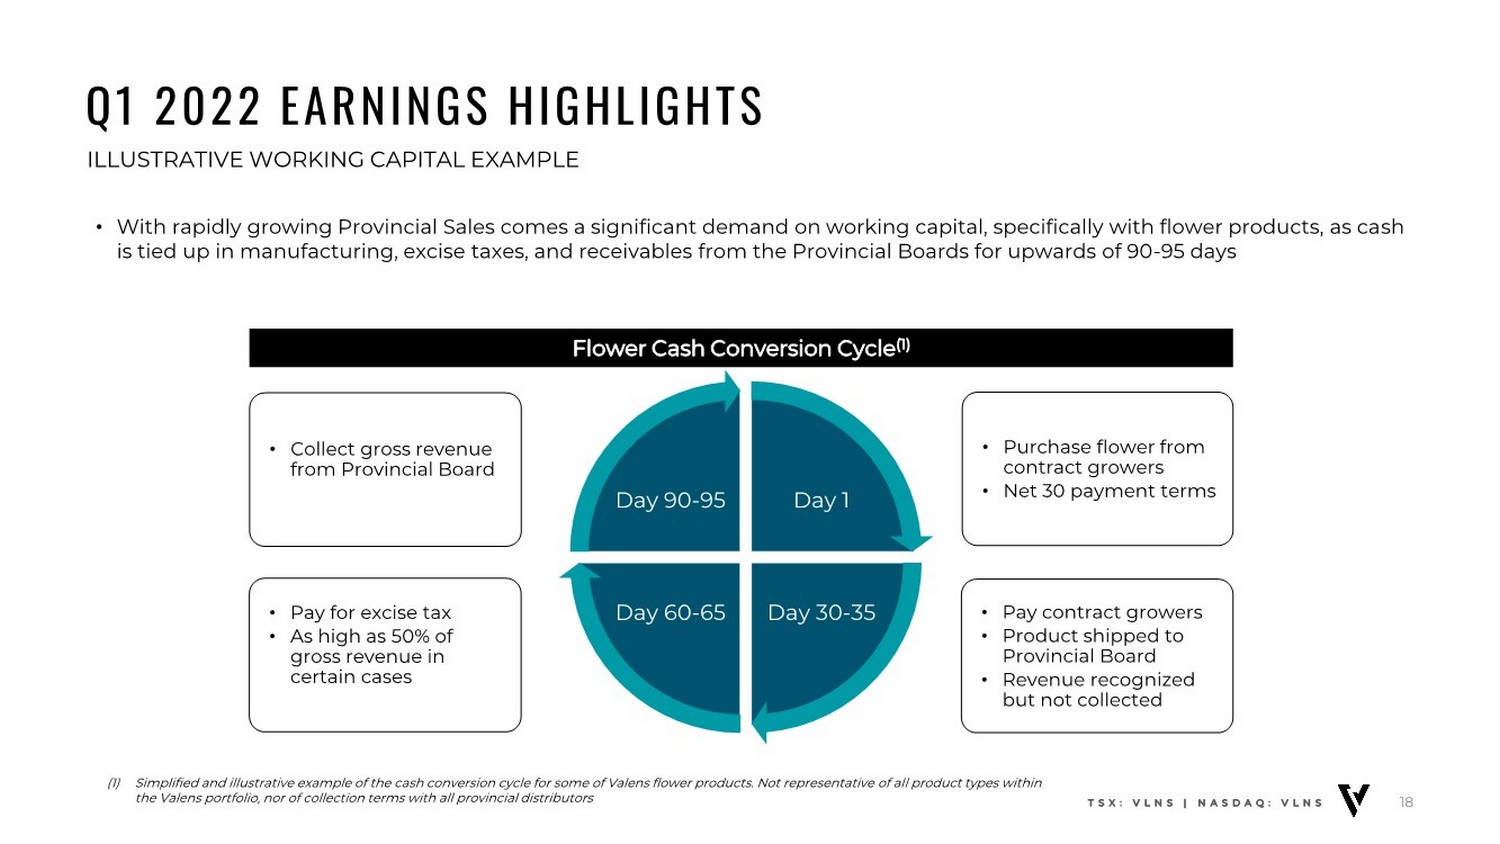
| Q1 2022 EARNINGS HIGHLIGHTS ILLUSTRATIVE WORKING CAPITAL EXAMPLE 18 (1) Simplified and illustrative example of the cash conversion cycle for some of Valens flower products. Not representative of all product types within the Valens portfolio, nor of collection terms with all provincial distributors • With rapidly growing Provincial Sales comes a significant demand on working capital, specifically with flower products, as cash is tied up in manufacturing, excise taxes, and receivables from the Provincial Boards for upwards of 90-95 days TSX: VLNS | NASDAQ: VLNS Day 1 Day 30-35 Day 60-65 Day 90-95 • Purchase flower from contract growers • Net 30 payment terms • Pay contract growers • Product shipped to Provincial Board • Revenue recognized but not collected • Pay for excise tax • As high as 50% of gross revenue in certain cases • Collect gross revenue from Provincial Board Flower Cash Conversion Cycle(1) |
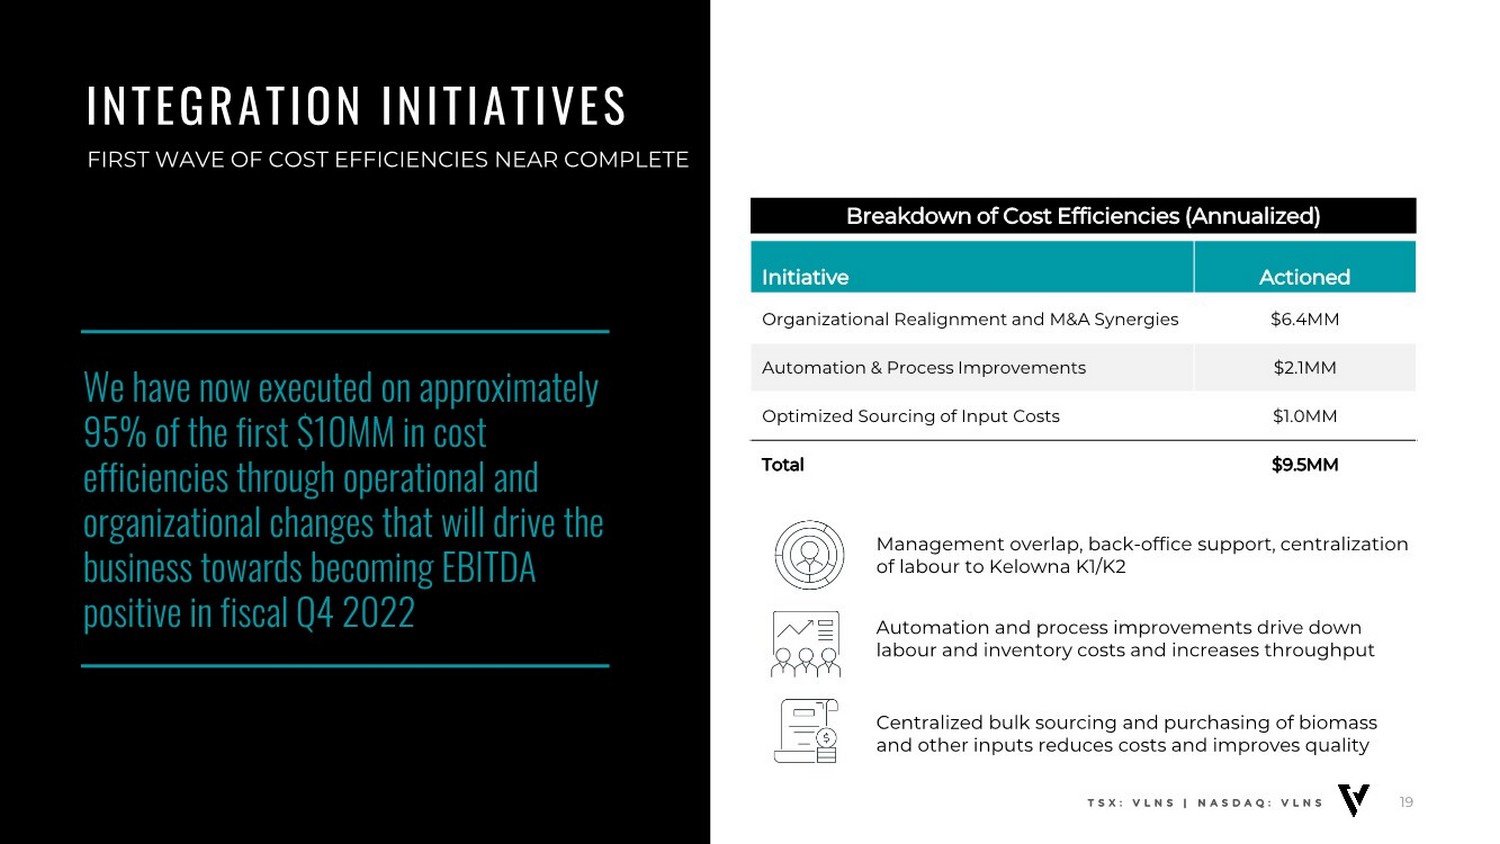
| INTEGRATION INITIATIVES FIRST WAVE OF COST EFFICIENCIES NEAR COMPLETE 19 We have now executed on approximately 95% of the first $10MM in cost efficiencies through operational and organizational changes that will drive the business towards becoming EBITDA positive in fiscal Q4 2022 TSX: VLNS | NASDAQ: VLNS Initiative Actioned Organizational Realignment and M&A Synergies $6.4MM Automation & Process Improvements $2.1MM Optimized Sourcing of Input Costs $1.0MM Total $9.5MM Breakdown of Cost Efficiencies (Annualized) Management overlap, back-office support, centralization of labour to Kelowna K1/K2 Automation and process improvements drive down labour and inventory costs and increases throughput Centralized bulk sourcing and purchasing of biomass and other inputs reduces costs and improves quality |
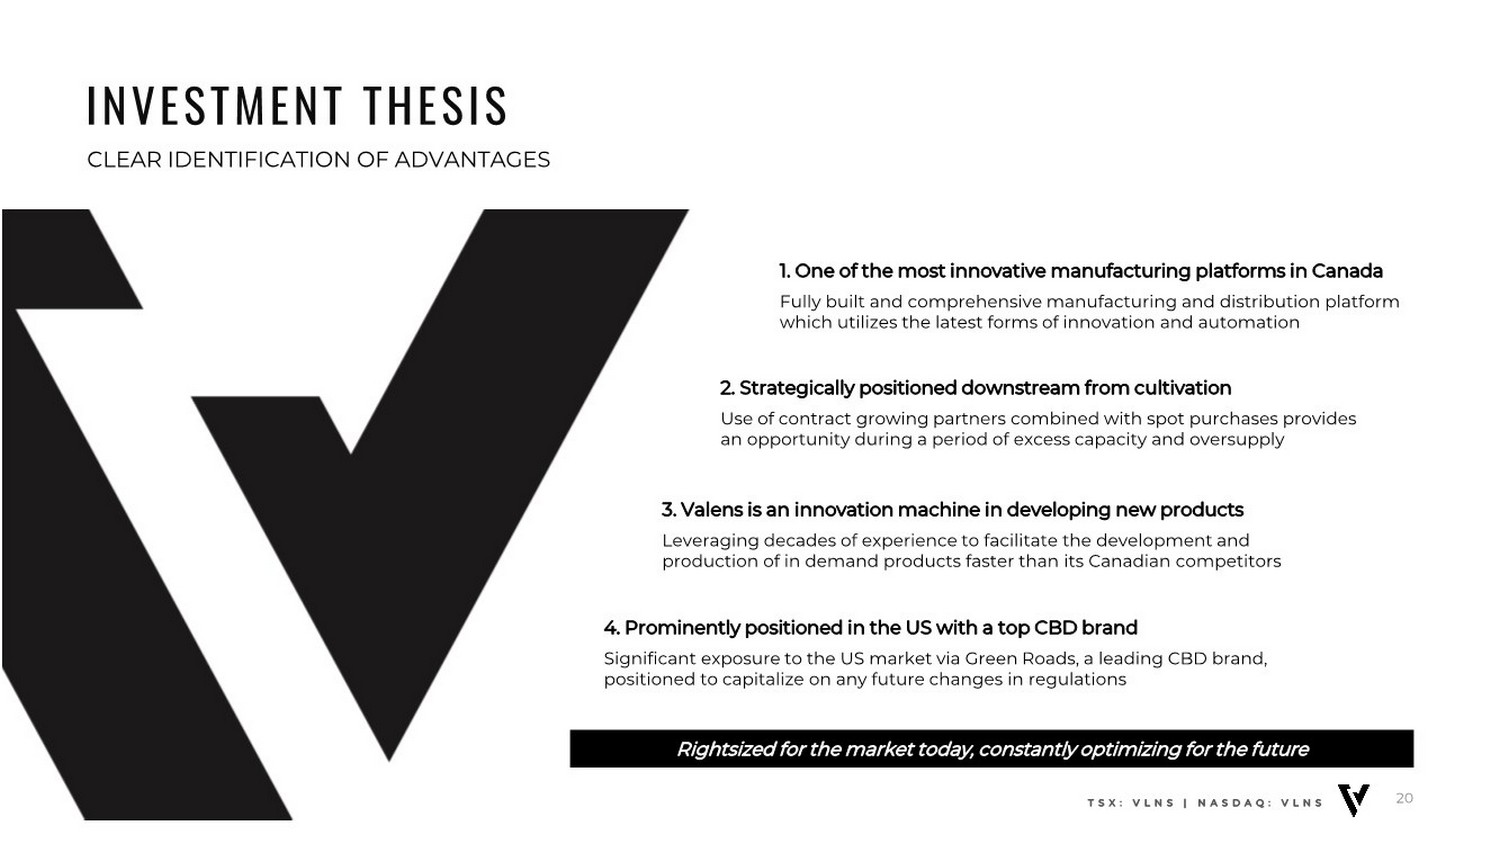
| 1. One of the most innovative manufacturing platforms in Canada Fully built and comprehensive manufacturing and distribution platform which utilizes the latest forms of innovation and automation 2. Strategically positioned downstream from cultivation Use of contract growing partners combined with spot purchases provides an opportunity during a period of excess capacity and oversupply 4. Prominently positioned in the US with a top CBD brand Significant exposure to the US market via Green Roads, a leading CBD brand, positioned to capitalize on any future changes in regulations 3. Valens is an innovation machine in developing new products Leveraging decades of experience to facilitate the development and production of in demand products faster than its Canadian competitors Rightsized for the market today, constantly optimizing for the future INVESTMENT THESIS CLEAR IDENTIFICATION OF ADVANTAGES 20 TSX: VLNS | NASDAQ: VLNS |
| QUESTIONS & ANSWERS 21 TSX: VLNS | NASDAQ: VLNS |
| CONTACT US TORONTO KELOWNA 96 Spadina Ave, Suite 400 Toronto, ON 230 Carion Rd Kelowna, BC EMAIL PHONE [email protected] 1 647-956-8254 TSX: VLNS | NASDAQ: VLNS 22 |

Serious News for Serious Traders! Try StreetInsider.com Premium Free!
You May Also Be Interested In
- Sveitarfélagið Árborg – Ársreikningur 2023
- Silver Range Resources Ltd. to Present at Metals & Mining Virtual Investor Conference May 2nd
- CBH Homes Announces Grand Opening of Thunderbolt Landing: A New Community in Mountain Home, Idaho
Create E-mail Alert Related Categories
SEC FilingsSign up for StreetInsider Free!
Receive full access to all new and archived articles, unlimited portfolio tracking, e-mail alerts, custom newswires and RSS feeds - and more!
