

Form 6-K TOTAL SE For: May 03
 Tweet
Tweet Share
Share
UNITED STATES
SECURITIES AND EXCHANGE COMMISSION
Washington, D.C. 20549
FORM 6-K
REPORT OF FOREIGN PRIVATE ISSUER
PURSUANT TO RULE 13a-16 OR 15d-16 OF
THE SECURITIES EXCHANGE ACT OF 1934
May 3, 2021
Commission File Number 001-10888
TOTAL SE
(Translation of registrant’s name into English)
2, place Jean Millier
La Défense 6
92400 Courbevoie
France
(Address of principal executive offices)
Indicate by check mark whether the registrant files or will file annual reports under cover of Form 20-F or Form 40-F.
Form 20-F x Form 40-F ¨
Indicate by check mark if the registrant is submitting the Form 6-K in paper as permitted by Regulation S-T Rule 101(b)(1): ¨
Note: Regulation S-T Rule 101(b)(1) only permits the submission in paper of a Form 6-K if submitted solely to provide an attached annual report to security holders.
Indicate by check mark if the registrant is submitting the Form 6-K in paper as permitted by Regulation S-T Rule 101(b)(7): ¨
Note: Regulation S-T Rule 101(b)(7) only permits the submission in paper of a Form 6-K if submitted to furnish a report or other document that the registrant foreign private issuer must furnish and make public under the laws of the jurisdiction in which the registrant is incorporated, domiciled or legally organized (the registrant’s “home country”), or under the rules of the home country exchange on which the registrant’s securities are traded, as long as the report or other document is not a press release, is not required to be and has not been distributed to the registrant’s security holders, and, if discussing a material event, has already been the subject of a Form 6-K submission or other Commission filing on EDGAR.
TOTAL SE is providing on this Form 6-K a description of certain recent developments relating to its business.
TABLE OF CONTENTS
SIGNATURES
EXHIBIT INDEX
SIGNATURES
Pursuant to the requirements of the Securities Exchange Act of 1934, the registrant has duly caused this report to be signed on its behalf by the undersigned, thereunto duly authorized.
| TOTAL SE | |||
| Date: May 3, 2021 | By: | /s/ ANTOINE LARENAUDIE | |
| Name: | Antoine LARENAUDIE | ||
| Title: | Group Treasurer | ||
EXHIBIT INDEX
Exhibit 99.1

Press release
Hélène Moreau-Leroy appointed
Chairman and Chief Executive Officer of Hutchinson
Paris, April 6, 2021 – Hélène Moreau-Leroy, 56, appointed Chairman and Chief Executive Officer of Hutchinson, succeeding to Jacques Maigné.
After graduating from the INSA grande école in Lyon and obtaining an MBA in international business from the University of New England in Australia, Hélène Moreau-Leroy began her career as Design Office Manager and then International Production and Purchasing Manager at the major industrial groups Thomson and Alstom.
She joined Safran's Purchasing Department in 2003, before moving to its subsidiary Safran Landing Systems, the world leader in aircraft landing and braking systems, first as Head of Supply Chain Development in emerging countries, then Director of the Airbus and European Programs Business Unit and finally Program Director.
In 2013, she joined Safran's Executive Committee as Chief Executive Officer of Safran Transmission Systems, a division specialized in the design and manufacture of power transmissions for the aerospace and space industries, and in 2018 she oversaw the integration of Zodiac Aerospace on its acquisition by the Group.
Hélène Moreau-Leroy is also Lead Director of the Board of Directors of Arkema and a Knight of the French National Order of the Legion of Honor.
***
About Hutchinson
Hutchinson is a chemicals subsidiary of Total specialized in sealing systems, fluid transfer systems, vibration, acoustic and thermal insulation, and transmission and mobility systems. Hutchinson designs and produces customized materials and connected solutions to respond to the needs of its global customers, on land, in the air and at sea. A global leader in vibration control, fluid management and sealing system technologies, Hutchinson stands out with a multiple market offering spanning multiple areas of expertise and delivering synergies and value-added. Hutchinson reported revenues of €3.8 billion in 2020 and has 40,000 employees in 25 countries. Our ambition is to contribute to safer, more efficient and more responsible mobility.
About Total
Total is a broad energy company that produces and markets fuels, natural gas and electricity. Our 100,000 employees are committed to better energy that is more affordable, more reliable, cleaner and accessible to as many people as possible. Active in more than 130 countries, our ambition is to become the responsible energy major.
Total Contacts
Media Relations: +33 (0)1 47 44 46 99 l [email protected] | @TotalPress
Investor Relations: +44 (0)207 719 7962 l [email protected]
Cautionary note
This press release, from which no legal consequences may be drawn, is for information purposes only. The entities in which TOTAL SE directly or indirectly owns investments are separate legal entities. TOTAL SE has no liability for their acts or omissions. In this document, the terms “Total”, “Total Group” and Group are sometimes used for convenience. Likewise, the words “we”, “us” and “our” may also be used to refer to subsidiaries in general or to those who work for them. This document may contain forward-looking information and statements that are based on a number of economic data and assumptions made in a given economic, competitive and regulatory environment. They may prove to be inaccurate in the future and are subject to a number of risk factors. Neither TOTAL SE nor any of its subsidiaries assumes any obligation to update publicly any forward-looking information or statement, objectives or trends contained in this document whether as a result of new information, future events or otherwise.
Exhibit 99.2

Press Release
Total Begins Producing Sustainable Aviation Fuel in France
Paris, April 8, 2021 – Total has begun producing sustainable aviation fuel (SAF) at its La Mède biorefinery in southern France and its Oudalle facility near Le Havre. The biojet fuel, made from used cooking oil, will be delivered to French airports starting in April 2021.
Total will also be able to produce SAF as from 2024 at its zero-crude Grandpuits platform, southeast of Paris.
All of these sustainable aviation fuels will be made from animal fat, used cooking oil and other waste and residue sourced from the circular economy. Total will not use vegetable oils as feedstock.
In this way, Total will be in a position to respond from its production sites in France to new French legislation that calls for aircraft to use at least 1% biojet fuel by 2022, 2% by 2025 and 5% by 2030.
The development of SAF is one of the strategic paths being pursued by Total to meet the challenge of carbon neutrality, as biojet fuels help reduce CO2 emissions from air transportation.
“By producing sustainable aviation fuel at our French sites today, we are able to respond to strong demand from an aviation industry looking to reduce its carbon footprint, while adapting our industrial resources. As a broad energy company, we support our customers by providing innovative solutions to reduce their emissions. This commitment is fully aligned with Total’s climate ambition to get to net zero emissions by 2050,” said Bernard Pinatel, President of Refining & Chemicals at Total.
Total and Sustainable Aviation Fuel
Total is involved in numerous initiatives to produce and market sustainable aviation fuel in partnership with aviation industry partners. The Group will reach a new milestone in May 2021 with the creation of a dedicated Renewable Fuels Business Unit.
Sustainable Aviation Fuel is a practical alternative to fossil-based jet fuel. It significantly reduces the CO2 emissions from air transportation and can be used as a drop-in fuel as of today, without any need to modify existing supply chain infrastructure, aircraft or engines.
***
About Total
Total is a broad energy company that produces and markets fuels, natural gas and electricity. Our 100,000 employees are committed to better energy that is more affordable, more reliable, cleaner and accessible to as many people as possible. Active in more than 130 countries, our ambition is to become the responsible energy major.
Total Contacts
Media Relations: +33 (0)1 47 44 46 99 l [email protected] | @TotalPress
Investor Relations: +44 (0)207 719 7962 l [email protected]
Cautionary note
This press release, from which no legal consequences may be drawn, is for information purposes only. The entities in which TOTAL SE directly or indirectly owns investments are separate legal entities. TOTAL SE has no liability for their acts or omissions. In this document, the terms “Total”, “Total Group” and Group are sometimes used for convenience. Likewise, the words “we”, “us” and “our” may also be used to refer to subsidiaries in general or to those who work for them. This document may contain forward-looking information and statements that are based on a number of economic data and assumptions made in a given economic, competitive and regulatory environment. They may prove to be inaccurate in the future and are subject to a number of risk factors. Neither TOTAL SE nor any of its subsidiaries assumes any obligation to update publicly any forward-looking information or statement, objectives or trends contained in this document whether as a result of new information, future events or otherwise.
Exhibit 99.3
Press Release
Uganda and Tanzania: Final Agreements
for the Lake Albert resources development project
Paris, 12 April 2021 — During a signing ceremony held yesterday in Entebbe, in the presence of Yoweri Museveni, President of the Republic of Uganda, Samia Suluhu Hassan, President of the United Republic of Tanzania, Patrick Pouyanné, Chairman and CEO of Total, as well as representatives of China National Offshore Oil Corporation (CNOOC), Uganda National Oil Company (UNOC) and Tanzania Petroleum Development Corporation (TPDC), the partners of the Lake Albert development project concluded the final agreements required to launch this major project.
The Lake Albert development encompasses Tilenga and Kingfisher upstream oil projects in Uganda and the construction of the East African Crude Oil Pipeline (EACOP) in Uganda and Tanzania. The Tilenga project, operated by Total, and the Kingfisher project, operated by CNOOC, are expected to deliver a combined production of 230,000 barrels per day at plateau. The upstream partners are Total (56.67%), CNOOC (28.33%) and UNOC (15%). The production will be transported from the oilfields in Uganda to the port of Tanga in Tanzania via EACOP cross-border pipeline, with Total, UNOC, TPDC and CNOOC as shareholders.
The agreements concluded yesterday include the Shareholders Agreement of EACOP and the Tariff and Transportation Agreement between EACOP and the Lake Albert oil shippers.
These agreements open the way for the commencement of the Lake Albert development project. The main engineering, procurement and construction contracts will be awarded shortly, and construction will start. First oil export is planned in early 2025.
All the partners are committed to implement these projects in an exemplary manner and taking into highest consideration the biodiversity and environmental stakes as well as the local communities’ rights and within the stringent environmental and social performance standards of the International Finance Corporation (IFC).
“The Tilenga development and EACOP pipeline project are major projects for Total and are consistent with our strategy to focus on low breakeven oil projects while lowering the average carbon intensity of the Group’s upstream portfolio. These projects will create significant in-country value for both Uganda and Tanzania” said Patrick Pouyanné, Chairman and Chief Executive Officer of Total. “Total is also taking into the highest consideration the sensitive environmental context and social stakes of these onshore projects. Our commitment is to implement these projects in an exemplary and fully transparent manner”.
***
About Total
Total is a broad energy company that produces and markets fuels, natural gas and electricity. Our 100,000 employees are committed to better energy that is more affordable, more reliable, cleaner and accessible to as many people as possible. Active in more than 130 countries, our ambition is to become the responsible energy major.
Total Contacts
Media Relations: +33 1 47 44 46 99 l [email protected] l @TotalPress
Investor Relations: +44 (0)207 719 7962 l [email protected]
Cautionary Note
This press release, from which no legal consequences may be drawn, is for information purposes only. The entities in which TOTAL SE directly or indirectly owns investments are separate legal entities. TOTAL SE has no liability for their acts or omissions. In this document, the terms “Total”, “Total Group” and Group are sometimes used for convenience. Likewise, the words “we”, “us” and “our” may also be used to refer to subsidiaries in general or to those who work for them. This document may contain forward-looking information and statements that are based on a number of economic data and assumptions made in a given economic, competitive and regulatory environment. They may prove to be inaccurate in the future and are subject to a number of risk factors. Neither TOTAL SE nor any of its subsidiaries assumes any obligation to update publicly any forward-looking information or statement, objectives or trends contained in this document whether as a result of new information, future events or otherwise.
Exhibit 99.4
Press Release
Total
Partners with Siemens Energy to Reduce
LNG Related Emissions
Paris, April 13th, 2021 – Total and Siemens Energy signed a Technical Collaboration Agreement to study sustainable solutions for CO2 emissions reduction. The collaboration will focus on natural gas liquefaction facilities and associated power generation.
Each partner will bring together their best-in-class technologies and combine their know-how to deliver industrial-stage solutions such as combustion of clean hydrogen in gas turbines, competitive all-electrical liquefaction, optimized power generation, the integration of renewable energy in liquefaction plants’ power system and their efficiency enhancement.
“This collaboration with Siemens Energy, a major player in the energy technology sector, brings many opportunities to further reduce the carbon footprint of our activities, especially in our strategic LNG business,” said Arnaud Breuillac, President Exploration & Production at Total. “The development of low-carbon LNG will contribute to meet the growth in global energy demand whilst reducing the carbon intensity of the energy products consumed. Reducing its carbon footprint is essential for LNG to play its role fully in the energy transition.”
“We are pleased to partner with Total as one of the main players in the LNG value chain to explore how we can competitively reduce the carbon footprint of brownfield and greenfield LNG projects,” said Thorbjörn Fors, Executive Vice President of the Industrial Applications Division at Siemens Energy. “The agreement is a next step, following our announcement last June to collaborate together and conduct studies exploring possible liquefaction and power generation plant designs to help decarbonize the production of LNG.”
Total, Second Largest Private Global LNG Player
Total is the world's second largest privately owned LNG player, with a global portfolio of nearly 50 Mtpa by 2025 and a global market share of around 10%. The Group benefits from strong and diversified positions throughout the LNG value chain: gas production and liquefaction, LNG transportation and trading, and contribution to the development of the LNG industry for maritime transport. Through its interests in liquefaction plants in Qatar, Nigeria, Russia, Norway, Oman, Egypt, the United Arab Emirates, the United States, Australia and Angola, the Company markets LNG on all world markets.
***
About Total
Total is a broad energy company that produces and markets fuels, natural gas and electricity. Our 100,000 employees are committed to better energy that is more affordable, more reliable, cleaner and accessible to as many people as possible. Active in more than 130 countries, our ambition is to become the responsible energy major.
Siemens Energy
Siemens Energy is one of the world’s leading energy technology companies. The company works with its customers and partners on energy systems for the future, thus supporting the transition to a more sustainable world. With its portfolio of products, solutions and services, Siemens Energy covers almost the entire energy value chain – from power generation and transmission to storage. The portfolio includes conventional and renewable energy technology, such as gas and steam turbines, hybrid power plants operated with hydrogen, and power generators and transformers.
Total Contacts
Media Relations: +33 1 47 44 46 99 l [email protected] l @TotalPress
Investor Relations: +44 (0)207 719 7962 l [email protected]
Cautionary Note
This press release, from which no legal consequences may be drawn, is for information purposes only. The entities in which TOTAL SE directly or indirectly owns investments are separate legal entities. TOTAL SE has no liability for their acts or omissions. In this document, the terms “Total”, “Total Group” and Group are sometimes used for convenience. Likewise, the words “we”, “us” and “our” may also be used to refer to subsidiaries in general or to those who work for them. This document may contain forward-looking information and statements that are based on a number of economic data and assumptions made in a given economic, competitive and regulatory environment. They may prove to be inaccurate in the future and are subject to a number of risk factors. Neither TOTAL SE nor any of its subsidiaries assumes any obligation to update publicly any forward-looking information or statement, objectives or trends contained in this document whether as a result of new information, future events or otherwise.
Exhibit 99.5
Press Release
Total declares Force Majeure on Mozambique LNG project
Paris, 26 April 2021 – Considering the evolution of the security situation in the north of the Cabo Delgado province in Mozambique, Total confirms the withdrawal of all Mozambique LNG project personnel from the Afungi site. This situation leads Total, as operator of Mozambique LNG project, to declare force majeure.
Total expresses its solidarity with the government and people of Mozambique and wishes that the actions carried out by the government of Mozambique and its regional and international partners will enable the restoration of security and stability in Cabo Delgado province in a sustained manner.
Total E&P Mozambique Area 1 Limitada, a wholly owned subsidiary of Total SE, operates Mozambique LNG with a 26.5% participating interest alongside ENH Rovuma Área Um, S.A. (15%), Mitsui E&P Mozambique Area1 Limited (20%), ONGC Videsh Rovuma Limited (10%), Beas Rovuma Energy Mozambique Limited (10%), BPRL Ventures Mozambique B.V. (10%), and PTTEP Mozambique Area 1 Limited (8.5%).
***
About Total
Total is a broad energy company that produces and markets fuels, natural gas and electricity. Our 100,000 employees are committed to better energy that is more affordable, more reliable, cleaner and accessible to as many people as possible. Active in more than 130 countries, our ambition is to become the responsible energy major.
Total Contacts
Media Relations: +33 1 47 44 46 99 l [email protected] l @TotalPress
Investor Relations: +44 (0)207 719 7962 l ir@total.com
Cautionary Note
This press release, from which no legal consequences may be drawn, is for information purposes only. The entities in which TOTAL SE directly or indirectly owns investments are separate legal entities. TOTAL SE has no liability for their acts or omissions. In this document, the terms “Total”, “Total Group” and Group are sometimes used for convenience. Likewise, the words “we”, “us” and “our” may also be used to refer to subsidiaries in general or to those who work for them. This document may contain forward-looking information and statements that are based on a number of economic data and assumptions made in a given economic, competitive and regulatory environment. They may prove to be inaccurate in the future and are subject to a number of risk factors. Neither TOTAL SE nor any of its subsidiaries assumes any obligation to update publicly any forward-looking information or statement, objectives or trends contained in this document whether as a result of new information, future events or otherwise.
Exhibit 99.6
Press Release
Total Direct Energie tops 5 million customers in France
Paris, April 28, 2021 – Total, through Total Direct Energie, now has more than five million B2C and B2B customers in France, confirming its position as the leading alternative gas and power supplier.
In March 2021, Total Direct Energie was recognized with two awards for the quality of its customer relations:
| · | For the fourth year in a row, Total Direct Energie has retained first place of its category in the Podium de la Relation Client awards (Bearing Point and Kantar). |
| · | For the third year in a row, Total Direct Energie received the Customer Excellence Award (Ipsos, Trusteam Finance, Académie du Service). |
In April 2021, thanks to its support for the French wind and solar industries, Total Direct Energie launched a new competitive green offering to meet the expectations of millions of customers looking for ways to contribute to the energy transition.
“We are very proud to have passed the 5 million customer mark in France. I would like to congratulate the Total Direct Energie teams for their work and I would like to thank all our customers for the trust they have placed in us. We will continue our efforts to grow but also to support our customers by offering them green products and services, in line with our ambition to get to net zero by 2050," said Sébastien Loux, Managing Director at Total Direct Energie.
Total Direct Energie aims for net growth of 500,000 customers this year and a market share of 15% by 2025 in France, versus close to 10% today. For Europe, the objective is nine million B2C customers by 2025.
***
About Total Direct Energie
Total Direct Energie, the 3rd largest electricity and gas operator in France, is the subsidiary of Total that enables everyone to make responsible savings. At the heart of its strategy: innovation and customer satisfaction, in order to offer reliable, affordable and clean energy to as many people as possible and to participate in a more responsible energy future.
Total Direct Energie provides its 5 million individual and business customers competitive electricity and/or natural gas offers, as well as innovative services to help them optimize their consumption.
About Total
Total is a broad energy company that produces and markets fuels, natural gas and electricity. Our 100,000 employees are committed to better energy that is more affordable, more reliable, cleaner and accessible to as many people as possible. Active in more than 130 countries, our ambition is to become the responsible energy major.
Total Contacts
Media Relations: +33 1 47 44 46 99 l [email protected] l @TotalPress
Investor Relations: +44 (0)207 719 7962 l [email protected]
Cautionary Note
This press release, from which no legal consequences may be drawn, is for information purposes only. The entities in which TOTAL SE directly or indirectly owns investments are separate legal entities. TOTAL SE has no liability for their acts or omissions. In this document, the terms “Total”, “Total Group” and Group are sometimes used for convenience. Likewise, the words “we”, “us” and “our” may also be used to refer to subsidiaries in general or to those who work for them. This document may contain forward-looking information and statements that are based on a number of economic data and assumptions made in a given economic, competitive and regulatory environment. They may prove to be inaccurate in the future and are subject to a number of risk factors. Neither TOTAL SE nor any of its subsidiaries assumes any obligation to update publicly any forward-looking information or statement, objectives or trends contained in this document whether as a result of new information, future events or otherwise.
Exhibit 99.7
Press Release
ESG & UN Sustainable Development Goals:
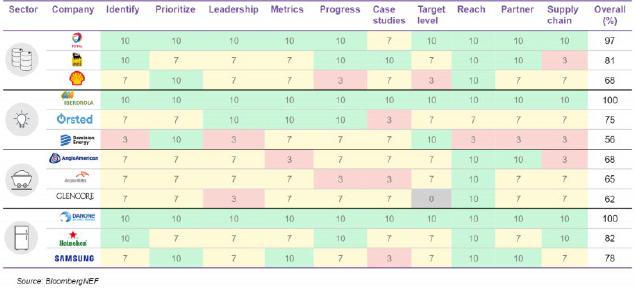
Total Recognized as a Top Leader by BloombergNEF
Paris, April 28, 2021 – On April 13, BloombergNEF published its first study on the alignment of corporate strategies with the United Nations’ Sustainable Development Goals (SDGs). With a score of 97/100, Total ranked third worldwide in the survey, among the four business sectors studied (Oil and Gas, Utilities, Metals & Mining, Consumer Goods), and first in its sector.
The study, entitled “UN Sustainable Development Goals for Companies: Primer” assesses companies on the basis of an analysis of 10 categories of criteria, in terms of integration of the SDGs into their strategy, identification of their priority impacts and improvement targets. The assessment also takes into account the transparency of the associated reporting.
Since 2016, Total made a commitment to contribute to the SDGs’ achievement and uses them as a benchmark for measuring and prioritizing its impacts. The Group also played a pioneering role in SDG-related reporting by contributing to the work of the platform created in 2017 by the UN Global Compact and the Global Reporting Initiative (GRI).
“Total is resolutely engaged in a transformation that addresses the challenges of the sustainable development agenda: fighting global warming, delivering tangible solutions and actively promoting a just transition. Total wants to be a benchmark for corporate commitment to the Sustainable Development Goals, and I am delighted that our teams’ engagement has been recognized with this first ranking,” said Patrick Pouyanné, Chairman and Chief Executive Officer of Total.
The Bloomberg study recognizes the alignment of Total’s business strategy with clearly stated climate objectives (SDG 13), its transformation into a broad energy company with tangible low-carbon energy projects (SDG 7), and the use of its economic and social clout, notably within its supply chain (SDG 8). The study also highlights Total’s work on transparent disclosure, with the publication of detailed SDG reporting.
Total believes that transparency is essential for building relationships of trust with its stakeholders and for putting the Group on a continuous improvement path. Total reports on its performance on the basis of the various commonly used ESG disclosure frameworks. In addition to the SDGs, Total refers to the standards of the Global Reporting Initiative (GRI) and Sustainability Accounting Standards Board (SASB), the Core metrics proposed by the World Economic Forum, and the recommendations of the Task Force on Climate-Related Financial Disclosures (TCFD) for its climate reporting.
All of Total’s disclosures are available on its dedicated Sustainable Performance website.
About the Sustainable Development Goals
In 2015, the United Nations and its Member States adopted the 17 Sustainable Development Goals (SDGs) as a blueprint for addressing the global challenges of poverty, environmental protection, peace and prosperity by 2030. Businesses are asked to contribute to this agenda with their financial resources and capacity for innovation, to collectively resolve the issues of sustainable development.

***
About Total
Total is a broad energy company that produces and markets fuels, natural gas and electricity. Our 100,000 employees are committed to better energy that is more affordable, more reliable, cleaner and accessible to as many people as possible. Active in more than 130 countries, our ambition is to become the responsible energy major.
Total Contacts
Media Relations: +33 1 47 44 46 99 l [email protected] l @TotalPress
Investor Relations: +44 (0)207 719 7962 l [email protected]
Cautionary Note
This press release, from which no legal consequences may be drawn, is for information purposes only. The entities in which TOTAL SE directly or indirectly owns investments are separate legal entities. TOTAL SE has no liability for their acts or omissions. In this document, the terms “Total”, “Total Group” and Group are sometimes used for convenience. Likewise, the words “we”, “us” and “our” may also be used to refer to subsidiaries in general or to those who work for them. This document may contain forward-looking information and statements that are based on a number of economic data and assumptions made in a given economic, competitive and regulatory environment. They may prove to be inaccurate in the future and are subject to a number of risk factors. Neither TOTAL SE nor any of its subsidiaries assumes any obligation to update publicly any forward-looking information or statement, objectives or trends contained in this document whether as a result of new information, future events or otherwise.
Exhibit 99.8
Press Release
First quarter 2021 results
With results of more than $3 billion,
Total fully benefits from rebound in hydrocarbon prices
LNG and renewables represent one-third of results
| 1Q21 | 1Q20 | Change | 1Q19 | Change | |
| vs 1Q20 | vs 1Q19 | ||||
| Oil price - Brent ($/b) | 61.1 | 50.1 | +22% | 63.1 | -3% |
| Average price of LNG ($/Mbtu) | 6.1 | 6.3 | -4% | 7.2 | -16% |
| Variable cost margin - Refining Europe, VCM ($/t) | 5.3 | 26.3 | -80% | 33.0 | -84% |
| Adjusted net income (Group share)1 | |||||
| - in billions of dollars (B$) | 3.0 | 1.8 | 69% | 2.8 | +9% |
| - in dollars per share | 1.10 | 0.66 | +68% | 1.02 | +8% |
| DACF1 (B$) | 5.8 | 4.3 | +34% | 6.3 | -8% |
| Cash Flow from operations (B$) | 5.6 | 1.3 | x4.3 | 3.6 | +54% |
| Net income (Group share) of 3.3 B$ in 1Q21 | |||||
| Net-debt-to-capital ratio of 19.5% at March 31, 2021 vs. 21.7% at December 31, 20202 | |||||
| Hydrocarbon production of 2,863 kboe/d in 1Q21, a decrease of 7% compared to 1Q20 | |||||
| First 2021 interim dividend set at 0.66 €/share | |||||
Paris, April 29, 2021 - The Board of Directors of Total SE, meeting on April 28, 2021, under the chairmanship of Chairman and Chief Executive Officer Patrick Pouyanné, approved the Group's first quarter 2021 accounts. On this occasion, Patrick Pouyanné said:
« In the first quarter, the Group fully benefited from rising oil and gas prices, up 38% and 24%, respectively quarter-to-quarter, and its strategy to grow LNG and Renewables and Electricity.
The Group reported adjusted net income of $3 billion, above the pre-crisis first quarter of 2019, despite a less favorable environment by taking advantage of the action plans implemented during the crisis. Cash flow (DACF) increased to $5.8 billion and gearing already decreased to less than 20% in the first quarter of 2021, validating the strategy of resilience and maintaining the dividend driven by the Board of Directors during the 2020 crisis. The Board of Directors confirms the objective of anchoring the Group's gearing sustainably below 20%. The organic cash breakeven was less than $25/b in the first quarter.
The iGRP segment reported adjusted net operating income of $1 billion, the highest in its history, and generated cash flow of more than $1 billion, thanks to growing LNG sales and the positive contribution from Renewables and Electricity, which had an EBITDA of nearly $350 million. Over the past year, gross installed renewable power generation capacity grew from 3 GW to 7.8 GW, renewable power production more than doubled, net power production increased by more than 60% and the Group now has more than 5 million customers in France. With more than $2 billion invested in renewables, including the acquisition of a 20% stake in Adani Green Energy Ltd in India, in the first quarter of 2021, the Group is accelerating its transformation into a broad energy company.
With an adjusted net operating income of $2 billion, Exploration & Production fully captured the higher oil price and provided a strong cash flow contribution of $3.8 billion. Given the OPEC+ quota implementation, the Group’s production, as announced, increased slightly to 2.86 Mboe/d (0.8%). With the launch of the Lake Albert project in Uganda and Tanzania, the Group is implementing its strategy to invest in resilient low-breakeven projects that reduce the carbon intensity of its portfolio.
The improved Upstream environment contrasts with depressed European refining margins, down 80% from a year ago, reflecting weak demand for petroleum products of 13 Mb/d in the first quarter 2021 versus 15 Mb/d a year earlier. Downstream adjusted net operating income was more than $500 million, supported by strong petrochemicals performance and resilient Marketing & Services.
Strengthened by these excellent results and confident in the fundamentals of the Group, the Board of Directors decided to distribute a first interim dividend for fiscal year 2021 stable at €0.66 / share. »
1 Definition page 3.
2 Excluding leases.
1
Highlights3
Sustainability
| · | Total's Board of Directors takes the initiative to submit a resolution on the Company's ambition for sustainable development and energy transition toward carbon neutrality | |
| · | Consistent with its climate policy, the Group withdraws from the American Petroleum Institute | |
| · | Inauguration of L’Industreet, a campus for training young people in the industry profession, Total's flagship action for social responsibility in France |
Renewables and Electricity
| · | Acquired in India 20% of Adani Green Energy Limited (AGEL), the largest solar developer in the world | |
| · | Secured with Macquarie rights to seabed lease to jointly develop 1.5 GW offshore wind project in the UK | |
| · | Acquired 4 GW portfolio of solar and energy storage projects in the US | |
| · | Partnered with Microsoft to support digital innovation and carbon neutrality goals | |
| · | Signed major green power sale agreement to Orange to develop 80 MW of solar farms in France | |
| · | Farmed down 50% of two renewables portfolios in France representing close to 340 MW |
LNG
| · | Declaration of force majeure on Mozambique LNG project considering the security situation in the northern Cabo Delgado | |
| · | Signed agreements with Shenergy Group for the supply of up to 1.4 Mt/y of LNG in China | |
| · | Obtained supplier license for marine bunker LNG in Singapore | |
| · | Signed technical collaboration agreement with Siemens Energy to reduce CO2 emissions related to LNG |
Upstream
| · | Signed definitive agreements enabling the launch of Tilenga and Kingfisher upstream oil projects and construction of East African Crude Oil Pipeline in Uganda and Tanzania | |
| · | Published societal and environmental studies relating to the Tilenga and EACOP projects in Uganda and Tanzania |
Downstream
| · | Started production of sustainable aviation fuel in France at the La Mède biorefinery and at the Oudalle facility (Seine-Maritime) |
Carbon Capture
| · | Investment to plant 40,000-hectare forest in Republic of Congo that will create a carbon sink to sequester more than 10 million tons of CO2 over 20 years | |
| · | Creation of the joint-venture development of the Northern Lights CO2 sequestration project in the northern North Sea |
3 Certain transitions referred to in the highlights are subject to approval by authorities or to conditions as per the agreements.
2
Key figures from Total’s consolidated financial statements4
| In millions of dollars, except effective tax rate, | 1Q21 | 4Q20 | 1Q20 | 1Q21 vs |
1Q19 | 1Q21
vs |
| earnings per share and number of shares | 1Q20 | 1Q19 | ||||
| Adjusted net operating income from business segments | 3,487 | 1,824 | 2,300 | +52% | 3,413 | +2% |
| Exploration & Production | 1,975 | 1,068 | 703 | x2.8 | 1,722 | +15% |
| Integrated Gas, Renewables & Power | 985 | 254 | 913 | +8% | 592 | +66% |
| Refining & Chemicals | 243 | 170 | 382 | -36% | 756 | -68% |
| Marketing & Services | 284 | 332 | 302 | -6% | 343 | -17% |
| Contribution of equity affiliates to adjusted net income | 520 | 367 | 658 | -21% | 614 | -15% |
| Group effective tax rate5 | 34.6% | 14.9% | 30.0% | 40.5% | ||
| Adjusted net income (Group share) | 3,003 | 1,304 | 1,781 | +69% | 2,759 | +9% |
| Adjusted fully-diluted earnings per share (dollars)6 | 1.10 | 0.46 | 0.66 | +68% | 1.02 | +8% |
| Adjusted fully-diluted earnings per share (euros)* | 0.91 | 0.39 | 0.60 | +52% | 0.90 | +1% |
| Fully-diluted weighted-average shares (millions) | 2,645 | 2,645 | 2,601 | +2% | 2,620 | +1% |
| Net income (Group share) | 3,344 | 891 | 34 | x98.4 | 3,111 | +7% |
| Organic investments7 | 2,379 | 3,432 | 2,523 | -6% | 2,784 | -15% |
| Net acquisitions8 | 1,590 | 1,099 | 1,102 | +44% | 306 | x5.2 |
| Net investments9 | 3,969 | 4,531 | 3,625 | +9% | 3,090 | +28% |
| Operating cash flow before working capital changes**10 | 5,366 | 4,498 | 3,765 | +43% | 5,774 | -7% |
| Operating cash flow before working capital changes w/o financial charges (DACF)11 | 5,750 | 4,933 | 4,277 | +34% | 6,277 | -8% |
| Cash flow from operations | 5,598 | 5,674 | 1,299 | x4.3 | 3,629 | +54% |
From 2019, data takes into account the impact of the IFRS16 “Leases” rule, effective January 1, 2019.
| * | Average €-$ exchange rate: 1.2048 in the first quarter 2021. |
** 1Q20 and 1Q19 data restated.
| 4 | Adjusted results are defined as income using replacement cost, adjusted for special items, excluding the impact of changes for fair value; adjustment items are on page 15. |
| 5 | Group effective tax rate = (tax on adjusted net operating income) / (adjusted net operating income – income from equity affiliates – dividends received from investments – impairment of goodwill + tax on adjusted net operating income). |
| 6 | In accordance with IFRS rules, adjusted fully-diluted earnings per share is calculated from the adjusted net income less the interest on the perpetual subordinated bond |
| 7 | Organic investments = net investments excluding acquisitions, asset sales and other operations with non-controlling interests. |
| 8 | Net acquisitions = acquisitions – assets sales – other transactions with non-controlling interests (see page 15). |
| 9 | Net investments = organic investments + net acquisitions (see page 15). |
| 10 | Operating cash flow before working capital changes, is defined as cash flow from operating activities before changes in working capital at replacement cost, excluding the mark-to-market effect of iGRP’s contracts and including capital gain from renewable projects sale (effective first quarter 2020). |
The inventory valuation effect is explained on page 18. The reconciliation table for different cash flow figures is on page 16.
| 11 | DACF = debt adjusted cash flow, is defined as operating cash flow before working capital changes and financial charges. |
3
Key figures of environment and Group production
| > | Environment* – liquids and gas price realizations, refining margins |
| 1Q21 | 4Q20 | 1Q20 | 1Q21 vs |
1Q19 | 1Q21 vs |
|
| 1Q20 | 1Q19 | |||||
| Brent ($/b) | 61.1 | 44.2 | 50.1 | +22% | 63.1 | -3% |
| Henry Hub ($/Mbtu) | 2.7 | 2.8 | 1.9 | +46% | 2.9 | -5% |
| NBP ($/Mbtu) | 6.8 | 5.6 | 3.1 | x2.2 | 6.3 | +7% |
| JKM ($/Mbtu) | 10.0 | 8.0 | 3.6 | x2.8 | 6.6 | +50% |
| Average price of liquids ($/b) Consolidated subsidiaries | 56.4 | 41.0 | 44.4 | +27% | 58.7 | -4% |
| Average price of gas ($/Mbtu) Consolidated subsidiaries | 4.06 | 3.31 | 3.35 | +21% | 4.51 | -10% |
| Average price of LNG ($/Mbtu) Consolidated subsidiaries and equity affiliates | 6.08 | 4.90 | 6.32 | -4% | 7.20 | -16% |
| Variable cost margin - Refining Europe, VCM ($/t) | 5.3 | 4.6 | 26.3 | -80% | 33.0 | -84% |
| * | The indicators are shown on page 19. |
| > | Production* |
| 1Q21 | 4Q20 | 1Q20 | 1Q21 vs |
1Q19 | 1Q21 vs |
|
| 1Q20 | 1Q19 | |||||
| Hydrocarbon production (kboe/d) | 2,863 | 2,841 | 3,086 | -7% | 2,946 | -3% |
| Oil (including bitumen) (kb/d) | 1,272 | 1,238 | 1,448 | -12% | 1,425 | -11% |
| Gas (including condensates and associated NGL) (kboe/d) | 1,591 | 1,603 | 1,638 | -3% | 1,521 | +5% |
| Hydrocarbon production (kboe/d) | 2,863 | 2,841 | 3,086 | -7% | 2,946 | -3% |
| Liquids (kb/d) | 1,508 | 1,483 | 1,699 | -11% | 1,629 | -7% |
| Gas (Mcf/d) | 7,400 | 7,406 | 7,560 | -2% | 7,167 | +3% |
| * | Group production = E&P production + iGRP production |
Hydrocarbon production was 2,863 thousand barrels of oil equivalent per day (kboe/d) in the first quarter 2021, a decrease of 7% year-on-year, comprised of:
| · | -3% due to compliance with OPEC+ quotas, notably in Nigeria, the United Arab Emirates and Kazakhstan, |
| · | +2% due to resumption of production in Libya, |
| · | +2% due to the start-up and ramp-up of projects, notably North Russkoye in Russia, Culzean in the United Kingdom, Johan Sverdrup in Norway and Iara in Brazil, |
| · | -2% due to portfolio effect, notably the sales of assets in the United Kingdom and Block CA1 in Brunei, |
| · | -3% due to unplanned maintenance shut-downs notably in Norway, |
| · | -3% due to the natural decline of fields. |
4
Analysis of business segments
Integrated Gas, Renewables & Power (iGRP)
| > | Production and sales of Liquefied natural gas (LNG) and electricity |
| Hydrocarbon production for LNG | 1Q21 | 4Q20 | 1Q20 | 1Q21
vs |
1Q19 | 1Q21
vs |
| 1Q20 | 1Q19 | |||||
| iGRP (kboe/d) | 518 | 532 | 552 | -6% | 518 | - |
| Liquids (kb/d) | 64 | 65 | 73 | -13% | 66 | -4% |
| Gas (Mcf/d) | 2,476 | 2,549 | 2,611 | -5% | 2,460 | +1% |
| Liquefied Natural Gas in Mt | 1Q21 | 4Q20 | 1Q20 | 1Q21 vs |
1Q19 | 1Q21
vs |
| 1Q20 | 1Q19 | |||||
| Overall LNG sales | 9.9 | 10.0 | 9.8 | +1% | 7.7 | +28% |
| incl. Sales from equity production* | 4.4 | 4.3 | 4.7 | -7% | 3.8 | +15% |
| incl. Sales by Total from equity production and third party purchases | 7.9 | 8.0 | 7.8 | +1% | 6.0 | +31% |
| * | The Group’s equity production may be sold by Total or by the joint ventures. |
Despite hydrocarbon production for LNG in the first quarter of 2021, down 6% year-over-year, mainly due to the shutdown of the Snøhvit LNG plant following a fire at the end of September 2020, total LNG sales were stable in the first quarter of 2021.
| Renewables & Electricity | 1Q21 | 4Q20 | 1Q20 | 1Q21
vs |
| 1Q20 | ||||
| Portfolio of renewable power generation gross capacity to 2025 (GW) 1,2 | 36.2 | 26.1 | 16.7 | x2.2 |
| o/w installed capacity | 7.8 | 7.0 | 3.0 | x2.6 |
| o/w capacity in construction | 5.1 | 4.1 | 2.2 | x2.3 |
| o/w capacity in development | 23.3 | 15.0 | 11.5 | x2 |
| Gross capacity in development post-2025 2 | 4.0 | 2.5 | 0.4 | x10 |
| Gross renewables capacity with PPA (GW) 1,2 | 21.2 | 17.5 | 8.3 | x2.6 |
| Portfolio of renewable power generation net capacity to 2025 (GW) 1,2 | 28.0 | 17.9 | 11.5 | x2.4 |
| o/w installed capacity | 3.8 | 3.1 | 1.2 | x3.1 |
| o/w capacity in construction | 3.1 | 2.3 | 0.8 | x3.8 |
| o/w capacity in development | 21.1 | 12.5 | 9.5 | x2.2 |
| Net capacity in development post-2025 2 | 2.1 | 1.4 | 0.3 | x6.5 |
| Net power production (TWh) 3 | 4.7 | 4.3 | 2.9 | +61% |
| incl. Power production from renewables | 1.6 | 1.2 | 0.7 | x2.3 |
| Clients power - BtB and BtC (Million) 2 | 5.7 | 5.6 | 4.2 | +37% |
| Clients gas - BtB and BtC (Million) 2 | 2.7 | 2.7 | 1.7 | +58% |
| Sales power - BtB and BtC (TWh) | 16.1 | 13.5 | 14.2 | +13% |
| Sales gas - BtB and BtC (TWh) | 36.2 | 31.5 | 33.5 | +8% |
| Proportionnal EBITDA Renewables and Electricity (M$) 4 | 344 | 179 | 250 | +38% |
| incl. from renewables business | 148 | 102 | 91 | +62% |
1 Includes 20% of Adani Green Energy Ltd gross capacity effective first quarter 2021.
2 End of period data.
3 Solar, wind, biogas, hydroelectric and combined-cycle gas turbine (CCGT) plants.
4 Group’s share (% interest) of EBITDA in Renewables and Electricity affiliates, regardless of consolidation method and including gains on asset sales.
EBITDA: “Earnings Before Interest, Tax, Depreciation and Amortization »
5
Gross installed renewable power generation capacity grew to 7.8 GW at the end of the first quarter 2021, in line with the target of 10 GW by end-2021.
The portfolio of power capacity in operation, in construction and in development for 2025 has more than doubled from a year ago. It grew by 10 GW in the first quarter 2021 to 36 GW gross and 28 GW net, including the 20% interest in Adani Green Energy Limited (AGEL) and the acquisition of a 4 GW portfolio of solar projects in the US.
Net electricity production was 4.7 TWh in the first quarter 2021, an increase of 61% year-over-year, notably due to doubling production from renewable sources and the acquisition of four CCGT in France and Spain in the fourth quarter 2020.
Sales of electricity and gas in the first quarter 2021 increased by 13% and 8%, respectively, compared to the first quarter 2020 thanks to the growth in the number of customers.
The Group’s share of EBITDA for the Renewables and Electricity activity was $344 million in the first quarter 2021, an increase of 38% year-on-year, driven by the growth in electricity production, mainly from renewables, and the number of gas and electricity customers.
| > | Results |
| In millions of dollars | 1Q21 | 4Q20 | 1Q20 | 1Q21 |
1Q19 | 1Q21 |
| 1Q20 | 1Q19 | |||||
| Adjusted net operating income* | 985 | 254 | 913 | +8% | 592 | +66% |
| including income from equity affiliates | 264 | 97 | 248 | +6% | 255 | +4% |
| Organic investments | 753 | 1,007 | 646 | +17% | 493 | +53% |
| Net acquisitions | 1,893 | 577 | 1,137 | +66% | 400 | x4.7 |
| Net investments | 2,646 | 1,584 | 1,783 | +48% | 893 | x3 |
| Operating cash flow before working capital changes ** | 1,059 | 1,072 | 601 | +76% | 351 | x3 |
| Cash flow from operations *** | 780 | 575 | (489) | ns | 892 | -13% |
* Detail of adjustment items shown in the business segment information annex to financial statements.
| ** | Excluding financial expenses, except those related to lease contracts, excluding the impact of contracts recognized at fair value for the sector and including capital gains on the sale of renewable projects. 1Q20 and 1Q19 data restated (see note 10 on page 3). |
| *** | Excluding financial charges, except those related to leases. |
Adjusted net operating income for the iGRP segment was $985 million in the first quarter, a new record high. The year-on-year increase of 8%, despite the lower price of LNG, reflects the growing contribution of the Renewables and Electricity activity and good performance of trading.
Operating cash flow before working capital changes was $1,059 million in the first quarter 2021, an increase of 76% compared to the first quarter 2020, for the same reasons.
6
Exploration & Production
| > | Production |
| Hydrocarbon production | 1Q21 | 4Q20 | 1Q20 | 1Q21 |
1Q19 | 1Q21 |
| 1Q20 | 1Q19 | |||||
| EP (kboe/d) | 2,345 | 2,309 | 2,534 | -7% | 2,428 | -3% |
| Liquids (kb/d) | 1,444 | 1,418 | 1,626 | -11% | 1,563 | -8% |
| Gas (Mcf/d) | 4,924 | 4,857 | 4,949 | -1% | 4,707 | +5% |
| > | Results |
| In millions of dollars, except effective tax rate | 1Q21 | 4Q20 | 1Q20 | 1Q21 |
1Q19 | 1Q21 |
| 1Q20 | 1Q19 | |||||
| Adjusted net operating income* | 1,975 | 1,068 | 703 | x2.8 | 1,722 | +15% |
| including income from equity affiliates | 270 | 222 | 390 | -31% | 213 | +27% |
| Effective tax rate** | 41.0% | 19.8% | 59.6% | 48.6% | ||
| Organic investments | 1,279 | 1,569 | 1,572 | -19% | 1,958 | -35% |
| Net acquisitions | (202) | 548 | (6) | ns | 38 | ns |
| Net investments | 1,077 | 2,117 | 1,566 | -31% | 1,996 | -46% |
| Operating cash flow before working capital changes *** | 3,824 | 2,652 | 2,576 | +48% | 4,246 | -10% |
| Cash flow from operations *** | 3,736 | 3,046 | 3,923 | -5% | 3,936 | -5% |
| * | Details on adjustment items are shown in the business segment information annex to financial statements. | |
| ** | Tax on adjusted net operating income / (adjusted net operating income - income from equity affiliates - dividends received from investments - impairment of goodwill + tax on adjusted net operating income). | |
| *** | Excluding financial charges, except those related to leases. |
Adjusted net operating income for the Exploration & Production segment was $1,975 million in the first quarter 2021, nearly triple the first quarter 2020, due to the sharp rebound in oil and gas prices.
Operating cash flow before working capital changes increased by 48% year-over-year to $3,824 million in the first quarter 2021 for the same reasons.
7
Downstream (Refining & Chemicals and Marketing & Services)
| > | Results |
| In millions of dollars | 1Q21 | 4Q20 | 1Q20 | 1Q21 |
1Q19 | 1Q21 |
| 1Q20 | 1Q19 | |||||
| Adjusted net operating income* | 527 | 502 | 684 | -23% | 1,099 | -52% |
| Organic investments | 335 | 840 | 277 | +21% | 319 | +5% |
| Net acquisitions | (103) | 80 | (30) | ns | (131) | ns |
| Net investments | 232 | 920 | 247 | -6% | 188 | +23% |
| Operating cash flow before working capital changes ** | 872 | 1,129 | 1,064 | -18% | 1,686 | -48% |
| Cash flow from operations ** | 1,661 | 2,162 | (1,582) | ns | (306) | ns |
| * | Detail of adjustment items shown in the business segment information annex to financial statements. | |
| ** | Excluding financial charges, except those related to leases. |
Refining & Chemicals
| > | Refinery and petrochemicals throughput and utilization rates |
| Refinery throughput and utilization rate* | 1Q21 | 4Q20 | 1Q20 | 1Q21 |
1Q19 | 1Q21 |
| 1Q20 | 1Q19 | |||||
| Total refinery throughput (kb/d) | 1,147 | 1,262 | 1,444 | -21% | 1,862 | -38% |
| France | 114 | 247 | 255 | -55% | 592 | -81% |
| Rest of Europe | 660 | 582 | 756 | -13% | 823 | -20% |
| Rest of world | 373 | 433 | 433 | -14% | 447 | -17% |
| Utlization rate based on crude only** | 58% | 60% | 69% | 89% |
| * | Includes refineries in Africa reported in the Marketing & Services segment. | |
| ** | Based on distillation capacity at the beginning of the year, excluding Grandpuits from 2021, definitively shut down first quarter 2021. |
| Petrochemicals production and utilization rate | 1Q21 | 4Q20 | 1Q20 | 1Q21 |
1Q19 | 1Q21 |
| 1Q20 | 1Q19 | |||||
| Monomers* (kt) | 1,405 | 1,486 | 1,386 | +1% | 1,393 | +1% |
| Polymers (kt) | 1,165 | 1,291 | 1,202 | -3% | 1,297 | -10% |
| Vapocracker utilization rate** | 87% | 90% | 83% | 87% |
| * | Olefins. | |
| ** | Based on olefins production from steamcrackers and their treatment capacity at the start of the year. |
Refinery throughput volumes fell by 21% in the first quarter 2021 compared to a year ago due to the voluntary economic shutdown of the Donges refinery given the low margins, the shutdown of the Grandpuits refinery before its conversion to a zero-oil platform and the sale of the Lindsey refinery in the United Kingdom. The temporary shutdown of the Port Arthur platform in the US due to Storm Uri also contributed to the decline.
Production of monomers and polymers was stable compared to a year ago. The effect of strong demand was partially offset by the temporary shutdown of facilities in the US due to Storm Uri in Texas.
8
| > | Results |
| In millions of dollars | 1Q21 | 4Q20 | 1Q20 | 1Q21 |
1Q19 | 1Q21 |
| 1Q20 | 1Q19 | |||||
| Adjusted net operating income* | 243 | 170 | 382 | -36% | 756 | -68% |
| Organic investments | 222 | 448 | 168 | +32% | 240 | -8% |
| Net acquisitions | (57) | (2) | (36) | ns | (124) | ns |
| Net investments | 165 | 446 | 132 | +25% | 116 | +42% |
| Operating cash flow before working capital changes ** | 394 | 560 | 674 | -42% | 1,104 | -64% |
| Cash flow from operations ** | 996 | 1,514 | (1,183) | ns | (538) | ns |
| * | Detail of adjustment items shown in the business segment information annex to financial statements. | |
| ** | Excluding financial charges, except those related to leases. |
Adjusted net operating income for the Refining & Chemicals segment fell by 36% year-on-year to $243 million in the first quarter 2021. The drop was driven by European refining margins, which are still very poor, due to high oil prices and weak demand, particularly for distillates, due to reduced aviation activity.
Operating cash flow before working capital changes fell by 42% year-on-year to $394 million in the first quarter 2021 for the same reasons.
Cash flow from operations increased by $2,179 million to $996 million in the first quarter 2021 notably due to the decrease in working capital in the first quarter 2021, despite the low first quarter 2020 inventory values that reflected the sharp drop in oil prices.
Marketing & Services
| > | Petroleum product sales |
| Sales in kb/d* | 1Q21 | 4Q20 | 1Q20 | 1Q21 |
1Q19 | 1Q21 |
| 1Q20 | 1Q19 | |||||
| Total Marketing & Services sales | 1,442 | 1,509 | 1,656 | -13% | 1,836 | -21% |
| Europe | 776 | 828 | 906 | -14% | 1,012 | -23% |
| Rest of world | 666 | 681 | 750 | -11% | 824 | -19% |
| * Excludes trading and bulk refining sales |
Petroleum product sales volumes decreased by 13% year-over-year because of the Covid-19 pandemic-related lockdowns and the 50% drop in aviation activity.
| > | Results |
| In millions of dollars | 1Q21 | 4Q20 | 1Q20 | 1Q21 |
1Q19 | 1Q21 |
| 1Q20 | 1Q19 | |||||
| Adjusted net operating income* | 284 | 332 | 302 | -6% | 343 | -17% |
| Organic investments | 113 | 392 | 109 | +4% | 80 | +41% |
| Net acquisitions | (46) | 82 | 6 | ns | (8) | ns |
| Net investments | 67 | 474 | 115 | -42% | 72 | -7% |
| Operating cash flow before working capital changes ** | 478 | 569 | 390 | +23% | 582 | -18% |
| Cash flow from operations ** | 665 | 648 | (399) | ns | 232 | x2.9 |
| * | Detail of adjustment items shown in the business segment information annex to financial statements. | |
| ** | Excluding financial charges, except those related to leases |
Adjusted net operating income was $284 million in the first quarter 2021, a decrease of 6% compared to a year ago, mainly due to lower worldwide sales volumes for the reasons indicated above.
Operating cash flow before working capital changes was $478 million in the first quarter 2021, an increase of 23%, notably due to the negative impact in the first quarter 2020 of the revaluation of futures contracts.
9
Group results
| > | Adjusted net operating income from business segments |
Adjusted net operating income from the business segments was $3,487 million in the first quarter 2021, an increase of 52% year-on-year due to the increase in oil and gas prices.
| > | Adjusted net income (Group share) |
Adjusted net income (Group share) was $3,003 million in the first quarter 2021 compared to $1,781 million in the first quarter 2020, an increase of 69%, due to the increase in oil and gas prices.
Adjusted net income excludes the after-tax inventory effect, special items and the impact of effects of changes in fair value12.
Total net income adjustments13 were $341 million in the first quarter 2021, comprised of a positive stock effect of close to $700 million, restructuring charges related to voluntary departures in France and Belgium and an impairment related to end of the Qatargas 1 contract.
The effective tax rate for the Group was 34.6% in the first quarter 2021 versus 30% in the first quarter 2020.
| > | Adjusted earnings per share |
Adjusted fully-diluted earnings per share was $1.10 in the first quarter 2021, calculated based on 2,645 million weighted-average shares, versus $0.66 in the first quarter 2020.
| > | Acquisitions - asset sales |
Acquisitions were $2,208 million in the first quarter 2021 and include notably the acquisition for $2 billion of a 20% interest in the renewable energy project developer in India, Adani Green Energy Limited.
Asset sales were $618 million in the first quarter 2021 and include notably the 50% farm down in France of a portfolio of renewable projects with total capacity of 285 MW (100%), the sale of a 10% interest in the onshore OML 17 block in Nigeria, a price supplement to the sale of Block CA1 in Brunei and the disposal of the Lindsey refinery in the United Kingdom.
| > | Net cash flow |
Net cash flow14 for the Group was $1,397 million in the first quarter 2021 compared to $140 million in the first quarter 2020, which takes into account the increase in operating cash flow before changes in working capital to $5,366 million from $3,765 million and stable net investments of $3,969 million in the first quarter 2021 compared to $3,625 million a year ago.
12 Adjustment items shown on page 18.
13 Details shown on page 15 and in the appendix to the financial statements.
14 Net cash flow = operating cash flow before working capital changes - net investments (including other transactions with non-controlling interests).
10
| > | Profitability |
The return on equity was 4.9% for the twelve months ended March 31, 2021.
| In millions of dollars | April
1, 2020 March 31, 2021 |
January
1, 2020 December 31, 2020 |
April
1, 2019 March 31, 2020 |
| Adjusted net income | 5,330 | 4,067 | 11,079 |
| Average adjusted shareholders' equity | 109,135 | 110,643 | 113,607 |
| Return on equity (ROE) | 4.9% | 3.7% | 9.8% |
The return on average capital employed was 4.6% for the twelve months ended March 31, 2021.
| In millions of dollars | April
1, 2020 March 31, 2021 |
January
1, 2020 December 31, 2020 |
April
1, 2019 March 31, 2020 |
| Adjusted net operating income | 6,915 | 5,806 | 13,032 |
| Average capital employed | 148,777 | 145,723 | 150,418 |
| ROACE | 4.6% | 4.0% | 8.7% |
Total SE accounts
Net income for Total SE, the parent company, was €1,472 million in the first quarter 2021 compared to €1,718 in the first quarter 2020.
2021 Sensitivities*
| Estimated impact on | Estimated impact on | ||
| Change | adjusted | cash flow from | |
| net operating income | operations | ||
| Dollar | +/- 0.1 $ per € | -/+ 0.1 B$ | ~0 B$ |
| Average liquids price** | +/- 10 $/b | +/- 2.7 B$ | +/- 3.2 B$ |
| European gas price - NBP ($/Mbtu) | +/- 1 $/Mbtu | +/- 0.3 B$ | +/- 0.25 B$ |
| Variable cost margin, European refining (VCM) | +/- 10 $/t | +/- 0.4 B$ | +/- 0.5 B$ |
| * | Sensitivities are revised once per year upon publication of the previous year’s fourth quarter results. Sensitivities are estimates based on assumptions about the Group’s portfolio in 2021. Actual results could vary significantly from estimates based on the application of these sensitivities. The impact of the $-€ sensitivity on adjusted net operating income is essentially attributable to Refining & Chemicals. Please find the indicators detailed page 19. |
| ** | In a 50 $/b Brent environment. |
11
Summary and outlook
Supported by the OPEC+ active policy to reduce inventories by adapting supply to demand, the oil price has remained above $60/b since the beginning of February 2021. However, the oil environment remains volatile and dependent on the global demand recovery, still affected by the Covid-19 pandemic.
The Group maintains its expectation for stable hydrocarbon production in 2021 compared to 2020, benefiting from the resumption of production in Libya.
Total anticipates that the increase in the oil price observed in the first quarter will have a positive impact on its average LNG selling price over the next six months, given the lag effect on pricing formulas.
Given the high level of distillate inventories, European refining margins remain fragile.
Faced with uncertainties in the environment, the Group maintains spending discipline with an operating cost savings target of $0.5 billion in 2021 and production costs close to $5/boe. Net investments are expected to be between $12-13 billion in 2021, half to maintain the Group's activities and half for growth. Nearly 50% of these growth investments will be allocated to renewables and electricity.
The Group's teams are fully committed to the four priorities of HSE including the objectives in terms of CO2 emission reductions, operational excellence, cost reduction and cash flow generation.
In a 2021 hydrocarbon price environment maintained at the level of the first quarter (Brent at $60/b, European gas at $6/Mbtu), and with European refining margins at $10-15/t, the Group would expect to generate cash flow (DACF) on the order of $24 billion and a return on capital employed of close to 10%.
The Group confirms its priorities in terms of cash flow allocation: investing in profitable projects to implement its strategy to transform the Group into a broad-energy company, supporting the dividend through economic cycles, and maintaining a solid balance sheet with a minimum long-term “A” rating, by deleveraging to anchor the net debt-to-capital ratio sustainably below 20%.
* * * * *
To listen to the conference call with CFO Jean-Pierre Sbraire today at 13:30 (Paris time) please log on to total.com or call +44 (0) 203 009 5709 in Europe or +1 646 787 1226 in the United States (code: 3046396). The conference replay will be available on total.com after the event.
* * * * *
Total contacts
| Media Relations: | +33 1 47 44 46 99 l [email protected] l @TotalPress |
| Investors Relations: | +44 (0) 207 719 7962 l [email protected] |
12
Operating information by segment
| > | Group production (Exploration & Production + iGRP) |
| Combined liquids and gas | 1Q21 | 4Q20 | 1Q20 | 1Q21 vs 1Q20 |
1Q19 | 1Q21 vs 1Q19 |
||
| production by region (kboe/d) | ||||||||
| Europe and Central Asia | 1,050 | 1,059 | 1,097 | -4% | 990 | +6% | ||
| Africa | 551 | 566 | 701 | -21% | 697 | -21% | ||
| Middle East and North Africa | 651 | 598 | 681 | -4% | 686 | -5% | ||
| Americas | 376 | 382 | 372 | +1% | 373 | +1% | ||
| Asia-Pacific | 235 | 236 | 235 | - | 201 | +17% | ||
| Total production | 2,863 | 2,841 | 3,086 | -7% | 2,946 | -3% | ||
| includes equity affiliates | 729 | 727 | 753 | -3% | 709 | +3% | ||
| Liquids production by region (kb/d) | 1Q21 | 4Q20 | 1Q20 | 1Q21 | 1Q19 | 1Q21 | ||
| vs | vs | |||||||
| 1Q20 | 1Q19 | |||||||
| Europe and Central Asia | 374 | 378 | 404 | -7% | 352 | +6% | ||
| Africa | 415 | 427 | 555 | -25% | 540 | -23% | ||
| Middle East and North Africa | 499 | 454 | 516 | -3% | 522 | -4% | ||
| Americas | 179 | 181 | 178 | +1% | 177 | +1% | ||
| Asia-Pacific | 41 | 43 | 47 | -13% | 39 | +5% | ||
| Total production | 1,508 | 1,483 | 1,699 | -11% | 1,629 | -7% | ||
| includes equity affiliates | 201 | 200 | 214 | -6% | 217 | -7% | ||
| Gas production by region (Mcf/d) | 1Q21 | 4Q20 | 1Q20 | 1Q21 | 1Q19 | 1Q21 | ||
| vs | vs | |||||||
| 1Q20 | 1Q19 | |||||||
| Europe and Central Asia | 3,636 | 3,666 | 3,734 | -3% | 3,426 | +6% | ||
| Africa | 693 | 701 | 746 | -7% | 795 | -13% | ||
| Middle East and North Africa | 843 | 809 | 912 | -8% | 905 | -7% | ||
| Americas | 1,100 | 1,126 | 1,092 | +1% | 1,101 | - | ||
| Asia-Pacific | 1,128 | 1,104 | 1,076 | +5% | 940 | +20% | ||
| Total production | 7,400 | 7,406 | 7,560 | -2% | 7,167 | +3% | ||
| includes equity affiliates | 2,855 | 2,851 | 2,905 | -2% | 2,656 | +8% | ||
| > Downstream (Refining & Chemicals and Marketing & Services) | ||||||||
| Petroleum product sales by region (kb/d) | 1Q21 | 4Q20 | 1Q20 | 1Q21 | 1Q19 | 1Q21 | ||
| vs | vs | |||||||
| 1Q20 | 1Q19 | |||||||
| Europe | 1,488 | 1,651 | 1,771 | -16% | 2,022 | -26% | ||
| Africa | 667 | 628 | 683 | -2% | 658 | +1% | ||
| Americas | 772 | 794 | 766 | +1% | 839 | -8% | ||
| Rest of world | 495 | 547 | 444 | +11% | 616 | -20% | ||
| Total consolidated sales | 3,422 | 3,619 | 3,663 | -7% | 4,135 | -17% | ||
| Includes bulk sales | 331 | 458 | 497 | -33% | 557 | -41% | ||
| Includes trading | 1,648 | 1,652 | 1,510 | +9% | 1,742 | -5% | ||
| Petrochemicals production* (kt) | 1Q21 | 4Q20 | 1Q20 | 1Q21 | 1Q19 | 1Q21 | ||
| vs | vs | |||||||
| 1Q20 | 1Q19 | |||||||
| Europe | 1,346 | 1,381 | 1,272 | 6% | 1,416 | -5% | ||
| Americas | 510 | 662 | 664 | -23% | 614 | -17% | ||
| Middle East and Asia | 714 | 735 | 652 | +9% | 660 | +8% | ||
| * | Olefins, polymers |
13
| > | Renewables |
| 1Q21 | 4Q20 | |||||||||||
| Installed power generation gross capacity | Solar | Onshore | Other | Total | Solar | Onshore | Other | Total | ||||
| (GW) 1,2 | Wind | Wind | ||||||||||
| France | 0.4 | 0.5 | 0.1 | 1.0 | 0.4 | 0.5 | 0.1 | 1.0 | ||||
| Rest of Europe | 0.1 | 0.8 | 0.1 | 1.0 | 0.1 | 0.8 | 0.1 | 1.0 | ||||
| Africa | 0.1 | 0.0 | 0.0 | 0.1 | 0.1 | 0.0 | 0.0 | 0.1 | ||||
| Middle East | 0.3 | 0.0 | 0.0 | 0.3 | 0.3 | 0.0 | 0.0 | 0.3 | ||||
| North America | 0.8 | 0.0 | 0.0 | 0.8 | 0.6 | 0.0 | 0.0 | 0.6 | ||||
| South America | 0.2 | 0.1 | 0.0 | 0.3 | 0.2 | 0.1 | 0.0 | 0.2 | ||||
| India | 3.4 | 0.1 | 0.0 | 3.5 | 3.3 | 0.0 | 0.0 | 3.3 | ||||
| Asia-Pacific | 0.7 | 0.0 | 0.0 | 0.7 | 0.5 | 0.0 | 0.0 | 0.5 | ||||
| Total | 6.1 | 1.5 | 0.1 | 7.8 | 5.6 | 1.3 | 0.1 | 7.0 | ||||
| 1Q21 | 4Q20 | |||||||||||
| Power generation gross capacity from | ||||||||||||
| renewables in construction to 2025 | Solar | Onshore | Offshore | Other | Total | Solar | Onshore | Offshore | Other | Total | ||
| (GW) 1,2 | Wind | Wind | Wind | Wind | ||||||||
| France | 0.3 | 0.0 | 0.0 | 0.1 | 0.4 | 0.3 | 0.0 | 0.0 | 0.0 | 0.3 | ||
| Rest of Europe | 0.1 | 0.3 | 1.1 | 0.0 | 1.5 | 0.1 | 0.3 | 1.1 | 0.0 | 1.5 | ||
| Africa | 0.0 | 0.0 | 0.0 | 0.0 | 0.0 | 0.0 | 0.0 | 0.0 | 0.0 | 0.0 | ||
| Middle East | 0.8 | 0.0 | 0.0 | 0.0 | 0.8 | 0.8 | 0.0 | 0.0 | 0.0 | 0.8 | ||
| North America | 0.3 | 0.0 | 0.0 | 0.0 | 0.3 | 0.0 | 0.0 | 0.0 | 0.0 | 0.1 | ||
| South America | 0.2 | 0.2 | 0.0 | 0.0 | 0.3 | 0.2 | 0.3 | 0.0 | 0.0 | 0.4 | ||
| India | 0.9 | 0.4 | 0.0 | 0.0 | 1.3 | 0.5 | 0.0 | 0.0 | 0.0 | 0.5 | ||
| Asia-Pacific | 0.4 | 0.0 | 0.0 | 0.0 | 0.5 | 0.5 | 0.0 | 0.0 | 0.0 | 0.5 | ||
| Total | 2.9 | 0.9 | 1.1 | 0.1 | 5.1 | 2.3 | 0.6 | 1.1 | 0.1 | 4.1 | ||
| 1Q21 | 4Q20 | |||||||||||
| Power generation gross capacity from | ||||||||||||
| renewables in development to 2025 | Solar | Onshore | Offshore | Other | Total | Solar | Onshore | Offshore | Other | Total | ||
| (GW) 1,2 | Wind | Wind | Wind | Wind | ||||||||
| France | 3.2 | 1.0 | 0.0 | 0.0 | 4.2 | 3.5 | 1.0 | 0.0 | 0.1 | 4.6 | ||
| Rest of Europe | 5.2 | 0.3 | 0.4 | 0.0 | 5.9 | 5.1 | 0.3 | 0.4 | 0.0 | 5.7 | ||
| Africa | 0.1 | 0.1 | 0.0 | 0.0 | 0.2 | 0.1 | 0.1 | 0.0 | 0.0 | 0.2 | ||
| Middle East | 0.2 | 0.0 | 0.0 | 0.0 | 0.2 | 0.1 | 0.0 | 0.0 | 0.0 | 0.1 | ||
| North America | 3.4 | 0.2 | 0.0 | 0.7 | 4.2 | 0.6 | 0.3 | 0.0 | 0.0 | 0.9 | ||
| South America | 0.8 | 0.8 | 0.0 | 0.0 | 1.6 | 0.5 | 0.3 | 0.0 | 0.0 | 0.9 | ||
| India | 6.2 | 0.1 | 0.0 | 0.0 | 6.2 | 1.6 | 0.0 | 0.0 | 0.0 | 1.6 | ||
| Asia-Pacific | 0.8 | 0.0 | 0.0 | 0.0 | 0.8 | 0.9 | 0.0 | 0.0 | 0.0 | 0.9 | ||
| Total | 19.8 | 2.5 | 0.4 | 0.7 | 23.3 | 12.5 | 2.0 | 0.4 | 0.1 | 15.0 |
1 Includes 20% of gross capacity of Adani Green Energy Ltd effective first quarter 2021.
2 End-of-period data.
| In operation | In construction | In development | |||||||||||
| Gross renewables capacity covered by | Solar | Onshore | Total | Solar | Onshore | Offshore | Total | Solar | Onshore | Offshore | Total | ||
| PPA at 31 March 2021 (GW) | Wind | Wind | Wind | Wind | Wind | ||||||||
| Europe | 0.6 | 1.3 | 1.9 | 0.3 | 0.3 | 0.8 | 1.4 | 3.8 | 0.3 | X | 4.2 | ||
| Asia | 4.4 | X | 4.5 | 2.2 | 0.4 | - | 2.6 | 4.0 | X | - | 4.0 | ||
| North America | 0.8 | X | 0.8 | X | X | - | 0.2 | 0.3 | X | - | 0.3 | ||
| Rest of World | 0.3 | X | 0.5 | X | X | - | 0.4 | 0.2 | X | - | 0.3 | ||
| total | 6.0 | 1.5 | 7.6 | 2.8 | 0.9 | 0.8 | 4.5 | 8.3 | 0.6 | X | 8.9 | ||
| In operation | In construction | In development | |||||||||||
| PPA average price at 31 march 2021 | Solar | Onshore | Total | Solar | Onshore | Offshore | Total | Solar | Onshore | Offshore | Total | ||
| ($/MVh) | Wind | Wind | Wind | Wind | Wind | ||||||||
| Europe | 242 | 123 | 159 | 68 | 94 | 61 | 68 | 44 | 72 | X | 49 | ||
| Asia | 88 | X | 87 | 46 | 49 | - | 47 | 40 | X | - | 40 | ||
| North America | 156 | X | 159 | X | X | - | 57 | 32 | X | - | 54 | ||
| Rest of World | 105 | X | 105 | X | X | - | 45 | 89 | X | - | 123 | ||
| total | 113 | 115 | 113 | 48 | 66 | 61 | 55 | 42 | 87 | X | 46 | ||
14
Adjustment items to net income (Group share)
| In millions of dollars | 1Q21 | 4Q20 | 1Q20 | 1Q19 |
| Special items affecting net income (Group share) | (342) | (683) | (334) | (14) |
| Gain (loss) on asset sales | - | 104 | - | - |
| Restructuring charges | (161) | (194) | (80) | (2) |
| Impairments | (144) | (71) | - | - |
| Other | (37) | (522) | (254) | (12) |
| After-tax inventory effect : FIFO vs. replacement cost | 689 | 224 | (1,414) | 388 |
| Effect of changes in fair value | (6) | 46 | 1 | (22) |
| Total adjustments affecting net income | 341 | (413) | (1,747) | 352 |
Investments - Divestments
| In millions of dollars | 1Q21 | 4Q20 | 1Q20 | 1Q21 | 1Q19 | 1Q21 | |
| vs | vs | ||||||
| 1Q20 | 1Q19 | ||||||
| Organic investments ( a ) | 2,379 | 3,432 | 2,523 | -6% | 2,784 | -15% | |
| capitalized exploration | 243 | 214 | 135 | +80% | 232 | +5% | |
| increase in non-current loans | 292 | 355 | 279 | +5% | 130 | x2.2 | |
| repayment of non-current loans, | (96) | (212) | (117) | ns | (134) | ns | |
| excluding organic loan repayment from equity affiliates | |||||||
| change in debt from renewable projects (Group share) | (167) | (46) | (105) | ns | - | ns | |
| Acquisitions ( b ) | 2,208 | 1,538 | 1,644 | +34% | 669 | x3.3 | |
| Asset sales ( c ) | 618 | 439 | 542 | +14% | 363 | +70% | |
| change in debt from renewable projects (partner share) | 100 | 15 | 61 | 64% | - | ns | |
| Other transactions with non-controlling interests ( d ) | - | - | - | ns | - | ns | |
| Net investments ( a + b - c - d ) | 3,969 | 4,531 | 3,625 | +9% | 3,090 | +28% | |
| Organic loan repayment from equity affiliates ( e ) | (30) | (77) | 7 | ns | - | ns | |
| Change in debt from renewable projects financing * ( f ) | 267 | 61 | 166 | +61% | - | ns | |
| Capex linked to capitalized leasing contracts ( g ) | 22 | 39 | 24 | -8% | - | ns | |
| Cash flow used in investing activities ( a + b - c + e + f -g) | 4,184 | 4,476 | 3,774 | +11% | 3,090 | +35% | |
| * | Change in debt from renewable projects (Group share and partner share). |
15
Cash flow
| In millions of dollars | 1Q21 | 4Q20 | 1Q20 | 1Q21 | 1Q19 | 1Q21 | |
| vs | vs | ||||||
| 1Q20 | 1Q19 | ||||||
| Operating cash flow before working capital changes w/o | |||||||
| financials charges (DACF) | 5,750 | 4,933 | 4,277 | +34% | 6,277 | -8% | |
| Financial charges | (384) | (436) | (512) | ns | (503) | ns | |
| Operating cash flow before working capital changes ( a ) * | 5,366 | 4,498 | 3,765 | +43% | 5,774 | -7% | |
| (Increase) decrease in working capital ** | (555) | 976 | (633) | ns | (2,711) | ns | |
| Inventory effect | 883 | 308 | (1,796) | ns | 566 | +56% | |
| capital gain from renewable projects sale | (66) | (32) | (44) | ns | - | ns | |
| Organic loan repayment from equity affiliates | (30) | (77) | 7 | ns | - | ns | |
| Cash flow from operations | 5,598 | 5,674 | 1,299 | x4.3 | 3,629 | +54% | |
| Organic investments ( b ) | 2,379 | 3,432 | 2,523 | -6% | 2,784 | -15% | |
| Free cash flow after organic investments, | 2,987 | 1,066 | 1,242 | x2.4 | 3,249 | -8% | |
| w/o net asset sales ( a - b ) | |||||||
| Net investments ( c ) | 3,969 | 4,531 | 3,625 | +9% | 3,090 | +28% | |
| Net cash flow ( a - c ) | 1,397 | (33) | 140 | x10 | 2,943 | -53% |
| * | Operating cash flow before working capital changes, is defined as cash flow from operating activities before changes in working capital at replacement cost, excluding the mark-to-market effect of iGRP’s contracts and including capital gain from renewable projects sale (effective first quarter 2020). Historical data have been restated to cancel the impact of fair valuation of iGRP sector’s contracts. |
| ** | Changes in working capital are presented excluding the mark-to-market effect of iGRP’s contracts. |
| Gearing ratio | ||||
| In millions of dollars | 03/31/2021 | 31/12/2020 | 03/31/2020 | 03/31/2019 |
| Current borrowings * | 19,279 | 15,893 | 17,361 | 12,998 |
| Other current financial liabilities | 351 | 203 | 604 | 651 |
| Current financial assets * | (4,492) | (4,519) | (6,870) | (3,373) |
| Net financial assets classified as held for sale | - | 313 | - | 227 |
| Non-current financial debt * | 44,842 | 52,467 | 42,461 | 38,264 |
| Non-current financial assets * | (2,669) | (3,762) | (993) | (587) |
| Cash and cash equivalents | (30,285) | (31,268) | (21,634) | (25,432) |
| Net debt (a) | 27,026 | 29,327 | 30,929 | 22,748 |
| Shareholders’ equity - Group share | 109,295 | 103,702 | 112,006 | 117,993 |
| Non-controlling interests | 2,390 | 2,383 | 2,428 | 2,365 |
| Shareholders' equity (b) | 111,685 | 106,085 | 114,434 | 120,358 |
| Net-debt-to-capital ratio = a / (a+b) | 19.5% | 21.7% | 21.3% | 15.9% |
| Leases (c) | 7,747 | 7,812 | 7,309 | 6,991 |
| Net-debt-to-capital ratio including leases (a+c) / (a+b+c) | 23.7% | 25.9% | 25.0% | 19.8% |
| * Excludes leases receivables and leases debts. |
16
Return on average capital employed
| > | Twelve months ended March 31, 2021 |
| Integrated Gas, | Exploration & | Refining & | Marketing & | ||||
| In millions of dollars | Renewables & | Production | Chemicals | Services | Group | ||
| Power | |||||||
| Adjusted net operating income | 1,850 | 3,635 | 900 | 1,206 | 6,915 | ||
| Capital employed at 03/31/2020* | 44,236 | 85,622 | 12,878 | 8,764 | 152,374 | ||
| Capital employed at 03/31/2021* | 48,423 | 78,170 | 10,403 | 8,198 | 145,180 | ||
| ROACE | 4.0% | 4.4% | 7.7% | 14.2% | 4.6% |
| > | Twelve months ended December 31, 2020 |
| Integrated Gas, | Exploration & | Refining & | Marketing & | ||||
| In millions of dollars | Renewables & | Production | Chemicals | Services | Group | ||
| Power | |||||||
| Adjusted net operating income | 1,778 | 2,363 | 1,039 | 1,224 | 5,806 | ||
| Capital employed at 12/31/2019* | 41,549 | 88,844 | 12,228 | 8,371 | 148,828 | ||
| Capital employed at 12/31/2020* | 45,611 | 78,928 | 11,375 | 8,793 | 142,617 | ||
| ROACE | 4.1% | 2.8% | 8.8% | 14.3% | 4.0% |
| > | Twelve months ended March 31, 2020 |
| Integrated Gas, | Exploration & | Refining & | Marketing & | ||||
| In millions of dollars | Renewables & | Production | Chemicals | Services | Group | ||
| Power | |||||||
| Adjusted net operating income | 2,710 | 6,490 | 2,629 | 1,612 | 13,032 | ||
| Capital employed at 03/31/2019* | 37,235 | 90,051 | 13,153 | 8,255 | 148,463 | ||
| Capital employed at 03/31/2020* | 44,236 | 85,622 | 12,878 | 8,764 | 152,374 | ||
| ROACE | 6.7% | 7.4% | 20.2% | 18.9% | 8.7% |
| * | At replacement cost (excluding after-tax inventory effect). |
17
This press release presents the results for the first quarter of 2021 from the consolidated financial statements of TOTAL SE as of March 31, 2021. The limited review procedures by the Statutory Auditors are underway. The notes to the consolidated financial statements (unaudited) are available on the Total website total.com.
This document may contain forward-looking statements within the meaning of the Private Securities Litigation Reform Act of 1995, notably with respect to the financial condition, results of operations, business activities and industrial strategy of TOTAL. This document may also contain statements regarding the perspectives, objectives, areas of improvement and goals of the Group, including with respect to climate change and carbon neutrality (net zero emissions). An ambition expresses an outcome desired by the Group, it being specified that the means to be deployed do not depend solely on TOTAL. These forward-looking statements may generally be identified by the use of the future or conditional tense or forward-looking words such as “envisions”, “intends”, “anticipates”, “believes”, “considers”, “plans”, “expects”, “thinks”, “targets”, “aims” or similar terminology. Such forward-looking statements included in this document are based on economic data, estimates and assumptions prepared in a given economic, competitive and regulatory environment and considered to be reasonable by the Group as of the date of this document.
These forward-looking statements are not historical data and should not be interpreted as assurances that the perspectives, objectives or goals announced will be achieved. They may prove to be inaccurate in the future, and may evolve or be modified with a significant difference between the actual results and those initially estimated, due to the uncertainties notably related to the economic, financial, competitive and regulatory environment, or due to the occurrence of risk factors, such as, notably, the price fluctuations in crude oil and natural gas, the evolution of the demand and price of petroleum products, the changes in production results and reserves estimates, the ability to achieve cost reductions and operating efficiencies without unduly disrupting business operations, changes in laws and regulations including those related to the environment and climate, currency fluctuations, as well as economic and political developments, changes in market conditions, loss of market share and changes in consumer preferences, or pandemics such as the COVID-19 pandemic. Additionally, certain financial information is based on estimates particularly in the assessment of the recoverable value of assets and potential impairments of assets relating thereto.
Neither TOTAL nor any of its subsidiaries assumes any obligation to update publicly any forward-looking information or statement, objectives or trends contained in this document whether as a result of new information, future events or otherwise. The information on risk factors that could have a significant adverse effect on the Group’s business, financial condition, including its operating income and cash flow, reputation, outlook or the value of financial instruments issued by TOTAL is provided in the most recent version of the Universal Registration Document which is filed by the Company with the French Autorité des Marchés Financiers and the annual report on Form 20-F filed with the United States Securities and Exchange Commission (“SEC”).
Financial information by business segment is reported in accordance with the internal reporting system and shows internal segment information that is used to manage and measure the performance of TOTAL. In addition to IFRS measures, certain alternative performance indicators are presented, such as performance indicators excluding the adjustment items described below (adjusted operating income, adjusted net operating income, adjusted net income), return on equity (ROE), return on average capital employed (ROACE), gearing ratio, operating cash flow before working capital changes, the shareholder rate of return. These indicators are meant to facilitate the analysis of the financial performance of TOTAL and the comparison of income between periods. They allow investors to track the measures used internally to manage and measure the performance of the Group.
These adjustment items include:
(i) Special items
Due to their unusual nature or particular significance, certain transactions qualified as "special items" are excluded from the business segment figures. In general, special items relate to transactions that are significant, infrequent or unusual. However, in certain instances, transactions such as restructuring costs or asset disposals, which are not considered to be representative of the normal course of business, may be qualified as special items although they may have occurred within prior years or are likely to occur again within the coming years.
(ii) Inventory valuation effect
The adjusted results of the Refining & Chemicals and Marketing & Services segments are presented according to the replacement cost method. This method is used to assess the segments’ performance and facilitate the comparability of the segments’ performance with those of its competitors.
In the replacement cost method, which approximates the LIFO (Last-In, First-Out) method, the variation of inventory values in the statement of income is, depending on the nature of the inventory, determined using either the month-end price differentials between one period and another or the average prices of the period rather than the historical value. The inventory valuation effect is the difference between the results according to the FIFO (First-In, First-Out) and the replacement cost.
(iii) Effect of changes in fair value
The effect of changes in fair value presented as an adjustment item reflects, for some transactions, differences between internal measures of performance used by TOTAL’s management and the accounting for these transactions under IFRS.
IFRS requires that trading inventories be recorded at their fair value using period-end spot prices. In order to best reflect the management of economic exposure through derivative transactions, internal indicators used to measure performance include valuations of trading inventories based on forward prices.
TOTAL, in its trading activities, enters into storage contracts, whose future effects are recorded at fair value in Group’s internal economic performance. IFRS precludes recognition of this fair value effect.
Furthermore, TOTAL enters into derivative instruments to risk manage certain operational contracts or assets. Under IFRS, these derivatives are recorded at fair value while the underlying operational transactions are recorded as they occur. Internal indicators defer the fair value on derivatives to match with the transaction occurrence.
The adjusted results (adjusted operating income, adjusted net operating income, adjusted net income) are defined as replacement cost results, adjusted for special items, excluding the effect of changes in fair value.
Euro amounts presented for the fully adjusted-diluted earnings per share represent dollar amounts converted at the average euro-dollar (€-$) exchange rate for the applicable period and are not the result of financial statements prepared in euros.
Cautionary Note to U.S. Investors – The SEC permits oil and gas companies, in their filings with the SEC, to separately disclose proved, probable and possible reserves that a company has determined in accordance with SEC rules. We may use certain terms in this press release, such as “potential reserves” or “resources”, that the SEC’s guidelines strictly prohibit us from including in filings with the SEC. U.S. investors are urged to consider closely the disclosure in the Form 20-F of TOTAL, File N° 1-10888, available from us at 2, place Jean Millier – Arche Nord Coupole/Regnault - 92078 Paris-La Défense Cedex, France, or at our website total.com. You can also obtain this form from the SEC by calling 1-800-SEC-0330 or on the SEC’s website sec.gov.
18
Exhibit 99.9

Press Release
Total announces the first 2021 interim dividend
stable at €0.66/share
Paris, April 29, 2021 – The Board of Directors met on April 28, 2021, and declared the distribution of the first 2021 interim dividend stable at €0.66/share. This interim dividend will be paid in cash exclusively, according to the following timetable:
| Shareholders | ADS holders | |
| Ex-dividend date | September 21, 2021 | September 17, 2021 |
| Payment date | October 1, 2021 | October 12, 2021 |
About Total
Total is a broad energy company that produces and markets fuels, natural gas and electricity. Our 100,000 employees are committed to better energy that is safer, more affordable, cleaner and accessible to as many people as possible. Active in more than 130 countries, our ambition is to become the responsible energy major.
* * * * *
Total Contacts
Media Relations: +33 1 47 44 46 99 l [email protected] l @TotalPress
Investor Relations: +44 (0)207 719 7962 l [email protected]
Cautionary Note
This press release, from which no legal consequences may be drawn, is for information purposes only. The entities in which TOTAL SE directly or indirectly owns investments are separate legal entities. TOTAL SE has no liability for their acts or omissions. In this document, the terms “Total”, “Total Group” and Group are sometimes used for convenience. Likewise, the words “we”, “us” and “our” may also be used to refer to subsidiaries in general or to those who work for them.
This document may contain forward-looking information and statements that are based on a number of economic data and assumptions made in a given economic, competitive and regulatory environment. They may prove to be inaccurate in the future and are subject to a number of risk factors. Neither TOTAL SE nor any of its subsidiaries assumes any obligation to update publicly any forward-looking information or statement, objectives or trends contained in this document whether as a result of new information, future events or otherwise.
Exhibit 99.10
Press Release
Total Enters a 640 MW Offshore Wind Project
Under Construction in Taiwan
Paris, April 29, 2021 – Total has signed an agreement with wpd to acquire a 23% interest in Yunlin Holding GmbH, the owner of Yunlin offshore wind farm located off the coast of Taiwan, around 200 kilometers southwest of Taipei. The project, currently under construction, represents production capacity of 640 megawatts (MW) and benefits from a 20-year guaranteed-price power purchase agreement (PPA) with the state-owned company Taipower of USD 250/MWh for the first 10 years and USD 125/MWh for the following 10 years1. For this acquisition of a 23% interest, Total will pay to wpd a consideration based on its share of past costs.
Located around 10 kilometers offshore at water depths ranging from 7 to 35 meters, the wind farm will comprise 80 wind turbines with a unit capacity of 8 MW. Construction is scheduled to be completed in 2022. Once on stream, the project will produce 2.4 terawatt hours (TWh) of renewable electricity per year, enough to serve the power needs of 605,000 households.
Procurement of the main components has been finalized and marine works are under way. The project reached a major milestone with the installation of the first wind turbine on April 23.
Identified by Taiwan’s authorities as a key area in the development of renewable energies, offshore wind power will be a significant contributor to the objective of generating 20% of its electricity from renewables by 2025 while fostering the emergence of a local wind power industry. Taiwan is one of the priority regions selected by Total for its development in offshore wind power in Asia.
“This agreement provides Total with an opportunity to gain a foothold in one of Asia’s main offshore wind markets and strengthens the Group’s position in this fast-growing segment, in line with its strategy of profitable development in renewables worldwide,” said Stéphane Michel, President Gas, Renewables & Power at Total. “Taiwan has been a pioneer in developing offshore wind power in Asia, and we are proud to contribute to the transformation of its energy mix. We are delighted to enter into this first partnership with wpd, one of the leading independent developers of offshore wind power.”
The project is currently 48%-owned by wpd, 25% by EGCO (Electricity Generating Public Company Limited) and 27% by a consortium of Japanese investors led by Sojitz (Sojitz Corporation, ENEOS Corporation, Chugoku Electric Power, Chudenko Corporation and Shikoku Electric Power).
The acquisition, which is subject to government approval, will broaden the Group’s portfolio of offshore wind projects under development and construction, that currently represents a cumulative capacity of about 5.5 GW.
1 Based on a rate of 28 NTD/USD
Total, renewables and electricity
As part of its ambition to get to net zero by 2050, Total is building a portfolio of activities in renewables and electricity that should account for up to 40 % of its sales by 2050. At the end of 2020, Total's gross power generation capacity worldwide was around 12 GW, including 7 GW of renewable energy. Total will continue to expand this business to reach 100 GW of gross production capacity from renewable sources by 2030 with the objective of being among the world's top 5 in renewable energies.
***
About Total
Total is a broad energy company that produces and markets fuels, natural gas and electricity. Our 100,000 employees are committed to better energy that is more affordable, more reliable, cleaner and accessible to as many people as possible. Active in more than 130 countries, our ambition is to become the responsible energy major.
Total Contacts
Media Relations: +33 1 47 44 46 99 l [email protected] l @TotalPress
Investor Relations: +44 (0)207 719 7962 l [email protected]
Cautionary Note
This press release, from which no legal consequences may be drawn, is for information purposes only. The entities in which TOTAL SE directly or indirectly owns investments are separate legal entities. TOTAL SE has no liability for their acts or omissions. In this document, the terms “Total”, “Total Group” and Group are sometimes used for convenience. Likewise, the words “we”, “us” and “our” may also be used to refer to subsidiaries in general or to those who work for them. This document may contain forward-looking information and statements that are based on a number of economic data and assumptions made in a given economic, competitive and regulatory environment. They may prove to be inaccurate in the future and are subject to a number of risk factors. Neither TOTAL SE nor any of its subsidiaries assumes any obligation to update publicly any forward-looking information or statement, objectives or trends contained in this document whether as a result of new information, future events or otherwise.
Serious News for Serious Traders! Try StreetInsider.com Premium Free!
You May Also Be Interested In
- Merck Announces First-Quarter 2024 Financial Results
- Textron Reports First Quarter 2024 Results
- ALLETE Board of Directors declares dividend on common stock
Create E-mail Alert Related Categories
SEC FilingsSign up for StreetInsider Free!
Receive full access to all new and archived articles, unlimited portfolio tracking, e-mail alerts, custom newswires and RSS feeds - and more!
