

Form 6-K TEXTAINER GROUP HOLDINGS For: Apr 23
 Tweet
Tweet Share
Share
UNITED STATES
SECURITIES AND EXCHANGE COMMISSION
Washington, D.C. 20549
FORM 6-K
REPORT OF FOREIGN PRIVATE ISSUER
PURSUANT TO RULE 13a-16 OR 15d-16
UNDER THE SECURITIES EXCHANGE ACT OF 1934
April 23, 2018
Commission File Number 001-33725
Textainer Group Holdings Limited
(Translation of registrant’s name into English)
Century House
16 Par-La-Ville Road
Hamilton HM 08
Bermuda
(441) 296-2500
(Address of principal executive office)
Indicate by check mark whether the registrant files or will file annual reports under cover of Form 20-F or Form 40-F.
Form 20-F ☒ Form 40-F ☐
Indicate by check mark if the registrant is submitting the Form 6-K in paper as permitted by Regulation S-T Rule 101(b)(1): ☐
Indicate by check mark if the registrant is submitting the Form 6-K in paper as permitted by Regulation S-T Rule 101(b)(7): ☐
Indicate by check mark whether the registrant by furnishing the information contained in this Form is also thereby furnishing the information to the Commission pursuant to Rule 12g3-2(b) under the Securities Exchange Act of 1934. Yes ☐ No ☒
If “Yes” is marked, indicate below the file number assigned to the registrant in connection with Rule 12g3-2(b): Not applicable
Indicate by check mark whether the registrant is an emerging growth company as defined in Rule 405 of the Securities Act of 1933 (17 CFR §230.405) or Rule 12b-2 of the Securities Exchange Act of 1934 (17 CFR §240.12b-2). Emerging growth company ☐
If an emerging growth company, indicate by check mark if the registrant has elected not to use the extended transition period for complying with any new or revised financial accounting standards provided pursuant to Section 13(a) of the Exchange Act. ☐
On or about April 23, 2018, Textainer Group Holdings Limited (the “Company”) caused copies of the following documents to be mailed to the Company’s shareholders of record: (1) the Company’s 2017 Annual Report to Shareholders and (2) the Company’s Notice of 2018 Annual General Meeting of Shareholders to be held on May 23, 2018, together with the accompanying Proxy Statement and accompanying Form of Proxy Card.
The Company’s 2017 Annual Report to Shareholders includes the Company’s financial highlights, letter to shareholders and Annual Report on Form 20-F for the fiscal year ended December 31, 2017. The following documents, filed as exhibits to this Form 6-K, are incorporated by reference as part of this Form 6-K:
SIGNATURE
Pursuant to the requirements of the Securities Exchange Act of 1934, the registrant has duly caused this report to be signed on its behalf by the undersigned, thereunto duly authorized.
Date: April 23, 2018
| Textainer Group Holdings Limited |
| /s/ PHILIP K. BREWER |
| Philip K. Brewer |
| President and Chief Executive Officer |
EXHIBIT INDEX
| Exhibit Number |
Description of Document | |
| 99.1 | Textainer Group Holdings Limited 2017 Annual Report to Shareholders | |
| 99.2 | Textainer Group Holdings Limited Notice of 2018 Annual General Meeting of Shareholders to be Held May 23, 2018, Proxy Statement and Form of Proxy Card | |
Exhibit 99.1
FINANCIAL HIGHLIGHTS
(All figures in millions of U.S. dollars except for per share data and percentage calculations)
| 2017 | 2016 | 2015 | ||||||||||
| Consolidated Operating Results |
||||||||||||
| Total revenue (a) |
$ | 490.9 | $ | 496.2 | $ | 544.3 | ||||||
| Income from operations |
$ | 143.9 | $ | 26.2 | $ | 211.8 | ||||||
| Income (loss) before income tax and noncontrolling interests |
$ | 22.4 | $ | (61.3 | ) | $ | 120.7 | |||||
| Net income (loss) attributable to TGH Limited common shareholders |
$ | 19.4 | $ | (52.5 | ) | $ | 108.4 | |||||
| Basic net income (loss) per share |
$ | 0.34 | $ | (0.93 | ) | $ | 1.90 | |||||
| Diluted net income (loss) per share |
$ | 0.34 | $ | (0.93 | ) | $ | 1.90 | |||||
| Dividend per share |
$ | — | $ | 0.51 | $ | 1.65 | ||||||
| Return on average shareholders’ equity |
1.7 | % | -4.5 | % | 9.1 | % | ||||||
| Return on average assets (b) |
1.9 | % | -5.3 | % | 2.6 | % | ||||||
| Leverage ratio (c) |
247 | % | 256 | % | 237 | % | ||||||
| Consolidated Financial Position |
||||||||||||
| Total assets |
$ | 4,380.3 | $ | 4,294.0 | $ | 4,365.3 | ||||||
| Long-term debt (including current portion) |
$ | 2,990.3 | $ | 3,038.3 | $ | 3,003.6 | ||||||
| Total shareholders’ equity (exclude noncontrolling interest) |
$ | 1,152.5 | $ | 1,125.9 | $ | 1,201.6 | ||||||
| Total shareholders’ equity per share |
$ | 20.19 | $ | 19.83 | $ | 21.26 | ||||||
Additional information is available on the investor relations website – http://investor.textainer.com/
Notes:
| (a) | Does not include leasing revenue for containers managed but not owned by Textainer. |
| (b) | Includes noncontrolling interest. |
| (c) | Equity includes noncontrolling interest. |
| (d) | Leasing revenue and net operating income includes all managed containers, including containers not owned by Textainer. |

To Our Shareholders:
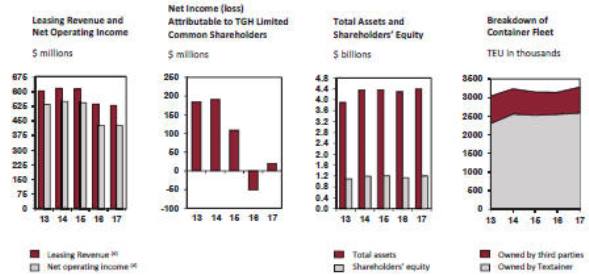
As we noted in this letter last year, container leasing is a cyclical business. Textainer has been leasing containers since 1979 to shipping lines throughout the world. Over that time, we have successfully navigated both strong and weak markets. During the last year, we have seen a strengthening of the positive market conditions that emerged in the fourth quarter of 2016. Each quarter of 2017 our performance improved. We returned to profitability and purchased over 300,000 TEU which have already been leased out on excellent terms.
We entered 2017 with new and used container prices, lease-out demand, and new and depot container lease rates at levels that were significantly higher than those that prevailed prior to Hanjin Shipping Co.’s bankruptcy in August 2016 (Hanjin). And these rates further improved during the year. Additionally, last year we saw solid growth in container trade, a trend that has continued into 2018. Building on these positive trends and our focus on operational discipline and prudent investment policy, we expect continued improvement in our financial performance during 2018.
Year in Review
Container leasing market conditions at the start of 2017 were very favorable. New container prices had increased almost $1000 over the lowest prices of 2016. Disposal container prices also improved greatly from 2016’s lows and climbed a further 70% by year-end. These higher new and used container prices, coupled with limited depot container inventories, caused lease rates to reach levels that were more than double those prevailing in 2016. Although these rates moderated towards the end of the year, they remain at attractive levels which support new investment. Of equal importance, recent lease agreements require a high percentage of containers to be returned in China and other locations in Asia where we anticipate there will be demand.
The strong market conditions last year resulted in higher utilization, increased lease-outs of depot containers, reduced downward pressure on the repricing of maturing term leases and increased gains on sales of used containers. Lease rental income increased each quarter of the year. We were not profitable during the first half of the year because of the ongoing costs of recovering, repairing and repositioning containers from Hanjin, the loss of revenue from these units, the costs of restructuring and refinancing debt facilities to address covenant issues, and ongoing but declining container impairments. We returned to profitability in the second half of 2017 due to continued lease revenue growth, further increases in utilization, reduced costs related to Hanjin, gains from disposal container sales and the elimination of material container impairments. We also invested heavily in new containers during the second half of the year, ending 2017 as the second largest investor among container lessors.
Container trade grew approximately 5.5% in 2017, 1.7 times the rate of growth in global GDP. During 2016, container trade growth lagged global GDP growth, making the increase during 2017 even more impressive. In addition to benefiting container lessors, the growth in container trade resulted in most shipping lines experiencing dramatic improvements in their performance. They also benefited from continued consolidation, increased operating efficiencies, lower fuel prices and higher freight rates. Notwithstanding their improved financial results, shipping lines generally preferred to lease instead of buy containers. More than 60% of new container production in 2017 was purchased by lessors.
TEXTAINER GROUP HOLDINGS LIMITED 2017 ANNUAL REPORT | 1
TO OUR SHAREHOLDERS (continued)
New container rental rates peaked in the first half of the year as a limited number of lessors purchased containers. While rates have declined somewhat since then, they remain among the highest levels we have experienced since 2012, supported by strong demand, low depot container inventories, moderate interest rate increases and stable new container prices. Depot container rental rates also rose significantly last year and are currently double the lowest levels for new containers in 2016.
New container prices were very stable during 2017, generally $2200 +/- $50 per CEU, a significant change from the preceding years when wide price fluctuations occurred. The container manufacturers, in the face of increases in iron ore and steel prices and increased costs resulting from the use of waterborne paint, became more disciplined in their approach to production and pricing. Approximately 3.5 million TEU were built in 2017, a significant increase from the 2 million produced in 2016 and only the third time since 2009 that more than three million TEU were produced. With strong trade growth and minimal depot inventories, new production was the primary source of containers to satisfy demand.
Prices for used containers increased in tandem with the increases in new container prices. The used container price increase was due not just to higher new container prices but also to the limited inventory of sales containers as a result of high utilization and reduced returns of on-lease containers. Higher used container prices reversed the significant container impairments of 2016 and resulted in over $26 million in gains on sale last year. These gains arose even though we sold fewer containers in 2017, than in the previous year.
Increased used container prices led us to change our residual values at the start of the third quarter of 2017. We increased the residual value for 20’ standard, 40’ standard, and 40’ high cube containers from $950, $1,150, and $1,300 to $1,000, $1,200, and $1,350, respectively. These changes resulted in an ongoing decrease in quarterly depreciation expense of $3.6 million.
We invested $625 million to purchase more than 300,000 TEU of new and used containers in 2017, the second most of any container lessor. 94% of our investments were for our own fleet. We also assumed the management of 182,000 TEU of dry freight and refrigerated containers from Magellan Maritime Services GmbH. At year-end, our fleet totaled 3.3 million TEU. We own 79% of our fleet.
Utilization increased during the year from 94.2% at the beginning of the year to 97.7% at year-end. Utilization has subsequently increased and is currently 97.9%.
Our adjusted net income for the year was $23.2 million, or $0.41 per diluted common share, a substantial turnaround from the $58.0 million adjusted loss in 2016.
We continue to maintain a strong balance sheet. During 2017, we completed $2.7 billion in debt financings, including raising new funds and refinancing existing facilities. In several facilities we were able to improve pricing and increase our advance rate. We finished the year with approximately $900 million of available liquidity. Our debt-to-equity ratio at 2.4:1 remains the lowest among our publicly listed peers.
Outlook
Global GDP is expected to grow 3.9% in 2018. Global trade grew 1.7 times the growth of global GDP during 2017. Even if the multiplier declines from this level, the projections for container trade growth of 5-6% in 2018 appear realistic. We continue to see strong demand for new and depot containers from our shipping line customers. Additionally, due to high utilization and low depot inventory, shipping lines have reduced returns of on-lease containers.
TEXTAINER GROUP HOLDINGS LIMITED 2017 ANNUAL REPORT | 2
TO OUR SHAREHOLDERS (continued)
We expect container production in 2018 to be similar to the 3.5 million TEU produced last year. Due to the similar conditions that led to higher prices in 2017 - increases in component costs, a strengthening Renminbi and increased discipline among manufacturers - we expect new container prices to remain in the range of $2150-2250. The rate of increase in used container prices has moderated recently. Given the level of new container prices, high utilization and limited depot supply we expect used container prices to remain around their current levels. Factory inventory currently is around 700,000 TEU, of which approximately 66% TEU belongs to lessors, much of which is already committed to lease. With all lessors enjoying high utilization and low depot inventories, there is no surplus of containers and the market can support another year of strong container production.
Rental rates remain at levels that provide attractive returns and are two or more times the lows of 2016. Perhaps more importantly, new container rental rates are above both our fleetwide average rate and the average rate of term leases maturing this year. This provides the opportunity to increase revenue from containers subject to maturing term leases. Since the average rental rate on our maturing leases declines each year going forward to a low of $0.37 in 2021, we expect to benefit from upwards repricing for several years. Furthermore, the full impact of higher new container rental rates will grow over time as containers reprice and new containers are put on lease.
Most major shipping lines saw improved financial performance in 2017 as industry profitability exceeded $7 billion. This improved performance should continue into 2018 as shipping lines continue to consolidate and the three major alliances improve their operating efficiency. The critical question, as in every year, is what will happen to freight rates? Deliveries of new ships combined with limited scrapping are expected to result in containership capacity growth exceeding demand growth both this year and next. Freight rates weakened during the fourth quarter of 2017 and the start of 2018 while vessel utilization declined and fuel costs remained elevated. Several lines have plans to increase freight rates but excess vessel capacity may undermine these efforts.
We expect the positive trends benefitting container lessors to continue this year. The outlook for container trade is positive and container prices seem likely to remain at their current level or increase. While current rental rates provide attractive returns on equity, higher interest rates, competition among lessors and the increased supply of capital to our industry will impact lease rates and could negatively affect the performance of all container lessors. Serious trade disputes, were they to arise, could have a similar impact. Nonetheless, we expect our financial results to improve as we move through 2018.
As noted at the beginning of this letter, our industry is and always has been cyclical. We have been in business for almost 40 years and have successfully managed through many business cycles. We are extremely gratified by our performance in 2017 after a very challenging 2016 and look forward to continued growth and improved results this year.
TEXTAINER GROUP HOLDINGS LIMITED 2017 ANNUAL REPORT | 3
TO OUR SHAREHOLDERS (continued)
To our shareholders, customers, suppliers and employees, thank you for your trust in and support of Textainer. You are the reason we are here.

|

| |||
| Hyman Shwiel CHAIRMAN OF THE BOARD |
Philip K. Brewer PRESIDENT AND CHIEF EXECUTIVE OFFICER | |||
This Annual Report contains forward-looking statements within the meaning of U.S. securities laws. Forward-looking statements include statements that are not statements of historical facts and include, without limitation, statements regarding our belief that our financial performance will continue to improve during 2018, that China and other locations in Asia will continue as high demand locations for containers, that global GDP will grow 3.8% in 2018 and trade growth may be 5-6% in 2018, our expectation that container production in 2018 will be similar to the 3.5 million TEU in 2017, our expectations that new container prices will range between $2150 and $2250 in 2018, our belief that used container prices will remain near their current level in 2018, our expectation of benefits from increases in rental rates on expiring leases in future years and our expectation that this benefit will increase over time, our expectation that shipping line improved profitability will continue in 2018, and our expectation that positive trends for container lessors will continue in 2018. Readers are cautioned that these forward-looking statements involve risks and uncertainties, are only predictions and may differ materially from actual future events or results. For a discussion of such risks and uncertainties, see Item 3, “Key Information—Risk Factors” in Textainer’s Annual Report on Form 20-F filed with the Securities and Exchange Commission on March 14, 2018.
Textainer’s views, estimates, plans and outlook as described within this Annual Report may change subsequent to the release of this Annual Report, Textainer is under no obligation to modify or update any or all the statements it has made herein despite any subsequent changes Textainer may make in its views, estimates, plans or outlook for the future.
This Annual Report contains market data and industry forecasts that were obtained from industry publications, third-party market research and publicly available information. These publications generally state that the information contained therein has been obtained from sources believed to be reliable, but the accuracy and completeness of such information is not guaranteed.
TEXTAINER GROUP HOLDINGS LIMITED 2017 ANNUAL REPORT | 4
UNITED STATES
SECURITIES AND EXCHANGE COMMISSION
Washington, D.C. 20549
FORM 20-F
| ☐ | REGISTRATION STATEMENT PURSUANT TO SECTION 12(b) OR (g) OF THE SECURITIES EXCHANGE ACT OF 1934 |
OR
| ☒ | ANNUAL REPORT PURSUANT TO SECTION 13 OR 15(d) OF THE SECURITIES EXCHANGE ACT OF 1934 |
For the fiscal year ended December 31, 2017
OR
| ☐ | TRANSITION REPORT PURSUANT TO SECTION 13 OR 15(d) OF THE SECURITIES EXCHANGE ACT OF 1934 |
OR
| ☐ | SHELL COMPANY REPORT PURSUANT TO SECTION 13 OR 15(d) OF THE SECURITIES EXCHANGE ACT OF 1934 |
Date of event requiring this shell company report
For the transition period from to
Commission file number 001-33725
Textainer Group Holdings Limited
(Exact name of Registrant as specified in its charter)
Not Applicable
(Translation of Registrant’s name into English)
Bermuda
(Jurisdiction of incorporation or organization)
Century House
16 Par-La-Ville Road
Hamilton HM 08
Bermuda
(Address of principal executive offices)
Michael J. Harvey
Textainer Group Holdings Limited
Century House
16 Par-La-Ville Road
Hamilton HM 08
Bermuda
(441) 296-2500
(Name, Telephone, E-mail and/or Facsimile number and Address of Company Contact Person)
Securities registered or to be registered pursuant to Section 12(b) of the Act.
|
Title of each class |
Name of each exchange on which registered | |
| Common Shares, $0.01 par value | New York Stock Exchange |
Securities registered or to be registered pursuant to Section 12(g) of the Act.
None
(Title of Class)
Securities for which there is a reporting obligation pursuant to Section 15(d) of the Act.
None
(Title of Class)
Indicate the number of outstanding shares of each of the issuer’s classes of capital or common stock as of the close of the period covered by the annual report.
57,097,220 Common Shares
Indicate by check mark if the registrant is a well-known seasoned issuer, as defined in Rule 405 of the Securities Act. Yes ☐ No ☒
If this report is an annual or transition report, indicate by check mark if the registrant is not required to file reports pursuant to Section 13 or 15(d) of the Securities Exchange Act of 1934. Yes ☐ No ☒
Indicate by check mark whether the registrant (1) has filed all reports required to be filed by Section 13 or 15(d) of the Securities Exchange Act of 1934 during the preceding 12 months (or for such shorter period that the registrant was required to file such reports), and (2) has been subject to such filing requirements for the past 90 days. Yes ☒ No ☐
Indicate by check mark whether the registrant has submitted electronically and posted on its corporate Web site, if any, every Interactive Data File required to be submitted and posted pursuant to Rule 405 of Regulation S-T (§232.405 of this chapter) during the preceding 12 months (or for such shorter period that the registrant was required to submit and post such files). Yes ☒ No ☐
Indicate by check mark whether the registrant is a large accelerated filer, an accelerated filer, or a non-accelerated filer, or an emerging growth company. See definitions of “accelerated filer”, “large accelerated filer” and “emerging growth company” in Rule 12b-2 of the Exchange Act. (Check one):
Large accelerated filer ☐ Accelerated filer ☒ Non-accelerated filer ☐ Emerging growth company ☐
If an emerging growth company, indicate by check mark if the registrant has elected not to use the extended transition period for complying with any new or revised financial accounting standards provided pursuant to Section 13(a) of the Exchange Act. ☐
Indicate by check mark which basis of accounting the registrant has used to prepare the financial statements included in this filing:
| U.S. GAAP ☒ |
International Financial Reporting Standards as issued by the International Accounting Standards Board ☐ |
Other ☐ |
If “Other” has been checked in response to the previous question, indicate by check mark which financial statement item the registrant has elected to follow. Item 17 ☐ Item 18 ☐
If this is an annual report, indicate by check mark whether the registrant is a shell company (as defined in Rule 12b-2 of the Exchange Act). Yes ☐ No ☒
TABLE OF CONTENTS
In this Annual Report on Form 20-F, unless indicated otherwise, references to: (1) “Textainer,” “TGH,” “the Company,” “we,” “us” and “our” refer, as the context requires, to Textainer Group Holdings Limited, which is the registrant and the issuer of the class of common shares that has been registered pursuant to Section 12(b) of the Securities Exchange Act of 1934, as amended, or Textainer Group Holdings Limited and its subsidiaries; (2) “TEU” refers to a “Twenty-Foot Equivalent Unit,” which is a unit of measurement used in the container shipping industry to compare shipping containers of various lengths to a standard 20’ dry freight container, thus a 20’ container is one TEU and a 40’ container is two TEU; (3) “CEU” refers to a Cost Equivalent Unit, which is a unit of measurement based on the approximate cost of a container relative to the cost of a standard 20’ dry freight container, so the cost of a standard 20’ dry freight container is one CEU; the cost of a 40’ dry freight container is 1.6 CEU; the cost of a 40’ high cube dry freight container (9’6” high) is 1.7 CEU; and the cost of a 40’ high cube refrigerated container is 8.0 CEU; (4) “our owned fleet” means the containers we own; (5) “our managed fleet” means the containers we manage that are owned by other container investors; (6) “our fleet” and “our total fleet” mean our owned fleet plus our managed fleet plus any containers we lease from other lessors; (7) “container investors” means the owners of the containers in our managed fleet; and (8) “Trencor” refers to Trencor Ltd., a public South African investment holding company, listed on the JSE Limited in Johannesburg, South Africa, which, indirectly owns approximately 47.8% of our common shares (such interest, “beneficiary interest”) through its wholly-owned subsidiary. See Item 4, “Information on the Company” for an explanation of the relationship between Trencor and us.
Dollar amounts in this Annual Report on Form 20-F are expressed in thousands, unless otherwise indicated.
INFORMATION REGARDING FORWARD-LOOKING STATEMENTS; CAUTIONARY LANGUAGE
This Annual Report on Form 20-F, including the sections entitled Item 3, “Key Information — Risk Factors,” and Item 5, “Operating and Financial Review and Prospects,” contains forward-looking statements within the “safe harbor” provisions of the U.S. Private Securities Litigation Reform Act of 1995. Forward-looking statements include all statements that are not statements of historical facts and may relate to, but are not limited to, expectations or estimates of future operating results or financial performance, capital expenditures, introduction of new products, regulatory compliance, plans for growth and future operations, as well as assumptions relating to the foregoing. In some cases, you can identify forward-looking statements by terminology such as “may,” “will,” “should,” “could,” “expect,” “plan,” “anticipate,” “believe,” “estimate,” “predict,” “intend,” “potential,” “continue” or the negative of these terms or other similar terminology. Forward-looking statements include, among others, statements regarding: (i) our expectation that the favorable market conditions driven by solid trade growth, shipping lines preference to lease and minimal depot inventory to continue into 2018; (ii) our belief that the container trade grows at an even faster rate than the around 4% 2018 forecasted GDP; (iii) our expectation that new container prices to remain stable given the recent increase in steel prices and ongoing demand; (iv) our expectation that resale prices to remain high given the level of new container prices and the limited supply of containers placed on sale as a result of near full utilization; and (v) our expectation that new lease returns to remain at attractive levels assuming disciplined ordering by lessors and shipping lines .
Although we do not make forward-looking statements unless we believe we have a reasonable basis for doing so, we cannot guarantee their accuracy, and actual results may differ materially from those we anticipated due to a number of uncertainties, many of which cannot be foreseen. Our actual results could differ materially from those anticipated in these forward-looking statements for many reasons, including, among others, the risks we face that are described in the section entitled Item 3, “Key Information — Risk Factors” and elsewhere in this Annual Report on Form 20-F.
We believe that it is important to communicate our future expectations to potential investors, shareholders and other readers. However, there may be events in the future that we are not able to accurately predict or control and that may cause actual events or results to differ materially from the expectations expressed in or implied by our forward-looking statements. The risk factors listed in Item 3, “Key Information — Risk Factors,” as well as any cautionary language in this Annual Report on Form 20-F, provide examples of risks, uncertainties and events that may cause our actual results to differ materially from the expectations we describe in our forward-looking statements. Before you decide to buy, hold or sell our common shares, you should be aware that the occurrence of the events described in Item 3, “Key Information — Risk Factors” and elsewhere in this Annual Report on Form 20-F could negatively impact our business, cash flows, results of operations, financial condition and share price. Potential investors, shareholders and other readers should not place undue reliance on our forward-looking statements.
Forward-looking statements regarding our present plans or expectations involve risks and uncertainties relative to return expectations and related allocation of resources, and changing economic or competitive conditions which could cause actual results to differ from present plans or expectations, and such differences could be material. Similarly, forward-looking statements regarding our present expectations for operating results and cash flow involve risks and uncertainties related to factors such as utilization rates, per diem rates, container prices, demand for containers by container shipping lines, supply and other factors discussed under Item 3, “Key Information — Risk Factors” or elsewhere in this Annual Report on Form 20-F, which could also cause actual results to differ from present plans. Such differences could be material.
All future written and oral forward-looking statements attributable to us or any person acting on our behalf are expressly qualified in their entirety by the cautionary statements contained or referred to in this section. New risks and uncertainties arise from time to time, and we cannot predict those events or how they may affect us. We assume no obligation to, and do not plan to, update any forward-looking statements after the date of this Annual Report on Form 20-F as a result of new information, future events or developments, except as required by federal securities laws. You should read this Annual Report on Form 20-F and the documents that we reference and have filed as exhibits with the understanding that we cannot guarantee future results, levels of activity, performance or achievements and that actual results may differ materially from what we expect.
Industry data and other statistical information used in this Annual Report on Form 20-F are based on independent publications, reports by market research firms or other published independent sources. Some data are also based on our good faith estimates, derived from our review of internal surveys and the independent sources listed above. Although we believe these sources are reliable, we have not independently verified the information.
1
In this Annual Report on Form 20-F, unless otherwise specified, all monetary amounts are in U.S. dollars. To the extent that any monetary amounts are not denominated in U.S. dollars, they have been translated into U.S. dollars in accordance with our accounting policies as described in Item 18, “Financial Statements” in this Annual Report on Form 20-F.
2
PART I
| ITEM 1. | IDENTITY OF DIRECTORS, SENIOR MANAGEMENT AND ADVISERS |
Not applicable.
| ITEM 2. | OFFER STATISTICS AND EXPECTED TIMETABLE |
Not applicable.
| ITEM 3. | KEY INFORMATION |
| A. | Selected Financial Data |
The selected financial data presented below under the heading “Statement of Income Data” for the years ended December 31, 2017, 2016 and 2015 and under the heading “Balance Sheet Data” as of December 31, 2017 and 2016 have been derived from our audited consolidated financial statements included in Item 18, “Financial Statements” in this Annual Report on Form 20-F. The selected financial data presented below under the heading “Statement of Income Data” for the years ended December 31, 2014 and 2013 and under the heading “Balance Sheet Data” as of December 31, 2015, 2014 and 2013 are audited and have been derived from our audited consolidated financial statements not included in this Annual Report on Form 20-F. The data presented below under the heading “Other Financial and Operating Data” have not been audited. Historical results are not necessarily indicative of the results of operations to be expected in future periods. You should read the selected consolidated financial data and operating data presented below in conjunction with Item 5, “Operating and Financial Review and Prospects” and with Item 18, “Financial Statements” in this Annual Report on Form 20-F.
| Fiscal Years Ended December 31, | ||||||||||||||||||||
| 2017 | 2016 (1) | 2015 | 2014 | 2013 | ||||||||||||||||
| (Dollars in thousands, except per share data) | ||||||||||||||||||||
| Statement of Income Data: |
||||||||||||||||||||
| Revenues: |
||||||||||||||||||||
| Lease rental income |
$ | 444,888 | $ | 460,427 | $ | 512,544 | $ | 506,538 | $ | 470,332 | ||||||||||
| Management fees |
14,994 | 13,420 | 15,610 | 17,408 | 19,921 | |||||||||||||||
| Trading container sales proceeds |
4,758 | 15,628 | 12,670 | 27,989 | 12,980 | |||||||||||||||
| Gain on sale of containers, net |
26,210 | 6,761 | 3,454 | 13,070 | 27,340 | |||||||||||||||
|
|
|
|
|
|
|
|
|
|
|
|||||||||||
| Total revenues |
490,850 | 496,236 | 544,278 | 565,005 | 530,573 | |||||||||||||||
|
|
|
|
|
|
|
|
|
|
|
|||||||||||
| Operating expenses: |
||||||||||||||||||||
| Direct container expense |
60,321 | 62,596 | 47,342 | 47,446 | 43,062 | |||||||||||||||
| Cost of trading containers sold |
3,302 | 15,904 | 12,475 | 27,465 | 11,910 | |||||||||||||||
| Depreciation expense |
231,043 | 236,144 | 191,930 | 164,209 | 140,414 | |||||||||||||||
| Container impairment |
8,072 | 94,623 | 35,345 | 13,108 | 8,891 | |||||||||||||||
| Amortization expense |
4,092 | 5,053 | 4,741 | 4,010 | 4,226 | |||||||||||||||
| General and administrative expense |
30,697 | 26,311 | 27,645 | 25,778 | 24,922 | |||||||||||||||
| Short-term incentive compensation expense |
3,481 | 2,242 | 913 | 4,075 | 1,779 | |||||||||||||||
| Long-term incentive compensation expense |
5,499 | 5,987 | 7,040 | 6,639 | 4,961 | |||||||||||||||
| Bad debt expense (recovery), net |
477 | 21,166 | 5,028 | (474 | ) | 8,084 | ||||||||||||||
|
|
|
|
|
|
|
|
|
|
|
|||||||||||
| Total operating expenses |
346,984 | 470,026 | 332,459 | 292,256 | 248,249 | |||||||||||||||
|
|
|
|
|
|
|
|
|
|
|
|||||||||||
| Income from operations |
143,866 | 26,210 | 211,819 | 272,749 | 282,324 | |||||||||||||||
|
|
|
|
|
|
|
|
|
|
|
|||||||||||
3
| Fiscal Years Ended December 31, | ||||||||||||||||||||
| 2017 | 2016 (1) | 2015 | 2014 | 2013 | ||||||||||||||||
| (Dollars in thousands, except per share data) | ||||||||||||||||||||
| Other (expense) income: |
||||||||||||||||||||
| Interest expense (2) |
(117,475 | ) | (85,215 | ) | (76,063 | ) | (79,117 | ) | (84,279 | ) | ||||||||||
| Write-off of unamortized deferred debt (2) costs and bond discounts |
(7,550 | ) | — | (458 | ) | (6,814 | ) | (895 | ) | |||||||||||
| Interest income |
613 | 408 | 125 | 119 | 122 | |||||||||||||||
| Realized losses on interest rate swaps, collars and caps, net |
(1,191 | ) | (8,928 | ) | (12,823 | ) | (10,293 | ) | (8,409 | ) | ||||||||||
| Unrealized gains (losses) on interest rate swaps, collars and caps, net |
4,094 | 6,210 | (1,947 | ) | 1,512 | 8,656 | ||||||||||||||
| Other, net |
3 | (8 | ) | 26 | 23 | (45 | ) | |||||||||||||
|
|
|
|
|
|
|
|
|
|
|
|||||||||||
| Net other expense |
(121,506 | ) | (87,533 | ) | (91,140 | ) | (94,570 | ) | (84,850 | ) | ||||||||||
|
|
|
|
|
|
|
|
|
|
|
|||||||||||
| Income (loss) before income tax and noncontrolling interest |
22,360 | (61,323 | ) | 120,679 | 178,179 | 197,474 | ||||||||||||||
| Income tax benefit (expense) |
(1,618 | ) | 3,447 | (6,695 | ) | 18,068 | (6,831 | ) | ||||||||||||
|
|
|
|
|
|
|
|
|
|
|
|||||||||||
| Net income (loss) |
20,742 | (57,876 | ) | 113,984 | 196,247 | 190,643 | ||||||||||||||
| Less: Net (income) loss attributable to the noncontrolling interests |
(1,377 | ) | 5,393 | (5,576 | ) | (5,692 | ) | (6,565 | ) | |||||||||||
|
|
|
|
|
|
|
|
|
|
|
|||||||||||
| Net income (loss) attributable to Textainer Group Holdings Limited common shareholders |
$ | 19,365 | $ | (52,483 | ) | $ | 108,408 | $ | 190,555 | $ | 184,078 | |||||||||
|
|
|
|
|
|
|
|
|
|
|
|||||||||||
| Net income (loss) attributable to Textainer Group Holdings Limited common shareholders per share: |
||||||||||||||||||||
| Basic |
$ | 0.34 | $ | (0.93 | ) | $ | 1.90 | $ | 3.36 | $ | 3.27 | |||||||||
| Diluted |
$ | 0.34 | $ | (0.93 | ) | $ | 1.90 | $ | 3.34 | $ | 3.24 | |||||||||
| Weighted average shares outstanding (in thousands): |
||||||||||||||||||||
| Basic |
56,845 | 56,608 | 56,953 | 56,719 | 56,317 | |||||||||||||||
| Diluted |
57,159 | 56,608 | 57,093 | 57,079 | 56,862 | |||||||||||||||
| Other Financial and Operating Data (unaudited): |
||||||||||||||||||||
| Cash dividends declared per common share |
$ | — | $ | 0.51 | $ | 1.65 | $ | 1.88 | $ | 1.85 | ||||||||||
| Purchase of containers and fixed assets |
$ | 300,125 | $ | 505,528 | $ | 533,306 | $ | 818,451 | $ | 765,418 | ||||||||||
| Utilization rate (3) |
96.40 | % | 94.70 | % | 96.80 | % | 96.10 | % | 94.90 | % | ||||||||||
| Total fleet in TEU (as of the end of the period) |
3,279,892 | 3,142,556 | 3,147,690 | 3,233,364 | 3,040,454 | |||||||||||||||
| Balance Sheet Data (as of the end of the period): |
||||||||||||||||||||
| Cash and cash equivalents |
$ | 137,894 | $ | 84,045 | $ | 115,594 | $ | 107,067 | $ | 120,223 | ||||||||||
| Containers, net |
3,791,610 | 3,717,542 | 3,696,311 | 3,635,314 | 3,244,956 | |||||||||||||||
| Net investment in direct financing and sales-type leases (current and long-term) |
182,624 | 237,234 | 331,792 | 361,010 | 266,540 | |||||||||||||||
| Total assets |
4,380,342 | 4,294,026 | 4,365,312 | 4,334,748 | 3,879,193 | |||||||||||||||
| Long-term debt (including current portion) |
2,990,308 | 3,038,297 | 3,003,648 | 2,974,311 | 2,641,250 | |||||||||||||||
| Total liabilities |
3,170,060 | 3,109,241 | 3,099,427 | 3,084,946 | 2,737,455 | |||||||||||||||
| Total Textainer Group Holdings Limited shareholders’ equity |
1,152,542 | 1,125,926 | 1,201,633 | 1,189,982 | 1,094,067 | |||||||||||||||
| Noncontrolling interest |
57,740 | 58,859 | 64,252 | 59,820 | 47,671 | |||||||||||||||
| (1) | Certain previously reported information has been revised for the effect of immaterial corrections of identified errors pertaining to the calculation of gain on sale of containers, net and to properly account for lease concessions. See Note 2 “Immaterial Correction of Errors in Prior Periods” to our consolidated financial statements in Item 18, “Financial Statements” in this Annual Report on Form 20-F. |
4
| (2) | Amount for years ended 2013 to 2016 has been restated to reclassify the write-off of unamortized deferred debt costs and bond discounts out of interest expense to conform with the 2017 presentation. |
| (3) | We measure the utilization rate on the basis of CEU on lease, using the actual number of days on-hire, expressed as a percentage of CEU available for lease, using the actual days available for lease. CEU available for lease excludes CEU that have been manufactured for us but have not been delivered yet to a lessee and CEU designated as held-for-sale units. |
| B. | Capitalization and Indebtedness |
Not applicable.
| C. | Reasons for the Offer and Use of Proceeds |
Not applicable.
| D. | Risk Factors |
An investment in our common shares involves a high degree of risk. You should carefully consider the following risk factors, together with the other information contained elsewhere in this Annual Report on Form 20-F, including our financial statements and the related notes thereto, before you decide to buy, hold or sell our common shares. Any of the risk factors we describe below could adversely affect our business, cash flows, results of operations and financial condition. The market price of our common shares could decline and you may lose some or all of your investment if one or more of these risks and uncertainties develop into actual events.
Risks Related to Our Business and Industry
The demand and pricing for leased containers depends on many factors beyond our control.
Substantially all of our revenue derives from activities related to the leasing, managing and selling of containers. Our ability to continue successfully leasing containers to container shipping lines, earning management fees on leased containers, selling used containers and sourcing capital required to purchase new and used containers depends, in part, upon the continued demand to lease new and used and purchase used containers.
Demand for leased containers depends largely on the rate of growth of world trade and economic growth, with worldwide consumer demand being the most critical factor affecting this growth. Demand for leased containers is also driven by our customers’ “lease vs. buy” decisions. In the past economic downturns in the U.S., Europe, Asia and countries with consumer-oriented economies have resulted in a reduction in the rate of growth of world trade and demand by container shipping lines for leased containers and it is likely that any future downturns would have similar results. Thus, a decrease in world trade can and has adversely affected our utilization and per diem rates and lead to reduced revenue and increased operating expenses (such as storage and repositioning costs), and can have an adverse effect on our financial performance. We cannot predict whether, or when, such downturns will occur. Other material factors affecting demand for leased containers, utilization and per diem rates include the following:
| • | prices of new and used containers; |
| • | economic conditions, profitability, competitive pressures and consolidation in the container shipping and container leasing industry; |
| • | shifting trends and patterns of cargo traffic; |
| • | fluctuations in demand for containerized goods outside their area of production; |
5
| • | the availability and terms of container financing for us and for our competitors and customers; |
| • | fluctuations in interest rates and currency exchange rates; |
| • | overcapacity, undercapacity and consolidation of container manufacturers; |
| • | the lead times required to purchase containers; |
| • | the number of containers purchased in the current year and prior years by competitors and container lessees; |
| • | container ship fleet overcapacity or undercapacity; |
| • | repositioning by container shipping lines of their own empty containers to higher demand locations in lieu of leasing containers; |
| • | port congestion and the efficient movement of containers as affected by labor disputes, work stoppages, increased vessel size, shipping line alliances or other factors that reduce or increase the speed at which containers are handled; |
| • | consolidation, withdrawal or insolvency of individual container shipping lines, such as the bankruptcy of Hanjin Shipping Co. in August 2016 which is discussed below; |
| • | import/export tariffs and restrictions; |
| • | customs procedures, foreign exchange controls and other governmental regulations; |
| • | natural disasters that are severe enough to affect local and global economies or interfere with trade, such as the 2011 earthquake and tsunami in Japan; and |
| • | other political and economic factors. |
Many of these and other factors affecting the container industry are inherently unpredictable and beyond our control. These factors will vary over time, often quickly and unpredictably, and any change in one or more of these factors may have a material adverse effect on our business and results of operations. In addition, many of these factors also influence the decision by container shipping lines to lease or buy containers. Should one or more of these factors influence container shipping lines to buy a larger percentage of the containers they operate, our utilization rate and/or per diems could decrease, resulting in decreased revenue and increased storage and repositioning costs, which would harm our business, results of operations and financial condition.
The bankruptcy of Hanjin Shipping Co. in August 2016 substantially impacted us.
On August 31, 2016 Hanjin’s filed for bankruptcy protection in South Korea. In the following months its services ceased operation. The insolvency of Hanjin severely disrupted container trade and the container shipping industry. At the time of the insolvency, containers leased to Hanjin with ownership interests attributable to Textainer represented approximately 4.8% of the total owned and managed fleet in TEU. We incurred substantial costs from the Hanjin insolvency, arising from container recovery expenses, unpaid current and future rental income from Hanjin, container repair expenses, container repositioning expenses, re-leasing expenses and the loss of unreturned containers. Additionally, many containers formerly leased to Hanjin were re-leased at substantially lower lease rates than the rates in the leases with Hanjin and other containers were disposed, often at prices below the book value for the containers. We have recovered 93% of the containers formerly leased to Hanjin, with the balance of the containers uneconomic or impossible to recover. We maintain insurance that covers certain costs and losses from customer defaults. At the time of the Hanjin default our policy provided for $80 million of coverage after a $5 million deductible was met. We have collected $50 million of our insurance claim and are working with our insurance companies to finalize the remaining payout amount up to our $80 million coverage limit However even if we receive the full amount of our insurance, it will be insufficient to cover all of our losses and disruptions related to Hanjin. At the time of its insolvency Hanjin was the 7th largest container shipping line in the world and the bankruptcy of Hanjin substantially impacted us, including as follows:
| • | A material portion of the losses we reported for 2016 were attributable to Hanjin’s default and the expenses caused by the default and these expenses related to the default continued in 2017 and were not fully covered by insurance; |
6
| • | As a result of the Hanjin default, lower container lease rates and lower used container sales prices, our cash flow was substantially reduced in the second half of 2016 and the first half of 2017 and this impacted our ability to comply with financial covenants in certain debt facilities and to invest in new containers in 2016 and the first half of 2017; we obtained waivers and amendments from lenders to address these issues and subsequently refinanced the majority of our debt; |
| • | We established an insurance receivable in anticipation of the receipt of insurance proceeds to cover certain Hanjin related losses; however, there can be no assurance that the insurers will pay our claim in full or without dispute; additionally, our insurance is insufficient to cover all the Hanjin related losses and disruptions; |
| • | Customer default insurance may not be available in the future to us or may not be affordable; we have renewed our insurance twice after the Hanjin default; however, the policy and coverage terms are not as favorable as before the Hanjin default and the premium has substantially increased; and |
| • | The Hanjin bankruptcy has led to further consolidation in the shipping line industry, increasing our reliance on a limited number of customers; as a result of the Hanjin default shippers have heightened concern about the shipping line that carries their cargo and this may impact the container shipping industry in ways we are unable to anticipate and which may adversely impact us. |
Global economic weakness has in the past and may in the future materially and negatively impact our business, results of operations, cash flows, financial condition and future prospects.
While domestic and global economic growth resumed and has continued following the global financial crisis in 2008 and 2009, the continued sustainability of the US and international growth is uncertain. Any slowdown or reversal of the US and global economic recoveries and trade growth could heighten a number of material risks to our business, results of operations, cash flows and financial condition, as well as our future prospects, including the following:
| • | Containerized cargo volume growth — A contraction or slowdown in containerized cargo volume growth would likely create lower utilization, higher direct costs, weaker shipping lines going out of business, pressure for us to offer lease concessions and lead to a reduction in the size of our customers’ container fleets. |
| • | Credit availability and access to equity markets — Issues involving liquidity and capital adequacy affecting lenders could affect our ability to fully access our credit facilities or obtain additional debt and could affect the ability of our lenders to meet their funding requirements when we need to borrow. Further, a high level of volatility in the equity markets could make it difficult for us to access the equity markets for additional capital at attractive prices, if at all. If we are unable to obtain credit or access the capital markets, our business could be negatively impacted. In several of the years prior to 2017 the returns provided from lease transactions were lower due to increased competition in part caused by increased debt financing access for the container leasing industry. At the end of 2016, lower container returns coupled with the impact of Hanjin’s bankruptcy and lower residual values impacted our ability to meet the financial covenants in our lending facilities, required covenant amendments and limited our ability to access funds for investment in additional new containers. |
Lease and/or utilization rates may decrease, which could adversely affect our business, results of operations and financial condition.
We compete mostly on the pricing and the availability of containers. Lease rates for our containers depend on a large number of factors, including the following:
| • | the supply of, and demand for, containers available; |
| • | the price of new containers (which is positively correlated with the price of steel); |
7
| • | the type and length of the lease; |
| • | interest rates and the availability of financing for leasing companies and shipping lines; |
| • | assumptions regarding residual value and future lease pricing; |
| • | the type and age of the container; |
| • | the location of the container being leased; |
| • | the quantity of containers available for lease by our competitors; and |
| • | lease rates offered by our competitors. |
Most of these factors are beyond our control. In particular the price of steel declined materially in 2015 and continued to decline in the beginning of 2016 and this was a significant factor in the decline in new container prices and lease rates at that time. New container prices and lease rates reached historically low levels in the beginning of 2016, but starting in the second half of 2016 and continuing during 2017 steel prices, container prices and lease rates all increased materially. In addition, lease rates can be negatively impacted by, among other things, the entrance of new leasing companies, overproduction of new containers by factories and the over-buying by shipping lines, leasing companies and tax-driven container investors. In 2012 and continuing in 2013 and 2014, container leasing companies, including us, raised substantial amounts of new funds in the debt and equity markets and were able to repeatedly refinance existing debt on ever more favorable terms. This increased availability and reduced cost of debt, which given a limited demand for containers, contributed to downward pressure on lease rates. The impact on us of the decline in lease rates that ended in the second half of 2016 has been more severe than past rate decreases due to the substantial growth in our owned fleet in the past few years and the relatively high prices paid for new containers in the period from 2010 to 2012 that were initially leased at historically high rates on leases that matured during this period of low lease rates. If future market lease rates again decrease or return to historically low levels, revenues generated by our fleet will be adversely affected, which will harm our business, results of operations, cash flows and financial condition.
We face risks associated with re-leasing containers after their initial long term lease.
We estimate the useful lives of our non-refrigerated containers other than open-top and flat-rack containers to be 13 to 14 years, open-top and flat-rack containers to be 14 to 16 years, refrigerated containers to be 12 years and tank containers to be 20 years. When we purchase newly produced containers, we typically lease them out under long-term leases with terms of three to five years at a lease rate that is correlated to the price paid for the container and prevailing interest rates. As containers leased under term leases are not leased out for their full economic life, we face risks associated with re-leasing containers after their initial long term lease at a rate that continues to provide a reasonable economic return based on the initial purchase price of the container. For leases that are currently expiring we might be re-leasing the containers at lower lease per diems as prevailing container lease rates have declined from the lease rates available three to five years ago when these containers were initially leased. If prevailing container lease rates decline significantly between the time a container is initially leased out and when its initial long term lease expires, or if overall demand for containers declines, we may be unable to earn a similar lease rate from the re-leasing of containers when their initial term leases expire which could materially adversely impact our results and financial performance. Additionally, for containers purchased new in 2015 and 2016, many of these containers are on long term leases with low per diems that are below current lease rates. Our ability to improve our financial performance depends in part on the ability to renew or re-lease these containers at the time of the expiration of their initial leases at higher rates than the per diems these containers were originally leased out. If container lease rates decline and we are unable to renew these leases at higher rates our financial results will be adversely impacted.
8
Gains and losses associated with the disposition or trading of used equipment may fluctuate and adversely affect our business, results of operations and financial condition.
We regularly sell used containers at the end of their useful lives in marine service or when we believe it maximizes the projected financial return, considering the location, sale price, cost of repair, possible repositioning expenses, earnings prospects and remaining useful life. The realized residual value of these containers affects our profitability. The volatility of the residual values of used containers may be significant. These values depend upon, among other factors, demand for used containers for secondary purposes, comparable new container costs, used container availability, condition and location of the containers, and market conditions. Most of these factors are outside of our control. Additionally, if shipping lines or our leasing company competitors determine to sell their used containers at a younger age than we believe to be the useful life of our equipment, our containers may be more difficult to sell or may sell for less than containers that were more recently manufactured.
Gains or losses on the disposition of used container equipment and the sales fees earned on the disposition of managed containers fluctuate and may be significant if we sell large quantities of used containers. In 2016, we incurred approximately $67 million of container impairments due to the fact that when we determined to dispose of containers their book value exceeded the fair market value. Low disposal prices and the high volume of containers being disposed of can cause an elevated level of container impairments to occur. Continued low disposal prices and/or disposal volumes could harm our business, results of operations and financial condition. See Item 5, “Operating and Financial Review and Prospects” for a discussion of our gains or losses on the disposition of used container equipment.
In addition to disposing of our fleet’s used containers at the end of their useful life, we opportunistically purchase used containers for resale from our shipping line customers and other sellers. Shipping lines either enter into trading deals with us at the time they are ready to dispose of older containers or enter into purchase leaseback transactions with us where they sell us older containers and then lease them back until the shipping line is ready to dispose of the containers. We face resale price risk with both transactions since by the time the container is provided to us from the shipping line the prevailing prices for older containers may have declined from the value we assumed at the time of purchase.
If the supply of trading equipment becomes limited because these sellers develop other means for disposing of their equipment or develop their own sales network, our equipment trading revenues and our profitability could be negatively impacted. If selling prices rapidly deteriorate and we are holding a large inventory that was purchased when prices for trading equipment were higher or if prices decline over the life of our purchase leaseback transactions, then our gross margins from trading and the sale of containers acquired through purchase leaseback transactions will decline or become negative. Low resale prices coupled with the higher prices paid for purchase leaseback transactions completed several years ago have caused some purchase leaseback transactions to be unprofitable.
Reductions in the prices of new containers would harm our business, results of operations and financial condition.
Lease rates for new containers are positively correlated to the price of new containers, which is positively correlated with the price of steel, a major component used in the manufacture of new containers. In the past five years, prices for new standard 20’ dry freight containers have moved in a wide range, with prices ranging between approximately $1,185 and $2,425 during this time. Our average new container cost per CEU increased 56% during 2017 compared to 2016. Container prices have substantially increased since late 2016, but if new container prices return to very low levels, the lease rates of older, off-lease containers will also decrease and the prices obtained for containers sold at the end of their useful lives will also decrease. Since the beginning of 2013 until the second half of 2016 we saw new container pricing and the sale prices of our containers sold at the end of their useful lives decline. Low new container prices cause low market lease rates and low resale values for containers, which have and may in the future adversely affect our business, results of operations and financial condition, even if low new container prices allow us to purchase new containers at a lower cost. Our future financial performance and profitability depends in part on the lease rates increasing for current leases that expire during the next three years as many of these leases were concluded with low initial lease rates. A reversal in the current recovery of new container prices and lease rates would increase the difficulty of raising lease rates on long term container leases that expire in the future.
9
Lessee defaults have and may continue to harm our business, results of operations and financial condition by decreasing revenue and increasing storage, repositioning, collection, insurance and recovery expenses.
Our containers are leased to numerous container lessees. Lessees are required to pay rent and to indemnify us for damage to or loss of containers. Lessees may default in paying rent and performing other obligations under their leases. A delay or diminution in amounts received under the leases (including leases on our managed containers), or a default in the performance of maintenance or other lessee obligations under the leases could adversely affect our business, results of operations and financial condition and our ability to make payments on our debt.
We experienced several lessee defaults in 2016, including the default of Hanjin discussed above, which severely negatively impacted our financial performance and we believe that there is the continued risk of lessee defaults in the future. During the last several years shipping lines have made a number of efforts to raise freight rates on the major trade lanes, however rate increases have generally not been sustainable for long periods of time. Excess vessel capacity due to new ship production, including the production of very large ships, and the re-activation of previously laid up vessels will continue to be a factor in the future, especially if older vessels are not scrapped. Major shipping lines are expected to be profitable overall for 2017, however reliable information about the financial position and resources of many shipping lines can be difficult to obtain. While containerized trade grew in 2017, it was not sufficient to fully utilize vessel capacity and major shipping lines both took delivery of, and resumed ordering, large vessels. Existing excess vessel capacity and continued new vessel deliveries, especially the delivery of very large vessels, are expected to continue to pressure freight rates for some time. As a result, we continue to face heightened risk that our financial performance and cash flow could be severely affected by defaults by our customers.
When lessees default, we may fail to recover all of our containers, and the containers that we do recover may be recovered in locations where we will not be able to quickly re-lease or sell them on commercially acceptable terms. In recovery actions we must locate the containers and often need to pay accrued storage and handling charges to depots and terminals, which may include debts incurred by the defaulting shipping line. We also may have to reposition these containers to other places where we can re-lease or sell them, which could be expensive, depending on the locations and distances involved. Following repositioning, we may need to repair the containers and pay container depots for storage until the containers are re-leased. These recovery, repair and repositioning costs generally are reflected in our financial statements under direct container expense. Accordingly, the amount of our bad debt expense may not capture the total adverse financial impact on us from a shipping line’s default. For our owned containers, these costs directly reduce our income and for our managed containers, lessee defaults decrease rental revenue and increase operating expenses, and thus reduce our management fee revenue. While we maintain insurance to cover some defaults, it is subject to large deductible amounts and significant exclusions and, therefore, may not be sufficient to prevent us from suffering material losses. In 2015 and 2016 we filed significant insurance claims for lessee defaults we experienced. As a result of these insurance claims, potential future insurance claims or changes in the perceived risk of providing default insurance, such insurance might not be available to us in the future on commercially reasonable terms or at all. In the renewals of our default insurance following the Hanjin bankruptcy, the policy premium was significantly increased and coverage was reduced. In any insurance claim our insurers may not agree with our determination that we have suffered an insured loss or our calculation of the amount of the insured loss. Any such future defaults could harm our business, results of operations and financial condition.
Historically we have recovered a very high percentage of the containers from defaulted lessees. However, in the last five years we encountered defaults from several smaller lessees and lessees in locations where recoveries did not track to our historical experience and significant losses were incurred. These losses were due to a number of containers being unrecoverable as the containers were not in the control of the lessee or the containers were detained by depots or terminals that demanded storage charges in excess of the value of the detained containers after accounting for repair and repositioning costs. If a material amount of future recoveries from defaulted lessees continue to deviate from our historical recovery experience, our financial performance and cash flow could be severely adversely affected.
10
Certain liens may arise on our containers.
Depot operators, manufacturers, repairmen, terminals, and transporters do come into possession of our containers from time to time and have amounts due to them from the lessees or sublessees of the containers. In the event of nonpayment of those charges by the lessees or sublessees, we may be delayed in, or entirely barred from, repossessing the containers, or be required to make payments or incur expenses to discharge such liens on our containers.
We derive a substantial portion of our lease billings from a limited number of container lessees, and the loss of, or reduction in business by, any of these container lessees could harm our business, results of operations and financial condition.
We have derived, and believe that we will continue to derive, a significant portion of lease billings and cash flow from a limited number of container lessees. Lease billings from our 20 largest container lessees represented $429.7 million or 80.0% of the total fleet billings during 2017, with lease billings from our single largest container lessee accounting for $80.2 million, or 15.1% of container lease billings during such fiscal year. Due to the ongoing consolidation in the shipping line industry, our 20 largest container lessees are becoming an increasing percentage of our total revenue, with correspondingly increased concentration of credit risk. Given the high concentration of our customer base, a default by any of our largest customers would result in a major reduction in leasing revenue, large repossession expenses, potentially large lost equipment charges and a material adverse impact on our performance and financial condition. Our experience with the Hanjin bankruptcy that commenced on August 31, 2016 is an example of the occurrence of these materially adverse events.
The introduction of very large container ships (18,000 TEU+) on the major trade lanes may lead to further industry consolidation and shipping line alliance participation, and even greater reliance by us on our largest customers, and negatively impact the performance of smaller and mid-size shipping lines. Several of the largest shipping lines have invested heavily in these very large ships and reportedly have achieved meaningful unit cost advantages and increased market shares on the major trade lanes. In response, some smaller shipping lines have started to exit the major trade lanes, while others are seeking to form closer operating partnerships.
Consolidation, shipping line alliances, and concentration in the container shipping industry could decrease the demand for leased containers.
We primarily lease containers to container shipping lines. The container shipping lines have historically relied on a large number of leased containers to satisfy their needs. The shipping industry has been consolidating for a number of years, and further consolidation is expected. In recent years two major German shipping lines have each acquired different South American shipping lines, a French shipping line acquired a Singaporean shipping line, two large Chinese shipping lines merged, a German shipping line merged with a Middle Eastern shipping line and a Danish shipping line acquired a German shipping line. Three major Japanese shipping lines will also complete their merger in April 2018. Additionally, Hanjin declared bankruptcy in August 2016, further reducing the number of large shipping lines. Historically, shipping lines have also formed a number of alliances to share vessel space and the creation of new alliances and changes in the membership of each alliance is ongoing. Consolidation of major container shipping lines and growth of alliances could create efficiencies and decrease the demand that container shipping lines have for leased containers because they may be able to fulfill a larger portion of their needs through their owned container fleets. Consolidation could also create concentration of credit risk if the number of our container lessees decreases. If shipping line alliances are effective at making shipping lines more efficient, this could reduce the demand for containers. The growth of alliances may add pressure to those shipping lines that do not join an alliance as they may find it more difficult to cost effectively serve shippers needs and/or shippers may choose to only ship cargo with alliances due to solvency concerns or otherwise. Additionally, large container shipping lines with significant resources could choose to manufacture or purchase their own containers, which would decrease their demand for leased containers and could harm our business, results of operations and financial condition.
11
Our indebtedness reduces our financial flexibility and could impede our ability to operate.
We have historically operated with, and anticipate continuing to operate with, a significant amount of debt. As of December 31, 2017, we had outstanding indebtedness of $3,014.4 million under our debt facilities. All of our outstanding indebtedness is secured debt collateralized by our container assets. There is no assurance that we will be able to refinance our outstanding indebtedness on terms that we can afford or at all. If we are unable to refinance our outstanding indebtedness, or if we are unable to increase the amount of our borrowing capacity, it could limit our ability to grow our business.
The amount of our indebtedness, and the terms of the related indebtedness (including interest rates and covenants), could have important consequences for us, including the following:
| • | require us to dedicate a substantial portion of our cash flows from operations to make payments on our debt, thereby reducing funds available for operations, investments, dividends, and future business opportunities and other purposes; |
| • | limit our flexibility in planning for, or reacting to, changes in our business and the industry in which we operate; |
| • | reduce our ability to make acquisitions or expand our business; |
| • | make it more difficult for us to satisfy our current or future debt obligations; |
| • | any failure to comply with our debt obligations, including financial and other restrictive covenants, could result in an event of default under the agreements governing such indebtedness, which could lead to, among other things, an acceleration of our indebtedness or foreclosure on the assets securing our indebtedness and have a material adverse effect on our business or financial condition; |
| • | limit our ability to borrow additional funds or to sell assets to raise funds, if needed, for working capital, capital expenditures, acquisitions or other purposes; and |
| • | increase our vulnerability to general adverse economic and industry conditions, including changes in interest rates. |
We may not generate sufficient cash flow from operations to service and repay our debt and related obligations and have sufficient funds left over to achieve or sustain profitability in our operations, meet our working capital and capital expenditure needs and/or compete successfully in our industry. An uncured event of default in some or all of our debt facilities could cause some or all of our entities to be declared bankrupt or liquidated.
We will require a significant amount of cash to service and repay our outstanding indebtedness, fund future capital expenditures, and our ability to generate cash depends on many factors beyond our control.
Our ability to make payments on and repay our indebtedness and to fund planned capital expenditures will depend on our ability to generate cash in the future. Our business primarily generates cash from our container assets. Our lenders, rating agencies and the investors in our asset-backed debt securities look to the historical and anticipated performance of our container assets when deciding whether to lend to us and the terms for such lending. It is possible that:
| • | our business will not generate sufficient cash flow from operations to service and repay our debt and to fund working capital requirements and future capital expenditures; |
| • | future borrowings will not be available under our current or future credit facilities in an amount sufficient to enable us to refinance our debt; or |
| • | we will not be able to refinance any of our debt on commercially reasonable terms or at all due to declining historical or anticipated financial performance of our assets or for other reasons. |
12
The terms of our debt facilities impose, and the terms of any future indebtedness may impose, significant operating, financial and other restrictions on us and our subsidiaries.
Restrictions imposed by our secured debt facilities, revolving credit facilities, term loan and bonds may limit or prohibit, among other things, our ability to:
| • | incur additional indebtedness; |
| • | pay dividends on or redeem or repurchase our common shares; |
| • | enter into new lines of business; |
| • | issue capital stock of our subsidiaries; |
| • | make loans and certain types of investments; |
| • | incur liens; |
| • | sell certain assets or merge with or into other companies or acquire other companies; |
| • | enter into certain transactions with shareholders and affiliates; and |
| • | restrict dividends, distributions or other payments from our subsidiaries. |
We are also required to comply with certain financial ratio covenants. These restrictions could adversely affect our ability to finance our future operations or capital needs and pursue available business opportunities. A breach of any of these financial covenants and restrictions, due to weaker financial performance, reduced asset values or otherwise could result in a default in respect of the related indebtedness. If a default occurs, the relevant lenders could elect to declare the indebtedness, together with accrued interest and fees, to be immediately due and payable and proceed against any collateral securing that indebtedness, which will constitute substantially all of our container assets. As a result of the Hanjin bankruptcy, coupled with the lower container returns provided in recent years due to increased competition and lower realized used container prices, in 2016 and 2017 we experienced difficulty in meeting certain of the financial covenants on our lending facilities. We obtained various covenant amendments and waivers to address this situation and subsequently refinanced the majority of our debt with revised covenants. If needed in the future we may be unable to obtain covenant amendments and waivers from our lenders and some or all of our indebtedness could be in default. Additionally, covenant amendments and waivers may limit our ability to access additional funds for container investment and the cost and expense of covenant amendments, waivers and/or refinancing may limit our available funds for container investment.
If we are unable to enter into interest rate swaps, collars and caps on reasonable commercial terms or if a counterparty under our interest rate swap, collar and cap agreements defaults, our exposure associated with our variable rate debt could increase.
We have typically funded a significant portion of the purchase price of new containers through borrowings under our revolving credit facilities and our secured debt facilities and intend to use borrowings under our revolving credit facilities and our secured debt facilities for such funding in the future. All of our outstanding debt, other than the $874.8 million in aggregate principal amount under TMCL V’s Series 2017-1 and Series 2017-2 Fixed Rate Asset Backed Notes are subject to variable interest rates. We have entered into various interest rate swap, collar and cap agreements to mitigate our exposure associated with variable rate debt. The swap agreements involve payments by us to counterparties at fixed rates in return for receipts based upon variable rates indexed to the London Inter Bank Offered Rate. There can be no assurance that interest rate swaps, collars and caps will be available in the future, or if available, will be on terms satisfactory to us. Moreover, our interest rate swap agreements are subject to counterparty credit exposure, which is defined as the ability of a counterparty to perform its financial obligations under a derivative contract. While we monitor our counterparties’ credit ratings on an on-going basis, we cannot be certain that they will stay in compliance with the related derivative agreements and not default in the future. If we are unable to obtain interest rate swaps, collars and caps or if a counterparty under our interest rate swap, collar and cap agreements defaults, our exposure associated with our variable rate debt could increase.
13
Consolidation of container manufacturers or the disruption of manufacturing for the major manufacturers could result in higher new container prices and/or decreased supply of new containers. Any material increase in the cost or reduction in the supply of new containers could harm our business, results of operations and financial condition.
We currently purchase almost all of our containers from manufacturers based in the People’s Republic of China (the “PRC”). If it were to become more expensive for us to procure containers in the PRC or to transport these containers at a low cost from the manufacturer to the locations where they are needed by our container lessees because of changes in exchange rates between the U.S. Dollar and Chinese Yuan, consolidation among container suppliers, increased tariffs imposed by the U.S. or other governments, changing trade patterns, increased fuel costs, increased labor costs, or for any other reason, we may have to seek alternative sources of supply and we may not be able to make alternative arrangements quickly enough to meet our container needs, and the alternative arrangements may increase our costs.
The availability and price of containers depend significantly on the capacity and bargaining position of the major container manufacturers. Three major manufacturers have approximately 80% of that industry’s market share. This market structure and the commodity inputs used in manufacturing have led to significant variability in container prices. In particular, the increased focus on environmental matters in China may reduce the supply (and increase the cost) of steel used in our containers and the mandatory use of water borne paint by all container factories in China has already increased the cost of containers and created container production constraints. If an increased cost of purchasing containers is not matched by a corresponding increase in lease rates, or if we have difficulty in sourcing containers, our business, results of operations and financial condition would be harmed.
We may incur significant costs to reposition our containers, which could harm our business, results of operations and financial condition.
When lessees return containers to locations where supply exceeds demand and when lessees default and we recover containers, we sometimes reposition containers to higher demand areas. Repositioning expenses vary depending on geographic location, distance, freight rates and other factors, and may not be fully covered by drop-off charges collected from the previous lessee of the containers or pick-up charges paid by the new lessee. We seek to limit the number of and impose surcharges on containers returned to low demand locations. Market conditions, however, may not enable us to continue such practices. In addition, we may not be able to accurately anticipate which locations will be characterized by higher or lower demand in the future, and our current contracts will not protect us from repositioning costs if locations that we expect to be higher demand locations turn out to be lower demand locations at the time the containers are returned. For example, the vast majority of our long-term leases require that a high percentage of the containers are returned in Asia, primarily in China. If long-term trade patterns change, it may not be economically desirable to have the bulk of our containers returned in China at the end of long term leases. Additionally, our customer default insurance that covers lessee insolvencies does not sufficiently insure us for container repositioning expense. Any such increases in costs to reposition our containers could harm our business, results of operations and financial condition.
The demand for leased containers is partially tied to international trade. If this demand were to decrease due to increased barriers to trade, or for any other reason, it could reduce demand for intermodal container leasing, which would harm our business, results of operations and financial condition.
A substantial portion of our containers are used in trade involving goods being shipped from the PRC and other Asian countries to the United States, Europe, Latin America or other regions and within Asia. The willingness and ability of international consumers to purchase foreign goods is dependent on political support, in the United States, Europe Latin America and other countries, for an absence of government-imposed barriers to international trade in goods and services. For example, international consumer demand for foreign goods is related to price; if the price differential between foreign goods and domestically-produced goods were to decrease due to increased tariffs on foreign goods, strengthening in the applicable foreign currencies relative to domestic currencies, rising wages, increasing input or energy costs or other factors, demand for foreign goods could decrease, which could result in reduced demand for intermodal container leasing. A similar reduction in demand for intermodal container leasing could result from an increased use of quotas or other technical barriers to restrict trade. The current regime of relatively free trade may not continue.
14
A contraction or slowdown in containerized cargo growth or negative containerized cargo growth would lead to a surplus of containers and a lack of storage space, which could negatively impact us.
We depend on third party depot operators to repair and store our equipment in port areas throughout the world. Growth in the world’s container fleet has significantly outpaced growth in depot capacity and even in the current period of historically high utilization, we continue to experience limited depot capacity in certain major port cities. Additionally, the land occupied by depots is increasingly being considered prime real estate, as it is coastal land in or near major cities, and this land may be developed into other uses or there may be increasing restrictions on depot operations by local communities. This trend has already caused depot storage costs to increase and could further increase depots’ costs and in some cases force depots to relocate to sites further from the port areas. If these changes affect a large number of our depots, or if we experience a period of lower container utilization, it could significantly increase the cost of maintaining and storing our off-hire containers. Additionally, if depot space is unavailable, we may be unable to accept returned containers from lessees, which may cause us to breach our lease agreements.
We own a large number of containers in our fleet and are subject to significant ownership risk and increasing our owned fleet entails increasing our debt, which could result in financial instability.
Ownership of containers entails greater risk than management of containers for container investors. In 2017, the percentage of containers in our fleet that we own decreased from 81.0% at the beginning of the year to 78.8% at the end of the year. This decrease is primarily due to our assumption of the management of containers formerly owned and managed by Magellan Maritime Services GmbH, a German container lessor that became insolvent. In the years prior to 2017 we have consistently increased the number of owned containers in our fleet as a percentage of the total fleet. The increased number of containers in our owned fleet increases our exposure to financing costs, financing risks, changes in per diem rates, re-leasing risk, changes in utilization rates, lessee defaults, repositioning costs, storage expenses, impairment charges and changes in sales prices upon the disposition of containers. The number of containers in our owned fleet fluctuates over time as we purchase new containers, sell containers into the secondary resale market, and acquire other fleets.
If we increase the number of containers in our owned fleet, we will likely have more capital at risk and may need to maintain higher debt balances. Additional borrowings may not be available under our revolving credit facilities or our secured debt facilities, and we may not be able to refinance these facilities, if necessary, on commercially reasonable terms or at all. We may need to raise additional debt or equity capital in order to fund our business, expand our sales activities and/or respond to competitive pressures. We may not have access to the capital resources we desire or need to fund our business or may not have access on attractive terms. These factors, among others, may reduce our profitability and adversely affect our plans to maintain the container ownership portion of our business.
If we are unable to lease our new containers shortly after we purchase them, our business, results of operations, cash flows and financial condition may be harmed.
Lease rates for new containers are positively correlated to the fluctuations in the price of new containers, which is positively correlated with the price of steel, a major component used in the manufacture of new containers. If we are unable to lease the new containers that we purchase within a short period of time of such purchase, the market price of new containers and the corresponding market lease rates for new containers may decrease, regardless of the higher cost of the previously purchased containers. Additionally, if we believe new container prices are attractive, we may purchase more containers than we have immediate demand for if we expect container prices or lease rates may rise. If prices do not rise or new container demand weakens, we may be unable to lease this speculative inventory on attractive terms or at all. Declines in new container prices, lease rates, or the inability to lease new containers could harm our business, results of operations and financial condition.
Sustained reduction in the production of new containers could harm our business, results of operations and financial condition.
The lack of new production of standard dry freight containers from the fourth quarter of 2008 through the end of 2009, combined with continued retirement of older containers in the ordinary course, led to a decline in the world container fleet of approximately 4% in 2009, creating a shortage of containers as worldwide cargo volumes
15
increased by 12.0% in 2010 and 8.6% in 2011. During the period of decline in the world container fleet, container manufacturers lost up to 60% of their skilled work force due to long shutdowns, and had limited production capacity in 2010 as they had to hire and train a new skilled work force. Although manufacturers resumed production in 2011 and continued steady production from 2012 through 2017, if there is a sustained reduction in the production of new containers, it could impact our ability to expand our fleet, which could harm our business, results of operations and financial condition.
Terrorist attacks, the threat of such attacks or the outbreak of war and hostilities could negatively impact our operations and profitability and may expose us to liability.
Terrorist attacks and the threat of such attacks have contributed to economic instability in the U.S. and elsewhere, and further acts or threats of terrorism, violence, war or hostilities could similarly affect world trade and the industries in which we and our container lessees operate. For example, worldwide containerized trade dramatically decreased in the immediate aftermath of the September 11, 2001 terrorist attacks in the U.S., which affected demand for leased containers. In addition, terrorist attacks, threats of terrorism, violence, war or hostilities may directly impact ports, depots, our facilities or those of our suppliers or container lessees and could impact our sales and our supply chain. A severe disruption to the worldwide ports system and flow of goods could result in a reduction in the level of international trade and lower demand for our containers.
Our lease agreements require our lessees to indemnify us for all costs, liabilities and expenses arising out of the use of our containers, including property damage to the containers, damage to third-party property and personal injury. However, our lessees may not have adequate resources to honor their indemnity obligations after a terrorist attack. Our insurance coverage is limited and is subject to large deductibles and significant exclusions and we have very limited insurance for liability arising from a terrorist attack. Accordingly, we may not be protected from liability (and expenses in defending against claims of liability) arising from a terrorist attack.
We face extensive competition in the container leasing industry.
We may be unable to compete favorably in the highly competitive container leasing and container management businesses. We compete with a relatively small number of major leasing companies, many smaller lessors, companies and financial institutions offering finance leases, and promoters of container ownership and leasing as a tax-efficient investment. Some of these competitors may have greater financial resources and access to capital than we do. Additionally, some of these competitors may have large, underutilized inventories of containers, which could, if leased, lead to significant downward pressure on per diem rates, margins and prices of containers. Competition among container leasing companies depends upon many factors, including, among others: per diem rates; supply reliability; lease terms, including lease duration, drop-off restrictions and repair provisions; customer service; and the location, availability, quality and individual characteristics of containers. In recent years several container leasing companies have acquired other container lessors and we may face increased competition from these merged firms. Following the completion of each consolidation, the new entity may face further pressure for fleet growth and may compete even more aggressively, causing further declines in rental rates available from container leases. New entrants into the leasing business may be attracted by the historically high rate of containerized trade growth, access to the capital markets and low pricing for containers. New entrants may be willing to offer pricing or other terms that we are unwilling or unable to match. Additionally, the management agreements under which we manage containers for other parties do not restrict these container owners from having other container fleets managed by competing leasing companies or from directly competing with us.
Our lessees may decide to buy, rather than lease their containers.
We, like other suppliers of leased containers, are dependent upon decisions by shipping lines to lease rather than buy their container equipment. Shipping lines own a significant amount of the world’s intermodal containers and effectively compete with us. In part due to constraints on their financing and need to allocate capital to new ship purchases and port terminals, in recent years, shipping lines have generally reduced their purchases of new containers. In 2017 we believe that about 60% of all shipping containers were purchased by leasing companies. Although we believe that this percentage should somewhat rebalance itself we still expect leasing companies to be a majority purchaser of the new containers to be produced. Should shipping lines decide to buy a larger percentage of the containers they operate, our utilization rate would decrease, resulting in decreased leasing revenues, increased storage costs and increased positioning costs. A decrease in the portion of leased containers would also reduce our investment opportunities and significantly constrain our growth.
16
Our results of operations are subject to changes resulting from the political and economic policies of the PRC and economic activity in the PRC.
A substantial portion of our containers are leased out from locations in the PRC. The main manufacturers of containers are also located in the PRC. The political and economic policies of the PRC and the level of economic activity in the PRC may have a significant impact on our company and our financial performance.
Changes in the political leadership of the PRC may have a significant effect on laws and policies that impact economic growth and trade and the corresponding need for containers to ship goods from the PRC, including the introduction of measures to control inflation, changes in the rate or method of taxation, and the imposition of additional restrictions on currency conversion, remittances abroad, and foreign investment. Moreover, economic reforms and growth in the PRC have been more successful in certain provinces than in others, and the continuation of or increases in such disparities could affect the political or social stability of the PRC. Furthermore, the current high level of debt by some companies in China may lead to defaults which may not be supported by the Chinese government. In recent years the rate of economic growth in the PRC has declined. Additionally, government policies that reduce the emphasis on manufacturing and increase priorities for domestic consumption and services may alter trade patterns and reduce demand for containers. Chinese government environmental policies and practices may reduce steel production which would impact container costs and may limit factory production, which could impact trade growth and container demand.
A large number of our shipping line customers are domiciled either in the PRC (including Hong Kong) or in Taiwan. In 2017, approximately 28.3% of our revenue was attributable to shipping line customers that were either domiciled in the PRC (including Hong Kong) or in Taiwan. Almost all container manufacturing facilities from which we purchased our containers in 2017 are located in the PRC. A reduced rate of economic growth, changes to economic or trade policy or political instability in either the PRC or Taiwan could have a negative effect on our major customers, our ability to obtain containers and correspondingly, our results of operations and financial condition.
The legal systems in the PRC and other jurisdictions have inherent uncertainties that could limit the legal protections available to us and even if legal judgments are obtained, collection may be difficult.
We currently purchase almost all of our containers from manufacturers based in the PRC. In addition, a substantial portion of our containers are leased out from locations in the PRC. California law governs almost all of these agreements. However, disputes or settlements arising out of these agreements may need to be enforced in the PRC. The PRC legal system is based on written statutes. Prior court decisions may be cited for reference but have limited precedential value. Since 1979, PRC legislation and regulations have significantly enhanced the protections afforded to various forms of foreign investments in the PRC. However, since these laws and regulations are relatively new and the PRC legal system continues to evolve, the interpretations of many laws, regulations and rules are not always uniform and may be subject to considerable discretion, variation, or influence by external forces unrelated to the legal merits of a particular matter. The enforcement of these laws, regulations, and rules involves uncertainties that may limit remedies available to us. Any litigation or arbitration in the PRC may be protracted and may result in substantial costs and diversion of resources and management attention. In addition, the PRC may enact new laws or amend current laws that may be detrimental to us, which may have a material adverse effect on our business operations. If we are unable to enforce any legal rights that we may have under our contracts or otherwise in the PRC, our ability to compete and our results of operations could be harmed.
In addition, as our containers are used in trade involving goods being shipped to locations throughout the world, it is not possible to predict, with any degree of certainty, the jurisdictions in which enforcement proceedings may be commenced. Litigation and enforcement proceedings have inherent uncertainties in any jurisdiction and are expensive. These uncertainties are enhanced in countries that have less developed legal systems where the interpretation of laws and regulations is not consistent, may be influenced by factors other than legal merits and may be cumbersome, time-consuming and even more expensive. For example, repossession from defaulting lessees may be difficult and more expensive in jurisdictions whose laws do not confer the same security interests and rights to creditors and lessors as those in the United States and where the legal system is not as well developed. Additionally, even if we are successful in obtaining judgments against defaulting lessees, these lessees may have limited owned assets and/or heavily encumbered assets and the collection and enforcement of a monetary judgment may be unsuccessful. As a result, the remedies available and the relative success and expedience of collection and enforcement proceedings with respect to the containers in various jurisdictions cannot be predicted.
17
Because substantially all of our revenues are generated in U.S. dollars, but a significant portion of our expenses are incurred in other currencies, exchange rate fluctuations could have an adverse impact on our results of operations.
The U.S. dollar is our primary operating currency. Almost all of our revenues are denominated in U.S. dollars, and approximately 75% of our direct container expenses were denominated in U.S. dollars for the year ended December 31, 2017. Accordingly, a significant amount of our expenses are incurred in currencies other than the U.S. dollar. This difference could lead to fluctuations in net income due to changes in the value of the U.S. dollar relative to the other currencies. During 2017, 2016, and 2015, 25%, 36%, and 27%, respectively, of our direct container expenses were paid in up to 20 different foreign currencies. A decrease in the value of the U.S. dollar against non-U.S. currencies in which our expenses are incurred translates into an increase in those expenses in U.S. dollar terms, which would decrease our net income. While the prices of the used containers we trade or dispose are primarily quoted and billed in U.S. Dollars, declines in the currencies where these containers are sold relative to the U.S. Dollar can serve to reduce the market prices for used containers, which will decrease our net income. We do not engage in foreign currency hedging activities which might reduce the volatility associated with exchange rates.
Sustained Asian economic instability could reduce demand for leasing, which would harm our business, results of operations and financial condition.
Many of our customers are substantially dependent upon shipments of goods exported from Asia. From time to time, there have been health scares, such as Severe Acute Respiratory Syndrome and avian flu, financial turmoil, natural disasters and political instability in Asia. If these events were to occur in the future, they could adversely affect our container lessees and the general demand for shipping and lead to reduced demand for leased containers or otherwise adversely affect us. Any reduction in demand for leased containers would harm our business, results of operations and financial condition.
The international nature of the container shipping industry exposes us to numerous risks.
We are subject to risks inherent in conducting business across national boundaries, any one of which could adversely impact our business. These risks include:
| • | regional or local economic downturns; |
| • | fluctuations in currency exchange rates; |
| • | changes in governmental policy or regulation; |
| • | restrictions on the transfer of funds or other assets into or out of different countries; |
| • | import and export duties and quotas; |
| • | domestic and foreign customs, tariffs and taxes; |
| • | war, hostilities and terrorist attacks, or the threat of any of these events; |
| • | government instability; |
| • | nationalization of foreign assets; |
| • | government protectionism; |
| • | compliance with export controls and economic sanctions, including those of the U.S. Department of Commerce and the U.S. Treasury or other governments; |
| • | compliance with import procedures and controls, including those of the U.S. Department of Homeland Security or other governments; |
| • | consequences from changes in tax laws, including tax laws pertaining to the container investors; |
| • | potential liabilities relating to foreign withholding taxes; |
| • | labor or other disruptions at key ports; |
18
| • | difficulty in staffing and managing widespread operations; and |
| • | restrictions on our ability to own or operate subsidiaries, make investments or acquire new businesses in various jurisdictions. |
One or more of these factors or other related factors may impair our current or future international operations and, as a result, harm our business, results of operations and financial condition.
We rely on our proprietary information technology systems to conduct our business. If these systems fail to perform their functions adequately, or if we experience an interruption in their operation, our business, results of operations and financial condition could be harmed.
The efficient operation of our business is highly dependent on our proprietary information technology systems. We rely on our systems to record transactions, such as repair and depot charges, purchases and disposals of containers and movements associated with each of our owned or managed containers. We use the information provided by these systems in our day-to-day business decisions in order to effectively manage our lease portfolio, reduce costs and improve customer service. We also rely on these systems for the accurate tracking of the performance of our managed fleet for each container investor. The failure of our systems to perform as we expect could disrupt our business, adversely affect our results of operations and cause our relationships with lessees and container investors to suffer. Our information technology systems are vulnerable to damage or interruption from circumstances beyond our control, including fire, natural disasters, power loss and computer systems failures and viruses or cyber-attacks. Even though we have developed redundancies and other contingencies to mitigate any disruptions to our information technology systems, these redundancies and contingencies may not completely prevent interruptions to our information technology systems. In recent years we have moved various information technology systems and data to cloud-based storage providers and software vendors. We face additional risks from relying on third parties to store, process and manage our data and software. Any such interruptions could harm our business, results of operations and financial condition.
Use of counterfeit and improper refrigerant in refrigeration machines for refrigerated containers could cause irreparable damage to the refrigeration machines, death or personal injury, and materially impair the value of our refrigerated container fleet.
In past years, there were a limited number of reports of counterfeit and improper refrigerant gas being used to service refrigeration machines in depots primarily in Asia. The use of this counterfeit gas has led to the explosion of several refrigeration machines. Several of these incidents resulted in personal injury or death, and in all cases, the counterfeit gas led to irreparable damage to the refrigeration machines.
Safer testing procedures were developed and implemented by refrigeration manufacturers and industry participants in order to determine whether counterfeit or improper gas was used to service a refrigeration machine. However, there can be no assurance that these procedures will prove to continue to be reliable and cost effective. If industry procedures and tests are not proven safe and effective or if the use of such counterfeit and improper refrigerant recurs and is widespread or other counterfeit refrigerant issues emerge in the future, the value of our refrigerated container fleet and our ability to lease refrigerated containers could be materially impaired and could therefore have a material adverse effect on our financial condition, results of operations and cash flows. Additionally, we might be subject to claims for damages by parties injured by contaminated refrigeration machinery operated by our lessees which may materially adversely affect us.
We face risks from our tank container management agreement with Trifleet Leasing (The Netherlands) B.V.
In June 2013 we announced that we had entered into a tank container management agreement with Trifleet Leasing (The Netherlands) B.V. (“Trifleet”). Under this agreement, we invest funds with Trifleet for the purchase and leasing of tank containers. Trifleet is our exclusive manager for investments in tank containers. Intermodal tank containers are used for the transport and storage of liquid foodstuffs, chemicals and gases. This is a specialized market subject to a number of regulations and strict operating procedures. As Trifleet is investing funds on our behalf in tank containers, our return on any investments under this management agreement are highly reliant on their skill and performance, as well as, the overall investment climate for tank containers. While we approve of the
19
amounts committed under the management agreement, Trifleet selects the lessees, negotiates lease terms, determines equipment specifications, negotiates equipment orders and supervises production, and is responsible for all other management activities including customer billing, equipment return, re-leasing, maintenance and repairs. If Trifleet or the tank container market does not perform as we anticipate, we may not receive adequate returns on our investment and our results could be materially impacted. Additionally, given the nature of tank containers and their cargos, our ownership of tank containers could expose us to different and additional risks than we generally face as the owner and lessor of dry freight and refrigerated containers. While lessees, Trifleet and ourselves all maintain insurance, and lessees agree to accept liability for claims caused by the operation of tank containers, this may still be inadequate to shield us from costs and liability from any claims arising from tank containers that we own pursuant to the Trifleet management agreement.
If our insurance is inadequate or if we are unable to obtain insurance, we may experience losses.
Under all of our leases, our lessees are generally responsible for loss of or damage to a container beyond ordinary wear and tear, and they are required to purchase insurance to cover any other liabilities. Our depots are also required to maintain insurance and indemnify us against losses. We also maintain our own insurance to cover our containers when they are not on-hire to lessees or when the lessee fails to have adequate primary coverage, and third-party liability insurance for both on-hire and off-hire containers. In addition, we maintain insurance that, after satisfying our deductibles, would cover loss of revenue as a result of default under most of our leases, as well as, the recovery cost or replacement value of most of our containers. Lessees’ and depots’ insurance policies and indemnity rights may not protect us against losses. Our own insurance may prove to be inadequate to prevent against losses or in the future coverage may be unavailable or uneconomic, and losses could arise from a lack of insurance coverage.
U.S. investors in our company could suffer adverse tax consequences if we are characterized as a passive foreign investment company for U.S. federal income tax purposes.
Based upon the nature of our business activities, we could be classified in the future as a passive foreign investment company (“PFIC”) for U.S. federal income tax purposes. Such characterization could result in adverse U.S. tax consequences to direct or indirect U.S. investors in our common shares. For example, if we are a PFIC, our U.S. investors could become subject to increased tax liabilities under U.S. tax laws and regulations and could become subject to burdensome reporting requirements. The determination of whether or not we are a PFIC is made on an annual basis and depends on the composition of our income and assets from time to time. Specifically, for any taxable year we will be classified as a PFIC for U.S. tax purposes if either:
| • | 75% or more of our gross income in the taxable year is passive income, or |
| • | the average percentage of our assets (which includes cash) by value in a taxable year which produce or are held for the production of passive income is at least 50%. |
In applying these tests, we are treated as owning or generating directly our pro rata share of the assets and income of any corporation in which we own at least 25% by value. In addition, the composition of our income and assets will be affected by how, and how quickly, we spend the cash we have raised.
If you are a U.S. investor and we are a PFIC for any taxable year during which you own our common shares, you could be subject to adverse U.S. tax consequences. Under the PFIC rules, unless a U.S. investor is permitted to and does elect otherwise under the Internal Revenue Code, such U.S. investor would be liable to pay U.S. federal income tax at the then prevailing income tax rates on ordinary income plus interest upon excess distributions and upon any gain from the disposition of our common shares, as if the excess distribution or gain had been recognized ratably over the investor’s holding period for our common shares. Based on the composition of our income, valuation of our assets (including goodwill), and our election to treat certain of our subsidiaries as disregarded entities for U.S. federal income tax purposes, we do not believe we were a PFIC for any period after our initial public offering (“IPO”) date and we do not expect that we should be treated as a PFIC for our current taxable year. However, there can be no assurance at all in this regard. Because the PFIC determination is highly fact intensive and made at the end of each taxable year, it is possible that we may be a PFIC for the current or any future taxable year or that the U.S. Internal Revenue Service (“IRS”) may challenge our determination concerning our PFIC status.
20
We may become subject to unanticipated tax liabilities that may have a material adverse effect on our results of operations.
Textainer Group Holdings Limited is a Bermuda company, and we believe that a significant portion of the income derived from our operations will not be subject to tax in Bermuda, which currently has no corporate income tax, or in many other countries in which we conduct activities or in which our customers or containers are located. However, this belief is based on the anticipated nature and conduct of our business, which may change. It is also based on our understanding of our position under the tax laws of the countries in which we have assets or conduct activities. This position is subject to review and possible challenge by taxing authorities and to possible changes in law that may have retroactive effect.
A portion of our income is treated as effectively connected with our conduct of a trade or business within the U.S., and is accordingly subject to U.S. federal income tax. It is possible that the IRS will conclude that a greater portion of our income is effectively connected income that should be subject to U.S. federal income tax.
Our results of operations could be materially and adversely affected if we become subject to a significant amount of unanticipated tax liabilities.
Our U.S. subsidiaries may be treated as personal holding companies for U.S. federal tax purposes now or in the future.
Any of our direct or indirect U.S. subsidiaries could be subject to additional U.S. tax on a portion of its income if it is considered to be a personal holding company (“PHC”) for U.S. federal income tax purposes. This status depends on whether more than 50% of the subsidiary’s shares by value could be deemed to be owned (taking into account constructive ownership rules) by five or fewer individuals and whether 60% or more of the subsidiary’s adjusted ordinary gross income consists of “personal holding company income,” which includes certain forms of passive and investment income. The PHC rules do not apply to non-U.S. corporations. We believe that none of our U.S. subsidiaries should be considered PHCs. In addition, we intend to cause our U.S. subsidiaries to manage their affairs in a manner that reduces the possibility that they will meet the 60% income threshold. However, because of the lack of complete information regarding our ultimate share ownership (i.e., particularly as determined by constructive ownership rules), our U.S. subsidiaries may become PHCs in the future and, in that event, the amount of U.S. federal income tax that would be imposed could be material.
Changes in tax laws or their application could adversely affect the results of our operations.
Our worldwide operations are taxed under the laws of the jurisdictions in which we operate. However, the integrated nature of our worldwide operations can produce conflicting claims from revenue authorities in different countries as to the profits to be taxed in the individual countries, including disputes relating to transfer pricing. Some of the jurisdictions in which we operate have double tax treaties with other foreign jurisdictions, which provide a framework for mitigating the impact of double taxation on our revenues and capital gains. However, mechanisms developed to resolve such conflicting claims are largely uncertain, and can be expected to be very lengthy in coming to a final determination in the applicable jurisdictions.
In recent years, tax authorities around the world have increased their scrutiny of company tax filings, and have become more rigid in exercising any discretion they may have. As part of this, the Organization for Economic Co-operation and Development (“OECD”) has proposed a number of tax law changes under its Base Erosion and Profit Shifting (“BEPS”) Action Plans to address issues of transparency, coherence and substance.
These OECD tax reform initiatives also need local country implementation, including in the Bermuda and U.S., which may result in significant changes to established tax principles.
In addition, in the U.S., President Trump on December 22, 2017, signed into law the Tax Cuts and Jobs Act of 2017 (the “New Tax Act”), which includes substantial changes to the U.S. taxation of individuals and businesses. The New Tax Act also establishes new tax laws that will affect our operations, including, but not limited to, (1) reduction of the U.S. federal corporate tax rate; (2) elimination of the corporate alternative minimum tax; (3) the creation of the base erosion anti-abuse tax (“BEAT”), a new minimum tax on taxable income adjusted for certain
21
base erosion payments; (4) a general elimination of U.S. federal income taxes on dividends from foreign subsidiaries; (5) a new provision designed to currently tax certain global intangible low-taxed income (“GILTI”) of controlled foreign corporations, which allows for the possibility of using foreign tax credits (“FTCs”) and a deduction of up to 50% to reduce this income tax liability (subject to some limitations); (6) a new limitation on deductible interest expense; (7) limitations on the deductibility of certain executive compensation; (8) limitations on the use of FTCs to reduce the U.S. income tax liability; and (9) limitations on net operating losses generated in the taxable years beginning after December 31, 2017, to 80% of taxable income. Although the New Tax Law substantially decreased tax rates applicable to corporations in the U.S., we do not yet know what all of the consequences of this new statute will be, including whether the law will have any unintended consequences. In particular, significant uncertainties remain as to how the U.S. government will implement the New Tax Law, including with respect to the tax qualification of interest deductions, the concept of a territorial tax regime, royalty payments and cost of goods sold.
In general, such tax reform efforts, including with respect to tax base or rate, transfer pricing, intercompany dividends, cross border transactions, controlled corporations, and limitations on tax relief allowed on the interest on intercompany debt, will require us to continually assess our organizational structure against tax policy trends, and could lead to an increased risk of international tax disputes and an increase in our effective tax rate, and could adversely affect our financial results.
The U.S. government has special contracting requirements that create additional risks.
We have a firm, fixed price, indefinite quantity contract with the U.S. Transportation Command Directorate of Acquisition (“USTranscom”) to supply leased marine containers to the U.S. military. As an indefinite quantity contract, there is no guarantee that the U.S. military will pay more than the minimum guarantee, which guaranteed amount is substantially below the total amount authorized under the contract. Thus, the expected revenues from the USTranscom contract may not fully materialize. If we do not perform in accordance with the terms of the USTranscom contract, we may receive a poor performance report that would be considered by the U.S. military in making any future awards. Accordingly, we cannot be certain that we will be awarded any future government contracts.
In contracting with the U.S. military, we are subject to U.S. government contract laws, regulations and other requirements that impose risks not generally found in commercial contracts. For example, U.S. government contracts require contractors to comply with a number of socio-economic requirements and to submit periodic reports regarding compliance, are subject to audit and modification by the U.S. government in its sole discretion, and impose certain requirements relating to software and/or technical data that, if not followed, could result in the inadvertent grant to the U.S. government of broader licenses to use and disclose such software or data than intended.
These laws, regulations and contract provisions also permit, under certain circumstances, the U.S. government unilaterally to:
| • | suspend or prevent us for a set period of time from receiving new government contracts or extending existing contracts based on violations or suspected violations of laws or regulations; |
| • | terminate the USTranscom contract; |
| • | reduce the scope and value of the USTranscom contract; |
| • | audit our performance under the USTranscom contract and our compliance with various regulations; and |
| • | change certain terms and conditions in the USTranscom contract. |
In addition, the U.S. military may terminate the USTranscom contract either for its convenience at any time or if we default by failing to perform in accordance with the contract schedule and terms. Termination for convenience provisions generally enable the contractor to recover only those costs incurred or committed, and settlement expenses and profit on the work completed prior to termination. Termination for default provisions do not permit these recoveries and make the contractor liable for excess costs incurred by the U.S. military in procuring undelivered items from another source.
22
In addition, the U.S. government could bring criminal and civil charges against us based on intentional or unintentional violations of the representations and certifications that we have made in the USTranscom contract. Although adjustments arising from U.S. government audits and reviews have not seriously harmed our business in the past, future audits and reviews could cause adverse effects. We could also suffer serious harm to our reputation if allegations of impropriety were to be made against us.
We may choose to pursue acquisitions or joint ventures that could present unforeseen integration obstacles or costs and we face risks from our two joint ventures.
We may pursue acquisitions and joint ventures. Acquisitions involve a number of risks and present financial, managerial and operational challenges, including:
| • | potential disruption of our ongoing business and distraction of management; |
| • | difficulty integrating personnel and financial and other systems; |
| • | hiring additional management and other critical personnel; and |
| • | increasing the scope, geographic diversity and complexity of our operations. |
In addition, we may encounter unforeseen obstacles or costs in the integration of acquired businesses. Also, the presence of one or more material liabilities of an acquired company that are unknown to us at the time of acquisition may have a material adverse effect on our business. Acquisitions or joint ventures may not be successful, and we may not realize any anticipated benefits from acquisitions or joint ventures.
On August 5, 2011, a joint venture, TW Container Leasing, Ltd (“TW”), was formed between our wholly-owned subsidiary, Textainer Limited (“TL”), and Wells Fargo Container Corp (“WFC”), a wholly-owned subsidiary of Wells Fargo and Company. The purpose of TW is to lease containers to lessees under direct financing leases. TW is governed by members, credit and management agreements. Under the members agreement, TL owns 25% and WFC owns 75% of the common shares and related voting rights of TW. TL also has two seats and WFC has six seats on TW’s board of directors, with each seat having equal voting rights, provided, however, that the approval of at least one TL-appointed director is required for any action of the board of directors. As we do not own the majority of TW, we face risks associated with investing in an entity that we do not control and it is possible that the interests of the controlling stockholder could be different from our interests. Conflicts between us and the controlling stockholder of TW could result in litigation, an inability to operate TW, lost business opportunities for TW and us, and other problems that might have a material adverse impact on us as a whole.
On December 20, 2012, TL purchased 50.1% of the outstanding common shares of TAP Funding Ltd. (“TAP Funding”). TAP Funding owns a fleet of containers under our management. TAP Funding is governed by members and management agreements. TL has two voting rights and TAP Ltd. (“TAP”), the 49.9% shareholder, has one voting right in TAP Funding, with the exception of certain matters such as bankruptcy proceedings, the incurrence of debt and mergers and consolidations, which require unanimity. TL also has two seats and TAP has one seat on TAP Funding’s board of directors. While we own the majority of TAP Funding, we face risks associated with TAP Funding’s structure that requires both shareholders to agree on certain significant matters such as debt financing, mergers and liquidation. It is possible that the interests of the other shareholder could be different from our interests. Conflicts between us and the other shareholder of TAP Funding could result in litigation, an inability to finance and operate TAP Funding, and other problems that might have a material adverse impact on us as a whole.
Our senior executives are critical to the success of our business and any inability to retain them or recruit and successfully integrate new personnel could harm our business, results of operations and financial condition.
Our senior management has a long history in the container leasing industry, with an average of 14 years of service with us. We rely on this knowledge and experience in our strategic planning and in our day-to-day business operations. Our success depends in large part upon our ability to retain our senior management, the loss of one or more of whom could have a material adverse effect on our business.
23
Our success also depends on our ability to retain our experienced sales force and technical personnel as well as recruit new skilled sales, marketing and technical personnel. Competition for these individuals in our industry is intense and we may not be able to successfully recruit, train or retain qualified personnel. If we fail to retain and recruit the necessary personnel, our business and our ability to obtain new container lessees and provide acceptable levels of customer service could suffer. We have “at will” employment agreements with all of our executive officers.
The lack of an international title registry for containers increases the risk of ownership disputes.
Although the Bureau International des Containers registers and allocates a four letter prefix to every container in accordance with ISO standard 6346 (Freight container coding, identification and marking) to identify the owner/operator and each container has a unique prefix and serial number, there is no internationally recognized system of recordation or filing to evidence our title to containers nor is there an internationally recognized system for filing security interests in containers. Although this has not occurred to date, the lack of a title recordation system with respect to containers could result in disputes with lessees, end-users, or third parties who may improperly claim ownership of containers.
We may incur costs associated with new cargo security regulations, which may adversely affect our business, results of operations and financial condition.
We may be subject to regulations promulgated in various countries, including the U.S., seeking to protect the integrity of international commerce and prevent the use of containers for international terrorism or other illicit activities. For example, the Container Security Initiative, the Customs-Trade Partnership Against Terrorism and Operation Safe Commerce are among the programs administered by the U.S. Department of Homeland Security that are designed to enhance security for cargo moving throughout the international transportation system by identifying existing vulnerabilities in the supply chain and developing improved methods for ensuring the security of containerized cargo entering and leaving the U.S. Moreover, the International Convention for Safe Containers, 1972, as amended, adopted by the International Maritime Organization, applies to containers and seeks to maintain a high level of safety of human life in the transport and handling of containers by providing uniform international safety regulations. As these regulations develop and change, we may incur compliance costs due to the acquisition of new, compliant containers and/or the adaptation of existing containers to meet new requirements imposed by such regulations. Additionally, certain companies are currently developing or may in the future develop products designed to enhance the security of containers transported in international commerce. Regardless of the existence of current or future government regulations mandating the safety standards of intermodal shipping containers, our competitors may adopt such products or our container lessees may require that we adopt such products. In responding to such market pressures, we may incur increased costs, which could have a material adverse effect on our business, results of operations and financial condition.
Environmental liability and regulations may adversely affect our business, results of operations and financial condition.
We are subject to federal, state, local and foreign laws and regulations relating to the protection of the environment, including those governing the discharge of pollutants to air, ground and water, the management and disposal of hazardous substances and wastes and the cleanup of contaminated sites. We could incur substantial costs, including cleanup costs, fines and costs arising out of third-party claims for property or natural resource damage and personal injury, as a result of violations of or liabilities under or compliance with environmental laws and regulations in connection with our or our lessees’ current or historical operations. Under some environmental laws in the U.S. and certain other countries, the owner or operator of a container may be liable for environmental damage, cleanup or other costs in the event of a spill or discharge of material from the container without regard to the fault of the owner or operator. While we typically maintain certain limited liability insurance and typically require lessees to provide us with indemnity against certain losses, the insurance coverage may not be sufficient to protect against any or all liabilities and such indemnities may not be sufficient, or available, to protect us against losses arising from environmental damage. Moreover, our lessees may not have adequate resources, or may refuse to honor their indemnity obligations and our insurance coverage is subject to large deductibles, coverage limits and significant exclusions.
24
Environmental regulations also impact container production and operation, including regulations on the use of chemical refrigerants due to their ozone depleting and global warming effects. Our refrigerated containers currently use R134A refrigerant. While R134A does not contain chlorofluorocarbons (“CFCs”), the European Union (“EU”) has instituted regulations to phase out the use of R134A in automobile air conditioning systems beginning in 2011 due to concern that the release of R134A into the atmosphere may contribute to global warming. While the European Union regulations do not currently restrict the use of R134A in refrigerated containers or trailers, it is possible that the phase out of R134A in automobile air conditioning systems will be extended to containers in the future and our operations could be impacted. It has been proposed that R134A usage in containers be banned beginning in 2025, although the final decision has not been made as of yet.
Container production also raises environmental concerns. The floors of dry freight containers are plywood typically made from tropical hardwoods. Due to concerns regarding de-forestation and climate change, many countries have implemented severe restrictions on the cutting and export of this wood. Accordingly, container manufacturers have switched a significant portion of production to alternatives such as birch, bamboo, and other farm grown wood and users are also evaluating alternative designs that would limit the amount of plywood required and are also considering possible synthetic materials. New woods or other alternatives have not proven their durability over the typical life of a dry freight container, and if they cannot perform as well as the hardwoods have historically, the future repair and operating costs for these containers may be impacted. Also, the insulation foam in the walls of certain refrigerated containers requires the use of a blowing agent that contains CFCs. Manufacturers are phasing out the use of this blowing agent in manufacturing, however, if future regulations prohibit the use or servicing of containers with insulation manufactured with this blowing agent we could be forced to incur large retrofitting expenses and these containers might bring lower rental rates and disposal prices. EU regulations currently restrict the sale or use of refrigerated containers manufactured with the CFC containing blowing agent and strict enforcement of these regulations could impact our ability to lease or sell these refrigerated containers in EU countries. The container industry in China has always used solvent-based paint systems. New regulations in China for the container industry require stopping the use of solvent-based paint systems, due to the restrictions on volatile organic compounds used in solvent-based paints. To comply with the new regulations, new water borne paint systems have been developed and are being used by container manufacturers. This change was already implemented in all factories in Southern China as of July 2016. The remaining container factories in China have been required to use water borne paint systems since April 1, 2017. The use of water borne paint systems has required significant factory investment and it is problematic to apply water borne paint during the winter in colder parts of China. The conversion to water borne paint may impact factory capacity, increase the cost of containers and require greater investment by us in container inspection and factory supervision.
We are subject to certain U.S. laws that may impact our international operations and any investigation or determination that we violated these laws may affect our business and operations adversely.
As a Bermuda corporation that has an indirect wholly-owned U.S. subsidiary with operations in the U.S., our U.S. operations are subject to certain U.S. laws that may also impact our international operations. We are subject to the regulations imposed by the Foreign Corrupt Practices Act, which generally prohibits U.S. companies and their intermediaries from making improper payments to foreign officials for the purpose of obtaining or keeping business. We are also subject to U.S. Executive Orders and U.S. Treasury sanctions regulations restricting or prohibiting business dealings in or with certain nations and with certain specially designated nationals (individuals and legal entities). Any determination or investigation into violations of these laws and regulations could have a material adverse effect on our business, financial condition, results of operations and cash flows.
We could face litigation involving our management of containers for container investors.
We manage containers for container investors under management agreements that are negotiated with each container investor. We make no assurances to container investors that they will make any amount of profit on their investment or that our management activities will result in any particular level of income or return of their initial capital. Although our management agreements contain contractual protections and indemnities that are designed to limit our exposure to such litigation, such provisions may not be effective, and we may be subject to a significant loss in a successful litigation by a container investor.
25
We may not be able to resume paying a dividend and any dividends paid in the future could be reduced or eliminated.
We eliminated our dividend payment in fourth quarter of 2016. We may not be able to reinstate our dividend program and pay future dividends, and if reinstated any future dividend could again be eliminated or reduced. The declaration, amount and payment of future dividends are at the discretion of our board of directors and will be dependent on our future operating results and the cash requirements of our business. There are a number of factors that can affect our ability to pay dividends and there is no guarantee that we will pay dividends in any given year, in each quarter of a year, or pay any specific amount of dividends. In addition, we will not pay dividends in the event we are not allowed to do so under Bermuda law, are in default under (or such payment would cause a default under) TL’s revolving credit facilities or term loan, or if such payment would cause us to breach any of our covenants. These covenants include certain financial covenants, which would be directly affected by the payment of dividends, such as a maximum ratio of consolidated funded debt to consolidated tangible net worth (which amount would decrease by the amount of any dividend paid). The reduction, suspension or elimination of dividends may negatively affect the market price of our common shares. Furthermore, since we are a holding company, substantially all of the assets shown on our consolidated balance sheet are held by our subsidiaries. Accordingly, our earnings and cash flow and our ability to pay dividends are largely dependent upon the earnings and cash flows of our subsidiaries and the distribution or other payment of such earnings to us in the form of dividends as permitted under our lending agreements.
We face risks from our share repurchase program
In 2015 we announced a share repurchase program to repurchase up to $100 million of our shares. Purchases under this program are at our discretion and we may not purchase all $100 million of shares under the program. This program may be reduced or terminated at any time by us. Using our available cash to purchase shares may reduce the amount available for dividend payments which could cause us to need to reduce the amount of our dividend or adopt a more flexible dividend policy. Share repurchases may also reduce our financial flexibility and limit our ability to reduce debt and may reduce our funds available for container investments. Using funds to repurchase shares could cause our debt to equity ratio to increase and may impair our ability to comply with the financial covenants in our debt agreements. Share repurchases may also reduce the number of shares available for other investors to purchase in the market which could add to share price volatility for our stock. We face these and other risks related to share repurchases. During 2015, the Company repurchased 630,000 shares at an average price of $14.52 for a total amount of $9,149. The Company did not repurchase any of its common shares during 2016 and 2017.
The calculation of our income tax expense requires judgment and the use of estimates.
We periodically assess tax positions based on current tax developments, including enacted statutory, judicial and regulatory guidance. In analyzing our overall tax position, consideration is given to the amount and timing of recognizing income tax liabilities and benefits. In applying the tax and accounting guidance to the facts and circumstances, income tax balances are adjusted appropriately through the income tax provision. We account for income tax positions on uncertainties by recognizing the effect of income tax positions only if those positions are more likely than not of being sustained and maintain reserves for income tax positions we believe are not more likely than not of being sustained. Recognized income tax positions are measured at the largest amount that is greater than 50% likely of being realized. However, due to the judgment required in estimating those reserves, actual amounts paid, if any, could differ from these estimates.
Future changes in accounting rules could significantly impact how both we and our customers account for our leases.
Our consolidated financial statements are prepared in accordance with generally accepted accounting principles in the United States of America (“U.S. GAAP”). In February 2016, the Financial Accounting Standards Board (“FASB”) issued Accounting Standards Update No. 2016-02, Leases (Topic 842) (“ASU 2016-02”). Under this new guidance, lessor accounting is largely unchanged. Certain targeted improvements were made to align, where necessary, lessor accounting with the lessee accounting model and Topic 606, Revenue from Contracts with Customers. Lessees will be required to recognize the following for all leases (with the exception of short-term
26
leases) at the commencement date: (1) a lease liability, which is a lessee’s obligation to make lease payments arising from a lease, measured on a discounted basis; and (2) a right-of-use asset, which is an asset that represents the lessee’s right to use, or control the use of, a specified asset for the lease term. The new lease guidance also simplified the accounting for sale and leaseback transactions primarily because lessees must recognize lease assets and lease liabilities. Lessees will no longer be provided with a source of off-balance sheet financing. The guidance is effective for interim and annual periods beginning after December 15, 2018 and early application is permitted. Because this new guidance virtually eliminates for lessees the financial statement benefit of entering into operating leases, it could change the way we and our customers conduct our businesses.
Risks Related to Our Common Shares
The market price and trading volume of our common shares, which may be affected by market conditions beyond our control, have been volatile and could continue to remain volatile.
The market price of our common shares has been, and may continue to be highly volatile and subject to wide fluctuations. In addition, the trading volume in our common shares has fluctuated and may continue to fluctuate, causing significant price variations to occur. Since our initial public offering, our common shares have fluctuated from an intra-day low of $4.23 per share to an intra-day high of $43.96 per share. If the market price of the shares declines significantly, the value of an investment in our common shares would decline. The market price of our common shares may fluctuate or decline significantly in the future. Some of the factors that could negatively affect the price of our common shares or result in fluctuations in the price or trading volume of our common shares include:
| • | variations in our quarterly operating results; |
| • | failure to meet analysts’ earnings estimates; |
| • | publication of research reports about us, other intermodal container lessors or the container shipping industry or the failure of securities analysts to cover our common shares or our industry; |
| • | additions or departures of key management personnel; |
| • | adverse market reaction to any indebtedness we may incur or preference or common shares we may issue in the future; |
| • | changes in our dividend payment policy or failure to execute our existing policy; |
| • | our share repurchase program, the execution of this program or changes in this program; |
| • | actions by shareholders; |
| • | changes in market valuations of similar companies; |
| • | announcements by us or our competitors of significant contracts, acquisitions, dispositions, strategic partnerships, joint ventures or capital commitments; |
| • | speculation in the press or investment community; |
| • | changes or proposed changes in laws or regulations affecting the container shipping industry or enforcement of these laws and regulations, or announcements relating to these matters; and |
| • | impact of global financial crises or stock market disruptions. |
Recently and in the past, the stock market has experienced extreme price and volume fluctuations. These market fluctuations could result in extreme volatility in the trading price of our common shares, which could cause a decline in the value of your investment in our common shares. In addition, the trading price of our common shares could decline for reasons unrelated to our business or financial results, including in reaction to events that affect other companies in our industry even if those events do not directly affect us. You should also be aware that price volatility may be greater if the public float and trading volume of our common shares are low.
27
One of our major shareholders, Halco Holdings Inc. (“Halco”), is owned by Trencor, and Halco could act in a manner with which other shareholders may disagree or that is not necessarily in the interests of other shareholders.
Halco currently owns approximately 47.8% of our issued and outstanding common shares. On January 1, 2018, Halco entered into a voting limitation deed with the Company, pursuant to which Halco agreed to limit its shareholder voting rights in the Company, solely in respect of the appointment and/or removal of directors. Otherwise, Halco has the ability to influence the outcome of matters submitted to our shareholders for approval, including any amalgamation, merger, consolidation or sale of all or substantially all of our assets. Three of our nine directors are also directors of Trencor and two of our directors are directors of Halco. Halco may have interests that are different from other shareholders. For example, it may support proposals and actions with which you may disagree or which are not in your interests as a shareholder of our company. The concentration of ownership could delay or prevent a change in control of us or otherwise discourage a potential acquirer from attempting to obtain control of us, which in turn could reduce the price of our common shares. Additionally, we have no agreements with Halco or Trencor that limit or restrict their ability to sell or transfer their shares in us. Any sale or transfer of some or all of the common shares owned by Halco could adversely affect our share price.
Affiliates of Halco and Trencor may compete with us and compete with some of our customers.
Halco and Trencor, through their affiliates, are free to compete with us, and have engaged in the past and will likely continue to engage in businesses that are similar to ours. In particular, Leased Assets Pool Company Limited (“LAPCO”), an affiliate of Halco, owns containers, has competed against us and our customers through its investment in containers and has used our competitors to manage some of its containers in the past. Thus, although we have a management agreement with LAPCO to manage a majority of its containers, we expect that we will continue to compete with LAPCO in the future, which may result in various conflicts of interest.
Our current management and share ownership structure may create conflicts of interest.
Three of our nine directors are also directors of Trencor and two of our directors are directors of Halco. These directors owe fiduciary duties to each company and may have conflicts of interest in matters involving or affecting us as well as Halco and Trencor, including matters arising under our agreements with Halco and its affiliates. In addition, to the extent that some of these directors may own shares in Trencor, they may have conflicts of interest when faced with decisions that could have different implications for Trencor than they do for us. Furthermore, Trencor, as a South African company, endorses the Code of Corporate Practices and Conduct in the King III Report on Corporate Governance. The King IV Report on Corporate Governance is a document promulgated by the South African Institute of Directors which, among other things, suggests that corporations in their corporate decision-making consider the following stakeholders in addition to the owners of shares: parties who contract with the enterprise; parties who have a non-contractual nexus with the enterprise (including civic society and the environment); and the state. Halco and/or Trencor may seek to impose these corporate governance practices on us, which may result in constraints on management and may involve significant costs. Your interests as a holder of our common shares may not align with the interests of Halco and/or Trencor and their affiliates and shareholders.
We are a holding company with no material direct operations and rely on our operating subsidiaries to provide us with funds necessary to meet our financial obligations and to pay dividends.
We are a holding company with no material direct operations. Our principal assets are the equity interests we directly or indirectly hold in our operating subsidiaries, which own our operating assets. As a result, we are dependent on loans, dividends and other payments from our subsidiaries to generate the funds necessary to meet our financial obligations and to pay dividends on our common shares. Our subsidiaries are legally distinct from us and may be prohibited or restricted from paying dividends or otherwise making funds available to us under certain conditions or lending covenants. If we are unable to obtain funds from our subsidiaries, we may be unable to, or our board may exercise its discretion not to, pay dividends on our common shares.
28
Our ability to issue securities in the future may be materially constrained by Trencor’s South African currency restrictions and JSE Listings Requirements and Trencor’s results may differ from our results due to their use of different accounting standards.
Trencor, a South African company listed on the JSE Limited (the “JSE”), owns 100% of Halco, which currently has an interest in 47.8% of our issued and outstanding shares. Three of our nine directors are also directors of Trencor and two of our directors are directors of Halco. Both South African exchange control authorities and the JSE impose certain restrictions on Trencor.
South Africa’s exchange control regulations provide for restrictions on exporting capital from South Africa. These restrictions require Trencor to obtain approval from South African exchange control authorities before Halco engages in transactions that would result in dilution of Halco’s share interest in us below certain thresholds, whether through Halco’s sale of its own shareholdings or through its approval of our issuance of new shares. The exchange control authorities may decide not to grant such approval if a proposed transaction were to dilute Halco’s interest in us below certain levels. While the South African government has, to some extent, relaxed exchange controls in recent years, it is difficult to predict whether or how it will further relax or abolish exchange control measures in the future. The above requirements could restrict or limit our ability to issue new shares. In addition, Trencor is required to comply with JSE Listings Requirements in connection with Halco’s holding or sale of our common shares.
The above requirements could limit our financial flexibility by, among other things, impacting our future ability to raise funds through the issuance of securities, preventing or limiting the use of our common shares as consideration in acquisitions, and limiting our use of option grants and restricted share grants to our directors, officers and other employees as incentives to improve the financial performance of our company. Additionally, Trencor reports its results under the IFRS accounting standards while we report under U.S. GAAP. This may cause Trencor’s reporting of our results to differ from what we report and may result in an inability to reconcile the results of both companies, market confusion and an inconsistent market reaction when both companies report results.
It may not be possible for investors to enforce U.S. judgments against us.
We and all of our direct and indirect subsidiaries, except Textainer Equipment Management (U.S.) Limited and Textainer Equipment Management (U.S.) II LLC, are incorporated in jurisdictions outside the U.S. A substantial portion of our assets and those of our subsidiaries are located outside of the U.S. In addition, most of our directors are non-residents of the U.S., and all or a substantial portion of the assets of these non-residents are located outside the U.S. As a result, it may be difficult or impossible for U.S. investors to serve process within the U.S. upon us, our non-U.S. subsidiaries, or our directors, or to enforce a judgment against us for civil liabilities in U.S. courts. In addition, you should not assume that courts in the countries in which we or our subsidiaries are incorporated or where our assets or the assets of our subsidiaries are located would enforce judgments of U.S. courts obtained in actions against us or our subsidiaries based upon the civil liability provisions of applicable U.S. federal and state securities laws, or would enforce, in original actions, liabilities against us or our subsidiaries based on those laws.
We are a foreign private issuer and, as a result, under New York Stock Exchange (“NYSE”) rules, we are not required to comply with certain corporate governance requirements.
As a foreign private issuer, we are permitted by the NYSE to comply with Bermuda corporate governance practice in lieu of complying with certain NYSE corporate governance requirements. This means that we are not required to comply with NYSE requirements that:
| • | the board of directors consists of a majority of independent directors; |
| • | independent directors meet in regularly scheduled executive sessions; |
| • | the audit committee satisfy NYSE standards for director independence (although we must still comply with independence standards pursuant to Rule 10A-3 promulgated under the U.S. Securities Exchange Act of 1934, as amended); |
| • | the audit committee have a written charter addressing the committee’s purpose and responsibilities; |
| • | we have a nominating and corporate governance committee composed of independent directors with a written charter addressing the committee’s purpose and responsibilities; |
29
| • | we have a compensation committee composed of independent directors with a written charter addressing the committee’s purpose and responsibilities; |
| • | we establish corporate governance guidelines and a code of business conduct; |
| • | our shareholders approve any equity compensation plans; and |
| • | there be an annual performance evaluation of the nominating and corporate governance and compensation committees. |
Our board of directors has adopted an audit committee charter, a compensation committee charter and a nominating and governance committee charter. Additionally, we have a company code of conduct, corporate governance guidelines, conduct performance evaluations of our board and committees, and have obtained shareholder approval for our equity compensation plan. However, we use some of the exemptions available to a foreign private issuer. As a result, our board of directors may not consist of a majority of independent directors and our compensation committee may not consist of any or a majority of independent directors. Accordingly, our shareholders may not have the same protections afforded to shareholders of companies that are subject to all of the NYSE corporate governance requirements.
Required public company corporate governance and financial reporting practices and policies have increased our costs, and we may be unable to provide the required financial information in a timely and reliable manner.
Our management may not be able to continue to meet the regulatory compliance and reporting requirements that are applicable to us as a public company. This result may subject us to adverse regulatory consequences, and could lead to a negative reaction in the financial markets due to a loss of confidence in the reliability of our financial statements. If we do not maintain compliance with the requirements of Section 404 of the Sarbanes-Oxley Act of 2002, or if we or our independent registered public accounting firm identify deficiencies in our internal controls over financial reporting that are deemed to be material weaknesses, we could suffer a loss of investor confidence in the reliability of our financial statements, which could cause the market price of our common shares to decline.
In addition, if we fail to maintain effective controls and procedures, we may be unable to provide the required financial information in a timely and reliable manner or otherwise comply with the standards applicable to us as a public company. Any failure by us to timely provide the required financial information could materially and adversely impact our financial condition and the market value of our common shares. Furthermore, testing and maintaining internal controls can divert our management’s attention from other matters that are important to our business. These regulations have increased our legal and financial compliance costs, we expect the regulations to make it more difficult to attract and retain qualified officers and directors, particularly to serve on our audit committee, and make some activities more difficult, time consuming and costly.
Future sales of a large number of our securities into the public market, or the expectation of such sales, could cause the market price of our common shares to decline significantly.
Sales of substantial amounts of common securities into the public market, or the perception that such sales will occur, may cause the market price of our common shares to decline significantly. In September 2012, we completed a sale of 8,625,000 common shares, including 2,500,000 common shares offered by a selling shareholder, Halco. The price of our shares could be negatively impacted if we undertake additional offerings to sell securities. In addition, at our 2010 Annual General Meeting of Shareholders held on May 19, 2010, our shareholders approved an amendment to our 2007 Share Incentive Plan to increase the maximum number of our common shares issuable pursuant to such plan by 1,468,500 shares from 3,808,371 shares to 5,276,871 shares. On May 21, 2015, our shareholders approved an amendment and restatement of the 2007 Share Incentive Plan as the 2015 Share Incentive Plan and to increase the maximum number of our common shares issuable pursuant to such plan by 2,000,000 shares and to extend the term of such plan for ten years from the date of the annual meeting of shareholders. The common shares to be issued pursuant to awards under our 2015 Share Incentive Plan have been registered on registration statements on Form S-8 filed with the Securities Exchange Commission and, when issued, will be freely tradable under the Securities Act of 1933.
30
We have provisions in our bye-laws that may discourage a change of control.
Bermuda law and our bye-laws contain provisions that could make it more difficult for a third party to acquire us without the consent of our board of directors. These include provisions:
| • | requiring the approval of not less than 66% of our issued and outstanding voting shares for certain merger or amalgamation transactions that have not been approved by our board of directors; |
| • | prohibiting us from engaging in a business combination with an interested shareholder for a period of three years after the date of the transaction in which the person becomes an interested shareholder, unless certain conditions are met; |
| • | authorizing our board of directors to issue blank-check preference shares without shareholder approval; |
| • | establishing a classified board with staggered three-year terms; |
| • | only authorizing the removal of directors (i) for cause by the affirmative vote of the holders of a majority of the votes cast at a meeting or (ii) without cause by the affirmative vote of the holders of 66% of the common shares then issued and outstanding and entitled to vote on the resolution; and |
| • | establishing advance notice requirements for nominations for election to our board of directors. |
These provisions may make it difficult and expensive for a third party to pursue a tender offer, change in control or takeover attempt that is opposed by our management and/or our board of directors. Public shareholders who might desire to participate in these types of transactions may not have an opportunity to do so. These provisions could substantially impede the ability of public shareholders to benefit from a change in control or change our management and board of directors and, as a result, may adversely affect the market price of our common shares and your ability to realize any potential change of control premium.
As a shareholder of our company, you may have greater difficulties in protecting your interests than as a shareholder of a U.S. corporation.
The Companies Act 1981 of Bermuda, as amended (the “Companies Act”), applies to our company and differs in material respects from laws generally applicable to U.S. corporations and their shareholders. Taken together with the provisions of our bye-laws, some of these differences may result in your having greater difficulties in protecting your interests as a shareholder of our company than you would have as a shareholder of a U.S. corporation. This affects, among other things, the circumstances under which transactions involving an interested director are voidable, whether an interested director can be held accountable for any benefit realized in a transaction with our company, what approvals are required for business combinations by our company with a large shareholder or a wholly-owned subsidiary, what rights you may have as a shareholder to enforce specified provisions of the Companies Act or our bye-laws, and the circumstances under which we may indemnify our directors and officers.
Our bye-laws restrict shareholders from bringing legal action against our officers and directors.
Our bye-laws contain a broad waiver by our shareholders of any claims or right of action, both individually and on our behalf, against any of our officers or directors. The waiver applies to any action taken by an officer or director, or the failure of an officer or director to take any action, in the performance of his or her duties, except with respect to any matter involving any fraud or dishonesty on the part of the officer or director. This waiver limits the right of shareholders to assert claims against our officers and directors unless the act or failure to act involves fraud or dishonesty.
31
| ITEM 4. | INFORMATION ON THE COMPANY |
| A. | History and Development of the Company |
Our business began operations in 1979. We reorganized our business in 1993 and incorporated Textainer Group Holdings Limited under the laws of Bermuda as a holding company of a group of corporations involved in the purchase, ownership, management, leasing and disposal of a fleet of intermodal containers. Textainer Group Holdings Limited is incorporated with an indefinite duration under registration number EC18896. Textainer Group Holdings Limited’s common shares are listed on the New York Stock Exchange (“NYSE”) under the symbol “TGH”. Textainer Group Holdings Limited’s headquarters office is located at Century House, 16 Par-La-Ville Road, Hamilton HM 08 Bermuda and our telephone number is (441) 296-2500. Our agent in the United States is Daniel W. Cohen, Textainer Group Holdings Limited, c/o Textainer Equipment Management (U.S.) Limited, 650 California Street, 16th Floor, San Francisco, CA 94108.
At December 31, 2017, Textainer Group Holdings Limited had two directly-owned subsidiaries:
| • | Textainer Equipment Management Limited (“TEML”), our wholly-owned subsidiary incorporated in Bermuda, which provides container management, acquisition and disposal services to affiliated and unaffiliated container investors; and |
| • | Textainer Limited (“TL”), our wholly-owned subsidiary incorporated in Bermuda, which owns containers directly and via six subsidiaries: |
| • | Textainer Marine Containers II Limited (“TMCL II”), a Bermuda company which is wholly-owned by TL; |
| • | Textainer Marine Containers III Limited (“TMCL III”), a Bermuda company which is wholly-owned by TL; |
| • | Textainer Marine Containers IV Limited (“TMCL IV”), a Bermuda company which is wholly-owned by TL; |
| • | Textainer Marine Containers V Limited (“TMCL V”), a Bermuda company which is wholly-owned by TL; |
| • | TAP Funding Ltd. (“TAP Funding”), a Bermuda company in which TL and TAP Limited (“TAP”) hold common shares of 50.1% and 49.9%, respectively, and voting rights of 66.7% and 33.3%, respectively; and |
| • | TW Container Leasing Ltd. (“TW”), a Bermuda company in which TL and Wells Fargo Container Corp. (“WFC”) hold common shares and related voting rights of 25% and 75%, respectively. |
Trencor Limited (“Trencor”), a company publicly traded on the JSE Limited (the “JSE”) in Johannesburg, South Africa under the symbol “TRE”, and its affiliate currently has beneficiary interest in 47.8% of our issued and outstanding common shares as shareholder of Halco Holdings Inc.
Our internet website address is www.textainer.com. The information contained on, or that can be accessed through, our website is not incorporated into and is not intended to be a part of this Annual Report on Form 20-F.
Significant Events
On July 23, 2015, TL entered into a five-year revolving credit facility (the “TL Revolving Credit Facility II”) with a group of financial institutions and an aggregate commitment amount of up to $190,000. The TL Revolving Credit Facility II provides for payments of interest only during its term beginning on its inception date through July 23, 2020, when all borrowings are due in full. Interest on the outstanding amount due under the TL Revolving Credit Facility II is based either on the base rate or LIBOR plus a spread between 0.80% and 1.65%, which varies based on TGH’s leverage.
32
In August 2015, one of the Company’s customers became insolvent and containers on operating and direct financing leases to the customer were deemed unlikely to be recovered. The Company maintains insurance that covers a portion of the exposure related to the value of containers that are unlikely to be recovered from its customers, the cost to recover containers and up to 183 days of lost lease rental income. Accordingly, during the year ended December 31, 2015, an impairment was recorded to write off containers, net and net investment in direct financing and sales-type leases with book values of $8,815 and $2,903, respectively. In addition, bad debt expense of $2,574 was recorded for the year ended December 31, 2015 to fully reserve for the customer’s outstanding accounts receivable (see Note 3 “Insurance Receivable and Impairment” to our consolidated financial statements in Item 18, “Financial Statements” in this Annual Report on Form 20-F for additional information).
On October 29, 2015, TGH’s board of directors approved a share repurchase program of up to $100,000 of the Company’s common shares. Under the program, the Company may purchase its common shares from time to time in the open market, in privately negotiated transactions or by establishing a trading plan under Rule 10b5-1 of the Securities Exchange Act of 1934 to facilitate purchases of its common shares (see Note 16 “Share Repurchase Program” to our consolidated financial statements in Item 18, “Financial Statements” in this Annual Report on Form 20-F for additional information).
In February and March 2016, we concluded two separate purchases totaling approximately 41,000 containers that we had been managing for an institutional investor for total purchase consideration of $71.0 million (see Note 4 “Container Purchases” to our consolidated financial statements in Item 18, “Financial Statements” in this Annual Report on Form 20-F for additional information).
In April and June 2016, we concluded two separate purchase leaseback transactions for approximately 15,000 containers from a shipping company for total purchase consideration of $21.2 million (see Note 5 “Purchase-Leaseback Transactions” to our consolidated financial statements in Item 18, “Financial Statements” in this Annual Report on Form 20-F for additional information).
In August 2016, one of the Company’s customers, Hanjin Shipping company Co., Ltd (“Hanjin”), filed for bankruptcy. The Company maintains insurance that covers a portion of the exposure related to the value of containers that are unlikely to be recovered from its customers, the cost to recover containers and up to 183 days of lost lease rental income. Accordingly, during the year ended December 31, 2016, an impairment of $22,149 representing $17,399 to write down the containers on direct finance leases with Hanjin to the lower of estimated fair market value or net book value and $4,750 insurance deductible. In addition, bad debt expense of $18,992, net of estimated insurance proceeds of $2,592, was recorded for the year ended December 31, 2016 to fully reserve for Hanjin’s outstanding accounts receivable. (see Note 3 “Insurance Receivable and Impairment” to our consolidated financial statements in Item 18, “Financial Statements” in this Annual Report on Form 20-F for additional information).
During the second quarter of 2017, TMCL III’s 2013-1 Bonds and 2014-1 Bonds were early terminated and were fully repaid by the proceeds from the TMCL III’s 2017-A Notes, which itself was full repaid by the proceeds from the TMCL V’s 2017-1 Bonds. The Company wrote off $7,228 of unamortized debt issuance costs and bond discounts during the period. (see Note 12 “Secured Debt Facilities, Credit Facilities, Term Loan and Bonds Payable, and Derivative Instruments” to our consolidated financial statements in Item 18, “Financial Statements” in this Annual Report on Form 20-F for additional information).
During the second quarter of 2017, TMCL V issued the Series 2017-1 Fixed Rate Asset Backed Notes (the “2017-1 Bonds”) and the Series 2017-2 Fixed Rate Asset Backed Notes (“2017-2 Bonds’) in an aggregated principal amount of $420,000 and $500,000, respectively. Both 2017-1 Bonds and 2017-2 Bonds were issued at fixed interest rates. Proceeds from the 2017-1 Bonds and 2017-2 Bonds were primarily used to fully repay the TMCL III debts and to repay the Company’s certain short-term debts, respectively (see Note 12 “Secured Debt Facilities, Credit Facilities, Term Loan and Bonds Payable, and Derivative Instruments” to our consolidated financial statements in Item 18, “Financial Statements” in this Annual Report on Form 20-F for additional information).
During the second half of 2017, we concluded three separate purchases totaling approximately 20,000 containers that we had been managing for institutional investors for a total purchase consideration of $19.9 million (see Note 4 “Container Purchases” to our consolidated financial statements in Item 18, “Financial Statements” in this Annual Report on Form 20-F for additional information).
33
During third quarter of 2017, the Company entered into an agreement with a third-party to manage approximately 112,000 containers in 182,000 TEU owned by that third-party effective August 1, 2017.
On August 31, 2017, TMCL II entered into an amendment of the TMCL II Secured Debt Facility which extended the conversion date to August 2020, and lowered the interest margin (see Note 12 “Secured Debt Facilities, Credit Facilities, Term Loan and Bonds Payable, and Derivative Instruments” to our consolidated financial statements in Item 18, “Financial Statements” in this Annual Report on Form 20-F for additional information).
On December 8, 2017, TAP Funding entered into an amendment of the TAP Funding Revolving Credit Facility which extended the maturity date to December 2021, increased the advance rate, lowered the interest rate margin and increased the aggregate commitment amount from $150,000 to $190,000 (see Note 12 “Secured Debt Facilities, Credit Facilities, Term Loan and Bonds Payable, and Derivative Instruments” to our consolidated financial statements in Item 18, “Financial Statements” in this Annual Report on Form 20-F for additional information).
On December 22, 2017, the U.S. Tax Cuts and Jobs Act of 2017 (TCJA) was enacted. The most significant impact on the Company is the U.S. federal corporate income tax reduction from 35% to 21% beginning January 01, 2018. A change in tax law is accounted for in the period of enactment, which require re-measurement of all our U.S. deferred income tax asset and liabilities during this period-end. The corporate tax reduction resulted in a $2,653 one-time reduction in our net deferred tax liabilities and was recorded as a credit adjustment to our 2017 income tax expense. (see Note 11 “Income Taxes” to our consolidated financial statements in Item 18, “Financial Statements” in this Annual Report on Form 20-F for additional information).
On January 31, 2018, TMCL IV terminated its secured debt facility and the unpaid debt amount of $129,400 was fully repaid by $124,608 proceeds from the TL Revolving Credit Facility and TMCL IV’s available cash of $4,792.
On February 15, 2018, Textainer Marine Containers VI Limited, an indirect wholly-owned subsidiary of the Company, completed a $300 million seven-year fixed rate term facility. The proceeds of the facility were used to pay down certain of the Company’s short-term debt. (see Note 17 “Subsequent Events” to our consolidated financial statements in Item 18, “Financial Statements” in this Annual Report on Form 20-F for additional information).
In February 2018, we concluded a purchase of approximately 18,000 containers that we had been managing for an institutional investor for a total purchase consideration of $13.2 million.
Principal Capital Expenditures
Our capital expenditures for containers in our owned fleet and fixed assets during 2017, 2016 and 2015 were $300.1 million, $505.5 million and $533.3 million, respectively. We received proceeds from the sale of containers and fixed assets during 2017, 2016 and 2015 of $135.3 million, $126.6 million and $129.5 million, respectively.
As all of our containers are used internationally, where no one container is domiciled in one particular place for a prolonged period of time, all of our long-lived assets are considered to be international with no single country of use. Our capital requirements are primarily financed through cash flows from operations, our secured debt facilities, share offerings and our revolving credit facilities.
34
| B. | Business Overview |
Our Company
We are one of the world’s largest lessors of intermodal containers based on fleet size, with a total fleet of approximately 2.2 million containers, representing almost 3.3 million TEU. Containers are an integral component of intermodal trade, providing a secure and cost-effective method of transportation because they can be used to transport freight by ship, rail or truck, making it possible to move cargo from point of origin to final destination without repeated unpacking and repacking. We lease containers to approximately 300 shipping lines and other lessees, including each of the world’s top 20 container lines, as measured by the total TEU capacity of their container vessels. We believe that our scale, global presence, customer service, market knowledge and long history with our customers have made us one of the most reliable suppliers of leased containers. We have a long track record in the industry, operating since 1979, and have developed long-standing relationships with key industry participants. Our top 20 customers, as measured by revenues, have leased containers from us for an average of almost 30 years.
We have provided an average of more than 210,000 TEU of new containers per year for the past five years, and have been one of the largest buyers of new containers over the same period. We are one of the largest sellers of used containers, having sold an average of more than 130,000 containers per year for the last five years to more than 1,400 customers.
We provide our services worldwide via an international network of 14 regional and area offices and more than 500 independent depots.
We operate our business in three core segments.
| • | Container Ownership. As of December 31, 2017, we owned containers accounting for approximately 79% of our fleet. |
| • | Container Management. As of December 31, 2017, we managed containers on behalf of 12 affiliated and unaffiliated container investors, providing acquisition, management and disposal services. As of December 31, 2017, total managed containers accounted for approximately 21% of our fleet. |
| • | Container Resale. We generally sell containers from our fleet when they reach the end of their useful lives in marine service or when we believe it is financially attractive for us to do so, considering location, sale price, the cost of repair, and possible repositioning expenses. We also purchase and lease or resell containers from shipping line customers, container traders and other sellers of containers. |
Our total revenues primarily consist of leasing revenues derived from the lease of our owned containers and, to a lesser extent, fees received for managing containers owned by third parties and equipment resale. The most important driver of our profitability is the extent to which revenues on our owned fleet and management fee income exceed our operating costs. The key drivers of our revenues are fleet size, rental rates, sales proceeds, utilization and direct costs. Our operating costs primarily consist of depreciation and amortization, container impairment, interest expense, direct operating expenses and administrative expenses. Our lessees are generally responsible for loss of or damage to a container beyond ordinary wear and tear, and they are required to purchase insurance to cover any other liabilities.
Our total fleet consists of containers that we own and containers owned by other container investors that we manage. In general, owning containers during periods of high demand for containers provides higher margins than managing containers, since we receive all of the net operating income for the containers that we own but only a percentage of the net operating income of the containers that we manage as a management fee. On the other hand, managing containers during periods of low demand for containers reduces the negative financial impact of such periods since the container investors bear the cost or risk of owning the containers.
For 2017, we generated revenues, income from operations and income before income tax and noncontrolling interests of $490.9 million, $143.9 million and $22.4 million, respectively. During 2017, the average utilization of our owned fleet was 96.4%. As mentioned above, we operate in three reportable segments: Container Ownership,
35
Container Management and Container Resale. The following tables summarize revenues, by category of activity, and income before income tax and noncontrolling interests generated from each of our operating segments reconciled to our total revenues and income before income tax and noncontrolling interests shown in our consolidated statements of comprehensive income included in Item 18, “Financial Statements” in this Annual Report on Form 20-F for the fiscal years ended December 31, 2017, 2016 and 2015:
| 2017 |
Container Ownership |
Container Management |
Container Resale |
Other | Eliminations | Totals | ||||||||||||||||||
| Lease rental income |
$ | 442,219 | $ | 2,669 | $ | — | $ | — | $ | — | $ | 444,888 | ||||||||||||
| Management fees from external customers |
266 | 9,953 | 4,775 | — | — | 14,994 | ||||||||||||||||||
| Inter-segment management fees |
— | 40,269 | 9,477 | — | (49,746 | ) | — | |||||||||||||||||
| Trading container sales proceeds |
— | — | 4,758 | — | — | 4,758 | ||||||||||||||||||
| Gain on sale of containers, net |
26,210 | — | — | — | — | 26,210 | ||||||||||||||||||
|
|
|
|
|
|
|
|
|
|
|
|
|
|||||||||||||
| Total revenues |
$ | 468,695 | $ | 52,891 | $ | 19,010 | $ | — | $ | (49,746 | ) | $ | 490,850 | |||||||||||
|
|
|
|
|
|
|
|
|
|
|
|
|
|||||||||||||
| Segment (loss) income before income tax and noncontrolling interests |
$ | (1,707 | ) | $ | 15,376 | $ | 10,854 | $ | (3,568 | ) | $ | 1,405 | $ | 22,360 | ||||||||||
|
|
|
|
|
|
|
|
|
|
|
|
|
|||||||||||||
| 2016 (1) |
Container Ownership |
Container Management |
Container Resale |
Other | Eliminations | Totals | ||||||||||||||||||
| Lease rental income |
$ | 458,246 | $ | 2,181 | $ | — | $ | — | $ | — | $ | 460,427 | ||||||||||||
| Management fees from external customers |
291 | 10,076 | 3,053 | — | — | 13,420 | ||||||||||||||||||
| Inter-segment management fees |
— | 38,080 | 8,493 | — | (46,573 | ) | — | |||||||||||||||||
| Trading container sales proceeds |
— | — | 15,628 | — | — | 15,628 | ||||||||||||||||||
| Gain on sale of containers, net |
6,761 | — | — | — | — | 6,761 | ||||||||||||||||||
|
|
|
|
|
|
|
|
|
|
|
|
|
|||||||||||||
| Total revenues |
$ | 465,298 | $ | 50,337 | $ | 27,174 | $ | — | $ | (46,573 | ) | $ | 496,236 | |||||||||||
|
|
|
|
|
|
|
|
|
|
|
|
|
|||||||||||||
| Segment income (loss) before income tax and noncontrolling interests |
$ | (84,252 | ) | $ | 18,134 | $ | 6,178 | $ | (3,016 | ) | $ | 1,633 | $ | (61,323 | ) | |||||||||
|
|
|
|
|
|
|
|
|
|
|
|
|
|||||||||||||
| 2015 |
Container Ownership |
Container Management |
Container Resale |
Other | Eliminations | Totals | ||||||||||||||||||
| Lease rental income |
$ | 510,954 | $ | 1,590 | $ | — | $ | — | $ | — | $ | 512,544 | ||||||||||||
| Management fees from external customers |
317 | 12,002 | 3,291 | — | — | 15,610 | ||||||||||||||||||
| Inter-segment management fees |
— | 45,620 | 10,104 | — | (55,724 | ) | — | |||||||||||||||||
| Trading container sales proceeds |
— | — | 12,670 | — | — | 12,670 | ||||||||||||||||||
| Gain on sale of containers, net |
3,454 | — | — | — | — | 3,454 | ||||||||||||||||||
|
|
|
|
|
|
|
|
|
|
|
|
|
|||||||||||||
| Total revenues |
$ | 514,725 | $ | 59,212 | $ | 26,065 | $ | — | $ | (55,724 | ) | $ | 544,278 | |||||||||||
|
|
|
|
|
|
|
|
|
|
|
|
|
|||||||||||||
| Segment income (loss) before income tax and noncontrolling interests |
$ | 88,536 | $ | 26,305 | $ | 9,335 | $ | (4,283 | ) | $ | 786 | $ | 120,679 | |||||||||||
|
|
|
|
|
|
|
|
|
|
|
|
|
|||||||||||||
| (1) | Certain previously reported information has been revised for the effect of immaterial corrections of identified errors pertaining to the calculation of gain on sale of container, net and to properly account for lease concessions. See Note 2 “Immaterial Correction of Errors in Prior Periods” to our consolidated financial statements in Item 18, “Financial Statements” in this Annual Report on Form 20-F. |
General and administrative expenses are allocated to the reportable business segments based on direct overhead costs incurred by those segments. Amounts reported in the “Other” column represent activity unrelated to the active reportable operating segments. Amounts reported in the “Eliminations” column represent inter-segment management fees between the container management, container resale and container ownership segments.
Our container lessees use containers for their global trade utilizing many worldwide trade routes. The Company earns its revenue from these international carriers when the containers are on lease. Substantially all of our leasing related revenues are denominated in U.S. dollars.
The largest portion of our fleet is comprised of dry freight containers, which are by far the most common of the three principal types of intermodal containers. Dry freight intermodal containers are large, standardized steel boxes used to transport cargo by multiple modes of transportation, including ships, trains and trucks. We also lease
36
refrigerated containers, which have integral refrigeration units on one end that plug into an outside power source and are used to transport perishable goods. Compared to traditional shipping methods, intermodal containers typically provide users with faster loading and unloading as well as some protection from weather and theft, thereby reducing both transportation costs and time to market for our lessees’ customers.
We primarily lease containers under four different types of leases. Term leases provide a customer with a specified number of containers for a specified period of time, typically ranging from three to five years, with an associated set of pick-up and drop-off conditions. Term leases also include lifecycle leases, under which lessees will lease containers until they reach a pre-specified age which is typically near the end of their useful lives. Once containers under lifecycle leases are returned to us, they are generally sold due to the age of the containers. Term leases represented 78.4% of our total on-hire fleet as of December 31, 2017. Master leases, which provide a framework of terms and conditions valid for a specified period of time, typically one year, give customers greater pick-up and drop-off flexibility than is typical in term leases and represented 13.2% of our total on-hire fleet as of December 31, 2017. Finance leases, which provide customers an alternative means for purchasing containers, represented 5.7% of our total on-hire fleet as of December 31, 2017. Spot leases, which provide customers with containers for a relatively short lease period and fixed pick-up and drop-off locations, represented 2.7% of our total on-hire fleet as of December 31, 2017.
Our expertise and flexibility in managing containers after their initial lease is an important factor in our success. The administrative process of leasing new containers is relatively easy because initial leases for new containers typically cover large volumes of units and are fairly standardized transactions. However, to successfully compete in our industry, we must not only obtain favorable initial long-term leases for new containers, but also maximize the return generated by these containers throughout their useful life in marine service and their ultimate sale into the secondary market. To do that, we focus on renewing or extending our long-term container leases beyond their expiration dates (typically three to five years from the start of the lease). In addition, we attempt to negotiate favorable return provisions on all leases, maintain an active presence in the master and spot lease markets, and work to increase our options for disposing of off-lease containers so that we have attractive alternatives if it is not possible to achieve reasonable renewal or extension of terms with the current lessee. We have the capability and the infrastructure to re-lease or dispose of our containers at comparatively attractive terms, which increases our leverage with the lessees.
We supply leased containers to the U.S. military pursuant to a contract with the U.S. Transportation Command Directorate of Acquisition (“USTranscom”) and earn a fee for supplying and managing its fleet of leased containers. We are the main supplier of leased intermodal containers to the U.S. military.
We believe that we have the ability to reposition containers, if necessary, that are returned in lower demand locations to higher demand locations at competitive costs as a result of our experienced logistics team. Our large customer base of approximately 300 lessees increases our ability to re-lease returned containers. Our Container Resale segment sells containers to optimize their residual value in multiple markets, including locations with low lease-out demand. This system of generating an attractive revenue stream from and achieving high utilization of our container fleet has enabled us to become one of the world’s largest container lessors.
Industry Overview
Containers are built in accordance with standard dimensions and weight specifications established by the International Organization for Standardization (“ISO”). The industry-standard measurement unit is the Twenty-Foot Equivalent Unit (“TEU”), which compares the length of a container to a standard 20’ container. For example, a 20’ container is equivalent to one TEU and a 40’ container is equivalent to two TEU. Standard dry freight containers are typically 8’ wide, come in lengths of 20’, 40’ or 45’ and are either 8’6” or 9’6” high. The three principal types of containers are described as follows:
| • | Dry freight standard containers. A dry freight standard container is constructed of steel sides, roof, an end panel on one end and a set of doors on the other end, a wooden floor and a steel undercarriage. Dry freight standard containers are the least expensive and most commonly used type of container. They are used to carry general cargo, such as manufactured component parts, consumer staples, electronics and apparel. According to the latest available data, dry freight standard containers comprised approximately 90.1% of the worldwide container fleet, as measured in TEU, at December 31, 2016. |
37
| • | Dry freight specialized containers. Dry freight specialized containers consist of open-top and flat-rack containers. An open-top container is similar in construction to a dry freight standard container except that the roof is replaced with a tarpaulin supported by removable roof bows. A flat-rack container is a heavily reinforced steel platform with a wood deck and steel end panels. Open-top and flat-rack containers are generally used to transport heavy or oversized cargo, such as marble slabs, building products or machinery. According to the latest available data, dry freight specialized containers comprised approximately 2.1% of the worldwide container fleet, as measured in TEU, at December 31, 2016. |
| • | Other containers. Other containers include refrigerated containers, tank containers, 45’ containers, pallet-wide containers and other types of containers. The two most prominent types of such containers are refrigerated containers and tank containers. A refrigerated container has an integral refrigeration unit on one end which plugs into an outside power source and is used to transport perishable goods. Tank containers are used to transport liquid bulk products such as chemicals, oils, and other liquids. According to the latest available data, other containers comprised approximately 7.8% of the worldwide container fleet, as measured in TEU, at December 31, 2016. |
Containers provide a secure and cost-effective method of transportation because they can be used in multiple modes of transportation, making it possible to move cargo from a point of origin to a final destination without repeated unpacking and repacking. As a result, containers reduce transit time and freight and labor costs, as they permit faster loading and unloading of shipping vessels and more efficient utilization of transportation containers than traditional break bulk shipping methods. The protection provided by containers also reduces damage, loss and theft of cargo during shipment. While the useful life of containers varies based upon the damage and normal wear and tear suffered by the container, we estimate that our useful life for a standard dry freight container used in intermodal transportation is on average 13 to 14 years. Some shipping lines have recently indicated that they intend to keep their containers for longer than 13 to 14 years.
According to World Cargo News, as of January 2017, leasing companies owned approximately 50% of the total worldwide container fleet of 38.0 million TEU. The percentage of containers owned by shipping lines ranged from 39% to 54% from 1980 through 2017. Given the uncertainty and variability of export volumes and the fact that shipping lines have difficulty in accurately forecasting their container requirements at different ports, the availability of containers for lease significantly reduces a shipping line’s need to purchase and maintain excess container inventory. In addition, leasing a portion of their total container fleets enables shipping lines to serve their manufacturer and retailer customers better by:
| • | increasing their flexibility to manage the availability and location of containers; |
| • | increasing their ability to meet peak demand requirements, particularly prior to holidays such as Christmas and Lunar New Year; and |
| • | reducing their capital expenditures. |
Based on industry analyst reports, we expect 2018 new dry freight container production to remain more or less in line with the 3.2 million TEU in 2017, with lessors purchasing a higher percentage than the historical average. Global demand for shipping is expected to continue to increase at a rate of almost 5 % which is only slightly lower than the estimated 6.5% experienced in 2017. While new production inventory has increased to almost 700,000 TEU at the end of December 2017, availability of depot containers remain extremely limited with almost all lessors enjoying utilization rates above 97%. Deliveries of mega ships is also expected to have a positive impact on container demand in 2018. Idle container ship capacity meanwhile remains at a low level of 2% or less.
The shipping business has been characterized by cyclical swings due in part to lengthy periods of excess or scarce vessel capacity. We believe that these sustained periods of vessel supply/demand imbalances are mainly a function of the multi-year ordering and production cycle associated with the manufacture of new vessels, which requires shipping lines to estimate market growth many years into the future, and the shipping line industry’s shift to the use of significantly larger vessels. Container leasing companies are partially insulated from the risks of these shipping cycles by the relatively short production time associated with the manufacture of new containers. Lead times for new container orders are typically only a few months, so the rate of new container ordering can be quickly adjusted to reflect unexpected market changes.
38
Our term leases maturing in 2018, represent approximately 9.7% of our fleet. Additionally, for most leasing companies, the percentage of containers on long-term leases has grown over the past ten years, while the percentage on master leases has declined. As of December 31, 2017, approximately 78% of our total on-hire fleet was on long-term leases, compared to approximately 67% ten years ago. As a result, changes in utilization have become less volatile for Textainer and most leasing companies.
According to World Cargo News, intermodal leasing companies, as ranked by total TEU as of January 2017, are as follows:
| Company |
TEU (000’s) |
Percent of Total |
||||||
| Triton International Limited |
4,930 | 25.8 | % | |||||
| Textainer(1) |
3,280 | 17.2 | % | |||||
| Florens Leasing |
2,850 | 14.9 | % | |||||
| SeaCo Global |
2,430 | 12.7 | % | |||||
| SeaCube Container Leasing Ltd. |
1,220 | 6.4 | % | |||||
| CAI International, Inc. |
1,080 | 5.7 | % | |||||
| Beacon Intermodal Leasing |
1,060 | 5.5 | % | |||||
| Touax Global Container Solutions |
650 | 3.4 | % | |||||
| Blue Sky Intermodal |
360 | 1.9 | % | |||||
| UES International |
220 | 1.2 | % | |||||
| Other |
1,020 | 5.3 | % | |||||
|
|
|
|
|
|||||
| Grand Total |
19,100 | 100.0 | % | |||||
|
|
|
|
|
|||||
| (1) | Textainer Group’s owned and managed fleet consisted of 3,280 TEU at December 31, 2017. |
Competitive Strengths
We believe that we possess a number of strengths that provide us with a competitive advantage, including:
One of the Largest Container Lessors in the Industry. We operate one of the world’s largest fleets of leased intermodal containers by fleet size, with a total fleet of approximately 2.2 million containers, representing almost 3.3 million TEU, as of December 31, 2017. We provide our services worldwide via a network of regional and area offices and independent depots. We have been one of the largest buyers of new containers purchasing an average of more than 210,000 TEU per year for the last five years and are also one of the largest sellers of used containers, selling an average of more than 130,000 containers per year for the last five years. Our consistent presence in the market buying and selling containers provides us with broad market intelligence, and valuable insight into the demand patterns of our shipping line customers and resale container buyers.
Proven Ability to Grow Our Fleet Over Time. Our ability to invest in our fleet has allowed us to become one the world’s largest container lessors. We have demonstrated our ability to increase the size of our container fleet by purchasing containers from manufacturers and by acquiring existing container fleets or their management rights. Over the past 19 years, we have acquired the rights to manage over 1,500,000 TEU from former competitors and we have acquired approximately 700,000 TEU of containers from our managed fleet. Last year we acquired the rights to manage a fleet of 182,000 TEU formerly operated by Magellan Maritime Services GmbH. As one of the largest buyers of new containers, we have developed strong relationships with container manufacturers. These relationships, along with our large volume buying power and solid financial structure, enable us to reliably purchase containers during periods of high demand.
Ability to Generate Attractive Returns Throughout the Container Life-Cycle. One of our major strengths is our demonstrated ability to generate attractive revenue streams throughout the economic life of a container in marine service and upon resale of the container at the end of its marine service life. At the end of a lease, we generally have the ability to either negotiate an extension of the lease term or to take back the container and re-lease or sell it maximizing the container’s return. This flexibility, coupled with our international coverage, organization and resources, allows us to deploy containers to those markets where we can re-lease or sell them on comparatively attractive terms, thereby optimizing our returns and the residual value of our fleet.
39
Strong Long-Standing Relationships with Customers. Our scale, long presence in the business and reliability as a supplier of containers has resulted in strong relationships with our customers. We lease containers to approximately 300 shipping lines and other lessees, including each of the world’s top 20 container lines, as measured by vessel fleet size in TEU and we have sold containers to an average of more than 1,400 resale customers for the last five years. We believe our ability to consistently supply containers in locations where our customers need them makes us one of the most reliable lessors of containers. Our top 20 customers, as measured by revenues, have leased containers from us for an average of almost 30 years.
Multiple Sources of Revenue. We believe that the long-term nature of our lease portfolio, as well as the presence of both owned and managed containers in our fleet, provides us with a more predictable source of revenues and operating cash flow and higher operating margins over time, enabling us to manage and grow our business more effectively. We derive revenues from leasing our owned containers, managing containers owned by third parties and buying and selling containers. These multiple revenue streams provide for a diverse income base, help to mitigate the effects of our cyclical industry on profitability and allow us to optimize our use of capital.
Experienced Management Team. Our senior executives have a long history in the industry. Our senior executives have an average of 14 years of service with us. The executive team has extensive experience in sourcing, leasing, financing, selling, trading and managing containers, as well as a long track record of successfully acquiring and selling container assets.
Business Strategies
We intend to grow our business profitably by pursuing the following strategies:
Leverage Our Status as one of the Largest Container Lessors and Consistent Purchaser and Seller of Containers. We endeavor to make regular purchases of containers to replace older containers and increase the size of our fleet. We believe that this consistent purchasing behavior and the resulting scale and young fleet age profile provides us with a competitive advantage in maintaining strong relationships with manufacturers and growing our market share with our existing customers.
Be the Most Reliable Supplier of Quality Containers. We continue to provide superior equipment and ensure that it is available in the right location and at the right time. Having one of the world’s largest owned and managed container fleets, we are in a strong position to be the most reliable supplier of dry freight containers to meet the demands of shipping lines.
Pursue Attractive Container Related Acquisition Opportunities. We will continue to seek to identify and attempt to acquire attractive portfolios of containers and companies to allow us to grow our fleet profitably. We believe that the consolidation trend in our industry will continue and may offer us future growth opportunities. We also believe that current economic conditions may also result in potential acquisition opportunities, including the purchase and leaseback of customer-owned containers. Purchase and leaseback transactions can be attractive to our customers because they free up cash for other capital needs. These transactions enable us to buy attractively priced containers and at the same time place them on leases for the remainder of their marine service lives.
Continue to Focus on Maintaining High Levels of Utilization and Operating Efficiency. We will continue to target high utilization rates and attractive returns on our assets through our focus on longer-term leases and disciplined portfolio management. As of December 31, 2017, approximately 78% of our total on hire fleet (based on total TEU) was on long-term leases, compared to approximately 67% ten years ago. We also drive operating efficiency by maintaining a low cost structure, having brought down our fleet management cost per CEU per day by approximately 25% over the 10 years ended December 31, 2017. We believe that we can grow our fleet without a proportionate increase in our headcount, thereby improving our profitability by spreading our operating expenses over a larger revenue base.
Extend the Lease of In-fleet Containers. Since many shipping lines must utilize capital to finance vessels, it is possible that some will conclude in 2018, as they did in 2017, that it is more cost-effective to extend leases of in-fleet containers than either buy containers or lease new containers.
40
Grow Our Container Resale Business. We look to sell containers from our fleet when they reach the end of their useful lives in marine service or when we believe it is financially attractive for us to do so, considering the location, sales price, cost of repair, and possible repositioning expenses. In order to improve the sales price of our containers, we often move them from the location where they are returned by the lessee to another location that has a higher market price. We benefit not only as a result of the increased sales price but also because we often receive rental revenue from a shipping line for the one-way lease of the container. We also buy and resell containers from shipping line customers, container traders and other sellers of containers. We attempt to improve the sales price of these containers in the same manner as with containers from our fleet.
Maintain Access to Diverse Sources of Capital. We have successfully utilized a wide variety of financing alternatives to fund our growth, including secured debt financings, bank financing, and equity from third party investors in containers. We believe this diversity of funding, combined with our access to the public equity markets, provides us with an advantage in terms of both cost and availability of capital, versus our smaller competitors and also some of our shipping line customers.
Operations
We operate our business through a network of regional and area offices and independent depots. We maintain four regional offices as follows:
| • | Americas Region in Cranford, New Jersey, USA responsible for North and South America; |
| • | European Region in New Malden, UK responsible for Europe, the Mediterranean, the Middle East, and Africa; |
| • | North Asia Region in Yokohama, Japan responsible for Japan, South Korea, and Taiwan; and |
| • | South Asia Region in Singapore, responsible for Southeast Asia, the People’s Republic of China (“PRC”) (including Hong Kong) and Australia. |
Regional vice presidents are in charge of regional leasing and operations. Marketing directors and assistants located in the regional and area offices handle day-to-day marketing and collection activities. Our operations include a global sales force, container operations group, container resale group, and logistics services group. Our headquarters office is in Hamilton, Bermuda. Our administrative office is located in San Francisco, California.
Our Container Fleet
As of December 31, 2017, we operated 3,279,892 TEU. We attempt to continually invest in our container fleet each year in an effort to replace the older containers being retired from marine service and to build our fleet size. We purchased an average of more than 210,000 TEU of new containers per year over the past five years. Our ability to invest in our fleet on a consistent basis has been instrumental in our becoming one of the world’s largest container lessors. Our container fleet consists primarily of standard dry freight and refrigerated containers. The containers that we lease are either owned outright by us or owned by third parties and managed by us. The table below summarizes the composition of our owned and managed fleets, in TEU and CEU, by type of containers as of December 31, 2017 (unaudited):
| TEU | CEU | |||||||||||||||||||||||
| Owned | Managed | Total | Owned | Managed | Total | |||||||||||||||||||
| Standard dry freight |
2,381,650 | 676,349 | 3,057,999 | 2,135,792 | 602,752 | 2,738,544 | ||||||||||||||||||
| Refrigerated |
145,924 | 12,192 | 158,116 | 590,811 | 49,304 | 640,115 | ||||||||||||||||||
| Other specialized |
56,417 | 7,360 | 63,777 | 86,520 | 12,421 | 98,941 | ||||||||||||||||||
|
|
|
|
|
|
|
|
|
|
|
|
|
|||||||||||||
| Total fleet |
2,583,991 | 695,901 | 3,279,892 | 2,813,123 | 664,477 | 3,477,600 | ||||||||||||||||||
|
|
|
|
|
|
|
|
|
|
|
|
|
|||||||||||||
| Percent of total fleet |
78.8 | % | 21.2 | % | 100.0 | % | 80.9 | % | 19.1 | % | 100.0 | % | ||||||||||||
The amounts in the table above did not change significantly from December 31, 2017 to the date of this Annual Report on Form 20-F.
41
Our containers are designed to meet a number of criteria outlined by the ISO. The standard criteria include the size of the container and the gross weight rating of the container. This standardization ensures that the widest possible number of transporters can use containers and it facilitates container and vessel sharing by the shipping lines. The standardization of the container is also an important element of the container leasing business since we can operate one fleet of containers that can be used by all of our major customers.
Maintenance and repair of our containers is performed by independent depots that we retain in major port areas and inland locations. Such depots also handle and inspect containers that are either picked up or redelivered by lessees, and store containers that are not leased.
Our Leases
Most of our revenues are derived from leasing our owned fleet of containers to our core shipping line customers. The vast majority of our container leases are structured as operating leases, though we also provide customers with finance leases. Regardless of lease type, we seek to exceed our targeted return on our owned and managed containers over the life of each container by managing container utilization, lease rates, drop-off restrictions and the disposal process. We lease containers under three different types of operating leases (term leases, master leases and spot leases) and also under finance leases.
Term leases
Term leases (also referred to as long-term leases) provide a customer with a specified number of containers for a specified period, typically ranging from three to five years, with an associated set of pick-up and drop-off conditions. Our term leases generally require our lessees to maintain all units on lease for the duration of the lease. Term leases also include lifecycle leases, under which lessees will lease containers until they reach a pre-specified age which is typically near the end of their useful lives rather than for a specified period. Once containers under lifecycle leases are returned to us, they are generally sold due to the age of the containers. Term leases provide us with enhanced cash flow certainty due to their extended duration but carry lower per diem rates than other lease types. As of December 31, 2017, 78.4% of our owned on-hire fleet, as measured in TEU, was on term leases.
As of December 31, 2017, our term leases had an average remaining duration of 36 months, assuming no leases are renewed. However, we believe that many of our customers will renew leases for containers that are less than sale age at the expiration of the lease. In addition, for leases that are not extended our containers typically remain on-hire at the contractual per diem rate for an average of an additional 13 months beyond the end of the contractual lease term.
The following are the minimum future rentals for our owned fleet at December 31, 2017, due under long-term leases (in thousands):
| Year ending December 31 (dollars in thousands): |
||||
| 2018 |
$ | 263,425 | ||
| 2019 |
189,130 | |||
| 2020 |
131,427 | |||
| 2021 |
91,685 | |||
| 2022 and thereafter |
120,345 | |||
|
|
|
|||
| Total future minimum lease payments receivable |
$ | 796,012 | ||
|
|
|
Some of our term leases give our customers Early Termination Options (“ETOs”). If exercised, ETOs allow customers to return containers prior to the expiration of the term lease. However, if an ETO is exercised, the customer is required to pay a penalty per diem rate that is applied retroactively to the beginning of the lease. As a result of this retroactive penalty, ETOs have historically rarely been exercised.
42
Master leases
Master leases provide a framework of terms and conditions pursuant to which lessees can lease containers on an as-needed basis for unspecified periods of time. Master lease terms and conditions are valid for a set period, typically one year, and provide the lessee with greater flexibility than is typical in term leases. Under our master leases, lessees know in advance their per diem rates and drop-off locations, subject to monthly drop-off location limits. In addition, under these master lease agreements, the lessee is generally not committed to leasing a minimum number of containers from us during the lease term and may generally return the containers to us at any time, subject to certain restrictions. Due to their flexibility and duration, master leases command higher per diem rates than term leases. A subset of master leases are our special leases, which are predominately round-trip Asia leases, allowing customers to return containers at any time but with restrictions on drop-off locations, generally in higher demand locations in Asia. As of December 31, 2017, 13.2% of our owned on-hire fleet, as measured in TEU, was on master leases.
Spot leases
Spot leases provide the customer with containers for a relatively short lease period with fixed pick-up and drop-off locations. Spot leases are generally used to position a container to a desired location for subsequent lease or sale. As of December 31, 2017, 2.7% of our total on-hire fleet, as measured in TEU, was on spot leases.
Finance Leases
Finance leases provide our lessees with an alternative method to finance their container acquisitions. Finance leases are long-term in nature, typically ranging from three to eight years and require relatively little customer service attention. They ordinarily require fixed payments over a defined period and provide lessees with a right to purchase the subject containers for a nominal amount at the end of the lease term. Per diem rates include an element of repayment of capital and, therefore, typically are higher than rates charged under other leases. Finance leases require the lessee to keep the containers on lease for the entire term of the lease. Finance leases are reflected as “Net investment in direct financing and sales-type leases” on our consolidated balance sheets. As of December 31, 2017, approximately 5.7% of our owned on-hire fleet, as measured in TEU, was on finance leases with an average remaining term of 24 months.
Maintenance, Repair and Damage Protection
Under all of our leases, our lessees are generally responsible for loss of or damage to a container beyond ordinary wear and tear, and they are required to purchase insurance to cover any other liabilities. Any damage must be repaired at the expense of the lessee according to standardized guidelines promulgated by the Institute of International Container Lessors (“IICL”). Lessees are also required to obtain insurance to cover loss of the equipment on lease, public liability and property damage insurance as well as indemnify us from claims related to their usage of the leased containers. In some cases, a Damage Protection Plan (“DPP”) is provided whereby the lessee pays us (in the form of either a higher per-diem rate or a fixed one-time payment upon the return of a container) to assume a portion of the financial burden of repairs up to a pre-negotiated amount. This DPP does not cover damages from war or war risks, loss of a container, constructive total loss of the container, damages caused by contamination or corrosion from cargo, damages to movable parts and any costs incurred in removing labels, which are all responsibilities of the lessees. DPP is generally cancelable by either party with prior written notice. Maintenance is monitored through inspections at the time that a container is leased out and returned. In 2017, DPP revenue was 2.1% of total lease rental income. We also maintain our own insurance to cover our containers when they are not on-hire to lessees or when the lessee fails to have adequate primary coverage, and third-party liability insurance for both on-hire and off-hire containers. In addition, we maintain insurance that, after satisfying our deductibles, would cover loss of revenue as a result of default under most of our leases, as well as the recovery cost or replacement value of most of our containers.
43
Lease Agreements
In general, our lease agreements consist of two basic elements, a master terms and conditions agreement (“Master Agreement”), and a lease schedule. Lease schedules contain the business terms (including daily rate, term duration and drop-off schedule, among other things) for specific leasing transactions, while Master Agreements outline the general rights and obligations of the lessor and lessee under all of the lease schedules covered by the Master Agreement. For most customers, we have a small number of Master Agreements (often one) and a large number of lease schedules.
Our standard Master Agreements generally require the lessees to pay rentals, depot charges, taxes and other charges when due, to maintain the containers in good condition and repair, to return the containers in good condition in accordance with the return conditions set forth in the Master Agreement, to use the containers in compliance with all laws, and to pay us for the value of the containers as determined under the terms of the agreements if the container is lost or destroyed. The default clause gives us certain legal remedies in the event that the lessee is in breach of the lease.
Re-leasing, Logistics and Depot Management
We believe that managing the period after termination of our containers’ first lease is one of the most important aspects of our business. The container shipping industry is characterized by large regional trade imbalances, with loaded containers generally flowing from export-oriented economies in Asia to North America and Western Europe. Because of these trade imbalances, container shipping lines have an incentive to return leased containers in North America and Western Europe to avoid the cost of shipping empty containers back to Asia. Successful management of the deployment of our containers after they come off their first lease requires disciplined re-leasing capabilities, logistics management, depot management, careful cost control and effective sales of used containers.
Re-leasing
Since our leases allow our lessees to return their containers, we typically lease a container several times during its life. New containers can usually be leased with a limited sales and customer service infrastructure because initial leases for new containers typically cover large volumes of units and are fairly standardized transactions. Used containers, on the other hand, are typically leased in smaller transactions that are structured to accommodate pick-ups and returns in a variety of locations. Our utilization rates depend in part on our re-leasing capabilities. Factors that affect our ability to re-lease used containers include the size of our lessee base, ability to anticipate lessee needs, their presence in relevant geographic locations and the level of service we provide our lessees. We believe that our global presence and relationships with approximately 300 container lessees provide us an advantage in re-leasing our containers relative to many of our smaller competitors.
Logistics
Other methods of reducing off-lease risks include:
| • | Limiting or prohibiting container returns to low-demand areas. In order to reduce our repositioning costs, our leases typically include a prohibition on returning containers to specific locations, limitations on the number of containers that may be returned to lower demand locations, drop-off charges for returning containers to lower demand locations or a combination of these provisions. |
| • | Taking advantage of a robust resale market when available. In order to optimize the investment return on a container, we have sold containers in our excess inventory and/or weak demand locations when an analysis indicates it is financially more attractive than attempting to re-lease or reposition the container. |
| • | Seeking one-way lease opportunities to move containers from lower demand locations to higher demand locations. One-way leases may include incentives, such as free days, credits and limited damage waivers. The cost of offering these incentives is generally less than the cost we would incur if we were to pay to reposition the containers. We also use one-way leases to move containers from locations where the market price for selling containers is low to locations with a higher market price, to improve the resale value of the containers. |
44
| • | Paying to reposition our containers to higher demand locations. At locations where our inventories remain high, despite the efforts described above, we will selectively choose to pay to reposition excess containers to locations with higher demand or higher resale prices. |
| • | Diversifying our customers. We have sought to diversify our customers and, correspondingly, the locations where containers are needed around the world. |
Depot Management
As of December 31, 2017, we managed our container fleet through approximately 530 independent container depot facilities in more than 230 locations. Depot facilities are generally responsible for repairing containers when they are returned by lessees and for storing the containers while they are off-hire. Our operations group is responsible for managing our depot relationships and periodically visiting the depot facilities to conduct quality assurance audits to control costs and ensure repairs meet industry standards. We occasionally supplement our internal operations group with the use of independent inspection agents. Furthermore, depot repair work is periodically audited to prevent over-charging. We are in regular communication with our depot partners through the use of electronic data interchange (“EDI”) and/or e-mail. The electronic exchange of container activity information with each depot is conducted via the internet. As of December 31, 2017, a large majority of our off-lease inventory was located at depots that are able to report container activity and damage detail via EDI. We use the industry standard, ISO 9897 Container Equipment Data Exchange messages, for most EDI reporting.
Most of the depot agency agreements follow a standard form and generally provide that the depot will be liable for loss or damage of containers and, in the event of loss, will pay us the previously agreed loss value of the applicable containers. The agreements require the depots to maintain insurance against container loss or damage and we carry insurance to cover the risk when a depot’s insurance proves insufficient.
Our container repair standards and processes are generally managed in accordance with standards and procedures specified by the IICL. The IICL establishes and documents the acceptable interchange condition for containers and the repair procedures required to return damaged containers to the acceptable interchange condition. At the time that containers are returned by lessees, the depot arranges an inspection of the containers to assess the repairs required to return the containers to acceptable IICL condition. As part of the inspection process, damages are categorized either as lessee damage or normal wear and tear. Items typically designated as lessee damage include dents in the container and debris left in the container, while items such as rust are typically designated as normal wear and tear. In general, lessees are responsible for the lessee damage portion of the repair costs and we are responsible for normal wear and tear. The lessees are generally billed the lessee damage portion at the time the containers are returned. As discussed above in “Operations—Our Leases,” for an additional fee, we sometimes offer our lessees a DPP, pursuant to which we assume financial responsibility for repair costs up to a previously negotiated amount.
Management Services
As of December 31, 2017, we owned approximately 79% of the containers in our fleet (including containers held by entities we wholly and partially own), and managed the rest, equaling 695,901 TEU, on behalf of 12 affiliated and unaffiliated container investors. We earn acquisition, management and disposal fees on managed containers. Our information technology (“IT”) systems track revenues and operating expenses attributable to specific containers and the container investors receive payments based on the net operating income of their own containers. Fees to manage containers typically include acquisition fees of 1% to 2% of the purchase price; daily management fees of 8% to 13% of net operating income; and disposal fees of 5% to 10% of cash proceeds when containers are sold. We earned combined acquisition, management and disposal fees on our managed fleet of $15.0 million, $13.4 million and $15.6 million for the years ended December 31, 2017, 2016 and 2015, respectively. If operating expenses were to exceed revenues, the container investors would be obligated to pay the excess or we would deduct the excess, including our management fee, from future net operating income. In some cases, we are compensated for sales through a percentage sharing of sale proceeds over an agreed floor amount. We will typically indemnify the container investors for liabilities or losses arising from negligence, willful misconduct or breach of our obligations in managing the containers. The container investors will indemnify us as the manager against any claims or losses arising with respect to the containers, provided that such claims or losses were not caused by our negligence, willful misconduct or breach of our obligations. Typically, the terms of the management agreements are for the expected remaining useful life in marine services of the containers subject to the agreement.
45
In June 2003, we entered into a contract with the USTranscom pursuant to which we serve as a major supplier of leased marine containers to the U.S. military. Compared to our shipping line customers, we provide a much broader level of services to the U.S. military under the USTranscom contract. We have developed and currently operate a proprietary information system for the U.S. military which provides the U.S. military real-time access to the status of its leased fleet. Furthermore, unlike our shipping line customers, who pick up from and return containers to container depots, for the U.S. military we are required to arrange transportation from a container depot to a military facility upon lease out and to pick up a container at a military facility and return it to a container depot when the lease period has ended. This requires us to arrange for movement of the empty containers by truck, rail and/or vessel. The USTranscom contract provides added compensation for these services. In addition, since approximately half of these services are required in non-U.S. locations, our expenses for contracting for these services may be incurred in foreign currencies. The USTranscom contract contains a foreign currency adjustment feature such that we are protected against many foreign currency risks for the expenses incurred under the USTranscom contract.
This contract also allows the U.S. military to return containers in many locations throughout the world. Since the inception of the USTranscom contract, we have delivered or transitioned approximately 171,000 containers and chassis to the U.S. military, of which approximately 116,000 containers have been returned. In addition, approximately 51,000 containers have been reported as unaccounted for and the U.S. Military paid a stipulated loss value for each such container. The USTranscom contract expired on June 23, 2013 and we were awarded a new contract on December 12, 2013. The new contract covered a base year starting on December 24, 2013, was renewed on October 1, 2014, October 1, 2015, October 1, 2016 and on October 1, 2017 with the contract extended until September 30, 2018. We are expecting a new request for next contract proposal by US Transcom within the upcoming months and the USTranscom has indicated that it will move to a multi-vendor container supply platform for the new contract.
Resale of Containers
Our Resale Division sells containers from our fleet at the end, typically about 13 years, of their useful lives in marine service or when we believe it is financially attractive for us to do so, considering the location, sale price, cost of repair, and possible repositioning expenses. In addition, we buy used containers (trading containers) from shipping lines and other third parties that we then lease or resell. Our Resale Division has a team of 19 container sales and operations specialists in five offices globally that manage the sale process for these used containers. Our Resale Division is one of the largest sellers of used containers among container lessors, selling an average of more than 130,000 containers per year for the last five years to more than 1,400 customers. Our Resale Division has been a significant profit center for us. From 2013 through 2017, this Division generated $47.4 million in income before income tax and noncontrolling interests, including $10.9 million during 2017. We generally sell containers to depots, domestic storage companies, freight forwarders (who often use the containers for one-way trips into less developed countries) and other purchasers of used containers.
Underwriting and Credit Controls
We only lease to container shipping lines and other lessees or sell to buyers that meet our credit criteria. Our credit approval process is rigorous and all of our underwriting and credit decisions are controlled by our credit committee, which is made up of senior management from different disciplines. Our credit committee sets different maximum exposure limits depending on our relationship and previous experience with each customer lessee and container sales customer. Credit criteria may include, but are not limited to, trade route, country, social and political climate, assessments of financial performance including net worth and profitability, asset ownership, bank and trade credit references, credit bureau reports, operational history and financial strength. Our marketing and resale staff are also responsible for collections, which positively contributes to our strong collection and credit approval process through our staff’s close communication with our customers.
46
Our credit department sets and reviews credit limits for new and existing customer lessees and container sales customers, monitors compliance with those limits on an on-going basis, monitors collections, and deals with customers in default. Our credit department actively maintains a credit watch report on our proprietary information technology systems, which is available to all regional and area offices. This credit watch report lists customer lessees and container sales customers at or near their credit limits. New leases of containers to lessees on the credit watch report is only allowed with the approval of our credit department. Similarly, management may decide to stop sales of containers to purchasers whose payments are delinquent. Our credit committee meets regularly to assess performance of our container lessees and to recommend actions to be taken in order to reduce credit risks. Our underwriting processes are aided by the long payment experience we have with most of our customer lessees and container sales customers, our broad network of relationships in the container shipping industry that provides current information about customer lessees’ and container sales customers’ market reputations and our focus on collections.
Other factors reducing losses due to default by a lessee or customer include the growth in the container shipping industry, our constant monitoring of collections, effective collection mechanism, our historically high recovery rate for containers in default situations and the re-marketability of our container fleet. The growth in the container shipping industry helps reduce the risk of customer defaults since the core assets of a poorly performing shipping line, its ships and containers, have historically been needed to meet the demand for world containerized trade. In addition, the law in several major port locations is highly favorable to creditors and many of our large customers call on ports that will allow us to arrest, or seize, the customers’ ships or fuel storage bunkers, or repossess our containers if the customer is in default under our container leases. Finally, we also purchase insurance for equipment recovery and loss of revenue due to customer defaults for most of our customers, in addition to the insurance that our customers are required to obtain, however our equipment recovery insurance is subject to high deductibles and has coverage limits and exclusions.
During 2013 through 2017, we recovered, on average, 84% of the containers that were the subject of defaulted contracts which had at least 1,000 CEU on lease. In connection with the Hanjin bankruptcy, 93% of the containers leased to Hanjin have been turned in, and we believe the unrecovered containers and the recovery expenses will be recoverable under the insurance policies. We typically incur operating expenses such as repairs and repositioning when containers are recovered after a default. However, recovery expenses are typically covered under insurance and we are reimbursed above our deductible amount. Due to the above, over the last five years, our write-offs of customer receivables for our owned and managed fleet have averaged 1.6% of our lease rental income over such period.
Marketing and Customer Service
Our global sales and customer service force is responsible for developing and maintaining relationships with senior management staff at our shipping line customers, negotiating lease contracts and maintaining day-to-day coordination with operations staff. This close customer communication often assists us in negotiating lease contracts that satisfy both our financial return requirements and our customers’ operating needs. It also makes us more likely to be aware of our customers’ potential equipment shortages and makes our customers more likely to be aware of our available container inventories.
Our senior sales people have considerable industry experience and we believe that the quality of our customer relationships and the level of communication with our customers represent an important advantage for us. As of December 31, 2017, our global sales and customer service group consisted of approximately 81 people, with 17 in North America, 43 in Asia and Australia, 15 in Europe and 6 in Africa.
Customers
We believe that our staff, organization and long presence in the business have resulted in very strong relationships with our shipping line customers. Our top 20 customers, as measured by lease billings of our total owned and managed fleet, have leased containers from us for an average of almost 30 years and have an average Dynamar credit rating, a common credit report used in the maritime sector, of 3.8. The Dynamar credit rating ranges from 1 to 10, with 1 indicating low credit risk. We had one customer that individually accounted for 14.4%, 12.0% and 10.4% of our lease billings for owned containers in 2017, 2016 and 2015, respectively. The Company’s second largest customer individually accounted for 13.6%, 14.0% and 11.0% of our lease billings for owned containers in
47
2017, 2016 and 2015, respectively. Our top 20 customers include all of the world’s largest shipping lines, as measured by container vessel fleet size. We currently have containers on-hire to approximately 300 customers. Our customers are mainly international shipping lines, but we also lease containers to freight forwarding companies and the U.S. military. Our five largest customers accounted for approximately 49.5% of our total owned and managed fleet’s 2017 lease billings. Our top five customers by lease billings in 2017 were Mediterranean Shipping Company S.A., CMA-CGM S.A., Cosco Container Lines, Evergreen Marine Corp. Ltd. and Hapag-Lloyd AG. During 2017, 2016 and 2015, revenue from our 20 largest container lessees by lease billings represented 80.0%, 78.9% and 77.4% of our total owned and managed fleet’s container leasing billings, respectively, with lease billings from our single largest container lessee accounting for $80.2 million, $73.0 million and $72.9 million or 15.1%, 13.6% and 11.9% of our total owned and managed fleet’s container lease billings during the respective periods. A default by any of these major customers, such as the bankruptcy of Hanjin in 2016, could have a material adverse impact on our business, results from operations and financial condition. In addition, the largest lessees of our owned fleet are often among the largest lessees of our managed fleet. The largest lessees of our managed fleet are responsible for a significant portion of the billings that generate our management fee revenue.
Proprietary Information Technology
We have developed proprietary IT systems that allow us to monitor container status and offer our customers a high level of service. Our systems include internet-based updates regarding container availability and booking status. Our systems record the status of and provide the accounting and billing for each of our containers individually by container number. We also have the ability to produce complete management reports for each portfolio of equipment we own and manage. This makes us a preferred candidate to quickly assume management of competitors’ container fleets. We also maintain proprietary technology in support of our military business.
In addition, our systems allow our business partners to conduct certain business with us through our website, www.textainer.com. These systems allow customers to check our container inventories, review design specifications, request bookings for container pick-ups, create redelivery bookings and review and approve repair bills. Our website also allows depots to download recent statements for self-billing activity and to check the status of containers.
Suppliers
We have long relationships with all of our major suppliers. We currently purchase almost all of our containers in the PRC. There are four major manufacturers of dry freight standard and specialized containers. Our operations staff reviews the designs for our containers and periodically audits the production facilities of our suppliers. In addition, we use our Asian operations group and occasionally third party inspectors to visit factories when our containers are being produced to provide an extra layer of quality control. Nevertheless, defects in our containers do sometimes occur. We work with the manufacturers to correct these defects, and our manufacturers have generally honored their warranty obligations in such cases.
Competition
According to World Cargo News, as of January 2017, the top ten container leasing companies, as measured on a TEU basis, control approximately 94.6%, and the top five container leasing companies control approximately 76.9%, of the total equipment held by all container lessors. According to this data, we are one of the world’s largest lessors of intermodal containers based on fleet size by TEU and we manage approximately 16.6% by TEU of the equipment held by all container leasing companies.
We compete with approximately ten other large or medium size container leasing companies, many smaller lessors, companies and financial institutions offering finance leases, and promoters of container ownership and leasing as a tax-efficient investment. It is common for our shipping line customers to utilize several leasing companies to meet their container needs.
Other lessors compete with us in many ways, including pricing, lease flexibility and supply reliability, as well as the location, availability, quality and individual characteristics of their containers and customer service. While we are forced to compete aggressively on price, we emphasize our supply reliability and high level of customer service
48
to our customers. We invest heavily to ensure container availability in higher demand locations. We dedicate a large part of our organization to building customer relationships, maintaining close day-to-day coordination with customers’ operating staffs and have developed powerful and user-friendly systems that allow our customers to transact business with us through the internet. We believe that our close customer relationships, experienced staff, reputation for market leadership, scale efficiencies and proprietary systems provide important competitive advantages.
Legal Proceedings
From time to time we are a party to litigation matters arising in connection with the normal course of our business. While we cannot predict the outcome of these matters, in the opinion of our management, any liability arising from these matters will not have a material adverse effect on our business. Nevertheless, unexpected adverse future events, such as an unforeseen development in our existing proceedings, new claims brought against us or changes in our current insurance arrangements could result in liabilities that have a material adverse impact on our business.
Environmental
We are subject to federal, state, local and foreign laws and regulations relating to the protection of the environment, including those governing the discharge of pollutants to air and water, the management and disposal of hazardous substances and wastes and the cleanup of contaminated sites. We could incur substantial costs, including cleanup costs, fines and third-party claims for property damage and personal injury, as a result of violations of or liabilities under environmental laws and regulations in connection with our or our lessees’ current or historical operations or the storage of our containers. Under some environmental laws in the U.S. and certain other countries, the owner or operator of a leased container may be liable for environmental damage, cleanup or other costs in the event of a spill or discharge of material from a container without regard to the fault of the owner or operator. While we maintain certain limited liability insurance coverage as well as require our lessees to provide us with indemnity against certain losses, the insurance coverage is subject to large deductibles, limits on maximum coverage and significant exclusions and may not be sufficient to protect against any or all liabilities and such indemnities may not cover or be sufficient to protect us against losses arising from environmental damage and/or systems or services we may be required to install.
In addition to environmental regulations affecting container movement, shipping, movement and spillage, environmental regulations also impact container production and operation, including regulations on the use of chemical refrigerants due to their ozone depleting and global warming effects. Our refrigerated containers currently use R134A or R404A refrigerant. While R134A does not contain chlorofluorocarbons (“CFC’s”), the European Union has instituted regulations to phase out the use of R134A in automobile air conditioning systems beginning in 2011 due to concern that the release of R134A into the atmosphere may contribute to global warming. While the European Union regulations do not currently restrict the use of R134A in refrigerated containers or trailers, it is possible that the phase out of R134A in automobile air conditioning systems will be extended to containers in the future and our operations could be impacted. It has been proposed that R134A usage in containers be banned beginning in 2025, although the final decision has not been made as of yet.
Container production also raises environmental concerns. The floors of dry containers are plywood made from timber which may include tropical hardwoods. Due to concerns regarding de-forestation and climate change, many countries have implemented severe restrictions on the cutting and export of this wood. Accordingly, container manufacturers have switched a significant portion of production to alternatives such as birch, bamboo, and other farm grown wood and users are also evaluating alternative designs that would limit the amount of plywood required and are also considering possible synthetic materials. New woods or other alternatives have not proven their durability over the typical life of a dry container, and if they cannot perform as well as the hardwoods have historically, the future repair and operating costs for these containers may be impacted. Also, the insulation foam in the walls of refrigerated containers requires the use of a blowing agent that contains CFC’s. Manufacturers are phasing out the use of this blowing agent in manufacturing. However, if future regulations prohibit the use or servicing of containers with insulation manufactured with this blowing agent we could be forced to incur large retrofitting expenses and these containers might bring lower rental rates and disposal prices. The container industry in China has always used solvent-based paint systems. New regulations in China for the container industry require
49
stopping the use of solvent-based paint systems, due to the restrictions on volatile organic compounds used in solvent-based paints. To comply with the new regulations, new water borne paint systems have been developed and are being used by container manufacturers. This change was already implemented in all factories in Southern China as of July 2016. The remaining container factories in China have been required to use water borne paint systems since April 1, 2017. The use of water borne paint systems has required significant factory investment and it is problematic to apply water borne paint during the winter in colder parts of China. The conversion to water borne paint may impact factory capacity, increase the cost of containers and require greater investment by us in container inspection and factory supervision.
Regulation
We may be subject to regulations promulgated in various countries, including the U.S., seeking to protect the integrity of international commerce and prevent the use of containers for international terrorism or other illicit activities. For example, the Container Security Initiative, the Customs-Trade Partnership Against Terrorism and Operation Safe Commerce are among the programs administered by the U.S. Department of Homeland Security that are designed to enhance security for cargo moving throughout the international transportation system by identifying existing vulnerabilities in the supply chain and developing improved methods for ensuring the security of containerized cargo entering and leaving the U.S. Moreover, the International Convention for Safe Containers, 1972, as amended, adopted by the International Maritime Organization, applies to new and existing containers and seeks to maintain a high level of safety of human life in the transport and handling of containers by providing uniform international safety regulations. As these regulations develop and change, we may incur increased compliance costs due to the acquisition of new, compliant containers and/or the adaptation of existing containers to meet any new requirements imposed by such regulations.
We may also be affected by legal or regulatory responses to potential global climate change. Please see Item 3, “Key Information — Risk Factors – Environmental liability and regulations may adversely affect our business, results of operations and financial condition.”
50
| C. | Organizational Structure |
Our current corporate structure is as follows:
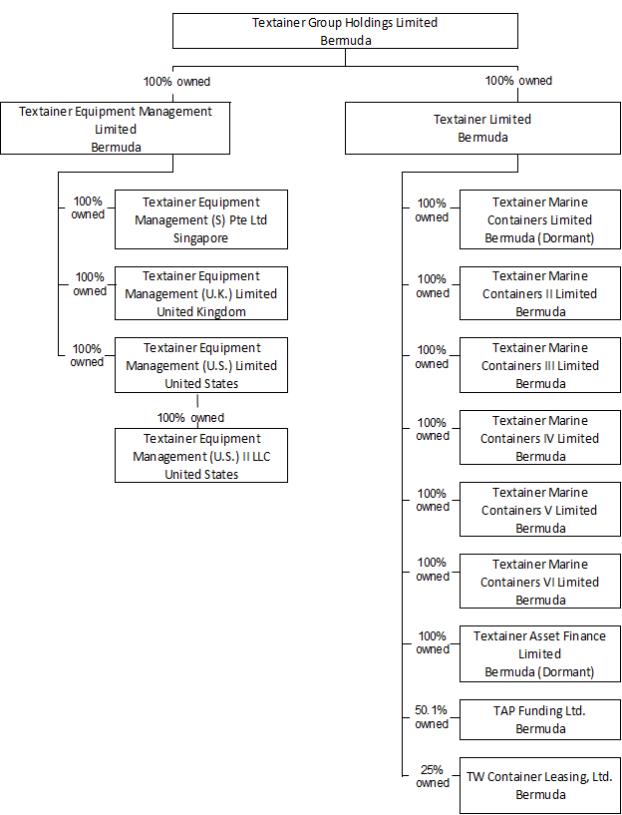
51
We currently own 100% of all of our direct and indirect subsidiaries, except for TAP Funding and TW. TAP Funding is a joint venture involving TL and TAP. As of December 31, 2017, TL owned 50.1% and TAP owned 49.9% of the common shares and TL had two voting rights and TAP had one voting right of TAP Funding, with the exception of certain matters such as bankruptcy proceedings, the incurrence of debt and mergers and consolidations, which require unanimity. TW is a joint venture involving TL and WFC, a wholly-owned subsidiary of Wells Fargo and Company. As of December 31, 2017, TL owned 25% and WFC owned 75% of the common shares and related voting rights of TW.
Our principal shareholder, Halco, which owned approximately 47.8% of our outstanding share capital as of December 31, 2017, is a wholly-owned subsidiary of Trencor Limited. Trencor is a South African public investment holding company, that has been listed on the JSE in Johannesburg, South Africa since 1955. Trencor’s origins date from 1929, and it currently has businesses owning, leasing and managing marine cargo containers and finance related activities. Halco was previously wholly-owned by Halco Trust, a discretionary trust with an independent trustee. On February 20, 2018, Halco Trust distributed and transferred to Trencor Limited, a nominated discretionary beneficiary of Halco Trust, the trust’s 100% shareholding in Halco.
James E. McQueen, Hennie Van der Merwe and David M. Nurek are members of our board of directors and the board of directors of Trencor. In addition, two of our directors, Iain Brown and Hennie Van der Merwe are also members of the board of directors of Halco.
| D. | Property, Plant and Equipment |
As of December 31, 2017, our employees were located in 14 regional and area offices in 13 different countries. We maintain an office in Bermuda, where Textainer Group Holdings Limited is incorporated. We have 13 offices outside Bermuda, including our administrative office in San Francisco, California and offices in Cranford, New Jersey; New Malden, United Kingdom; Hamburg, Germany; Durban, South Africa; Yokohama, Japan; Seoul, South Korea; Taipei, Taiwan; Singapore; Sydney, Australia; Port Klang, Malaysia; Hong Kong; and Shanghai, China. We lease our office space in Bermuda, the U.S., United Kingdom and Singapore and have exclusive agents that secure office space for us in our other locations. The lease for our Bermuda office expires in December 2018, the lease for our San Francisco office expires in May 2027, the lease for our Hackensack, New Jersey office expires in August 2021, the lease for our New Malden, United Kingdom office expires in December 2019 and our lease for our Singapore office expires in August 2021. In addition, we have non-exclusive agents who represent us in India, Indonesia, Pakistan, Republic of the Philippines, Sri Lanka, Thailand, and Vietnam. We believe that our current facilities are adequate to meet current requirements and that additional or substitute space will be available as needed to accommodate our expected growth.
| ITEM 4A. | UNRESOLVED STAFF COMMENTS |
Not applicable.
52
| ITEM 5. | OPERATING AND FINANCIAL REVIEW AND PROSPECTS |
The following Operating and Financial Review and Prospects should be read in conjunction with our audited consolidated financial statements and related notes included elsewhere in this Annual Report on Form 20-F. In addition to historical consolidated financial information, the following discussion contains forward-looking statements that reflect our plans, estimates and beliefs. Our actual results may differ materially from those contained in or implied by any forward-looking statements. See “Information Regarding Forward-Looking Statements; Cautionary Language.” Factors that could cause or contribute to these differences include those discussed below and elsewhere in this Annual Report on Form 20-F, particularly in Item 3, “Key Information— Risk Factors.”
Dollar amounts in this section of this Annual Report on Form 20-F are expressed in thousands of U.S. dollars unless otherwise indicated.
Certain previously reported information have been revised for the effect of immaterial corrections of identified errors related to the calculation of the gain on sale of containers, net and to properly account for lease concessions. See Note 2 “Immaterial Correction of Errors in Prior Periods” to our consolidated financial statements in Item 18, “Financial Statements” in this Annual Report on Form 20-F.
Executive Summary
Operating since 1979, we are one of the world’s largest lessors of intermodal containers based on fleet size, with a total fleet of approximately 2.2 million containers, representing almost 3.3 million TEU. During 2017: (i) we ordered approximately $625 million for 300,000 TEU in capital expenditures for our total fleet, (ii) we increased the managed portion of our total fleet to 21.2% as of December 31, 2017 from 19.0% as of December 31, 2016 primarily due to our assumption of the management of 182,000 TEU formerly owned and managed by Magellan Maritime Services GmbH, a German container lessor that became insolvent, (iii) utilization averaged 96.4% compared to 94.7% in 2016; (iv) we completed over $2.3 billion of financing in the debt markets, resulting in $540 million in net incremental debt funding, and (v) we recorded a $7.6 million expense in write-off of unamortized debt issuance costs and bond discounts related to the early redemption and amendments on our various debt facilities. Refer to “2018 Outlook” below for further discussion.
Our business comprises three reportable segments for financial reporting purposes: Container Ownership, Container Management and Container Resale. Our total revenues primarily consist of leasing revenues derived from the leasing of our owned containers and, to a lesser extent, fees received for managing containers owned by third parties, equipment resale and military management. The most important driver of our profitability is the extent to which net operating income on our owned fleet and management fee income exceed our operating costs. The key drivers of our net operating income are fleet size, rental rates, direct costs and utilization. Our operating costs primarily consist of depreciation, container impairment, amortization, interest expense, direct operating expenses and administrative expenses. Our lessees are generally responsible for loss of or damage to a container beyond ordinary wear and tear, and they are required to purchase insurance to cover any other liabilities.
Key Factors Affecting Our Performance
We believe there are a number of key factors that have affected, and are likely to continue to affect, our operating performance. These key factors include the following, among others:
| • | the demand for leased containers; |
| • | lease rates; |
| • | steel prices; |
| • | interest rates; |
| • | our ability to lease our new containers shortly after we purchase them; |
| • | prices of new and used containers and the impact of changing prices on containers held for sale and the residual value of our in-fleet owned containers; |
53
| • | remarketing risk; |
| • | the creditworthiness of our customers; |
| • | further consolidation among shipping lines and/or container lessors; |
| • | further consolidation of container manufacturers and/or decreased access to new containers; and |
| • | global and macroeconomic factors that affect trade generally, such as recessions, terrorist attacks, pandemics or the outbreak of war and hostilities. |
For further details of these and other factors which may affect our business and results of operations, see Item 3, “Key Information— Risk Factors.”
2018 Outlook
We expect the favorable market conditions we are seeing to continue into 2018, mostly driven by solid trade growth, shipping lines preference to lease, and minimal depot inventory. Forecasted growth in 2018 GDP has increased recently to around 4% due to several factors including strengthening European economies and the tax cut in the US. Container trade is expected to grow at an even faster rate. We expect new container prices to remain stable given the recent increase in steel prices and ongoing demand. Resale prices are also expected to remain high given the level of new container prices and the limited supply of containers placed on sale as a result of near full utilization. Yields on new leases have slightly moderated as competition increases. However, assuming disciplined ordering by lessors and shipping lines, we expect returns to remain at attractive levels.
Revenue
Our revenue comprises lease rental income, management fees, trading container sale proceeds and gain on sale of containers, net.
Lease Rental Income. We generate lease rental income by leasing our owned containers to container shipping lines and other customers. Lease rental income comprises daily per diem rental charges due under the lease agreements, together with payments for other charges set forth in the leases, such as handling fees, drop-off charges and pick-up charges and credits (together “geography revenue”) and charges for a damage protection plan (“DPP”). The operating results of our owned container business are determined by the amount by which our container rental revenue exceeds our ownership costs, consisting primarily of depreciation, interest expense, storage, handling and other direct operating expenses and management costs.
Utilization is a key performance indicator that demonstrates how much of our equipment is on lease at a point in time or over a period of time. We measure utilization on the basis of CEU on lease, dividing the actual number of CEU days on-hire by actual CEU days available for lease. We calculate containers available for lease by excluding containers that have been manufactured for us but have not yet been delivered to a lessee and containers designated as held-for-sale units. Our utilization is primarily a function of our current lease structure, overall level of container demand, the location of our available containers and prevailing lease terms by location. The location of available containers is critical because containers available in high-demand locations are more readily leased and are typically leased on more favorable terms than containers available in low-demand locations.
Lease rental income is also affected by per diem rates. The per diem rate for a lease is set at the time we enter into a lease agreement. Our long-term per diem rate for new containers has historically been strongly influenced by new container pricing (which in turn is heavily influenced by the cost of container manufacturing inputs such as steel, paint, wood, labor and other components), interest rates, the balance of supply and demand for containers at a particular time and location, our estimate of the residual value of the container at the end of its useful life in marine service, the type of the container being leased, container purchasing activities by container shipping lines and competitors, and efficiencies in container utilization by container shipping lines. Average per diem rates for containers in our owned fleet and in the portfolios of containers comprising our managed fleet change slowly in response to changes in new container prices because existing lease agreements can only be re-priced upon the expiration of the lease.
54
Management Fees. Management fee revenue is generated by our management services, which include the acquisition, leasing, repair, repositioning, storage and disposition of containers. We provide these management services pursuant to management agreements with container investors. Under these agreements, we earn fees for the acquisition of new containers and the management of the containers, and a sales commission upon disposition of containers under management. The management agreements typically cover the entire economic life of the containers.
Our acquisition fees are calculated as a percentage of the cost of the container. Our management fees are calculated as a percentage of net operating income of the containers. Net operating income is calculated as the lease payment and any other revenue attributable to a container, minus operating expenses related to that container (but not depreciation or financing expenses of the container investor). The management fee percentage generally varies based upon the type of lease and the terms of the management agreement. Management fee percentages for long-term leases are generally lower than management fee percentages for master or spot leases because less daily involvement by management personnel is required to manage long-term leases. Our sales commissions are either fixed dollar amount or based on a percentage of the sales price.
All rental operations are conducted worldwide in our name as agent for the container investors. Revenues, customer accounts receivable, operating expenses, and vendor payables arising from direct container operations of the managed portion of our fleet are excluded from our financial statements.
Trading Container Sales Proceeds. Our Container Resale Division purchases used containers from third parties, primarily shipping lines, and resells these containers to a wide variety of buyers. This activity is reported as trading container sales proceeds.
Gain on Sale of Containers, net. Gain on sale of containers, net, represents the excess of the sale price of our owned fleet containers over their net book value at the time of sale. Containers are generally sold at the end of their useful lives in marine service or when we believe it is financially attractive for us to do so, considering the location, sale price, cost of repair and possible repositioning expenses.
Gain on sale of containers, net, also includes gains and losses recognized at the inception of sales-type leases, representing the excess of the estimated fair value of containers placed on sales-type leases over their book value.
| Operating | Expenses |
Our operating expenses include direct container expenses, cost of trading containers sold, depreciation of container rental equipment, container impairment, amortization expense, general and administrative expenses, short-term incentive compensation expense, long-term incentive compensation expense and bad debt expense (recovery).
Direct Container Expenses. Storage, handling, maintenance, repositioning, agency costs, insurance expenses and other direct container expenses are operating costs of our owned fleet. Storage and handling expenses occur when our customers drop off containers at depots around the world. Storage and handling expenses vary significantly by location. Other direct container expenses include maintenance expenses, which are the result of normal wear and tear on the containers, and repositioning expenses, which are incurred when we contract to move containers from locations where our inventories exceed actual or expected demand to locations with higher demand. Other direct container expenses also include agency costs, which are operational expenses incurred in our agent offices, and insurance expenses, which include customer default insurance and recovery costs for problem lessees. Storage, handling, maintenance, repositioning, and other direct container expenses are directly related to the number of containers in our owned fleet and inversely related to our utilization rate for those containers. As utilization increases, we typically have lower storage, handling, maintenance and repositioning expenses. We use the direct expense method of accounting for maintenance and repairs.
Our leases require the lessee to pay for any damage to the container beyond normal wear and tear at the end of the lease term. We also offer a DPP pursuant to which the lessee pays a fee over the term of the lease (per diem) or a lump sum upon return of containers in exchange for not being charged for certain damages at the end of the lease term. This revenue is recognized as earned over the term of the lease. We do not recognize DPP revenue and related
55
expense over the lease term for customers who are billed at the end of the lease term under the DPP or for other lessees who do not participate in the DPP. Based on past history, there is uncertainty as to collectability of these amounts from lessees who are billed at the end of the lease term because the amounts due under the DPP are typically re-negotiated at the end of the lease term or the lease term is extended.
Cost of Trading Containers Sold. We buy used containers for resale, primarily from shipping lines. Cost of trading containers sold represents the cost of these containers and is recognized as an expense at the time the containers are sold.
Depreciation Expense. We depreciate our non-refrigerated containers other than open top and flat rack containers over a period of 13 to 14 years, refrigerated containers over a period of 12 years, tank containers over a period of 20 years and open top and flat rack containers over a period of 14 to 16 years, on a straight-line basis to a fixed residual value. We regularly assess both the estimated useful life of our containers and the expected residual values, and, when warranted, adjust our depreciation estimates accordingly. Depreciation expense will vary over time based upon the number and the purchase price of containers in our owned fleet. Beginning from the third quarter of 2015, depreciation of our existing owned fleet increased as a result of a decrease in the estimated residual value of our 40’ high cube dry containers. Beginning from the third quarter of 2016, depreciation of our existing owned fleet increased as a result of a decrease in the estimated residual values of our 20’ dry containers, 40’ dry containers, 40’ high cube dry containers and 40’ folding flat rack containers, partially offset by an increase in the estimated useful lives of 40’dry containers, 20’ folding flat rack containers, 20’ open top containers and 40’ folding flat rack containers. Beginning from the third quarter of 2017, depreciation of our existing owned fleet decreased as a result of an increase in the estimated residual value of our 20’ dry containers, 40’ dry containers and 40’ high cube dry containers.
Container Impairment. We evaluate our containers held for use in our leasing operation to determine whether there has been any event such as a decline in results of operations or residual values that would cause the book value of our containers held for use to be impaired. When an impairment exists, containers held for use are written down to their fair value and the amount of the write down is recorded in container impairment.
When the Company is required to write down the cost basis of its containers identified for sale to fair value less cost to sell, the Company measures the fair value of its containers identified for sale under a Level 2 input. The Company relies on its recent sales prices for identical or similar assets in markets, by geography, that are active. The Company records impairments to write down the value of containers identified for sale to their estimated fair value less cost to sell. Any subsequent increase in fair value are recognized as reversal of container impairment but not in excess of the cumulative loss previously recognized.
Amortization Expense. Amortization expense represents the amortization of the price paid for the rights to manage the container fleets of Capital Intermodal Limited, Capital Intermodal GmbH and Capital Intermodal Assets Limited(collectively “Capital Intermodal”) and Amphibious Container Leasing Limited (“Amficon”); Capital Lease Limited, Hong Kong (“Capital”). The purchase prices are being amortized over the expected useful lives of the contracts on a pro-rata basis to the expected management fees.
General and Administrative Expense. Our general and administrative expenses are primarily employee-related costs such as salary, employee benefits, rent, travel and entertainment costs, as well as expenses incurred for outside services such as legal, consulting, tax and audit-related fees.
Short-term Incentive Compensation Expense. Short-term incentive compensation expense is the annual bonus plan in which all company employees participate. The compensation amounts are determined on an annual basis based on the company’s performance.
Long-term Incentive Compensation Expense. Long-term incentive compensation expense represents costs recorded for share-based and cash compensation that vests over several years in which some company employees participate.
Bad Debt Expense, net. Bad debt expense, net, represents the amounts recorded to provide for an allowance for the doubtful collection of accounts receivable for the owned fleet.
56
| A. | Operating Results |
Comparison of the Years Ended December 31, 2017, 2016 and 2015
The following table summarizes our total revenues for the years ended December 31, 2017, 2016 and 2015 and percentage changes between those periods:
| Year Ended December 31, | % Change Between | |||||||||||||||||||
| 2017 | 2016 | 2015 | 2017 and 2016 | 2016 and 2015 | ||||||||||||||||
| (Dollars in thousands) | ||||||||||||||||||||
| Lease rental income |
$ | 444,888 | $ | 460,427 | $ | 512,544 | (3.4 | %) | (10.2 | %) | ||||||||||
| Management fees |
14,994 | 13,420 | 15,610 | 11.7 | % | (14.0 | %) | |||||||||||||
| Trading container sales proceeds |
4,758 | 15,628 | 12,670 | (69.6 | %) | 23.3 | % | |||||||||||||
| Gain on sale of containers, net |
26,210 | 6,761 | 3,454 | 287.7 | % | 95.7 | % | |||||||||||||
|
|
|
|
|
|
|
|
|
|
|
|||||||||||
| Total revenues |
$ | 490,850 | $ | 496,236 | $ | 544,278 | (1.1 | )% | (8.8 | %) | ||||||||||
|
|
|
|
|
|
|
|
|
|
|
|||||||||||
Lease rental income decreased $15,539 (-3.4%) from 2016 to 2017. This decrease was primarily due to a 9.1% decrease in average per diem rental rates, partially offset by a 1.2 percentage point increase in utilization for our owned fleet and a 4.8% increase in our owned fleet size. Lease rental income decreased $52,117 (-10.2%) from 2015 to 2016. This decrease was primarily due to a 12.9% decrease in average per diem rental rates and a 2.2 percentage point decrease in utilization for our owned fleet, partially offset by a 4.1% increase in our owned fleet size. The decrease in lease rental income for 2016 included a $11,534 decrease in revenue from Hanjin’s bankruptcy in August 2016.
Management fees increased $1,574 (11.7%) from 2016 to 2017 due to a $1,723 increase in sales commissions and a $560 resulting from a 6.0% increase in the size of the managed fleet, partially offset by a $551 decrease due from lower acquisition fees due to lesser container purchases and a $158 decrease resulting from lower fleet profitability. Management fees decreased $2,190 (-14.0%) from 2015 to 2016 due to a $1,600 decrease resulting from a 7.5% decrease in the size of the managed fleet primarily due to disposals of containers that reached the end of their useful lives, a $892 decrease due to lower fleet profitability and a $238 decrease in sales commissions, partially offset by a $540 increase from higher acquisition fees due to more managed container purchases.
Trading container sales proceeds decreased $10,870 (-69.6%) from 2016 to 2017 due to a $12,830 decrease resulting from a 82.1% decrease in unit sales due to a decrease in the number of trading containers that we were able to source and sell, partially offset by an $1,960 increase due to an increase in average sales proceeds per container. Trading container sales proceeds increased $2,958 (23.3%) from 2015 to 2016 due to a $9,298 increase resulting from a 73.4% increase in unit sales due to an increase in the number of trading containers that we were able to source and sell, partially offset by a $6,340 decrease due to a decrease in average sales proceeds per container.
Gain on sale of containers, net, increased $19,449 (287.7%) from 2016 to 2017 primarily due to a $20,751 increase resulting from an increase in average sales proceeds of $189 per unit and a $988 increase from an average net gain on sales-type leases, partially offset by of $1,453 decrease resulting from a 21.2% decrease in the number of containers sold. Gain on sale of containers, net, increased $3,307 (95.7%) from 2015 to 2016 primarily due to a $2,618 increase resulting from an increase in average sales proceeds of $19 per unit and a $815 increase resulting from a 23.8% increase in the number of containers sold, partially offset by a $126 decrease from an average net loss on sales-type leases.
57
The following table summarizes our total operating expenses for the years ended December 31, 2017, 2016 and 2015 and percentage changes between those periods:
| Year Ended December 31, | % Change Between | |||||||||||||||||||
| 2017 | 2016 | 2015 | 2017 and 2016 | 2016 and 2015 | ||||||||||||||||
| (Dollars in thousands) | ||||||||||||||||||||
| Direct container expense |
$ | 60,321 | $ | 62,596 | $ | 47,342 | (3.6 | %) | 32.2 | % | ||||||||||
| Cost of trading containers sold |
3,302 | 15,904 | 12,475 | (79.2 | %) | 27.5 | % | |||||||||||||
| Depreciation expense |
231,043 | 236,144 | 191,930 | (2.2 | %) | 23.0 | % | |||||||||||||
| Container impairment |
8,072 | 94,623 | 35,345 | (91.5 | %) | 167.7 | % | |||||||||||||
| Amortization expense |
4,092 | 5,053 | 4,741 | (19.0 | %) | 6.6 | % | |||||||||||||
| General and administrative expense |
30,697 | 26,311 | 27,645 | 16.7 | % | (4.8 | %) | |||||||||||||
| Short-term incentive compensation expense |
3,481 | 2,242 | 913 | 55.3 | % | 145.6 | % | |||||||||||||
| Long-term incentive compensation expense |
5,499 | 5,987 | 7,040 | (8.2 | %) | (15.0 | %) | |||||||||||||
| Bad debt expense, net |
477 | 21,166 | 5,028 | (97.7 | %) | 321.0 | % | |||||||||||||
|
|
|
|
|
|
|
|
|
|
|
|||||||||||
| Total operating expenses |
$ | 346,984 | $ | 470,026 | $ | 332,459 | (26.2 | %) | 41.4 | % | ||||||||||
|
|
|
|
|
|
|
|
|
|
|
|||||||||||
Direct container expense decreased $2,275 (-3.6%) from 2016 to 2017 primarily due to an increase in utilization for our owned fleet, partially offset by an increase in the size of our owned fleet and included a $8,754 decrease in storage expense, a $2,950 decrease in recovery costs for problem lessees, partially offset by a $5,191 increase in repositioning expense, a $2,039 increase in maintenance expense and a $1,401 increase in insurance expense. Direct container expense increased $15,254 (32.2%) from 2015 to 2016 primarily due to a decrease in utilization for our owned fleet and an increase in the size of our owned fleet and included a $8,419 increase in storage expense, a $2,283 increase in repositioning expense, a $2,281 increase in handling expense and a $1,313 increase in insurance expense.
Cost of trading containers sold decreased $12,602 (-79.2%) from 2016 to 2017 due to a $13,057 decrease resulting from an 82.1% decrease in the number of containers sold due to a decrease in the number of trading containers that we were able to source and sell, partially offset by a $455 increase resulting from a 16.0% increase in the average cost per unit of containers sold. Cost of trading containers sold increased $3,429 (27.5%) from 2015 to 2016 due to a $9,155 increase resulting from a 73.4% increase in the number of containers sold due to an increase in the number of trading containers that we were able to source and sell, partially offset by a $5,726 decrease resulting from a 26.5% decrease in the average cost per unit of containers sold.
Depreciation expense decreased $5,101 (-2.2%) from 2016 to 2017 and increased $44,214 (23.0%) from 2015 to 2016. The following table summarizes the variances included within these changes,
| From 2016 to 2017 |
From 2015 to 2016 |
|||||||
| Increase in the size of our owned fleet, excluding fully depreciated containers |
$ | 6,405 | $ | 29,301 | ||||
| Increase in estimated future residual value of 20’ dry, 40’ dry and 40’ high cube dry containers used in the calculation of depreciation expense, effective July 1, 2017 |
(7,104 | ) | — | |||||
| Decrease in estimated future residual value of 20’ dry, 40’ dry, 40’ high cube dry and 40’ folding flat rack containers and increase in the estimated useful lives of 40’ dry, 20’ folding flat rack, 20’ open top and 40’ folding flat rack containers, used in the calculation of depreciation expense effective July 1, 2016, of which $4,402 was a one-time charge for containers that were fully depreciated to their previous residual value |
(4,402 | ) | 25,432 | |||||
| Decrease in estimated future residual value of 40’ high cube dry containers used in the calculation of depreciation expense, effective July 1, 2015 |
— | (10,519 | ) | |||||
|
|
|
|
|
|||||
| $ | (5,101 | ) | $ | 44,214 | ||||
|
|
|
|
|
|||||
58
Container impairment decreased $86,551 (-91.5%) from 2016 to 2017 and increased $59,278 (167.7%) from 2015 to 2016. The following table summarizes the variances included within these changes,
| From 2016 to 2017 |
From 2015 to 2016 |
|||||||
| Write down containers on terminated direct finance leases to their estimated fair market value or net book value and for containers that were deemed unlikely to be recovered ($4,750 insurance deductible) from a bankrupt customer in 2016 |
$ | (22,149 | ) | $ | 22,149 | |||
| (Decrease) increase in impairment to write down the value of containers held for sale to their estimated fair value less cost to sell |
(50,980 | ) | 33,772 | |||||
| (Decrease) increase in impairment for containers that were unlikely to be recovered from lessees in default |
(465 | ) | 4,273 | |||||
| Decrease in impairment on containers to a customer that became insolvent in 2015 |
(1,732 | ) | (916 | ) | ||||
| Reversal of previously recorded impairments on containers held for sale due to rising used container prices during 2017 |
(11,225 | ) | — | |||||
|
|
|
|
|
|||||
| $ | (86,551 | ) | $ | 59,278 | ||||
|
|
|
|
|
|||||
Amortization expense represents the amortization of the amounts paid to acquire the rights to manage the Capital Intermodal, Amficon and Capital fleets. Amortization expense decreased $961 (-19.0%) and increased $312 (6.6%) from 2016 to 2017 and from 2015 to 2016, respectively, primarily due to a revision in management fee revenue estimates for the Capital Intermodal, Amficon and Capital fleets.
General and administrative expense increased $4,386 (16.7%) from 2015 to 2016 primarily due to a $2,167 increase in rent expense, included a $1,280 non-recurring charge recorded during 2017 related to an adjustment of prior periods expense, a $899 increase in compensation costs, a $835 increase in professional fees, and a $270 increase in information technology costs. General and administrative expense decreased $1,334 (-4.8%) from 2015 to 2016 primarily due to a $815 decrease in professional fees, a $349 decrease in rent expense, a $219 decrease in compensation costs and a $197 decrease in travel and entertainment expense, partially offset by a $247 increase in information technology costs.
Short-term incentive compensation expense increased $1,239 (55.3%) from 2016 to 2017 due to an increase in the amount of incentive compensation awards for 2017 compared to 2016 resulting from a better achievement of our anticipated financial performance for the fiscal year 2017 compared to fiscal year 2016. Short-term incentive compensation expense increased $1,329 (145.6%) from 2015 to 2016 due to an increase in the amount of incentive compensation awards for 2016 compared to 2015 resulting from a better achievement of our anticipated financial performance for the fiscal year 2016 compared to fiscal year 2015.
Long-term incentive compensation expense decreased $488 (-8.2%) from 2016 to 2017 primarily due to lower fair value of share options and restricted share units that were granted under the 2015 Share Incentive Plan (“2015 Plan”) in November 2016 that vested in 2017 and an adjustment to forfeiture rates in 2017, partially offset by additional share options and restricted share units that were each granted under the 2015 Plan in November 2016 and 2017. Long-term incentive compensation expense decreased $1,053 (-15.0%) from 2015 to 2016 primarily due to lower fair value of share options and restricted share units that was granted under the 2015 Plan in November 2015 that vested in 2016 and an adjustment to forfeiture rates in 2016 partially offset by additional share options and restricted share units that were each granted under the 2015 Plan in November 2015 and 2016.
Bad debt expense, net, decreased $20,689 (-97.7%) from 2016 to 2017 primarily due to a provision of $18,992, net of insurance proceeds, for Hanjin’s bankruptcy in 2016 and management’s assessment that the financial condition of certain of the Company’s lessees and their ability to make required payments had improved during 2017. Bad debt expense, net, increased $16,138 (321.0%) from 2015 to 2016 primarily due to a provision of $18,992, net of insurance proceeds, for Hanjin’s bankruptcy in 2016, as compared to a provision of $2,574 resulting from a customer that became insolvent in 2015 and management’s assessment that the financial condition of certain of the Company’s lessees and their ability to make required payments had improved during 2016.
59
The following table summarizes other income (expenses) for the years ended December 31, 2017, 2016 and 2015 and percentage changes between those periods:
| Year Ended December 31, | % Change Between | |||||||||||||||||||
| 2017 | 2016 | 2015 | 2017 and 2016 | 2016 and 2015 | ||||||||||||||||
| (Dollars in thousands) | ||||||||||||||||||||
| Interest expense |
$ | (117,475 | ) | $ | (85,215 | ) | $ | (76,063 | ) | 37.9 | % | 12.0 | % | |||||||
| Write-off of unamortized deferred debt issuance costs and bond discounts |
(7,550 | ) | — | (458 | ) | 100.0 | % | (100.0 | %) | |||||||||||
| Interest income |
613 | 408 | 125 | 50.2 | % | 226.4 | % | |||||||||||||
| Realized losses on interest rate swaps, collars and caps, net |
(1,191 | ) | (8,928 | ) | (12,823 | ) | (86.7 | )% | (30.4 | %) | ||||||||||
| Unrealized gains (losses) on interest rate swaps, collars and caps, net |
4,094 | 6,210 | (1,947 | ) | (34.1 | )% | (419.0 | %) | ||||||||||||
| Other, net |
3 | (8 | ) | 26 | (137.5 | )% | (130.8 | %) | ||||||||||||
|
|
|
|
|
|
|
|
|
|
|
|||||||||||
| Net other expense |
$ | (121,506 | ) | $ | (87,533 | ) | $ | (91,140 | ) | 38.8 | % | (4.0 | %) | |||||||
|
|
|
|
|
|
|
|
|
|
|
|||||||||||
Interest expense increased $32,260 (37.9%) from 2016 to 2017 and $9,152 (12.0%) from 2015 to 2016. The increase in interest expense for 2017 compared to 2016 was due to a $34,374 increase resulting from an increase in average interest rates of 1.16 percentage points, partially offset by a $2,114 decrease resulting from a decrease in average debt balances of $75,167. The increase in interest expense for 2016 compared to 2015 was due to a $9,681 increase resulting from an increase in average interest rates of 0.30 percentage points, partially offset by a $529 decrease resulting from a decrease in average debt balances of $21,236.
Write-off of unamortized debt issuance costs and bond discounts increased $7,550 (100.0%) from 2016 to 2017 and decreased $458 (-100.0%) from 2015 to 2016. The write-off of unamortized debt issuance costs and bond discounts for 2017 amount to 7,550, of which $7,228 related to the early redemption of Textainer Marine Containers III Limited’s (“TMCL III”) 2013-1 Bonds, 2014-1 Bonds and 2017-A Notes, $238 related to the amendment of Textainer Marine Containers II Limited’s (“TMCL II”) secured debt facility and $84 related to the amendment of TAP Funding Limited’s (“TAP”) revolving credit facility. There was no write-off of unamortized deferred debt issuance costs and bond discounts for 2016. The write-off of unamortized debt issuance costs and bond discounts for 2015 amounted to $458, of which $160 and $298 which related to the amendment of Textainer Limited’s (“TL”) revolving credit facility and the amendment of Textainer Marine Containers IV Limited’s (“TMCL IV”) secured debt facility, respectively.
Realized losses on interest rate swaps, collars and caps, net decreased $7,737 (-86.7%) from 2016 to 2017 due to a $6,352 decrease from a decrease in the average net settlement differential between variable interest rates received compared to fixed interest rates paid on interest rate swaps of 0.41 percentage points, and a $1,385 decrease resulting from a decrease in average interest rate swap notional amounts of $282,694. Realized losses on interest rate swaps, collars and caps, net decreased $3,895 (-30.4%) from 2015 to 2016 due to a $7,175 decrease from a decrease in the average net settlement differential between variable interest rates received compared to fixed interest rates paid on interest rate swaps of 0.41 percentage points, partially offset by a $3,280 increase resulting from an increase in average interest rate swap notional amounts of $352,525.
Unrealized gains on interest rate swaps, collars and caps, net decreased $2,116 (-34.1%) from 2016 to 2017 primarily due to a smaller increase in long-term interest rates during 2017 compared to 2016. Unrealized gains (losses) on interest rate swaps, collars and caps, net changed from a net loss of $1,947 in 2015 to a net gain of $6,210 in 2016 primarily due to a decrease in long-term interest rates during 2015 compared to an increase in long-term interest rates during 2016. Unrealized gains (losses) were triggered by the change of the fair values of the Company’s interest rate hedging instruments, which were mainly due to factors such as projected levels of forward yield curves, credit spreads and the passage of time.
60
The following table summarizes income tax benefit (expense) and net (loss) income attributable to the noncontrolling interests for the years ended December 31, 2017, 2016 and 2015 and percentage changes between those periods:
| Year Ended December 31, | % Change Between | |||||||||||||||||||
| 2017 | 2016 | 2015 | 2017 and 2016 | 2016 and 2015 | ||||||||||||||||
| (Dollars in thousands) | ||||||||||||||||||||
| Income tax (expense) benefit |
$ | (1,618 | ) | $ | 3,447 | $ | (6,695 | ) | (146.9 | )% | (151.5 | %) | ||||||||
| Net income (loss) attributable to the noncontrolling interests |
$ | 1,377 | $ | (5,393 | ) | $ | 5,576 | (125.5 | )% | (196.7 | %) | |||||||||
Income tax (expense) benefit changed from income tax benefit of $3,447 in 2016 to an income tax expense of $1,618 in 2017. Our effective tax rate in 2017 increased to 7.24% from 5.62% in 2016. The change in income tax (expense) benefit in 2017 compared to 2016 was primarily due to an increase resulting from a higher level of U.S. sourcing income before tax and noncontrolling interests and a higher effective tax rate, partially offset by a tax benefit on the re-measurement of our U.S. deferred tax assets and liabilities due to the 2017 tax reform, TCJA. Income tax benefit (expense) changed from income tax expense of $6,695 in 2015 to an income tax benefit of $3,447 in 2016. Our effective tax rate in 2016 increased marginally to 5.62% from 5.55% in 2015. The change in income tax benefit (expense) in 2016 compared to 2015 was primarily due to a decrease resulting from a lower level of U.S. sourcing income before tax and noncontrolling interests.
Net income (loss) attributable to the noncontrolling interests in 2017, 2016 and 2015 represents the noncontrolling interest’s portion of TAP Funding and TW Container Leasing, Ltd.’s (“TW”) net income (loss). Net income attributable to the noncontrolling interests for the year ended December 31, 2017 and 2015 represents the noncontrolling interest’s portion of TAP Funding’s and TWCL’s net income. Net loss attributable to the noncontrolling interests for the years ended December 31, 2016 represents the noncontrolling interest’s portion of TAP Funding’s and TWCL’s net loss. See Item 4, “Information on the Company— History and Development of the Company.”
Segment Information
The following table summarizes our income (loss) before income taxes and noncontrolling interests attributable to each of our business segments for the years ended December 31, 2017 and 2016 and 2015 (before inter-segment eliminations) and percentage changes between those periods:
| Year Ended December 31, | % Change Between | |||||||||||||||||||
| 2017 | 2016 | 2015 | 2017 and 2016 | 2016 and 2015 | ||||||||||||||||
| (Dollars in thousands) | ||||||||||||||||||||
| Container ownership |
$ | (1,707 | ) | $ | (84,252 | ) | $ | 88,536 | (98.0 | %) | (195.2 | %) | ||||||||
| Container management |
15,376 | 18,134 | 26,305 | (15.2 | %) | (31.1 | %) | |||||||||||||
| Container resale |
10,854 | 6,178 | 9,335 | 75.7 | % | (33.8 | %) | |||||||||||||
| Other |
(3,568 | ) | (3,016 | ) | (4,283 | ) | 18.3 | % | (29.6 | %) | ||||||||||
| Eliminations |
1,405 | 1,633 | 786 | (14.0 | %) | 107.8 | % | |||||||||||||
|
|
|
|
|
|
|
|
|
|
|
|||||||||||
| Income before income tax and noncontrolling interests |
$ | 22,360 | $ | (61,323 | ) | $ | 120,679 | (136.5 | %) | (150.8 | %) | |||||||||
|
|
|
|
|
|
|
|
|
|
|
|||||||||||
61
Loss before income taxes and noncontrolling interests attributable to the Container Ownership segment decreased $82,545 (-98.0%) from 2016 to 2017. The following table summarizes the variances included within this decrease:
| Increase in interest expense |
$ | (32,260 | )(1) | |
| Decrease in lease rental income |
(16,027 | )(2) | ||
| Increase in write-off of unamortized deferred debt issuance costs and bond discounts |
(7,550 | )(3) | ||
| Decrease in unrealized gains on interest rate swaps, collars and caps, net |
(2,116 | )(4) | ||
| Decrease in container impairments |
86,551 | (5) | ||
| Decrease in bad debt expense |
20,685 | (6) | ||
| Increase in gain on sale of containers, net |
19,449 | (7) | ||
| Decrease in realized losses on interest rate swaps, collars and caps, net |
7,737 | (8) | ||
| Decrease in depreciation expense |
4,921 | (9) | ||
| Other |
1,155 | |||
|
|
|
|||
| $ | 82,545 | |||
|
|
|
| (1) | The increase in interest expense was primarily due to an increase in average interest rates of 1.16 percentage points, partially offset by a decrease in average debt balances of $75,167. |
| (2) | The decrease in lease rental income was primarily due to a 9.1% decrease in average per diem rental rates, partially offset by a 1.2 percentage point increase in utilization for our owned fleet and a 4.8% increase in our owned fleet size. |
| (3) | The write-off of unamortized debt issuance costs and bond discounts in 2017 amounted to $7,228, $238 and $84, which related to the early redemption of TMCL III’s 2013-1 Bonds, 2014-1 Bonds and 2017-A Notes, amendment of TMCL II’s Secured Debt Facility, and amendment of TAP’s Revolving Credit Facility, respectively. |
| (4) | The decrease in unrealized gains (losses) on interest rate swaps, collars and caps, net was primarily due to a lower increase in long-term interest rates during 2017 compared 2016. |
| (5) | The decrease in container impairment was due to a $50,980 decrease in impairments to write down the value of containers held for sale to their estimated fair value less cost to sell and a $11,225 reversal of previously recorded impairments on containers held for sale due to rising used container prices during 2017, a $465 decrease in impairments for containers that were unlikely to be recovered from lessees in default, a $17,399 impairment to write down the carrying value of containers on terminated direct finance leases to their estimated fair market value and a $4,750 impairment net of estimated insurance proceeds for containers on operating and direct financing leases that were deemed unlikely to be recovered from a customer that filed for bankruptcy in August 2016 and a $1,732 decrease in impairment for containers on operating and direct financing leases that were deemed unlikely recoverable from a customer that became insolvent in 2015. |
| (6) | The decrease in bad debt expense, net was primarily due to a provision of $18,992, net of insurance proceeds, for Hanjin’s bankruptcy in 2016 and management’s assessment that the financial condition of certain of the Company’s lessees and their ability to make required payments had improved during 2017. |
| (7) | The increase in gain on sale of containers, net was primarily due to an increase in average sales proceeds of $189 per unit and an increase from a net gain on sales-type leases, partially offset by a 21.2% decrease in the number of containers sold. |
| (8) | The decrease in realized losses on interest rate swaps, collars and caps, net was due to a decrease in the average net settlement differential between variable interest rates received compared to fixed interest rates paid on interest rate swaps of 0.41 percentage points and a decrease in average interest rate swap notional amounts of $282,694. |
| (9) | The decrease in depreciation expense was primarily due to a $7,104 decrease resulting from an increase in the estimated future residual value of 20’ dry, 40’ dry and 40’ high cube dry containers used in the calculation of depreciation expense effective July 1, 2017 and a $4,402 one-time charge for containers that were fully depreciated to their previous residual value on the decrease in the estimated future residual value of 20’ dry, 40’ dry, 40’ high cube dry and 40’ folding flat rack containers used in the calculation of depreciation expense effective July 1, 2016, including a, partially offset by a $6,585 increase resulting from an increase in the size of our owned fleet, excluding fully depreciated containers. |
62
(Loss) income before income taxes and noncontrolling interests attributable to the Container Ownership segment decreased $172,788 (-195.2%) from 2015 to 2016. The following table summarizes the variances included within this decrease:
| Increase in container impairments |
$ | (59,278 | )(1) | |
| Decrease in lease rental income |
(52,708 | )(2) | ||
| Increase in depreciation expense |
(44,414 | )(3) | ||
| Increase in bad debt expense |
(16,129 | )(4) | ||
| Increase in interest expense |
(8,694 | )(5) | ||
| Increase in direct container expense |
(6,776 | )(6) | ||
| Change from unrealized losses on interest rate swaps, collars and caps, net in 2015 to unrealized gains on interest rate swaps, collars and caps, net in 2016 |
8,157 | (7) | ||
| Decrease in realized losses on interest rate swaps and caps, net |
3,895 | (8) | ||
| Increase in gain on sale of containers, net |
3,307 | (9) | ||
| Other |
(148 | ) | ||
|
|
|
|||
| $ | (172,788 | ) | ||
|
|
|
| (1) | The increase in container impairment was due to a $33,772 increase in impairments to write down the value of containers held for sale to their estimated fair value less cost to sell, a $4,273 increase in impairments for containers that were unlikely to be recovered from lessees in default, a $17,399 impairment to write down the carrying value of containers on terminated direct finance leases to their estimated fair market value and a $4,750 impairment net of estimated insurance proceeds for containers on operating and direct financing leases that were deemed unlikely to be recovered from a customer that filed for bankruptcy in August 2016, partially offset by a $916 decrease in impairment for containers on operating and direct financing leases that were deemed unlikely recoverable from a customer that became insolvent in 2015. |
| (2) | The decrease in lease rental income was primarily due to a 12.9% decrease in average per diem rental rates and a 2.2 percentage point decrease in utilization for our owned fleet, partially offset by a 4.1% increase in our owned fleet size. The decrease in lease rental income for 2016 included a $11,534 decrease in revenue from Hanjin’s bankruptcy in August 2016. |
| (3) | The increase in depreciation expense was primarily due to a $29,501 increase resulting from an increase in the size of our owned fleet and a $25,432 net increase resulting from a decrease in the estimated future residual value of 20’ dry, 40’ dry, 40’ high cube dry and 40’ folding flat rack containers and an increase in the estimated useful lives of 40’ dry, 20’ folding flat rack, 20’ open top and 40’ folding flat rack containers used in the calculation of depreciation expense effective July 1, 2016, including a $4,402 a one-time charge for containers that were fully depreciated to their previous residual value, partially offset by a $10,519 increase resulting from a decrease in the estimated future residual value of 40’ high cube dry containers used in the calculation of depreciation expense, effective July 1, 2015. |
| (4) | The increase in bad debt expense, net was primarily due to a provision of $18,992, net of insurance proceeds, for Hanjin’s bankruptcy in 2016, as compared to a provision of $2,574 resulting from a customer that became insolvent in 2015 and management’s assessment that the financial condition of certain of the Company’s lessees and their ability to make required payments had improved during 2016. |
| (5) | The increase in interest expense for 2016 was primarily due to an increase in average interest rates of 0.30 percentage points, partially offset by a decrease in average debt balances of $21,236. |
| (6) | The increase in direct container expense was primarily due to a decrease in utilization for our owned fleet and an increase in the size of our owned fleet and included increases in storage, repositioning, handling and insurance expenses. The increase in direct container expense also included a decrease in inter-segment management fees of $7,009 paid to our Container Management segment primarily due to lowered profitability of the owned fleet, partially offset by an increase in the size of the owned fleet and a decrease in inter-segment sales commissions of $1,611 paid to our Container Resale segment primarily due to a decrease in average sales proceeds of our owned container sales, partially offset by an increase in the volume of owned container sales. Inter-segment management fees and sales commissions are eliminated in consolidation. |
| (7) | Unrealized gains (losses) on interest rate swaps, collars and caps, net changed from a net loss of $1,947 in 2015 to a net gain of $6,210 in 2016 primarily due to a decrease in long-term interest rates during 2015 compared to an increase in long-term interest rates in 2016. |
63
| (8) | The decrease in realized losses on interest rate swaps, collars and caps, net was due to a decrease in the average net settlement differential between variable interest rates received compared to fixed interest rates paid on interest rate swaps of 0.41 percentage points, partially offset by an increase in average interest rate swap notional amounts of $352,525. |
| (9) | The increase in gain on sale of containers, net was primarily due to an increase in average sales proceeds of $19 per unit and a 23.8% increase in the number of containers sold, partially offset by a decrease from a net loss on sales-type leases. |
Income before income taxes and noncontrolling interests attributable to the Container Management segment decreased $2,758 (-15.2%) from 2016 to 2017. The following table summarizes the variances included within this decrease:
| Increase in general and administrative expense |
$ | (4,123 | )(1) | |
| Increase in short term incentive compensation expense |
(1,124 | )(2) | ||
| Increase in management fees |
1,326 | (3) | ||
| Decrease in long term incentive compensation expense |
1,069 | (4) | ||
| Other |
94 | |||
|
|
|
|||
| $ | (2,758 | ) | ||
|
|
|
| (1) | The increase in general and administrative expense was primarily due to increases in rent expense, compensation costs, professional fees and information technology costs. |
| (2) | The increase in short-term incentive compensation expense was due to an increase in the incentive compensation awards for 2017 compared to 2016 resulting from a better achievement of our anticipated financial performance for the fiscal year 2017 compared to fiscal year 2016. |
| (3) | The increase in management fees was primarily due to a $1,216 increase in inter-segment management fees received from our Container Ownership segment primarily due to an increase in the size of the owned fleet, partially offset by lower profitability of the owned fleet, a $233 increase in inter-segment acquisition fees received from our Container Ownership segment primarily due to an increase in the amount of owned container purchases, partially offset by a $123 decrease in management fees from external customers resulting from lower acquisition fees due to lesser container purchases, partially offset by a 6.0% increase in the size of the managed fleet. Inter-segment management fees and acquisition fees are eliminated in consolidation. |
| (4) | The decrease in long-term incentive compensation expense was primarily due to lower fair value of share options and restricted share units that were granted under the 2015 Plan in November 2016 that vested in 2017 and an adjustment to forfeiture rates in 2017, partially offset by additional share options and restricted share units that were each granted under the 2015 Plan in November 2016 and 2017. |
Income before income taxes and noncontrolling interests attributable to the Container Management segment decreased $8,171 (-31.1%) from 2015 to 2016. The following table summarizes the variances included within this decrease:
| Decrease in management fees |
$ | (9,466 | )(1) | |
| Increase in short term incentive compensation expense |
(1,211 | )(2) | ||
| Decrease in long term incentive compensation expense |
997 | (3) | ||
| Decrease in general and administrative expense |
507 | (4) | ||
| Decrease in amortization expense |
413 | (5) | ||
| Other |
589 | |||
|
|
|
|||
| $ | (8,171 | ) | ||
|
|
|
| (1) | The decrease in management fees was primarily due to a $7,009 decrease in inter-segment management fees received from our Container Ownership segment primarily due to lower profitability of the owned fleet, partially offset by an increase in the size of the owned fleet, a $1,926 decrease in management fees from external customers resulting from a 7.5% decrease in the size of the managed fleet primarily due to disposals of containers that reached the end of their useful lives and a $531 decrease in inter-segment acquisition fees received from our Container Ownership segment primarily due to an decrease in the amount of owned container purchases. Inter-segment management fees and acquisition fees are eliminated in consolidation. |
64
| (2) | The increase in short-term incentive compensation expense was due to an increase in the incentive compensation awards for 2016 compared to 2015. |
| (3) | The decrease in long-term incentive compensation expense was due to share options and restricted share units granted under the 2007 Plan in 2010 and an adjustment to forfeiture rates in 2016, partially offset by additional share options and restricted share units that were each granted under the 2015 Plan in November 2015 and 2016. |
| (4) | The decrease in general and administrative expense due to decreases in professional fees, rent expense, compensation costs and travel and entertainment expense, partially offset by an increase in information technology costs. |
| (5) | The decrease in amortization expense was primarily due to a revision in management fee revenue estimates for the Capital Intermodal, Amficon and Capital fleets. |
Income before income taxes and noncontrolling interests attributable to the Container Resale segment increased $4,676 (75.7%) from 2016 to 2017. The following table summarizes the variances included within this increase:
| Increase in management fees |
$ | 2,706 | (1) | |
| Change from losses on container trading, net to gains on container trading, net |
1,739 | (2) | ||
| Other |
231 | |||
|
|
|
|||
| $ | 4,676 | |||
|
|
|
| (1) | The increase in management fees was due to an increase in sales commissions resulting from a $1,722 increase in sales commissions from external customers primarily due to an increase in average sales proceeds of managed container sales, partially offset by a decrease in the volume of managed containers sales and a $984 increase in inter-segment sales commissions received from our Container Ownership segment primarily due to an increase in average sales proceeds of owned container sales, partially offset by a decrease in the volume of owned container sales. Inter-segment sales commissions are eliminated in consolidation. |
| (2) | Net gains (losses) on container trading, net changed from a net loss of $284 in 2016 to a net gain of $1,455 in 2017 primarily due to an increase in average sales margin per container, partially offset by an 82.1% decrease in unit sales resulting from a decrease in the number of trading containers that we were able to source and sell. |
Income before income taxes and noncontrolling interests attributable to the Container Resale segment decreased $3,157 (-33.8%) from 2015 to 2016. The following table summarizes the variances included within this decrease:
| Decrease in management fees |
$ | (1,848 | )(1) | |
| Increase in amortization expense |
(725 | )(2) | ||
| Change from gains on container trading, net in 2015 to losses on container trading, net in 2016 |
(492 | )(3) | ||
| Other |
(92 | ) | ||
|
|
|
|||
| $ | (3,157 | ) | ||
|
|
|
| (1) | The decrease in management fees was due to a decrease in sales commissions resulting from a $1,611 decrease in inter-segment sales commissions received from our Container Ownership segment primarily due to a decrease in average sales proceeds of owned container sales, partially offset by an increase in the volume of owned container sales and a $237 decrease in sales commissions from external customers primarily due to a decrease in average sales proceeds of managed container sales, partially offset by an increase in the volume of managed containers sales. Inter-segment sales commissions are eliminated in consolidation. |
| (2) | The increase in amortization expense was primarily due to a revision in management fees revenue estimates for the Capital Intermodal, Amficon and Capital fleets. |
| (3) | Net (losses) gains on container trading, net changed from a net gain of $208 in 2015 to a net loss of $284 in 2016 primarily due to a decrease in average sales margin per container, partially offset by a 73.4% increase in unit sales resulting from an increase in the number of trading containers that we were able to source and sell. |
65
Loss before income taxes and noncontrolling interests attributable to Other activities unrelated to our reportable business segments increased $552 (18.3%) from 2016 to 2017 primarily due to a $541 increase in long-term incentive compensation expense resulting from additional share options and restricted share units that were each granted under the 2015 Plan in November 2016 and 2017.
Loss before income taxes and noncontrolling interests attributable to Other activities unrelated to our reportable business segments decreased $1,267 (-29.6%) from 2015 to 2016 primarily due to a $1,110 decrease in corporate overhead expense resulting primarily from a decrease in professional fees.
Segment eliminations decreased $228 (-14.0%) from 2016 to 2017 and consisted of a $233 increase in acquisition fees received by our Container Management segment from our Container Ownership segment, partially offset by a $5 increase in depreciation expense related to capitalized acquisition fees received by our Container Management segment from our Container Ownership segment. Our Container Ownership segment capitalizes acquisition fees billed by our Container Management segment as part of containers, net and records depreciation expense to amortize the acquisition fees over the useful lives of the containers, which is eliminated in consolidation.
Segment eliminations increased $847 (107.8%) from 2015 to 2016 and consisted of a $531 decrease in acquisition fees received by our Container Management segment from our Container Ownership segment and a $316 increase in depreciation expense related to capitalized acquisition fees received by our Container Management segment from our Container Ownership segment. Our Container Ownership segment capitalizes acquisition fees billed by our Container Management segment as part of containers, net and records depreciation expense to amortize the acquisition fees over the useful lives of the containers, which is eliminated in consolidation.
Currency
As in previous years, almost all of our revenues are denominated in U.S. dollars and approximately 75% of our direct container expenses in 2017 were denominated in U.S. dollars. Our operations in locations outside of the U.S. have some exposure to foreign currency fluctuations, and trade growth and the direction of trade flows can be influenced by large changes in relative currency values. In 2017, our non-U.S. dollar operating expenses were spread among 20 currencies, resulting in some level of self-hedging. We do not engage in currency hedging.
Critical Accounting Policies and Estimates
The preparation of financial statements in conformity with U.S. GAAP requires management to use judgment in making estimates and assumptions that affect the reported amounts of assets and liabilities, the reported amounts of income and expenses during the reporting period and the disclosure of contingent assets and liabilities as of the date of the financial statements. We have identified the policies and estimates below as among those critical to our business operations and the understanding of our results of operations. These policies and estimates are considered critical due to the existence of uncertainty at the time the estimates are made, the likelihood of changes in estimates from period to period and the potential impact that these estimates can have on our financial statements. The following accounting policies and estimates include inherent risks and uncertainties related to judgments and assumptions made by us. Our estimates are based on the relevant information available at the end of each period.
Revenue Recognition
Lease Rental Income. We recognize revenue from operating leases of our owned containers as earned over the term of the lease. The Company’s container leases generally do not include step-rent provisions, nor do they depend on indices or rates. The Company recognizes revenue on container leases that include lease concessions in the form of free-rent periods using the straight-line method over the minimum terms of the leases. We cease recognition of lease revenue if and when a container lessee defaults in making timely lease payments or we otherwise determine that future lease payments are not likely to be collected from the lessee. Our determination of the collectability of future lease payments is made by management on the basis of available information, including the current creditworthiness of container shipping lines that lease containers from us, historical collection results and review of specific past due receivables. If we experience unexpected payment defaults from our container lessees, we will cease revenue recognition for those leases, which will reduce container rental revenue. Finance lease income is
66
recognized using the effective interest method, which generates a constant rate of interest over the period of the lease. The same risks of collectability discussed above apply to our collection of finance lease income. If we experience unexpected payment defaults under our finance leases, we will cease revenue recognition for those leases that will reduce finance lease income.
Our leases typically require the lessee to pay, at the end of the lease term, for any damage to the container beyond normal wear and tear. We also offer a Damage Protection Plan (“DPP”) pursuant to which the lessee pays a fee over the term of the lease, primarily on a daily basis, in exchange for not being charged for certain damages at the end of the lease term. It is our policy to recognize these revenues as earned on a daily basis over the related term of the lease. We have not recognized revenue for customers who are billed at the end of the lease term under our DPP or for other lessees who do not participate in the DPP. Based on past history, there is uncertainty as to collectability of these amounts because the amounts due under the DPP are typically re-negotiated at the end of the lease term or when the lease term is extended.
Management Fee Revenue. We recognize revenue from management fees earned under management agreements on an as-earned basis. Fees are typically calculated as a percentage of net operating income, which is revenue from the containers under management minus direct operating expense related to those containers. If a lessee of a managed container defaults in making timely lease payments or we otherwise determine that future lease payments are not likely to be collected from the lessee, then we will cease to record lease revenue, which in turn will result in reduced management fee revenue.
Container Resale Revenue. We recognize revenue from resale of used containers at the time of delivery to, or pick-up by, the customer and when collectability is reasonably assured. The related expenses represent the cost of trading containers sold as well as other selling costs that are recognized as incurred.
Accounting for Container Leasing Equipment
Accounting for container leasing equipment includes depreciation, impairment of held for use equipment and the impairment of containers held for sale.
Depreciation. When we acquire containers, we record the cost of the container on our balance sheet. We then depreciate the container over its estimated useful life (which represents the number of years we expect to be able to lease the container to shipping lines) to its estimated “residual value” (which represents the amount we estimate we will recover upon the sale or other disposition of the equipment at the end of its “useful life” as a shipping container). Our estimates of useful life are based on our actual experience with our fleet, and our estimates of residual value are based on a number of factors including disposal price history.
We review our depreciation policies, including our estimates of useful lives and residual values, on a regular basis to determine whether a change in our estimates of useful lives and residual values is warranted.
67
We assessed the estimates used in the Company’s depreciation policy on a quarterly basis during the years ended December 31, 2017 and 2016. We take a long-term view when assessing its residual values and typically does not change its residual values until disposal prices have been significantly above or below residual values between one to two years.
The Company estimates the useful lives and residual values of its containers to be as follows:
| Effective July 1, 2017 | July 1, 2016 through June 30, 2017 |
January 1, 2016 through June 30, 2016 |
||||||||||||||||||||||
| Estimated useful life (years) |
Residual Value |
Estimated useful life (years) |
Residual Value |
Estimated useful life (years) |
Residual Value |
|||||||||||||||||||
| Dry containers other than open top and flat rack containers: |
||||||||||||||||||||||||
| 20’ |
13 | $ | 1,000 | 13 | $ | 950 | 13 | $ | 1,050 | |||||||||||||||
| 40’ |
14 | $ | 1,200 | 14 | $ | 1,150 | 13 | $ | 1,300 | |||||||||||||||
| 40’ high cube |
13 | $ | 1,350 | 13 | $ | 1,300 | 13 | $ | 1,450 | |||||||||||||||
| 45’ high cube dry van |
13 | $ | 1,500 | 13 | $ | 1,500 | 13 | $ | 1,500 | |||||||||||||||
| Refrigerated containers: |
||||||||||||||||||||||||
| 20’ |
12 | $ | 2,750 | 12 | $ | 2,750 | 12 | $ | 2,750 | |||||||||||||||
| 20’ high cube |
12 | $ | 2,049 | 12 | $ | 2,049 | 12 | $ | 2,049 | |||||||||||||||
| 40’ high cube |
12 | $ | 4,500 | 12 | $ | 4,500 | 12 | $ | 4,500 | |||||||||||||||
| Open top and flat rack containers: |
||||||||||||||||||||||||
| 20’ folding flat rack |
15 | $ | 1,300 | 15 | $ | 1,300 | 14 | $ | 1,300 | |||||||||||||||
| 40’ folding flat rack |
16 | $ | 1,700 | 16 | $ | 1,700 | 14 | $ | 2,000 | |||||||||||||||
| 20’ open top |
15 | $ | 1,500 | 15 | $ | 1,500 | 14 | $ | 1,500 | |||||||||||||||
| 40’ open top |
14 | $ | 2,500 | 14 | $ | 2,500 | 14 | $ | 2,500 | |||||||||||||||
| Tank containers |
20 | 10% of cost | 20 | 10% of cost | 20 | 10% of cost | ||||||||||||||||||
During the third quarter 2017, the Company reassessed the estimates contained in its depreciation policy. To perform the assessment, the Company analyzed sales data from 2008 to July 2017 as this period reflects the cyclical nature of the global economic environment and more specifically, the Company’s industry. This period includes multiple business cycles, including two periods of weak trade growth (2009 and 2014 through July 2017) and two periods of strong container demand (2008 and 2010 through 2012). We believe the best comparison points are the weighted averages sales prices for this period excluding the highest and lowest years or periods and average sales prices for the last two periods/years which highlight the most current period trends as shown in the table below for each of our major equipment types.
| Periods |
Dry Containers | Refrigerated Containers |
||||||||||||||
| 20’ | 40’ | 40’ High Cube | 40’ High Cube | |||||||||||||
| Weighted average sales price from 2008 to July 2017 (excludes the highest and lowest periods) |
$ | 1,163 | $ | 1,443 | $ | 1,607 | $ | 4,782 | ||||||||
| Average sales price: |
||||||||||||||||
| 2016 |
$ | 734 | $ | 812 | $ | 910 | $ | 3,640 | ||||||||
| Year-to-date July 2017 |
$ | 1,069 | $ | 1,186 | $ | 1,363 | $ | 4,527 | ||||||||
68
The average of long-term average sales prices excluding the highest and lowest years and the year-to-date July 2017 sales prices for 20’, 40’ and 40’ high cube dry containers were significantly above their residual values for the year-to-date July 2017 so the Company performed additional qualitative analyses and concluded a change in the residual values was warranted as the increase in value is indicative of a permanent increase. Accordingly, beginning July 1, 2017, the Company increased the estimated future residual value of its 20’, 40’ and 40’ high cube dry containers.
During the third quarter 2016, the Company reassessed the estimates contained in its depreciation policy. As previously mentioned, we do not adjust long-term residual value estimates based on short-term data points including year-to-date July 2016 average sales prices shown in the table below.
| Periods |
Dry containers | Refrigerated Containers |
||||||||||||||
| 20’ | 40’ | 40’ High Cube | 40’ High Cube | |||||||||||||
| Weighted average sales price from 2008 to July 2016 (excludes the highest and lowest periods) |
$ | 1,172 | $ | 1,474 | $ | 1,645 | $ | 4,931 | ||||||||
| Average sales price: |
||||||||||||||||
| 2015 |
$ | 966 | $ | 1,132 | $ | 1,229 | $ | 3,747 | ||||||||
| Year-to-date July 2016 |
$ | 734 | $ | 835 | $ | 914 | $
|
3,626 |
| |||||||
The average sales prices for 20’, 40’ and 40’ high cube dry containers were significantly below their residual values in both 2015 and year-to-date July 2016 so the Company performed additional qualitative analyses and concluded a change in the residual values was warranted as the decline in value was indicative of a permanent decline. Accordingly, beginning July 1, 2016, the Company decreased the estimated future residual value of its 20’, 40’, and 40’ dry high cube containers and 40’ folding flat rack containers. Over the past few years, the Company has also experienced a significant increase in the useful lives of its 40’ dry containers, 20’ folding flat rack containers, 20’ open top containers and 40’ flat rack containers as the Company entered into leases with longer terms on these equipment types. Based on this extended period of longer useful lives and the Company’s expectation that new equipment lives on these equipment types would remain near those levels, the Company increased the estimated useful lives of these equipment types effective July 1, 2016. While the average sales price for 40’ high cube refrigerated containers have been below their residual value year-to-date July 2016 and in 2015, the Company does not believe the average sales price for those containers to be indicative of a decline in value because the containers that were disposed during those periods were lower cost containers that were not representative of the Company’s fleet of 40’ high cube refrigerated containers. Accordingly, the Company did not adjust the residual value of its 40’ high cube refrigerated containers.
If market conditions in the future warrant a change in the estimated useful lives or residual values of our containers, we may be required to again recognize increased or decreased depreciation expense. A decrease in either the useful life or residual value of our containers would result in increased depreciation expense and decreased net income. An increase in either the useful life or residual value of our containers would result in reduced depreciation expense and increased net income.
Container Impairment. On a quarterly basis, we evaluate our containers held for use in our leasing operation to determine whether there has been any event such as a decline in results of operations or residual values that would cause the book value of our containers held for use to be impaired. This evaluation is performed at the lowest level of identifiable cash flows which we have determined to be groups of containers based on equipment type. The estimated undiscounted cash flows was based on historical lease operating revenue, expenses and residual values, adjusted to reflect current market conditions. Impairment exists when the estimated future undiscounted cash flows to be generated by an asset group are less than the net book value of that asset group. Any such impairment would be expensed in our results of operations. There was no such impairment for the years ended December 31, 2017, 2016 and 2015.
In 2017, 2016 and 2015 the Company recorded impairments for containers that were unlikely recoverable from lessees in default. When an impairment exists, the containers are written down to their fair value. This fair value is then the containers’ new cost basis and is depreciated over their remaining useful lives in marine services to their estimated residual values. Any impairment charge results in decreased net income.
69
Impairment of Containers Held for Sale. We also evaluate all off-lease containers to determine whether the containers will be repaired and returned to service or sold based upon what we estimate will be the best economic alternative. If we designate a container as held for sale, depreciation on the container ceases, and the container is reported at the lower of (1) its recorded value or (2) the amount we expect to receive upon sale (less the estimated cost to sell the container). Containers held for sale are evaluated for impairment on a quarterly basis based on sale prices for similar types of equipment in the locations in which the containers are stored. Any write-down of containers held for sale is reflected in our statement of operations as an expense. If a large number of containers are designated as held for sale or prices for used containers drop, impairment charges for containers held for sale may increase which would result in decreased net income. Subsequent additions or reductions to the fair values of these written down assets are recorded as adjustments to the carrying value of the equipment held for sale. Any subsequent increase in fair value are recognized as reversal to container impairment but not in excess of the cumulative loss previously recognized.
We will continue to monitor the performance of our container fleet and evaluate the key factors driving market conditions and assess the assumptions used in our impairment testing analysis should market conditions warrant a reassessment.
Allowance for Doubtful Accounts
We only lease to container shipping lines and other lessees that meet our credit criteria. Our credit approval process is rigorous and our underwriting and credit decisions are controlled by our credit committee, which is made up of senior management from different disciplines. Our credit committee sets different maximum exposure limits depending on our relationship and previous experience with each shipping line customer and container sales customer. Credit criteria may include, but are not limited to, trade route, country, social and political climate, assessments of net worth, asset ownership, bank and trade credit references, credit bureau reports, operational history and financial strength.
Our credit department sets and reviews credit limits for new and existing shipping line customers and container sales customers, monitors compliance with those limits on an on-going basis, monitors collections, and deals with customers in default. Our credit department actively maintains a credit watch report on our proprietary information technology systems, which is available to all regional and area offices. This credit watch report lists shipping line customers and container sales customers at or near their credit limits. New leases of containers by shipping line customers on the credit watch report would only be allowed with the approval of our credit department. Similarly, management may decide to stop sales of containers to purchasers whose payments are delinquent. Our underwriting processes are aided by the long payment experience we have with most of our shipping line customers and container sales customers, our broad network of relationships in the container shipping industry that provide current information about shipping line customers’ and container sales customers’ market reputations and our focus on collections.
Other factors reducing losses due to default by a lessee or customer include the growth in the container shipping industry, effective collection tools, our historically high recovery rate for containers in default situations and the re-marketability of our container fleet. The growth in the container shipping industry helps reduce the risk of customer defaults since the core assets of a poorly performing shipping line, its ships and containers, have historically been needed to meet the demand for world containerized trade. In addition, the law in several major port locations is highly favorable to creditors and many of our large customers call on ports that will allow us to arrest, or seize, the customers’ ships or repossess our containers if the customer is in default under our container leases. Finally, we also purchase insurance for equipment recovery and loss of revenue due to customer defaults for most of our customers, in addition to the insurance that our customers are required to obtain, however our equipment recovery insurance is subject to high deductibles and has coverage limits and exclusions. In recent years our container recovery rate has declined as we have experienced several defaults where the containers are difficult to locate or when located are subject to liens for repairs and/or storage that make recovery uneconomical.
70
During 2013 through 2017, we recovered 84% of the containers that were the subject of defaulted contracts which had at least 1,000 CEU on lease. In connection with the Hanjin bankruptcy, approximately 93% of the containers leased to Hanjin have been turned in, and we believe the unrecovered containers and the recovery expenses will be recoverable under the insurance policies. We typically incur operating expenses such as repairs and repositioning when containers are recovered after a default. However, recovery expenses are typically covered by insurance and we are reimbursed above our deductible amount.
Our allowance for doubtful accounts is reviewed regularly by our management and is based on the risk profile of the receivables, credit quality indicators such as the level of past due amounts and economic conditions. Our credit committee meets regularly to assess performance of our container lessees and to recommend actions to be taken in order to reduce credit risks. Accounts are generally written off after an analysis is completed which indicates that collection of the full balance is remote. Changes in economic conditions or other events may necessitate additions or deductions to the allowance for doubtful accounts. The allowance is intended to provide for losses inherent in the owned fleet’s accounts receivable, and requires the application of estimates and judgments as to the outcome of collection efforts and the realization of collateral, among other things. If the financial condition of our container lessees were to deteriorate, reducing their ability to make payments, additional allowances may be required, which would decrease our net income or increase our net loss in the period of the adjustment.
Recent Accounting Pronouncements
For further discussion, see Note 1 “Nature of Business and Summary of Significant Accounting Policies” to our consolidated financial statements in Item 18, “Financial Statements” in this Annual Report on Form 20-F.
| B. | Liquidity and Capital Resources |
As of December 31, 2017, we had cash and cash equivalents of $137,894. Our principal sources of liquidity have been (1) cash flows from operations, (2) the sale of containers, (3) borrowings under conduit facilities (which allow for recurring borrowings and repayments) granted to TMCL II (the “TMCL II Secured Debt Facility”) and TMCL IV (the “TMCL IV Secured Debt Facility”), (4) borrowings under the revolving credit facilities extended to TL (the “TL Revolving Credit Facility” and the “TL Revolving Credit Facility II” ), TW (the “TW Credit Facility”), and TAP Funding (the “TAP Funding Revolving Credit Facility), (5) proceeds from TL’s term loan (the “TL Term Loan”) and (6) proceeds from the issuance of 2017-1 and 2017-2 Fixed Rate Asset Backed Notes (the “2017-1 Bonds” and “2017-2 Bonds”, respectively). As of December 31, 2017, we had the following outstanding borrowings and borrowing capacities per debt facility (in thousands):
| Facility: |
Current Borrowing |
Additional Borrowing Commitment |
Total Commitment |
Current Borrowing |
Available Borrowing, as Limited by our Borrowing Base |
Current and Available Borrowing |
||||||||||||||||||
| TMCL II Secured Debt Facility |
$ | 664,751 | $ | 535,249 | $ | 1,200,000 | $ | 664,751 | $ | 58,648 | $ | 723,399 | ||||||||||||
| TMCL IV Secured Debt Facility (1) |
133,000 | 167,000 | 300,000 | 133,000 | 26,127 | 159,127 | ||||||||||||||||||
| TL Revolving Credit Facility |
574,000 | 126,000 | 700,000 | 574,000 | 70,956 | 644,956 | ||||||||||||||||||
| TL Revolving Credit Facility II |
152,000 | 38,000 | 190,000 | 152,000 | 4,110 | 156,110 | ||||||||||||||||||
| TW Credit Facility |
97,148 | — | 97,148 | 97,148 | — | 97,148 | ||||||||||||||||||
| TAP Funding Revolving Credit Facility |
164,700 | 25,300 | 190,000 | 164,700 | — | 164,700 | ||||||||||||||||||
| TL Term Loan |
354,000 | — | 354,000 | 354,000 | — | 354,000 | ||||||||||||||||||
| 2017-1 Bonds |
394,275 | — | 394,275 | 394,275 | — | 394,275 | ||||||||||||||||||
| 2017-2 Bonds (2) |
480,542 | — | 480,542 | 480,542 | — | 480,542 | ||||||||||||||||||
|
|
|
|
|
|
|
|
|
|
|
|
|
|||||||||||||
| Total (3) |
$ | 3,014,416 | $ | 891,549 | $ | 3,905,965 | $ | 3,014,416 | $ | 159,841 | $ | 3,174,257 | ||||||||||||
|
|
|
|
|
|
|
|
|
|
|
|
|
|||||||||||||
| (1) | The TMCL IV Secured debt facility was terminated and unpaid debt amount was fully repaid by proceeds primarily from the TL Revolving Credit facility on January 31, 2018. |
| (2) | Future scheduled payments for 2017-2 Bonds exclude an unamortized discount of $75. |
| (3) | Current borrowing for all debts exclude prepaid debt issuance costs in an aggregate amount of $24,034. |
71
We have typically funded a significant portion of the purchase price of new containers through borrowings under our TMCL II Secured Debt Facility, TL Revolving Credit Facility, TL Revolving Credit Facility II, and TAP Funding Revolving Credit Facility and intend to continue to utilize these facilities in the future. In 2017, at such time as our secured debt facilities reached an appropriate size, the facilities were refinanced through the issuance of bonds to institutional investors. We anticipate similar refinancing at such times as the TMCL II Secured Debt Facility or any similar revolving debt facilities we establish nears their maximum size. This timing will depend on our level of future purchases of containers and the size of our debt facilities in the future.
Our cash inflows from operations are affected by the utilization rate of our fleet and the per diem rates of our leases, whereas the cash inflows from proceeds for the sale of containers are affected by market demand for used containers and our available inventory of containers for sale. Our cash outflows are affected by payments and expenses related to our purchasing of containers, interest on our debt obligations or other contingencies discussed in Note 14 “Commitments and Contingencies” to our consolidated financial statements in Item 18, “Financial Statements” in this Annual Report on Form 20-F, which may place demands on our short-term liquidity.
We are a holding company with no material direct operations. Our principal assets are the equity interests we directly or indirectly hold in our operating subsidiaries, which own our operating assets. As a result, we are dependent on loans, dividends and other payments from our subsidiaries to generate the funds necessary to meet our financial obligations and to pay dividends, if any, on our common shares. Our subsidiaries are legally distinct from us and may be prohibited or restricted from paying dividends or otherwise making funds available to us under certain conditions. If we are unable to obtain funds from our subsidiaries, we may be unable to, or our board may exercise its discretion not to, pay dividends on our common shares. Our board of directors takes a fresh view every quarter, taking into consideration our cash needs for opportunities that may be available to us, and sets our dividend, if any, accordingly. The TL Revolving Credit Facility, TL Revolving Credit Facility II and TL Term Loan also prohibit TL from paying dividends to TGH in excess of certain limits. A substantial amount of cash used by TGH to pay dividends to its common shareholders has historically been received from TL in the form of dividends.
Our consolidated financial statements do not reflect the income taxes that would be payable to foreign taxing jurisdictions if the earnings of a group of corporations operating in those jurisdictions were to be transferred out of such jurisdictions, because such earnings are intended to be permanently reinvested in those countries. At December 31, 2017, cumulative earnings of approximately $36,527 would be subject to income taxes of approximately $10,958 if such earnings of foreign corporations were transferred out of such jurisdictions in the form of dividends.
The disruption in the credit market in 2008 and 2009 had a significant adverse impact on a number of financial institutions and Hanjin’s bankruptcy in 2016 had a significant adverse impact on the liquidity of the container leasing industry. Assuming that our lenders remain solvent, we currently believe that cash flow from operations, proceeds from the sale of containers and borrowing availability under our debt facilities are sufficient to meet our liquidity needs for the next twelve months. We will continue to monitor our liquidity and the credit markets. However, we cannot predict with any certainty the impact on the Company of any further disruptions in the credit environment.
Description of Indebtedness
For further discussion, see Note 12 “Secured Debt Facilities, Credit Facilities, Term Loan and Bonds Payable, and Derivative Instruments” to our consolidated financial statements in Item 18, “Financial Statements” in this Annual Report on Form 20-F.
As of December 31, 2017, the total outstanding principal balance on our fixed rate debt facilities was $874.8 million with fixed interest rates between 3.73% and 3.91% as of December 31, 2017. Final Maturities on these fixed rate debt facilities are between May 2042 and June 2042.As of December 31, 2017, the total outstanding principal balance on our floating rate debt facilities was $2,139.6 million with interest rates between 3.38% and 4.00%, primarily LIBOR plus a margin, as of December 31, 2017. Final Maturities on these floating rate debt facilities are between April 2019 and September 2026.
We have entered into several interest rate cap, collar and swap agreements to reduce the impact of changes in interest rates associated with our floating rate debt obligations. Total notional amount of these interest rate hedging agreements amounted to $1,284.2 million as of December 31, 2017 (also see Item 11 “Quantitative and Qualitative Disclosures about Market Risk” for further information).
72
TMCL II Secured Debt Facility. TMCL II has a securitization facility with a total commitment of $1,200,000 (the “TMCL II Secured Debt Facility”). Our primary ongoing container financing requirements have been funded by commitments under the TMCL II Secured Debt Facility.
TMCL II is required to make principal payments on any payment date for the outstanding loan principal amount that exceeds the borrowing base on such payment date. The interest rate on the TMCL II Secured Debt Facility, payable monthly in arrears, is one-month London Inter Bank Offered Rate (“LIBOR”) plus 1.90% during the revolving period prior to the Conversion Date. There is a commitment fee on the unused amount of the total commitment.
Under the TMCL II Indenture, TGH, TMCL II and TGH’s wholly-owned subsidiary, Textainer Equipment Management Limited (“TEML”), must maintain certain financial covenants, including the following (i) TGH must maintain consolidated leverage ratio that is no greater than 3.5 to 1.00; (ii) TGH must maintain a consolidated fixed charge coverage ratio that is no less than 1.2 to 1.00; (iii) TEML may not incur more than $1,000 of consolidated funded debt; (iv) TEML must make at least $2,000 in after-tax profits annually; (v) Textainer Equipment Management (U.S.) Limited (“TEML US”), a wholly-owned subsidiary of TEML, may not incur more than $1,000 of consolidated funded debt and (vi) TEML US must make at least $200 in after-tax profits annually.
TMCL IV Secured Debt Facility. TMCL IV had a securitization facility with a total commitment of $300,000 (the “TMCL IV Secured Debt Facility”). TMCL IV’s ongoing container financing requirements had been funded by commitments under the TMCL IV Secured Debt Facility. TMCL IV was required to make principal payments on any payment date for the outstanding loan principal amount that exceeds the borrowing base on such payment date. The interest rate on the TMCL IV Secured Debt Facility, payable monthly in arrears, was one-month LIBOR plus 2.50% during the revolving period prior to the Conversion Date. There was a commitment fee on the unused amount of the total commitment.
Under the TMCL IV Indenture, TGH, TMCL IV, TEML and TEMUS must maintain certain financial covenants, including the following (i) TMCL IV must maintain at least a 1.20 to 1.00 debt service coverage ratio; (ii) TMCL IV and TGH must maintain at least a 0.90:1.00 container disposition ratio; (iii) TEML may not incur more than $1,000 of consolidated funded debt; (iv) TEML must make at least $2,000 in after-tax profits annually; (v) TEML US may not incur more than $1,000 of consolidated funded debt (vi); TEML US must make at least $200 in after-tax profits annually; and (vii) TGH must maintain a ratio of consolidated funded debt to consolidated tangible net worth that is no greater than 4.00 to 1.00.
TL Revolving Credit Facility. TL has a credit agreement with Wells Fargo Bank and other lenders to provide it with a revolving credit facility (the “TL Credit Agreement”) with a total commitment amount of up to $700,000 (which includes a $50,000 letter of credit facility, together, the “TL Revolving Credit Facility”). The TL Revolving Credit Facility provides for payments of interest only during its term, beginning on its inception date through the Maturity Date. TL is required to make principal payments on any payment date for the outstanding loan principal amount that exceeds the borrowing base on such payment date. The interest rate on the TL Revolving Credit Facility, payable monthly in arrears, is based either on the base rate for Base rate loans plus a spread of between 1.50% and 2.00% or LIBOR for Eurodollar rate loans plus a spread between 2.0% and 2.50% during the revolving period prior to the Maturity Date. There is a commitment fee on the unused amount of the total commitment. The spread and the commitment fee vary based on the leverage of TGH.
The TL Revolving Credit Facility contains restrictive covenants, including limitations on certain liens, indebtedness and investments. In addition, the TL Credit Facility contains certain restrictive financial covenants on TL and TGH. The TL Revolving Credit Facility’s covenants require (1) TL to maintain a minimum liquidity of $30,000; (2) TGH and TL each to maintain a consolidated leverage ratio of 3.50 to 1.00 or less; (3) TGH to maintain a minimum consolidated fixed charge coverage ratio of 1.20 to 1.00; and (4) TL to maintain a minimum consolidated interest coverage ratio of 2.50 to 1.00.
73
TL Revolving Credit Facility II. TL has a credit agreement with ABN AMRO Capital USA LLC and other lenders to provide it with a revolving credit facility (the “TL Credit Agreement II”) with a total commitment amount of up to $190,000 (the “TL Revolving Credit Facility II”). The TL Revolving Credit Facility II provides for payments of interest only during its term, beginning on its inception date through the Maturity Date. TL is required to make principal payments on any payment date for the outstanding loan principal amount that exceeds the borrowing base on such payment date. The interest rate on the TL Revolving Credit Facility II, payable monthly in arrears, is based either on the base rate for Base rate loans plus a spread of between 1.50% and 2.00% or LIBOR for Eurodollar rate loans plus a spread between 2.0% and 2.50% during the revolving period prior to the Maturity Date. There is a commitment fee on the unused amount of the total commitment. The spread and the commitment fee vary based on the leverage of TGH.
The TL Revolving Credit Facility II contains restrictive covenants, including limitations on certain liens, indebtedness and investments. In addition, the TL Credit Facility II contains certain restrictive financial covenants on TL and TGH. The TL Revolving Credit Facility II’s covenants require (1) TL to maintain a minimum liquidity of $30,000; (2) TGH and TL each to maintain a consolidated leverage ratio of 3.50 to 1.00 or less; (3) TGH to maintain a minimum consolidated fixed charge coverage ratio of 1.20 to 1.00; and (4) TL to maintain a minimum consolidated interest coverage ratio of 2.50 to 1.00.
TW Credit Facility. Our 25% owned joint venture, TW, has a credit agreement (“TW Credit Agreement”) with Wells Fargo Bank, N.A. (“WFB”), a wholly-owned subsidiary of Wells Fargo & Company, with a total commitment amount of up to $144,889 (the “TW Credit Facility”). The monthly principal payment amount equals to available funds from net revenue collection after payments for manager and administration agent fee, interest, interest rate hedging payment and an amount required to maintain a cash reserve account balance of three-month interest. The aggregate unpaid loan principal balance is due on the Maturity Date. The TW Credit Facility contains restrictive covenants, including limitations on TW’s finance lease default ratio, debt service coverage ratio, certain liens, indebtedness and investments. In addition, the TW Credit Facility contains certain restrictive financial covenants on TGH’s leverage, fixed charge coverage, TEML’s net income and debt levels, and TW’s overall Asset Base minimums.
TAP Funding Revolving Credit Facility. Our 50.1% owned joint venture, TAP Funding, has a credit agreement (the “TAP Funding Credit Agreement”) with a group of banks that provides for a revolving credit facility with an aggregate commitment amount of up to $190,000 (the “TAP Funding Revolving Credit Facility”). The interest rate on the TAP Funding Revolving Credit Facility, payable monthly in arrears, is one-month LIBOR plus 1.95% through its Maturity Date. There is a commitment fee on the unused amount of the total commitment. TAP Funding is required to make principal payments on a monthly basis to the extent that the outstanding amount due exceeded TAP Funding’s borrowing base.
The TAP Funding Revolving Credit Facility also contains restrictive covenants, including limitations on TEML’s net income and debt levels, TAP Funding’s certain liens, indebtedness, investments, overall Asset Base minimums, certain earnings ratio, tangible net worth and the average age of TAP Funding’s container fleet.
TL Term Loan. TL has a five-year term loan (the “TL Term Loan”) with a group of financial institutions that represents a partially-amortizing term loan with the remaining principal due in full on April 30, 2019. The TL Term Loan was entered into on April 30, 2014 and proceeds from the TL Term Loan, our secured debt facilities and available cash were used to repay all of the outstanding principal balance of TMCL’s bonds. TMCL then transferred all of its containers, net, net investment in direct financing and sales-type leases and remaining net assets, to TL, TMCL II and TMCL IV.
The interest rate on the TL Term Loan is based either on the base rate for Base rate loans plus a spread of between 1.50% and 2.00% or LIBOR for Eurodollar rate loans plus a spread between 2.0% and 2.50%, which is based upon TGH’s leverage. Under the terms of the TL Term Loan, scheduled principal repayments are payable in twenty quarterly installments, consisting of nineteen quarterly installments, commencing on September 30, 2014, each in an amount equal to 1.58% of the initial principal balance and one final installment payable on the maturity date. TL is required to make additional principal payments on any payment date for the outstanding loan principal amount that exceeds the borrowing base on such payment date.
74
The TL Term Loan contains restrictive covenants, including limitations on certain liens, indebtedness and investments. In addition, the TL Term Loan contains certain restrictive financial covenants on TL and TGH. The TL Term Loan’s covenants require (1) TGH and TL each to maintain a consolidated leverage ratio of 3.50 to 1.00 or less; (2) TGH to maintain a minimum consolidated fixed charge coverage ratio of 1.20 to 1.00; and (3) TL to maintain a minimum consolidated interest coverage ratio of 2.50 to 1.00.
2017-1 Bonds & 2017-2 Bonds TMCL V issued the Series 2017-1 Fixed Rate Asset Backed Notes (the “2017-1 Bonds”), $350,000 aggregate Class A principal amount and $70,000 aggregate Class B principal amount of 2017-1 Bonds, to qualified institutional investors pursuant to Rule 144A under the Securities Act and to non-U.S. persons in accordance with Regulation S promulgated under the Securities Act.
The $420,000 in 2017-1 Bonds represent fully amortizing notes payable over a scheduled payment term of 9 years, but not to exceed a maximum payment term of 25 years. The target final payment date and legal final payment date are May 20, 2026 and May 20, 2042, respectively. Proceeds from the 2017-1 Bonds was used to acquire containers from TMCL III and for general corporate purposes. TMCL V issued the Series 2017-2 Fixed Rate Asset Backed Notes (the “2017-2 Bonds”), $416,000 aggregate Class A principal amount and $84,000 aggregate Class B principal amount of 2017-2 Bonds, to qualified institutional investors pursuant to Rule 144A under the Securities Act and to non-U.S. persons in accordance with Regulation S promulgated under the Securities Act.
The $500,000 in 2017-2 Bonds represent fully amortizing notes payable over a scheduled payment term of 9 years, but not to exceed a maximum payment term of 25 years. The target final payment date and legal final payment date are June 20, 2026 and June 20, 2042, respectively. Proceeds from the 2017-2 Bonds were used to acquire containers from TL and TMCL II and for general corporate purposes. Under the TMCL V Indenture, Series 2017-1 Supplement and Series 2017-2 Supplement, TGH, TMCL V, TEML and TEML US must maintain certain financial covenants, including the following (i) TMCL V must maintain at least a 1.10 to 1.00 of the debt service coverage ratio; (ii) TEML may not incur more than $1,000 of consolidated funded debt; (iii) TEML must make at least $2,000 in after-tax profits annually; (iv) TEML US may not incur more than $1,000 of consolidated funded debt; (v) TEML US must make at least $200 in after-tax profits annually; and (vi) TGH must maintain a ratio of consolidated funded debt to consolidated tangible net worth that is no greater than 4.00 to 1.00.
Debt Covenants. All of our debt facilities are secured by specific pools of containers and related assets owned by the Company. TGH also acts as an unconditional guarantor of the TL Revolving Credit Facility, TL Revolving Credit Facility II and TL Term Loan. In addition to customary events of default as defined in our credit agreements and indenture and various restrictive financial covenants fore-mentioned, the Company’s debt facilities also contain other various debt covenants and borrowing base minimums. The TL Revolving Credit Facility, TL Revolving Credit Facility II and TL Term Loan also contain cross default provisions that may result in an acceleration of principal repayment under these debt facilities if an uncured default condition were to exist. We were in full compliance with these requirements at December 31, 2017.
On January 31, 2018, the TMCL IV Secured Debt Facility was terminated and the unpaid debt amount was fully repaid primarily by proceeds from the TL Revolving Credit Facility. On February 15, 2018, the Company completed a seven-year fixed rate term loan of $300 million and the proceeds of the loan were used to pay down certain short-term debt. (see Note 12 “Secured Debt Facilities, Credit Facilities, Term Loan and Bonds payable, and Derivative Instruments” and Note 17 “Subsequent Event” to our consolidated financial statements in Item 18, “Financial Statements” in this Annual Report on Form 20-F).
75
Cash Flow
The following table summarizes historical cash flow information for the years ended December 31, 2017, 2016 and 2015:
| December 31, | % Change Between | |||||||||||||||||||
| 2017 | 2016 (1) | 2015 | 2017 and 2016 | 2016 and 2015 | ||||||||||||||||
| (Dollars in thousands) | ||||||||||||||||||||
| Net income (loss) |
$ | 20,742 | $ | (57,876 | ) | $ | 113,984 | (135.8 | %) | (150.8 | %) | |||||||||
| Adjustments to reconcile net income (loss) to net cash provided by operating activities |
230,233 | 335,770 | 257,974 | (31.4 | %) | 30.2 | % | |||||||||||||
|
|
|
|
|
|
|
|
|
|
|
|||||||||||
| Net cash provided by operating activities |
250,975 | 277,894 | 371,958 | (9.7 | %) | (25.3 | %) | |||||||||||||
| Net cash used in investing activities |
(85,364 | ) | (280,430 | ) | (305,627 | ) | (69.6 | %) | (8.2 | %) | ||||||||||
| Net cash used in financing activities |
(70,372 | ) | (4,619 | ) | (83,957 | ) | 1423.5 | % | (94.5 | %) | ||||||||||
| Effect of exchange rate changes |
207 | (233 | ) | (240 | ) | (188.8 | %) | (2.9 | %) | |||||||||||
|
|
|
|
|
|
|
|
|
|
|
|||||||||||
| Net (decrease) increase in cash, cash equivalents and restricted cash |
95,446 | (7,388 | ) | (17,866 | ) | (1391.9 | %) | (58.6 | %) | |||||||||||
| Cash, cash equivalents and restricted cash at beginning of year |
142,123 | 149,511 | 167,377 | (4.9 | %) | (10.7 | %) | |||||||||||||
|
|
|
|
|
|
|
|
|
|
|
|||||||||||
| Cash, cash equivalents and restricted cash at end of year |
$ | 237,569 | $ | 142,123 | $ | 149,511 | 67.2 | % | (4.9 | %) | ||||||||||
|
|
|
|
|
|
|
|
|
|
|
|||||||||||
| (1) | Certain previously reported information has been revised for the effect of immaterial corrections of identified errors pertaining to the calculation of gain on sale of containers, net (see Note 2 “Immaterial Correction of Errors in Prior Periods” to our consolidated financial statements in Item 18, “Financial Statements” in this Annual Report on Form 20-F) and for the adoption of Accounting Standards Update No. 2016-15, Statement of Cash Flows (Topic 230): Classification of Certain Cash Receipts and Cash Payments and Accounting Standards Update No. 2016-18, Statement of Cash Flows (Topic 230): Restricted Cash. |
Operating Activities
Net cash provided by operating activities decreased $26,919 (-9.7%) from 2016 to 2017. The following table summarizes the variances included within this decrease:
| Increase in gain on sale of containers, net in 2017 |
$ | (19,449 | )(1) | |
| Decrease in due to owners, net in 2017 compared to an increase in 2016 |
(13,327 | )(2) | ||
| Increase in trading containers in 2017 compared to a decrease in 2016 |
(6,857 | )(3) | ||
| Decrease in accounts payable and accrued expenses in 2017 compared to an increase in 2016 |
(6,125 | )(4) | ||
| Increase in net income adjusted for noncash items |
14,787 | (5) | ||
| Larger increase in accounts receivable in 2016 compared to 2017 |
5,263 | (6) | ||
| Other, net |
(1,211 | ) | ||
|
|
|
|||
| $ | (26,919 | ) | ||
|
|
|
| (1) | The increase in gain on sale of containers, net was due to an increase in average sales proceeds of $189 per unit and a $988 increase in net gain on sales-type leases, partially offset by a 21.2% decrease in the number of containers sold. |
| (2) | The decrease in due to owners, net in 2017 compared to an increase in 2016 was due to the timing of when payments were made. |
| (3) | The increase in trading containers in 2017 compared to a decrease in 2016 was due to a higher number of trading containers that were held for sale. |
| (4) | The decrease in accounts payable and accrued expenses in 2017 compared to an increase in 2016 was due to the timing of when payments were made. |
76
| (5) | The increase in net income adjusted for noncash items such as depreciation expense, container impairment, bad debts expense, amortization of debt issuance costs and other noncash items was primarily due to a 1.2 percentage point increase in utilization for our owned fleet due to improved conditions in the container leasing industry, a 4.8% increase in our owned fleet and 6% increase in the size of the managed fleet, partially offset by a 9.1% decrease in average per diem rental rates. |
| (6) | The larger increase in accounts receivable, net in 2016 compared to 2017 was due to lower revenue in 2017 and the timing of when collections on accounts receivable were received. |
Net cash provided by operating activities decreased $94,064 (-25.3%) from 2015 to 2016. The following table summarizes the variances included within this decrease:
| Decrease in net income adjusted for noncash items |
$ | (67,847 | )(1) | |
| Larger increase in accounts receivable in 2016 compared to 2015 |
(9,565 | )(2) | ||
| Increase in gain on sale of containers, net |
(6,099 | )(3) | ||
| Larger increase in due to owners, net in 2016 compared to 2015 |
(5,523 | )(4) | ||
| Increase in accounts payable and accrued expenses in 2016 compared to a decrease in 2015 |
(4,771 | )(5) | ||
| Smaller decrease in trading containers in 2016 compared to 2015 |
(1,374 | )(6) | ||
| Other, net |
1,115 | |||
|
|
|
|||
| $ | (94,064 | ) | ||
|
|
|
| (1) | The decrease in net income adjusted for noncash items such as depreciation expense, container impairment, and other noncash items was primarily due to a 12.9% decrease in average per diem rental rates and a 2.2 percentage point decrease in utilization for our owned fleet, partially offset by a 4.1% increase in our owned fleet size due to the purchase of new and used containers. |
| (2) | The larger increase in accounts receivable, net in 2016 compared to 2015 was due to a larger fleet size in 2016 and the timing of when collections on accounts receivable were received. |
| (3) | The increase in gain on sale of containers, net was due to an increase in average sales proceeds of $39 per unit and an 23.5% increase in the number of containers sold, partially offset by a decrease in average net gains on sales-type leases. |
| (4) | The larger increase in due to owners, net in 2016 compared to 2015 was due to the timing of when payments were made. |
| (5) | The increase in accounts payable and accrued expenses in 2016 compared to a decrease in 2015 was due to the timing of when payments were made. |
| (6) | The smaller decrease in trading containers in 2016 compared to 2015 was due to a change in the number of trading containers that were held for sale. |
Investing Activities
Net cash used in investing activities decreased $195,066 (-69.6%) from 2016 to 2017 due to a lower amount of cash paid for container and fixed asset purchases, higher insurance proceeds received from unrecoverable containers and higher proceeds from the sale of containers and fixed assets, partially offset by lower receipts of payments on direct financing and sales-type leases, net of income earned.
Net cash used in investing activities decreased $25,197 (-8.2%) from 2015 to 2016 due to a lower amount of cash paid for container purchases and insurance proceeds received from unrecoverable containers, partially offset by lower proceeds from the sale of containers and fixed assets and lower receipts of payments on direct financing and sales-type leases, net of income earned.
77
Financing Activities
Net cash used in financing activities increased $65,753 (1,423.5%) from 2016 to 2017. The following table summarizes the variances included within this increase:
| Increase in net payments on debt |
$ | (72,049 | ) | |
| Increase in debt issuance costs paid |
(21,733 | ) | ||
| Dividends paid to noncontrolling interests in 2017 |
(2,496 | ) | ||
| Dividends paid to Textainer Group Holdings Limited shareholders in 2016 |
28,754 | |||
| Proceeds received from the issuance of common shares upon the exercise of share options in 2017 |
961 | |||
| Net tax benefit from share-based compensation awards in 2016 |
810 | |||
|
|
|
|||
| $ | (65,753 | ) | ||
|
|
|
Net cash used in financing activities decreased $79,338 (-94.5%) from 2015 to 2016. The following table summarizes the variances included within this decrease:
| Decrease in dividends paid to Textainer Group Holdings Limited shareholders |
$ | 65,325 | ||
| Purchases of treasury shares in 2015 |
9,149 | |||
| Increase in net proceeds on debt |
3,614 | |||
| Dividends paid to noncontrolling interests in 2015 |
2,994 | |||
| Decrease in net tax benefit from share-based compensation awards |
523 | |||
| Capital contributions from noncontrolling interests in 2015 |
(1,850 | ) | ||
| Proceeds received from the issuance of common shares upon the exercise of share options in 2015 |
(301 | ) | ||
| Increase in debt issuance costs paid |
(116 | ) | ||
|
|
|
|||
| $ | 79,338 | |||
|
|
|
| C. | Research and Development, Patents and Licenses, etc. |
We do not carry out research and development activities and our business and profitability are not materially dependent upon any patents or licenses. We have registered “TEXTAINER,” “TEX” and “tex” (logo) in the U.S. Patent and Trademark Office and in the patent and trademark agencies of thirteen countries as trademarks.
| D. | Trend Information |
Please see Item 5, “Operating and Financial Review and Prospects – Tabular Disclosure of Contractual Obligations” for a description of identifiable trends, demands, commitments, events or uncertainties that will result in, or that are reasonably likely to result in, our liquidity either increasing or decreasing at present or in the foreseeable future. We will require sufficient capital in the future to meet our payments and other obligations under our contractual obligations and commercial commitments. The need to make such payments is a “Trend” as it is unlikely that all such obligations will be eliminated from our future business activities. We intend to utilize cash on hand in order to meet our obligations under our contractual obligations and commercial commitments. It is likely that we will generate sufficient operating cash flow to meet these ongoing obligations in the foreseeable future. From time to time, we may issue additional debt in order to raise capital for future requirements.
| E. | Off-Balance Sheet Arrangements |
At December 31, 2017, we had no off-balance sheet arrangements that have or are reasonably likely to have a current or future effect on our financial condition, change in financial condition, revenues or expenses, results of operations, liquidity, capital expenditures or capital resources that is material to investors.
78
| F. | Tabular Disclosure of Contractual Obligations |
The following table sets forth our contractual obligations and commercial commitments by due date as of December 31, 2017:
| Payments Due by Twelve Month Period Ending December 31 | ||||||||||||||||||||||||||||
| Total | 2018 | 2019 | 2020 | 2021 | 2022 | 2023 and thereafter |
||||||||||||||||||||||
| (Dollars in thousands) | ||||||||||||||||||||||||||||
| (Unaudited) | ||||||||||||||||||||||||||||
| Total debt obligations: |
||||||||||||||||||||||||||||
| TMCL II Secured Debt Facility (1) |
$ | 664,751 | — | — | $ | 22,136 | $ | 66,475 | $ | 66,475 | $ | 509,665 | ||||||||||||||||
| TMCL IV Secured Debt Facility (1) (2) |
133,000 | 48,000 | 48,000 | 37,000 | — | — | — | |||||||||||||||||||||
| TL Revolving Credit Facility |
574,000 | — | — | 574,000 | — | — | — | |||||||||||||||||||||
| TL Revolving Credit Facility II |
152,000 | 36,000 | 36,000 | 80,000 | — | — | ||||||||||||||||||||||
| TW Credit Facility |
97,148 | 26,793 | 21,854 | 25,654 | 17,009 | 5,279 | 559 | |||||||||||||||||||||
| TAP Funding Revolving Credit Facility |
164,700 | 9,600 | 9,600 | 9,600 | 135,900 | — | — | |||||||||||||||||||||
| TL Term Loan |
354,000 | 39,600 | 314,400 | — | — | — | — | |||||||||||||||||||||
| 2017-1 Bonds |
394,275 | 37,065 | 38,331 | 39,357 | 52,173 | 63,220 | 164,129 | |||||||||||||||||||||
| 2017-2 Bonds (3) |
480,542 | 40,627 | 40,968 | 43,958 | 55,259 | 67,021 | 232,709 | |||||||||||||||||||||
| Interest on obligations (4) |
422,603 | 107,253 | 90,583 | 70,813 | 55,024 | 42,548 | 56,382 | |||||||||||||||||||||
| Interest rate swaps and collar (receivables) payables, net (5) |
(3,698 | ) | (2,801 | ) | (921 | ) | (56 | ) | 50 | 30 | ||||||||||||||||||
| Office lease obligations |
19,638 | 2,104 | 2,156 | 2,113 | 2,053 | 1,936 | 9,276 | |||||||||||||||||||||
| Container contracts payable |
131,087 | 131,087 | ||||||||||||||||||||||||||
|
|
|
|
|
|
|
|
|
|
|
|
|
|
|
|||||||||||||||
| Total contractual obligations (6) |
$ | 3,584,046 | $ | 475,328 | $ | 600,971 | $ | 904,575 | $ | 383,943 | $ | 246,509 | $ | 972,720 | ||||||||||||||
|
|
|
|
|
|
|
|
|
|
|
|
|
|
|
|||||||||||||||
| (1) | The estimated future repayments for TMCL II and TMCL IV Secured Debt Facilities are based on the assumptions that both facilities will not be extended on their associated conversion dates. |
| (2) | On January 31, 2018, the TMCL IV Secured Debt Facility was terminated and the unpaid debt amount was fully repaid by proceeds primarily from the TL Revolving Credit Facility. |
| (3) | Future scheduled payments for the 2017-2 Bonds exclude an unamortized discount of $75. |
| (4) | Using 1.56% which was one month spot interest rate of London InterBank Offered Rate (“LIBOR”) plus a margin rate that varies based on each debt facility. Weighted average interest rate at 3.63%. |
| (5) | Calculated based on the difference between our fixed contractual rates and the counterparties’ estimated average rate at 1.56% which was one month spot LIBOR rate as of December 31, 2017, for all periods, for all interest rate contracts outstanding as of December 31, 2017. |
| (6) | Future scheduled payments for all debts exclude prepaid issuance costs in an aggregate amount of $24,034. |
| G. | Safe Harbor |
This Annual Report on Form 20-F contains forward-looking statements. See “Information Regarding Forward-Looking Statements; Cautionary Language.”
79
| ITEM 6. | DIRECTORS, SENIOR MANAGEMENT AND EMPLOYEES |
| A. | Directors and Senior Management |
The following table sets forth information regarding our executive officers and directors as of March 6, 2018. Our board of directors is elected annually on a staggered basis and each director holds office for three years or until his successor has been duly elected, except in the event of his death, resignation, removal or earlier termination of his office. Our bye-laws provide for, among other things, the election of our board of directors on a staggered basis. The business address of each of our executive officers and non-management directors is Century House, 16 Par-La-Ville Road, Hamilton HM 08, Bermuda.
David M. Nurek, Robert D. Pedersen and Iain Brown are designated Class III directors, to hold office until our 2020 annual general meeting of shareholders, Philip K. Brewer, Hennie Van der Merwe and James E. McQueen are designated Class II directors, to hold office until our 2018 annual general meeting of shareholders and John A. Maccarone, Dudley R. Cottingham, and Hyman Shwiel are designated Class I directors, to hold office until our 2019 annual general meeting of shareholders. Directors may be re-elected when their term of office expires.
As of March 6, 2018, Trencor, through Halco Holdings Inc. (“Halco”), held a beneficiary interest in approximately 47.8% of our outstanding share capital. See Item 4, “Information on the Company— Organizational Structure” for an explanation of the relationship between us and Trencor. As indicated below, three of our directors are also directors of Trencor.
|
Executive Officers and Directors |
Age | Position | ||
| Hyman Shwiel(1)(2)(3) |
73 | Chairman | ||
| Philip K. Brewer |
60 | Director, President and Chief Executive Officer | ||
| Iain Brown |
54 | Director | ||
| Dudley R. Cottingham(1)(2)(3) |
66 | Director | ||
| John A. Maccarone(2)(3) |
73 | Director | ||
| James E. McQueen(1)(4) |
73 | Director | ||
| David M. Nurek(2)(3)(5) |
68 | Director | ||
| Hennie Van der Merwe(7) |
70 | Director | ||
| Robert D. Pedersen (6) |
58 | Director | ||
| Olivier Ghesquiere |
51 | Executive Vice President - Leasing | ||
| Hilliard C. Terry, III |
48 | Executive Vice President and Chief Financial Officer |
| (1) | Member of the audit committee. Messrs. Cottingham and Shwiel are voting members and Mr. McQueen is a non-voting member. |
| (2) | Member of the compensation committee. |
| (3) | Member of the nominating and corporate governance committee. |
| (4) | Director of Trencor, the indirect beneficiary of 47.8% of our share interest. |
| (5) | Chairman of Trencor, the indirect beneficiary of 47.8% of our share interest. |
| (6) | Robert D. Pedersen retired from his position as the President and Chief Executive of TEML effective March 31, 2017. |
| (7) | Chief Executive Officer and Director of Trencor, the indirect beneficiary of 47.8% of our share interest. |
Certain biographical information about each of these individuals is set forth below.
Directors
Hyman Shwiel has been a member of our board of directors since September 2007. Mr. Shwiel was a partner with Ernst & Young LLP for 25 years. He served during that period in various roles, including Area Managing Partner and as National Director of Enterprise and Professional Risk. Upon his retirement in 2005, he became a consultant to Ernst & Young until 2007. Mr. Shwiel holds a C.T.A. and a M.B.A. from the University of Cape Town and is a Chartered Accountant (South Africa) and a CPA.
80
Philip K. Brewer was appointed President and Chief Executive Officer and to our board of directors in October 2011. Mr. Brewer served as our Executive Vice President from 2006 to October 2011, responsible for managing our capital structure and identifying new sources of finance for our company, as well as overseeing the management and coordinating the activities of our risk management and resale divisions. Mr. Brewer was Senior Vice President of our asset management group from 1999 to 2005 and Senior Vice President of our capital markets group from 1996 to 1998. Prior to joining our company in 1996, Mr. Brewer worked at Bankers Trust starting in 1990 as a Vice President and ending as a Managing Director and President of its Indonesian subsidiary. From 1989 to 1990, he was Vice President in Corporate Finance at Jardine Fleming. From 1987 to 1989, he was Capital Markets Advisor to the United States Agency for International Development in Indonesia. From 1984 to 1987, he was an associate with Drexel Burnham Lambert, an investment banking firm, in New York. Mr. Brewer holds a B.A. in Economics and Political Science from Colgate University and an M.B.A. in Finance from Columbia University.
Iain Brown has been a member of our board of directors since May 2016. Mr. Brown is a member of the board of directors of Halco. Mr. Brown is a director of Container Investment Services Limited and has been providing administrative services and strategic advice to owners and investors in the container leasing industry for over twenty years. He holds a Bachelor of Science in Engineering degree from the University of Cape Town, a MS in Engineering from University of Texas and an MBA in Finance from The Wharton School of the University of Pennsylvania.
Dudley R. Cottingham has been a member of our board of directors since December 1993 and served as assistant Secretary and/or secretary between December 1993 and October 2007. He has also served in the past as president of certain of our subsidiaries and continues to serve as a director of our Bermuda subsidiaries. Mr. Cottingham has over 35 years of experience in public accounting for a variety of international and local clients. He is a director and the audit committee chairman of Bermuda Press (Holdings) Ltd., a newspaper publishing and commercial printing company listed on the Bermuda Stock Exchange and is chairman of the listing committee of the Bermuda Stock Exchange. He is chairman and an Investment and Operational Committee member of the Aurum Funds which are listed on the Bermuda and Irish Stock Exchanges. He is a managing director of and was formerly a partner of Arthur Morris & Company Limited, a provider of audit and accounting services for international clients, since 1982, and has served as vice president and director of Continental Management Ltd., a Bermuda company providing corporate representation, administration and management services, since 1982 and Continental Trust Corporation Ltd., a Bermuda company that provides corporate and individual trust administration services, since 1994. He is a director of Morris, Cottingham & Co. Ltd. and their other group companies in Turks & Caicos Islands. Mr. Cottingham is a Chartered Accountant.
John A. Maccarone served as our President and Chief Executive Officer from January 1999 until October 2011 when he retired from Textainer and as a member of our board of directors since December 1993. Mr. Maccarone co-founded Intermodal Equipment Associates, a marine container leasing company based in San Francisco, and held a variety of executive positions with the company from 1979 until 1987, when he joined the Textainer Group as President and Chief Executive Officer of Textainer Equipment Management Limited, now a subsidiary of our company. From 1977 through 1978, Mr. Maccarone was Director of Marketing based in Hong Kong for Trans Ocean Leasing Corporation, a San Francisco-based company. From 1969 to 1976, Mr. Maccarone was a marketing representative for IBM Corporation in Chicago, Illinois. From 1966 to 1968, he served as a Lieutenant in the U.S. Army Corps of Engineers in Thailand and Virginia. Mr. Maccarone holds a B.S. in Engineering Management from Boston University and an M.B.A. from Loyola University of Chicago.
James E. McQueen has been a member of our board of directors since March 2003. Mr. McQueen joined Trencor in June 1976 and has served as financial director of Trencor since April 1984. Mr. McQueen is also a director of one of Trencor’s subsidiaries. Mr. McQueen was a member of the board of directors of Halco until August 2017. Prior to joining Trencor, Mr. McQueen was an accountant in public practice. Mr. McQueen received a Bachelor of Commerce degree and a Certificate in the Theory of Accounting from the University of Cape Town and is a Chartered Accountant (South Africa).
David M. Nurek has been a member of our board of directors since September 2007. Mr. Nurek was appointed as an alternate director of Trencor in November 1992 and as a non-executive member of its board of directors in July 1995 and is chairman of Trencor’s remuneration and nomination and social and ethics committees and a member of its audit committee. Mr. Nurek is an executive of Investec Bank Limited, a subsidiary of Investec Limited, which is listed on the JSE. Investec Limited has entered into a dual listed company structure with Investec
81
plc, which is quoted on the London Stock Exchange (collectively, the “Investec Group”). He is the regional chairman of Investec Limited’s various businesses in the Western Cape, South Africa, and is also the Investec Group’s worldwide head of legal risk. Prior to joining Investec Limited in June 2000, Mr. Nurek served as chairman of the South African legal firm Sonnenberg Hoffmann & Galombik, which has since changed its name to Edward Nathan Sonnenbergs Inc. Mr. Nurek serves as a non-executive on the boards of directors of various listed and unlisted companies in South Africa and holds a Diploma in Law and a Graduate Diploma in Company Law from the University of Cape Town, and completed a Program of Instruction for Lawyers at Harvard Law School and a Leadership in Professional Services Firms program at Harvard Business School.
Hennie Van der Merwe has been a member of our board of directors since August 2017 and between March 2003 to 2011. Mr. Van der Merwe joined Trencor in 1997 and began serving as a director of Trencor in 1998. He was appointed the Chief Executive Officer of Trencor in August 2017. Mr. Van der Merwe also serves as non-executive chairman of the board of Master Drilling Group Limited and as a non-executive director of Bell Equipment Limited, both of which are listed on the JSE. From 1984 to 1991, he held various senior executive positions in the banking sector in South Africa, lastly as chief executive officer of Senbank, the corporate/merchant banking arm of Bankorp Group Ltd. From 1991 to 1998, Mr. Van der Merwe served as deputy chairman for Waco International Ltd., an international industrial group listed on the JSE with subsidiaries listed on the Sydney and London Stock Exchanges. Prior to entering the business world, Mr. Van der Merwe practiced as an attorney at law in Johannesburg, South Africa. Mr. Van der Merwe holds Bachelor of Arts and L.L.B degrees in Law from the University of Stellenbosch in South Africa, and a Master of Law in Tax Law from the University of the Witwatersrand in South Africa. In August 2017, Mr. Van der Merwe was appointed as a director of Halco, and as a director of both Leased Asset Pool Limited and TAC Limited, entities that each own intermodal containers managed by the Company.
Robert D. Pedersen has been a member of our board of directors since April 2017. Mr. Pedersen was appointed President and Chief Executive Officer of Textainer Equipment Management Limited, our management company, in October 2011 and retired on March 31, 2017. Mr. Pedersen served as our Executive Vice President responsible for worldwide sales and marketing related activities and operations since January 2006. Mr. Pedersen was Senior Vice President of our leasing group from 1999 to 2005. From 1991 to 1999, Mr. Pedersen held several positions within our company, and from 1978 through 1991, he worked in various capacities for Klinge Cool, a manufacturer of refrigerated container cooling units, XTRA, a container lessor, and Maersk Line, a container shipping line. Mr. Pedersen is a graduate of the A.P. Moller Shipping and Transportation Program and the Merkonom Business School in Copenhagen, where he majored in Company Organization.
Executive Officers
For certain biographical information about Philip K. Brewer, see “Directors” above.
Olivier Ghesquiere was appointed Executive Vice President – Leasing in January 2017 and is responsible for worldwide sales and marketing related activities and operations. Mr. Ghesquiere served as our Senior Vice President – Marketing and Sales since December 2015. Mr. Ghesquiere worked at Groupe Ermewa S.A. as Chief Operating Officer and then Chief Executive Officer from January 2009 through February 2015 where he was responsible for growing the railcar and locomotive fleet to become the second largest in Europe. During that time Mr. Ghesquiere was also chairman of Eurotainer SA for which he was the Managing Director from April 2004 through December 2008 where he developed their tank container business focusing on higher value segments of the market. Mr. Ghesquiere has served as Vice Chairman and chairman of the International Tank Container Organization (ITCO) leasing committee from 2006 through 2010. Mr. Ghesquiere holds a Masters in Applied Economics from the Louvain School of Management, Belgium.
Hilliard C. Terry, III was appointed Executive Vice President and Chief Financial Officer in January 2012. Prior to joining the company, Mr. Terry served as Vice President and Treasurer at Agilent Technologies, Inc., where he worked prior to the company’s initial public offering in 1999 and subsequent spin-off from Hewlett-Packard Company (HP). He previously served as the head of Investor Relations until he was appointed Vice President and Treasurer in 2006. Before joining Agilent Technologies, Mr. Terry worked in marketing and investor relations for HP’s VeriFone subsidiary and joined VeriFone, Inc. in 1995 prior to the company’s acquisition by HP in 1997. He also held positions in investor relations with Kenetech Corporation and investment banking at Goldman, Sachs & Co. Mr. Terry currently serves on the board of directors of Umpqua Holdings Corporation, a publicly traded financial services company and on the board of its principal subsidiary, Umpqua Bank. Mr. Terry also served on the board of trustees of the Oakland Museum of California. Mr. Terry holds a B.A. in Economics from the University of California at Berkeley and an M.B.A. from Golden Gate University.
82
Board of Directors
Our board of directors currently consists of nine members. Our bye-laws provide that our board of directors shall consist of five to twelve directors, as the board of directors may determine from time to time.
| B. | Compensation |
The aggregate direct compensation we paid to our executive officers as a group (four persons, including an executive officer retired on March 31, 2017) for the year ended December 31, 2017 was approximately $2.3 million, which included approximately $0.6 million in bonuses and approximately $83 in funds set aside or accrued to provide for health and life insurance, retirement, or similar benefits. During 2017, our executive officers as a group were granted 80,332 share options, with an exercise price of $22.95 and an expiration date of November 30, 2027, and 80,332 restricted share units through our 2015 Share Incentive Plan. This amount does not include expenses we incurred for other payments, including dues for professional and business associations, business travel and other expenses. We did not pay our officers who also serve as directors any separate compensation for their directorship during 2017, other than reimbursements for travel expenses.
All of our full-time employees, including employees of our direct and indirect subsidiaries and dedicated agents and our executive officers, were eligible to participate in our 2015 Short Term Incentive Plan (“STIP”). Under that plan, all eligible employees received an incentive award based on their respective job classification and our return on assets and earnings per share. In 2017, all STIP participants, including our executive officers received 75% of their target incentive award.
The aggregate direct compensation we paid to our directors who are not officers for their services as directors as a group for the year ended December 31, 2017 was approximately $473. Some directors were also reimbursed for expenses incurred in order to attend board or committee meetings.
2007 Share Incentive Plan and 2015 Share Incentive Plan
Our board of directors adopted the 2007 Share Incentive Plan (“2007 Plan”) on August 9, 2007, and our shareholders approved the 2007 Plan on September 4, 2007. The maximum number of common shares of Textainer Group Holdings Limited that could be granted pursuant to the 2007 Plan was 3,808,371 shares, representing 8% of the number of common shares issued and outstanding 45 days following our initial public offering on October 9, 2007, subject to adjustments for share splits, share dividends or other similar changes in our common shares or our capital structure. On February 23, 2010, the Company’s Board of Directors approved an increase in the number of shares available for future issuance by 1,468,500 from 3,808,371 shares to 5,276,871 shares, which was approved by the Company’s shareholders at the annual meeting of shareholders on May 19, 2010. The shares to be issued pursuant to awards under the 2007 Plan may be authorized, but unissued, or reacquired common shares. On May 21, 2015, TGH’s board of directors approved an amendment and restatement of the 2007 Plan as the 2015 Plan at the annual meeting of shareholders. The amendment and restatement of the 2007 Plan increased the maximum number of shares available for future issuance by 2,000,000 shares and extended the term of such plan for ten years from the date of the annual meeting of shareholders. At December 31, 2017, 787,937 shares were available for future issuance under the 2015 Plan.
The 2015 Plan provides for the grant of share options, restricted shares, restricted share units, share appreciation rights and dividend equivalent rights, collectively referred to as “awards.” Share options granted under the 2015 Plan may be either incentive share options under the provisions of Section 422 of the Internal Revenue Code of 1986, as amended (the “Code”), or non-qualified share options. We may grant incentive share options only to our employees or employees of any parent or subsidiary of Textainer Group Holdings Limited. Awards other than incentive share options may be granted to our employees, directors and consultants or the employees, directors and consultants of any parent or subsidiary of Textainer Group Holdings Limited.
83
Our board of directors or a committee designated by our board of directors, referred to as the “plan administrator,” will administer the 2015 Plan, including selecting the award recipients, determining the number of shares to be subject to each award, determining the exercise or purchase price of each award and determining the vesting and exercise periods of each award. Awards under the plan may vest upon the passage of time or upon the attainment of certain performance criteria.
The exercise price of all share options granted under the 2015 Plan will be at least equal to 100% of the fair market value of our common shares on the date of grant. If, however, incentive share options are granted to an employee who owns shares possessing more than 10% of the voting power of all classes of our common shares or the shares of any parent or subsidiary, the exercise price of any incentive share option granted must equal at least 110% of the fair market value on the grant date and the maximum term of these incentive share options must not exceed five years. The maximum term of all other awards under the 2015 Plan will be ten years. The plan administrator will determine the term and exercise or purchase price of any other awards granted under the 2015 Plan.
Under the 2015 Plan, incentive share options may not be sold, pledged, assigned, hypothecated, transferred or disposed of in any manner other than by will or by the laws of descent or distribution and may be exercised during the lifetime of the participant only by the participant. Other awards shall be transferable by will or by the laws of descent or distribution and to the extent provided in the award agreement. The 2015 Plan permits the designation of beneficiaries by holders of awards, including incentive share options.
In the event a participant in the 2015 Plan terminates employment or is terminated by us (or by our parent or subsidiary) without cause, any options which have become exercisable prior to the time of termination will remain exercisable for three months from the date of termination (unless a shorter or longer period of time is determined by the plan administrator). In the event a participant in the 2015 Plan is terminated by us (or by our parent or subsidiary) for cause, any options which have become exercisable prior to the time of termination will immediately terminate. If termination was caused by death or disability, any options which have become exercisable prior to the time of termination, will remain exercisable for twelve months from the date of termination (unless a shorter or longer period of time is determined by the plan administrator). Unless an individual award agreement otherwise provides, all vesting of all other awards will generally terminate upon the date of termination.
Subject to any required action by our shareholders, the number of common shares covered by outstanding awards, the number of common shares that have been authorized for issuance under the 2015 Plan, the exercise or purchase price of each outstanding award, the maximum number of common shares that may be granted subject to awards to a participant in any calendar year, and the like, shall be proportionally adjusted by the plan administrator in the event of any increase or decrease in the number of issued common shares resulting from certain changes in our capital structure as described in the 2015 Plan.
In the event of a corporate transaction or a change in control of Textainer Group Holdings Limited, all outstanding awards under the 2015 Plan will terminate unless the acquirer assumes or replaces such awards. In addition and except as otherwise provided in an individual award agreement, assumed or replaced awards will automatically become fully vested if a participant is terminated by the acquirer without cause within twelve months after a corporate transaction. In the event of a corporate transaction where the acquirer does not assume or replace awards granted under the 2015 Plan, all of these awards become fully vested immediately prior to the consummation of the corporate transaction. In the event of a change in control and except as otherwise provided in an individual award agreement, outstanding awards will automatically become fully vested if a participant is terminated by the acquirer without cause within twelve months after such change in control.
Under the 2015 Plan, a “corporate transaction” is generally defined as:
| • | acquisition of 50% or more of the common shares by any individual or entity including by tender offer; |
| • | a reverse merger or amalgamation in which 40% or more of the common shares is acquired by an individual or entity; |
| • | a sale, transfer or other disposition of all or substantially all of the assets of Textainer Group Holdings Limited; |
84
| • | a merger, amalgamation or consolidation in which Textainer Group Holdings Limited is not the surviving entity; or |
| • | a complete liquidation or dissolution. |
Under the 2015 Plan, a “change in control” is generally defined as:
| • | acquisition of 50% or more of the common shares by any individual or entity which a majority of our board of directors (who have served on the board for at least 12 months) do not recommend that our shareholders accept, or |
| • | a change in the composition of the board of directors as a result of contested elections over a period of 12 months or less. |
Unless terminated sooner, the 2015 Plan will automatically terminate in 2025. The board of directors will have authority to amend or terminate the 2015 Plan. To the extent necessary to comply with applicable provisions of federal securities laws, state corporate and securities laws, the Code, the rules of any applicable stock exchange or national market system, and the rules of any non-U.S. jurisdiction applicable to awards granted to residents therein, we will obtain shareholder approval of any such amendment to the 2015 Plan in such a manner and to such a degree as required.
2008 Bonus Plan
On September 21, 2007, our board of directors approved the Textainer Group Holdings Limited 2008 Bonus Plan (the “Bonus Plan”). The Bonus Plan provides for incentive payments to our employees and those of our affiliates, including our dedicated agents and key executives. Although the Bonus Plan permits the awards to be paid in shares, we expect that the awards will be cash-based. The Bonus Plan is designed to provide incentive awards based on the achievement of goals relating to our performance and the performance of our individual business units while maintaining a degree of flexibility in the amount of incentive compensation paid to such individuals. Under the Bonus Plan, performance goals may relate to one or more of the following measures, for the company as a whole, a line of business, service or product: increase in share price, earnings per share, total shareholder return, operating margin, gross margin, return on equity, return on assets, return on investment, operating income, net operating income, pre-tax income, cash flow, revenue, expenses, earnings before interest, taxes and depreciation, economic value added, market share, corporate overhead costs, liquidity management, net interest income, net interest income margin, return on capital invested, shareholders’ equity, income before income tax expense, residual earnings after reduction for certain compensation expenses, net income, profitability of an identifiable business unit or product, or performance relative to a peer group of companies on any of the foregoing measures.
Employment with Executive Officers and Directors
We have entered into employment agreements with most of our executive officers. Each of these employment agreements contains provisions requiring us to make certain severance payments in case the executive officer is terminated without cause. The agreements terminate upon termination of employment. Employment is at-will for each of our executive officers and they may be terminated at any time for any reason.
Other than as disclosed above, none of our directors has service contracts with us or any of our subsidiaries providing for benefits upon termination of employment.
85
| C. | Board Practices |
Our corporate governance practices are in compliance with, and are not prohibited by, the laws of Bermuda. Therefore, we are exempt from many of the New York Stock Exchange’s (“NYSE”) corporate governance practices, other than the establishment of a formal audit committee satisfying the requirements of Rule 10A-3 under the Exchange Act and notification of non-compliance with NYSE listing requirements pursuant to Rule 10A-3 promulgated under the Exchange Act. The practices that we follow in lieu of the NYSE’s corporate governance rules are described below.
| • | We do not, and are not required under Bermuda law to, maintain a board of directors with a majority of independent directors. Currently, a majority of our directors are not independent, as that term is defined by the NYSE. |
| • | We are not required by Bermuda law to hold regular meetings of the board of directors at which only independent directors are present. |
| • | Under Bermuda law, compensation of executive officers does not need to be determined by an independent committee. We have established a compensation committee that reviews and approves the compensation and benefits for our executive officers and other key executives, makes recommendations to the board regarding compensation matters and is responsible for awarding compensation to our executive officers and other employees under our share compensation plans. The committee also has the discretion to interpret and amend the terms of, and take all other actions necessary to administer, the 2015 Plan. However, our compensation committee is not comprised solely of independent directors, as required by NYSE standards. The members of our compensation committee are Messrs. Cottingham, Maccarone, Nurek and Shwiel. Mr. Nurek is a director of Trencor. Messrs. Cottingham, Maccarone and Shwiel satisfy the NYSE’s standards for director independence. |
| • | We have established an audit committee responsible (i) for advising the board regarding the selection of independent auditors, (ii) overseeing the Company’s accounting and financial reporting process, (iii) evaluating our internal controls, and (iv) overseeing compliance with policies and legal requirements with respect to financial reporting. Our audit committee need not comply with NYSE requirements that the audit committee have a minimum of three members or the NYSE’s standards of director independence for domestic issuers. Our audit committee has three members, Messrs. Shwiel, Cottingham and McQueen. Messrs. Shwiel and Cottingham are voting members of the committee and are independent as that term is defined in Rule 10A-3 under the Exchange Act. Mr. McQueen is a director of Trencor and has no voting rights. |
| • | We have established a nominating and governance committee, although this committee is not comprised solely of independent directors, as would be required of a domestic issuer. Our nominating and governance committee has four members, Messrs. Cottingham, Maccarone, Nurek and Shwiel. Messrs. Cottingham, Maccarone and Shwiel satisfy the NYSE’s standards for director independence. Our board of directors has adopted a nominating and governance committee charter. |
| • | Under Bermuda law, we are not required to obtain shareholder consent prior to issuing securities or adopting share compensation plans. Nonetheless, we sought and received the approval of our shareholders for our 2015 Plan on May 21, 2015 and 2007 Plan on September 4, 2007. Under Bermuda law, consent of the Bermuda Monetary Authority is required for the issuance of securities in certain circumstances. |
| • | Under Bermuda law, we are not required to adopt corporate governance guidelines or a code of business conduct. Nonetheless, we have adopted both corporate governance guidelines and a code of business conduct. |
| D. | Employees |
As of December 31, 2017, we employed 164 people. We believe that our relations with our employees are good, and we are not a party to any collective bargaining agreements.
| E. | Share Ownership |
See Item 7, “Major Shareholders and Related Party Transactions” for information regarding director and senior management ownership of our common shares.
86
| ITEM 7. | MAJOR SHAREHOLDERS AND RELATED PARTY TRANSACTIONS |
| A. | Major Shareholders |
The following table presents information regarding the beneficial ownership of our common shares as of March 6, 2018:
| • | each person or entity that we know beneficially owns more than 5% of our issued and outstanding shares; |
| • | each director, director nominee and executive officer; and |
| • | all of our directors, director nominees and executive officers as a group. |
Beneficial ownership is determined in accordance with the rules of the SEC and generally includes any shares over which a person exercises sole or shared voting or investment power. The percentage of beneficial ownership of our common shares owned is based on 57,099,249 common shares issued and outstanding on March 6, 2018. We do not believe that we are directly or indirectly owned or controlled by any foreign government. The voting rights of our common shares held by major shareholders are the same as the voting rights of shares held by all other shareholders. We are unaware of any arrangement that might result in a change of control.
| Number of Common Shares Beneficially Owned |
||||||||
| Holders |
Shares (1) | % (2) | ||||||
| 5% or More Shareholders |
||||||||
| Halco Holdings Inc. (3) |
27,278,802 | 47.8 | % | |||||
| Trencor Limited (3) |
27,278,802 | 47.8 | % | |||||
| Isam K. Kabbani (4) |
3,372,350 | 5.9 | % | |||||
| Directors and Executive Officers |
||||||||
| Philip K. Brewer (5) |
565,959 | 1.0 | % | |||||
| Dudley R. Cottingham (6) |
19,716 | * | ||||||
| John A. Maccarone (7) |
1,497,201 | 2.6 | % | |||||
| James E. McQueen (8) |
27,295,518 | 47.8 | % | |||||
| David M. Nurek (9) |
27,295,518 | 47.8 | % | |||||
| Hyman Shwiel |
21,716 | * | ||||||
| Iain Brown (10) |
27,286,356 | 47.8 | % | |||||
| Hennie Van der Merwe (11) |
27,279,802 | 47.8 | % | |||||
| Robert D. Pedersen |
391,464 | * | ||||||
| Hilliard C. Terry, III |
168,369 | * | ||||||
| Olivier Ghesquiere |
98,422 | * | ||||||
| Current directors and executive officers (11 persons) as a group |
30,083,635 | 52.7 | % | |||||
| * | Less than 1%. |
87
| (1) | Beneficial ownership by a person assumes the exercise of all share options, warrants and rights held by such person, even if not vested. Common shares beneficially owned include the following share options and restricted share units: |
| Grant Date | ||||||||||||||||||||||||||||||||||||||||||||||||
| 11/18/2009 | 11/18/2010 | 11/16/2011 | 1/20/2012 | 11/14/2012 | 11/14/2013 | 11/19/2014 | 11/12/2015 | 5/19/2016 | 11/30/2016 | 5/19/2017 | 11/30/2017 | |||||||||||||||||||||||||||||||||||||
| Share options |
|
|||||||||||||||||||||||||||||||||||||||||||||||
| Exercise price |
$ | 16.97 | $ | 28.26 | $ | 28.54 | $ | 31.34 | $ | 28.05 | $ | 38.36 | $ | 34.14 | $ | 14.17 | $ | 12.23 | $ | 9.70 | N/A | $ | 22.95 | |||||||||||||||||||||||||
| Expiration date |
11/17/2019 | 11/17/2020 | 11/15/2021 | 1/19/2022 | 11/14/2022 | 11/14/2023 | 11/19/2024 | 11/12/2025 | 5/19/2026 | 11/30/2026 | N/A | 11/30/2027 | ||||||||||||||||||||||||||||||||||||
| Philip K. Brewer |
22,350 | 15,000 | 30,000 | — | 32,000 | 36,000 | 38,520 | 45,291 | — | 54,349 | — | 46,197 | ||||||||||||||||||||||||||||||||||||
| Robert D. Pedersen |
— | 7,500 | 16,500 | — | 23,000 | 26,000 | 27,820 | 26,534 | — | 39,252 | — | — | ||||||||||||||||||||||||||||||||||||
| Hilliard C. Terry, III |
— | — | — | 10,000 | 11,000 | 12,500 | 13,375 | 15,726 | — | 19,265 | — | 16,375 | ||||||||||||||||||||||||||||||||||||
| Olivier Ghesquiere |
— | — | — | — | — | — | — | — | 10,000 | 19,200 | — | 17,760 | ||||||||||||||||||||||||||||||||||||
| Restricted share units |
|
|||||||||||||||||||||||||||||||||||||||||||||||
| Philip K. Brewer |
— | — | — | — | — | — | 9,630 | 22,645 | — | 40,761 | — | 46,197 | ||||||||||||||||||||||||||||||||||||
| Dudley R. Cottingham |
— | — | — | — | — | — | — | — | — | — | 6,154 | — | ||||||||||||||||||||||||||||||||||||
| John A. Maccarone |
— | — | — | — | — | — | — | — | — | — | 6,154 | — | ||||||||||||||||||||||||||||||||||||
| James E. McQueen |
— | — | — | — | — | — | — | — | — | — | 6,154 | — | ||||||||||||||||||||||||||||||||||||
| David M. Nurek |
— | — | — | — | — | — | — | — | — | — | 6,154 | — | ||||||||||||||||||||||||||||||||||||
| Hyman Shwiel |
— | — | — | — | — | — | — | — | — | — | 6,154 | — | ||||||||||||||||||||||||||||||||||||
| Iain Brown |
— | — | — | — | — | — | — | — | — | — | 6,154 | — | ||||||||||||||||||||||||||||||||||||
| Hennie Van der Merwe |
— | — | — | — | — | — | — | — | — | — | — | — | ||||||||||||||||||||||||||||||||||||
| Robert D. Pedersen |
— | — | — | — | — | — | 6,955 | 16,354 | — | 29,439 | 6,154 | — | ||||||||||||||||||||||||||||||||||||
| Hilliard C. Terry, III |
— | — | — | — | — | — | 3,343 | 7,862 | — | 14,448 | — | 16,375 | ||||||||||||||||||||||||||||||||||||
| Olivier Ghesquiere |
— | — | — | — | — | — | — | — | 7,500 | 14,400 | — | 17,760 | ||||||||||||||||||||||||||||||||||||
| (2) | Percentage ownership is based on 57,099,249 shares outstanding as of March 6, 2018. |
| (3) | Includes 27,278,802 shares held by Halco Holdings Inc. (“Halco”). Halco is wholly-owned by Trencor. Halco was previously wholly-owned by Halco Trust, a discretionary trust with an independent trustee. On February 20, 2018, Halco Trust distributed and transferred to Trencor, a nominated discretionary beneficiary of Halco Trust, the trust’s 100% shareholding in Halco. |
| (4) | Includes 3,372,350 shares held by Delmas Invest Holding S.A, an affiliate of Mr. Kabbani. |
| (5) | Includes 94,045 shares held by the Philip Brewer 2009 Trust and 32,974 shares held by a joint account of Mr. Brewer and Dr. Choi Yue Victoria Woo. |
| (6) | Includes 8,080 shares held by Caribbean Dream Limited, a company owned by a trust in which Mr. Cottingham is the principal beneficiary and 5,482 shares held by Mr. Cottingham. |
| (7) | Includes 1,205,100 shares held by the Maccarone Family Partnership L.P., 283,497 shares held by the Maccarone Revocable Trust, 1,100 shares held by the Maccarone Charitable Trust, 1,000 shares held by the John Maccarone IRA Rollover and 350 shares held by the Bryan Maccarone UTMA. |
| (8) | Includes 27,278,802 shares held by Halco (which in terms of SEC regulations are solely reported herewith as beneficially owned by Mr. McQueen due to his position as a director of Trencor) and 10,562 shares held by Mr. McQueen. Mr. McQueen is one of our directors, and a member of the board of directors of Trencor. Mr. McQueen disclaims beneficial ownership, except to the extent of his pecuniary interest therein, if any, of the shares held by Halco. |
| (9) | Includes 27,278,802 shares held by Halco (which in terms of SEC regulations are solely reported herewith as beneficially owned by Mr. Nurek due to his position as a director of Trencor) and 10,562 shares held by Mr. Nurek. Mr. Nurek is one of our directors, and a member of the board of directors of Trencor. Mr. Nurek disclaims beneficial ownership, except to the extent of his pecuniary interest therein, if any, of the shares held by Halco. |
| (10) | Includes 27,278,802 shares held by Halco (which in terms of SEC regulations are solely reported herewith as beneficially owned by Mr. Brown due to his position as a director of Halco), 700 shares held by the trust of IB Settlement and 700 shares held by Michelle Brown, Mr. Brown’s spouse. Mr. Brown is one of our directors and also a director of Halco. Mr. Brown disclaims beneficial ownership, except to the extent of his pecuniary interest therein, if any, of the shares held by Halco. |
| (11) | Includes 27,278,802 shares held by Halco (which in terms of SEC regulations are solely reported herewith as beneficially owned by Mr. Van der Merwe due to his position as a director of Trencor) and 1,000 shares held by Mr. Van der Merwe. Mr. Van der Merwe is one of our directors, a director of Halco and also a CEO and director of Trencor. Mr. Van der Merwe disclaims beneficial ownership, except to the extent of his pecuniary interest therein, if any, of the shares held by Halco. |
88
As of March 6, 2018, based on information available to the Company, 19,716 of our common shares issued and outstanding were held by one record holder in our domicile and headquarters country (Bermuda). We also had six shareholders of record in the United States and held an aggregate of 29,353,645 of our common shares, which includes 29,316,508 shares held by Cede & Company, a nominee of the Depository Trust Company. The shares held by Cede & Company include common shares beneficially owned by several holders in the United States and by non-U.S. beneficial owners.
| B. | Related Party Transactions |
We do not have a corporate policy regarding related party transactions, nor are there any provisions in our memorandum of association or bye-laws regarding related party transactions, other than the provision, as permitted by Bermuda law, that we, or one of our subsidiaries, may enter into a contract in which our directors or officers are directly or indirectly interested if the director or officer discloses his interest to our board of directors at the first opportunity at a meeting of directors or in writing.
Loans to Executive Officers
As permitted by Bermuda law, in the past, we have extended loans to our employees in connection with their acquisition of our common shares in accordance with our various employees’ share schemes. As of December 31, 2017 and 2016, no amounts were outstanding on such loans to employees. Currently, there are no loans outstanding to our directors or executive officers, and we will not extend loans to our directors or executive officers in the future, in compliance with the requirements of Section 402 of the Sarbanes-Oxley Act of 2002 and Section 13(k) of the Securities Exchange Act of 1934, as amended.
Indemnification of Officers and Directors
We have entered into indemnification agreements with each of our directors and executive officers to give such directors and officers, as well as their immediate family members, additional contractual assurances regarding the scope of indemnification set forth in our bye-laws, and to provide additional procedural protections which may, in some cases, be broader than the specific indemnification provisions contained in our bye-laws. The indemnification agreements may require us, among other things, to indemnify such directors and officers, as well as their immediate family members, against liabilities that may arise by reason of their status or service as directors or officers and to advance expenses as a result of any proceeding against them as to which they could be indemnified.
Agreements with Needman Group Holdings Inc.
Textainer Equipment Management Limited has entered into a management agreement with Needman Group Holdings Inc., related to Textainer Equipment Management Limited’s management of containers owned by Needman Group Holdings Inc. Needman Group Holdings Inc. is under the trust IKK Settlement and Mr. Isam Kabbani, a former member of our board, is the settlor of the IKK Settlement. In 2017, 2016 and 2015, we managed approximately 10,000 TEU (for which we received approximately $193 in management fees), 9,000 TEU (for which we received approximately $250 in management fees) and 9,000 TEU (for which we received approximately $168 in management fees), respectively, for Needman Group Holdings Inc.
Agreements with Maccarone Container Fund, LLC
Textainer Equipment Management Limited has entered into a management agreement with Maccarone Container Fund, LLC, related to Textainer Equipment Management Limited’s management of containers owned by Maccarone Container Fund, LLC effective 2016. Director John Maccarone and his family members are the beneficial owners of Maccarone Container Fund, LLC. In 2017 and 2016, we managed approximately 1,300 TEU (for which we received approximately $17 in management fees) and 1,300 TEU (for which we received approximately $2 in management fees), respectively, for Maccarone Container Fund, LLC.
89
Relationships and Agreements with Entities Related to Trencor Limited
Halco is a wholly-owned subsidiary of Trencor Limited. Halco was previously wholly-owned by Halco Trust (“Trust”), a discretionary trust with an independent trustee. On February 20, 2018, Halco Trust distributed and transferred to Trencor, a nominated discretionary beneficiary of Halco Trust, the trust’s 100% shareholding in Halco. Hennie Van der Merwe, David Nurek and James McQueen, are members of our board of directors and the board of directors of Trencor. In addition, two of our directors, Hennie Van der Merwe and Iain Brown are also members of the board of directors of Halco.
We have entered into an agreement with LAPCO, an associate of Halco, related to our management of containers owned by LAPCO. Pursuant to this agreement, LAPCO has the right, but not an obligation, to require us to purchase containers on its behalf, within guidelines specified in the agreement and for as long as the management agreement is in place. In 2017, 2016 and 2015, we received the following fees or commissions from LAPCO: (i) $2,329, $2,282 and $2,889, respectively, in management fees and (ii) $666, $713 and $653, respectively, in sales commissions and acquisition fees. In 2017, 2016 and 2015, fees received under the LAPCO agreement accounted for 4.2%, 3.9% and 4.1%, respectively, of total combined Container Management and Container Resale segment revenue and 0.6%, 0.6% and 0.7%, respectively, of total revenue. LAPCO is free to compete against us with respect to its investment in containers and uses our competitors to manage some of its containers.
Halco acquired 2,100,000 common shares in the Company’s initial public offering on October 15, 2007 at the initial public offering price. The underwriters did not receive any discount or commission on these shares. The common shares that were purchased by Halco in the offering are not freely tradable in the public market due to Halco’s status as our “affiliate,” as such term is defined in Rule 144 under the Securities Act. See Item 14. “Material Modifications to the Rights of Security Holders and Use of Proceeds” for further details on these trading restrictions.
Transactions with Container Investment Limited
A member of our board of directors, Iain Brown, serves as Director and owns 50% of Container Investment Limited (“CIS”). CIS is a U.K. company that provides administration and accounting services. In 2017, 2016 and 2015, the Company paid $96, $63, and $102, respectively, to CIS primarily for accounting services provided to the Company’s U.K. entity, Textainer Equipment Management (U.K.) Limited.
Transactions with Continental Management Ltd.
A member of our board of directors, Dudley R. Cottingham, is also a member of the board of directors of Continental Management Ltd (“Continental”). Continental is a Bermuda company that provides corporate representation, administration and management services. In 2017, 2016 and 2015, the Company paid $59, $60, and $58, respectively, to Continental primarily for Bermuda government annual fees and registered office fees.
Transactions with Umpqua Bank
Our Executive Vice President and Chief Financial Officer, Hilliard C. Terry, III, serves as a member of the Board of Directors of Umpqua Holdings Corporation, the NASDAQ listed holding company for Umpqua Bank and Umpqua Investments, Inc. Umpqua Bank is a lender with a less than 5% commitment in the $700,000 Credit Agreement with the Company’s wholly-owned subsidiary, Textainer Limited (“TL Credit Agreement”). Umpqua Bank participates in the TL Credit Agreement on the same terms as the other lenders in the facility.
| C. | Interests of Experts and Counsel |
Not applicable.
90
| ITEM 8. | FINANCIAL INFORMATION |
| A. | Consolidated Statements and Other Financial Information |
Financial Statements
Our audited consolidated financial statements which are comprised of our consolidated balance sheets as of December 31, 2017 and 2016 and the related consolidated statements of comprehensive income, shareholders’ equity and cash flows for each of the years in the three-year period ended December 31, 2017 and the notes to those statements and the report of independent registered public accounting firm thereon, are included under Item 18, “Financial Statements” of this Annual Report on Form 20-F. Also, see Item 5, “Operating and Financial Review and Prospects” for additional financial information.
Legal Proceedings
See Item 4, “Information on the Company — Business Overview—Legal Proceedings” for information on our legal proceedings which may have, or have had in the recent past, significant effects on our financial position or profitability.
Dividend Policy
The following table summarizes dividends that we have declared and paid since January 1, 2015:
| Date Declared |
Dividend per Outstanding Common Share |
Total Dividend |
||||||
| February 2015 |
$ | 0.47 | $ | 26,781 | ||||
| April 2015 |
$ | 0.47 | $ | 26,783 | ||||
| July 2015 |
$ | 0.47 | $ | 26,796 | ||||
| October 2015 |
$ | 0.24 | $ | 13,719 | ||||
| February 2016 |
$ | 0.24 | $ | 13,479 | ||||
| April 2016 |
$ | 0.24 | $ | 13,577 | ||||
| August 2016 |
$ | 0.03 | $ | 1,698 | ||||
We are not required to pay dividends, and our shareholders do not have contractual or other rights, to receive dividends. The timing and amount of future dividends will be at the discretion of our board of directors and will be dependent on our future operating results and the cash requirements of our business. There are a number of factors that can affect our ability to pay dividends and there is no guarantee that we will pay dividends in any given year. See Item 3, “Key Information — Risk Factors,” for a discussion of these factors. Our board of directors may decide, in its discretion, at any time, to decrease the amount of dividends, otherwise modify or repeal the dividend policy or discontinue entirely the payment of dividends.
In addition, we will not pay dividends in the event we are not allowed to do so under Bermuda law, are in default under (or such payment would cause a default under) the revolving credit facility, revolving credit facility II or term loan of our wholly-owned subsidiary, Textainer Limited, or if such payment would cause us to breach any of our covenants. These covenants include certain financial covenants, which would be directly affected by the payment of dividends, such as a minimum tangible net worth level (which level would decrease by the amount of any dividend paid) and a maximum ratio of consolidated funded debt to consolidated tangible net worth (which amount would decrease by the amount of any dividend paid). Please see Item 5, “Operating and Financial Review and Prospects—Liquidity and Capital Resources” for a description of these covenants. Furthermore, since we are a holding company, substantially all of the assets shown on our consolidated balance sheet are held by our subsidiaries. Accordingly, our earnings and cash flow and our ability to pay dividends are largely dependent upon the earnings and cash flows of our subsidiaries and the distribution or other payment of such earnings to us in the form of dividends.
In 2014 we began calculating our earnings and profits under U.S. federal income tax principles for purposes of determining whether distributions exceed our current and accumulated earnings and profits. We believe that some or
91
all of our distributions will be treated as a return of capital to our U.S. shareholders and we report each quarter on our website at www.textainer.com whether that quarter’s distribution exceeds our current accumulated earnings and profits. The taxability of the dividends does not impact our corporate tax position. You should consult with a tax advisor to determine the proper tax treatment of these distributions.
| B. | Significant Changes |
Except as disclosed in the Annual Report on Form 20-F, no significant changes have occurred since December 31, 2017, which is the date of our audited consolidated financial statements included in this Annual Report on Form 20-F.
| ITEM 9. | THE OFFER AND LISTING |
| A. | Offer and Listing Details |
Trading Markets and Price History
Our common shares have been listed on the New York Stock Exchange (“NYSE”) under the symbol “TGH” since October 10, 2007. Prior to that time, there was no public market for our common shares. The following table sets forth the high and low closing sale prices, as reported on the NYSE for our common shares for the periods indicated:
| High | Low | |||||||
| Annual Highs and Lows: |
||||||||
| 2017 |
$ | 23.55 | $ | 8.50 | ||||
| 2016 |
$ | 15.72 | $ | 7.05 | ||||
| 2015 |
$ | 34.44 | $ | 13.48 | ||||
| 2014 |
$ | 39.87 | $ | 29.25 | ||||
| 2013 |
$ | 43.06 | $ | 31.98 | ||||
| Quarterly Highs and Lows (two most recent full financial years): |
||||||||
| Fourth quarter 2017 |
$ | 23.55 | $ | 17.50 | ||||
| Third quarter 2017 |
$ | 17.95 | $ | 13.95 | ||||
| Second quarter 2017 |
$ | 16.40 | $ | 9.75 | ||||
| First quarter 2017 |
$ | 17.30 | $ | 8.50 | ||||
| Fourth quarter 2016 |
$ | 10.35 | $ | 7.05 | ||||
| Third quarter 2016 |
$ | 13.08 | $ | 7.45 | ||||
| Second quarter 2016 |
$ | 15.72 | $ | 9.76 | ||||
| First quarter 2016 |
$ | 14.84 | $ | 7.31 | ||||
| Monthly Highs and Lows (over the most recent six month period): |
||||||||
| February 2018 |
$ | 24.50 | $ | 16.30 | ||||
| January 2018 |
$ | 26.40 | $ | 21.85 | ||||
| December 2017 |
$ | 22.65 | $ | 21.00 | ||||
| November 2017 |
$ | 23.55 | $ | 18.90 | ||||
| October 2017 |
$ | 19.85 | $ | 17.50 | ||||
| September 2017 |
$ | 17.95 | $ | 15.20 | ||||
Transfer Agent
The transfer agent and registrar for our common shares is Computershare Shareholder Services, Inc. and its fully owned subsidiary Computershare Trust Company, N.A., having its principal office at 250 Royall Street, Canton, MA 02021.
| B. | Plan of Distribution |
Not applicable.
92
| C. | Markets |
See Item 9, “Offer and Listing Details – Trading Markets” above.
| D. | Selling Shareholders |
Not applicable.
| E. | Dilution |
Not applicable.
| F. | Expenses of the Issue |
Not applicable.
| ITEM 10. | ADDITIONAL INFORMATION |
| A. | Share Capital |
Not applicable.
| B. | Memorandum and Articles of Association |
We are an exempted company incorporated under the laws of Bermuda. We are registered with the Registrar of Companies in Bermuda under registration number EC18896. We were incorporated on December 3, 1993 under the name Textainer Group Holdings Limited, prior to that time our business was based in Panama. Our headquarters office is located at 16 Par-La-Ville Road, Hamilton HM 08 Bermuda.
We incorporate by reference into this Annual Report on Form 20-F the description of our memorandum of association and our bye-laws contained in “Description of Share Capital” of our Registration Statement on Form F-1 filed with the SEC on September 26, 2007. Such information is a summary which does not purport to be complete and is qualified in its entirety by reference to our memorandum of association and our bye-laws, copies of which have been filed as Exhibits 3.1 and 3.2, respectively, to such Registration Statement.
| C. | Material Contracts |
We have not entered into any material contracts during the two years immediately preceding the date of this Annual Report on Form 20-F other than contracts entered into in the ordinary course of business and other than those described in Item 4, “Information on the Company—History and Development of the Company—Significant Events” or elsewhere in this Annual Report on Form 20-F.
93
| D. | Exchange Controls |
Trencor, a South African company listed on the JSE, has an indirect beneficiary interest in 47.8% of our issued and outstanding shares as of December 31, 2017. South Africa’s exchange control regulations provide for restrictions on exporting capital from South Africa. These restrictions require Trencor to obtain approval from South African exchange control authorities before engaging in transactions that would result in dilution of their share interest in us below certain thresholds, whether through their sale of their own shareholdings or through the approval of our issuance of new shares. The exchange control authorities may decide not to grant such approval if a proposed transaction were to dilute Trencor’s beneficiary interest in us below certain levels. While the South African government has, to some extent, relaxed exchange controls in recent years, it is difficult to predict whether or how it will further relax or abolish exchange control measures in the future. The above requirements could restrict or limit our ability to issue new shares. In addition, Trencor is required to comply with JSE Listings Requirements in connection with its holding or sale of our common shares.
| E. | Taxation |
The following discussion is a summary of the material Bermuda and U.S. federal income tax consequences of an investment in our common shares. This discussion is not exhaustive of all possible tax considerations. In particular, this discussion does not address the tax consequences under state, local, and other national (e.g., non-Bermuda and non-U.S.) tax laws. Accordingly, we urge you to consult your own tax advisor regarding your particular tax circumstances and the tax consequences under state, local, and other national tax laws. The following discussion is based upon laws and relevant interpretations thereof in effect as of the date hereof, all of which are subject to change, possibly with retroactive effect.
Bermuda Tax Consequences
The following is a summary of the material Bermuda tax consequences of an investment in our common shares. The following discussion is not exhaustive of all possible tax considerations. We urge you to consult your own tax advisor regarding your particular tax circumstances.
Taxation of the Companies
We and our Bermuda subsidiaries have obtained an assurance from the Bermuda Minister of Finance under the Exempted Undertakings Tax Protection Act 1966 that, if any legislation is enacted in Bermuda imposing any tax computed on profits or income, or computed on any capital asset, gain, or appreciation, or any tax in the nature of estate duty or inheritance tax, then such tax will not until March 31, 2035 be applicable to us or any of our operations, or to any of our shares, debentures, or other obligations, except insofar as such tax applies to persons ordinarily resident in Bermuda or is payable by us in respect of real property owned or leased by us in Bermuda. As an exempted company, we are required to pay an annual Bermuda government fee based on our assessable capital.
Taxation of Holders
Currently, there is no Bermuda income or profits tax, withholding tax, capital gains tax, capital transfer tax, estate duty or inheritance tax payable by our shareholders in respect of our common shares. The issue, transfer, or redemption of our common shares is not currently subject to stamp duty.
United States Federal Income Tax Consequences
The following is a summary of the material U.S. federal income tax consequences of an investment in our common shares. The following discussion is not exhaustive of all possible tax considerations. This summary is based upon the Code, regulations promulgated under the Code by the U.S. Treasury Department (including proposed and temporary regulations), rulings, current administrative interpretations and official pronouncements of the IRS, and judicial decisions, all as currently available and all of which are subject to differing interpretations or to change, possibly with retroactive effect. Any such change could materially and adversely affect the tax consequences described below. No assurance can be given that the IRS will not assert, or that a court will not sustain, a position contrary to any of the tax consequences described below.
94
This summary does not address all aspects of U.S. federal income taxation that may be important to a particular holder in light of its investment or tax circumstances or to holders subject to special tax rules, such as banks; financial institutions; insurance companies; dealers in stocks, securities, or currencies; traders in securities that elect to use a mark-to-market method of accounting for their securities holdings; tax-exempt organizations; real estate investment trusts; regulated investment companies; qualified retirement plans, individual retirement accounts, and other tax-deferred accounts; certain former citizens or long-term residents of the U.S.; persons subject to the alternative minimum tax; persons holding common shares as part of a straddle, hedge, conversion transaction, or other integrated transaction; persons who acquired common shares pursuant to the exercise of any employee share option or otherwise as compensation for services; persons actually or constructively holding 10% or more of our voting shares; and U.S. Holders (as defined below) whose functional currency is other than the U.S. dollar.
This discussion is not a comprehensive description of all of the U.S. federal tax consequences that may be relevant with respect to an investment in common shares. We urge you to consult your own tax advisor regarding your particular circumstances and the U.S. federal income and estate tax consequences to you of owning and disposing of common shares, as well as any tax consequences arising under the laws of any state, local, foreign or other tax jurisdiction and the possible effects of changes in U.S. federal or other tax laws.
This summary is directed solely to persons who hold their common shares as capital assets within the meaning of Section 1221 of the Code, which includes property held for investment. For purposes of this discussion, the term “U.S. Holder” means a beneficial owner of common shares that is any of the following:
| • | a citizen or resident of the U.S. or someone treated as a U.S. citizen or resident for U.S. federal income tax purposes; |
| • | a corporation (or other entity taxable as a corporation for U.S. federal income tax purposes) created or organized in or under the laws of the U.S., any state thereof, or the District of Columbia; |
| • | an estate, the income of which is subject to U.S. federal income taxation regardless of its source; |
| • | a trust if a U.S. court can exercise primary supervision over the trust’s administration and one or more U.S. persons have the authority to control all substantial decisions of the trust; or |
| • | a trust in existence on August 20, 1996 that has a valid election in effect under applicable Treasury Regulations to be treated as a U.S. person. |
The term “Non-U.S. Holder” means a beneficial owner of common shares that is not a U.S. Holder or an entity treated as a partnership for U.S. federal income tax purposes. As described in “—Taxation of Non-U.S. Holders” below, the tax consequences to a Non-U.S. Holder may differ substantially from the tax consequences to a U.S. Holder.
If a partnership (including for this purpose any entity treated as a partnership for U.S. federal income tax purposes) is a beneficial owner of common shares, the U.S. federal income tax consequences to a partner in the partnership will depend on the status of the partner and the activities of the partnership. A holder of common shares that is a partnership and the partners in such partnership should consult their own tax advisors regarding the U.S. federal income tax consequences of an investment in common shares.
Taxation of the Companies
Textainer and Non-U.S. Subsidiaries
A non-U.S. corporation deemed to be engaged in a trade or business within the U.S. is subject to U.S. federal income tax on income which is treated as effectively connected with the conduct of that trade or business. Such income tax, if imposed, is based on effectively connected income computed in a manner similar to the manner in which the income of a domestic corporation is computed, except that a foreign corporation will be entitled to deductions and credits for a taxable year only if it timely files a U.S. federal income tax return for that year. In addition, a non-U.S. corporation may be subject to the U.S. federal branch profits tax on the portion of its effectively connected earnings and profits, with certain adjustments, deemed repatriated out of the U.S. Currently, the maximum U.S. federal income tax rates are 35% for a corporation’s effectively connected income and 30% for the branch profits tax. Effective January 1, 2018, the maximum U.S. federal income tax rate drops to 21% for a corporation’s effectively connected income.
95
A portion of our income is treated as effectively connected with the conduct of a trade or business within the U.S., and such effectively connected income is subject to U.S. federal income tax. U.S. federal income tax returns have been filed declaring such effectively connected income.
The determination of whether a person is engaged in a U.S. trade or business is based on a highly factual analysis. In general, there is no clear test as to the nature and scope of activities that constitute being engaged in a U.S. trade or business, and it is unclear how a court would construe the existing authorities with respect to our activities. Accordingly, it is possible that the IRS could assert that a significantly greater portion of our income than we currently report is derived from the conduct of a U.S. trade or business and therefore, is effectively connected income that is subject to U.S. federal income tax.
In addition to U.S. federal income tax on income associated with a U.S. trade or business, we are also subject to a 30% U.S. withholding tax imposed on the gross amount of certain “fixed or determinable annual or periodic gains, profits and income” derived from sources within the U.S. (such as rents, dividends and interest on investments), to the extent such amounts are not effectively connected income. This 30% U.S. withholding tax is subject to reduction by applicable treaties. Distributions by our U.S. subsidiaries to us are expected to be subject to this 30% U.S. withholding tax.
U.S. Subsidiaries
Our U.S. subsidiaries are subject to U.S. federal income tax at regular corporate rates on their worldwide income, regardless of its source, subject to reduction by allowable foreign tax credits.
Transfer Pricing
Under U.S. federal income tax laws, transactions among taxpayers that are owned or controlled directly or indirectly by the same interests generally must be at arm’s-length terms. The IRS may distribute, apportion, or allocate gross income, deductions, credits, or allowances between or among such taxpayers if it determines that such transactions are not at arm’s-length terms and that such distribution, apportionment, or allocation is necessary in order to clearly reflect the income of any of such taxpayers. Additionally, if we have not met the requirements of the new CBC Regulations (effective for our taxable years beginning on or after June 30, 2016), we may become subject to penalties and the IRS may pursue a further investigation or audit of our operations, which may result in an adjustment to our transfer pricing policies as described in the immediately preceding sentence. In such a situation, we may incur increased tax liability, possibly materially, thereby reducing our profitability and cash flows.
Taxation of U.S. Holders
The discussion in “—Distributions on Common Shares” and “—Dispositions of Common Shares” below assumes that we will not be treated as a passive foreign investment company (“PFIC”) for U.S. federal income tax purposes. For a discussion of the rules that apply if we are treated as a PFIC, see “—Passive Foreign Investment Company” below.
Distributions on Common Shares
General. Subject to the discussion in “—Passive Foreign Investment Company” below, if you actually or constructively receive a distribution on common shares, you must include the distribution in gross income as a taxable dividend on the date of your receipt of the distribution, but only to the extent of our current or accumulated earnings and profits, as calculated under U.S. federal income tax principles. Such amount must be included without reduction for any foreign taxes withheld. Dividends paid by us will not be eligible for the dividends received deduction allowed to corporations with respect to dividends received from certain domestic corporations. Dividends paid by us may or may not be eligible for preferential rates applicable to qualified dividend income, as described below. In addition, certain non-corporate U.S. Holders may be subject to an additional 3.8% Medicare tax on dividend income whether or not it is “qualified dividend income.” See “—Medicare Tax” below.
96
To the extent a distribution exceeds our current and accumulated earnings and profits, it will be treated first as a non-taxable return of capital to the extent of your adjusted tax basis in the common shares, and thereafter as capital gain. Preferential tax rates for long-term capital gain may be applicable to non-corporate U.S. Holders. In addition, certain non-corporate U.S. Holders may be subject to an additional 3.8% Medicare tax on capital gain. See “—Medicare Tax” below.
Qualified Dividend Income. With respect to non-corporate U.S. Holders (i.e., individuals, trusts, and estates), the maximum individual U.S. federal income tax rate applicable to “qualified dividend income” (“QDI”) generally is 20%. Among other requirements, dividends will be treated as QDI if either (i) our common shares are readily tradable on an established securities market in the U.S., or (ii) we are eligible for the benefits of a comprehensive income tax treaty with the U.S. which includes an information exchange program and which is determined to be satisfactory by the Secretary of the U.S. Treasury. The income tax treaty between the U.S. and Bermuda (the jurisdiction of our incorporation) does not qualify for these purposes. However, subject to the discussion below, under “—Passive Foreign Investment Company—Mark-to-Market Election,” we expect that under current administrative guidance, our common shares are “readily tradable” on an established securities market as a result of being listed on the NYSE.
In addition, for dividends to be treated as QDI, we must not be a PFIC (as discussed below) for either the taxable year in which the dividend was paid or the preceding taxable year. We do not believe that we were a PFIC for our prior taxable year and we intend to conduct our business so that we should not be treated as a PFIC for our current taxable year or any future taxable year. However, because the PFIC determination is highly fact intensive and made at the end of each taxable year, it is possible that we may be a PFIC for the current or any future taxable year. Please see the discussion under “—Passive Foreign Investment Company” below. Additionally, in order to qualify for QDI treatment, you generally must have held the common shares for more than 60 days during the 121-day period beginning 60 days prior to the ex-dividend date. However, your holding period will be reduced for any period during which the risk of loss is diminished.
Since the QDI rules are complex, you should consult your own tax advisor regarding the availability of the preferential tax rates for dividends paid on common shares.
In-Kind Distributions. Generally, distributions to you of new common shares or rights to subscribe for new common shares that are received as part of a pro rata distribution to all of our shareholders will not be subject to U.S. federal income tax. The adjusted tax basis of the new common shares or rights so received will be determined by allocating your adjusted tax basis in the old common shares between the old common shares and the new common shares or rights received, based on their relative fair market values on the date of distribution. However, in the case of a distribution of rights to subscribe for common shares, the adjusted tax basis of the rights will be zero if the fair market value of the rights is less than 15% of the fair market value of the old common shares on the date of distribution and you do not make an election to determine the adjusted tax basis of the rights by allocation as described above. Your holding period for the new common shares or rights should include the holding period for the old common shares on which the distribution was made.
Foreign Tax Credits. Subject to certain conditions and limitations, any foreign taxes paid on or withheld from distributions from us and not refundable to you may be credited against your U.S. federal income tax liability or, alternatively, may be deducted from your taxable income. This election is made on a year-by-year basis and applies to all foreign taxes paid by you or withheld from you that year.
Distributions will constitute foreign source income for foreign tax credit limitation purposes. The foreign tax credit limitation is calculated separately with respect to two specific classes of income. For this purpose, distributions characterized as dividends distributed by us are expected to constitute “passive category income” or, in the case of certain U.S. Holders, “general category income.” Special limitations may apply if a dividend is treated as QDI (as defined above).
Since the rules governing foreign tax credits are complex, you should consult your own tax advisor regarding the availability of foreign tax credits in your particular circumstances.
97
Dispositions of Common Shares
Subject to the discussion in “—Passive Foreign Investment Company” below, you will recognize taxable gain or loss on the sale or other taxable disposition of common shares equal to the difference between the U.S. dollar value of (i) the amount realized on the disposition (i.e., the amount of cash plus the fair market value of any property received), and (ii) your adjusted tax basis in the common shares. Such gain or loss will be capital gain or loss.
If you have held the common shares for more than one year at the time of disposition, such capital gain or loss will be long-term capital gain or loss. Preferential tax rates for long-term capital gain apply for non-corporate U.S. Holders. The maximum rate for individuals on net long-term capital gain is currently 20%. In the case of a corporation, capital gains are taxed at the same rate as ordinary income, the maximum rate for which is currently 35%. If you have held the common shares for one year or less, such capital gain or loss will be short-term capital gain or loss taxable as ordinary income. The deductibility of capital losses is subject to limitations. In addition, certain U.S. persons, including individuals, estates and trusts, will be subject to an additional 3.8% Medicare tax on capital gain income. See “—Medicare Tax” below.
Any gain or loss recognized on the disposition of common shares is not expected to give rise to foreign source income for U.S. foreign tax credit purposes.
You should consult your own tax advisor regarding the U.S. federal income tax consequences if you receive currency other than U.S. dollars upon the disposition of common shares.
Passive Foreign Investment Company
We will be a PFIC under Section 1297 of the Code if, for a taxable year, either (a) 75% or more of our gross income for such taxable year is passive income (the “income test”) or (b) 50% or more of the average percentage, generally determined by fair market value, of our assets during such taxable year either produce passive income or are held for the production of passive income (the “asset test”). “Passive income” includes, for example, dividends, interest, certain rents and royalties, certain gains from the sale of stock and securities, and certain gains from commodities transactions. However, rents meeting certain requirements are treated as derived from the conduct of an active trade or business and are not treated as passive income.
Certain “look through” rules apply for purposes of the income and asset tests described above. If we own, directly or indirectly, 25% or more of the total value of the outstanding shares of another corporation, we will be treated as if we (a) held directly a proportionate share of the other corporation’s assets, and (b) received directly a proportionate share of the other corporation’s income. In addition, passive income does not include any interest, dividends, rents, or royalties that are received or accrued by us from a “related person” (as defined in Section 954(d)(3) of the Code), to the extent such items are properly allocable to income of such related person that is not passive income.
Under the income and asset tests, whether or not we are a PFIC will be determined annually based upon the composition of our income and the composition and valuation of our assets, all of which are subject to change. In analyzing whether we should be treated as a PFIC, we are relying on the amount and character of our projected revenues and the amount and character of our projected capital expenditures, the valuation of our assets, and our election to treat certain of our subsidiaries as disregarded entities for U.S. federal income tax purposes. If the amount and character of our actual revenues and capital expenditures do not match our projections, we may be a PFIC. In these calculations, we have valued our intangible assets based on our market capitalization, determined using the market price of our common shares. Such market price may fluctuate. If our market capitalization is less than anticipated or subsequently declines, this will decrease the value of our intangible assets and we may be a PFIC. Furthermore, we have made a number of assumptions regarding the value of our intangible assets. We believe our valuation approach is reasonable. However, it is possible that the IRS could challenge the valuation of our intangible assets, which may result in our being a PFIC.
98
We do not believe that we were a PFIC for our prior taxable year and we intend to conduct our business so that we should not be treated as a PFIC for our current taxable year or any future taxable year. However, because the PFIC determination is highly fact intensive and made at the end of each taxable year, it is possible that we may be a PFIC for the current or any future taxable year or that the IRS may challenge our determination concerning our PFIC status.
Default PFIC Rules under Section 1291 of the Code. If we are a PFIC, the U.S. federal income tax consequences to a U.S. Holder of an investment in common shares will depend on whether such U.S. Holder is permitted to make and makes (i) an election to treat us as a qualified electing fund (“QEF”) under Section 1295 of the Code (a “QEF Election”) or (ii) a mark-to-market election under Section 1296 of the Code (a “Mark-to-Market Election”). A U.S. Holder owning common shares while we were or are a PFIC that has not made either a QEF Election or a Mark-to-Market Election will be referred to in this summary as a “Non-Electing U.S. Holder.”
If you are a Non-Electing U.S. Holder, you will be subject to the default tax rules of Section 1291 of the Code with respect to:
| • | any “excess distribution” paid on common shares, which means the excess (if any) of the total distributions received by you during the current taxable year over 125% of the average distributions received by you during the three preceding taxable years (or during the portion of your holding period for the common shares prior to the current taxable year, if shorter); and |
| • | any gain recognized on the sale or other taxable disposition (including a pledge) of common shares. |
Under these default tax rules:
| • | any excess distribution or gain will be allocated ratably over your holding period for the common shares; |
| • | the amount allocated to the current taxable year and any period prior to the first day of the first taxable year in which we were a PFIC will be treated as ordinary income in the current year; |
| • | the amount allocated to each of the other years will be treated as ordinary income and taxed at the highest applicable tax rate in effect for that year; and |
| • | the resulting tax liability from any such prior years will be subject to the interest charge applicable to underpayments of tax. |
In addition, notwithstanding any election you may make, dividends that you receive from us will not be eligible for the preferential tax rates applicable to QDI (as discussed above in “—Distributions on Common Shares”) if we are a PFIC either in the taxable year of the distribution or the preceding taxable year, but will instead be taxable at rates applicable to ordinary income.
Special rules for Non-Electing U.S. Holders will apply to determine U.S. foreign tax credits with respect to foreign taxes imposed on distributions on common shares.
If we are a PFIC for any taxable year during which you hold common shares, we will continue to be treated as a PFIC with respect to you for all succeeding years during which you hold common shares, regardless of whether we actually continue to be a PFIC.
QEF Election. We currently do not intend to prepare or provide you with certain tax information that would permit you to make a QEF Election to avoid the adverse tax consequences associated with owning PFIC stock.
Mark-to-Market Election. U.S. Holders may make a Mark-to-Market Election, but only if the common shares are marketable stock. The common shares will be “marketable stock” as long as they remain listed on the NYSE and are regularly traded. Shares are “regularly traded” for any calendar year during which it is traded (other than in de minimis quantities) on at least fifteen days during each calendar quarter. There can be no assurances, however, that our common shares will be treated, or continue to be treated, as regularly traded.
99
If you make a Mark-to-Market Election, you generally will not be subject to the default rules of Section 1291 of the Code discussed above. Rather, you will be required to recognize ordinary income for any increase in the fair market value of the common shares for each taxable year that we are a PFIC. You will also be allowed to deduct as an ordinary loss any decrease in the fair market value to the extent of net marked-to-market gain previously included in prior years. Your adjusted tax basis in the common shares will be adjusted to reflect the amount included or deducted.
The Mark-to-Market Election will be effective for the taxable year for which the election is made and all subsequent taxable years, unless the common shares cease to be marketable stock or the IRS consents to the revocation of the election. You should consult your own tax advisor regarding the availability of, and procedure for making, a Mark-to-Market Election.
Since the PFIC rules are complex, you should consult your own tax advisor regarding them and how they may affect the U.S. federal income tax consequences of an investment in common shares.
Medicare Tax
Certain U.S. persons, including individuals, estates and trusts, may be required to pay an additional 3.8% on, among other things, dividends and capital gains from the sale or disposition of Common Shares. For individuals, the additional Medicare tax applies to the lesser of (i) “net investment income” or (ii) the excess of “modified adjusted gross income” over $200,000 ($250,000 if married and filing jointly or $125,000 if married and filing separately). “Net investment income” generally equals the taxpayer’s gross investment income reduced by the deductions that are allocable to such income. U.S. Holders likely will not be able to credit foreign taxes against the 3.8% Medicare tax. You should consult your tax advisors regarding the implications of the additional Medicare tax resulting from your ownership and disposition of our common shares.
Information Reporting and Backup Withholding
Information reporting requirements will apply to distributions on common shares or proceeds from the disposition of common shares paid within the U.S. (and, in certain cases, outside the U.S.) to a U.S. Holder unless such U.S. Holder is an exempt recipient, such as a corporation. Furthermore, backup withholding (currently at 28%) may apply to such amounts unless such U.S. Holder (i) is an exempt recipient that, if required, establishes its right to an exemption, or (ii) provides its taxpayer identification number, certifies that it is not currently subject to backup withholding, and complies with other applicable requirements. A U.S. Holder may avoid backup withholding if it furnishes a properly completed IRS Form W-9 and is able to make the required certifications.
Backup withholding is not an additional tax. Rather, amounts withheld under the backup withholding rules may be credited against your U.S. federal income tax liability. Furthermore, you may obtain a refund of any excess amounts withheld by filing an appropriate claim for refund with the IRS and furnishing any required information in a timely manner.
Information Reporting Regarding PFICs and Specified Foreign Financial Assets
If we are a PFIC, all U.S. Holders may be required to file annual tax returns (including on Form 8621) containing such information as the U.S. Treasury requires.
U.S. Holders who are individuals will be subject to reporting obligations with respect to their common shares if they do not hold their common shares in an account maintained by a financial institution and the aggregate value of their common shares and certain other “specified foreign financial assets” exceeds $50,000. Significant penalties can apply if a U.S. Holder is required to disclose its common shares under these rules and fails to do so.
In the event a U.S. Holder does not file the information reports described above relating to ownership of a PFIC or disclosure of specified foreign financial assets, the statute of limitations on the assessment and collection of U.S. federal income taxes of such U.S. holder for the related tax year will not close before such report is filed.
100
If you are a U.S. Holder, you are urged to consult with your own tax advisor regarding the application of the PFIC and specified foreign financial assets information reporting requirements and related statute of limitations tolling provisions with respect to our common shares.
Taxation of Non-U.S. Holders
Distributions on Common Shares
Subject to the discussion in “—Information Reporting and Backup Withholding” below, as a Non-U.S. Holder, you generally will not be subject to U.S. federal income tax, including withholding tax, on distributions received on common shares, unless the distributions are effectively connected with a trade or business that you conduct in the U.S. and (if an applicable income tax treaty so requires) attributable to a permanent establishment that you maintain in the U.S.
If distributions are effectively connected with a U.S. trade or business and (if applicable) attributable to a U.S. permanent establishment, you will be subject to tax on such distributions in the same manner as a U.S. Holder, as described in “Taxation of U.S. Holders – Distributions on Common Shares” above. In addition, any such distributions received by a corporate Non-U.S. Holder may also, under certain circumstances, be subject to an additional “branch profits tax” at a 30% rate or such lower rate as may be specified by an applicable income tax treaty.
Dispositions of Common Shares
Subject to the discussion in “—Information Reporting and Backup Withholding” below, as a Non-U.S. Holder, you generally will not be subject to U.S. federal income tax, including withholding tax, on any gain recognized on a sale or other taxable disposition of common shares, unless (i) the gain is effectively connected with a trade or business that you conduct in the U.S. and (if an applicable income tax treaty so requires) attributable to a permanent establishment that you maintain in the U.S., or (ii) you are an individual and are present in the U.S. for at least 183 days in the taxable year of the disposition, and certain other conditions are met.
If you meet the test in clause (i) above, you generally will be subject to tax on any gain that is effectively connected with your conduct of a trade or business in the U.S. in the same manner as a U.S. Holder, as described in “Taxation of U.S. Holders – Dispositions of Common Shares” above. Effectively connected gain realized by a corporate Non-U.S. Holder may also, under certain circumstances, be subject to an additional “branch profits tax” at a 30% rate or such lower rate as may be specified by an applicable income tax treaty.
If you meet the test in clause (ii) above, you generally will be subject to tax at a 30% rate on the amount by which your U.S. source capital gain exceeds your U.S. source capital loss during the taxable year.
Information Reporting and Backup Withholding
Payments to Non-U.S. Holders of distributions on, or proceeds from the disposition of, common shares are generally exempt from information reporting and backup withholding. However, a Non-U.S. Holder may be required to establish that exemption by providing certification of non-U.S. status on an appropriate IRS Form W-8.
Backup withholding is not an additional tax. Rather, amounts withheld under the backup withholding rules may be credited against your U.S. federal income tax liability. Furthermore, you may obtain a refund of any excess amounts withheld by filing an appropriate claim for refund with the IRS and furnishing any required information in a timely manner.
| F. | Dividends and Paying Agents |
Not applicable.
101
| G. | Statement by Experts |
Not applicable.
| H. | Documents on Display |
Whenever a reference is made in this Annual Report on Form 20-F to any contract, agreement or other document, the reference may not be complete and you should refer to the copy of that contract, agreement or other document filed as an exhibit to one of our previous SEC filings. You can read our SEC filings over the Internet at the SEC’s website at http://www.sec.gov. You may also read and copy any document we file with the SEC at its public reference facilities at 100 F Street N.E., Washington, D.C. 20549. You may also obtain copies of these documents at prescribed rates by writing to the Public Reference Section of the SEC at 100 F Street N.E., Washington, D.C. 20549. Please call the SEC at 1-800-SEC-0330 for further information on the operation of the public reference facilities. Copies of reports and other information may also be inspected in the offices of the NYSE, 20 Broad Street, New York, New York 10005.
| I. | Subsidiary Information |
Not applicable.
| ITEM 11. | QUANTITATIVE AND QUALITATIVE DISCLOSURES ABOUT MARKET RISK |
Market risk represents the risk of changes in value of a financial instrument, derivative or non-derivative, caused by fluctuations in foreign exchange rates and interest rates. Changes in these factors could cause fluctuations in our results of operations and cash flows. We are exposed to the market risks described below.
Foreign Exchange Rate Risk. Although we have significant foreign-based operations, the U.S. dollar is our primary operating currency. Thus, substantially all of our revenue and the majority of our expenses in 2017, 2016 and 2015 were denominated in U.S. dollars. During 2017, 2016 and 2015, 25%, 36% and 27%, respectively, of our direct container expenses were paid in up to 20 different foreign currencies, respectively. We do not hedge these container expenses as there are no significant payments made in any one foreign currency. Foreign exchange fluctuations did not materially impact our financial results in those periods.
Interest Rate Risk. We have entered into various interest rate swap, collar and cap agreements to mitigate our exposure associated with our variable rate debt. The swap agreements involve payments by us to counterparties at fixed rates in return for receipts based upon variable rates indexed to the London Inter Bank Offered Rate (“LIBOR”). The differentials between the fixed and variable rate payments under these agreements are recognized in realized losses on interest rate swaps, collars and caps, net in the consolidated statement of income.
As of December 31, 2017, 2016 and 2015, none of the derivative instruments we have entered into qualify for hedge accounting. The fair value of the derivative instruments is measured at each of these balance sheet dates and the change in fair value is recorded in the consolidated statements of comprehensive income as unrealized gains (losses) on interest rate swaps and caps, net.
We utilize a fair value hierarchy that prioritizes the inputs to valuation techniques used to measure fair value into three broad levels. This hierarchy prioritizes the inputs into three broad levels as follows: Level 1 inputs which are observable inputs such as quoted prices (unadjusted) in active markets for identical assets or liabilities; Level 2 inputs which are inputs other than quoted prices that are observable for the asset or liability, either directly or indirectly, which include quoted prices for similar assets or liabilities in active markets and quoted prices for identical or similar assets or liabilities in markets that are not active; and Level 3 inputs which are unobservable inputs that reflect the reporting entity’s own assumptions.
102
We use the exchange price notion, which is the price in an orderly transaction between market participants to sell an asset or transfer a liability in the market in which the reporting entity would transact for the asset or liability, that is, the principal or most advantageous market for the asset or liability. The transaction to sell the asset or transfer the liability is a hypothetical transaction at the measurement date, considered from the perspective of a market participant that holds the asset or owes the liability. Therefore, the definition focuses on the price that would be received to sell the asset or paid to transfer the liability (an exit price), not the price that would be paid to acquire the asset or received to assume the liability (an entry price).
Our liability valuation reflects our credit standing and the credit standing of the counterparties to the interest rate swaps and caps. The valuation technique we utilized to calculate the fair value of the interest rate swaps, collars and caps was the income approach. This approach represents the present value of future cash flows based upon current market expectations. Fair value of the interest rate swap agreements changed from a liability to an asset during 2016 primarily reflects an increase in long-term interest rates.
The notional amount of the interest rate swap agreements was $1,067,530 as of December 31, 2017, with expiration dates between January 2018 and July 2023. We receive fixed rates between 0.60% and 1.98% under the interest rate swap agreements. The net fair value asset of these agreements was $7,580, and $3,862 as of December 31, 2017 and 2016, respectively.
The notional amount of the interest rate collar agreements was $78,713 as of December 31, 2017, with expiration dates between April 2019 and June 2023. The net fair value of these agreements was an asset $126 and a liability $250 as of December 31, 2017 and 2016, respectively
The notional amount of the interest rate cap agreements was $138,000 as of December 31, 2017, with expiration dates between May 2018 and December 2019.
Based on the average debt balances and derivative instruments for the year ended December 31, 2017, it is estimated that a 1% increase in interest rates would result in a net increase of 10,365 in interest expense and realized losses on interest rate swaps, collars and caps, net. It would also result in a decrease in the fair value of interest rate swaps, collars and caps, net of $12,843.
Quantitative and Qualitative Disclosures About Credit Risk
We maintain detailed credit records about our container lessees. Our credit policy sets different maximum exposure limits for our container lessees. Credit criteria may include, but are not limited to, container lessee trade route, country, social and political climate, assessments of net worth, asset ownership, bank and trade credit references, credit bureau reports, including those from Dynamar B.V. or “Dynamar,” and Lloyd’s Marine Intelligence Unit (common credit reporting agencies used in the maritime sector), operational history and financial strength. We monitor our container lessees’ performance and our lease exposures on an ongoing basis, and our credit management processes are aided by the long payment experience we have with most of our container lessees and our broad network of long-standing relationships in the shipping industry that provide current information about our container lessees. In managing this risk, we also make an allowance for doubtful accounts. The allowance for doubtful accounts is developed based on two key components:
| • | specific reserves for receivables which are impaired for which management believes full collection is doubtful; and |
| • | reserves for estimated losses inherent in the receivables based upon historical trends. |
103
As of December 31, 2017, approximately 94.4% of accounts receivable for our total fleet and 98.0% of the finance lease receivables were from container lessees and customers outside of the U.S. Customers in Switzerland, France, the PRC (including Hong Kong), Taiwan and Singapore accounted for approximately 15.1%, 14.4%, 14.4%, 13.9% and 10.9%, respectively, of our total fleet container leasing revenue for 2017. Customers in no other country accounted for greater than 10.0% of our total fleet container leasing revenue for the same period. Total fleet container leasing revenue differs from our reported container rental revenue in that total fleet container leasing revenue comprises revenue earned from leases on containers in our total fleet, including revenue earned by our investors from leases on containers in our managed fleet, while our reported container revenue only comprises container leasing revenue associated with our owned fleet. We derive revenue with respect to container leasing revenue associated with our managed fleet from management fees based upon the operating performance of the managed containers.
Lease billings from our 20 largest container lessees represented $425,552, or 80.0% of our total owned and managed fleet container lease billings for 2017, with lease billings from our single largest container lessee accounting for $80,210, or 15.1% and another container lessee accounting for $76,612, or 14.4% of our owned and managed fleet container lease billings during such period. We had no other container lessees accounting for over 10% of our owned and managed fleet container lease billings in 2017.
An allowance for doubtful accounts of $5,775 has been established against receivables as of December 31, 2017 for our owned fleet. During 2017, receivable write-offs from the allowance for doubtful accounts, net of recoveries, totaled $26,546 for our owned fleet.
| ITEM 12. | DESCRIPTION OF SECURITIES OTHER THAN EQUITY SECURITIES |
Not applicable.
104
PART II
| ITEM 13. | DEFAULTS, DIVIDEND ARREARAGES AND DELINQUENCIES |
None.
| ITEM 14. | MATERIAL MODIFICATIONS TO THE RIGHTS OF SECURITY HOLDERS AND USE OF PROCEEDS |
On October 15, 2007, we completed our initial public offering of our common shares at a price of $16.50 per share and listed our common shares on the New York Stock Exchange (“NYSE”) under the symbol “TGH.” We sold an aggregate of 9,000,000 of our common shares and generated proceeds of $138.0 million, after deducting underwriting discounts and other offering expenses. The managing underwriters of our initial public offering were Credit Suisse Securities (USA) LLC, Wachovia Capital Markets, LLC, Jefferies & Company, Inc., Piper Jaffray & Co. and Fortis Securities LLC. There have been no material modifications to the rights of our security holders and the use of proceeds from our initial public offering previously disclosed in our registration statement on Form F-1 (File No. 333-146304) filed by us in connection with our initial public offering.
On September 19, 2012, we completed an underwritten public offering of an aggregate of 8,625,000 of our common shares at a price of $31.50. We sold 6,125,000 new common shares, which were listed on the NYSE under the symbol “TGH” and Halco Holdings Inc. (“Halco”) sold 2,500,000 of its existing common shares. We received $184.8 million after deducting underwriting discounts and other offering expenses. The managing underwriters of our public offering were Merril Lynch, Pierce, Fenner & Smith Incorporated, Wells Fargo Securities, LLC and Credit Suisse Securities (USA) LLC. There have been no material modifications to the rights of our security holders and the use of proceeds from our public offering previously disclosed in our registration statement on Form F-3 (File No. 333-171410) and related prospectus supplements filed by us in connection with our public offering.
| ITEM 15. | CONTROLS AND PROCEDURES |
| A. | Disclosure Controls and Procedures |
Textainer’s Chief Executive Officer and Chief Financial Officer, after evaluating the effectiveness of our disclosure controls and procedures (as defined in Exchange Act Rule 13a-15(e)) as of December 31, 2016, have concluded that, as of such date, our disclosure controls and procedures were effective.
Disclosure controls are controls and procedures designed to reasonably assure that information required to be disclosed in our reports filed under the Exchange Act, such as this Annual Report on Form 20-F, is recorded, processed, summarized and reported within the time periods specified in the Securities and Exchange Commission’s rules and forms. Disclosure controls are also designed to reasonably assure that this information is accumulated and communicated to our management, including the Chief Executive Officer and the Chief Financial Officer, to allow timely decisions regarding required disclosure.
| B. | Management’s Annual Report on Internal Control Over Financial Reporting |
Textainer’s management, with oversight by the Board of Directors, is responsible for establishing and maintaining adequate internal control over financial reporting. Textainer’s internal control system was designed to provide reasonable assurance regarding the reliability of our financial reporting and the preparation and fair presentation of financial statements in accordance with generally accepted accounting principles in the United States.
Textainer’s management assessed the effectiveness of our internal control over financial reporting as of December 31, 2017. In making this assessment, management used the criteria established in Internal Control—Integrated Framework (2013) issued by the Committee of Sponsoring Organizations of the Treadway Commission. Based on this assessment, our management concluded that our internal control over financial reporting was effective as of December 31, 2017.
105
All internal control systems, no matter how well designed, have inherent limitations. Therefore, even those systems determined to be effective may not prevent or detect misstatements and can provide only reasonable assurance with respect to financial statement preparation and presentation. Also, projections of any evaluation of effectiveness to future periods are subject to the risk that controls may become inadequate because of changes in conditions, or that the degree of compliance with the policies or procedures may deteriorate.
| C. | Report of the Registered Public Accounting Firm |
Our internal controls over financial reporting as of December 31, 2017 have been audited by KPMG LLP, an independent registered public accounting firm, as stated in their report, which is included under Item 18, “Financial Statements” on page F-3 in this Annual Report on Form 20-F.
| ITEM 16. | [RESERVED] |
| ITEM 16A. | AUDIT COMMITTEE FINANCIAL EXPERT |
In accordance with New York Stock Exchange (“NYSE”) rules, we have an audit committee responsible for advising the board regarding the selection of independent auditors and evaluating our internal controls. As a foreign private issuer, we are not required to comply with NYSE requirements that our audit committee has a minimum of three members and that all of our audit committee members satisfy the NYSE’s requirements for independence. Our audit committee has three members, Messrs. Shwiel, Cottingham and McQueen. Messrs. Shwiel and Cottingham are voting members of the audit committee and are independent as that term is defined in Rule 10A-3 under the Exchange Act. The board affirmatively determined that Messrs. Shwiel and Cottingham are audit committee financial experts. Mr. Shwiel is also the chairman of our board of directors. Mr. McQueen is a director of Trencor and has no voting rights. Our board of directors has adopted an audit committee charter effective October 9, 2007.
| ITEM 16B. | CODE OF ETHICS |
We have adopted the Textainer Group Holdings Limited Code of Business Conduct and Ethics (the “Code of Business Conduct and Ethics”), which covers members of our board of directors and all of our employees (including our principal executive officer, principal financial officer, principal accounting officer or controller, and persons performing similar functions).
The Code of Business Conduct and Ethics addresses, among other things, the following items:
| • | honest and ethical conduct, including the ethical handling of actual or apparent conflicts of interest between personal and professional relationships; |
| • | full, fair, accurate, timely and understandable disclosure in reports and documents that we file with, or submit to, the Securities and Exchange Commission and in other public communications made by us; |
| • | compliance with applicable governmental laws, rules and regulations; |
| • | the prompt internal reporting of violations of the code to an appropriate person or persons identified in the code; and |
| • | accountability for adherence to the code. |
During 2017, no waivers or amendments were made to the Code of Business Conduct and Ethics for any of our directors or executive officers. We have posted the text of the Code of Business Conduct and Ethics on our website at www.textainer.com.
106
| ITEM 16C. | PRINCIPAL ACCOUNTANT FEES AND SERVICES |
Our audit committee pre-approves all services provided by our principal accountants, KPMG LLP. All of the services and fees described below were reviewed and pre-approved by our audit committee. Our audit committee has delegated to the chairman of the audit committee certain limited authority to grant pre-approvals. These decisions to pre-approve a service must be presented to the full audit committee at its next scheduled meeting.
The following is a summary of the fees billed to us by our principal accountants for professional services rendered during 2017 and 2016:
| Fee Category |
2017 Fees |
2016 Fees |
||||||
| Audit Fees |
$ | 1,766 | $ | 1,531 | ||||
| Audit-Related Fees |
195 | 20 | ||||||
| Tax Fees |
22 | 15 | ||||||
|
|
|
|
|
|||||
| Total Fees |
$ | 1,983 | $ | 1,566 | ||||
|
|
|
|
|
|||||
Audit Fees— Consists of fees billed for professional services rendered for the audit of our financial statements and services that are normally provided by our principal accountants in connection with statutory and regulatory filings or engagements.
Audit-Related Fees—Consists of fees for attestation related services other than those described above as Audit fees. Fees of $20 billed in both 2017 and 2016 relate to the performance of agreed upon procedures on certain specific lender requirements.
Tax Fees— Consists of fees billed for professional services for tax compliance, tax advice and tax planning.
| ITEM 16D. | EXEMPTIONS FROM THE LISTING STANDARDS FOR AUDIT COMMITTEES |
We rely on the exemption afforded by Rule 10A-3(b)(1)(iv)(D) under the Exchange Act. One of the three members of our audit committee (Mr. McQueen) is a director of Trencor. Mr. McQueen is neither a voting member nor chairperson of our audit committee nor one of our executive officers. We believe that such reliance does not materially adversely affect the ability of the audit committee to act independently or to satisfy the other requirements of Rule 10A-3.
| ITEM 16E. | PURCHASES OF EQUITY SECURITIES BY THE ISSUER AND AFFILIATED PURCHASERS |
None.
| ITEM 16F. | CHANGE IN REGISTRANT’S CERTIFYING ACCOUNTANT |
None.
107
| ITEM 16G. | CORPORATE GOVERNANCE |
Our corporate governance practices are in compliance with, and are not prohibited by, the laws of Bermuda. Therefore, we are exempt from many of the New York Stock Exchange’s (“NYSE”) corporate governance practices, other than the establishment of a formal audit committee satisfying the requirements of Rule 10A-3 under the Exchange Act and notification of non-compliance with NYSE listing requirements pursuant to Rule 10A-3 promulgated under the Exchange Act. The practices that we follow in lieu of the NYSE’s corporate governance rules are described below.
| • | We do not, and are not required under Bermuda law to, maintain a board of directors with a majority of independent directors. Currently, a majority of our directors are not independent, as that term is defined by the NYSE. |
| • | We are not required by Bermuda law to hold regular meetings of the board of directors at which only independent directors are present. |
| • | Mr. Shwiel serves as the Chairman of our board of directors and he has been determined to be independent under applicable NYSE rules. If the Chairman of our board of directors is not an independent director, our Corporate Governance Guidelines provide that a lead independent director who is an independent director as defined by applicable NYSE rules will be appointed and annually elected by the independent directors of the board. The lead independent director will be responsible for coordinating the activities of the independent directors and shall perform such other duties and responsibilities as the board may determine. In addition to the duties of all board members, the specific responsibilities of the lead independent director are as follows: |
| • | Act as the principal liaison between the independent directors of the board and the chairman of the board; |
| • | Develop the agenda for and preside at executive sessions of the board’s independent directors when needed; |
| • | If requested by the chairman, approve with the chairman of the board the agenda for board and board committee meetings and the need for special meetings of the board, and service as deputy board chairman; |
| • | Advise the chairman of the board as to the quality, quantity and timeliness of the information submitted by the Company’s management that is necessary or appropriate for the independent directors to effectively and responsibly perform their duties; |
| • | Recommend to the board the retention of advisors and consultants who report directly to the board; |
| • | Assist the board and Company officers in better ensuring compliance with and implementation of the Corporate Governance Guidelines; |
| • | Serve as chairman of the board when the chairman is not present; and |
| • | Serve as a liaison for consultation and communication with shareholders. |
| • | Under Bermuda law, compensation of executive officers need not be determined by an independent committee. We have established a compensation committee that reviews and approves the compensation and benefits for our executive officers and other key executives, makes recommendations to the board regarding compensation matters and is responsible for awarding compensation to our executive officers and other employees under our share compensation plans. The committee also has the discretion to interpret and amend the terms of, and take all other actions necessary to administer, the 2007 Share Incentive Plan. However, our compensation committee is not comprised solely of independent directors, as required by NYSE standards. The members of our compensation committee are Messrs. Cottingham, Maccarone, Nurek and Shwiel. Mr. Nurek is a director of Trencor. Messrs. Cottingham, Maccarone and Shwiel satisfy the NYSE’s standards for director independence. Our board of directors has also adopted a compensation committee charter. |
108
| • | We have established an audit committee responsible for (i) advising the board regarding the selection of independent auditors, (ii) overseeing the Company’s accounting and financial reporting processes, (iii) evaluating our internal controls, and (iv) overseeing compliance with policies and legal requirements with respect to financial reporting. Our audit committee need not comply with the NYSE’s requirements that the audit committee have a minimum of three members or the NYSE’s standards of independence for domestic issuers. Our audit committee has three members, Messrs. Cottingham, McQueen and Shwiel. Messrs. Cottingham and Shwiel are voting members of the committee and are independent as that term is defined in Rule 10A-3 under the Exchange Act. Mr. McQueen is a director of Trencor and has no voting rights on the audit committee. Our board of directors has also adopted an audit committee charter. |
| • | We have established a nominating and governance committee, although this committee is not comprised solely of independent directors, as would be required of a domestic issuer. Our nominating and governance committee has four members, Messrs. Cottingham, Maccarone, Nurek and Shwiel. Messrs. Cottingham, Maccarone and Shwiel satisfy the NYSE’s standards for director independence. Our board of directors has also adopted a nominating and governance committee charter. |
| • | Under Bermuda law, we are not required to obtain shareholder consent prior to issuing securities or adopting share compensation plans. Nonetheless, we sought and received the approval of our shareholders for our 2007 Share Incentive Plan on September 4, 2007 and on May 21, 2015 we received shareholder approval for the amendment and restatement of our 2007 Share Incentive Plan as the 2015 Share Incentive Plan. We are also required under Bermuda law to obtain the consent of the Bermuda Monetary Authority for the issuance of securities in certain circumstances. |
| • | Under Bermuda law, we are not required to adopt corporate governance guidelines or a code of business conduct. Nonetheless, we have adopted both corporate governance guidelines and a code of business conduct. |
| • | As a foreign private issuer, we are not required to solicit proxies or provide proxy statements to the NYSE. However, we have provided a proxy statement to the NYSE and expect to continue to do so in the future. |
109
PART III
| ITEM 17. | FINANCIAL STATEMENTS |
We have responded to Item 18 “Financial Statements.”
| ITEM 18. | FINANCIAL STATEMENTS |
Reference is made to pages F-1 through F-47 and is incorporated herein by reference.
| Page | ||||
| Audited Consolidated Financial Statements |
||||
| Reports of Independent Registered Public Accounting Firm |
F-2 | |||
| Consolidated Statements of Comprehensive Income (Loss) for the Years Ended December 31, 2017, 2016 and 2015 |
F-5 | |||
| Consolidated Balance Sheets as of December 31, 2017 and 2016 |
F-6 | |||
| Consolidated Statements of Shareholders’ Equity for the Years Ended December 31, 2017, 2016 and 2015 |
F-7 | |||
| Consolidated Statements of Cash Flows for the Years Ended December 31, 2017, 2016 and 2015 |
F-8 | |||
| Notes to Consolidated Financial Statements |
F-9 | |||
| Financial Statement Schedules |
||||
| Schedule I – Parent Company Information |
F-46 | |||
| Schedule II – Valuation Accounts |
F-49 | |||
| ITEM 19. | EXHIBITS |
The exhibits filed as part of this Annual Report on Form 20-F are listed in the Exhibit Index.
110
TEXTAINER GROUP HOLDINGS LIMITED AND SUBSIDIARIES
INDEX TO FINANCIAL STATEMENTS
| Page | ||||
| Audited Consolidated Financial Statements |
||||
| Reports of Independent Registered Public Accounting Firm |
F-2 | |||
| Consolidated Statements of Comprehensive Income (Loss) for the Years Ended December 31, 2017, 2016 and 2015 |
F-5 | |||
| Consolidated Balance Sheets as of December 31, 2017 and 2016 |
F-6 | |||
| Consolidated Statements of Shareholders’ Equity for the Years Ended December 31, 2017, 2016 and 2015 |
F-7 | |||
| Consolidated Statements of Cash Flows for the Years Ended December 31, 2017, 2016 and 2015 |
F-8 | |||
| Notes to Consolidated Financial Statements |
F-9 | |||
| Financial Statement Schedules |
||||
| Schedule I – Parent Company Information |
F-46 | |||
| Schedule II – Valuation Accounts |
F-49 | |||
F-1
Report of Independent Registered Public Accounting Firm
To the Shareholders and Board of Directors
Textainer Group Holdings Limited:
Opinion on the Consolidated Financial Statements
We have audited the accompanying consolidated balance sheets of Textainer Group Holdings Limited and subsidiaries (the Company) as of December 31, 2017 and 2016, the related consolidated statements of comprehensive income (loss), shareholders’ equity, and cash flows for each of the years in the three-year period ended December 31, 2017, and the related notes and financial statement schedules I to II (collectively, the “consolidated financial statements”). In our opinion, the consolidated financial statements present fairly, in all material respects, the financial position of the Company as of December 31, 2017 and 2016, and the results of its operations and its cash flows for each of the years in the three-year period ended December 31, 2017, in conformity with U.S. generally accepted accounting principles.
We also have audited, in accordance with the standards of the Public Company Accounting Oversight Board (United States) (PCAOB), the Company’s internal control over financial reporting as of December 31, 2017, based on criteria established in Internal Control – Integrated Framework (2013) issued by the Committee of Sponsoring Organizations of the Treadway Commission, and our report dated March 14, 2018 expressed an unqualified opinion on the effectiveness of the Company’s internal control over financial reporting.
Basis for Opinion
These consolidated financial statements are the responsibility of the Company’s management. Our responsibility is to express an opinion on these consolidated financial statements based on our audits. We are a public accounting firm registered with the PCAOB and are required to be independent with respect to the Company in accordance with the U.S. federal securities laws and the applicable rules and regulations of the Securities and Exchange Commission and the PCAOB.
We conducted our audits in accordance with the standards of the PCAOB. Those standards require that we plan and perform the audit to obtain reasonable assurance about whether the consolidated financial statements are free of material misstatement, whether due to error or fraud. Our audits included performing procedures to assess the risks of material misstatement of the consolidated financial statements, whether due to error or fraud, and performing procedures that respond to those risks. Such procedures included examining, on a test basis, evidence regarding the amounts and disclosures in the consolidated financial statements. Our audits also included evaluating the accounting principles used and significant estimates made by management, as well as evaluating the overall presentation of the consolidated financial statements. We believe that our audits provide a reasonable basis for our opinion.
/s/ KPMG LLP
We have served as the Company’s auditor since 1987.
San Francisco, California
March 14, 2018
F-2
Report of Independent Registered Public Accounting Firm
To the Shareholders and Board of Directors
Textainer Group Holdings Limited:
Opinion on Internal Control Over Financial Reporting
We have audited Textainer Group Holdings Limited and subsidiaries’ (the Company) internal control over financial reporting as of December 31, 2017, based on criteria established in Internal Control – Integrated Framework (2013) issued by the Committee of Sponsoring Organizations of the Treadway Commission. In our opinion, the Company maintained, in all material respects, effective internal control over financial reporting as of December 31, 2017, based on criteria established in Internal Control – Integrated Framework (2013) issued by the Committee of Sponsoring Organizations of the Treadway Commission.
We also have audited, in accordance with the standards of the Public Company Accounting Oversight Board (United States) (PCAOB), the consolidated balance sheets of the Company as of December 31, 2017 and 2016, the related consolidated statements of comprehensive income (loss), shareholders’ equity, and cash flows for each of the years in the three-year period ended December 31, 2017, and the related notes and financial statement schedules I to II (collectively, the “consolidated financial statements”), and our report dated March 14, 2018 expressed an unqualified opinion on those consolidated financial statements.
Basis for Opinion
The Company’s management is responsible for maintaining effective internal control over financial reporting and for its assessment of the effectiveness of internal control over financial reporting, included in the accompanying Management’s Annual Report on Internal Control Over Financial Reporting. Our responsibility is to express an opinion on the Company’s internal control over financial reporting based on our audit. We are a public accounting firm registered with the PCAOB and are required to be independent with respect to the Company in accordance with the U.S. federal securities laws and the applicable rules and regulations of the Securities and Exchange Commission and the PCAOB.
We conducted our audit in accordance with the standards of the PCAOB. Those standards require that we plan and perform the audit to obtain reasonable assurance about whether effective internal control over financial reporting was maintained in all material respects. Our audit of internal control over financial reporting included obtaining an understanding of internal control over financial reporting, assessing the risk that a material weakness exists, and testing and evaluating the design and operating effectiveness of internal control based on the assessed risk. Our audit also included performing such other procedures as we considered necessary in the circumstances. We believe that our audit provides a reasonable basis for our opinion.
Definition and Limitations of Internal Control Over Financial Reporting
A company’s internal control over financial reporting is a process designed to provide reasonable assurance regarding the reliability of financial reporting and the preparation of financial statements for external purposes in accordance with generally accepted accounting principles. A company’s internal control over financial reporting includes those policies and procedures that (1) pertain to the maintenance of records that, in reasonable detail, accurately and fairly reflect the transactions and dispositions of the assets of the company; (2) provide reasonable assurance that transactions are recorded as necessary to permit preparation of financial statements in accordance with generally accepted accounting principles, and that receipts and expenditures of the company are being made only in accordance with authorizations of management and directors of the company; and (3) provide reasonable assurance regarding prevention or timely detection of unauthorized acquisition, use, or disposition of the company’s assets that could have a material effect on the financial statements.
Because of its inherent limitations, internal control over financial reporting may not prevent or detect misstatements. Also, projections of any evaluation of effectiveness to future periods are subject to the risk that controls may become inadequate because of changes in conditions, or that the degree of compliance with the policies or procedures may deteriorate.
F-3
/s/ KPMG LLP
San Francisco, California
March 14, 2018
F-4
TEXTAINER GROUP HOLDINGS LIMITED AND SUBSIDIARIES
Consolidated Statements of Comprehensive Income (Loss)
Years ended December 31, 2017, 2016 and 2015
(All currency expressed in United States dollars in thousands, except per share amounts)
| 2017 | 2016 (1) | 2015 | ||||||||||
| Revenues: |
||||||||||||
| Lease rental income |
$ | 444,888 | $ | 460,427 | $ | 512,544 | ||||||
| Management fees |
14,994 | 13,420 | 15,610 | |||||||||
| Trading container sales proceeds |
4,758 | 15,628 | 12,670 | |||||||||
| Gain on sale of containers, net |
26,210 | 6,761 | 3,454 | |||||||||
|
|
|
|
|
|
|
|||||||
| Total revenues |
490,850 | 496,236 | 544,278 | |||||||||
|
|
|
|
|
|
|
|||||||
| Operating expenses: |
||||||||||||
| Direct container expense |
60,321 | 62,596 | 47,342 | |||||||||
| Cost of trading containers sold |
3,302 | 15,904 | 12,475 | |||||||||
| Depreciation expense |
231,043 | 236,144 | 191,930 | |||||||||
| Container impairment |
8,072 | 94,623 | 35,345 | |||||||||
| Amortization expense |
4,092 | 5,053 | 4,741 | |||||||||
| General and administrative expense |
30,697 | 26,311 | 27,645 | |||||||||
| Short-term incentive compensation expense |
3,481 | 2,242 | 913 | |||||||||
| Long-term incentive compensation expense |
5,499 | 5,987 | 7,040 | |||||||||
| Bad debt expense, net |
477 | 21,166 | 5,028 | |||||||||
|
|
|
|
|
|
|
|||||||
| Total operating expenses |
346,984 | 470,026 | 332,459 | |||||||||
|
|
|
|
|
|
|
|||||||
| Income from operations |
143,866 | 26,210 | 211,819 | |||||||||
|
|
|
|
|
|
|
|||||||
| Other (expense) income: |
||||||||||||
| Interest expense (2) |
(117,475 | ) | (85,215 | ) | (76,063 | ) | ||||||
| Write-off of unamortized deferred debt issuance costs and bond discounts (2) |
(7,550 | ) | — | (458 | ) | |||||||
| Interest income |
613 | 408 | 125 | |||||||||
| Realized losses on interest rate swaps, collars and caps, net |
(1,191 | ) | (8,928 | ) | (12,823 | ) | ||||||
| Unrealized gains (losses) on interest rate swaps, collars and caps, net |
4,094 | 6,210 | (1,947 | ) | ||||||||
| Other, net |
3 | (8 | ) | 26 | ||||||||
|
|
|
|
|
|
|
|||||||
| Net other expense |
(121,506 | ) | (87,533 | ) | (91,140 | ) | ||||||
|
|
|
|
|
|
|
|||||||
| Income (loss) before income tax and noncontrolling interests |
22,360 | (61,323 | ) | 120,679 | ||||||||
| Income tax (expense) benefit, net |
(1,618 | ) | 3,447 | (6,695 | ) | |||||||
|
|
|
|
|
|
|
|||||||
| Net income (loss) |
20,742 | (57,876 | ) | 113,984 | ||||||||
| Less: Net (income) loss attributable to the noncontrolling interests |
(1,377 | ) | 5,393 | (5,576 | ) | |||||||
|
|
|
|
|
|
|
|||||||
| Net income (loss) attributable to Textainer Group Holdings Limited common shareholders |
$ | 19,365 | $ | (52,483 | ) | $ | 108,408 | |||||
|
|
|
|
|
|
|
|||||||
| Net income (loss) attributable to Textainer Group Holdings Limited common shareholders per share: |
||||||||||||
| Basic |
$ | 0.34 | $ | (0.93 | ) | $ | 1.90 | |||||
| Diluted |
$ | 0.34 | $ | (0.93 | ) | $ | 1.90 | |||||
| Weighted average shares outstanding (in thousands): |
||||||||||||
| Basic |
56,845 | 56,608 | 56,953 | |||||||||
| Diluted |
57,159 | 56,608 | 57,093 | |||||||||
| Other comprehensive income (loss): |
||||||||||||
| Foreign currency translation adjustments |
207 | (233 | ) | (240 | ) | |||||||
|
|
|
|
|
|
|
|||||||
| Comprehensive income (loss) |
20,949 | (58,109 | ) | 113,744 | ||||||||
| Comprehensive (income) loss attributable to the noncontrolling interest |
(1,377 | ) | 5,393 | (5,576 | ) | |||||||
|
|
|
|
|
|
|
|||||||
| Comprehensive income (loss) attributable to Textainer Group Holdings Limited common shareholders |
$ | 19,572 | $ | (52,716 | ) | $ | 108,168 | |||||
|
|
|
|
|
|
|
|||||||
| (1) | Certain amounts for the year ended December 31, 2016 have been restated for immaterial corrections of identified errors pertaining to the calculation of gain on sale of containers, net and to properly account for lease concessions (see Note 2 “Immaterial Correction of Errors in Prior Periods”). |
| (2) | Amount for the years ended December 31, 2016 and 2015 has been restated to reclassify the write-off of unamortized deferred debt costs and bond discounts out of interest expense to conform with the 2017 presentation. |
See accompanying notes to consolidated financial statements.
F-5
TEXTAINER GROUP HOLDINGS LIMITED AND SUBSIDIARIES
Consolidated Balance Sheets
December 31, 2017 and 2016
(All currency expressed in United States dollars in thousands)
| 2017 | 2016 (1) | |||||||
| Assets | ||||||||
| Current assets: |
||||||||
| Cash and cash equivalents |
$ | 137,894 | $ | 84,045 | ||||
| Accounts receivable, net of allowance for doubtful accounts of $5,775 and $31,844 in 2017 and 2016, respectively |
78,312 | 76,547 | ||||||
| Net investment in direct financing and sales-type leases |
56,959 | 64,951 | ||||||
| Trading containers |
10,752 | 4,363 | ||||||
| Containers held for sale |
22,089 | 25,513 | ||||||
| Prepaid expenses and other current assets |
12,243 | 13,584 | ||||||
| Insurance receivable |
15,909 | 44,785 | ||||||
| Due from affiliates, net |
1,134 | 869 | ||||||
|
|
|
|
|
|||||
| Total current assets |
335,292 | 314,657 | ||||||
| Restricted cash |
99,675 | 58,078 | ||||||
| Containers, net of accumulated depreciation of $1,172,355 and $990,784 at 2017 and 2016, respectively |
3,791,610 | 3,717,542 | ||||||
| Net investment in direct financing and sales-type leases |
125,665 | 172,283 | ||||||
| Fixed assets, net of accumulated depreciation of $10,788 and $10,136 at 2017 and 2016, respectively |
2,151 | 1,993 | ||||||
| Intangible assets, net of accumulated amortization of $44,279 and $40,762 at 2017 and 2016, respectively |
11,105 | 15,197 | ||||||
| Interest rate swaps, collars and caps |
7,787 | 4,816 | ||||||
| Deferred taxes |
1,563 | 1,385 | ||||||
| Other assets |
5,494 | 8,075 | ||||||
|
|
|
|
|
|||||
| Total assets |
$ | 4,380,342 | $ | 4,294,026 | ||||
|
|
|
|
|
|||||
| Liabilities and Equity | ||||||||
| Current liabilities: |
||||||||
| Accounts payable |
$ | 6,867 | $ | 12,060 | ||||
| Accrued expenses |
13,365 | 9,721 | ||||||
| Container contracts payable |
131,087 | 11,990 | ||||||
| Other liabilities |
235 | 265 | ||||||
| Due to owners, net |
11,131 | 18,132 | ||||||
| Debt, net of unamortized deferred financing costs of $3,989 and $6,137 at 2017 and 2016, respectively |
233,681 | 205,081 | ||||||
|
|
|
|
|
|||||
| Total current liabilities |
396,366 | 257,249 | ||||||
| Debt, net of unamortized deferred financing costs of $20,045 and $10,267 at 2017 and 2016, respectively |
2,756,627 | 2,833,216 | ||||||
| Interest rate swaps, collars and caps |
81 | 1,204 | ||||||
| Income tax payable |
9,081 | 9,076 | ||||||
| Deferred taxes |
5,881 | 6,237 | ||||||
| Other liabilities |
2,024 | 2,259 | ||||||
|
|
|
|
|
|||||
| Total liabilities |
3,170,060 | 3,109,241 | ||||||
|
|
|
|
|
|||||
| Equity: |
||||||||
| Textainer Group Holdings Limited shareholders’ equity: |
||||||||
| Common shares, $0.01 par value. Authorized 140,000,000 shares; 57,727,220 shares issued and 57,097,220 shares outstanding at 2017; 57,417,119 shares issued and 56,787,119 shares outstanding at 2016 |
578 | 575 | ||||||
| Additional paid-in capital |
397,821 | 390,780 | ||||||
| Treasury shares, at cost, 630,000 shares |
(9,149 | ) | (9,149 | ) | ||||
| Accumulated other comprehensive income |
(309 | ) | (516 | ) | ||||
| Retained earnings |
763,601 | 744,236 | ||||||
|
|
|
|
|
|||||
| Total Textainer Group Holdings Limited shareholders’ equity |
1,152,542 | 1,125,926 | ||||||
| Noncontrolling interest |
57,740 | 58,859 | ||||||
|
|
|
|
|
|||||
| Total equity |
1,210,282 | 1,184,785 | ||||||
|
|
|
|
|
|||||
| Total liabilities and equity |
$ | 4,380,342 | $ | 4,294,026 | ||||
|
|
|
|
|
|||||
| (1) | Certain amounts as of December 31, 2016 have been restated for immaterial corrections of identified errors related to the calculation of gain on sale of containers, net, to properly account for lease concessions (see Note 2 “Immaterial Correction of Errors in Prior Periods”) and to reclassify debt balances to conform with the 2017 presentation. |
See accompanying notes to consolidated financial statements.
F-6
TEXTAINER GROUP HOLDINGS LIMITED AND SUBSIDIARIES
Consolidated Statements of Shareholders’ Equity
Years ended December 31, 2017, 2016 and 2015
(All currency expressed in United States dollars in thousands, except share amounts)
| Textainer Group Holdings Limited Shareholders’ Equity | ||||||||||||||||||||||||||||||||||||||||
| Common shares | Treasury shares | Additional paid-in |
Accumulated other comprehensive |
Retained | Total Textainer Group Holdings Limited |
Noncontrolling | Total | |||||||||||||||||||||||||||||||||
| Shares | Amount | Shares | Amount | capital | income (loss) | earnings | shareholders’ equity | interest | equity | |||||||||||||||||||||||||||||||
| Balances, December 31, 2014 |
56,863,094 | $ | 565 | — | $ | — | $ | 378,316 | $ | (43 | ) | $ | 811,144 | $ | 1,189,982 | $ | 59,820 | $ | 1,249,802 | |||||||||||||||||||||
| Dividends to shareholders ($1.65 per common share) |
— | — | — | — | — | — | (94,079 | ) | (94,079 | ) | — | (94,079 | ) | |||||||||||||||||||||||||||
| Dividends paid to noncontrolling interest |
— | — | — | — | — | — | — | — | (2,994 | ) | (2,994 | ) | ||||||||||||||||||||||||||||
| Purchase of treasury shares |
— | — | (630,000 | ) | (9,149 | ) | — | — | — | (9,149 | ) | — | (9,149 | ) | ||||||||||||||||||||||||||
| Restricted share units vested |
272,945 | 7 | — | — | (7 | ) | — | — | — | — | — | |||||||||||||||||||||||||||||
| Exercise of share options |
27,056 | — | — | — | 301 | — | — | 301 | — | 301 | ||||||||||||||||||||||||||||||
| Long-term incentive compensation expense |
— | — | — | — | 7,743 | — | — | 7,743 | — | 7,743 | ||||||||||||||||||||||||||||||
| Tax benefit from share options exercised and restricted share units vested |
— | — | — | — | (1,333 | ) | — | — | (1,333 | ) | — | (1,333 | ) | |||||||||||||||||||||||||||
| Capital contributions from noncontrolling interest |
— | — | — | — | — | — | — | — | 1,850 | 1,850 | ||||||||||||||||||||||||||||||
| Comprehensive income: |
||||||||||||||||||||||||||||||||||||||||
| Net income attributable to Textainer Group Holdings Limited common shareholders |
— | — | — | — | — | — | 108,408 | 108,408 | — | 108,408 | ||||||||||||||||||||||||||||||
| Net income attributable to noncontrolling interests |
— | — | — | — | — | — | — | — | 5,576 | 5,576 | ||||||||||||||||||||||||||||||
| Foreign currency translation adjustments |
— | — | — | — | — | (240 | ) | — | (240 | ) | — | (240 | ) | |||||||||||||||||||||||||||
|
|
|
|
|
|
|
|
|
|
|
|
|
|
|
|
|
|
|
|
|
|||||||||||||||||||||
| Total comprehensive income |
113,744 | |||||||||||||||||||||||||||||||||||||||
|
|
|
|||||||||||||||||||||||||||||||||||||||
| Balances, December 31, 2015 |
57,163,095 | 572 | (630,000 | ) | (9,149 | ) | 385,020 | (283 | ) | 825,473 | 1,201,633 | 64,252 | 1,265,885 | |||||||||||||||||||||||||||
|
|
|
|
|
|
|
|
|
|
|
|
|
|
|
|
|
|
|
|
|
|||||||||||||||||||||
| Dividends to shareholders ($0.51 per common share) |
— | — | — | — | — | — | (28,754 | ) | (28,754 | ) | — | (28,754 | ) | |||||||||||||||||||||||||||
| Restricted share units vested |
254,024 | 3 | — | — | (3 | ) | — | — | — | — | — | |||||||||||||||||||||||||||||
| Long-term incentive compensation expense |
— | — | — | — | 6,573 | — | — | 6,573 | — | 6,573 | ||||||||||||||||||||||||||||||
| Net tax benefit from share options exercised and restricted share units vested |
— | — | — | — | (810 | ) | — | — | (810 | ) | — | (810 | ) | |||||||||||||||||||||||||||
| Comprehensive loss: |
||||||||||||||||||||||||||||||||||||||||
| Net loss attributable to Textainer Group Holdings Limited common shareholders |
— | — | — | — | — | — | (52,483 | ) | (52,483 | ) | — | (52,483 | ) | |||||||||||||||||||||||||||
| Net loss attributable to noncontrolling interests |
— | — | — | — | — | — | — | — | (5,393 | ) | (5,393 | ) | ||||||||||||||||||||||||||||
| Foreign currency translation adjustments |
— | — | — | — | — | (233 | ) | — | (233 | ) | — | (233 | ) | |||||||||||||||||||||||||||
|
|
|
|
|
|
|
|
|
|
|
|
|
|
|
|
|
|
|
|
|
|||||||||||||||||||||
| Total comprehensive loss |
(58,109 | ) | ||||||||||||||||||||||||||||||||||||||
|
|
|
|||||||||||||||||||||||||||||||||||||||
| Balances, December 31, 2016 (1) |
57,417,119 | 575 | (630,000 | ) | (9,149 | ) | 390,780 | (516 | ) | 744,236 | 1,125,926 | 58,859 | 1,184,785 | |||||||||||||||||||||||||||
|
|
|
|
|
|
|
|
|
|
|
|
|
|
|
|
|
|
|
|
|
|||||||||||||||||||||
| Dividends paid to noncontrolling interest |
— | — | — | — | — | — | — | — | (2,496 | ) | (2,496 | ) | ||||||||||||||||||||||||||||
| Restricted share units vested |
244,633 | 2 | — | — | (2 | ) | — | — | — | — | — | |||||||||||||||||||||||||||||
| Exercise of share options |
65,468 | 1 | 960 | 961 | 961 | |||||||||||||||||||||||||||||||||||
| Long-term incentive compensation expense |
— | — | — | — | 6,083 | — | — | 6,083 | — | 6,083 | ||||||||||||||||||||||||||||||
| Comprehensive income: |
||||||||||||||||||||||||||||||||||||||||
| Net income attributable to Textainer Group Holdings Limited common shareholders |
— | — | — | — | — | — | 19,365 | 19,365 | — | 19,365 | ||||||||||||||||||||||||||||||
| Net income attributable to noncontrolling interests |
— | — | — | — | — | — | — | — | 1,377 | 1,377 | ||||||||||||||||||||||||||||||
| Foreign currency translation adjustments |
— | — | — | — | — | 207 | — | 207 | — | 207 | ||||||||||||||||||||||||||||||
|
|
|
|
|
|
|
|
|
|
|
|
|
|
|
|
|
|
|
|
|
|||||||||||||||||||||
| Total comprehensive income |
20,949 | |||||||||||||||||||||||||||||||||||||||
|
|
|
|||||||||||||||||||||||||||||||||||||||
| Balances, December 31, 2017 |
57,727,220 | $ | 578 | (630,000 | ) | $ | (9,149 | ) | $ | 397,821 | $ | (309 | ) | $ | 763,601 | $ | 1,152,542 | $ | 57,740 | $ | 1,210,282 | |||||||||||||||||||
|
|
|
|
|
|
|
|
|
|
|
|
|
|
|
|
|
|
|
|
|
|||||||||||||||||||||
| (1) | Certain amounts for the year ended 2016 have been restated for immaterial corrections of identified errors pertaining to the calculation of gain on sale of containers, net and to properly account for lease concessions (see Note 2 “Immaterial Correction of Errors in Prior Periods”). |
See accompanying notes to consolidated financial statements.
F-7
TEXTAINER GROUP HOLDINGS LIMITED AND SUBSIDIARIES
Consolidated Statements of Cash Flows
Years ended December 31, 2017, 2016 and 2015
(All currency expressed in United States dollars in thousands)
| 2017 | 2016 (1) | 2015 (1) | ||||||||||
| Cash flows from operating activities: |
||||||||||||
| Net income (loss) |
$ | 20,742 | $ | (57,876 | ) | $ | 113,984 | |||||
|
|
|
|
|
|
|
|||||||
| Adjustments to reconcile net income (loss) to net cash provided by operating activities: |
||||||||||||
| Depreciation expense |
231,043 | 236,144 | 191,930 | |||||||||
| Container impairment |
8,072 | 94,623 | 35,345 | |||||||||
| Bad debt expense, net |
477 | 21,166 | 5,028 | |||||||||
| Unrealized (gains) losses on interest rate swaps, collars and caps, net |
(4,094 | ) | (6,210 | ) | 1,947 | |||||||
| Amortization and write-off of unamortized deferred debt issuance costs and accretion of bond discount |
20,814 | 9,704 | 7,887 | |||||||||
| Amortization of intangible assets |
4,092 | 5,053 | 4,741 | |||||||||
| Gain on sale of containers, net |
(26,210 | ) | (6,761 | ) | (3,454 | ) | ||||||
| Share-based compensation expense |
6,083 | 6,573 | 7,743 | |||||||||
| Decrease (increase) in: |
||||||||||||
| Accounts receivable, net |
(6,672 | ) | (11,935 | ) | (1,532 | ) | ||||||
| Trading containers, net |
(6,389 | ) | 468 | 1,842 | ||||||||
| Prepaid expenses and other current assets |
1,463 | 1,902 | (3,873 | ) | ||||||||
| Insurance receivable |
8,670 | (20,072 | ) | (1,685 | ) | |||||||
| Due from affiliates, net |
(265 | ) | (354 | ) | (525 | ) | ||||||
| Other assets |
2,581 | (1,088 | ) | 5,754 | ||||||||
| Increase (decrease) in: |
||||||||||||
| Accounts payable |
(5,193 | ) | 1,583 | 4,825 | ||||||||
| Accrued expenses |
3,556 | 2,905 | (5,108 | ) | ||||||||
| Deferred revenue and other liabilities |
(265 | ) | (290 | ) | (318 | ) | ||||||
| Due to owners, net |
(7,001 | ) | 6,326 | 803 | ||||||||
| Long-term income tax payable |
5 | 398 | 982 | |||||||||
| Deferred taxes, net |
(534 | ) | (4,365 | ) | 5,642 | |||||||
|
|
|
|
|
|
|
|||||||
| Total adjustments |
230,233 | 335,770 | 257,974 | |||||||||
|
|
|
|
|
|
|
|||||||
| Net cash provided by operating activities |
250,975 | 277,894 | 371,958 | |||||||||
|
|
|
|
|
|
|
|||||||
| Cash flows from investing activities: |
||||||||||||
| Purchase of containers and fixed assets |
(300,125 | ) | (505,528 | ) | (533,306 | ) | ||||||
| Proceeds from sale of containers and fixed assets |
135,299 | 126,560 | 129,452 | |||||||||
| Receipt of payments on direct financing and sales-type leases, net of income earned |
66,846 | 90,343 | 98,227 | |||||||||
| Insurance proceeds received for unrecoverable containers |
12,616 | 8,195 | — | |||||||||
|
|
|
|
|
|
|
|||||||
| Net cash used in investing activities |
(85,364 | ) | (280,430 | ) | (305,627 | ) | ||||||
|
|
|
|
|
|
|
|||||||
| Cash flows from financing activities: |
||||||||||||
| Proceeds from debt |
1,729,580 | 582,500 | 566,177 | |||||||||
| Principal payments on debt |
(1,770,715 | ) | (551,586 | ) | (538,877 | ) | ||||||
| Purchase of treasury shares |
— | — | (9,149 | ) | ||||||||
| Debt issuance costs |
(27,702 | ) | (5,969 | ) | (5,853 | ) | ||||||
| Issuance of common shares upon exercise of share options |
961 | — | 301 | |||||||||
| Net tax benefit from share-based compensation awards |
— | (810 | ) | (1,333 | ) | |||||||
| Capital contributions from noncontrolling interest |
— | — | 1,850 | |||||||||
| Dividends paid to noncontrolling interests |
(2,496 | ) | — | (2,994 | ) | |||||||
| Dividends paid to shareholders |
— | (28,754 | ) | (94,079 | ) | |||||||
|
|
|
|
|
|
|
|||||||
| Net cash used in financing activities |
(70,372 | ) | (4,619 | ) | (83,957 | ) | ||||||
|
|
|
|
|
|
|
|||||||
| Effect of exchange rate changes |
207 | (233 | ) | (240 | ) | |||||||
|
|
|
|
|
|
|
|||||||
| Net increase (decrease) in cash, cash equivalents and restricted cash |
95,446 | (7,388 | ) | (17,866 | ) | |||||||
| Cash, cash equivalents and restricted cash, beginning of the year |
142,123 | 149,511 | 167,377 | |||||||||
|
|
|
|
|
|
|
|||||||
| Cash, cash equivalents and restricted cash, end of the year |
$ | 237,569 | $ | 142,123 | $ | 149,511 | ||||||
|
|
|
|
|
|
|
|||||||
| Supplemental disclosures of cash flow information: |
||||||||||||
| Cash paid during the year for: |
||||||||||||
| Interest expense and realized losses on interest rate swaps, collars and caps, net |
$ | 105,322 | $ | 83,881 | $ | 82,577 | ||||||
| Net income taxes paid |
$ | 925 | $ | 1,503 | $ | 941 | ||||||
| Supplemental disclosures of noncash investing activities: |
||||||||||||
| Increase (decrease) in accrued container purchases |
$ | 119,097 | $ | (29,366 | ) | $ | (21,967 | ) | ||||
| Containers placed in direct financing and sales-type leases |
$ | 9,378 | $ | 101,354 | $ | 77,294 | ||||||
| Decrease in insurance receivable due to a decrease in estimated unrecoverable containers |
$ | 7,546 | $ | — | $ | — | ||||||
| (1) | Certain amounts for the years ended December 31, 2016 and 2015 have been restated for immaterial corrections of identified errors related to the calculation of gain on sale of containers, net, to properly account for lease concessions (see Note 2 “Immaterial Correction of Errors in Prior Periods”), to reclassify debt balances in order to conform with the 2017 presentation and for the adoption of Accounting Standards Update No. 2016-15, Statement of Cash Flows (Topic230): Classification of Certain Cash Receipts and Cash Payments and Accounting Standards Update No. 2016-18, Statement of Cash Flows (Topic 230): Restricted Cash. |
See accompanying notes to consolidated financial statements.
F-8
TEXTAINER GROUP HOLDINGS LIMITED AND SUBSIDIARIES
Notes to Consolidated Financial Statements
December 31, 2017, 2016, and 2015
(All currency expressed in U.S. dollars in thousands, except per share amounts)
(1) Nature of Business and Summary of Significant Accounting Policies
| (a) | Nature of Operations |
Textainer Group Holdings Limited (“TGH”) is incorporated in Bermuda. TGH is the holding company of a group of corporations, Textainer Group Holdings Limited and subsidiaries (collectively, the “Company”), involved in the purchase, management, leasing and resale of a fleet of marine cargo containers. The Company manages and provides administrative support to the affiliated and unaffiliated owners (the “Owners”) of the containers and structures and manages container leasing investment programs.
The Company conducts its business activities in three main areas: Container Ownership, Container Management and Container Resale. These activities are described below (also see Note 13 “Segment Information”).
Container Ownership
The Company’s containers consist primarily of standard dry freight containers, but also include refrigerated and other special-purpose containers. These containers are financed through retained earnings; revolving credit facilities, secured debt facilities and a term loan provided by banks; bonds payable to investors; and a public offering of TGH’s common shares. Expenses related to lease rental income include direct container expenses, depreciation expense and interest expense.
Container Management
The Company manages, on a worldwide basis, a fleet of containers for and on behalf of the Owners.
All rental operations are conducted worldwide in the name of the Company who, as agent for the Owners, acquires and sells containers, enters into leasing agreements and depot service agreements, bills and collects lease rentals from the lessees, disburses funds to depots for container handling, and remits net amounts, less management fees and commissions, to the Owners. Revenues, customer accounts receivable, fixed assets, depreciation and other operating expenses, and vendor payables arising from direct container operations of the managed portion of the Owners’ fleet have been excluded from the Company’s financial statements.
Management fees are typically a percentage of net operating income of each Owner’s fleet and consist of fees earned by the Company for services related to the management of the containers, sales commissions and net acquisition fees earned on the acquisition of containers. Expenses related to the provision of management services include general and administrative expense, short-term and long-term incentive compensation expense and amortization expense.
Container Resale
The Company buys and subsequently resells used containers (trading containers) from third parties. Container sales revenue represents the proceeds on the sale of containers purchased for resale. Cost of containers sold represents the cost of equipment purchased for resale that were sold as well as the related selling costs. The Company earns sales commissions related to the sale of the containers that it manages.
F-9
| (b) | Principles of Consolidation and Variable Interest Entity |
The consolidated financial statements of the Company include TGH and all of its subsidiaries in which the Company has a controlling financial interest. All significant intercompany accounts and balances have been eliminated in consolidation.
The Company determines whether it has a controlling financial interest in an entity by evaluating whether the entity is a variable interest entity (“VIE”) or a voting interest entity (“VME”). If it is determined that the Company does not have a variable interest in the entity, no further analysis is required and the Company does not consolidate the entity.
On December 20, 2012, the Company’s wholly-owned subsidiary, Textainer Limited (“TL”), purchased 50.1% of the outstanding common shares of TAP Funding Ltd. (“TAP Funding”) (a Bermuda company) from TAP Ltd. (“TAP”). Both before and after this purchase, TAP Funding leases containers to lessees under operating, direct financing and sales-type leases. TAP is governed by members and management agreements and the Company’s wholly-owned subsidiary, Textainer Equipment Management Limited (“TEML”), manages all of TAP Funding’s containers, making day-to-day decisions regarding the marketing, servicing and design of TAP Funding’s leases. TL’s purchase of a majority ownership of TAP Funding’s common shares allowed the Company to increase the size of its owned fleet at an attractive price. Under TAP Funding’s members agreement, TL owns 50.1% and TAP owns 49.9% of the common shares of TAP Funding. As common shareholders, TL has two voting rights and TAP has one voting right of TAP Funding, with the exception of certain matters such as bankruptcy proceedings and the incurrence of debt and mergers and consolidations, which require unanimity. TL also has two seats and TAP has one seat on TAP Funding’s board of directors. In addition, TL has an option to purchase the remaining outstanding common shares of TAP Funding held by TAP during the period beginning January 1, 2019 and through December 1, 2020 for a purchase price equal to the equity carrying value of TAP Funding plus 6% of TAP’s percentage ownership interest in TAP Funding minus the sum of any and all U.S. federal, state and local taxes of any nature that would be recognized by TL if TAP Funding was liquidated by TL immediately after TL purchased its shares.
TAP Funding is a VME and the Company consolidates TAP Funding as the Company has a controlling financial interest in TAP Funding, in which TL owns 50% or more voting interest. TAP Funding’s profits and losses are allocated to TL and TAP on the same basis as their ownership percentages. The equity owned by TAP in TAP Funding is shown as a noncontrolling interest on the Company’s consolidated balance sheets and the net income (loss) attributable to the noncontrolling interest’s operations is shown as net (income) loss attributable to the noncontrolling interests on the Company’s consolidated statements of comprehensive income (loss).
The Company has a joint venture, TW Container Leasing, Ltd. (“TW”) (a Bermuda company), between TL and Wells Fargo Container Corp. (“WFC”). The purpose of TW is to lease containers to lessees under direct financing leases. TW is governed by members, credit and management agreements. Under the members agreement, TL owns 25% and WFC owns 75% of the common shares and related voting rights of TW. TL also has two seats and WFC has six seats on TW’s board of directors, with each seat having equal voting rights, provided, however, that the approval of at least one TL-appointed director is required for any action of the board of directors. Under a credit agreement with Wells Fargo Bank, N.A. (“WFB”), TW maintains a credit facility with an outstanding balance of $97,148 as of December 31, 2017. TW is required to make monthly principal pay down from its available funds, net revenue collection after interest payment, interest rate hedging payment and certain management fees, until the outstanding balance is fully repaid and prior to final maturity (see Note 12 “Secured Debt Facilities, Credit Facilities, Term Loan and Bonds Payable, and Derivative Instruments”). Both WFC and WFB are directly and indirectly wholly-owned subsidiaries of Wells Fargo and Company. The remaining cost of originating direct financing leases will be provided in the form of capital contributions from TL and WFC, split 25% and 75%, respectively. Under the management agreement, TEML manages all of TW’s containers, making day-to-day decisions regarding the marketing, servicing and design of TW’s direct financing leases.
F-10
The Company has determined that it has a variable interest in TW and that TW is a VIE. The Company consolidates TW as the Company has determined that it is the primary beneficiary of TW by its equity ownership in the entity and by virtue of its role as manager of the vehicle, namely that the Company has the power to direct the activities of TW that most significantly impact TW’s economic performance. The book values of TW’s direct financing and sales-type leases and related debt as of December 31, 2017 and 2016 are disclosed in Note 7 “Direct Financing and Sales-type Leases” and Note 12 “Secured Debt Facilities, Credit Facilities, Term Loan and Bonds Payable, and Derivative Instruments”, respectively.
The majority of the container equipment included in the accompanying consolidated financial statements is owned by TL, Textainer Marine Containers II Limited (“TMCL II”), Textainer Marine Containers III Limited (“TMCL III”), Textainer Marine Containers IV Limited (“TMCL IV”) and Textainer Marine Containers V Limited (“TMCL V”), all Bermuda companies and all of which were wholly-owned subsidiaries of the Company as of December 31, 2017 and 2016.
| (c) | Cash and Cash Equivalents and Restricted Cash |
Cash and cash equivalents are comprised of interest-bearing deposits or money market securities with original maturities of three months or less. The Company maintains cash and cash equivalents and restricted cash (see Note 14 “Commitments and Contingencies—Restricted Cash”) with various financial institutions. These financial institutions are located in Bermuda, Canada, Hong Kong, Malaysia, Singapore, the United Kingdom and the United States. A significant portion of the Company’s cash and cash equivalents and restricted cash is maintained with a small number of banks and, accordingly, the Company is exposed to the credit risk of these counterparties in respect of the Company’s cash and cash equivalents and restricted cash. Furthermore, the deposits maintained at some of these financial institutions exceed the amount of insurance provided on the deposits. Restricted cash is excluded from cash and cash equivalents and is included in long-term assets.
In November 2016, the FASB issued Accounting Standards Update No. 2016-18, Statement of Cash Flows (Topic 230): Restricted Cash (“ASU 2016-18”). The Company early adopted ASU 2016-18 on April 1, 2017, which resulted in a $24,161 decrease in net cash used in financing activities and the inclusion of restricted cash balances of $33,917 and $58,078 to the beginning of the year and end of the year cash, cash equivalents and restricted cash, respectively, in the Company’s consolidated statements of cash flows for the year ended December 31, 2016. This also resulted in a $26,393 increase in net cash used in financing activities and the inclusion of restricted cash balances of $60,310 and $33,917 to the beginning of the year and end of the year cash, cash equivalents and restricted cash, respectively, in the Company’s consolidated statements of cash flows for the year ended December 31, 2015 (see Note 1(t) “Recently Issued Accounting Standards”).
The following table provides a reconciliation of cash, cash equivalents, and restricted cash reported within the consolidated balance sheets that sum to the total of the same such amounts shown in the consolidated statements of cash flows:
| 2017 | 2016 | 2015 | ||||||||||
| Cash and cash equivalents |
$ | 137,894 | $ | 84,045 | $ | 115,594 | ||||||
| Restricted cash included in long-term assets |
99,675 | 58,078 | 33,917 | |||||||||
|
|
|
|
|
|
|
|||||||
| Cash at end of period |
$ | 237,569 | $ | 142,123 | $ | 149,511 | ||||||
|
|
|
|
|
|
|
|||||||
| (d) | Intangible Assets |
Intangible assets, consisting primarily of exclusive rights to manage container fleets, are amortized over the expected life of the contracts based on forecasted income to the Company. The contract terms range from 11 to 13 years. The Company reviews its intangible assets for impairment if events and circumstances indicate that the carrying amount of the intangible assets may not be recoverable. The Company compares the carrying value of the intangible assets to expected future undiscounted cash flows for the purpose of assessing the recoverability of the recorded amounts. If the carrying amount exceeds expected undiscounted cash flows, the intangible assets shall be reduced to their fair value.
F-11
| (e) | Lease Rental Income |
Leasing income arises principally from the renting of containers owned by the Company to various international shipping lines. Revenue is recorded when earned according to the terms of the container rental contracts. These contracts are typically for terms of three to five years, but can vary from one to eight years, and are generally classified as operating leases.
Under long-term lease agreements, containers are usually leased from the Company for periods of three to five years. Such leases are generally cancelable with a penalty at the end of each 12-month period. Under master lease agreements, the lessee is not committed to leasing a minimum number of containers from the Company during the lease term and may generally return the containers to the Company at any time, subject to certain restrictions in the lease agreement. Under long-term lease and master lease agreements, revenue is earned and recognized evenly over the period that the equipment is on lease.
Under direct financing and sales-type leases, the containers are usually leased from the Company for the remainder of the container’s useful life with a bargain purchase option at the end of the lease term. Revenue is earned and recognized on direct financing leases over the lease terms so as to produce a constant periodic rate of return on the net investment in the leases. Under sales-type leases, a gain or loss is recognized at the inception of the leases by subtracting the book value of the containers from the estimated fair value of the containers and the remaining revenue is earned and recognized over the lease terms so as to produce a constant periodic rate of return on the net investment in the leases.
The Company’s container leases generally do not include step-rent provisions, nor do they depend on indices or rates. The Company recognizes revenue on container leases that include lease concessions in the form of free-rent periods using the straight-line method over the minimum terms of the leases.
The following is a schedule, by year, of future minimum lease payments receivable under the long-term leases as of December 31, 2017:
| Year ending December 31: |
||||
| 2018 |
$ | 263,425 | ||
| 2019 |
189,130 | |||
| 2020 |
131,427 | |||
| 2021 |
91,685 | |||
| 2022 and thereafter |
120,345 | |||
|
|
|
|||
| Total future minimum lease payments receivable |
$ | 796,012 | ||
|
|
|
The Company maintains allowances for doubtful accounts for estimated losses resulting from the inability of its lessees to make required payments. These allowances are based on management’s current assessment of the financial condition of the Company’s lessees and their ability to make their required payments. If the financial condition of the Company’s lessees deteriorates, resulting in an impairment of their ability to make payments, additional allowances may be required.
| (f) | Direct Container Expense |
Direct container expense represents the operating costs arising from the containers owned by the Company and includes storage, handling, maintenance, Damage Protection Plan (“DPP”) repair, repositioning, agent, insurance expense and repair and recovery costs for problem lessees. These costs are recognized when incurred.
F-12
| (g) | Containers Held for Resale |
The Company, through one or more of its subsidiaries, buys trading containers for resale, which are valued at the lower of cost or market value. The cost of trading containers sold is specifically identified.
| (h) | Foreign Currencies |
A functional currency is determined for each of the Company’s entities based on the currency of the primary economic environment in which the entity operates. The Company’s functional currency, excluding its foreign subsidiaries, is the U.S. dollar. Assets and liabilities denominated in a currency other than the entity’s functional currency are re-measured into its functional currency at the balance sheet date with a gain or loss recognized in current year net income. Foreign currency exchange gains and losses that arise from exchange rate changes on transactions denominated in a foreign currency are recognized in net income as incurred. Foreign currency exchange gains, reported in direct container expense in the consolidated statements of comprehensive income were $156, $188, and $221 for the years ended December 31, 2017, 2016 and 2015, respectively. For consolidation purposes, the financial statements are translated into U.S. dollars using the current exchange rate for the assets and liabilities and a weighted average exchange rate for the revenues and expenses recorded during the year with any translation adjustment shown as an element of accumulated other comprehensive income.
| (i) | Containers and Fixed Assets |
Capitalized container costs include the container cost payable to the manufacturer and the associated transportation costs incurred in moving the containers from the manufacturer to the containers’ first destined port. Containers purchased new are depreciated using the straight-line method over their estimated useful lives to an estimated dollar residual value. Containers purchased used are depreciated based upon their remaining useful lives at the date of acquisition to an estimated dollar residual value.
The Company evaluates the estimated residual values and remaining estimated useful lives on a regular basis to determine whether a change in our estimates of useful lives and residual values is warranted.
After the Company performed its regular depreciation policy review during third quarter of 2017, the Company concluded that, beginning July 1, 2017, an increase in the estimated future residual value of its 20’, 40’ and 40’ high cube dry containers, as stated in the below table on the Company’s useful lives and residual values estimates, was appropriate. Depreciation expense may fluctuate in future periods based on fluctuations in these estimates. The net effect of these changes was a decrease in depreciation expense of $7,104 for the year ended December 31, 2017.
After the Company performed its regular depreciation policy review during the third quarter of 2016, the Company concluded that, beginning July 1, 2016, a decrease in the estimated future residual value of its 20’ dry containers, 40’ dry containers, 40’ high cube dry containers and 40’ folding flat rack containers and an increase in the useful lives of its 40’ dry containers, 20’ folding flat rack containers, 20’ open top containers and 40’ flat rack containers, as stated in the below table on the Company’s useful lives and residual values estimates, was appropriate. Depreciation expense may fluctuate in future periods based on fluctuations in these estimates. The effect of these changes was an increase in depreciation expense of $25,126 for the year ended December 31, 2016, of which a $4,402 one-time charge was for containers that were fully depreciated to their previous residual value.
F-13
The Company estimates the useful lives and residual values of its containers to be as follows:
| Effective July 1, 2017 | July 1, 2016 through June 30, 2017 |
January 1, 2016 through June 30, 2016 |
||||||||||||||||||||||
| Estimated useful | Residual | Estimated useful | Residual | Estimated useful | Residual | |||||||||||||||||||
| life (years) | Value | life (years) | Value | life (years) | Value | |||||||||||||||||||
| Dry containers other than open top and flat rack containers: |
||||||||||||||||||||||||
| 20’ |
13 | $ | 1,000 | 13 | $ | 950 | 13 | $ | 1,050 | |||||||||||||||
| 40’ |
14 | $ | 1,200 | 14 | $ | 1,150 | 13 | $ | 1,300 | |||||||||||||||
| 40’ high cube |
13 | $ | 1,350 | 13 | $ | 1,300 | 13 | $ | 1,450 | |||||||||||||||
| 45’ high cube dry van |
13 | $ | 1,500 | 13 | $ | 1,500 | 13 | $ | 1,500 | |||||||||||||||
| Refrigerated containers: |
||||||||||||||||||||||||
| 20’ |
12 | $ | 2,750 | 12 | $ | 2,750 | 12 | $ | 2,750 | |||||||||||||||
| 20’ high cube |
12 | $ | 2,049 | 12 | $ | 2,049 | 12 | $ | 2,049 | |||||||||||||||
| 40’ high cube |
12 | $ | 4,500 | 12 | $ | 4,500 | 12 | $ | 4,500 | |||||||||||||||
| Open top and flat rack containers: |
||||||||||||||||||||||||
| 20’ folding flat rack |
15 | $ | 1,300 | 15 | $ | 1,300 | 14 | $ | 1,300 | |||||||||||||||
| 40’ folding flat rack |
16 | $ | 1,700 | 16 | $ | 1,700 | 14 | $ | 2,000 | |||||||||||||||
| 20’ open top |
15 | $ | 1,500 | 15 | $ | 1,500 | 14 | $ | 1,500 | |||||||||||||||
| 40’ open top |
14 | $ | 2,500 | 14 | $ | 2,500 | 14 | $ | 2,500 | |||||||||||||||
| Tank containers |
20 | 10% of cost | 20 | 10% of cost | 20 | 10% of cost | ||||||||||||||||||
F-14
The cost, accumulated depreciation and net book value of the Company’s leasing equipment by equipment type as of December 31, 2017 and 2016 were as follows:
| 2017 | 2016 (1) | |||||||||||||||||||||||
| Cost | Accumulated Depreciation |
Net Book Value |
Cost | Accumulated Depreciation |
Net Book Value |
|||||||||||||||||||
| Dry containers other than open top and flat rack containers: |
||||||||||||||||||||||||
| 20’ |
$ | 1,497,557 | $ | (347,910 | ) | $ | 1,149,647 | $ | 1,399,878 | $ | (304,652 | ) | $ | 1,095,226 | ||||||||||
| 40’ |
223,916 | (75,610 | ) | 148,306 | 253,226 | (76,344 | ) | 176,882 | ||||||||||||||||
| 40’ high cube |
2,043,253 | (476,238 | ) | 1,567,015 | 1,861,221 | (405,503 | ) | 1,455,718 | ||||||||||||||||
| 45’ high cube dry van |
29,010 | (8,494 | ) | 20,516 | 29,823 | (6,957 | ) | 22,866 | ||||||||||||||||
| Refrigerated containers: |
||||||||||||||||||||||||
| 20’ |
24,062 | (5,394 | ) | 18,668 | 24,420 | (3,830 | ) | 20,590 | ||||||||||||||||
| 20’ high cube |
5,139 | (2,327 | ) | 2,812 | 5,149 | (1,948 | ) | 3,201 | ||||||||||||||||
| 40’ high cube |
1,002,843 | (229,465 | ) | 773,378 | 1,004,532 | (169,383 | ) | 835,149 | ||||||||||||||||
| Open top and flat rack containers: |
||||||||||||||||||||||||
| 20’ folding flat |
16,595 | (3,525 | ) | 13,070 | 16,712 | (2,942 | ) | 13,770 | ||||||||||||||||
| 40’ folding flat |
43,334 | (14,394 | ) | 28,940 | 43,620 | (12,634 | ) | 30,986 | ||||||||||||||||
| 20’ open top |
10,837 | (1,237 | ) | 9,600 | 11,048 | (1,069 | ) | 9,979 | ||||||||||||||||
| 40’ open top |
26,690 | (4,469 | ) | 22,221 | 27,115 | (3,778 | ) | 23,337 | ||||||||||||||||
| Tank containers |
40,729 | (3,292 | ) | 37,437 | 31,582 | (1,744 | ) | 29,838 | ||||||||||||||||
|
|
|
|
|
|
|
|
|
|
|
|
|
|||||||||||||
| $ | 4,963,965 | $ | (1,172,355 | ) | $ | 3,791,610 | $ | 4,708,326 | $ | (990,784 | ) | $ | 3,717,542 | |||||||||||
|
|
|
|
|
|
|
|
|
|
|
|
|
|||||||||||||
| (1) | Certain amounts as of December 31, 2016 have been restated for immaterial corrections of identified errors related to the calculation of the gain on sale of containers, net (see Note 2 “Immaterial Correction of Errors in Prior Periods”). |
Fixed assets are recorded at cost and depreciated on a straight-line basis over the estimated useful lives of the assets, ranging from three to seven years.
The Company reviews its containers for impairment whenever events or circumstances indicate that the carrying amount of such assets may not be recoverable. The Company compares the carrying value of the containers to the expected future undiscounted cash flows for the purpose of assessing the recoverability of the recorded amounts. If the carrying value exceeds expected future undiscounted cash flows, the assets are reduced to fair value. There was no such impairment for the years ended December 31, 2017 and 2016. In addition, containers identified as being available for sale are valued at the lower of carrying value or fair value, less costs to sell.
The Company evaluates the recoverability of the recorded amount of container rental that are unlikely to be recovered from lessees in default. The Company also records impairments to write-down containers held for sale to their estimated fair value less cost to sell. The fair value was estimated based on recent gross sales proceeds for sales of similar containers. When containers are retired or otherwise disposed of, the cost and related accumulated depreciation are removed and any resulting gain or loss is recognized. Any subsequent increase in fair value less costs to sell are recognized as reversal of container impairment but not in excess of the cumulative loss previously recognized.
F-15
The Company recorded the following impairments that are included in container impairment in the consolidated statements of comprehensive income (loss) for the years ended December 31, 2017, 2016 and 2015:
| 2017 | 2016 | 2015 | ||||||||||
| Impairment to write down the value of containers held for sale to their estimated fair value less cost to sell |
$ | 15,475 | $ | 66,455 | $ | 32,680 | ||||||
| Impairment on containers from a bankruptcy customer in 2016 and customer that became insolvent in 2015 |
— | 22,961 | 1,968 | |||||||||
| Impairment for containers that were unlikely to be recovered from lessees in default (see Note 3 “Insurance Receivable and Impairment”) |
3,822 | 5,207 | 697 | |||||||||
| Reversal of previously recorded impairments on containers held for sale due to rising used container prices during the year |
(11,225 | ) | — | — | ||||||||
|
|
|
|
|
|
|
|||||||
| Container impairment |
$ | 8,072 | $ | 94,623 | $ | 35,345 | ||||||
|
|
|
|
|
|
|
|||||||
During the years ended December 31, 2017, 2016 and 2015, the Company recorded the following net gain on sales of containers, included in gain on sale of containers, net in the consolidated statements of comprehensive (loss) income:
| 2017 | 2016 (1) | 2015 | ||||||||||||||||||||||
| Units | Amount | Units | Amount | Units | Amount | |||||||||||||||||||
| Gain on sale of previously written down containers, net |
56,862 | $ | 18,662 | 118,071 | $ | 9,151 | 65,786 | $ | 2,336 | |||||||||||||||
| Gain (loss) on sale of containers not written down, net |
55,505 | 7,548 | 20,319 | (2,390 | ) | 45,777 | 1,118 | |||||||||||||||||
|
|
|
|
|
|
|
|
|
|
|
|
|
|||||||||||||
| Gain on sale of containers, net |
112,367 | $ | 26,210 | 138,390 | $ | 6,761 | 111,563 | $ | 3,454 | |||||||||||||||
|
|
|
|
|
|
|
|
|
|
|
|
|
|||||||||||||
| (1) | Certain amounts as of December 31, 2016 have been restated for immaterial corrections of identified errors related to the calculation of the gain on sale of containers, net (see Note 2 “Immaterial Correction of Errors in Prior Periods”). |
If other containers are subsequently identified as available for sale, the Company may incur additional write-downs or may incur losses on the sale of these containers if they are sold. The Company will continue to evaluate the recoverability of recorded amounts of containers and a write-down of certain containers held for continued use and/or an increase in its depreciation rate may be required in future periods for some or all containers.
| (j) | Income Taxes |
The Company uses the asset and liability method to account for income taxes. Deferred tax assets and liabilities are recognized for the future tax consequences attributable to differences between the financial statement carrying amounts of existing assets and liabilities and their respective tax bases and operating loss. Deferred tax assets and liabilities are measured using enacted tax rates expected to apply to taxable income in the years in which those temporary differences are expected to be recovered or settled. The effect on deferred tax assets and liabilities of a change in the tax rates is recognized in income in the period that includes the enactment date. A valuation allowance is recorded when the realization of a deferred tax asset is deemed to be unlikely.
The Company also accounts for income tax positions only if those positions are more likely than not of being sustained. Recognized income tax positions are measured at the largest amount that is greater than 50% likely of being realized. Changes in the recognition or measurement are reflected in the period in which the change in judgment occurs. If there are findings in future regulatory examinations of the Company’s tax returns, those findings may result in an adjustment to income tax expense.
F-16
The Company records interest and penalties related to unrecognized tax benefits in income tax expense.
| (k) | Maintenance and Repair Expense and Damage Protection Plan |
The Company’s leases generally require the lessee to pay for any damage to the container beyond normal wear and tear at the end of the lease term. The Company offers a DPP to certain lessees of its containers. Under the terms of the DPP, the Company charges lessees an additional amount primarily on a daily basis and the lessees are no longer obligated for certain future repair costs for containers subject to the DPP. It is the Company’s policy to recognize these revenues as earned on a daily basis over the related term of its leases. The Company has not recognized revenue and related expense for customers who are billed at the end of their lease terms under the DPP. Based on past history, there is uncertainty as to collectability of these amounts from lessees who are billed at the end of their lease terms because the amounts due under the DPP are typically re-negotiated at the end of the lease terms or the lease terms are extended. The Company uses the direct expense method of accounting for maintenance and repairs.
| (l) | Debt Issuance Costs |
The Company capitalizes costs directly associated with the issuance or modification of its debt and the balance of the debt issuance costs, net of amortization, are netted against the debt recorded in the consolidated balance sheets.
Debt issuance costs are amortized using the interest rate method and the straight-line method over the general terms of the related fixed principal payment debt and the related revolving debt facilities, respectively, and the amortization is recorded in the consolidated statements of comprehensive income (loss) as interest expense. In 2017, 2016 and 2015, debt issuance costs of $27,702, $5,969 and $5,853, respectively, were capitalized and amortization of debt issuance costs of $13,201, $9,465 and $7,158, respectively, were recorded in interest expense.
When the Company’s debt is modified or terminated, any unamortized debt issuance costs related to a decrease in borrowing capacity with any of the Company’s lenders is immediately written-off and recorded in interest expense. In 2017, interest expense included $238, $6,516 and $84 of write-offs of unamortized debt issuance costs related to the amendment of TMCL II’s secured debt facility, the redemption of TMCL III’s 2013-1 Bonds, 2014-1 Bonds, the termination of TMCL III’s 2017-A Notes and the amendment of TAP Funding’s secured debt facility, respectively, (see Note 12 “Secured Debt Facilities, Credit Facilities, Term Loan and Bonds Payable, and Derivative Instruments”). No unamortized debt issuance costs were written-off during the year ended December 31, 2016. In 2015, interest expense included $458 of write-offs of unamortized debt issuance costs related to the amendment of TL’s revolving credit facility and the amendment of the Company’s wholly-owned subsidiary, Textainer Marine Containers IV Limited’s (“TMCL IV”) (a Bermuda company), secured debt facility.
| (m) | Concentrations |
Although substantially all of the Company’s income from operations is derived from assets employed in foreign countries, virtually all of this income is denominated in U.S. dollars. The Company does pay some of its expenses in various foreign currencies. During 2017, 2016 and 2015, $15,143 or 25%, $22,642 or 36%, and $12,700 or 27%, respectively, of the Company’s direct container expenses were paid in up to 20 different foreign currencies. In accordance with its policy, the Company does not hedge these container expenses as there are no significant payments made in any one foreign currency.
The Company’s customers are mainly international shipping lines, which transport goods on international trade routes. Once the containers are on-hire with a lessee, the Company does not track their location. The domicile of the lessee is not indicative of where the lessee is transporting the containers. The Company’s business risk in its foreign concentrations lies with the creditworthiness of the lessees rather than the geographic location of the containers or the domicile of the lessees. Except
F-17
for the lessees noted in the table below, no other single lessee made up greater than 10% of the Company’s lease rental income during the years ended December 31, 2017, 2016 and 2015:
| 2017 | 2016 (1) | 2015 | ||||||||||
| Mediterranean Shipping Company S.A. |
14.4 | % | 12.0 | % | 10.4 | % | ||||||
| CMA-CGM S.A. |
13.6 | % | 14.0 | % | 11.0 | % | ||||||
| (1) | Certain amounts as of December 31, 2016 have been restated for immaterial corrections of identified errors relating to properly account for lease concessions (see Note 2 “Immaterial Correction of Errors in Prior Periods”). |
Mediterranean Shipping Company S.A. accounted for 13.1% and 9.0% of the Company’s gross accounts receivable as of December 31, 2017 and 2016, respectively. CMA-CGM S.A. accounted for 12.9% and 9.1% of the Company’s gross accounts receivable as of December 31, 2017 and 2016, respectively. Hanjin Shipping Co. accounted for 19.9% of the Company’s gross accounts receivable as of December 31, 2016. Hanjin Shipping Co. filed for bankruptcy in August 2016 and the Company’s outstanding accounts receivable with this customer was fully reserved as of December 31, 2016 and was written off as of December 31, 2017 (see Note 3 “Insurance Receivable and Impairment”). There is no other single lessee that accounted for more than 10% of the Company’s gross accounts receivable as of December 31, 2017 and 2016. As of December 31, 2016, the Company’s gross accounts receivable has been restated for immaterial corrections of identified errors pertaining to properly account for lease concessions (see Note 2 “Immaterial Correction of Errors in Prior Periods”).
Total fleet lease rental income differs from reported lease rental income in that total fleet lease rental income comprises revenue earned from leases on containers in the Company’s total fleet, including revenue earned by the Owners from leases on containers in its managed fleet, while the Company’s reported lease rental income only comprises income associated with its owned fleet. Except for the customers noted in the table below, no other customer that individually accounted for over 10% of the lease billings of the Company’s total fleet in 2017, 2016 and 2015:
| 2017 | 2016 | 2015 | ||||||||||
| Mediterranean Shipping Company S.A. |
15.1 | % | 13.6 | % | 11.9 | % | ||||||
| CMA-CGM S.A. |
14.4 | % | 15.4 | % | 12.2 | % | ||||||
The Company currently has containers on-hire to approximately 300 customers. The Company’s customers are mainly international shipping lines, but the Company also leases containers to freight forwarding companies and the U.S. military. The Company’s five largest customers accounted for approximately 49.5%, 48.1% and 40.3% of the Company’s total fleet leasing billings in 2017, 2016 and 2015, respectively. During 2017, 2016 and 2015, revenue from the Company’s 20 largest container lessees by lease billings represented 80.0%, 78.9% and 77.4% of the Company’s total fleet container lease billings, respectively. A default by any of these major customers could have a material adverse impact on the Company’s business, results from operations and financial condition.
F-18
As of December 31, 2017 and 2016, approximately 94.4 % and 95.0%, respectively, of the Company’ accounts receivable for its total fleet were from container lessees and customers outside of the U.S. As of December 31, 2017 and 2016, approximately 98.0% and 99.8%, respectively, of the Company’s finance lease receivables for its total fleet were from container lessees and customers outside of the U.S. Except for the countries outside of the U.S. noted in the table below, customers in no other single country made up greater than 10% of the Company’s total fleet container lease rental income during 2017, 2016 and 2015.
| Country |
2017 | 2016 | 2015 | |||||||||
| Switzerland |
15.1 | % | 13.4 | % | 11.5 | % | ||||||
| France |
14.4 | % | 15.3 | % | 12.2 | % | ||||||
| People’s Republic of China |
14.4 | % | 14.1 | % | 15.9 | % | ||||||
| Taiwan |
13.9 | % | 12.2 | % | 11.1 | % | ||||||
| Singapore |
10.9 | % | 8.7 | % | 11.0 | % | ||||||
| Korea |
6.8 | % | 9.9 | % | 11.6 | % | ||||||
| (n) | Derivative Instruments |
The Company has entered into various interest rate swap, collar and cap agreements to mitigate its exposure associated with its variable rate debt. The swap agreements involve payments by the Company to counterparties at fixed rates in return for receipts based upon variable rates indexed to the London Inter Bank Offered Rate (“LIBOR”). The differentials between the fixed and variable rate payments under these agreements are recognized in realized losses on interest rate swaps, collars and caps, net in the consolidated statements of comprehensive (loss) income.
As of the balance sheet dates, none of the derivative instruments are designated by the Company for hedge accounting. The fair value of the derivative instruments is measured at each balance sheet date and the change in fair value is recorded in the consolidated statements of comprehensive income as unrealized gains (losses) on interest rate swaps, collars and caps, net.
| (o) | Share Options and Restricted Share Units |
The Company estimates the fair value of all employee share options awarded under its 2015 Share Incentive Plan (the “2015 Plan”), amended and restated from the 2007 Share Incentive Plan (the “2007 Plan”) on May 21, 2015, on the grant date. The value of the portion of the award that is ultimately expected to vest is recognized as expense over the requisite service periods in the Company’s consolidated statements of comprehensive income as part of long-term incentive compensation expense.
The Company uses the Black-Scholes-Merton (“Black-Scholes”) option-pricing model to determine the estimated fair value for employee share option awards. The Company uses the fair market value of the Company’s common shares on the grant date, discounted for estimated dividends that will not be received by the employees during the vesting period, for determining the estimated fair value for employee restricted share units. Compensation expense for employee share awards is recognized on a straight-line basis over the vesting period of the award. Share-based compensation expense of $6,083, $6,573 and $7,743 was recorded as a part of long-term incentive compensation during 2017, 2016 and 2015, respectively, for share options and restricted share units awarded to employees under the 2015 Plan.
| (p) | Comprehensive Income |
The Company discloses the effect of its foreign currency translation adjustment as a component of other comprehensive income (loss) in the Company’s consolidated statements of comprehensive income (loss).
F-19
| (q) | Estimates |
The preparation of consolidated financial statements in conformity with accounting principles generally accepted in the United States of America requires the Company’s management to make estimates and assumptions that affect the reported amounts of assets and liabilities and disclosure of contingent assets and liabilities at the date of the consolidated financial statements and the reported amounts of revenues and expenses during the reporting period. The Company’s management evaluates its estimates on an ongoing basis, including those related to the container rental equipment, intangible assets, accounts receivable, income taxes, and accruals.
These estimates are based on historical experience and on various other assumptions that are believed to be reasonable under the circumstances, the results of which form the basis for making judgments regarding the carrying values of assets and liabilities. Actual results could differ from those estimates under different assumptions or conditions.
| (r) | Net Income (Loss) Attributable to Textainer Group Holdings Limited Common Shareholders per Share |
Basic earnings per share (“EPS”) is computed by dividing net income (loss) attributable to Textainer Group Holdings Limited common shareholders by the weighted average number of shares outstanding during the applicable period. Diluted EPS reflects the potential dilution that could occur if all outstanding share options were exercised for, and all outstanding restricted share units were converted into, common shares. Potentially dilutive share options and restricted share units that were anti-dilutive under the treasury stock method were excluded from the computation of diluted EPS. A reconciliation of the numerator and denominator of basic EPS with that of diluted EPS during 2017, 2016 and 2015 is presented as follows:
| Share amounts in thousands | 2017 | 2016 (1) | 2015 | |||||||||
| Numerator: |
||||||||||||
| Net income (loss) attributable to Textainer Group Holdings Limited common shareholders |
$ | 19,365 | $ | (52,483 | ) | $ | 108,408 | |||||
| Denominator: |
||||||||||||
| Weighted average common shares outstanding— basic |
56,845 | 56,608 | 56,953 | |||||||||
| Dilutive share options and restricted share units |
314 | — | 140 | |||||||||
|
|
|
|
|
|
|
|||||||
| Weighted average common shares outstanding— diluted |
57,159 | 56,608 | 57,093 | |||||||||
|
|
|
|
|
|
|
|||||||
| Net income (loss) attributable to Textainer Group Holdings Limited common shareholders per common share |
||||||||||||
| Basic |
$ | 0.34 | $ | (0.93 | ) | $ | 1.90 | |||||
| Diluted |
$ | 0.34 | $ | (0.93 | ) | $ | 1.90 | |||||
| Anti-dilutive share options and restricted share units, excluded from the computation of diluted EPS because they were anti-dilutive |
1,164 | 1,361 | 1,158 | |||||||||
| (1) | Amounts for the year ended December 31, 2016 have been restated for immaterial corrections of identified errors pertaining to the calculation of gain on sale of containers, net and to properly account for lease concessions (see Note 2 “Immaterial Correction of Errors in Prior Periods”). |
Given that the Company had a net loss attributable to Textainer Group Holdings Limited common shareholders for the year ended 2016, there was no dilutive effect of share option and restricted share units.
F-20
| (s) | Fair Value Measurements |
The Company utilizes a fair value hierarchy that prioritizes the inputs to valuation techniques used to measure fair value into three broad levels. The following is a brief description of those levels:
| • | Level 1: Observable inputs such as quoted prices (unadjusted) in active markets for identical assets or liabilities. |
| • | Level 2: Inputs other than quoted prices which are observable for the asset or liability, either directly or indirectly. These include quoted prices for similar assets or liabilities in active markets and quoted prices for identical or similar assets or liabilities in markets that are not active. |
| • | Level 3: Unobservable inputs that reflect the reporting entity’s own assumptions. |
The Company uses the exchange price notion, which is the price in an orderly transaction between market participants to sell an asset or transfer a liability in the market in which the reporting entity would transact for the asset or liability, that is, the principal or most advantageous market for the asset or liability. The transaction to sell the asset or transfer the liability is a hypothetical transaction at the measurement date, considered from the perspective of a market participant that holds the asset or owes the liability. Therefore, the definition focuses on the price that would be received to sell the asset or paid to transfer the liability (an exit price), not the price that would be paid to acquire the asset or received to assume the liability (an entry price).
The following table summarizes the Company’s assets and liabilities measured at fair value on a recurring basis as of December 31, 2017 and 2016:
| Quoted Prices in Active Markets for Identical Assets |
Significant Other Observable Inputs |
Significant Unobservable Inputs |
||||||||||
| (Level 1) | (Level 2) | (Level 3) | ||||||||||
| December 31, 2017 |
||||||||||||
| Assets |
||||||||||||
| Interest rate swaps, collars and caps |
$ | — | $ | 7,787 | $ | — | ||||||
|
|
|
|
|
|
|
|||||||
| Total |
$ | — | $ | 7,787 | $ | — | ||||||
|
|
|
|
|
|
|
|||||||
| Liabilities |
||||||||||||
| Interest rate swaps, collars and caps |
$ | — | $ | 81 | $ | — | ||||||
|
|
|
|
|
|
|
|||||||
| Total |
$ | — | $ | 81 | $ | — | ||||||
|
|
|
|
|
|
|
|||||||
| December 31, 2016 |
||||||||||||
| Assets |
||||||||||||
| Interest rate swaps, collars and caps |
$ | — | $ | 4,816 | $ | — | ||||||
|
|
|
|
|
|
|
|||||||
| Total |
$ | — | $ | 4,816 | $ | — | ||||||
|
|
|
|
|
|
|
|||||||
| Liabilities |
||||||||||||
| Interest rate swaps, collars and caps |
$ | — | $ | 1,204 | $ | — | ||||||
|
|
|
|
|
|
|
|||||||
| Total |
$ | — | $ | 1,204 | $ | — | ||||||
|
|
|
|
|
|
|
|||||||
F-21
The following table summarizes the Company’s assets measured at fair value on a non-recurring basis as of December 31, 2017 and 2016:
| Quoted Prices in Active Markets for Identical Assets |
Significant Other Observable Inputs |
Significant Unobservable Inputs |
Years Ended December 31, 2017 and 2016 |
|||||||||||||
| (Level 1) | (Level 2) | (Level 3) | Total Impairments (2) |
|||||||||||||
| December 31, 2017 |
||||||||||||||||
| Assets |
||||||||||||||||
| Containers held for sale (1) |
$ | — | $ | 8,984 | $ | — | $ | 15,475 | ||||||||
|
|
|
|
|
|
|
|
|
|||||||||
| Total |
$ | — | $ | 8,984 | $ | — | $ | 15,475 | ||||||||
|
|
|
|
|
|
|
|
|
|||||||||
| December 31, 2016 |
||||||||||||||||
| Assets |
||||||||||||||||
| Containers held for sale (1) |
$ | — | $ | 19,230 | $ | — | $ | 66,455 | ||||||||
|
|
|
|
|
|
|
|
|
|||||||||
| Total |
$ | — | $ | 19,230 | $ | — | $ | 66,455 | ||||||||
|
|
|
|
|
|
|
|
|
|||||||||
| (1) | Represents the carrying value of containers included in containers held for sale in the consolidated balance sheets that have been impaired to write down the value of the containers to their estimated fair value less cost to sell. |
| (2) | Included in container impairment in the accompanying consolidated statements of comprehensive income (loss). |
The Company measures the fair value of its $1,284,243 notional amount of interest rate swaps, collars and caps using observable (Level 2) market inputs. The valuation also reflects the credit standing of the Company and the counterparties to the interest rate swaps, collars and caps. The valuation technique utilized by the Company to calculate the fair value of the interest rate swaps, collars and caps is the income approach. This approach represents the present value of future cash flows based upon current market expectations. The Company’s interest rate swap, collar and cap agreements had net fair value asset and liability of $7,787 and $81, respectively, as of December 31, 2017 and a fair value asset and liability of $4,816 and $1,204, respectively, as of December 31, 2016. The credit valuation adjustment was determined to be $31 and $87 (both of which were additions to the net liabilities) as of December 31, 2017 and 2016, respectively. The change in fair value during 2017, 2016 and 2015 of $4,094, $6,210 and $(1,947), respectively, was recorded in the consolidated statements of comprehensive income (loss) as unrealized gains (losses) on interest rate swaps, collars and caps, net.
When the Company is required to write down the cost basis of its containers held for sale to fair value less cost to sell, the Company measures the fair value of its containers held for sale under a Level 2 input. At December 31, 2017 and 2016, the carrying value of 7,325 and 26,600 containers held for sale have been impaired in $8,984 and $19,230 were net of impairment charges of $4,362 and $15,332, respectively. The Company relies on its recent sales prices for identical or similar assets in markets, by geography, that are active. The Company records impairments to write down the value of containers held for sale to their estimated fair value less cost to sell. Subsequent additions or reductions to the fair values of these written down assets are recorded as adjustments to the carrying value of the equipment held for sale. Any subsequent increase in fair value less costs to sell are recognized as reversal to container impairment but not in excess of the cumulative loss previously recognized.
The Company calculates the fair value of financial instruments and includes this additional information in the notes to the consolidated financial statements when the fair value is different from the book value of those financial instruments. The Company’s financial instruments include cash and cash equivalents, restricted cash, accounts receivable and payable, net investment in direct financing and sales-type leases, due from affiliates, net, container contracts payable, due to owners, net, debt and interest rate swaps, collars and caps. At December 31, 2017 and 2016, the fair value of the Company’s financial instruments approximated the related book value of such instruments except that, the fair value of net investment in direct financing and sales-type leases (including the short-term balance) was approximately $183,305 and $235,769 at December 31, 2017 and 2016, respectively, compared to book values of $182,624 and $237,234 at December 31, 2017 and 2016, respectively. The fair value of long-term debt (including current maturities) based on the borrowing rates available to the Company was approximately $2,995,190 and $2,991,396 at December 31, 2017 and 2016, respectively, compared to book values of $2,990,308 and $3,038,297 at December 31, 2017 and 2016, respectively.
F-22
| (t) | Recently Issued Accounting Standards and Pronouncements |
In March 2016, the FASB issued Accounting Standards Update No. 2016-09, Compensation – Stock Compensation (Topic 718) (“ASU 2016-09”). ASU 2016-09 simplifies several aspects of accounting for share-based payment award transactions which includes accounting for income taxes, classification of excess tax benefits on statement of cash flows, minimum statutory tax withholding requirements and classification of employee taxes paid on the statement of cash flows when an employer withholds shares for tax-withholding purposes. The new guidance also allows an entity to make a policy election to account for forfeitures as they occur. ASU 2016-09 is effective for fiscal years beginning after December 15, 2016, and interim periods within those fiscal years. The Company adopted ASU 2016-09 on January 1, 2017 using the prospective transition method for the amendments related to the presentation of excess tax benefits on the statement of cash flows and will continue to account for forfeitures of share-based payment by estimating the number of awards expected to be forfeited and adjusting the estimate when it is likely to change. The Company’s adoption on ASU 2016-09 resulted in no changes to the Company’s 2016 consolidated financial statements.
In August 2016, the FASB issued Accounting Standards Update No. 2016-15, Statement of Cash Flows (Topic 230): Classification of Certain Cash Receipts and Cash Payments (“ASU 2016-15”). This amendment provides guidance on how cash receipts and cash payments are presented and classified in the statement of cash flows for certain scenarios and transactions, as defined in ASU 2016-15. ASU 2016-15 is effective for fiscal years beginning after December 15, 2017, and interim periods within those fiscal years. Early adoption of ASU 2016-15 is permitted. ASU 2016-15 requires the use of the retrospective transition method for all periods presented. The Company early adopted ASU 2016-15 on April 1, 2017, which resulted in a reclassification of $8,195 of insurance proceeds from cash flows from operating activities to cash flows from investing activities in the Company’s consolidated statements of cash flows for the year ended December 31, 2016.
In May 2014, the FASB issued Accounting Standards Update No. 2014-09, Revenue from Contracts with Customers (Topic 606) (“ASU 2014-09”). This new standard will replace all current U.S. GAAP guidance on this topic and eliminate industry-specific guidance. Leasing revenue recognition is specifically excluded from ASU 2014-09, and therefore, the new standard will only apply to sales of equipment portfolios, dispositions of used equipment and management service agreements. The new guidance defines a five-step process to achieve the core principle of ASU 2014-09, which is to recognize revenues when promised goods or services are transferred to customers in amounts that reflect the consideration to which an entity expects to be entitled for those goods or services. The topic was amended in August 2015 to defer the effective date to annual periods beginning after December 15, 2017.
The Company will adopt the new revenue standards on the effective date of January 1, 2018 using the modified retrospective method of adoption for the first quarter of 2018. The Company does not expect the adoption of ASU 2014-09 to have an impact on the timing of revenue recognition or on its consolidated financial statements. Upon adoption of ASU 2014-09, the revenue recognition for our sales of equipment portfolios, dispositions of used equipment and management service agreements will remain materially consistent with our current practice. The Company will continue to recognize revenue for our equipment sales at a “point in time” following the transfer of control to the customer, which typically occurs upon delivery of containers to the customers. The Company will continue to recognize revenue for our management service agreements “over time” as services are provided to the customers. In addition, ASU 2014-09 requires expanded disclosures of the nature, amount, timing and uncertainty of revenue and cash flows arising from contracts with customers.
In February 2016, the FASB issued Accounting Standards Update No. 2016-02, Leases (Topic 842) (“ASU 2016-02”). ASU 2016-02 will replace all current U.S. GAAP guidance on this topic. Under ASU 2016-02, lessors will account for leases using an approach that is substantially equivalent to existing U.S. GAAP for sales-type leases, direct financing leases and operating leases and lessors should be precluded from recognizing selling profit and revenue at lease commencement for a lease that does
F-23
not transfer control of the underlying asset to the lessees. A dual approach is to be applied for lessee accounting with lease classification determined in accordance with the principles in existing lease requirements. Under the new guidance, lessees will be required to recognize the following on the balance sheet for all leases at the commencement date, with an exception for short-term leases and leases that commence at or near the end of the underlying asset’s economic life:
| (i) | Right-of-use (“ROU”) asset, which is an asset that represents the lessee’s right to use, or control the use of, a specified asset for the lease term; and |
| (ii) | Lease liability, which is a lessee’s obligation to make lease payments arising from a lease, measured on a discounted basis. |
ASU 2016-02 is effective for fiscal years beginning after December 15, 2018, with early application permitted. ASU 2016-02 requires the use of the modified retrospective method for all periods presented, with certain practical expedients available. The Company plans to adopt ASU 2016-02 effective January 1, 2019 and is continuing to analyze and evaluate the potential impact on its current accounting practices, consolidated financial statements and related disclosures. The Company expects the adoption of ASU 2016-02 will not have a material impact on our consolidated balance sheets, consolidated income statements and consolidated cash flow statements. The accounting for capital leases will remain substantially unchanged upon adoption of ASU 2016-02. The Company expects to complete its assessment of the impact of ASU 2016-02 in fiscal year 2018.
In June 2016, the FASB issued Accounting Standards Update No. 2016-13, Financial Instruments – Credit Losses (Topic 326) (“ASU 2016-13”). This guidance affects trade receivables and net investments in leases and the amendments in this update replace the incurred loss impairment methodology in current GAAP with a methodology that reflects expected credit losses. The guidance requires the measurement of expected credit losses to be based on relevant information from past events, current conditions, and reasonable and supportable information that affect collectability. ASU 2016-13 is effective for fiscal years beginning after December 15, 2019, including interim periods within those fiscal years and with early adoption permitted for fiscal years beginning after December 15, 2018. The Company is currently evaluating the potential impact on its consolidated financial statements and related disclosures. The Company expects to complete its assessment of the impact of ASU 2016-13 in fiscal year 2019.
(2) Immaterial Correction of Errors in Prior Periods
During the first quarter of 2017, the Company identified errors related to the calculation of the gain on sale of containers, net and lease concessions that had not properly been recognized. In accordance with ASC 250, the Company evaluated the materiality of the errors from both a quantitative and qualitative perspective, and concluded that the errors were immaterial to the Company’s prior period interim and annual consolidated financial statements. Since these revisions were not material to any prior period interim or annual consolidated financial statements, no amendments to previously filed interim or annual reports are required. Consequently, the Company has adjusted for the errors by revising its historical consolidated balance sheet presented herein resulting in a $839 increase in accounted receivable, net, a $2,792 decrease in containers, net, a $1,821 decrease in retained earnings and a $132 decrease in noncontrolling interests recorded in the consolidated balance sheet as of December 31, 2016. For the year ended December 31, 2016, the correction of the errors also resulted in a decrease in gain on sale of containers, net of $2,792 and an increase of $839 in lease rental income, resulting in a decrease of $1,821 in net income (loss) recorded in the consolidated statements of comprehensive income (loss).
(3) Insurance Receivable and Impairment
In August 2016, one of the Company’s customers filed for bankruptcy and the book value of its owned containers, net on operating leases and direct financing leases with this customer was $178,344 and $88,171, respectively. The Company maintains insurance that covers a portion of the exposure related to the value of containers that are unlikely to be recovered from this customer, the cost to recover containers, up to 183 days
F-24
of lost lease rental income and defaulted accounts receivable. During the year ended December 31, 2016, the Company recorded a total container impairment of $22,149 representing $17,399 to write down the containers on direct finance leases with this customer to the lower of estimated fair market value or net book value and $4,750 insurance deductible. As of December 31, 2016, an insurance receivable of $39,321, net of insurance deductible of $4,750, was recorded for estimated unrecoverable containers of $24,912 (or 10% of the containers on lease to the customer) as a reduction to containers, net and $19,159 of recovery costs recorded as a reduction to direct container expense on the Company’s owned fleet. The Company also recorded bad debt expense of $18,992, net of estimated insurance proceeds of $2,592, to fully reserve for the customer’s outstanding accounts receivable during the year ended December 31, 2016. During the recent quarters in 2017, the Company reassessed its estimate of unrecoverable containers to actual amount of unrecoverable containers commensurate with the insurance claim filing. Accordingly, the Company recorded a $7,592 reduction to the insurance receivable and addition to the containers, net, for the year ended December 31, 2017. An additional insurance receivable of $32,067 was also recorded for the year ended December 31, 2017 for recovery costs that are reimbursable as reduction to direct container expense. For the year ended December 31, 2017, the Company received a total of $50,479 insurance proceeds for the Company’s owned fleet, which was recorded as a reduction to the insurance receivable.
Insurance receivable recorded on the Company’s owned fleet related to this bankrupt customer are as follows:
|
Estimated unrecoverable containers, net of insurance deductible |
$ | 20,162 | ||
| Recovery costs |
19,159 | |||
| Accounts receivable coverage by insurance |
2,592 | |||
|
|
|
|||
| Insurance receivable associated with this bankruptcy customer as of December 31, 2016 |
41,913 | |||
| Recovery costs |
32,067 | |||
| Insurance proceeds received |
(50,479 | ) | ||
| Reassessment associated with estimate of unrecoverable containers to actual amount of loss commensurate with the insurance claim filing |
(7,592 | ) | ||
|
|
|
|||
| Insurance receivable to this bankruptcy customer as of December 31, 2017 |
$ | 15,909 | ||
|
|
|
In August 2015, one of the Company’s customers became insolvent and containers on operating and direct financing leases to the customer were deemed unlikely to be recovered. The Company maintains insurance that covers a portion of the exposure related to the value of containers that are unlikely to be recovered from its customers, the cost to recover containers and up to 183 days of lost lease rental income. Accordingly, during the year ended December 31, 2015, an impairment was recorded to write off containers, net and net investment in direct financing and sales-type leases with book values of $8,815 and $2,903, respectively. In addition, bad debt expense of $2,574 was recorded in the condensed consolidated statements of comprehensive (loss) income for the year ended December 31, 2015 to fully reserve for the customer’s outstanding accounts receivable. As of December 31, 2015, an insurance receivable of $11,436 was recorded for $8,796 of estimated proceeds for containers unlikely to be recovered, $1,685 of recovery costs recorded as a reduction to direct container expense and $955 of lost lease rental income recorded as a reduction to container impairment. The impairment net of estimated insurance proceeds of $1,968 was recorded in container impairment in the condensed consolidated statements of comprehensive (loss) income for the year ended December 31, 2015. An additional insurance receivable of $1,007 was recorded for the year ended December 31, 2016 for $768 of recovery costs recorded as a reduction to direct container expense and $239 of lost lease rental income recorded as a reduction to container impairment for the years ended December 31, 2016. For the year ended December 31, 2016, the Company received a total of $8,250 insurance proceeds for the Company’s owned fleet, which was recorded as a reduction to the insurance receivable. In addition, the Company received final insurance proceeds of $3,592 for the Company’s owned fleet during the first quarter of 2017 and accordingly, wrote-off the remaining balance of insurance receivable of $1,321 recorded a $469 increase to containers, net, a $1,052 increase to container impairment and a $200 reduction to recovery costs for the year ended December 31, 2016. A further allocation of $720 insurance receivable, $200 to recovery costs and a $920 reduction to container impairment was recorded for the year ended December 31, 2017.
F-25
Insurance receivable recorded on the Company’s owned fleet related to this insolvency customer are as follows:
| Insurance receivable associated with this insolvency customer as of December 31, 2015 |
$ | 11,436 | ||
| Recovery costs |
768 | |||
| Lost lease rental income |
239 | |||
| Wrote off of remaining balance of insurance receivable per final insurance proceeds received |
(1,321 | ) | ||
| Insurance proceeds received |
(8,250 | ) | ||
|
|
|
|||
| Insurance receivable associated with this insolvency customer as of December 31, 2016 |
2,872 | |||
| Allocation adjustment on insurance receivable per final insurance proceeds received |
720 | |||
| Final insurance proceeds received |
(3,592 | ) | ||
|
|
|
|||
| Insurance receivable to this insolvency customer as of December 31, 2017 |
$ | — | ||
|
|
|
(4) Container Purchases
In 2016, the Company concluded two separate purchases totaling approximately 41,100 containers from a third-party owner for total purchase consideration of approximately $71,000. The total purchase price, which was based on the fair value of the assets acquired, was recorded in our net investment in direct financing and sales-type leases. One of the purchases totaling approximately 38,600 containers for total purchase consideration of $55,000 was for containers leased to one of the Company’s customers which subsequently filed for bankruptcy in August 2016, see Note 3 “Insurance Receivable and Impairment”.
In 2017, the Company concluded three separate purchases totaling 19,802 containers that it had been managing for institutional investors, including related net investment in direct financing and sales-type leases, accounts receivable, due from owners, net, accounts payable and accrued expenses for total cash purchase consideration of $19,893. The Company previously managed these fleets for the institutional investors, accordingly, intangible asset for the management rights relinquished amounting to $170 was written-off. The total purchase price, which was allocated based on the fair value of the assets and liabilities acquired, was recorded as follows and there were no intangible assets recognized related to the leases:
| Containers, net |
$ | 18,453 | ||
| Other net assets |
1,440 | |||
|
|
|
|||
| $ | 19,893 | |||
|
|
|
(5) Purchase-leaseback Transactions
In 2016, the Company concluded two separate purchase leaseback transactions for 14,954 containers from a shipping company for total purchase consideration of $21,151. The purchase price and leaseback rental rates were below market rates. The leases also require the lessee to pay drop-off charges at above market rates when the containers are returned.
The containers were recorded at fair value and the difference between the purchase price and the fair value of the containers was recorded as prepaid expenses and other current assets, resulting in the following purchase price allocation:
| Containers, net |
$ | 14,015 | ||
| Prepaid expenses and other current assets |
7,136 | |||
|
|
|
|||
| Purchase price |
$ | 21,151 | ||
|
|
|
As the lessee returns containers, the balance of prepaid expenses and other current assets will be reduced by drop-off charges paid to the Company. The remaining balance of drop-off charges was $5,233 and $6,218 as of December 31, 2017 and 2016, respectively.
F-26
(6) Transactions with Affiliates and Owners
Amounts due from affiliates, net generally result from cash advances and the payment of affiliated companies’ administrative expenses by the Company on behalf of such affiliates. Balances are generally paid within 30 days.
Management fees, including acquisition fees and sales commissions during 2017, 2016 and 2015 were as follows:
| 2017 | 2016 | 2015 | ||||||||||
| Fees from affiliated Owner |
$ | 2,994 | $ | 2,994 | $ | 3,542 | ||||||
| Fees from unaffiliated Owners |
10,073 | 8,556 | 10,252 | |||||||||
|
|
|
|
|
|
|
|||||||
| Fees from Owners |
13,067 | 11,550 | 13,794 | |||||||||
| Other fees |
1,927 | 1,870 | 1,816 | |||||||||
|
|
|
|
|
|
|
|||||||
| Total management fees |
$ | 14,994 | $ | 13,420 | $ | 15,610 | ||||||
|
|
|
|
|
|
|
|||||||
Due to owners, net represents lease rentals collected on behalf of and payable to Owners, net of direct expenses and management fees receivable. Due to owners, net at December 31, 2017 and 2016 consisted of the following:
| 2017 | 2016 | |||||||
| Affiliated Owner |
$ | 1,409 | $ | 5,167 | ||||
| Unaffiliated Owners |
9,722 | 12,965 | ||||||
|
|
|
|
|
|||||
| Total due to Owners, net |
$ | 11,131 | $ | 18,132 | ||||
|
|
|
|
|
|||||
(7) Direct Financing and Sales-type Leases
The Company leases containers under direct financing and sales-type leases. The Company had 111,059 and 135,221 containers under direct financing and sales-type leases as of December 31, 2017 and 2016, respectively.
The components of the net investment in direct financing and sales-type leases, which are reported in the Company’s Container Ownership segment as of December 31, 2017 and 2016 were as follows:
| 2017 | 2016 | |||||||
| Future minimum lease payments receivable |
$ | 204,451 | $ | 269,256 | ||||
| Residual value of containers |
4,885 | — | ||||||
| Less unearned income |
(26,712 | ) | (32,022 | ) | ||||
|
|
|
|
|
|||||
| Net investment in direct financing and sales-type leases |
$ | 182,624 | $ | 237,234 | ||||
|
|
|
|
|
|||||
| Amounts due within one year |
$ | 56,959 | $ | 64,951 | ||||
| Amounts due beyond one year |
125,665 | 172,283 | ||||||
|
|
|
|
|
|||||
| Net investment in direct financing and sales-type leases |
$ | 182,624 | $ | 237,234 | ||||
|
|
|
|
|
|||||
In September 2016, net investment in direct financing leases with a balance of $88,171 was reclassified to containers, net due to one of the Company’s customers filing for bankruptcy in August 2016 (see Note 3 “Insurance Receivable and Impairment”).
The carrying value of TW’s net investment in direct financing and sales-type leases was $103,571 and $133,991 at December 31, 2017 and 2016, respectively.
The Company maintains detailed credit records about its container lessees. The Company’s credit committee sets different maximum exposure limits for its container lessees. The Company uses various credit criteria to set maximum exposure limits rather than a standardized internal credit rating. Credit criteria used by the Company to set maximum exposure limits may include, but are not limited to, container lessee trade route, country, social and political climate, assessments of net worth, asset ownership, bank and trade credit references, credit bureau reports, including those from Dynamar B.V. and Lloyd’s Marine Intelligence Unit
F-27
(common credit reporting agencies used in the maritime sector), operational history and financial strength. The Company monitors its container lessees’ performance and its lease exposures on an ongoing basis, and its credit management processes are aided by the long payment experience the Company has had with most of its container lessees and the Company’s broad network of long-standing relationships in the shipping industry that provide the Company current information about its container lessees.
If the aging of current billings for the Company’s direct financing and sales-type leases included in accounts receivable, net were applied to the related balances of the unbilled future minimum lease payments receivable component of the Company’s net investment in direct finance leases and sales-type leases as of December 31, 2017, the aging would be as follows:
| 1-30 days past due |
$ | 2,838 | ||
| 31-60 days past due |
21 | |||
| 61-90 days past due |
2,786 | |||
| Greater than 90 days past due |
31,682 | |||
|
|
|
|||
| Total past due |
37,327 | |||
| Current |
167,124 | |||
|
|
|
|||
| Total future minimum lease payments |
$ | 204,451 | ||
|
|
|
The Company maintains allowances, if necessary, for doubtful accounts and estimated losses resulting from the inability of its lessees to make required payments under direct financing and sales-type leases based on, but not limited to, each lessee’s payment history, management’s current assessment of each lessee’s financial condition and the adequacy of the fair value of containers that collateralize the leases compared to the book value of the related net investment in direct financing and sales-type leases. The changes in the carrying amount of the allowance for doubtful accounts related to billed amounts under direct financing and sales-type leases and included in accounts receivable, net, during the years ended December 31, 2017 and 2016 are as follows:
| Balance as of December 31, 2015 |
$ | 3,883 | ||
| Additions charged to expense |
9,140 | |||
| Write-offs |
(3,462 | ) | ||
|
|
|
|||
| Balance as of December 31, 2016 |
9,561 | |||
| Additions charged to expense |
525 | |||
| Write-offs |
(9,839 | ) | ||
|
|
|
|||
| Balance as of December 31, 2017 |
$ | 247 | ||
|
|
|
The following is a schedule by year of future minimum lease payments receivable under these direct financing and sales-type leases as of December 31, 2017:
| Year ending December 31: |
||||
| 2018 |
$ | 66,703 | ||
| 2019 |
48,192 | |||
| 2020 |
29,553 | |||
| 2021 |
34,862 | |||
| 2022 and thereafter |
25,141 | |||
|
|
|
|||
| Total future minimum lease payments receivable |
$ | 204,451 | ||
|
|
|
Lease rental income includes income earned from direct financing and sales-type leases in the amount of $13,417, $18,558 and $25,291 during 2017, 2016 and 2015, respectively. Amounts for 2016 and 2015 have been restated for immaterial corrections of identified errors pertaining to the classification of certain leases (see Note 2 “Immaterial Correction of Errors in Prior Periods”).
F-28
(8) Containers and Fixed Assets
Containers, net at December 31, 2017 and 2016 consisted of the following:
| 2017 | 2016 (1) | |||||||
| Containers |
$ | 4,963,965 | $ | 4,708,326 | ||||
| Less accumulated depreciation |
(1,172,355 | ) | (990,784 | ) | ||||
|
|
|
|
|
|||||
| Containers, net |
$ | 3,791,610 | $ | 3,717,542 | ||||
|
|
|
|
|
|||||
| (1) | Amount as of December 31, 2016 has been restated for immaterial corrections of identified errors related to the calculation of gain on sale of containers, net (see Note 2 “Immaterial Correction of Errors in Prior Periods”). |
Trading containers had carrying values of $10,752 and $4,363 as of December 31, 2017 and 2016, respectively, and are not subject to depreciation. Containers held for sale had carrying values of $22,089 and $25,513 as of December 31, 2017 and 2016, respectively, and are also not subject to depreciation. All owned containers are pledged as collateral for debt as of December 31, 2017 and 2016.
Fixed assets, net at December 31, 2017 and 2016 consisted of the following:
| 2017 | 2016 | |||||||
| Computer equipment and software |
$ | 9,563 | $ | 8,898 | ||||
| Office furniture and equipment |
1,428 | 1,408 | ||||||
| Automobiles |
36 | 34 | ||||||
| Leasehold improvements |
1,912 | 1,789 | ||||||
|
|
|
|
|
|||||
| 12,939 | 12,129 | |||||||
| Less accumulated depreciation |
(10,788 | ) | (10,136 | ) | ||||
|
|
|
|
|
|||||
| Fixed assets, net |
$ | 2,151 | $ | 1,993 | ||||
|
|
|
|
|
|||||
(9) Intangible Assets
The changes in the carrying amount of intangible assets during the years ended December 31, 2017, 2016 and 2015 are as follows:
| Balance as of December 31, 2014 |
$ | 24,991 | ||
| Amortization expense |
(4,741 | ) | ||
| Balance as of December 31, 2015 |
20,250 | |||
|
|
|
|||
| Amortization expense |
(5,053 | ) | ||
| Balance as of December 31, 2016 |
15,197 | |||
|
|
|
|||
| Amortization expense |
(3,922 | ) | ||
| Write-off from the relinquishment of management rights |
(170 | ) | ||
|
|
|
|||
| Balance as of December 31, 2017 |
$ | 11,105 | ||
|
|
|
The following is a schedule, by year, of future amortization of intangible assets as of December 31, 2017:
| Year ending December 31: |
||||
| 2018 |
$ | 4,207 | ||
| 2019 |
4,156 | |||
| 2020 |
2,742 | |||
|
|
|
|||
| Total future amortization of intangible assets |
$ | 11,105 | ||
|
|
|
F-29
(10) Accrued Expenses
Accrued expenses at December 31, 2017 and 2016 consisted of the following:
| 2017 | 2016 | |||||||
| Accrued compensation |
$ | 5,025 | $ | 3,049 | ||||
| Direct container expense |
4,521 | 2,014 | ||||||
| Interest payable |
3,157 | 3,402 | ||||||
| Other |
662 | 1,256 | ||||||
|
|
|
|
|
|||||
| Total accrued expenses |
$ | 13,365 | $ | 9,721 | ||||
|
|
|
|
|
|||||
(11) Income Taxes
The Company is not subject to taxation in its country of incorporation; however, the Company is subject to taxation in certain other jurisdictions due to the nature of the Company’s operations. The Company estimates its tax liability based upon its understanding of the tax laws of the various countries in which it operates. Income tax expense (benefit) for 2017, 2016 and 2015 consisted of the following:
| 2017 | 2016 | 2015 | ||||||||||
| Current |
||||||||||||
| Bermuda |
$ | — | $ | — | $ | — | ||||||
| Foreign |
2,142 | 930 | 3,648 | |||||||||
|
|
|
|
|
|
|
|||||||
| 2,142 | 930 | 3,648 | ||||||||||
|
|
|
|
|
|
|
|||||||
| Deferred |
||||||||||||
| Bermuda |
— | — | — | |||||||||
| Foreign |
(524 | ) | (4,377 | ) | 3,047 | |||||||
|
|
|
|
|
|
|
|||||||
| (524 | ) | (4,377 | ) | 3,047 | ||||||||
|
|
|
|
|
|
|
|||||||
| $ | 1,618 | $ | (3,447 | ) | $ | 6,695 | ||||||
|
|
|
|
|
|
|
|||||||
The components of income (loss) before income taxes and noncontrolling interest were as follows:
| 2017 | 2016 (1) | 2015 | ||||||||||
| Bermuda sources |
$ | — | $ | — | $ | — | ||||||
| Foreign sources |
22,360 | (61,323 | ) | 120,679 | ||||||||
|
|
|
|
|
|
|
|||||||
| $ | 22,360 | $ | (61,323 | ) | $ | 120,679 | ||||||
|
|
|
|
|
|
|
|||||||
A reconciliation of the differences between the Bermuda statutory income tax rate and the effective tax rate as provided in the consolidated statements of comprehensive (loss) income is as follows:
| 2017 | 2016 (1) | 2015 | ||||||||||||||||||||||
| Bermuda tax rate |
$ | — | 0.00 | % | $ | — | 0.00 | % | $ | — | 0.00 | % | ||||||||||||
| Foreign tax rate |
1,297 | (5.80 | )% | 5,339 | 8.80 | % | (4,343 | ) | 3.60 | % | ||||||||||||||
| Tax uncertainties |
(2,915 | ) | 13.04 | % | (1,892 | ) | (3.18 | )% | (2,352 | ) | 1.95 | % | ||||||||||||
|
|
|
|
|
|
|
|
|
|
|
|
|
|||||||||||||
| $ | (1,618 | ) | 7.24 | % | $ | 3,447 | 5.62 | % | $ | (6,695 | ) | 5.55 | % | |||||||||||
|
|
|
|
|
|
|
|
|
|
|
|
|
|||||||||||||
| (1) | Amounts for 2016 have been restated for immaterial corrections of identified errors pertaining to the calculation of gain on sale of containers, net and to properly account for lease concessions (see Note 2 “Immaterial Correction of Errors in Prior Periods”). |
F-30
The tax effects of temporary differences that give rise to significant portions of the deferred tax assets and deferred tax liabilities at December 31, 2017 and 2016 are presented below:
| 2017 | 2016 | |||||||
| Deferred tax assets |
||||||||
| Net operating loss carryforwards |
$ | 19,209 | $ | 26,605 | ||||
| Other |
1,557 | 1,811 | ||||||
|
|
|
|
|
|||||
| 20,766 | 28,416 | |||||||
| Valuation allowance (net operating loss) |
(1,138 | ) | (678 | ) | ||||
|
|
|
|
|
|||||
| Deferred tax assets |
19,628 | 27,738 | ||||||
|
|
|
|
|
|||||
| Deferred tax liabilities |
||||||||
| Containers, net |
23,275 | 31,778 | ||||||
| Other |
671 | 812 | ||||||
|
|
|
|
|
|||||
| Deferred tax liabilities |
23,946 | 32,590 | ||||||
|
|
|
|
|
|||||
| Net deferred tax liabilities |
$ | 4,318 | $ | 4,852 | ||||
|
|
|
|
|
|||||
In assessing the extent to which deferred tax assets are realizable, the Company’s management considers whether it is more likely than not that the deferred tax assets will be realized. The ultimate realization of deferred tax assets is dependent upon the generation of future taxable income during the periods in which those temporary differences become deductible. The Company’s management considers the projected future reversal of taxable temporary items for making this assessment. Based upon the projections for the reversal of taxable temporary items over the periods in which the deferred tax assets are deductible, the Company’s management believes it is more likely than not the Company will not realize a portion of the benefits of these deductible differences, thus a valuation allowance has been provided.
The Company has net operating loss carry-forwards of $113,228 that will begin to expire from December 31, 2018 through December 31, 2037 if not utilized. The Company expects to utilize the net operating loss carry-forwards prior to their expiration, net of the valuation allowance.
The accompanying consolidated financial statements do not reflect the income taxes that would be payable to foreign taxing jurisdictions if the earnings of a group of corporations operating in those jurisdictions were to be transferred out of such jurisdictions, because such earnings are intended to be permanently reinvested in those countries. At December 31, 2017, cumulative earnings of approximately $36,527 would be subject to income taxes of approximately $10,958 if such earnings of foreign corporations were transferred out of such jurisdictions in the form of dividends.
The Company’s foreign tax returns, including the United States, State of California, State of New Jersey, State of Texas, Malaysia, Singapore, and United Kingdom, are subject to examination by the various tax authorities. The Company’s foreign tax returns are no longer subject to examinations by taxing authorities for years before 2011, except for its United Kingdom tax returns which are no longer subject to examinations for years before 2011.
The U.S. Tax Cuts and Job Act of 2017 (TCJA) was signed into law on December 22, 2017. The TCJA significantly revised the U.S. federal corporate income tax by, among other things, lowering the corporate income tax rate, implementing a territorial tax system, imposing a repatriation tax on earnings of foreign subsidiaries that are deemed to be repatriated to the United States, imposing limitations on the deduction of interest expense and executive compensation, and the creation of the base erosion anti-abuse tax (BEAT), a new minimum tax.
The most significant effect of TCJA on the Company was the U.S. federal corporate tax rate reduction from 35% to 21%. A change in tax law is accounted for in the period of enactment, which require re-measurement of all our U.S. deferred income tax asset and liabilities during this year-end As the Company is in an overall net deferred tax liability position, the corporate tax rate reduction results in a net tax benefit of $2,653 in 2017, when the deferred tax assets and liabilities are revalued downward. In addition, the Company’s 2017 effective tax rate was favorably affected by 11.9% due to the TCJA.
On the other significant provisions that are not yet effective but may impact the Company’s income taxes in future taxes such as limitation on the deduction of interest expense in excess of 30 percent of adjusted taxable income, limitation of net operating losses generated after fiscal year 2017 to 80 percent of taxable income and an incremental tax on BEAT.
F-31
A reconciliation of the beginning and ending unrecognized tax benefit amounts for 2017 and 2016 are as follows:
| Balance at December 31, 2015 |
$ | 12,065 | ||
| Increases related to prior year tax positions |
— | |||
| Decreases related to prior year tax positions |
(204 | ) | ||
| Increases related to current year tax positions |
2,378 | |||
| Lapse of statute of limitations |
(908 | ) | ||
|
|
|
|||
| Balance at December 31, 2016 |
13,331 | |||
| Increases related to prior year tax positions |
100 | |||
| Decreases related to prior year tax positions |
(12 | ) | ||
| Increases related to current year tax positions |
3,642 | |||
| Lapse of statute of limitations |
(911 | ) | ||
|
|
|
|||
| Balance at December 31, 2017 |
$ | 16,150 | ||
|
|
|
If the unrecognized tax benefits of $16,150 at December 31, 2017 were recognized, tax benefits in the amount of $16,102 would reduce our annual effective tax rate. The Company believes the total amount of unrecognized tax benefit as of December 31, 2017 will decrease by $1,138 in the next twelve months due to expiration of the statute of limitations, which would reduce our annual effective tax rate.
Interest and penalty expense recorded during 2017, 2016 and 2015 amounted to $181, $281 and $70, respectively. Total accrued interest and penalties as of December 31, 2017 and 2016 were $1,108 and $926, respectively, and were included in non-current income taxes payable.
(12) Secured Debt Facilities, Credit Facilities, Term Loan and Bonds Payable, and Derivative Instruments
The following represents the Company’s debt obligations as of December 31, 2017 and 2016:
| Secured Debt Facilities, Credit Facilities, Term Loan and Bonds Payable |
2017 | 2016 | ||||||||||||||||||
| Outstanding | Average Interest |
Outstanding | Average Interest |
Final Maturity | ||||||||||||||||
| TMCL II Secured Debt Facility (1) |
$ | 659,714 | 3.38 | % | $ | 951,923 | 2.40 | % | August 2024 | |||||||||||
| TMCL IV Secured Debt Facility (1) (2) |
132,885 | 4.00 | % | 140,202 | 2.69 | % | February 2020 | |||||||||||||
| TL Revolving Credit Facility |
568,403 | 3.56 | % | 671,060 | 2.50 | % | June 2020 | |||||||||||||
| TL Revolving Credit Facility II |
150,906 | 3.55 | % | 174,005 | 2.44 | % | July 2020 | |||||||||||||
| TW Credit Facility |
97,148 | 3.38 | % | 122,723 | 2.63 | % | September 2026 | |||||||||||||
| TAP Funding Revolving Credit Facility |
163,276 | 3.43 | % | 149,230 | 2.45 | % | December 2021 | |||||||||||||
| TL Term Loan |
352,555 | 3.69 | % | 394,732 | 2.59 | % | April 2019 | |||||||||||||
| 2013-1 Bonds |
— | — | 200,595 | 3.90 | % | September 2038 | ||||||||||||||
| 2014-1 Bonds |
— | — | 233,827 | 3.27 | % | October 2039 | ||||||||||||||
| 2017-1 Bonds |
390,013 | 3.91 | % | — | — | May 2042 | ||||||||||||||
| 2017-2 Bonds |
475,408 | 3.73 | % | — | — | June 2042 | ||||||||||||||
|
|
|
|
|
|||||||||||||||||
| Total debt obligations |
$ | 2,990,308 | $ | 3,038,297 | ||||||||||||||||
|
|
|
|
|
|||||||||||||||||
| Amount due within one year |
$ | 233,681 | $ | 205,081 | ||||||||||||||||
|
|
|
|
|
|||||||||||||||||
| Amounts due beyond one year |
$ | 2,756,627 | $ | 2,833,216 | ||||||||||||||||
|
|
|
|
|
|||||||||||||||||
| (1) | Final maturity of the TMCL II Secured Debt Facility and TMCL IV Secured Debt Facility are based on the assumptions that both facilities will not be extended on their associated conversion dates. |
F-32
| (2) | On January 31, 2018, the TMCL IV Secured Debt Facility was terminated and the unpaid debt amount was fully repaid by proceeds primarily from the TL Revolving Credit Facility (see Note 17 “Subsequent Events”). |
Secured Debt Facilities
| (a) | TMCL II |
TMCL II has a securitization facility (the “TMCL II Secured Debt Facility”) that provides for an aggregate commitment amount of up to $1,200,000. There is a commitment fee on the unused amount of the total commitment, payable monthly in arrears. TMCL II’s primary ongoing container financing requirements have been funded by commitments under the TMCL II Secured Debt Facility. The advance rates under the TMCL II Secured Debt Facility were 80.0% and 72.5% at December 31, 2017 and 2016, respectively. TMCL II is required to maintain restricted cash balances on deposit in a designated bank account equal to five months of interest expense.
On February 27, 2017, TMCL II entered into an amendment of the TMCL II Secured Debt which revised certain of the covenants and restrictions, and increased the interest rate.
On August 31, 2017, TMCL II entered into an amendment which extended the conversion date to August 2020, and lowered the interest rate to one-month LIBOR plus 1.90%, payable monthly in arrears, during the revolving period prior to the conversion date. The amendment also replaced the borrowing capacity of two of the TMCL II Secured Debt Facility lenders with three other lenders and, accordingly, the Company wrote off $238 of unamortized debt issuance costs in August 2017.
| (b) | TMCL IV |
TMCL IV had a securitization facility (the “TMCL IV Secured Debt Facility”) that provided for an aggregate commitment amount of up to $300,000. There is a commitment fee on the unused amount of the total commitment, payable monthly in arrears. Final legal payment date was two years after the Conversion Date (February 2, 2018) if the TMCL IV Secured Debt Facility was not renewed by the Conversion Date. TMCL IV’s ongoing container financing requirements had been funded by commitments under the TMCL IV Secured Debt Facility. The advance rates under the TMCL IV Secured Debt Facility were 80.0% and 72.5% at December 31, 2017 and 2016, respectively. TMCL IV was required to maintain restricted cash balances on deposit in a designated bank account equal to five months of interest expense.
On February 27, 2017, TMCL IV entered into an amendment of the TMCL IV Secured Debt Facility which revised certain of the covenants and restrictions, and increased interest margin from 1.95% to 2.50%.
On January 31, 2018, the TMCL IV Secured Debt Facility was terminated and the unpaid debt amount of $129,400 was fully repaid by $124,608 proceeds from the TL Revolving Credit Facility and TMCL IV’s available cash of $4,792.
Under the terms of the TMCL II Secured Debt Facility and TMCL IV Secured Debt Facility, the total outstanding principal of each of these two programs may not exceed the lesser of the commitment amount and an amount that is calculated based on TMCL II and TMCL IV’s book value of equipment, restricted cash and net investment in direct financing and sales-type leases as specified in each of the relevant secured debt facility indentures (the “Asset Base”). The total obligations under the TMCL II Secured Debt Facility and the TMCL IV Secured Debt Facility are secured by a pledge of TMCL II and TMCL IV’s assets, respectively. As of December 31, 2017, TMCL II Secured Debt Facility and TMCL IV Secured Debt Facility’s Asset Base amounted to $723,991 and $159,128, respectively and TMCL II and TMCL IV’s total assets amounted to $1,088,797 and $218,145, respectively.
Credit Facilities
| (a) | TL |
TL has a revolving credit facility (the “TL Revolving Credit Facility”) that provides for an aggregate commitment amount of up to $700,000 (which includes a $50,000 letter of credit facility). There is a commitment fee on the unused amount of the total commitment, payable quarterly in arrears. The TL Revolving Credit Facility provides for payments of interest only during its term beginning on its inception
F-33
date through June 19, 2020 when all borrowings are due in full. Interest on the outstanding amount due under the TL Revolving Credit Facility is based either on the base rate for Base Rate loans plus a spread between 1.50% and 2.00% or LIBOR for Eurodollar rate loans plus a spread between 2.00% and 2.50%, as defined in the credit agreement, which varied based on TGH’s leverage. TL’s primary ongoing container financing requirements have been funded by commitments under the TL Revolving Credit Facility. The advance rates under the TL Revolving Credit Facility were 84.5% and 85.0% at December 31, 2017 and 2016, respectively. Interest payments on Base Rate loans and Eurodollar rate loans are payable in arrears on the last day of each calendar month and on the last day of each interest period, respectively.
TL has another revolving credit facility (the “TL Revolving Credit Facility II”) that provides for an aggregate commitment amount of up to $190,000. There is a commitment fee on the unused amount of the total commitment, payable quarterly in arrears. The TL Revolving Credit Facility II provides for payments of interest only during its term beginning on its inception date through July 23, 2020, when all borrowings are due in full. Interest on the outstanding amount due under the TL Revolving Credit Facility II is based either on the base rate for Base Rate loans plus a spread between 1.50% and 2.00% or LIBOR for Eurodollar rate loans plus a spread between 2.00% and 2.50%, as defined in the credit agreement, which varies based on TGH’s leverage. The advance rates under the TL Revolving Credit Facility II were 84.5% and 85.0% at December 31, 2017 and 2016, respectively. Interest payments on Base Rate loans and Eurodollar rate loans are payable in arrears on the last day of each interest period, not to exceed three months, and on the last day of each calendar month, respectively.
On February 27, 2017 and October 31, 2017, TL entered into amendments of the TL Revolving Credit Facility and TL Revolving Credit Facility II which revised certain of the covenants and restrictions and increased the interest rate.
The TL Revolving Credit Facility and the TL Revolving Credit Facility II are each secured by segregated pools of TL’s containers and under the terms of both facilities, the total outstanding principal may not exceed the lesser of the commitment amount and an amount (the “Asset Base”), which is based on a formula based on TL’s net book value of containers and net investment in direct financing and sales-type leases designated to each of the TL Revolving Credit Facility and TL Revolving Credit Facility II. As of December 31, 2017, TL Revolving Credit Facility and the TL Revolving Credit Facility II’s Asset Base amounted to $662,925 and $156,110, respectively. TGH acts as an unconditional guarantor of the TL Revolving Credit Facility and the TL Revolving Credit Facility II. The Company had no outstanding letters of credit under the TL Revolving Credit Facility as of December 31, 2017 and 2016.
| (b) | TW |
TW has a credit agreement, with Wells Fargo Bank N.A. as the lender, which provided for a revolving credit facility with an aggregate commitment amount of up to $300,000 (the “TW Credit Facility”). The revolving credit period was terminated on July 29, 2016 through an amendment. TW is required to make monthly principal pay downs from its available funds, net revenue collection after interest payment, interest rate hedging payment and certain management fees, until the outstanding balance is fully repaid prior to final maturity. Interest on the outstanding amount due under the TW Credit Facility is based on one-month LIBOR plus 2.0%, payable monthly in arrears. The advance rates under the TW Credit Facility were 90% and 80% for containers under operating leases and net investment in direct financing and sales-type leases, respectively, at both December 31, 2017 and 2016. TW is required to maintain restricted cash balances on deposit in a designated bank account equal to three months of interest expense.
The TW Credit Facility is secured by a pledge of TW’s total assets and under the terms of the TW Credit Facility, the total outstanding principal may not exceed the lesser of the commitment amount and an amount that is based on a formula based on TW’s net book value of containers, restricted cash and net investment in direct financing and sales-type leases (the “Asset Base”). As of December 31, 2017, TW Credit Facility’s Asset Base and TW’s total assets amounted to $106,786 and $134,997, respectively.
| (c) | TAP Funding |
TAP Funding has a credit agreement, that provides for a revolving credit facility with an aggregate commitment amount of up to $190,000 (the “TAP Funding Revolving Credit Facility”). There is a commitment fee on the unused amount of the total commitment, payable monthly in arrears. TAP Funding’s primary ongoing container financing requirements have been funded by commitments under the TAP Funding
F-34
Revolving Credit Facility. The advance rates under the TAP Funding Revolving Credit Facility were 80.0% and 77.0% at December 31, 2017 and 2016, respectively. TAP Funding is required to maintain restricted cash balances on deposit in a designated bank account equal to five months of interest expense. Interest on the outstanding amount due under the TAP Funding Revolving Credit Facility is based on one-month LIBOR plus 1.95%, payable monthly in arrears.
On February 27, 2017, TAP Funding entered into an amendment of the TAP Funding Revolving Credit Facility which revised certain of the covenants and restrictions.
On December 8, 2017, TAP Funding entered into an amendment of the TAP Funding Revolving Credit Facility which extended the maturity date to December 7, 2021, increased the advance rate from 77.0% to 80.0%, lowered the interest margin from 2.25% to 1.95% and increased the aggregate commitment amount from $150,000 to $190,000.
The TAP Funding Revolving Credit Facility is secured by a pledge of TAP Funding’s total assets and under the terms of the TAP Funding Revolving Credit Facility, the total outstanding principal may not exceed the lesser of the commitment amount and an amount (the “Asset Base”), which is based on a formula based on TAP Funding’s net book value of containers and direct financing and sales-type leases. As of December 31, 2017, TAP Funding Revolving Credit Facility’s Asset Base and TAP Funding’s total assets amounted to $164,213 and $220,747, respectively.
Term Loan
TL has a $500,000 five-year term loan (the “TL Term Loan”) that represents a partially-amortizing term loan with the remaining principal due in full on April 30, 2019. Interest on the outstanding amount due under the TL Term Loan is based on the base rate for Base Rate loans plus a spread between 1.50% and 2.00% or LIBOR for Eurodollar rate loans plus a spread between 2.00% and 2.50%, as defined in the credit agreement, which is based upon TGH’s leverage. Under the terms of the TL Term Loan, scheduled principal repayments are payable in twenty quarterly installments, consisting of nineteen quarterly installments, commencing on September 30, 2014, each in an amount equal to 1.58% of the initial principal balance and one final installment payable on the Maturity Date (April 30, 2019). The advance rates under the TL Term Loan were 84.5% and 85.0% at December 31, 2017 and 2016, respectively. Interest payments are payable in arrears on the last day of each interest period, not to exceed three months.
On February 27, 2017 and October 31, 2017, TL entered into amendments of the TL Term Loan which revised certain of the covenants and restrictions, and increased the interest rate.
The TL Term Loan is secured by a segregated pool of the Company’s containers and under the terms of the TL Term Loan, the total outstanding principal may not exceed the lesser of the commitment amount and an amount that is based on a formula based on TL’s net book value of containers and net investment in direct financing and sales-type leases designated to the TL Term Loan (the “Asset Base”). As of December 31, 2017, TL Term Loan’s Asset Base amounted to $364,186. TGH acts as an unconditional guarantor of the TL Term Loan.
Bonds Payable
| (a) | TMCL III |
Textainer Marine Containers III Limited (“TMCL III”) (a Bermuda Company), one of the Company’s wholly-owned subsidiaries, issued $300,900 aggregate principal amount of Series 2013-1 Fixed Rate Asset Backed Notes (the “2013-1 Bonds”) and $301,400 aggregate principal amount of Series 2014-1 Fixed Rate Asset Backed Notes (the “2014-1 Bonds”) to qualified institutional investors pursuant to Rule 144A under the Securities Act and to non-U.S. persons in accordance with Regulation S promulgated under the Securities Act.
The 2013-1 Bonds were issued at 99.5% of par value, resulting in a discount of $1,542 which is being accreted to interest expense using the interest rate method over a 10 year term. The $300,900 in 2013-1 Bonds represent fully amortizing notes payable on a straight-line basis over a scheduled payment term of 10 years, but not to exceed a maximum payment term of 25 years. Both principal and interest incurred were payable
F-35
monthly in arrears. The target final payment date and legal final payment date was September 20, 2023 and September 20, 2038, respectively. TMCL III was required to maintain restricted cash balances on deposit in a designated bank account equal to nine months of interest expense on the 2013-1 Bonds.
The 2014-1 Bonds were issued at 99.9% of par value, resulting in a discount of $102 which is being accreted to interest expense using the interest rate method over a 10 year term. The $301,400 in 2014-1 Bonds represent fully amortizing notes payable on a straight-line basis over a scheduled payment term of 10 years, but not to exceed a maximum payment term of 25 years. Both principal and interest incurred were payable monthly in arrears. The target final payment date and legal final payment date was October 20, 2024 and October 20, 2039, respectively. TMCL III was required to maintain restricted cash balances on deposit in a designated bank account equal to nine months of interest expense on the 2014-1 Bonds.
On April 20, 2017, TMCL III entered into $406,000 of one-year floating rate asset-backed notes (the “2017-A Notes”) with a group of financial institutions. Interest on the outstanding amount due under the 2017-A Notes was based on adjusted LIBOR plus a spread of 3.0%. The entire proceeds of the 2017-A Notes with TMCL III’s available cash was used to fully repay the unpaid principal amount of $195,585 and $228,562 of the 2013-1 Bonds and the 2014-1 Bonds, respectively, on April 20, 2017.
On May 17, 2017, the TMCL III 2017-A Notes were fully repaid by proceeds from the sale of TMCL III’s containers to Textainer Marine Containers V Limited’s (“TMCL V”) (a Bermuda Company), one of the Company’s wholly-owned subsidiaries, and TMCL III’s available cash.
Unamortized debt issuance costs and unamortized bond discounts of the 2013-1 Bonds, the 2014-1 Bonds and the 2017-A Notes in an aggregate amount of $7,228 was written-off in second quarter of 2017.
| (b) | TMCL V |
On May 17, 2017, TMCL V issued the Series 2017-1 Fixed Rate Asset Backed Notes (the “2017-1 Bonds”), $350,000 aggregate Class A principal amount and $70,000 aggregate Class B principal amount of 2017-1 Bonds, to qualified institutional investors pursuant to Rule 144A under the Securities Act and to non-U.S. persons in accordance with Regulation S promulgated under the Securities Act. The $420,000 in 2017-1 Bonds represent fully amortizing notes payable over a scheduled payment term of 9 years, but not to exceed a maximum payment term of 25 years. The target final payment date and legal final payment date are May 20, 2026 and May 20, 2042, respectively. Both principal and interest incurred are payable monthly in arrears. The advance rate under the 2017-1 Bonds was 75.2% at December 31, 2017. TMCL V was required to maintain restricted cash balances on deposit in a designated bank account equal to nine months of interest expense on the 2017-1 Bonds. Proceeds from the 2017-1 Bonds was used to acquire containers from TMCL III and for general corporate purposes. The 2017-1 Bonds are secured by a pledge of TMCL V’s total assets.
On June 28, 2017, TMCL V issued the Series 2017-2 Fixed Rate Asset Backed Notes (the “2017-2 Bonds”), $416,000 aggregate Class A principal amount and $84,000 aggregate Class B principal amount of 2017-2 Bonds, to qualified institutional investors pursuant to Rule 144A under the Securities Act and to non-U.S. persons in accordance with Regulation S promulgated under the Securities Act. The $500,000 in 2017-2 Bonds represent fully amortizing notes payable over a scheduled payment term of 9 years, but not to exceed a maximum payment term of 25 years. The target final payment date and legal final payment date are June 20, 2026 and June 20, 2042, respectively. Both principal and interest incurred are payable monthly in arrears. The advance rate under the 2017-2 Bonds was 77.6% at December 31, 2017. TMCL V was required to maintain restricted cash balances on deposit in a designated bank account equal to nine months of interest expense on the 2017-2 Bonds. Proceeds from the 2017-2 Bonds was used to acquire containers from TL and TMCL II and for general corporate purposes. The 2017-2 Bonds are secured by a pledge of TMCL V’s total assets.
Under the terms of the 2017-1 Bonds and the 2017-2 Bonds, the total outstanding principal may not exceed an amount that is based on a formula based on TMCL V’s book value of equipment, restricted cash and net investment in direct financing and sales-type leases as specified in the bond indenture (the “Asset Base”). The total obligations under the 2017-1 Bonds and the 2017-2 Bonds are secured by a pledge of TMCL V’s assets. As of December 31, 2017, the 2017-1 Bonds and the 2017-2 Bonds’ Asset Base amounted to $395,892 and $482,198, respectively, and TMCL V’s total assets amounted to $1,179,021.
F-36
Restrictive Covenants
The Company’s secured debt facilities, revolving credit facilities, the TL Term Loan, the 2017-1 Bonds and the 2017-1 Bonds contain restrictive covenants, including limitations on certain liens, indebtedness and investments.
| • | The TL Revolving Credit Facility, TL Revolving Credit Facility II and the TL Term Loan contain certain restrictive financial covenants on TGH’s consolidated tangible net worth and TGH and TL’s leverage coverage. |
| • | The TMCL II Secured Debt Facility, the TMCL IV Secured Debt Facility, the TW Credit Facility, the TAP Funding Revolving Credit Facility, the 2017-1 Bonds and the 2017-2 Bonds contain restrictive covenants on TGH’s leverage, debt service coverage, TGH’s container management subsidiary net income and debt levels. |
| • | The TMCL II Secured Debt Facility and TMCL IV Secured Debt Facility also contain restrictive covenants regarding certain containers sales proceeds ratio. |
| • | The TW Credit Facility also contains restrictive covenants limiting TW’s finance lease default ratio and debt service coverage ratio. |
| • | The TMCL II Secured Debt Facility, the TMCL IV Secured Debt Facility, the TAP Funding Revolving Credit Facility, the 2017-1 Bonds and the 2017-2 Bonds also contain restrictive covenants’ regarding certain debt service ratios and the average age of the underlying container fleets securing each of these obligations. |
| • | The TMCL II Secured Debt Facility, the TMCL IV Secured Debt Facility, the 2017-1 Bonds and the 2017-2 Bonds also contain restrictive covenants on TMCL II, TMCL IV and TMCL V’s ability to incur other obligations and distribute earnings, respectively. |
| • | All of the Company’s debt facilities also contain restrictive covenants on borrowing base minimums. |
| • | TGH and its subsidiaries were in full compliance with these restrictive covenants at December 31, 2017. |
| • | The following is a schedule of future scheduled repayments, by year, and borrowing capacities, as of December 31, 2017: |
| Twelve months ending December 31, | Available borrowing, as limited by the |
Current and | ||||||||||||||||||||||||||||||
| 2018 | 2019 | 2020 | 2021 | 2022 and thereafter |
Total Borrowing |
Borrowing Base |
Available Borrowing |
|||||||||||||||||||||||||
| TMCL II Secured Debt (1) Facility |
$ | — | $ | — | $ | 22,136 | $ | 66,475 | $ | 576,140 | $ | 664,751 | $ | 58,648 | $ | 723,399 | ||||||||||||||||
| TMCL IV Secured Debt (1) (2) Facility |
48,000 | 48,000 | 37,000 | — | — | 133,000 | 26,127 | 159,127 | ||||||||||||||||||||||||
| TL Revolving Credit Facility |
— | — | 574,000 | — | — | 574,000 | 70,956 | 644,956 | ||||||||||||||||||||||||
| TL Revolving Credit Facility II |
36,000 | 36,000 | 80,000 | — | — | 152,000 | 4,110 | 156,110 | ||||||||||||||||||||||||
| TW Credit Facility |
26,793 | 21,854 | 25,654 | 17,009 | 5,838 | 97,148 | — | 97,148 | ||||||||||||||||||||||||
| TAP Funding Revolving Credit Facility |
9,600 | 9,600 | 9,600 | 135,900 | — | 164,700 | — | 164,700 | ||||||||||||||||||||||||
| TL Term Loan |
39,600 | 314,400 | — | — | — | 354,000 | — | 354,000 | ||||||||||||||||||||||||
| 2017-1 Bonds |
37,065 | 38,331 | 39,357 | 52,173 | 227,349 | 394,275 | — | 394,275 | ||||||||||||||||||||||||
| 2017-2 Bonds (3) |
40,627 | 40,968 | 43,958 | 55,259 | 299,730 | 480,542 | — | 480,542 | ||||||||||||||||||||||||
|
|
|
|
|
|
|
|
|
|
|
|
|
|
|
|
|
|||||||||||||||||
| Total (4) |
$ | 237,685 | $ | 509,153 | $ | 831,705 | $ | 326,816 | $ | 1,109,057 | $ | 3,014,416 | $ | 159,841 | $ | 3,174,257 | ||||||||||||||||
|
|
|
|
|
|
|
|
|
|
|
|
|
|
|
|
|
|||||||||||||||||
| (1) | Future scheduled payments for TMCL II and TMCL IV Secured Debt Facility are based on the assumptions that both facilities will not be extended on their associated conversion dates. |
F-37
| (2) | On January 31, 2018, the TMCL IV Secured Debt Facility was termination and the unpaid debt amount was fully repaid by proceeds primarily from the TL Revolving Credit Facility (see Note 17 “Subsequent Events”). |
| (3) | Future scheduled payments for 2017-2 Bonds exclude an unamortized discount of $75. |
| (4) | Future scheduled payments for all debts exclude prepaid debt issuance costs in an aggregate amount of $24,034. |
Derivative Instruments
The Company has entered into several interest rate cap, collar and swap agreements with several banks to reduce the impact of changes in interest rates associated with its debt obligations. The following is a summary of the Company’s derivative instruments as of December 31, 2017:
| Notional | ||||
| Derivative instruments |
amount | |||
| Interest rate swap contracts with several banks, with fixed rates between 0.60% and 1.98% per annum, amortizing notional amounts, with termination dates through July 15, 2023 |
$ | 1,067,530 | ||
| Interest rate collar contracts with a bank which cap rates between 1.26% and 2.18% per annum, and sets floors for rates between 0.76% and 1.68% per annum, amortizing notional amount, with termination dates through June 15, 2023 |
78,713 | |||
| Interest rate cap contracts with several banks with fixed rates between 3.70% and 4.49% per annum, nonamortizing notional amounts, with termination dates through December 15, 2019 |
138,000 | |||
|
|
|
|||
| Total notional amount as of December 31, 2017 |
$ | 1,284,243 | ||
|
|
|
|||
The Company’s interest rate swap, collar and cap agreements had a fair value asset and liability of $7,787 and $81 as of December 31, 2017, respectively, and a fair value asset and a fair value liability of $4,816 and $1,204 as of December 31, 2016, respectively, which are inclusive of counterparty risk. The primary external risk of the Company’s interest rate swap agreements is the counterparty credit exposure, as defined as the ability of a counterparty to perform its financial obligations under a derivative contract. The Company monitors its counterparties’ credit ratings on an on-going basis and they were in compliance with the related derivative agreements at December 31, 2017. The Company does not have any master netting arrangements with its counterparties. The Company’s fair value assets and liabilities for its interest rate swap, collar and cap agreements are included in interest rate swaps, collars and caps in the accompanying condensed consolidated balance sheets. The change in fair value was recorded in the condensed consolidated statements of comprehensive income (loss) as unrealized gains (losses) on interest rate swaps, collars and caps, net.
F-38
(13) Segment Information
As described in Note 1(a) “Nature of Operations”, the Company operates in three reportable segments: Container Ownership, Container Management and Container Resale. The following tables show segment information for 2017, 2016 and 2015, reconciled to the Company’s income before income tax and noncontrolling interests as shown in its consolidated statements of comprehensive income:
| Container | Container | Container | ||||||||||||||||||||||
| 2017 |
Ownership | Management | Resale | Other | Eliminations | Totals | ||||||||||||||||||
| Lease rental income |
$ | 442,219 | $ | 2,669 | $ | — | $ | — | $ | — | $ | 444,888 | ||||||||||||
| Management fees from external customers |
266 | 9,953 | 4,775 | — | — | 14,994 | ||||||||||||||||||
| Inter-segment management fees |
— | 39,529 | 9,477 | — | (49,006 | ) | — | |||||||||||||||||
| Trading container sales proceeds |
— | — | 4,758 | — | — | 4,758 | ||||||||||||||||||
| Gain on sale of containers, net |
26,210 | — | — | — | — | 26,210 | ||||||||||||||||||
|
|
|
|
|
|
|
|
|
|
|
|
|
|||||||||||||
| Total revenue |
$ | 468,695 | $ | 52,151 | $ | 19,010 | $ | — | $ | (49,006 | ) | $ | 490,850 | |||||||||||
|
|
|
|
|
|
|
|
|
|
|
|
|
|||||||||||||
| Depreciation expense |
$ | 236,577 | $ | 776 | $ | — | $ | — | $ | (6,310 | ) | $ | 231,043 | |||||||||||
|
|
|
|
|
|
|
|
|
|
|
|
|
|||||||||||||
| Container impairment |
$ | 8,072 | $ | — | $ | — | $ | — | $ | — | $ | 8,072 | ||||||||||||
|
|
|
|
|
|
|
|
|
|
|
|
|
|||||||||||||
| Interest expense |
$ | 117,475 | $ | — | $ | — | $ | — | $ | — | $ | 117,475 | ||||||||||||
|
|
|
|
|
|
|
|
|
|
|
|
|
|||||||||||||
| Write-off of unamortized deferred debt issuance costs and bond discounts |
$ | 7,550 | $ | — | $ | — | $ | — | $ | — | $ | 7,550 | ||||||||||||
|
|
|
|
|
|
|
|
|
|
|
|
|
|||||||||||||
| Unrealized gains on interest rate swaps, collars and caps, net |
$ | 4,094 | $ | — | $ | — | $ | — | $ | — | $ | 4,094 | ||||||||||||
|
|
|
|
|
|
|
|
|
|
|
|
|
|||||||||||||
| Segment (loss) income before income tax and noncontrolling interests |
$ | (1,707 | ) | $ | 15,376 | $ | 10,854 | $ | (3,568 | ) | $ | 1,405 | $ | 22,360 | ||||||||||
|
|
|
|
|
|
|
|
|
|
|
|
|
|||||||||||||
| Total assets |
$ | 4,316,272 | $ | 139,989 | $ | 10,873 | $ | 6,859 | $ | (93,651 | ) | $ | 4,380,342 | |||||||||||
|
|
|
|
|
|
|
|
|
|
|
|
|
|||||||||||||
| Purchases of long-lived assets |
$ | 418,288 | $ | 934 | $ | — | $ | — | $ | — | $ | 419,222 | ||||||||||||
|
|
|
|
|
|
|
|
|
|
|
|
|
|||||||||||||
F-39
| Container | Container | Container | ||||||||||||||||||||||
| 2016 (1) |
Ownership | Management | Resale | Other | Eliminations | Totals | ||||||||||||||||||
| Lease rental income |
$ | 458,246 | $ | 2,181 | $ | — | $ | — | $ | — | $ | 460,427 | ||||||||||||
| Management fees from external customers |
291 | 10,076 | 3,053 | — | — | 13,420 | ||||||||||||||||||
| Inter-segment management fees |
— | 38,080 | 8,493 | — | (46,573 | ) | — | |||||||||||||||||
| Trading container sales proceeds |
— | — | 15,628 | — | — | 15,628 | ||||||||||||||||||
| Gain on sale of containers, net |
6,761 | — | — | — | — | 6,761 | ||||||||||||||||||
|
|
|
|
|
|
|
|
|
|
|
|
|
|||||||||||||
| Total revenue |
$ | 465,298 | $ | 50,337 | $ | 27,174 | $ | — | $ | (46,573 | ) | $ | 496,236 | |||||||||||
|
|
|
|
|
|
|
|
|
|
|
|
|
|||||||||||||
| Depreciation expense |
$ | 241,498 | $ | 876 | $ | — | $ | — | $ | (6,230 | ) | $ | 236,144 | |||||||||||
|
|
|
|
|
|
|
|
|
|
|
|
|
|||||||||||||
| Container impairment |
$ | 94,623 | $ | — | $ | — | $ | — | $ | — | $ | 94,623 | ||||||||||||
|
|
|
|
|
|
|
|
|
|
|
|
|
|||||||||||||
| Interest expense |
$ | 85,215 | $ | — | $ | — | $ | — | $ | — | $ | 85,215 | ||||||||||||
|
|
|
|
|
|
|
|
|
|
|
|
|
|||||||||||||
| Unrealized gains on interest rate swaps, collars and caps, net |
$ | 6,210 | $ | — | $ | — | $ | — | $ | — | $ | 6,210 | ||||||||||||
|
|
|
|
|
|
|
|
|
|
|
|
|
|||||||||||||
| Segment (loss) income before income tax and noncontrolling interests |
$ | (84,252 | ) | $ | 18,134 | $ | 6,178 | $ | (3,016 | ) | $ | 1,633 | $ | (61,323 | ) | |||||||||
|
|
|
|
|
|
|
|
|
|
|
|
|
|||||||||||||
| Total assets |
$ | 4,261,296 | $ | 89,905 | $ | 6,010 | $ | 4,900 | $ | (68,085 | ) | $ | 4,294,026 | |||||||||||
|
|
|
|
|
|
|
|
|
|
|
|
|
|||||||||||||
| Purchases of long-lived assets |
$ | 474,956 | $ | 1,206 | $ | — | $ | — | $ | — | $ | 476,162 | ||||||||||||
|
|
|
|
|
|
|
|
|
|
|
|
|
|||||||||||||
| Container | Container | Container | ||||||||||||||||||||||
| 2015 |
Ownership | Management | Resale | Other | Eliminations | Totals | ||||||||||||||||||
| Lease rental income |
$ | 510,954 | $ | 1,590 | $ | — | $ | — | $ | — | $ | 512,544 | ||||||||||||
| Management fees from external customers |
317 | 12,002 | 3,291 | — | — | 15,610 | ||||||||||||||||||
| Inter-segment management fees |
— | 45,620 | 10,104 | — | (55,724 | ) | — | |||||||||||||||||
| Trading container sales proceeds |
— | — | 12,670 | — | — | 12,670 | ||||||||||||||||||
| Gain on sale of containers, net |
3,454 | — | — | — | — | 3,454 | ||||||||||||||||||
|
|
|
|
|
|
|
|
|
|
|
|
|
|||||||||||||
| Total revenue |
$ | 514,725 | $ | 59,212 | $ | 26,065 | $ | — | $ | (55,724 | ) | $ | 544,278 | |||||||||||
|
|
|
|
|
|
|
|
|
|
|
|
|
|||||||||||||
| Depreciation expense |
$ | 197,084 | $ | 792 | $ | — | $ | — | $ | (5,946 | ) | $ | 191,930 | |||||||||||
|
|
|
|
|
|
|
|
|
|
|
|
|
|||||||||||||
| Container impairment |
$ | 35,345 | $ | — | $ | — | $ | — | $ | — | $ | 35,345 | ||||||||||||
|
|
|
|
|
|
|
|
|
|
|
|
|
|||||||||||||
| Interest expense |
$ | 76,063 | $ | — | $ | — | $ | — | $ | — | $ | 76,063 | ||||||||||||
|
|
|
|
|
|
|
|
|
|
|
|
|
|||||||||||||
| Write-off of unamortized deferred debt issuance costs |
$ | 458 | $ | — | $ | — | $ | — | $ | — | $ | 458 | ||||||||||||
|
|
|
|
|
|
|
|
|
|
|
|
|
|||||||||||||
| Unrealized losses on interest rate swaps, collars and caps, net |
$ | 1,947 | $ | — | $ | — | $ | — | $ | — | $ | 1,947 | ||||||||||||
|
|
|
|
|
|
|
|
|
|
|
|
|
|||||||||||||
| Segment income (loss) before income tax and noncontrolling interests |
$ | 88,536 | $ | 26,305 | $ | 9,335 | $ | (4,283 | ) | $ | 786 | $ | 120,679 | |||||||||||
|
|
|
|
|
|
|
|
|
|
|
|
|
|||||||||||||
| Total assets |
$ | 4,348,196 | $ | 117,033 | $ | 5,210 | $ | 7,251 | $ | (112,378 | ) | $ | 4,365,312 | |||||||||||
|
|
|
|
|
|
|
|
|
|
|
|
|
|||||||||||||
| Purchases of long-lived assets |
$ | 510,269 | $ | 1,070 | $ | — | $ | — | $ | — | $ | 511,339 | ||||||||||||
|
|
|
|
|
|
|
|
|
|
|
|
|
|||||||||||||
| (1) | Amounts for the years ended December 31, 2016 have been restated for immaterial corrections of identified errors pertaining to the calculation of the gains on sale of containers, net and to properly account for lease concessions (see Note 2 “Immaterial Correction of Errors in Prior Periods”). |
General and administrative expenses are allocated to the reportable business segments based on direct overhead costs incurred by those segments. Amounts reported in the “Other” column represent activity unrelated to the active reportable business segments. Amounts reported in the “Eliminations” column represent inter-segment management fees between the Container Management and the Container Resale segments and the Container Ownership segment.
F-40
Geographic Segment Information
The Company’s container lessees use containers for their global trade utilizing many worldwide trade routes. The Company earns its revenue from international carriers when the containers are in use and carrying cargo around the world. Substantially all of the Company’s leasing related revenue is denominated in U.S. dollars. As all of the Company’s containers are used internationally, where no one container is domiciled in one particular place for a prolonged period of time, all of the Company’s long-lived assets are considered to be international with no single country of use.
The following table represents the geographic allocation of lease rental income and management fees during the years ended December 31, 2017, 2016 and 2015 based on customers’ primary domicile:
| Years ended December 31, | ||||||||||||||||||||||||
| 2017 | Percent of Total |
2016 (1) | Percent of Total |
2015 | Percent of Total |
|||||||||||||||||||
| Lease rental income: |
||||||||||||||||||||||||
| Asia |
$ | 231,928 | 52.1 | % | $ | 256,489 | 55.7 | % | $ | 301,209 | 58.7 | % | ||||||||||||
| Europe |
182,291 | 41.0 | % | 176,164 | 38.2 | % | 183,785 | 35.9 | % | |||||||||||||||
| North / South America |
26,329 | 5.9 | % | 21,929 | 4.8 | % | 15,957 | 3.1 | % | |||||||||||||||
| All other international |
4,340 | 1.0 | % | 5,845 | 1.3 | % | 11,593 | 2.3 | % | |||||||||||||||
| Bermuda |
— | 0.0 | % | — | 0.0 | % | — | 0.0 | % | |||||||||||||||
|
|
|
|
|
|
|
|
|
|
|
|
|
|||||||||||||
| $ | 444,888 | 100.0 | % | $ | 460,427 | 100.0 | % | $ | 512,544 | 100.0 | % | |||||||||||||
|
|
|
|
|
|
|
|
|
|
|
|
|
|||||||||||||
| Management fees: |
||||||||||||||||||||||||
| Bermuda |
$ | 9,074 | 60.5 | % | $ | 8,668 | 64.6 | % | $ | 10,201 | 65.3 | % | ||||||||||||
| Europe |
3,729 | 24.9 | % | 2,541 | 18.9 | % | 3,190 | 20.4 | % | |||||||||||||||
| North / South America |
1,948 | 13.0 | % | 1,915 | 14.3 | % | 1,819 | 11.7 | % | |||||||||||||||
| Asia |
28 | 0.2 | % | 41 | 0.3 | % | 48 | 0.3 | % | |||||||||||||||
| All other international |
215 | 1.4 | % | 255 | 1.9 | % | 352 | 2.3 | % | |||||||||||||||
|
|
|
|
|
|
|
|
|
|
|
|
|
|||||||||||||
| $ | 14,994 | 100.0 | % | $ | 13,420 | 100.0 | % | $ | 15,610 | 100.0 | % | |||||||||||||
|
|
|
|
|
|
|
|
|
|
|
|
|
|||||||||||||
| (1) | Amounts for the year ended December 31, 2016 have been restated for immaterial corrections of identified errors pertaining to properly account for lease concessions (see Note 2 “Immaterial Correction of Errors in Prior Periods”). |
The following table represents the geographic allocation of trading container sales proceeds and gains on sale of containers, net during the years ended December 31, 2017, 2016 and 2015 based on the location of sale:
| Years ended December 31, | ||||||||||||||||||||||||
| 2017 | Percent of Total |
2016 (1) | Percent of Total |
2015 | Percent of Total |
|||||||||||||||||||
| Trading container sales proceeds: |
||||||||||||||||||||||||
| Asia |
$ | 3,349 | 70.4 | % | $ | 11,647 | 74.5 | % | $ | 6,401 | 50.5 | % | ||||||||||||
| North / South America |
816 | 17.2 | % | 2,948 | 18.9 | % | 2,581 | 20.4 | % | |||||||||||||||
| Europe |
593 | 12.5 | % | 1,033 | 6.6 | % | 3,688 | 29.1 | % | |||||||||||||||
| Bermuda |
— | — | — | 0.0 | % | — | 0.0 | % | ||||||||||||||||
|
|
|
|
|
|
|
|
|
|
|
|
|
|||||||||||||
| $ | 4,758 | 100.0 | % | $ | 15,628 | 100.0 | % | $ | 12,670 | 100.0 | % | |||||||||||||
|
|
|
|
|
|
|
|
|
|
|
|
|
|||||||||||||
| Gain (loss) on sale of containers, net: |
||||||||||||||||||||||||
| Asia |
$ | 18,321 | 69.9 | % | $ | 6,015 | 89.0 | % | $ | 929 | 26.9 | % | ||||||||||||
| North / South America |
5,002 | 19.1 | % | 1,855 | 27.4 | % | 3,022 | 87.5 | % | |||||||||||||||
| Europe |
2,994 | 11.4 | % | 1,576 | 23.3 | % | (490 | ) | (14.2 | )% | ||||||||||||||
| Bermuda |
— | 0.0 | % | — | 0.0 | % | — | 0.0 | % | |||||||||||||||
| All other international |
(107 | ) | (0.4 | )% | (2,685 | ) | (39.7 | )% | (7 | ) | (0.2 | )% | ||||||||||||
|
|
|
|
|
|
|
|
|
|
|
|
|
|||||||||||||
| $ | 26,210 | 100.0 | % | $ | 6,761 | 100.0 | % | $ | 3,454 | 100.0 | % | |||||||||||||
|
|
|
|
|
|
|
|
|
|
|
|
|
|||||||||||||
| (1) | Amounts for the year ended December 31, 2016 have been restated for immaterial corrections of identified errors pertaining to the calculation of gain on sale of containers, net (see Note 2 “Immaterial Correction of Errors in Prior Periods”). |
F-41
(14) Commitments and Contingencies
| (a) | Leases |
The Company has entered into several operating leases for office space. Rent expense amounted to $3,432, $1,213 and $1,614 during 2017, 2016 and 2015, respectively.
Future minimum lease payment obligations under the Company’s noncancelable operating leases at December 31, 2017 were as follows:
| Operating leasing |
||||
| Year ending December 31: |
||||
| 2018 |
$ | 2,104 | ||
| 2019 |
2,156 | |||
| 2020 |
2,113 | |||
| 2021 |
2,053 | |||
| 2022 and thereafter |
11,212 | |||
|
|
|
|||
| Total |
$ | 19,638 | ||
|
|
|
|||
| (b) | Restricted Cash |
Restricted interest-bearing cash accounts were established by the Company as additional collateral for outstanding borrowings under the Company’s TMCL II Secured Debt Facility, TMCL IV Secured Debt Facility, TW Credit Facility, TAP Funding Revolving Credit Facility, 2013-1 Bonds, 2014-1 Bonds, 2017-1 Bonds and 2017-2 Bonds. In addition, TL is required under its credit facilities to maintain a $10,000 cash balance. The total balance of these restricted cash accounts was $99,675 and $58,078 as of December 31, 2017 and 2016, respectively.
| (c) | Container Commitments |
At December 31, 2017, the Company had placed orders with manufacturers for containers to be delivered subsequent to December 31, 2017 in the total amount of $244,990.
(15) Share Option and Restricted Share Unit Plans
As of December 31, 2017, the Company maintained one active share option and restricted share unit plan, the 2015 Share Incentive Plan (“2015 Plan”). The 2015 Plan provided for the grant of share options, restricted share units, restricted shares, share appreciation rights and dividend equivalent rights. The 2015 Plan provided for grants of incentive share options only to the Company’s employees or employees of any parent or subsidiary of TGH. Awards other than incentive share options could be granted to the Company’s employees, directors and consultants or the employees, directors and consultants of any parent or subsidiary of TGH. At December 31, 2017, 787,937 shares were available for future issuance under the 2015 Plan.
Share options are granted at exercise prices equal to the fair market value of the shares on the grant date. Each employee’s options vest in increments of 25% per year beginning approximately one year after an option’s grant date. Unless terminated pursuant to certain provisions within the share option plans, including discontinuance of employment with the Company, all unexercised options expire ten years from the date of grant.
Beginning approximately one year after a restricted share unit’s grant date for each employee’s restricted share unit granted prior to 2010, each employee’s restricted share units vest in increments of 15% per year for the first two years, 20% for the third year and 25% for the fourth and fifth year. Beginning
F-42
approximately one year after a restricted share unit’s grant date for each restricted share unit granted in 2010 and thereafter, each employee’s restricted share units vest in increments of 25% per year. Restricted share units granted to directors fully vest one year after their grant date.
The following is a summary of activity in the Company’s 2015 Plan for the years ended December 31, 2017, 2016, and 2015:
| Share options (common share equivalents) |
Weighted average exercise price |
|||||||
| Balances, December 31, 2014 |
961,031 | $ | 29.63 | |||||
| Options granted during the period |
257,428 | $ | 14.20 | |||||
| Options exercised during the period |
(32,495 | ) | $ | 11.90 | ||||
| Options expired during the period |
(6,532 | ) | $ | 30.99 | ||||
| Options forfeited during the period |
(20,086 | ) | $ | 33.70 | ||||
|
|
|
|
|
|||||
| Balances, December 31, 2015 |
1,159,346 | $ | 26.62 | |||||
| Options granted during the period |
341,532 | $ | 9.77 | |||||
| Options exercised during the period |
— | $ | — | |||||
| Options expired during the period |
(38,317 | ) | $ | 31.33 | ||||
| Options forfeited during the period |
(30,748 | ) | $ | 29.97 | ||||
|
|
|
|
|
|||||
| Balances, December 31, 2016 |
1,431,813 | $ | 22.41 | |||||
| Options granted during the period |
246,722 | $ | 22.75 | |||||
| Options exercised during the period |
(65,468 | ) | $ | 14.67 | ||||
| Options expired during the period |
(45,638 | ) | $ | 25.55 | ||||
| Options forfeited during the period |
(42,752 | ) | $ | 16.04 | ||||
|
|
|
|
|
|||||
| Balances, December 31, 2017 |
1,524,677 | $ | 22.88 | |||||
|
|
|
|
|
|||||
| Options exercisable at December 31, 2017 |
875,083 | $ | 27.04 | |||||
|
|
|
|
|
|||||
| Options vested and expected to vest at December 31, 2017 |
1,453,930 | $ | 23.15 | |||||
|
|
|
|
|
|||||
| Restricted share units |
Weighted average grant date fair value |
|||||||
| Balances, December 31, 2014 |
633,218 | $ | 27.99 | |||||
| Share units granted during the period |
277,336 | $ | 13.01 | |||||
| Share units vested during the period |
(272,945 | ) | $ | 26.00 | ||||
| Share units forfeited during the period |
(20,086 | ) | $ | 30.31 | ||||
|
|
|
|
|
|||||
| Balances, December 31, 2015 |
617,523 | $ | 21.70 | |||||
| Share units granted during the period |
361,152 | $ | 9.81 | |||||
| Share units vested during the period |
(254,024 | ) | $ | 24.26 | ||||
| Share units forfeited during the period |
(30,748 | ) | $ | 25.93 | ||||
|
|
|
|
|
|||||
| Balances, December 31, 2016 |
693,903 | $ | 14.72 | |||||
|
|
|
|
|
|||||
| Share units granted during the period |
289,800 | $ | 20.82 | |||||
| Share units vested during the period |
(244,633 | ) | $ | 18.33 | ||||
| Share units forfeited during the period |
(46,022 | ) | $ | 14.24 | ||||
|
|
|
|
|
|||||
| Balances, December 31, 2017 |
693,048 | $ | 16.03 | |||||
|
|
|
|
|
|||||
| Share units outstanding and expected to vest at December 31, 2017 |
620,950 | $ | 16.07 | |||||
|
|
|
|
|
|||||
F-43
The estimated weighted average grant date fair value of share options granted during 2017, 2016 and 2015 was $10.32, $4.01 and $3.16 per share, respectively. As of December 31, 2017, $12,797 of total compensation cost related to non-vested share option and restricted share unit awards not yet recognized is expected to be recognized over a weighted average period of 3 years. The aggregate intrinsic value of all options exercisable and outstanding, which represents the total pre-tax intrinsic value, based on the Company’s closing common share price of $21.50 per share as of December 31, 2017 was $2,034. The aggregate intrinsic value is calculated as the difference between the exercise prices of the Company’s share options that were in-the-money and the market value of the common shares that would have been issued if those share options were exercised as of December 31, 2017. The aggregate intrinsic value of all options exercised during 2017 and 2015, based on the closing share price on the date each option was exercised was $241 and $325, respectively. There were no share options exercised during 2016.
The following table summarizes information about share options exercisable and outstanding at December 31, 2017:
| Share options exercisable | Share options outstanding | |||||||||||||||
| Number of shares | Weighted average exercise price |
Number of shares | Weighted average exercise price |
|||||||||||||
| Range of per-share exercise prices: |
||||||||||||||||
| $7.10 |
10,600 | $ | 7.10 | 10,600 | $ | 7.10 | ||||||||||
| $9.70 |
306,666 | $ | 9.70 | 74,735 | $ | 9.70 | ||||||||||
| $9.75 - $12.23 |
13,750 | $ | 11.55 | 2,500 | $ | 12.23 | ||||||||||
| $14.17 |
219,742 | $ | 14.17 | 103,843 | $ | 14.17 | ||||||||||
| $16.97 |
47,410 | $ | 16.97 | 47,410 | $ | 16.97 | ||||||||||
| $22.95 |
242,972 | $ | 22.95 | — | $ | — | ||||||||||
| $27.68 - $28.26 |
209,140 | $ | 28.12 | 208,890 | $ | 28.12 | ||||||||||
| $28.54 - $31.34 |
114,715 | $ | 28.78 | 114,715 | $ | 28.78 | ||||||||||
| $34.14 |
190,019 | $ | 34.14 | 142,727 | $ | 34.14 | ||||||||||
| $38.36 |
169,663 | $ | 38.36 | 169,663 | $ | 38.36 | ||||||||||
|
|
|
|
|
|
|
|
|
|||||||||
| 1,524,677 | $ | 22.88 | 875,083 | $ | 27.04 | |||||||||||
|
|
|
|
|
|
|
|
|
|||||||||
The weighted average contractual life of options exercisable and outstanding as of December 31, 2017 was 5.6 years and 7.0 years, respectively.
The fair value of each share option granted under the 2015 Plan was estimated on the date of grant using the Black-Scholes option pricing model for the years ended December 31, 2017, 2016 and 2015 with the following assumptions:
| 2017 | 2016 | 2015 | ||||||||||
| Risk-free interest rates |
2.2 | % | 1.9 | % | 1.8 | % | ||||||
| Expected terms (in years) |
5.4 | 5.2 | 5.2 | |||||||||
| Expected common share price volatilities |
47.4 | % | 43.7 | % | 44.5 | % | ||||||
| Expected dividends |
0.0 | % | 0.0 | % | 6.8 | % | ||||||
| Expected forfeitures |
5.9 | % | 5.3 | % | 4.0 | % | ||||||
The risk-free interest rate is based on the implied yield on a U.S. Treasury zero-coupon issue with a remaining term equal to the expected term of the share option life. The expected term is calculated based on historical exercises. The expected common share price volatility for the 2015 Plan is based on the historical volatility of publicly traded companies within the Company’s industry. The dividend yield reflects the estimated future yield on the date of grant. The Company only recognizes expense for share-based awards that are ultimately expected to vest. The forfeiture rate is based on the Company’s estimate of share options that are expected to cancel prior to vesting.
F-44
(16) Share Repurchase Program
On October 29, 2015, TGH’s board of directors approved a share repurchase program of up to $100,000 of the Company’s common shares. Under the program, the Company may purchase its common shares from time to time in the open market, in privately negotiated transactions or by establishing a trading plan under Rule 10b5-1 of the Securities Exchange Act of 1934 to facilitate purchases of its common shares. During 2015, the Company repurchased 630,000 shares at an average price of $14.52 for a total amount of $9,149. The Company did not repurchase any of its common shares during the years ended December 31, 2017 and 2016.
(17) Subsequent Events
On February 15, 2018, The Company completed a $300 million, seven-year fixed rate term financing with a lender group comprised of a financial institution and on institutional investor. The facility was issued by Textainer Marine Containers VI Limited (“TMCL VI”), an indirect wholly-owned subsidiary of the Company. The facility is partially amortized and the remaining principal is due in full in seven years. The weighted average life of the facility is approximately five years and is secured by a pledge of TMCL VI’s containers. The proceeds of the facility were used to paydown certain of the Company’s short-term debt.
In February 2018, the company concluded a purchase of approximately 18,000 containers that we had been managing for an institutional investor for a total purchase consideration of $13.2 million.
F-45
TEXTAINER GROUP HOLDINGS LIMITED AND SUBSIDIARIES
SCHEDULE I - CONDENSED STATEMENTS OF COMPREHENSIVE INCOME (LOSS)
Parent Company Information
Years Ended December 31, 2017, 2016 and 2015
(All currency expressed in United States dollars in thousands)
| 2017 | 2016 (1)(2) | 2015 (2) | ||||||||||
| Operating expenses: |
||||||||||||
| General and administrative expense |
$ | 2,664 | $ | 2,657 | $ | 2,966 | ||||||
| Long-term incentive compensation expense |
904 | 363 | 432 | |||||||||
|
|
|
|
|
|
|
|||||||
| Total operating expenses |
3,568 | 3,020 | 3,398 | |||||||||
|
|
|
|
|
|
|
|||||||
| Loss from operations |
(3,568 | ) | (3,020 | ) | (3,398 | ) | ||||||
|
|
|
|
|
|
|
|||||||
| Other income (expense): |
||||||||||||
| Equity in net income (loss) of subsidiaries |
22,933 | (49,470 | ) | 111,806 | ||||||||
| Interest income |
— | 4 | — | |||||||||
|
|
|
|
|
|
|
|||||||
| Net other income (loss) |
22,933 | (49,466 | ) | 111,806 | ||||||||
|
|
|
|
|
|
|
|||||||
| Income (loss) before income tax |
19,365 | (52,486 | ) | 108,408 | ||||||||
| Income tax benefit |
— | 3 | — | |||||||||
|
|
|
|
|
|
|
|||||||
| Net income (loss) attributable to Textainer Group Holdings Limited common shareholders |
$ | 19,365 | $ | (52,483 | ) | $ | 108,408 | |||||
|
|
|
|
|
|
|
|||||||
| Net income (loss) attributable to Textainer Group Holdings Limited common shareholders per share: |
||||||||||||
| Basic |
$ | 0.34 | $ | (0.93 | ) | $ | 1.90 | |||||
| Diluted |
$ | 0.34 | $ | (0.93 | ) | $ | 1.90 | |||||
| Weighted average shares outstanding (in thousands): |
||||||||||||
| Basic |
56,845 | 56,608 | 56,953 | |||||||||
| Diluted |
57,159 | 56,608 | 57,093 | |||||||||
| Other comprehensive income: |
||||||||||||
| Foreign currency translation adjustments |
207 | (233 | ) | (240 | ) | |||||||
|
|
|
|
|
|
|
|||||||
| Comprehensive income (loss) attributable to Textainer Group Holdings Limited common shareholders |
$ | 19,572 | $ | (52,716 | ) | $ | 108,168 | |||||
|
|
|
|
|
|
|
|||||||
| (1) | Certain amounts for the year ended December 31, 2016 have been restated for immaterial corrections of identified errors pertaining to the calculation of gain on sale of containers, net and to properly account for lease concessions (see Note 2 ‘Immaterial Correction of Errors in Prior Periods”). |
| (2) | Certain amounts for the years ended December 31, 2016 and 2015 have been reclassified to conform with 2017 presentation. |
F-46
TEXTAINER GROUP HOLDINGS LIMITED AND SUBSIDIARIES
SCHEDULE I - CONDENSED BALANCE SHEETS
Parent Company Information
December 31, 2017 and 2016
(All currency expressed in United States dollars in thousands)
| 2017 | 2016 (1) | |||||||
| Assets | ||||||||
| Current assets: |
||||||||
| Cash and cash equivalents |
$ | 5,530 | $ | 2,975 | ||||
| Prepaid expenses |
216 | 173 | ||||||
| Due from affiliates, net |
1,020 | 189 | ||||||
|
|
|
|
|
|||||
| Total current assets |
6,766 | 3,337 | ||||||
| Investments in subsidiaries |
1,147,157 | 1,124,018 | ||||||
|
|
|
|
|
|||||
| Total assets |
$ | 1,153,923 | $ | 1,127,355 | ||||
|
|
|
|
|
|||||
| Liabilities and Shareholders’ Equity | ||||||||
| Current liabilities: |
||||||||
| Accrued expenses |
$ | 568 | $ | 618 | ||||
|
|
|
|
|
|||||
| Total current liabilities |
568 | 618 | ||||||
|
|
|
|
|
|||||
| Shareholders’ equity: |
||||||||
| Common shares |
578 | 575 | ||||||
| Additional paid-in capital |
398,634 | 391,591 | ||||||
| Treasury shares |
(9,149 | ) | (9,149 | ) | ||||
| Accumulated other comprehensive income |
(309 | ) | (516 | ) | ||||
| Retained earnings |
763,601 | 744,236 | ||||||
|
|
|
|
|
|||||
| Total shareholders’ equity |
1,153,355 | 1,126,737 | ||||||
|
|
|
|
|
|||||
| Total liabilities and shareholders’ equity |
$ | 1,153,923 | $ | 1,127,355 | ||||
|
|
|
|
|
|||||
| (1) | Certain amounts as of December 31, 2016 have been restated for immaterial corrections of identified errors related to the calculation of gain on sale of containers, net and to properly account for lease concessions (see Note 2 “Immaterial Correction of Errors in Prior Periods”). |
F-47
TEXTAINER GROUP HOLDINGS LIMITED AND SUBSIDIARIES
SCHEDULE I - CONDENSED STATEMENTS OF CASH FLOWS
Parent Company Information
Years ended December 31, 2017, 2016 and 2015
(All currency expressed in United States dollars in thousands)
| 2017 | 2016 (1)(2) | 2015 (2) | ||||||||||
| Cash flows from operating activities: |
||||||||||||
| Net income (loss) attributable to Textainer Group Holdings Limited common shareholders |
$ | 19,365 | $ | (52,483 | ) | $ | 108,408 | |||||
|
|
|
|
|
|
|
|||||||
| Adjustments to reconcile net (loss) income to net cash provided by operating activities: |
||||||||||||
| Equity in (income) loss of subsidiaries |
(22,933 | ) | 49,470 | (111,806 | ) | |||||||
| Dividends received from subsidiaries |
— | 28,000 | 100,000 | |||||||||
| Share-based compensation |
6,083 | 6,573 | 7,743 | |||||||||
| Decrease (increase) in: |
||||||||||||
| Prepaid expenses |
(43 | ) | 15 | 16 | ||||||||
| Increase (decrease) in: |
||||||||||||
| Accrued expenses |
(50 | ) | (489 | ) | 454 | |||||||
|
|
|
|
|
|
|
|||||||
| Total adjustments |
(16,943 | ) | 83,569 | (3,593 | ) | |||||||
|
|
|
|
|
|
|
|||||||
| Net cash provided by operating activities |
2,422 | 31,086 | 104,815 | |||||||||
|
|
|
|
|
|
|
|||||||
| Cash flows from investing activities: |
||||||||||||
| (Decrease) increase in investments in subsidiaries, net |
(204 | ) | (3,969 | ) | 233 | |||||||
|
|
|
|
|
|
|
|||||||
| Net cash (used in) provided by investing activities |
(204 | ) | (3,969 | ) | 233 | |||||||
|
|
|
|
|
|
|
|||||||
| Cash flows from financing activities: |
||||||||||||
| Purchase of treasury shares |
— | — | (9,149 | ) | ||||||||
| Issuance of common shares upon exercise of share options |
961 | — | 301 | |||||||||
| Dividends paid |
— | (28,754 | ) | (94,079 | ) | |||||||
| Due from affiliates, net |
(831 | ) | (364 | ) | 585 | |||||||
|
|
|
|
|
|
|
|||||||
| Net cash provided by (used) in financing activities |
130 | (29,118 | ) | (102,342 | ) | |||||||
|
|
|
|
|
|
|
|||||||
| Effect of exchange rate changes |
207 | (233 | ) | (240 | ) | |||||||
|
|
|
|
|
|
|
|||||||
| Net increase (decrease) in cash and cash equivalents |
2,555 | (2,234 | ) | 2,466 | ||||||||
|
|
|
|
|
|
|
|||||||
| Cash and cash equivalents, beginning of the year |
2,975 | 5,209 | 2,743 | |||||||||
|
|
|
|
|
|
|
|||||||
| Cash and cash equivalents, end of the year |
$ | 5,530 | $ | 2,975 | $ | 5,209 | ||||||
|
|
|
|
|
|
|
|||||||
| (1) | Certain amounts for the year ended December 31, 2016 have been restated for immaterial corrections of identified errors related to the calculation of gain on sale of containers, net and to properly account for lease concessions (see Note 2 “Immaterial Correction of Errors in Prior Periods”). |
| (2) | Certain amounts for the years ended December 31, 2016 and 2015 have been reclassified to conform with 2017 presentation. |
F-48
Schedule II
TEXTAINER GROUP HOLDINGS LIMITED AND SUBSIDIARIES
Valuation Accounts
Years ended December 31, 2017, 2016 and 2015
(All currency expressed in United States dollars in thousands)
| Balance at | Additions | Balance at | ||||||||||||||
| Beginning of | Charged to | End of | ||||||||||||||
| Year | Expense | Deductions | Year | |||||||||||||
| December 31, 2015 |
||||||||||||||||
| Accounts receivable, allowance for doubtful accounts |
$ | 12,139 | $ | 5,028 | $ | (3,114 | ) | $ | 14,053 | |||||||
| December 31, 2016 |
||||||||||||||||
| Accounts receivable, allowance for doubtful accounts |
$ | 14,053 | $ | 21,166 | $ | (3,375 | ) | $ | 31,844 | |||||||
| December 31, 2017 |
||||||||||||||||
| Accounts receivable, allowance for doubtful accounts |
$ | 31,844 | $ | 477 | $ | (26,546 | ) | $ | 5,775 | |||||||
F-49
| ITEM 19. | EXHIBITS |
The following exhibits are filed as part of this Annual Report on Form 20-F:
| Exhibit Number |
Description of Document | |
| 1.1 | Memorandum of Association of Textainer Group Holdings Limited (1) | |
| 1.2 | Bye-laws of Textainer Group Holdings Limited (2) | |
| 2.1 | Form of Common Share Certificate (3) | |
| 4.1 | Office Lease, dated August 8, 2001, by and between Pivotal 650 California St., LLC and Textainer Equipment Management (U.S.) Limited (the “Office Lease”) (4) | |
| 4.2 | First Amendment to the Office Lease, dated as of December 23, 2008, by and between A – 650 California Street, LLC and Textainer Equipment Management (U.S.) Limited (5) | |
| 4.3 | Second Amendment to the Office Lease, dated as of April 23, 2015, by and between Columbia REIT – 650 California Street, LLC and Textainer Equipment Management (U.S.) Limited (6) | |
| 4.4* | Employment Agreement, dated as of October 1, 2011 by and between Textainer Equipment Management (U.S.) Limited and Philip K. Brewer (7) | |
| 4.5* | Employment Agreement, dated January 10, 2012 by and between Textainer Equipment Management (U.S.) Limited and Hilliard C. Terry, III (8) | |
| 4.6* | Employment Agreement, dated December 4, 2015 by and between Textainer Equipment Management (U.S.) Limited and Olivier Ghesquiere (9) | |
| 4.7* | 2015 Share Incentive Plan (as amended and restated effective May 21, 2015) (10) | |
| 4.8* | 2008 Bonus Plan (11) | |
| 4.9* | Form of Indemnification Agreement (12) | |
| 4.10 | Amended and Restated Indenture, dated September 15, 2014, by and between Textainer Marine Containers Limited II, as issuer and Wells Fargo Bank, National Association, as indenture trustee (“TMCL II Indenture”) (13) | |
| 4.11† | Amendment Number 1, dated December 21, 2016 to the TMCL II Indenture | |
| 4.12† | Amendment Number 2, dated February 27, 2017 to the TMCL II Indenture | |
| 4.13 | Amended and Restated Textainer Marine Containers Limited II Series 2012-1 Supplement, dated September 15, 2014 to the TMCL II Indenture (the “Series 2012-1 Supplement”) (14) | |
| 4.14† | Amendment Number 1, dated December 21, 2016 to the Series 2012-1 Supplement | |
| 4.15† | Amendment Number 2, dated February 27, 2017 to the Series 2012-1 Supplement | |
| 4.16 | Credit Agreement, dated September 24, 2012, by and among, Textainer Limited, as borrower, Textainer Group Holdings Limited, as guarantor, Bank of America, N.A., as agent and the lenders party thereto (“TL Credit Agreement”) (15) | |
| 4.17 | Amendment Number 1, dated as of July 25, 2013 to the TL Credit Agreement (16) | |
| 4.18 | Amendment Number 2, dated April 30, 2014 to the TL Credit Agreement (17) | |
| 4.19 | Amendment Number 3, dated June 19, 2015 to the TL Credit Agreement (18) | |
| 4.20† | Amendment Number 4, dated June 23, 2016 to the TL Credit Agreement | |
| 4.21† | Amendment Number 5, dated October 26, 2016 to the TL Credit Agreement | |
111
| Exhibit Number |
Description of Document | |
| 4.22† | Amendment Number 6, dated February 24, 2017 to the TL Credit Agreement | |
| 4.23** | Fourth Amended and Restated Equipment Management Services Agreement, dated as of June 1, 2002, by and between Textainer Equipment Management Limited and Leased Assets Pool Company Limited (19) | |
| 4.24 | Amendment to Fourth Amended and Restated Equipment Management Services Agreement, dated as of September 12, 2007, by and between Textainer Equipment Management Limited and Leased Asset Pool Company Limited (20) | |
| 4.25 | Container Management Services Agreement, dated as of December 1, 2016, by and between Maccarone Container Fund, LLC and Textainer Equipment Management Limited (21) | |
| 4.26† | Voting Limitation Deed, dated January 1, 2018, by and between Halco Holdings, Inc. and the Company | |
| 4.27† | Indenture, dated May 27, 2017, by and between Textainer Marine Containers Limited V, as issuer and Wells Fargo Bank, National Association, as indenture trustee (“TMCL V Indenture”) | |
| 4.28† | Textainer Marine Containers Limited V Series 2017-1 Supplement, dated as of May 17, 2017 to the TMCL V Indenture | |
| 4.29† | Textainer Marine Containers Limited V Series 2017-2 Supplement, dated as of June 28, 2017 to the TMCL V Indenture | |
| 8.1† | Subsidiaries of the Registrant | |
| 12.1† | Certification of the Chief Executive Officer required by Rule 13a-14(a) or Rule 15d-14(a) under the Securities Exchange Act of 1934, as amended, as adopted pursuant to Section 302 of the Sarbanes-Oxley Act of 2002 | |
| 12.2† | Certification of the Chief Financial Officer required by Rule 13a-14(a) or Rule 15d-14(a) under the Securities Exchange Act of 1934, as amended, as adopted pursuant to Section 302 of the Sarbanes-Oxley Act of 2002 | |
| 13.1† | Certification of the Chief Executive Officer required by Rule 13a-14(b) and Section 1350 of Chapter 63 of Title 18 of the United States Code, as adopted pursuant to Section 906 of the Sarbanes-Oxley Act of 2002 | |
| 13.2† | Certification of the Chief Financial Officer required by Rule 13a-14(b) and Section 1350 of Chapter 63 of Title 18 of the United States Code, as adopted pursuant to Section 906 of the Sarbanes-Oxley Act of 2002 | |
| 15.1† | Consent of KPMG LLP | |
| 101.INS† | XBRL Instance Document | |
| 101.SCH† | XBRL Taxonomy Extension Schema Document | |
| 101.CAL† | XBRL Taxonomy Extension Calculation Linkbase Document | |
| 101.DEF† | XBRL Taxonomy Definition Linkbase Document | |
| 101.LAB† | XBRL Taxonomy Extension Label Linkbase Document | |
| 101.PRE† | XBRL Taxonomy Extension Presentation Linkbase Document | |
| † | Filed herewith. |
| * | Indicates management contract or compensatory plan. |
| ** | Confidential treatment requested for certain portions of this exhibit, which portions are omitted and filed separately with the SEC. |
| (1) | Incorporated by reference to Exhibit 3.1 to the Registrant’s Registration Statement on Form F-1 (File No. 333-146304) filed with the SEC on September 26, 2007. |
112
| (2) | Incorporated by reference to Exhibit 3.2 to the Registrant’s Registration Statement on Form F-1 (File No. 333-146304) filed with the SEC on September 26, 2007. |
| (3) | Incorporated by reference to Exhibit 4.1 to the Registrant’s Registration Statement on Form F-1 (File No. 333-146304) filed with the SEC on September 26, 2007. |
| (4) | Incorporated by reference to Exhibit 10.1 to the Registrant’s Registration Statement on Form F-1 (File No. 333-146304) filed with the SEC on September 26, 2007. |
| (5) | Incorporated by reference to Exhibit 4.2 to the Registrant’s Annual Report on Form 20-F (File No. 001-33725) filed with the SEC on March 16, 2009. |
| (6) | Incorporated by reference to Exhibit 4.3 to the Registrant’s Annual Report on Form 20-F (File No. 001- 33725) filed with the SEC on March 11, 2016. |
| (7) | Incorporated by reference to Exhibit 4.3 to the Registrant’s Annual Report on Form 20-F (File No. 001-33725) filed with the SEC on March 15, 2012. |
| (8) | Incorporated by reference to Exhibit 4.6 to the Registrant’s Annual Report on Form 20-F (File No. 001-33725) filed with the SEC on March 15, 2012. |
| (9) | Incorporated by reference to Exhibit 4.7 to the Registrant’s Annual Report on Form 20-F (File No. 001-33725) filed with the SEC on March 27, 2017. |
| (10) | Incorporated by reference to Exhibit 4.7 to the Registrant’s Annual Report on Form 20-F (File No. 001-33725) filed with the SEC on March 11, 2016. |
| (11) | Incorporated by reference to Exhibit 10.8 to the Registrant’s Registration Statement on Form F-1 (File No. 333-146304) filed with the SEC on September 26, 2007. |
| (12) | Incorporated by reference to Exhibit 4.10 to the Registrant’s Annual Report on Form 20-F (File No. 001-33725) filed with the SEC on March 15, 2012. |
| (13) | Incorporated by Reference to Exhibit 4.11 to the Registrant’s Annual Report on Form 20-F (File No. 001-33725) filed with the SEC on March 13, 2015. |
| (14) | Incorporated by Reference to Exhibit 4.12 to the Registrant’s Annual Report on Form 20-F (File No. 001-33725) filed with the SEC on March 13, 2015 |
| (15) | Incorporated by reference to Exhibit 4.25 to the Registrant’s Annual Report on Form 20-F (File No. 001-33725) filed with the SEC on March 15, 2013. |
| (16) | Incorporated by reference to Exhibit 4.27 to the Registrant’s Annual Report on Form 20-F (File No. 001-33725) filed with the SEC on March 19, 2014. |
| (17) | Incorporated by Reference to Exhibit 4.15 to the Registrant’s Annual Report on Form 20-F (File No. 001-33725) filed with the SEC on March 13, 2015. |
| (18) | Incorporated by reference to Exhibit 4.15 to the Registrant’s Annual Report on Form 20-F (File No. 001-33725) filed with the SEC on March 11, 2016. |
| (19) | Incorporated by reference to Exhibit 10.17 to the Registrant’s Registration Statement on Form F-1 (File No. 333-146304) filed with the SEC on September 26, 2007. |
| (20) | Incorporated by reference to Exhibit 10.18 to the Registrant’s Registration Statement on Form F-1 (File No. 333-146304) filed with the SEC on September 26, 2007. |
| (21) | Incorporated by reference to Exhibit 4.21 to the Registrant’s Annual Report on Form 20-F (File No. 001-33725) filed with the SEC on March 27, 2017. |
113
SIGNATURES
The registrant hereby certifies that it meets all of the requirements for filing on Form 20-F and that it has duly caused and authorized the undersigned to sign this Annual Report on its behalf.
| Textainer Group Holdings Limited |
| /s/ PHILIP K. BREWER |
| Philip K. Brewer |
| President and Chief Executive Officer |
| /s/ HILLIARD C. TERRY, III |
| Hilliard C. Terry, III |
| Executive Vice President and Chief Financial Officer |
March 14, 2018
114
CORPORATE INFORMATION
| BOARD OF DIRECTORS |
OFFICERS | |||
| Hyman Shwiel (1) (2) (3) Chairman Textainer Group Holdings Limited Former Partner Ernst & Young
Philip K. Brewer President and Chief Executive Officer Textainer Group Holdings Limited
Iain Brown Director Container Investment Services Limited
Dudley R. Cottingham (1) (2) (3) Managing Director Arthur Morris & Company Limited
John A. Maccarone (2) (3) Former President and Chief Executive Officer Textainer Group Holdings Limited
James E. McQueen (1) Financial Director Trencor Limited
David M. Nurek (2) (3) Executive Investec Bank Limited
Robert D. Pedersen Former President and Chief Executive Officer Textainer Equipment Management Limited
Hennie Van der Merwe Chief Executive Officer Trencor Limited |
Philip K. Brewer President and Chief Executive Officer Textainer Group Holdings Limited
Olivier Ghesquiere Executive Vice President, Leasing Textainer Equipment Management Limited
Hilliard C. Terry, III Executive Vice President, Chief Financial Officer Textainer Group Holdings Limited
Michael K. Chan Vice President, Finance Textainer Equipment Management (U.S.) Limited
Alvin V. Chong Global Vice President-Resale Textainer Equipment Management Limited
Gregory W. Coan Vice President, Chief Information Officer Textainer Equipment Management (U.S.) Limited
Daniel W. Cohen Vice President, General Counsel Textainer Equipment Management (U.S.) Limited
Jack G. Figueira Vice President, Corporate Operations and Acquisitions Textainer Equipment Management (U.S.) Limited
Michael Harvey Vice President Textainer Group Holdings Limited
Adam H. Hopkin Secretary Textainer Group Holdings Limited
Vincent Mak Regional Vice President-South Asia Textainer Equipment Management Limited
Seline E. Miller Vice President and Corporate Controller Textainer Equipment Management (U.S.) Limited
Masanori Sagara Regional Vice President-North Asia Textainer Equipment Management Limited
Michael Samsel Regional Vice President-Europe Textainer Equipment Management Limited
John R. Simmons Vice President-Americas Textainer Equipment Management Limited |
HEADQUARTERS
TEXTAINER GROUP HOLDINGS LIMITED Century House 16 Par-La-Ville Road Hamilton HM 08 Bermuda
ADMINISTRATIVE OFFICE
TEXTAINER EQUIPMENT MANAGEMENT (U.S.) LIMITED 650 California Street, 16th Floor San Francisco, CA 94108
OFFICES
Durban Hamburg Hong Kong London New York Port Klang Seoul Shanghai Singapore Sydney Taipei Yokohama | ||
| (1) | Member of the Audit Committee |
| (2) | Member of the Corporate Governance and Nominating Committee |
| (3) | Member of the Compensation Committee |

Table of Contents
Exhibit 99.2

Century House, 16 Par-la-Ville Road, Hamilton HM 08, Bermuda
NOTICE OF 2018 ANNUAL GENERAL MEETING OF SHAREHOLDERS
TO BE HELD ON MAY 23, 2018
TO OUR SHAREHOLDERS:
NOTICE IS HEREBY GIVEN that the 2018 Annual General Meeting of Shareholders of Textainer Group Holdings Limited, a Bermuda company (“we,” “our,” “us,” or the “Company”) will be held at The Fairmont Southampton, 101 South Shore Road, Southampton, Bermuda SN02, at 9:00 a.m. (local time) on Wednesday, May 23, 2018. The 2018 Annual General Meeting of Shareholders of the Company, including any postponement or adjournment(s) thereof (the “2018 Annual Meeting”) will be held for the following purposes:
| 1. | To approve the election of Messrs. Philip K. Brewer and Hennie Van der Merwe as our Class II directors; |
| 2. | To approve our annual audited financial statements for the fiscal year ended December 31, 2017, a copy of which is included in the enclosed 2017 Annual Report to Shareholders and will be laid before our shareholders at the 2018 Annual Meeting; |
| 3. | To approve the re-appointment of KPMG LLP, an independent registered public accounting firm, to act as our independent auditors for the fiscal year ending December 31, 2018 and the authorization for our Board of Directors, acting through our Audit Committee to fix the remuneration of our independent auditors for the fiscal year ending December 31, 2018; and |
| 4. | To transact such other business as may properly be brought before the 2018 Annual Meeting (including any postponement or adjournment(s) thereof). |
The close of business on April 2, 2018 has been fixed as the record date for determining the shareholders of record entitled to notice of and to vote at the 2018 Annual Meeting (including any postponement or adjournment(s) thereof).
Whether or not you plan to attend the 2018 Annual Meeting, in order to ensure that your shares will be voted in accordance with your wishes and that the presence of a quorum at the 2018 Annual Meeting may be assured, please promptly complete, sign, date and promptly return the enclosed proxy card in the enclosed envelope. The proxy card must be properly dated, signed and returned in order to be counted. You can also submit your proxy to vote your shares via the Internet or by telephone as provided in the instructions set forth on the enclosed proxy card. Following submission of your signed proxy, you may revoke your signed proxy at any time before it is voted by: (i) delivering to the Secretary of the Company at Textainer Group Holdings Limited, Century House, 16 Par-la-Ville Road, Hamilton HM 08, Bermuda, a written statement revoking such proxy, (ii) executing and delivering a later-dated proxy, or (iii) voting in person at the 2018 Annual Meeting.
Important Notice Regarding the Availability of Proxy Materials for the 2018 Annual Meeting to be held on May 23, 2018. The Company’s proxy materials for the 2018 Annual Meeting, including this notice, the accompanying proxy statement and the accompanying form of proxy card, along with the Company’s 2017 Annual Report to Shareholders, are available at www.textainer.com.
By Order of the Board of Directors,

Adam Hopkin
Secretary
Hamilton, Bermuda
April 23, 2018
Table of Contents
PROXY STATEMENT
2018 ANNUAL GENERAL MEETING OF SHAREHOLDERS
TO BE HELD MAY 23, 2018
This Proxy Statement is being furnished in connection with the solicitation on behalf of the Board of Directors of Textainer Group Holdings Limited, a Bermuda company (“we,” “our,” “us,” or the “Company”) of proxies to be voted at the 2018 Annual General Meeting of Shareholders to be held at The Fairmont Southampton, 101 South Shore Road, Southampton, Bermuda SN02, at 9:00 a.m. (local time) on Wednesday, May 23, 2018, including any postponement or adjournment(s) thereof (the “2018 Annual Meeting”). The 2018 Annual Meeting will be held for the purposes set forth in the accompanying Notice of 2018 Annual General Meeting of Shareholders and as more specifically described in this Proxy Statement. This Proxy Statement, the accompanying Notice of 2018 Annual General Meeting of Shareholders, the accompanying form of proxy card and our 2017 Annual Report to Shareholders are being first mailed to shareholders on or about April 23, 2018. These proxy materials are also available for viewing at www.textainer.com.
The close of business on April 2, 2018 has been fixed as the record date for determining the shareholders of record (“Shareholders”) of our common shares, $0.01 par value per share (“Common Shares”) entitled to notice of and to vote at the 2018 Annual Meeting (including any postponement or adjournment(s) thereof). As of March 28, 2018, there were 57,099,249 Common Shares issued and outstanding. Common Shares are our only class of equity securities issued and outstanding and entitled to vote at the 2018 Annual Meeting. Each Shareholder is entitled to one vote on each matter to be voted upon by the Shareholders at the 2018 Annual Meeting for each Common Share held by such Shareholder.
At the 2018 Annual Meeting, two or more persons present in person at the start of the 2018 Annual Meeting and representing in person or by proxy in excess of 50% of the total issued voting shares in the Company shall form a quorum for the transaction of business at the 2018 Annual Meeting.
At the 2018 Annual Meeting, Shareholders will receive the report of KPMG LLP, our independent auditors, and may be asked to consider and take action with respect to such other matters as may properly come before the 2018 Annual Meeting.
Adoption of each proposal set forth in the accompanying Notice of 2018 Annual General Meeting of Shareholders and as more specifically described in this Proxy Statement requires the affirmative vote of a majority of the votes cast at the 2018 Annual Meeting.
In this Proxy Statement, unless otherwise specified, all monetary amounts are in U.S. dollars.
SOLICITATION AND REVOCATION
PROXY CARDS IN THE FORM ENCLOSED WITH THIS PROXY STATEMENT ARE BEING SOLICITED ON BEHALF OF OUR BOARD OF DIRECTORS. OUR BOARD OF DIRECTORS HAS DESIGNATED THE PERSON(S) NAMED IN THE ACCOMPANYING FORM OF PROXY CARD AS A PROXY. Each such person designated as a proxy serves as a director and/or executive officer of the Company.
1
Table of Contents
Each Common Share represented by a properly executed proxy that is returned and not revoked will be voted in accordance with the instructions, if any, given thereon and in accordance with the proxyholder’s best judgment as to any other business as may properly come before the 2018 Annual Meeting. If no instructions are provided in a properly executed proxy, it will be voted FOR the approval of the election of each of the nominees identified in this Proxy Statement as a Class II director of the Company (Proposal One), and FOR the approval of each of Proposals Two and Three. Any Shareholder who executes a proxy may revoke it at any time before it is voted by: (i) delivering to the Secretary of the Company at Textainer Group Holdings Limited, Century House, 16 Par-la-Ville Road, Hamilton HM 08, Bermuda, a written statement revoking such proxy, (ii) executing and delivering a later-dated proxy, or (iii) voting in person at the 2018 Annual Meeting. Attendance at the 2018 Annual Meeting by a Shareholder who has executed and delivered a proxy to us shall not in and of itself constitute a revocation of such proxy. For Common Shares held in “street name” by a broker, bank or other nominee, new voting instructions must be delivered to the broker, bank or nominee prior to the 2018 Annual Meeting.
If within half an hour from the time appointed for the 2018 Annual Meeting a quorum is not present, then the 2018 Annual Meeting shall stand adjourned to the same day one week later, at the same time and place or to such other day, time or place as the Secretary of the Company may determine. Unless the 2018 Annual Meeting is adjourned to a specific date, place and time announced at the 2018 Annual Meeting being adjourned, fresh notice of the date, place and time for the resumption of the adjourned 2018 Annual Meeting shall be given to each Shareholder entitled to attend and vote thereat in accordance with the Company’s bye-laws as currently in effect.
We will bear the cost of solicitation of proxies. We have not engaged a proxy solicitation agent. Solicitation may be made by our directors, officers and employees personally, by telephone, Internet or otherwise, but such persons will not be specifically compensated for such services. We may also make, through bankers, brokers or other persons, a solicitation of proxies of beneficial holders of Common Shares. Upon request, we will reimburse brokers, dealers, banks or similar entities acting as nominees for reasonable expenses incurred in forwarding copies of the proxy materials relating to the 2018 Annual Meeting to the beneficial owners of Common Shares which such persons hold of record.
2
Table of Contents
| Page | ||||
| BENEFICIAL OWNERSHIP OF COMMON SHARES BY MAJOR SHAREHOLDERS AND MANAGEMENT |
4 | |||
| PROPOSAL ONE—APPROVAL OF THE ELECTION OF OUR CLASS II DIRECTORS |
6 | |||
| 6 | ||||
| 10 | ||||
| 11 | ||||
| 11 | ||||
| 11 | ||||
| 13 | ||||
| 13 | ||||
| 14 | ||||
| 14 | ||||
| 14 | ||||
| 15 | ||||
3
Table of Contents
BENEFICIAL OWNERSHIP OF COMMON SHARES
BY MAJOR SHAREHOLDERS AND MANAGEMENT
The following table presents information regarding the beneficial ownership of our Common Shares as of March 28, 2018 by:
| • | each person or entity that we know beneficially owns more than 5% of our issued and outstanding Common Shares; |
| • | each director, director nominee and executive officer; and |
| • | all of our directors, director nominees and executive officers as a group. |
For the purposes of the following table, beneficial ownership of our Common Shares is determined in accordance with the rules of the United States Securities and Exchange Commission (the “SEC”) and generally includes any Common Shares over which a person exercises sole or shared voting or investment power. The percentage of beneficial ownership of our Common Shares is based on 57,099,249 Common Shares issued and outstanding on March 28, 2018. We do not believe that we are directly or indirectly owned or controlled by any foreign government. The voting rights of our Common Shares held by major shareholders are the same as the voting rights of Common Shares held by all other shareholders. We are unaware of any arrangement that might result in a change of control of the Company.
| Number of
Common Shares Beneficially Owned |
||||||||
| Holders |
Shares (1) | % (2) | ||||||
| 5% or More Shareholders |
||||||||
| Halco Holdings Inc. (3) |
27,278,802 | 47.8 | % | |||||
| Trencor Limited (3) |
27,278,802 | 47.8 | % | |||||
| Isam K. Kabbani (4) |
3,372,350 | 5.9 | % | |||||
| Directors and Executive Officers |
||||||||
| Philip K. Brewer (5) |
565,959 | 1.0 | % | |||||
| Dudley R. Cottingham (6) |
19,716 | * | ||||||
| John A. Maccarone (7) |
1,497,201 | 2.6 | % | |||||
| James E. McQueen (8) |
27,295,518 | 47.8 | % | |||||
| David M. Nurek (9) |
27,295,518 | 47.8 | % | |||||
| Hyman Shwiel |
21,716 | * | ||||||
| Iain Brown (10) |
27,286,356 | 47.8 | % | |||||
| Hennie Van der Merwe (11) |
27,279,802 | 47.8 | % | |||||
| Robert D. Pedersen |
391,464 | * | ||||||
| Hilliard C. Terry, III |
168,369 | * | ||||||
| Olivier Ghesquiere |
98,422 | * | ||||||
| Current directors and executive officers (11 persons) as a group |
30,083,635 | 52.7 | % | |||||
| * | Less than 1%. |
4
Table of Contents
| (1) | Beneficial ownership by a person assumes the exercise of all share options, warrants and rights held by such person, even if not vested. Common Shares beneficially owned include the following share options and restricted share units: |
| Grant Date | ||||||||||||||||||||||||||||||||||||||||||||||||
| 11/18/2009 | 11/18/2010 | 11/16/2011 | 1/20/2012 | 11/14/2012 | 11/14/2013 | 11/19/2014 | 11/12/2015 | 5/19/2016 | 11/30/2016 | 5/19/2017 | 11/30/2017 | |||||||||||||||||||||||||||||||||||||
| Share options | ||||||||||||||||||||||||||||||||||||||||||||||||
| Exercise price | $ | 16.97 | $ | 28.26 | $ | 28.54 | $ | 31.34 | $ | 28.05 | $ | 38.36 | $ | 34.14 | $ | 14.17 | $ | 12.23 | $9.70 | N/A | $ | 22.95 | ||||||||||||||||||||||||||
| Expiration date | 11/17/2019 | 11/17/2020 | 11/15/2021 | 1/19/2022 | 11/14/2022 | 11/14/2023 | 11/19/2024 | 11/12/2025 | 5/19/2026 | 11/30/2026 | N/A | 11/30/2027 | ||||||||||||||||||||||||||||||||||||
| Philip K. Brewer | 22,350 | 15,000 | 30,000 | — | 32,000 | 36,000 | 38,520 | 45,291 | — | 54,349 | — | 46,197 | ||||||||||||||||||||||||||||||||||||
| Robert D. Pedersen | — | 7,500 | 16,500 | — | 23,000 | 26,000 | 27,820 | 26,534 | — | 39,252 | — | — | ||||||||||||||||||||||||||||||||||||
| Hilliard C. Terry, III | — | — | — | 10,000 | 11,000 | 12,500 | 13,375 | 15,726 | — | 19,265 | — | 16,375 | ||||||||||||||||||||||||||||||||||||
| Olivier Ghesquiere | — | — | — | — | — | — | — | — | 10,000 | 19,200 | — | 17,760 | ||||||||||||||||||||||||||||||||||||
| Restricted share units | ||||||||||||||||||||||||||||||||||||||||||||||||
| Philip K. Brewer | — | — | — | — | — | — | 9,630 | 22,645 | — | 40,761 | — | 46,197 | ||||||||||||||||||||||||||||||||||||
| Dudley R. Cottingham | — | — | — | — | — | — | — | — | — | — | 6,154 | — | ||||||||||||||||||||||||||||||||||||
| John A. Maccarone | — | — | — | — | — | — | — | — | — | — | 6,154 | — | ||||||||||||||||||||||||||||||||||||
| James E. McQueen | — | — | — | — | — | — | — | — | — | — | 6,154 | — | ||||||||||||||||||||||||||||||||||||
| David M. Nurek | — | — | — | — | — | — | — | — | — | — | 6,154 | — | ||||||||||||||||||||||||||||||||||||
| Hyman Shwiel | — | — | — | — | — | — | — | — | — | — | 6,154 | — | ||||||||||||||||||||||||||||||||||||
| Iain Brown | — | — | — | — | — | — | — | — | — | — | 6,154 | — | ||||||||||||||||||||||||||||||||||||
| Hennie Van der Merwe | — | — | — | — | — | — | — | — | — | — | — | — | ||||||||||||||||||||||||||||||||||||
| Robert D. Pedersen | — | — | — | — | — | — | 6,955 | 16,354 | — | 29,439 | 6,154 | — | ||||||||||||||||||||||||||||||||||||
| Hilliard C. Terry, III | — | — | — | — | — | — | 3,343 | 7,862 | — | 14,448 | — | 16,375 | ||||||||||||||||||||||||||||||||||||
| Olivier Ghesquiere | — | — | — | — | — | — | — | — | 7,500 | 14,400 | — | 17,760 | ||||||||||||||||||||||||||||||||||||
| (2) | Percentage ownership is based on 57,099,249 shares outstanding as of March 28, 2018. |
| (3) | Includes 27,278,802 shares held by Halco Holdings Inc. (“Halco”). Halco is wholly-owned by Trencor. Halco was previously wholly-owned by Halco Trust, a discretionary trust with an independent trustee. On February 20, 2018, Halco Trust distributed and transferred to Trencor, a nominated discretionary beneficiary of Halco Trust, the trust’s 100% shareholding in Halco. |
| (4) | Includes 3,372,350 shares held by Delmas Invest Holding S.A, an affiliate of Mr. Kabbani. |
| (5) | Includes 94,045 shares held by the Philip Brewer 2009 Trust and 32,974 shares held by a joint account of Mr. Brewer and Dr. Choi Yue Victoria Woo. |
| (6) | Includes 8,080 shares held by Caribbean Dream Limited, a company owned by a trust in which Mr. Cottingham is the principal beneficiary and 5,482 shares held by Mr. Cottingham. |
| (7) | Includes 1,205,100 shares held by the Maccarone Family Partnership L.P., 283,497 shares held by the Maccarone Revocable Trust, 1,100 shares held by the Maccarone Charitable Trust, 1,000 shares held by the John Maccarone IRA Rollover and 350 shares held by the Bryan Maccarone UTMA. |
| (8) | Includes 27,278,802 shares held by Halco (which in terms of SEC regulations are solely reported herewith as beneficially owned by Mr. McQueen due to his position as a director of Trencor) and 10,562 shares held by Mr. McQueen. Mr. McQueen is one of our directors and a member of the board of directors of Trencor. Mr. McQueen disclaims beneficial ownership, except to the extent of his pecuniary interest therein, if any, of the shares held by Halco. |
| (9) | Includes 27,278,802 shares held by Halco (which in terms of SEC regulations are solely reported herewith as beneficially owned by Mr. Nurek due to his position as a director of Trencor) and 10,562 shares held by Mr. Nurek. Mr. Nurek is one of our directors, and a member of the board of directors of Trencor. Mr. Nurek disclaims beneficial ownership, except to the extent of his pecuniary interest therein, if any, of the shares held by Halco. |
| (10) | Includes 27,278,802 shares held by Halco (which in terms of SEC regulations are solely reported herewith as beneficially owned by Mr. Brown due to his position as a director of Halco), 700 shares held by the trust of IB Settlement and 700 shares held by Michelle Brown, Mr. Brown’s spouse. Mr. Brown is one of our directors and also a director of Halco. Mr. Brown disclaims beneficial ownership, except to the extent of his pecuniary interest therein, if any, of the shares held by Halco. |
| (11) | Includes 27,278,802 shares held by Halco (which in terms of SEC regulations are solely reported herewith as beneficially owned by Mr. Van der Merwe due to his position as a director of Trencor) and 1,000 shares held by Mr. Van der Merwe. Mr. Van der Merwe is one of our directors, a director of Halco and also a CEO and director of Trencor. Mr. Van der Merwe disclaims beneficial ownership, except to the extent of his pecuniary interest therein, if any, of the shares held by Halco. |
5
Table of Contents
APPROVAL OF THE ELECTION OF OUR CLASS II DIRECTORS
At the 2018 Annual Meeting, Shareholders will be asked to approve the election of each of Messrs. Philip K. Brewer and Hennie Van der Merwe as a Class II director of the Company. In accordance with our bye-laws as currently in effect, our Board of Directors is elected annually on a staggered basis, with each director holding office until the annual general meeting for the year in which such director’s term expires, except in the event of his death, resignation, removal or earlier termination of his office. Our bye-laws as currently in effect provide for a classified Board of Directors, divided into three classes, which are designated as Class I, Class II and Class III. At each such annual general meeting of shareholders, directors in the class whose term expires at that annual general meeting of shareholders are elected for three-year terms. Directors may be re-elected when their term of office expires.
Messrs. David M. Nurek, Robert D. Pedersen and Iain Brown are currently designated Class III directors, each of whom holds office until our 2020 annual general meeting of shareholders. Messrs. Philip K. Brewer, James E. McQueen and Hennie van der Merwe are currently designated as Class II directors, each of whom holds office until the 2018 annual general meeting of shareholders. Messrs. John A. Maccarone, Dudley R. Cottingham and Hyman Shwiel are currently designated as Class I directors, each of whom holds office until our 2019 Annual Meeting.
The terms of the Class II directors are set to expire at the 2018 Annual Meeting. Based upon the recommendation of the Nominating and Corporate Governance Committee of our Board of Directors, our Board of Directors has nominated Messrs. Philip K. Brewer and Hennie Van der Merwe to stand for election, in each case, as a Class II director of the Company, at the 2018 Annual Meeting. Proposal One calls for a vote FOR the approval of the election of each of Messrs. Philip K. Brewer and Hennie Van der Merwe as a Class II director of the Company at the 2018 Annual Meeting. If elected at the 2018 Annual Meeting, each of Messrs. Philip K. Brewer and Hennie Van der Merwe will each serve for a three-year term expiring at our 2021 annual general meeting of shareholders, subject to his office being vacated earlier.
Biographical information relating to the directors under Proposal One is presented in this Proxy Statement below under “Directors and Senior Management—Directors.”
Directors and Senior Management
The following table sets forth information regarding our executive officers and directors as of April 2, 2018. The business address of each of our executive officers is c/o Textainer Equipment Management (U.S.) Limited, 650 California Street, 16th Floor, San Francisco, California 94108, United States. The business address for each of our non-management directors is Century House, 16 Par-la-Ville Road, Hamilton HM 08, Bermuda.
As of March 28, 2018, our principal shareholder, Halco, beneficially owned approximately 47.8% of our issued and outstanding Common Shares. On January 1, 2018, Halco entered into a voting limitation deed with the Company, pursuant to which Halco agreed to limit its shareholder voting rights in the Company, solely in respect of the appointment and/or removal of directors. Otherwise, Halco has the ability to influence the outcome of other matters submitted to our shareholders for approval, including the Proposal Two and Proposal Three to be voted on at the 2018 Annual Meeting, and may support proposals and actions with which other shareholders may disagree or which are not in such other shareholders’ interests. Halco is a wholly-owned subsidiary of Trencor Limited. Trencor is a South African container public company that has been listed on the Johannesburg Stock Exchange (“JSE”) in Johannesburg, South Africa since 1955. Trencor was founded in 1929, and currently its interests are in businesses owning, leasing and managing marine cargo containers and finance related activities. As indicated below, three of our nine directors are also directors of Trencor.
6
Table of Contents
| Executive Officers and Directors |
Age | Position | ||||
| Hyman Shwiel(1)(2)(3) |
73 | Chairman | ||||
| Philip K. Brewer |
60 | Director, President and Chief Executive Officer | ||||
| Iain Brown |
54 | Director | ||||
| Dudley R. Cottingham(1)(2)(3) |
66 | Director | ||||
| John A. Maccarone(2)(3) |
73 | Director | ||||
| James E. McQueen(1)(4) |
73 | Director | ||||
| David M. Nurek(2)(3)(5) |
68 | Director | ||||
| Hennie Van der Merwe(7) |
70 | Director | ||||
| Robert D. Pedersen(6) |
58 | Director | ||||
| Olivier Ghesquiere |
51 | Executive Vice President—Leasing | ||||
| Hilliard C. Terry, III |
48 | Executive Vice President and Chief Financial Officer | ||||
| (1) | Member of the Audit Committee. Messrs. Cottingham and Shwiel are voting members and Mr. McQueen is a non-voting member. |
| (2) | Member of the Compensation Committee. |
| (3) | Member of the Nominating and Corporate Governance Committee. |
| (4) | Director of Trencor, the beneficiary of 47.8% of our share interest |
| (5) | Chairman of Trencor, the beneficiary of 47.8% of our share interest. |
| (6) | Robert D. Pedersen retired from his position as the President and Chief Executive of Textainer Equipment Management Limited effective March 31, 2017. |
| (7) | Chief Executive Officer and Director of Trencor, the beneficiary of 47.8% of our share interest. |
Certain biographical information about each of these individuals is set forth below.
Directors
Hyman Shwiel has been a member of our board of directors since September 2007. Mr. Shwiel was a partner with Ernst & Young LLP for 25 years. He served during that period in various roles, including Area Managing Partner and as National Director of Enterprise and Professional Risk. Upon his retirement in 2005, he became a consultant to Ernst & Young until 2007. Mr. Shwiel holds a C.T.A. and a M.B.A. from the University of Cape Town and is a Chartered Accountant (South Africa) and a CPA.
Philip K. Brewer was appointed President and Chief Executive Officer and to our board of directors in October 2011. Mr. Brewer served as our Executive Vice President from 2006 to October 2011, responsible for managing our capital structure and identifying new sources of finance for our company, as well as overseeing the management and coordinating the activities of our risk management and resale divisions. Mr. Brewer was Senior Vice President of our asset management group from 1999 to 2005 and Senior Vice President of our capital markets group from 1996 to 1998. Prior to joining our company in 1996, Mr. Brewer worked at Bankers Trust starting in 1990 as a Vice President and ending as a Managing Director and President of its Indonesian subsidiary. From 1989 to 1990, he was Vice President in Corporate Finance at Jardine Fleming. From 1987 to 1989, he was Capital Markets Advisor to the United States Agency for International Development in Indonesia. From 1984 to 1987, he was an associate with Drexel Burnham Lambert, an investment banking firm, in New York. Mr. Brewer holds a B.A. in Economics and Political Science from Colgate University and an M.B.A. in Finance from Columbia University.
Iain Brown has been a member of our board of directors since May 2016. Mr. Brown is a member of the board of directors of Halco. Mr. Brown is a director of Container Investment Services Limited and has been providing administrative services and strategic advice to owners and investors in the container leasing industry
7
Table of Contents
for over twenty years. He holds a Bachelor of Science in Engineering degree from the University of Cape Town, a MS in Engineering from University of Texas and an MBA in Finance from The Wharton School of the University of Pennsylvania.
Dudley R. Cottingham has been a member of our board of directors since December 1993 and served as assistant Secretary and/or secretary between December 1993 and October 2007. He has also served in the past as president of certain of our subsidiaries and continues to serve as a director of our Bermuda subsidiaries. Mr. Cottingham has over 35 years of experience in public accounting for a variety of international and local clients. He is a director and the audit committee chairman of Bermuda Press (Holdings) Ltd., a newspaper publishing and commercial printing company listed on the Bermuda Stock Exchange and is chairman of the listing committee of the Bermuda Stock Exchange. He is chairman and an Investment and Operational Committee member of the Aurum Funds which are listed on the Bermuda and Irish Stock Exchanges. He is a managing director of and was formerly a partner of Arthur Morris & Company Limited, a provider of audit and accounting services for international clients, since 1982, and has served as vice president and director of Continental Management Ltd., a Bermuda company providing corporate representation, administration and management services, since 1982 and Continental Trust Corporation Ltd., a Bermuda company that provides corporate and individual trust administration services, since 1994. He is a director of Morris, Cottingham & Co. Ltd. and their other group companies in Turks & Caicos Islands. Mr. Cottingham is a Chartered Accountant.
John A. Maccarone served as our President and Chief Executive Officer from January 1999 until October 2011 when he retired from Textainer and as a member of our board of directors since December 1993. Mr. Maccarone co-founded Intermodal Equipment Associates, a marine container leasing company based in San Francisco, and held a variety of executive positions with the company from 1979 until 1987, when he joined the Textainer Group as President and Chief Executive Officer of Textainer Equipment Management Limited, now a subsidiary of our company. From 1977 through 1978, Mr. Maccarone was Director of Marketing based in Hong Kong for Trans Ocean Leasing Corporation, a San Francisco-based company. From 1969 to 1976, Mr. Maccarone was a marketing representative for IBM Corporation in Chicago, Illinois. From 1966 to 1968, he served as a Lieutenant in the U.S. Army Corps of Engineers in Thailand and Virginia. Mr. Maccarone holds a B.S. in Engineering Management from Boston University and an M.B.A. from Loyola University of Chicago.
James E. McQueen has been a member of our board of directors since March 2003. Mr. McQueen joined Trencor in June 1976 and has served as financial director of Trencor since April 1984. Mr. McQueen is also a director of one of Trencor’s subsidiaries. Mr. McQueen was a member of the board of directors of Halco until August 2017. Prior to joining Trencor, Mr. McQueen was an accountant in public practice. Mr. McQueen received a Bachelor of Commerce degree and a Certificate in the Theory of Accounting from the University of Cape Town and is a Chartered Accountant (South Africa).
David M. Nurek has been a member of our board of directors since September 2007. Mr. Nurek was appointed as an alternate director of Trencor in November 1992 and as a non-executive member of its board of directors in July 1995 and is chairman of Trencor’s remuneration and nomination and social and ethics committees and a member of its audit committee. Mr. Nurek is an executive of Investec Bank Limited, a subsidiary of Investec Limited, which is listed on the JSE. Investec Limited has entered into a dual listed company structure with Investec plc, which is quoted on the London Stock Exchange (collectively, the “Investec Group”). He is the regional chairman of Investec Limited’s various businesses in the Western Cape, South Africa, and is also the Investec Group’s worldwide head of legal risk. Prior to joining Investec Limited in June 2000, Mr. Nurek served as chairman of the South African legal firm Sonnenberg Hoffmann & Galombik, which has since changed its name to Edward Nathan Sonnenbergs Inc. Mr. Nurek serves as a non-executive on the boards of directors of various listed and unlisted companies in South Africa and holds a Diploma in Law and a Graduate Diploma in Company Law from the University of Cape Town, and completed a Program of Instruction for Lawyers at Harvard Law School and a Leadership in Professional Services Firms program at Harvard Business School.
8
Table of Contents
Hennie Van der Merwe has been a member of our board of directors since August 2017 and between March 2003 to 2011. Mr. Van der Merwe joined Trencor in 1997 and began serving as a director of Trencor in 1998. He was appointed the Chief Executive Officer of Trencor in August 2017. Mr. Van der Merwe also serves as non-executive chairman of the board of Master Drilling Group Limited and as a non-executive director of Bell Equipment Limited, both of which are listed on the JSE. From 1984 to 1991, he held various senior executive positions in the banking sector in South Africa, lastly as chief executive officer of Senbank, the corporate/merchant banking arm of Bankorp Group Ltd. From 1991 to 1998, Mr. Van der Merwe served as deputy chairman for Waco International Ltd., an international industrial group listed on the JSE with subsidiaries listed on the Sydney and London Stock Exchanges. Prior to entering the business world, Mr. Van der Merwe practiced as an attorney at law in Johannesburg, South Africa. Mr. Van der Merwe holds Bachelor of Arts and L.L.B degrees in Law from the University of Stellenbosch in South Africa, and a Master of Law in Tax Law from the University of the Witwatersrand in South Africa. In August 2017, Mr. Van der Merwe was appointed as a director of Halco, and as a director of both Leased Asset Pool Limited and TAC Limited, entities that each own intermodal containers managed by the Company.
Robert D. Pedersen has been a member of our board of directors since April 2017. Mr. Pedersen was appointed President and Chief Executive Officer of Textainer Equipment Management Limited, our management company, in October 2011 and retired on March 31, 2017. Mr. Pedersen served as our Executive Vice President responsible for worldwide sales and marketing related activities and operations since January 2006. Mr. Pedersen was Senior Vice President of our leasing group from 1999 to 2005. From 1991 to 1999, Mr. Pedersen held several positions within our company, and from 1978 through 1991, he worked in various capacities for Klinge Cool, a manufacturer of refrigerated container cooling units, XTRA, a container lessor, and Maersk Line, a container shipping line. Mr. Pedersen is a graduate of the A.P. Moller Shipping and Transportation Program and the Merkonom Business School in Copenhagen, where he majored in Company Organization.
Executive Officers
For certain biographical information about Philip K. Brewer, see “Directors” above.
Olivier Ghesquiere was appointed Executive Vice President – Leasing in January 2017 and is responsible for worldwide sales and marketing related activities and operations. Mr. Ghesquiere served as our Senior Vice President – Marketing and Sales since December 2015. Mr. Ghesquiere worked at Groupe Ermewa S.A. as Chief Operating Officer and then Chief Executive Officer from January 2009 through February 2015 where he was responsible for growing the railcar and locomotive fleet to become the second largest in Europe. During that time Mr. Ghesquiere was also chairman of Eurotainer SA for which he was the Managing Director from April 2004 through December 2008 where he developed their tank container business focusing on higher value segments of the market. Mr. Ghesquiere has served as Vice Chairman and chairman of the International Tank Container Organization (ITCO) leasing committee from 2006 through 2010. Mr. Ghesquiere holds a Masters in Applied Economics from the Louvain School of Management, Belgium.
Hilliard C. Terry, III was appointed Executive Vice President and Chief Financial Officer in January 2012. Prior to joining the company, Mr. Terry served as Vice President and Treasurer at Agilent Technologies, Inc., where he worked prior to the company’s initial public offering in 1999 and subsequent spin-off from Hewlett-Packard Company (HP). He previously served as the head of Investor Relations until he was appointed Vice President and Treasurer in 2006. Before joining Agilent Technologies, Mr. Terry worked in marketing and investor relations for HP’s VeriFone subsidiary and joined VeriFone, Inc. in 1995 prior to the company’s acquisition by HP in 1997. He also held positions in investor relations with Kenetech Corporation and investment banking at Goldman, Sachs & Co. Mr. Terry currently serves on the board of directors of Umpqua Holdings Corporation, a publicly traded financial services company and on the board of its principal subsidiary, Umpqua Bank. Mr. Terry also served on the board of trustees of the Oakland Museum of California. Mr. Terry holds a B.A. in Economics from the University of California at Berkeley and an M.B.A. from Golden Gate University.
9
Table of Contents
Our corporate governance practices are in compliance with, and are not prohibited by, the laws of Bermuda. Therefore, we are exempt from many of the New York Stock Exchange’s (“NYSE”) corporate governance practices, other than the establishment of a formal Audit Committee satisfying the requirements of Rule 10A-3 under the Securities Exchange Act of 1934, as amended (the “Exchange Act”) and notification of non-compliance with NYSE listing requirements. The practices that we follow in lieu of the NYSE’s corporate governance rules are described below.
| • | We do not, and are not required under Bermuda law to, maintain a Board of Directors with a majority of independent directors. Currently, a majority of our directors are not independent, as that term is defined by the NYSE. Our independent directors, as determined by the Board of Directors pursuant to NYSE rules are Dudley R. Cottingham, John A. Maccarone and Hyman Shwiel. |
| • | We are not required by Bermuda law to hold regular meetings of the Board of Directors at which only independent directors are present. |
| • | Under Bermuda law, compensation of executive officers does not need to be determined by an independent committee. We have established a Compensation Committee that reviews and approves the compensation and benefits for our executive officers and other key executives, makes recommendations to the board regarding compensation matters and is responsible for awarding compensation to our executive officers and other employees under our share compensation plans. The committee also has the discretion to interpret and amend the terms of, and take all other actions necessary to administer, the 2015 Share Incentive Plan (the “2015 Plan”). However, our Compensation Committee is not comprised solely of independent directors, as required by NYSE standards. The members of our Compensation Committee are Messrs. Cottingham, Maccarone, Nurek and Shwiel. Mr. Shwiel currently serves as the chairman of the Compensation Committee. Mr. Nurek is a director of Trencor. Messrs. Cottingham, Maccarone, and Shwiel satisfy the NYSE’s standards for director independence. We believe it is appropriate for non-independent directors to serve as members of our Compensation Committee as these directors have significant experience in the container manufacturing and leasing industry and either are or represent the interests of significant long term Company shareholders. We believe these factors enable the non-independent directors on our Compensation Committee to positively contribute to the committee and represent the interests of all Company shareholders. |
| • | We have established an Audit Committee responsible (i) for advising the board regarding the selection of independent auditors, (ii) overseeing the Company’s accounting and financial reporting process, (iii) evaluating our internal controls, and (iv) overseeing compliance with policies and legal requirements with respect to financial reporting. Our Audit Committee need not comply with NYSE requirements that the Audit Committee have a minimum of three members or the NYSE’s standards of director independence for domestic issuers. Our Audit Committee has three members, Messrs. Shwiel, Cottingham and McQueen. Mr. Shwiel is the chairman of the Audit Committee. Messrs. Shwiel and Cottingham are voting members of the committee and are independent as that term is defined in Rule 10A-3 under the Exchange Act. Mr. McQueen is a director of Trencor and has no voting rights on the Audit Committee. We believe it is appropriate for non-independent directors to serve as non-voting members of our Audit Committee as these directors have significant experience in the container manufacturing and leasing industry, have significant finance and accounting experience and either are or represent the interests of significant long term Company shareholders. We believe these factors enable the non-independent directors on our Audit Committee to positively contribute to the committee and represent the interests of all Company shareholders. |
| • | We have established a Nominating and Corporate Governance Committee, although this committee is not comprised solely of independent directors, as would be required of a domestic issuer. Our Nominating and Corporate Governance Committee has four members, Messrs. Cottingham, Maccarone, Nurek and Shwiel. Mr. Cottingham currently serves as chairman of the Nominating and |
10
Table of Contents
| Corporate Governance Committee. Messrs. Cottingham, Maccarone and Shwiel satisfy the NYSE’s standards for director independence. Our board of directors has adopted a Nominating and Corporate Governance Committee charter. We believe it is appropriate for non-independent directors to serve as members of our Nominating and Corporate Governance Committee as these directors have significant experience in the container manufacturing and leasing industry and either are or represent the interests of significant long term Company shareholders. We believe these factors enable the non-independent directors on our Nominating and Corporate Governance Committee to positively contribute to the committee and represent the interests of all Company shareholders. |
| • | Under Bermuda law, we are not required to obtain shareholder consent prior to issuing securities or adopting share compensation plans. Nonetheless, we sought and received the approval of our shareholders for our 2007 Share Incentive Plan (the “2007 Plan”) on September 4, 2007 and our 2015 Plan, an amendment and restatement of the 2007 Plan, on May 21, 2015. Under Bermuda law, consent of the Bermuda Monetary Authority is required for the issuance of securities in certain circumstances. |
| • | Under Bermuda law, we are not required to adopt corporate governance guidelines or a code of business conduct. Nonetheless, we have adopted both corporate governance guidelines and a code of business conduct. |
In 2017, our Board of Directors held four meetings and all current members of the Board attended each meeting occurring during their tenure. In 2017, our Audit Committee held nine meetings, our Compensation Committee held three meetings and our Nominating and Corporate Governance Committee held one meeting. All current committee members attended 100% of the applicable committee meetings during their tenure.
Director and Senior Management Compensation
The aggregate direct compensation we paid to our executive officers as a group (four persons, including an executive officer retired on March 31, 2017) for the year ended December 31, 2017 was approximately $2.3 million, which included approximately $0.6 million in bonuses and approximately $83,000 in funds set aside or accrued to provide for health and life insurance, retirement, or similar benefits. During 2017, our executive officers as a group were granted 80,332 share options, with an exercise price of $22.95 and an expiration date of November 30, 2027, and 80,332 restricted share units through our 2015 Share Incentive Plan. These amounts do not include expenses we incurred for other payments, including dues for professional and business associations, business travel and other expenses. We did not pay our officers who also serve as directors any separate compensation for their directorship during 2017, other than reimbursements for travel expenses.
All of our full-time employees, including employees of our direct and indirect subsidiaries and dedicated agents and our executive officers, were eligible to participate in our 2015 Short Term Incentive Plan. Under that plan, all eligible employees received an incentive award based on their respective job classification and our return on assets and earnings per share. In 2017, each of our executive officers received 75% of his target incentive award for targets that applied to calendar year 2016 performance with the incentive award paid in early 2017.
The aggregate direct compensation we paid to our directors who are not officers for their services as directors as a group for the year ended December 31, 2017 was approximately $473,000. In addition, on May 19, 2017, our directors as a group (excluding Messrs. Philip K. Brewer and Hennie Van der Merwe) were granted 43,078 restricted share units. Some directors were also reimbursed for expenses incurred in order to attend board or committee meetings.
Approval of the election of each of Messrs. Philip K. Brewer and Hennie Van der Merwe as a Class II director requires the affirmative vote of a majority of the votes cast at the 2018 Annual Meeting.
11
Table of Contents
The Board of Directors unanimously recommends a vote in favor of each of the Class II director nominees. The Board notes that each nominee is either a long tenured member of the Board of Directors or has significant experience in the container leasing industry, or both.
Our Board of Directors unanimously recommends a vote FOR the approval of the election of each of Messrs. Philip K. Brewer and Hennie Van der Merwe as a Class II director as set forth in Proposal One.
12
Table of Contents
APPROVAL OF OUR ANNUAL AUDITED FINANCIAL STATEMENTS FOR THE FISCAL
YEAR ENDED DECEMBER 31, 2017
At the 2018 Annual Meeting, Shareholders will be asked to approve the Company’s annual audited financial statements for the fiscal year ended December 31, 2017, a copy of which is included in the enclosed 2017 Annual Report to Shareholders and will be laid before the Shareholders at the 2018 Annual Meeting. Proposal Two calls for a vote FOR the approval of the Company’s annual audited financial statements for the fiscal year ended December 31, 2017.
Adoption of Proposal Two requires the affirmative vote of a majority of the votes cast at the 2018 Annual Meeting.
Our Board of Directors unanimously recommends a vote FOR the approval of the Company’s annual audited financial statements for the fiscal year ended December 31, 2017 as set forth in Proposal Two.
13
Table of Contents
APPROVAL OF THE RE-APPOINTMENT OF KPMG LLP TO ACT AS OUR INDEPENDENT AUDITORS FOR THE FISCAL YEAR ENDING DECEMBER 31, 2018 AND THE AUTHORIZATION FOR OUR BOARD OF DIRECTORS, ACTING THROUGH OUR AUDIT COMMITTEE, TO FIX THE REMUNERATION OF OUR INDEPENDENT AUDITORS FOR THE FISCAL YEAR ENDING DECEMBER 31, 2018
At the 2018 Annual Meeting, Shareholders will be asked to approve the re-appointment of KPMG LLP, an independent registered public accounting firm, to act as the Company’s independent auditors for the fiscal year ending December 31, 2018 and the authorization for the Board of Directors, acting through our Audit Committee, to fix the remuneration of the Company’s independent auditors for the fiscal year ending December 31, 2018.
Independent Auditors Fees and Services
Our Audit Committee pre-approves all services provided by KPMG LLP. All of the services and fees described below were reviewed and pre-approved by our Audit Committee. Our Audit Committee has delegated to the chairman of the Audit Committee certain limited authority to grant pre-approvals. These decisions to pre-approve a service must be presented to the full Audit Committee at its next scheduled meeting.
The following is a summary of the fees billed to us by KPMG LLP for professional services rendered for the fiscal years ended December 31, 2017 and 2016:
| Fee Category |
2017 Fees | 2016 Fees | ||||||
| Audit Fees |
$ | 1,766,000 | $ | 1,531,000 | ||||
| Audit-Related Fees |
195,000 | 20,000 | ||||||
| Tax Fees |
22,000 | 15,000 | ||||||
|
|
|
|
|
|||||
| Total Fees |
$ | 1,983,000 | $ | 1,566,000 | ||||
|
|
|
|
|
|||||
Audit Fees— Consists of fees billed for professional services rendered for the audit of our financial statements and services that are normally provided by our principal accountants in connection with statutory and regulatory filings or engagements.
Audit-Related Fees—Consists of fees for attestation related services other than those described above as Audit Fees. Fees of $195,000 and $20,000 billed in 2017 and 2016, respectively, relate to the performance of agreed upon procedures on certain specific lender requirements.
Tax Fees— Consists of fees billed for professional services for tax compliance, tax advice and tax planning.
Adoption of Proposal Three requires the affirmative vote of a majority of the votes cast at the 2018 Annual Meeting.
Our Board of Directors unanimously recommends a vote FOR the approval of the re-appointment of KPMG LLP, an independent registered public accounting firm, to act as the Company’s independent auditors for the fiscal year ending December 31, 2018 and the authorization for our Board of Directors, acting through our Audit Committee, to fix the remuneration of the Company’s independent auditors for the fiscal year ending December 31, 2018 as set forth in Proposal Three.
14
Table of Contents
Our Board of Directors is currently unaware of any other matters to come before the 2018 Annual Meeting other than as set forth in the accompanying Notice of 2018 Annual General Meeting of Shareholders and as more specifically described in this Proxy Statement. Each Common Share represented by a properly executed proxy which is returned and not revoked will be voted in accordance with the proxyholder’s best judgment as to any other business as may properly come before the 2018 Annual Meeting.
15
Table of Contents


q IF YOU HAVE NOT VOTED VIA THE INTERNET OR TELEPHONE, FOLD ALONG THE PERFORATION, DETACH AND RETURN THE BOTTOM PORTION IN THE ENCLOSED ENVELOPE. q
| A | Proposals — The Board of Directors recommends a vote FOR all the nominees listed and FOR Proposals 2 and 3. | |||||||||||||||||||||||
|
1. |
Proposal to approve the election of the persons listed below, nominated by the current Board of Directors, as Class II directors of the Company: |
For
|
Against
|
Abstain
|
|
+ |
| |||||||||||||||||
| 2. | Proposal to approve the Company’s annual audited financial statements for the fiscal year ended December 31, 2017. | ☐ | ☐ | ☐ | ||||||||||||||||||||
| 01 - Philip K. Brewer | For
☐ |
Against
☐ |
Abstain
☐ |
|
3.
|
|
Proposal to approve the re-appointment of KPMG LLP, an independent registered public accounting firm, to act as the Company’s independent auditors for the fiscal year ending December 31, 2018 and the authorization for the Company’s Board of Directors, acting through the Company’s Audit Committee, to fix the remuneration of the Company’s independent auditors for the fiscal year ending December 31, 2018.
|
☐ |
☐ |
☐ |
||||||||||||||
|
02 - Hennie Van der Merwe
|
☐
|
☐
|
☐
|
|||||||||||||||||||||
| 4. | To transact such other business as may properly be brought before the 2018 Annual Meeting (including any postponement or adjournment(s) thereof).
|
|||||||||||||||||||||||
| B | Non-Voting Items | |||||||||||||||||||||||
| Change of Address — Please print new address below. | ||||||||||||||||||||||||
| C | Authorized Signatures — This section must be completed for your vote to be counted. — Date and Sign Below |
Please sign exactly as name appears on your share certificate(s). When shares are held by joint tenants, all should sign. When signing as an attorney, executor, administrator, trustee or guardian, please indicate in what capacity. If signing for a corporation, please provide the full corporate name as well as signature(s) and title(s) of its authorized officer(s). If signing for a partnership, please provide the full partnership name as well as signature(s) of its authorized partner(s). The signer hereby revokes all proxies heretofore given by the signer to vote at said meeting or any adjournment thereof. In his discretion, the Proxy is authorized to vote upon such other matters as may properly come before the meeting.
| Date (mm/dd/yyyy) — Please print date below. |
Signature 1 — Please keep signature within the box. |
Signature 2 — Please keep signature within the box. | ||||||||||
| / / |

Table of Contents
q IF YOU HAVE NOT VOTED VIA THE INTERNET OR TELEPHONE, FOLD ALONG THE PERFORATION, DETACH AND RETURN THE BOTTOM PORTION IN THE ENCLOSED ENVELOPE.q
Proxy — TEXTAINER GROUP HOLDINGS LIMITED
2018 ANNUAL GENERAL MEETING OF SHAREHOLDERS TO BE HELD MAY 23, 2018
THIS PROXY CARD IS SOLICITED ON BEHALF OF THE BOARD OF DIRECTORS
This Proxy Card is solicited on behalf of the Board of Directors of Textainer Group Holdings Limited, a Bermuda company (the “Company”), for use only at the Company’s 2018 Annual General Meeting of Shareholders to be held on May 23, 2018 to be held at The Fairmont Southampton, 101 South Shore Road, Southampton, Bermuda SN02 at 9:00 a.m. (local time) and at any postponement or adjournment(s) thereof (the “2018 Annual Meeting”).
The undersigned, being a shareholder of the Company, hereby appoints Philip K. Brewer, President and Chief Executive Officer of the Company, as proxy of the undersigned (the “Proxy”), with full powers of substitution, to vote on the undersigned’s behalf, all common shares, $0.01 par value per share of the Company, of the undersigned at the 2018 Annual Meeting, as designated on the reverse side of this Proxy Card.
This Proxy Card (when properly executed, returned and not revoked) will be voted in accordance with the instructions, if any, given thereon. If no instructions are provided in this Proxy Card (when properly executed, returned and not revoked) it will be voted FOR each nominee identified below to be elected to the Board of Directors (Proposal One), FOR each of Proposals Two and Three and in accordance with the proxyholder’s best judgment as to any other business as may properly come before the 2018 Annual Meeting.
The Board of Directors unanimously recommends a vote FOR each nominee identified below to be elected to the Board of Directors (Proposal One) and FOR each of Proposals Two and Three.
CONTINUED AND TO BE SIGNED ON REVERSE SIDE
SEE REVERSE SIDE
Serious News for Serious Traders! Try StreetInsider.com Premium Free!
You May Also Be Interested In
- Tornado Global Hydrovacs Reports Record 2023 Results
- DLP Resources Expands Copper and Molybdenum zone on the 100 % Owned Esperanza Project with an Additional 53 Rock Samples Returning up to 3.46 % Cu, 130.5ppm Mo, 7930ppm Zn and 245ppm Co
- Bigleaf Networks Named as a Bronze Winner of the 2024 Stevie Awards for Sales & Customer Service
Create E-mail Alert Related Categories
SEC FilingsSign up for StreetInsider Free!
Receive full access to all new and archived articles, unlimited portfolio tracking, e-mail alerts, custom newswires and RSS feeds - and more!
