

Form 6-K TEEKAY TANKERS LTD. For: Mar 31
 Tweet
Tweet Share
ShareUNITED STATES
SECURITIES AND EXCHANGE COMMISSION
WASHINGTON, D.C. 20549
___________________________________________________________
FORM 6-K
___________________________________________________________
Report of Foreign Private Issuer
Pursuant to Rule 13a-16 or 15d-16 under
the Securities Exchange Act of 1934
For the quarterly period ended March 31, 2021
Commission file number 1-33867
___________________________________________________________
TEEKAY TANKERS LTD.
(Exact name of Registrant as specified in its charter)
___________________________________________________________
4th Floor, Belvedere Building, 69 Pitts Bay Road, Hamilton, HM08, Bermuda
(Address of principal executive office)
___________________________________________________________
Indicate by check mark whether the registrant files or will file annual reports under cover of Form 20-F or Form 40-F.
Form 20-F ý Form 40-F ¨
Indicate by check mark if the registrant is submitting the Form 6-K in paper as permitted by Regulation S-T Rule 101(b)(1).
Yes ¨ No ý
Indicate by check mark if the registrant is submitting the Form 6-K in paper as permitted by Regulation S-T Rule 101(b)(7).
Yes ¨ No ý
TEEKAY TANKERS LTD.
REPORT ON FORM 6-K FOR THE QUARTERLY PERIOD ENDED MARCH 31, 2021
INDEX
| PAGE | ||||||||
| Item 1. | ||||||||
| Item 2. | ||||||||
PART I – FINANCIAL INFORMATION
ITEM 1 – FINANCIAL STATEMENTS
TEEKAY TANKERS LTD. AND SUBSIDIARIES
UNAUDITED CONSOLIDATED STATEMENTS OF (LOSS) INCOME (note 1)
(in thousands of U.S. Dollars, except share and per share amounts)
| Three Months Ended March 31, | ||||||||||||||
| 2021 | 2020 | |||||||||||||
| $ | $ | |||||||||||||
Voyage charter revenues (note 3) | 112,201 | 317,478 | ||||||||||||
Time-charter revenues (note 3) | 28,285 | 15,567 | ||||||||||||
Other revenues (notes 3 and 4) | 2,263 | 8,855 | ||||||||||||
| Total revenues | 142,749 | 341,900 | ||||||||||||
| Voyage expenses | (69,045) | (119,241) | ||||||||||||
Vessel operating expenses (note 13b) | (43,048) | (50,649) | ||||||||||||
| Time-charter hire expenses | (3,630) | (9,879) | ||||||||||||
| Depreciation and amortization | (26,684) | (29,632) | ||||||||||||
General and administrative expenses (note 13b) | (11,470) | (9,286) | ||||||||||||
Write-down and loss on sale of assets (note 15) | (715) | (3,087) | ||||||||||||
| (Loss) income from operations | (11,843) | 120,126 | ||||||||||||
| Interest expense | (10,068) | (15,135) | ||||||||||||
| Interest income | 30 | 256 | ||||||||||||
Realized and unrealized gain (loss) on derivative instruments (note 8) | 703 | (827) | ||||||||||||
| Equity (loss) income | (359) | 1,940 | ||||||||||||
Other income (note 9) | 743 | 1,143 | ||||||||||||
| Net (loss) income before income tax | (20,794) | 107,503 | ||||||||||||
Income tax expense (note 10) | (571) | (664) | ||||||||||||
| Net (loss) income | (21,365) | 106,839 | ||||||||||||
Per common share amounts (note 14) | ||||||||||||||
| - Basic (loss) earnings per share | $ | (0.63) | $ | 3.17 | ||||||||||
| - Diluted (loss) earnings per share | $ | (0.63) | $ | 3.15 | ||||||||||
Weighted-average number of Class A and Class B common stock outstanding (note 14) | ||||||||||||||
| - Basic | 33,743,722 | 33,669,967 | ||||||||||||
| - Diluted | 33,743,722 | 33,946,292 | ||||||||||||
Related party transactions (note 13) | ||||||||||||||
The accompanying notes are an integral part of the unaudited consolidated financial statements.
1
TEEKAY TANKERS LTD. AND SUBSIDIARIES
UNAUDITED CONSOLIDATED BALANCE SHEETS (notes 1 and 2)
(in thousands of U.S. Dollars)
| As at | As at | |||||||||||||
| March 31, 2021 | December 31, 2020 | |||||||||||||
$ | $ | |||||||||||||
| ASSETS | ||||||||||||||
| Current | ||||||||||||||
| Cash and cash equivalents | 87,595 | 97,232 | ||||||||||||
Restricted cash – current (note 16) | 2,813 | 2,779 | ||||||||||||
| Accounts receivable | 36,782 | 36,202 | ||||||||||||
Assets held for sale (note 15) | — | 32,974 | ||||||||||||
Due from affiliates (note 13c) | 1,730 | 5,236 | ||||||||||||
| Bunker and lube oil inventory | 40,403 | 34,606 | ||||||||||||
| Prepaid expenses | 11,618 | 9,739 | ||||||||||||
| Accrued revenue | 38,057 | 26,640 | ||||||||||||
| Total current assets | 218,998 | 245,408 | ||||||||||||
Restricted cash – long-term (note 16) | 3,135 | 3,135 | ||||||||||||
Vessels and equipment | ||||||||||||||
At cost, less accumulated depreciation of $437.1 million (2020 - $417.4 million) (note 6) | 1,085,289 | 1,104,742 | ||||||||||||
Vessels related to finance leases, at cost, less accumulated depreciation of $131.3 million (2020 - $124.4 million) (note 7) | 444,793 | 450,558 | ||||||||||||
Operating lease right-of-use assets (notes 7 and 15) | 708 | 2,529 | ||||||||||||
| Total vessels and equipment | 1,530,790 | 1,557,829 | ||||||||||||
| Investment in and advances to equity-accounted joint venture | 28,202 | 28,561 | ||||||||||||
Derivative assets (note 8) | 167 | — | ||||||||||||
| Other non-current assets | 2,075 | 897 | ||||||||||||
| Intangible assets at cost, less accumulated amortization of $3.8 million (2020 - $3.7 million) | 1,860 | 1,989 | ||||||||||||
| Goodwill | 2,426 | 2,426 | ||||||||||||
| Total assets | 1,787,653 | 1,840,245 | ||||||||||||
| LIABILITIES AND EQUITY | ||||||||||||||
| Current | ||||||||||||||
| Accounts payable | 34,485 | 31,059 | ||||||||||||
Accrued liabilities (note 13c) | 35,535 | 55,055 | ||||||||||||
Short-term debt (note 5) | 20,000 | 10,000 | ||||||||||||
Due to affiliates (note 13c) | 4,748 | 3,123 | ||||||||||||
| Current portion of long-term debt (note 6) | 10,973 | 10,858 | ||||||||||||
Current portion of derivative liabilities (note 8) | 313 | 289 | ||||||||||||
Current obligations related to finance leases (note 7) | 198,164 | 78,476 | ||||||||||||
Current portion of operating lease liabilities (note 7) | 1,880 | 3,685 | ||||||||||||
Other current liabilities (note 3) | 2,643 | 4,574 | ||||||||||||
| Total current liabilities | 308,741 | 197,119 | ||||||||||||
Long-term debt (note 6) | 214,805 | 232,103 | ||||||||||||
Long-term obligations related to finance leases (note 7) | 155,797 | 281,567 | ||||||||||||
Long-term operating lease liabilities (note 7) | 211 | 315 | ||||||||||||
Derivative liabilities (note 8) | — | 597 | ||||||||||||
Other long-term liabilities (note 10) | 50,221 | 49,642 | ||||||||||||
| Total liabilities | 729,775 | 761,343 | ||||||||||||
Commitments and contingencies (notes 5, 6, 7, and 8) | ||||||||||||||
| Equity | ||||||||||||||
Common stock and additional paid-in capital (585.0 million shares authorized, 29.2 million Class A and 4.6 million Class B shares issued and outstanding as of March 31, 2021 and 585.0 million shares authorized, 29.1 million Class A and 4.6 million Class B shares issued and outstanding as at December 31, 2020) (note 12) | 1,299,561 | 1,299,220 | ||||||||||||
| Accumulated deficit | (241,683) | (220,318) | ||||||||||||
| Total equity | 1,057,878 | 1,078,902 | ||||||||||||
| Total liabilities and equity | 1,787,653 | 1,840,245 | ||||||||||||
The accompanying notes are an integral part of the unaudited consolidated financial statements.
2
TEEKAY TANKERS LTD. AND SUBSIDIARIES
UNAUDITED CONSOLIDATED STATEMENTS OF CASH FLOWS (note 1)
(in thousands of U.S. Dollars)
| Three Months Ended March 31, | ||||||||||||||
| 2021 | 2020 | |||||||||||||
| $ | $ | |||||||||||||
| Cash, cash equivalents and restricted cash provided by (used for) | ||||||||||||||
| OPERATING ACTIVITIES | ||||||||||||||
| Net (loss) income | (21,365) | 106,839 | ||||||||||||
| Non-cash items: | ||||||||||||||
| Depreciation and amortization | 26,684 | 29,632 | ||||||||||||
Write-down and loss on sale of assets (note 15) | 715 | 3,087 | ||||||||||||
Unrealized (gain) loss on derivative instruments (note 8) | (740) | 1,301 | ||||||||||||
| Equity loss (income) | 359 | (1,940) | ||||||||||||
Income tax expense (note 10) | 484 | 1,439 | ||||||||||||
| Other | (500) | 744 | ||||||||||||
| Change in operating assets and liabilities | (30,037) | (1,308) | ||||||||||||
| Expenditures for dry docking | (3,045) | (1,109) | ||||||||||||
| Net operating cash flow | (27,445) | 138,685 | ||||||||||||
| FINANCING ACTIVITIES | ||||||||||||||
Proceeds from short-term debt (note 5) | 10,000 | 135,000 | ||||||||||||
Prepayments of short-term debt (note 5) | — | (130,000) | ||||||||||||
Proceeds from long-term debt, net of issuance costs (note 6) | — | 479,091 | ||||||||||||
Scheduled repayments of long-term debt (note 6) | (2,808) | (5,728) | ||||||||||||
Prepayments of long-term debt (note 6) | (15,000) | (557,368) | ||||||||||||
Scheduled repayments of obligations related to finance leases (note 7) | (6,082) | (6,108) | ||||||||||||
| Other | (42) | — | ||||||||||||
| Net financing cash flow | (13,932) | (85,113) | ||||||||||||
| INVESTING ACTIVITIES | ||||||||||||||
Proceeds from sale of vessels (note 15) | 32,687 | 60,915 | ||||||||||||
| Expenditures for vessels and equipment | (913) | (842) | ||||||||||||
| Loan repayments from equity-accounted joint venture | — | 2,000 | ||||||||||||
| Net investing cash flow | 31,774 | 62,073 | ||||||||||||
| (Decrease) increase in cash, cash equivalents and restricted cash | (9,603) | 115,645 | ||||||||||||
| Cash, cash equivalents and restricted cash, beginning of the period | 103,146 | 96,790 | ||||||||||||
| Cash, cash equivalents and restricted cash, end of the period | 93,543 | 212,435 | ||||||||||||
Supplemental cash flow information (note 16)
The accompanying notes are an integral part of the unaudited consolidated financial statements.
3
TEEKAY TANKERS LTD. AND SUBSIDIARIES
UNAUDITED CONSOLIDATED STATEMENTS OF CHANGES IN EQUITY (note 1)
(in thousands of U.S. Dollars, except share amounts)
Common Stock and Additional Paid-in Capital | ||||||||||||||||||||||||||||||||
Thousands of Common Shares # | Class A Common Shares $ | Class B Common Shares $ | Accumulated Deficit $ | Total $ | ||||||||||||||||||||||||||||
| Balance as at December 31, 2020 | 33,738 | 1,210,688 | 88,532 | (220,318) | 1,078,902 | |||||||||||||||||||||||||||
| Net loss | — | — | — | (21,365) | (21,365) | |||||||||||||||||||||||||||
Equity-based compensation (note 12) | 17 | 341 | — | — | 341 | |||||||||||||||||||||||||||
| Balance as at March 31, 2021 | 33,755 | 1,211,029 | 88,532 | (241,683) | 1,057,878 | |||||||||||||||||||||||||||
Common Stock and Additional Paid-in Capital | ||||||||||||||||||||||||||||||||
Thousands of Common Shares # | Class A Common Shares $ | Class B Common Shares $ | Accumulated Deficit $ | Total $ | ||||||||||||||||||||||||||||
| Balance as at December 31, 2019 | 33,655 | 1,209,023 | 88,532 | (307,635) | 989,920 | |||||||||||||||||||||||||||
| Net income | — | — | — | 106,839 | 106,839 | |||||||||||||||||||||||||||
Equity-based compensation (note 12) | 57 | 468 | — | — | 468 | |||||||||||||||||||||||||||
| Balance as at March 31, 2020 | 33,712 | 1,209,491 | 88,532 | (200,796) | 1,097,227 | |||||||||||||||||||||||||||
The accompanying notes are an integral part of the unaudited consolidated financial statements.
4
TEEKAY TANKERS LTD. AND SUBSIDIARIES
NOTES TO THE UNAUDITED CONSOLIDATED FINANCIAL STATEMENTS
(all tabular amounts stated in thousands of U.S. Dollars, other than share or per share data)
1.Basis of Presentation
The unaudited interim consolidated financial statements (or unaudited consolidated financial statements) have been prepared in accordance with United States generally accepted accounting principles (or GAAP). These unaudited consolidated financial statements include the accounts of Teekay Tankers Ltd., its wholly-owned subsidiaries, equity-accounted joint venture and any variable interest entities (or VIEs) of which it is the primary beneficiary (collectively, the Company). The preparation of financial statements in conformity with GAAP requires management to make estimates and assumptions that affect the amounts reported in the unaudited consolidated financial statements and accompanying notes. Actual results could differ from those estimates.
Certain information and footnote disclosures required by GAAP for complete annual financial statements have been omitted and, therefore, these unaudited consolidated financial statements should be read in conjunction with the Company’s audited consolidated financial statements for the year ended December 31, 2020, filed on Form 20-F with the U.S. Securities and Exchange Commission (or the SEC) on April 1, 2021. In the opinion of management, these unaudited consolidated financial statements reflect all adjustments, consisting solely of a normal recurring nature, necessary to present fairly, in all material respects, the Company’s unaudited consolidated financial position, results of operations, and cash flows for the interim periods presented. The results of operations for the interim periods presented are not necessarily indicative of those for a full fiscal year. Intercompany balances and transactions have been eliminated upon consolidation.
In March 2020, the World Health Organization declared the outbreak of a novel coronavirus (or COVID-19) as a pandemic. Given the dynamic nature of these circumstances, the full extent to which the COVID-19 pandemic may have direct or indirect impact on the Company's business and the related financial reporting implications cannot be reasonably estimated at this time, although the pandemic could materially affect the Company's business, results of operations and financial condition in the future. COVID-19 has resulted and may continue to result in a significant decline in global demand for oil. As the Company's business includes the transportation of crude oil and refined petroleum products on behalf of customers, any significant decrease in demand for the cargo the Company transports could adversely affect demand for the Company's vessels and services. Spot tanker rates have come under pressure since mid-May 2020 as a result of significantly reduced oil demand due to COVID-19 and the subsequent decision by the OPEC+ group of oil producers to implement record oil supply cuts. Reduced oil production from other oil producing nations due to lower oil prices and the impact of COVID-19, as well as the unwinding of floating storage, has also contributed to the weakness in tanker rates.
2. Recent Accounting Pronouncements
In December 2019, the FASB issued ASU 2019-12, Income Taxes (Topic 740) Simplifying the Accounting for Income Taxes (or ASU 2019-12), as part of its initiative to reduce complexity in the accounting standards. The amendments in ASU 2019-12 eliminate certain exceptions related to the approach for intraperiod tax allocation, the methodology for calculating income taxes in an interim period and the recognition of deferred tax liabilities for outside basis differences, among other changes. The Company adopted this update on January 1, 2021. The adoption did not have an impact on the Company's unaudited consolidated financial statements and related disclosures.
In March 2020, the FASB issued ASU 2020-04, Reference Rate Reform (Topic 848) Facilitation of the Effects of Reference Rate Reform on Financial Reporting (or ASU 2020-04). This ASU provides optional guidance for a limited period of time to ease potential accounting impacts associated with transitioning away from reference rates that are expected to be discontinued, such as the London Interbank Offered Rate (or LIBOR). The amendments in this ASU apply only to contracts, hedging relationships, and other transactions that reference LIBOR or another reference rate expected to be discontinued. The amendments in this ASU are effective through December 31, 2022. The Company is currently evaluating the effect of adopting this new guidance.
3. Revenue
The Company’s primary source of revenue is from chartering its vessels (Aframax tankers, Suezmax tankers and Long Range 2 (or LR2) tankers) to its customers. The Company utilizes two primary forms of contracts, consisting of voyage charters and time-charters.
The extent to which the Company employs its vessels on voyage charters versus time charters is dependent upon the Company’s chartering strategy and the availability of time charters. Spot market rates for voyage charters are volatile from period to period, whereas time charters provide a stable source of monthly revenue. The Company also provides ship-to-ship support services, which include managing the process of transferring cargo between seagoing ships positioned alongside each other, either stationary or underway, as well as management services to third-party owners of vessels. Prior to April 30, 2020, the Company managed liquefied natural gas (or LNG) terminals and procured LNG-related goods for terminal owners and other customers. For descriptions of these types of contracts, see Item 18 - Financial Statements: Note 3 in the Company’s audited consolidated financial statements filed with its Annual Report on Form 20-F for the year ended December 31, 2020. On April 30, 2020, the Company completed the sale of the non-US portion of its ship-to-ship support services business, as well as its LNG terminal management business (see note 15).
The following table contains a breakdown of the Company's revenue by contract type for the three months ended March 31, 2021 and March 31, 2020. All revenue is part of the Company's tanker segment, except for revenue for the non-US portion of the ship-to-ship support services and LNG terminal management, consultancy, procurement, and other related services, which are part of the Company's
5
TEEKAY TANKERS LTD. AND SUBSIDIARIES
NOTES TO THE UNAUDITED CONSOLIDATED FINANCIAL STATEMENTS
(all tabular amounts stated in thousands of U.S. Dollars, other than share or per share data)
previously existing ship-to-ship transfer segment (see note 4). The Company’s lease income consists of the revenue from its voyage charters and time-charters.
| Three Months Ended March 31, | |||||||||||
| 2021 | 2020 | ||||||||||
$ | $ | ||||||||||
| Voyage charter revenues | |||||||||||
| Suezmax | 55,943 | 157,720 | |||||||||
| Aframax | 27,069 | 72,464 | |||||||||
| LR2 | 17,149 | 48,786 | |||||||||
| Full service lightering | 12,040 | 38,508 | |||||||||
| Total | 112,201 | 317,478 | |||||||||
| Time-charter revenues | |||||||||||
| Suezmax | 19,435 | 15,567 | |||||||||
| Aframax | 6,240 | — | |||||||||
| LR2 | 2,610 | — | |||||||||
| Total | 28,285 | 15,567 | |||||||||
| Other revenues | |||||||||||
| Ship-to-ship support services | 970 | 6,719 | |||||||||
| Vessel management | 1,293 | 2,353 | |||||||||
| LNG terminal management, consultancy, procurement and other | — | (217) | |||||||||
| Total | 2,263 | 8,855 | |||||||||
| Total revenues | 142,749 | 341,900 | |||||||||
Charters-out
As at March 31, 2021, six (December 31, 2020 - nine) of the Company’s vessels operated under fixed-rate time charter contracts, four of which are scheduled to expire in 2021 and two of which are scheduled to expire in 2022. As at March 31, 2021, the minimum scheduled future revenues to be received by the Company under these time charters were approximately $18.0 million (remainder of 2021) and $5.2 million (2022) (December 31, 2020 - $45.3 million (2021) and $5.2 million (2022)). The hire payments should not be construed to reflect a forecast of total charter hire revenue for any of the periods. Future hire payments do not include hire payments generated from new contracts entered into after March 31, 2021, from unexercised option periods of contracts that existed on March 31, 2021 or from variable consideration, if any, under contracts. In addition, future hire payments presented above have been reduced by estimated off-hire time for required periodic maintenance and do not reflect the impact of revenue sharing arrangements whereby time-charter revenues are shared with other revenue sharing arrangement participants. Actual amounts may vary given future events such as unplanned vessel maintenance.
Contract Liabilities
As at March 31, 2021, the Company had $1.8 million (December 31, 2020 - $4.2 million) of advanced payments recognized as contract liabilities that are expected to be recognized as time-charter revenues in subsequent periods and which currently are included in other current liabilities on the Company's unaudited consolidated balance sheets.
6
TEEKAY TANKERS LTD. AND SUBSIDIARIES
NOTES TO THE UNAUDITED CONSOLIDATED FINANCIAL STATEMENTS
(all tabular amounts stated in thousands of U.S. Dollars, other than share or per share data)
4. Segment Reporting
On April 30, 2020, the Company completed the sale of the non-US portion of its ship-to-ship support services business, as well as its LNG terminal management business. Following the sale, the Company's remaining ship-to-ship support operations were integrated into the Company's tanker business. As a result, effective April 30, 2020, the Company has one reportable segment. The Company’s segment information for all periods prior to the sale and reorganization has been retroactively adjusted whereby the remaining ship-to-ship support operations have been reallocated from the ship-to-ship transfer segment to the tanker segment. Consequently, the Company’s tanker segment now consists of the operation of all of its tankers, including the operations from those tankers employed on full service lightering contracts, and the US based ship-to-ship support service operations that the Company retained, including its lightering support services provided as part of full service lightering operations. The Company’s ship-to-ship transfer segment consisted of the Company’s non-US lightering support services, LNG terminal management, consultancy, procurement, and other related services which were sold as of April 30, 2020. Segment results are evaluated based on income from operations. The accounting policies applied to the reportable segments are the same as those used in the preparation of the Company’s unaudited consolidated financial statements.
The following table includes results for the Company’s revenues and income from operations by segment for the three months ended March 31, 2020. No results are included for the three months ended March 31, 2021 as the Company only had one reportable segment during that period.
| Three Months Ended March 31, 2020 | ||||||||||||||||||||||||||
| Tanker Segment | Ship-to-Ship Transfer Segment | Total | ||||||||||||||||||||||||
| $ | $ | $ | ||||||||||||||||||||||||
Revenues (1) | 335,672 | 6,228 | 341,900 | |||||||||||||||||||||||
| Voyage expenses | (119,241) | — | (119,241) | |||||||||||||||||||||||
| Vessel operating expenses | (45,787) | (4,862) | (50,649) | |||||||||||||||||||||||
| Time-charter hire expenses | (9,879) | — | (9,879) | |||||||||||||||||||||||
| Depreciation and amortization | (29,260) | (372) | (29,632) | |||||||||||||||||||||||
General and administrative expenses (2) | (8,806) | (480) | (9,286) | |||||||||||||||||||||||
| Loss and write-down on sale of assets | (3,087) | — | (3,087) | |||||||||||||||||||||||
| Income from operations | 119,612 | 514 | 120,126 | |||||||||||||||||||||||
| Equity income | 1,940 | — | 1,940 | |||||||||||||||||||||||
(1)Revenues earned from the ship-to-ship transfer segment are reflected in Other Revenues in the Company's unaudited consolidated statements of (loss) income.
(2)Includes direct general and administrative expenses and indirect general and administrative expenses (allocated to each segment based on estimated use of corporate resources).
5. Short-Term Debt
In November 2018, Teekay Tankers Chartering Pte. Ltd. (or TTCL), a wholly-owned subsidiary of the Company, entered into a working capital revolving loan facility (or the Working Capital Loan), which initially provided available aggregate borrowings of up to $40.0 million for TTCL, and had an initial maturity date in May 2019, subject to extension as described below. The maximum available aggregate borrowings were subsequently increased to $80.0 million, effective December 2019. The amount available for drawdown is limited to a percentage of certain receivables and accrued revenue, which is assessed weekly. The next maturity date of the Working Capital Loan is in May 2021. The Working Capital Loan maturity date is continually extended for further periods of six months thereafter unless and until the lender gives notice in writing that no further extensions shall occur. Proceeds of the Working Capital Loan are used to provide working capital in relation to certain vessels subject to the revenue sharing agreements (or RSAs). Interest payments are based on LIBOR plus a margin of 3.5%. The Working Capital Loan is collateralized by the assets of TTCL. The Working Capital Loan requires the Company to maintain its paid-in capital contribution under the RSAs and the retained distributions of the RSA counterparties in an amount equal to the greater of (a) an amount equal to the minimum average capital contributed by the RSA counterparties per vessel in respect of the RSA (including cash, bunkers or other working capital contributions and amounts accrued to the RSA counterparties but unpaid) and (b) a minimum capital contribution ranging from $20.0 million to $30.0 million based on the amount borrowed. As at March 31, 2021, $20.0 million (December 31, 2020 - $10.0 million) was owing under this facility, the aggregate available borrowings were $35.7 million (December 31, 2020 - $32.0 million) and the interest rate on the facility was 3.6% (December 31, 2020 - 3.6%). As at March 31, 2021, the Company was in compliance with all covenants in respect of this facility.
7
TEEKAY TANKERS LTD. AND SUBSIDIARIES
NOTES TO THE UNAUDITED CONSOLIDATED FINANCIAL STATEMENTS
(all tabular amounts stated in thousands of U.S. Dollars, other than share or per share data)
6. Long-Term Debt
| As at | As at | ||||||||||
| March 31, 2021 | December 31, 2020 | ||||||||||
| $ | $ | ||||||||||
| Revolving credit facility due through 2024 | 170,000 | 185,000 | |||||||||
| Term loan due in 2023 | 61,760 | 64,568 | |||||||||
| Total principal | 231,760 | 249,568 | |||||||||
| Less: unamortized discount and debt issuance costs | (5,982) | (6,607) | |||||||||
| Total debt | 225,778 | 242,961 | |||||||||
| Less: current portion | (10,973) | (10,858) | |||||||||
| Long-term portion | 214,805 | 232,103 | |||||||||
As at March 31, 2021, the Company had one revolving credit facility (or the 2020 Revolver), which, as at such date, provided for aggregate borrowings of up to $438.4 million (December 31, 2020 - $438.4 million), of which $268.4 million (December 31, 2020 - $253.4 million) was undrawn. Interest payments are based on LIBOR plus a margin, which was 2.40% as at March 31, 2021 (December 31, 2020 - 2.40%). The total amount available under the 2020 Revolver decreases by $91.4 million (remainder of 2021), $80.4 million (2022), $65.3 million (2023) and $201.3 million (2024). As at March 31, 2021, the Company also had one term loan (or the 2020 Term Loan) outstanding, which totaled $61.8 million (December 31, 2020 - $64.6 million). Interest payments are based on LIBOR plus a margin, which was 2.25% as at March 31, 2021 (December 31, 2020 - 2.25%). The term loan reduces in quarterly payments and has a balloon repayment due at maturity in 2023. The 2020 Revolver and 2020 Term Loan are further described below.
In January 2020, the Company entered into the 2020 Revolver, which is scheduled to mature in December 2024, and which had an outstanding balance of $170.0 million drawn as at March 31, 2021. The 2020 Revolver was used to repay a portion of the $455.3 million previously outstanding under two previous revolving credit facilities of the Company, which were scheduled to mature in 2021 and 2022, and under two term loan facilities, which were scheduled to mature in 2020 and 2021. The 2020 Revolver is collateralized by 31 of the Company's vessels, together with other related security. The 2020 Revolver requires that the Company maintain a minimum hull coverage ratio of 125% of the total outstanding drawn balance for the facility period. Such requirement is assessed on a semi-annual basis with reference to vessel valuations compiled by two or more agreed upon third parties. Should the ratio drop below the required amount, the lender may request that the Company either prepay a portion of the loan in the amount of the shortfall or provide additional collateral in the amount of the shortfall, at the Company's option. As at March 31, 2021, the hull coverage ratio was 408%. A decline in the tanker market could negatively affect the ratio. In addition, the Company is required to maintain a minimum liquidity (cash, cash equivalents and undrawn committed revolving credit lines with at least six months to maturity) of the greater of $35.0 million and at least 5% of the Company's total consolidated debt and obligations related to finance leases.
In August 2020, the Company entered into the 2020 Term Loan, which is scheduled to mature in August 2023, and which had an outstanding balance of $61.8 million as at March 31, 2021. The 2020 Term Loan was used to repay a portion of the $85.1 million previously outstanding under one previous term loan facility, which was scheduled to mature in 2021. The 2020 Term Loan is collateralized by four of the Company's vessels, together with other related security. The 2020 Term Loan requires that the Company maintain a minimum hull coverage ratio of 125% of the total outstanding principal balance for the loan period. Such requirement is assessed on a semi-annual basis with reference to vessel valuations compiled by two or more agreed upon third parties. Should the ratio drop below the required amount, the lender may request that the Company either prepay a portion of the loan in the amount of the shortfall or provide additional collateral in the amount of the shortfall, at the Company's option. As at March 31, 2021, the hull coverage ratio was 162%. A decline in the tanker market could negatively affect the ratio. In addition, the Company is required to maintain a minimum liquidity (cash, cash equivalents and undrawn committed revolving credit lines with at least six months to maturity) of the greater of $35.0 million and at least 5% of the Company's total consolidated debt and obligations related to finance leases.
As at March 31, 2021, the Company was in compliance with all covenants in respect of the 2020 Revolver and the 2020 Term Loan.
The weighted-average interest rate on the Company’s long-term debt as at March 31, 2021 was 2.6% (December 31, 2020 - 2.6%). This rate does not reflect the effect of the Company’s interest rate swap agreement (see note 8).
The aggregate annual long-term debt principal repayments required to be made by the Company under the 2020 Revolver and the 2020 Term Loan subsequent to March 31, 2021, are $8.4 million (remainder of 2021), $11.2 million (2022), $42.2 million (2023) and $170.0 million (2024).
8
TEEKAY TANKERS LTD. AND SUBSIDIARIES
NOTES TO THE UNAUDITED CONSOLIDATED FINANCIAL STATEMENTS
(all tabular amounts stated in thousands of U.S. Dollars, other than share or per share data)
7. Operating Leases and Obligations Related to Finance Leases
Operating Leases
The Company charters-in vessels from other vessel owners on time-charter contracts, whereby the vessel owner provides use and technical operation of the vessel for the Company. A time charter-in contract is typically for a fixed period of time, although in certain cases, the Company may have the option to extend the charter. The Company typically pays the owner a daily hire rate that is fixed over the duration of the charter. The Company is generally not required to pay the daily hire rate during periods the vessel is not able to operate.
As at March 31, 2021, minimum commitments to be incurred by the Company under time charter-in contracts were approximately $5.6 million (remainder of 2021), $3.3 million (2022), $6.8 million (2023), $6.8 million (2024), $6.8 million (2025) and $25.0 million (thereafter), including for one Aframax tanker newbuilding expected to be delivered to the Company in the fourth quarter of 2022 to commence a seven-year time charter-in contract.
Obligations Related to Finance Leases
| As at | As at | ||||||||||
| March 31, 2021 | December 31, 2020 | ||||||||||
| $ | $ | ||||||||||
| Total obligations related to finance leases | 353,961 | 360,043 | |||||||||
| Less: current portion | (198,164) | (78,476) | |||||||||
| Long-term obligations related to finance leases | 155,797 | 281,567 | |||||||||
From 2017 to 2019, the Company completed sale-leaseback financing transactions with financial institutions relating to 16 of the Company's vessels. Under these arrangements, the Company transferred the vessels to subsidiaries of the financial institutions (collectively, the Lessors) and leased the vessels back from the Lessors on bareboat charters ranging from 9- to 12-year terms. In October 2020, the Company completed the purchases of two of these vessels for a total cost of $29.6 million, and in May 2021, the Company completed the purchases of two more of these vessels for a total cost of $56.7 million (see note 18). In March 2021, the Company also declared purchase options to acquire six of these vessels for a total cost of $128.8 million with an expected completion date of September 2021. The Company has the option to purchase each of the remaining six vessels starting at various times through November 2021 until the end of their respective lease terms.
The bareboat charters related to these vessels require that the Company maintain a minimum liquidity (cash, cash equivalents and undrawn committed revolving credit lines with at least six months to maturity) of the greater of $35.0 million and at least 5.0% of the Company's consolidated debt and obligations related to finance leases.
Six of the bareboat charters were entered into with subsidiaries of a financial institution in July 2017 and November 2018. Four of these bareboat charters, entered into in July 2017, require the Company to maintain, for each vessel, a minimum hull coverage ratio of 90% of the total outstanding principal balance during the first three years of the lease period and 100% of the total outstanding principal balance thereafter. As at March 31, 2021, these ratios were 101% (December 31, 2020 - ranged from 121% to 143%). The remaining two of these bareboat charters, entered into in November 2018, require the Company to maintain, for each vessel, a minimum hull coverage ratio of 100% of the total outstanding principal balance. As at March 31, 2021, these ratios ranged from 121% to 126% (December 31, 2020 - ranged from 145% to 156%). Should any of these ratios drop below the required amount, the lessor may request that the Company prepay additional charter hire.
Eight bareboat charters were entered into with subsidiaries of a financial institution in September 2018 and May 2019. Six of these bareboat charters, entered into in September 2018, require the Company to maintain, for each vessel, a minimum hull coverage ratio of 75% of the total outstanding principal balance during the first year of the lease period, 78% for the second year, 80% for the following two years and 90% of the total outstanding principal balance thereafter. As at March 31, 2021, these ratios ranged from 84% to 92% (December 31, 2020 - ranged from 80% to 88%). The remaining two of these bareboat charters, entered into in May 2019, require the Company to maintain, for each vessel, a minimum hull coverage ratio of 75% of the total outstanding principal balance during the first year of the lease period, 78% for the second year, 80% for the following two years and 90% of the total outstanding principal balance thereafter. As at March 31, 2021, these ratios were 81% (December 31, 2020 - 81%). Should any of these ratios drop below the required amount, and we are unable to cure any such breach within the prescribed cure period, our obligations may become immediately due and payable at the election of the relevant lessor. In certain circumstances, this could lead to cross-defaults under our other financing agreements which in turn could result in obligations becoming due and commitments being terminated under such agreements. In November 2020, the Company declared purchase options to acquire two of these vessels, which purchases were completed in May 2021 (see note 18) for a total cost of $56.7 million, and in March 2021, the Company declared purchase options to acquire the remaining six vessels for a total cost of $128.8 million with an expected completion date of September 2021. In April 2021, the Company was served with a claim from the counterparty of the bareboat charters relating to these eight vessels for reimbursement of breakage costs in respect of interest rate swaps that were entered into by the counterparty in connection with the counterparty's underlying financing. The breakage costs are currently estimated to range from $8 million to $9 million; however, depending on the timing of terminating the swaps and changes in underlying interest rates, the amount of the claim may change. No loss provision in respect of this claim has been made by the Company based on its assessment of the merits of the claim.
9
TEEKAY TANKERS LTD. AND SUBSIDIARIES
NOTES TO THE UNAUDITED CONSOLIDATED FINANCIAL STATEMENTS
(all tabular amounts stated in thousands of U.S. Dollars, other than share or per share data)
The requirements of the bareboat charters are assessed annually or quarterly with reference to vessel valuations compiled by one or more agreed upon third parties. As at March 31, 2021, the Company was in compliance with all covenants in respect of its obligations related to finance leases.
The weighted-average interest rate on the Company’s obligations related to finance leases as at March 31, 2021 was 7.8% (December 31, 2020 - 7.8%).
As at March 31, 2021, the Company's total remaining commitments (including the vessel purchase options declared) related to the financial liabilities of these vessels were approximately $420.2 million (December 31, 2020 - $480.9 million), including imputed interest of $66.2 million (December 31, 2020 - $120.9 million), repayable from 2021 through 2030, as indicated below:
| Commitments | ||||||||
| March 31, 2021 | ||||||||
| Year | $ | |||||||
| Remainder of 2021 | 210,962 | |||||||
| 2022 | 21,848 | |||||||
| 2023 | 21,846 | |||||||
| 2024 | 21,903 | |||||||
| 2025 | 21,841 | |||||||
| Thereafter | 121,782 | |||||||
8. Derivative Instruments
Interest rate swap agreement
The Company uses derivative instruments in accordance with its overall risk management policies. The Company enters into interest rate swap agreements which exchange a receipt of floating interest for a payment of fixed interest to reduce the Company’s exposure to interest rate variability on its outstanding floating-rate debt. The Company has not designated, for accounting purposes, its interest rate swap as a cash flow hedge of its U.S. Dollar LIBOR-denominated borrowings.
In January 2020, the Company completed a refinancing of certain long-term debt facilities (see note 6). As a result of this refinancing, the Company extinguished all of its then existing interest rate swaps. In March 2020, the Company entered into a new interest rate swap agreement which is scheduled to mature in December 2024. The following summarizes the Company's interest rate swap agreement as at March 31, 2021:
| Interest Rate | Notional Amount | Fair Value /Carrying Amount of Asset | Fair Value /Carrying Amount of (Liability) | Remaining Term | Fixed Swap Rate | ||||||||||||||||||||||||||||||
| Index | $ | $ | $ | (years) | (%) (1) | ||||||||||||||||||||||||||||||
| LIBOR-Based Debt: | |||||||||||||||||||||||||||||||||||
| U.S. Dollar-denominated interest rate swap agreement | LIBOR | 50,000 | 167 | (280) | 3.8 | 0.76 | |||||||||||||||||||||||||||||
(1)Excludes the margin the Company pays on its variable-rate long-term debt, which, as of March 31, 2021, ranged from 2.25% to 2.40%.
The Company is potentially exposed to credit loss in the event of non-performance by the counterparty to the interest rate swap agreements in the event that the fair value results in an asset being recorded. In order to minimize counterparty risk, the Company only enters into interest rate swap agreements with counterparties that are rated A– or better by Standard & Poor’s or A3 or better by Moody’s at the time transactions are entered into.
Forward freight agreements
The Company uses forward freight agreements (or FFAs) in non-hedge-related transactions to increase or decrease its exposure to spot market rates, within defined limits. Net gains and losses from FFAs are recorded within realized and unrealized gain (loss) on derivative instruments in the Company's unaudited consolidated statements of (loss) income.
10
TEEKAY TANKERS LTD. AND SUBSIDIARIES
NOTES TO THE UNAUDITED CONSOLIDATED FINANCIAL STATEMENTS
(all tabular amounts stated in thousands of U.S. Dollars, other than share or per share data)
The following table presents the location and fair value amounts of derivative instruments, segregated by type of contract, on the Company’s unaudited consolidated balance sheets.
| Current Portion of Derivative Assets | Derivative Assets | Accounts Receivable | Current Portion of Derivative Liabilities | Derivative Liabilities | |||||||||||||||||||||||||
$ | $ | $ | $ | $ | |||||||||||||||||||||||||
| As at March 31, 2021 | |||||||||||||||||||||||||||||
| Interest rate swap agreement | — | 167 | — | (280) | — | ||||||||||||||||||||||||
| Forward freight agreements | — | — | — | (33) | — | ||||||||||||||||||||||||
| — | 167 | — | (313) | — | |||||||||||||||||||||||||
| As at December 31, 2020 | |||||||||||||||||||||||||||||
| Interest rate swap agreement | — | — | — | (289) | (597) | ||||||||||||||||||||||||
| — | — | — | (289) | (597) | |||||||||||||||||||||||||
Realized and unrealized (losses) gains relating to the interest rate swaps and FFAs are recognized in earnings and reported in realized and unrealized gain (loss) on derivative instruments in the Company’s unaudited consolidated statements of (loss) income as follows:
| Three Months Ended | Three Months Ended | ||||||||||||||||||||||
| March 31, 2021 | March 31, 2020 | ||||||||||||||||||||||
| Realized (Losses) Gains | Unrealized Gains (Losses) | Total | Realized Gains (Losses) | Unrealized (Losses) | Total | ||||||||||||||||||
| $ | $ | $ | $ | $ | $ | ||||||||||||||||||
| Interest rate swap agreement | (65) | 773 | 708 | 523 | (1,214) | (691) | |||||||||||||||||
| Forward freight agreements | 28 | (33) | (5) | (49) | (87) | (136) | |||||||||||||||||
| (37) | 740 | 703 | 474 | (1,301) | (827) | ||||||||||||||||||
9. Other Income
The components of other income are as follows:
| Three Months Ended March 31, | |||||||||||
| 2021 | 2020 | ||||||||||
| $ | $ | ||||||||||
| Foreign exchange gain | 612 | 1,135 | |||||||||
| Other income | 131 | 8 | |||||||||
| Total | 743 | 1,143 | |||||||||
10. Income Tax Expense
The following table reflects changes in uncertain tax positions relating to freight tax liabilities, which are recorded in other long-term liabilities on the Company's unaudited consolidated balance sheets:
| Three Months Ended March 31, | |||||||||||
2021 $ | 2020 $ | ||||||||||
| Balance of unrecognized tax benefits as at January 1 | 49,124 | 49,579 | |||||||||
| Increases for positions related to the current year | 1,062 | 422 | |||||||||
| Increases for positions related to prior years | 1,293 | 1,016 | |||||||||
| Decreases related to statute of limitations | (2,065) | — | |||||||||
| Foreign exchange gain | (598) | (1,098) | |||||||||
| Balance of unrecognized tax benefits as at March 31 | 48,816 | 49,919 | |||||||||
11
TEEKAY TANKERS LTD. AND SUBSIDIARIES
NOTES TO THE UNAUDITED CONSOLIDATED FINANCIAL STATEMENTS
(all tabular amounts stated in thousands of U.S. Dollars, other than share or per share data)
Included in the Company's current income tax expense are provisions for uncertain tax positions relating to freight taxes. Positions relating to freight taxes can vary each year depending on the trading patterns of the Company's vessels.
The Company does not presently anticipate that its provisions for these uncertain tax positions will significantly increase in the next 12 months; however, this is dependent on the jurisdictions in which vessel trading activity occurs. The Company reviews its freight tax obligations on a regular basis and may update its assessment of its tax positions based on available information at that time. Such information may include legal advice as to applicability of freight taxes in relevant jurisdictions. Freight tax regulations are subject to change and interpretation; therefore, the amounts recorded by the Company may change accordingly.
11. Financial Instruments
Fair Value Measurements
For a description of how the Company estimates fair value and for a description of the fair value hierarchy levels, see Item 18 - Financial Statements: Note 12 to the Company’s audited consolidated financial statements filed with its Annual Report on Form 20-F for the year ended December 31, 2020.
The following table includes the estimated fair value, carrying value and categorization using the fair value hierarchy of those assets and liabilities that are measured at their estimated fair value on a recurring and non-recurring basis, as well as certain financial instruments that are not measured at fair value on a recurring basis.
| March 31, 2021 | December 31, 2020 | |||||||||||||||||||||||||||||||
Fair Value Hierarchy Level | Carrying Amount Asset / (Liability) $ | Fair Value Asset / (Liability) $ | Carrying Amount Asset / (Liability) $ | Fair Value Asset / (Liability) $ | ||||||||||||||||||||||||||||
| Recurring: | ||||||||||||||||||||||||||||||||
Cash, cash equivalents and restricted cash (note 16) | Level 1 | 93,543 | 93,543 | 103,146 | 103,146 | |||||||||||||||||||||||||||
Derivative instruments (note 8) | ||||||||||||||||||||||||||||||||
Interest rate swap agreement - asset (1) | Level 2 | 167 | 167 | — | — | |||||||||||||||||||||||||||
Interest rate swap agreement - liability (1) | Level 2 | (280) | (280) | (886) | (886) | |||||||||||||||||||||||||||
Freight forward agreements (1) | Level 2 | (33) | (33) | — | — | |||||||||||||||||||||||||||
| Non-recurring: | ||||||||||||||||||||||||||||||||
Operating lease right-of-use assets (note 15) | Level 2 | 78 | 78 | 1,799 | 1,799 | |||||||||||||||||||||||||||
Vessels and equipment (note 15) | Level 2 | — | — | 59,250 | 59,250 | |||||||||||||||||||||||||||
Assets held for sale (note 15) | Level 2 | — | — | 31,680 | 31,680 | |||||||||||||||||||||||||||
| Other: | ||||||||||||||||||||||||||||||||
Short-term debt (note 5) | Level 2 | (20,000) | (20,000) | (10,000) | (10,000) | |||||||||||||||||||||||||||
| Advances to equity-accounted joint venture | Note (2) | 5,280 | Note (2) | 5,280 | Note (2) | |||||||||||||||||||||||||||
Long-term debt, including current portion (note 6) | Level 2 | (225,778) | (231,002) | (242,961) | (248,738) | |||||||||||||||||||||||||||
Obligations related to finance leases, including current portion (note 7) | Level 2 | (353,961) | (374,211) | (360,043) | (411,740) | |||||||||||||||||||||||||||
(1)The fair value of the Company’s interest rate swap agreement and FFAs at March 31, 2021 and December 31, 2020 exclude accrued interest income and expenses which are recorded in accounts receivable and accrued liabilities, respectively, on the unaudited consolidated balance sheets.
(2)The advances to its equity-accounted joint venture, together with the Company’s investment in the equity-accounted joint venture, form the net aggregate carrying value of the Company’s interests in the equity-accounted joint venture in these unaudited consolidated financial statements. The fair values of the individual components of such aggregate interests as at March 31, 2021 and December 31, 2020 were not determinable.
12
TEEKAY TANKERS LTD. AND SUBSIDIARIES
NOTES TO THE UNAUDITED CONSOLIDATED FINANCIAL STATEMENTS
(all tabular amounts stated in thousands of U.S. Dollars, other than share or per share data)
12. Capital Stock and Equity-Based Compensation
The authorized capital stock of the Company at March 31, 2021 was 100.0 million shares of Preferred Stock (December 31, 2020 - 100.0 million shares), with a par value of $0.01 per share (December 31, 2020 - $0.01 per share), 485.0 million shares of Class A common stock (December 31, 2020 - 485.0 million shares), with a par value of $0.01 per share (December 31, 2020 - $0.01 per share), and 100.0 million shares of Class B common stock (December 31, 2020 - 100.0 million shares), with a par value of $0.01 per share (December 31, 2020 - $0.01 per share). A share of Class A common stock entitles the holder to one vote per share while a share of Class B common stock entitles the holder to five votes per share, subject to a 49% aggregate Class B common stock voting power maximum. As of March 31, 2021, the Company had 29.2 million shares of Class A common stock (December 31, 2020 – 29.1 million), 4.6 million shares of Class B common stock (December 31, 2020 – 4.6 million) and no shares of preferred stock (December 31, 2020 – nil) issued and outstanding.
During the three months ended March 31, 2021 and 2020, the Company recorded $0.4 million and $0.3 million, respectively, of expenses related to restricted stock units and stock options in general and administrative expenses. During the three months ended March 31, 2021, a total of 24.0 thousand restricted stock units (2020 - 78.3 thousand) with a market value of $0.3 million (2020 - $1.3 million) vested and 17.3 thousand shares (2020 - 46.6 thousand shares) of Class A common stock, net of withholding taxes, were concurrently issued to the grantees.
13. Related Party Transactions
Management Fee - Related and Other
a.The Company's operations are conducted in part by its subsidiaries, which receive services from Teekay's wholly-owned subsidiary, Teekay Shipping Ltd. (or the Manager) and its affiliates. The Manager provides various services under a long-term management agreement (the Management Agreement), as disclosed below.
b.Amounts received and (paid) by the Company for related party transactions for the periods indicated were as follows:
| Three Months Ended | |||||||||||
| March 31, 2021 | March 31, 2020 | ||||||||||
| $ | $ | ||||||||||
Vessel operating expenses - technical management fee (i) | (252) | (248) | |||||||||
Strategic and administrative service fees (ii) | (9,042) | (7,972) | |||||||||
Secondment fees (iii) | (87) | (98) | |||||||||
Technical management fee revenue (iv) | 170 | 169 | |||||||||
Service revenues (v) | — | 9 | |||||||||
(i)The cost of ship management services provided by a third party has been presented as vessel operating expenses on the Company's unaudited consolidated statements of (loss) income. The Company paid such third party technical management fees to the Manager in relation to certain former TIL vessels.
(ii)The Manager’s strategic and administrative service fees have been presented in general and administrative expenses, except for fees related to technical management services, which have been presented in vessel operating expenses on the Company’s unaudited consolidated statements of (loss) income. The Company’s executive officers are employees of Teekay or subsidiaries thereof, and their compensation (other than any awards under the Company’s long-term incentive plan) is set and paid by Teekay or such other subsidiaries. The Company compensates Teekay for time spent by its executive officers on the Company’s management matters through the strategic portion of the management fee.
(iii)The Company pays secondment fees for services provided by some employees of Teekay. Secondment fees have been presented in general and administrative expenses, except for fees related to technical management services, which have been presented in vessel operating expenses on the Company's unaudited consolidated statements of (loss) income.
(iv)The Company receives reimbursements from Teekay for the provision of technical management services. These reimbursements have been presented in general and administrative expenses on the Company's unaudited consolidated statements of (loss) income.
(v)The Company recorded service revenues relating to Teekay Tanker Operations Limited's (or TTOL) administration of certain revenue sharing agreements and provision of certain commercial services to the counterparties in the agreements.
c.The Manager and other subsidiaries of Teekay collect revenues and remit payments for expenses incurred by the Company’s vessels. Such amounts, which are presented on the Company’s unaudited consolidated balance sheets in "due from affiliates" or "due to affiliates," as applicable, are without interest or stated terms of repayment. In addition, $8.8 million and $10.6 million were payable as crewing and manning costs as at March 31, 2021 and December 31, 2020, respectively, and such amounts are included in accrued liabilities in the unaudited consolidated balance sheets. These crewing and manning costs will be payable as reimbursement to the Manager once they are paid by the Manager to the vessels' crew.
13
TEEKAY TANKERS LTD. AND SUBSIDIARIES
NOTES TO THE UNAUDITED CONSOLIDATED FINANCIAL STATEMENTS
(all tabular amounts stated in thousands of U.S. Dollars, other than share or per share data)
14. (Loss) Earnings Per Share
The net (loss) earnings available for common shareholders and (loss) earnings per common share are presented in the table below:
| Three Months Ended | |||||||||||
| March 31, 2021 | March 31, 2020 | ||||||||||
| $ | $ | ||||||||||
| Net (loss) income | (21,365) | 106,839 | |||||||||
| Weighted average number of common shares - basic | 33,743,722 | 33,669,967 | |||||||||
| Dilutive effect of stock-based awards | — | 276,325 | |||||||||
| Weighted average number of common shares - diluted | 33,743,722 | 33,946,292 | |||||||||
| (Loss) earnings per common share: | |||||||||||
| – Basic | (0.63) | 3.17 | |||||||||
| – Diluted | (0.63) | 3.15 | |||||||||
Stock-based awards that have an anti-dilutive effect on the calculation of diluted earnings per common share are excluded from this calculation. In the periods where a loss attributable to shareholders has been incurred, all stock-based awards are anti-dilutive. For the three months ended March 31, 2020, no restricted stock units had anti-dilutive effects on the calculation of diluted earnings per common share. For the three months ended March 31, 2020, options to acquire 0.1 million shares of the Company’s Class A common stock had anti-dilutive effects on the calculation of diluted earnings per common share.
15. Write-down and Loss on Sale of Assets
During the three months ended March 31, 2021, the Company completed the sale of two Aframax tankers for an aggregate sales price of $32.0 million. These vessels were written-down to their agreed sales price less selling costs and classified as held for sale on the Company's consolidated balance sheet as at December 31, 2020.
During the three months ended March 31, 2021, the Company recorded a write-down of $0.7 million on one of its operating lease right-of-use assets, which was written-down to its estimated fair value, based on prevailing charter rates for comparable periods, due to a reduction in these charter rates.
During the three months ended March 31, 2020, the Company completed the sale of three Suezmax tankers, with an aggregate loss on sales of $2.6 million. The Company also recorded a write-down of $0.5 million on one Suezmax tanker, which was written down to its estimated sales price.
In January 2020, the Company entered into an agreement to sell the non-US portion of its ship-to-ship support services business, as well as its LNG terminal management business. The sale closed on April 30, 2020 for total proceeds of $27.1 million, including an adjustment of $1.1 million for the final amounts of cash and other working capital present on the closing date, and resulted in a gain on sale of approximately $3.1 million. The sale of the ship-to-ship support services business was classified as held for sale as at March 31, 2020.
14
TEEKAY TANKERS LTD. AND SUBSIDIARIES
NOTES TO THE UNAUDITED CONSOLIDATED FINANCIAL STATEMENTS
(all tabular amounts stated in thousands of U.S. Dollars, other than share or per share data)
16. Supplemental Cash Flow Information
Total cash, cash equivalents and restricted cash, including cash, cash equivalents and restricted cash held for sale are as follows:
| As at | As at | As at | As at | ||||||||||||||||||||
| March 31, 2021 | December 31, 2020 | March 31, 2020 | December 31, 2019 | ||||||||||||||||||||
$ | $ | $ | $ | ||||||||||||||||||||
Cash and cash equivalents | 87,595 | 97,232 | 203,325 | 88,824 | |||||||||||||||||||
Restricted cash – current | 2,813 | 2,779 | 3,318 | 3,071 | |||||||||||||||||||
Restricted cash – long-term | 3,135 | 3,135 | 3,437 | 3,437 | |||||||||||||||||||
| Cash and cash equivalents held for sale | — | — | 2,018 | 1,121 | |||||||||||||||||||
| Restricted cash held for sale - current | — | — | 337 | 337 | |||||||||||||||||||
| 93,543 | 103,146 | 212,435 | 96,790 | ||||||||||||||||||||
The Company maintains restricted cash deposits relating to certain FFAs (see note 8), for certain contracts related to the ship-to-ship transfer business and for the LNG terminal management business, prior to its sale in April 2020 (see note 15). Attached to the LNG terminal management contracts were certain performance guarantees which were required to be issued by the Company and have now been terminated. The Company also maintains restricted cash deposits as required by the Company's obligations related to certain finance leases (see note 7).
17. Liquidity
Management is required to assess if the Company will have sufficient liquidity to continue as a going concern for the one-year period following the issuance of these unaudited consolidated financial statements. The Company completed the purchases of two tankers in May 2021 (see note 18) and has declared purchase options to acquire six tankers with an expected completion date of September 2021, for a total cost of $185.5 million, as part of the repurchase options under the sale-leaseback arrangements described in note 7. As a result of this, over the one-year period following the issuance of these unaudited consolidated financial statements, the Company expects it will need to obtain additional sources of financing, in addition to amounts generated from operations, to meet its minimum liquidity requirements under its financial covenants. The Company expects to obtain this liquidity through refinancing the two vessels purchased and six vessels to be repurchased.
The Company is actively pursuing the refinancing described above, which it considers probable of completion based on the status of the refinancing process and the Company’s history of being able to refinance loan facilities and arrange sale-leaseback financings for similar types of vessels.
Based on the Company's liquidity as at the date these unaudited consolidated financial statements were issued, and from the expected cash flows from Company's operations over the following year and by incorporating the Company’s plans to raise additional liquidity that it considers probable, the Company estimates that it will have sufficient liquidity to continue as a going concern for at least a one-year period following the issuance of these unaudited consolidated financial statements.
18. Subsequent Events
On May 17, 2021, the Company completed the purchases of two Suezmax tankers previously under the sale-leaseback arrangements described in note 7 for a total cost of $56.7 million, using available cash and undrawn credit facility.
15
ITEM 2 – MANAGEMENT’S DISCUSSION AND ANALYSIS OF FINANCIAL CONDITION AND RESULTS OF OPERATIONS
The following Management’s Discussion and Analysis of Financial Condition and Results of Operations should be read in conjunction with the unaudited consolidated financial statements and accompanying notes contained in "Item 1 – Financial Statements" of this Report on Form 6-K and with our audited consolidated financial statements contained in "Item 18 – Financial Statements" and "Management’s Discussion and Analysis of Financial Condition and Results of Operations" in "Item 5 – Operating and Financial Review and Prospects" of our Annual Report on Form 20-F for the year ended December 31, 2020.
OVERVIEW
Our business is to own and operate crude oil and product tankers, and we employ a chartering strategy that seeks to capture upside opportunities in the tanker spot market while using fixed-rate time charters and full service lightering (or FSL) contracts to reduce potential downside risks. Our mix of vessels trading in the spot market or subject to fixed-term time charters will change from time to time. In addition to our core business, we also provide ship-to-ship (or STS) support services, along with our tanker commercial management and technical management operations. As at March 31, 2021, our fleet consisted of 55 vessels, including four in-chartered vessels, and one 50%-owned Very Large Crude Carrier (or VLCC). The following table summarizes our fleet as at March 31, 2021:
| Owned and Leased Vessels | Chartered-in Vessels | Total | |||||||||
| Fixed-rate: | |||||||||||
| Suezmax Tankers | 2 | — | 2 | ||||||||
| Aframax Tankers | 3 | — | 3 | ||||||||
LR2 Product Tanker (1) | 1 | — | 1 | ||||||||
Total Fixed-Rate Fleet (2) | 6 | — | 6 | ||||||||
| Spot-rate: | |||||||||||
| Suezmax Tankers | 24 | — | 24 | ||||||||
Aframax Tankers (3)(4) | 12 | 1 | 13 | ||||||||
LR2 Product Tankers (1) | 8 | — | 8 | ||||||||
VLCC Tanker (5) | 1 | — | 1 | ||||||||
Total Spot Fleet (6) | 45 | 1 | 46 | ||||||||
| STS Support Vessels | — | 3 | 3 | ||||||||
| Total Teekay Tankers Fleet | 51 | 4 | 55 | ||||||||
1.Long Range 2 (or LR2) product tankers.
2. Four charter-out contracts are scheduled to expire in 2021 and two charter-out contracts are scheduled to expire in 2022.
3. One Aframax tanker is currently time-chartered in for a period of 24 months expiring in 2021 with an option to extend for one year.
4.Excludes one newbuilding Aframax tanker, which is expected to be delivered to us in late-2022 under a seven-year time charter-in contract with options to extend for three years.
5. VLCC owned through a 50/50 joint venture. As at March 31, 2021, the VLCC was trading on spot voyage charters in a pooling arrangement managed by a third party.
6. As at March 31, 2021, a total of 38 of our owned, leased and chartered-in vessels, as well as 15 vessels not in our fleet and owned by third parties, were subject to revenue sharing agreements (or RSAs).
ITEMS YOU SHOULD CONSIDER WHEN EVALUATING OUR RESULTS
There are a number of factors that should be considered when evaluating our historical financial performance and assessing our future prospects, and we use a variety of financial and operational terms and concepts when analyzing our results of operations. These items can be found in "Item 5 – Operating and Financial Review and Prospects" in our Annual Report on Form 20-F for the year ended December 31, 2020.
16
SIGNIFICANT DEVELOPMENTS IN 2021
Novel Coronavirus (COVID-19) Pandemic
The COVID-19 pandemic has resulted and may continue to result in a significant decline in global demand for oil. As our business includes the transportation of crude oil and refined petroleum products on behalf of our customers, any significant decrease in demand for the cargo we transport could adversely affect demand for our vessels and services.
For the three months ended March 31, 2021, we did not experience any material business interruptions as a result of the COVID-19 pandemic. Spot tanker rates have come under pressure since mid-May 2020 as a result of significantly reduced oil demand due to COVID-19 and the subsequent decision by the OPEC+ group of oil producers to implement record oil supply cuts. Reduced oil production from other oil producing nations due to lower oil prices and the impact of COVID-19, as well as the unwinding of floating storage, has also contributed to the weakness in tanker rates. We continue to monitor the potential impact of the COVID-19 pandemic on us and our industry, including counterparty risk associated with our vessels under contract and the impact on potential vessel impairments. We have also introduced a number of measures to protect the health and safety of the crews on our vessels and our onshore staff.
Effects of the COVID-19 pandemic may include, among others: deterioration of worldwide, regional or national economic conditions and activity and of demand for oil, including due to a potential slowdown in oil demand due to a current resurgence of COVID-19 cases and variants in many regions and the potential for continued or renewed restrictions and lockdowns; operational disruptions to us or our customers due to worker health risks and the effects of regulations, directives or practices implemented in response to the pandemic (such as travel restrictions for individuals and vessels and quarantining and physical distancing); potential delays in (a) the loading and discharging of cargo on or from our vessels, (b) vessel inspections and related certifications by class societies, customers or government agencies, (c) maintenance, modifications or repairs to, or dry docking of, our existing vessels due to worker health or other business disruptions, and (d) the timing of crew changes; reduced cash flow and financial condition, including potential liquidity constraints; potential reduced access to capital as a result of any credit tightening generally or due to declines in global financial markets; potential reduced ability to opportunistically sell any of our vessels on the second-hand market, either as a result of a lack of buyers or a general decline in the value of second-hand vessels; potential decreases in the market values of our vessels and any related impairment charges or breaches relating to vessel-to-loan financial covenants; and potential deterioration in the financial condition and prospects of our customers or business partners.
Given the dynamic nature of the pandemic, including the development of variants of the virus that cause COVID-19, the duration of any potential business disruption and the related financial impact and effects on us and our suppliers, customers and industry, cannot be reasonably estimated at this time and could materially affect our business, results of operations and financial condition. Please read “Item 3 - Key Information - Risk Factors” in our Annual Report on Form 20-F for the year ended December 31, 2020 for additional information about the potential risks of COVID-19 on our business.
Vessel Sales
In February 2021, we agreed to sell two Aframax tankers for a combined sales price of $32.0 million. Both tankers were delivered to their new owners in March 2021.
Vessel Purchases
In March 2021, we declared purchase options to acquire six Aframax tankers for a total cost of $128.8 million, as part of the repurchase options under the sale-leaseback arrangements described in "Item 1 - Financial Statements: Note 7 - Operating Leases and Obligations Related to Finance Leases" of this report. We expect to complete the purchase and delivery of these vessels in September 2021.
In May 2021, we completed the purchases of two Suezmax tankers previously under the sale-leaseback arrangements described in "Item 1 - Financial Statements: Note 7 - Operating Leases and Obligations Related to Finance Leases" of this report, for a total cost of $56.7 million, using available cash and undrawn credit facility.
RESULTS OF OPERATIONS
There are a number of factors that should be considered when evaluating our historical financial performance and assessing our future prospects, and we use a variety of financial and operational terms and concepts when analyzing our results of operations. These can be found in "Item 5 – Operating and Financial Review and Prospects" in our Annual Report on Form 20-F for the year ended December 31, 2020.
In accordance with GAAP, we report gross revenues in our unaudited consolidated statements of (loss) income and include voyage expenses among our operating expenses. However, ship-owners base economic decisions regarding the deployment of their vessels upon anticipated “time-charter equivalent” (or TCE) rates, which represent net revenues (or (loss) income from operations before write-down and loss on sale of assets, general and administrative expenses, depreciation and amortization, time-charter hire expenses and vessel operating expenses), which includes voyage expenses, divided by revenue days; in addition, industry analysts typically measure bulk shipping freight and hire rates in terms of TCE rates. This is because under time charter-out contracts the customer usually pays the voyage expenses, while under voyage charters the ship-owner usually pays the voyage expenses, which typically are added to the hire rate at an approximate cost. Accordingly, the discussion of revenue below focuses on net revenues and TCE rates (both of which are non-GAAP financial measures) where applicable.
17
Summary
Our consolidated loss from operations was $11.8 million for the three months ended March 31, 2021, compared to income from operations of $120.1 million for the same period last year. The primary reasons for this decrease are as follows:
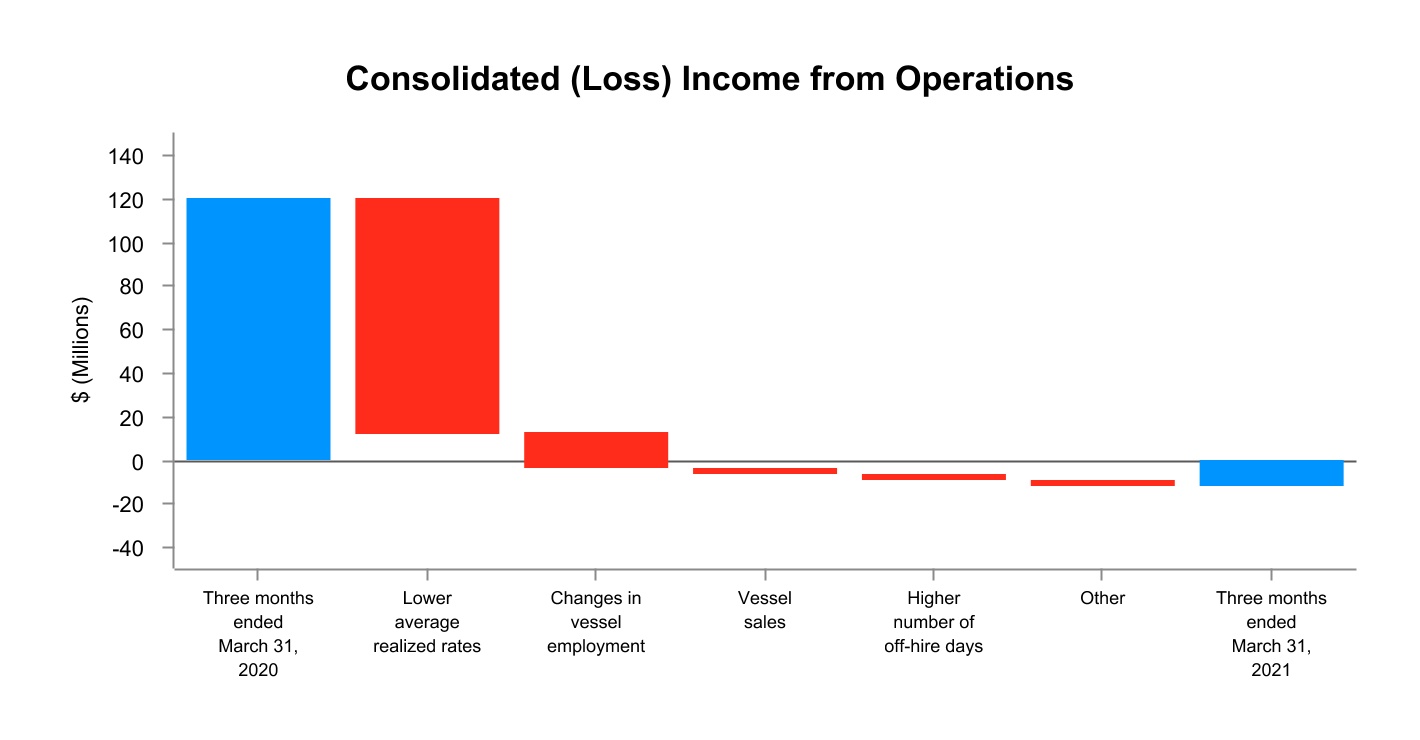
•a decrease of $107.8 million due to lower overall average realized spot TCE rates earned during the first quarter of 2021 by our Suezmax tankers, Aframax tankers and LR2 product tankers, as well as lower earnings from our FSL dedicated vessels;
•a net decrease of $16.7 million due to various vessels on time-charter out contracts earning lower rates compared to the spot rates for the first quarter of 2020;
•a decrease of $2.6 million due to the sale of three Suezmax tankers in the first quarter of 2020 and two Aframax tankers in the first quarter of 2021; and
•a decrease of $2.4 million due to more off-hire days during the first quarter of 2021 primarily related to vessel repairs compared to the same period in the prior year.
On April 30, 2020, we completed the sale of the non-US portion of our STS support services business, as well as our LNG terminal management business. Following this sale, we have only one reportable segment. For periods prior to the sale, we managed our business and analyzed and reported our results of operations on the basis of two reportable segments: the tanker segment and the STS transfer segment. The segment information for all periods has been adjusted to be consistent with the segment presentation after the sale. Please read “Item 1 - Financial Statements: Note 4 - Segment Reporting” of this report.
Details of the changes to our results of operations for each of our segments for the three months ended March 31, 2021, compared to the three months ended March 31, 2020 are provided below.
Three Months Ended March 31, 2021 versus Three Months Ended March 31, 2020
Tanker Segment
Our tanker segment consists of crude oil and product tankers that (i) are subject to long-term, fixed-rate time-charter contracts (which have an original term of one year or more), (ii) operate in the spot tanker market, or (iii) are subject to time-charters that are priced on a spot market basis or are short-term, fixed-rate contracts (which have original terms of less than one year), including those employed on FSL contracts. In addition, our tanker segment also includes our US based STS support services.
18
The following table presents the operating results of our tanker segment for the three months ended March 31, 2021 and 2020, and compares net revenues, a non-GAAP financial measure, for those periods to (loss) income from operations, the most directly comparable GAAP financial measure:
| Three Months Ended March 31, | |||||||||||||||||
| (in thousands of U.S. Dollars, except percentage changes) | 2021 | 2020 | % Change | ||||||||||||||
| Revenues | 142,749 | 335,672 | (57.5)% | ||||||||||||||
| Less: Voyage expenses | (69,045) | (119,241) | (42.1)% | ||||||||||||||
| Net revenues | 73,704 | 216,431 | (65.9)% | ||||||||||||||
| Vessel operating expenses | (43,048) | (45,787) | (6.0)% | ||||||||||||||
| Time-charter hire expenses | (3,630) | (9,879) | (63.3)% | ||||||||||||||
| Depreciation and amortization | (26,684) | (29,260) | (8.8)% | ||||||||||||||
General and administrative expenses (1) | (11,470) | (8,806) | 30.3% | ||||||||||||||
| Write-down and loss on sale of assets | (715) | (3,087) | (76.8)% | ||||||||||||||
| (Loss) income from operations | (11,843) | 119,612 | (109.9)% | ||||||||||||||
| Equity (loss) income | (359) | 1,940 | (118.5)% | ||||||||||||||
(1)Includes direct general and administrative expenses and indirect general and administrative expenses (allocated to each segment based on estimated use of corporate resources). See the discussion under “Other Operating Results” below.
Tanker Market
Crude tanker spot rates remained under pressure during the first quarter of 2021 due to the ongoing impact of the COVID-19 pandemic on global oil demand, oil supply cuts by the OPEC+ group of producers, and the continued unwinding of floating storage. However, the mid-size crude tanker sectors experienced some pockets of strength during the latter part of the first quarter of 2021 due to the impact of weather events in the Atlantic Basin and the blockage of the Suez Canal in late-March 2021.
A resurgence in the number of COVID-19 cases in various regions led to a slowdown in global oil demand during the first quarter of 2021. According to the International Energy Agency (IEA), global oil demand declined to 93.7 million barrels per day (mb/d), down approximately 1.0 mb/d from the fourth quarter of 2020. After increasing supply by 0.5 mb/d in January 2021, the OPEC+ group of producers decided to freeze production for the rest of the first quarter of 2021, while Saudi Arabia implemented an additional voluntary supply cut of 1.0 mb/d from February 2021. The combination of stalling oil demand growth and lower OPEC+ supply put pressure on crude tanker spot rates during the first quarter of 2021. In addition, the number of tankers being used for floating storage fell to a 12-month low of just under 20 million deadweight tons (mdwt) by the end of the first quarter of 2021, which further added to the current tanker supply and demand imbalance.
Despite these pressures, mid-size tanker spot rates showed some pockets of strength during the latter part of the first quarter, particularly in the Atlantic Aframax market. Bad weather in the U.S. Gulf during February and March 2021, along with vessel delays in the Mediterranean, led to tighter tonnage supply, bolstering spot Aframax rates which reached over $20,000 per day on some routes. The blockage of the Suez Canal by the containership Ever Given at the end of March 2021 further tightened vessel supply and contributed to additional rate volatility. Although these events have now passed and spot tanker rates declined at the start of the second quarter, it was encouraging to see a positive rate reaction to these factors in what was otherwise a relatively depressed rate environment.
Although the tanker market is currently under pressure, there are positive indicators that are trending in the right direction and signal a potential recovery in the tanker market in the coming quarters, including:
•Improvements in the global economy. The outlook for the global economy is improving, with the International Monetary Fund (IMF) raising their global GDP growth forecast for 2021 from 5.5 percent to 6.0 percent. As a result of this improved economic outlook, the IEA has increased its forecast for global oil demand in the second half of 2021 from 98.6 mb/d at the start of the year to 98.9 mb/d in its May 2021 monthly report. More importantly for the crude tanker market, the IEA expects global refinery throughput to increase by 6.6 mb/d between April and August 2021, which is expected to generate a significant increase in crude tanker demand.
•Rapidly declining global oil inventories. Global oil inventories, which increased significantly in the second half of 2020, have been drawn down since the beginning of the year and are almost back to long-term averages, which means that oil demand growth will increasingly need to be met by additional oil supply in order to keep the oil market in balance. The OPEC+ group has already indicated its intention to return supply to the oil market by announcing a production increase of 2.1 mb/d between May and July 2021, and it is expected that additional supply will be needed in the second half of 2021 as oil demand is expected to increase in tandem with the rollout of global vaccination programs. This is expected to be positive for tanker demand moving into the second
19
half of 2021; however, the risk remains that further outbreaks of COVID-19 could have a negative impact on oil demand, particularly if these outbreaks affect large oil importing nations.
•Positive tanker fleet supply fundamentals. Tanker supply fundamentals continue to look very positive due to a small orderbook, relatively low levels of new tanker ordering, and an aging global tanker fleet. Since the start of 2021, there has been a large amount of new vessel ordering in the containership sector, which is taking up a considerable amount of shipyard capacity through 2023 and is driving newbuilding prices up for all vessel types. High steel prices are also contributing to the increase in newbuilding prices, which have risen by approximately 10 percent since the fourth quarter of 2020. Higher newbuilding prices, coupled with ongoing uncertainty over vessel technology, are expected to keep the level of new tanker orders relatively low. Tanker scrapping appears to be picking up, with 1.7 mdwt scrapped in March 2021, the highest level in almost three years. The combination of these factors is expected to keep tanker fleet growth at relatively low levels for the next two to three years.
In summary, the tanker market continues to face challenges in the near-term due to the impact of the COVID-19 pandemic. However, the outlook for the second half of 2021 looks more positive as global oil demand is expected to recover in tandem with the rollout of vaccination programs and as the OPEC+ group of producers return oil supply to the market. This should lead to improved tanker fleet utilization in the latter part of 2021, with a more sustained recovery expected in 2022 and 2023 supported by positive long-term fleet supply fundamentals.
Fleet and TCE Rates
As at March 31, 2021, we owned 50 double-hulled oil and product tankers and time chartered-in one Aframax tanker. We also owned a 50% interest in one VLCC, the results of which are included in equity (loss) income.
The following table highlights the operating performance of our time-charter vessels and spot vessels trading in RSAs, on voyage charters and in FSL, measured in net voyage revenue per revenue day, or TCE rates, before off-hire bunker expenses:
| Tanker Segment | |||||||||||||||||||||||
| Three Months Ended March 31, 2021 | |||||||||||||||||||||||
Revenues (1)(5) | Voyage Expenses (2)(5) | Adjustments (3) | TCE Revenues | Revenue Days | Average TCE per Revenue Day (3) | ||||||||||||||||||
| (in thousands) | (in thousands) | (in thousands) | (in thousands) | ||||||||||||||||||||
| Voyage-charter contracts - Suezmax | $ | 55,943 | $ | (35,748) | $ | 146 | $ | 20,341 | 1,906 | $ | 10,670 | ||||||||||||
Voyage-charter contracts - Aframax (4) | $ | 35,198 | $ | (22,826) | $ | 420 | $ | 12,792 | 1,266 | $ | 10,108 | ||||||||||||
Voyage-charter contracts - LR2 (4)(5) | $ | 20,781 | $ | (12,490) | $ | 23 | $ | 8,314 | 727 | $ | 11,434 | ||||||||||||
| Time-charter out contracts - Suezmax | $ | 19,435 | $ | (609) | $ | (152) | $ | 18,674 | 418 | $ | 44,699 | ||||||||||||
| Time-charter out contracts - Aframax | $ | 6,240 | $ | (140) | $ | 9 | $ | 6,109 | 267 | $ | 22,887 | ||||||||||||
| Time-charter out contracts - LR2 | $ | 2,610 | $ | 41 | $ | (73) | $ | 2,578 | 90 | $ | 28,638 | ||||||||||||
| Total | $ | 140,207 | $ | (71,772) | $ | 373 | $ | 68,808 | 4,674 | $ | 14,722 | ||||||||||||
(1)Excludes $0.8 million of revenue earned from our responsibilities in employing the vessels subject to the RSAs, $1.0 million of revenues related to the US portion of our STS support services operations and $0.4 million of bunker commissions earned.
(2)Includes $2.8 million of operating expenses related to providing lightering support services to our FSL operations.
(3)Adjustments primarily include off-hire bunker expenses, which are excluded from Average TCE per revenue day.
(4)Includes $11.9 million of revenues and $7.8 million of voyage expenses related to our FSL operations, which includes $2.8 million of operating expenses referenced in note (2) above related to FSL operations.
(5)Excludes $0.3 million of revenues and $0.1 million of voyage expenses related to a risk-sharing agreement that was entered into during the first quarter of 2019 for one time charter-in contract, which ended in the first quarter of 2021.
20
| Tanker Segment | |||||||||||||||||||||||
| Three Months Ended March 31, 2020 | |||||||||||||||||||||||
Revenues (1)(5) | Voyage Expenses (2)(5) | Adjustments (3) | TCE Revenues | Revenue Days | Average TCE per Revenue Day (3) | ||||||||||||||||||
| (in thousands) | (in thousands) | (in thousands) | (in thousands) | ||||||||||||||||||||
| Voyage-charter contracts - Suezmax | $ | 157,720 | $ | (56,350) | $ | 238 | $ | 101,608 | 2,071 | $ | 49,067 | ||||||||||||
Voyage-charter contracts - Aframax (4)(5) | $ | 98,540 | $ | (38,980) | $ | (215) | $ | 59,345 | 1,723 | $ | 34,438 | ||||||||||||
Voyage-charter contracts - LR2 (4)(5) | $ | 55,924 | $ | (23,040) | $ | (2) | $ | 32,882 | 953 | $ | 34,494 | ||||||||||||
| Time-charter out contracts - Suezmax | $ | 15,567 | $ | (271) | $ | 3 | $ | 15,299 | 453 | $ | 33,752 | ||||||||||||
| Total | $ | 327,751 | $ | (118,641) | $ | 24 | $ | 209,134 | 5,200 | $ | 40,214 | ||||||||||||
(1)Excludes $1.8 million of revenue earned from our responsibilities in employing the vessels subject to the RSAs, $1.3 million of revenues related to the US portion of our STS support services operations, a $1.1 million reduction of taxes recoverable from one of our customers, and $0.5 million of bunker commissions earned.
(2)Includes $3.2 million of operating expenses related to providing lightering support services to our FSL operations.
(3)Adjustments primarily include off-hire bunker expenses, which are excluded from Average TCE per revenue day.
(4)Includes $36.7 million of revenues and $16.9 million of voyage expenses related to our FSL operations, which includes $3.2 million of operating expenses referenced in note (2) above related to FSL operations.
(5)Excludes $5.3 million of revenues and $3.8 million of voyage expenses related to risk-sharing agreements that were entered into during the first quarter of 2019 for two time charter-in contracts, one of which ended in the first quarter of 2020.
Net Revenues. Net revenues were $73.7 million for the three months ended March 31, 2021, compared to $216.4 million for the same period in the prior year.
The decrease for the three months ended March 31, 2021 compared to the same period in the prior year was primarily the result of:
•a decrease of $95.6 million for the three months ended March 31, 2021 due to lower overall average realized spot rates earned by our Suezmax tankers, Aframax tankers and LR2 product tankers;
•a net decrease of $16.7 million for the three months ended March 31, 2021 primarily due to various vessels on time-charter out contracts earning lower rates compared to the spot rates for the three months ended March 31, 2020;
•a decrease of $12.7 million for the three months ended March 31, 2021 primarily due to the sale of three Suezmax tankers during the first quarter of 2020 and the sale of two Aframax tankers during the first quarter of 2021, as well as the redeliveries of three Aframax and two LR2 in-chartered tankers to their owners during the first quarter of 2020, the fourth quarter of 2020 and the first quarter of 2021;
•a decrease of $12.2 million for the three months ended March 31, 2021 due to lower net results from our FSL dedicated tankers resulting from lower overall average realized spot rates and FSL spot rates compared to the same period in the prior year;
•a decrease of $2.4 million for the three months ended March 31, 2021 due to more off-hire days primarily related to vessel repairs compared to the same period in the prior year;
•a decrease of $2.1 million for the three months ended March 31, 2021 due to one fewer calendar day compared to the same period in the prior year; and
•a decrease of $1.0 million for the three months ended March 31, 2021 due to lower revenue earned from our responsibilities in employing the vessels subject to the RSAs compared to the same period in the prior year.
Vessel Operating Expenses. Vessel operating expenses were $43.0 million for the three months ended March 31, 2021, compared to $45.8 million for the same period in the prior year. The decrease was due to a reduction of $1.9 million primarily due to the sale of five tankers during the first quarters of 2020 and 2021, a decrease of $1.1 million due to the timing of repair and planned maintenance activities as well as lower expenditures for insurance and port expenses, partially offset by a net increase of $0.5 million primarily due to crewing-related costs that have been impacted by disruptions resulting from the COVID-19 global pandemic.
Time-charter Hire Expenses. Time-charter hire expenses were $3.6 million for the three months ended March 31, 2021, compared to $9.9 million for the same period in the prior year. The decrease was primarily due to a reduction of $5.5 million related to the redeliveries of five chartered-in vessels during 2020 and early 2021 and a decrease of $0.8 million due to the impairments of two operating lease right-of-use assets related to chartered-in vessels during the second half of 2020.
21
Depreciation and Amortization. Depreciation and amortization expense was $26.7 million for the three months ended March 31, 2021, compared to $29.3 million for the same period in the prior year. The decrease was primarily due to a reduction of $1.2 million due to the sale of two tankers in the first quarter of 2021 and a decrease of $1.2 million due to the impairments of seven of our Aframax tankers during 2020.
Write-Down and Loss on Sale of Assets. The write-down and loss on sale of assets of $0.7 million for the three months ended March 31, 2021 was due to the impairment recorded on one of our operating lease right-of-use assets resulting from a decline in short-term time charter rates. The write-down and loss on sale of assets of $3.1 million for the three months ended March 31, 2020 was due to the sale of three Suezmax tankers in the first quarter of 2020, which resulted in an aggregate net loss of $2.6 million and the write-down of one Suezmax tanker by $0.5 million to its estimated sales price.
Equity (Loss) Income. Equity loss was $0.4 million for the three months ended March 31, 2021 compared to a gain of $1.9 million for the same period in the prior year. The decrease for the three months ended March 31, 2021 was primarily due to lower spot rates realized by our 50% ownership interest in a VLCC, which has been trading in a third-party managed VLCC pooling arrangement.
Ship-to-ship Transfer Segment
Our STS transfer segment consisted of our non-US lightering support services, as well as our LNG terminal management, consultancy, procurement and other related services, which was sold on April 30, 2020.
The following table presents the operating results for our STS transfer segment for the three months ended March 31, 2021 and 2020.
| Three Months Ended March 31, | ||||||||||||||||||||
| (in thousands of U.S. Dollars, except percentage changes) | 2021 | 2020 | % Change | |||||||||||||||||
| Revenues | — | 6,228 | (100.0)% | |||||||||||||||||
| Vessel operating expenses | — | (4,862) | (100.0)% | |||||||||||||||||
| Depreciation and amortization | — | (372) | (100.0)% | |||||||||||||||||
General and administrative expenses (1) | — | (480) | (100.0)% | |||||||||||||||||
| Income from operations | — | 514 | (100.0)% | |||||||||||||||||
(1)Includes direct general and administrative expenses and indirect general and administrative expenses (allocated to each segment based on estimated use of corporate resources). See the discussion under “Other Operating Results” below.
Revenues, Vessel Operating Expenses, Depreciation and Amortization. Revenues, vessel operating expenses, and depreciation and amortization were nil for the three months ended March 31, 2021 due to the sale of the non-US portion of our ship-to-ship support services business as well as our LNG terminal management business during the second quarter of 2020.
Other Operating Results
The following table compares our other operating results for the three months ended March 31, 2021 and 2020:
| Three Months Ended | ||||||||||||||
| (in thousands of U.S. Dollars) | March 31, 2021 | March 31, 2020 | ||||||||||||
| General and administrative expenses | (11,470) | (9,286) | ||||||||||||
| Interest expense | (10,068) | (15,135) | ||||||||||||
| Interest income | 30 | 256 | ||||||||||||
| Realized and unrealized gain (loss) on derivative instruments | 703 | (827) | ||||||||||||
| Income tax expense | (571) | (664) | ||||||||||||
| Other income | 743 | 1,143 | ||||||||||||
General and Administrative Expenses. General and administrative expenses were $11.5 million for the three months ended March 31, 2021, compared to $9.3 million for the same period in the prior year. The increase was primarily due to higher general corporate expenditures and the timing of equity-based compensation.
Interest Expense. Interest expense was $10.1 million for the three months ended March 31, 2021, compared to $15.1 million for the same period in the prior year. The decrease was primarily due to significant prepayments of loan principal during 2020, the debt refinancings completed during 2020 (see "Liquidity and Capital Resources" below), overall lower average LIBOR rates, as well as lower interest associated with our finance lease obligations resulting from the repurchase of two Aframax tankers, previously under sale-leaseback arrangements, during the fourth quarter of 2020.
22
Realized and Unrealized Gain (Loss) on Derivative Instruments. Realized and unrealized gain on derivative instruments was $0.7 million for the three months ended March 31, 2021, compared to a loss of $0.8 million for the same period in the prior year.
In January 2020, we extinguished all of our then existing interest rate swaps and in March 2020, we entered into a new interest rate swap with a notional amount of $50.0 million and a fixed rate of approximately 0.8%, which is scheduled to mature in December 2024. We incurred a realized loss of $0.1 million during the three months ended March 31, 2021, compared to a realized gain of $0.5 million for the same period in the prior year, primarily due to lower average LIBOR rates.
Primarily as a result of changes in the long-term forward LIBOR rates, we recognized an unrealized gain of $0.8 million in the three months ended March 31, 2021, compared to an unrealized loss of $1.2 million for the same period in the prior year under the interest rate swap agreements.
Liquidity and Capital Resources
Liquidity and Cash Needs
As at March 31, 2021, we had a working capital deficit of $89.7 million, compared to a working capital surplus of $48.3 million as at December 31, 2020. The change in working capital balance was primarily due to an increase in current liabilities resulting from the repurchase options declared in March 2021 for six vessels under existing finance leases, which are expected to be completed in September 2021, as described in "Item 1 - Financial Statements: Note 7 - Operating Leases and Obligations Related to Finance Leases". We expect the working capital deficit will be addressed through cash generated from operations and expected proceeds from anticipated refinancings of vessels to be repurchased, as described below.
Our primary sources of liquidity are cash and cash equivalents, cash flows provided by our operations, our undrawn credit facilities, and capital raised through financing transactions. As at March 31, 2021, our total consolidated cash and cash equivalents was $87.6 million, compared to $97.2 million as at December 31, 2020. Our cash balance decreased primarily as a result of net cash used for operating activities and prepayments of our revolving credit facility, partially offset by net proceeds received from the sale of two Aframax tankers. Our total consolidated liquidity, including cash, cash equivalents and undrawn credit facilities, was $371.7 million as at March 31, 2021, compared to $372.6 million as at December 31, 2020. We anticipate that our primary sources of funds for our short-term liquidity needs will be cash flows from operations, existing cash and cash equivalents, undrawn short-term and long-term borrowings and expected proceeds from refinancing the eight vessel repurchases described below, which we believe will be sufficient to meet our existing liquidity needs for at least the next 12 months.
In January 2020, we entered into a $532.8 million long-term revolving credit facility, which is scheduled to mature in December 2024, and which had an outstanding balance of $170.0 million as at March 31, 2021. We used proceeds from this revolving credit facility to repay a portion of the $455.3 million then outstanding under our prior two revolving facilities, which were scheduled to mature in 2021 and 2022, and two term loan facilities, which were scheduled to mature in 2020 and 2021.
In August 2020, we entered into a $67.4 million term loan facility, which is scheduled to mature in August 2023, and which had an outstanding balance of $61.8 million as at March 31, 2021. We used proceeds from this term loan facility to repay a portion of the $85.1 million then outstanding under a prior term loan facility, which was scheduled to mature in 2021.
Our short-term liquidity requirements include the payment of operating expenses, dry-docking and capital expenditures, debt servicing costs, scheduled repayments of long-term debt, scheduled repayments of our obligations related to finance leases, as well as funding our other working capital requirements. Included among our current financing lease obligations are the purchase price obligations for eight vessel repurchase options we declared under existing finance leases, which purchases were completed for two vessels in May 2021 using available cash and undrawn credit facility, with the purchases of the remaining six vessels expected to be completed in September 2021, as described in "Item 1 - Financial Statements: Note 7 - Operating Leases and Obligations Related to Finance Leases". We expect to refinance the vessels purchased, as well as the remaining repurchase obligations, with future debt facilities or finance leases together with existing cash and undrawn credit facilities. Our short-term charters and spot market tanker operations contribute to the volatility of our net operating cash flow, and thus may impact our ability to generate sufficient cash flows to meet our short-term liquidity needs. Historically, the tanker industry has been cyclical, experiencing volatility in profitability and asset values resulting from changes in the supply of, and demand for, vessel capacity. In addition, tanker spot markets historically have exhibited seasonal variations in charter rates. Tanker spot markets are typically stronger in the winter months as a result of increased oil consumption in the northern hemisphere and unpredictable weather patterns that tend to disrupt vessel scheduling. However, there may be years where other factors override typical seasonality. This was the case in the first quarter of 2021 when lower oil demand as a result of the COVID-19 pandemic, a constrained oil supply resulting from production cuts, and the return of ships from floating storage contributed to weak tanker rates.
Our long-term capital needs primarily include capital expenditures and repayment of our loan facilities and obligations related to finance leases. Generally, we expect that our primary long-term sources of funds will be cash from operations, cash balances, long-term bank borrowings and other debt, lease or equity financings. We expect that we will rely upon external financing sources, including bank borrowings, lease financings and the issuance of debt and equity securities, to fund acquisitions and capital expenditures, including opportunities we may pursue to purchase additional vessels.
Our operating lease commitments and obligations related to finance leases are described in "Item 1 - Financial Statements: Note 7 - Operating Leases and Obligations Related to Finance Leases", our revolving credit facility and term loan are described in "Item 1 - Financial
23
Statements: Note 6 - Long-term Debt" and our working capital loan is described in "Item 1 - Financial Statements: Note 5 - Short-term Debt" of this report. Our working capital loan requires us to maintain a minimum threshold of paid-in capital contribution and retained distributions of participants in the RSAs. Our revolving credit facility and term loan contain covenants and other restrictions that we believe are typical of debt financing collateralized by vessels, including those that restrict the relevant subsidiaries from: incurring or guaranteeing additional indebtedness; making certain negative pledges or granting certain liens; and selling, transferring, assigning or conveying assets. In the future, some of the covenants and restrictions in our financing agreements could restrict the use of cash generated by ship-owning subsidiaries in a manner that could adversely affect our ability to pay future dividends on our common stock. However, we currently do not expect that these covenants will have such an effect. Our revolving credit facility, term loan and obligations related to finance leases require us to maintain financial covenants, which are described in further detail in Notes 6 and 7 of our unaudited interim consolidated financial statements. If we do not meet these financial covenants, the lender may declare our obligations under the agreements immediately due and payable and terminate any further loan commitments, which would significantly affect our short-term liquidity requirements. As at March 31, 2021, we were in compliance with all covenants under our revolving credit facility, term loan, working capital loan and obligations related to finance leases.
Cash Flows
The following table summarizes our sources and uses of cash for the periods presented:
| Three Months Ended March 31, | ||||||||||||||
| 2021 | 2020 | |||||||||||||
| (in thousands of U.S. Dollars) | $ | $ | ||||||||||||
| Net cash flow (used for) provided by operating activities | (27,445) | 138,685 | ||||||||||||
| Net cash flow used for financing activities | (13,932) | (85,113) | ||||||||||||
| Net cash flow provided by investing activities | 31,774 | 62,073 | ||||||||||||
Operating Cash Flows
Net cash flow (used for) provided by operating activities primarily reflects fluctuations as a result of changes in realized TCE rates, changes in interest rates, fluctuations in working capital balances, the timing and the amount of dry-docking expenditures, repairs and maintenance activities, the average number of vessels in service and vessel dispositions. Our exposure to the spot tanker market has contributed significantly to fluctuations in operating cash flows historically as a result of highly cyclical spot tanker rates.
Net cash flow provided by operating activities decreased by $166.1 million for the three months ended March 31, 2021 compared to the same period in 2020. This decrease was primarily due to:
•a decrease of $135.5 million in cash inflows primarily due to lower operating earnings resulting from lower average realized spot tanker rates, various vessels on time-charter out contracts earning lower rates than spot rates realized during the first quarter of 2020, the redeliveries of five chartered-in vessels during 2020 and early 2021, the sale of five vessels during the first quarters of 2020 and 2021 and the sale of our non-US portion of our ship-to-ship support services business as well as our LNG terminal management business in April 2020; and
•a decrease of $30.6 million due to an increase in cash outflows related to changes in net working capital and expenditures for dry-docking activities during the three months ended March 31, 2021.
Financing Cash Flows
Net cash flow used for financing activities decreased by $71.2 million for the three months ended March 31, 2021 compared to the same period in 2020. The decrease was primarily due to:
•a decrease of $66.2 million in cash outflows due to a net decrease in repayments and prepayments on our revolving credit facility and term loans during the three months ended March 31, 2021; and
•a decrease of $5.0 million in cash outflows due to a decrease in net repayments on our working capital facility during the three months ended March 31, 2021.
Investing Cash Flows
Net cash flow provided by investing activities decreased by $30.3 million for the three months ended March 31, 2021 compared to the same period in 2020. The decrease was primarily due to:
•a decrease of $28.3 million in cash inflows resulting from the proceeds received from the sale of the two Aframax tankers during the three months ended March 31, 2021 compared to proceeds received from the sale of the three Suezmax tankers during the three months ended March 31, 2020; and
•a decrease of $2.0 million in cash inflows due to loan repayments from our joint venture during the three months ended March 31, 2020.
24
Contractual Obligations and Contingencies
The following table summarizes our long-term contractual obligations as at March 31, 2021:
| Beyond | |||||||||||||||||||||||||||||||||||||||||
| (in millions of U.S. Dollars) | Total | Remainder of 2021 | 2022 | 2023 | 2024 | 2025 | 2025 | ||||||||||||||||||||||||||||||||||
| U.S. Dollar-Denominated Obligations | |||||||||||||||||||||||||||||||||||||||||
Scheduled repayments of revolving facility, term loan and other debt (1) | 69.9 | 28.4 | 11.2 | 8.5 | 21.8 | — | — | ||||||||||||||||||||||||||||||||||
Repayments at maturity of revolving facility, term loan and other debt (1) | 181.9 | — | — | 33.7 | 148.2 | — | — | ||||||||||||||||||||||||||||||||||
Scheduled repayments of obligations related to finance leases (1) (2) | 354.0 | 195.2 | 12.3 | 13.1 | 13.9 | 14.8 | 104.7 | ||||||||||||||||||||||||||||||||||
Chartered-in vessels (operating leases) (3)(4) | 54.3 | 5.6 | 3.3 | 6.8 | 6.8 | 6.8 | 25.0 | ||||||||||||||||||||||||||||||||||
| Total | 660.1 | 229.2 | 26.8 | 62.1 | 190.7 | 21.6 | 129.7 | ||||||||||||||||||||||||||||||||||
(1)Our interest-bearing obligations include commercial bank debt and obligations related to finance leases. Please read "Item 1 - Financial Statements: Note 5 - Short-term Debt", "Item 1 - Financial Statements: Note 6 - Long-term Debt" and "Item 1 - Financial Statements: Note 7 - Operating Leases and Obligations Related to Finance Leases", for the terms upon which future interest payments are determined.
(2)Gives effect to the purchase options declared in November 2020 and March 2021, to acquire two Suezmax tankers in May 2021 and six Aframax tankers in September 2021, respectively, under the sale-leaseback arrangements described in "Item 1 - Financial Statements: Note 7 - Operating Leases and Obligations Related to Finance Leases", excludes imputed interest payments of $15.7 million (remainder of 2021), $9.6 million (2022), $8.8 million (2023), $8.0 million (2024), $7.0 million (2025) and $17.1 million (thereafter).
(3)Includes one Aframax tanker expected to be delivered to us in late-2022 to commence a seven-year time charter-in contract.
(4)Excludes payments required if we exercise options to extend the terms of in-chartered leases signed as of March 31, 2021. If we exercise all options to extend the terms of signed in-chartered leases, we would expect total payments of $8.8 million (remainder of 2021), $8.6 million (2022), $8.4 million (2023), $6.8 million (2024), $6.8 million (2025) and $47.9 million (thereafter).
Off-Balance Sheet Arrangements
We have no off-balance sheet arrangements that have, or are reasonably likely to have, a current or future material effect on our financial condition, results of operations, liquidity, capital expenditures or capital resources.
Critical Accounting Estimates
We prepare our consolidated financial statements in accordance with GAAP, which require us to make estimates in the application of our accounting policies based on our best assumptions, judgments and opinions. On a regular basis, management reviews the accounting policies, assumptions, estimates and judgments to ensure that our consolidated financial statements are presented fairly and in accordance with GAAP. However, because future events and their effects cannot be determined with certainty, actual results could differ from our assumptions and estimates, and such differences could be material. Accounting estimates and assumptions that we consider to be the most critical to an understanding of our financial statements because they inherently involve significant judgments and uncertainties are discussed in "Item 5 – Operating and Financial Review and Prospects" in our Annual Report on Form 20-F for the year ended December 31, 2020. The following contains those sections of our critical accounting estimates that have been updated for significant developments up to March 31, 2021:
Vessel Lives and Impairment
The following contains an update from our Annual Report on Form 20-F for the year ended December 31, 2020 for significant developments up to March 31, 2021 to our critical accounting estimates with respect to Vessel Lives and Impairment for vessels where undiscounted cash flows are marginally greater than the carrying values. The table below presents the aggregate market values and carrying values of our vessels that we have determined have a market value that is less than their carrying value and which have estimated future undiscounted cash flows that are only marginally greater than their respective carrying values as of March 31, 2021. While the market values of these vessels are below their carrying values, no impairment has been recognized on any of these vessels in the three months ended March 31, 2021 as the estimated future undiscounted cash flows relating to such vessels are greater than their carrying values and GAAP does not allow an impairment to be recognized under this circumstance. We consider the vessels reflected in the following table to be at a higher risk of future impairment as compared to other vessels in our fleet:
25
Aframax, Suezmax and Product Tankers (in thousands of U.S. dollars, except number of vessels) | # Vessels | Market Values (1) | Carrying Values | ||||||||||||||
| Tankers | 17 | 357,500 | 547,520 | ||||||||||||||
(1)Market values are determined using reference to second-hand market comparables. Since vessel values can be volatile, our estimates of market value shown above may not be indicative of either the current or future prices we could obtain if we sold any of the vessels.
Our estimates of future undiscounted cash flows used to determine whether a vessel's carrying value is recoverable involve assumptions about future charter rates, vessel utilization, operating expenses, dry-docking expenditures, vessel residual values, the probability of the vessel being sold and the remaining estimated life of our vessels. Our estimated charter rates are based on rates under existing vessel contracts and market rates at which we expect we can re-charter our vessels. Such market rates for the first three years are based on prevailing market 3-year time-charter rates and thereafter, a 10-year historical average of actual spot charter rates earned by our vessels, adjusted to exclude years which management has determined as outliers. We consider as outliers those years that have been impacted by rare events or circumstances that have distorted the historical 10-year trailing average to such a degree that this average is not representative of what a reasonable outlook would be if we don’t exclude such years. We have identified such events in the current 10-year historical period as at March 31, 2021, which has resulted in the exclusion of the three years from 2011 to 2013 from our averages. Our estimated charter rates are discounted for the years when the vessel age is 15 years and older, as compared to the estimated charter rates for years when the vessel is younger than 15 years. Such discounts reflect expectations of lower utilization and higher fuel consumption for older vessels.
Our estimates of vessel utilization, including estimated off-hire time, are based on historical experience. Our estimates of operating expenses and dry-docking expenditures are based on historical operating and dry-docking costs and our expectations of future inflation and operating requirements. Vessel residual values are a product of a vessel’s lightweight tonnage and an estimated scrap rate per tonne. The probability of the vessel being sold is based on our current plans and expectations. The remaining estimated lives of our vessels used in our estimates of future cash flows are consistent with those used in the calculations of depreciation.
In our experience, certain assumptions relating to our estimates of future cash flows are more predictable by their nature, including estimated revenue under existing contract terms, on-going operating costs and remaining vessel life. Certain assumptions relating to our estimates of future cash flows require more judgment and are inherently less predictable, such as future charter rates beyond the firm period of existing contracts, the probability and timing of vessels being sold and vessel residual values, due to their volatility. We believe that the assumptions used to estimate future cash flows of our vessels are reasonable at the time they are made. We can make no assurances, however, as to whether our estimates of future cash flows, particularly future vessel charter rates or vessel values, will be accurate.
Our estimates of future cash flows are more sensitive to changes in certain assumptions, such as future charter rates. For example, for those 17 vessels in the table above where the undiscounted cash flows are marginally greater than the carrying values, if at March 31, 2021, the 10-year historical average of actual spot charter rates earned by our vessels, adjusted to exclude years which management has determined as outliers, was reduced by either 5% or 10%, 11 or 15, respectively, of the 17 vessels would have been impaired, resulting in an additional impairment of $126.6 million or $176.6 million, respectively. For additional information about our impairment policies, please read "Item 5 – Operating and Financial Review and Prospects - Critical Accounting Estimates - Vessel Lives and Impairment" in our Annual Report on Form 20-F for the year ended December 31, 2020.
26
FORWARD-LOOKING STATEMENTS
This Report on Form 6-K for the three months ended March 31, 2021 contains certain forward-looking statements (as such term is defined in Section 27A of the Securities Act of 1933, as amended, and Section 21E of the Securities Exchange Act of 1934, as amended) concerning future events and our operations, performance and financial condition, including, in particular, statements regarding:
•crude oil and refined product tanker market fundamentals, including the balance of supply and demand in the oil and tanker markets and the volatility of such markets;
•forecasts of worldwide tanker fleet growth or contraction and newbuilding tanker deliveries and vessel scrapping;
•estimated changes in global oil demand and supply;
•future tanker rates, OPEC+ oil production or oil supply cuts and floating storage demand;
•timing of and our expectations regarding delivery of newbuildings and vessel acquisitions;
•our expectations regarding the effects of the COVID-19 pandemic on our industry and business, including our liquidity and the potential effect on typical seasonal variations in tanker rates;
•our liquidity needs for the upcoming 12 months, including anticipated funds and sources of financing for liquidity and capital expenditure needs, including the cost of repurchasing vessels under our finance leases, and the sufficiency of cash flows;
•our expectations regarding the covenants in our financing agreements, including the potential effects of financial covenants or restrictions;
•our expectations regarding, and our accounting estimates and the level of expected changes in our provisions for uncertain tax positions relating to freight taxes in the next 12 months; and
•expected interest payments on our contractual obligations and the impact on our payment obligations if we exercise options to extend in-chartered leases.
Forward-looking statements include, without limitation, any statement that may predict, forecast, indicate or imply future results, performance or achievements, and may contain the words “believe”, “anticipate”, “expect”, “estimate”, “project”, “will be”, “will continue”, “will likely result”, or words or phrases of similar meanings. These statements involve known and unknown risks and are based upon a number of assumptions and estimates that are inherently subject to significant uncertainties and contingencies, many of which are beyond our control. Actual results may differ materially from those expressed or implied by such forward-looking statements, which involve risks and uncertainties. Important factors that could cause actual results to differ materially include, but are not limited to: spot tanker market rate fluctuations; changes in vessel values; changes in price, the production of or demand for oil or refined products; changes in trading patterns significantly affecting overall vessel tonnage requirements; greater or lower than expected levels of tanker scrapping; OPEC+ production and supply levels; the duration and extent of the coronavirus outbreak, and any resulting effects on the markets in which we operate; the impact of the coronavirus outbreak on our ability to maintain safe and efficient operations; changes in applicable industry laws and regulations and the timing of implementation of new laws and regulations; the potential for early termination of charter contracts and our potential inability to renew or replace charter contracts; competitive factors in the markets in which we operate; loss of any customer, time-charter or vessel; our potential inability to meet our liquidity needs, including our ability to refinance our two repurchased vessels and our anticipated repurchase of six vessels; our future capital expenditure requirements; changes in interest rates and the capital markets; changes in our costs, such as the cost of crews, dry-docking expenses and associated off-hire days; dry-docking delays; geopolitical tensions; our exposure to foreign currency exchange rate fluctuations; and other factors detailed from time to time in our periodic reports filed with the SEC, including our Annual Report on Form 20-F for the year ended December 31, 2020. We do not intend to release publicly any updates or revisions to any forward-looking statements contained herein to reflect any change in our expectations with respect thereto or any change in events, conditions or circumstances on which any such statement is based.
27
TEEKAY TANKERS LTD. AND SUBSIDIARIES
March 31, 2021
PART II – OTHER INFORMATION
Item 1 – Legal Proceedings
None.
Item 1A – Risk Factors
In addition to the other information set forth in this Report on Form 6-K, you should carefully consider the risk factors discussed in Part I, “Item 3 - Key Information - Risk Factors” in our Annual Report on Form 20-F for the year ended December 31, 2020, which could materially affect our business, financial condition or results of operations and the price and value of our securities.
Item 2 – Unregistered Sales of Equity Securities and Use of Proceeds
None.
Item 3 – Defaults Upon Senior Securities
None.
Item 4 – Mine Safety Disclosures
N/A.
Item 5 – Other Information
N/A.
Item 6 – Exhibits
N/A.
THIS REPORT ON FORM 6-K IS HEREBY INCORPORATED BY REFERENCE INTO THE FOLLOWING REGISTRATION STATEMENTS OF THE COMPANY.
REGISTRATION STATEMENT ON FORM S-8 (FILE NO. 333-148055) FILED WITH THE SEC ON DECEMBER 13, 2007.
REGISTRATION STATEMENT ON FORM S-8 (FILE NO. 333-194404) FILED WITH THE SEC ON MARCH 7, 2014.
REGISTRATION STATEMENT ON FORM S-8 (FILE NO. 333-223824) FILED WITH THE SEC ON MARCH 21, 2018.
28
SIGNATURE
Pursuant to the requirements of the Securities Exchange Act of 1934, the registrant has duly caused this report to be signed on its behalf by the undersigned, thereunto duly authorized.
| TEEKAY TANKERS LTD. | |||||||||||||||||
| Date: | May 21, 2021 | By: | /s/ Stewart Andrade | ||||||||||||||
Stewart Andrade Chief Financial Officer (Principal Financial and Accounting Officer) | |||||||||||||||||
29
Serious News for Serious Traders! Try StreetInsider.com Premium Free!
You May Also Be Interested In
- NV Gold Announces Secured Loan Terms
- Ridgeline Minerals Announces Upsized Non-Brokered Private Placement to $2.2M
- TabaPay to Acquire the Assets of Synapse Financial Technologies, Inc.
Create E-mail Alert Related Categories
SEC FilingsSign up for StreetInsider Free!
Receive full access to all new and archived articles, unlimited portfolio tracking, e-mail alerts, custom newswires and RSS feeds - and more!
