

Form 6-K Sanofi For: May 16
 Tweet
Tweet Share
ShareUNITED STATES
SECURITIES AND EXCHANGE COMMISSION
Washington, D.C. 20549
FORM 6-K
REPORT OF FOREIGN PRIVATE ISSUER
PURSUANT TO RULE 13a-16 OR 15d-16
UNDER THE SECURITIES EXCHANGE ACT OF 1934
For the month of May 2022
Commission File Number: 001-31368
SANOFI
(Translation of registrant’s name into English)
54, rue La Boétie, 75008 Paris, FRANCE
(Address of principal executive offices)
Indicate by check mark whether the registrant files or will file annual reports under cover Form 20-F or Form 40-F.
Form 20-F ☒ Form 40-F ☐
Indicate by check mark if the registrant is submitting the Form 6-K in paper as permitted by Regulation S-T Rule 101(b)(1): ________
Indicate by check mark if the registrant is submitting the Form 6-K in paper as permitted by Regulation S-T Rule 101(b)(7): ________
In May 2022, Sanofi issued the document attached hereto as Exhibit 99.1 which is incorporated herein by reference.
Exhibit List
| Exhibit No. |
Description |
|||
| Exhibit 99.1 | Information on Q1 2022 financial results | |||
SIGNATURES
Pursuant to the requirements of the Securities Exchange Act of 1934, the registrant has duly caused this report to be signed on its behalf by the undersigned, thereunto duly authorized.
| Dated: May 16, 2022 | SANOFI | |||||
| By | /s/ Alexandra Roger | |||||
| Name: Alexandra Roger | ||||||
| Title: Head of Securities Law and Capital Markets | ||||||
Exhibit 99.1

| Q1 2022 | Change | |||||||||||
| IFRS net sales reported |
€9,674m | +12.6% | ||||||||||
| IFRS net income reported |
€2,009m | +28.3% | ||||||||||
| IFRS EPS reported |
€1.61 | +28.8% | ||||||||||
| Business operating income |
€3,065m | +16.2% | ||||||||||
Changes in net sales are expressed at constant exchange rates (CER) unless otherwise indicated (definition in Appendix 7)
Q1 2022 sales growth driven by Dupixent® and CHC
| ● | Specialty Care grew driven by Dupixent® |
| ● | Vaccines were up reflecting strong PPH franchise as well as gradual recovery of Travel vaccines |
| ● | General Medicines core assets up, driven by Rezurock® and overall GBU sales broadly stable |
| ● | CHC continued strong growth momentum driven by Cough & Cold and Pain care categories |
Q1 2022 business EPS(1) up 16.1% at CER driven by higher sales and improving margins
| ● | IFRS EPS of €1.61 (up 28.8%) |
| ● | Business operating income (BOI) margin up reflecting improvement in gross margin while investing in R&D |
| ● | Business EPS(1) up, also benefitting from an improved effective tax rate |
Key milestone and regulatory achievements on R&D transformation
| ● | Efanesoctocog alfa met phase 3 primary endpoint in hemophilia A and demonstrated superiority to prior factor prophylaxis |
| ● | Dupixent® approved in EU for severe asthma in children aged 6 to 11 years; Priority Review obtained in atopic dermatitis for children (6 months to 5 years) and eosinophilic esophagitis patients 12 years and older in the U.S. |
| ● | Nirsevimab EMA regulatory submission accepted under accelerated assessment for RSV protection in all infants |
| ● | FDA approved Enjaymo™, first treatment for use in patients with cold agglutinin disease (CAD) |
| ● | Xenpozyme® approved in Japan, first and only approved therapy indicated to treat acid sphingomyelinase deficiency (ASMD) |
| ● | Sanofi and GSK applied for conditional regulatory authorization for their first-generation COVID-19 vaccine in Europe with data supporting its use as a universal booster, designed to boost all currently approved COVID-19 vaccine platforms |
(1) In order to facilitate an understanding of operational performance, Sanofi comments on the business net income statement. Business net income is a non-GAAP financial measure (definition in Appendix 7). The consolidated income statement for Q1 2022 is provided in Appendix 3 and a reconciliation of reported IFRS net income to business net income is set forth in Appendix 4; (2) 2021 business EPS was €6.56.
2022 first-quarter Sanofi sales
-----------------------------------
Unless otherwise indicated, all percentage changes in sales in this document are stated at CER1
-----------------------------------
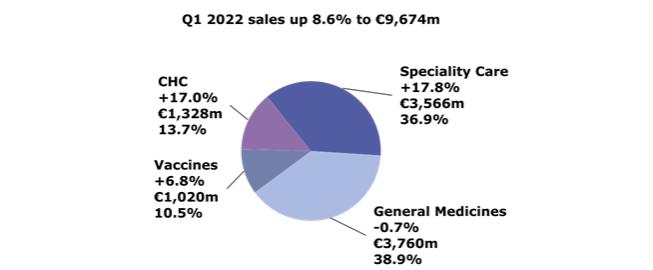
In the first quarter of 2022, Sanofi sales were €9,674 million, up 12.6% on a reported basis. Exchange rate movements had a positive effect of 4.0 percentage points, mainly due to the U.S. dollar.
Global Business Units
First-quarter 2022 net sales by Global Business Unit (variation at CER; € million; % of total sales)
| 1 | See Appendix 7 for definitions of financial indicators. |
1
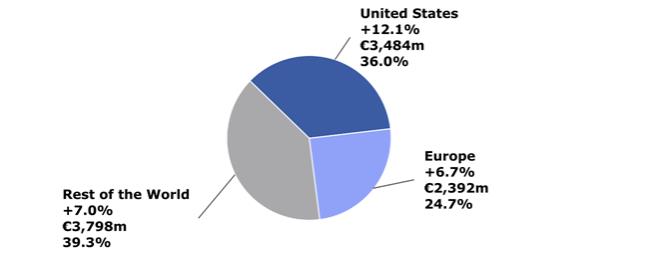
First-quarter 2022 net sales by geographic region (variation at CER; € million; % of total sales)
First-quarter 2022 operating income
First-quarter business operating income (BOI) increased.. The ratio of BOI to net sales increased 1.0 percentage point to 31.7%.
Pharmaceuticals
First-quarter 2022 Pharmaceutical sales increased 7.5% to €7,326 million, mainly driven by the Specialty Care portfolio (up 17.8%) with continued strong performance of Dupixent® while sales in General Medicines decreased 0.7%.
Specialty Care
Dupixent
| Net sales (€ million) | Q1 2022 | Change at CER |
||||||||
| Total Dupixent® |
1,614 | +45.7% | ||||||||
In the first quarter, Dupixent® (collaboration with Regeneron) sales increased 45.7% to €1,614 million. In the U.S., Dupixent® sales of €1,176 million (up 38.1%) were driven by continued strong demand in AD in adults, adolescents, and children aged 6 to 11 years, and continued uptake in asthma and chronic rhinosinusitis with nasal polyposis (CRSwNP). Dupixent® total prescriptions (TRx) increased 43% (year-over-year) and new-to-brand prescriptions (NBRx) grew 32%. In Europe, first-quarter Dupixent® sales
2
grew 53.3% to €211 million reflecting continued growth in AD and additional launches in younger population in AD, asthma and CRSwNP.
Neurology and Immunology
| Net sales (€ million) | Q1 2022 |
Change at CER | ||
| Aubagio® |
491 | -6.6% | ||
|
Lemtrada® |
25 | —% | ||
| Kevzara® |
95 | +61.4% | ||
| Total Neurology and Immunology |
611 | +0.3% | ||
In the first quarter, Neurology and Immunology sales grew 0.3% to €611 million, reflecting strong Kevzara® sales which were partially offset by lower Aubagio® sales.
Aubagio® sales decreased 6.6% in the first quarter to €491 million due to lower sales in the U.S. as a result of both competitive pressure and price. Sales in Europe were stable.
First-quarter Kevzara® (collaboration with Regeneron) sales increased 61.4% to €95 million due to a COVID-19 related increase in global demand for IL-6 receptor blockers and the temporary tocilizumab shortage.
Rare Disease
| Net sales (€ million) | Q1 2022 |
Change at CER | ||
| Myozyme® / Lumizyme® |
235 | -3.0% | ||
|
Nexviazyme® |
30 | ns | ||
|
Fabrazyme® |
220 | +2.4% | ||
|
Cerezyme® |
165 | -6.7% | ||
|
Aldurazyme® |
69 | +3.0% | ||
|
Cerdelga® |
67 | +3.2% | ||
| Others Rare Disease |
18 | -14.3% | ||
| Total Rare Disease |
804 | +1.9% | ||
In the first quarter, Rare Disease sales increased 1.9% to €804 million driven by the Pompe franchise, partially offset by unfavorable purchasing patterns in Rest of the World region primarily for the Gaucher and Fabrazyme franchises. Underlying patients base treated grew around 6% compared to the same quarter of last year.
First-quarter sales of the Pompe franchise (Myozyme/Lumizyme® + Nexviazyme®) increased 8.9% to €265 million primarily from new patient accruals and the ramp up of Nexviazyme®. Myozyme®/Lumizyme® sales decreased 3.0% to €235 million mainly reflecting the conversion to Nexviazyme® in the U.S. Sales of Nexviazyme® (which was launched in the US in August 2021 and in Japan in November 2021) were €30 million in the first quarter (of which €26 million in the U.S.).
Sales of the Gaucher franchise (Cerezyme® + Cerdelga®) decreased 4.2% (to €232 million) in the first quarter. Over the period, Cerezyme® sales decreased 6.7% to €165 million, mainly due to unfavorable buying patterns resulting in lower sales in the Rest of the World region. In parallel, Cerdelga® sales were up 3.2% driven by switches and new patient accruals in Europe and the U.S.
First-quarter Fabrazyme® sales increased 2.4% to €220 million driven mainly by Europe and the U.S. In the Rest of the World region, despite unfavorable purchasing patterns, Fabrazyme® sales were stable.
Oncology
3
| Net sales (€ million) | Q1 2022 | Change at CER | ||
| Jevtana® |
98 | -25.4% | ||
|
Sarclisa® |
65 | +85.3% | ||
|
Fasturtec® |
40 | +8.6% | ||
| Libtayo® |
41 | +53.8% | ||
| Total Oncology |
244 | +6.8% | ||
First-quarter 2022 sales of Oncology increased 6.8% (to €244 million) driven by the Sarclisa® launch which more than offset the impact of Jevtana® generic competition in Europe.
First-quarter Jevtana® sales decreased 25.4% to €98 million following the entry of generic competition in some European markets (down 75.6%) at the end of March 2021. In the U.S., sales were up 8.6%, where Jevtana® is currently covered by four Orange Book listed patents US 7,241,907, US 8,927,592, US 10,583,110 and US 10,716,777. Sanofi filed patent infringement suits under Hatch-Waxman against generic filers asserting the ‘110 patent, the ‘777 patent and the ‘592 patent in the US District Court for the District of Delaware. Sanofi has reached settlement agreements with some of the defendants and the suit against the remaining defendants is ongoing. A 3-day trial against Apotex and Sandoz has been scheduled starting January 2023 and the remaining defendants have agreed not to launch any generic cabazitaxel product until the earlier of a district court decision in favor of the defendants or four months after the completion of the post-trial briefing. Jevtana® also received a regulatory data exclusivity related to the CARD clinical study which expires in December 2023.
First-quarter Sarclisa® sales were €65 million (versus €34 million in the first quarter of 2021) primarily driven by performance in the U.S. (€25 million), Europe (€22 million) and Japan.
Rare Blood Disorders
| Net sales (€ million) | Q1 2022 | Change at CER | ||
| Eloctate® |
138 | -3.0% | ||
|
Alprolix® |
108 | +2.0% | ||
| Cablivi® |
46 | +15.8% | ||
| Total Rare Blood Disorders |
293 | +1.8% | ||
In the first quarter, Rare Blood Disorders franchise sales increased 1.8% (€293 million), reflecting Cablivi® and Alprolix® growth partially offset by lower Eloctate®/Alprolix® industrial sales to Sobi (recorded in the Rest of the World region).
Eloctate® sales were €138 million in the first quarter, down 3.0% reflecting lower sales in the U.S. (down 1.9%) and in the Rest of the World region.
First-quarter Alprolix® sales were up 2.0% to €108 million driven by the U.S. sales (up 8.9%), partially offset by lower sales in the Rest of the World region.
Cablivi® sales increased by 15.8% to €46 million in the first quarter driven by launches in Europe (up 46.7% to €23 million). In the U.S., sales of the product were down 4.5% to €22 million, due to the COVID-19 environment impacting treatment initiations at the hospital level.
4
General Medicines
First quarter General Medicines sales decreased 0.7% to €3,760 million and were stable excluding portfolio streamlining.
Core assets
| Net sales (€ million) | Q1 2022 | Change at CER | ||
| Lovenox® |
377 | -8.2% | ||
| Toujeo® |
274 | +6.3% | ||
| Plavix® |
261 | 0.0% | ||
| Multaq® |
87 | +13.9% | ||
|
Thymoglobulin® |
97 | +13.8% | ||
| Mozobil® |
58 | +5.8% | ||
|
Praluent® |
69 | +21.4% | ||
| Soliqua® |
53 | +15.9% | ||
|
Rezurock® |
41 | na | ||
| Others |
277 | +1.9% | ||
| Total core assets |
1,594 | +4.7% | ||
In the first quarter, core assets sales increased 4.7% to €1,594 million, driven by Toujeo®, Praluent®, Multaq®, Thymoglobulin® and Rezurock® (consolidated from November 9, 2021), partially offset by lower sales of Lovenox®. Core assets sales grew across all geographies in the first quarter.
First-quarter Lovenox® sales decreased 8.2% to €377 million, mainly reflecting lower sales in the Rest of the World region (down 11.9%) due to high base of comparison in the first quarter of 2021 which benefitted from strong Covid-related demand (WHO guidelines recommending the use of low molecular weight heparins in hospitalized COVID-19 patients). In addition, biosimilar competition and supply limitations affected the performance.
First-quarter Toujeo® sales increased 6.3% to €274 million due to growth in Europe and the Rest of the World region, partially offset by lower sales in the U.S.
In China, the Volume Based Procurement (VBP) for insulins is expected to be implemented in May 2022. In November 2021, Sanofi participated in the VBP tender for basal insulin analogues and was among the bidding winners in the group A with Lantus®/Toujeo®. Sanofi expects its glargine (Toujeo®/Lantus®) sales to decrease in China in 2022, due to high volumes at significantly lower prices. In China, Toujeo®/Lantus® sales were €459 million in 2021.
Plavix® sales were stable in the first quarter to €261 million, higher sales in the Rest of the World region (up 1.4%) offsetting lower sales in Europe. Plavix® sales in China were down 3.4% to €123 million due to a high base of comparison in the first quarter of 2021.
Multaq® first quarter sales grew 13.9% to €87 million, reflecting strong U.S. sales growth.
Sales of Rezurock®, a recently FDA-approved, first-in-class treatment for chronic graft-versus-host disease (cGVHD) for adult and pediatric patients 12 years and older who have failed at least two prior lines of systemic therapy, were consolidated as of November 9, 2021 (through the Kadmon acquisition) and generated €41 million in the first quarter. Rezurock® performance reflects the rapidly expanding pool of prescribing institutions as well as pent-up demand from cGVHD patients who have already failed multiple systemic therapies.
Praluent® first-quarter sales were €69 million, up 21.4% driven by Europe performance. In Rest of the World region, sales were up 6.7%. In China, Praluent® was included in the NDRL list at the beginning of 2022.
First-quarter Soliqua® sales increased 15.9% to €53 million driven by the Rest of World region (up 54.5%) supported by new launches and Solimix results.
5
Non-core assets
| Net sales (€ million) | Q1 2022 | Change at CER | ||
| Lantus®* |
671 | -1.5% | ||
| Aprovel®/Avapro® |
125 | +17.8% | ||
| Other non-core assets |
1,187 | -7.4% | ||
| Total non-core assets |
1,983 | -4.2% | ||
In the first quarter, non-core assets sales decreased 4.2% to €1,983 million reflecting portfolio streamlining (-1.4ppt), lower Lantus® sales as well as the impact of VBP wave 5 in China on Eloxatin® and Taxotere® sales.
Lantus® sales were €671 million, down 1.5% in the first quarter, due to lower sales in Europe, reflecting biosimilar competition and continuous Toujeo® switches.
First-quarter Aprovel®/Avapro® sales were up 17.8% to €125 million, due to some supply improvement and compared with a low base in the first quarter of 2021.
Pharmaceuticals business operating income
In the first quarter, business operating income (BOI) of Pharmaceuticals increased. The ratio of BOI to net sales increased by 0.3 percentage point to 38.6%, reflecting an improvement of the gross margin ratio.
Vaccines
| Net sales (€ million) | Q1 2022 | Change at CER | ||
| Polio/Pertussis/Hib vaccines
(incl. Hexaxim® / Hexyon®, Pentacel®, Pentaxim® and Imovax®) |
613 |
+10.3% | ||
| Meningitis vaccines
(incl. Menactra®, MenQuadfi®) |
112 |
-16.4% | ||
| Booster vaccines (incl. Adacel ®) |
109 | +4.0% | ||
| Travel and endemic vaccines |
98 | +61.0% | ||
| Influenza vaccines
(incl. Fluzone® HD/ Efluelda®, Fluzone®, Flublok®, Vaxigrip®) |
66 |
-18.2% | ||
| Other vaccines |
22 | +11.1% | ||
| Total Vaccines |
1,020 | +6.8% | ||
First-quarter Vaccines sales increased 6.8% to €1,020 million driven by double-digit growth of Polio/Pertussis/Hib vaccines sales and partial recovery of Travel vaccines.
In the first quarter, Polio/Pertussis/Hib (PPH) vaccines sales increased 10.3% to €613 million. In the Rest of the World region, PPH sales grew 23.1% driven by a strong performance of Pentaxim® in China compared to a low base last year and favorable timing of polio tender delivery. In the U.S., PPH sales were impacted by inventory fluctuation and progressive ramp up of Vaxelis® sales. As a reminder, Vaxelis® in-market sales are not consolidated and the profits are shared equally between Sanofi and Merck.
First-quarter Meningitis sales decreased 16.4% to €112 million, due to lower sales in Latin America reflecting price competition in public tenders.
6
Booster vaccines sales increased 4.0% in the first quarter to €109 million, driven by the Rest of the World region.
First-quarter Travel and endemic vaccines sales increased 61.0% to €98 million, reflecting a partial recovery of Travel vaccines in Europe and the U.S. as well as higher endemic vaccines sales in the Rest of the World region.
Influenza vaccines sales decreased 18.2% in the first quarter, reaching €66 million due to an exceptional high demand in the first quarter of 2021.
Vaccines business operating income
In the first quarter, business operating income (BOI) decreased compared to the same period of last year. This reflects higher R&D expenses related to Translate Bio and the mRNA center of excellence and the payment from Daiichi Sankyo recorded in the first quarter of 2021. BOI to net sales ratio was 29.0% (versus 40.5% in the first quarter of 2021, 27.5% excluding the payment from Daiichi Sankyo).
Consumer Healthcare
| Net sales (€ million) | Q1 2022 | Change at CER | ||
| Allergy |
226 | +11.3% | ||
| Cough & Cold |
121 | +118.2% | ||
| Pain Care |
314 | +22.5% | ||
| Digestive Wellness |
325 | +13.8% | ||
| Physical and Mental Wellness |
154 | +14.9% | ||
| Personal Care |
130 | -2.4% | ||
| Non-Core / Others |
58 | -16.2% | ||
| Total Consumer Healthcare |
1,328 | +17.0% | ||
In the first quarter, Consumer Healthcare (CHC) sales increased 17.0% to €1,328 million sustained by growth in Europe and the Rest of the World region. This performance was mainly driven by the strong demand for Cough & Cold products, as well as the performance of Pain Care and Digestive Wellness categories. This global performance includes a positive price effect of 3%. The divestments of non-core products had an impact of -0.6 ppt of growth in the first quarter.
In the U.S., first-quarter CHC sales increased 2.1% to €310 million driven by double-digit growth of Allergy category partially offset by lower sales of Personal care and non-core assets mainly due to supply constraints.
In Europe, first-quarter CHC sales increased 21.0% to €406 million mainly reflecting strong growth of the Cough & Cold and Pain Care categories.
In Rest of World, first-quarter CHC sales increased 22.8% to €612 million, supported by growth in all categories.
CHC business operating income
In the first quarter, business operating income (BOI) of CHC increased. The ratio of BOI to net sales increased 9.5 percentage point to 44.9% versus the prior year, reflecting strong top line growth as well as a capital gain related to divestments of non-strategic assets.
Company sales by geographic region
7
| Sanofi sales (€ million) | Q1 2022 | Change at CER | ||
| United States |
3,484 | +12.1% | ||
| Europe |
2,392 | +6.7% | ||
| Rest of the World |
3,798 | +7.0% | ||
| of which China |
901 | +13.4% | ||
| of which Japan |
433 | +1.6% | ||
| of which Brazil |
260 | -9.3% | ||
| of which Russia |
185 | +34.4% | ||
| Total Sanofi sales |
9,674 | +8.6% | ||
First-quarter sales in the U.S. increased +12.1% to €3,484 million supported by the strong performance of Dupixent®.
In Europe sales increased +6.7% in the first quarter to €2,392 million mainly driven by Dupixent® performance as well as strong CHC growth.
In Rest of World sales increased +7.0% to €3,798 million in the first quarter, reflecting the performance of Dupixent®, CHC and Vaccines which largely offset lower sales of General Medicines. Sales in China increased 13.4% to €901 million mainly as a result of the growth of Dupixent®, Vaccines and CHC. In Japan, first-quarter sales increased 1.6% to €433 million driven by Dupixent® and Sarclisa® which more than offset lower sales of General Medicines. In Russia, due to strong cough, cold and flu related sales, higher vaccines sales and unprecedented stockpiling at pharmacy and patient level sales increased 34.4% in the first quarter. In March, Sanofi decided to stop any new spending not related to the supply of its essential and life-changing medicines and vaccines in Russia. This includes all advertising and promotional spending.
8
R&D update at the end of the first quarter 2022
Regulatory update
| ● | The European Medicines Agency’s Committee for Medicinal Products for Human Use (CHMP) has adopted a positive opinion recommending to extend the approval of Dupixent® (dupilumab) in the European Union to include add-on maintenance treatment for children aged 6 to 11 years with severe asthma with type 2 inflammation characterized by raised blood eosinophils and/or raised fractional exhaled nitric oxide (FeNO) who are inadequately controlled on two maintenance therapies. |
| ● | The U.S. Food and Drug Administration (FDA) has accepted for Priority Review the supplemental Biologics License Application (sBLA) for Dupixent® as an add-on maintenance treatment for children aged 6 months to 5 years with moderate-to-severe atopic dermatitis whose disease is not adequately controlled with topical prescription therapies or when those therapies are not advisable. The target action date for the FDA decision on this investigational use is June 9, 2022. Dupixent® remains the only biologic medicine approved for patients 6 years of age and older in this indication. |
| ● | The FDA has accepted for Priority Review the supplemental Biologics License Application (sBLA) for Dupixent® 300 mg weekly to treat adults and adolescents aged 12 years and older with eosinophilic esophagitis (EoE), a chronic and progressive type 2 inflammatory disease that damages the esophagus and the ability to swallow. |
| ● | The FDA has approved Enjaymo™ (sutimlimab-jome), the first and only approved treatment to decrease the need for red blood cell transfusion due to hemolysis in adults with cold agglutinin disease (CAD). CAD is a chronic and rare blood disorder that impacts the lives of an estimated 5,000 people in the U.S. Sanofi estimates around 3,200 patients to be drug-treated per year and that Enjaymo could reach a market share of around 25% in the years to come. |
| ● | The Japanese Ministry of Health, Labor and Welfare (MHLW) has granted marketing authorization for Xenpozyme® (olipudase alfa) for the treatment of adult and pediatric patients with non-central nervous system manifestations of acid sphingomyelinase deficiency (ASMD). Xenpozyme® is currently the only approved treatment for ASMD and represents Sanofi’s first therapy to be approved under the SAKIGAKE or pioneer designation, which is the Japanese government’s regulatory fast-track pathway to promote research and development of innovative new medical products addressing urgent unmet medical needs. |
| ● | The EMA has accepted the Marketing Authorization Application (MAA) for nirsevimab under an accelerated assessment procedure. Nirsevimab, the first investigational long-acting antibody designed to protect all infants against medically attended lower respiratory tract infections (LRTI) for the respiratory syncytial virus (RSV) season, is being developed by Sanofi and AstraZeneca. The New England Journal of Medicine (NEJM) published detailed Phase 3 results of the MELODY trial. In this study, with healthy infants born at term or late preterm entering their first RSV season, the primary endpoint was met, reducing the incidence of medically attended LRTI, such as bronchiolitis or pneumonia, caused by RSV by 74.5% compared to placebo. |
| ● | The EMA has started to evaluate the application for the conditional marketing authorization of the Sanofi-GSK first-generation recombinant COVID-19 vaccine as a primary vaccine and a booster designed to boost all currently approved COVID-19 vaccine platforms. Final analysis of the VAT02 COVID-19 booster trial confirms universal ability to boost neutralizing antibodies 18- to 30-fold across vaccine platforms. The VAT08 primary series trial, with two doses of the Sanofi-GSK vaccine in seronegative populations demonstrated 100% efficacy against severe COVID-19 disease and hospitalizations, 75% efficacy against moderate or severe COVID-19 disease, and 57.9% efficacy against any symptomatic COVID-19 disease, in line with expected vaccine effectiveness in today’s environment dominated by variants of concern. When the Sanofi-GSK vaccine was used as a two-dose primary series followed by a booster dose, neutralizing antibodies increased 84- to 153-fold compared to pre-boost levels. |
9
| ● | Sanofi and Regeneron announced the voluntary withdrawal of the sBLA for Libtayo® (cemiplimab-rwlc) as a second-line treatment for patients with advanced cervical cancer. The decision was made after the companies and the FDA were not able to align on certain post-marketing studies. Discussions with regulatory authorities outside of the U.S. are ongoing. |
Portfolio update
Phase 3:
| ● | Sanofi and Sobi announced positive topline results from the pivotal XTEND-1 study evaluating the safety, efficacy and pharmacokinetics of efanesoctocog alfa (BIVV001), a once-weekly recombinant factor VIII therapy, in previously treated patients ≥12 years of age with severe hemophilia A. The study met both primary and secondary endpoints, showing a clinically meaningful prevention of bleeds in people with severe hemophilia A over a period of 52 weeks, with a median annualized bleeding rate (ABR) of 0 and a mean ABR of 0.71, and a superiority to prior prophylactic factor VIII replacement therapy based on intra-patient comparison. Sanofi plans to submit the data in the U.S. mid-2022. Submission in the EU is expected to follow the availability of data from the ongoing XTEND-Kids pediatric study, expected in 2023. |
| ● | A second trial (PRIME) evaluating Dupixent® in adults with uncontrolled prurigo nodularis (PN), met its primary and key secondary endpoints, showing it significantly reduced itch and skin lesions compared to placebo at 24 weeks in this investigational setting. The data confirm the positive results that were previously reported from the Phase 3 PRIME2 trial. |
| ● | The LIBERTY-CPUO-CHIC study evaluating the efficacy and safety of subcutaneous Dupixent® for the treatment of adult participants with chronic pruritus of unknown origin (CPUO) has initiated, and enrolled its first participant. |
| ● | The CUPID Study B evaluating Dupixent® in patients with chronic spontaneous urticaria (CSU), who were refractory to omalizumab, stopped due to futility based on a pre-specified interim analysis. Although positive numerical trends in reducing itch and hives were observed, the results from the interim analysis did not demonstrate statistical significance for the primary endpoints. The LIBERTY-CUPID pivotal program was initiated in 2020 with an accelerated direct-to-Phase 3 strategy. The previously reported Phase 3 trial (Study A), which evaluated a different group of patients who were biologic-naïve, met its primary and all key secondary endpoints at 24 weeks showing that adding Dupixent to standard-of-care antihistamines significantly reduced itch and hives compared to antihistamines alone. Sanofi and Regeneron remain committed to advancing Dupixent for patients with CSU uncontrolled on antihistamines, next steps are being evaluated including discussions with regulatory authorities. |
| ● | The clinical trial evaluating the efficacy and safety of amcenestrant compared with tamoxifen in patients with HR+ early breast cancer who have discontinued adjuvant aromatase inhibitor (AI) therapy due to treatment related toxicity (AMEERA-6), enrolled its first participant. |
Phase 2:
| ● | Three studies assessing rilzabrutinib have initiated, and enrolled their first participants: a randomized, double-blind, placebo-controlled study in adults with moderate-to-severe asthma, a randomized, double-blind, placebo-controlled study in CSU, and an open-label study in adults with Warm Autoimmune Hemolytic Anemia (wAIHA). |
| ● | The non-randomized and open-label study assessing the clinical benefit of SAR444245 combined with other anticancer therapies for the treatment of adults with advanced or metastatic gastrointestinal cancer was initiated, and was administered to the first participant. |
| ● | The pivotal AMEERA-3 clinical trial evaluating amcenestrant, an investigational optimized oral selective estrogen receptor degrader (SERD), as monotherapy compared to endocrine treatment of physician’s choice in patients with locally advanced or metastatic ER+/HER2- breast cancer who progressed on or after hormonal therapies, did not meet its primary endpoint of improving progression-free survival as assessed by an independent central review. |
10
Phase 1:
| ● | The study assessing the safety and efficacy of 4 investigational HSV 2 vaccines in adults with recurrent genital herpes caused by HSV 2 (HSV15) has been discontinued. |
Given the war in Ukraine and the suffering of the Ukrainian people, Sanofi has adapted its clinical trial implementation in the region. The company decided to halt any new recruitment of patients for ongoing clinical trials in Russia and Belarus, though it will continue to treat patients already enrolled. In Ukraine, Sanofi seeks to continue to support and supply patients currently enrolled in Sanofi-sponsored clinical trials, including transferring them within Ukraine or into neighboring countries. In anticipation of potential loss of data, the company is currently activating new clinical sites and expanding patient enrollment in geographies not impacted by the war. This may lead to the planned primary completion dates of its pivotal trials in MS and COPD to shift, but previously communicated submission timelines remain unchanged.
Acquisitions and major collaborations
| ● | Sanofi and Blackstone announced a strategic, risk-sharing collaboration under which funds managed by Blackstone Life Sciences will contribute up to €300 million to accelerate the global pivotal studies and the clinical development program for the subcutaneous formulation and delivery of the anti-CD38 antibody Sarclisa®, to treat patients with multiple myeloma (MM), expecting to begin in the second half of 2022. |
| ● | Sanofi announced the research collaboration and license agreement to develop up to 15 novel small molecule candidates across oncology and immunology with Exscientia, leveraging their end-to-end AI-driven platform utilizing actual patient samples. The companies have been working together since 2016 and in 2019, Sanofi in-licensed Exscientia’s novel bispecific small molecule candidate capable of targeting two distinct targets in inflammation and immunology. |
| ● | Sanofi announced the completion of the acquisition of Amunix Pharmaceuticals, Inc, adding a promising pipeline of T-cell engagers and cytokine therapies. The acquisition also provides access to their Pro-XTEN, XPAT, and XPAC technology to deliver next generation conditionally activated biologics. The technology platform is highly complementary to Sanofi’s existing R&D platforms and supports Sanofi’s efforts to accelerate and expand its contributions to innovative medicines for oncology patients, with approximately 20 molecules currently in development. |
| ● | Sanofi and Seagen announced an exclusive collaboration agreement to design, develop, and commercialize antibody-drug conjugates (ADCs) for up to three cancer targets. The collaboration will utilize both Sanofi’s proprietary monoclonal antibody technology and Seagen’s proprietary ADC technology. |
| ● | Sanofi and IGM Biosciences announced the signing of an exclusive worldwide collaboration agreement to create, develop, manufacture, and commercialize IgM antibody agonists against three oncology targets and three immunology/inflammation targets. |
An update of the R&D pipeline at as of March 31, 2022, is available on Sanofi’s website:
https://www.sanofi.com/en/science-and-innovation/research-and-development
11
Covid Update
Sanofi and GSK applied for regulatory authorization of their first-generation COVID-19 vaccine in Europe with data supporting its use as a universal booster, designed to boost all currently approved COVID-19 vaccine platforms. In addition, the companies are developing a next-generation booster vaccine designed to provide broad protection against all variants of concern, from the original strain to Omicron BA.2. The data (VAT02 Cohort 2) is expected to be communicated in Q2 2022.
12
First-quarter 2022 financial results
Business Net Income2
In the first quarter of 2022, Sanofi generated net sales of €9,674 million, an increase of 12.6% (up 8.6% at CER).
First-quarter other revenues increased 28.5% (up 23.7% at CER) to €379 million, including VaxServe sales contribution of non-Sanofi products of €286 million (up 16.7 % at CER).
First-quarter Gross Profit increased 15.7% (up 11.1% at CER) to €7,175 million. The gross margin ratio increased 2.0 percentage points to 74.2% versus the first quarter of 2021, reflecting strong improvement of the Pharmaceuticals gross margin ratio (which increased from 75.2% to 77.9%) driven by favorable impact of growing weight of Specialty Care, efficiency gains in Industrial Affairs and lower royalty expenses. The Vaccines gross margin ratio slightly decreased to 61.6% from 62.0%. CHC gross margin ratio was 67.3%, down 0.7 percentage point.
Research and Development (R&D) expenses increased 17.5% (up 14.0% at CER) to €1,489 million in the first quarter, reflecting increase in priority assets development as well as recent acquisitions.
First-quarter selling general and administrative expenses (SG&A) increased 8.4% to €2,379 million. At CER, SG&A expenses were up 4.3%, reflecting increased commercial investments in Specialty Care growth drivers which were partially offset by continued streamlining initiatives. In the first quarter, the ratio of SG&A to sales decreased 0.9 percentage point to 24.6% compared to the prior year.
First-quarter operating expenses were €3,868 million, an increase of 11.8% and 7.8% at CER.
First-quarter other current operating income net of expenses was -€265 million versus -€101 million in the first quarter of 2021. Other current operating income net of expenses included an expense of €477 million (versus an expense of €279 million in the first quarter of 2021) corresponding to the share of profit to Regeneron of the monoclonal antibodies Alliance, reimbursement of development costs by Regeneron and the reimbursement of commercialization-related expenses incurred by Regeneron. In the first quarter, this line also included €232 million of net capital gains related to General Medicines and CHC portfolio streamlining compared to €56million in the same period of 2021.
The share of profit from associates was €30 million versus €9 million in the first quarter of 2021 and included the share of U.S profit related to Vaxelis®.
First-quarter business operating income2 (BOI) increased. . The ratio of BOI to net sales increased 1.0 percentage point to 31.7% mainly reflecting gross margin ratio improvement.
Net financial expenses were €78 million versus €84 million in the same period of 2021.
First-quarter effective tax rate was 19.0% versus 21.0% in the prior year. Sanofi expects its effective tax rate to be around 19% in 2022.
First-quarter business net income2 increased 20.2% to €2,424 million and increased 16.0% at CER. The ratio of business net income to net sales increased 1.6 percentage point to 25.1% versus the first quarter of 2021.
In the first quarter of 2022, business earnings per share2 (EPS) was €1.94, up 20.5% on a reported basis (up 16.1% at CER). The average number of shares outstanding was 1,249.2 million versus 1,249.3 million in first quarter 2021.
Reconciliation of IFRS net income reported to business net income (see Appendix 4)
2 See Appendix 3 for 2021 first-quarter consolidated income statement; see Appendix 7 for definitions of financial indicators, and Appendix 4 for reconciliation of IFRS net income reported to business net income.
13
In the first quarter of 2022, the IFRS net income was €2,009 million. The main items excluded from the business net income were:
| ● | An amortization charge of €449 million related to fair value remeasurement on intangible assets of acquired companies (primarily Genzyme: €145 million, Bioverativ: €88 million, Boehringer Ingelheim CHC business: €48 million, Ablynx: €42 million and Kadmon: €37 million) and to acquired intangible assets (licenses/products: €24 million). These items have no cash impact on the Company. |
| ● | An impairment of intangible assets of €5 million. |
| ● | Restructuring costs and similar items of €175 million related to streamlining initiatives. |
| ● | A €232 million tax effect arising from the items listed above, mainly comprising €96 million of deferred taxes generated by amortization and impairments of intangible assets and €46 million associated with restructuring costs and similar items (see Appendix 4). |
Capital Allocation
In the first quarter of 2022, free cash flow before restructuring, acquisitions and disposals4 decreased by 15.5% to €1,998 million, after net changes in working capital (-€468 million) and capital expenditures (-€356 million). After acquisitions (-€277 million), proceeds from disposals3 (+€347 million) and payments related to restructuring and similar items (-€361 million), free cash flow4 decreased by 11.3% to €1,707 million. After the acquisition of Amunix (-€803 million), net debt decreased from €9,983 million at December 31, 2021 to €9,432 million at March 31, 2022 (amount net of €8,728 million cash and cash equivalents).
3 Not exceeding €500 million per transaction (inclusive of all payments related to the transaction).
4 Non-GAAP financial measure (definition in Appendix 7).
14
Forward-Looking Statements
This document contains forward-looking statements as defined in the Private Securities Litigation Reform Act of 1995, as amended. Forward-looking statements are statements that are not historical facts. These statements include projections and estimates and their underlying assumptions, statements regarding plans, objectives, intentions and expectations with respect to future financial results, events, operations, services, product development and potential, and statements regarding future performance. Forward-looking statements are generally identified by the words “expects”, “expected to”, “anticipates”, “believes”, “intends”, “estimates”, “plans” and similar expressions. Although Sanofi’s management believes that the expectations reflected in such forward-looking statements are reasonable, investors are cautioned that forward-looking information and statements are subject to various risks and uncertainties, many of which are difficult to predict and generally beyond the control of Sanofi, that could cause actual results and developments to differ materially from those expressed in, or implied or projected by, the forward-looking information and statements. These risks and uncertainties include among other things, the uncertainties inherent in research and development, future clinical data and analysis, including post marketing, decisions by regulatory authorities, such as the FDA or the EMA, regarding whether and when to approve any drug, device or biological application that may be filed for any such product candidates as well as their decisions regarding labelling and other matters that could affect the availability or commercial potential of such product candidates, the fact that product candidates if approved may not be commercially successful, the future approval and commercial success of therapeutic alternatives, Sanofi’s ability to benefit from external growth opportunities, to complete related transactions and/or obtain regulatory clearances, risks associated with intellectual property and any related pending or future litigation and the ultimate outcome of such litigation, trends in exchange rates and prevailing interest rates, volatile economic and market conditions, cost containment initiatives and subsequent changes thereto, and the impact that COVID-19 will have on us, our customers, suppliers, vendors, and other business partners, and the financial condition of any one of them, as well as on our employees and on the global economy as a whole. Any material effect of COVID-19 on any of the foregoing could also adversely impact us. This situation is changing rapidly and additional impacts may arise of which we are not currently aware and may exacerbate other previously identified risks. The risks and uncertainties also include the uncertainties discussed or identified in the public filings with the SEC and the AMF made by Sanofi, including those listed under “Risk Factors” and “Cautionary Statement Regarding Forward-Looking Statements” in Sanofi’s annual report on Form 20-F for the year ended December 31, 2021. Other than as required by applicable law, Sanofi does not undertake any obligation to update or revise any forward-looking information or statements.
Appendices
| Appendix 1: |
First-quarter 2022 sales by GBU, franchise, geographic region and product | |
| Appendix 2: |
First-quarter 2022 business net income statement | |
| Appendix 3: |
First-quarter 2022 consolidated income statement | |
| Appendix 4: |
Reconciliation of IFRS net income reported to business net income | |
| Appendix 5: |
Change in net debt | |
| Appendix 6: |
Currency sensitivity | |
| Appendix 7: |
Definitions of non-GAAP financial indicators | |
Media Relations
Sandrine Guendoul | + 33 6 25 09 14 25 | [email protected]
Nicolas Obrist | + 33 6 77 21 27 55 | [email protected]
Victor Rouault | + 33 6 70 93 71 40 | [email protected]
Sally Bain | + 1 617 834 6026 | [email protected]
Investor Relations
Eva Schaefer-Jansen | + 33 7 86 80 56 39 | [email protected]
Arnaud Delépine | + 33 6 73 69 36 93 | [email protected]
Corentine Driancourt | + 33 6 40 56 92 | [email protected]
Felix Lauscher | + 1 908 612 7239 | [email protected]
Priya Nanduri | +1 617 764 6418 | [email protected]
Nathalie Pham | + 33 7 85 93 30 17 | [email protected]
15
Appendix 1: 2022 first-quarter net sales by GBU, franchise, geographic region and product
| Q1 2022 (€ million) | Total Sales | % CER | % reported | United States |
% CER | Europe | % CER | Rest of the world |
% CER | |||||||||||||||||||||||||||
| Dupixent |
1,614 | +45.7 | % | +54.2 | % | 1,176 | +38.1 | % | 211 | +53.3 | % | 227 | +88.0 | % | ||||||||||||||||||||||
| Aubagio |
491 | -6.6 | % | -1.8 | % | 329 | -9.7 | % | 132 | 0.0 | % | 30 | 0.0 | % | ||||||||||||||||||||||
| Lemtrada |
25 | 0.0 | % | +4.2 | % | 11 | 0.0 | % | 6 | +20.0 | % | 8 | -11.1 | % | ||||||||||||||||||||||
| Kevzara |
95 | +61.4 | % | +66.7 | % | 50 | +88.0 | % | 28 | +33.3 | % | 17 | +54.5 | % | ||||||||||||||||||||||
| Neurology & Immunology |
611 | +0.3 | % | +5.2 | % | 390 | -2.9 | % | 166 | +5.1 | % | 55 | +10.2 | % | ||||||||||||||||||||||
| Cerezyme |
165 | -6.7 | % | -7.3 | % | 45 | +5.0 | % | 60 | -4.8 | % | 60 | -14.7 | % | ||||||||||||||||||||||
| Cerdelga |
67 | +3.2 | % | +8.1 | % | 36 | +3.1 | % | 27 | +3.8 | % | 4 | 0.0 | % | ||||||||||||||||||||||
| Myozyme |
235 | -3.0 | % | 0.0 | % | 82 | -13.6 | % | 103 | +4.1 | % | 50 | +2.0 | % | ||||||||||||||||||||||
| Nexviazyme |
30 | 0.0 | % | 0.0 | % | 26 | 0.0 | % | 1 | 0.0 | % | 3 | 0.0 | % | ||||||||||||||||||||||
| Fabrazyme |
220 | +2.4 | % | +5.8 | % | 105 | +4.3 | % | 58 | +1.8 | % | 57 | 0.0 | % | ||||||||||||||||||||||
| Aldurazyme |
69 | +3.0 | % | +4.5 | % | 13 | 0.0 | % | 24 | 0.0 | % | 32 | +6.5 | % | ||||||||||||||||||||||
| Rare Disease |
804 | +1.9 | % | +4.4 | % | 307 | +7.2 | % | 274 | +1.9 | % | 223 | -3.8 | % | ||||||||||||||||||||||
| Jevtana |
98 | -25.4 | % | -22.2 | % | 68 | +8.6 | % | 11 | -75.6 | % | 19 | -13.0 | % | ||||||||||||||||||||||
| Fasturtec |
40 | +8.6 | % | +14.3 | % | 24 | +9.5 | % | 12 | +9.1 | % | 4 | 0.0 | % | ||||||||||||||||||||||
| Libtayo |
41 | +53.8 | % | +57.7 | % | — | 0.0 | % | 34 | +50.0 | % | 7 | +75.0 | % | ||||||||||||||||||||||
| Sarclisa |
65 | +85.3 | % | +91.2 | % | 25 | +100.0 | % | 22 | +69.2 | % | 18 | +88.9 | % | ||||||||||||||||||||||
| Oncology |
244 | +6.8 | % | +10.4 | % | 117 | +20.9 | % | 79 | -14.3 | % | 48 | +23.1 | % | ||||||||||||||||||||||
| Alprolix |
108 | +2.0 | % | +8.0 | % | 92 | +8.9 | % | — | 0.0 | % | 16 | -23.8 | % | ||||||||||||||||||||||
| Eloctate |
138 | -3.0 | % | +3.0 | % | 108 | -1.9 | % | — | 0.0 | % | 30 | -6.5 | % | ||||||||||||||||||||||
| Cablivi |
46 | +15.8 | % | +21.1 | % | 22 | -4.5 | % | 23 | +46.7 | % | 1 | 0.0 | % | ||||||||||||||||||||||
| Rare Blood Disorder |
293 | +1.8 | % | +7.7 | % | 223 | +2.5 | % | 23 | +46.7 | % | 47 | -13.2 | % | ||||||||||||||||||||||
| Specialty Care |
3,566 | +17.8 | % | +23.3 | % | 2,213 | +19.3 | % | 753 | +12.0 | % | 600 | +20.4 | % | ||||||||||||||||||||||
| Lovenox |
377 | -8.2 | % | -6.0 | % | 5 | -61.5 | % | 185 | -0.5 | % | 187 | -11.9 | % | ||||||||||||||||||||||
| Toujeo |
274 | +6.3 | % | +8.3 | % | 58 | -12.9 | % | 104 | +9.6 | % | 112 | +15.5 | % | ||||||||||||||||||||||
| Plavix |
261 | 0.0 | % | +4.0 | % | 3 | 0.0 | % | 26 | -10.3 | % | 232 | +1.4 | % | ||||||||||||||||||||||
| Multaq |
87 | +13.9 | % | +20.8 | % | 78 | +17.7 | % | 5 | -16.7 | % | 4 | 0.0 | % | ||||||||||||||||||||||
| Thymoglobulin |
97 | +13.8 | % | +21.3 | % | 56 | +13.0 | % | 8 | 0.0 | % | 33 | +19.2 | % | ||||||||||||||||||||||
| Mozobil |
58 | +5.8 | % | +11.5 | % | 31 | +3.6 | % | 15 | +7.1 | % | 12 | +10.0 | % | ||||||||||||||||||||||
| Praluent |
69 | +21.4 | % | +23.2 | % | — | -100.0 | % | 53 | +44.4 | % | 16 | +6.7 | % | ||||||||||||||||||||||
| Soliqua/iGlarLixi |
53 | +15.9 | % | +20.5 | % | 30 | +3.8 | % | 8 | 0.0 | % | 15 | +54.5 | % | ||||||||||||||||||||||
| Rezurock |
41 | 0.0 | % | 0.0 | % | 41 | 0.0 | % | — | 0.0 | % | — | 0.0 | % | ||||||||||||||||||||||
| Others core assets |
277 | +1.9 | % | +4.5 | % | 39 | -37.5 | % | 95 | +10.6 | % | 143 | +13.7 | % | ||||||||||||||||||||||
| Core Assets |
1,594 | +4.7 | % | +8.1 | % | 341 | +5.0 | % | 499 | +6.5 | % | 754 | +3.4 | % | ||||||||||||||||||||||
| Lantus |
671 | -1.5 | % | +2.9 | % | 208 | +0.5 | % | 112 | -11.2 | % | 351 | +0.9 | % | ||||||||||||||||||||||
| Aprovel |
125 | +17.8 | % | +23.8 | % | 1 | -50.0 | % | 21 | -8.7 | % | 103 | +27.6 | % | ||||||||||||||||||||||
| Others non-core assets |
1,187 | -7.4 | % | -5.6 | % | 95 | -2.2 | % | 300 | -8.8 | % | 792 | -7.4 | % | ||||||||||||||||||||||
|
Non-Core Assets |
1,983 | -4.2 | % | -1.3 | % | 304 | -0.7 | % | 433 | -9.4 | % | 1,246 | -3.1 | % | ||||||||||||||||||||||
| Industrial Sales |
183 | -4.3 | % | -2.7 | % | 10 | -18.2 | % | 168 | +5.8 | % | 5 | -71.4 | % | ||||||||||||||||||||||
| General Medicines |
3,760 | -0.7 | % | +2.4 | % | 655 | +1.8 | % | 1,100 | -0.5 | % | 2,005 | -1.5 | % | ||||||||||||||||||||||
| Pharmaceuticals |
7,326 | +7.5 | % | +11.6 | % | 2,868 | +14.8 | % | 1,853 | +4.2 | % | 2,605 | +2.9 | % | ||||||||||||||||||||||
| Polio / Pertussis / Hib |
613 | +10.3 | % | +15.0 | % | 125 | -14.1 | % | 78 | 0.0 | % | 410 | +23.1 | % | ||||||||||||||||||||||
| Booster Vaccines |
109 | +4.0 | % | +9.0 | % | 53 | +2.1 | % | 31 | -8.8 | % | 25 | +33.3 | % | ||||||||||||||||||||||
| Meningitis |
112 | -16.4 | % | -12.5 | % | 76 | -6.6 | % | 2 | 0.0 | % | 34 | -34.6 | % | ||||||||||||||||||||||
| Influenza Vaccines |
66 | -18.2 | % | -14.3 | % | 12 | 0.0 | % | 4 | -55.6 | % | 50 | -29.4 | % | ||||||||||||||||||||||
| Travel and Endemic Vaccines |
98 | +61.0 | % | +66.1 | % | 23 | +57.1 | % | 17 | +240.0 | % | 58 | +40.0 | % | ||||||||||||||||||||||
| Vaccines |
1,020 | +6.8 | % | +11.5 | % | 306 | -0.4 | % | 133 | +4.7 | % | 581 | +11.3 | % | ||||||||||||||||||||||
| Allergy |
226 | +11.3 | % | +15.9 | % | 131 | +15.1 | % | 17 | -5.6 | % | 78 | +9.9 | % | ||||||||||||||||||||||
| Cough and Cold |
121 | +118.2 | % | +120.0 | % | — | 0.0 | % | 66 | +164.0 | % | 55 | +80.0 | % | ||||||||||||||||||||||
| Pain Care |
314 | +22.5 | % | +24.1 | % | 46 | +7.5 | % | 151 | +23.8 | % | 117 | +27.5 | % | ||||||||||||||||||||||
| Digestive Wellness |
325 | +13.8 | % | +14.8 | % | 29 | +8.0 | % | 112 | +5.7 | % | 184 | +20.3 | % | ||||||||||||||||||||||
| Physical Wellness |
88 | +7.4 | % | +8.6 | % | — | 0.0 | % | 6 | -25.0 | % | 82 | +11.0 | % | ||||||||||||||||||||||
| Mental Wellness |
66 | +26.4 | % | +24.5 | % | 12 | 0.0 | % | 34 | +17.2 | % | 20 | +69.2 | % | ||||||||||||||||||||||
| Personal Care |
130 | -2.4 | % | +4.0 | % | 96 | -7.3 | % | 1 | 0.0 | % | 33 | +14.3 | % | ||||||||||||||||||||||
| Non-Core / Others |
58 | -16.2 | % | -14.7 | % | (4 | ) | -160.0 | % | 19 | -30.8 | % | 43 | +13.5 | % | |||||||||||||||||||||
| Consumer Healthcare |
1,328 | +17.0 | % | +19.3 | % | 310 | +2.1 | % | 406 | +21.0 | % | 612 | +22.8 | % | ||||||||||||||||||||||
| Company |
9,674 | +8.6 | % | +12.6 | % | 3,484 | +12.1 | % | 2,392 | +6.7 | % | 3,798 | +7.0 | % | ||||||||||||||||||||||
16
Appendix 2: Business net income statement
| First Quarter 2022 | Pharmaceuticals | Vaccines | Consumer Healthcare | Other(1) | Total Group | |||||||||||||||||||||||||||||||||||||||||||||||||
| € million | Q1 2022 |
Q1 2021(2) |
Change | Q1 2022 |
Q1 2021(2) |
Change | Q1 2022 |
Q1 2021(2) |
Change | Q1 2022 |
Q1 2021(2) |
Change | Q1 2022 |
Q1 2021(2) |
Change | |||||||||||||||||||||||||||||||||||||||
| Net sales |
7,326 | 6,563 | 11.6% | 1,020 | 915 | 11.5% | 1,328 | 1,113 | 19.3% | — | — | —% | 9,674 | 8,591 | 12.6% | |||||||||||||||||||||||||||||||||||||||
| Other revenues |
75 | 50 | 50.0% | 289 | 231 | 25.1% | 14 | 14 | —% | 1 | — | —% | 379 | 295 | 28.5% | |||||||||||||||||||||||||||||||||||||||
| Cost of Sales | (1,695) | (1,679) | 1.0% | (681) | (579) | 17.6% | (448) | (370) | 21.1% | (54) | (56) | -3.6% | (2,878) | (2,684) | 7.2% | |||||||||||||||||||||||||||||||||||||||
| As % of net sales | (23.1)% | (25.6)% | (66.8)% | (63.3)% | (33.7)% | (33.2)% | (29.7)% | (31.2)% | ||||||||||||||||||||||||||||||||||||||||||||||
| Gross Profit | 5,706 | 4,934 | 15.6% | 628 | 567 | 10.8% | 894 | 757 | 18.1% | (53) | (56) | -5.4% | 7,175 | 6,202 | 15.7% | |||||||||||||||||||||||||||||||||||||||
| As % of net sales | 77.9% | 75.2% | 61.6% | 62.0% | 67.3% | 68.0% | 74.2% | 72.2% | ||||||||||||||||||||||||||||||||||||||||||||||
| Research and development expenses | (1,165) | (979) | 19.0% | (185) | (145) | 27.6% | (36) | (28) | 28.6% | (103) | (115) | -10.4% | (1,489) | (1,267) | 17.5% | |||||||||||||||||||||||||||||||||||||||
| As % of net sales | (15.9)% | (14.9)% | (18.1)% | (15.8)% | (2.7)% | (2.5)% | (15.4)% | (14.7)% | ||||||||||||||||||||||||||||||||||||||||||||||
| Selling and general expenses | (1,308) | (1,188) | 10.1% | (170) | (170) | —% | (382) | (344) | 11.0% | (519) | (492) | 5.5% | (2,379) | (2,194) | 8.4% | |||||||||||||||||||||||||||||||||||||||
| As % of net sales | (17.9)% | (18.1)% | (16.7)% | (18.6)% | (28.8)% | (30.9)% | (24.6)% | (25.5)% | ||||||||||||||||||||||||||||||||||||||||||||||
| Other current operating income/expenses | (411) | (252) | 7 | 120 | 122 | 10 | 17 | 21 | (265) | (101) | ||||||||||||||||||||||||||||||||||||||||||||
| Share of profit/loss of associates* and joint ventures | 14 | 7 | 16 | (1) | — | 3 | — | — | 30 | 9 | ||||||||||||||||||||||||||||||||||||||||||||
| Net income attributable to non controlling interests | (5) | (8) | — | — | (2) | (4) | — | — | (7) | (12) | ||||||||||||||||||||||||||||||||||||||||||||
| Business operating income | 2,831 | 2,514 | 12.6% | 296 | 371 | -20.2% | 596 | 394 | 51.3% | (658) | (642) | 2.5% | 3,065 | 2,637 | 16.2% | |||||||||||||||||||||||||||||||||||||||
| As % of net sales | 38.6% | 38.3% | 29.0% | 40.5% | 44.9% | 35.4% | 31.7% | 30.7% | ||||||||||||||||||||||||||||||||||||||||||||||
|
|
||||||||||||||||||||||||||||||||||||||||||||||||||||||
| Financial income and expenses | (78) | (84) | ||||||||||||||||||||||||||||||||||||||||||||||||||||
| Income tax expenses | (563) | (537) | ||||||||||||||||||||||||||||||||||||||||||||||||||||
| Tax rate** | 19.0% | 21.0% | ||||||||||||||||||||||||||||||||||||||||||||||||||||
| Business net income | 2,424 | 2,016 | 20.2% | |||||||||||||||||||||||||||||||||||||||||||||||||||
| As % of net sales | 25.1% | 23.5% | ||||||||||||||||||||||||||||||||||||||||||||||||||||
| Business earnings / share(in euros)*** | 1.94 | 1.61 | 20.5% | |||||||||||||||||||||||||||||||||||||||||||||||||||
* Net of tax.
** Determined on the basis of Business income before tax, associates, and non-controlling interests.
*** Based on an average number of shares outstanding of 1,249.2 million in the first quarter of 2022 and 1,249.3 million in the first quarter of 2021.
| (1) | Other includes the cost of global support functions (Finance, Human Resources, Information Solution & Technologies, Sanofi Business Services, etc…). |
| (2) | Includes the impacts of the IFRIC final agenda decision of April 2021 on the attribution of benefits to periods of service. |
17
Appendix 3: Consolidated income statements
| € million | Q1 2022 | Q1 2021 (1) | ||||||||||
| Net sales |
9,674 | 8,591 | ||||||||||
| Other revenues |
379 | 295 | ||||||||||
| Cost of sales |
(2,880 | ) | (2,684 | ) | ||||||||
| Gross profit |
7,173 | 6,202 | ||||||||||
| Research and development expenses |
(1,489 | ) | (1,267 | ) | ||||||||
| Selling and general expenses |
(2,379 | ) | (2,194 | ) | ||||||||
| Other operating income |
390 | 267 | ||||||||||
| Other operating expenses |
(655 | ) | (368 | ) | ||||||||
| Amortization of intangible assets |
(449 | ) | (389 | ) | ||||||||
| Impairment of intangible assets |
(5 | ) | (2 | ) | ||||||||
| Fair value remeasurement of contingent consideration |
4 | (36 | ) | |||||||||
| Restructuring costs and similar items |
(175 | ) | (156 | ) | ||||||||
| Other gains and losses, and litigation |
(18 | ) | — | |||||||||
| Operating income |
2,397 | 2,057 | ||||||||||
| Financial expenses |
(88 | ) | (98 | ) | ||||||||
| Financial income |
10 | 14 | ||||||||||
| Income before tax and associates and joint ventures |
2,319 | 1,973 | ||||||||||
| Income tax expense |
(332 | ) | (404 | ) | ||||||||
| Share of profit/(loss) of associates and joint ventures |
30 | 9 | ||||||||||
| Net income |
2,017 | 1,578 | ||||||||||
| Net income attributable to non-controlling interests |
8 | 12 | ||||||||||
| Net income attributable to equity holders of Sanofi |
2,009 | 1,566 | ||||||||||
| Average number of shares outstanding (million) |
1,249.2 | 1,249.3 | ||||||||||
| IFRS Earnings per share (in euros) |
1.61 | 1.25 | ||||||||||
(1) Includes the impacts of the IFRIC final agenda decision of April 2021 on the attribution of benefits to periods of service
18
Appendix 4: Reconciliation of Net income attributable to equity holders of Sanofi to Business net income
| € million | Q1 2022 | Q1 2021 (1) | ||||||||||
| Net income attributable to equity holders of Sanofi |
2,009 | 1,566 | ||||||||||
| Amortization of intangible assets (2) |
449 | 389 | ||||||||||
| Impairment of intangible assets |
5 | 2 | ||||||||||
| Fair value remeasurement of contingent consideration |
(4 | ) | 36 | |||||||||
| Expenses arising from the impact of acquisitions on inventories |
3 | — | ||||||||||
| Restructuring costs and similar items |
175 | 156 | ||||||||||
| Other gains and losses, and litigation |
18 | — | ||||||||||
| Tax effect of the items listed above: |
(232 | ) | (133 | ) | ||||||||
| Amortization and impairment of intangible assets |
(96 | ) | (89 | ) | ||||||||
| Fair value remeasurement of contingent consideration |
(7 | ) | (1 | ) | ||||||||
| Restructuring costs and similar items |
(46 | ) | (42 | ) | ||||||||
| Other tax effects |
(83 | ) | (1 | ) | ||||||||
| Share of items listed above attributable to non-controlling interests |
1 | — | ||||||||||
| Business net income |
2,424 | 2,016 | ||||||||||
| IFRS earnings per share (3) (in euros) |
1.61 | 1.25 | ||||||||||
| (1) | Includes the impacts of the IFRIC final agenda decision of April 2021 on the attribution of benefits to periods of service. |
| (2) | Of which related to amortization expense generated by the remeasurement of intangible assets as part of business combinations: €425 million in the first quarter of 2022 and €369 million in the first quarter of 2021. |
| (3) | Based on an average number of shares outstanding of 1,249.2 million in the first quarter of 2022 and 1,249.3 million in the first quarter of 2021. |
19
Appendix 5: Change in net debt
| € million | Q1 2022 | Q1 2021 (1) | ||||||||||
| Business net income |
2,424 | 2,016 | ||||||||||
| Depreciation & amortization & impairment of property, plant and equipment and software |
361 | 347 | ||||||||||
| Other items |
37 | (43 | ) | |||||||||
| Operating cash flow |
2,822 | 2,320 | ||||||||||
| Changes in Working Capital |
(468 | ) | 422 | |||||||||
| Acquisitions of property, plant and equipment and software |
(356 | ) | (378 | ) | ||||||||
| Free cash flow before restructuring, acquisitions and disposals |
1,998 | 2,364 | ||||||||||
| Acquisitions of intangibles assets, investments and other long-term financial assets (2) |
(277 | ) | (277 | ) | ||||||||
| Restructuring costs and similar items paid |
(361 | ) | (244 | ) | ||||||||
| Proceeds from disposals of property, plant and equipment, intangible assets and other non-current assets net of taxes (2) | 347 | 82 | ||||||||||
| Free cash flow |
1,707 | 1,925 | ||||||||||
| Acquisitions of investments in consolidated undertakings including assumed debt (3) |
(823 | ) | (21 | ) | ||||||||
| Issuance of Sanofi shares |
13 | 11 | ||||||||||
| Acquisition of treasury shares |
(360 | ) | (140 | ) | ||||||||
| Other items |
14 | 192 | ||||||||||
| Change in net debt |
551 | 1,967 | ||||||||||
| Beginning of period |
9,983 | 8,790 | ||||||||||
| Closing of net debt |
9,432 | 6,823 | ||||||||||
| (1) | Includes the impacts of the IFRIC final agenda decision of April 2021 on the attribution of benefits to periods of service. |
| (2) | Free cash flow includes investments and divestments not exceeding a cap of €500 million per transaction (inclusive of all payments related to the transaction). |
| (3) | Includes transactions that are above a cap of €500 million per transaction (inclusive of all payments related to the transaction). |
20
Appendix 6: Currency sensitivity
2022 business EPS currency sensitivity
| Currency | Variation | Business EPS Sensitivity | ||
| U.S. Dollar |
+0.05 USD/EUR | -EUR0.14 | ||
| Japanese Yen |
+5 JPY/EUR | -EUR 0.02 | ||
| Chinese Yuan |
+0.2 CNY/EUR | -EUR 0.02 | ||
| Brazilian Real |
+0.4 BRL/EUR | -EUR 0.01 | ||
| Russian Ruble |
+10 RUB/EUR | -EUR 0.02 | ||
Currency exposure on Q1 2022 sales
| Currency | Q1 2022 | |
| US $ |
37.0% | |
| Euro € |
21.0% | |
| Chinese Yuan |
8.8% | |
| Japanese Yen |
4.4% | |
| Brazilian Real |
2.5% | |
| Russian ruble |
1.8% | |
| Hungarian Forint |
1.7% | |
| Canadian $ |
1.4% | |
| Australian $ |
1.4% | |
| British Pound |
1.4% | |
| Others |
18.6% | |
Currency average rates
| Q1 2021 | Q1 2022 | Change | ||||||||||
| €/$ |
1.21 | 1.12 | -6.9% | |||||||||
| €/Yen |
127.69 | 130.47 | +2.2% | |||||||||
| €/Yuan |
7.81 | 7.14 | -8.6% | |||||||||
| €/Real |
6.59 | 5.88 | -10.8% | |||||||||
|
€/Ruble |
89.72 | 97.95 | +9.2% | |||||||||
21
Appendix 7: Definitions of non-GAAP financial indicators
Company sales at constant exchange rates (CER)
When we refer to changes in our net sales “at constant exchange rates” (CER), this means that we exclude the effect of changes in exchange rates.
We eliminate the effect of exchange rates by recalculating net sales for the relevant period at the exchange rates used for the previous period.
Reconciliation of net sales to Company sales at constant exchange rates for the first quarter 2022
| € million | Q1 2022 | |
| Net sales |
9,674 | |
| Effect of exchange rates |
341 | |
| Company sales at constant exchange rates |
9,333 | |
Business net income
Sanofi publishes a key non-GAAP indicator. Business net income is defined as net income attributable to equity holders of Sanofi excluding:
| ● | amortization of intangible assets, |
| ● | impairment of intangible assets, |
| ● | fair value remeasurement of contingent consideration related to business combinations or to disposals, |
| ● | other impacts associated with acquisitions (including impacts of acquisitions on associates and joint ventures), |
| ● | restructuring costs and similar items(1), |
| ● | other gains and losses (including gains and losses on disposals of non-current assets(1)), |
| ● | costs or provisions associated with litigation(1), |
| ● | gain on Regeneron investment as a result of the transaction completed on May 29, 2020 (the amount does not include the gain related to the remeasurement at fair value at this date of the 400,000 retained shares), |
| ● | tax effects related to the items listed above as well as effects of major tax disputes, |
| ● | effect of equity method accounting for Regeneron investment (excluded from Business net income) as a consequence of the sale of the entire equity investment in Regeneron (with the exception of 400,000 shares retained by Sanofi) on May 29th 2020), |
| ● | net income attributable to non-controlling interests related to the items listed above. |
(1) Reported in the line items Restructuring costs and similar items and Gains and losses on disposals, and litigation, which are defined in Notes B.19. and B.20. to our consolidated financial statements.
Free cash flow
Free cash flow is a non-GAAP financial indicator which is reviewed by our management, and which we believe provides useful information to measure the net cash generated from the Company’s operations that is available for strategic investments1 (net of divestments1), for debt repayment, and for capital return to shareholders. Free Cash Flow is determined from the Business Net Income adjusted for depreciation, amortization and impairment, share of profit/loss in associates and joint ventures net of dividends received, gains & losses on disposals, net change in provisions including pensions and other post-employment benefits, deferred taxes, share-based expense and other non-cash items. It comprises net changes in working capital, capital expenditures and other asset acquisitions2 net of disposal proceeds2, and payments related to restructuring and similar items. Free cash flow is not defined by IFRS and it is not a substitute measure for the IFRS aggregate net cash flows in operating activities.
22
1 Amount of the transaction above a cap of €500 million per transaction (inclusive of all payments related to the transaction).
2 Not exceeding a cap of €500 million per transaction (inclusive of all payments related to the transaction).
23
Serious News for Serious Traders! Try StreetInsider.com Premium Free!
You May Also Be Interested In
- ROSEN, LEADING INVESTOR COUNSEL, Encourages Banco Santander, S.A. Investors to Inquire About Securities Class Action Investigation – SAN
- Brüush Receives Additional Delisting Notification to Address at Hearing
- Nykredit Realkredit A/S – New final terms for Euro Medium Term Note Programme
Create E-mail Alert Related Categories
SEC FilingsSign up for StreetInsider Free!
Receive full access to all new and archived articles, unlimited portfolio tracking, e-mail alerts, custom newswires and RSS feeds - and more!
