

Form 6-K Sanofi For: Jul 31
 Tweet
Tweet Share
ShareUNITED STATES
SECURITIES AND EXCHANGE COMMISSION
Washington, D.C. 20549
FORM 6-K
REPORT OF FOREIGN PRIVATE ISSUER
PURSUANT TO RULE 13a-16 OR 15d-16
UNDER THE SECURITIES EXCHANGE ACT OF 1934
For the month of July 2018
Commission File Number: 001-31368
SANOFI
(Translation of registrant’s name into English)
54, rue La Boétie, 75008 Paris, FRANCE
(Address of principal executive offices)
Indicate by check mark whether the registrant files or will file annual reports under cover Form 20-F or Form 40-F.
Form 20-F ☒ Form 40-F ☐
Indicate by check mark if the registrant is submitting the Form 6-K in paper as permitted by Regulation S-T Rule 101(b)(1): ☐
Indicate by check mark if the registrant is submitting the Form 6-K in paper as permitted by Regulation S-T Rule 101(b)(7): ☐
Indicate by check mark whether the registrant by furnishing the information contained in this Form is also thereby furnishing the information to the Commission pursuant to Rule 12g3-2(b) under the Securities Exchange Act of 1934.
Yes ☐ No ☒
If “Yes” marked, indicate below the file number assigned to the registrant in connection with Rule 12g3-2(b): 82-
In July 2018, Sanofi issued the press releases and the statement attached hereto as Exhibit 99.1 and 99.2 which are incorporated herein by reference.
Exhibit List
| Exhibit No. |
Description | |
| Exhibit 99.1 | Press release dated July 31, 2018: Second-quarter 2018 Performance Positions Sanofi for New Growth Phase | |
| Exhibit 99.2 | Sanofi’s Product Sales Statement, for the Product Sales Measuring Period Ended June 30, 2018 | |
2
Exhibit Index
| Exhibit No. |
Description | |
| Exhibit 99.1 | Press release dated July 31, 2018: Second-quarter 2018 Performance Positions Sanofi for New Growth Phase | |
| Exhibit 99.2 |
Sanofi’s Product Sales Statement, for the Product Sales Measuring Period Ended June 30, 2018 | |
3
SIGNATURES
Pursuant to the requirements of the Securities Exchange Act of 1934, the registrant has duly caused this report to be signed on its behalf by the undersigned, thereunto duly authorized.
| Dated: July 31, 2018 | SANOFI | |||||||
| By | /s/ Alexandra Roger | |||||||
| Name: | Alexandra Roger | |||||||
| Title: | Head of Securities Law and Capital Markets | |||||||
4
Exhibit 99.1

Paris, July 31, 2018
Q2 2018 Performance Positions Sanofi for New Growth Phase
| Q2 2018 | Change | Change at CER |
H1 2018 | Change | Change at CER |
|||||||||||||||||||
| IFRS net sales reported |
€ | 8,176m | -5.7 | % | +0.1 | % | € | 16,074m | -7.2 | % | -0.1 | % | ||||||||||||
| IFRS net income reported |
€ | 762m | -26.2 | % | — | € | 1,778m | -73.6 | %(2) | — | ||||||||||||||
| IFRS EPS reported |
€ | 0.61 | -25.6 | % | — | € | 1.42 | -73.4 | %(2) | — | ||||||||||||||
| Business net income(1) |
€ | 1,558m | -7.9 | % | +0.4 | % | € | 3,156m | -9.4 | % | +0.4 | % | ||||||||||||
| Business EPS(1) |
€ | 1.25 | -6.7 | % | +1.5 | % | € | 2.53 | -8.3 | % | +1.4 | % | ||||||||||||
Second-quarter 2018 sales stable(3) with strong contributions from Specialty Care and Emerging Markets
| • | Net sales were €8,176 million, down 5.7% on a reported basis, up 0.1%(3) at CER and down 2.5% at CER/CS (4). |
| • | Sanofi Genzyme sales up 14.1% at CER/CS (4) (33.1% at CER) driven by Dupixent® and consolidation of Bioverativ. |
| • | Vaccines sales down 15.7% reflecting high basis for comparison and expected Pentaxim® supply constraint in China. |
| • | CHC sales increased 4.1% supported by growth in Europe and Emerging Markets(5). |
| • | DCV(6) GBU sales down 15.6%; global Diabetes franchise sales declined 11.9%, confirming expected trend for year. |
| • | Emerging Markets sales(5) increased 5.2% with double-digit growth in China. |
2018 business EPS guidance range slightly narrowed
| • | Second-quarter 2018 business EPS(1) up 1.5% at CER to €1.25. |
| • | Second-quarter 2018 IFRS EPS was €0.61 (-25.6%). |
| • | Business EPS(1) in 2018 now expected to grow 3% to 5% at CER(7) barring unforeseen major adverse events. |
| • | Currency impact on 2018 business EPS is estimated to be around -6% applying the average July exchange rates. |
Key achievements in sustaining innovation in R&D
| • | Sanofi completed the acquisition of Ablynx in May, internalizing the innovative Nanobody® platform. |
| • | Positive CHMP recommendation for CabliviTM for aTTP(8). |
| • | Phase 1/2a data on BIVV001, an extended factor VIII therapy, demonstrated half-life of 37 hours. |
| • | A phase 2/3 study is being initiated on venglustat, an oral glucosylceramide synthase (GCS) inhibitor, in ADPKD(9). |
| • | Positive phase 3 trial evaluating Dupixent® to treat moderate-to-severe atopic dermatitis in adolescents. |
| • | Priority review granted in the U.S. to cemiplimab for the treatment of CSCC(10). |
| • | ZynquistaTM (sotagliflozin) accepted for review by the FDA in type 1 diabetes. |
| • | Praluent® ODYSSEY OUTCOMES results submitted to the FDA and EMA in Q2. |
Sanofi Chief Executive Officer, Olivier Brandicourt, commented:
“In the second quarter, we achieved significant milestones in building our new Rare Blood Disorder franchise and the successful continued execution of the global roll-out of Dupixent®. As the impact from the U.S. losses of exclusivity peaked in the second quarter, the growth of our diversified businesses largely compensated for these headwinds. We look forward to entering a new growth phase led by our increasing focus on Specialty Care and our leadership positions in Emerging Markets and Vaccines.”
| (1) | In order to facilitate an understanding of operational performance, Sanofi comments on the business net income statement. Business net income is a non-GAAP financial measure (see Appendix 8 for definitions). The consolidated income statement for Q2 2018 is provided in Appendix 3 and a reconciliation of reported IFRS net income to business net income is set forth in Appendix 4; |
| (2) | Excluding Animal Health gain on disposal, first-half IFRS net income was down 22.6% and first-half IFRS EPS was down 22.4%; |
| (3) | Changes in net sales are expressed at constant exchange rates (CER) unless otherwise indicated (see Appendix 10); |
| (4) | Constant Structure: Adjusted for Bioverativ acquisition; |
| (5) | See definition page 8; |
| (6) | DCV: Diabetes and Cardiovascular; |
| (7) | 2017 business EPS was €5.52; |
| (8) | Acquired thrombotic thrombocytopenic purpura; |
| (9) | Autosomal Dominant Polycystic Kidney Disease; |
| (10) | Cutaneous Squamous Cell Carcinoma |
| Investor Relations: (+) 33 1 53 77 45 45 - E-mail: [email protected] - Media Relations: (+) 33 1 53 77 46 46 - E-mail: [email protected] Website: www.sanofi.com Mobile app: SANOFI IR available on the App Store and Google Play |
1
2018 Second-quarter and first-half Sanofi sales
Unless otherwise indicated, all percentage changes in sales in this press release are stated at CER(11).
In the second quarter of 2018, Company sales were €8,176 million, down 5.7% on a reported basis. Exchange rate movements had a negative effect of 5.8 percentage points mainly driven by the movement of the U.S. Dollar accompanied by the Brazilian Real, Argentine Peso, Turkish Lira, Japanese Yen and Russian Ruble. At CER, Company sales increased 0.1%.
First-half Company sales reached €16,074 million, down 7.2% on a reported basis. Exchange rate movements had an unfavorable effect of 7.1 percentage points. At CER, Company sales were down 0.1%.
Global Business Units
The table below presents sales by Global Business Unit (GBU). Please note that Emerging Markets sales for Specialty Care and Diabetes and Cardiovascular are included in the General Medicines and Emerging Markets GBU.
| Net Sales by GBU (€ million) |
Q2 2018 | Change at CER |
H1 2018 | Change at CER |
||||||||||||
| Sanofi Genzyme (Specialty Care)(a) |
1,808 | +33.1 | % | 3,268 | +24.8 | % | ||||||||||
| Diabetes and Cardiovascular(a) |
1,107 | -15.6 | % | 2,195 | -15.6 | % | ||||||||||
| General Medicines & Emerging Markets(b) |
3,335 | -3.7 | % | 6,736 | -2.6 | % | ||||||||||
| Total Pharmaceuticals |
6,250 | +1.9 | % | 12,199 | +0.5 | % | ||||||||||
| Consumer Healthcare (CHC) |
1,115 | +4.1 | % | 2,353 | +3.0 | % | ||||||||||
| Sanofi Pasteur (Vaccines) |
811 | -15.7 | % | 1,522 | -9.3 | % | ||||||||||
| Total net sales |
8,176 | +0.1 | % | 16,074 | -0.1 | % | ||||||||||
| (a) | Does not include Emerging Markets sales- see definition page 8; (b) Includes Emerging Markets sales for Diabetes & Cardiovascular and Specialty Care |
Global Franchises
The tables below present second-quarter and first-half 2018 sales by global franchise, including Emerging Markets sales, to facilitate comparisons. Appendix 1 provides a reconciliation of sales by GBU and franchise.
| Net sales by Franchise (€ million) |
Q2 2018 | Change at CER |
Developed Markets |
Change at CER |
Emerging Markets |
Change at CER |
||||||||||||||||||
| Specialty Care |
2,071 | +29.5 | % | 1,808 | +33.1 | % | 263 | +10.3 | % | |||||||||||||||
| Diabetes and Cardiovascular |
1,511 | -9.4 | % | 1,107 | -15.6 | % | 404 | +12.2 | % | |||||||||||||||
| Established Rx Products |
2,266 | -7.9 | % | 1,301 | -17.3 | % | 965 | +7.8 | % | |||||||||||||||
| Consumer Healthcare (CHC) |
1,115 | +4.1 | % | 723 | +0.8 | % | 392 | +10.1 | % | |||||||||||||||
| Generics |
402 | -1.6 | % | 230 | -6.8 | % | 172 | +5.3 | % | |||||||||||||||
| Vaccines |
811 | -15.7 | % | 482 | -15.9 | % | 329 | -15.5 | % | |||||||||||||||
| Total net sales |
8,176 | +0.1 | % | 5,651 | -2.1 | % | 2,525 | +5.2 | % | |||||||||||||||
| Net sales by Franchise (€ million) |
H1 2018 | Change at CER |
Developed Markets |
Change at CER |
Emerging Markets |
Change at CER |
||||||||||||||||||
| Specialty Care |
3,781 | +23.1 | % | 3,268 | +24.8 | % | 513 | +13.4 | % | |||||||||||||||
| Diabetes and Cardiovascular |
2,995 | -9.0 | % | 2,195 | -15.6 | % | 800 | +15.0 | % | |||||||||||||||
| Established Rx Products |
4,586 | -7.1 | % | 2,628 | -16.7 | % | 1,958 | +8.7 | % | |||||||||||||||
| Consumer Healthcare (CHC) |
2,353 | +3.0 | % | 1,552 | -1.6 | % | 801 | +12.3 | % | |||||||||||||||
| Generics |
837 | -0.3 | % | 486 | -3.7 | % | 351 | +4.1 | % | |||||||||||||||
| Vaccines |
1,522 | -9.3 | % | 953 | -4.2 | % | 569 | -16.7 | % | |||||||||||||||
| Total net sales |
16,074 | -0.1 | % | 11,082 | -3.1 | % | 4,992 | +6.8 | % | |||||||||||||||
| (11) | See Appendix 10 for definitions of financial indicators. |
2
Pharmaceuticals
Second-quarter Pharmaceutical sales were up 1.9% to €6,250 million driven by the Rare Blood Disorder and Immunology franchises which were partially offset by Diabetes and Established Rx Products. First-half sales for Pharmaceuticals increased 0.5% to €12,199 million.
Rare Disease franchise
| Net sales (€ million) | Q2 2018 | Change at CER |
H1 2018 | Change at CER |
||||||||||||
| Myozyme® / Lumizyme® |
209 | +7.8 | % | 405 | +9.4 | % | ||||||||||
| Fabrazyme® |
188 | +6.3 | % | 358 | +6.5 | % | ||||||||||
| Cerezyme® |
181 | +2.6 | % | 356 | +6.2 | % | ||||||||||
|
Aldurazyme® |
52 | -1.8 | % | 103 | +1.8 | % | ||||||||||
|
Cerdelga® |
38 | +32.3 | % | 74 | +29.0 | % | ||||||||||
| Others Rare Disease |
75 | +5.3 | % | 142 | -5.5 | % | ||||||||||
| Total Rare Disease |
743 | +6.1 | % | 1,438 | +6.5 | % | ||||||||||
In the second quarter, Rare Disease sales increased 6.1% to €743 million, driven by Europe (up 6.2% to €256 million), Emerging Markets (up 7.1% to €139 million) and Rest of the World (up 12.0% to €85 million). In the U.S., second-quarter Rare Disease sales grew 3.7% to €263 million. First-half Rare Disease sales increased 6.5% to €1,438 million.
Second-quarter Gaucher (Cerezyme® and Cerdelga®) sales were up 6.7% to €219 million, supported by the increasing penetration of Cerdelga® in Europe and the U.S. and the sustained growth of Cerezyme® in Emerging Markets. Second-quarter Cerdelga® sales increased 32.3% to €38 million, with sales doubling in Europe (€12 million). First-half Gaucher sales were €430 million, up 9.5%.
Second-quarter Myozyme®/Lumizyme® sales grew 7.8% to €209 million, supported by positive trends in naïve patient accruals. Second-quarter Myozyme®/Lumizyme® sales increased 9.2% to €95 million in Europe and 8.8% to €69 million in the U.S., respectively. First-half Myozyme®/Lumizyme® sales increased 9.4% to €405 million.
Second-quarter Fabrazyme® sales grew 6.3% to €188 million. Second-quarter sales in the U.S. and Europe increased 5.2% (to €93 million) and 9.8% (to €45 million), respectively. First-half Fabrazyme® sales were up 6.5% to €358 million.
Multiple Sclerosis franchise
| Net sales (€ million) | Q2 2018 | Change at CER |
H1 2018 | Change at CER |
||||||||||||
| Aubagio® |
404 | +1.2 | % | 775 | +6.0 | % | ||||||||||
| Lemtrada® |
102 | -12.9 | % | 207 | -10.8 | % | ||||||||||
| Total Multiple Sclerosis |
506 | -2.0 | % | 982 | +2.0 | % | ||||||||||
Second-quarter Multiple Sclerosis (MS) sales decreased 2.0% to €506 million, reflecting lower Lemtrada® sales and a high basis of comparison for Aubagio® in Europe. First-half MS sales increased 2.0% to €982 million.
Second-quarter Aubagio® sales increased 1.2% to €404 million, supported by the U.S. performance (up 9.1% to €287 million) which was offset by lower sales in Europe (down 21.1% to €89 million) reflecting the high basis of comparison from clinical trial supply orders of approximately €30 million in the second quarter of 2017. First-half Aubagio® sales increased 6.0% to €775 million.
In the second quarter, Lemtrada® sales decreased 12.9% to €102 million due to lower U.S. sales (down 20.6% to €46 million) reflecting increased competition as well as its unique dosing and durable effect. In Europe, Lemtrada® sales were down 2.1% to €45 million. First-half Lemtrada® sales decreased 10.8% to €207 million.
3
Immunology franchise
| Net sales (€ million) | Q2 2018 | Change at CER |
H1 2018 | Change at CER |
||||||||||||
| Dupixent® |
176 | — | 283 | — | ||||||||||||
| Kevzara® |
20 | — | 30 | — | ||||||||||||
| Total Immunology |
196 | — | 313 | — | ||||||||||||
Dupixent® (collaboration with Regeneron) for the treatment of moderate-to-severe atopic dermatitis in adults generated sales of €176 million in the second quarter compared to €26 million in the second quarter of 2017. In the U.S., Dupixent® was launched in April 2017 and reached sales of €151 million in the second quarter. Demand for the product remains strong with more than 50,000 patients having been prescribed to date and total prescriptions (source: IQVIA weekly TRx data) increasing 27% sequentially in the second quarter. Trade inventory at the end of the second quarter is estimated to have been in the middle of the normal range of three to five weeks. Outside the U.S., Dupixent® was launched in Germany in December 2017 and the Netherlands, Canada, Denmark, Sweden and Japan during the first half of 2018. Second-quarter sales in Europe were €16 million. First-half Dupixent® sales were €283 million compared to €26 million in the first half of 2017.
Kevzara® (collaboration with Regeneron) for rheumatoid arthritis was launched in the U.S. in June 2017, in Germany, the UK, the Netherlands during the second half of last year and in Japan, Belgium, Sweden and Finland in the first half of 2018. Second-quarter Kevzara® sales were €20 million, of which €15 million were generated in the U.S. reflecting improved U.S. commercial coverage. First-half Kevzara® sales were €30 million.
Rare Blood Disorder franchise
| Net sales (€ million) | Q2 2018 | Change at CER |
H1 2018 | Change at CER |
||||||||||||
| Eloctate® |
176 | — | 219 | — | ||||||||||||
| Alprolix® |
81 | — | 102 | — | ||||||||||||
| Total Rare Blood Disorder |
257 | — | 321 | — | ||||||||||||
Bioverativ was consolidated in Sanofi’s Financial Statements from March 9, 2018. Second-quarter sales of the Rare Blood Disorder franchise were €257 million, up 15.5% on a pro forma basis(12) including non U.S. sales of €38 million with Japan as the primary contributor. Eloctate® and Alprolix® were launched in Colombia in the first quarter of 2018. In the first half of 2018, consolidated sales of the Rare Blood Disorder franchise were €321 million, up 18.3% on a pro forma basis(12).
Eloctate®, a recombinant antihemophilic Factor VIII, Fc Fusion Protein, indicated for the treatment of hemophilia A, generated sales of €176 million in the second quarter, up 20.0% on a pro forma basis(12). First-half consolidated Eloctate® sales were €219 million, up 23.3% on a pro forma basis(12).
Alprolix®, a recombinant coagulation Factor IX, Fc Fusion Protein, indicated for the treatment of hemophilia B, generated sales of €81 million in the second quarter, up 6.6% on a pro forma basis(12) despite a delay in government contracting in Canada. First-half consolidated Alprolix® sales were €102 million, up 8.9% on a pro forma basis(12).
Oncology franchise
| Net sales (€ million) | Q2 2018 | Change at CER |
H1 2018 | Change at CER |
||||||||||||
| Jevtana® |
103 | +10.0 | % | 202 | +10.2 | % | ||||||||||
| Thymoglobulin® |
74 | +3.9 | % | 144 | +6.1 | % | ||||||||||
| Eloxatin® |
46 | +4.4 | % | 90 | +5.6 | % | ||||||||||
| Mozobil® |
44 | +15.0 | % | 82 | +10.0 | % | ||||||||||
| Taxotere® |
41 | 0.0 | % | 84 | -1.1 | % | ||||||||||
| Zaltrap® |
24 | +38.9 | % | 46 | +41.2 | % | ||||||||||
| Others |
37 | -31.7 | % | 79 | -44.5 | % | ||||||||||
| Total Oncology |
369 | +2.4 | % | 727 | -1.8 | % | ||||||||||
| (12) | Growth comparing full second-quarter 2018 sales versus full second-quarter 2017 sales, and full first-half 2018 sales versus full first-half 2017 sales at CER. Unaudited data. |
4
Second-quarter Oncology sales increased 2.4% to €369 million. Consistent with the Company’s portfolio prioritization efforts, Sanofi sold Leukine® on January 31, 2018. Excluding Leukine®, oncology second-quarter sales were up 5.1%. First-half Oncology sales were down 1.8% to €727 million and up 4.3% excluding Leukine®.
Jevtana® sales were up 10.0% to €103 million in the second quarter supported by the performance in the U.S. (up 14.6% to €43 million). First-half Jevtana® sales increased 10.2% to €202 million. In the second quarter, Thymoglobulin® and Eloxatin® sales increased 3.9% (to €74 million) and 4.4% (to €46 million), respectively, with growth driven by China. First-half sales of Thymoglobulin® and Eloxatin® increased 6.1% (to €144 million) and 5.6% (to €90 million), respectively.
Diabetes franchise
| Net sales (€ million) | Q2 2018 | Change at CER |
H1 2018 | Change at CER |
||||||||||||
| Lantus® |
891 | -20.6 | % | 1,802 | -19.1 | % | ||||||||||
| Toujeo® |
217 | +7.9 | % | 414 | +10.7 | % | ||||||||||
| Total glargine |
1,108 | -16.2 | % | 2,216 | -14.9 | % | ||||||||||
| Apidra® |
92 | +5.4 | % | 183 | +3.1 | % | ||||||||||
| Amaryl® |
87 | +9.5 | % | 170 | +5.8 | % | ||||||||||
| Insuman® |
23 | -17.2 | % | 47 | -12.5 | % | ||||||||||
| Lyxumia® |
6 | -14.3 | % | 11 | -14.3 | % | ||||||||||
| Soliqua® |
17 | +260.0 | % | 26 | +222.2 | % | ||||||||||
| Total Diabetes |
1,366 | -11.9 | % | 2,722 | -10.9 | % | ||||||||||
In the second quarter, global Diabetes sales decreased 11.9% to €1,366 million, due to lower glargine (Lantus® and Toujeo®) sales in the U.S. Second-quarter U.S. Diabetes sales were down 30.1% to €525 million, reflecting the previously announced changes in coverage of the Part D business and a continued decline in average U.S. glargine net prices. Second-quarter sales in Emerging Markets increased 11.8% to €401 million. Second-quarter sales in Europe increased 0.3% to €325 million, supported by Toujeo® growth. First-half global Diabetes sales decreased 10.9% to €2,722 million.
Second-quarter glargine (Lantus® and Toujeo®) sales decreased 16.2% to €1,108 million. U.S. glargine sales were down 32.2% to €489 million, reflecting the aforementioned changes in coverage in Part D and a continued decline in average U.S. glargine net prices. In Europe, glargine sales increased 0.8% to €249 million due to strong Toujeo® performance, despite biosimilar glargine competition in several European markets. First-half glargine sales decreased 14.9% to €2,216 million.
In the second quarter, Lantus® sales were €891 million, down 20.6%. In the U.S., Lantus® sales decreased 33.9% to €403 million mainly reflecting lower average net price and changes in coverage in Part D. In Europe, second-quarter Lantus® sales were €174 million, down 9.8% due to biosimilar glargine competition and patients switching to Toujeo®. In Emerging Markets, second-quarter Lantus® sales were up 1.1% to €244 million. First-half Lantus® sales decreased 19.1% to €1,802 million.
Second-quarter Toujeo® sales were €217 million, up 7.9%. In the U.S., second-quarter Toujeo® sales were €86 million, down 23.0%. In Europe and Emerging Markets, second-quarter Toujeo® sales were €75 million (up 38.9%) and €37 million (versus €24 million), respectively. First-half Toujeo® sales increased 10.7% to €414 million.
Soliqua® 100/33 (insulin glargine 100 Units/mL & lixisenatide 33 mcg/mL injection) was launched in the U.S. in January 2017 and Suliqua™ was also launched in several European countries in 2017. Second-quarter and first-half Soliqua® 100/33 / Suliqua™ sales were €17 million and €26 million, respectively.
Amaryl® sales were €87 million, up 9.5% in the second quarter, of which €74 million were generated in Emerging Markets (up 11.4%). First-half Amaryl® sales were up 5.8% at €170 million,
Second-quarter Apidra® sales increased 5.4% to €92 million. Lower sales in the U.S. (down 22.2% to €19 million) were offset by strong growth in Emerging Markets (up 29.2% to €27 million). First-half Apidra® sales increased 3.1% to €183 million.
5
Cardiovascular franchise
Second-quarter Praluent® (collaboration with Regeneron) sales increased 54.8% to €62 million, of which €35 million was generated in the U.S. and €22 million in Europe. First-half Praluent® sales increased 55.3% to €111 million. The Company is in active discussions with a number of U.S. payers to simplify utilization management (UM) criteria and improve access for patients in return for greater rebates, consistent with the new commercial policy for Praluent® announced in March. As a result of recent payer agreements, around 30% of Commercial lives now benefit from improved UM criteria. Negotiations with U.S. payers are ongoing with additional contract decisions expected to be finalized in the next few months.
Second-quarter and first-half Multaq® sales were up 7.2% (to €83 million) and down 1.7% (to €162 million), respectively.
Established Rx Products
| Net sales (€ million) | Q2 2018 | Change at CER |
H1 2018 | Change at CER |
||||||||||||
| Lovenox® |
377 | -2.2 | % | 768 | -1.5 | % | ||||||||||
| Plavix® |
374 | +0.3 | % | 761 | +4.6 | % | ||||||||||
| Aprovel®/Avapro® |
171 | -6.3 | % | 343 | -4.7 | % | ||||||||||
| Renvela®/Renagel® |
100 | -57.3 | % | 201 | -55.7 | % | ||||||||||
| Synvisc® /Synvisc-One® |
92 | -13.8 | % | 160 | -14.6 | % | ||||||||||
| Myslee®/Ambien®/Stilnox® |
55 | -7.8 | % | 116 | -8.0 | % | ||||||||||
| Allegra® |
28 | -11.8 | % | 80 | -14.7 | % | ||||||||||
| Other |
1,069 | -1.5 | % | 2,157 | -2.0 | % | ||||||||||
| Total Established Rx Products |
2,266 | -7.9 | % | 4,586 | -7.1 | % | ||||||||||
In the second quarter, Established Rx Products sales decreased 7.9% to €2,266 million. This reflected generic competition to Renvela®/Renagel® (sevelamer) in the U.S., which more than offset growth in Emerging Markets (up 7.8% to €965 million). First-half Established Rx Products sales decreased 7.1% to €4,586 million.
Second-quarter Lovenox® sales decreased 2.2% to €377 million, reflecting increased competition in Europe (down 5.8% to €227 million), which offset the growth in Emerging Markets (up 10.6% to €121 million). Biosimilars are available in the UK, Germany and Italy. First-half Lovenox® sales were down 1.5% to €768 million.
In the second quarter, Plavix® sales were up 0.3% to €374 million reflecting generic competition in Japan (sales down 28.1% to €42 million) offset by strong growth in Emerging Markets (up 7.1% to €278 million) driven by China. First-half Plavix® sales increased 4.6% to €761 million.
Second-quarter Aprovel®/Avapro® sales decreased 6.3% to €171 million, reflecting the strong performance in China offset by the impact of generic competition in Japan. First-half Aprovel®/Avapro® sales decreased 4.7% to €343 million.
Second-quarter Renvela®/Renagel® (sevelamer) sales decreased 57.3% to €100 million, due to generic competition in the U.S. (down 68.9% to €60 million). First-half Renvela®/Renagel® sales decreased 55.7% to €201 million.
Generics
In the second quarter, Generics sales decreased 1.6% to €402 million. Sales in Emerging Markets sales were up 5.3% (to €172 million) and sales in Europe were down 3.2% (to €183 million). In June, Sanofi and Advent International finished negotiations for the acquisition by Advent of Zentiva, Sanofi’s European generics business and the companies signed a Share Purchase Agreement worth €1.9 billion (enterprise value). The transfer of the Zentiva business to Advent is anticipated during the course of the fourth quarter 2018. The transaction remains subject to approval of the regulatory authorities.
6
Consumer Healthcare
CHC sales by geography and category are provided in Appendix 1.
| Net sales (€ million) | Q2 2018 | Change at CER |
H1 2018 | Change at CER |
||||||||||||
| Allergy Cough & Cold |
239 | +2.0 | % | 580 | -4.2 | % | ||||||||||
| of which Allegra® |
99 | +1.9 | % | 229 | +2.0 | % | ||||||||||
| of which Mucosolvan® |
22 | +53.3 | % | 49 | +13.0 | % | ||||||||||
| of which Xyzal® |
7 | — | 21 | -52.9 | % | |||||||||||
| Pain |
304 | +10.4 | % | 628 | +9.6 | % | ||||||||||
| of which Doliprane® |
77 | +6.8 | % | 161 | +4.5 | % | ||||||||||
| of which Buscopan® |
50 | +39.0 | % | 104 | +42.2 | % | ||||||||||
| Digestive |
248 | +8.6 | % | 496 | +11.7 | % | ||||||||||
| of which Dulcolax® |
56 | +3.6 | % | 109 | +12.6 | % | ||||||||||
| of which Enterogermina® |
45 | +16.7 | % | 94 | +14.6 | % | ||||||||||
| of which Essentiale® |
46 | +8.9 | % | 89 | +11.8 | % | ||||||||||
| of which Zantac® |
31 | +10.0 | % | 62 | +21.1 | % | ||||||||||
| Nutritionals |
166 | +0.6 | % | 330 | +2.0 | % | ||||||||||
| Other |
158 | -6.0 | % | 319 | -5.6 | % | ||||||||||
| of which Gold Bond® |
48 | +6.0 | % | 97 | +9.0 | % | ||||||||||
| Total Consumer Healthcare |
1,115 | +4.1 | % | 2,353 | +3.0 | % | ||||||||||
In the second quarter, Consumer Healthcare (CHC) sales increased 4.1% to €1,115 million, led by good growth in Emerging Markets and Europe which more than offset a decline in U.S. sales due the late onset of the allergy season and private label competition. First-half CHC sales increased 3.0% to €2,353 million.
In Europe, second-quarter CHC sales were up 6.6% to €324 million driven by Pain (up 8.9%) and Allergy Cough & Cold (up 11.9%) categories. First-half CHC sales in Europe were stable at €706 million.
In the U.S., second-quarter CHC sales decreased 5.8% to €254 million due to the late onset of the allergy season which impacted sales of Allegra®, Nasacort® and Xyzal®. Nasacort® was additionally impacted by private label competition. In the U.S., first-half CHC sales decreased 5.3% to €541 million.
In Emerging Markets, second-quarter CHC sales increased 10.1% to €392 million driven by double-digit growth of Allergy, Cough and Cold (up 13.9%), Pain (up 19.1%) and Digestive (up 17.6%) categories primarily in Latin America. In the first half, Emerging Markets CHC sales increased 12.3% to €801 million.
Vaccines
| Net sales (€ million) | Q2 2018 | Change at CER |
H1 2018 | Change at CER |
||||||||||||
| Polio/Pertussis/Hib vaccines (incl. Hexaxim® / Hexyon®, Pentacel®, Pentaxim® and Imovax®) |
354 | -20.3 | % | 734 | -12.8 | % | ||||||||||
| Travel and other endemic vaccines |
126 | +15.9 | % | 228 | +9.6 | % | ||||||||||
| Meningitis/Pneumo vaccines (incl. Menactra®) |
116 | -36.4 | % | 205 | -22.1 | % | ||||||||||
| Influenza vaccines (incl. Vaxigrip®, Fluzone HD® & Fluzone®) |
98 | +7.1 | % | 127 | +0.7 | % | ||||||||||
| Adult Booster vaccines (incl. Adacel ®) |
94 | -14.8 | % | 186 | +2.1 | % | ||||||||||
| Other vaccines (including Dengvaxia®) |
23 | -7.7 | % | 42 | -23.3 | % | ||||||||||
| Total Vaccines |
811 | -15.7 | % | 1,522 | -9.3 | % | ||||||||||
Second-quarter Vaccines performance was impacted as expected by the supply constraint of Pentaxim® in China, a high basis of comparison for Menactra® and phasing for the Polio/Pertussis/Hib franchise. Second-quarter Vaccines sales decreased by 15.7% to €811 million reflecting a decline of 15.5% to €329 million in Emerging Markets and a decrease of 25.4% to €265 million in the U.S. As anticipated, first-half Vaccines sales were lower than in the first half of 2017, down 9.3% to €1,522 million. In the second half of 2018, sales of the Vaccines GBU are expected to grow in the mid-single digits, supported by the growth of the Polio/Pertussis/Hib franchise, including the progressive recovery in Pentaxim® supply in China as of the third quarter.
7
In the second quarter, Polio/Pertussis/Hib (PPH) vaccines sales decreased 20.3% to €354 million, reflecting the supply constraint for Pentaxim® in China and impacted by the timing of tender business for Pentaxim® and Hexaxim® in Emerging Markets. In the U.S., PPH vaccines sales decreased 25.0% to €65 million, reflecting inventory fluctuation for Pentacel® and Daptacel®. First-half Polio/Pertussis/Hib vaccines sales decreased 12.8% to €734 million.
Second-quarter Travel and other endemic vaccines sales were €126 million up 15.9% supported by increased demand for Yellow fever and Typhim®. First-half Travel and other endemic vaccines sales were up 9.6% to €228 million.
Second-quarter Menactra® sales decreased 31.5% to €116 million due a high basis for comparison. In the second quarter of the previous year, Menactra® sales benefited from CDC order phasing in the U.S. and a meningitis outbreak in Australia which together accounted for €58 million. First-half Menactra® sales decreased 16.6% to €205 million.
Second-quarter Influenza vaccines sales were up 7.1% to €98 million driven by the Southern Hemisphere flu campaign. First-half Influenza vaccines sales increased 0.7% to €127 million.
Second-quarter Adult Booster vaccines sales decreased 14.8% to €94 million due to lower sales in the U.S. (down 21.1% to €56 million) reflecting timing of orders which are expected to be weighted in the second half of 2018. First-half Adult Booster vaccines sales increased 2.1% to €186 million.
Company sales by geographic region
|
Sanofi sales (€ million)
|
Q2 2018
|
Change
|
H1 2018
|
Change
|
||||||||||||
| United States |
2,479 | -4.4 | % | 4,677 | -6.3 | % | ||||||||||
| Emerging Markets(a) |
2,525 | +5.2 | % | 4,992 | +6.8 | % | ||||||||||
| of which Asia |
993 | +9.0 | % | 1,993 | +9.2 | % | ||||||||||
| of which Latin America |
648 | +4.5 | % | 1,298 | +8.9 | % | ||||||||||
| of which Africa, Middle East |
539 | -7.4 | % | 1,030 | -4.3 | % | ||||||||||
| of which Eurasia(b) |
307 | +17.3 | % | 597 | +14.3 | % | ||||||||||
| Europe(c) |
2,342 | +0.1 | % | 4,758 | +0.3 | % | ||||||||||
| Rest of the World(d) |
830 | -0.7 | % | 1,647 | -2.1 | % | ||||||||||
| of which Japan |
430 | -3.0 | % | 875 | -5.4 | % | ||||||||||
|
Total Sanofi sales
|
|
8,176
|
|
|
+0.1
|
%
|
|
16,074
|
|
|
-0.1
|
%
| ||||
| (a) | World excluding U.S., Canada, Western & Eastern Europe (except Eurasia), Japan, South Korea, Australia, New Zealand and Puerto Rico |
| (b) | Russia, Ukraine, Georgia, Belarus, Armenia and Turkey |
| (c) | Western Europe + Eastern Europe except Eurasia |
| (d) | Japan, South Korea, Canada, Australia, New Zealand, Puerto Rico |
Second-quarter sales in the U.S. decreased 4.4% to €2,479 million, reflecting the good performances of Dupixent® and Aubagio® and consolidation of Eloctate® and Alprolix® sales offset by lower sales in Diabetes (down 30.1%) and Vaccines (down 25.4%) as well as generic competition for sevelamer. In the U.S., first-half sales decreased 6.3% to €4,677 million.
Second-quarter sales in Emerging Markets grew 5.2% to €2,525 million, mainly driven by Established Rx Products (up 7.8%), Diabetes (up 11.8%) and CHC (up 10.1%). In Asia, second-quarter sales were up 9.0% to €993 million, reflecting strong performance in China (up 11.0% to €613 million) despite Pentaxim® local supply constraint. In Latin America, second-quarter sales increased 4.5% to €648 million. Second-quarter sales in Brazil were up 1.1% to €240 million impacted by lower sales in Rare Disease and Diabetes. In Africa and the Middle East region, second-quarter sales were €539 million down 7.4% (down 5.0% excluding Maphar in Morocco in which Sanofi sold a controlling stake at the end of Q2 2017 and therefore is no longer consolidating sales) reflecting lower Vaccines sales in South Africa and Middle East. Second-quarter sales in the Eurasia region increased 17.3% to €307 million, supported by strong growth in Turkey and Russia. Second-quarter sales in Russia were €168 million up 17.2% driven by Pharma and Vaccines. In Emerging Markets, first-half sales increased 6.8% to €4,992 million.
Second-quarter sales in Europe were €2,342 million, up 0.1% mainly driven by Rare Disease (up 6.2%), CHC (up 6.6%) and the roll-out of Dupixent® and Praluent® which offset lower sales in Established Rx Products (down 3.6%) and Multiple Sclerosis (down 15.5%). In Europe, first-half sales increased 0.3% to €4,758 million.
Sales in Japan decreased 3.0% to €430 million in the second quarter, due to lower sales of Plavix® and Aprovel® generic competition. In Japan, first-half sales decreased 5.4% to €875 million.
8
R&D update
| Consult Appendix 6 for full overview of Sanofi’s R&D pipeline |
Regulatory update
Regulatory updates since April 27, 2018 include the following:
| • | In June, the European Medicines Agency’s (EMA) Committee for Medicinal Products for Human Use (CHMP) recommended approval of CabliviTM (caplacizumab) in the European Union for the treatment of adults experiencing an episode of acquired thrombotic thrombocytopenic purpura (aTTP), a rare blood-clotting disorder. CabliviTM was developed by Ablynx, a Sanofi Company. |
| • | In May, ZynquistaTM (sotagliflozin) was accepted for review by the U.S. Food and Drug Administration (FDA) in type 1 diabetes. |
| • | In April, the FDA accepted for priority review the Biologics License Application (BLA) for cemiplimab (collaboration with Regeneron) for the treatment of patients with metastatic cutaneous squamous cell carcinoma (CSCC) or patients with locally advanced CSCC who are not candidates for surgery. |
| • | The results of the ODYSSEY OUTCOMES study, which showed Praluent® (collaboration with Regeneron) significantly reduced the risk of major adverse cardiovascular events in patients who had suffered a recent acute coronary syndrome, were submitted to the FDA and EMA in the second quarter. |
At the end of April 2018, the R&D pipeline contained 87 projects including 40 new molecular entities in clinical development. 36 projects are in phase 3 or have been submitted to the regulatory authorities for approval.
Portfolio update
Phase 3:
| • | In June, positive non-inferiority results of the BRIGHT study comparing Toujeo® to insulin degludec were presented at the American Diabetes Association (ADA). |
| • | In May, Sanofi and Regeneron announced that a pivotal phase 3 trial evaluating Dupixent® to treat moderate-to-severe atopic dermatitis in adolescents (aged 12-17 years) met its primary and key secondary endpoints. The U.S. regulatory submission for patients aged 12-17 years is planned for third quarter 2018. |
| • | Mavacamten (SAR439152/MYK461; partnership with MyoKardia), a myosin inhibitor, moved into phase 3 in obstructive hypertrophic cardiomyopathy (HCM). A phase 2 study in non-obstructive HCM also started. |
| • | A trial evaluating Cerdelga® in pediatric type 1 Gaucher patients switching from ERT was initiated. |
| • | A study evaluating Praluent® (collaboration with Regeneron) in children with heterozygous familial hypercholesterolemia (HeFH) was initiated. |
| • | Sotagliflozin (partnership with Lexicon) moved into phase 3 in patients with worsening heart failure in diabetes. |
| • | A phase 2/3 study evaluating venglustat, an oral glucosylceramide synthase (GCS) inhibitor, in patients at risk of rapidly progressive Autosomal Dominant Polycystic Kidney Disease (ADPKD) is in the process of being initiated. |
| • | A cardiovascular outcome study, AMPLITUDE-O, evaluating efpeglenatide was initiated. |
Phase 2:
| • | ALX-0171, an anti RSV Nanobody®, entered into Sanofi’s portfolio through the acquisition of Ablynx. |
| • | SAR440340, an anti-IL33 monoclonal antibody (partnership with Regeneron), is in the process of being initiated in a phase 2 study in chronic obstructive pulmonary disease (COPD). |
| • | Phase 1/2a data on BIVV001, an extended factor VIII therapy, was presented at the World Federation of Hemophilia (WFH) and demonstrated a half-life of 37 hours. |
| • | Decisions were taken to stop the development of SAR566658, a maytansin-loaded anti CA6 monoclonal antibody, in triple negative breast cancer and a recombinant subunit vaccine against tuberculosis. |
| • | ST-400, a gene editing technology (collaboration between Sangamo and Ablynx), entered phase 2 in beta thalassemia. |
| • | A phase 2 study evaluating dupilumab in grass immunotherapy was initiated. |
.
9
2018 Second-quarter and first-half financial results(13)
Business Net Income(13)
In the second quarter of 2018, Sanofi generated net sales of €8,176 million, a decrease of 5.7% (up 0.1% at CER). First-half sales were €16,074 million, down 7.2% on a reported basis (down 0.1% at CER).
Second-quarter other revenues increased 13.0% (up 21.1% at CER) to €305 million, reflecting the VaxServe sales contribution of non-Sanofi products (€228 million, up 26.7% at CER) and the collaboration revenues from Swedish Orphan Biovitrum AB. First-half other revenues increased 2.7% (up 13.1% at CER) to €533 million of which €397 million were generated by VaxServe (up 20.1% at CER).
Second-quarter Gross Profit decreased 5.1% to €5,830 million (up 0.9% at CER). The gross margin ratio was 71.3% (71.3% at CER) versus 70.8% in the second quarter of 2017. The positive impact of business mix toward Specialty Care as well as the contribution from Bioverativ more than offset the negative impacts from U.S. Diabetes net price evolution and sevelamer generic competition. In the second quarter of 2018, the gross margin ratio of segments were 74.9% for Pharmaceuticals (up 0.1 percentage points), 67.4% for CHC (up 1.4 percentage points) and 55.1% for Vaccines (down 2.8 percentage points). First-half Gross Profit decreased 7.3% to €11,441 million (stable at CER). In the first half of 2018, the gross margin ratio decreased 0.1 percentage point to 71.2% (71.4% at CER) versus the first half of 2017. Sanofi expects its gross margin ratio to be between 70% and 71% at CER in 2018.
Research and Development (R&D) expenses increased 8.6% to €1,475 million in the second quarter of 2018. At CER, R&D expenses increased 13.1%, mainly reflecting the acquisitions of Bioverativ and Ablynx together with the investments in the immuno-oncology and diabetes programs. In 2018, second-quarter R&D expenses also included clinical materials for comparator studies purchased from a third party (which were recorded in R&D expenses); as part of the agreement, the expense (€58 million) was offset by income related to data shared with this same third party on a previously divested product candidate, which was recorded under the “other current operating income net of expenses” line. Excluding the impact of this transaction, second-quarter R&D expenses grew 8.6% at CER. First-half R&D expenses increased 3.3% to €2,755 million (up 8.9% at CER).
Second-quarter selling general and administrative expenses (SG&A) decreased 2.8% to €2,499 million. At CER, SG&A expenses were up 2.7% reflecting consolidation of Bioverativ and Ablynx and investments in immunology, which were partially offset by lower Diabetes expenses in the U.S. In the second quarter, the ratio of SG&A to sales increased 0.9 percentage points to 30.6% compared to the second quarter of 2017. First-half SG&A expenses decreased 4.8% to €4,809 million (up 1.8% at CER). In the first half of 2018, the ratio of SG&A to sales was 0.7 percentage points higher at 29.9% compared to the same period of 2017.
Second-quarter other current operating income net of expenses was €189 million versus €68 million in the second quarter of 2017 and included the share of profit to Regeneron of the monoclonal antibodies Alliance. In the second quarter of 2018, this line also included the Ablynx acquisition-related fees which were more than offset by €123 million of capital gains on disposals of some small products in Latin American and Europe, in line with our portfolio simplification efforts. This line also benefited from the aforementioned data share agreement. First-half other current operating income net of expenses was €158 million versus €102 million in the first half of 2017.
The share of profits from associates was €75 million in the second quarter versus €46 million for the same period of 2017 partly driven by the increased contribution of the share of profits in Regeneron. In the first half, the share of profits from associates was €149 million versus €70 million for the same period of 2017.
In the second quarter, non-controlling interests were -€28 million versus -€30 million in the second quarter of 2017. First-half non-controlling interests were -€58 million versus -€65 million for the same period of 2017.
Second-quarter business operating income decreased 8.9% to €2,092 million. At CER, business operating income decreased 1.0%. The ratio of business operating income to net sales decreased 0.9 percentage points to 25.6% versus the second quarter of 2017. Over the period, the business operating income ratio of segments were 37.5% for Pharmaceuticals (down 0.5 percentage points), 35.6% for CHC (up 8.7 percentage points) and 16.0% for Vaccines (down 9.7 percentage points). First-half business operating income was €4,126 million, down 12.8% (or down 3.8% at CER). In the first half of 2018 the ratio of business operating income to net sales decreased 1.6 percentage point to 25.7%.
Net financial expenses were -€107 million in the second quarter versus -€60 million in the same period of 2017. In the second quarter of 2018, net financial expenses included the cost associated with the Bioverativ and Ablynx acquisitions. First-half net financial expenses were -€105 million versus -€123 million in the first half of 2017.
| (13) | See Appendix 3 for 2018 second-quarter consolidated income statement; see Appendix 10 for definitions of financial indicators, and Appendix 4 for reconciliation of IFRS net income reported to business net income. |
10
The second-quarter effective tax rate was 22.0% compared to 24.5% in the second quarter of 2017, mainly reflecting the net positive impact of the U.S. tax reform and lower tax rates in different countries. First-half effective tax rate was 22.0% compared to 24.5% in the same period of 2017.
Second-quarter business net income(13) decreased 7.9% to €1,558 million and increased 0.4% at CER. The ratio of business net income to net sales decreased 0.4 percentage points to 19.1% versus the second quarter of 2017. First-half 2018 business net income(13) decreased 9.4% to €3,156 million and increased 0.4% at CER. The ratio of business net income to net sales decreased 0.5 percentage points to 19.6% versus the first half of 2017.
In the second quarter of 2018, business earnings per share(13) (EPS) decreased 6.7% to €1.25 on a reported basis and increased 1.5% at CER. The average number of shares outstanding was 1,247.4 million versus 1,258.2 million in the second quarter of 2017.
In the first half of 2018, business earnings per share(13) was €2.53, down 8.3% on a reported basis and up 1.4% at CER. The average number of shares outstanding was 1,247.8 million in the first half of 2018 versus 1,260.3 million in the first half of 2017.
Reconciliation of IFRS net income reported to business net income (see Appendix 4)
In the first half of 2018, the IFRS net income was €1,778 million. The main items excluded from the business net income were:
| • | An amortization charge of €999 million related to fair value remeasurement on intangible assets of acquired companies (primarily Aventis: €145 million, Genzyme: €385 million, Boehringer Ingelheim CHC business: €120 million, Bioverativ: €161 million) and to acquired intangible assets (licenses/products: €65 million). An amortization charge of €541 million related to fair value remeasurement on intangible assets of acquired companies (primarily Aventis: €72 million, Genzyme: €191 million, Boehringer Ingelheim CHC business: €60 million, Bioverativ: €124 million), and to acquired intangible assets (licenses/products: €32 million) was recorded in the second quarter. These items have no cash impact on the Company. |
| • | An impairment of intangible assets of €101 million (of which €98 million in the second quarter) mainly related to Lemtrada® reflecting recent sales trends. This item has no cash impact on the Company. |
| • | A charge of €99 million (of which €69 million in the second quarter) arising from the workdown of inventories of acquired companies (related to Bioverativ) remeasured at fair value due to the application of purchase accounting to acquisitions. This item has no cash impact on the Group. |
| • | Restructuring costs and similar items of €607 million (of which €416 million in the second quarter) mainly related to accelerated depreciation of industrial assets and the U.S. and streamlining initiatives in Europe and Japan. In addition, restructuring costs includes the cost of transfer to Evotec of the early stage infectious diseases R&D portfolio and the Research unit for an amount of €253 million. |
| • | A €475 million tax effect arising from the items listed above, mainly comprising €275 million of deferred taxes generated by amortization and impairments of intangible assets, and €183 million associated with restructuring costs and similar items. The second quarter tax effect was €290 million, including €153 million of deferred taxes on amortization charged against intangible assets and €131 million associated with restructuring costs and similar items (see Appendix 4). |
| • | A €93 million tax effect (of which €27 million in the second quarter) arising mainly from the U.S. tax reform. |
| • | An income of €74 million net of tax (of which €30 million in the second quarter) related to restructuring costs of associates and joint ventures, and expenses arising from the impact of acquisitions on associates and joint ventures. |
| (13) | See Appendix 3 for 2018 second-quarter consolidated income statement; see Appendix 10 for definitions of financial indicators, and Appendix 4 for reconciliation of IFRS net income reported to business net income. |
11
Capital Allocation
In the first half of 2018, net cash generated by operating activities was €1,854 million after capital expenditures of €689 million and an increase in working capital of €1,139 million. This net cash flow funded restructuring costs and similar items (€414 million) and share repurchases (€730 million). Over the period, the dividend paid by Sanofi was €3,773 million and acquisitions and partnerships net of disposals were €12,460 million (including €12,685 million related to Bioverativ and Ablynx). As a consequence, net debt increased from €5,229 million at December 31, 2017, to €21,278 million at June 30, 2018 (amount net of € 7,493 million cash and cash equivalents).
Forward-Looking Statements
This press release contains forward-looking statements as defined in the Private Securities Litigation Reform Act of 1995, as amended. Forward-looking statements are statements that are not historical facts. These statements include projections and estimates and their underlying assumptions, statements regarding plans, objectives, intentions and expectations with respect to future financial results, events, operations, services, product development and potential, and statements regarding future performance. Forward-looking statements are generally identified by the words “expects”, “anticipates”, “believes”, “intends”, “estimates”, “plans” and similar expressions. Although Sanofi’s management believes that the expectations reflected in such forward-looking statements are reasonable, investors are cautioned that forward-looking information and statements are subject to various risks and uncertainties, many of which are difficult to predict and generally beyond the control of Sanofi, that could cause actual results and developments to differ materially from those expressed in, or implied or projected by, the forward-looking information and statements. These risks and uncertainties include among other things, the uncertainties inherent in research and development, future clinical data and analysis, including post marketing, decisions by regulatory authorities, such as the FDA or the EMA, regarding whether and when to approve any drug, device or biological application that may be filed for any such product candidates as well as their decisions regarding labelling and other matters that could affect the availability or commercial potential of such product candidates, the absence of guarantee that the product candidates if approved will be commercially successful, the future approval and commercial success of therapeutic alternatives, Sanofi’s ability to benefit from external growth opportunities, to complete related transactions, and/or obtain regulatory clearances, risks associated with intellectual property and any related pending or future litigation and the ultimate outcome of such litigation, trends in exchange rates and prevailing interest rates, volatile economic conditions, the impact of cost containment initiatives and subsequent changes thereto, the average number of shares outstanding as well as those discussed or identified in the public filings with the SEC and the AMF made by Sanofi, including those listed under “Risk Factors” and “Cautionary Statement Regarding Forward-Looking Statements” in Sanofi’s annual report on Form 20-F for the year ended December 31, 2017. Other than as required by applicable law, Sanofi does not undertake any obligation to update or revise any forward-looking information or statements.
Appendices
List of appendices
| Appendix 1: | 2018 second-quarter and first-half net sales by GBU, franchise, geographic region and product | |
| Appendix 2: | 2018 second-quarter and first-half Business net income statement | |
| Appendix 3: | 2018 second-quarter and first-half Consolidated income statement | |
| Appendix 4: | Reconciliation of IFRS net income reported to business net income | |
| Appendix 5:
Appendix 6:
Appendix 7:
Appendix 8:
Appendix 9: |
Change in net debt
Simplified consolidated balance sheet
Currency sensitivity
R&D pipeline
Expected R&D milestones | |
| Appendix 10: | Definitions of non-GAAP financial indicators | |
12
Appendix 1: 2018 second-quarter net sales by GBU, franchise, geographic region and product
| Q2 2018
|
Total
|
% CER
|
%
|
Europe
|
% CER
|
United
|
% CER
|
Rest of the World |
% CER
|
Emerging
|
% CER
|
Total
|
% CER
|
%
|
||||||||||||||||||||||||||||||||||||||||||||||||||||||||||||||
| Aubagio |
391 | 0.2 | % | -5.6 | % | 89 | -21.1 | % | 287 | 9.1 | % | 15 | -6.7 | % | 13 | 36.4 | % | 404 | 1.2 | % | -4.9 | % | ||||||||||||||||||||||||||||||||||||||||||||||||||||||
| Lemtrada |
95 | -16.1 | % | -19.5 | % | 45 | -2.1 | % | 46 | -20.6 | % | 4 | -62.5 | % | 7 | 50.0 | % | 102 | -12.9 | % | -17.7 | % | ||||||||||||||||||||||||||||||||||||||||||||||||||||||
|
Total Multiple Sclerosis |
486 | -3.4 | % | -8.6 | % | 134 | -15.5 | % | 333 | 3.7 | % | 19 | -26.1 | % | 20 | 41.2 | % | 506 | -2.0 | % | -7.8 | % | ||||||||||||||||||||||||||||||||||||||||||||||||||||||
| Cerezyme |
120 | -3.9 | % | -7.0 | % | 68 | -2.8 | % | 42 | -2.2 | % | 10 | -16.7 | % | 61 | 15.4 | % | 181 | 2.6 | % | -6.7 | % | ||||||||||||||||||||||||||||||||||||||||||||||||||||||
| Cerdelga |
37 | 29.0 | % | 19.4 | % | 12 | 100.0 | % | 23 | 13.0 | % | 2 | 0.0 | % | 1 | — | 38 | 32.3 | % | 22.6 | % | |||||||||||||||||||||||||||||||||||||||||||||||||||||||
| Myozyme |
179 | 9.4 | % | 4.7 | % | 95 | 9.2 | % | 69 | 8.8 | % | 15 | 12.5 | % | 30 | 0.0 | % | 209 | 7.8 | % | 2.5 | % | ||||||||||||||||||||||||||||||||||||||||||||||||||||||
| Fabrazyme |
168 | 7.2 | % | 1.2 | % | 45 | 9.8 | % | 93 | 5.2 | % | 30 | 10.3 | % | 20 | 0.0 | % | 188 | 6.3 | % | -1.1 | % | ||||||||||||||||||||||||||||||||||||||||||||||||||||||
| Aldurazyme |
37 | 2.7 | % | 0.0 | % | 19 | 0.0 | % | 11 | 9.1 | % | 7 | 0.0 | % | 15 | -10.0 | % | 52 | -1.8 | % | -8.8 | % | ||||||||||||||||||||||||||||||||||||||||||||||||||||||
|
Total Rare Disease |
604 | 5.9 | % | 1.0 | % | 256 | 6.2 | % | 263 | 3.7 | % | 85 | 12.0 | % | 139 | 7.1 | % | 743 | 6.1 | % | -1.2 | % | ||||||||||||||||||||||||||||||||||||||||||||||||||||||
| Taxotere |
9 | -10.0 | % | -10.0 | % | 1 | 0.0 | % | 1 | — | 7 | -11.1 | % | 32 | 3.0 | % | 41 | 0.0 | % | -4.7 | % | |||||||||||||||||||||||||||||||||||||||||||||||||||||||
| Jevtana |
97 | 10.8 | % | 4.3 | % | 38 | 0.0 | % | 43 | 14.6 | % | 16 | 28.6 | % | 6 | 0.0 | % | 103 | 10.0 | % | 3.0 | % | ||||||||||||||||||||||||||||||||||||||||||||||||||||||
| Eloxatine |
9 | 0.0 | % | 0.0 | % | 0 | — | 0 | — | 9 | 0.0 | % | 37 | 5.6 | % | 46 | 4.4 | % | 2.2 | % | ||||||||||||||||||||||||||||||||||||||||||||||||||||||||
| Thymoglobulin |
56 | 0.0 | % | -5.1 | % | 10 | 0.0 | % | 41 | 0.0 | % | 5 | 0.0 | % | 18 | 17.6 | % | 74 | 3.9 | % | -2.6 | % | ||||||||||||||||||||||||||||||||||||||||||||||||||||||
| Mozobil |
41 | 12.8 | % | 5.1 | % | 12 | 9.1 | % | 24 | 8.3 | % | 5 | 50.0 | % | 3 | 100.0 | % | 44 | 15.0 | % | 10.0 | % | ||||||||||||||||||||||||||||||||||||||||||||||||||||||
| Zaltrap |
21 | 40.0 | % | 40.0 | % | 13 | 0.0 | % | 2 | 50.0 | % | 6 | — | 3 | 33.3 | % | 24 | 38.9 | % | 33.3 | % | |||||||||||||||||||||||||||||||||||||||||||||||||||||||
|
Total Oncology |
266 | 0.0 | % | -5.3 | % | 87 | 1.2 | % | 126 | -6.1 | % | 53 | 17.0 | % | 103 | 8.9 | % | 369 | 2.4 | % | -3.4 | % | ||||||||||||||||||||||||||||||||||||||||||||||||||||||
| Dupixent |
175 | 619.2 | % | 573.1 | % | 16 | — | 151 | 526.9 | % | 8 | — | 1 | — | 176 | 623.1 | % | 576.9 | % | |||||||||||||||||||||||||||||||||||||||||||||||||||||||||
| Kevzara |
20 | 2,100.0 | % | 1,900.0 | % | 3 | — | 15 | 1,600.0 | % | 2 | — | 0 | — | 20 | 2,100.0 | % | 1,900.0 | % | |||||||||||||||||||||||||||||||||||||||||||||||||||||||||
|
Total Immunology |
195 | 674.1 | % | 622.2 | % | 19 | — | 166 | 566.7 | % | 10 | — | 1 | — | 196 | 677.8 | % | 625.9 | % | |||||||||||||||||||||||||||||||||||||||||||||||||||||||||
| Alprolix |
81 | — | — | 0 | — | 67 | — | 14 | — | 0 | — | 81 | — | — | ||||||||||||||||||||||||||||||||||||||||||||||||||||||||||||||
| Eloctate |
176 | — | — | 0 | — | 152 | — | 24 | — | 0 | — | 176 | — | — | ||||||||||||||||||||||||||||||||||||||||||||||||||||||||||||||
|
Total Rare blood disorders |
257 | — | — | 0 | — | 219 | — | 38 | — | 0 | — | 257 | — | — | ||||||||||||||||||||||||||||||||||||||||||||||||||||||||||||||
| Sanofi Genzyme (Specialty Care) |
1,808 | 33.1 | % | 25.7 | % | 496 | 2.0 | % | 1,107 | 50.9 | % | 205 | 39.9 | % | 263 | 10.3 | % | 2,071 | 29.5 | % | 21.1 | % | ||||||||||||||||||||||||||||||||||||||||||||||||||||||
| Lantus |
647 | -26.7 | % | -30.7 | % | 174 | -9.8 | % | 403 | -33.9 | % | 70 | -7.6 | % | 244 | 1.1 | % | 891 | -20.6 | % | -25.5 | % | ||||||||||||||||||||||||||||||||||||||||||||||||||||||
| Toujeo |
180 | -0.5 | % | -5.3 | % | 75 | 38.9 | % | 86 | -23.0 | % | 19 | 42.9 | % | 37 | 75.0 | % | 217 | 7.9 | % | 1.4 | % | ||||||||||||||||||||||||||||||||||||||||||||||||||||||
| Apidra |
65 | -2.9 | % | -5.8 | % | 35 | 9.4 | % | 19 | -22.2 | % | 11 | 10.0 | % | 27 | 29.2 | % | 92 | 5.4 | % | -1.1 | % | ||||||||||||||||||||||||||||||||||||||||||||||||||||||
| Amaryl |
13 | 0.0 | % | -7.1 | % | 4 | -33.3 | % | 1 | — | 8 | 12.5 | % | 74 | 11.4 | % | 87 | 9.5 | % | 3.6 | % | |||||||||||||||||||||||||||||||||||||||||||||||||||||||
| Insuman |
18 | -14.3 | % | -14.3 | % | 18 | -10.0 | % | 1 | — | -1 | -100.0 | % | 5 | -25.0 | % | 23 | -17.2 | % | -20.7 | % | |||||||||||||||||||||||||||||||||||||||||||||||||||||||
| Soliqua / Suliqua |
16 | 240.0 | % | 220.0 | % | 2 | — | 14 | 220.0 | % | 0 | — | 1 | — | 17 | 260.0 | % | 240.0 | % | |||||||||||||||||||||||||||||||||||||||||||||||||||||||||
|
Total Diabetes |
965 | -19.2 | % | -23.4 | % | 325 | 0.3 | % | 525 | -30.1 | % | 115 | 1.7 | % | 401 | 11.8 | % | 1,366 | -11.9 | % | -17.2 | % | ||||||||||||||||||||||||||||||||||||||||||||||||||||||
| Multaq |
82 | 7.4 | % | 1.2 | % | 10 | -9.1 | % | 69 | 5.6 | % | 3 | -300.0 | % | 1 | 0.0 | % | 83 | 7.2 | % | 0.0 | % | ||||||||||||||||||||||||||||||||||||||||||||||||||||||
| Praluent |
60 | 51.2 | % | 46.3 | % | 22 | 100.0 | % | 35 | 27.6 | % | 3 | 200.0 | % | 2 | 200.0 | % | 62 | 54.8 | % | 47.6 | % | ||||||||||||||||||||||||||||||||||||||||||||||||||||||
|
Total Cardiovascular |
142 | 22.1 | % | 16.4 | % | 32 | 45.5 | % | 104 | 12.0 | % | 6 | — | 3 | 66.7 | % | 145 | 23.2 | % | 16.0 | % | |||||||||||||||||||||||||||||||||||||||||||||||||||||||
|
Diabetes & Cardiovascular |
1,107 | -15.6 | % | -19.8 | % | 357 | 3.2 | % | 629 | -25.5 | % | 121 | 5.8 | % | 404 | 12.2 | % | 1,511 | -9.4 | % | -14.9 | % | ||||||||||||||||||||||||||||||||||||||||||||||||||||||
| Plavix |
374 | 0.3 | % | -2.6 | % | 38 | -2.6 | % | 0 | — | 58 | -21.5 | % | 278 | 7.1 | % | 374 | 0.3 | % | -2.6 | % | |||||||||||||||||||||||||||||||||||||||||||||||||||||||
| Lovenox |
377 | -2.2 | % | -6.5 | % | 227 | -5.8 | % | 8 | -42.9 | % | 21 | -8.7 | % | 121 | 10.6 | % | 377 | -2.2 | % | -6.5 | % | ||||||||||||||||||||||||||||||||||||||||||||||||||||||
| Renagel / Renvela |
100 | -57.3 | % | -59.7 | % | 16 | -15.8 | % | 60 | -68.9 | % | 6 | -30.0 | % | 18 | 80.0 | % | 100 | -57.3 | % | -59.7 | % | ||||||||||||||||||||||||||||||||||||||||||||||||||||||
| Aprovel |
171 | -6.3 | % | -10.0 | % | 27 | -6.9 | % | 3 | -33.3 | % | 21 | -48.9 | % | 120 | 12.6 | % | 171 | -6.3 | % | -10.0 | % | ||||||||||||||||||||||||||||||||||||||||||||||||||||||
| Allegra |
28 | -11.8 | % | -17.6 | % | 3 | -25.0 | % | 0 | — | 25 | -10.0 | % | 0 | — | 28 | -11.8 | % | -17.6 | % | ||||||||||||||||||||||||||||||||||||||||||||||||||||||||
| Myslee / Ambien / Stilnox |
55 | -7.8 | % | -14.1 | % | 9 | -10.0 | % | 12 | -7.7 | % | 20 | -17.9 | % | 14 | 15.4 | % | 55 | -7.8 | % | -14.1 | % | ||||||||||||||||||||||||||||||||||||||||||||||||||||||
| Synvisc / Synvisc One |
92 | -13.8 | % | -20.7 | % | 7 | -22.2 | % | 66 | -22.0 | % | 3 | 0.0 | % | 16 | 50.0 | % | 92 | -13.8 | % | -20.7 | % | ||||||||||||||||||||||||||||||||||||||||||||||||||||||
| Depakine |
116 | 9.0 | % | 4.5 | % | 42 | 4.9 | % | 0 | — | 4 | 0.0 | % | 70 | 12.1 | % | 116 | 9.0 | % | 4.5 | % | |||||||||||||||||||||||||||||||||||||||||||||||||||||||
| Tritace |
58 | -1.6 | % | -6.5 | % | 37 | -5.1 | % | 0 | — | 1 | 100.0 | % | 20 | 0.0 | % | 58 | -1.6 | % | -6.5 | % | |||||||||||||||||||||||||||||||||||||||||||||||||||||||
| Other Rx Drugs |
895 | -2.7 | % | -7.0 | % | 442 | -1.8 | % | 50 | -7.3 | % | 95 | -16.5 | % | 308 | 1.5 | % | 895 | -2.7 | % | -7.0 | % | ||||||||||||||||||||||||||||||||||||||||||||||||||||||
|
Total Established Rx Products |
2,266 | -7.9 | % | -12.0 | % | 848 | -3.6 | % | 199 | -45.7 | % | 254 | -20.8 | % | 965 | 7.8 | % | 2,266 | -7.9 | % | -12.0 | % | ||||||||||||||||||||||||||||||||||||||||||||||||||||||
|
Generics |
402 | -1.6 | % | -8.6 | % | 183 | -3.2 | % | 25 | -15.6 | % | 22 | -19.4 | % | 172 | 5.3 | % | 402 | -1.6 | % | -8.6 | % | ||||||||||||||||||||||||||||||||||||||||||||||||||||||
|
Total Emerging Markets Specialty Care |
263 | 10.3 | % | -3.3 | % | 263 | 10.3 | % | ||||||||||||||||||||||||||||||||||||||||||||||||||||||||||||||||||||
|
Total Emerging Markets Diabetes & Cardiovascular |
404 | 12.2 | % | 2.5 | % | 404 | 12.2 | % | ||||||||||||||||||||||||||||||||||||||||||||||||||||||||||||||||||||
| General Medicines & Emerging Markets |
3,335 | -3.7 | % | -9.4 | % | 1,031 | -3.5 | % | 224 | -43.4 | % | 276 | -20.7 | % | 1,804 | 8.9 | % | |||||||||||||||||||||||||||||||||||||||||||||||||||||||||||
| Total Pharmaceuticals |
6,250 | 1.9 | % | -3.8 | % | 1,884 | -0.9 | % | 1,960 | -0.4 | % | 602 | -1.4 | % | 1,804 | 8.9 | % | 6,250 | 1.9 | % | -3.8 | % | ||||||||||||||||||||||||||||||||||||||||||||||||||||||
| Allergy, Cough and Cold |
239 | 2.0 | % | -5.2 | % | 67 | 11.9 | % | 68 | -17.0 | % | 24 | 7.7 | % | 80 | 13.9 | % | 239 | 2.0 | % | -5.2 | % | ||||||||||||||||||||||||||||||||||||||||||||||||||||||
| Pain |
304 | 10.4 | % | 1.7 | % | 122 | 8.9 | % | 41 | -2.2 | % | 30 | 3.2 | % | 111 | 19.1 | % | 304 | 10.4 | % | 1.7 | % | ||||||||||||||||||||||||||||||||||||||||||||||||||||||
| Digestive |
248 | 8.6 | % | 1.6 | % | 79 | 3.9 | % | 47 | 2.0 | % | 14 | -6.3 | % | 108 | 17.6 | % | 248 | 8.6 | % | 1.6 | % | ||||||||||||||||||||||||||||||||||||||||||||||||||||||
| Nutritional |
166 | 0.6 | % | -6.7 | % | 29 | 0.0 | % | 9 | -18.2 | % | 65 | 4.5 | % | 63 | 0.0 | % | 166 | 0.6 | % | -6.7 | % | ||||||||||||||||||||||||||||||||||||||||||||||||||||||
| Consumer Healthcare |
1,115 | 4.1 | % | -3.5 | % | 324 | 6.6 | % | 254 | -5.8 | % | 145 | 2.0 | % | 392 | 10.1 | % | 1,115 | 4.1 | % | -3.5 | % | ||||||||||||||||||||||||||||||||||||||||||||||||||||||
| Polio / Pertussis / Hib |
354 | -20.3 | % | -24.5 | % | 68 | -16.9 | % | 65 | -25.0 | % | 40 | 10.3 | % | 181 | -24.3 | % | 354 | -20.3 | % | -24.5 | % | ||||||||||||||||||||||||||||||||||||||||||||||||||||||
| Adult Booster Vaccines |
94 | -14.8 | % | -18.3 | % | 29 | 0.0 | % | 56 | -21.1 | % | 6 | 0.0 | % | 3 | -20.0 | % | 94 | -14.8 | % | -18.3 | % | ||||||||||||||||||||||||||||||||||||||||||||||||||||||
| Meningitis/Pneumonia |
116 | -36.4 | % | -40.5 | % | 0 | — | 90 | -35.1 | % | 3 | -85.0 | % | 23 | -7.4 | % | 116 | -36.4 | % | -40.5 | % | |||||||||||||||||||||||||||||||||||||||||||||||||||||||
| Influenza Vaccines |
98 | 7.1 | % | 0.0 | % | 0 | — | 0 | — | 19 | 133.3 | % | 79 | -5.6 | % | 98 | 7.1 | % | 0.0 | % | ||||||||||||||||||||||||||||||||||||||||||||||||||||||||
| Travel And Other Endemic Vaccines |
126 | 15.9 | % | 11.5 | % | 32 | 52.4 | % | 40 | 0.0 | % | 13 | -7.1 | % | 41 | 22.2 | % | 126 | 15.9 | % | 11.5 | % | ||||||||||||||||||||||||||||||||||||||||||||||||||||||
| Dengue |
0 | -100.0 | % | -100.0 | % | 0 | — | 0 | — | 0 | — | 0 | -100.0 | % | 0 | -100.0 | % | -100.0 | % | |||||||||||||||||||||||||||||||||||||||||||||||||||||||||
|
Vaccines |
811 | -15.7 | % | -20.2 | % | 134 | 0.0 | % | 265 | -25.4 | % | 83 | 0.0 | % | 329 | -15.5 | % | 811 | -15.7 | % | -20.2 | % | ||||||||||||||||||||||||||||||||||||||||||||||||||||||
| Total Company |
8,176 | 0.1 | % | -5.7 | % | 2,342 | 0.1 | % | 2,479 | -4.4 | % | 830 | -0.7 | % | 2,525 | 5.2 | % | 8,176 | 0.1 | % | -5.7 | % | ||||||||||||||||||||||||||||||||||||||||||||||||||||||
13
2018 first-half net sales by GBU, franchise, geographic region and product
| H1 2018
|
Total
|
% CER
|
%
|
Europe
|
% CER
|
United
|
% CER
|
Rest of
|
% CER
|
Emerging
|
% CER
|
Total
|
% CER
|
%
|
||||||||||||||||||||||||||||||||||||||||||||||||||||||||||||||
| Aubagio |
750 | 4.9 | % | -3.5 | % | 184 | -9.8 | % | 541 | 11.0 | % | 25 | -7.1 | % | 25 | 52.6 | % | 775 | 6.0 | % | -2.6 | % | ||||||||||||||||||||||||||||||||||||||||||||||||||||||
| Lemtrada |
195 | -13.0 | % | -18.1 | % | 92 | 1.1 | % | 93 | -19.2 | % | 10 | -43.8 | % | 12 | 36.4 | % | 207 | -10.8 | % | -16.9 | % | ||||||||||||||||||||||||||||||||||||||||||||||||||||||
| Total Multiple Sclerosis | 945 | 0.7 | % | -6.9 | % | 276 | -6.4 | % | 634 | 5.2 | % | 35 | -20.5 | % | 37 | 46.7 | % | 982 | 2.0 | % | -6.0 | % | ||||||||||||||||||||||||||||||||||||||||||||||||||||||
| Cerezyme |
236 | -2.4 | % | -7.1 | % | 134 | -2.9 | % | 83 | 1.1 | % | 19 | -13.0 | % | 120 | 25.0 | % | 356 | 6.2 | % | -3.8 | % | ||||||||||||||||||||||||||||||||||||||||||||||||||||||
| Cerdelga |
73 | 27.4 | % | 17.7 | % | 22 | 100.0 | % | 47 | 10.4 | % | 4 | 33.3 | % | 1 | — | 74 | 29.0 | % | 19.4 | % | |||||||||||||||||||||||||||||||||||||||||||||||||||||||
| Myozyme |
349 | 10.2 | % | 4.5 | % | 188 | 11.8 | % | 133 | 9.6 | % | 28 | 3.3 | % | 56 | 5.0 | % | 405 | 9.4 | % | 2.8 | % | ||||||||||||||||||||||||||||||||||||||||||||||||||||||
| Fabrazyme |
320 | 6.8 | % | -1.2 | % | 87 | 7.4 | % | 179 | 5.8 | % | 54 | 9.3 | % | 38 | 4.7 | % | 358 | 6.5 | % | -2.5 | % | ||||||||||||||||||||||||||||||||||||||||||||||||||||||
| Aldurazyme |
71 | 2.8 | % | -1.4 | % | 38 | 0.0 | % | 21 | 9.1 | % | 12 | 0.0 | % | 32 | 0.0 | % | 103 | 1.8 | % | -6.4 | % | ||||||||||||||||||||||||||||||||||||||||||||||||||||||
|
Total Rare Disease |
1,170 | 4.9 | % | -1.4 | % | 502 | 6.8 | % | 509 | 3.5 | % | 159 | 4.2 | % | 268 | 13.3 | % | 1,438 | 6.5 | % | -1.9 | % | ||||||||||||||||||||||||||||||||||||||||||||||||||||||
| Taxotere |
17 | -15.0 | % | -15.0 | % | 2 | 0.0 | % | 1 | 0.0 | % | 14 | -17.6 | % | 67 | 2.9 | % | 84 | -1.1 | % | -6.7 | % | ||||||||||||||||||||||||||||||||||||||||||||||||||||||
| Jevtana |
191 | 12.1 | % | 4.9 | % | 78 | 4.0 | % | 84 | 16.0 | % | 29 | 23.1 | % | 11 | -13.3 | % | 202 | 10.2 | % | 2.5 | % | ||||||||||||||||||||||||||||||||||||||||||||||||||||||
| Eloxatine |
16 | 0.0 | % | -5.9 | % | 1 | -50.0 | % | 0 | — | 15 | 6.7 | % | 74 | 6.8 | % | 90 | 5.6 | % | 0.0 | % | |||||||||||||||||||||||||||||||||||||||||||||||||||||||
| Thymoglobulin |
107 | 0.9 | % | -7.8 | % | 19 | -5.0 | % | 78 | 2.4 | % | 10 | 0.0 | % | 37 | 25.0 | % | 144 | 6.1 | % | -2.7 | % | ||||||||||||||||||||||||||||||||||||||||||||||||||||||
| Mozobil |
77 | 7.8 | % | 0.0 | % | 24 | 9.1 | % | 45 | 2.0 | % | 8 | 50.0 | % | 5 | 66.7 | % | 82 | 10.0 | % | 2.5 | % | ||||||||||||||||||||||||||||||||||||||||||||||||||||||
|
Total Oncology |
520 | -5.3 | % | -11.6 | % | 176 | 1.1 | % | 248 | -15.2 | % | 96 | 20.0 | % | 207 | 8.3 | % | 727 | -1.8 | % | -8.4 | % | ||||||||||||||||||||||||||||||||||||||||||||||||||||||
| Dupixent |
282 | 1,088.5 | % | 984.6 | % | 26 | — | 246 | 950.0 | % | 10 | — | 1 | — | 283 | 1,092.3 | % | 988.5 | % | |||||||||||||||||||||||||||||||||||||||||||||||||||||||||
| Kevzara |
30 | 3,200.0 | % | 2,900.0 | % | 5 | — | 23 | 2,500.0 | % | 2 | — | 0 | — | 30 | 3,200.0 | % | 2,900.0 | % | |||||||||||||||||||||||||||||||||||||||||||||||||||||||||
|
Total Immunology |
312 | 1,166.7 | % | 1,055.6 | % | 31 | — | 269 | 1,007.4 | % | 12 | — | 1 | — | 313 | 1,170.4 | % | 1,059.3 | % | |||||||||||||||||||||||||||||||||||||||||||||||||||||||||
| Alprolix |
102 | — | — | 0 | — | 83 | — | 19 | — | 0 | — | 102 | — | — | ||||||||||||||||||||||||||||||||||||||||||||||||||||||||||||||
| Eloctate |
219 | — | — | 0 | — | 187 | — | 32 | — | 0 | — | 219 | — | — | ||||||||||||||||||||||||||||||||||||||||||||||||||||||||||||||
|
Total Rare blood disorders |
321 | — | — | 0 | — | 270 | — | 51 | — | 0 | — | 321 | — | — | ||||||||||||||||||||||||||||||||||||||||||||||||||||||||||||||
| Sanofi Genzyme (Specialty Care) |
3,268 | 24.8 | % | 16.0 | % | 985 | 4.9 | % | 1,930 | 36.3 | % | 353 | 27.7 | % | 513 | 13.4 | % | 3,781 | 23.1 | % | 13.5 | % | ||||||||||||||||||||||||||||||||||||||||||||||||||||||
| Lantus |
1,310 | -25.6 | % | -31.3 | % | 355 | -9.4 | % | 816 | -32.4 | % | 139 | -7.9 | % | 492 | 4.8 | % | 1,802 | -19.1 | % | -25.7 | % | ||||||||||||||||||||||||||||||||||||||||||||||||||||||
| Toujeo |
349 | 1.6 | % | -4.6 | % | 142 | 42.0 | % | 171 | -19.0 | % | 36 | 31.0 | % | 65 | 100.0 | % | 414 | 10.7 | % | 2.7 | % | ||||||||||||||||||||||||||||||||||||||||||||||||||||||
| Apidra |
129 | -5.6 | % | -9.8 | % | 70 | 4.5 | % | 40 | -19.6 | % | 19 | 0.0 | % | 54 | 29.2 | % | 183 | 3.1 | % | -4.2 | % | ||||||||||||||||||||||||||||||||||||||||||||||||||||||
| Amaryl |
24 | -16.1 | % | -22.6 | % | 8 | -27.3 | % | 1 | 0.0 | % | 15 | -10.5 | % | 146 | 10.6 | % | 170 | 5.8 | % | -1.7 | % | ||||||||||||||||||||||||||||||||||||||||||||||||||||||
| Soliqua / Suliqua |
25 | 211.1 | % | 177.8 | % | 2 | — | 23 | 188.9 | % | 0 | — | 1 | — | 26 | 222.2 | % | 188.9 | % | |||||||||||||||||||||||||||||||||||||||||||||||||||||||||
|
Total Diabetes |
1,929 | -18.6 | % | -24.4 | % | 648 | -0.3 | % | 1,059 | -28.3 | % | 222 | -1.6 | % | 793 | 14.7 | % | 2,722 | -10.9 | % | -17.8 | % | ||||||||||||||||||||||||||||||||||||||||||||||||||||||
| Multaq |
159 | -1.7 | % | -10.2 | % | 21 | -4.5 | % | 135 | -1.9 | % | 3 | 100.0 | % | 3 | 0.0 | % | 162 | -1.7 | % | -10.5 | % | ||||||||||||||||||||||||||||||||||||||||||||||||||||||
| Praluent |
107 | 52.7 | % | 44.6 | % | 41 | 115.8 | % | 61 | 26.4 | % | 5 | 150.0 | % | 4 | 150.0 | % | 111 | 55.3 | % | 46.1 | % | ||||||||||||||||||||||||||||||||||||||||||||||||||||||
|
Total Cardiovascular |
266 | 14.3 | % | 6.0 | % | 62 | 51.2 | % | 196 | 5.3 | % | 8 | 133.3 | % | 7 | 50.0 | % | 273 | 15.2 | % | 6.2 | % | ||||||||||||||||||||||||||||||||||||||||||||||||||||||
|
Diabetes & Cardiovascular |
2,195 | -15.6 | % | -21.6 | % | 710 | 2.7 | % | 1,255 | -24.6 | % | 230 | 0.0 | % | 800 | 15.0 | % | 2,995 | -9.0 | % | -16.1 | % | ||||||||||||||||||||||||||||||||||||||||||||||||||||||
| Plavix |
761 | 4.6 | % | -0.4 | % | 76 | -2.6 | % | 0 | — | 110 | -25.3 | % | 575 | 14.6 | % | 761 | 4.6 | % | -0.4 | % | |||||||||||||||||||||||||||||||||||||||||||||||||||||||
| Lovenox |
768 | -1.5 | % | -6.0 | % | 471 | -5.4 | % | 20 | -24.1 | % | 41 | -4.3 | % | 236 | 9.9 | % | 768 | -1.5 | % | -6.0 | % | ||||||||||||||||||||||||||||||||||||||||||||||||||||||
| Renagel / Renvela |
201 | -55.7 | % | -59.3 | % | 32 | -13.5 | % | 121 | -67.5 | % | 15 | -10.5 | % | 33 | 59.1 | % | 201 | -55.7 | % | -59.3 | % | ||||||||||||||||||||||||||||||||||||||||||||||||||||||
| Aprovel |
343 | -4.7 | % | -10.2 | % | 55 | -8.3 | % | 5 | -16.7 | % | 41 | -50.5 | % | 242 | 15.1 | % | 343 | -4.7 | % | -10.2 | % | ||||||||||||||||||||||||||||||||||||||||||||||||||||||
| Allegra |
80 | -14.7 | % | -21.6 | % | 5 | -16.7 | % | 0 | — | 75 | -14.6 | % | 0 | — | 80 | -14.7 | % | -21.6 | % | ||||||||||||||||||||||||||||||||||||||||||||||||||||||||
| Myslee / Ambien / Stilnox |
116 | -8.0 | % | -15.3 | % | 20 | 0.0 | % | 22 | -14.3 | % | 42 | -17.5 | % | 32 | 9.4 | % | 116 | -8.0 | % | -15.3 | % | ||||||||||||||||||||||||||||||||||||||||||||||||||||||
| Synvisc / Synvisc One |
160 | -14.6 | % | -22.3 | % | 13 | -23.5 | % | 111 | -22.2 | % | 7 | -12.5 | % | 29 | 43.5 | % | 160 | -14.6 | % | -22.3 | % | ||||||||||||||||||||||||||||||||||||||||||||||||||||||
| Depakine |
230 | 7.6 | % | 2.7 | % | 84 | 2.4 | % | 0 | — | 7 | -12.5 | % | 139 | 12.0 | % | 230 | 7.6 | % | 2.7 | % | |||||||||||||||||||||||||||||||||||||||||||||||||||||||
| Tritace |
115 | -2.4 | % | -7.3 | % | 73 | -6.4 | % | 0 | — | 2 | 50.0 | % | 40 | 2.3 | % | 115 | -2.4 | % | -7.3 | % | |||||||||||||||||||||||||||||||||||||||||||||||||||||||
| Other Rx Drugs |
1,812 | -3.1 | % | -8.5 | % | 890 | -2.6 | % | 100 | -2.7 | % | 190 | -12.2 | % | 632 | -0.8 | % | 1,812 | -3.1 | % | -8.5 | % | ||||||||||||||||||||||||||||||||||||||||||||||||||||||
|
Total Established Rx Products |
4,586 | -7.1 | % | -12.3 | % | 1,719 | -3.9 | % | 379 | -44.1 | % | 530 | -20.0 | % | 1,958 | 8.7 | % | 4,586 | -7.1 | % | -12.3 | % | ||||||||||||||||||||||||||||||||||||||||||||||||||||||
|
Generics |
837 | -0.3 | % | -7.6 | % | 367 | -4.7 | % | 48 | -21.7 | % | 71 | 21.9 | % | 351 | 4.1 | % | 837 | -0.3 | % | -7.6 | % | ||||||||||||||||||||||||||||||||||||||||||||||||||||||
|
Total Emerging Markets Specialty Care |
513 | 13.4 | % | -0.4 | % | 513 | 13.4 | % | ||||||||||||||||||||||||||||||||||||||||||||||||||||||||||||||||||||
|
Total Emerging Markets Diabetes & Cardiovascular |
800 | 15.0 | % | 4.0 | % | 800 | 15.0 | % | ||||||||||||||||||||||||||||||||||||||||||||||||||||||||||||||||||||
| General Medicines & Emerging Markets |
6,736 | -2.6 | % | -9.2 | % | 2,086 | -4.1 | % | 427 | -42.2 | % | 601 | -16.6 | % | 3,622 | 10.2 | % | |||||||||||||||||||||||||||||||||||||||||||||||||||||||||||
| Total Pharmaceuticals |
12,199 | 0.5 | % | -6.4 | % | 3,781 | -0.6 | % | 3,612 | -5.4 | % | 1,184 | -3.5 | % | 3,622 | 10.2 | % | 12,199 | 0.5 | % | -6.4 | % | ||||||||||||||||||||||||||||||||||||||||||||||||||||||
| Allergy, Cough and Cold |
580 | -4.2 | % | -12.0 | % | 167 | 1.2 | % | 173 | -19.4 | % | 78 | 4.9 | % | 162 | 7.6 | % | 580 | -4.2 | % | -12.0 | % | ||||||||||||||||||||||||||||||||||||||||||||||||||||||
| Pain |
628 | 9.6 | % | 0.6 | % | 254 | 1.2 | % | 78 | -2.2 | % | 57 | 5.2 | % | 239 | 24.9 | % | 628 | 9.6 | % | 0.6 | % | ||||||||||||||||||||||||||||||||||||||||||||||||||||||
| Digestive |
496 | 11.7 | % | 3.8 | % | 163 | 1.2 | % | 95 | 12.8 | % | 27 | 7.1 | % | 211 | 20.5 | % | 496 | 11.7 | % | 3.8 | % | ||||||||||||||||||||||||||||||||||||||||||||||||||||||
| Nutritional |
330 | 2.0 | % | -6.3 | % | 62 | 1.6 | % | 18 | -9.1 | % | 123 | 2.3 | % | 127 | 3.6 | % | 330 | 2.0 | % | -6.3 | % | ||||||||||||||||||||||||||||||||||||||||||||||||||||||
| Consumer Healthcare |
2,353 | 3.0 | % | -5.3 | % | 706 | 0.0 | % | 541 | -5.3 | % | 305 | 2.5 | % | 801 | 12.3 | % | 2,353 | 3.0 | % | -5.3 | % | ||||||||||||||||||||||||||||||||||||||||||||||||||||||
| Polio / Pertussis / Hib |
734 | -12.8 | % | -18.5 | % | 139 | 0.7 | % | 176 | -10.0 | % | 81 | 4.8 | % | 338 | -21.4 | % | 734 | -12.8 | % | -18.5 | % | ||||||||||||||||||||||||||||||||||||||||||||||||||||||
| Adult Booster Vaccines |
186 | 2.1 | % | -4.1 | % | 66 | 43.5 | % | 97 | -11.6 | % | 13 | 7.7 | % | 10 | -21.4 | % | 186 | 2.1 | % | -4.1 | % | ||||||||||||||||||||||||||||||||||||||||||||||||||||||
| Meningitis/Pneumonia |
205 | -22.1 | % | -29.3 | % | 0 | -100.0 | % | 157 | -21.0 | % | 7 | -63.6 | % | 41 | -6.3 | % | 205 | -22.1 | % | -29.3 | % | ||||||||||||||||||||||||||||||||||||||||||||||||||||||
| Influenza Vaccines |
127 | 0.7 | % | -6.6 | % | 1 | — | 4 | 66.7 | % | 24 | 36.8 | % | 98 | -7.9 | % | 127 | 0.7 | % | -6.6 | % | |||||||||||||||||||||||||||||||||||||||||||||||||||||||
| Travel And Other Endemic Vaccines |
228 | 9.6 | % | 4.1 | % | 59 | 37.2 | % | 62 | -5.6 | % | 28 | 7.1 | % | 79 | 9.1 | % | 228 | 9.6 | % | 4.1 | % | ||||||||||||||||||||||||||||||||||||||||||||||||||||||
|
Vaccines |
1,522 | -9.3 | % | -15.4 | % | 271 | 16.2 | % | 524 | -12.6 | % | 158 | 0.6 | % | 569 | -16.7 | % | 1,522 | -9.3 | % | -15.4 | % | ||||||||||||||||||||||||||||||||||||||||||||||||||||||
| Total Company |
16,074 | -0.1 | % | -7.2 | % | 4,758 | 0.3 | % | 4,677 | -6.3 | % | 1,647 | -2.1 | % | 4,992 | 6.8 | % | 16,074 | -0.1 | % | -7.2 | % | ||||||||||||||||||||||||||||||||||||||||||||||||||||||
14
Appendix 2: Business net income statement
| Second quarter 2018 |
Pharmaceuticals | Consumer Healthcare |
Vaccines | Others(2) | Total Group | |||||||||||||||||||||||||||||||||||||||||||||||||||||||
| € million | Q2 2018 |
Q2 2017(1) |
Change | Q2 2018 |
Q2 2017(1) |
Change | Q2 2018 |
Q2 2017(1) |
Change | Q2 2018 |
Q2 2017(1) |
Change | Q2 2018 |
Q2 2017(1) |
Change | |||||||||||||||||||||||||||||||||||||||||||||
| Net sales |
6,250 | 6,499 | (3.8 | %) | 1,115 | 1,156 | (3.5 | %) | 811 | 1,016 | (20.2 | %) | — | — | — | 8,176 | 8,671 | (5.7 | %) | |||||||||||||||||||||||||||||||||||||||||
| Other revenues |
76 | 72 | 5.6 | % | — | — | — | 229 | 197 | 16.2 | % | — | 1 | (100.0 | %) | 305 | 270 | 13.0 | % | |||||||||||||||||||||||||||||||||||||||||
| Cost of sales |
(1,643 | ) | (1,709 | ) | (3.9 | %) | (364 | ) | (393 | ) | (7.4 | %) | (593 | ) | (625 | ) | (5.1 | %) | (51 | ) | (71 | ) | (28.2 | %) | (2,651 | ) | (2,798 | ) | (5.3 | %) | ||||||||||||||||||||||||||||||
| As % of net sales |
(26.3 | %) | (26.3 | %) | (32.6 | %) | (34.0 | %) | (73.1 | %) | (61.5 | %) | (32,4 | %) | (32.3 | %) | ||||||||||||||||||||||||||||||||||||||||||||
| Gross profit |
4,683 | 4,862 | (3.7 | %) | 751 | 763 | (1.6 | %) | 447 | 588 | (24.0 | %) | (51 | ) | (70 | ) | (27.1 | %) | 5,830 | 6,143 | (5.1 | %) | ||||||||||||||||||||||||||||||||||||||
| As % of net sales |
74.9 | % | 74.8 | % | 67.4 | % | 66.0 | % | 55.1 | % | 57.9 | % | 71.3 | % | 70.8 | % | ||||||||||||||||||||||||||||||||||||||||||||
| Research & Development expenses |
(1,135 | ) | (999 | ) | 13.6 | % | (30 | ) | (30 | ) | — | (142 | ) | (137 | ) | 3.6 | % | (168 | ) | (192 | ) | (12.5 | %) | (1,475 | ) | (1,358 | ) | 8.6 | % | |||||||||||||||||||||||||||||||
| As % of net sales |
(18.2 | %) | (15.4 | %) | (2.7 | %) | (2.6 | %) | (17.5 | %) | (13.5 | %) | (18.0 | %) | (15.7 | %) | ||||||||||||||||||||||||||||||||||||||||||||
| Selling and general expenses |
(1,394 | ) | (1,422 | ) | (2.0 | %) | (399 | ) | (444 | ) | (10.1 | %) | (173 | ) | (193 | ) | (10.4 | %) | (533 | ) | (513 | ) | 3.9 | % | (2,499 | ) | (2,572 | ) | (2.8 | %) | ||||||||||||||||||||||||||||||
| As % of net sales |
(22.3 | %) | (21.9 | %) | (35.8 | %) | (38.4 | %) | (21.3 | %) | (19.0 | %) | (30.6 | %) | (29.7 | %) | ||||||||||||||||||||||||||||||||||||||||||||
| Other current operating income/ expenses |
139 | 8 | 77 | 25 | (2 | ) | 4 | (25 | ) | 31 | 189 | 68 | ||||||||||||||||||||||||||||||||||||||||||||||||
| Share of profit/loss of associates* and joint-ventures |
75 | 47 | — | — | — | (1 | ) | — | — | 75 | 46 | |||||||||||||||||||||||||||||||||||||||||||||||||
| Net income attributable to non-controlling interests |
(26 | ) | (27 | ) | (2 | ) | (3 | ) | — | — | — | — | (28 | ) | (30 | ) | ||||||||||||||||||||||||||||||||||||||||||||
| Business operating income |
2,342 | 2,469 | (5.1 | %) | 397 | 311 | 27.7 | % | 130 | 261 | (50.2 | %) | (777 | ) | (744 | ) | 4.4 | % | 2,092 | 2,297 | (8.9 | %) | ||||||||||||||||||||||||||||||||||||||
| As % of net sales |
37.5 | % | 38.0 | % | 35.6 | % | 26.9 | % | 16.0 | % | 25.7 | % | 25.6 | % | 26.5 | % | ||||||||||||||||||||||||||||||||||||||||||||
| Financial income and expenses |
(107 | ) | (60 | ) | ||||||||||||||||||||||||||||||||||||||||||||||||||||||||
| Income tax expenses |
(427 | ) | (545 | ) | ||||||||||||||||||||||||||||||||||||||||||||||||||||||||
| Tax rate** |
22.0 | % | 24.5 | % | ||||||||||||||||||||||||||||||||||||||||||||||||||||||||
| Business net income |
1,558 | 1,692 | (7.9 | %) | ||||||||||||||||||||||||||||||||||||||||||||||||||||||||
| As % of net sales |
19.1 | % | 19.5 | % | ||||||||||||||||||||||||||||||||||||||||||||||||||||||||
| Business earnings / share (in euros) *** |
1.25 | 1.34 | (6.7 | %) | ||||||||||||||||||||||||||||||||||||||||||||||||||||||||
| * | Net of tax. |
| ** | Determined on the basis of Business income before tax, associates and non-controlling interests. |
| *** | Based on an average number of shares outstanding of 1,247.4 million in the second quarter of 2018 and 1,258.2 million in the second quarter of 2017. |
| (1) | Includes the effects of first-time application of IFRS 15 on revenue recognition, effective January 1, 2018 |
| (2) | Other includes the cost of global support functions (Medical Affairs, External Affairs, Finance, Human Resources, Information Solution & Technologies, Sanofi Business Services, etc…). |
15
| First Half 2018 |
Pharmaceuticals | Consumer Healthcare | Vaccines | Others(2) | Total Group | |||||||||||||||||||||||||||||||||||||||||||||||||||||||
| € million | H1 2018 |
H1 2017(1) |
Change | H1 2018 |
H1 2017(1) |
Change | H1 2018 |
H1 2017(1) |
Change | H1 2018 |
H1 2017(1) |
Change | H1 2018 |
H1 2017(1) |
Change | |||||||||||||||||||||||||||||||||||||||||||||
| Net sales |
12,199 | 13,038 | (6.4 | %) | 2,353 | 2,486 | (5.3 | %) | 1,522 | 1,800 | (15.4 | %) | — | — | — | 16,074 | 17,324 | (7.2 | %) | |||||||||||||||||||||||||||||||||||||||||
| Other revenues |
134 | 148 | (9.5 | %) | — | — | — | 399 | 370 | 7.8 | % | — | 1 | (100.0 | %) | 533 | 519 | 2.7 | % | |||||||||||||||||||||||||||||||||||||||||
| Cost of sales |
(3,230 | ) | (3,419 | ) | (5.5 | %) | (763 | ) | (818 | ) | (6.7 | %) | (1,068 | ) | (1,123 | ) | (4.9 | %) | (105 | ) | (135 | ) | (22.2 | %) | (5,166 | ) | (5,495 | ) | (6.0 | %) | ||||||||||||||||||||||||||||||
| As % of net sales |
(26.5 | %) | (26.2 | %) | (32.4 | %) | (32.9 | %) | (70.2 | %) | (62.4 | %) | (32.1 | %) | (31.7 | %) | ||||||||||||||||||||||||||||||||||||||||||||
| Gross profit |
9,103 | 9,767 | (6.8 | %) | 1,590 | 1,668 | (4.7 | %) | 853 | 1,047 | (18.5 | %) | (105 | ) | (134 | ) | (21.6 | %) | 11,441 | 12,348 | (7.3 | %) | ||||||||||||||||||||||||||||||||||||||
| As % of net sales |
74.6 | % | 74.9 | % | 67.6 | % | 67.1 | % | 56.0 | % | 58.2 | % | 71.2 | % | 71.3 | % | ||||||||||||||||||||||||||||||||||||||||||||
| Research& Development expenses |
(2,113 | ) | (1,999 | ) | 5.7 | % | (58 | ) | (52 | ) | 11.5 | % | (268 | ) | (260 | ) | 3.1 | % | (316 | ) | (356 | ) | (11.2 | %) | (2,755 | ) | (2,667 | ) | 3.3 | % | ||||||||||||||||||||||||||||||
| As % of net sales |
(17,3 | %) | (15.3 | %) | (2.5 | %) | (2.1 | %) | (17.6 | %) | (14.4 | %) | (17.1 | %) | (15.4 | %) | ||||||||||||||||||||||||||||||||||||||||||||
| Selling and general expenses |
(2,648 | ) | (2,807 | ) | (5.7 | %) | (788 | ) | (880 | ) | (10.5 | %) | (326 | ) | (363 | ) | (10.2 | %) | (1,047 | ) | (1,004 | ) | 4.3 | % | (4,809 | ) | (5,054 | ) | (4.8 | %) | ||||||||||||||||||||||||||||||
| As % of net sales |
(21.7 | %) | (21.5 | %) | (33.5 | %) | (35.4 | %) | (21.4 | %) | (20.2 | %) | (29.9 | %) | (29.2 | %) | ||||||||||||||||||||||||||||||||||||||||||||
| Other current operating income/ expenses |
132 | 41 | 82 | 57 | — | 1 | (56 | ) | 3 | 158 | 102 | |||||||||||||||||||||||||||||||||||||||||||||||||
| Share of profit/loss of associates* and joint-ventures |
150 | 71 | — | — | (1 | ) | (1 | ) | — | — | 149 | 70 | ||||||||||||||||||||||||||||||||||||||||||||||||
| Net income attributable to non-controlling interests |
(52 | ) | (54 | ) | (6 | ) | (11 | ) | — | — | — | — | (58 | ) | (65 | ) | ||||||||||||||||||||||||||||||||||||||||||||
| Business operating income |
4,572 | 5,019 | (8.9 | %) | 820 | 782 | 4.9 | % | 258 | 424 | (39.2 | %) | (1,524 | ) | (1,491 | ) | 2.2 | % | 4,126 | 4,734 | (12.8 | %) | ||||||||||||||||||||||||||||||||||||||
| As % of net sales |
37.5 | % | 38.5 | % | 34.8 | % | 31.5 | % | 17.0 | % | 23.6 | % | 25.7 | % | 27.3 | % | ||||||||||||||||||||||||||||||||||||||||||||
| Financial income and expenses | (105 | ) | (123 | ) | ||||||||||||||||||||||||||||||||||||||||||||||||||||||||
| Income tax expenses | (865 | ) | (1,129 | ) | ||||||||||||||||||||||||||||||||||||||||||||||||||||||||
| Tax rate** | 22.0 | % | 24.5 | % | ||||||||||||||||||||||||||||||||||||||||||||||||||||||||
| Business net income | 3,156 | 3,482 | (9.4 | %) | ||||||||||||||||||||||||||||||||||||||||||||||||||||||||
| As % of net sales | 19.6 | % | 20.1 | % | ||||||||||||||||||||||||||||||||||||||||||||||||||||||||
| Business earnings / share (in euros) *** | 2.53 | 2.76 | (8.3 | %) | ||||||||||||||||||||||||||||||||||||||||||||||||||||||||
| * | Net of tax. |
| ** | Determined on the basis of Business income before tax, associates and non-controlling interests. |
| *** | Based on an average number of shares outstanding of 1,247.8 million in the first half of 2018 and 1,260.3 million in the first half of 2017. |
| (1) | Includes the effects of first-time application of IFRS 15 on revenue recognition, effective January 1, 2018 |
| (2) | Other includes the cost of global support functions (Medical Affairs, External Affairs, Finance, Human Resources, Information Solution & Technologies, Sanofi Business Services, etc…). |
16
Appendix 3: Consolidated income statements
| € million | Q2 2018 | Q2 2017(1) | H1 2018 | H1 2017(1) | ||||||||||||
| Net sales |
8,176 | 8,671 | 16,074 | 17,324 | ||||||||||||
| Other revenues |
305 | 270 | 533 | 519 | ||||||||||||
| Cost of sales |
(2,720 | ) | (2,886 | ) | (5,265 | ) | (5,671 | ) | ||||||||
| Gross profit |
5,761 | 6,055 | 11,342 | 12,172 | ||||||||||||
| Research and development expenses |
(1,475 | ) | (1,358 | ) | (2,755 | ) | (2,667 | ) | ||||||||
| Selling and general expenses |
(2,507 | ) | (2,572 | ) | (4,819 | ) | (5,054 | ) | ||||||||
| Other operating income |
298 | 113 | 323 | 173 | ||||||||||||
| Other operating expenses |
(109 | ) | (45 | ) | (165 | ) | (71 | ) | ||||||||
| Amortization of intangible assets |
(541 | ) | (487 | ) | (999 | ) | (990 | ) | ||||||||
| Impairment of intangible assets |
(98 | ) | (12 | ) | (101 | ) | (12 | ) | ||||||||
| Fair value remeasurement of contingent consideration liabilities |
66 | (64 | ) | 10 | (100 | ) | ||||||||||
| Restructuring costs and similar items |
(416 | ) | (245 | ) | (607 | ) | (364 | ) | ||||||||
| Other gains and losses and litigation |
(18 | ) | (7 | ) | (67 | ) | (7 | ) | ||||||||
| Operating income |
961 | 1,378 | 2,162 | 3,080 | ||||||||||||
| Financial expenses |
(107 | ) | (107 | ) | (202 | ) | (218 | ) | ||||||||
| Financial income |
— | 47 | 97 | 95 | ||||||||||||
| Income before tax and associates and joint ventures |
854 | 1,318 | 2,057 | 2,957 | ||||||||||||
| Income tax expense |
(110 | ) | (276 | ) | (297 | ) | (612 | ) | ||||||||
| Share of profit/loss of associates and joint ventures |
45 | 27 | 75 | 27 | ||||||||||||
| Net income excluding the held for exchange Animal Health business |
789 | 1,069 | 1,835 | 2,372 | ||||||||||||
| Net income from the held for exchange Animal Health business |
1 | (6 | ) | — | 4,421 | |||||||||||
| Net income |
790 | 1,063 | 1,835 | 6,793 | ||||||||||||
| Net income attributable to non-controlling interests |
28 | 30 | 57 | 64 | ||||||||||||
| Net income attributable to equity holders of Sanofi |
762 | 1,033 | 1,778 | 6,729 | ||||||||||||
| Average number of shares outstanding (million) |
1,247.4 | 1,258.2 | 1,247.8 | 1,260.3 | ||||||||||||
| Earnings per share (in euros) excluding the held for exchange Animal Health business |
0.61 | 0.83 | 1.42 | 1.83 | ||||||||||||
| IFRS earnings per share (in euros) |
0.61 | 0.82 | 1.42 | 5.34 | ||||||||||||
| (1) | Includes the effects of first-time application of IFRS 15 on revenue recognition, effective January 1, 2018 |
| (2) | In 2017 net gain resulting from the divestment of the Animal Health business presented separately in accordance with IFRS5, Non current assets held-for-sale and discontinued operations. |
17
Appendix 4: Reconciliation of business net income to consolidated net income attributable to equity holders of Sanofi
| € million | Q2 2018 | Q2 2017(1) | Change | |||||||||
| Net income attributable to equity holders of Sanofi |
762 | 1,033 | (26.2 | %) | ||||||||
| Amortization of intangible assets(2) |
541 | 487 | ||||||||||
| Impairment of intangible assets |
98 | 12 | ||||||||||
| Fair value remeasurement of contingent consideration |
(66 | ) | 64 | |||||||||
| Expenses arising from the impact of acquisitions on inventories |
69 | 88 | ||||||||||
| Other expenses related to business combinations |
8 | — | ||||||||||
| Restructuring costs and similar items |
416 | 245 | ||||||||||
| Other gains and losses, and litigation(3) |
18 | 7 | ||||||||||
| Tax effect of items listed above: |
(290 | ) | (380 | ) | ||||||||
| Amortization & impairment of intangible assets |
(153 | ) | (167 | ) | ||||||||
| Fair value remeasurement of contingent consideration |
17 | (25 | ) | |||||||||
| Expenses arising from the impact of acquisitions on inventories |
(17 | ) | (28 | ) | ||||||||
| Other expenses related to business combinations |
1 | — | ||||||||||
| Restructuring costs and similar items |
(131 | ) | (83 | ) | ||||||||
| Other tax effects |
(7 | ) | (77 | ) | ||||||||
| Other tax items(4) |
(27 | ) | 111 | |||||||||
| Share of items listed above attributable to non-controlling interests |
— | — | ||||||||||
| Restructuring costs of associates and joint-ventures, and expenses arising from the impact of acquisitions on associates and joint-ventures |
30 | 19 | ||||||||||
| Animal Health items(5) |
(1 | ) | 6 | |||||||||
| Business net income |
1,558 | 1,692 | (7.9 | %) | ||||||||
| IFRS earnings per share(6) (in euros) |
0.61 | 0.82 | ||||||||||
| (1) | Includes the effects of first-time application of IFRS 15 on revenue recognition, effective January 1, 2018. |
| (2) | Of which related to amortization expense generated by the remeasurtement of intangible asstes as part of business combinations: €509 million in the second quarter of 2018 and €453 million in the second quarter of 2017 |
| (3) | In 2018, separation costs for the European Generics business divestiture. |
| (4) | In 2018, adjustments made to our preliminary analysis of the direct and indirect impacts of US tax reform. In 2017, relates to French 3% tax on dividends. |
| (5) | In 2017, net gain resulting from divestment of the Animal Health business presented separately in accordance with IFRS 5, Non current assets held-for-sale and discontinued operations. |
| (6) | Based on an average number of shares outstanding of 1,247.4 million in the second quarter of 2018 and 1,258.2 million in the second quarter of 2017. |
18
| € million | H1 2018 | H1 2017(1) | Change | |||||||||
| Net income attributable to equity holders of Sanofi |
1,778 | 6,729 | (73.6 | %) | ||||||||
| Amortization of intangible assets(2) |
999 | 990 | ||||||||||
| Impairment of intangible assets |
101 | 12 | ||||||||||
| Fair value remeasurement of contingent Consideration |
(10 | ) | 100 | |||||||||
| Expenses arising from the impact of acquisitions on inventories |
99 | 176 | ||||||||||
| Other expenses related to business combinations |
10 | — | ||||||||||
| Restructuring costs and similar items |
607 | 364 | ||||||||||
| Other gains and losses, and litigation(3) |
67 | 7 | ||||||||||
| Tax effect of items listed above: |
(475 | ) | (628 | ) | ||||||||
| Amortization & impairment of intangible assets |
(275 | ) | (349 | ) | ||||||||
| Fair value remeasurement of contingent consideration |
11 | (31 | ) | |||||||||
| Expenses arising from the impact of acquisitions on inventories |
(23 | ) | (56 | ) | ||||||||
| Other expenses related to business combinations on inventories |
— | — | ||||||||||
| Restructuring costs and similar items |
(183 | ) | (126 | ) | ||||||||
| Other tax effects |
(5 | ) | (66 | ) | ||||||||
| Other tax items(4) |
(93 | ) | 111 | |||||||||
| Share of items listed above attributable to non-controlling interests |
(1 | ) | (1 | ) | ||||||||
| Restructuring costs of associates and joint-ventures, and expenses arising from the impact of acquisitions on associates and joint-ventures |
74 | 43 | ||||||||||
| Animal Health items(5) |
— | (4,421 | ) | |||||||||
| Business net income |
3,156 | 3,482 | (9.4 | %) | ||||||||
| IFRS earnings per share(6) (in euros) |
1.42 | 5.34 | ||||||||||
| (1) | Includes the effects of first-time application of IFRS 15 on revenue recognition, effective January 1, 2018 |
| (2) | Of which related to amortization expense generated by the remeasurement of intangible assets as part of business combination: €934 million in the first-half of 2018 and €919 million in the first-half of 2017 |
| (3) | In 2018, separation costs for the European Generics business divestiture. |
| (4) | In 2018, adjustments made to our preliminary analysis of the direct and indirect impacts of US tax reform. In 2017, relates to French 3% tax on dividends. |
| (5) | In 2017, net gain resulting from the divestment of the Animal Health business presented separately in accordance with IFRS 5, Non current assets hel-for-sale and discontinued operations. |
| (6) | Based on an average number of shares outstanding of 1,247.8 million in the first-half of 2018 and 1,260.3 million in the first-half of 2017. |
19
Appendix 5: Change in net debt
| € million | H1 2018 | H1 2017(1) | ||||||
| Business net income |
3,156 | 3,482 | ||||||
| Depreciation amortization and impairment of property, plant and equipment and software |
591 | 604 | ||||||
| Gains and losses on disposals of non-current assets, net of tax |
(216 | ) | (79 | ) | ||||
| Other non-cash items |
151 | 167 | ||||||
| Operating cash flow before changes in working capital(2) |
3,682 | 4,174 | ||||||
| Changes in working capital(2) |
(1,139 | ) | (1,187 | ) | ||||
| Acquisitions of property, plant and equipment and software |
(689 | ) | (688 | ) | ||||
| Free cash flow(2) |
1,854 | 2,299 | ||||||
| Acquisitions of intangibles, excluding software |
(77 | ) | (285 | ) | ||||
| Acquisitions of investments, in consolidated undertakings including assumed debt |
(12,872 | ) | (274 | ) | ||||
| Restructuring costs and similar items paid |
(414 | ) | (438 | ) | ||||
| Proceeds from disposals of property, plant and equipment, intangibles, and other non-current assets, net of tax |
489 | 313 | ||||||
| Issuance of Sanofi shares |
19 | 99 | ||||||
| Dividends paid to shareholders of Sanofi |
(3,773 | ) | (3,710 | ) | ||||
| Acquisition of treasury shares |
(730 | ) | (1,698 | ) | ||||
| Transactions with non-controlling interests including dividends |
(18 | ) | (48 | ) | ||||
| Foreign exchange impact |
(210 | ) | 290 | |||||
| Net cash-flow from the swap between BI – CHC and Sanofi Aninal Health business |
5 | 4,349 | ||||||
| Other items |
(322 | ) | (154 | ) | ||||
| Change in net debt |
(16,049 | ) | 743 | |||||
| (1) | Includes the effects of first-time application of IFRS 15 on revenue recognition, effective January 1, 2018 |
| (2) | Excluding restructuring costs and similar items |
20
Appendix 6: Simplified consolidated balance sheet
| ASSETS € million |
Jun 30, 2018 |
Dec 31, 2017(1) |
LIABILITIES & EQUITY € million |
Jun 30, 2018 |
Dec 31, 2017(1) |
|||||||||||||
| Equity attributable to equity-holders of Sanofi
|
|
56,197
|
|
|
58,070
|
| ||||||||||||
| Equity attributable to non-controlling interests
|
|
164
|
|
|
169
|
| ||||||||||||
|
Total equity
|
|
56,361
|
|
|
58,239
|
| ||||||||||||
| Long-term debt
|
|
22,788
|
|
|
14,326
|
| ||||||||||||
| Property, plant and equipment |
9,470 | 9,579 | Non-current liabilities related to business combinations and to non-controlling interests
|
|
1,018
|
|
|
1,026
|
| |||||||||
| Intangible assets (including goodwill) |
67,264 | 53,344 | Provisions and other non-current liabilities
|
|
8,949
|
|
|
9,154
|
| |||||||||
| Non-current financial assets, investments in associates, and deferred tax assets |
10,575 | 10,502 | Deferred tax liabilities | 3,784 | 1,605 | |||||||||||||
|
Non-current assets
|
|
87,309
|
|
|
73,425
|
|
Non-current liabilities
|
|
36,539
|
|
|
26,111
|
| |||||
| Accounts payable and other current liabilities
|
|
13,004
|
|
|
13,845
|
| ||||||||||||
| Inventories, accounts receivable and other current assets |
16,443 | 16,039 | Current liabilities related to business combinations and to non-controlling interests
|
|
450
|
|
|
343
|
| |||||||||
| Cash and cash equivalents |
7,493 | 10,315 | Short-term debt and current portion of long-term debt
|
|
6,153
|
|
|
1,275
|
| |||||||||
|
Current assets
|
|
23,936
|
|
|
26,354
|
|
Current liabilities
|
|
19,607
|
|
|
15,463
|
| |||||
| Assets held for sale or exchange |
1,533 | 34 | Liabilities related to assets held for sale or exchange
|
|
271
|
|
|
—
|
| |||||||||
|
Total ASSETS
|
|
112,778
|
|
|
99,813
|
|
Total LIABILITIES & EQUITY
|
|
112,778
|
|
|
99,813
|
| |||||
| (1) | Includes the effects of first-time application of IFRS 15 on revenue recognition, effective January 1, 2018 |
21
Appendix 7 : currency sensitivity
2018 Business EPS currency sensitivity
| Currency | Variation | Business EPS Sensitivity | ||
| U.S. Dollar |
+0.05 USD/EUR | -EUR 0.10 | ||
| Japanese Yen |
+5 JPY/EUR | -EUR 0.01 | ||
| Chinese Yuan |
+0.2 CNY/EUR | -EUR 0.02 | ||
| Brazilian Real |
+0.4 BRL/EUR | -EUR 0.02 | ||
| Russian Ruble |
+10 RUB/EUR | -EUR 0.03 |
Currency exposure on Q2 2018 sales
| Currency | Q2 2018 | |||
| US $ |
31.1 | % | ||
| Euro € |
25.2 | % | ||
| Chinese Yuan |
7.3 | % | ||
| Japanese Yen |
5.1 | % | ||
| Brazilian Real |
2.7 | % | ||
| British Pound |
2.1 | % | ||
| Russian Ruble |
2.0 | % | ||
| Australian $ |
1.7 | % | ||
| Canadian $ |
1.6 | % | ||
| Mexican Peso |
1.4 | % | ||
| Others |
19.8 | % | ||
Currency average rates
| Q2 2017 | Q2 2018 | Change | ||||||||||
| €/$ |
1.10 | 1.19 | +8.4 | % | ||||||||
| €/Yen |
122.15 | 130.15 | +6.6 | % | ||||||||
| €/Yuan |
7.54 | 7.60 | +0.9 | % | ||||||||
| €/Real |
3.54 | 4.30 | +21.5 | % | ||||||||
| €/Ruble |
62.87 | 74.02 | +17.7 | % | ||||||||
22
Appendix 8: R&D Pipeline
O : Opt-in rights products for which rights have not been exercised yet
R : Registrational Study (other than Phase 3)
|
|
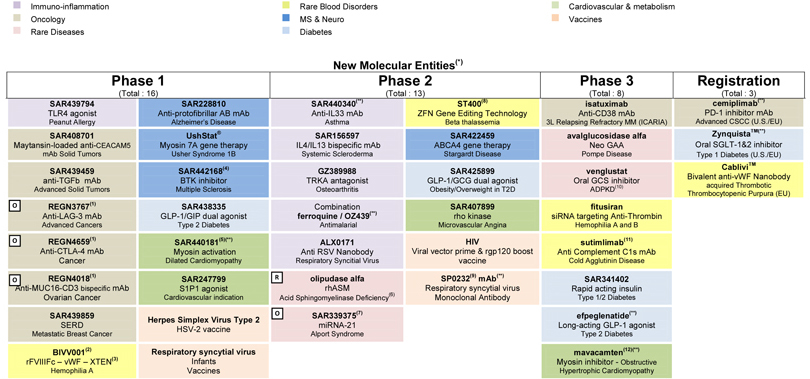
| (1) Regeneron product for which Sanofi has opt-in rights (2) Sanofi Product for which Sobi has opt-in rights (3) Recombinant Coagulation Factor VIII Fc – von Willebrand Factor - XTEN Fusion protein (4) Also known as PRN2246 (5) Also known as MYK491 (6) Also known as Niemann Pick type B (7) Regulus product for which Sanofi has opt-in rights |
(8) Developed in collaboration with Sangamo (9) Also known as MEDI8897 (10) Autosomal Dominant Polycystic Kidney Disease (11) Also known as BIVV009 (12) Also known as SAR439152 and MYK461 (*) Data related to all studies published on clinicaltrials.gov (**) Partnered and/or in collaboration - Sanofi may have limited or shared rights on some of these products |
Immuno-inflammation Oncology Rare Diseases Rare Blood Disorders MS & Neuro Diabetes Cardiovascular & metabolism Vaccines New Molecular Entities(*) Phase 1 (Total : 16) Phase 2 (Total : 13) Phase 3 (Total : 8) Registration (Total : 3) SAR439794 TLR4 agonist Peanut Allergy SAR228810 Anti-protofibrillar AB mAb Alzheimer’s Disease SAR440340(**) Anti-IL33 mAb Asthma ST400(8) ZFN Gene Editing Technology Beta thalassemia isatuximab Anti-CD38 mAb 3L Relapsing Refractory MM (ICARIA) cemiplimab(**) PD-1 inhibitor mAb Advanced CSCC (U.S./EU) SAR408701 Maytansin-loaded anti-CEACAM5 mAb Solid Tumors UshStat Myosin 7A gene therapy Usher Syndrome 1B SAR156597 IL4/IL13 bispecific mAb Systemic Scleroderma SAR422459 ABCA4 gene therapy Stargardt Disease avalglucosidase alfa Neo GAA Pompe Disease ZynquistaTM(**) Oral SGLT-1&2 inhibitor Type 1 Diabetes (U.S./EU) SAR439459 anti-TGFb mAb Advanced Solid Tumors SAR442168(4) BTK inhibitor Multiple Sclerosis GZ389988 TRKA antagonist Osteoarthritis SAR425899 GLP-1/GCG dual agonist Obesity/Overweight in T2D venglustat Oral GCS inhibitor ADPKD(10) CabliviTM Bivalent anti-vWF Nanobody acquired Thrombotic Thrombocytopenic Purpura (EU) REGN3767(1) Anti-LAG-3 mAb Advanced Cancers SAR438335 GLP-1/GIP dual agonist Type 2 Diabetes Combination ferroquine / OZ439(**) Antimalarial SAR407899 rho kinase Microvascular Angina fitusiran siRNA targeting Anti-Thrombin Hemophilia A and B REGN4659(1) Anti-CTLA-4 mAb Cancer SAR440181(5)(**) Myosin activation Dilated Cardiomyopathy ALX0171 Anti RSV Nanobody Respiratory Syncitial Virus HIV Viral vector prime & rgp120 boost vaccine sutimlimab(11) Anti Complement C1s mAb Cold Agglutinin Disease REGN4018(1) Anti-MUC16-CD3 bispecific mAb Ovarian Cancer SAR247799 S1P1 agonist Cardiovascular indication olipudase alfa rhASM Acid Sphingomyelinase Deficiency(6) SP0232(9) mAb(**) Respiratory syncytial virus Monoclonal Antibody SAR341402 Rapid acting insulin Type 1/2 Diabetes SAR439859 SERD Metastatic Breast Cancer Herpes Simplex Virus Type 2 HSV-2 vaccine SAR339375(7) miRNA-21 Alport Syndrome efpeglenatide(**) Long-acting GLP-1 agonist Type 2 Diabetes BIVV001(2) rFVIIIFc – vWF – XTEN(3) Hemophilia A Respiratory syncytial virus Infants Vaccines mavacamten(12)(**) Myosin inhibitor—Obstructive Hypertrophic Cardiomyopathy
23
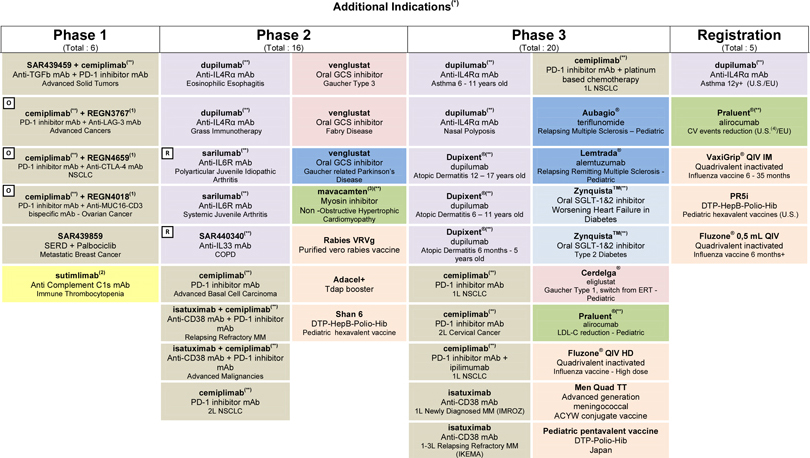
|
| (1) | Regeneron product for which Sanofi has opt-in rights |
| (2) | Also known as BIVV009 |
| (3) | Also known as SAR439152 and MYK461 |
| (4) | U.S. filing pending acceptance by FDA |
| (*) | Data related to all studies published on clinicaltrials.gov |
| (**) | Partnered and/or in collaboration - Sanofi may have limited or shared rights on some of these products |
Additional Indications(*) Phase 1 (Total : 6) Phase 2 (Total : 16) Phase 3 (Total : 20) Registration (Total : 5) SAR439459 + cemiplimab(**) Anti-TGFb mAb + PD-1 inhibitor mAb Advanced Solid Tumors dupilumab(**) Anti-IL4Rα mAb Eosinophilic Esophagitis venglustat Oral GCS inhibitor Gaucher Type 3 dupilumab(**) Anti-IL4Rα mAb Asthma 6—11 years old cemiplimab(**) PD-1 inhibitor mAb + platinum based chemotherapy 1L NSCLC dupilumab(**) Anti-IL4Rα mAb Asthma 12y+ (U.S./EU) cemiplimab(**) + REGN3767(1) PD-1 inhibitor mAb + Anti-LAG-3 mAb Advanced Cancers dupilumab(**) Anti-IL4Rα mAb Grass Immunotherapy venglustat Oral GCS inhibitor Fabry Disease dupilumab(**) Anti-IL4Rα mAb Nasal Polyposis Aubagio® teriflunomide Relapsing Multiple Sclerosis – Pediatric Praluent®(**) alirocumab CV events reduction (U.S.(4)/EU) cemiplimab(**) + REGN4659(1) PD-1 inhibitor mAb + Anti-CTLA-4 mAb NSCLC sarilumab(**) Anti-IL6R mAb Polyarticular Juvenile Idiopathic Arthritis venglustat Oral GCS inhibitor Gaucher related Parkinson’s Disease Dupixent®(**) dupilumab Atopic Dermatitis 12 – 17 years old Lemtrada® alemtuzumab Relapsing Remitting Multiple Sclerosis—Pediatric VaxiGrip® QIV IM Quadrivalent inactivated Influenza vaccine 6—35 months cemiplimab(**) + REGN4018(1) PD-1 inhibitor mAb + Anti-MUC16-CD3 bispecific mAb—Ovarian Cancer sarilumab(**) Anti-IL6R mAb Systemic Juvenile Arthritis mavacamten(3)(**) Myosin inhibitor Non -Obstructive Hypertrophic Cardiomyopathy Dupixent®(**) dupilumab Atopic Dermatitis 6 – 11 years old ZynquistaTM(**) Oral SGLT-1&2 inhibitor Worsening Heart Failure in Diabetes PR5i DTP-HepB-Polio-Hib Pediatric hexavalent vaccines (U.S.) SAR439859 SERD + Palbociclib Metastatic Breast Cancer SAR440340(**) Anti-IL33 mAb COPD Rabies VRVg Purified vero rabies vaccine Dupixent®(**) dupilumab Atopic Dermatitis 6 months—5 years old ZynquistaTM(**) Oral SGLT-1&2 inhibitor Type 2 Diabetes Fluzone® 0,5 mL QIV Quadrivalent inactivated Influenza vaccine 6 months+ sutimlimab(2) Anti Complement C1s mAb Immune Thrombocytopenia cemiplimab(**) PD-1 inhibitor mAb Advanced Basal Cell Carcinoma Adacel+ Tdap booster cemiplimab(**) PD-1 inhibitor mAb 1L NSCLC Cerdelga® eliglustat Gaucher Type 1, switch from ERT—Pediatric isatuximab + cemiplimab(**) Anti-CD38 mAb + PD-1 inhibitor mAb Relapsing Refractory MM Shan 6 DTP-HepB-Polio-Hib Pediatric hexavalent vaccine cemiplimab(**) PD-1 inhibitor mAb 2L Cervical Cancer Praluent®(**) alirocumab LDL-C reduction—Pediatric isatuximab + cemiplimab(**) Anti-CD38 mAb + PD-1 inhibitor mAb Advanced Malignancies cemiplimab(**) PD-1 inhibitor mAb + ipilimumab 1L NSCLC Fluzone® QIV HD Quadrivalent inactivated Influenza vaccine—High dose cemiplimab(**) PD-1 inhibitor mAb 2L NSCLC isatuximab Anti-CD38 mAb 1L Newly Diagnosed MM (IMROZ) Men Quad TT Advanced generation meningococcal ACYW conjugate vaccine isatuximab Anti-CD38 mAb 1-3L Relapsing Refractory MM (IKEMA) Pediatric pentavalent vaccine DTP-Polio-Hib Japan
24
|
|
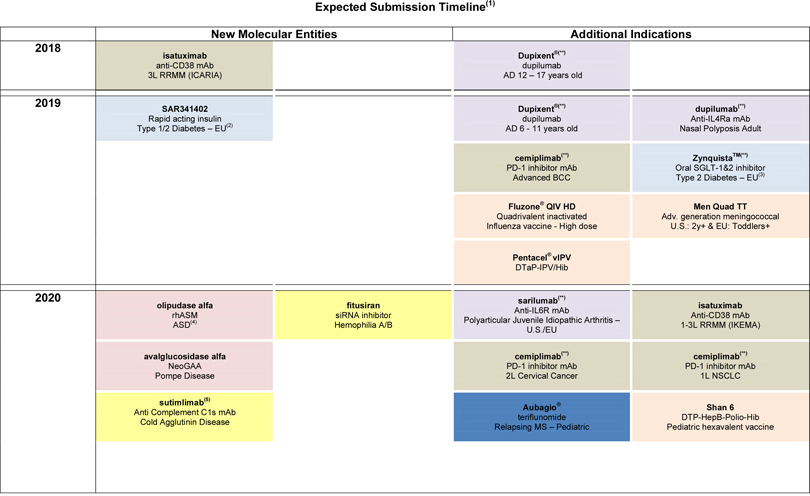
Expected Submission Timeline(1) New Molecular Entities Additional Indications 2018 isatuximab anti-CD38 mAb 3L RRMM (ICARIA) Dupixent®(**) dupilumab AD 12 – 17 years old 2019 SAR341402 Rapid acting insulin Type 1/2 Diabetes – EU(2) Dupixent®(**) dupilumab AD 6—11 years old dupilumab(**) Anti-IL4Ra mAb Nasal Polyposis Adult cemiplimab(**) PD-1 inhibitor mAb Advanced BCC ZynquistaTM(**) Oral SGLT-1&2 inhibitor Type 2 Diabetes – EU(3) Fluzone® QIV HD Quadrivalent inactivated Influenza vaccine—High dose Men Quad TT Adv. generation meningococcal U.S.: 2y+ & EU: Toddlers+ Pentacel® vIPV DTaP-IPV/Hib 2020 olipudase alfa rhASM ASD(4) fitusiran siRNA inhibitor Hemophilia A/B sarilumab(**) Anti-IL6R mAb Polyarticular Juvenile Idiopathic Arthritis – U.S./EU isatuximab Anti-CD38 mAb 1-3L RRMM (IKEMA) avalglucosidase alfa NeoGAA Pompe Disease cemiplimab(**) PD-1 inhibitor mAb 2L Cervical Cancer cemiplimab(**) PD-1 inhibitor mAb 1L NSCLC sutimlimab(5) Anti Complement C1s mAb Cold Agglutinin Disease Aubagio® teriflunomide Relapsing MS – Pediatric Shan 6 DTP-HepB-Polio-Hib Pediatric hexavalent vaccine
25
|
|
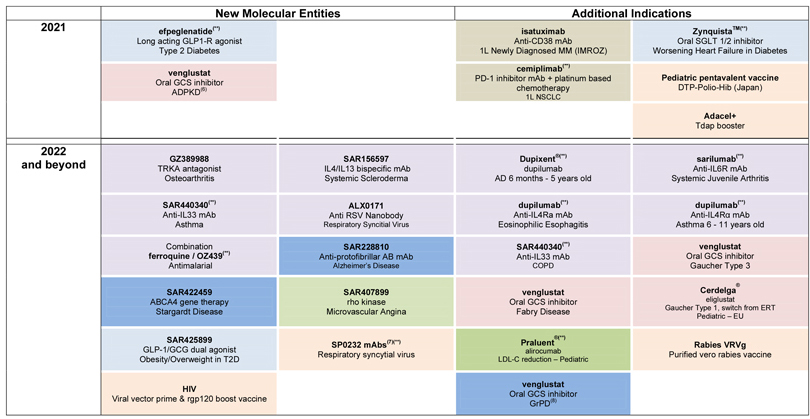
| (1) | Excluding Phase 1 - Data related to all studies published on clinicaltrials.gov |
| (2) | Submission strategy for the U.S. under evaluation |
| (3) | Submission for the U.S. expected in 2020 |
| (4) | Acid Sphingomyelinase Deficiency |
| (5) | Also known as BIVV009; Currently operating as separate entities. Reported dates are based on prior Bioverativ disclosure of study completion date |
| (6) | Autosomal Dominant Polycystic Kidney Disease |
| (7) | Also known as MEDI8897 |
| (8) | Gaucher Related Parkinson’s Disease |
| (**) | Partnered and/or in collaboration – Sanofi may have limited or shared rights on some of these products |
New Molecular Entities Additional Indications 2021 efpeglenatide(**) Long acting GLP1-R agonist Type 2 Diabetes isatuximab Anti-CD38 mAb 1L Newly Diagnosed MM (IMROZ) ZynquistaTM(**) Oral SGLT 1/2 inhibitor Worsening Heart Failure in Diabetes venglustat Oral GCS inhibitor ADPKD(6) cemiplimab(**) PD-1 inhibitor mAb + platinum based chemotherapy 1L NSCLC Pediatric pentavalent vaccine DTP-Polio-Hib (Japan) Adacel+ Tdap booster 2022 and beyond GZ389988 TRKA antagonist Osteoarthritis SAR156597 IL4/IL13 bispecific mAb Systemic Scleroderma Dupixent®(**) dupilumab AD 6 months—5 years old sarilumab(**) Anti-IL6R mAb Systemic Juvenile Arthritis SAR440340(**) Anti-IL33 mAb Asthma ALX0171 Anti RSV Nanobody Respiratory Syncitial Virus dupilumab(**) Anti-IL4Ra mAb Eosinophilic Esophagitis dupilumab(**) Anti-IL4Rα mAb Asthma 6—11 years old Combination ferroquine / OZ439(**) Antimalarial SAR228810 Anti-protofibrillar AB mAb Alzheimer’s Disease SAR440340(**) Anti-IL33 mAb COPD venglustat Oral GCS inhibitor Gaucher Type 3 SAR422459 ABCA4 gene therapy Stargardt Disease SAR407899 rho kinase Microvascular Angina venglustat Oral GCS inhibitor Fabry Disease Cerdelga® eliglustat Gaucher Type 1, switch from ERT Pediatric – EU SAR425899 GLP-1/GCG dual agonist Obesity/Overweight in T2D SP0232 mAbs(7)(**) Respiratory syncytial virus Praluent®(**) alirocumab LDL-C reduction – Pediatric Rabies VRVg Purified vero rabies vaccine HIV Viral vector prime & rgp120 boost vaccine venglustat Oral GCS inhibitor GrPD(8)
26
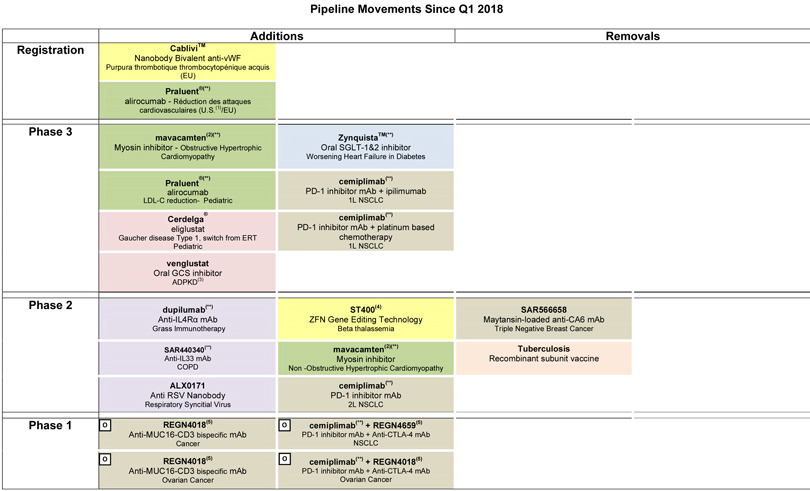
|
| (**) Partnered and/or in collaboration - Sanofi may have limited or shared rights on some of these products (1) U.S. filing pending acceptance by FDA (2) Also known as SAR439152 and MYK46 (3) Autosomal Dominant Polycystic Kidney Disease (4) Developed in collaboration with Sangamo (5) Regeneron product for which Sanofi has opt-in rights |
Pipeline Movements Since Q1 2018 Additions Removals Registration CabliviTM Nanobody Bivalent anti-vWF Purpura thrombotique thrombocytopénique acquis (EU) Praluent®(**) alirocumab—Réduction des attaques cardiovasculaires (U.S.(1)/EU) Phase 3 mavacamten(2)(**) Myosin inhibitor—Obstructive Hypertrophic Cardiomyopathy ZynquistaTM(**) Oral SGLT-1&2 inhibitor Worsening Heart Failure in Diabetes Praluent®(**) alirocumab LDL-C reduction- Pediatric cemiplimab(**) PD-1 inhibitor mAb + ipilimumab 1L NSCLC Cerdelga® eliglustat Gaucher disease Type 1, switch from ERT Pediatric cemiplimab(**) PD-1 inhibitor mAb + platinum based chemotherapy 1L NSCLC venglustat Oral GCS inhibitor ADPKD(3) Phase 2 dupilumab(**) Anti-IL4Rα mAb Grass Immunotherapy ST400(4) ZFN Gene Editing Technology Beta thalassemia SAR566658 Maytansin-loaded anti-CA6 mAb Triple Negative Breast Cancer SAR440340(**) Anti-IL33 mAb COPD mavacamten(2)(**) Myosin inhibitor Non -Obstructive Hypertrophic Cardiomyopathy Tuberculosis Recombinant subunit vaccine ALX0171 Anti RSV Nanobody Respiratory Syncitial Virus cemiplimab(**) PD-1 inhibitor mAb 2L NSCLC Phase 1 REGN4018(5) Anti-MUC16-CD3 bispecific mAb Cancer cemiplimab(**) + REGN4659(5) PD-1 inhibitor mAb + Anti-CTLA-4 mAb NSCLC REGN4018(5) Anti-MUC16-CD3 bispecific mAb Ovarian Cancer cemiplimab(**) + REGN4018(5) PD-1 inhibitor mAb + Anti-CTLA-4 mAb Ovarian Cancer
27
Appendix 9: Expected R&D milestones
| Products | Expected milestones | Timing | ||
| Praluent® | U.S. sBLA filing to include ODYSSEY OUTCOMES results(1) | Q3 2018 | ||
| isatuximab | Start of Phase 3 in 1st line Multiple Myeloma in SCT eligible patients (GMMG) | Q3 2018 | ||
| CabliviTM (caplacizumab) | U.S. FDA filing in acquired Thrombotic Thrombocytopenic Purpura | Q3 2018 | ||
| venglustat | Start of Pivotal study in Autosomal Dominant Polycystic Kidney Disease | Q3 2018 | ||
| MenQuadTT | Phase 3 results for prevention of Meningococcal Meningitis | Q3 2018 | ||
| Dupixent® | U.S. FDA filing in Atopic Dermatitis in Adolescent patients | Q3 2018 | ||
| Fluzone® QIV HD | Phase 3 results for prevention of Influenza | Q4 2018 | ||
| cemiplimab | U.S. regulatory decision in locally advanced CSCC | Q4 2018 | ||
| dupilumab | U.S. regulatory decision in Asthma in Adult/Adolescent patients | Q4 2018 | ||
| dupilumab | Start of Phase 2b/3 trial in Chronic Obstructive Pulmonary Disease | Q4 2018 | ||
| isatuximab | Phase 3 results in Multiple Myeloma in combination with PomDex (ICARIA) | Q4 2018 | ||
| dupilumab | Phase 3 read-out in Nasal Polyps | Q4 2018 | ||
| efpeglenatide | Start of Phase 3 in Type 2 Diabetes as add-on to metformin vs dulaglutide | Q4 2018 | ||
| efpeglenatide | Start of Phase 3 in Type 2 Diabetes as add-on to basal insulins | Q4 2018 | ||
| dupilumab | Start of Phase 3 trial in Eosinophilic Esophagitis | Q4 2018 | ||
| alemtuzumab | Start of Phase 3 in Primary Progressive Multiple Sclerosis | H2 2018 | ||
| ZynquistaTM (sotagliflozin) | EU CHMP decision expected in Type 1 Diabetes | Q1 2019 | ||
| cemiplimab | EU CHMP decision expected in Advanced Cutaneous Squamous Cell Carcinoma | Q1 2019 |
| (1) | Praluent® ODYSSEY OUTCOMES results submitted to the FDA in Q2 2018; submission is pending acceptance by FDA |
28
Appendix 10: Definitions of non-GAAP financial indicators
Company
“Company” corresponds to Sanofi and its subsidiaries
Company sales at constant exchange rates (CER)
When we refer to changes in our net sales “at constant exchange rates” (CER), this means that we exclude the effect of changes in exchange rates.
We eliminate the effect of exchange rates by recalculating net sales for the relevant period at the exchange rates used for the previous period.
Reconciliation of net sales to Company sales at constant exchange rates for the second quarter and first half 2018
| € million | Q2 2018 | H1 2018 | ||||||
| Net sales |
8,176 | 16,074 | ||||||
| Effect of exchange rates |
(508 | ) | (1,227 | ) | ||||
| Company sales at constant exchange rates |
8,684 | 17,301 | ||||||
Business net income
Sanofi publishes a key non-GAAP indicator.
Business net income is defined as net income attributable to equity holders of Sanofi excluding:
| • | amortization of intangible assets, |
| • | impairment of intangible assets, |
| • | fair value remeasurement of contingent consideration related to business combinations or to disposals, |
| • | other impacts associated with acquisitions (including impacts of acquisitions on associates and joint ventures), |
| • | restructuring costs and similar items(1), |
| • | other gains and losses (including gains and losses on disposals of non-current assets(1)), |
| • | costs or provisions associated with litigation(1), |
| • | tax effects related to the items listed above as well as effects of major tax disputes, |
| • | net income attributable to non-controlling interests related to the items listed above, |
| (1) | Reported in the line items Restructuring costs and similar items and Gains and losses on disposals, and litigation, which are defined in Note B.20. to our consolidated financial statements. |
29
Exhibit 99.2
PRODUCT SALES STATEMENT, FOR THE PRODUCT SALES MEASURING PERIOD ENDED JUNE 30, 2018
As called for under §5.4 of the Contingent Value Rights Agreement (the “CVRA”) by and between Sanofi (formerly known as sanofi-aventis) and American Stock Transfer & Trust Company LLC dated as of March 30, 2011. On May 13, 2016, American Stock Transfer & Trust Company, LLC (“AST”) tendered its resignation as trustee under the CVRA to Sanofi. As of June 30, 2016, UMB Bank, National Association replaced AST and is the Successor Trustee under the CVRA. All capitalized terms used in the present Product Sales Statement have the respective meanings ascribed to them in the CVRA. Amounts set forth herein are not necessarily indicative of results that will be achieved in subsequent Product Sales Measuring Periods.
Sales data for the Product
| Market | Q2 2018 | Q1 2018 | Q4 2017 | Q3 2017 | ||||||||||||||||||||||||||
| (I) | (II) | X- rate | (I) | (II) | X- rate | (I) | (II) | X- rate | (I) | (II) | X- rate | |||||||||||||||||||
| Major Markets |
||||||||||||||||||||||||||||||
| USA |
67.5 | 54.7 | 1.0 | 70.9 | 58.2 | 1.0 | 79.2 | 65.5 | 1.0 | 83.7 | 70.6 | 1.0 | ||||||||||||||||||
| UK |
18.5 | 17.1 | 0.7350 | 22.6 | 20.9 | 0.7186 | 16.2 | 15.6 | 0.7534 | 17.5 | 16.7 | 0.7644 | ||||||||||||||||||
| France |
||||||||||||||||||||||||||||||
| Germany |
10.9 | 9.9 | 0.8388 | 11.6 | 10.7 | 0.8134 | 10.6 | 9.8 | 0.8491 | 11.4 | 10.4 | 0.8514 | ||||||||||||||||||
| Italy |
6.4 | 6.1 | 0.8388 | 6.5 | 6.4 | 0.8134 | 6.0 | 5.5 | 0.8491 | 4.0 | 3.4 | 0.8514 | ||||||||||||||||||
| Spain |
9.4 | 6.5 | 0.8388 | 8.8 | 6.1 | 0.8134 | 6.9 | 4.5 | 0.8491 | 6.5 | 4.4 | 0.8514 | ||||||||||||||||||
| Subtotal |
112.7 | 94.3 | 120.5 | 102.4 | 119.0 | 100.9 | 123.1 | 105.4 | ||||||||||||||||||||||
| All other |
36.0 | 28.0 | Misc. | 35.5 | 26.2 | Misc. | 38.6 | 30.2 | Misc. | 36.8 | 27.2 | Misc. | ||||||||||||||||||
| Exclusions |
||||||||||||||||||||||||||||||
| Oncology(1) |
0.0 | 0.0 | 0.1 | 0.1 | 0.2 | 0.2 | 0.0 | 0.0 | ||||||||||||||||||||||
| Transplant Indications* |
** | ** | ** | ** | ** | ** | ** | ** | ||||||||||||||||||||||
Legend:
| (I): | Aggregate gross amount invoiced by the Company, its Affiliates and its licensees for sales of the Product by the Company, its Affiliates and licensees of the Company and its Affiliates to third parties, in millions of United States dollars. |
| (II): | Product Sales, in millions of United States dollars. |
| X-rate: | Exchange rates used for conversion of the specified Major Market’s foreign currency into United States dollars for the quarter indicated. Exchange rates for other markets will be provided to the extent there are sales invoiced in currencies other than the United States dollar. |
| *: | Note that amounts appearing in this line are a subset of the amounts appearing in the “Oncology” line, above, provided for information purposes and calculated by reference to relevant data compiled by the UNOS (United Network for Organ Sharing). |
| **: | During the period under review, there was no Transplant Indication stock keeping units (SKUs) recorded. UNOS data specifying Transplant Indication usage for the specified period is not available as of the date of this Statement. |
| N/A: | Not applicable. |
| (1): | Commercialized Campath® is currently available exclusively in Japan, for the rest of world Campath® is being made available to patients at no cost through a patient access/distribution program. Commercial sales in Japan amount to 0.04 million of United States dollars during the quarter. |
Do Product Sales in the Product Sales Measuring Period ended June 30, 2018 include Product Sales of a Combination Product? ☒ No ☐ Yes
Has any Product Sales Milestone been achieved during the Product Sales Measuring Period ended June 30, 2018? ☒ No ☐ Yes
Based upon actual sales trends to date, Sanofi does not expect that Product Sales Milestones #2-4 will be met.
After due inquiry and to the best of the knowledge and belief of the undersigned, the undersigned hereby certifies that the information set forth in this statement is true, complete and correct.
| Sanofi | ||
| By: | /s/ Jérôme Contamine | |
| Name: | Jérôme Contamine | |
| Title: | Executive Vice President, Chief Financial Officer | |
| Date: July 30, 2018 | ||
Serious News for Serious Traders! Try StreetInsider.com Premium Free!
You May Also Be Interested In
- Sanofi (SNY) Said To Ask Banks To Pitch For Role On $20B OTC Spinoff - Bloomberg
- CureVac Announces Financial Results for the Fourth Quarter and Full-Year 2023 and Provides Business Update
- Watsco Reports Record First Quarter Sales, Record Cash Flow and Improving Business Trends Ahead of Summer Selling Season
Create E-mail Alert Related Categories
SEC FilingsSign up for StreetInsider Free!
Receive full access to all new and archived articles, unlimited portfolio tracking, e-mail alerts, custom newswires and RSS feeds - and more!
