

Form 6-K Performance Shipping For: May 31
 Tweet
Tweet Share
ShareFORM 6-K
SECURITIES AND EXCHANGE COMMISSION
WASHINGTON, D.C. 20549
WASHINGTON, D.C. 20549
REPORT OF FOREIGN PRIVATE ISSUER PURSUANT TO RULE 13A-16 OR 15D-16 OF THE SECURITIES EXCHANGE ACT OF 1934
For the month of May 2021
Commission File Number: 001-35025
PERFORMANCE SHIPPING INC.
(Translation of registrant's name into English)
(Translation of registrant's name into English)
373 Syngrou Avenue, 175 64 Palaio Faliro, Athens, Greece
(Address of principal executive office)
(Address of principal executive office)
Indicate by check mark whether the registrant files or will file annual reports under cover of Form 20-F or Form 40-F.
Form 20-F [X] Form 40-F [ ]
Indicate by check mark if the registrant is submitting the Form 6-K in paper as permitted by Regulation S-T Rule 101(b)(1): [ ].
Note: Regulation S-T Rule 101(b)(1) only permits the submission in paper of a Form 6-K if submitted solely to provide an attached annual
report to security holders.
Indicate by check mark if the registrant is submitting the Form 6-K in paper as permitted by Regulation S-T Rule 101(b)(7): [ ].
Note: Regulation S-T Rule 101(b)(7) only permits the submission in paper of a Form 6-K if submitted to furnish a report or other document
that the registrant foreign private issuer must furnish and make public under the laws of the jurisdiction in which the registrant is incorporated, domiciled or legally organized (the registrant's "home country"), or under the rules of the home
country exchange on which the registrant's securities are traded, as long as the report or other document is not a press release, is not required to be and has not been distributed to the registrant's security holders, and, if discussing a material
event, has already been the subject of a Form 6-K submission or other Commission filing on EDGAR.
INFORMATION CONTAINED IN THIS FORM 6-K REPORT
Attached to this Report on Form 6-K as Exhibit 99.1 is an investor presentation dated May 2021 of Performance Shipping Inc. (the “Company”).
SIGNATURES
Pursuant to the requirements of the Securities Exchange Act of 1934, the registrant has duly caused this report to be signed on its behalf by the undersigned, thereunto duly
authorized.
PERFORMANCE SHIPPING INC.
(registrant)
|
Dated: May 24, 2021
|
By:
|
/s/ Andreas Michalopoulos
|
|
Andreas Michalopoulos
|
||
|
Chief Executive Officer
|
Exhibit 99.1

May 2021 A Pure - Play Tanker Company

Disclosure 2 Matters discussed in this presentation may constitute forward-looking statements. The
Private Securities Litigation Reform Act of 1995 provides safe harbor protections for forward-looking statements in order to encourage companies to provide prospective information about their business. Forward-looking statements include, but
are not limited to, statements concerning plans, objectives, goals, strategies, future events or performance, and underlying assumptions and other statements, which are other than statements of historical facts.The Company desires to take
advantage of the safe harbor provisions of the Private Securities Litigation Reform Act of 1995 and is including this cautionary statement in connection with this safe harbor legislation. The words "believe," "anticipate," "intends,"
"estimate," "forecast," "project," "plan," "potential," "may," "should," "expect," "pending," and similar expressions, terms, or phrases may identify forward-looking statements.The forward-looking statements in this presentation are based upon
various assumptions, many of which are based, in turn, upon further assumptions, including without limitation, our management's examination of historical operating trends, data contained in our records and other data available from third
parties. Although we believe that these assumptions were reasonable when made, because these assumptions are inherently subject to significant uncertainties and contingencies which are difficult or impossible to predict and are beyond our
control, we cannot assure you that we will achieve or accomplish these expectations, beliefs or projections.In addition to these important factors, other important factors that, in our view, could cause actual results to differ materially from
those discussed in the forward-looking statements include the strength of world economies, fluctuations in currencies and interest rates, general market conditions, including fluctuations in charter hire rates and vessel values, changes in
demand for our vessels, changes in the supply of vessels, changes in worldwide oil production and consumption and storage, changes in our operating expenses, including bunker prices, crew costs, dry-docking and insurance costs, our future
operating or financial results, availability of financing and refinancing, changes in governmental rules and regulations or actions taken by regulatory authorities, potential liability from pending or future litigation, general domestic and
international political conditions, the length and severity of epidemics and pandemics, including the ongoing outbreak of the novel coronavirus (COVID-19) and its impact on the demand for seaborne transportation of petroleum and other types of
products, changes in governmental rules and regulations or actions taken by regulatory authorities, potential liability from pending or future litigation, general domestic and international political conditions or events, including “trade
wars”, acts by terrorists or acts of piracy on ocean-going vessels, potential disruption of shipping routes due to accidents, labor disputes or political events, vessel breakdowns and instances of off-hires and other important factors. Please
see our filings with the U.S. Securities and Exchange Commission for a more complete discussion of these and other risks and uncertainties

Agenda Section 2: Financial Presentation 3 Section 1: Company Overview Section 3:
Appendix
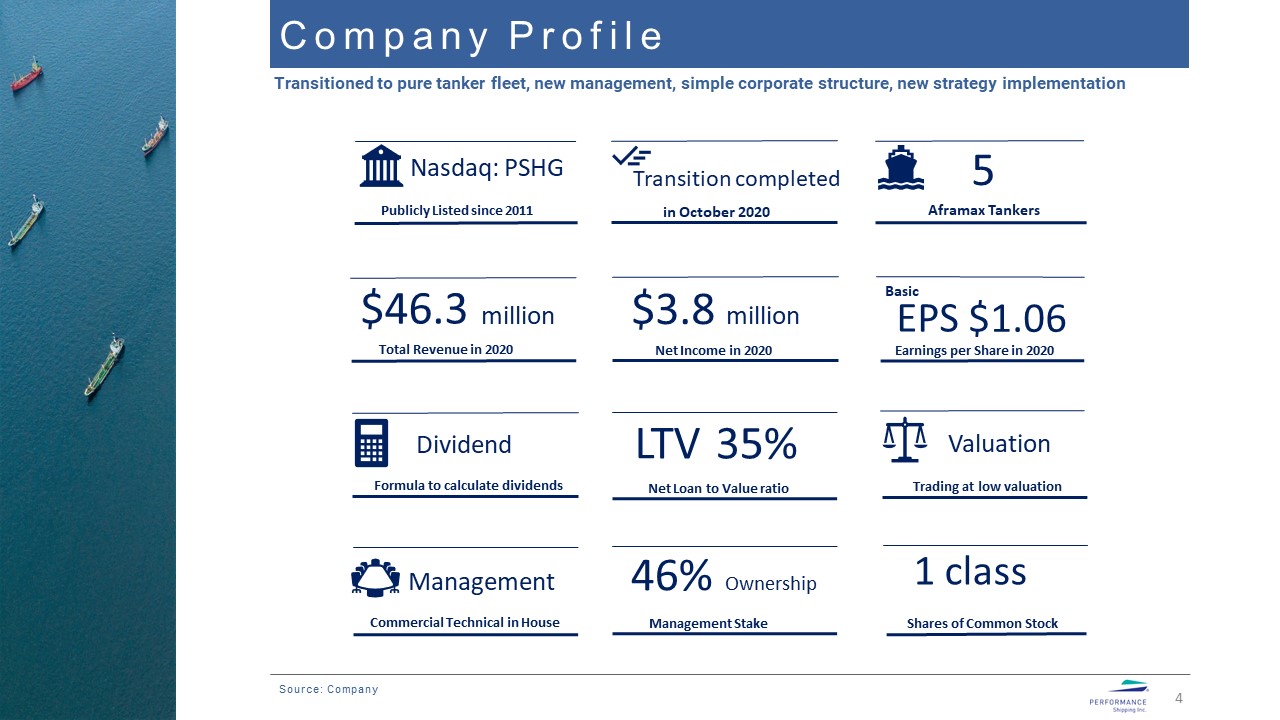
Company Profile 4 Source: Company 5 Aframax Tankers $46.3 million Total Revenue in 2020 LTV Net
Loan to Value ratio 35% $3.8 million Net Income in 2020 Nasdaq: PSHG Publicly Listed since 2011 EPS Earnings per Share in 2020 $1.06 Basic Transitioned to pure tanker fleet, new management, simple corporate structure, new strategy
implementation Management Stake 46% Ownership Shares of Common Stock 1 class Dividend Formula to calculate dividends Management Commercial Technical in House Valuation Trading at low valuation Transition completed in October
2020
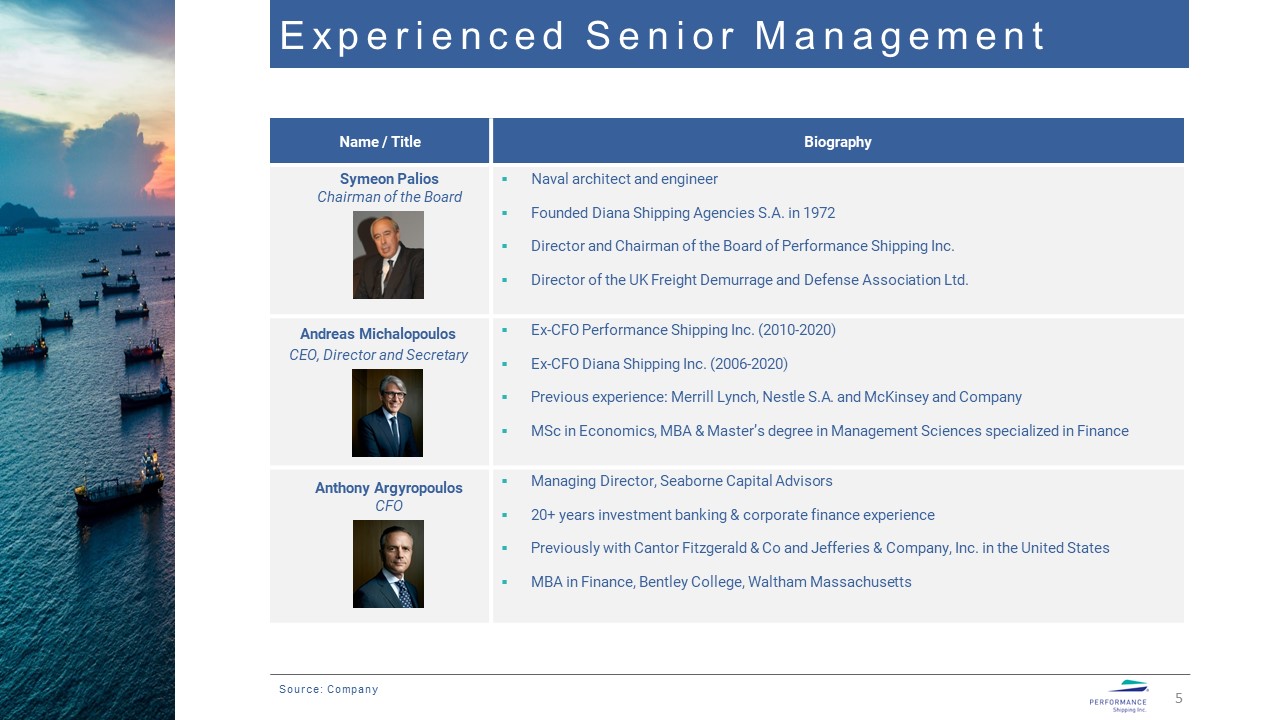
Experienced Senior Management 5 Name / Title Biography Symeon PaliosChairman of the Board Naval
architect and engineerFounded Diana Shipping Agencies S.A. in 1972Director and Chairman of the Board of Performance Shipping Inc. Director of the UK Freight Demurrage and Defense Association Ltd. Ex-CFO Performance Shipping Inc.
(2010-2020)Ex-CFO Diana Shipping Inc. (2006-2020)Previous experience: Merrill Lynch, Nestle S.A. and McKinsey and CompanyMSc in Economics, MBA & Master’s degree in Management Sciences specialized in Finance Managing Director, Seaborne
Capital Advisors20+ years investment banking & corporate finance experiencePreviously with Cantor Fitzgerald & Co and Jefferies & Company, Inc. in the United StatesMBA in Finance, Bentley College, Waltham Massachusetts Source:
Company Anthony ArgyropoulosCFO Andreas MichalopoulosCEO, Director and Secretary
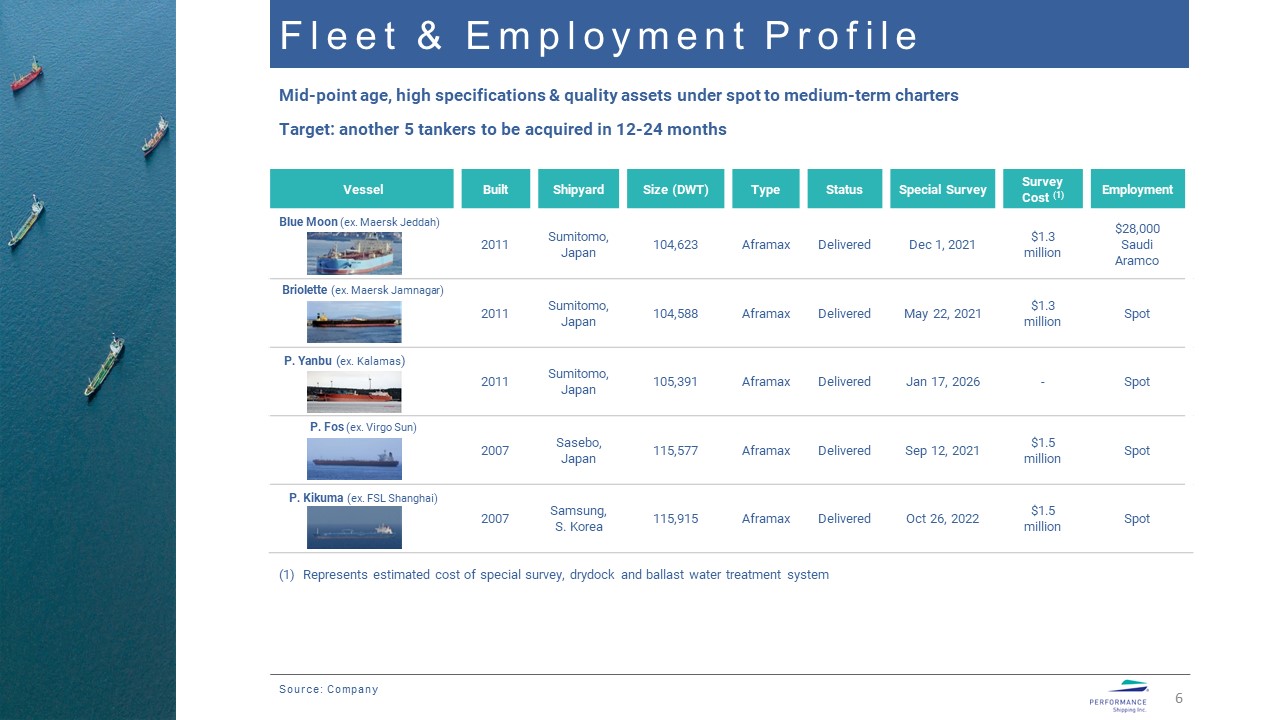
Fleet & Employment Profile 6 Vessel Built Shipyard Size (DWT) Type Status Special
Survey Survey Cost (1) Employment Blue Moon (ex. Maersk Jeddah) 2011 Sumitomo, Japan 104,623 Aframax Delivered Dec 1, 2021 $1.3 million $28,000Saudi Aramco Briolette (ex. Maersk Jamnagar) 2011 Sumitomo,
Japan 104,588 Aframax Delivered May 22, 2021 $1.3 million Spot P. Yanbu (ex. Kalamas) 2011 Sumitomo, Japan 105,391 Aframax Delivered Jan 17, 2026 - Spot P. Fos (ex. Virgo Sun) 2007 Sasebo,
Japan 115,577 Aframax Delivered Sep 12, 2021 $1.5 million Spot P. Kikuma (ex. FSL Shanghai) 2007 Samsung,S. Korea 115,915 Aframax Delivered Oct 26, 2022 $1.5 million Spot Mid-point age, high specifications & quality assets
under spot to medium-term charters Represents estimated cost of special survey, drydock and ballast water treatment system Target: another 5 tankers to be acquired in 12-24 months Source: Company
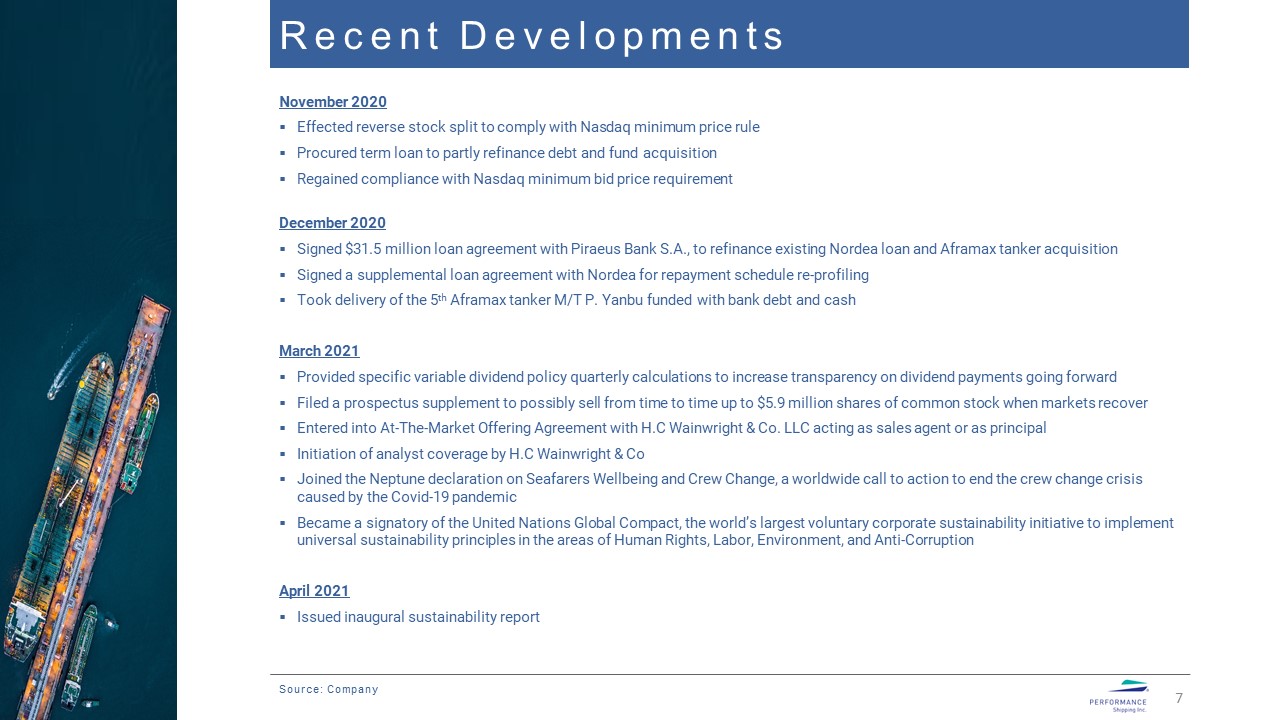
Recent Developments 7 Source: Company November 2020Effected reverse stock split to comply with Nasdaq
minimum price ruleProcured term loan to partly refinance debt and fund acquisitionRegained compliance with Nasdaq minimum bid price requirementDecember 2020Signed $31.5 million loan agreement with Piraeus Bank S.A., to refinance existing Nordea
loan and Aframax tanker acquisitionSigned a supplemental loan agreement with Nordea for repayment schedule re-profilingTook delivery of the 5th Aframax tanker M/T P. Yanbu funded with bank debt and cashMarch 2021Provided specific variable
dividend policy quarterly calculations to increase transparency on dividend payments going forwardFiled a prospectus supplement to possibly sell from time to time up to $5.9 million shares of common stock when markets recoverEntered into
At-The-Market Offering Agreement with H.C Wainwright & Co. LLC acting as sales agent or as principalInitiation of analyst coverage by H.C Wainwright & CoJoined the Neptune declaration on Seafarers Wellbeing and Crew Change, a worldwide
call to action to end the crew change crisis caused by the Covid-19 pandemicBecame a signatory of the United Nations Global Compact, the world’s largest voluntary corporate sustainability initiative to implement universal sustainability
principles in the areas of Human Rights, Labor, Environment, and Anti-CorruptionApril 2021Issued inaugural sustainability report

Focused Business Strategy 8 Transparent company provides investors with low leverage variable
dividend exposure to the tanker sector Fleet Composition Source: Company Target net leverage below 35% LTV at incurrenceEquity capital markets reliance for disciplined growthReserves for fleet replacement & maintenanceCash to
shareholders through variable dividends Expert in-house technical and commercial managerMajority independent BOD, transparent corporate structureManagement major shareholder, one class common stockESG efforts, strive towards sustainable
development goals Commercial Deployment Financial Parameters Spot market focus, short to medium term chartersEstablished commercial relationshipsPresence in all major marketsEast and west of Suez Canal Management Transparency

Technical & Commercial Management 9 Technical & Commercial Manager, Unitized Ocean Transport
Limited (UOT) our Wholly-Owned Subsidiary Full-Service Platform Services CharteringOperationsInsurance/ClaimsTechnicalPurchasingCrewingQuality AssuranceFinanceAccounting/ReportingLegal S&P Source: Company. Key Professionals Access to
Top-Tier Charterers Mr. Ioannis Karagiannis – Commercial Director Captain Nikolaos Gavalas – Operations DirectorCaptain Panos Chatzikyriakos – HSQE DirectorMr. Argyris L. Chachalis – Technical Director Established efficient operations with
low vessel operating expenses We fully fund all commercial and technical services provided by UOT

Agenda Section 2: Financial Presentation 10 Section 1: Company Overview Section 3:
Appendix
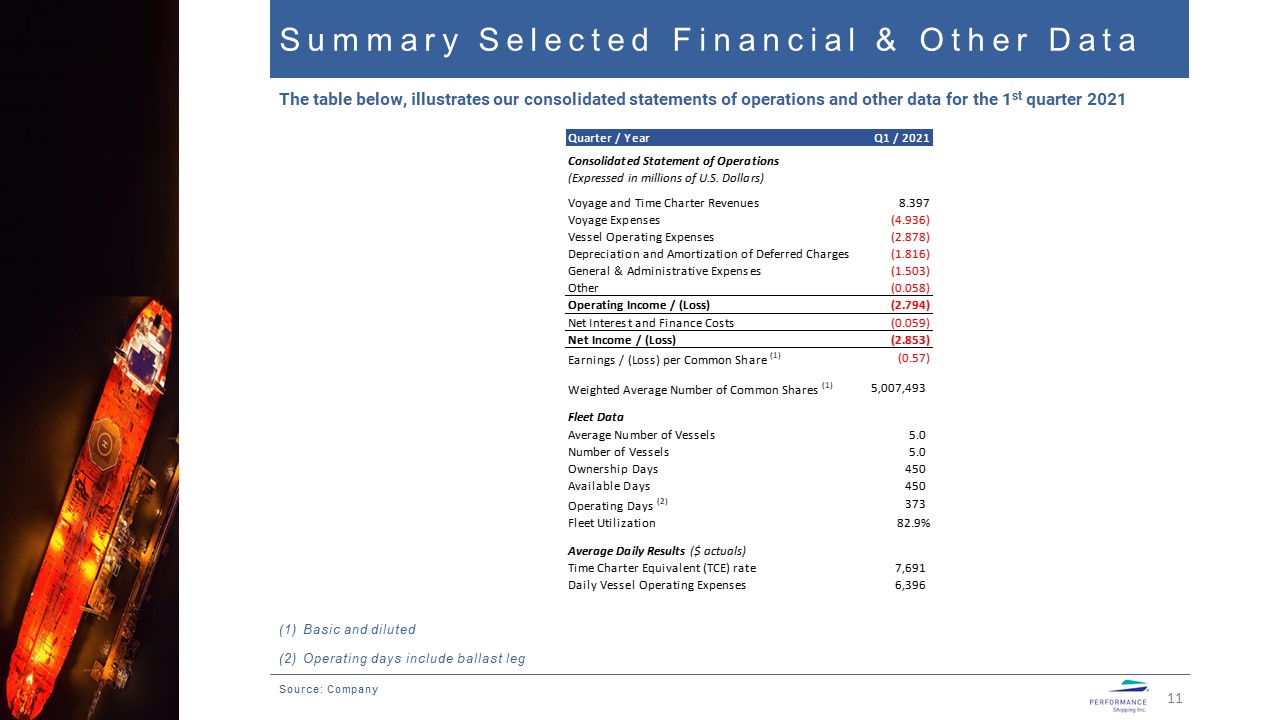
Summary Selected Financial & Other Data 11 Source: Company The table below, illustrates our
consolidated statements of operations and other data for the 1st quarter 2021 Basic and dilutedOperating days include ballast leg

Debt Description 12 Source: Company Vessel Debt Drawdown($m) Debt Outstanding (Mar 31, 2021) Annual
Repayment($m) Interest Rate Maturity Blue Moon 16.5 13.5 1.77 L + 2.75% Jul 2024 Briolette 16.5 13.7 1.96 L + 2.75% Jul 2024 P. Yanbu 8.8 8.5 0.98 L + 2.85% Dec 2024 P. Fos 14.0 10.2 1.59 L + 2.85% Dec 2024 P.
Kikuma 12.0 10.2 1.59 L + 2.85% Dec 2024 TOTAL 67.8 56.1 7.89 - - Bank Relationships Indebtedness exclusively comprising of efficient secured amortizing loan from relationship banks, with annual repayment following new refinancing
with new term loan and 5th Aframax tanker acquisition
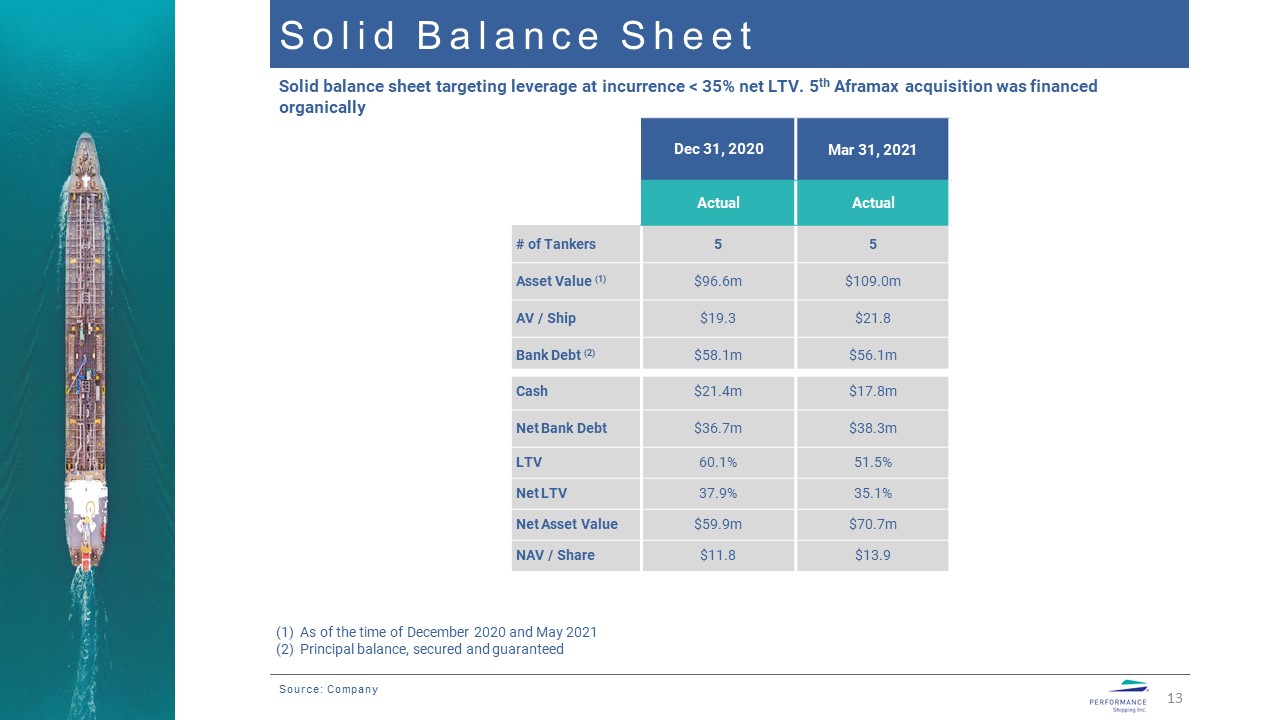
Solid Balance Sheet 13 Dec 31, 2020 Mar 31, 2021 Actual Actual # of Tankers 5 5 Asset Value
(1) $96.6m $109.0m AV / Ship $19.3 $21.8 Bank Debt (2) $58.1m $56.1m Cash $21.4m $17.8m Net Bank Debt $36.7m $38.3m LTV 60.1% 51.5% Net LTV 37.9% 35.1% Net Asset Value $59.9m $70.7m NAV / Share $11.8 $13.9 Source:
Company Solid balance sheet targeting leverage at incurrence < 35% net LTV. 5th Aframax acquisition was financed organically As of the time of December 2020 and May 2021Principal balance, secured and guaranteed

Equity Capital Markets 14 Source: Company Major Shareholders Capital Markets
Exchanged Nasdaq Category Capital Market Ticker PSHG Outstanding Shares 5,082,726 Indicative Share Price $5.0 Market Capitalization $25.4m Enterprise Value $63.7m EV / Ship $12.7m Company has one class of equity securities,
target to gradually increase its free float and trading volume Average Daily Trading Volume (last 30 days) Aliki Palios, Director 46.3% Other Officers and Directors 4.3% Public free Float 49.4% # Shares 65,820 $
Value $329,100 Currently trading modestly above cash, much below replacement cost and at very deep discount to net asset value

Historical Rates vs Break Even 15 Source: Company Indicative Run Rate Breakeven Amounts in millions
except daily figures 5 Ships 10 Ships DAILY OPEX $7,000 $7,000 OWNERSHIP DAYS 1,825 3,650 FLEET OPEX $12.8 $25.5 G&A EXPENSES $5.7 $6.5 DEBT REPAYMENT (1) $7.9 $11.4 INTEREST EXPENSE (2) $1.6 $2.4 MAINTENANCE
RESERVE $1.7 $3.5 TOTAL OUTFLOWS $29.7 $49.3 DAILYBREAK EVEN RATE $16,256 $13,505 The above figures do not include non-cash items which will result in differences with actual reported results Debt repayment for 10 ships based on
additional $35m debt with repayment profile similar to the existing term loans(2) Based on LIBOR at 0.16% Expected daily breakeven rate per vessel (5 Aframax fleet) Further fleet expansion from 5 to 10 vessels over next 12 - 24 months
expected to reduce daily breakeven level above which we generate cashflow available for dividends High and Low represent one standard deviation

Value created under most market scenarios with charter rates above our breakeven levels generating
multiples of quarterly cash flow compared to those below breakeven levels Through Cycle Value Generation 1/2 16 We used the trailing 5-year historical Aframax spot charter rates (Q2/2016 – Q1/2021) and assumed all vessels operated in the
spot market incurring the expenses in our indicative run rate breakeven table, to determine quarterly cash flows that may have been available for dividends after higher of capital costs or replacement reserves and after maintenance reserves
$14.9m $6.4m $1.2m Break-even $16,256 $13,505 -$3.3m -$5.0m Quarterly FCF 5 Tankers Quarterly FCF 10 Tankers 9 Quarters $32.3m $15.3m $4.8m Highest $52,853 Median $20,315 High $32,624 -$4.2m -$7.5m 11 Quarters Low $9,662
Lowest $5,713 12 Quarters 8 Quarters Source: Company Results are hypothetical and may not be repeated in the future
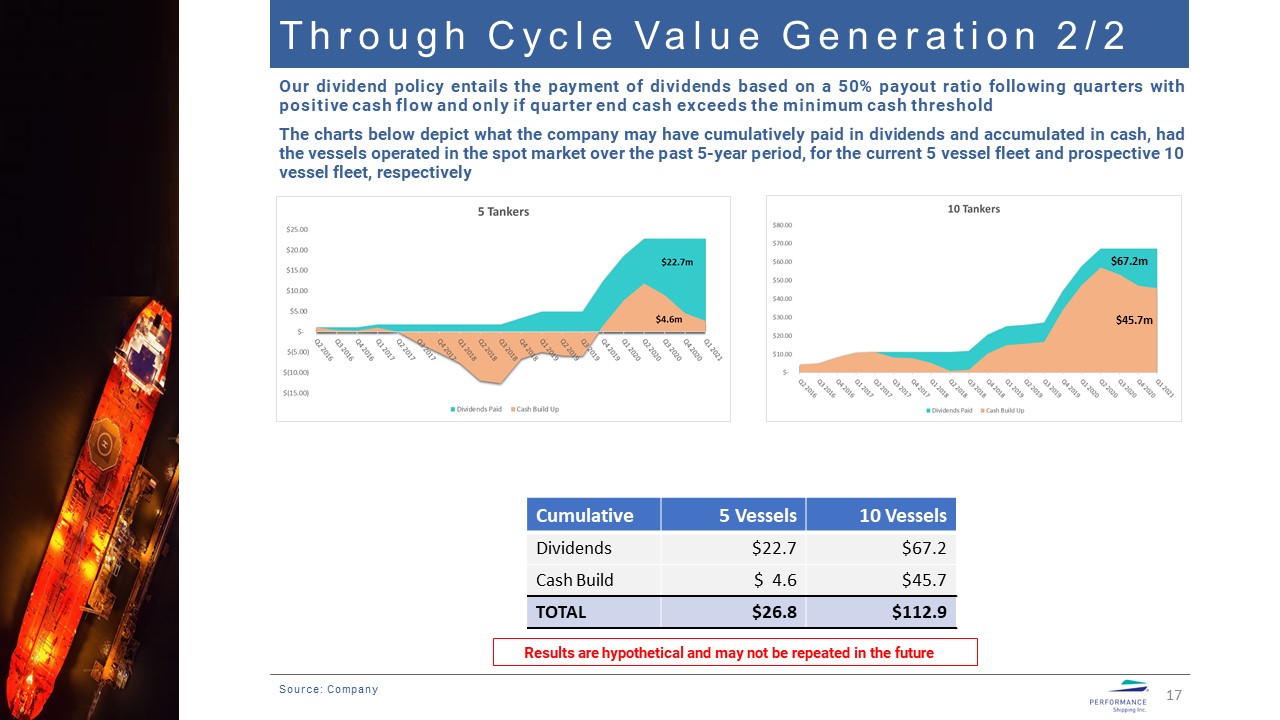
Through Cycle Value Generation 2/2 17 Source: Company Our dividend policy entails the payment of
dividends based on a 50% payout ratio following quarters with positive cash flow and only if quarter end cash exceeds the minimum cash thresholdThe charts below depict what the company may have cumulatively paid in dividends and accumulated in
cash, had the vessels operated in the spot market over the past 5-year period, for the current 5 vessel fleet and prospective 10 vessel fleet, respectively Cumulative 5 Vessels 10 Vessels Dividends $22.7 $67.2 Cash Build $
4.6 $45.7 TOTAL $26.8 $112.9 Results are hypothetical and may not be repeated in the future $45.7m $67.2m

Attractive Equity Story 18 Performance Shipping is a compelling play on a tanker vessel recovery
1 2 3 4 5 6 7 Source: Company

Agenda Section 2: Financial Presentation 19 Section 1: Company Overview Section 3:
Appendix

Dividend Policy – Quarterly Calcs 20 The company expects to pay dividends only if during the
preceding quarter both Quarterly Cash Flow and Quarter End Excess Cash are positiveQuarter End Excess Cash is defined as actual end of quarter Cash and Cash Equivalents over Minimum Cash Threshold. Minimum Cash Threshold is defined as the sum
of $9.0m minimum liquidity pursuant to the loan agreements and $1.5m per vesselQuarterly Cash Flow is defined as voyage and time charter revenues less voyage expenses, less vessel operating expenses, less general and administrative expenses,
less - the greater of i) net interest expense and repayment of debt or ii) fleet replacement reserves - and less maintenance reserves for the fleetThe quarterly dividend payments, if any, are expected to be based on a pay-out ratio of the lower
of i) Quarterly Cash Flow and ii) Quarter End Excess CashWe expect the payout ratio of 50% to increase as the company leverage decreases – maximum 90% if leverage (total debt/equity market capitalization) is <10% Source: Company
Serious News for Serious Traders! Try StreetInsider.com Premium Free!
You May Also Be Interested In
- REGENT Advances the Future of Coastal Transportation in Abu Dhabi
- Works By JD Offers Expert Interior Home Painting Services
- Groupe SEB: First-quarter 2024 Sales and Financial Data
Create E-mail Alert Related Categories
SEC FilingsSign up for StreetInsider Free!
Receive full access to all new and archived articles, unlimited portfolio tracking, e-mail alerts, custom newswires and RSS feeds - and more!
