

Form 6-K NexGen Energy Ltd. For: Feb 25
 Tweet
Tweet Share
Share
UNITED STATES
SECURITIES AND EXCHANGE COMMISSION
Washington, D.C. 20549
Form 6-K
REPORT OF FOREIGN PRIVATE ISSUER
PURSUANT TO RULE 13a-16 OR 15d-16
OF THE SECURITIES EXCHANGE ACT OF 1934
For the month of February 2021
Commission File Number 001-38072
NexGen Energy Ltd.
(Translation of registrant’s name into English)
Suite 3150, 1021 – West Hastings Street
Vancouver, B.C., Canada V6E 0C3
(Address of principal executive offices)
Indicate by check mark whether the registrant files or will file annual reports under cover of Form 20-F or Form 40-F.)
Form 20-F ☐ Form 40-F ☒
Indicate by check mark if the registrant is submitting the Form 6-K in paper as permitted by Regulation S-T Rule 101(b)(1) ☐
Indicate by check mark if the registrant is submitting the Form 6-K in paper as permitted by Regulation S-T Rule 101(b)(7) ☐
EXHIBIT INDEX
| Exhibit |
Description | |
| 99.1 | Material Change Report, dated February 24, 2021, with respect to the conversion of outstanding debentures | |
| 99.2 | Material Change Report, dated February 24, 2021,with respect to the filing of a Technical Report on Feasibility Study | |
2
SIGNATURES
Pursuant to the requirements of the Securities Exchange Act of 1934, the registrant has duly caused this report to be signed on its behalf by the undersigned, thereunto duly authorized, on February 25, 2021.
| NEXGEN ENERGY LTD. | ||||
| By: | /s/ Leigh Curyer | |||
| Name: |
Leigh Curyer | |||
| Title: | Chief Executive Officer | |||
3
Exhibit 99.1
|
FORM 51-102F3
MATERIAL CHANGE REPORT
| Item 1 | Name and Address of Company: |
NexGen Energy Ltd. (“NexGen” or the “Corporation”)
Suite 3150, 1021 West Hastings Street
Vancouver, BC V6E 0C3
| Item 2 | Date of Material Change: |
February 18, 2021
| Item 3 | News Release: |
On February 18, 2021, the Corporation issued a news release disclosing the material change through CNW Group Ltd. (a Cision Company).
| Item 4 | Summary of Material Change: |
On February 18, 2021, the Corporation announced that the registered holders of the entire US$120 million aggregate principal amount of Convertible Debentures issued in 2016 and 2017 (collectively, the “Debentures”) had provided notice to NexGen and the indenture trustee that they have elected to convert the Debentures into common shares of NexGen (“Common Shares”) pursuant to the terms of the relevant trust indenture governing the Debentures.
| Item 5 | Full Description of Material Change: |
On February 18, 2021, the Corporation announced that the registered holders of the entire US$120 million aggregate principal amount of Debentures had provided notice to NexGen and the indenture trustee that they have elected to convert the Debentures into Common Shares pursuant to the terms of the relevant trust indenture governing the Debentures.
The registered holders of the Debentures are affiliates of CEF Holdings Limited and its shareholders (“CEF”). The Debentures consist of US$60 million aggregate principal amount of 7.5% unsecured convertible debentures issued by the Company in 2016 (the “2016 Debentures”) and US$60 million aggregate principal amount of 7.5% unsecured convertible debentures issued by the Company in 2017 (the “2017 Debentures”), both due to mature on July 22, 2022.
Under their terms, the Debentures are convertible into Common Shares at a price of US$2.3261 for the 2016 Debentures and US$2.6919 for the 2017 Debentures. Such Common Shares will be deemed to have been issued on the effective date of conversion, as provided for in the relevant trust indenture governing the Debentures. Upon issuance, CEF’s percentage ownership of the issued and outstanding Common Shares will increase from ~8.7% to ~18.7%.
| Item 6 | Reliance on subsection 7.1(2) of National Instrument 51-102: |
Not applicable.
| Item 7 | Omitted Information: |
No significant facts otherwise required to be disclosed in this report have been omitted.
| Item 8 | Executive Officer: |
The following executive officer of the Corporation is knowledgeable about the material change and may be contacted respecting the change:
Leigh Curyer
Chief Executive Officer
Phone: (604) 428-4112
Email: [email protected]
| Item 9 | Date of Report: |
February 24, 2021
- 2 -
Exhibit 99.2
|
|
FORM 51-102F3
MATERIAL CHANGE REPORT
ITEM 1 – NAME AND ADDRESS OF COMPANY
NexGen Energy Ltd. (“NexGen” or the “Company”)
Suite 3150, 1021 West Hastings Street
Vancouver, BC V6E 0C3
ITEM 2 – DATE OF MATERIAL CHANGE
February 22, 2021
ITEM 3 – NEWS RELEASE
On February 22, 2021, NexGen issued a news release through CNW Group (Cision). The news release was also filed on the System for Electronic Document Analysis and Retrieval (“SEDAR”) and on the Electronic Data Gathering, Analysis and Retrieval system (“EDGAR”), and is available under NexGen’s profiles at www.sedar.com and www.sec.gov.
ITEM 4 – SUMMARY OF MATERIAL CHANGE
On February 22, 2021, NexGen announced positive results from an independent feasibility study including an updated mineral reserve and mineral resources estimate of the basement-hosted Arrow Deposit, located on the Company’s 100% owned Rook 1 project (“Rook I Project”) in the Athabasca Basin in Saskatchewan, Canada. On February 23, 2021 a technical report (the “Rook I FS Technical Report”) in respect of the Project was filed on SEDAR and EDGAR entitled “Arrow Deposit, Rook I Project Saskatchewan NI 43-101 Technical Report on Feasibility Study” with an effective date of February 22, 2021.
ITEM 5.1 – FULL DESCRIPTION OF MATERIAL CHANGE
On February 22, 2021, NexGen announced positive results from the Rook I FS Technical Report, including an updated mineral reserve and mineral resources estimate of the Rook I Project. On February 23, 2021 the Technical Report was filed on SEDAR and EDGAR.
Summary
NexGen retained Stantec Consulting Ltd. (“Stantec”), Wood Canada Limited (“Wood”), Roscoe Postle Associates Inc. (“RPA”) part of SLR Consulting (Canada) Ltd., and Golder Associates Ltd. (”Golder”) to complete the Rook I FS Technical Report regarding the Arrow uranium deposit within the Rook I Project site in Saskatchewan, Canada.
Principal Outcomes
The Rook I FS Technical Report is based on NexGen processing 4,575 kt of uranium grading 2.37% U3O8 (probable reserve) at the Arrow Deposit. Processing will take place over an 11-year mine life to produce 233.6 Mlb of recovered yellowcake (YC), with an average metallurgical recovery of 97.5%.
The economic analysis is based on the timing of a final investment decision (“FID”), and it does not include the pre-commitment early works capital costs, which are costs NexGen intends on expending prior to the FID. The pre-commitment early works scope includes preparing the site, completing initial freeze hole drilling, and building the supporting infrastructure (i.e., concrete batch plant, Phase I camp accommodations, and bulk fuel storage) required for the Rook I Project. Costs for the pre-commitment early works will total an estimated C$158 million.
The total capital cost carried in the economic model is C$1,573.9 million, inclusive of C$1,142.0 million in pre-production capital costs, C$362.4 million of sustaining capital costs, and C$78.6 million of closure / reclamation costs, less $9.1 million in salvage.
Total life of mine (“LOM”) operating costs are estimated to be C$1,769.8 million. On a pre-tax basis, the net present value (“NPV”) at 8% is C$5,577.0 million, the internal rate of return (“IRR”) is 64.9%, and the assumed payback period is 0.8 years. On a post-tax basis, the NPV at 8% is C$3,465.0 million, the IRR is 52.4%, and the assumed payback period is 0.9 years. The payback period is calculated from the start of production.
Terms of Reference
The Rook I FS Technical Report was prepared as a National Instrument 43-101 Technical Report for NexGen by Stantec, Wood, RPA, and Golder, and was filed with the Canadian Securities Administrators on SEDAR. The quality of information, conclusions, and estimates contained herein is consistent with the level of effort based on:
| • | information available at the time of preparation; |
| • | data supplied by outside sources; and |
| • | the assumptions, conditions, and qualifications set forth in this report. |
This report is written in Canadian English and uses SI units of measurement, unless otherwise indicated. Monetary units are expressed in Canadian dollars (CAD), except for uranium pricing, which is expressed in United States dollars (USD).
Project Setting
The Rook I Project is located in northwest Saskatchewan, approximately 40 km east of the Alberta–Saskatchewan border, 150 km north of the town of La Loche, and 640 km northwest of the city of Saskatoon. The Rook I Project can be accessed via all-weather gravel, Highway 955, which travels north-south approximately 8 km west of the Arrow Deposit. From Highway 955, a 13 km long all-weather, single-lane road provides access to the western portion of the Rook I Project, including the Arrow Deposit area.
The Rook I Project will take place in a region with a sub-arctic climate typical of mid-latitude continental areas. It is expected that mining activities will be conducted on a year-round basis.
The topography of the Rook I Project area is variable. Drumlins and lakes / wetlands dominate the northwest and southeast parts of the project area, respectively; and lowland lakes, rivers, and muskegs dominate the central part of the project area. The northwest part of the project area lies over portions of Patterson Lake and Forrest Lake, which are two of the largest waterbodies within 100 km of the Rook I Project. Elevations range from 583 metres above sea level (“masl”) on drumlins, to 480 masl in lowland lakes. The elevation of Patterson Lake is 499 masl.
- 2 -
The Rook I Project is covered by boreal forest common to the Canadian Shield. Bedrock outcrops are very rare, but are known to exist in areas of the eastern half of the project area.
Mineral Tenure, Surface Rights, Water Rights, Royalties, and Agreements
The Property consists of 32 contiguous mineral claims with a total area of 35,065 ha. All claims are 100% owned by NexGen.
Six of the 32 claims are subject to a 2% net smelter return (“NSR”) royalty payable to Advance Royalty Corporation (“ARC”), and a 10% production carried interest with Terra Ventures Inc. (“Terra”). The NSR may be reduced to 1% upon payment of $1.0 million to ARC. The Arrow Deposit is located outside of these six claims.
As of December 6, 2012, mineral dispositions are defined as electronic mineral claims parcels within the Mineral Administration Registry Saskatchewan (“MARS”) using a Geographical Information System (“GIS”). MARS is a web-based, electronic tenure system used for issuing and administrating mineral permits, claims, and leases. Mineral claims are acquired via electronic map staking, and administration of the dispositions is also web-based.
As of the effective date of the Rook I FS Technical Report, all 32 mineral claims comprising the Rook I property are in good standing, and are all registered in the name of NexGen.
Surface rights are distinct from subsurface or mineral rights. The Rook I Project is located on provincial Crown land; as the owner, the Province of Saskatchewan can grant surface rights under the authority of the Forest Resources Management Act and the Provincial Lands Act. Granting surface rights for the purpose of accessing the land to extract minerals is done by issuing a mineral surface lease subject to the Crown Resource Land Regulations. Mineral surface leases have a 33-year maximum term which may be extended, as necessary.
NexGen does not currently hold surface rights of the project area. Surface rights are obtained after the ministerial review and approval of the Environmental Assessment (“EA”), and the successful negotiation of a mineral surface lease agreement with the Province of Saskatchewan.
RPA is not aware of any environmental liabilities to which the property is subject. RPA is not aware of any other significant factors and risks that may affect access, title, or the right or ability to perform the proposed work program on the Rook I property.
Geology and Mineralization
The Rook I property is located along the southwestern rim of the Athabasca Basin, a large Paleoproterozoic-aged, flat-lying, intracontinental, fluvial, redbed sedimentary basin that covers much of northern Saskatchewan and part of northern Alberta. The Athabasca Basin is ovular at surface, with approximate dimensions of 450 km × 200 km. It reaches a maximum thickness of approximately 1,500 m near its centre.
The southwest portion of the Athabasca Basin is overlain by the flat-lying Phanerozoic stratigraphy of the Western Canada Sedimentary Basin, including the carbonate-rich rocks of the Lower to Middle Devonian Elk Point Group, Lower Cretaceous Manville Group sandstones and mudstones, moderately lithified diamictites, and Quaternary unconsolidated sediments.
- 3 -
South of the Athabasca Basin, where Athabasca sandstone cover becomes thin, paleo-valley fill and debris flow sandstones of the Devonian La Loche / Contact Rapids formation (Alberta) or Meadow Lake (Saskatchewan) formation unconformably overlie the basement rocks.
The Paleoproterozoic basement rocks of the Taltson Domain unconformably underlies the Athabasca Basin and the Phanerozoic stratigraphy within the extents of the Rook I property. The crystalline basement rocks comprise a spectrum of variably altered mafic to ultramafic, intermediate, and local alkaline rock types. The most abundant basement lithologies consist of gneissic, metasomatized-feldspar-rich granitoid rocks, and dioritic to quartz dioritic and quartz monzodioritic gneiss, with lesser granodioritic and tonalitic gneiss.
Mineralization occurs at the following seven locations on the property, and is exclusively hosted in basement lithologies below the unconformity that is overlain by the Athabasca Group.
| • | Arrow Deposit |
| • | South Arrow Discovery |
| • | Harpoon occurrence |
| • | Bow occurrence |
| • | Cannon occurrence |
| • | Camp East occurrence |
| • | Area A occurrence |
Of the seven mineralized locations, the Arrow Deposit has undergone the most investigation.
The Arrow Deposit is currently interpreted as being hosted chiefly in variably altered porphyroblastic quartz-flooded quartz-feldspar-garnet-biotite (± graphite) gneiss. Mineralization at the Arrow Deposit is defined by an area comprised of several steeply dipping shears that have been labelled as the A0, A1, A2, A3, A4, and A5 shears. The A0 through A5 shears locally host high-grade (“HG”) uranium mineralization.
The Arrow Deposit is considered to be an example of a basement-hosted, vein type uranium deposit.
History
The Geological Survey of Canada in 1961 included the Rook I property as part of a larger area.
From 1968 to 1970, Wainoco Oil and Chemicals Ltd. completed airborne magnetic and radiometric surveys, and geochemical sampling programs. No structures or anomalies of interest were detected.
In 1974, Uranerz Exploration and Mining Ltd. completed geological mapping, prospecting, and lake sediment sampling around the property.
From 1976 to 1982, Canadian Occidental Petroleum Ltd. and other companies (e.g., Saskatchewan Mining and Development Corporation (SMDC, now Cameco)) completed airborne INPUT electromagnetic (“EM”) surveys. These surveys detected numerous conductors, many of which were subject to ground surveys prior to drilling.
Airborne magnetic-radiometric surveys were also completed and followed up on with prospecting, geological mapping, lake sediment surveys, and some soil and rock geochemical sampling. Few anomalies were found, other than those that were already located during the airborne and ground EM survey.
From 2005 to 2008, Titan Uranium Inc. (“Titan”) carried out airborne time-domain EM surveys using MEGATEM and Versatile Time Domain Electromagnetic (“VTEM”) systems, which detected numerous strong EM anomalies. A ground MaxMin II survey conducted in 2008 confirmed the airborne anomalies.
- 4 -
In 2012, pursuant to a mineral property acquisition agreement between Mega Uranium Ltd. (“Mega”) and Titan dated February 1, 2012, Mega acquired all nine dispositions comprising the Rook I Project. A gravity survey was completed over 60% of S-113921 through S-113933, which defined several regional features and some additional local smaller scale features. Simultaneously, Mega sampled organic-rich soils and prospected the same area. No soil geochemical anomalies or radioactive boulders were found.
In 2012, NexGen acquired Mega’s interest in the Rook I property.
Exploration Status
Since acquiring the Rook I property in December 2012, NexGen has carried out exploration activities consisting of the following.
| • | Ground gravity surveys |
| • | Ground direct current (DC) resistivity and induced polarization surveys |
| • | Airborne magnetic-radiometric- very low frequency (VLF) survey |
| • | Airborne VTEM survey |
| • | Airborne Z-Axis Tipper electromagnetic (ZTEM) survey |
| • | Airborne gravity survey |
| • | Radon-in-water geochemical survey |
| • | Ground radiometric and boulder prospecting program. |
NexGen also conducted diamond drilling programs to test several targets on the Rook I property, which resulted in the discovery of the Arrow Deposit in drill hole AR-14-001 (formerly known as RK-14-21) in February 2014.
Mineralization at the Arrow Deposit is defined by an area comprising the A0 through A5 shears, which locally host HG uranium mineralization. The mineralized area is 315 m wide, with an overall strike of 980 m. Mineralization is noted to occur 100 m below surface, and it extends to a depth of 980 m. The individual shear zones vary in thickness from 2 m to 60 m. The Arrow Deposit is open in most directions and at depth.
Regional drilling completed by NexGen from 2015–2019 along the Patterson conductive corridor identified new uranium discoveries at the Harpoon, Bow, Cannon, Camp East, and Area A occurrences, and the South Arrow Discovery.
Exploration, Drilling, and Analytical Data Collection in Support of Mineral Resource Estimation
As of the effective date of the Rook I FS Technical Report, NexGen and its predecessors have drilled 754 holes totalling 380,051 m. From 2013 to the effective date of Rook I FS Technical Report, NexGen has drilled 716 holes totaling 374,917 m.
Three types of drill core samples are collected at site for geochemical analysis and uranium assay.
| • | One-metre and 0.5-metre samples taken over intervals of elevated radioactivity, and one metre or two metres beyond radioactivity. |
| • | Point samples taken at nominal spacings of five metres or 50 m for infill holes, which is meant to be representative of the interval or of a particular rock unit. |
| • | Composite samples in the Devonian and Athabasca sandstone units where one-centimetre long pieces are taken and spaced throughout sample intervals ranging from one metre to 10 m long. |
All samples are analyzed at Saskatchewan Research Council (“SRC”) Geoanalytical Laboratories by inductively coupled plasma optical emission spectroscopy (ICP-OES) or inductively coupled plasma mass spectroscopy (ICP-MS) for 64 elements, including uranium. Samples with low radioactivity are analyzed using ICP-MS. Samples with anomalous radioactivity are analyzed using ICP-OES.
- 5 -
NexGen personnel perform full core bulk density measurements using standard laboratory techniques. In mineralized zones, average bulk density is measured from samples at 2.5 m intervals, where possible (i.e., approximately 20% of all mineralized samples). In order for density to be correlated with uranium grades across the data set, each density sample directly correlates with a sample sent to SRC for assay.
Samples are also collected for clay mineral identification using infrared spectroscopy in areas of clay alteration. Samples are typically collected at five-metre intervals. and consist of centimetre-long pieces of core selected by a geologist.
Based on the data validation and the results of the standard, blank, and duplicate analyses, RPA believes that the assay and bulk density databases are of sufficient quality for Mineral Resource estimation at the Arrow Deposit.
RPA is not aware of any drilling, sampling, or recovery factors that could materially impact the accuracy and reliability of the results.
In RPA’s opinion, the drilling, core handling, logging, and sampling procedures meet or exceed industry standards, and are adequate for the purpose of Mineral Resource estimation.
Data Verification
RPA’s data verification steps included site visits during which RPA personnel reviewed core handling, logging, sample preparation and analytical protocols, density measurement system, and storage procedures. RPA also reviewed the Leapfrog model parameters and geological interpretation, reviewed how drill hole collar locations are defined, inspected the use of directional drilling methods, observed the data management system, obtained a copy of the master database, and obtained SRC laboratory certificates for all drilling assays.
A review of the database indicated no significant issues. A separate review of the assay table determined minimal errors, and all are most likely due to rounding. Limitations were not placed on RPA’s data verification process.
RPA considers the resource database reliable and appropriate to support a Mineral Resource estimate.
Metallurgical Test Work
NexGen conducted a metallurgical test program in 2018, which included a bench test program, a pilot plant, and paste backfill testing. Test work samples comprised three composite samples, consisting of low grade (“LG”), medium grade (“MG”), and high grade (“HG”) material, and ten samples of localized deposit areas.
Completed bench test work included the following.
| • | Quantitative evaluation of materials by scanning electron microscopy (QEMSCAN), potential acid generation |
| • | SAGDesignTM and Bond ball mill index |
| • | Batch leach |
| • | Optimization leaching |
| • | Confirmation and variability |
| • | Settling |
| • | Solvent extraction (SX) |
| • | Separating funnel shakeout |
- 6 -
| • | Stripping |
| • | Gypsum precipitation |
| • | YC precipitation |
| • | Preliminary sulfide flotation |
| • | Diagnostic gravity separation |
Additionally, two pilot leaching tests were performed in 2018 using two different feed samples.
In 2019, a series of tests were carried out to advance the process design. These tests were carried out at the SRC facilities and included the following.
| • | Bench-scale testing to recover uranium from gypsum (June 2019). |
| • | Trade-off study / test work of dewatering and washing technologies using belt filters (July 2019). |
| • | Trade-off study / test work of dewatering and washing technologies using centrifuges (August 2019). |
An advanced phase of the paste backfill testing program was conducted in 2019 using drill core samples from the pilot plant program. Geotechnical and geochemical evaluations were performed to validate the mine / mill design, and results will be used in for the Rook I Project’s EA. Test work included investigating the following.
| • | Particle size distribution |
| • | Whole rock analysis |
| • | Mineralogy |
| • | Static yield stress |
| • | Rheology |
| • | Transportable moisture limit |
| • | Uniaxial compressive strength (UCS) |
| • | Process water analysis |
| • | Tailings and kinetic tests |
The Rook I FS Technical Report assumes a metallurgical steady state uranium recovery of 97.6%. This value was determined based on the results of pilot plant test work, and by compiling the performance of unit operation uranium recoveries. Pilot leach testing results indicated uranium extractions of 99.3%. The washing efficiency in the counter current decantation was greater than 99.6%. All other unit operations in the pilot testing had uranium recoveries of greater than 99.6%.
The QEMSCAN analysis identified that there were no primary molybdenum-bearing minerals present. However, molybdenum did occur in chalcopyrite and galena solid solutions. Similarly, there were no arsenic-bearing minerals identified.
Mineral Resource Estimation
The Mineral Resource estimate for the Rook I Project was based on results from 521 diamond drill holes. It was reported using a $50/lb U3O8 price, at a cut-off grade of 0.25% U3O8.
| • | Measured Mineral Resources total 2.18 million tonnes (“Mt”) at an average grade of 4.35% U3O8, for a total of 209.6 million pounds (“Mlb”) of U3O8. |
| • | Indicated Mineral Resources total 1.57 Mt at an average grade of 1.36% U3O8, for a total of 47.1 Mlb U3O8. |
| • | Inferred Mineral Resources total 4.40 Mt at an average grade of 0.83% U3O8, for a total of 80.7 Mlb U3O8. |
The effective date of the Mineral Resource estimate is July 19, 2019. Estimated block model grades are based on chemical assays only. The Mineral Resources were estimated by NexGen and audited by RPA. Mineral Resources are inclusive of Mineral Reserves. RPA has noted that the deposit is open in many directions.
- 7 -
The Arrow Deposit Mineral Resource estimate is based on the results of surface diamond drilling campaigns conducted from 2014–2019. The Mineral Resources of the Arrow Deposit are classified as Measured, Indicated, and Inferred based on drill hole spacing and apparent continuity of mineralization, as summarized in Table 1-1.
Table 1-1: Mineral Resource Estimate – 19 July 2019
| Classification |
Zone |
Tonnage |
Grade |
Contained Metal | ||||
| Measured | A2-LG | 920,000 | 0.79 | 16,000,000 | ||||
| A2-HG | 441,000 | 16.65 | 161,900,000 | |||||
| A3-LG | 821,000 | 1.75 | 31,700,000 | |||||
| Measured Total | – | 2,183,000 | 4.35 | 209,600,000 | ||||
| Indicated | A2-LG | 700,000 | 0.79 | 12,200,000 | ||||
| A2-HG | 56,000 | 9.92 | 12,300,000 | |||||
| A3-LG | 815,000 | 1.26 | 22,700,000 | |||||
| Indicated Total | – | 1,572,000 | 1.36 | 47,100,000 | ||||
| Measured + Indicated | A2-LG | 1,620,000 | 0.79 | 28,100,000 | ||||
| A2-HG | 497,000 | 15.90 | 174,200,000 | |||||
| A3-LG | 1,637,000 | 1.51 | 54,400,000 | |||||
| Measured + Indicated Total | – | 3,754,000 | 3.10 | 256,700,000 | ||||
| Inferred | A1 | 1,557,000 | 0.69 | 23,700,000 | ||||
| A2-LG | 863,000 | 0.61 | 11,500,000 | |||||
| A2-HG | 3,000 | 10.95 | 600,000 | |||||
| A3-LG | 1,207,000 | 1.12 | 29,800,000 | |||||
| A4 | 769,000 | 0.89 | 15,000,000 | |||||
| Inferred Total | – | 4,399,000 | 0.83 | 80,700,000 |
Notes:
| 1. | CIM (2014) definitions were followed for Mineral Resources. |
| 2. | Mineral Resources are reported at a cut-off grade of 0.25% U3O8. |
| 3. | Mineral Resources are estimated using a long-term uranium price of US$50/lb U3O8 and estimated mining costs. |
| 4. | A minimum thickness of one metre was used. |
| 5. | Tonnes are based on bulk density weighting. |
| 6. | Mineral Resources are inclusive of Mineral Reserves. |
| 7. | Mineral Resources that are not Mineral Reserves do not have demonstrated economic viability. |
| 8. | Numbers may not sum due to rounding. |
| 9. | HG = High Grade, LG = Low Grade. |
RPA has reviewed the geology, structure, and mineralization of the Arrow Deposit based on the results of 566 diamond drill holes. RPA has also audited three-dimensional (“3D”) wireframe models developed by NexGen, which represent 0.05% U3O8 grade envelopes with a minimum thickness of one metre.
Of the 566 holes completed, 45 drill holes were drilled on the South Arrow Discovery and were not used for the purposes of the Mineral Resource estimate. The wireframe models representing the Arrow Deposit mineralized zones are intersected in 418 of 566 drill holes. The updated 2019 Mineral Resource estimate does not account for HG domains within A3, which were accounted for in the previous 2017 Mineral Resource estimates. The A3-HG domains were found to be of relatively LG, with average grades just above the HG modelling threshold of 5% U3O8; after the 2019 infill drilling, the variability of grades was better handled with ordinary kriging (“OK”), where the locally varying mean, in conjunction with the density of data, counters grade smearing.
- 8 -
Based on 5,850 dry bulk density determinations for the Arrow Deposit, NexGen developed a formula that relates bulk density to grade. This formula was used to assign a density value to each assay. Bulk density values were then used to weight the grade estimation and convert volume to tonnage.
High grade values were capped, and their influence was further restricted during the block estimation process. High grade outliers were capped at 1%, 2%, 3%, 4%, 5%, 6%, 8%, 10%, 15%, 25%, and 30% U3O8, depending on the domain. This resulted in 428 capped assay values. No outlier assay values were identified in the HG domains. Therefore, no capping was applied to the assays as each HG domain dataset was determined to be stationary and appropriate for interpolation, with the exclusion of the A2-HG8, which was capped at 30% U3O8.
Variable density and grade multiplied by density (“GxD”) were interpolated using OK in the A2-HG domains (excluding A2-HG6 and A2-HG8), the A2-LG domain that envelopes a HG domain, and two large A3-LG domains (301 and 312). Inverse distance squared (ID2) was used on all remaining mineralized domains. Estimates used a minimum of one to three composites per block estimate, to a maximum of 50 composites per block estimate. The majority of the domains used a maximum of two composites per drill hole.
Sample selection criteria were based on sensitivity testing that compared the estimated block means of each domain to the composited mean. Unsampled intervals and samples below the detection limit within the domains were assigned a grade of zero and considered to be internal dilution. Hard boundaries were used to limit the use of composites between domains. Block grade was derived by dividing the interpolated GxD value by the interpolated density value for each block.
The block model was validated by swath plots, volumetric comparison, visual inspection, and statistical comparison. The average block grade at zero cut-off was compared to the average of the composited assay data to ensure that there was no global bias.
RPA is not aware of any environmental, permitting, legal, title, taxation, socio-economic, marketing, political, or other relevant factors that could materially affect the Mineral Resource estimate other than what has been described in the Rook I FS Technical Report.
Mineral Reserve Estimation
The vertical extent of the Mineral Reserves extends from approximately 320 m below surface to 680 m below surface.
Based on the cut-off grade assessment, an incremental cut-off grade of 0.30% U3O8 was applied as the input parameter for designing stopes. This cut-off grade was applied at the level of stoping solids, after inclusion of waste and fill dilution. The Mineral Reserves are limited to the A2 and A3 veins within the Arrow Deposit.
A nominal amount of material between 0.03% U3O8 (the regulatory limit between benign waste and mineralized material) and 0.26% U3O8 (which is uneconomic to process) has been included in the mine plan, in addition to 88,100 tonnes of waste used to commission the mill and to keep the mill feed grade below 5.0%.
Stantec assumed that both transverse stope and longitudinal retreat stope mining methods would be used. The assumed mining rate is nominally 1,300 tonnes per day (t/d). A total planned dilution of approximately 24% is projected for the longhole stopes. The unplanned or overbreak dilution is estimated at 12% total.
Fill dilution will occur when mining next to fill walls and mucking on fill floors; a 4% fill dilution was applied to secondary transverse stopes only, and a 1% fill dilution was applied to secondary longitudinal stopes. Extraction (mining recovery) is estimated at a combined 95.5% for longhole mining and ore development.
- 9 -
The Mineral Reserve estimate is reported using the 2014 CIM Definition Standards. The effective date of the Mineral Reserve estimate is 21 January 2021. The Qualified Person (QP) for the estimate is Mr. Mark Hatton, P.Eng., an employee of Stantec. Table 1-2 summarizes Mineral Reserves based on a $50/lb uranium price at a cut-off grade of 0.30% U3O8.
Factors that may affect the Mineral Reserve estimate include the following.
| • | Commodity price assumptions. |
| • | Changes in local interpretations of mineralization geometry and continuity of mineralization zones. |
| • | Changes to geotechnical, hydrogeological, and metallurgical recovery assumptions. |
| • | Input factors used to assess stope dilution. |
| • | Assumptions that facilities such as the Underground Tailings Management Facility (UGTMF) can be permitted. |
| • | Assumptions regarding social, permitting, and environmental conditions. |
| • | Additional infill or step out drilling. |
Table 1-2: Mineral Reserve Estimate
| Classification |
Recovered Ore Tonnes (thousands) |
U3O8 Grade (%) |
U3O8 lb (millions) | |||
| Proven |
0 | 0 | 0 | |||
| Probable |
4,575 | 2.37% | 239.6 | |||
| Total |
4,575 | 2.37% | 239.6 |
Notes:
| 1. | CIM definitions were followed for Mineral Reserves. |
| 2. | Mineral Reserves are reported with an effective date of 21 January 2021. |
| 3. | Mineral Reserves include transverse and longitudinal stopes, ore development, marginal ore, special waste, and a nominal amount of waste required for mill ramp-up and grade control. |
| 4. | Stopes were estimated at a cut-off grade of 0.30% U3O8. |
| 5. | Marginal ore is material between 0.26% U3O8 and 0.30% U3O8 that must be extracted to access mining areas. |
| 6. | Special waste in material between 0.03% and 0.26% U3O8 that must be extracted to access mining areas. 0.03% U3O8 is the limit for what is considered benign waste and material that must be treated and stockpiled in an engineered facility. |
| 7. | Mineral Reserves are estimated using a long-term metal price of US$50/lb U3O8, and a 0.75 US$/C$ exchange rate (C$1.00 = US$0.75). The cost to ship the YC product to a refinery is considered to be included in the metal price. |
| 8. | A minimum mining width of 3.0 m was applied for all longhole stopes. |
| 9. | Mineral Reserves are estimated using a combined underground (UG) mining recovery of 95.5% and total dilution (planned and unplanned) of 33.8%. |
| 10. | The density varies according to the U3O8 grade in the block model. Waste density is 2.464 t/m3. |
| 11. | Numbers may not add due to rounding. |
Stantec is not aware of any environmental, permitting, legal, title, taxation, socio-economic, political, or other relevant factors that could materially affect the Mineral Reserve estimate.
Mining Methods
Access to the underground (“UG”) Arrow Deposit will be via two shafts, an 8.0 m diameter Production Shaft (intake air) and a 5.5 m diameter Exhaust Shaft (second egress). Access to the working will be from the Production Shaft with stations on 500 and 590 Levels. Levels will be spaced 30 m apart UG and will be connected via an internal ramp.
Production will be via a conventional longhole mining. The longhole mining methods and mine design discussed in this section were chosen to optimize safety performance, reduce worker exposure to physical hazards and radiation, maximize Mineral Resource extraction, and increase operational flexibility and productivity by achieving simultaneous production from multiple mining fronts.
- 10 -
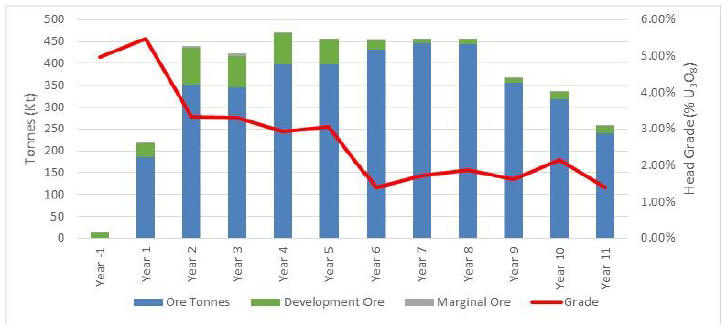
The estimated mill capacity is targeted at 1,300 tonnes per day (t/d) of ore. To realize this target, the mine plan will include longhole production on four separate mining blocks, with multiple stopes available per block. The estimated production rates of the stopes range from 250 t/d to 300 t/d. This will require approximately five stopes to be active to achieve 1,300 t/d, which will be feasible with that many stopes available. The grades will vary by mining block; this will facilitate the ability to provide a more consistent grade to the process plant with four active blocks. Production profile and head grade from UG are shown in Figure 1-1.
Figure 1-1: Underground Production Profile with Grade (U3O8)
|
The tailings produced by the mill will be returned UG as either cemented paste backfill for the production stopes or as cemented paste tailings into stopes that will be created for this purpose. The UGTMF will be located on the north side of the deposit and will consist of approximately 97 waste stopes and related development.
The mining method will make use of mechanized equipment and conventional processes widely employed in the global mining industry.
Shaft sinking will occur through a variety of stable and unstable strata, including water saturated overburden, Devonian Sandstone, Cretaceous Shales and Athabasca Sandstones, and finally into the basement rocks. These domains consist of poor to very poor-quality rock masses; however, once these have been temporarily artificially frozen for shaft construction, these are not anticipated to be problematic. A 600 mm hydrostatic lining is considered to be the minimum practicable thickness for lining against a freeze wall. As such, a 600 mm liner will be installed to 175 m in the Production Shaft and 217 m in the Exhaust Shaft. To prevent migration of water down the back of the liner and into the shaft, a grout seal will be placed at the base of the hydrostatic pressure resisting liner.
The minimum distance between the shallowest mine excavation and the unconformity is approximately 250 m. This drastically reduces the risks associated with the crown pillar and therefore has not been investigated in detail.
The processing of uranium ore will generate several forms of waste. A portion of the waste will be used for paste backfill. The remainder will be permanently stored in purpose-built excavations / chambers in the footwall (“FW”) of the deposit, in an area that is interpreted to have relatively minimal alteration or fault or shear structures. The Rook I FS Technical Report proposes the UGTMF will consist of 97 waste stopes, each approximately 25 m wide by 25 m long by 60 m high. The excavations will be arranged in a regular pattern with a minimum of 15 m pillars between openings. The first waste stopes will be located on the 500 Level and the top of the excavations will be approximately 250 m below the unconformity.
- 11 -
Backfill of mined stopes is planned to use a combination of process waste, cement, potential fillers (such as fly ash), and water. The creation of paste tailings is directly proportional to the amount of material processed through the plant. For each tonne of processed material, 0.82 m3 of paste tailings will be created, along with 0.32 m3 of combined waste precipitates. Based on a steady-state production rate, the total fill produced will be nominally 373,100 m3 per year for paste tailings, and 145,600 m3 per year for combined precipitates. Tailings not used for paste backfill will be stored in the UGTMF.
The Arrow Deposit is planned to be accessed via two shafts. Both shafts will be located in the FW of the deposit. The first shaft will be used as a Production Shaft, and for transportation of personnel and materials into the mine and will be sunk to a depth of 650 m below surface. The Production Shaft will have divided compartments so that fresh air that comes into contact with ore being skipped to surface will be immediately exhausted within the mine. The Production Shaft will have a permanent headframe and hoisting house. The second shaft will be used as an exhaust ventilation shaft. The Exhaust Shaft will be sunk to a depth of 533 m below surface and will be equipped with a secondary emergency escapeway system.
Thirteen levels, spaced at 30 m intervals sill to sill, are planned for the Arrow Deposit. Lateral development will be concentrated in the first four years to establish the production areas, the UGTMF areas, UG infrastructure and the permanent ventilation system. In addition to the lateral development, there will be an internal ramp system that will connect all mining levels.
Mine dewatering will be completed using a clean water system on the 500 Level. The 500 Level sumps will be capable of collecting and removing all strata and operational process water from the mine infrastructure, ongoing development, operational stopes, shaft inflow, and pastefill seepage. Run-of-mine water will decant through membranes; the clean water will be pumped to surface while the residual solids and water will be collected and placed into the ore handling system.
Transverse stope mining will be used in areas of wider stopes (generally greater than 12 m), while longitudinal retreat stope mining will be used in areas of thinner stope widths. Transverse longhole mining will be completed using primary and secondary stoping sequences to avoid leaving pillars. The order in which stopes are extracted will be largely driven by the head grade, with the overarching goal of processing 30 Mlb of U3O8 annually. Primary stopes will be recovered first, followed by primary stopes on two vertical levels above, and then secondary stopes on the original level.
Two separate vertical mining blocks (the Upper Block and Lower Block) will be established, and within each vertical block, the A2 and A3 veins can be mined independently. Mining activities will commence from both the Upper Block and Lower Block, and in the A2 and A3 veins, for a total of four separate production areas. A fifth production block will be created below the 620 Level.
The ore handling system will begin with load-haul-dump (“LHD”) units loading muck in transverse and longitudinal retreat stopes. The LHDs will tram muck to centrally located ore and waste passes. The bottom of the ore pass will be located on 590 Level, where a control system will direct ore on to a grizzly equipped with a remotely operated rock breaker. The grizzly openings will be 400 mm by 450 mm. The sized ore will be loaded onto a conveyor on the 620 Level and hauled to the shaft for skip loading.
There will be two separate waste handling systems. The waste from the UGTMF will report to a rockbreaker on the 500 Level, near the Production Shaft. The sized waste rock will be loaded onto the 620 Level conveyor and hauled to the shaft for skip loading. The second waste handling system will be located near the ore body and will handle all remaining lateral development. The system will be identical to the ore handing system.
- 12 -
The ventilation system is designed as a predominately negative or “pull” system. Fresh air will be distributed throughout the mine from the 500 and 590 Level shaft stations from the Production Shaft and internal ramp. The auxiliary ventilation system will utilize both flow-through and extraction ventilation to exhaust contaminated air from localized areas to return air drifts and raises.
The Rook I mine will be developed using a high degree of equipment mechanization. Each of the main pieces of equipment will have remote operating capability, and in some cases will be autonomous to reduce radiation exposure. A raisebore machine will be used for development of ore and waste passes, and internal ventilation raises.
The mobile equipment UG will be captive in the mine. The maintenance facility will be equipped to repair and service all captive equipment for the life of the operation.
Recovery Methods
The process plant design developed by Wood for the Rook I Project is based on the metallurgical testing and on the latest unit processes successfully used in uranium process plants across the world, including plants in northern Saskatchewan. The design of tailings preparation has been improved to facilitate a more reliable tailings deposition strategy through the paste plant. The process plant will consist of the following.
| • | Ore sorting |
| • | Grinding |
| • | Leaching |
| • | Liquid-solid separation via counter current decantation and clarification |
| • | SX |
| • | Gypsum precipitation and washing |
| • | YC precipitation and washing |
| • | YC drying, calcining and packaging |
| • | Tailings preparation and paste tailings plant |
| • | Effluent treatment |
Plant throughput will be 1,300 t/d and design production will be 30 Mlb U3O8 per annum. It is expected that a 3-month ramp-up period will be required to reach design throughput.
Water from the settling pond and fresh water from Patterson Lake will be fed to the process plant to provide the process requirements. The amount of water recycled from the settling pond has been further optimized to reduce the amount of fresh water required by using settling pond water for counter current decantation (“CCD”) wash water and using belt filter filtrate for paste process water.
The major reagents required will include sulphur, sulphuric acid, unslaked lime, hydrogen peroxide, flocculant, kerosene, tertiary amine, isodecanol, sodium carbonate, magnesia, barium chloride and ferric sulphate.
The process plant will require approximately 7.4 megawatts (MW) of power to operate at full capacity. The paste plant will require approximately 0.9 MW of power.
Project Infrastructure
The key infrastructure contemplated for the Rook I Project includes the following.
| • | UG mine with two vertical shafts. |
| • | UG infrastructure, including material handling systems, maintenance facilities, fuel bay, explosives magazine, ventilation, paste backfill and paste tailings distribution system, electrical and communications facilities, UG water supply, dewatering facilities. |
| • | UGTMF. |
- 13 -
| • | Surface support infrastructure for the mine, including headframe and hoist facilities, surface explosives magazine, and ventilation fans. |
| • | Surface support infrastructure for the mill, including process plant, SX plant, effluent treatment plant, and acid plant. |
| • | Site support infrastructure, including accommodation camp, Liquefied Natural Gas (LNG) facilities, LNG power plant, mine and mill dry facilities, analytical and metallurgical laboratory and maintenance, warehouse and security buildings. |
| • | Surface ore storage stockpile facility. |
| • | Waste rock storage facilities for potentially acid generating (PAG), non-potentially acid generating (NPAG) and special waste materials. |
| • | Water management facilities, including: two site water runoff ponds, six contact water process ponds, a PAG stockpile runoff collection pond, and conveyance and diversion structures. |
| • | Domestic / industrial waste management areas. |
| • | Airstrip. |
| • | LNG power plant. |
From a study completed during the prefeasibility study (“PFS”), it was determined that the NexGen Rook I site would be powered by an on-site generation plant due to a lack of existing power infrastructure and a high cost for the installation of a new transmission line. An LNG power plant was progressed during the preparation of the Rook I FS Technical Report with a power requirement of 26.5 MW based on a nominal demand of 24.1 MW. An N+1 design is planned, with eight generators operating at 3.3 MW and one standby unit. The plant design includes LNG storage and filling facilities with the fuel being trucked to the site.
Environmental, Permitting and Social Considerations
Ore and Special Waste Stockpiles
There will be an ore stockpile consisting of four piles of differing grades. Each pile will be approximately 6,500 m3.
It is estimated that about 1% of the waste rock brought to surface will be mineralized but will not contain high enough grade to be processed through the mill economically, and therefore is not stockpiled in the ore stockpile area. This material is stored in the special waste rock stockpile area with an anticipated pile volume of 60,000 m3. The special waste will be processed during normal operations, to ensure the mill head grade remains below the 5% U3O8 design limit. The remaining special waste will be processed at end of mine life, with the resultant tailing being deposited UG in the UGTMF chambers.
Both the ore and special waste stockpiles will be dual lined with high-density polyethylene (HDPE) and will be self-contained facilities capable of holding a full probable maximum precipitation (“PMP”) 24-hour event.
Environmental Studies
NexGen commenced collection of baseline data in 2015, with the majority of field studies commencing in 2018. Where necessary, some studies continued into 2019 and 2020 to complete the baseline data and information collection requirements, with some work ongoing into 2021. At the time of the Rook I FS Technical Report, NexGen had undertaken sufficient baseline data collection to complete a comprehensive EA.
- 14 -
Waste Rock Management Facility
Approximately 5.9 Mm3 of waste rock will be generated over the course of the LOM. Of this total, 4.6 Mm3 (78%) is PAG and 1.3 Mm3 is NPAG. The PAG and NPAG waste rock will have separate storage areas. The PAG and NPAG waste rock will be stockpiled with 2H:1V side slopes and the top of the finished stockpile will tie into the hill to the south; the overall height will not exceed the highest nearby topography. The PAG storage area will be HDPE lined and the NPAG storage area will not be lined.
Water Management
The water management infrastructure has been designed to maximize the diversion of non-contact surface runoff water away from the general site footprint and developed features. Precipitation events and snow melt runoff that come in contact with disturbed infrastructure areas, or potential contact zones, are captured, collected, and directed to respective impound areas identified as site runoff ponds or collection areas.
All ponds and pads containing mineralized or radiologically contaminated material have been designed to accommodate a PMP 24-hour event. These areas are self-contained in that the initial precipitation events are contained within the feature itself. The initial precipitation event does not exit elsewhere until pumped. These contained waters are tested before release to the environment based on regulatory requirement; water that does not meet specification will report to the effluent treatment plant for treatment.
The capture zones for Site Runoff Pond #1 have potential contact with mineralized or radiologically contaminated material. Site Runoff Pond #1 is designed to capture a PMP 24-hour event. Draw down is by sump pump to the site settling pond.
Site Runoff Pond #2 is designed to capture a 1:100 year 24-hour precipitation event. The pond contents will be tested, and if suitable for release, will be released to environment. If tested and not suitable for release, pond contents will be pumped to the site settling pond. In the case of a PMP 24-hour precipitation event, Site Runoff Pond #2 will capture and collect runoff to full capacity of the pond, prior to overflowing additional precipitation to the west bermed runoff collection area.
Six contact water storage ponds are planned, including four fill-test-release monitoring ponds for treated effluent, one contingency pond, and one feed settling pond. Each monitoring pond and the contingency pond is sized for 5,000 m3 of capacity and will maintain 1 m of freeboard as contingency for a PMP 24-hour event. The feed settling pond will have a capacity of 16,000 m3 with 1 m freeboard. Approximately 1,100 m3 of the settling pond capacity is reserved for a 1:100 year 24-hour precipitation event which includes runoff collecting immediately surrounding the Production Shaft and in the pipe containment corridor.
All other water conveyance and containment structures have been designed to accommodate a 1:100 year 24-hour precipitation event as well as the anticipated volumes of water generated under routine and non-routine operating conditions.
Closure and Reclamation Planning
Following the completion of mining and milling activities, a detailed decommissioning plan will be developed in accordance with Provincial and Federal regulations and guidelines. Once finalized, the plan and an application for approval to decommission will be submitted to Provincial and Federal authorities. Following approval, decommissioning activities will commence.
Decommissioning will be preceded by the orderly cessation of operations and transition of the operation into a safe inactive state. Production mining will be completed, and active mining areas backfilled and
- 15 -
secured. The mill processing circuits will be systematically shut down, flushed, and cleaned. Surface facilities, infrastructure, and equipment will be cleaned, as necessary, scanned, and prepared for decommissioning.
Wherever practicable, surface and UG infrastructure, equipment, and materials not required during the decommissioning phase and which meet radiological criteria for off-site removal will be salvaged, sold, or transferred off-site for recycling or disposal. Remaining infrastructure, equipment and materials will undergo final decommissioning on-site.
Permitting
There are several federal and provincial regulatory approvals required for a new uranium mine and mill development. Federally, under the authority of the Nuclear Safety Control Act (“NSCA”), proponents wishing to carry out uranium mining and milling must first obtain a licence from the federal nuclear regulator, the Canadian Nuclear Safety Commission (“CNSC”). The CNSC licensing process is in progress. Before the CNSC can make a licensing decision, proponents are required to undergo an EA of the proposed project. As the Rook I Project falls under both federal and provincial jurisdictions for EA, each of the CNSC and the Saskatchewan Ministry of Environment (“ENV”) – Environmental Assessment Branch (“EA Branch”) will require an EA prior to project approval. The EA process for the Rook I Project is in progress as of the effective date of the Rook I FS Technical Report, and preparation of a Draft EIS is underway.
As development of the Draft EIS and licensing applications are in progress, any findings, including any notable issues that could materially impact NexGen’s ability to extract the Mineral Resources, are not yet available for inclusion in the Technical Report. Furthermore, no recommendations from the EA or licensing processes for future monitoring and/or management of environmental and social aspects of the Rook I Project have been determined. Therefore, any consideration regarding specific monitoring and management plans are not included in the Rook I FS Technical Report.
Social or Community Impacts
NexGen has engaged regularly and established relationships with local communities and Indigenous groups since 2013. Community and Indigenous engagement have evolved since the submission of the 2018 Technical Report. Engagement mechanisms have included notification letters, meetings with leadership, establishing joint working groups (“JWGs”) for detailed discussions, and providing funding for traditional land use studies. The engagement process will continue throughout the EA and licensing processes.
In the second half of 2019, NexGen entered into Study Agreements (the “Study Agreements”) with the following four Indigenous groups.
| • | Clearwater River Dene Nation |
| • | Métis Nation – Saskatchewan (MN-S), including as on behalf of the Locals of MN-S Northern Region II |
| • | Birch Narrows Dene Nation |
| • | Buffalo River Dene Nation |
The Study Agreements provide a framework for working collaboratively to advance the EA and exchange information that will be used to inform the Crown as the Crown undertakes its duty to consult.
The Study Agreements provide funding to each Indigenous group and outline a collaborative process for formal engagement to support the inclusion of Indigenous knowledge in the EA. The Study Agreements also outline processes for identifying potential effects to Indigenous rights, treaty rights, and socio-economic interests, and avoidance and accommodation measures in relation to the Rook I Project.
- 16 -
Markets and Contracts
Marketing studies and commodity price assumptions are based on research and forecasts by UxC LLC.
NexGen is considering selling production from the Rook I Project through all avenues of selling uranium including long-term contracts that would be entered into with buyers. It is expected that any such contracts would be within industry norms for such uranium contracts. Contracts have currently not been entered into for the Rook I Project.
The financial analysis assumes that 100% of uranium produced from the planned Rook I Project can be sold at long-term price of US$50/lb U3O8, using an exchange rate of C$1.00 = US$0.75, which includes the cost to ship the YC product to the final processing site.
Capital Cost Estimates
The estimate meets the classification standard for a Class 3 estimate as defined by Association for the Advancement of Cost Engineering (“AACE”) International and has an intended accuracy of ±15%. The estimate is reported in Q4 2020 Canadian dollars. Table 1-3 outlines the estimated capital cost for supplying, constructing, and pre-commissioning the Rook I Project, and is inclusive of the early works activities.
Mining capital costs primarily comprise the following areas: shaft sinking, lateral mine development, and stationary mine infrastructure. Mine mobile equipment is assumed to be purchased on a lease-to-own basis, with the costs incurred in the lease payments. Process plant costs include the construction of the entirety of the process plant facility. Infrastructure costs include provision for the LNG power plant, as well as site preparation, permanent camp, maintenance shop, fuel storage, administration and dry facility, water treatment systems, airstrip, and site roads. Indirect costs include temporary construction facilities, construction services and supplies, and construction management (“CM”) costs, construction equipment, freight, Owner’s costs, and contingency.
NexGen is preparing a pre-commitment early works program that will encompass all scheduled activities planned for Year -4 Month 1 through Month 6. This plan will advance certain elements of the overall scope and mitigate project risks. The program includes work and the associated costs that NexGen intends on expending prior to an FID.
The scope of the pre-commitment early works program includes the following (at a high level).
| • | Clearing and grubbing. |
| • | Site levelling and road construction. |
| • | Batch plant construction. |
| • | Initial camp construction. |
| • | Shaft-sinking preparations, including freeze hole drilling, freeze plant installation, and sinking plant installations). |
Stantec estimates the pre-commitment early works program will cost approximately $157.9 million.
- 17 -
Table 1-3: Total Capital Cost Estimate
| Description |
Units | Cost | ||||||
| Pre-commitment early works |
$ | million | 157.9 | |||||
| Project Capital |
||||||||
| UG Mining |
$ | million | 240.0 | |||||
| Processing |
$ | million | 216.4 | |||||
| Site Development |
$ | million | 27.7 | |||||
| On-Site / Off-Site Infrastructure |
$ | million | 118.9 | |||||
| Subtotal Project Direct Costs |
$ | million | 602.9 | |||||
| Project indirect costs |
$ | million | 326.5 | |||||
| Project Owner’s Costs |
$ | million | 97.9 | |||||
| Subtotal Project Direct and Indirect Costs |
$ | million | 1,027.2 | |||||
| Project Contingency |
$ | million | 114.8 | |||||
| Total Project Capital |
$ | million | 1142.0 | |||||
| Pre-production Capital Cost (Pre-Commitment & Project) |
$ | million | 1,299.9 | |||||
| Sustaining |
$ | million | 362.4 | |||||
| Closure |
$ | million | 69.5 | |||||
| Total |
$ | million | 1,731.8 | |||||
Notes:
| 1. | Pre-commitment capital costs include contingency. |
| 2. | Totals may not sum due to rounding. |
Sustaining capital incorporates all capital expenditures after the pre-production period of Year –4, Year -3, Year -2, and Year -1. Reclamation costs of $78.6 million have been included in Years 12 through Year 16, less $9.1 million in salvage value.
Operating Cost Estimates
Operating cost estimates were developed to present annual costs for production. Unit costs are expressed as $/tonne processed and $/lb U3O8. Operating costs were allocated to either mining, process, tailings facility and paste plant, or general and administration (G&A). LOM operating costs are estimated to be $1,769.8 million. LOM operating costs are summarized in Table 1-4.
UG mining occurs during Year -2 to Year 11 (note in Year -2 and Year -1, UG mining costs are capitalized). UG mining begins with capital development in Year -2 and the capitalized development continues through the LOM.
Table 1-4: Operating Cost Estimate Summary (Year 1 to Year 11 inclusive)
| Description |
LOM Cost ($ million) |
Average Annual ($ million) |
Unit Cost ($/t processed) |
Unit Cost ($/lb U3O8) |
||||||||||||
| Mining |
691.3 | 64.6 | 151.09 | 2.96 | ||||||||||||
| Processing |
647.0 | 60.5 | 141.41 | 2.77 | ||||||||||||
| Tailing Facility and Paste Plant |
144.0 | 13.5 | 31.46 | 0.62 | ||||||||||||
| General and administration |
287.5 | 26.9 | 62.84 | 1.23 | ||||||||||||
| Total |
1,769.8 | 165.4 | 386.80 | 7.58 | ||||||||||||
Notes:
| 1. | Totals may not sum due to rounding. |
| 2. | Average annual cost based on 10.7 years |
- 18 -
G&A costs include labour, camp and catering costs, flights to and from site, insurance premiums, general maintenance of the surface buildings, and marketing and accounting functions. Allowances were included for reimbursable fees paid to the CNSC.
Economic Analysis
The results of the economic analysis represent forward-looking information that is subject to a number of known and unknown risks, uncertainties, and other factors that may cause actual results to differ materially from those presented here. Forward-looking statements in the Rook I FS Technical Report include, but are not limited to, statements with respect to future uranium prices, estimation of Mineral Resources and Mineral Reserves, estimated mine production and uranium recovered, estimated capital and operating costs, and estimated cash flows generated from the planned mine production. Actual results may be affected by the following.
| • | Differences in estimated initial capital costs and development time from what has been assumed in the Rook I FS Technical Report. |
| • | Unexpected variations in quantity of ore, grade, or recovery rates, or presence of deleterious elements that would affect the process plant or waste disposal. |
| • | Unexpected geotechnical and hydrogeological conditions from what was assumed in the mine designs, including water management during construction, mine operations, and post mine closure. |
| • | Differences in the timing and quantity of estimated future uranium production, costs of future uranium production, sustaining capital requirements, future operating costs, assumed currency exchange rate, requirements for additional capital, unexpected failure of plant, or equipment or processes not operating as anticipated. |
| • | Changes in government regulation of mining operations, environment, and taxes. |
| • | Unexpected social risks, higher closure costs and unanticipated closure requirements, mineral title disputes or delays to obtaining surface access to the property. |
If additional mining, technical, and engineering studies are conducted, these may alter the project assumptions presented in the Rook I FS Technical Report and may result in changes to the calendar timelines and the information and statements contained in the Rook I FS Technical Report.
Development and licensing approvals are not currently in place, and statutory permits, including environmental permits, are required to be granted prior to mine commencement.
The Rook I Project has been evaluated using discounted cash flow analysis. Cash inflows consist of annual revenue projections. Cash outflows consist of project capital expenditures, sustaining capital costs, operating costs, taxes, royalties, and commitments to other stakeholders. These are subtracted from revenues to arrive at the annual cash projections.
Cash flows are taken to occur at the mid point of each period. To reflect the time value of money, annual cash flow projections are discounted to the Rook I Project valuation date using the yearly discount rate. The discount rate appropriate to a specific project can depend on many factors, including the type of commodity, the cost of capital to the project, and the level of project risks (e.g., market risk, environmental risk, technical risk, and political risk) in comparison to the expected return from the equity and money markets.
The base case discount rate for the Rook I FS Technical Report is 8%. The discounted present values of the cash flows are summed to arrive at the Rook I Project’s NPV. In addition to the NPV, the IRR and the payback period are also calculated. The IRR is defined as the discount rate that results in an NPV equal to zero. The payback period is calculated as the time required to achieve positive cumulative cash flow for the Rook I Project from the start of production.
Taxes and depreciation for the Rook I Project were modelled based on input from NexGen, as well as a review of the Guideline: Uranium Royalty System, Government of Saskatchewan, June 2014. In addition, NexGen has opening balances of Canadian Exploration Expense (“CEE”) and operating losses that were applied in the tax model.
- 19 -
On a pre-tax basis, the NPV at 8% is $5,577.0 million, the IRR is 64.9%, and the assumed payback period is 0.8 years. On a post-tax basis, the NPV at 8% is $3,465.0 million, the IRR is 52.4% and the assumed payback period is 0.9 years.
A summary of the LOM cashflow is provided in Tabl3 1-5 and Figure 1-2. Table 1-6 summarizes the economic results of the Rook I FS Technical Report, with the NPV at 8% base case highlighted.
Table 1-5: LOM Cashflow Forecast Summary Table
| Description |
Units | Value | ||||||
| Gross revenue |
$ | million | 15,573.2 | |||||
| Less: transportation |
$ | million | 0 | |||||
| NSR |
$ | million | 15,573.2 | |||||
| Less: provincial revenue royalties |
$ | million | (1,129.1 | ) | ||||
| Net revenue |
$ | million | 14,444.1 | |||||
| Less: total operating costs |
$ | million | (1,769.8 | ) | ||||
| Operating cash flow |
$ | million | 12,674.3 | |||||
| Less: capital costs |
$ | million | (1,573.9 | ) | ||||
| Pre-tax cash flow |
$ | million | 11,100.4 | |||||
| Less: provincial profit royalties |
$ | million | (1,683.5 | ) | ||||
| Less: taxes |
$ | million | (2,404.5 | ) | ||||
| Post-tax cash flow |
$ | million | 7,012.4 | |||||
- 20 -
Figure 1-2: Undiscounted After-Tax Cash Flow

|
Table 1-6: 2021 Feasibility Study Forecast Economic Results
| Description |
Units | Value | ||||||
| Pre-Tax |
| |||||||
| NPV at 8% |
$ | million | 5,577 | |||||
| NPV at 10% |
$ | million | 4,745 | |||||
| NPV at 12% |
$ | million | 4,051 | |||||
| Internal rate of return |
% | 64.9 | % | |||||
| Payback period |
Years | 0.8 | ||||||
| After-Tax |
| |||||||
| NPV at 8% |
$ | million | 3,465 | |||||
| NPV at 10% |
$ | million | 2,930 | |||||
| NPV at 12% |
$ | million | 2,484 | |||||
| Internal rate of return |
% | 52.4 | % | |||||
| Payback period |
Years | 0.9 | ||||||
Note: Payback period is calculated from the start of production
Sensitivity Analysis
The cash flow model was tested for sensitivity to variances regarding the following.
| • | Head grade |
| • | Process recovery |
| • | Uranium price |
| • | Overall operating costs |
| • | Overall capital costs |
- 21 -
| • | Labour costs |
| • | Reagent costs |
| • | CAD to USD exchange rate |
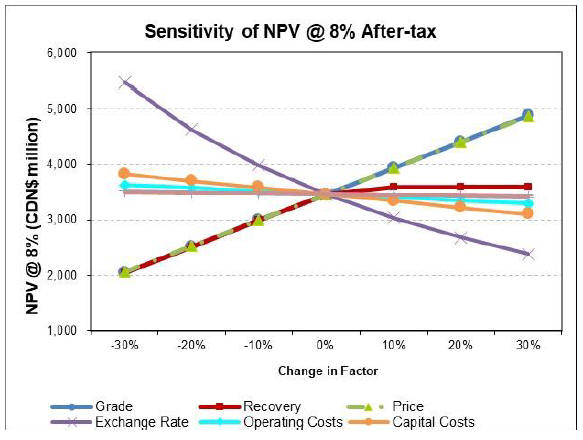
Figure 1-3 illustrates the results of the sensitivity analysis. The anticipated Rook I Project cash flow is most sensitive to fluctuations in the price of uranium, head grade, and process recovery. YC is primarily traded in US dollars, whereas capital and operating costs for the Rook I Project are primarily priced in Canadian dollars. Therefore, the CAD to USD exchange rate may significantly influence project economics.
Figure 1-3: Sensitivity Analysis
|
Risks and Opportunities
NexGen and its lead consultants have assessed critical areas of the Rook I Project and identified risks associated with the technical and cost assumptions used. The main risks identified in the Rook I Project include: assumptions around the prevalence of mineralized material in areas designated for mine infrastructure, assumptions around ground freezing and overall shaft development, adverse ground conditions as they relate to planned mining excavations, material handling systems unable to meet planned and peak production, commissioning of the UGTMF being slower than anticipated resulting in delays to first production, regulatory risks around permitting, and stakeholder engagement, and risks around cost escalation and project execution.
NexGen and its lead consultants performed an opportunities analysis. Opportunities that were recognized included: a potential expansion of Mineral Resources, and corresponding extension of the mine operating life, improvements to the mine extraction factor, reduction in mining operating costs and improved safety by considering remote or autonomous mining equipment, reductions in mining and process water usage through recycling, finalize the site water management philosophy and optimize the required infrastructure, consider heat recovery opportunities from the acid plant and power plant, evaluate alternative energy options including renewables and connecting to a provincial grid, and advancing critical early works construction packages to streamline overall project execution.
- 22 -
Interpretation and Conclusions
Under the assumptions presented in the Rook I FS Technical Report, the Rook I Project indicates positive economics. The anticipated Rook I Project cash flow is most sensitive to the price of uranium, head grade, and process recovery. The Canadian dollar to United States dollar exchange rate significantly influences Rook I Project economics.
Recommendations
Engineering
Its is recommended that NexGen proceeds to Basic Engineering. The target for basic engineering to create a Class 2 Estimate along with the related Level 4 Schedule. Estimated project costs for basic engineering totals $33.0 million.
Site Investigations
It is recommended that NexGen proceeds with site investigations to support Basic Engineering, including, but not limited to the following:
| • | Detailed materials characteristics and quantification assessment to confirm borrow source locations and available volumes of aggregates. |
| • | Drill hole investigations of nuisance mineralization observed in the footwall of Arrow proximal to LOM infrastructure, the quartz vein observed in GAR-18-013 (Exhaust Shaft pilot hole), and the northern extents of the UGTMF. |
| • | Hydrogeological studies to increase NexGen’s understanding of the impact of groundwater on the UG mine and mine dewatering requirements. |
| • | Investigate near surface and subsurface conditions in the area of proposed surface infrastructure, focusing on the Mine Terrace and Waste Rock Storage Facility. |
The total estimated project costs for the geotechnical, geomechanical, hydrological and surface material assessment is $9 million.
Process Plant Test Work
The following studies are proposed.
| • | Loaded strip acid recovery |
| • | Gypsum belt filter optimization |
| • | YC particle size enhancement |
| • | YC belt filter optimization |
| • | Clarifier optimization |
| • | Paste plant optimization |
| • | Geo-metallurgical characterization |
| • | Mine water pre-treatment technology |
This program is estimated at $1.0 million.
Environmental Studies
Baseline environmental studies are sufficient for the work going forward, but there are no results available yet to make any material recommendations regarding potential issues identified and further work required.
- 23 -
Geology and Mineral Resources
In RPA’s opinion, the controls and procedures implemented by NexGen personnel for resource estimation meet or exceed industry practices, and no additional changes to the proposed exploration program are recommended.
The Rook I property hosts a significant uranium deposit, and merits considerable exploration and development work. RPA understands that NexGen’s primary objectives are to advance engineering work and explore unexplored areas of the property. Work will include further exploration drilling at untested locations on the property and at known uranium occurrences.
The information contained in this material change regarding the Rook I Project has been derived from the Rook I FS Technical Report, is subject to certain assumptions, qualifications and procedures described in the Rook I FS Technical Report and is qualified in its entirety by the full text of the Rook I FS Technical Report. Reference should be made to the full text of the Rook I FS Technical Report. Capitalized terms used but not otherwise defined in this material change report have the meaning given to them in the Rook I FS Technical Report.
All technical information in this material change report has been reviewed and approved by Anthony (Tony) George, P. Eng, NexGen’s Chief Project Officer, who is a qualified person under National Instrument 43-101– Standards of Disclosure for Mineral Projects.
ITEM 5.2 – DISCLOSURE FOR RESTRUCTURING TRANSACTIONS
Not applicable.
ITEM 6 – RELIANCE ON SUBSECTION 7.1(2) OF NATIONAL INSTRUMENT 51-102
Not applicable.
ITEM 7 – OMITTED INFORMATION
No significant facts otherwise required to be disclosed in this report have been omitted.
ITEM 8 – EXECUTIVE OFFICER
The following executive officer of NexGen is knowledgeable about the material change and may be contacted respecting the change:
Leigh Curyer
Chief Executive Officer
NexGen Energy Ltd.
+1 604 428 4112
www.nexgenenergy.ca
ITEM 9 – DATE OF REPORT
February 24, 2021
- 24 -
Serious News for Serious Traders! Try StreetInsider.com Premium Free!
You May Also Be Interested In
- IsoEnergy Provides Winter Exploration Update
- How a Texas-Based App Wants to Bring Safety, Fun Back into Online Dating
- PriceLabs Leverages Generative AI to Make Revenue Management Accessible to Everyone
Create E-mail Alert Related Categories
SEC FilingsSign up for StreetInsider Free!
Receive full access to all new and archived articles, unlimited portfolio tracking, e-mail alerts, custom newswires and RSS feeds - and more!
