

Form 6-K MAGNA INTERNATIONAL INC For: May 06
 Tweet
Tweet Share
ShareUNITED STATES
SECURITIES AND EXCHANGE COMMISSION
Washington, D.C. 20549
FORM 6-K
Report of Foreign Private Issuer Pursuant to Rule 13a-16 or 15d-16 under the Securities Exchange Act of 1934
For the month of May 2021
Commission File Number 001-11444
| MAGNA INTERNATIONAL INC. |
| (Exact Name of Registrant as specified in its Charter) |
| 337 Magna Drive, Aurora, Ontario, Canada L4G 7K1 |
| (Address of principal executive office) |
Indicate by check mark whether the registrant files or will file annual reports under cover Form 20-F or Form 40-F.
Form 20-F [ ] Form 40-F [X]
Indicate by check mark if the registrant is submitting the Form 6-K in paper as permitted by Regulation S-T Rule 101(b)(1): _______
Note: Regulation S-T Rule 101(b)(1) only permits the submission in paper of a Form 6-K if submitted solely to provide an attached annual report to security holders.
Indicate by check mark if the registrant is submitting the Form 6-K in paper as permitted by Regulation S-T Rule 101(b)(7): _______
Note: Regulation S-T Rule 101(b)(7) only permits the submission in paper of a Form 6-K if submitted to furnish a report or other document that the registrant foreign private issuer must furnish and make public under the laws of the jurisdiction in which the registrant is incorporated, domiciled or legally organized (the registrant’s “home country”), or under the rules of the home country exchange on which the registrant’s securities are traded, as long as the report or other document is not a press release, is not required to be and has not been distributed to the registrant’s security holders, and, if discussing a material event, has already been the subject of a Form 6-K submission or other Commission filing on EDGAR.
SIGNATURES
Pursuant to the requirements of the Securities Exchange Act of 1934, the registrant has duly caused this report to be signed on its behalf by the undersigned, thereunto duly authorized.
| Date: May 6, 2021 | MAGNA INTERNATIONAL INC. | ||
| By: | /s/ “Bassem Shakeel” | ||
| Bassem A. Shakeel, | |||
| Vice-President and Corporate Secretary | |||
EXHIBITS
| Exhibit 99 | Q1 2021 Earnings Presentation slides (May 6, 2021) |
Exhibit 99

Q1 2021 Earnings Presentation May 6, 2021

Forward Looking Statements Q1 2021 Earnings - May 6, 2021 2 Certain statements in this document constitute "forward - looking information" or "forward - looking statements" (collectively, "forward - looking statements") . Any such forward - looking statements are intended to provide information about management's current expectations and plans and may not be appropriate for other purposes . Forward - looking statements may include financial and other projections, as well as statements regarding our future plans, strategic objectives or economic performance, or the assumptions underlying any of the foregoing, and other statements that are not recitations of historical fact . We use words such as "may", "would", "could", "should", "will", "likely", "expect", "anticipate", "believe", "intend", "plan", "aim", "forecast", "outlook", "project", "estimate", "target" and similar expressions suggesting future outcomes or events to identify forward - looking statements . The following table identifies the material forward - looking statements contained in this document, together with the material potential risks that we currently believe could cause actual results to differ materially from such forward - looking statements . Readers should also consider all of the risk factors which follow below the table : Material Forward - Looking Statement Material Potential Risks Related to Applicable Forward - Looking Statement Total Sales Segment Sales Mandatory stay - at - home orders and other restrictions to help contain COVID - 19 spread could impact vehicle sales, vehicle production and our own production Economic impact of COVID - 19 on consumer confidence Supply disruptions, including as a result of a semiconductor chip shortage currently being experienced in the industry and shortages of, or supply constraints on, certain critical materials such as chemicals for seating foam, resins for plastic components, rubber as well as certain types of steel Concentration of sales with six customers Shifts in market shares among vehicles or vehicle segments Shifts in consumer “take rates” for products we sell Adjusted EBIT Margin Segment Adjusted EBIT Margin Net Income Attributable to Magna Same risks as for Total Sales/Segment Sales above Operational underperformance Higher costs incurred to mitigate the risk of supply disruptions, including : materials price increases ; higher - priced substitute supplies ; premium freight costs to expedite supply of materials ; production inefficiencies due to production lines being stopped/restarted unexpectedly based on customers’ production schedules ; and, potential fines/penalties if customer production is disrupted Price concessions Tax risks Equity Income Same risks as Adjusted EBIT Margin and Net Income Attributable to Magna above Risks related to conducting business through joint ventures
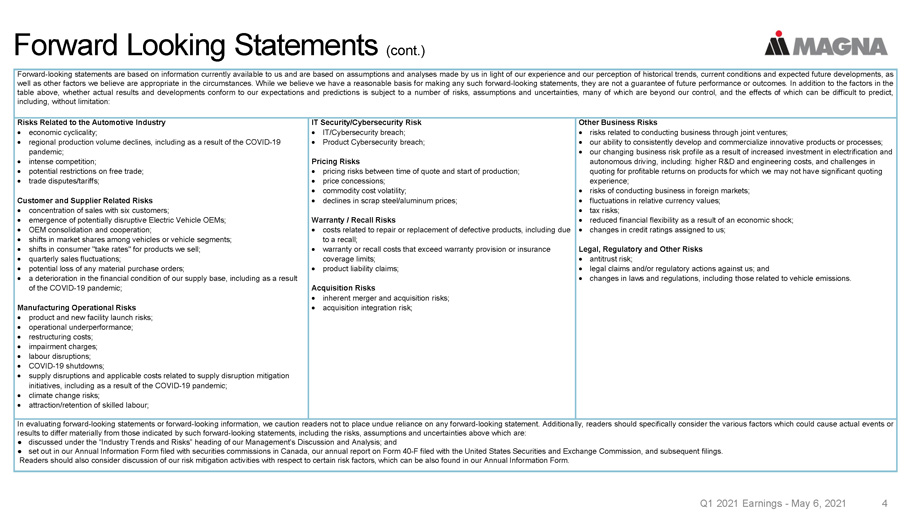
Forward Looking Statements (cont.) 3 Q1 2021 Earnings - May 6, 2021 Forward - looking statements are based on information currently available to us and are based on assumptions and analyses made by us in light of our experience and our perception of historical trends, current conditions and expected future developments, as well as other factors we believe are appropriate in the circumstances . While we believe we have a reasonable basis for making any such forward - looking statements, they are not a guarantee of future performance or outcomes . In addition to the factors in the table above, whether actual results and developments conform to our expectations and predictions is subject to a number of risks, assumptions and uncertainties, many of which are beyond our control, and the effects of which can be difficult to predict, including, without limitation : Risks Related to the Automotive Industry economic cyclicality; regional production volume declines, including as a result of the COVID - 19 pandemic; intense competition; potential restrictions on free trade; trade disputes/tariffs; Customer and Supplier Related Risks concentration of sales with six customers; emergence of potentially disruptive Electric Vehicle OEMs; OEM consolidation and cooperation; shifts in market shares among vehicles or vehicle segments; shifts in consumer "take rates" for products we sell; quarterly sales fluctuations; potential loss of any material purchase orders; a deterioration in the financial condition of our supply base, including as a result of the COVID - 19 pandemic; Manufacturing Operational Risks product and new facility launch risks; operational underperformance; restructuring costs; impairment charges; labour disruptions; COVID - 19 shutdowns; supply disruptions and applicable costs related to supply disruption mitigation initiatives, including as a result of the COVID - 19 pandemic; climate change risks; attraction/retention of skilled labour ; IT Security/Cybersecurity Risk IT/Cybersecurity breach; Product Cybersecurity breach; Pricing Risks pricing risks between time of quote and start of production; price concessions; commodity cost volatility; declines in scrap steel/aluminum prices; Warranty / Recall Risks costs related to repair or replacement of defective products, including due to a recall; warranty or recall costs that exceed warranty provision or insurance coverage limits; product liability claims; Acquisition Risks inherent merger and acquisition risks; acquisition integration risk; Other Business Risks risks related to conducting business through joint ventures; our ability to consistently develop and commercialize innovative products or processes; our changing business risk profile as a result of increased investment in electrification and autonomous driving, including: higher R&D and engineering costs, and challenges in quoting for profitable returns on products for which we may not have significant quoting experience; risks of conducting business in foreign markets; fluctuations in relative currency values; tax risks; reduced financial flexibility as a result of an economic shock; changes in credit ratings assigned to us; Legal, Regulatory and Other Risks antitrust risk; legal claims and/or regulatory actions against us; and changes in laws and regulations, including those related to vehicle emissions. In evaluating forward - looking statements or forward - looking information, we caution readers not to place undue reliance on any forward - looking statement . Additionally, readers should specifically consider the various factors which could cause actual events or results to differ materially from those indicated by such forward - looking statements, including the risks, assumptions and uncertainties above which are : ● discussed under the “Industry Trends and Risks” heading of our Management’s Discussion and Analysis ; and ● set out in our Annual Information Form filed with securities commissions in Canada, our annual report on Form 40 - F filed with the United States Securities and Exchange Commission, and subsequent filings . Readers should also consider discussion of our risk mitigation activities with respect to certain risk factors, which can be also found in our Annual Information Form .

Q1 2021 Earnings - May 6, 2021 4 Reminders All amounts are in U.S. Dollars Today’s discussion excludes the impact of other expense (income), net (“Unusual Items”) “Organic”, in the context of sales movements, means “excluding the impact of foreign exchange, acquisitions and divestitures”
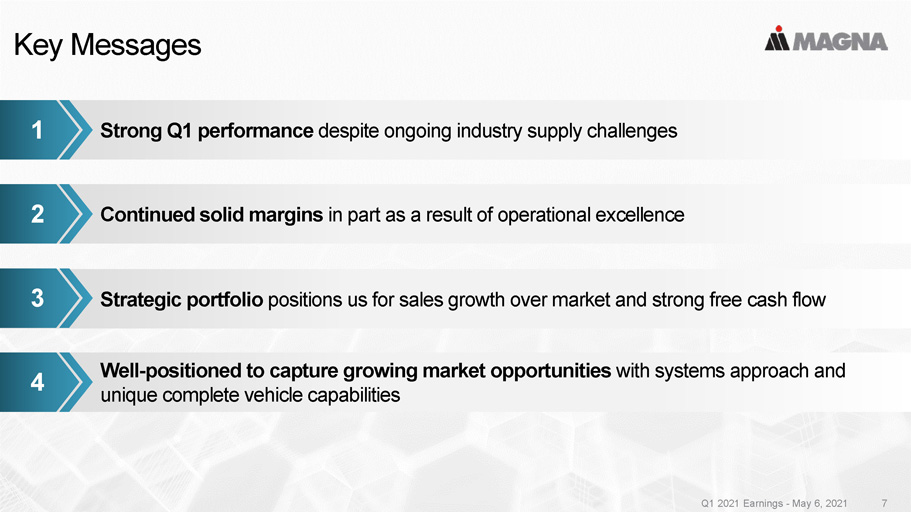
5 Key Messages Q1 2021 Earnings - May 6, 2021 Strong Q1 performance despite ongoing industry supply challenges 1 Continued solid margins in part as a result of operational excellence 2 Strategic portfolio positions us for sales growth over market and strong free cash flow 3 Well - positioned to capture growing market opportunities with systems approach and unique complete vehicle capabilities 4
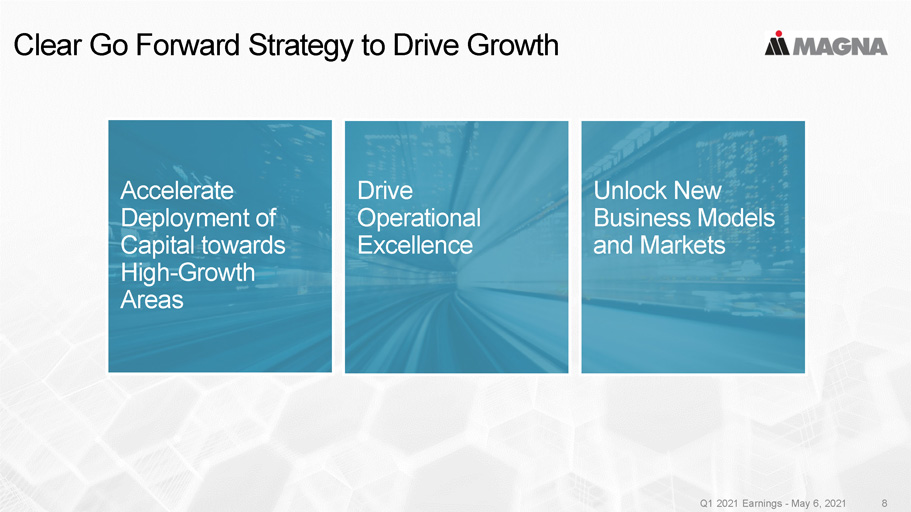
Clear Go Forward Strategy to Drive Growth Q1 2021 Earnings - May 6, 2021 6 Accelerate Deployment of Capital towards High - Growth Areas Drive Operational Excellence Unlock New Business Models and Markets

Q1 2021 Earnings - May 6, 2021 7 • Up to 38% emission reduction • Unique cloud connectivity feature • Smart cruise control and eco routing • Class - leading performance in all - electric driving EtelligentReach Battery - electric drive system • 30% range extension • Combination of Next - Gen eDrive, software and controls • Improvement in efficiency and driving dynamics • First awarded business EtelligentForce EV solution for pick - up trucks • Drop - in replacement retains pick - up truck capability • Leverage existing assembly processes and installed capital • First significant change to solid beam rear axle in more than 100 years Program Award New Benchmark for Efficient Plug - in - Hybrid Technology BEV Drive System for Best - in - Class Range and Dynamics Electrifying Trucks without Compromising Utility EtelligentEco Connected PHEV system

Q1 2021 Earnings - May 6, 2021 8 Program Award Program Award Structural Opportunities Expand with Electrification Increasing In - Cabin Safety with Monitoring Establishing Team to Identify Vehicle Development Opportunities • Contributes to vehicle structure and safety • Steel, aluminum, and multi - material, including composites • Business awards for GM Hummer EV and Ford F - 150 EV Driver Monitoring System • Detection of distracted driver behavior, drowsiness and fatigue • Customizable audible, visual and haptic alert notifications • Program launch in 2022 Strategic Collaboration Agreement • Exploring development of Modular Electric Vehicles across a variety of use cases • Exploring potential collaboration for Mobility - as - a - Service venture in LCVs Battery Enclosures

Current Market Dynamics Q1 2021 Earnings - May 6, 2021 9 Recovering Global Auto Production Continued Shift to Light Trucks Relatively Weaker US$ Supply Constraints Higher Commodity Costs Ongoing COVID - 19 Challenges TAILWINDS HEADWINDS

CONSOLIDATED SALES $10.2B Weighted Growth Over Market ( GoM ) 1 +3% Q1 2021 Performance Highlights Q1 2021 Earnings - May 6, 2021 10 ADJUSTED EBIT MARGIN % 7.6% +290 bps OTHER ACCOMPLISHMENTS Raised 2021 Outlook ADJUSTED DILUTED EPS $1.86 +116% FREE CASH FLOW 2 $414M +13% Returned $280M to shareholders through share buybacks + dividends 1 Weighted Growth over Market ( GoM ) compares organic sales growth (%) to vehicle production change (%) after applying Magna geographic sales weighting, excludi ng Complete Vehicles, to regional production 2 Free Cash Flow is Cash from Operating Activities plus proceeds from normal course dispositions of fixed and other assets plus se ttlement of long - term receivable from a non - consolidated joint venture minus capital spending minus investment in other assets Execution Drives Another Quarter of Strong Performance

11 Q1 2021 Financial Results Q1 2021 Earnings - May 6, 2021 Key Factors • Global light vehicle production (+) • Higher a ssembly volumes (+) • Foreign currency translation: $465M (+) • Launch of new programs (+) • Business combinations: $238M (+) • End of production of certain programs ( - ) • Net customer price concessions ( - ) Weighted GoM 1 +3% Q1/21 Production Global +18% China +87% N.A. - Europe +5% Magna Weighted +6% Consolidated Sales ($Billions) +18% $8.7 $10.2 0.0 0.1 0.1 0.1 0.1 0.1 0.1 0.1 0 2 4 6 8 10 12 Q1'20 Q1'21 1 Weighted Growth over Market ( GoM ) compares organic sales growth (%) to vehicle production change (%) after applying Magna geographic sales weighting, excluding Complete Vehicles, to regional production

12 Q1 2021 Financial Results Q1 2021 Earnings - May 6, 2021 Margin Impact By Segment EBIT Margin Q1 2020 4.7% Body Exteriors & Structures 1.1% Power & Vision 1.3% Seating 0.1% Complete Vehicles - Corporate & Other 0.4% EBIT Margin Q1 2021 7.6% Adjusted effective tax rate of 23.3%, in line with expectations Adjusted Net Income Attributable to Magna of $566M, up $305M Equity Income (+17M) • Higher sales in our equity - accounted operations (+) • Business combinations (+) Adjusted EBIT & Margin ($Millions) +91% Adjusted EPS ($) +116% $0.86 $1.86 0.0 0.1 0.1 0.1 0.1 0.1 0.1 0.1 0 0.2 0.4 0.6 0.8 1 1.2 1.4 1.6 1.8 2 Q1'20 Q1'21 $403 $770 4.7% 7.6% 0.0 0.1 0.1 0.1 0.1 0.1 0.1 0.1 0 100 200 300 400 500 600 700 800 900 Q1'20 Q1'21
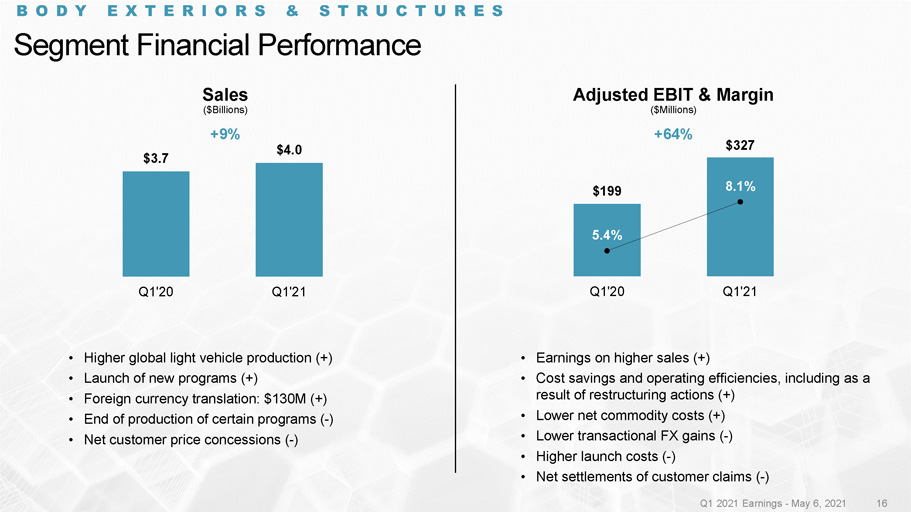
Segment Financial Performance Q1 2021 Earnings - May 6, 2021 13 • Earnings on higher sales (+) • Cost savings and operating efficiencies, including as a result of restructuring actions (+) • Lower net commodity costs (+) • Lower transactional FX gains ( - ) • Higher launch costs ( - ) • Net settlements of customer claims ( - ) • Higher global light vehicle production (+) • Launch of new programs (+) • Foreign currency translation: $130M (+) • End of production of certain programs ( - ) • Net customer price concessions ( - ) $3.7 $4.0 Q1'20 Q1'21 Sales ($Billions) +9% Adjusted EBIT & Margin ($Millions) +64% $199 $327 5.4% 8.1% 0.0 0.1 0.1 0.1 0.1 0.1 0.1 0.1 0 50 100 150 200 250 300 350 Q1'20 Q1'21 BODY EXTERIORS & STRUCTURES
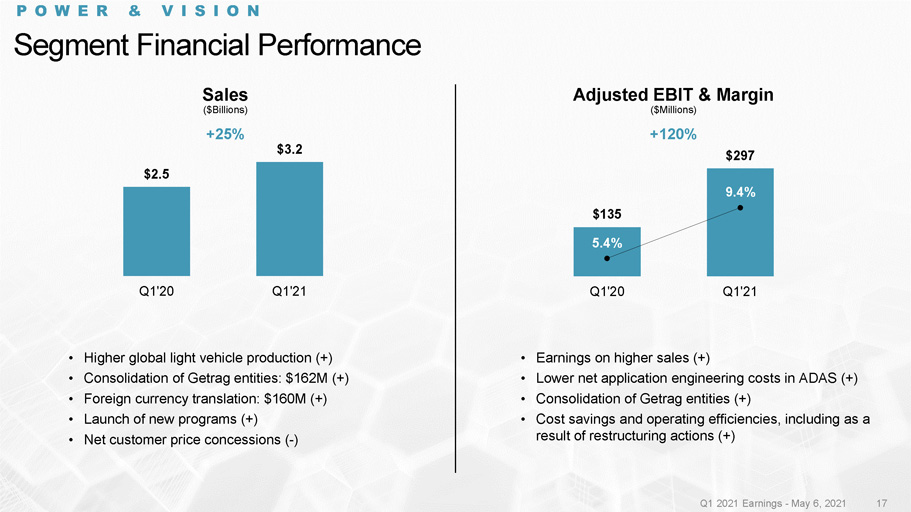
• Higher global light vehicle production (+) • Consolidation of Getrag entities: $162M (+) • Foreign currency translation: $160M (+) • Launch of new programs (+) • Net customer price concessions ( - ) Segment Financial Performance Q1 2021 Earnings - May 6, 2021 14 • Earnings on higher sales (+) • Lower net application engineering costs in ADAS (+) • Consolidation of Getrag entities (+) • Cost savings and operating efficiencies, including as a result of restructuring actions (+) POWER & VISION $2.5 $3.2 Q1'20 Q1'21 $135 $297 5.4% 9.4% 0.0 0.1 0.1 0.1 0.1 0.1 0.1 0.1 0.1 0.1 0.1 0 50 100 150 200 250 300 350 Q1'20 Q1'21 Sales ($Billions) +25% Adjusted EBIT & Margin ($Millions) +120%

• Acquisition of Hongli in China (+) • Launch of new programs: $76M (+) • Foreign currency translation: $30M (+) • Unfavourable production mix ( - ) • Net customer price concessions ( - ) Segment Financial Performance Q1 2021 Earnings - May 6, 2021 15 • Productivity and efficiency improvements at an underperforming facility (+) • Higher equity income (+) • Cost savings and operating efficiencies, including as a result of restructuring actions (+) • Unfavourable vehicle production mix ( - ) SEATING $1.26 $1.30 Q1'20 Q1'21 $40 $55 3.2% 4.2% 0.0 0.0 0.0 0.0 0.0 0.1 0.1 0.1 Q1'20 Q1'21 Sales ($Billions) +3% Adjusted EBIT & Margin ($Millions) +38%
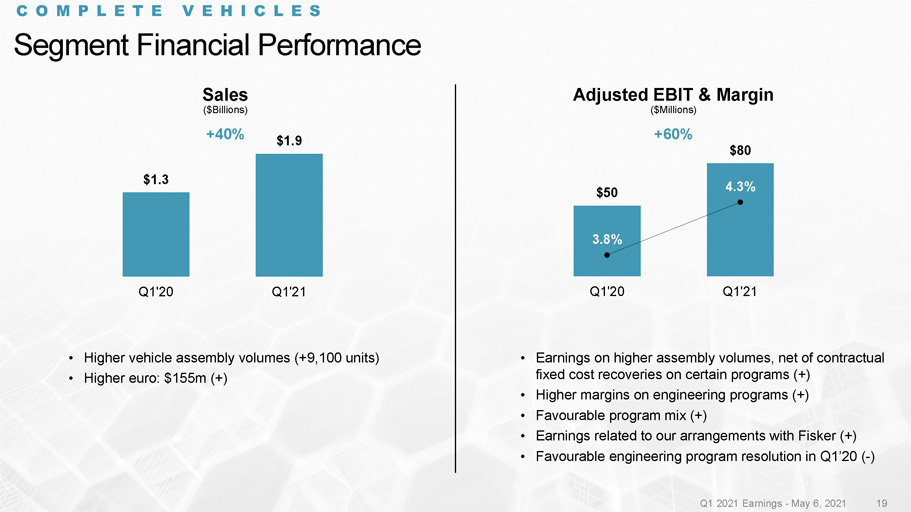
• Higher vehicle assembly volumes (+9,100 units) • Higher euro: $155m (+) Segment Financial Performance Q1 2021 Earnings - May 6, 2021 16 • Earnings on higher assembly volumes, net of contractual fixed cost recoveries on certain programs (+) • Higher margins on engineering programs (+) • Favourable program mix (+) • Earnings related to our arrangements with Fisker (+) • Favourable engineering program resolution in Q1’20 ( - ) COMPLETE VEHICLES $1.3 $1.9 Q1'20 Q1'21 $50 $80 3.8% 4.3% 0.0 0.0 0.0 0.0 0.0 0.0 0.0 0 10 20 30 40 50 60 70 80 90 Q1'20 Q1'21 Sales ($Billions) +40% Adjusted EBIT & Margin ($Millions) +60%

17 Q1 2021 Cash Flows and Investment Activities Q1 2021 Earnings - May 6, 2021 Free Cash Flow 1 ($Millions) +13% $366 $414 0.0 0.1 0.1 0.1 0.1 0.1 0.1 0.1 0 50 100 150 200 250 300 350 400 450 Q1'20 Q1'21 USES OF CASH Private Equity Investments $3M Share Repurchases (1.8M Shares) $162M Dividends ($0.43/share) $130M Cash from Operations Before Changes in Operating Assets & Liabilities $1,033M Changes in Operating Assets & Liabilities ($372M) Cash from Operations (+3%) $661M Fixed Asset Additions ($212M) Increase in Investments, Other Assets and Intangible Assets ($104M) Settlement of Long - Term Receivable $50M Proceeds from Dispositions $19M Free Cash Flow 1 $414M 1 Free Cash Flow is Cash from Operating Activities plus proceeds from normal course dispositions of fixed and other assets plus se ttlement of long - term receivable from a non - consolidated joint venture minus capital spending minus investment in other assets

Continued Financial Flexibility Q1 2021 Earnings - May 6, 2021 18 Improving Adjusted Debt to Adjusted EBITDA Q1’21 HIGHLIGHTS • Continued operational excellence and higher earnings driving strong cash generation • Extended maturity date on $2.6 billion of our revolving credit facility by two years to June 2026 ($B) Estimated Future LTD Principal Repayments (12/31/20) ($M) $129 $365 $722 $760 $647 $1,479 2021 2022 2023 2024 2025 Thereafter LEVERAGE RATIO (LTM, 3/31/21) Adjusted Debt $6.147 Adjusted EBITDA $3.540 Adjusted Debt / Adjusted EBITDA (Q1 2021) 1.74 Adjusted Debt / Adjusted EBITDA (Q4 2020) 1.98 TOTAL LIQUIDITY (3/31/21) Cash $3.5 Available Term & Operating Lines of Credit $3.5 Total Liquidity $7.0 Investment - grade ratings from Moody’s, S&P, DBRS

2021 Outlook Assumptions Q1 2021 Earnings - May 6, 2021 19 FEBRUARY MAY Light Vehicle Production (millions of units) • North America 15.9 15.6 • Europe 18.5 18.5 • China 24.0 24.7 Foreign Exchange Rates • 1 CDN dollar equals USD 0.770 0.797 • 1 EURO equals USD 1.210 1.201 • 1 RMB equals USD 0.153 0.153 Changed from previous Outlook

2021 Outlook Q1 2021 Earnings - May 6, 2021 20 $ Billions, Unless Otherwise Noted FEBRUARY MAY Sales: • Body Exteriors & Structures $16.5 – $17.1 $16.5 – $17.1 • Power & Vision $11.6 – $12.0 $12.0 – $12.4 • Seating Systems $5.8 – $6.1 $5.6 – $5.9 • Complete Vehicles $6.5 – $6.8 $6.7 – $7.0 Total Sales $40.0 – $41.6 $40.2 – $41.8 Adjusted EBIT Margin % 1 7.1% – 7.5% 7.2% – 7.6% Equity Income $85M – $115M $120M – $150M Interest Expense ~$110M ~$100M Income Tax Rate 2 ~23% ~23% Net Income Attributable to Magna 3 $2.1 – $2.3 $2.2 – $2.4 Capital Spending ~$1.6 ~$1.6 1 Adjusted EBIT Margin is the ratio of Adjusted EBIT to Total Sales 2 The Income Tax Rate has been calculated using Adjusted EBIT and is based on current tax legislation 3 Net Income Attributable to Magna represents Net Income excluding Other expense (income), net Changed from previous Outlook
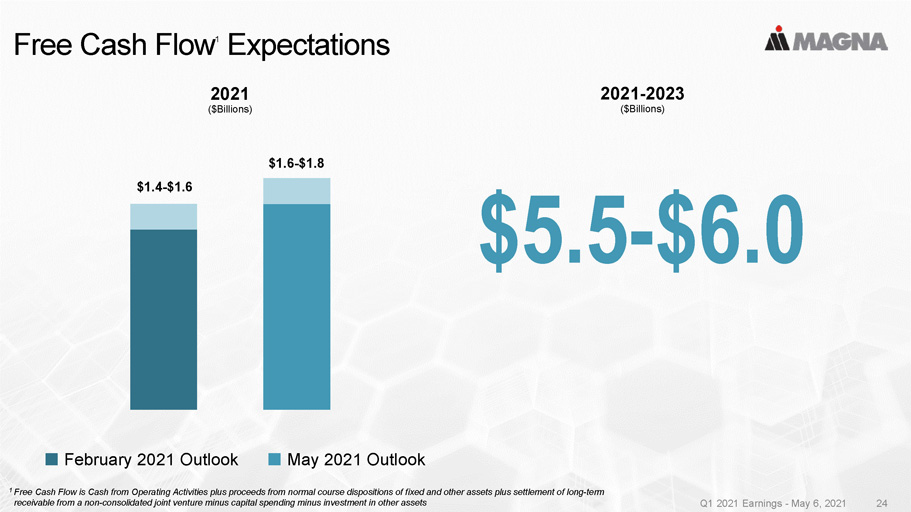
21 Free Cash Flow 1 Expectations Q1 2021 Earnings - May 6, 2021 2021 ($Billions) 0.0 0.2 0.4 0.6 0.8 1.0 1.2 1.4 1.6 1.8 2.0 $1.4 - $1.6 $1.6 - $1.8 $5.5 - $6.0 February 2021 Outlook May 2021 Outlook 2021 - 2023 ($Billions) 1 Free Cash Flow is Cash from Operating Activities plus proceeds from normal course dispositions of fixed and other assets plus se ttlement of long - term receivable from a non - consolidated joint venture minus capital spending minus investment in other assets

2021 Segment Adjusted EBIT Margin 22 2020 February 2021 Outlook May 2021 Outlook BODY EXTERIORS & STRUCTURES 6.0% 8.6 - 9.1% 8.5 - 9.0% SEATING SYSTEMS 2.4% 5.8 - 6.3% 5.4 - 5.9% POWER & VISION 5.1% 7.2 - 7.7% 7.7 - 8.2% COMPLETE VEHICLES 5.1% 3.8 - 4.3% 4.1 - 4.6% Q1 2021 Earnings - May 6, 2021
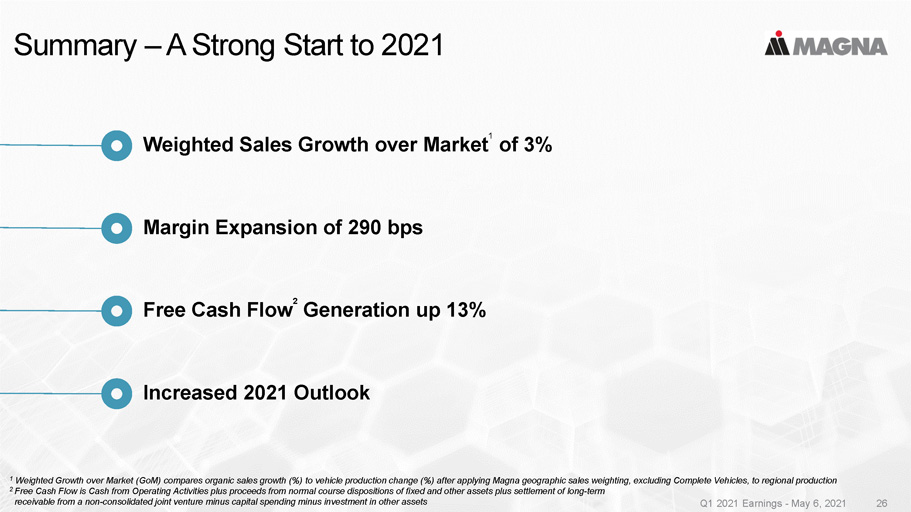
Summary – A Strong Start to 2021 Q1 2021 Earnings - May 6, 2021 23 Weighted Sales Growth over Market 1 of 3% Margin Expansion of 290 bps Increased 2021 Outlook Free Cash Flow 2 Generation up 13% 1 Weighted Growth over Market ( GoM ) compares organic sales growth (%) to vehicle production change (%) after applying Magna geographic sales weighting, excludi ng Complete Vehicles, to regional production 2 Free Cash Flow is Cash from Operating Activities plus proceeds from normal course dispositions of fixed and other assets plus sett le ment of long - term receivable from a non - consolidated joint venture minus capital spending minus investment in other assets

Q1 2021 Earnings - May 6, 2021 24 Appendix

Secular Trends Driving Change Q1 2021 Earnings - May 6, 2021 25 Well - Positioned for Car of the Future x Enhanced e - Powertrain portfolio x Product range fills transition roadmap to EV x New EV business across all products x Full ADAS capability x Complete system expertise x Expanded collaboration ecosystem x Leverage new business models x Enabling automakers and new entrants x Software - enabled functionality in our ECU - related products x Optimizing performance and efficiency New Mobility Magna Positioning
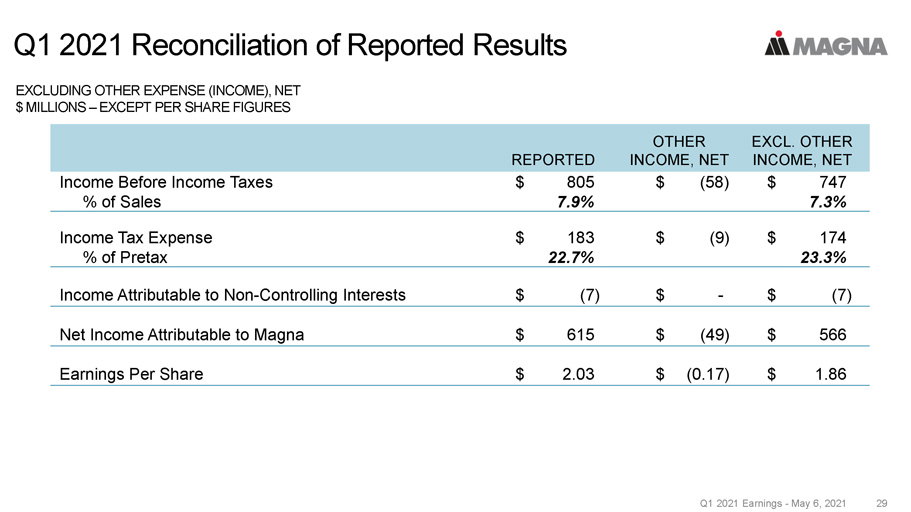
Q1 2021 Reconciliation of Reported Results Q1 2021 Earnings - May 6, 2021 26 EXCLUDING OTHER EXPENSE (INCOME), NET $ MILLIONS – EXCEPT PER SHARE FIGURES REPORTED OTHER INCOME, NET EXCL. OTHER INCOME, NET Income Before Income Taxes $ 805 $ (58) $ 747 % of Sales 7.9% 7.3% Income Tax Expense $ 183 $ (9) $ 174 % of Pretax 22.7% 23.3% Income Attributable to Non - Controlling Interests $ (7) $ - $ (7) Net Income Attributable to Magna $ 615 $ (49) $ 566 Earnings Per Share $ 2.03 $ (0.17) $ 1.86

Sales Performance vs Market 27 REPORTED ORGANIC 1 PERFORMANCE VS WEIGHTED GLOBAL PRODUCTION (Weighted GoM ) Body Exteriors & Structures 9% 6% - Power & Vision 25% 12% 6% Seating 3% (5%) (11%) Complete Vehicles 40% 28% 22% TOTAL SALES 18% 9% 3% Unweighted Production Growth 18% Weighted Production Growth 2 6% 1 Organic Sales represents sales excluding acquisitions net of divestitures and FX movements 2 Calculated by applying Magna geographic sales weighting, excluding Complete Vehicles, to regional production Q1 2021 Earnings - May 6, 2021 Q1 2021 vs Q1 2020

Geographic Sales 28 Q1 2020 Q1 2021 NORTH AMERICA $4.5B $4.6B PRODUCTION 0% EUROPE $3.9B $4.7B PRODUCTION 5% ASIA $331M $924M PRODUCTION 36% (China 87%) REST OF WORLD $110M $99M S.A. PRODUCTION 7% Q1 2021 vs Q1 2020 Q1 2021 Earnings - May 6, 2021

2023 Financial Outlook 1 Q1 2021 Earnings - May 6, 2021 29 1 We have not updated 2023 Outlook ranges from our February 19 th , 2021 press release 2 Adjusted EBIT Margin is the ratio of Adjusted EBIT to Total Sales Assumptions Light Vehicle Production (millions of units) • North America 16.3 • Europe 20.1 • China 26.0 Foreign Exchange Rates • 1 CDN dollar equals USD 0.770 • 1 EURO equals USD 1.210 • 1 RMB equals USD 0.153 $ Billions, Unless Otherwise Noted Sales • Body Exteriors & Structures $18.0 – $19.0 • Power & Vision $13.0 – $13.6 • Seating Systems $6.1 – $6.5 • Complete Vehicles $6.3 – $6.8 Total Sales $43.0 – $45.5 • Adjusted EBIT Margin % 2 8.1% – 8.6% • Equity Income $155M – $200M

Capital Allocation Principles Q1 2021 Earnings - May 6, 2021 30 Disciplined, Profitable Approach to Growth Remains a Foundational Principle Q1’21 Maintain Strong Balance Sheet • Preserve liquidity and high investment grade credit ratings - Adj. debt / Adj. EBITDA ratio between 1.0 - 1.5x LTM 03/31/21 1.74x • Maintain flexibility to invest for growth Invest for Growth • Organic and inorganic opportunities Fixed asset additions Other investments $212M $104M • Innovation Return Capital to Shareholders • Continued dividend growth over time $130M • Repurchase shares with excess liquidity $150M

Q1 2021 Earnings - May 6, 2021 31
Serious News for Serious Traders! Try StreetInsider.com Premium Free!
You May Also Be Interested In
- Magna Int'l (MGA) PT Lowered to $63 at TD Securities
- Form 8.5 (EPT/RI) - Mattioli Woods
- HighByte Announces Series A Raise to Accelerate Growth in Industrial DataOps Market
Create E-mail Alert Related Categories
SEC FilingsSign up for StreetInsider Free!
Receive full access to all new and archived articles, unlimited portfolio tracking, e-mail alerts, custom newswires and RSS feeds - and more!
