SECURITIES AND EXCHANGE COMMISSION
Washington, DC 20549
FORM 6-K
REPORT OF FOREIGN PRIVATE ISSUER
PURSUANT TO RULE 13a-16 OR 15d-16 UNDER
THE SECURITIES EXCHANGE ACT OF 1934
Report on Form 6-K dated 9 June 2015
(Commission File No. 001-35053)
INTERXION HOLDING N.V.
(Translation of Registrant’s Name into English)
Tupolevlaan 24, 1119 NX
Schiphol-Rijk, The Netherlands, +31 20 880 7600
(Address of Principal Executive Office)
Indicate by check mark whether the registrant files or will file annual reports under cover of Form 20-F or Form 40-F.
Form 20-F x
Form 40-F ¨
Indicate by check mark if the registrant is
submitting the Form 6-K in paper as permitted by Regulation S-T Rule 101(b)(1): ¨
Note: Regulation S-T Rule 101(b)(1) only permits the submission in paper of a Form 6-K if submitted solely to provide an attached
annual report to security holders.
Indicate by check mark if the registrant is submitting the Form 6-K in paper as permitted by Regulation S-T
Rule 101(b)(7) ): ¨
Note: Regulation S-T Rule 101(b)(7) only permits the
submission in paper of a Form 6-K if submitted to furnish a report or other document that the registrant foreign private issuer must furnish and make public under the laws of the jurisdiction in which the registrant is incorporated, domiciled or
legally organized (the registrant’s “home country”), or under the rules of the home country exchange on which the registrant’s securities are traded, as long as the report or other document is not a press release, is not required
to be and has not been distributed to the registrant’s security holders, and, if discussing a material event, has already been the subject of a Form 6-K submission or other Commission filing on EDGAR.
This
report contains Interxion Holding N.V.’s (1) press release “Interxion files 2014 Dutch Statutory Annual Report” and (2) 2014 Dutch Statutory Annual Report.
This Report on Form 6-K is incorporated by reference into the Registration Statement on Form S-8 of the Registrant originally filed with the Securities and
Exchange Commission on 23 June 2011 (File No. 333-175099) and into the Registration Statement on Form S-8 of the Registrant originally filed with the Securities and Exchange Commission on 2 June 2014 (File No. 333-196447).
|
|
|
|
Exhibit
|
|
|
|
|
| 99.1 |
|
The press release “Interxion files 2014 Dutch Statutory Annual Report”, dated 9 June 2015. |
|
|
| 99.2 |
|
2014 Dutch Statutory Annual Report. |
SIGNATURE
Pursuant to the requirements of the Securities Exchange Act of 1934, the registrant has duly caused this report to be signed on its behalf by
the undersigned, thereunto duly authorized.
|
|
|
| INTERXION HOLDING N.V. |
|
|
| By: |
|
/s/ David C. Ruberg |
| Name: |
|
David C. Ruberg |
| Title: |
|
Chief Executive Officer |
Date: 9 June 2015
Exhibit 99.1

Press release 9 June 2015
Interxion Files 2014 Dutch Statutory Annual Report
AMSTERDAM 9 June 2015. INTERXION HOLDING N.V. (NYSE: INXN), a leading European provider of carrier and cloud neutral colocation data centre
services, today announced that it has filed its 2014 Dutch Statutory Annual Report with the Securities and Exchange Commission. The 2014 Dutch Statutory Annual Report can be found under the “Annual Reports” link on the company’s
website at investors.interxion.com as well as on the SEC website at www.sec.gov. In addition, shareholders may request a hard copy of the 2014 Dutch Statutory Annual Report, which includes the company’s complete audited financial statements,
free of charge by contacting Interxion Investor Relations at Tupolevlaan 24, 1119 NX Schiphol-Rijk, The Netherlands, Attention: Investor Relations or by email at [email protected].
About Interxion
Interxion (NYSE: INXN) is a leading
provider of carrier and cloud-neutral colocation data centre services in Europe, serving a wide range of customers through 39 data centres in 11 European countries. Interxion’s uniformly designed, energy efficient data centres offer customers
extensive security and uptime for their mission-critical applications.
With over 500 connectivity providers, 20 European Internet exchanges, and most
leading cloud and digital media platforms across its footprint, Interxion has created connectivity, cloud, content and finance hubs that foster growing customer communities of interest. For more information, please visit www.interxion.com.
Contact:
Jim Huseby
Investor Relations
Interxion
Tel: +1-813-644-9399
[email protected]
Exhibit 99.2
CLOUD AND CARRIER-NEUTRAL
DATA CENTRE SERVICES
Interxion is a leading pan-European
provider of cloud and carrier-neutral data centre services. We deliver value to our customers by being responsive to their needs, and by building communities of interest that enable our customers to add value to their service offerings. Established
in 1998, we have expanded rapidly to create 39 data centres in 13 cities across 11 countries, giving us the largest reach across Europe and providing our customers with access to more than 77% of EU GDP.
FORWARD-LOOKING STATEMENTS
This
annual report contains forward-looking statements within the meaning of Section 27A of the Securities Act of 1933, as amended, and Section 21E of the Securities Exchange Act of 1934, as amended, with respect to all statements other than
statements of historical fact regarding our business, financial condition, results of operations and certain of our plans, objectives, assumptions, projections, expectations or beliefs with respect to these items and statements regarding other
future events or prospects. These statements include, without limitation, those concerning: our strategy and our ability to achieve it; expectations regarding sales, profitability and growth; plans for the construction of new data centres; our
possible or assumed future results of operations; research and development, capital expenditure and investment plans; adequacy of capital; and financing plans. The words “aim,” “may,” “will,” “expect,”
“anticipate,” “believe,” “future,” “continue,” “help,” “estimate,” “plan,” “schedule,” “intend,” “should,” “shall” or the negative or other
variations thereof as well as other statements regarding matters that are not historical fact, are or may constitute forward-looking statements.
In addition, this
annual report includes forward-looking statements relating to our potential exposure to various types of market risks, such as foreign exchange rate risk, interest rate risks and other risks related to financial assets and liabilities. We have based
these forward-looking statements on our management’s current view with respect to future events and financial performance. These views reflect the best judgment of our management but involve a number of risks and uncertainties which could cause
actual results to differ materially from those predicted in our forward-looking statements and from past results, performance or achievements. Although we believe that the estimates reflected in the forward-looking statements are reasonable, those
estimates may prove to be incorrect.
By their nature, forward-looking statements involve risk and uncertainty because they relate to events and depend on
circumstances that will occur in the future. There are a number of factors that could cause actual results and developments to differ materially from these expressed or implied by these forward-looking statements. These factors include, among other
things:
| ● |
|
operating expenses cannot be easily reduced in the short term; |
| ● |
|
inability to utilise the capacity of newly planned data centres and data centre expansions; |
| ● |
|
significant competition; |
| ● |
|
cost and supply of electrical power; |
| ● |
|
data centre industry over-capacity; |
| ● |
|
and performance under service level agreements. |
These risks and others described under “Risk Factors” (page 32)
are not exhaustive. Other sections of this annual report describe additional factors that could adversely affect our business, financial condition or results of operations. Additionally, new risk factors can emerge from time to time, and it is not
possible for us to predict all such risk factors, nor can we assess the impact of all such risk factors to differ materially from those contained in any forward-looking statements. Given these risks and uncertainties, you should not place undue
reliance on forward-looking statements as a prediction of actual results.
All forward-looking statements included in this annual report are based on information
available to us on the date of this annual report. We undertake no obligation to update publicly or revise any forward-looking statement, whether as a result of new information, future events or otherwise, except as may be required by applicable
law. All subsequent written and oral forward-looking statements attributable to us or persons acting on our behalf are expressly qualified in their entirety by the cautionary statements contained throughout this annual report.
|
| 2 / INTERXION ANNUAL REPORT 2014 |
IN THIS REPORT
|
|
|
|
|
|
|
| OPERATIONAL REVIEW |
|
|
|
|
| 6 |
|
Our 2014 performance at a glance |
|
12 |
|
Our country team |
| 7 |
|
Selected financial data |
|
13 |
|
Our segment team |
| 8 |
|
What we do |
|
14 |
|
Consistent execution |
| 9 |
|
Why customers choose us |
|
15 |
|
Continued growth |
| 10 |
|
Our
people |
|
16 |
|
Market
strategy |
| FINANCIAL REVIEW |
|
|
|
|
| 20 |
|
Income statement highlights |
|
23 |
|
Cash flow highlights |
| 22
|
|
Balance sheet
highlights |
|
|
|
|
| REPORT OF THE BOARD OF
DIRECTORS |
|
|
|
|
| 26 |
|
Structure |
|
32 |
|
Shares beneficially owned |
| 26 |
|
Board of Directors |
|
32 |
|
Risk management |
| 29 |
|
Director’s insurance and
indemnification |
|
32 |
|
Risk factors |
| 30 |
|
Board committees |
|
34 |
|
Controls and procedures |
| 31
|
|
Compensation |
|
34 |
|
Dutch Corporate
Governance Code |
| CONSOLIDATED FINANCIAL
STATEMENTS |
|
|
|
|
| 38
38 |
|
Consolidated income statement
Consolidated statement of comprehensive
income |
|
40 |
|
Consolidated statement of changes in shareholders’
equity |
|
|
41 |
|
Consolidated statement of cash flows |
| 39
|
|
Consolidated
statement of financial position |
|
42 |
|
Notes to the 2014
consolidated financial statements |
| COMPANY FINANCIAL
STATEMENTS |
|
|
|
|
| 86 |
|
Company statement of financial position |
|
87 |
|
Notes to the 2014 company financial
statements |
| 87 |
|
Company income
statement |
|
|
|
|
| OTHER INFORMATION |
|
FIND OUT MORE |
| 94 |
|
Appropriation of result |
|
98 |
|
Where can I find out more? |
| 95 |
|
Independent
auditor’s report |
|
99 |
|
Follow
us |
|
| INTERXION ANNUAL REPORT 2014 / 3 |
|
| 4 / INTERXION ANNUAL REPORT 2014 |
INTERXION ANNUAL REPORT
2014 / 5
OUR 2014 PERFORMANCE AT A GLANCE

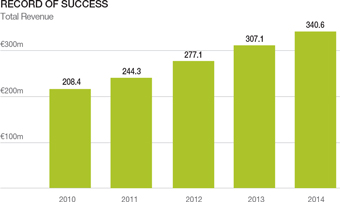
Throughout 2014 we have continued to build on the previous track record of consistent growth to achieve a strong set of financial
and operating results. We expanded our footprint, added capacity to continue to meet our customers’ needs and focused on our strategy of developing communities of interest amongst our customer base. Magnetic customers established their presence
in our Cloud Hubs across Europe, positioning Interxion to benefit as cloud adoption in Europe develops.
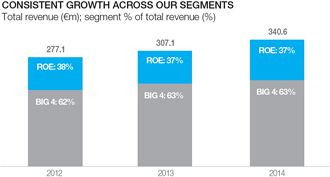
Growth across our footprint was strong, with recurring revenue growing 10% and Adjusted EBITDA growing 11% over 2013,
despite a continued challenging European economy.
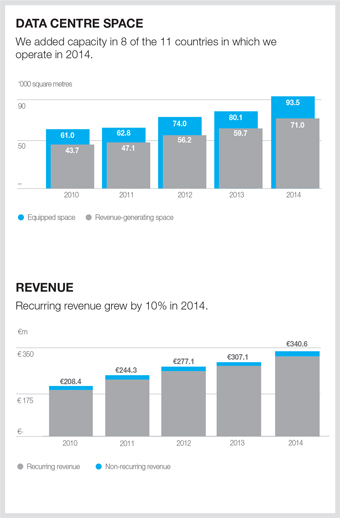
We made customer-driven capital investments to open 6 new data centres and completed expansion projects in 8 of the
11 countries in which we operate. We added over 13,400 square metres of equipped space in line with customer demand and the discipline of our approach was highlighted as utilisation increased from around 75% to around 76% as more than 11,300 square
metres of revenue generating space was installed by our customers during the year.
With the purchase of the SFR Netcenter in Marseille, we are positioning Interxion
at the crossroads of connectivity between Europe, Asia, Africa and the Middle East and allowing our customers easier, cost effective access to these expanding markets.
Overall, 2014 was a year of solid progress and growth. Looking forward, the order-driven momentum that we have created and
the attractive opportunity opened up by our Marseille investment, combined with healthy industry fundamentals, leave us optimistic on our future growth prospects.
We
expect the strong customer demand to continue in 2015 and we will be investing in further capacity during the course of the year. We have already announced new data centre builds in Frankfurt and Stockholm and three expansions in Amsterdam,
Marseille and Vienna.
Subsequent to the year end, on 9th March 2015, we announced that we have entered into a definitive agreement* on an all-share merger with
Telecity Group plc. We believe that the combination of the two businesses is strategically compelling. Demand for data centre services is evolving rapidly and the additional geographic scope and financial scale of the combined business will provide
customers with even more robust connectivity choices and cloud platforms, and will be better positioned to service the needs of global data centre customers.
Finally, I would like to thank all our employees for their dedication, commitment and contribution to Interxion’s continuing success.
David Ruberg, Chief Executive Officer
28 April 2015
* Completion of the transaction will be subject to, amongst other
things, all relevant regulatory and anti-trust approvals
|
| 6 / INTERXION ANNUAL REPORT 2014 |
SELECTED FINANCIAL DATA
|
|
|
|
|
|
|
|
|
|
|
|
|
|
|
|
|
|
|
|
|
| |
|
2010
|
|
|
2011
|
|
|
2012
|
|
|
2013
|
|
|
2014
|
|
| Recurring revenue |
|
|
193.0 |
|
|
|
228.3 |
|
|
|
259.2 |
|
|
|
291.3 |
|
|
|
319.2 |
|
| Non-recurring revenue |
|
|
15.4 |
|
|
|
16.0 |
|
|
|
17.9 |
|
|
|
15.8 |
|
|
|
21.4 |
|
| Revenue |
|
|
208.4 |
|
|
|
244.3 |
|
|
|
277.1 |
|
|
|
307.1 |
|
|
|
340.6 |
|
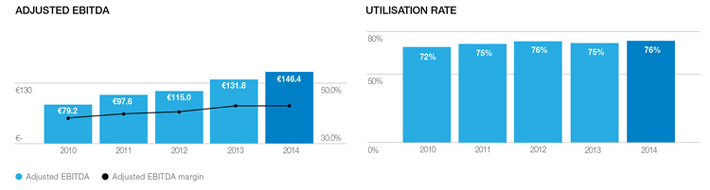
| Adjusted EBITDA |
|
|
79.2 |
|
|
|
97.6 |
|
|
|
115.0 |
|
|
|
131.8 |
|
|
|
146.4 |
|
| Adjusted EBITDA margin |
|
|
38.0% |
|
|
|
40.0% |
|
|
|
41.5% |
|
|
|
42.9% |
|
|
|
43.0% |
|
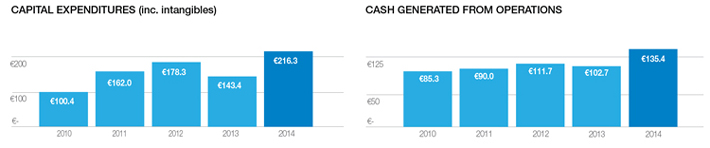
| Capital expenditures (including
intangibles) |
|
|
(100.4) |
|
|
|
(162.0) |
|
|
|
(178.3) |
|
|
|
(143.4) |
|
|
|
(216.3) |
|
| Cash generated from operations |
|
|
85.3 |
|
|
|
90.0 |
|
|
|
111.7 |
|
|
|
102.7 |
|
|
|
135.4 |
|
| Revenue-generating space |
|
|
43.7 |
|
|
|
47.1 |
|
|
|
56.2 |
|
|
|
59.7 |
|
|
|
71.0 |
|
| Equipped space |
|
|
61.0 |
|
|
|
62.8 |
|
|
|
74.0 |
|
|
|
80.1 |
|
|
|
93.5 |
|
| Utilisation rate |
|
|
72% |
|
|
|
75% |
|
|
|
76% |
|
|
|
75% |
|
|
|
76% |
|
Financial figures are expressed as millions of euros; space figures in ‘000 sqm.
|
| INTERXION ANNUAL REPORT 2014 / 7 |
WHAT WE DO
CLOUD AND CARRIER-NEUTRAL COLOCATION DATA CENTRES
With 39 cloud and carrier-neutral colocation data centres
across 11 countries and 13 cities, Interxion enables over 1,500 customers to securely deliver applications and content to their end-customers, with excellent response time and performance.

We are located in the markets where demand for data centre services is the greatest. Our footprint provides access to over 77% of
European GDP, and our data centres are home to more than 500 carriers and ISPs, as well as 20 European Internet exchanges
WHAT MAKES US DIFFERENT?
We are a provider that delivers value to customers by offering reliability and security beyond industry standards, and by creating communities of interest. Our data
centres are close to city centres, which gives our customers direct access to Europe’s leading businesses and helps them provide rapid response times to their end customers.
Organisations that colocate with us can take advantage of the security, uptime and scalability we offer without relinquishing control of their ICT infrastructure. They
can cut both capital and operational costs while improving application performance, achieving increased business flexibility, and realising the value of community membership.

CLOUD AND CARRIER-NEUTRALITY
A neutral
data centre provider like Interxion is independent of the organisations that colocate in its facilities: it doesn’t compete with any of them. All colocating organisations are free to contract directly with the cloud platforms and the
connectivity, infrastructure, managed services and other providers of their choice.
Our neutrality helps to attract a wide range of providers into our facilities,
all of whom compete to offer the best performance, service and price. Our data centres effectively constitute a marketplace within a highly connected environment, helping customers gain the flexibility, performance and cost efficiencies they need.
Customers can interconnect quickly and easily with low-latency Cross Connects that not only improve the speed and flexibility of doing business, but also reduce the
costs.
CREATING COMMUNITIES OF INTEREST
We develop strong communities of interest within our data centres to bring together companies operating in the same sector. Organisations find a ready-formed community of
potential customers, providers and partners, and can benefit from fast, low-cost interconnectivity and rapidly establish profitable business relationships.

|
|
|
|
|
|
|
|
MEETING THE SPECIFIC
NEEDS OF DIFFERENT INDUSTRY SECTORS
Our communities of interest, together with our in-house industry experts, deliver real value to our customers. We recognise that organisations in different sectors have
differing needs, which influence what they want from a data centre partner. We help:
● Service providers meet the challenges of a dynamically
growing, time-sensitive market where providing outstanding quality of service is critical
● Connectivity providers extend their reach and deploy new
services
● Digital media providers meet the demand for content, anytime,
anywhere
● Enterprises reduce costs, manage risk, develop a platform for
growth and meet their environmental objectives ● Financial services organisations trade securely at high speed and move quickly to meet their regulatory obligations
● Systems integrators grow their business and create new
business models |
|
|

|
| 8 / INTERXION ANNUAL REPORT 2014 |
WHY CUSTOMERS CHOOSE US
A FUTURE-PROOF HOME FOR OUR CUSTOMERS’ ICT INFRASTRUCTURE
Our state-of-the-art data centre design and our commitment to sustainability are among the reasons our customers choose to work with us – they also understand
the value derived from being part of a community backed by consistent, strong operational support and design excellence.
UNEQUALLED SUPPORT AND EXPERTISE
Our support teams in all the European countries where we operate speak our customers’ languages and understand the local market and regulations. Our on-site, highly
skilled engineering teams help to ensure the smooth running and availability of our customers’ ICT infrastructures.
Our European Customer Service Centre (ECSC)
is made up of experienced professionals who are available 24/7 to provide multi-lingual support via a single phone number. Customers can also use our secure portal for self-service access to real-time information.
For our larger pan-European customers, our international accounts team provides streamlined support, along with a single point of contact and a master services agreement
spanning all their locations.

INNOVATION AND TECHNICAL EXCELLENCE
For
well over a decade we have been at the forefront of data centre design and management, and we continue to focus strongly on innovation and efficiency improvements. Whether it’s evaluating the latest energy-efficiency techniques, options for
green power, or new design practices, Interxion leads the way.
Our dedicated Digital, Technology and Engineering Group (DTEG) pioneered many of today’s key data
centre design approaches, such as modular design and build, designing for power usage effectiveness (PUE), cold aisle containment and other energy efficient design innovations.
Because we have grown by organic expansion, the data centres that we have built are designed, operated and maintained in a consistent way, which contributes to high
levels of technical excellence, reliability and performance.

OUR COMMITMENT TO SUSTAINABILITY
We are
committed to environmental responsibility. We deliver efficient, cost-effective services by minimising waste and energy use, without compromising reliability and performance. Our modular data centre design – which lets us build large systems
from smaller subsystems – optimises our use of space, power and cooling and helps us continue to improve PUE.
In 2014 we reaffirmed our commitment to
sustainability with the formation of our Energy Strategy Group which works across Interxion countries to develop, implement and govern the energy strategy of the company.
This year we reached a milestone with more than 90% of power coming from sustainable sources. We implement free cooling wherever we can and recycle waste heat for other
purposes.
Our Paris operations have led the way, receiving ISO 50001 certification for energy efficiency through the development of an energy management system.
As part of our sustainability commitment we contribute to recognised industry bodies. For example, we sit on the Technical Committee and the Advisory Council of The Green
Grid (the leading energy efficiency and sustainability association for the data centre industry), and contribute to the EC Joint Research Centre on sustainability.
|
| INTERXION ANNUAL REPORT 2014 / 9 |
OUR PEOPLE
OUR SENIOR TEAM
Our people are a key part of what differentiates us, led
by a management team with considerable experience in the technology sector. The team focus on customers and on driving Interxion towards the heart of the digital economy, adding value and making it easier for our customers to do business.
|
|
|
|
|
| DAVID RUBERG |
|
|
|
|
|

|
|
David Ruberg, Chief Executive Officer
After serving for five years as Chairman, David became CEO in 2007 and continues to develop our
business as one of Europe’s leading providers of cloud and carrier-neutral data centres. In his role he combines valuable insights into the needs of our customers with his knowledge of how colocation technology can add value to such companies
and help them further develop their business. Prior to this, David was CEO and Chairman of
Intermedia Communications, a broadband communications services provider. David has also held posts at Data General and AT&T, and has served on the boards of several businesses, including Adaptix and Broadview Networks.
He holds a Masters degree from the University of Michigan in Computer and Communications Science.
|
|
|
|
|
|
|
|
| JOSH JOSHI |
|
|
|
|
|

|
|
Josh Joshi, Chief Financial Officer
Josh joined Interxion in 2007 and is responsible for our financial policy and funding strategy,
financial planning, reporting and control, and investor relations. Josh has held senior executive roles in data centre, network and infrastructure businesses for over 15 years.
Before joining Interxion, Josh worked as CFO at two publicly traded companies – Leisure and
Gaming plc and Telecity Group plc. He was one of the founders of the private equity-backed Storm Telecommunications Ltd. Early in his career Josh worked in professional practice for eight years, latterly with Arthur Andersen.
He holds a degree in Civil Engineering from Imperial College, London and is a member of the Institute
of Chartered Accountants in England and Wales. |
|
|
|
| 10 / INTERXION ANNUAL REPORT 2014 |
|
|
|
|
|
| GIULIANO
DI VITANTONIO

|
|
Giuliano Di
Vitantonio, Chief Marketing & Strategy Officer Giuliano
joined Interxion in 2015 and is responsible for our market and product strategies including product management, product marketing, segment strategy and business development. He joined from Cisco Systems where he held the position of Vice President
Marketing, Data Center & Cloud. Giuliano has over 20 years of experience in the IT
industry, including 17 years at Hewlett-Packard, where he held a broad range of positions in R&D, strategy, consulting, business development and marketing. Giuliano’s areas of expertise include IT management software, enterprise
applications, data centre infrastructure and business intelligence solutions. He has a Masters degree in EE/ Telecommunications from the University of Bologna and an MBA from the London Business School.
Giuliano has lived in five different countries and is fluent in four languages. He is based in
London. |
|
|
| |
|
|
|
|
| JAN-PIETER ANTEN

|
|
Jan-Pieter Anten,
Vice President, Human Resources Jan-Pieter joined Interxion
as VP Human Resources in 2011 and is responsible for the development and implementation of our HR strategy. His experience in human resources enables him to oversee the recruitment, development and retention of the experienced and dedicated staff
who are key to our business across Europe. He joined Interxion from global management
consulting firm Hay Group, where he held the position of Director, International Strategic Clients Europe. In previous posts, he has worked as VP Human Resources for other international organisations such as Synthon and as a senior consultant within
Hay Group. Jan-Pieter holds a degree in Pharmaceutical Sciences from the University of
Utrecht. |
|
|
| |
|
|
|
|
| JAAP
CAMMAN

|
|
Jaap Camman, Senior Vice President, Legal Jaap joined Interxion in 1999 and is
responsible for all legal and corporate affairs across the group. Jaap provides strategic legal direction, drawing on his extensive experience in corporate financing, finance restructuring, corporate governance and business design.
He joined Interxion after working in a number of roles within the Dutch government during which time
he was responsible for the development of financial sector legislation and represented the Netherlands both at European Union and United Nations level. In his latest role he served as Deputy Head of the Insurance Division at the Netherlands Ministry
of Finance. Jaap holds a Masters degree in Law from the University of Utrecht. |
|
|
|
| INTERXION ANNUAL REPORT 2014 / 11 |
OUR COUNTRY TEAM
We have strong local management, operational, sales, service delivery and assurance teams, enabling us to deliver a more efficient, consistent and personal service.
Our country leaders have the local knowledge and focus to ensure we provide outstanding service to our customers and continue to expand our data centre campuses.
|
|
|
|
|
|
|
|
|
|


|
|
|
|
|
|
WHAT OUR CUSTOMERS SAY ABOUT US
“When it comes to data centres, no-one does it better than Interxion. Having looked at all providers in Spain, Interxion was our first choice for quality,
reliability and scalability. They combine outstanding flexibility with a reassuring attention to detail.”
Diego Cabezudo, CEO Gigas Hosting
“With its core expertise in data centre operations, Interxion can much more efficiently and
reliably perform both installation and maintenance. We also benefit from lower initial investment costs and shorter implementation times, as well as greater scalability, flexibility and cost efficiency offered by the cloud model.”
Thomas Leidenbach,
Head of IS Infrastructure Bombardier
“We were pleased to see Interxion enter the Marseille market. It’s great to have a partner who focuses on connectivity, digital media and cloud segments, and
recognises the connectivity and business advantages of Marseille and supports us as we continue to grow our business.”
Franck Simon, Managing Director
France-IX “Interxion’s London facilities were a perfect fit to complement our
network build in key European locations, bringing us closer to potential new customers. This has also enabled us to lower the cost of our infrastructure build, improving our competitiveness – without compromising service quality.”
Clive Hamilton,
VP Network Services NTT Europe
“In the coming years we want to expand our activities in Europe by providing telecommunication services with the highest standards. We believe Interxion is the
best partner to facilitate this growth, thanks to central locations of the data centres and providing access to the Internet Exchanges and Connectivity Hubs where the biggest and fastest network connections come together.”
Bjarni Thorvardarson,
CEO Hibernia Networks |
|
|
|
| 12 / INTERXION ANNUAL REPORT 2014 |
OUR SEGMENT TEAM
Our segment strategies are led by people who understand our customers and have direct experience of the challenges they face. Our segment leaders spend time and
become familiar with their business objectives, how their technology platforms work and explore solutions available. They will continue to develop our communities of interest strategy.
|
|
|
|
|
|
|
|
|
|
|
| Bill
Fenick, Financial Services |
|
|
|
|
|
|
|
WHAT OUR CUSTOMERS SAY ABOUT US “We were impressed by Interxion’s
track record in Financial Services combined with the unrivalled range of connectivity to the entire CEE region from the Vienna data centre.”
Sean Chinnock, Director COO Data and Services,
Deutsche Börse “Working with Interxion as a European data centre partner has
proved to be a positive business decision for Zayo. We’re very happy with the partnership we have and look forward to continued collaboration and potential expansion.”
Alastair Kane,
VP for Europe, Zayo Group
“Interxion really stood out for their understanding of our target business model and the flexibility to make it a reality.”
Ruben van der Zwan,
CTO, Amsio
“The resilience and reliability of systems need to be of a very high standard. We needed to find a partner who was willing to talk through options that were not
necessarily about increased space and increased cost.” Mary
Hensher, IT Director, Cancer Research UK
“When reviewing options for our data centre expansion we were impressed with the quality, professionalism and level of connectivity from Interxion. They
demonstrated an impressive commitment to understanding our specific industry needs and have actively pursued a strategy designed to support our success and long-term growth.”
Matthew Breedlove, Technical and Data Operations, Rubicon
Project |
|
|
| Bill works to build on our financial hubs
that comprise access points to financial markets, tier 1 banks, hedge funds, prime brokers and independent software vendors. With a career spanning over 19 years in financial services, Bill has first-hand experience of large capital-intensive
infrastructure projects: developing new products and services and, ultimately, running businesses that provide cloud, data and infrastructure services to the financial services Industry.
“Interxion has rich communities of financial services companies colocated
in its data centres. Via these communities of interest, our customers implement their infrastructure and cross connect to their own clients. This all leads to an ease of doing business with us and greater return on their investment.”
|
|

|
|
|
|
|
|
|
|
| |
|
|
|
|
|
|
|
|
| Jeff
Smith, Connectivity |
|
|
|
|
|
|
|
|
| Jeff focuses on attracting into our data
centres the connectivity providers most demanded by our customers and has over 20 years’ experience in Telecommunications across multiple roles in various markets including EMEA, Australia & NZ. As connectivity providers launch new
services and capabilities, Jeff ensures they’re made available in our data centres as early as possible. This provides our customers with a competitive advantage - access to new technologies ahead of their competitors.
“I am focused on executing a clear connectivity strategy ensuring that
Interxion is central to their European market requirements – this in turn creates a diverse community of interest that supports and drives growth amongst all our customers.”
|
|

|
|
|
|
|
|
|
| |
|
|
|
|
|
|
|
|
| Vincent in’t Veld, Cloud |
|
|
|
|
|
|
|
|
| Vincent identifies and targets prospects
that will make the most magnetic and strategic additions to our cloud communities of interest, and leads the process for developing relationships with these prospects and winning their business. Vincent draws on over 19 years of experience in
international telecoms and IT, working in various roles across sales, product management and marketing.
“The migration towards cloud is a phased process. IT leaders are assessing what applications and workloads should go where. It’s key for
our service provider customers to understand from partners, like Interxion, how to best build out their cloud and networking infrastructure and lower the thresholds for enterprise customers to migrate their applications and workloads to the
cloud.” |
|

|
|
|
|
|
|
|
| |
|
|
|
|
|
|
|
|
| Ian McVey,
Enterprise and Systems Integrators |
|
|
|
|
|
|
|
|
| Ian is responsible for the go-to-market
strategy for our enterprise and system integrator segments. His target is to win “first-of-a-kind” deals for Interxion. He ensures we identify, promote and capitalise on the key trends in the market through a mix of value proposition
articulation, market-making and education. With nearly 20 years in ICT from strategy consulting to telecoms, software and outsourcing, Ian understands the pressures and the opportunities in transforming business models, and can see the resulting
opportunity for Interxion. |
|

|
|
|
|
|
|
|
| “Interxion is a key enabler of the
digital economy. As enterprises replatform to the cloud and leverage innovations in big data, Interxion is strongly positioned to enable customers to create value from their IT operations, supported by a strong community”
|
|
|
|
|
|
|
|
| |
|
|
|
|
|
|
|
|
| Bryan Hill,
Digital Media |
|
|
|
|
|
|
|
|
|
| Bryan is responsible for our digital media
business and the strategic development and implementation of our communities of interest across video, social media, advertising, gaming and gambling. Bryan has spent 20 years in the sector and has experience of the monetisation of content and
audiences, an understanding of the complex, technical and evolving workflows that underpin the digital media value chains and the challenges our customers are facing. |
|

|
|
|
|
|
|
|
|
| “The growth in the delivery of online
content and services to consumers, the automation of advertising, the movement of media workflows to the cloud and the transformation of TV are driving new interconnected communities. It is our mission to help companies navigate and meet these
challenges” |
|
|
|
|
|
|
|
|
|
|
| INTERXION ANNUAL REPORT 2014 / 13 |
CONSISTENT EXECUTION
We offer outstanding customer service and deliver exceptional data centre performance. We embrace innovation to ensure that our data centres remain state-of-the-art,
and we strive to maintain our leadership in data centre design, construction, operation, maintenance, sustainability and management.
Continuing to deliver best-in-class service
We are focused on maximising customer satisfaction. Our European Customer Service Centre (ECSC) operates round the clock and gives our customers a single number to call
for help at any time of the day or night.
As part of our ongoing drive to deliver outstanding customer service, we introduced Cloud Connect, allowing for easy
implementation of hybrid IT environments in the data centre. Currently in operation in the UK, this will be rolled out to more countries in 2015.
Building new capacity in line with demand
We continue to invest in data centre capacity in the context of our disciplined investment
approach and prudent financial policy. Our expansion plans are based on analysis of selling patterns, pipeline and trends in existing demand, and on working with our customers to understand their future capacity requirements.
Our expansions are fully funded and take place in phases to reduce risk and improve our return on capital.

Targeting new customers
We target new customers in segments where colocation delivers the highest value, including cloud and managed services, connectivity, digital media and financial services.
Winning new customers in these markets lets us create and expand communities of interest within our data centres.
We expect the benefits of our communities of
interest to continue to attract new prospects, lowering our customer acquisition costs and reducing churn.
Making it easier to do business with us
We expanded our international accounts focus so that our customers in multiple countries can share a single point of contact. This coupled with our product
standardisation programme, means that customers can order the same product in any country to allow for scalability and agile growth.

We continue to develop tools to make our interaction with customers easier, including our Customer Portal that provides real-time
access to information. And we invest in our service delivery and assurance teams to be responsive to customers’ needs locally, in their own language.

|
| 14 / INTERXION ANNUAL REPORT 2014 |
CONTINUED GROWTH
We aim to generate strong returns on the capital we invest by adding value to our customers through the communities of interest we build, and the market-leading
connectivity, high-quality infrastructure and best-in-class customer service that we offer.

NEW CUSTOMERS
| ● |
|
ACTIV Financial, ITG and SIX Group are some of the new financial services customers that now derive value from our ultra-low latency connectivity to global liquidity venues. |
| ● |
|
Salesforce.com, Oracle and Digital Ocean joined our growing community of cloud providers, taking advantage of our wealth of industry knowledge as well as our highly secure and resilient facilities. |
| ● |
|
We welcomed new digital media providers into our customer base, including Riedel Networks and SWISS TXT, who derive value from our growing content hubs, as cloud becomes a vital part of the media workflow.
|
| ● |
|
Bombardier and Minds + Machines are two of the customers who joined our enterprise and systems Integrator communities. These companies gain from increased efficiencies through community connections, and will be well
positioned to take advantage of trends such as big data and the Internet of Things. |
| ● |
|
We also saw a rapid increase in the number of connectivity customers in our Marseille facility, a strategic location which serves as the telecom landing point serving the Middle East and Africa as well as particularly
strong growth in the CDN market with companies such as Akamai, Edgecast and CDNetworks expanding their presence across Interxion locations.
|
|
| INTERXION ANNUAL REPORT 2014 / 15 |
MARKET STRATEGY
Interxion continues to execute a proven strategic approach that anticipates how the disruptions in the ICT industry will impact the market for colocation data centre
services and successfully captures the associated customer demand.
The premise of our market strategy is that current and future demand for data centre services is largely shaped by
enterprise cloud adoption and cloud provider deployment strategies.
Our strategy is designed to enable and benefit from the evolution of Cloud, and has been
validated through our ability to attract the leading global cloud infrastructure providers to our data centres. These leading cloud service providers recognize the value of the existing communities of interests we have established and their presence
will further enhance our ability to expand our communities as the migration to Cloud continues to evolve.
Our performance throughout 2014 reinforces our belief that
neutral colocation data centres have a central role to play in addressing the Cloud opportunity and in meeting the long term needs of our customers.
CAPTURING
THE FIRST WAVE OF CLOUD DEPLOYMENTS
The first phase of Cloud adoption has been underway for a few years and consists of enterprises embracing SaaS
(Software-as-a-Service) and IaaS (Infrastructure-as-a-Service) for standalone applications.
SaaS is the most mature model, as enterprises are shifting from software
licenses to a pay-per-use model to reduce their capital investments. The adoption of IaaS is also growing rapidly and is primarily driven by the small and medium business segment and specific workloads within enterprises - such as test and
development.

This first wave of adoption is fueling the rapid growth of service build-outs by Cloud Providers, with colocation data
centres playing a critical role in their deployment strategies, especially as US-based providers establish their presence in Europe to reach the local markets.
In
2014, Interxion expanded its relationship with all the main SaaS and IaaS vendors, leading to the fast growth of this segment, which now represents 26% of our revenue. Several Cloud Providers that are present in our data centres have raised their
forecasts for capacity requirements, and are planning further expansions into current and new cities.

PREPARING FOR HYBRID CLOUD ADOPTION
The
second phase of Cloud adoption is starting with the emergence of Hybrid Cloud solutions in the United States, which we expect to spill over into Europe in the coming years.
We are supporting our customers and partners with the development of their new applications that are being deployed in a hybrid environment of public and private clouds
to get the best of both worlds: optimal response time and full control, combined with the ability to flex the usage of resources up and down.
One of the key drivers
for this phase is PaaS (Platform-as-a-Service), which is becoming a strategic priority for Cloud Providers, developers and system integrators. Cloud Providers are making significant investments in PaaS to create Cloud communities on their platforms,
while developers and system integrators are embracing this new model for Cloud native applications.
This phase is very important for the colocation industry,
because it provides a strong indication that enterprises are starting to restructure their applications with a Hybrid Cloud model in mind, which makes them ideal candidates to be colocated with Cloud Providers in a carrier neutral data centre.
|
| 16 / INTERXION ANNUAL REPORT 2014 |

ANTICIPATING THE FUTURE EVOLUTION OF CLOUD
The third phase of Cloud adoption is further out in the future, but some of our customers are already starting to consider the redesign of their business processes to
take full advantage of the flexibility that Hybrid Cloud provides from an architectural standpoint. This is the phase when all the legacy processes will be rethought and applications will be fully converted to the new model, which presents a huge
opportunity for the colocation industry.
Our strategic focus is to enable Colocated Hybrid Cloud solutions that address current demand and prepare us for these
future developments. A hybrid environment requires fast, secure data flow between the different platforms to enable migration of workloads from one platform to another when necessary. Enterprises that are colocated in Interxion’s data centres
will be able to connect to the communities of interest that we support and will find it easier to rewrite business processes and applications to meet future requirements, potentially leapfrogging their competition.
Benefits of Colocation Data Centre Services
Carrier neutral colocation is the outsourcing option that best lends itself to a Hybrid Cloud model, and we expect it to fuel further growth in the
industry.
Enterprises cannot be expected to predict the shape of their IT beyond a few years, given the constantly changing mix of applications and
services, and those that house their IT in neutral facilities will have the flexibility to adapt and will be well-placed to create value in any business scenario.
Interxion has made the right investments over the last 24-36 months to capture this opportunity and accelerate the Hybrid Cloud adoption for Enterprises.
The neutral colocation data centres designed, built and operated by Interxion provide a single secure environment where customers simultaneously
have access to:
| |
● |
|
Direct connection to the major public cloud platforms, providing greater security and better performance than internet connectivity |
| |
● |
|
A wide choice of carriers for other networking needs |
| |
● |
|
The potential to connect to other providers of IT services housed in the same data centre campus |
| |
● |
|
State-of-the-art data centres for private cloud or legacy IT deployments behind the corporate firewall |

|
| INTERXION ANNUAL REPORT 2014 / 17 |
|
| 18 / INTERXION ANNUAL REPORT 2014 |
INTERXION ANNUAL REPORT
2014 / 19
FINANCIAL REVIEW

Interxion delivered a strong year of financial performance in 2014. Total revenue increased by 11% to €340.6 million
while recurring revenue, at €319.2 million, was up 10% year-on-year. Non-recurring revenues grew 35% year-on-year driven by strong customer installations. Adjusted EBITDA increased by 11%, to €146.4 million, and Adjusted EBITDA
margin increased slightly to 43.0% from 42.9% in 2013.
Net finance expense for the year was
€27.9 million, compared with €57.5 million in 2013; the decrease was primarily attributable to the €31.0 million one-off cost associated with the refinancing activities in 2013. The underlying blended interest cost of the business was 6.1%, improving 40 basis points compared to 2013. Net profit
for the year was €35.1 million, compared with €6.8 million in 2013 which was impacted by the one off refinancing costs. Underlying
adjusted net profit* for the year increased by 10%.
In April we returned to the public debt market to support growth by issuing €150 million in aggregate principal of our 6% Senior Secured Notes, due 2020, at a premium of 106.75, providing net proceeds of €157.9
million. The additional financing, combined with a new €9.2 million mortgage secured in 2014, was used to repay amounts drawn under our revolving facility and to fund further expansion
projects.
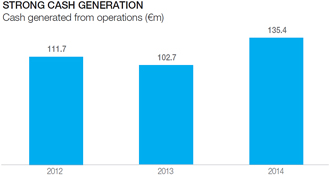
The Company continued to generate significant cash from its operations: €135.4 million in 2014.
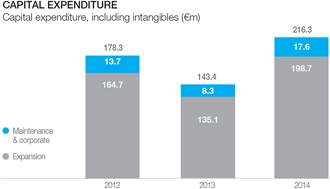
We continue to deploy these resources in a disciplined manner, which together with the additional financing, was used to service debt, repay amounts drawn under our revolving facility and to fund further customer-driven data centre expansion: €198.7 million of the €216.3 million capital expenditure in 2014 was invested in expansion and upgrade projects to build the foundation
of future growth.
During the year, we added a record 13,400 square metres of data centre equipped space, of which more than 70% has already been committed to
customers.
Josh Joshi
Chief Financial Officer
28 April 2015
INCOME STATEMENT HIGHLIGHTS
|
|
|
|
|
|
|
|
|
|
|
|
|
| (€ millions) |
|
2014 |
|
|
2013 |
|
|
2012 |
|
| Total revenue |
|
|
340.6 |
|
|
|
307.1 |
|
|
|
277.1 |
|
| Recurring revenue |
|
|
94% |
|
|
|
95% |
|
|
|
94% |
|
| Gross profit |
|
|
201.5 |
|
|
|
183.0 |
|
|
|
164.0 |
|
| Gross profit margin |
|
|
59% |
|
|
|
60% |
|
|
|
59% |
|
| Adjusted EBITDA |
|
|
146.4 |
|
|
|
131.8 |
|
|
|
115.0 |
|
| Adjusted EBITDA margin |
|
|
43% |
|
|
|
43% |
|
|
|
42% |
|
| Operating profit |
|
|
78.4 |
|
|
|
70.4 |
|
|
|
65.2 |
|
| Operating profit margin |
|
|
23% |
|
|
|
23% |
|
|
|
24% |
|
| Profit for the year |
|
|
35.1 |
|
|
|
6.8 |
|
|
|
31.6 |
|
REVENUE
Interxion benefits
from a business model that has a high proportion of recurring revenue. Total revenue during the year was €340.6 million, of which
€319.2 million, or 94%, was recurring. This compares with €307.1 million in revenue for 2013, of which €291.3 million, or 95%, was recurring. The increased percentage of non-recurring revenue was driven by an expected significant increase in customer installations in the latter part of 2014, in
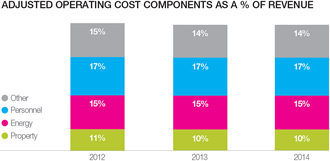
particular in the Netherlands, France and Austria. In the Big 4 countries – France, Germany, the Netherlands and the UK – €200.6 million or 94% of total revenue of €214.2 million was recurring which compares with €182.2 million (95%) of
€192.5 million total revenue in 2013. Recurring revenue in the Big 4 segment grew 9% organically on a constant-currency basis.
*For reconciliation see page 22
|
|
|
| 20 / INTERXION ANNUAL REPORT 2014 |
|
|
€118.6 million or 94% of
€126.4 million total revenue in the Rest of Europe countries was recurring. This compares with €109.1 million (95%) of €114.7 million total revenue in 2013. Recurring revenue in the Rest of Europe segment grew 9% organically on a constant-currency basis.
Germany and the Netherlands revenue growth was particularly strong in 2014 with Austria, Ireland and Sweden also performing very well within the Rest of Europe.
COST OF SALES
Cost of sales increased by
12% in 2014, to €139.1 million (2013: €124.1 million). Interxion’s business model not only results in a high percentage of
recurring revenue, but also delivers significant operating benefits: once data centres are in operation, a number of costs are relatively fixed contributing to operating leverage. Conversely, newly opened data centres generate comparatively higher
non-recurring installation revenues at a relatively higher cost of sales combined with nearly full operating costs at lower utilisation levels. This “expansion drag” was evident in 2014: most of the new openings occurred in the latter part
of the year and this, in turn, led to a slight decrease, to 59.2% (2013: 59.6%), in gross profit margin. The underlying inherent operating leverage of the business model remains intact.
SALES AND MARKETING COSTS
Sales and marketing costs increased by 8%, to €24.6 million (2013: €22.8 million), but were maintained at 7% of revenue. The increase was primarily a result of higher sales commissions
that resulted from increased bookings. Our marketing department continued to invest resources in understanding our customers’ needs and how best to meet them. The department continues to develop the expertise within our organisation to support
our strategy of developing customer communities of interest around magnetic customers.
These communities of interest will, we believe, result in a high-quality
customer base that benefits and grows from the businesses that our magnetic customers attract to our data centres leading to better customer satisfaction, lower churn and attractive investment returns.
GENERAL AND ADMINISTRATIVE COSTS
General and administrative costs increased
by 10% in 2014, to €98.9 million (2013: €90.1 million), and were maintained at 29% of revenue. The higher costs were primarily the
result of a €4.5 million increase, to €62.2 million (2013: €57.7 million), in
depreciation and amortisation and a €2.4 million increase in share-based payments. The higher depreciation and amortisation costs were consistent with the Company’s year-on-year
increase of equipped data centre space
and were partially offset by the full-year cost benefit arising from the adjustment in the estimated useful lives of certain assets
that had been accomplished in October 2013.
General and administrative costs, excluding depreciation, amortisation, impairments, share-based payments, M&A
transaction costs and increase/(decrease) in provision for onerous lease contracts, increased by 8% to €30.6 million compared with 2013 – an indication of the Company’s continued
tight cost control.
ADJUSTED EBITDA
Adjusted EBITDA increased 11%
during the year to €146.4 million (2013: €131.8 million). Adjusted EBITDA margin expanded by five basis points, to 43.0% (2013: 42.9%).
Adjusted EBITDA in the Big 4 countries – France, Germany, the Netherlands and the UK – totalled €113.4 million (2013: €104.4
million), a 52.9% margin (2013: 54.2%).
The decrease in Big 4 Adjusted EBITDA margin was the result of expansion drag and relatively higher sales commissions in
2014, partially offset by a positive Adjusted EBITDA performance in France. Adjusted EBITDA in the Rest of Europe totalled €67.3 million (2013:
€ 59.1 million), a 53.2% margin (2013: 51.5%). Growth in Adjusted EBITDA and Adjusted EBITDA margin was particularly strong in Belgium, Ireland, Sweden and Switzerland.
The operating leverage in the Company’s business model and cost control is manifested in its Adjusted EBITDA results, which grew faster than recurring revenue and
resulted in stable to expanding margins. Over the period, 2012–2014, Interxion’s recurring revenue increased by 23%, while Adjusted EBITDA grew by 27%.
During this period, Adjusted EBITDA margins expanded by 150 basis points, from 41.5% in 2012 to 43.0% in 2014 (2013: 42.9%). The drivers behind this performance can be
understood by looking at the trends in the nature of the operating costs.
The costs of data centre installation and energy have shown a direct correlation with the
growth of revenue, whereas property and other general and administrative costs generally grow at a slower pace. In 2014, the Company employed an average of 478 full-time equivalent employees, compared to 425 in 2013. We expect this number to
increase moderately in 2015, in line with new data centre capacity becoming available and with customer requirements.
OPERATING PROFIT
Operating profit increased by 11% to €78.4 million in 2014 (2013:
€70.4 million), primarily as a result of the increased scale of the business.
|
| INTERXION ANNUAL REPORT 2014 / 21 |
NET FINANCE EXPENSE
Net
finance expense for the year decreased to €27.9 million (2013: €57.5 million), primarily as a result of a €31.0 million one-off cost associated with the refinancing in 2013. Normalised net finance expense increased by 5%, principally because of the increase in total debt financing in 2014.
INCOME TAX EXPENSE
Income tax expense in 2014 was €15.4 million (2013: €6.1 million), an increase of 154%. Our effective tax rate decreased from 47% in 2013 to 31% in 2014. The underlying 2013
effective tax rate was approximately 30% after adjusting for the impact of the €31.0 million one-off refinancing costs and the
€0.6 million deferred tax asset adjustment. The underlying year-on-year increase in the effective tax rate for 2014 was caused by the increase of non-deductible share-based payments.
NET PROFIT
Net profit, which increased to €35.1 million (2013: €6.8 million), was also affected by the one-off refinancing costs. Net profit margin increased to 10.3% in 2014 (2013:
2.2%). Net profit, adjusted for refinancing charges, transaction expenses, capitalised interest and other items, increased by 10% to €32.5 million. Adjusted net profit margin decreased by 11 bps
to 10%.
EARNINGS PER SHARE
Diluted earnings per share (EPS) were €0.50 per share in 2014 (2013: €0.10). The increase was principally a result of the one-off
€31.0 million refinancing cost in 2013. Adjusted net profit for the year increased by 9% on an earnings-per-share basis.
NET PROFIT HIGHLIGHTS
|
|
|
|
|
|
|
|
|
|
|
|
|
|
|
|
|
| (€ millions) |
|
2014 |
|
|
2013 |
|
|
2012 |
|
| Net profit - as reported |
|
|
35.1 |
|
|
|
6.8 |
|
|
|
31.6 |
|
| Add back |
|
|
|
|
|
|
|
|
|
|
|
|
| + Refinancing charges |
|
|
0.6 |
|
|
|
31.0 |
|
|
|
— |
|
| + M&A transaction costs |
|
|
0.3 |
|
|
|
— |
|
|
|
— |
|
| + Deferred tax asset adjustment |
|
|
— |
|
|
|
0.6 |
|
|
|
— |
|
| + Dutch crisis wage tax |
|
|
— |
|
|
|
0.4 |
|
|
|
1.9 |
|
| + Adjustments to onerous lease |
|
|
— |
|
|
|
— |
|
|
|
0.8 |
|
| |
|
|
0.9 |
|
|
|
32.0 |
|
|
|
2.7 |
|
| Reverse |
|
|
|
|
|
|
|
|
|
|
|
|
| – Adjustments to onerous lease |
|
|
(0.8) |
|
|
|
— |
|
|
|
— |
|
| – Interest Capitalised |
|
|
(3.6) |
|
|
|
(1.7) |
|
|
|
(9.2) |
|
| |
|
|
(4.4) |
|
|
|
(1.7) |
|
|
|
(9.2) |
|
| Tax effect of above add backs & reversals |
|
|
0.9 |
|
|
|
(7.5) |
|
|
|
1.6 |
|
| Adjusted Net profit |
|
|
32.5 |
|
|
|
29.6 |
|
|
|
26.7 |
|
| |
|
|
|
|
|
|
|
|
|
|
|
|
| Reported Basic EPS: (€) |
|
|
0.51 |
|
|
|
0.10 |
|
|
|
0.47 |
|
| Reported Diluted EPS: (€) |
|
|
0.50 |
|
|
|
0.10 |
|
|
|
0.46 |
|
| Adjusted Basic EPS: (€) |
|
|
0.47 |
|
|
|
0.43 |
|
|
|
0.40 |
|
| Adjusted Diluted EPS: (€) |
|
|
0.46 |
|
|
|
0.43 |
|
|
|
0.39 |
|
BALANCE SHEET HIGHLIGHTS
|
|
|
|
|
|
|
|
|
|
|
|
|
|
|
|
|
| (€ millions) |
|
2014 |
|
|
2013 |
|
|
2012 |
|
| PP&E and intangible assets |
|
|
914.2 |
|
|
|
716.6 |
|
|
|
639.6 |
|
| Cash and cash equivalents |
|
|
99.9 |
|
|
|
45.7 |
|
|
|
68.7 |
|
| Other current and non-current assets |
|
|
159.0 |
|
|
|
148.5 |
|
|
|
110.9 |
|
| Total assets |
|
|
1,173.1 |
|
|
|
910.8 |
|
|
|
819.2 |
|
| |
|
|
|
|
|
|
|
|
|
|
|
|
| Borrowings |
|
|
561.6 |
|
|
|
364.0 |
|
|
|
288.1 |
|
| Other current and non-current liabilities |
|
|
175.4 |
|
|
|
158.9 |
|
|
|
155.6 |
|
| Total liabilities |
|
|
737.0 |
|
|
|
522.9 |
|
|
|
443.7 |
|
| Shareholders’ equity |
|
|
436.1 |
|
|
|
387.9 |
|
|
|
375.6 |
|
| Total liabilities and shareholders’ equity |
|
|
1,173.1 |
|
|
|
910.8 |
|
|
|
819.2 |
|
BALANCE SHEET
Interxion’s balance sheet
at financial year-end 2014 was strong and well capitalised, with growing assets, declining costs of capital, and increasing shareholders’ equity.
During 2014,
we invested €198.7 million for discretionary expansion and upgrade projects, including €8.5 million relating to the transaction
with Société Française du Radiotéléphone, SFR SA (“SFR”), to purchase a data centre campus in Marseille, France. The acquisition was completed in the summer of 2014. Including Marseille, we opened six new
data centres and expanded two others; we increased equipped space by 13,400 square metres. Net of depreciation, this resulted in a €196.4 million increase in property, plant and equipment.
At 31 December 2014, the total book value of the Company’s property, plant and equipment was €895.2 million.
Intangible assets, which primarily represent power grid rights and software development expenditure, increased on a net basis by
€1.1 million to end the year at €19.0 million.
The
Company’s deferred tax assets represent the temporary timing differences between the carrying amounts of assets for financial reporting purposes and the amounts for taxation purposes, and result primarily from tax loss carry-forwards. At
31 December 2014, the balance of these deferred tax assets was €30.1 million. Cash and cash equivalents increased to €99.9 million
at year-end 2014 (at year-end 2013: €45.7 million), primarily as a result of financing activities and cash generated from operations, offset by capital expenditures.
Trade and other current assets increased by 27%, to €122.4 million. The Company’s contracts typically require
that, with the exception of metered power usage which is invoiced in arrears, monthly recurring fees are invoiced quarterly in advance. Total trade payables and other liabilities increased 11% to
€158.7 million (2013: €143.6 million). Of this, 92%, or €146.5 million (2013 €132.1 million), were current liabilities. Other liabilities included deferred revenue, customer deposits, tax and social security liabilities, and accrued expenses.
22 / INTERXION ANNUAL REPORT 2014
Borrowings at year-end 2014 increased to €561.6 million (2013: €364.0 million), primarily as a result of the additional €150 million Senior Secured Notes and the new finance leases for the AMS7 and VIE
data centres, which were previously reported as operating leases.
To fund expansion, by Q1 2014, the Company had drawn
€30.0 million under the €100.0 million revolving facility. This was repaid in Q2 with the proceeds from the bond tap. The €100 million revolving facility was undrawn, providing a healthy liquidity cushion, as of 31 December 2014.
Interxion continued to be in full compliance with its debt covenants. Our net debt leverage ratio stood at 3.22 compared with a covenant of less than 4.00.
Other than the Vienna financial lease liability, which was settled in the first quarter of 2015, the Company had no significant near-term debt maturities: 94% of its debt
matures in 2019 or beyond. The €475 million 6.00% Senior Secured Notes mature in July 2020.
Shareholders’ equity increased by €48.2 million in 2014 to
€436.1 million, primarily as a result of retained net profit in 2014 and foreign currency translation differences, leading to a total comprehensive income of €38.4 million, and €9.8 million relating to new shares issued in respect of share options exercised.
CASH FLOW HIGHLIGHTS
|
|
|
|
|
|
|
|
|
|
|
|
|
| (€ millions) |
|
2014 |
|
|
2013 |
|
|
2012 |
|
| Cash generated from operations |
|
|
135.4 |
|
|
|
102.7 |
|
|
|
111.7 |
|
| Net cash flows from operating activities |
|
|
104.4 |
|
|
|
72.6 |
|
|
|
89.1 |
|
| Capital expenditures, including intangible assets |
|
|
(216.3) |
|
|
|
(143.4) |
|
|
|
(178.3) |
|
| Net cash flows used in investing activities |
|
|
(217.9) |
|
|
|
(143.4) |
|
|
|
(179.1) |
|
| Net cash flows from financing activities |
|
|
167.6 |
|
|
|
47.9 |
|
|
|
15.9 |
|
| Net movement in cash and cash equivalents |
|
|
54.2 |
|
|
|
(23.0) |
|
|
|
(74.0) |
|
| Cash and cash equivalents at the end of the year |
|
|
99.9 |
|
|
|
45.7 |
|
|
|
68.7 |
|
CASH FLOW
During 2014, cash generated from
operations was 32% higher, at €135.4 million (2013: €102.7 million), principally as a result of a higher operating profit and a decrease
in working capital. Movements in trade and other current liabilities, including an increase in deferred income and accrued expenses, primarily drove the decrease in working capital.
Reported cash interest paid in 2014 was €25.2 million (2013:
€22.7 million). In accordance with IFRS, Interxion is required to capitalise interest costs during construction.
The related cash interest paid reported in “purchase of property, plant and equipment” in 2014 was
€2.5 million (2013: €3.7 million).
Cash income taxes decreased by 20%, to €6.3 million (2013: €7.9 million). As a result, net cash flow from operating activities increased by 44%, to €104.4 million (2013: €72.6 million). Capital expenditure for 2014, which included the purchase of property, plant and equipment, plus the purchase of intangible assets, totalled
€216.3 million. These investments were financed through the cash generated from operations and incremental financing; €198.7 million of
this expenditure was invested in expansion and upgrade projects to fuel future growth.
Net cash flow from financing activities was €167.6 million (2013: €47.9 million). In April, net proceeds from the €150 million
bond tap at a premium of 106.75 amounted to €157.9 million. In addition, we acquired additional capital at attractive rates by securing a mortgage on our BRU1 data centre with net proceeds
amounting to €9.2 million. As a result, the blended net effective interest rate improved to approximately 6.1%.
Scheduled repayments for our mortgages totalled €2.0 million in 2014. The Company also received €3.3 million from the exercise of stock options. While the Company does not currently hedge its foreign exchange exposure, exchange rates had a small positive impact on cash balances in 2014,
compared with a small negative impact in 2013. During 2014, the Company’s cash and cash equivalents increased by €54.2 million, from
€45.7 million at the beginning of the year to €99.9 million at the year-end.
EVENTS SUBSEQUENT TO THE BALANCE SHEET DATE
On 9 March 2015, Interxion announced the signing of a definitive agreement on an all-share merger with London-based Telecity Group plc. At publication date, the
companies are working towards closing the merger transaction which is expected to complete sometime in the second half of 2015. The merger announcement does not affect the 2014 financial statements of Interxion.
INTERXION ANNUAL REPORT
2014 / 23
|
| 24 / INTERXION ANNUAL REPORT 2014 |
|
|
|
| REPORT
OF THE BOARD OF DIRECTORS |
|
|
INTERXION ANNUAL REPORT
2014 / 25
|
|
|
|
Report of the Board of Directors
|
|
|
REPORT OF THE BOARD OF DIRECTORS
STRUCTURE
Interxion Holding
N.V. (the “Company”) is a public limited liability company incorporated under the laws of the Netherlands and is the direct or indirect parent company of all companies forming the Interxion group of companies (the “Group”). Our
corporate seat is in Amsterdam, the Netherlands. Our principal office is at Tupolevlaan 24, 1119 NX, Schiphol-Rijk, the Netherlands. The Company was incorporated on 6 April 1998 as European Telecom Exchange B.V. and was renamed Interxion
Holding B.V. on 12 June 1998. On 11 January 2000, the Company was converted into a Naamloze Vennootschap. Since 28 January 2011 the Company’s shares have been listed on the New York Stock Exchange (“NYSE”).
The Company has one class of shares of which 69,317,029 had been issued and paid-up as of 31 December 2014. Of these shares 20,375,252 were issued by the Company in
2011 as part of its initial public offering.
BOARD OF DIRECTORS
BOARD POWERS AND FUNCTION
The Company has a one-tier management structure with one board of directors, currently consisting of one
Executive Director and six Non-executive Directors. Our Board is responsible for the overall conduct of our business and has the powers, authorities and duties vested in it by and pursuant to the relevant laws of the Netherlands and our Articles of
Association. In all its dealings, our Board shall be guided by the interests of our Group as a whole, including our shareholders and other stakeholders. Our Board has the final responsibility for the management, direction and performance of us and
our Group. Our Executive Director is responsible for the day-to-day management of the Company. Our Non-executive Directors supervise the Executive Director and our general affairs, and provide general advice to the Executive Director.
Our Chief Executive Officer (“CEO”), the Executive Director, is the general manager of our business, subject to the control of our Board, and is entrusted with
all of our Board’s powers, authorities and discretions (including the power to sub-delegate) delegated by the full Board from time to time by a resolution of our Board. Matters expressly delegated to our CEO are validly resolved upon by our CEO
and no further resolutions, approvals or other involvement of our Board is required. Our Board may also delegate authorities to its committees. Upon any such delegation our Board supervises the execution of its responsibilities by our CEO and/or our
Board committees. The Board remains ultimately responsible
for the fulfilment of its duties. Moreover, its members remain accountable for the actions and decision of the Board and have ultimate responsibility for the Company’s management and the
external reporting. The Board’s members are accountable to the shareholders of the Company at its Annual General Meeting.
BOARD
MEETINGS AND DECISIONS
All resolutions of our Board are adopted by a simple majority of votes cast in a meeting at which at least the majority of the
Directors are present or represented. A member of the Board may authorise another member of the Board to represent him/ her at the Board meeting and vote on his/her behalf. Each Director is entitled to one vote (provided that, for the avoidance of
doubt, a member representing one or more absent members of the Board by written power of attorney will be entitled to cast the vote of each such absent member). If there is a tie, the Chairman has the casting vote.
Our Board meets as often as it deems necessary or appropriate or upon the request of any member of our Board. During 2014 our Board met sixteen times. Our Board has
adopted rules, which contain additional requirements for our decision-making process, the convening of meetings and, through separate resolution by our Board, details on the assignment of duties and a division of responsibilities between Executive
Directors and Non-executive Directors. Our Board has appointed one of the Directors as Chairman and one of the Directors as Vice- Chairman of the Board. Our Board is further assisted by a Corporate Secretary. The Corporate Secretary may be a member
of our Board or of our Senior Management and is appointed by our Board.
|
| 26 / INTERXION ANNUAL REPORT 2014 |
|
|
|
|
|
Report of the Board of Directors
|
COMPOSITION OF THE BOARD
Our Board consists of a minimum of one Executive Director and a minimum of three Non-executive Directors, provided that our Board is comprised of a maximum of seven
members. The number of Executive Directors and Non-executive Directors is determined by our General Meeting, with the proviso that the majority of our Board must consist of Non- executive Directors. Only natural persons can be Non-executive
Directors. the Executive Directors and Non-executive Directors are appointed by our General Meeting, provided that our Board is classified, with respect to the term for which each member of our Board will severally be appointed and serve as a member
of our Board, into three classes, as nearly equal in number as reasonably possible.
Our Directors are appointed for a period of three years. The initial class I
Directors served for a term that expired at the Annual General Meeting held in 2011; the initial class II Directors served for a term that expired at the Annual General Meeting held in 2012; and the initial class III Directors are serving for a term
expiring at the Annual General Meeting held in 2013. At each Annual General Meeting, Directors appointed to succeed those Directors whose terms expire are appointed to serve for a term of office to expire at the third succeeding Annual General
Meeting after their appointment. Notwithstanding the foregoing, the Directors appointed to each class continue to serve their term in office until their successors are duly appointed and qualified or until their earlier resignation, death or
removal. If a vacancy occurs, any Director so appointed to fill that vacancy serves its term in office for the remainder of the full term of the class of Directors in which the vacancy occurred.
Our Board has nomination rights with respect to the appointment of a Director. Any nomination by our Board may consist of one or more candidates per vacant seat. If a
nomination consists of a list of two or more candidates, it is binding, and the appointment to the vacant seat concerned will be from the persons placed on the binding list of candidates, and will be effected through election. Notwithstanding the
foregoing, our General Meeting may, at all times, by a resolution passed with a two-thirds majority of the votes cast representing more than half of our issued and outstanding capital, resolve that such list of candidates will not be binding. Upon
completion of the initial public offering in January 2011, the Company entered into a shareholders’ agreement with affiliates of Baker Capital. For so long as Baker Capital or its affiliates continue to be the owner of shares representing more
than 25% of our outstanding shares, Baker Capital will have the right to designate for nomination a majority of the members of our Board of Directors, including the right to nominate the Chairman of our Board of Directors. As a result, these
shareholders have, and will continue to have, directly or indirectly, the power, among other things, to affect our legal and capital structure and our day-to-day operations, as well as the ability to elect and change our management and to approve
other changes to our operation. The interests of Baker Capital and its affiliates could conflict with the other shareholders’ interests, particularly if we encounter financial difficulties or are unable to pay our debts when due. Affiliates of
Baker Capital also have an interest in pursuing acquisitions, divestitures, financings or other transactions that, in their judgment, could enhance their equity investments, although such transactions might involve risks to the holders of shares. In
addition, Baker Capital or its affiliates may, in the future, own businesses that directly compete with the Company’s business or
do business with us. The concentration of ownership may further have the effect of delaying, preventing or deterring a change of control of our Company, could deprive our shareholders of an
opportunity to receive a premium for their shares as part of a sale of our Company, and might ultimately affect the market price of our shares.
The majority of our
Directors are independent as required by the NYSE Manual. Of our Non-executive Directors, Mr. Baker and Mr. Manning are considered to be non-independent as they are both general partners of Baker Capital affiliates. Our other Non-
executive Directors are all independent.
Directors may be suspended or dismissed at any time by our General Meeting. A resolution to suspend or dismiss a Director
must be adopted by at least a two-thirds majority of the votes cast, provided such majority represents more than half of our issued and outstanding share capital. Executive Directors may also be suspended by the Board.
On 1 January 2013 the Act on Management and Supervision became effective. This Act considers that a board is well balanced if it consists of at least 30% women and
30% men. “Large” companies must take this into account:
| ● |
|
Upon appointment and, where applicable, recommendation for nomination or nomination for appointment of Directors; and |
| ● |
|
When drawing up the profile for the size and composition of the Board. |
A company is considered “large” if, on
two consecutive balance sheet dates, at least two of the following three criteria are met:
| ● |
|
The value of the company’s assets according to its balance sheet, based on the acquisition and manufacturing price, exceeds €17,500,000; |
| ● |
|
The net turnover exceeds €35,000,000; and |
| ● |
|
The average number of employees is at least 250. |
The Company is committed to making an effort to increase the number of
women on our Board of Directors, which it will primarily do by focusing on female candidates for Director positions. The main focus of the Company will continue to be on ensuring that those persons best qualified for a position on our Board of
Directors are nominated, irrespective of their gender.
|
| INTERXION ANNUAL REPORT 2014 / 27 |
|
|
|
|
Report of the Board of Directors
|
|
|
DIRECTORS
|
|
|
|
|
|
|
|
|
|
|
| Name |
|
Age
|
|
Gender
|
|
Nationality
|
|
Position
|
|
Term
Expiration
|
|
David Ruberg |
|
69 |
|
Male |
|
American |
|
President,
Chief Executive Officer Vice-Chairman and
Executive Director |
|
2016 |
|
John C. Baker |
|
65 |
|
Male |
|
American |
|
Chairman and
Non-Executive Director |
|
2016 |
|
Frank Esser |
|
56 |
|
Male |
|
German |
|
Non-Executive
Director |
|
2017 |
|
Mark Heraghty |
|
51 |
|
Male |
|
Irish |
|
Non-Executive
Director |
|
2017 |
|
Jean F.H.P. Mandeville |
|
55 |
|
Male |
|
Belgian |
|
Non-Executive
Director |
|
2016 |
|
Robert M. Manning |
|
55 |
|
Male |
|
American |
|
Non-Executive
Director |
|
2015 |
|
Rob Ruijter |
|
63 |
|
Male |
|
Dutch |
|
Non-Executive
Director |
|
2015 |
David Ruberg, President, Chief Executive Officer,
Vice-Chairman and Executive Director
David
Ruberg joined us as President and Chief Executive officer in November 2007 and became Vice-Chairman of our Board of Directors when it became a one-tier board in 2011.
David served as Chairman of our Supervisory Board from 2002 to 2007 and on the Management Board from 2007 until the conversion into a one-tier board. From January 2002
until October 2007 he was affiliated with Baker Capital, a private equity firm. From April 1993 until October 2001 he was Chairman, president and CEO of
Intermedia Communications, a NASDAQ-listed broadband communications services provider, as well as Chairman of its majority-owned subsidiary, Digex, Inc., a NASDAQ-listed managed web-hosting
company. He began his career as a scientist at AT&T Bell labs, contributing to the development of operating systems and computer languages. David holds a Bachelor’s degree from Middlebury College and a Master’s in Computer and
Communication Sciences from the University of Michigan.
|
| 28 / INTERXION ANNUAL REPORT 2014 |
|
|
|
|
|
Report of the Board of Directors
|
John C. Baker, Chairman and Non-executive Director
John Baker is the Chairman of our Board of Directors. Before the Company moved to a one-tier board in January 2011, John served as Chairman of our Supervisory Board,
which he joined in 2007. He founded Baker Capital in 1995. John is a member of the board of Wine.com and university of Cincinnati IAC.. He is a graduate of Harvard College and Harvard Business School.
Frank Esser, Non-executive Director
Mr. Esser serves on our board of directors, to which he was appointed in June 2014. From 2000 onwards he has held various positions with the French telecom operator
SFR, where, from 2002 to 2012, he was President and CEO and from 2006 to 2009 he was a member of the Vivendi Management board. Prior to that he was a Senior Vice President of Mannesmann International Operations until 2000. Frank serves on the board
of AVG N.V., Rentabiliweb S.A. and Swisscom AG. He is a Business Administration graduate from Cologne University and he holds a Doctorate in Business Administration from the Cologne University.
Mark Heraghty, Non-executive Director
Mr. Heraghty serves on our board of directors, to which he was appointed in June 2014. His most recent position is Managing Director of Virgin Media Business. From
2006 to 2009, he was President EMEA for Reliance Globalcom with regional responsibility for the former FLAG Telecom and Vanco businesses which Reliance acquired. From 2000 to 2003, he was the CEO Europe for Cable & Wireless. Mark graduated
from Trinity College Dublin with a degree in Mechanical Engineering (1985) and holds an MBA awarded by Warwick University (1992).
Jean F.H.P. Mandeville, Non-executive Director
Jean F.H.P. Mandeville joined our Board in January 2011. Mr Mandeville is a co-founder and general partner of private equity firm Astra Capital Management LCC. From
October 2008 to December 2010, Jean served as Chief Financial Officer and board member of MACH S.à.r.l. He was an Executive Vice-President and the Chief Financial Officer of Global Crossing Holdings ltd/Global Crossing ltd from February 2005
to September 2008, where he was responsible for all of its financial operations. He served as Chief Financial Officer of Singapore technologies Telemedia pte. ltd/St Telemedia from July 2002 to January 2005. Jean was with British Telecom from 1992
to June 2002, where he served in various capacities covering all sectors of the telecommunications market (including wired, wireless and multimedia) in Europe, Asia and the Americas. He was President of Asia pacific from July 2000 to June 2002,
Director of International Development, Asia pacific from June 1999 to July 2000, and General Manager, Special projects from January 1998 to July 1999. He was a Senior Consultant with Coopers & Lybrand, Belgium, from 1989 to 1992. He
graduated from the University Saint-Ignatius Antwerp with a Master’s in Applied Economics in 1982 and a Special Degree in Sea Law in 1985.
Robert M. Manning, Non-executive Director
Before the conversion into a one-tier board in January 2011, Robert was a member of our Supervisory Board, which he joined in 2002.
Robert is a general partner with Baker Capital. He was CFO of Intermedia Communications, Inc., a NASDAQ-listed broadband communications services provider, from 1996 to
2001 and a Director of its majority-owned subsidiary Digex, Inc., a NASDAQ-listed managed web-hosting company, from 1998 to 2001. Prior to Intermedia, Robert was a founding executive of DMX, Inc. — the first satellite- and cable-delivered
digital radio network — from 1990 to 1996. Before that, he worked as an investment banker to the cable television and communications industries. He serves on the boards of Wine.com (Chairman) and Core Value Software (Chairman). He is a graduate
of Williams College.
Rob Ruijter, Non-executive Director
Mr. Ruijter serves on our board of directors, to which he was appointed in November 2014. Mr. Ruijter was the Chief Financial Officer of KLM Royal Dutch
Airlines from 2001 until its merger with Air France in 2004 and the Chief Financial Officer of VNU N.V. (a publicly listed marketing and publishing company now the Nielsen company) between 2004 and 2007. In 2009 and 2010, he served as the CFO of ASM
International N.V. (a publicly listed manufacturer of electronic components) and in 2013 as the interim CEO of Vion Food Group N.V.
Mr. Ruijter currently serves
on the Supervisory Boards of Wavin N.V. (a manufacturer of piping) and Ziggo N.V. (a publicly listed cable company) as Chairman of the Audit Committee and as non-executive director of Inmarsat Plc. He also serves on the Supervisory Board of Delta
Lloyd N.V. as Chairman of the Remuneration Committee and a member of the Audit and Risk Committees. Mr. Ruijter is a Certified Public Accountant in the United States and in the Netherlands and a member of the ACT in the UK.
The current members of the Board have been selected with a view to securing the relevant expertise and cultural background that the Company requires in its current state
of development. The performance and composition of the Board will be reviewed annually.
DIRECTORS’ INSURANCE AND INDEMNIFICATION
In order to attract and retain qualified and talented persons to serve as members of our Board or of our Senior Management, we currently provide such persons with
protection through a directors’ and officers’ insurance policy, and expect to continue to do so. Under this policy, any of our past, present or future Directors and members of our Senior Management will be insured against any claim made
against any one of them for any wrongful act in their respective capacities.
Under our Articles of Association, we are required to indemnify each current and former
member of our Board who was or is involved in that capacity as a party to any actions or proceedings, against all conceivable financial loss or harm suffered in connection with those actions or proceedings, unless it is ultimately determined by a
court having jurisdiction that the damage was caused by intent (opzet), wilful recklessness (bewuste roekeloosheid) or serious culpability (ernstige verwijtbaarheid) on the part of such member.
Insofar as indemnification of liabilities arising under the Securities Act may be permitted to members of our Board, officers or persons controlling us pursuant to the
foregoing provisions, we have been informed that, in the opinion of the SEC, such indemnification is against public policy as expressed in the Securities Act and is therefore unenforceable.
|
| INTERXION ANNUAL REPORT 2014 / 29 |
|
|
|
|
Report of the Board of Directors
|
|
|
BOARD COMMITTEES
Our Board has
established an audit committee, a compensation committee and a nominating committee. Each committee evaluates its performance annually to determine whether it is functioning effectively.
AUDIT COMMITTEE
Our audit committee consists of
three independent Directors, Rob Ruijter, Frank Esser and Mark Heraghty. Until June 2014 Cees van Luijk served as the chair of the audit committee. Jean Mandeville served as the chair until December 2014 and from that date onwards Rob Ruijter serves
as the chair of the audit committee. The audit committee is independent as defined under and required by rule 10A-3 under the US Securities Exchange Act of 1934, as amended (“rule 10A-3”) and the NYSE Manual. The audit committee is
responsible for the appointment (subject to Board and shareholders’ approval) of independent registered public accounting firm KPMG Accountants N.V. as our statutory auditors, for its compensation and retention, and for oversight of its work.
In addition, approval of the audit committee is required prior to our entering into any related-party transaction. It is also responsible for “whistleblowing” procedures, certain other compliance matters, and the evaluation of the
Company’s policies with respect to risk assessment and risk management. The audit committee met five times during 2014. Most of its time was dedicated to reviewing, with management and with the independent auditor, the unaudited quarterly
interim reports and the audited annual Dutch statutory financial statements as well as the 20-F. This included reviewing the effectiveness of the internal controls and of the Company’s disclosure controls and procedures (as defined in rules
13a-15(e) and 15d-15(e) under the Securities Exchange Act of 1934), and overseeing the Company’s compliance with its legal and regulatory requirements.
COMPENSATION COMMITTEE
Our compensation committee consists of two independent Directors, Frank Esser and Mark Heraghty, and one
non-independent Director, John Baker. Until June 2014 David Lister served as the chair and from that date onwards John Baker serves as chair of the compensation committee. Among other things, the compensation committee reviews, and makes
recommendations to the Board regarding the compensation and benefits of our CEO and our Board. The compensation committee also administers the issuance of shares and stock options and other awards under our equity incentive plan, and evaluates and
reviews policies relating to the compensation and benefits of our employees and consultants. The compensation committee met four times during 2014, with a focus on approving the 2013 senior management bonus payout, reviewing the long-term
compensation philosophy of the Company, and reviewing and approving the Company’s share and option grants and senior management’s 2014 cash incentive scheme.
NOMINATING COMMITTEE
Our nominating committee
consists of two independent Directors, Frank Esser and Mark Heraghty, and one non-independent Director, John C. Baker, who serves as the chair of the nominating committee. The nominating committee is responsible for, among other things, developing
and recommending to our Board our corporate governance guidelines, identifying individuals qualified to become Directors, overseeing the evaluation of the performance of the Board, selecting the Director nominees for the next annual meeting of
shareholders, and selecting Director candidates to fill any vacancies on the Board. The nominating committee met four times during 2014. The main focus of this meeting was to discuss the nomination of Non-executive Directors.
GENERAL MEETINGS OF SHAREHOLDERS AND VOTING RIGHTS
Our Annual General Meeting must be held within six months of the end of the previous financial year. It must be held in the Netherlands in Amsterdam, Haarlemmermeer
(Schiphol Airport) or Hoofddorp. Our financial year coincides with the calendar year. The notice convening the Annual General Meeting, together with the agenda for the meeting, shall be sent to the addresses of the shareholders shown in the register
of shareholders. An extraordinary general meeting may be convened whenever our Board or CEO deems it necessary.
In addition, shareholders and/or persons having the
rights conferred by the laws of the Netherlands upon holders of depositary receipts issued with a company’s cooperation for shares in its capital representing in the aggregate at least one-tenth of the Company’s issued capital, may request
the Board to convene a General Meeting, stating specifically the business to be discussed. If the Board has not given proper notice of a General Meeting within the four weeks following receipt of the request, the applicants shall be authorised to
convene a meeting themselves. Each of the shares confers the right to cast one vote. each shareholder entitled to participate in a General Meeting, either in person or through a written proxy, is entitled to attend and address the meeting and, to
the extent that the voting rights accrue to him or her, to exercise his or her voting rights in accordance with our Articles. The voting rights attached to any shares, or shares for which depositary receipts have been issued, are suspended as long
as they are held in treasury.
At the Annual General Meeting the following items are discussed and/or approved as a minimum:
| ● |
|
The adoption of the annual accounts; |
| ● |
|
The appointment of the auditor to audit the annual accounts; |
| ● |
|
The discharge of the Directors from certain liabilities; |
| ● |
|
Appointment of Directors; and |
The Board of Directors requires the approval of the General Meeting for resolutions of the Board
that entail a significant change in the identity or character of the Company or the business connected with it, which significant changes in any case include:
| ● |
|
The transfer of (nearly) the entire business of the Company to a third party; |
| ● |
|
The entering into or termination of a long-term co-operation of the Company or one of its subsidiaries with another legal entity or company or as fully liable partner in a limited or general partnership, if this
co-operation or termination is of major significance for the Company; and |
| ● |
|
The acquisition or disposal by the Company or by one of its subsidiaries of participating interests in the capital of a company representing at least one-third of the sum of the assets of the Company as shown on its
balance sheet according to the last adopted annual account of the Company. |
Shareholders holding at least 3% of our issued share capital may submit
agenda proposals for the General Meeting. Provided we receive such proposals no later than 60 days before the date of the General Meeting, and provided that such a proposal does not, according to our Board, conflict with our vital interests, we will
have the proposals included in the notice.
Pursuant to the provisions in our Articles of Association, the General Meeting may only upon a proposal of the Board
resolve to amend the Company’s Articles of Association, change the Company’s corporate form, enter into a Dutch statutory (de) merger or dissolve and liquidate the Company. Moreover these decisions require a resolution passed with a
two-thirds majority of the votes cast representing at least one-half of the Company’s issued share capital.
|
| 30 / INTERXION ANNUAL REPORT 2014 |
|
|
|
|
|
Report of the Board of Directors
|
ANTI-TAKEOVER MEASURES
The Company has no anti-takeover measures in place. Although we do not envisage adopting any specific anti-takeover measures, the Board of Directors, pursuant to the
Articles of Association as adopted by the General Meeting on 26 January 2011 and as amended on 20 January 2012, has been designated for a period of five years, which terminates on 28 January 2016, to issue shares and grant rights to
subscribe for shares up to the amount of our authorised share capital.
ISSUANCE OF SHARES
The General Meeting is authorised to decide on the issue of new shares or to designate another body of the Company to issue shares for a fixed period of a maximum of five
years. On such designation, the number of shares which may be issued must be specified. The designation may be extended for a period not exceeding five years. A resolution of the General Meeting to issue shares or to designate another body of the
Company as the competent body to issue shares can only be adopted at the proposal of the Board. The General Meeting has designated the Board as the body of the Company authorised to issue shares with the power to limit or exclude the rights of
pre-emption relating thereto for a period that will end on 28 January 2016.
ACQUISITION BY THE COMPANY OF SHARES IN ITS ISSUED
CAPITAL
The Company may acquire shares in its issued capital only if all of the following requirements are met:
| 1. |
The distributable equity of the Company must be at least equal to the purchase price; |
| 2. |
The aggregate nominal value of the shares already held by the Company and its subsidiaries and of the shares held in pledge by the Company does not exceed one-half of the Company’s issued capital; and
|
| 3. |
The Board has been authorised by the General Meeting thereto. Such authorisation shall be valid for not more than 18 months and the General Meeting must specify in the authorisation the number of shares which may be
acquired, the manner in which they may be acquired and the limits within which the price must be set. This authorisation is not required insofar as shares in the Company’s issued share capital are acquired in order to transfer them to employees
of the Company or of its subsidiaries as referred to in section 2:24b of the Dutch Civil Code pursuant to a plan applicable to such employees. |
COMPENSATION
PROCESS
In compliance with Dutch law, the General Meeting has adopted a directors’ remuneration policy for the Board of Directors. The remuneration of Executive Directors
shall be determined by the Board within the framework of this remuneration policy, which determination will be on the basis of recommendations made by the Board’s Compensation Committee. The remuneration of our Non-executive Directors shall be
determined by the General Meeting based on a proposal of the Board.
POLICY GOAL
The goal of the Company’s remuneration policy is to provide remuneration to its Directors in a form that will attract, retain and motivate qualified industry
professionals in an international labour market, and to align the remuneration of the Directors with the short- and long-term elements of the tasks of the Directors as well as with interests of the stakeholders of the Company. The compensation of
our Directors will be reviewed regularly. Our Executive Director has a management agreement that terminates on 30 June 2016.
COMPENSATION
The annual fixed cash compensation of our Executive Director for the year ended 31 December 2014, was €590,000
and consisted of an annual base salary of €550,000 and allowances of €40,000. Our Executive Director is also eligible for an annual cash
incentive, which is set at an on-target cash incentive percentage of 100% of his annual base salary. In 2014, he earned approximately €613,000 for achievements during 2014. In 2014, performance
shares were granted to the Executive Director (reference is made to note 21). Upon termination, the Executive Director is entitled to a contractually agreed compensation equal to 12 months’ base salary.
The annual cash compensation of our Non-executive Directors for the year ended 31 December 2014 was €40,000.
Each Non-executive Director who was a member of the Company’s audit committee in addition received €20,000 gross per annum, and the chairman of the Company’s audit committee received a
further €10,000 gross per annum. Each Non-executive Director who was a member of the Company’s compensation committee in addition received
€5,000 gross per annum, and the chairman of the Company’s compensation committee received a further €5,000 gross per annum. No other
cash incentives are paid to our Non-executive Directors. An overview of the annual compensation of our Non-executive Directors is disclosed in note 34.
In addition
to the cash compensation paid for the services delivered in fiscal year 2014, each of our Non-executive Directors was awarded restricted shares equivalent to a value of €40,000 for the services
to be delivered in the AGM year 2014–2015 (the period from June 2014 until the next year’s Annual General Meeting of Shareholders currently anticipated to be held in June 2015). The number of restricted shares was set on the basis of the
Company’s share value ($27.38) at the closing of the New York Stock Exchange on the day of the 2014 Annual General Meeting of Shareholders. For each Non-executive Director all of these restricted shares (1,996 restricted shares each) vest on
the day of the next Annual General Meeting of Shareholders. All of these restricted shares will be locked up for a period ending three years (with the exception of a cash settlement to cover taxes) after the date of award (the date of the 2014 AGM)
or the date the Non-executive Director ceases to be a director of the Company, whichever is sooner.
For the services delivered in the AGM year 2013–2014 (the
period from the AGM held in June 2013 until the next year’s Annual General Meeting of Shareholders held in June 2014), each of our Non-executive Directors was also awarded restricted shares (2,047 restricted shares each) equivalent to a value
of €40,000. The number of restricted shares was set on the basis of the Company’s share value at the closing of the New York Stock Exchange on the day of the 2013 Annual General Meeting of
Shareholders. All of these restricted shares vested at the General Meeting of Shareholders held at 30 June 2014 and will be locked up for a period ending three years with the exception of a cash settlement to cover taxes due) after the date of
award (the date of the 2013 AGM) or the date the Non-executive Director ceases to be a director of the Company, whichever is sooner.
For the services delivered in
the AGM year 2012–2013 (the period from June 2012 until the next year’s Annual General Meeting of Shareholders held in June 2013), our Non-executive Directors Mr. John Baker, Mr. Rob Manning and Mr. Cees van Luijk (until
June 2014) were awarded 5,000 options each, with an exercise price of $18.01. These options vested at the General Meeting held at 26 June 2013.
The Company does
not contribute to any pension scheme for its Directors. None of the Non-executive Directors is entitled to any contractually agreed benefit upon termination.
|
| INTERXION ANNUAL REPORT 2014 / 31 |
|
|
|
|
Report of the Board of Directors
|
|
|
SHARES BENEFICIALLY OWNED
In
the table below, beneficial ownership includes any shares over which a person exercises sole voting and/or investment power. Shares subject to options and/or restricted shares exercisable, as at 31 December 2014, are deemed outstanding and have
therefore been included in the number of shares beneficially owned. The shared voting and/or investment power, which Mr. Baker and Mr. Manning have through Baker Capital, representing 18,657,892 shares, is not included.
|
|
|
|
|
| Directors |
|
|
Shares Beneficially Owned
as at 31 December 2014 |
|
| David Ruberg |
|
|
1,388,000 |
|
| John C. Baker |
|
|
69,712 |
|
| Frank Esser |
|
|
– |
|
| Mark Heraghty |
|
|
– |
|
| Jean F.H.P. Mandeville |
|
|
17,047 |
|
| Robert M. Manning |
|
|
19,238 |
|
| Rob Ruijter |
|
|
– |
|
RISK MANAGEMENT
RISK MANAGEMENT AND THE INTERNAL CONTROL STRUCTURE
The aim of our risk management and internal control structure is to find the right balance between an effective, professional enterprise and the risk profile that we are
aiming for as a business. Our risk management and internal controls, based on the Committee of Sponsoring organizations (COSO) of the Treadway Commission Enterprise Risk Management Framework (2013), make a significant contribution to the prompt
identification and adequate management of strategic and market risks. They also support us in achieving our operational and financial targets and in complying with the applicable laws and regulations. The risk management and internal control
structure have been designed to meet the Sarbanes Oxley 404 requirements.
RISK MANAGEMENT APPROACH
The Board has the ultimate responsibility for the risk management and internal control structure. Local subsidiary management teams are responsible for implementing the
strategy, achieving results, identifying underlying opportunities and risks, and ensuring effective operations. They have to act in accordance with the policy and standards set by the Board, in which they are supported by corporate departments.
Compliance to standards and policies is discussed regularly between subsidiary management and representatives of the Board, and is subject to review by corporate departments.
INTERNAL AUDIT FUNCTION
In 2014, a formal
internal audit function was not in place.
FINANCIAL INSTRUMENTS
For the Company’s risk management procedures related to financial instruments we refer to the Group’s accounting policies and note 20, as included in these
financial statements.
INTERXION’S CODE OF CONDUCT
Our Code of Conduct and Business ethics is a reflection of our commitment to act as a responsible social partner and of the way we try to interact with all of our
stakeholders. It is noted that all transactions in which there are conflicts of interest with one or more directors shall be agreed on terms that are customary in the
sector concerned. Such transactions must be published in the annual report, together with a statement of the conflict of interest and a declaration that the relevant best practice provisions of
the Dutch Corporate Governance Code have been complied with. A director may not take part in any discussion or decision making with regard to topics where such director is conflicted.
RISK FACTORS
RISKS RELATED TO OUR BUSINESS
| ● |
|
Our operations may suffer from the effects of (i) business uncertainties resulting from the announcement of the proposed transaction with Telecity Group plc, (ii) contractual restrictions on our activities
during the period in which we are subject to the terms of the Implementation Agreement, and (iii) costs associated with the proposed transaction. |
| ● |
|
We cannot easily reduce our operating expenses in the short term, which could have a material adverse effect on our business in the event of a slowdown in demand for our services or a decrease in revenue for any reason.
|
| ● |
|
Our inability to utilize the capacity of newly planned data centres and data centre expansions in line with our business plan would have a material adverse effect on our business, financial condition and results of
operations. |
| ● |
|
If we are unable to expand our existing data centres or locate and secure suitable sites for additional data centres on commercially acceptable terms our ability to grow our business may be limited. |
| ● |
|
Failure to renew or maintain real estate leases for our existing data centres on commercially acceptable terms, or at all, could harm our business. |
| ● |
|
Our leases may obligate us to make payments beyond our use of the property. |
| ● |
|
We may experience unforeseen delays and expenses when fitting out and upgrading data centres, and the costs could be greater than anticipated. |
| ● |
|
We may incur non-cash impairment charges to our assets, in particular to our property, plant and equipment, which could result in a reduction to our earnings. |
| ● |
|
We face significant competition and we may not be able to compete successfully against current and future competitors. |
| ● |
|
Our services may have a long sales cycle that may materially adversely affect our business, financial condition and results of operations. |
| ● |
|
Our business is dependent on the adequate supply of electrical power and could be harmed by prolonged electrical power outages or increases in the cost of power. |
| ● |
|
A general lack of electrical power resources sufficient to meet our customers’ demands may impair our ability to utilize fully the available space at our existing data centres or our plans to open new data centres.
|
| ● |
|
A significant percentage of our Monthly Recurring Revenue is generated by contracts with terms of one year or less remaining. If those contracts are not renewed, or if their pricing terms are negotiated downwards, our
business, financial condition and results of operations would be materially adversely affected. |
| ● |
|
Our inability to use all or part of our net deferred tax assets could cause us to pay taxes at an earlier date and in greater amounts than expected. |
| ● |
|
Our operating results have fluctuated in the past and may fluctuate in the future, which may make it difficult to evaluate our business and prospects.
|
|
| 32 / INTERXION ANNUAL REPORT 2014 |
|
|
|
|
|
Report of the Board of Directors
|
| ● |
|
We are dependent on third-party suppliers for equipment, technology and other services. |
| ● |
|
We depend on the ongoing service of our personnel and senior management team and may not be able to attract, train and retain a sufficient number of qualified personnel to maintain and grow our business.
|
| ● |
|
Disruptions to our physical infrastructure could lead to significant costs, reduce our revenues and harm our business reputation and financial results. |
| ● |
|
Our insurance may not be adequate to cover all losses. |
| ● |
|
Our failure to meet the performance standards under our service level agreements may subject us to liability to our customers, which could have a material adverse effect on our reputation, business, financial condition
or results of operations. |
| ● |
|
We could be subject to costs, as well as claims, litigation or other potential liability, in connection with risks associated with the security of our data centres. |
| ● |
|
We face risks relating to foreign currency exchange rate fluctuations. |
| ● |
|
The slowdown in global economies and their delayed recovery may have an impact on our business and financial condition in ways that we cannot currently predict. |
| ● |
|
Acquisitions, business combinations and other transactions present many risks, and we may not realize the financial or strategic goals that were contemplated at the time of any transaction and such transactions may
alter our financial or strategic goals. |
| ● |
|
We focus on the development of communities of interest within customer segments and the attraction of magnetic customers. Our failure to attract, grow and retain these communities of interest could harm our business and
operating results. |
| ● |
|
Consolidation may have a negative impact on our business model. |
| ● |
|
Our operations are highly dependent on the proper functioning of our information technology systems. We are in the process of upgrading our information technology systems. The failure or unavailability of such systems
during or after the upgrade process could result in the loss of existing or potential customers and harm our reputation, business and operating results. |
| ● |
|
Substantial indebtedness could adversely affect our financial condition and our ability to operate our business, and we may not be able to generate sufficient cash flows to meet our debt service obligations.
|
| ● |
|
We require a significant amount of cash to service our debt, which may limit available cash to fund working capital and capital expenditures. Our ability to generate sufficient cash depends on many factors beyond our
control. |
| ● |
|
We may need to refinance our outstanding debt. |
| ● |
|
We are subject to significant restrictive debt covenants, which limit our operating flexibility. |
RISKS RELATED TO OUR INDUSTRY
| ● |
|
The European data centre industry has suffered from over-capacity in the past, and a substantial increase in the supply of new data centre capacity and/or a general decrease in demand for data centre services could have
an adverse impact on industry pricing and profit margins. |
| ● |
|
If we do not keep pace with technological changes, evolving industry standards and customer requirements, our competitive position will suffer.
|
| ● |
|
Terrorist activity throughout the world and military action to counter terrorism could adversely impact our business. |
| ● |
|
Our carrier neutral business model depends on the presence of numerous telecommunications carrier networks in our data centres. |
| ● |
|
We may be subject to reputational damage and legal action in connection with the information disseminated by our customers. |
RISKS RELATED TO REGULATION
| ● |
|
Laws and government regulations governing Internet-related services, related communication services and information technology and electronic commerce, across the European countries in which we operate, continue to
evolve and, depending on the evolution of such regulations, may adversely affect our business. |
| ● |
|
We and the industry in which we operate are subject to environmental and health and safety laws and regulations and may be subject to more stringent efficiency, environmental and health and safety laws and regulations
in the future. |
| ● |
|
Changes in Dutch or foreign tax laws and regulations, or interpretations thereof may adversely affect our financial position. |
| ● |
|
Laws and government regulations governing the licenses or permits we need across the European countries in which we operate may change, which can adversely affect our business. |
RISKS RELATED TO OUR SHARES
| ● |
|
The market price for our ordinary shares may continue to be volatile. |
| ● |
|
A substantial portion of our total outstanding ordinary shares may be sold into the market at any time. Such future sales or issuances, or perceived future sales or issuances, could adversely affect the price of our
shares. |
| ● |
|
You may not be able to exercise pre-emptive rights. |
| ● |
|
We may need additional capital and may sell additional ordinary shares or other equity securities or incur indebtedness, which could result in additional dilution to our shareholders or increase our debt service
obligations. |
| ● |
|
We have never paid, do not currently intend to pay and may not be able to pay any dividends on our ordinary shares. |
| ● |
|
Your rights and responsibilities as a shareholder will be governed by Dutch law and will differ in some respects from the rights and responsibilities of shareholders under U.S. law, and your shareholder rights under
Dutch law may not be as clearly established as shareholder rights are established under the laws of some U.S. jurisdictions. |
| ● |
|
The interests of our principal shareholders may be inconsistent with your interests. |
| ● |
|
We are a foreign private issuer and, as a result, and as permitted by the listing requirements of the New York Stock Exchange, we may rely on certain home country governance practices rather than the corporate
governance requirements of the New York Stock Exchange. |
| ● |
|
You may be unable to enforce judgments obtained in U.S. courts against us. |
| ● |
|
We incur increased costs as a result of being a public company. |
| ● |
|
If our internal controls over financial reporting are found to be ineffective, our financial results or our stock price may be adversely affected.
|
|
| INTERXION ANNUAL REPORT 2014 / 33 |
|
|
|
|
Report of the Board of Directors
|
|
|
CONTROLS AND PROCEDURES
MANAGEMENT’S REPORT ON INTERNAL CONTROL OVER FINANCIAL REPORTING
Management is responsible for establishing and maintaining
adequate internal control over financial reporting (as defined in rules 13a-15(f) and 15d-15(f) under the Securities Exchange Act of 1934) and for the assessment of the effectiveness of internal control over financial reporting. Internal control
over financial reporting includes maintaining records that, in reasonable detail, accurately and fairly reflect our transactions; providing reasonable assurance that transactions are recorded as necessary for preparation of our financial statements;
providing reasonable assurance that receipts and expenditures of Company assets are made in accordance with management authorisation; and providing reasonable assurance that unauthorised acquisition, use or disposition of Company assets that could
have a material effect on our financial statements would be prevented or detected on a timely basis. The Company’s internal control over financial reporting is a process designed to provide reasonable, but not absolute, assurance regarding the
reliability of financial reporting and the preparation of the consolidated financial statements in accordance with generally accepted accounting principles. Because of its inherent limitations, internal control over financial reporting is not
intended to provide absolute assurance that a misstatement of our financial statements would be prevented or detected.
In connection with the preparation of the
Company’s annual consolidated financial statements, management has undertaken an assessment of the effectiveness of the Company’s internal control over financial reporting as of 31 December 2014, based on criteria established in the
‘Internal Control Integrated Framework (2013)’ issued by the Committee of Sponsoring organizations of the Treadway Commission (the COSO Framework).
Under
the supervision and with the participation of the Chief Executive Officer (CEO) and Chief Financial Officer (CFO), the effectiveness of the Company’s disclosure controls and procedure (as defined in rule 13a-15(e) and 15d-15(e) under the
Securities Exchange Act of 1934) have been evaluated as of 31 December 2014. Based upon the evaluation, the CEO and CFO, concluded that as of 31 December 2014, the Company’s disclosure controls and procedures were effective and
designed to provide reasonable assurance that the information required to be disclosed by us in the reports that we file or submit under the Securities Exchange Act of 1934, is recorded, processed, summarised and reported within the time periods
specified in the SEC’s rules and forms and to ensure that material information required to be disclosed in the reports that we file or submit under the Securities Exchange Act of 1934 is accumulated and communicated to our management, including
the CEO and CFO, as appropriate, to allow timely decisions regarding required disclosure.
Management’s report is subject to attestation by the Company’s
independent registered public accounting firm. our consolidated financial statements as of 31 December 2014, 2013 and 2012 have been audited by KPMG Accountants N.V., an independent registered public accounting firm, which has issued an
attestation report on the Company’s internal control over financial reporting included in the 2014 annual report on Form 20-F.
CHANGES IN INTERNAL CONTROLS AND PROCEDURES OVER FINANCIAL REPORTING
Enhancements have been made during the period. There were no changes that occurred during the period covered by this report that have materially affected, or are
reasonably likely to materially affect, the Company’s internal control over financial reporting.
DUTCH CORPORATE GOVERNANCE CODE
In addition to the “Structure” section of this report on page 29, below is a further description of our corporate governance.
Since our initial public offering on 28 January 2011, we are required to comply with the Dutch Corporate Governance Code. The revised Dutch Corporate Governance Code
(the Code) became effective on 1 January 2009 and applies to all Dutch companies listed in a government-recognised stock exchange, whether in the Netherlands or elsewhere. Because the Company is listed on the New York Stock Exchange (NYSE) it
is also required to comply with the US Sarbanes-Oxley Act of 2002, as well as with NYSE listing rules, and the rules and regulations promulgated by the US Securities and Exchange Commission (SEC).
The full text of the Dutch Corporate Governance Code can be found at the website of the Monitoring Commission Corporate Governance Code
(www.commissiecorporategovernance.nl).
The Code is based on a ‘comply or explain’ principle. Material changes in the corporate governance structure of the
Company and in its compliance with the Code will be discussed at the Annual General Meeting as a separate agenda item. The discussion below summarises the deviations from the best practice provisions of the Code:
| ● |
|
Best practice provision II.2 contains detailed principles regarding the level and structure of the remuneration of the Board. Our current remuneration policy does not meet all of these principles. We review our
remuneration policy on an ongoing basis with a focus on best practice provisions the Company currently does not meet. |
| ● |
|
Best practice provision II.2.4 states among others that if options are granted, they shall, in any event, not be exercised in the first three years following the date of granting. the Company has granted options to some
of its Directors which vest starting within three years of the date of granting. Although not in accordance with the Code, the Company considers that it is in the best interest of the Company and its stakeholders to align the vesting of the options
with the term of their appointment as Director. |
| ● |
|
Best practice provision II.2.5 states that shares granted without financial consideration shall be retained for a period of five years or the end of employment if this period is shorter. The Company is operating a
long-term incentive plan whereby currently the beneficiary of the shares can either start trading 25% of the shares after the first, second, third and fourth anniversary, or (in case of shares awarded to Non-executive Directors) can trade all shares
after the fourth anniversary. |
| ● |
|
Best practice provision II.2.6 states that the option price may not be fixed at a level lower than a verifiable price or a verifiable price average in accordance with the trading in a regulated market on one or more
predetermined days during a period of not more than five trading days prior to and including the day on which the option is granted. Mr. Mandeville joined our Board on 26 January 2011 and the Company considers that on that day $13.00 was
fair value per share. In 2013, Mr. Baker and Mr. Manning were awarded 5,000 options each, to acquire shares in the capital of the Company at an exercise price of $18.01 per share, while the shares on the grant date traded at $25.61.
|
|
| 34 / INTERXION ANNUAL REPORT 2014 |
|
|
|
|
|
Report of the Board of Directors
|
| ● |
|
Best practice provision III.2.1 states that all Non-executive Directors, with the exception of not more than one person, shall be independent within the meaning of Best practice provision III.2.2. In deviation to this
principal, but in compliance with the NYSE Manual, two of our Non-executive Directors are not independent as they are both partners of Baker Capital, a private equity firm that owns 26.85% (as at 31 March 2015) of the Company’s shares.
Given the shareholder structure of the Company it is considered justified to deviate from this best practice principle. |
| ● |
|
Best practice provision III.7.1 states that a Non-executive Director may not be granted any shares and/or rights to shares by way of remuneration. The Company has granted shares to all and options to some of its
Non-executive Directors as it believes that this is a valuable instrument to align the interests of the Non-executive Directors concerned with those of the Company. |
| ● |
|
Best practice provision IV.1.1 states that the General Meeting may pass a resolution to cancel the binding nature of a nomination for the appointment of an Executive Director or a Non-executive Director, by an absolute
majority which may have to represent at most one-third of the issued capital. To cancel the binding nature of such a nomination, the Company’s Articles require a two-thirds majority representing more than 50% of the issued capital.
|
Management is responsible for establishing and maintaining adequate internal control over financial reporting and for the assessment of the
effectiveness of internal control over financial reporting. For management’s internal control statement we refer to “Management’s report on internal control over financial reporting” on page 34.
EVENTS SUBSEQUENT TO THE BALANCE SHEET DATE
On 9 March 2015, Interxion
announced the signing of a definitive agreement on an all-share merger with London-based Telecity Group plc. At publication date, the companies are working towards closing the merger transaction which is expected to complete sometime in the second
half of 2015. The merger announcement does not affect the 2014 financial statements of Interxion.
The Board of Directors
28 April 2015
|
| INTERXION ANNUAL REPORT 2014 / 35 |
|
| 36 / INTERXION ANNUAL REPORT 2014 |
|
|
|
| CONSOLIDATED |
|
|
| FINANCIAL STATEMENTS |
|
|
|
| INTERXION ANNUAL REPORT 2014 / 37 |
|
|
|
|
Consolidated Financial Statements
|
|
|
CONSOLIDATED FINANCIAL STATEMENTS
CONSOLIDATED INCOME STATEMENT
|
|
|
|
|
|
|
|
|
|
|
| |
|
For the year ended 31 December
|
| |
|
Note |
|
2014 |
|
|
2013
(€’000) |
|
2012 |
| Revenue |
|
5,6
|
|
|
340,624 |
|
|
307,111
|
|
277,121
|
| Cost of sales |
|
5,7
|
|
|
(139,075) |
|
|
(124,141)
|
|
(113,082)
|
|
Gross profit |
|
|
|
|
201,549 |
|
|
182,970
|
|
164,039
|
| Other income |
|
5
|
|
|
271 |
|
|
341
|
|
463
|
| Sales and marketing costs |
|
5,7
|
|
|
(24,551) |
|
|
(22,818)
|
|
(20,100)
|
| General and administrative costs |
|
5,7,10
|
|
|
(98,884) |
|
|
(90,134)
|
|
(79,243)
|
|
Operating profit |
|
5
|
|
|
78,385 |
|
|
70,359
|
|
65,159
|
| Finance income |
|
8
|
|
|
890 |
|
|
484
|
|
907
|
|
Finance expense |
|
8
|
|
|
(28,766) |
|
|
(57,937)
|
|
(18,653)
|
|
Profit before taxation |
|
|
|
|
50,509 |
|
|
12,906
|
|
47,413
|
| Income tax expense |
|
9
|
|
|
15,449 |
|
|
(6,082)
|
|
(15,782)
|
|
Profit for the year attributable to shareholders
|
|
|
|
|
35,060 |
|
|
6,824
|
|
31,631
|
| Earnings per share attributable to shareholders: |
|
|
|
|
|
|
|
|
|
|
| Basic earnings per share: (€) |
|
16
|
|
|
0.51 |
|
|
0.10
|
|
0.47
|
| Diluted earnings per share: (€) |
|
16
|
|
|
0.50 |
|
|
0.10
|
|
0.46
|
| CONSOLIDATED STATEMENT OF COMPREHENSIVE INCOME |
|
|
|
|
|
|
|
|
|
|
| |
|
|
|
For the year ended 31 December
|
| |
|
|
|
2014 |
|
|
2013
(€’000) |
|
2012 |
| Profit for the year attributable to shareholders |
|
|
|
|
35,060 |
|
|
6,824
|
|
31,631
|
|
Other comprehensive income |
|
|
|
|
|
|
|
|
|
|
| Items that are, or may be, reclassified subsequently to profit or loss |
|
|
|
|
|
|
|
|
|
|
| Foreign currency translation differences |
|
|
|
|
4,201 |
|
|
(3,220)
|
|
2,588
|
| Effective portion of changes in fair value of cash flow hedge |
|
|
|
|
(458) |
|
|
90
|
|
—
|
|
Tax on items that are, or may be, reclassified subsequently to profit or loss
|
|
|
(367) |
|
|
544
|
|
(571)
|
|
Other comprehensive income/(loss), net of tax
|
|
|
|
|
3,376 |
|
|
(2,586)
|
|
2,017
|
|
Total comprehensive income attributable to shareholders
|
|
|
|
|
38,436 |
|
|
4,238
|
|
33,648
|
Note: The accompanying notes form an integral
part of these consolidated financial statements.
38 / INTERXION ANNUAL REPORT 2014
|
|
|
|
|
Consolidated Financial Statements
|
CONSOLIDATED STATEMENT OF FINANCIAL POSITION
|
|
|
|
|
|
|
|
|
|
|
|
|
|
|
| |
|
|
|
|
As at 31 December
|
| |
|
Note |
|
|
2014 |
|
|
2013
(€’000) |
|
|
2012 |
|
Non-current assets |
|
|
|
|
|
|
|
|
|
|
|
|
|
|
| Property, plant and equipment |
|
|
10
|
|
|
|
895,184 |
|
|
|
698,748 |
|
|
620,931
|
| Intangible assets |
|
|
11
|
|
|
|
18,996 |
|
|
|
17,878 |
|
|
18,638
|
| Deferred tax assets |
|
|
9
|
|
|
|
30,064 |
|
|
|
34,446 |
|
|
30,376
|
| Financial asset |
|
|
12
|
|
|
|
774 |
|
|
|
774 |
|
|
774
|
| Other non-current assets |
|
|
13
|
|
|
|
5,750 |
|
|
|
16,536 |
|
|
4,959
|
| |
|
|
|
|
|
|
950,768 |
|
|
|
768,382 |
|
|
675,678
|
|
Current assets |
|
|
|
|
|
|
|
|
|
|
|
|
|
|
| Trade and other current assets |
|
|
13
|
|
|
|
120,762 |
|
|
|
96,703 |
|
|
74,854
|
| Short term investments |
|
|
14
|
|
|
|
1,650 |
|
|
|
– |
|
|
–
|
| Cash and cash equivalents |
|
|
14
|
|
|
|
99,923 |
|
|
|
45,690 |
|
|
68,692
|
| |
|
|
|
|
|
|
222,335 |
|
|
|
142,393 |
|
|
143,546 |
|
Total assets |
|
|
|
|
|
|
1,173,103 |
|
|
|
910,775 |
|
|
819,224
|
|
Shareholders’ equity |
|
|
|
|
|
|
|
|
|
|
|
|
|
|
| Share capital |
|
|
15
|
|
|
|
6,932 |
|
|
|
6,887 |
|
|
6,818
|
| Share premium |
|
|
15
|
|
|
|
495,109 |
|
|
|
485,347 |
|
|
477,326
|
| Foreign currency translation reserve |
|
|
15
|
|
|
|
10,440 |
|
|
|
6,757 |
|
|
9,403
|
| Hedging reserve, net of tax |
|
|
15
|
|
|
|
(247) |
|
|
|
60 |
|
|
–
|
| Accumulated deficit |
|
|
15
|
|
|
|
(76,089) |
|
|
|
(111,149) |
|
|
(117,973)
|
| |
|
|
|
|
|
|
436,145 |
|
|
|
387,902 |
|
|
375,574
|
|
Non-current liabilities |
|
|
|
|
|
|
|
|
|
|
|
|
|
|
| Trade payables and other liabilities |
|
|
17
|
|
|
|
12,211 |
|
|
|
11,537 |
|
|
11,194
|
| Deferred tax liability |
|
|
9
|
|
|
|
7,029 |
|
|
|
4,147 |
|
|
2,414
|
| Provision for onerous lease contracts |
|
|
18
|
|
|
|
1,491 |
|
|
|
4,855 |
|
|
7,848
|
| Borrowings |
|
|
19
|
|
|
|
540,530 |
|
|
|
362,209 |
|
|
288,085
|
| |
|
|
|
|
|
|
561,261 |
|
|
|
382,748 |
|
|
309,541
|
|
Current liabilities |
|
|
|
|
|
|
|
|
|
|
|
|
|
|
| Trade payables and other liabilities |
|
|
17
|
|
|
|
146,502 |
|
|
|
132,093 |
|
|
127,778
|
| Income tax liabilities |
|
|
|
|
|
|
4,690 |
|
|
|
2,229 |
|
|
2,301
|
| Provision for onerous lease contracts |
|
|
18
|
|
|
|
3,443 |
|
|
|
4,020 |
|
|
3,978
|
| Borrowings |
|
|
19
|
|
|
|
21,062 |
|
|
|
1,783 |
|
|
52
|
| |
|
|
|
|
|
|
175,697 |
|
|
|
140,125 |
|
|
134,109
|
|
Total liabilities |
|
|
|
|
|
|
736,958 |
|
|
|
522,873 |
|
|
443,650
|
|
Total liabilities and shareholders’ equity
|
|
|
|
|
|
|
1,173,103 |
|
|
|
910,775 |
|
|
819,224
|
Note: The accompanying notes form an integral part of these consolidated financial statements.
INTERXION ANNUAL REPORT
2014 / 39
|
|
|
|
Consolidated Financial Statements
|
|
|
CONSOLIDATED STATEMENT OF CHANGES IN SHAREHOLDERS’ EQUITY
|
|
|
|
|
|
|
|
|
|
|
|
|
|
|
|
|
|
|
|
|
|
|
|
|
|
|
|
|
|
|
|
|
| |
|
Note
|
|
Share
capital
|
|
Share
premium
|
|
Foreign
currency
translation
reserve
|
|
Hedging
reserve
|
|
Accumulated
deficit
|
|
Total
equity
|
| |
|
(€’000) |
|
Balance at 1 January 2014 |
|
|
|
|
|
6,887 |
|
|
|
|
485,347 |
|
|
|
|
6,757 |
|
|
|
|
60 |
|
|
|
|
(111,149) |
|
|
|
|
387,902 |
|
|
Profit for the year
|
|
|
|
|
|
— |
|
|
|
|
— |
|
|
|
|
— |
|
|
|
|
— |
|
|
|
|
35,060 |
|
|
|
|
35,060 |
|
|
Hedging result, net of tax
|
|
|
|
|
|
— |
|
|
|
|
— |
|
|
|
|
— |
|
|
|
|
(307) |
|
|
|
|
— |
|
|
|
|
(307) |
|
|
Total other comprehensive income (loss), net of tax |
|
|
|
|
|
— |
|
|
|
|
— |
|
|
|
|
3,683 |
|
|
|
|
— |
|
|
|
|
— |
|
|
|
|
3,683 |
|
| Total comprehensive
income/(loss), net of tax |
|
|
|
|
|
— |
|
|
|
|
— |
|
|
|
|
3,683 |
|
|
|
|
(307) |
|
|
|
|
35,060 |
|
|
|
|
38,436 |
|
|
Exercise of options
|
|
|
|
|
|
45 |
|
|
|
|
3,278 |
|
|
|
|
— |
|
|
|
|
— |
|
|
|
|
— |
|
|
|
|
3,323 |
|
| Share-based
payments |
|
21
|
|
|
|
— |
|
|
|
|
6,484 |
|
|
|
|
— |
|
|
|
|
— |
|
|
|
|
— |
|
|
|
|
6,484 |
|
| Total contribution
by, and distributions to, owners of the Company |
|
|
|
|
|
45 |
|
|
|
|
9,762 |
|
|
|
|
— |
|
|
|
|
— |
|
|
|
|
— |
|
|
|
|
9,807 |
|
|
Balance at 31 December 2014 |
|
|
|
|
|
6,932 |
|
|
|
|
495,109 |
|
|
|
|
10,440 |
|
|
|
|
(247) |
|
|
|
|
(76,089) |
|
|
|
|
436,145 |
|
|
|
|
|
|
|
|
|
|
|
|
|
|
|
|
|
|
|
|
|
|
|
|
|
|
|
|
|
|
|
|
|
|
|
|
Balance at 1 January 2013 |
|
|
|
|
|
6,818 |
|
|
|
|
477,326 |
|
|
|
|
9,403 |
|
|
|
|
— |
|
|
|
|
(117,973) |
|
|
|
|
375,574 |
|
| Profit for the year |
|
|
|
|
|
— |
|
|
|
|
— |
|
|
|
|
— |
|
|
|
|
— |
|
|
|
|
6,824 |
|
|
|
|
6,824 |
|
| Hedging result, net of tax |
|
|
|
|
|
— |
|
|
|
|
— |
|
|
|
|
— |
|
|
|
|
60 |
|
|
|
|
— |
|
|
|
|
60 |
|
| Total other
comprehensive income/(loss), net of tax |
|
|
|
|
|
— |
|
|
|
|
— |
|
|
|
|
(2,646) |
|
|
|
|
— |
|
|
|
|
— |
|
|
|
|
(2,646) |
|
| Total comprehensive income/(loss), net
of tax |
|
|
|
|
|
— |
|
|
|
|
— |
|
|
|
|
(2,646) |
|
|
|
|
60 |
|
|
|
|
6,824 |
|
|
|
|
4,238 |
|
| Exercise of options |
|
|
|
|
|
69 |
|
|
|
|
4,431 |
|
|
|
|
— |
|
|
|
|
— |
|
|
|
|
— |
|
|
|
|
4,500 |
|
| Share-based payments |
|
21
|
|
|
|
— |
|
|
|
|
3,590 |
|
|
|
|
— |
|
|
|
|
— |
|
|
|
|
— |
|
|
|
|
3,590 |
|
| Total contribution by, and
distributions to, owners of the Company |
|
|
|
|
|
69 |
|
|
|
|
8,021 |
|
|
|
|
— |
|
|
|
|
— |
|
|
|
|
— |
|
|
|
|
8,090 |
|
|
Balance at 31 December 2013 |
|
|
|
|
|
6,887 |
|
|
|
|
485,347 |
|
|
|
|
6,757 |
|
|
|
|
60 |
|
|
|
|
(111,149) |
|
|
|
|
387,902 |
|
| |
|
|
|
|
|
|
|
|
|
|
|
|
|
|
|
|
|
|
|
|
|
|
|
|
|
|
|
|
|
|
|
|
| Balance at 1 January 2012
|
|
|
|
|
|
6,613 |
|
|
|
|
466,166 |
|
|
|
|
7,386 |
|
|
|
|
— |
|
|
|
|
(149,604) |
|
|
|
|
330,561 |
|
| Profit for the year |
|
|
|
|
|
— |
|
|
|
|
— |
|
|
|
|
— |
|
|
|
|
— |
|
|
|
|
31,631 |
|
|
|
|
31,631 |
|
| Total other comprehensive income, net of tax |
|
|
|
|
|
— |
|
|
|
|
— |
|
|
|
|
2,017 |
|
|
|
|
— |
|
|
|
|
— |
|
|
|
|
2,017 |
|
| Total comprehensive income, net of
tax |
|
|
|
|
|
— |
|
|
|
|
— |
|
|
|
|
2,017 |
|
|
|
|
— |
|
|
|
|
31,631 |
|
|
|
|
33,648 |
|
| Exercise of options |
|
|
|
|
|
205 |
|
|
|
|
7,750 |
|
|
|
|
— |
|
|
|
|
— |
|
|
|
|
— |
|
|
|
|
7,955 |
|
| Share-based payments |
|
21
|
|
|
|
— |
|
|
|
|
3,410 |
|
|
|
|
— |
|
|
|
|
— |
|
|
|
|
— |
|
|
|
|
3,410 |
|
| Total contribution by, and
distributions to, owners of the Company |
|
|
|
|
|
205 |
|
|
|
|
11,160 |
|
|
|
|
— |
|
|
|
|
— |
|
|
|
|
— |
|
|
|
|
11,365 |
|
|
Balance at 31 December 2012 |
|
|
|
|
|
6,818 |
|
|
|
|
477,326 |
|
|
|
|
9,403 |
|
|
|
|
— |
|
|
|
|
(117,973) |
|
|
|
|
375,574 |
|
Notes: Since no minority shareholders in Group equity exist, the Group equity is entirely attributable to the
parent’s shareholders.
The accompanying notes form an integral part of these consolidated financial statements.
40 / INTERXION ANNUAL REPORT 2014
|
|
|
|
|
Consolidated Financial Statements
|
CONSOLIDATED STATEMENT OF CASH FLOWS
|
|
|
|
|
|
|
|
|
|
|
|
|
|
|
| |
|
|
|
|
For the years ended 31 December
|
| |
|
Note |
|
|
2014 |
|
|
2013
(€’000)
|
|
|
2012 |
| Profit for the year |
|
|
|
|
|
|
35,060 |
|
|
|
6,824 |
|
|
31,631
|
| Depreciation, amortisation and impairments |
|
|
10, 11
|
|
|
|
62,177 |
|
|
|
57,670 |
|
|
43,993
|
| Provision for onerous lease contracts |
|
|
18
|
|
|
|
(4,172) |
|
|
|
(3,285) |
|
|
(2,328)
|
| Share-based payments |
|
|
21
|
|
|
|
6,576 |
|
|
|
4,149 |
|
|
5,488
|
| Net finance expense |
|
|
8
|
|
|
|
27,876 |
|
|
|
57,453 |
|
|
17,746
|
| Income tax expense |
|
|
9
|
|
|
|
15,449 |
|
|
|
6,082 |
|
|
15,782
|
| |
|
|
|
|
|
|
142,966 |
|
|
|
128,893 |
|
|
112,312
|
| Movements in trade and other current assets |
|
|
|
|
|
|
(24,026) |
|
|
|
(22,712) |
|
|
(7,154)
|
| Movements in trade and other liabilities |
|
|
|
|
|
|
16,478 |
|
|
|
(3,510) |
|
|
6,543
|
|
Cash generated from operations |
|
|
|
|
|
|
135,418 |
|
|
|
102,671 |
|
|
111,701
|
| Interest and fees paid |
|
|
|
|
|
|
(25,166) |
|
|
|
(22,747) |
|
|
(18,081)
|
| Interest received |
|
|
|
|
|
|
471 |
|
|
|
569 |
|
|
1,007
|
| Income tax paid |
|
|
|
|
|
|
(6,305) |
|
|
|
(7,930) |
|
|
(5,545)
|
|
Net cash flows from operating activities |
|
|
|
|
|
|
104,418 |
|
|
|
72,563 |
|
|
89,082
|
| Cash flow from investing activities |
|
|
|
|
|
|
|
|
|
|
|
|
|
|
| Purchase of property, plant and equipment |
|
|
|
|
|
|
(212,938) |
|
|
|
(140,251) |
|
|
(172,036)
|
| Purchase of intangible assets |
|
|
|
|
|
|
(3,339) |
|
|
|
(3,130) |
|
|
(6,295)
|
| Acquisition of financial asset |
|
|
|
|
|
|
— |
|
|
|
— |
|
|
(774)
|
| Acquisition of short-term investments |
|
|
14
|
|
|
|
(1,650) |
|
|
|
— |
|
|
—
|
|
Net cash flows used in investing activities
|
|
|
|
|
|
|
(217,927) |
|
|
|
(143,381) |
|
|
(179,105)
|
|
Cash flow from financing activities
|
|
|
|
|
|
|
|
|
|
|
|
|
|
|
| Proceeds from exercised options |
|
|
|
|
|
|
3,324 |
|
|
|
4,500 |
|
|
7,956
|
| Proceeds from mortgages |
|
|
|
|
|
|
9,185 |
|
|
|
15,490 |
|
|
9,890
|
| Repayment of mortgages |
|
|
|
|
|
|
(2,041) |
|
|
|
(1,167) |
|
|
—
|
| Proceeds from revolving facility |
|
|
|
|
|
|
30,000 |
|
|
|
— |
|
|
—
|
| Repayments of revolving facility |
|
|
|
|
|
|
(30,000) |
|
|
|
— |
|
|
—
|
| Proceeds 6% Senior Secured Notes due 2020 |
|
|
|
|
|
|
157,878 |
|
|
|
317,045 |
|
|
—
|
| Repayment 9.50% Senior Secured Notes due 2017 |
|
|
|
|
|
|
— |
|
|
|
(286,478) |
|
|
—
|
| Payments for revolving facility agreement |
|
|
|
|
|
|
— |
|
|
|
(1,398) |
|
|
(1,159)
|
| Interest received at issuance of Additional Notes |
|
|
|
|
|
|
2,600 |
|
|
|
— |
|
|
—
|
| Interest paid
related to interest received at issuance of Additional Notes |
|
|
|
|
|
|
(2,600) |
|
|
|
— |
|
|
—
|
| Transaction costs related to senior secured facility |
|
|
|
|
|
|
(646) |
|
|
|
— |
|
|
—
|
| Repayment of other borrowings |
|
|
|
|
|
|
(72) |
|
|
|
(81) |
|
|
(804)
|
|
Net cash flows from financing activities |
|
|
|
|
|
|
167,628 |
|
|
|
47,911 |
|
|
15,883
|
| Effect of exchange rate changes on cash |
|
|
|
|
|
|
114 |
|
|
|
(95) |
|
|
163
|
|
Net movement in cash and cash equivalents
|
|
|
|
|
|
|
54,233 |
|
|
|
(23,002) |
|
|
(73,977)
|
| Cash and cash equivalents, beginning of year |
|
|
|
|
|
|
45,690 |
|
|
|
68,692 |
|
|
142,669
|
|
Cash and cash equivalents, end of year |
|
|
14
|
|
|
|
99,923 |
|
|
|
45,690 |
|
|
68,692
|
Note: The accompanying notes form an integral part of these consolidated financial statements.
INTERXION ANNUAL REPORT
2014 / 41
|
|
|
|
Consolidated Financial Statements
|
|
|
NOTES TO THE 2014 CONSOLIDATED FINANCIAL STATEMENTS
Interxion Holding N.V. (the “Company”) is domiciled in the
Netherlands. The Company’s registered office is at Tupolevlaan 24, 1119 NX Schiphol-Rijk, the Netherlands. The consolidated financial statements of the Company for the year ended 31 December 2014 comprise the Company and its subsidiaries
(together referred to as the “Group”). The Group is a leading pan-European operator of carrier-neutral Internet data centres.
The financial statements, which were approved and authorised for issue by the Board of Directors on 28 April 2015, are subject to adoption by
the General Meeting of Shareholders.
Statement of compliance
The consolidated financial statements have been prepared in accordance with International Financial Reporting Standards (“IFRSs”),
effective as at 31 December 2014, as issued by the Internal Accounting Standards Board (“IASB”), and IFRS as adopted by the European Union, and also comply with the financial reporting requirements included in Part 9 of Book 2 of the
Netherlands Civil Code.
Basis of measurement
The Group prepared its consolidated financial statements on a going-concern basis and under the historical cost convention except for certain
financial instruments that have been measured at fair value.
Change in accounting policies
Except for the changes below, the Group has consistently applied the accounting policies set out below to all periods presented in these
consolidated financial statements. The standards below are applicable for financial statements as prepared after 1 January 2014 for IFRS as issued by the International Accounting Standards Board, and are effective for IFRS as endorsed by the
European Union for periods ending after 1 January 2015. For preparation of these financial statements, these standards have been early adopted under IFRS as endorsed by European Union.
Amendment to IAS 32 – Financial instruments: Presentation
This amendment clarifies some of the requirements for offsetting financial assets and financial liabilities on the statement of financial position.
The amendment clarifies that the right of set-off must be available today, and is not contingent on a future event. Furthermore it clarifies that gross settlements with features that (i) eliminate credit and liquidity risk and (ii) process
receivables and payables in a single settlement process, are effectively equivalent to net settlements, and therefore satisfy the IAS 32 criterion. The amendment has no impact on the Group’s assets and liabilities.
Amendment to IAS 36 – Impairment of assets
This amendment has made small changes to the disclosures required by this standard when the recoverable amount is determined based on fair value
less costs of disposal. The amendment has impact when an impairment loss on non-financial assets is recognised or reversed. The amendment has no impact on the disclosure on the Group’s assets and liabilities.
Amendment to IAS 39 – Financial instruments: Recognition and measurement
The amendment relates to the novation of derivatives and the continuation of hedge accounting. This amendment considers
legislative changes to ‘over-the-counter’ derivatives and the establishment of central counterparties. Under IAS 39 novation of derivatives to central counterparties would result in discontinuance of hedge accounting. The amendment
provides relief from discontinuing hedge accounting when novation of a hedging instrument meets specified criteria. The group has applied the amendment and there has been no significant impact on the group financial statements as a result.
IFRIC 21 – Levies
The Group has adopted IFRIC 21 – Levies with a date of 1 January 2014. IFRIC 21 sets out the accounting for an obligation to pay a levy when that liability is within the scope of IAS 37 ‘Provisions’. The
interpretation addresses what the obligating event is that gives rise to pay a levy and when a liability should be recognized. The Group is not currently subject to significant levies so the impact on the Group is not significant.
IFRS 10 “Consolidated Financial Statements”, IFRS 11 “Joint Arrangements, IFRS 12 “Disclosure of Interests in Other
Entities” and revised standards IAS 27 “Separate Financial Statements” and IAS 28 “Investments in Associates and Joint Ventures” were issued during 2011 and are required to be adopted, with retrospective effect, by
1 January 2013 as per IFRS as issued by the IASB and by 1 January 2014 as per IFRS as endorsed by the European Union. These standards have already been early adopted in the Group’s 2013 financial statements.
Use of estimates and judgements
The preparation of financial statements in conformity with IFRS requires management to make judgements, estimates and assumptions that affect the application of accounting policies and the reported amounts of assets, liabilities,
income and expenses. Actual results may differ from these estimates, which together with underlying assumptions are reviewed on an ongoing basis. Revisions to accounting estimates are recognised in the period in which the estimates are revised and
in any future periods affected.
Judgements, estimates and assumptions applied by management in preparing these financial statements are
based on circumstances as at 31 December 2014 and Interxion operating as a stand-alone company. The closing of the intended transaction with Telecity Group plc. (reference is made to Note 26 Events subsequent to the balance sheet date), may
have an impact in the future on the judgements, estimates and assumptions as applied by management in preparing our financial statements.
In particular, information about significant areas of estimation uncertainty and critical judgments in applying accounting policies that have the
most significant effect on amounts recognised in the financial statements are discussed below:
Property, plant and equipment
depreciation (see also Note 10)
Estimated remaining useful lives and residual values are reviewed annually. The carrying
values of property, plant and equipment are also reviewed for impairment, where there has been a triggering event, by assessing the present value of estimated future cash flows and net realisable value compared with net book value.
|
| 42 / INTERXION ANNUAL REPORT 2014 |
|
|
|
|
|
Consolidated Financial Statements
|
The calculation of estimated future cash flows and residual values is based on the Group’s best
estimates of future prices, output and costs and is, therefore, subjective. Furthermore, the valuation of some of the assets under construction requires judgments which are related to the probability of signing lease contracts and obtaining planning
permits.
In February 2015, management received notification from the local Madrid municipal authorities that the Company’s
subsidiary in Spain lacks certain required certificates of data centre occupation and operation at our data centres in Madrid (MAD 1 and MAD 2). While we have since then obtained these certificates for the MAD 1 data centre, we have made good
progress obtaining these certificates for the MAD 2 data centre. Based on our positive experience in obtaining the certificates for MAD 1, management is confident that the certificates for the MAD 2 data centre will be obtained in due course, and
the lack thereof is not considered an impairment triggering event.
In the fourth quarter of the year 2013, as part of the annual review
of the estimated useful lives, the Company concluded that certain of our existing assets are used longer than originally anticipated. The estimated useful lives of certain of our property, plant and equipment have, therefore, been extended. This
change was accounted for as a change in accounting estimate on a prospective basis effective 1 October 2013 under IAS 8 “Change in Accounting Estimates”. In the fourth quarter of the year 2013, approximately €2 million lower depreciation expenses were recorded as a result of the changes in the estimated useful lives of certain of our property, plant and equipment. On an annualised
basis for the year 2013, the depreciation charges would have been approximately €8 million lower.
Intangible fixed assets amortisation (see also Note 11)
Estimated remaining useful lives and residual values are reviewed annually. The carrying values of intangible fixed assets are also reviewed for
impairment where there has been a triggering event by assessing the present value of estimated future cash flows and net realisable value compared with net book value. The calculation of estimated future cash flows and residual values is based on
the Group’s best estimates of future prices, output and costs and is, therefore, subjective.
Lease accounting (see also Note
22)
At inception or modification of an arrangement, the Group determines whether such an arrangement is, or contains, a lease.
Classification of a lease contract is based on the extent to which risks and rewards incidental to ownership of a leased asset lie with the lessor or the lessee. The classification of lease contracts includes the use of judgements and estimates.
Provision for onerous lease contracts (see also Note 18)
A provision is made for the discounted amount of future losses that are expected to be incurred in respect of unused data centre sites over the term
of the leases. Where unused sites have been sublet, or partly sublet, management has taken account of the contracted sublease income expected to be received over the minimum sublease term, which meets the Group’s revenue recognition criteria in
arriving at the amount of future losses.
Costs of site restoration (see also Note 24)
Liabilities in respect of obligations to restore premises to their
original condition are estimated at the commencement of the lease and reviewed yearly, based on the rent period, contracted extension possibilities and possibilities of lease terminations.
Deferred taxation (see also Note 9)
Provision is made for deferred taxation at the rates of tax prevailing at the period-end dates unless future rates have been substantively enacted.
Deferred tax assets are recognised where it is probable that they will be recovered based on estimates of future taxable profits for each tax jurisdiction. The actual profitability may be different depending on local financial performance in each
tax jurisdiction.
Share-based payments (see also Note 21)
The Group issues equity-settled share-based payments to certain employees under the terms of the long-term incentive plans. The charges related to
equity-settled share-based payments, options to purchase ordinary shares and restricted and performance shares, are measured at fair value at the date of grant. The fair value at the grant date of options is determined using the Black Scholes model
and is expensed over the vesting period. The fair value at grant date of the performance shares is determined using the Monte Carlo model and is expensed over the vesting period. The value of the expense is dependent upon certain assumptions
including the expected future volatility of the Group’s share price at the date of grant and for the performance shares the relative performance of the Group’s share price compared to a group of peer companies.
Senior Secured Notes due 2020 (see also Note 19)
The Senior Secured Notes due 2020 are valued at amortised cost. The Senior Secured Notes due 2020 indenture includes specific early redemption
clauses. As part of the initial measurement of the amortised costs value of the Senior Secured Notes due 2020 it is assumed that the Notes will be held to maturity. If an early redemption of all or part of the Notes is expected, the liability will
be re-measured based on the original effective interest rate. The difference between the liability, excluding a change in assumed early redemption and the liability, including a change in assumed early redemption, will go through the profit and
loss.
Functional and presentation currency
These consolidated financial statements are presented in euros, the Company’s functional and presentation currency. All information presented
in euros has been rounded to the nearest thousand, except when stated otherwise.
| 3 |
SIGNIFICANT ACCOUNTING POLICIES |
Basis of consolidation
The consolidated financial statements incorporate the financial statements of the Company and all entities that are directly or indirectly
controlled by the Company. Subsidiaries are entities that are controlled by the Group. The Group controls an entity when it is exposed to, or has the right to, variable returns from its involvement with the entity and has the ability to affect those
returns through its power over the entity. The financial statements of subsidiaries are included in the consolidated financial statements from the date on which control commences until the date on which control ceases.
The accounting policies set out below have been applied consistently by all subsidiaries to all periods presented in these consolidated financial
statements.
INTERXION ANNUAL REPORT
2014 / 43
|
|
|
|
Consolidated Financial Statements
|
|
|
Loss of control
When the Group loses control over a subsidiary, the Company de-recognises the assets and liabilities of the subsidiary, any non-controlling
interests and the other components of equity related to the subsidiary. Any surplus or deficit arising on the loss of control is recognised in profit or loss.
Transactions eliminated on consolidation
Intercompany balances and transactions, and any unrealised income and expenses arising from intercompany transactions, are eliminated in preparing the consolidated financial statements.
Subsidiaries
With
the exception of Stichting Administratiekantoor Management Interxion, all the subsidiary undertakings of the Group as set out below are wholly owned. Stichting Administratiekantoor is part of the consolidation based on the Group’s control over
the entity.
| ● |
|
Interxion HeadQuarters B.V., Amsterdam, the Netherlands; |
| ● |
|
Interxion Nederland B.V., Amsterdam, the Netherlands; |
| ● |
|
Interxion Trademarks B.V., Amsterdam, the Netherlands; |
| ● |
|
Interxion Österreich GmbH, Vienna, Austria; |
| ● |
|
Interxion Real Estate VII GmbH, Vienna, Austria; |
| ● |
|
Interxion Belgium N.V., Brussels, Belgium; |
| ● |
|
Interxion Real Estate IX N.V., Brussels, Belgium; |
| ● |
|
Interxion Denmark ApS, Copenhagen, Denmark; |
| ● |
|
Interxion Real Estate VI ApS, Copenhagen, Denmark; |
| ● |
|
Interxion France SAS, Paris, France; |
| ● |
|
Interxion Real Estate II SARL, Paris, France; |
| ● |
|
Interxion Real Estate III SARL, Paris, France; |
| ● |
|
Interxion Real Estate XI SARL, Paris, France; |
| ● |
|
Interxion Deutschland GmbH, Frankfurt, Germany; |
| ● |
|
Interxion Ireland Ltd, Dublin, Ireland; |
| ● |
|
Interxion Telecom SRL, Milan, Italy; |
| ● |
|
Interxion España SA, Madrid, Spain; |
| ● |
|
Interxion Sverige AB, Stockholm, Sweden; |
| ● |
|
Interxion (Schweiz) AG, Zurich, Switzerland; |
| ● |
|
Interxion Real Estate VIII AG, Zurich, Switzerland; |
| ● |
|
Interxion Carrier Hotel Ltd., London, United Kingdom; |
| ● |
|
Interxion Europe Ltd., London, United Kingdom; |
| ● |
|
Interxion Real Estate Holding B.V., Amsterdam, the Netherlands; |
| ● |
|
Interxion Real Estate I B.V., Amsterdam, the Netherlands; |
| ● |
|
Interxion Real Estate IV B.V., Amsterdam, the Netherlands; |
| ● |
|
Interxion Real Estate V B.V., Amsterdam, the Netherlands; |
| ● |
|
Interxion Real Estate X B.V., Amsterdam, the Netherlands; |
| ● |
|
Interxion Operational B.V., Amsterdam, the Netherlands; |
| ● |
|
Interxion Datacenters B.V., The Hague, the Netherlands (formerly Centennium Detachering B.V.); |
| ● |
|
Interxion Consultancy Services B.V., Amsterdam, the Netherlands (dormant); |
| ● |
|
Interxion Telecom B.V., Amsterdam, the Netherlands (dormant); |
| ● |
|
Interxion Trading B.V., Amsterdam, the Netherlands (dormant); |
| ● |
|
Interxion B.V., Amsterdam, the Netherlands (dormant); |
| ● |
|
Interxion Telecom Ltd., London, United Kingdom (dormant); |
| ● |
|
Stichting Administratiekantoor Management Interxion, Amsterdam, the Netherlands.
|
Foreign currency
Foreign currency transactions
The individual financial statements of each Group entity are presented in the currency of the primary economic environment in which the entity operates (its functional currency). For the purpose of the consolidated financial
statements, the results and the financial position of each entity are expressed in euros, which is the functional currency of the Company and the presentation currency for the consolidated financial statements.
In preparing the financial statements of the individual entities, transactions in foreign currencies other than the entity’s functional
currency are recorded at the rates of exchange prevailing at the dates of the transactions. At each balance sheet date, monetary assets and liabilities denominated in foreign currencies are retranslated at the rates prevailing at the balance sheet
date. Non-monetary items that are measured in terms of historical cost in a foreign currency are not retranslated. The income and expenses of foreign operations are translated to euros at average exchange rates.
Foreign operations
For the purpose of presenting consolidated financial statements, the assets and liabilities of the Group’s foreign operations are expressed in
euros using exchange rates prevailing at the balance sheet date. Income and expense items are translated at average exchange rates for the period. Exchange differences, if any, arising on net investments including receivables from or payables to a
foreign operation for which settlement is neither planned nor likely to occur, are recognised directly in the foreign currency translation reserve (FCTR) within equity. When control over a foreign operation is lost, in part or in full, the relevant
amount in the FCTR is transferred to profit or loss.
Borrowing costs
Borrowing costs directly attributable to the acquisition, construction or production of qualifying assets, which are assets that necessarily take a
substantial period of time to get ready for their intended use or sale, are added to the cost of those assets, until such time as the assets are substantially ready for their intended use or sale. All other borrowing costs are recognised in profit
or loss in the period in which they are incurred.
Borrowing costs are capitalised based on the effective interest rate of the Senior
Secured Notes.
Statement of cash flows
The consolidated statement of cash flows is prepared using the indirect method. The cash flow statement distinguishes between operating, investing
and financing activities.
Cash flows in foreign currencies are converted at the exchange rate at the dates of the transactions.
Currency exchange differences on cash held are separately shown. Payments and receipts of corporate income taxes and interest paid are included as cash flow from operating activities.
Financial instruments
Derivative financial instruments
Derivatives are initially recognised at fair value; any attributable transaction costs are recognised in profit and loss as they are incurred. Subsequent to initial recognition, derivatives are measured at their fair value, and
changes therein are generally recognised in profit and loss.
|
| 44 / INTERXION ANNUAL REPORT 2014 |
|
|
|
|
|
Consolidated Financial Statements
|
When a derivative is designated as a cash flow hedging instrument, the effective portion of changes
in the fair value of the derivative is recognised in OCI and accumulated in the hedging reserve. Any ineffective portion of changes in the fair value of the derivative is recognised immediately in profit or loss.
The amount accumulated in equity is retained in OCI and reclassified to the profit or loss in the same period, or periods, during which the hedged
item affects profit or loss.
If the hedging instrument no longer meets the criteria for hedge accounting, expires, is sold, terminated
or exercised, or the designation is revoked, hedge accounting is discontinued prospectively. If the forecast transaction is no longer expected to occur, the amount accumulated in equity is reclassified to profit or loss.
Fair values are obtained from quoted market prices in active markets or, where an active market does not exist, by using valuation techniques.
Valuation techniques include discounted cash flow models.
Non-derivative financial instruments
Non-derivative financial instruments comprise trade and other receivables, cash and cash equivalents, loans and borrowings, and trade and other
payables.
Non-derivative financial instruments are recognised initially at fair value, net of any directly attributable transaction
costs. Subsequent to initial recognition, non-derivative financial instruments are measured at amortized cost using the effective interest method, less any impairment losses.
The Group de-recognises a financial asset when the contractual rights to the cash flows from the asset expire, or it transfers the right to receive
the contractual cash flows in a transaction in which substantially all the risk and rewards of ownership of the financial asset are transferred. Any interest in such transferred financial assets that is created or retained by the Group is recognised
as a separate asset or liability.
Financial assets and liabilities are offset and the net amount presented in the statement of financial
position when, and only when, the Group has a legal right to offset the amounts and intends either to settle on a net basis or to realise the asset and settle the liability simultaneously.
Financial assets are designated as at fair value through profit and loss if the Group manages such investments and makes purchase and sale decisions
based on their fair value in accordance with the Group’s risk management or investment strategy. Attributable transaction costs are recognised in profit and loss as incurred. Financial assets at fair value through profit and loss are measured
at fair value and changes therein, which takes into account any dividend income, are recognised in profit and loss.
The fair values of
investments in equity are determined with reference to their quoted closing bid price at the measurement date or, if unquoted, using a valuation technique.
Trade receivables and other current assets
Trade receivables and other current assets are recognised
initially at fair value and subsequently measured at amortized cost using the effective interest method, less provision for impairment.
A provision for impairment of trade receivables and other current assets is established when there is
objective evidence that the Group will not be able to collect all amounts due according to the original term of the receivables. Significant financial difficulties of the debtor, probability that the debtor will enter bankruptcy or financial
reorganisation, and default or delinquency in payments are considered indicators that the trade receivable is impaired.
The amount of
the provision is the difference between the asset’s carrying amount and the present value of estimated future cash flows, discounted at the original effective interest rate. The carrying amount of the asset is reduced through the use of an
allowance account, and the amount of the loss is recognised in the income statement.
When a trade receivable and other current asset is
uncollectable, it is written off against the allowance account for trade receivables. Subsequent recoveries of amounts previously written off are credited in the income statement.
Cash and cash equivalents
Cash and cash equivalents includes cash in hand, deposits held at call with banks and other short-term highly liquid investments with original maturities of three months or less. Cash and cash equivalents, including short-term
investments, is valued at face value, which equals its fair value.
Share capital
Ordinary shares are classified as equity. Incremental costs directly attributable to the issue of ordinary shares and share options are recognised
as a deduction from equity, net of any tax effects.
Trade payables and other current liabilities
Trade payables and other current liabilities are recognised initially at fair value and subsequently measured at amortized cost using the effective
interest method.
Property, plant and equipment
Property, plant and equipment are measured at cost less accumulated depreciation and accumulated impairment losses.
Cost includes expenditure that is directly attributable to the acquisition or construction of the asset and comprises purchase cost, together with
the incidental costs of installation and commissioning. These costs include external consultancy fees, capitalised borrowing costs, rent and associated costs attributable to bringing the assets to a working condition for their intended used and
internal employment costs that are directly and exclusively related to the underlying asset. Where it is probable that the underlying property lease will not be renewed, the cost of self-constructed assets includes the estimated costs of dismantling
and removing the items and restoring the site on which they are located.
When parts of an item of property, plant and equipment have
different useful lives, they are accounted for as separate items (major components) of property, plant and equipment.
Gains and losses
on disposal of an item of property, plant and equipment are determined by comparing the proceeds from disposal with the carrying amount of property, plant and equipment and are recognised within income.
|
| INTERXION ANNUAL REPORT 2014 / 45 |
|
|
|
|
Consolidated Financial Statements
|
|
|
The cost of replacing part of an item of property, plant and equipment is recognised in the carrying
amount of the item if it is probable that the future economic benefits embodied within the part will flow to the Group and its cost can be measured reliably. The carrying amount of the replaced part is de-recognised. The costs of the day-to-day
servicing of property, plant and equipment are recognised in profit or loss as incurred.
Depreciation is calculated from the date an
asset becomes available for use and is depreciated on a straight-line basis over the estimated useful life of each part of an item of property, plant and equipment. Leased assets are depreciated on the same basis as owned assets over the shorter of
the lease term and their useful lives. The principal periods used for this purpose are:
|
|
|
|
|
| Data centre freehold land |
|
|
|
Not
depreciated |
| Data centre buildings |
|
|
|
15–30
years |
| Data centre infrastructure and equipment |
|
|
|
5–20
years |
| Office equipment and
other |
|
|
|
3–15 years
|
Depreciation methods, useful lives and residual values are reviewed annually.
In the fourth quarter of the year 2013, as part of the annual review of the estimated useful lives, the Company concluded that certain of our
existing assets are used longer than originally anticipated. The estimated useful lives of certain of our property, plant and equipment have, therefore, been extended. This change was accounted for as a change in accounting estimate on a prospective
basis effective 1 October 2013 under IAS 8 “Change in Accounting Estimates”. In the fourth quarter of the year 2013, approximately €2 million lower
depreciation expenses were recorded as a result of the changes in the estimated useful lives of certain of our property, plant and equipment. On an annualised basis for the year 2013, the depreciation charges would have been approximately €8 million lower.
Data centre freehold land consists of the land
owned by the Company. The data centre buildings consist of the core and shell in which we have constructed a data centre. Data centre infrastructure and equipment comprises data centre structures, leasehold improvements, data centre cooling and
power infrastructure, including infrastructure for advanced environmental controls such as ventilation and air conditioning, specialised heating, fire detection and suppression equipment and monitoring equipment. Office equipment and other comprises
office leasehold improvements and office equipment consisting of furniture, computer equipment and software.
Intangible assets
Intangible assets represent power grid rights, software and other intangible assets, and are recognised at cost less accumulated
amortisation and accumulated impairment losses. Other intangible assets principally consist of lease premiums (paid in addition to obtain rental contracts).
Software includes development expenditure, which is capitalised only if development costs can be measured reliably, the product or process is technically and commercially feasible, future economic benefits are probable, and the
Group intends to and has sufficient resources to complete development and to use the asset. The expenditure capitalised includes the cost of material, services and direct labour costs that are directly attributable to preparing the asset for its
intended use.
Amortisation is calculated on a straight-line basis over the estimated useful lives of the intangible
asset. Amortisation methods, useful lives and residual values are reviewed annually.
The estimated useful lives are:
|
|
|
|
Power grid rights |
|
10–15
years |
|
Software |
|
3–5
years |
|
Other |
|
3–12 years
|
Impairment of non-financial assets
The carrying amounts of the Group’s non-financial assets, other than deferred tax assets, are reviewed at each reporting date to determine
whether there is any indication of impairment. If any such indication exists, then the asset’s recoverable amount is estimated. For intangible assets that are not yet available for use, the recoverable amount is estimated at each reporting
date.
The recoverable amount of an asset or cash-generating unit is the greater of either its value in use or its fair value less costs
to sell. In assessing value in use, the estimated future cash flows are discounted to their present value using a pre-tax discount rate that reflects current market assessments of the time value of money and the risks specific to the asset. For the
purpose of impairment testing, assets are grouped together into the smallest group of assets that generates cash inflows from continuing use that are largely independent of the cash inflows of other assets or groups of assets (the
“cash-generating unit”).
Considering the Company manages its data centres by country, and, given the data centre campus
structures, the financial performance of data centres within a country is highly interdependent, the Company has determined that the cash-generating unit for impairment-testing purposes should be the group of data centres per country, unless
specific circumstances would indicate that a single data centre is a cash-generating unit.
An impairment loss is recognised if the
carrying amount of an asset or its cash-generating unit exceeds its estimated recoverable amount. Impairment losses are recognised in profit or loss.
Impairment losses recognised in respect of cash-generating units are to reduce the carrying amount of the assets in the unit (group of units) on a pro-rata basis.
Impairment losses recognised in prior periods are assessed at each reporting date for any indications that the loss has decreased or no longer
exists. An impairment loss is reversed if there has been a change in the estimates used to determine the recoverable amount. An impairment loss is reversed only to the extent that the asset’s carrying amount does not exceed the carrying amount
that would have been determined, net of depreciation or amortisation, if no impairment loss had been recognised.
Borrowings
Borrowings are recognised initially at fair value, net of transaction costs incurred. Borrowings are subsequently stated at
amortized cost; with any difference between the proceeds (net of transaction costs) and the redemption value recognised in the income statement over the period of the borrowings using the effective interest method.
Borrowings are classified as current liabilities unless the Group has an unconditional right to defer settlement of the liability for at least 12
months after the balance sheet date. The Group de-recognises a borrowing when its contractual obligations are discharged, cancelled or expired.
|
| 46 / INTERXION ANNUAL REPORT 2014 |
|
|
|
|
|
Consolidated Financial Statements
|
As part of the initial measurement of the amortized costs value of the Senior Secured Notes due 2020
it is assumed that the Notes will be held to maturity. If an early redemption of all or part of the Notes is expected the liability will be re-measured based on the original effective interest rate. The difference between the liability, excluding a
change in assumed early redemption and the liability, including a change in assumed early redemption, will go through the profit and loss.
Provisions
A provision is recognised in the statement of financial position when the Group has a present legal
or constructive obligation as a result of a past event; it is probable that an outflow of economic benefits will be required to settle the obligation and the amount can be estimated reliably. Provisions are determined by discounting the expected
future cash flows at a pre-tax rate that reflects current market assessments of the time value of money and, where appropriate, the risks specific to the liability. The discount rate arising on the provision is amortized in future years through
interest.
A provision for site restoration is recognised when costs for restoring leasehold premises to their original condition at the
end of the lease need to be made are probable to be incurred and it is possible to make an accurate estimate of these costs. The discounted cost of the liability is included in the related assets and is depreciated over the remaining estimated term
of the lease. If the likelihood of this liability is estimated to be possible, rather than probable, it is disclosed as a contingent liability in Note 24.
A provision for onerous lease contracts is recognised when the expected benefits to be derived by the Group from a contract are lower than the unavoidable cost of meeting its obligations under the contract. The provision is measured
at the discounted amount of future losses expected to be incurred in respect of unused data centre sites over the term of the leases. Where unused sites have been sublet or partly sublet, management has taken account of the contracted sublease
income expected to be received over the minimum sublease term, which meets the Group’s revenue recognition criteria in arriving at the amount of future losses. Before a provision is established, the Group recognises any impairment loss on the
assets associated with that contract.
Leases
Leases, in which the Group assumes substantially all the risks and rewards of ownership, are classified as finance leases. On initial recognition,
the leased asset is measured at an amount equal to the lower of either its fair value or the present value of the minimum lease payments. Subsequent to initial recognition, the asset is accounted for in accordance with the accounting policy
applicable to that asset.
Other leases are operating leases and the leased assets are not recognised on the Group’s statement of
financial position. Payments made under operating leases are recognised in the income statement, or capitalised during construction, on a straight-line basis over the term of the lease. Lease incentives received are recognised as an integral part of
the total lease expense, over the term of the lease.
Minimum finance lease payments are apportioned between the finance charge and the
reduction of the outstanding liability. The finance charge is allocated to each period during the lease term so
as to produce a constant periodic rate of interest on the remaining balance of the liability.
At inception or modification of an arrangement, the Group determines whether such an arrangement is, or contains, a lease. This will be the case if the following two criteria are met:
| ● |
|
the fulfilment of the arrangement is dependent on the use of a specific asset or assets; and |
| ● |
|
the arrangement contains the right to use an asset. |
At inception or
on reassessment of the arrangement, the Group separates payments and other consideration required by such an arrangement into those for the lease and those for other elements on the basis of their relative fair values.
Segment reporting
The
segments are reported in a manner consistent with internal reporting provided to the chief operating decision-maker, identified as the Board of Directors. There are two segments: the first segment is France, Germany, the Netherlands and the
United Kingdom, the second segment is Rest of Europe, which comprises Austria, Belgium, Denmark, Ireland, Spain, Sweden and Switzerland. Shared expenses such as corporate management, general and administrative expenses, loans and
borrowings and related expenses and income tax assets and liabilities are stated in Corporate and other.
Segment results, assets
and liabilities include items directly attributable to a segment as well as those that can be allocated on a reasonable basis. Unallocated items presented as Corporate and other principally comprise loans and borrowings and related expenses;
corporate assets and expenses (primarily the Company’s headquarters); and income tax assets and liabilities.
Segment capital
expenditure is defined as the net cash outflow during the period to acquire property, plant and equipment, and intangible assets other than goodwill.
EBITDA and Adjusted EBITDA, as well as recurring revenue, are additional indicators of our operating performance, and are not required by or presented in accordance with IFRS. EBITDA is defined as operating profit plus depreciation,
amortisation and impairment of assets. We define Adjusted EBITDA as EBITDA adjusted to exclude share-based payments, increase/decrease in provision for onerous lease contracts, M & A transaction costs and income from subleases on unused data
centre sites. We present EBITDA and Adjusted EBITDA as additional information because we understand that they are measures used by certain investors and because they are used in our financial covenants in our €100 million Revolving Facility Agreement and €475 million 6.00% Senior Secured Notes due 2020. Other
companies may, however, present EBITDA and Adjusted EBITDA differently. EBITDA and Adjusted EBITDA are not measures of financial performance under IFRS and should not be considered as an alternative to operating profit or as a measure of liquidity
or an alternative to net income as indicators of our operating performance or any other measure of performance derived in accordance with IFRS.
This information, provided to the chief operating decision-maker, is disclosed to permit a more complete analysis of our operating performance. Exceptional items are those significant items that are separately disclosed by virtue of
their size, nature or incidence to enable a full understanding of the Group’s financial performance.
|
| INTERXION ANNUAL REPORT 2014 / 47 |
|
|
|
|
Consolidated Financial Statements
|
|
|
Revenue recognition
Revenue is recognised when it is probable that future economic benefits will flow to the Group and that these benefits, together with their related
costs, can be measured reliably. Revenue is measured at the fair value of the consideration received or receivable taking into account any discounts or volume rebates.
The Group reviews transactions for separately identifiable components and, if necessary, applies individual recognition treatment, revenues are
allocated to separately identifiable components based on their relative fair values.
The Group earns colocation revenue as a result of
providing data centre services to customers at its data centres. Colocation revenue and lease income are recognised in profit or loss on a straight-line basis over the term of the customer contract. Incentives granted are recognised as an integral
part of the total income, over the term of the customer contract. Customers are usually invoiced quarterly in advance and income is recognised on a straight-line basis over the quarter. Initial setup fees payable at the beginning of customer
contracts are deferred at inception and recognised in the income statement on a straight-line basis over the initial term of the customer contract. Power revenue is recognised based on customers’ usage.
Other services revenue, including managed services, connectivity and customer installation services including equipment sales are recognised when
the services are rendered. Certain installation services and equipment sales, which by their nature have a non-recurring character, are presented as non-recurring revenues and are recognised on delivery of service.
Deferred revenues relating to invoicing in advance and initial setup fees are carried on the statement of financial position as part of trade
payables and other liabilities. Deferred revenues due to be recognised after more than one year are held in non-current liabilities.
Cost of sales
Cost of sales
consists mainly of rental costs for the data centres and offices, power costs, maintenance costs relating to the data centre equipment, operation and support personnel costs and costs related to installations and other customer requirements. In
general, maintenance and repairs are expensed as incurred. In cases where maintenance contracts are in place, the costs are recorded on a straight-line basis over the contractual period.
Sales and marketing costs
The operating expenses related to sales and marketing consist of costs for personnel (including sales commissions), marketing and other costs
directly related to the sales process. Costs of advertising and promotion are expensed as incurred.
General and administrative costs
General and administrative costs are expensed as incurred.
Employee benefits
Defined contribution pension plans
A defined contribution pension plan is a post-employment plan under which an entity pays fixed contributions into a separate entity and has no legal or constructive obligation to pay further amounts. Obligations for contributions to
defined contribution plans are recognised as an employee benefit expense in the income statement in the periods during which the related services are rendered by employees. Prepaid contributions are recognised as an asset to the extent that a cash
refund or a reduction in future payments is available. Contributions to a defined contribution plan that are due more than 12 months after the end of the period in which the employees render the service are discounted to their present value.
Termination benefits
Termination benefits are recognised as an expense when the Group is demonstrably committed, without realistic possibility of withdrawal, to a formal detailed plan to either terminate employment before the normal retirement date, or
to provide termination benefits as a result of an offer made to encourage voluntary redundancy. Termination benefits for voluntary redundancy are recognised as an expense if the Group has made an offer of voluntary redundancy, it is probable that
the offer will be accepted, and the number of acceptances can be estimated reliably. If benefits are payable more than 12 months after the reporting date, they are discounted to their present value.
Share-based payments
The long-term incentive programme enables Group employees to earn and/or acquire shares of the Group. The fair value at the date of grant to
employees of share options, as determined using the Black Scholes model for options and the Monte Carlo model for the performance shares, is recognised as an employee expense, with a corresponding increase in equity, over the period that the
employees become unconditionally entitled to the options and/or shares. The amount recognised as an expense is adjusted to reflect the actual number of share options, restricted and performance shares that vest.
Finance income and expense
Finance expense comprises interest payable on borrowings calculated using the effective interest rate method, fair value losses on financial assets
at fair value through profit and loss and foreign exchange gains and losses. Borrowing costs directly attributable to the acquisition or construction of data centre assets, which are assets that necessarily take a substantial period of time to get
ready for their intended use, are added to the costs of those assets, until such time as the assets are ready for their intended use.
Interest income is recognised in the income statement as it accrues, using the effective interest method. The interest expense component of finance
lease payments is recognised in the income statement using the effective interest rate method.
Foreign currency gains and losses are
reported on a net basis, as either finance income or expenses, depending on whether the foreign currency movements are in a net gain or a net loss position.
|
| 48 / INTERXION ANNUAL REPORT 2014 |
|
|
|
|
|
Consolidated Financial Statements
|
Income tax
Income tax on the profit or loss for the year comprises current and deferred tax. Income tax is recognised in the income statement except to the
extent that it relates to items recognised directly in equity, in which case it is recognised in equity.
Current tax is the expected tax
payable on the taxable income for the year, using tax rates enacted or substantially enacted at the balance sheet date, and any adjustment to tax payable in respect of previous years.
Deferred tax is recognised in respect of temporary differences between the carrying amount of assets and liabilities for financial reporting
purposes and the amounts used for taxation purposes. The following temporary differences are not provided for: the initial recognition of assets or liabilities that affect neither accounting nor taxable profit, and differences relating to
investments in subsidiaries to the extent that they will probably not reverse in the foreseeable future. The amount of deferred tax provided is based on the expected manner of realisation or settlement of the carrying amount of assets and
liabilities, using tax rates enacted or substantively enacted at the balance sheet date that are expected to be applied to temporary differences when they reverse or loss carry forwards when they are utilised.
A deferred tax asset is also recognised for unused tax losses and tax credits. A deferred tax asset is recognised only to the extent that it is
probable that future taxable profits will be available against which the asset can be utilised. Deferred tax assets are reduced to the extent that it is no longer probable that the related tax benefit will be realised.
Additional income taxes that arise from the distribution of dividends are recognised at the same time as the liability to pay the related dividend.
In determining the amount of current and deferred tax the Company takes into account the impact of uncertain tax positions and whether
additional taxes and interest may be due. The Company believes that its accruals for tax liabilities are adequate for all open tax years based on its assessment of many factors, including interpretations of tax law and prior experience. This
assessment relies on estimates and assumptions and may involve a series of judgements about future events. New information may become available that causes the Company to change its judgement regarding the adequacy of existing tax liabilities; such
changes to tax liabilities will have an impact on tax expense in the period that such a determination is made.
Deferred tax assets and
liabilities are offset if there is a legally enforceable right to offset current tax liabilities and assets, and they relate to taxes levied by the same tax authority on the same taxable entity, or on different tax entities, but they intend to
settle current tax liabilities and assets on a net basis of their tax assets and liabilities will be realised simultaneously.
Earnings per share
The Group presents basic and diluted earnings per share (EPS) data for its ordinary shares. Basic EPS is calculated by dividing the profit or loss
attributable to ordinary and preference shareholders of the Company by the weighted average number of ordinary and preference shares outstanding during the year. Diluted EPS is determined by adjusting the profit or loss attributable to ordinary and
preference shareholders and the weighted average number of ordinary and preference shares outstanding for the effects of all dilutive potential ordinary shares, which comprise the share options granted.
New standards and interpretations not yet adopted
The following listed new standards, amendments to standards and interpretations are available for early adoption in annual period beginning on
1 January 2014, although they are not mandatory until a later period. The Group has decided not to early adopt these new standards or amendments.
|
|
|
|
|
|
Effective date |
|
|
|
New standard or
amendments |
| 1 January 2016
|
|
|
|
IFRS 14 –
Regulatory deferral accounts; |
|
|
|
|
Amendments to IFRS
11 – Accounting for acquisitions of interests in Joint Operations |
| |
|
|
|
Amendments to IAS
16 and IAS 38 – Clarification of acceptable methods of depreciation and amortisation; |
| 1
January 2017 |
|
|
|
IFRS 15 –
Revenue from contracts with customers; |
| 1 January 2018
|
|
|
|
IFRS 9 – Financial instruments.
|
| 4 |
FINANCIAL RISK MANAGEMENT |
Overview
The Group has exposure to the following risks from its use of financial instruments:
This note presents information about the Group’s
exposure to each of the above risks, the Group’s goals, policies and processes for measuring and managing risk, and the its management of capital. Further quantitative disclosures are included throughout these consolidated financial statements.
The Board of Directors has overall responsibility for the oversight of the Group’s risk management framework.
The Group continues developing and evaluating the Group’s risk management policies with a view to identifying and analysing the risks faces, to
setting appropriate risk limits and controls, and to monitoring risks and adherence to limits. Risk management policies and systems are reviewed regularly to reflect changes in market conditions and the Group’s activities. The Group, through
its training and management standards and procedures, aims to develop a disciplined and constructive control environment in which all employees understand their roles and obligations.
|
| INTERXION ANNUAL REPORT 2014 / 49 |
|
|
|
|
Consolidated Financial Statements
|
|
|
The Board of Directors oversees the way management monitors compliance with the Group’s risk
management policies and procedures and reviews the adequacy of the risk management framework in relation to the risks the Group faces.
Credit risk
Credit risk is
the risk of financial loss to the Group if a customer, bank or other counterparty to a financial instrument fails to meet its contractual obligations. This risk principally arises from the Group’s receivables from customers. The Group’s
most significant customer, serviced from multiple locations and under multiple service contracts, accounts for less than 10% of the recurring revenues for 2014, 2013 and 2012.
Trade and other receivables
The Group’s exposure to credit risk is mainly influenced by the individual characteristics of each customer. The demographics of the Group’s customer base, including the default risk of the industry and the country in
which customers operate, has less of an influence on credit risk.
The Group has an established credit policy under which each new
customer is analysed individually for creditworthiness before it begins to trade with the Group. If customers are independently rated, these ratings are used. If, there is no independent rating, the credit quality of the customer is analysed taking
its financial position, past experience and other factors into account.
The Group’s standard terms require contracted services to
be paid in advance of these services being delivered. Next to the standard terms the Group provided service fee holidays in relation to our long-term customer contracts, for which an accrued revenue balance is accounted for. In the event that a
customer fails to pay amounts that are due, the Group has a clearly defined escalation policy that can result in a customer’s access to their equipment being denied or service to the customer being suspended.
In 2014, 94% (2013: 95% and 2012: 94%) of the Group’s revenue was derived from contracts under which customers paid an agreed contracted
amount, including power on a regular basis (usually monthly or quarterly) or from deferred initial setup fees paid at the outset of the customer contract.
As a result of the Group’s credit policy and the contracted nature of the revenues, losses have occurred infrequently (see Note 20). The Group establishes an allowance that represents its estimate of potential incurred losses
in respect of trade and other receivables. This allowance is entirely composed of a specific loss component relating to individually significant exposures.
Bank counterparties
The Group has certain obligations under the terms of its revolving loan agreement and
Senior Secured Notes which limit disposal with surplus cash balances. Term risk is limited to short-term deposits. The Group monitors its cash position, including counterparty and term risk, daily.
Guarantees
Certain of
our subsidiaries have granted guarantees to our lending banks in relation to our facilities. The Company grants rent guarantees to landlords of certain of the Group’s property leases (see Note 24).
Liquidity risk
Liquidity risk is the risk that the Group will not be able to meet its financial obligations as they fall due. The Group’s approach to managing
liquidity is to ensure, as far as possible, that it will always have sufficient liquidity to meet its liabilities when due, under both normal and stressed conditions, without incurring unacceptable losses or risking damage to the its reputation or
jeopardising its future.
The majority of the Group’s revenues and operating costs are contracted, which assists it in monitoring
cash flow requirements, which is done on a daily and weekly basis. Typically, the Group ensures that it has sufficient cash on demand to meet expected normal operational expenses, including the servicing of financial obligations, for a period of 60
days; this excludes the potential impact of extreme circumstances, such as natural disasters, that cannot reasonably be predicted.
All
significant capital expansion projects are subject to formal approval by the Board of Directors, and material expenditure or customer commitments are only made once the management is satisfied that the Group has adequate committed funding to cover
the anticipated expenditure (see Note 22).
Senior Secured Notes
On 3 July 2013, the Company issued an aggregate principal amount of
€325 million 6.00% Senior Secured Notes due 2020 (the “Senior Secured Notes due 2020”). The net proceeds of the offering were used to purchase all of the €260 million Senior Secured Notes due 2017, which were tendered in the offer for those notes and to redeem the
€260 million Senior Secured Notes due 2017 which remained outstanding following the expiration and settlement of the tender offer and consent solicitation, to pay all related
fees, expenses and premiums and for other general corporate purposes.
The Senior Secured Notes due 2020 are governed by an indenture
dated 3 July 2013, between the Company, as issuer, and The Bank of New York Mellon, London Branch as Trustee. The indenture contains customary restrictive covenants, including but not limited to limitations or restrictions on our ability to
incur debt, grant liens, make restricted payments and sell assets. The restrictive covenants are subject to customary exceptions and are governed by a consolidated fixed charge ratio (Adjusted EBITDA to Finance Charges) to exceed 2.00 and a
consolidated senior leverage ratio (Total Net Debt to Pro-forma EBITDA) not to exceed 4.00. In addition, the aggregate of any outstanding debt senior to our Senior Secured Notes should not exceed €100 million.
The obligations under the Senior Secured Notes due 2020
are guaranteed by certain of the Company’s subsidiaries.
On 29 April 2014, the Company completed the issuance of €150.0 million aggregate principal amount of 6.00% Senior Secured Notes due 2020 (the “Additional Notes”). The net proceeds of the offering amount to €157.9 million, net of offering fees and expenses of €2.3 million. The net proceeds reflect the issuance of
the Additional Notes at a premium at 106.75 and net of offering fees and expenses. The Additional Notes, which are guaranteed by certain subsidiaries of the Company, were issued under the indenture pursuant to which, on 3 July 2013, the Company
issued €325.0 million in aggregate principal amount of 6.00% Senior Secured Notes due 2020.
|
| 50 / INTERXION ANNUAL REPORT 2014 |
|
|
|
|
|
Consolidated Financial Statements
|
Senior Secured Facility
On 14 April 2014, the Company entered into a senior secured facility agreement (the “Senior Secured Facility Agreement”) between,
among others, the Issuer, Barclays Bank PLC and ABN AMRO Bank N.V. as lenders and Barclays Bank PLC as agent (the “Agent”) and security trustee, pursuant to which a
€100.0 million senior secured term facility (the “Senior Secured Facility”) was made available to the Company.
Following the successful closing of the offering of Additional Notes (as defined and described in the preceding paragraph), the Company terminated
the €100.0 million Senior Secured Facility Agreement. No amounts had been drawn under the Senior Secured Facility Agreement. However, the deferred financing fees amounting to
€0.6 million were written off in April 2014 in connection with the termination of the Secured Senior Facility Agreement.
Revolving Facility
On
17 June 2013, the Company entered into a new €100 million Revolving Facility Agreement with ABN AMRO Bank N.V., Barclays Bank PLC, Citigroup Global Markets Limited,
Credit Suisse AG, Banc of America Securities Limited, as arrangers, the lenders thereunder, Barclays Bank PLC, as agent and Barclays Bank PLC as security trustee. This new
€100 million Revolving Facility Agreement replaced the €60 million revolving facility agreement.
On 3 July 2013, in connection with the issuance of the
€325 million Senior Secured Notes due 2020, all conditions precedent to the utilization of this Revolving Facility Agreement were satisfied.
On 28 July 2014, Interxion Holding N.V. received consent from the lenders under its
€100 million revolving facility to decrease the net assets guarantor coverage from 70% to 65% for a one-year period with effect from 30 June 2014. The Company has not
been in breach of any covenants during the year.
As of December 2014, following the addition of Interxion Österreich GmbH as
obligor to the group of guarantors, the net assets guarantor coverage exceeded 70%.
The net asset guarantor coverage is calculated as
the aggregate net assets of the guarantors under the revolving facility (calculated on an unconsolidated basis and excluding all intragroup items and investments in subsidiaries of any member of the Group) to consolidated net assets of the Group.
The Revolving Facility Agreement also requires the Company to maintain a specified financial ratio. The restrictive covenants are
subject to customary exceptions including, in relation to the incurrence of additional debt, a consolidated fixed charge ratio (calculated as a ratio of adjusted EBITDA to consolidated interest expense) to exceed 2.00 to 1.00 on a pro forma basis
for the four full fiscal quarters (taken as one period) for which financial statements are available immediately preceding the incurrence of such debt and, if such debt is senior debt, a consolidated senior leverage ratio (calculated as a ratio of
outstanding senior debt net of cash and cash equivalents of the Company and its restricted subsidiaries (on a consolidated basis) to pro forma adjusted EBITDA) to be less than 4.00 to 1.00 on a pro forma basis for the four full fiscal quarters
(taken as one period) for which financial statements are available immediately preceding the incurrence of such debt.
The Revolving Facility Agreement also includes a leverage ratio financial covenant (tested on a
quarterly basis) requiring total net debt (calculated as a ratio to pro forma EBITDA) not to exceed a leverage ratio of 4.00 to 1.00. In addition, the Company must ensure, under the Revolving Facility Agreement, that the guarantors represent a
certain percentage of adjusted EBITDA of the Group as a whole and a certain percentage of the consolidated net assets of the Group as a whole. Our ability to meet these covenants may be affected by events beyond our control and, as a result, we
cannot assure you that we will be able to meet the covenants. In the event of a default under the Revolving Facility Agreement, the lenders could terminate their commitments and declare all amounts owed to them to be due and payable. Borrowings
under other debt instruments that contain cross acceleration or cross default provisions, including the Senior Secured Notes, may as a result also be accelerated and become due and payable.
The breach of any of these covenants by the Company or the failure by the Company to maintain its leverage ratio could result in a default under the
Revolving Facility Agreement. As of 31 December 2014, the Company was in compliance with all covenants in the Revolving Facility Agreement. In addition, the Company does not anticipate any such breach or failure and believes that its ability to
borrow funds under the Revolving Facility Agreement will not be adversely affected by the covenants in the next 12 months.
As at
31 December 2014, the revolving facility agreement remained undrawn. The Company’s consolidated fixed charge ratio stood at 4.36 and the net debt ratio / consolidated senior leverage ratio stood at 3.24.
Mortgages
On
5 November 2012, the Company secured a five-year mortgage bank loan of €10 million, which is secured by mortgages on the AMS6 property, owned by Interxion Real Estate IV
B.V. The loan is subject to a floating interest rate of EURIBOR plus an individual margin of 275 basis points. Interest is due quarterly in arrears. No financial covenants apply to this loan next to the repayment schedule.
On 18 January 2013, the Group completed two mortgage financings totalling
€10 million. The loans are secured by mortgages on the PAR3 land, owned by Interxion Real Estate II Sarl and the PAR5 land, owned by Interxion Real Estate III Sarl, pledges on the
lease agreements, and are guaranteed by Interxion France SAS. The principal amounts on the two loans are to be repaid in quarterly instalments in an aggregate amount of €167,000
commencing on 18 April 2013. The mortgages have a maturity of fifteen years and have a variable interest rate based on EURIBOR plus an individual margin ranging from 240 to 280 basis points. The interest rates have been fixed through an
interest rate swap for 75% of the principal outstanding amount for a period of ten years. No financial covenants apply to this loan next to the repayment schedule.
On 26 June 2013, the Group completed a €6 million mortgage
financing. The loan is secured by a mortgage on the AMS3 property, owned by Interxion Real Estate V B.V. and a pledge on the lease agreement. The principal is to be repaid in annual instalments of €400,000 commencing 1 May 2014 and a final repayment of €4,400,000 due on 1 May 2018. The mortgage has a
variable interest rate based on EURIBOR plus 275 basis points. The loan contains a minimum of 1.1 debt service capacity covenant ratio based on the operations of Interxion Real Estate V B.V.
|
| INTERXION ANNUAL REPORT 2014 / 51 |
|
|
|
|
Consolidated Financial Statements
|
|
|
On 1 April 2014, the Group completed a
€9.2 million mortgage financing. The facility is secured by a mortgage on the data centre property in Belgium (see pg. 61), which was acquired by Interxion Real Estate IX
N.V. on 9 January 2014, a pledge on the lease agreement, and is guaranteed by Interxion Real Estate Holding B.V. The facility has a maturity of fifteen years and has a variable interest rate based on EURIBOR plus 200 basis points. The principal
amount is to be repaid in 59 quarterly instalments of €153,330 of which the first quarterly instalment was paid on 31 July 2014 and a final repayment of €153,330 is due on 30 April 2029. No financial covenants apply to this loan next to the repayment schedule.
Further details are in the Borrowing section (see Note 19).
Market risk
Currency
risk
The Group is exposed to currency risk on sales, purchases and borrowings that are denominated in a currency other than the
respective functional currencies of Group entities, primarily the euro, but also pounds sterling (GBP), Swiss francs (CHF), Danish kroner (DKK) and Swedish kronor (SEK). The currencies in which these transactions are primarily denominated are EUR,
GBP, CHF, DKK, SEK and USD.
Historically, the revenues and operating costs of each of the Group’s entities have provided an
economic hedge against foreign currency exposure and have not required foreign currency hedging.
It is anticipated that a number of
capital expansion projects will be funded in a currency that is not the functional currency of the entity in which the associated expenditure will be incurred. In the event that this occurs and is material to the Group, the Group will seek to
implement an appropriate hedging strategy.
The majority of the Group’s borrowings are euro denominated and the Company believes
that the Interest on these borrowings will be serviced from the cash flows generated by the underlying operations of the Group, the functional currency of which is the euro. The Group’s investments in subsidiaries are not hedged.
Interest rate risk
Following the issue of 6.00% Senior Secured Notes due 2020, the Group is not exposed to significant variable interest rate expense for borrowings.
On 5 November 2012, the Company secured a five-year mortgage
€10 million on the AMS6 data centre property. The loan is subject to a floating interest rate of EURIBOR plus an individual margin of 275 basis points per annum. Interest is
due quarterly in arrears.
On 18 January 2013, the Group completed two mortgage financings totalling €10 million. The loans are secured by mortgages, on the PAR3 land owned by Interxion Real Estate II Sarl, and the PAR5 land owned by Interxion Real Estate III Sarl, pledges on the lease
agreements, and are guaranteed by Interxion France SAS. The mortgages have a maturity of fifteen years and have a variable interest rate based on EURIBOR plus an individual margin ranging from 240 to 280 basis points. The interest rates have been
fixed through an interest rate swap for 75% of the principal outstanding amount for a period of 10 years.
On 26 June 2013, the
Group completed a €6 million mortgage financing. The loan is secured by a mortgage on the AMS3 property
owned by Interxion Real Estate V B.V. and a pledge on the lease agreement. The mortgage loan has a variable interest rate based on EURIBOR plus 275 basis points.
On 1 April 2014, the Group completed a €9.2 million mortgage
financing. The facility is secured by a mortgage on the data centre property in Zaventem (Belgium), which was acquired by Interxion Real Estate IX N.V. on 9 January 2014, a pledge on the lease agreement, and is guaranteed by Interxion Real
Estate Holding B.V. The mortgage loan has a variable interest rate based on EURIBOR plus 200 basis points.
As at 31 December 2014,
on the Revolving Facility Agreement the interest payable on EUR amounts drawn would be at the rate of EURIBOR plus 350 basis points and for GBP amounts drawn the interest payable would be LIBOR plus 350 basis points. The Revolving Facility Agreement
was fully undrawn as at 31 December 2014.
Further details are in the Financial Instruments section (see Note 20).
Other risks
Price
risk
There is a risk that changes in market circumstances, such as strong unanticipated increases in operational costs,
construction of new data centres or churn in customer contracts, will negatively affect the Group’s income. Customers individually have medium-term contracts that require notice prior to termination. The objective of market risk management is
to manage and control market risk exposures within acceptable parameters, while optimising the return.
The Group is a significant user
of power and has exposure to increases in power prices. It uses independent consultants to monitor price changes in electricity and seeks to negotiate fixed-price term agreements with the power supply companies, not more than for own use, where
possible. The risk to the Group is mitigated by the contracted ability to recover power price increases through adjustments in the pricing for power services.
Capital management
The Group has a capital base comprising its equity, including reserves, Senior Secured Notes, mortgage loan, finance leases and committed debt
facilities. It monitors its solvency ratio, financial leverage, funds from operations and net debt with reference to multiples of its previous twelve months’ Adjusted EBITDA levels. The Company’s policy is to maintain a strong capital base
and access to capital in order to sustain the future development of the business and maintain shareholders’, creditors’ and customers’ confidence.
The principal use of capital in the development of the business is through capital expansion projects for the deployment of further equipped space
in new and existing data centres. Major capital expansion projects are not started unless the Company has access to adequate capital resources at the start of the project to complete the project, and they are evaluated against target internal rates
of return before approval. Capital expansion projects are continually monitored before and after completion.
There were no changes in
the Group’s approach to capital management during the year.
|
| 52 / INTERXION ANNUAL REPORT 2014 |
|
|
|
|
|
Consolidated Financial Statements
|
Operating segments are to be identified on the basis of internal
reports about components of the Group that are regularly reviewed by the chief operating decision maker in order to allocate resources to the segments and to assess their performance. Management monitors the operating results of its business units
separately for the purpose of making decisions about performance assessments.
The performance of the operating segments is primarily
based on the measures of revenue, EBITDA and Adjusted EBITDA. Other information provided, except as noted below, to the Board of Directors is measured in a manner consistent with that in the financial statements.
|
|
|
|
|
|
|
|
|
|
|
|
|
|
|
|
|
|
|
|
|
|
|
| INFORMATION BY SEGMENT, 2014 |
|
FR, DE, NL |
|
Rest of Europe |
|
Subtotal |
|
Corporate |
|
Total |
| |
|
and UK |
|
|
|
|
|
and other |
|
|
| |
|
|
|
|
|
(€’000) |
|
|
|
|
| Recurring revenue |
|
|
|
200,603 |
|
|
|
|
118,581 |
|
|
|
|
319,184 |
|
|
|
|
— |
|
|
319,184 |
| Non-recurring revenue |
|
|
|
13,608 |
|
|
|
|
7,832 |
|
|
|
|
21,440 |
|
|
|
|
— |
|
|
21,440 |
| Total revenue |
|
|
|
214,211 |
|
|
|
|
126,413 |
|
|
|
|
340,624 |
|
|
|
|
— |
|
|
340,624 |
| Cost of sales |
|
|
|
(83,844) |
|
|
|
|
(47,947 |
) |
|
|
|
(131,791 |
) |
|
|
|
(7,284 |
) |
|
(139,075) |
| Gross profit/(loss) |
|
|
|
130,367 |
|
|
|
|
78,466 |
|
|
|
|
208,833 |
|
|
|
|
(7,284 |
) |
|
201,549 |
| Other income |
|
|
|
271 |
|
|
|
|
— |
|
|
|
|
271 |
|
|
|
|
— |
|
|
271 |
| Sales and marketing costs |
|
|
|
(7,599) |
|
|
|
|
(5,308 |
) |
|
|
|
(12,907 |
) |
|
|
|
(11,644 |
) |
|
(24,551) |
| General and administrative costs |
|
|
|
(50,001) |
|
|
|
|
(25,359 |
) |
|
|
|
(75,360 |
) |
|
|
|
(23,524 |
) |
|
(98,884) |
| Operating profit/(loss) |
|
|
|
73,038 |
|
|
|
|
47,799 |
|
|
|
|
120,837 |
|
|
|
|
(42,452 |
) |
|
78,385 |
| Net finance expense |
|
|
|
|
|
|
|
|
|
|
|
|
|
|
|
|
|
|
|
|
|
(27,876) |
| Profit before taxation |
|
|
|
|
|
|
|
|
|
|
|
|
|
|
|
|
|
|
|
|
|
50,509 |
| |
|
|
|
|
|
|
|
|
|
|
|
|
|
|
|
|
|
|
|
|
|
|
| Total assets |
|
|
|
804,537 |
|
|
|
|
290,455 |
|
|
|
|
1,094,992 |
|
|
|
|
78,111 |
|
|
1,173,103 |
| Total liabilities |
|
|
|
166,250 |
|
|
|
|
73,448 |
|
|
|
|
239,698 |
|
|
|
|
497,260 |
|
|
736,958 |
| Capital expenditures, including intangible assets* |
|
|
|
(150,224) |
|
|
|
|
(60,436 |
) |
|
|
|
(210,660 |
) |
|
|
|
(5,617 |
) |
|
(216,277) |
| Depreciation, amortisation and impairments |
|
|
|
(40,129) |
|
|
|
|
(18,514 |
) |
|
|
|
(58,643 |
) |
|
|
|
(3,534 |
) |
|
(62,177) |
| |
|
|
|
|
|
|
|
|
|
|
|
|
|
|
|
|
|
|
|
|
|
|
| Adjusted EBITDA |
|
|
|
113,409 |
|
|
|
|
67,273 |
|
|
|
|
180,682 |
|
|
|
|
(34,295 |
) |
|
146,387 |
Note: *Capital expenditures, including intangible assets, represent payments to acquire property, plant and
equipment and intangible assets, as recorded in the consolidated statement of cash flows as “Purchase of property, plant and equipment” and “Purchase of intangible assets” respectively.
|
| INTERXION ANNUAL REPORT 2014 / 53 |
|
|
|
|
Consolidated Financial Statements
|
|
|
|
|
|
|
|
|
|
|
|
|
|
|
|
|
|
|
|
|
|
|
|
|
|
| INFORMATION BY SEGMENT, 2013 |
|
FR, DE, NL |
|
Rest of Europe |
|
Subtotal |
|
Corporate |
|
Total |
| |
|
and UK |
|
|
|
|
|
and other |
|
|
| |
|
|
|
|
|
(€’000) |
|
|
|
|
| Recurring revenue |
|
|
|
182,165 |
|
|
|
|
109,109 |
|
|
|
|
291,274 |
|
|
|
|
— |
|
|
291,274 |
| Non-recurring revenue |
|
|
|
10,293 |
|
|
|
|
5,544 |
|
|
|
|
15,837 |
|
|
|
|
— |
|
|
15,837 |
| Total revenue |
|
|
|
192,458 |
|
|
|
|
114,653 |
|
|
|
|
307,111 |
|
|
|
|
— |
|
|
307,111 |
| Cost of sales |
|
|
|
(71,944) |
|
|
|
|
(44,522) |
|
|
|
|
(116,466 |
) |
|
|
|
(7,675) |
|
|
(124,141) |
| Gross profit/(loss) |
|
|
|
120,514 |
|
|
|
|
70,131 |
|
|
|
|
190,645 |
|
|
|
|
(7,675) |
|
|
182,970 |
| Other income |
|
|
|
341 |
|
|
|
|
— |
|
|
|
|
341 |
|
|
|
|
— |
|
|
341 |
| Sales and marketing costs |
|
|
|
(7,200) |
|
|
|
|
(5,212) |
|
|
|
|
(12,412 |
) |
|
|
|
(10,406) |
|
|
(22,818) |
| General and administrative costs |
|
|
|
(47,074) |
|
|
|
|
(23,437) |
|
|
|
|
(70,511 |
) |
|
|
|
(19,623) |
|
|
(90,134) |
| Operating profit/(loss) |
|
|
|
66,581 |
|
|
|
|
41,482 |
|
|
|
|
108,063 |
|
|
|
|
(37,704) |
|
|
70,359 |
| Net finance expense |
|
|
|
|
|
|
|
|
|
|
|
|
|
|
|
|
|
|
|
|
|
(57,453) |
| Profit before taxation |
|
|
|
|
|
|
|
|
|
|
|
|
|
|
|
|
|
|
|
|
|
12,906 |
| |
|
|
|
|
|
|
|
|
|
|
|
|
|
|
|
|
|
|
|
|
|
|
| Total assets |
|
|
|
619,356 |
|
|
|
|
223,274 |
|
|
|
|
842,630 |
|
|
|
|
68,145 |
|
|
910,775 |
| Total liabilities |
|
|
|
148,884 |
|
|
|
|
39,708 |
|
|
|
|
188,592 |
|
|
|
|
334,281 |
|
|
522,873 |
| Capital expenditures, including intangible assets* |
|
|
|
(93,676) |
|
|
|
|
(47,016) |
|
|
|
|
(140,692 |
) |
|
|
|
(2,689) |
|
|
(143,381) |
| Depreciation, amortisation and impairments |
|
|
|
(37,371) |
|
|
|
|
(17,269) |
|
|
|
|
(54,640 |
) |
|
|
|
(3,030) |
|
|
(57,670) |
| |
|
|
|
|
|
|
|
|
|
|
|
|
|
|
|
|
|
|
|
|
|
|
| Adjusted EBITDA |
|
|
|
104,373 |
|
|
|
|
59,097 |
|
|
|
|
163,470 |
|
|
|
|
(31,633) |
|
|
131,837 |
|
|
|
|
|
|
| INFORMATION BY SEGMENT, 2012 |
|
FR, DE, NL |
|
Rest of Europe |
|
Subtotal |
|
Corporate |
|
Total |
| |
|
and UK |
|
|
|
|
|
and other |
|
|
| |
|
|
|
|
|
(€’000) |
|
|
|
|
| Recurring revenue |
|
|
|
159,136 |
|
|
|
|
100,113 |
|
|
|
|
259,249 |
|
|
|
|
— |
|
|
259,249 |
| Non-recurring revenue |
|
|
|
12,640 |
|
|
|
|
5,232 |
|
|
|
|
17,872 |
|
|
|
|
— |
|
|
17,872 |
| Total revenue |
|
|
|
171,776 |
|
|
|
|
105,345 |
|
|
|
|
277,121 |
|
|
|
|
— |
|
|
277,121 |
| Cost of sales |
|
|
|
(66,367) |
|
|
|
|
(40,559) |
|
|
|
|
(106,926 |
) |
|
|
|
(6,156) |
|
|
(113,082) |
| Gross profit/(loss) |
|
|
|
105,409 |
|
|
|
|
64,786 |
|
|
|
|
170,195 |
|
|
|
|
(6,156) |
|
|
164,039 |
| Other income |
|
|
|
463 |
|
|
|
|
— |
|
|
|
|
463 |
|
|
|
|
— |
|
|
463 |
| Sales and marketing costs |
|
|
|
(6,039) |
|
|
|
|
(4,259) |
|
|
|
|
(10,298 |
) |
|
|
|
(9,802) |
|
|
(20,100) |
| General and administrative costs |
|
|
|
(36,497) |
|
|
|
|
(21,558) |
|
|
|
|
(58,055 |
) |
|
|
|
(21,188) |
|
|
(79,243) |
| Operating profit/(loss) |
|
|
|
63,336 |
|
|
|
|
38,969 |
|
|
|
|
102,305 |
|
|
|
|
(37,146) |
|
|
65,159 |
| Net finance expense |
|
|
|
|
|
|
|
|
|
|
|
|
|
|
|
|
|
|
|
|
|
(17,746) |
| Profit before taxation |
|
|
|
|
|
|
|
|
|
|
|
|
|
|
|
|
|
|
|
|
|
47,413 |
| |
|
|
|
|
|
|
|
|
|
|
|
|
|
|
|
|
|
|
|
|
|
|
| Total assets |
|
|
|
546,842 |
|
|
|
|
197,802 |
|
|
|
|
744,644 |
|
|
|
|
74,580 |
|
|
819,224 |
| Total liabilities |
|
|
|
139,576 |
|
|
|
|
48,183 |
|
|
|
|
187,759 |
|
|
|
|
255,891 |
|
|
443,650 |
| Capital expenditures, including intangible assets* |
|
|
|
(145,080) |
|
|
|
|
(29,014) |
|
|
|
|
(174,094 |
) |
|
|
|
(4,237) |
|
|
(178,331) |
| Depreciation, amortisation and impairments |
|
|
|
(25,686) |
|
|
|
|
(15,691) |
|
|
|
|
(41,377 |
) |
|
|
|
(2,616) |
|
|
(43,993) |
| |
|
|
|
|
|
|
|
|
|
|
|
|
|
|
|
|
|
|
|
|
|
|
| Adjusted EBITDA |
|
|
|
90,121 |
|
|
|
|
55,068 |
|
|
|
|
145,189 |
|
|
|
|
(30,174) |
|
|
115,015 |
Note: *Capital expenditures, including intangible assets, represent payments to acquire property, plant and
equipment and intangible assets, as recorded in the consolidated statement of cash flows as “Purchase of property, plant and equipment” and “Purchase of intangible assets” respectively.
|
| 54 / INTERXION ANNUAL REPORT 2014 |
|
|
|
|
|
Consolidated Financial Statements
|
RECONCILIATION ADJUSTED EBITDA
|
|
|
|
|
|
|
|
|
|
|
| Consolidated |
|
2014 |
|
|
2013 |
|
|
2012 |
| |
|
|
|
|
|
|
(€’000 |
) |
|
|
| Profit for the year attributable to shareholders |
|
|
35,060 |
|
|
|
6,824 |
|
|
31,631 |
| Income tax expense |
|
|
15,449 |
|
|
|
6,082 |
|
|
15,782 |
| Profit before taxation |
|
|
50,509 |
|
|
|
12,906 |
|
|
47,413 |
| Finance income |
|
|
(890) |
|
|
|
(484 |
) |
|
(907) |
| Finance expense |
|
|
28,766 |
|
|
|
57,937 |
|
|
18,653 |
| Operating profit |
|
|
78,385 |
|
|
|
70,359 |
|
|
65,159 |
| Depreciation, amortisation and impairment |
|
|
62,177 |
|
|
|
57,670 |
|
|
43,993 |
| EBITDA(1) |
|
|
140,562 |
|
|
|
128,029 |
|
|
109,152 |
| Share-based payments |
|
|
6,576 |
|
|
|
4,149 |
|
|
5,488 |
| Increase/(decrease) in provision of onerous lease contracts(2) |
|
|
(805) |
|
|
|
— |
|
|
838 |
| M&A transaction costs |
|
|
325 |
|
|
|
— |
|
|
— |
| Income from sublease of unused data centre sites |
|
|
(271) |
|
|
|
(341 |
) |
|
(463) |
| Adjusted EBITDA |
|
|
146,387 |
|
|
|
131,837 |
|
|
115,015 |
|
|
|
|
| France, Germany, the Netherlands and UK |
|
2014 |
|
|
2013 |
|
|
2012 |
| |
|
|
|
|
|
|
(€’000 |
) |
|
|
| Operating profit |
|
|
73,038 |
|
|
|
66,581 |
|
|
63,336 |
| Depreciation, amortisation and impairment |
|
|
40,129 |
|
|
|
37,371 |
|
|
25,686 |
| EBITDA(1) |
|
|
113,167 |
|
|
|
103,952 |
|
|
89,022 |
| Share-based payments |
|
|
1,318 |
|
|
|
762 |
|
|
724 |
| Increase/(decrease) in provision onerous lease contracts(2) |
|
|
(805) |
|
|
|
— |
|
|
838 |
| Income from sublease of unused data centre sites |
|
|
(271) |
|
|
|
(341 |
) |
|
(463) |
| Adjusted EBITDA |
|
|
113,409 |
|
|
|
104,373 |
|
|
90,121 |
|
|
|
|
| Rest of Europe |
|
2014 |
|
|
2013 |
|
|
2012 |
| |
|
|
|
|
|
|
(€’000 |
) |
|
|
| Operating profit |
|
|
47,799 |
|
|
|
41,482 |
|
|
38,969 |
| Depreciation, amortisation and impairment |
|
|
18,514 |
|
|
|
17,269 |
|
|
15,691 |
| EBITDA(1) |
|
|
66,313 |
|
|
|
58,751 |
|
|
54,660 |
| Share-based payments |
|
|
960 |
|
|
|
346 |
|
|
408 |
| Adjusted EBITDA |
|
|
67,273 |
|
|
|
59,097 |
|
|
55,068 |
|
|
|
|
| Corporate and other |
|
2014 |
|
|
2013 |
|
|
2012 |
| |
|
|
|
|
|
|
(€’000 |
) |
|
|
| Operating profit |
|
|
(42,452) |
|
|
|
(37,704 |
) |
|
(37,146) |
| Depreciation, amortisation and impairment |
|
|
3,534 |
|
|
|
3,030 |
|
|
2,616 |
| EBITDA(1) |
|
|
(38,918) |
|
|
|
(34,674 |
) |
|
(34,530) |
| Share-based payments |
|
|
4,298 |
|
|
|
3,041 |
|
|
4,356 |
| M&A transaction costs |
|
|
325 |
|
|
|
— |
|
|
— |
| Adjusted EBITDA |
|
|
(34,295) |
|
|
|
(31,633 |
) |
|
(30,174) |
|
|
|
| Note: |
|
(1) Operating profit plus depreciation, amortisation and impairment of assets. |
|
|
(2) Before deduction of income from subleases on unused data centre sites. |
In 2014, the share-based payments include an amount of
€92,000 related to taxes and social security
charges (2013: €559,000, 2012: €2,078,000).
|
| INTERXION ANNUAL REPORT 2014 / 55 |
|
|
|
|
Consolidated Financial Statements
|
|
|
Revenue consists of colocation revenue derived from the rendering of data centre
services, which includes customer installation services and equipment sales.
| 7 |
EMPLOYEE BENEFIT EXPENSES |
The Group employed an average of 478 employees (full-time
equivalents) during 2014 (2013: 425 and 2012: 385). Costs incurred in respect of these employees were:
|
|
|
|
|
|
|
|
|
|
|
| |
|
2014 |
|
|
2013 |
|
|
2012 |
| |
|
|
|
|
(€’000) |
|
|
|
| Salaries and bonuses |
|
|
36,489 |
|
|
|
32,369 |
|
|
30,229 |
| Social security charges |
|
|
6,025 |
|
|
|
5,535 |
|
|
5,295 |
| Contributions to defined contribution pension plans |
|
|
2,178 |
|
|
|
2,051 |
|
|
1,776 |
| Other personnel-related costs |
|
|
7,355 |
|
|
|
8,309 |
|
|
5,233 |
| Share-based payments |
|
|
6,576 |
|
|
|
4,149 |
|
|
5,488 |
| |
|
|
58,623 |
|
|
|
52,413 |
|
|
48,021 |
The following income statement line items include employee benefit expenses of:
|
|
|
|
|
|
|
|
|
|
|
| |
|
2014 |
|
|
2013 |
|
|
2012 |
| |
|
|
|
|
(€’000) |
|
|
|
| Costs of sales |
|
|
22,282 |
|
|
|
19,963 |
|
|
16,634 |
| Sales and marketing costs |
|
|
15,266 |
|
|
|
14,942 |
|
|
12,300 |
| General and administrative costs |
|
|
21,075 |
|
|
|
17,508 |
|
|
19,087 |
| |
|
|
58,623 |
|
|
|
52,413 |
|
|
48,021 |
The Group operates a defined contribution pension scheme for most of its employees. The contributions are made in
accordance with the scheme and are expensed in the income statement as incurred.
In 2013 and 2012, the Dutch Government imposed a
crisis wage tax payable by employers. The total charge in 2013, included in General and administrative costs, amounted to €417,000 (2012: €1,854,000). In 2014, this crisis wage tax was no longer applicable.
|
| 56 / INTERXION ANNUAL REPORT 2014 |
|
|
|
|
|
Consolidated Financial Statements
|
| 8 |
FINANCE INCOME AND EXPENSE |
|
|
|
|
|
|
|
|
|
|
|
| |
|
2014 |
|
|
2013
(€’000) |
|
|
2012 |
| Bank and other interest |
|
|
496 |
|
|
|
484 |
|
|
907 |
| Net foreign currency exchange gain |
|
|
394 |
|
|
|
— |
|
|
— |
| Finance income |
|
|
890 |
|
|
|
484 |
|
|
907 |
| Interest expense on Senior Secured Notes, bank and other loans |
|
|
(23,783) |
|
|
|
(22,594) |
|
|
(16,680) |
| Interest expense on finance leases |
|
|
(2,314) |
|
|
|
(1,642) |
|
|
(61) |
| Interest expense on provision for onerous lease contracts |
|
|
(230) |
|
|
|
(334) |
|
|
(428) |
| Other financial expenses |
|
|
(2,439) |
|
|
|
(32,751) |
|
|
(1,221) |
| Net foreign currency exchanges loss |
|
|
— |
|
|
|
(616) |
|
|
(263) |
| Finance expense |
|
|
(28,766) |
|
|
|
(57,937) |
|
|
(18,653) |
| Net finance expense |
|
|
(27,876) |
|
|
|
(57,453) |
|
|
(17,746) |
In 2014, the “Interest expense on Senior Secured Notes, bank and other loans” increased principally as
result of the increased interest expenses related to the Additional Notes amounting to €150 million partly offset by higher capitalized borrowing costs.
In 2013, the “Interest expense on Senior Secured Notes, bank and other loans” increased principally as result of €7.5 million lower capitalised borrowing costs.
As a result of
the refinancing completed on 3 July 2013, the Company incurred costs, presented in “Other financial expenses”, of approximately €31 million of which €26.5 million in cash related to the tender and redemption premiums and consent fees for the 9.50% Senior Secured Notes due 2017 (the “Senior Secured Notes due 2017”) and
€4.5 million non-cash expenses from the deferred financing costs related to the former €60 million
Revolving Facility Agreement and the unamortized costs of the Senior Secured Notes due 2017.
The “Interest expense on provision
for onerous lease contracts” related to the unwinding of the discount rate used to calculate the “Provision for onerous lease contracts”.
INCOME TAX (EXPENSE)/BENEFIT
|
|
|
|
|
|
|
|
|
|
|
| |
|
2014 |
|
|
2013
(€’000) |
|
|
2012 |
| Current taxes |
|
|
(8,947) |
|
|
|
(7,888) |
|
|
(6,219) |
| Deferred taxes |
|
|
(6,502) |
|
|
|
1,806 |
|
|
(9,563) |
| Total income tax (expense)/benefit |
|
|
(15,449) |
|
|
|
(6,082) |
|
|
(15,782) |
|
| INTERXION ANNUAL REPORT 2014 / 57 |
|
|
|
|
Consolidated Financial Statements
|
|
|
RECONCILIATION OF EFFECTIVE TAX RATE
A reconciliation between income taxes calculated at the Dutch statutory tax rate of 25% in 2014 (25% in 2013 and 2012) and the actual tax
benefit/(expense) with an effective tax rate of 30.6% (47.1% in 2013 and 33.3% in 2012) is as follows:
|
|
|
|
|
|
|
|
|
|
|
| |
|
2014 |
|
|
2013
(€’000) |
|
|
2012 |
| Profit for the year |
|
|
35,060 |
|
|
|
6,824 |
|
|
31,631 |
| Income tax expense |
|
|
(15,449) |
|
|
|
(6,082) |
|
|
(15,782) |
| Profit before taxation |
|
|
50,509 |
|
|
|
12,906 |
|
|
47,413 |
| |
|
|
|
|
|
|
|
|
|
|
| Income tax using Company’s domestic tax rate |
|
|
(12,627) |
|
|
|
(3,227) |
|
|
(11,854) |
| Effect of tax rates in foreign jurisdictions |
|
|
(1,033) |
|
|
|
(1,007) |
|
|
(1,308) |
| Change in tax rate and legislation |
|
|
355 |
|
|
|
305 |
|
|
(1,042) |
| Non-deductible expenses |
|
|
(1,617) |
|
|
|
(2,041) |
|
|
(1,372) |
| Recognition of previously unrecognised tax losses |
|
|
— |
|
|
|
— |
|
|
355 |
| Current year results for which no deferred tax asset was
recognised |
|
|
— |
|
|
|
25 |
|
|
(328) |
| Prior year adjustments included in current year tax |
|
|
(25) |
|
|
|
344 |
|
|
201 |
| Other |
|
|
(502) |
|
|
|
(481) |
|
|
(434) |
| Income tax expense |
|
|
(15,449) |
|
|
|
(6,082) |
|
|
(15,782) |
RECOGNISED DEFERRED TAX ASSETS/(LIABILITIES)
The movement in recognised deferred tax assets during the year is as follows:
|
|
|
|
|
|
|
|
|
|
|
|
|
|
|
|
|
|
|
|
|
|
|
|
|
|
|
|
|
| |
|
Property,
plant and
equipment,
and
Intangibles
|
|
|
|
|
Provision
onerous
contracts
|
|
|
|
|
Other
(€’000) |
|
|
|
|
Tax loss
carry-
forward
|
|
|
|
|
Total
|
|
| 1 January 2012 |
|
|
14,748 |
|
|
|
|
|
4,382 |
|
|
|
|
|
2,048 |
|
|
|
|
|
26,480 |
|
|
|
|
|
47,658 |
|
| Recognised in profit/(loss) for 2012 |
|
|
210 |
|
|
|
|
|
(743) |
|
|
|
|
|
2,547 |
|
|
|
|
|
(8,013) |
|
|
|
|
|
(5,999) |
|
| Recognised in equity |
|
|
— |
|
|
|
|
|
— |
|
|
|
|
|
— |
|
|
|
|
|
(571) |
|
|
|
|
|
(571) |
|
| Effects of movements in exchange rates |
|
|
21 |
|
|
|
|
|
— |
|
|
|
|
|
5 |
|
|
|
|
|
255 |
|
|
|
|
|
281 |
|
| 31 December 2012 |
|
|
14,979 |
|
|
|
|
|
3,639 |
|
|
|
|
|
4,600 |
|
|
|
|
|
18,151 |
|
|
|
|
|
41,369 |
|
| Recognised in profit/(loss) for 2013 |
|
|
(990) |
|
|
|
|
|
(1,022) |
|
|
|
|
|
869 |
|
|
|
|
|
5,924 |
|
|
|
|
|
4,781 |
|
| Recognised in equity |
|
|
— |
|
|
|
|
|
— |
|
|
|
|
|
— |
|
|
|
|
|
544 |
|
|
|
|
|
544 |
|
| Effects of movements in exchange rates |
|
|
2 |
|
|
|
|
|
— |
|
|
|
|
|
— |
|
|
|
|
|
(104) |
|
|
|
|
|
(102) |
|
| 31 December 2013 |
|
|
13,991 |
|
|
|
|
|
2,617 |
|
|
|
|
|
5,469 |
|
|
|
|
|
24,515 |
|
|
|
|
|
46,592 |
|
| Recognised in profit/(loss) for 2014 |
|
|
(565) |
|
|
|
|
|
(1,042) |
|
|
|
|
|
(2,130) |
|
|
|
|
|
(1,214) |
|
|
|
|
|
(4,951) |
|
| Recognised in equity |
|
|
— |
|
|
|
|
|
— |
|
|
|
|
|
— |
|
|
|
|
|
(367) |
|
|
|
|
|
(367) |
|
| Effects of movements in exchange rates |
|
|
2 |
|
|
|
|
|
— |
|
|
|
|
|
5 |
|
|
|
|
|
(22) |
|
|
|
|
|
(15) |
|
| 31 December 2014 |
|
|
13,428 |
|
|
|
|
|
1,575 |
|
|
|
|
|
3,344 |
|
|
|
|
|
22,912 |
|
|
|
|
|
41,259 |
|
| Offset deferred tax liabilities |
|
|
(7,704) |
|
|
|
|
|
— |
|
|
|
|
|
(1,286) |
|
|
|
|
|
(2,205) |
|
|
|
|
|
(11,195) |
|
| Net deferred tax assets/(liabilities) |
|
|
5,724 |
|
|
|
|
|
1,575 |
|
|
|
|
|
2,058 |
|
|
|
|
|
20,707 |
|
|
|
|
|
30,064 |
|
58 / INTERXION ANNUAL REPORT 2014
|
|
|
|
|
Consolidated Financial Statements
|
The movement in recognised deferred tax liabilities during the year is as follows:
|
|
|
|
|
|
|
|
|
|
|
|
|
|
|
|
|
|
|
|
|
| |
|
Property,
plant and
equipment,
and
Intangibles
|
|
|
Provision
onerous
contracts
|
|
|
Other
(€’000) |
|
|
Tax loss
carry-
forward
|
|
|
Total
|
|
| 1 January 2012 |
|
|
(8,790) |
|
|
|
— |
|
|
|
(1,053) |
|
|
|
— |
|
|
|
(9,843) |
|
| Recognised in profit/(loss) for 2012 |
|
|
(3,501) |
|
|
|
— |
|
|
|
(63) |
|
|
|
— |
|
|
|
(3,564) |
|
| 31 December 2012 |
|
|
(12,291) |
|
|
|
— |
|
|
|
(1,116) |
|
|
|
— |
|
|
|
(13,407) |
|
| Recognised in profit/(loss) for 2013 |
|
|
(3,398) |
|
|
|
— |
|
|
|
423 |
|
|
|
— |
|
|
|
(2,975) |
|
| Effects of movements in exchange rates |
|
|
89 |
|
|
|
— |
|
|
|
— |
|
|
|
— |
|
|
|
89 |
|
| 31 December 2013 |
|
|
(15,600) |
|
|
|
— |
|
|
|
(693) |
|
|
|
— |
|
|
|
(16,293) |
|
| Recognised in profit/(loss) for 2014 |
|
|
(1,138) |
|
|
|
— |
|
|
|
(413) |
|
|
|
— |
|
|
|
(1,551) |
|
| Effects of movements in exchange rates |
|
|
(380) |
|
|
|
— |
|
|
|
— |
|
|
|
— |
|
|
|
(380) |
|
| 31 December 2014 |
|
|
(17,118) |
|
|
|
— |
|
|
|
(1,106) |
|
|
|
— |
|
|
|
(18,224) |
|
| Offset deferred tax assets |
|
|
7,704 |
|
|
|
— |
|
|
|
1,286 |
|
|
|
2,205 |
|
|
|
11,195 |
|
| Net deferred tax assets/(liabilities) |
|
|
(9,414) |
|
|
|
— |
|
|
|
180 |
|
|
|
2,205 |
|
|
|
(7,029) |
|
The deferred tax assets and liabilities are presented as net amounts as far as the amounts can be offset.
The estimated utilisation of carried-forward tax losses in future years is based on management’s forecasts of future
profitability by tax jurisdiction.
The following net deferred tax assets have not been recognised:
|
|
|
|
|
|
|
|
|
|
|
| |
|
2014 |
|
|
2013
(€’000) |
|
|
2012
|
| Deductible temporary differences - net |
|
|
39 |
|
|
|
117 |
|
|
46 |
| Tax losses |
|
|
787 |
|
|
|
1,303 |
|
|
1,501 |
| |
|
|
826 |
|
|
|
1,420 |
|
|
1,547 |
The accumulated recognised and unrecognised tax losses expire as follows:
|
|
|
|
|
|
|
|
|
|
|
| |
|
2014 |
|
|
2013
(€’000) |
|
|
2012 |
| Within one year |
|
|
— |
|
|
|
3,159 |
|
|
3,798 |
| Between 1 and 5 years |
|
|
7,000 |
|
|
|
4,949 |
|
|
7,057 |
| After 5 years |
|
|
32,318 |
|
|
|
24,775 |
|
|
5,918 |
| Unlimited |
|
|
67,397 |
|
|
|
79,754 |
|
|
69,403 |
| |
|
|
106,715 |
|
|
|
112,637 |
|
|
86,176 |
INTERXION ANNUAL REPORT
2014 / 59
|
|
|
|
Consolidated Financial Statements
|
|
|
| 10 |
PROPERTY, PLANT AND EQUIPMENT |
|
|
|
|
|
|
|
|
|
|
|
|
|
|
|
|
|
|
|
|
|
|
|
| |
|
Freehold
land and
buildings |
|
|
Infrastructure
and
equipment |
|
|
Assets
under
construction |
|
|
Total
data centre assets |
|
Office
equipment
and other |
|
|
Total |
|
| |
|
|
|
|
|
|
|
(€’000) |
|
|
|
|
|
|
| Cost: |
|
|
|
|
|
|
|
|
|
|
|
|
|
|
|
|
|
|
|
|
|
|
| As at 1 January 2014 |
|
|
103,715 |
|
|
|
765,282 |
|
|
|
87,213 |
|
|
956,210 |
|
|
31,028 |
|
|
|
987,238 |
|
| Additions |
|
|
53,597 |
|
|
|
51,782 |
|
|
|
141,042 |
|
|
246,421 |
|
|
5,375 |
|
|
|
251,796 |
|
| Exchange differences |
|
|
6 |
|
|
|
5,227 |
|
|
|
364 |
|
|
5,597 |
|
|
179 |
|
|
|
5,776 |
|
| Disposals |
|
|
— |
|
|
|
(2,560) |
|
|
|
— |
|
|
(2,560) |
|
|
(6,631) |
|
|
|
(9,191) |
|
| Transfers |
|
|
11,187 |
|
|
|
142,674 |
|
|
|
(153,861) |
|
|
— |
|
|
— |
|
|
|
— |
|
| As at 31 December 2014 |
|
|
168,505 |
|
|
|
962,405 |
|
|
|
74,758 |
|
|
1,205,668 |
|
|
29,951 |
|
|
|
1,235,619 |
|
| Accumulated depreciation and impairment: |
|
|
|
|
|
|
|
|
|
|
|
|
|
|
|
|
|
|
|
| As at 1 January 2014 |
|
|
(7,308) |
|
|
|
(260,012) |
|
|
|
— |
|
|
(267,320) |
|
|
(21,170) |
|
|
|
(288,490) |
|
| Depreciation |
|
|
(1,962) |
|
|
|
(53,907) |
|
|
|
— |
|
|
(55,869) |
|
|
(3,231) |
|
|
|
(59,100) |
|
| Exchange differences |
|
|
— |
|
|
|
(1,533) |
|
|
|
— |
|
|
(1,533) |
|
|
(110) |
|
|
|
(1,643) |
|
| Disposals |
|
|
— |
|
|
|
2,170 |
|
|
|
— |
|
|
2,170 |
|
|
6,628 |
|
|
|
8,798 |
|
| As at 31 December 2014 |
|
|
(9,270) |
|
|
|
(313,282) |
|
|
|
— |
|
|
(322,552) |
|
|
(17,883) |
|
|
|
(340,435) |
|
| Carrying amount as at
31 December 2014 |
|
|
159,235 |
|
|
|
649,123 |
|
|
|
74,758 |
|
|
883,116 |
|
|
12,068 |
|
|
|
895,184 |
|
| |
|
|
|
|
|
|
|
|
|
|
|
|
|
|
|
|
|
|
|
|
|
|
| |
|
|
|
|
|
|
|
|
|
|
|
|
|
|
|
|
|
|
|
|
|
|
| Cost: |
|
|
|
|
|
|
|
|
|
|
|
|
|
|
|
|
|
|
|
|
|
|
| As at 1 January 2013 |
|
|
87,157 |
|
|
|
709,722 |
|
|
|
30,553 |
|
|
827,432 |
|
|
28,883 |
|
|
|
856,315 |
|
| Additions |
|
|
16,558 |
|
|
|
27,206 |
|
|
|
89,770 |
|
|
133,534 |
|
|
2,373 |
|
|
|
135,907 |
|
| Exchange differences |
|
|
— |
|
|
|
(3,735) |
|
|
|
— |
|
|
(3,735) |
|
|
(122) |
|
|
|
(3,857) |
|
| Disposals |
|
|
— |
|
|
|
(1,021) |
|
|
|
— |
|
|
(1,021) |
|
|
(106) |
|
|
|
(1,127) |
|
| Transfers |
|
|
— |
|
|
|
33,110 |
|
|
|
(33,110) |
|
|
— |
|
|
— |
|
|
|
— |
|
| As at 31 December 2013 |
|
|
103,715 |
|
|
|
765,282 |
|
|
|
87,213 |
|
|
956,210 |
|
|
31,028 |
|
|
|
987,238 |
|
| Accumulated depreciation and impairment: |
|
|
|
|
|
|
|
|
|
|
|
|
|
|
|
|
|
|
|
| As at 1 January 2013 |
|
|
(4,594) |
|
|
|
(211,882) |
|
|
|
— |
|
|
(216,476) |
|
|
(18,908) |
|
|
|
(235,384) |
|
| Depreciation |
|
|
(2,714) |
|
|
|
(49,941) |
|
|
|
— |
|
|
(52,655) |
|
|
(2,435) |
|
|
|
(55,090) |
|
| Exchange differences |
|
|
— |
|
|
|
790 |
|
|
|
— |
|
|
790 |
|
|
67 |
|
|
|
857 |
|
| Disposals |
|
|
— |
|
|
|
1,021 |
|
|
|
— |
|
|
1,021 |
|
|
106 |
|
|
|
1,127 |
|
| As at 31 December 2013 |
|
|
(7,308) |
|
|
|
(260,012) |
|
|
|
— |
|
|
(267,320) |
|
|
(21,170) |
|
|
|
(288,490) |
|
| Carrying amount as at
31 December 2013 |
|
|
96,407 |
|
|
|
505,270 |
|
|
|
87,213 |
|
|
688,890 |
|
|
9,858 |
|
|
|
698,748 |
|
|
| 60 / INTERXION ANNUAL REPORT 2014 |
|
|
|
|
|
Consolidated Financial Statements
|
|
|
|
|
|
|
|
|
|
|
|
|
|
|
|
|
|
|
|
|
|
|
|
|
|
| |
|
Freehold
land and
buildings
|
|
|
Infrastructure
and
equipment
|
|
|
Assets
under
construction
|
|
|
Total
data centre
assets
|
|
|
Office
equipment
and other
|
|
|
Total |
|
| |
|
(€’000)
|
|
|
Cost: |
|
|
|
|
|
|
|
|
|
|
|
|
|
|
|
|
|
|
|
|
|
|
|
|
| As at 1 January 2012 |
|
|
38,710 |
|
|
|
506,847
|
|
|
|
101,173
|
|
|
|
646,730 |
|
|
|
24,830 |
|
|
|
671,560 |
|
| Additions |
|
|
48,447 |
|
|
|
41,590
|
|
|
|
89,431
|
|
|
|
179,468 |
|
|
|
3,973 |
|
|
|
183,441 |
|
| Exchange differences |
|
|
— |
|
|
|
2,862
|
|
|
|
— |
|
|
|
2,862 |
|
|
|
112 |
|
|
|
2,974 |
|
| Disposals |
|
|
— |
|
|
|
(1,628) |
|
|
|
— |
|
|
|
(1,628) |
|
|
|
(32) |
|
|
|
(1,660) |
|
| Transfers |
|
|
— |
|
|
|
160,051
|
|
|
|
(160,051)
|
|
|
|
— |
|
|
|
— |
|
|
|
— |
|
|
As at 31 December 2012 |
|
|
87,157 |
|
|
|
709,722 |
|
|
|
30,553 |
|
|
|
827,432 |
|
|
|
28,883 |
|
|
|
856,315 |
|
|
Accumulated depreciation and impairment: |
|
|
|
|
|
|
|
|
|
|
|
|
|
|
|
|
|
|
|
|
|
| As at 1 January 2012 |
|
|
(3,042) |
|
|
|
(174,116)
|
|
|
|
— |
|
|
|
(177,158) |
|
|
|
(16,604) |
|
|
|
(193,762) |
|
| Depreciation |
|
|
(1,552) |
|
|
|
(38,668) |
|
|
|
— |
|
|
|
(40,220) |
|
|
|
(2,275) |
|
|
|
(42,495) |
|
| Exchange differences |
|
|
— |
|
|
|
(726) |
|
|
|
— |
|
|
|
(726) |
|
|
|
(61) |
|
|
|
(787) |
|
| Disposals |
|
|
— |
|
|
|
1,628
|
|
|
|
— |
|
|
|
1,628 |
|
|
|
32 |
|
|
|
1,660 |
|
|
As at 31 December 2012 |
|
|
(4,594) |
|
|
|
(211,882) |
|
|
|
— |
|
|
|
(216,476) |
|
|
|
(18,908) |
|
|
|
(235,384) |
|
|
Carrying amount as at
31 December 2012 |
|
|
82,563 |
|
|
|
497,840 |
|
|
|
30,553 |
|
|
|
610,956 |
|
|
|
9,975 |
|
|
|
620,931 |
|
In November 2014, the Group agreed to purchase the VIE data centre land and building. As a result of this
modification, in accordance with IAS17, as of November 2014, the lease, which was previously reported as an operating lease is reported as a financial lease. The carrying amount of the land amounts to €8,619,000 and the carrying value of the building amounts to €10,097,000. The purchase transaction was effectuated
in January 2015.
In August 2014, the Group exercised its option to purchase the AMS7 data centre land and building. The actual legal
transaction will become effective in 2023. As a result of this modification, in accordance with IAS17, as of August 2014, the lease, which was previously reported as an operating lease is reported as a financial lease. The carrying amount of the
land amounts to €5,800,000 and the carrying amount of the leased building amounts to €7,511,000.
In August 2014, the Group completed the €8.5 million transaction with
Société Française du Radiotéléphone – SFR SA (“SFR”) to purchase a data centre campus in Marseille, France, owned by SFR. As at 31 December 2014, the carrying amount of the land amounts to €638,000 and the carrying value of the building amounts to €7,161,000.
In January 2014, the Group completed the €11.4 million transaction to
purchase the data centre property in Brussels, Belgium. As at 31 December 2014, the carrying amount of the land amounts to €3,775,000 and the carrying value of the building
amounts to €8,635,000.
In December 2012, the Group exercised its
option to purchase the PAR7 data centre land. The actual legal transaction will become effective in 2019. As a result of this modification, in accordance with IAS17, as of 20 December 2012, the lease, which was previously reported as an
operating lease is reported as a financial lease. The carrying amount of the land amounts to €20,832,000 (2013:
€20,832,000 and 2012: €20,832,000). In addition, until 2014, the Group leased data centre equipment under a
number of finance lease agreements, with a carrying amount of €202,000 per 31 December 2013 (2012:
€224,000). In 2014, the lease agreement expired and the ownership of these assets was transferred to the Group.
Capitalised interest relating to borrowing costs for 2014 amounted to
€3,604,000 (2013: €1,701,000 and 2012:
€9,195,000). The cash effect of the interest capitalised for 2014 amounted to €2,512,000, which is presented
in the Statement of Cash Flows under “Purchase of property, plant and equipment” (2013: €3,681,000 and 2012:
€8,224,000).
As at 31 December 2014, the carrying value of
freehold land included in the category “Freehold land and buildings” amounts to €70,497,000 (2013:
€51,663,000 and 2012: €44,092,000).
Depreciation of property, plant and equipment is disclosed as general and administrative cost in the consolidated statement of income.
At 31 December 2014, properties with a carrying value of €55,614,000
(2013: €44,017,000 and 2012: €17,568,000) were subject to a registered debenture to secure mortgages (see
Note 19).
|
| INTERXION ANNUAL REPORT 2014 / 61 |
|
|
|
|
Consolidated Financial Statements
|
|
|
The components of intangible assets are as follows:
|
|
|
|
|
|
|
|
|
|
|
|
|
|
|
|
|
|
|
|
|
| |
|
Power grid rights
|
|
|
|
|
Software |
|
|
|
|
Other |
|
|
|
|
Total |
| |
|
|
|
|
|
|
(€’000)
|
|
|
|
|
|
|
Cost: |
|
|
|
|
|
|
|
|
|
|
|
|
|
|
|
|
|
|
|
|
|
As at 1 January 2014
|
|
|
11,980 |
|
|
|
|
|
10,723 |
|
|
|
|
|
2,165 |
|
|
|
|
24,868 |
|
Additions |
|
|
376 |
|
|
|
|
|
2,953 |
|
|
|
|
|
— |
|
|
|
|
3,329 |
|
Exchange differences
|
|
|
477 |
|
|
|
|
|
25 |
|
|
|
|
|
— |
|
|
|
|
502 |
|
Disposals |
|
|
—
|
|
|
|
|
|
(662) |
|
|
|
|
|
— |
|
|
|
|
(662) |
|
As at 31 December 2014 |
|
|
12,833
|
|
|
|
|
|
13,039 |
|
|
|
|
|
2,165 |
|
|
|
|
28,037 |
|
Amortisation: |
|
|
|
|
|
|
|
|
|
|
|
|
|
|
|
|
|
|
|
|
|
As at 1 January 2014
|
|
|
(943) |
|
|
|
|
|
(4,936) |
|
|
|
|
|
(1,111) |
|
|
|
|
(6,990) |
|
Amortisation |
|
|
(354) |
|
|
|
|
|
(2,144) |
|
|
|
|
|
(186) |
|
|
|
|
(2,684) |
|
Exchange differences
|
|
|
—
|
|
|
|
|
|
(29) |
|
|
|
|
|
— |
|
|
|
|
(29) |
|
Disposals |
|
|
—
|
|
|
|
|
|
662 |
|
|
|
|
|
— |
|
|
|
|
662 |
|
As at 31 December 2014 |
|
|
(1,297)
|
|
|
|
|
|
(6,447) |
|
|
|
|
|
(1,297) |
|
|
|
|
(9,041) |
|
Carrying amount as at 31 December 2014
|
|
|
11,536
|
|
|
|
|
|
6,592 |
|
|
|
|
|
868 |
|
|
|
|
18,996 |
| |
|
|
|
|
|
|
|
|
|
|
|
|
|
|
|
|
|
|
|
|
|
Cost: |
|
|
|
|
|
|
|
|
|
|
|
|
|
|
|
|
|
|
|
|
| As at 1 January 2013 |
|
|
11,833
|
|
|
|
|
|
9,059
|
|
|
|
|
|
2,165 |
|
|
|
|
23,057
|
| Additions |
|
|
296
|
|
|
|
|
|
1,678
|
|
|
|
|
|
— |
|
|
|
|
1,974
|
| Exchange differences |
|
|
(149)
|
|
|
|
|
|
(14) |
|
|
|
|
|
— |
|
|
|
|
(163)
|
|
As at 31 December 2013 |
|
|
11,980
|
|
|
|
|
|
10,723 |
|
|
|
|
|
2,165 |
|
|
|
|
24,868 |
|
Amortisation: |
|
|
|
|
|
|
|
|
|
|
|
|
|
|
|
|
|
|
|
|
| As at 1 January 2013 |
|
|
(612)
|
|
|
|
|
|
(2,882) |
|
|
|
|
|
(925) |
|
|
|
|
(4,419)
|
| Amortisation |
|
|
(331)
|
|
|
|
|
|
(2,063) |
|
|
|
|
|
(186) |
|
|
|
|
(2,580)
|
| Exchange differences |
|
|
— |
|
|
|
|
|
9 |
|
|
|
|
|
— |
|
|
|
|
9
|
|
As at 31 December 2013 |
|
|
(943) |
|
|
|
|
|
(4,936) |
|
|
|
|
|
(1,111) |
|
|
|
|
(6,990) |
|
Carrying amount as at 31 December 2013
|
|
|
11,037
|
|
|
|
|
|
5,787 |
|
|
|
|
|
1,054 |
|
|
|
|
17,878 |
|
|
|
|
|
|
|
|
|
|
|
|
|
|
|
|
|
|
|
|
|
|
|
Cost: |
|
|
|
|
|
|
|
|
|
|
|
|
|
|
|
|
|
|
|
|
| As at 1 January 2012 |
|
|
7,378
|
|
|
|
|
|
6,246
|
|
|
|
|
|
1,835 |
|
|
|
|
15,459
|
| Additions |
|
|
4,300
|
|
|
|
|
|
2,822
|
|
|
|
|
|
330 |
|
|
|
|
7,452
|
| Disposals |
|
|
— |
|
|
|
|
|
(9) |
|
|
|
|
|
— |
|
|
|
|
(9)
|
| Exchange differences |
|
|
155
|
|
|
|
|
|
— |
|
|
|
|
|
— |
|
|
|
|
155
|
|
As at 31 December 2012 |
|
|
11,833
|
|
|
|
|
|
9,059 |
|
|
|
|
|
2,165 |
|
|
|
|
23,057 |
|
Amortisation: |
|
|
|
|
|
|
|
|
|
|
|
|
|
|
|
|
|
|
|
|
| As at 1 January 2012 |
|
|
(350)
|
|
|
|
|
|
(1,820) |
|
|
|
|
|
(747) |
|
|
|
|
(2,917)
|
| Amortisation |
|
|
(249)
|
|
|
|
|
|
(1,071) |
|
|
|
|
|
(178) |
|
|
|
|
(1,498)
|
| Disposals |
|
|
— |
|
|
|
|
|
9 |
|
|
|
|
|
— |
|
|
|
|
9
|
| Exchange differences |
|
|
(13)
|
|
|
|
|
|
— |
|
|
|
|
|
— |
|
|
|
|
(13)
|
|
As at 31 December 2012 |
|
|
(612) |
|
|
|
|
|
(2,882) |
|
|
|
|
|
(925) |
|
|
|
|
(4,419) |
|
Carrying amount as at 31 December 2012
|
|
|
11,221
|
|
|
|
|
|
6,177 |
|
|
|
|
|
1,240 |
|
|
|
|
18,638 |
Amortisation of intangible assets is disclosed as general and administrative cost in the consolidated income
statement.
|
| 62 / INTERXION ANNUAL REPORT 2014 |
|
|
|
|
|
Consolidated Financial Statements
|
The financial asset consists of a 1.6% equity shareholding in
iStreamPlanet Inc. The financial asset was designated as a financial asset measured at fair value through profit and loss.
| 13 |
TRADE AND OTHER (NON-) CURRENT ASSETS |
|
|
|
|
|
|
|
| |
|
2014
|
|
2013
|
|
2012
|
| |
|
|
|
(€’000) |
|
|
| Non-current
|
|
|
|
|
|
|
| Data-centre-related prepaid expenses |
|
976 |
|
11,500 |
|
— |
| Rental and other supplier deposits |
|
2,714 |
|
2,093 |
|
2,254 |
| Deferred financing costs |
|
995 |
|
1,258 |
|
1,371 |
| Deferred rent related stamp duties |
|
523 |
|
556 |
|
606 |
| Cash flow hedge |
|
— |
|
90 |
|
— |
| Other non-current assets |
|
542 |
|
1,039 |
|
728 |
| |
|
5,750 |
|
16,536 |
|
4,959 |
| As at 31 December 2013, an amount of €11,500,000 was related to cash prepaid to a notary account from which the acquisition of our Brussels data centre building subsequent to year-end has been paid. |
| The deferred financing costs relate to the
costs incurred for the Revolving Facility Agreement. On 17 June 2013, the Company entered into a €100 million revolving facility agreement with ABN AMRO Bank N.V.,
Barclays Bank PLC, Citigroup Global Markets Limited, Credit Suisse AG, Banc of America Securities Limited, as arrangers, the lenders thereunder, Barclays Bank PLC, as agent and Barclays Bank PLC as security trustee. This agreement replaced the €60 million revolving facility agreement. The deferred financing costs balance of 2012 was charged to the income statement in full in 2013 as a result of the refinancing (see also
note 8). |
| On 3 July 2013, in connection with the
issue of the €325 million Senior Secured Notes due 2020, all conditions precedent to the utilisation of this revolving facility agreement were satisfied. In 2012, the Company
amended the terms of its existing Revolving Facility Agreement. The amended facility, originally scheduled to expire on 1 February 2013, extended the termination date to 12 May 2016, expanded the credit commitment from €50 million to €60 million and aligned the incurrence covenants with those contained in the indenture of
the former 9.50% Senior Secured Notes due 2017. The capitalised costs are amortized over the duration period of the facility agreement. |
| |
|
2014
|
|
2013
|
|
2012
|
| |
|
|
|
(€’000) |
|
|
| Current
|
|
|
|
|
|
|
| Trade receivables – net (Note 20) |
|
69,224 |
|
58,405 |
|
51,119 |
| Taxes receivable |
|
2,881 |
|
7,093 |
|
3,052 |
| Accrued revenue |
|
35,104 |
|
21,234 |
|
10,778 |
| Prepaid expenses and other current assets |
|
13,553 |
|
9,971 |
|
9,905 |
| |
|
120,762 |
|
96,703 |
|
74,854 |
Accrued revenue relate to service fee holidays provided in relation to our long-term customer contracts.
Prepaid expenses and other current assets principally comprise accrued income, prepaid insurances, rental and other related
operational data centre and construction-related prepayments.
|
| INTERXION ANNUAL REPORT 2014 / 63 |
|
|
|
|
Consolidated Financial Statements
|
|
|
| 14 |
CASH AND CASH EQUIVALENTS AND SHORT-TERM INVESTMENTS |
Cash and cash equivalents include €5,286,000 (2013: €4,078,000 and 2012:
€5,017,000) that is restricted and held as collateral to support the issuance of bank guarantees on behalf of a number of subsidiary companies.
Short-term investments relate to short-term interest bearing deposit accounts.
SHARE CAPITAL AND SHARE PREMIUM
|
|
|
|
|
|
|
|
|
| |
|
|
|
Ordinary shares
|
|
|
|
|
| |
|
2014 |
|
2013
|
|
2012
|
|
|
| |
|
|
|
(In thousands of shares)
|
|
|
|
|
| On issue at 1 January |
|
68,867 |
|
68,176
|
|
66,129
|
|
|
| Issue/conversion of shares |
|
450 |
|
691
|
|
2,047 |
|
|
|
On issue at 31 December
|
|
69,317
|
|
68,867 |
|
68,176 |
|
|
On 28 January 2011, the Company issued 16,250 thousand new shares (post reverse stock split) at the New
York Stock Exchange under the ticker symbol INXN. On completion of the offering, the Company did a reverse stock split 5:1, which resulted in nominal value of €0.10 per
ordinary shares. The 34,808 thousand Preferred Shares were converted into ordinary shares and the Liquidation Price of €1.00 (post reverse stock split) per Preferred A Share
was either paid out in cash or converted in ordinary shares (3.3 million ordinary shares). In 2014, a total of approximately 0.5 million (2013: 0.7 million, 2012: 2.0 million) options were exercised and restricted and performance shares
were vested.
At 31 December 2014, 2013 and 2012, the authorised share capital comprised 200,000,000 ordinary shares at par value
of €0.10. All issued shares are fully paid.
Voting
On completion of the initial public offering in January 2011, the Company entered into a shareholders’ agreement with
affiliates of Baker Capital. For so long as Baker Capital or its affiliates continue to be the owner of shares representing more than 25% of our outstanding ordinary shares, Baker Capital will have the right to designate for nomination a majority of
the members of our Board of Directors, including the right to nominate the Chairman of our Board of Directors. As a result, these shareholders have, and will continue to have, directly or indirectly, the power, among other things, to affect our
legal and capital structure and our day-to-day operations, as well as the ability to elect and change our management and to approve other changes to our operation. The interests of Baker Capital and its affiliates could conflict with your interests,
particularly if we encounter financial difficulties or are unable to pay our debts when due. Affiliates of Baker Capital also have an interest in pursuing acquisitions, divestitures, financings or other transactions that, in their judgment, could
enhance their equity investments, although such transactions might involve risks to you as a holder of ordinary shares. In addition, Baker Capital or its affiliates may, in the future, own businesses that directly compete with ours or do business
with us. The concentration of ownership may further have the effect of delaying, preventing or deterring a change of control of our Company, could deprive our shareholders of an opportunity to receive a premium for their ordinary shares as part of a
sale of our company and might ultimately affect the market price of our ordinary shares.
As at 31 March 2015, private equity
investment funds affiliated with Baker Capital indirectly own 26.85%, on a fully diluted basis, of Interxion’s equity.
|
| 64 / INTERXION ANNUAL REPORT 2014 |
|
|
|
|
|
Consolidated Financial Statements
|
Foreign currency translation reserve
The foreign currency translation reserve comprises all foreign exchange differences arising from the translation of the financial statements of
foreign operations as well as from the translation of intergroup balances with a permanent nature.
BASIC EARNINGS PER SHARE
The calculation of basic earnings per share at 31 December 2014, was based on the profit of €35,060,000 attributable to ordinary shareholders (2013: €6,824,000 and 2012: €31,631,000) and a weighted average number of ordinary shares outstanding during the year ended 31 December 2014 of 69,048,000 (for the years; 2013: 68,584,000 and 2012:
67,309,000). Profit is attributable to ordinary on an equal basis.
DILUTED EARNINGS PER SHARE
The calculation of diluted earnings per share at 31 December 2014 was based on the profit of €35,060,000 attributable to ordinary shareholders (2013: €6,824,000 and 2012: €31,631,000) and a weighted average number of ordinary shares and the impact of options, restricted share and performance shares outstanding during the year ended 31 December 2014
of 69,922,000 (for the years; 2013: 69,345,000 and 2012: 68,262,000).
In January 2011, the Company issued new shares at the New York
Stock Exchange under the ticker symbol INXN. On completion of the offering, the Company did a reverse stock split 5:1, which resulted in nominal value of €0.10 per ordinary
share. The 5:1 reverse stock split effectuated is presented in the basic earnings per share calculation and the diluted earnings per share calculation.
PROFIT ATTRIBUTABLE TO ORDINARY SHAREHOLDERS
|
|
|
|
|
|
|
| |
|
2014
|
|
2013
|
|
2012
|
| |
|
|
|
(€’000)
|
|
|
|
Profit attributable to ordinary shareholders
|
|
35,060 |
|
6,824 |
|
31,631 |
| WEIGHTED AVERAGE NUMBER OF ORDINARY
SHARES |
| |
|
2014
|
|
2013
|
|
2012
|
| |
|
|
|
(in thousands of shares) |
| Weighted average number of ordinary shares at 31 December |
|
69,048 |
|
68,584 |
|
67,309 |
| Dilution effect of share options, restricted and performance shares on issue |
|
874 |
|
761 |
|
953 |
|
Weighted average number of ordinary (diluted) at 31 December
|
|
69,922 |
|
69,345 |
|
68,262 |
|
| INTERXION ANNUAL REPORT 2014 / 65 |
|
|
|
|
Consolidated Financial Statements
|
|
|
| 17 |
TRADE PAYABLES AND OTHER LIABILITIES |
|
|
|
|
|
|
|
|
|
|
|
| |
|
2014 |
|
|
2013 |
|
|
2012 |
| |
|
|
|
|
(€’000) |
|
|
|
| Non-current |
|
|
|
|
|
|
|
|
|
|
| Deferred revenue |
|
|
4,986 |
|
|
|
4,605 |
|
|
5,014 |
| Other non-current liabilities |
|
|
7,225 |
|
|
|
6,932 |
|
|
6,180 |
| |
|
|
12,211 |
|
|
|
11,537 |
|
|
11,194 |
| Current |
|
|
|
|
|
|
|
|
|
|
| Trade payables |
|
|
23,902 |
|
|
|
28,175 |
|
|
21,087 |
| Tax and social security |
|
|
9,921 |
|
|
|
8,778 |
|
|
10,788 |
| Customer deposits |
|
|
19,286 |
|
|
|
18,507 |
|
|
18,274 |
| Deferred revenue |
|
|
53,246 |
|
|
|
44,550 |
|
|
41,516 |
| Accrued expenses |
|
|
40,147 |
|
|
|
32,083 |
|
|
36,113 |
| |
|
|
146,502 |
|
|
|
132,093 |
|
|
127,778 |
| Trade payables include €13,976,000 (2013: 20,074,000 and 2012 €10,319,000) accounts payable in respect of purchases of property, plant and
equipment. Accrued expenses are analysed as
follows: |
| |
|
2014 |
|
|
2013 |
|
|
2012 |
| |
|
|
|
|
(€’000) |
|
|
|
| Data-centre-related costs |
|
|
9,042 |
|
|
|
7,158 |
|
|
9,959 |
| Personnel and related costs |
|
|
9,381 |
|
|
|
8,769 |
|
|
8,060 |
| Professional services |
|
|
1,857 |
|
|
|
1,824 |
|
|
2,083 |
| Customer implementation and related costs |
|
|
3,689 |
|
|
|
2,199 |
|
|
3,039 |
| Financing-related costs |
|
|
13,414 |
|
|
|
9,994 |
|
|
9,625 |
| Other |
|
|
2,764 |
|
|
|
2,139 |
|
|
3,347 |
| |
|
|
40,147 |
|
|
|
32,083 |
|
|
36,113 |
As at 31 December 2014, the accrued financing-related costs principally relate to interest expenses on the
Senior Secured Notes.
|
| 66 / INTERXION ANNUAL REPORT 2014 |
|
|
|
|
|
Consolidated Financial Statements
|
| 18 |
PROVISION FOR ONEROUS LEASE CONTRACTS |
As at 31 December 2014, the provision for
onerous lease contracts relates to two unused data centre sites in Germany, one in Munich terminating in March 2016 and one in Dusseldorf terminating in August 2016.
The provision is calculated based on the discounted future contracted payments net of any sublease revenues.
|
|
|
|
|
|
|
|
|
|
|
| |
|
2014 |
|
|
2013 |
|
|
2012 |
| |
|
|
|
|
(€’000) |
|
|
|
| As at 1 January |
|
|
8,875 |
|
|
|
11,826 |
|
|
13,726 |
| Increase (decrease) in provision |
|
|
(805) |
|
|
|
— |
|
|
838 |
| Unwinding of discount |
|
|
230 |
|
|
|
334 |
|
|
428 |
| Utilisation of provision |
|
|
(3,366) |
|
|
|
(3,285) |
|
|
(3,166) |
| As at 31 December |
|
|
4,934 |
|
|
|
8,875 |
|
|
11,826 |
| Non-current |
|
|
1,491 |
|
|
|
4,855 |
|
|
7,848 |
| Current |
|
|
3,443 |
|
|
|
4,020 |
|
|
3,978 |
| |
|
|
4,934 |
|
|
|
8,875 |
|
|
11,826 |
| Discounted estimated future losses are
calculated using a discount rate based on the five-year euro-area government benchmark bond yield prevailing at the balance sheet date.
19 BORROWINGS
|
| |
|
2014 |
|
|
2013 |
|
|
2012 |
| |
|
|
|
|
(€’000) |
|
|
|
| Non-current |
|
|
|
|
|
|
|
|
|
|
| Senior Secured Notes 6.0%, due 2020 |
|
|
475,643 |
|
|
|
317,610 |
|
|
— |
| Senior Secured Notes 9.5%, due 2017 |
|
|
— |
|
|
|
— |
|
|
256,268 |
| Mortgages |
|
|
29,141 |
|
|
|
22,524 |
|
|
9,903 |
| Finance lease liabilities |
|
|
34,141 |
|
|
|
20,470 |
|
|
20,309 |
| Other loans |
|
|
1,605 |
|
|
|
1,605 |
|
|
1,605 |
| |
|
|
540,530 |
|
|
|
362,209 |
|
|
288,085 |
| Current |
|
|
|
|
|
|
|
|
|
|
| Mortgages |
|
|
2,346 |
|
|
|
1,733 |
|
|
— |
| Finance lease liabilities |
|
|
18,716 |
|
|
|
50 |
|
|
52 |
| |
|
|
21,062 |
|
|
|
1,783 |
|
|
52 |
| Total borrowings |
|
|
561,592 |
|
|
|
363,992 |
|
|
288,137 |
The carrying amounts of the Group’s borrowings are principally denominated in euros. The face value of the
Senior Secured Notes as at 31 December 2014 was €475,000,000 (2013: €325,000,000 and 2012: €260,000,000).
The face value of the mortgages amounted to €31,993,000 as per 31 December 2014 (2013: €24,833,000 and 2012: €10,000,000).
|
| INTERXION ANNUAL REPORT 2014 / 67 |
|
|
|
|
Consolidated Financial Statements
|
|
|
SENIOR SECURED NOTES AND BANK BORROWINGS
Mortgages
In
November 2012, the Group entered into a five-year mortgage for €10 million. The mortgage is secured by the AMS6 land and data centre buildings with a carrying value of €15,895,000. The loan is subject to a floating interest rate of EURIBOR plus an individual margin of 275 basis points.
In January 2013, the Group completed two mortgage financings totalling €10
million. The loans are secured by mortgages on the PAR3 land, owned by Interxion Real Estate II Sarl, and the PAR5 land, owned by Interxion Real Estate III Sarl, pledges on the lease agreements, and are guaranteed by Interxion France SAS. The
principal amounts on the two loans are to be repaid in quarterly instalments in an aggregate amount of €167,000 commencing on 18 April 2013. The mortgages have a maturity of
fifteen years and have a variable interest rate based on EURIBOR plus an individual margin ranging from 240 to 280 basis points. The interest rates have been fixed for 75% of the principal outstanding amount for a period of 10 years.
In June 2013, the Group completed a €6 million mortgage financing. The
loan is secured by a mortgage on the AMS3 property owned by Interxion Real Estate V B.V. and a pledge on the lease agreement. The principal is to be repaid in annual instalments of
€400,000 commencing 1 May 2014 and a final repayment of €4,400,000 due on 1 May 2018. The mortgage
has a variable interest rate based on EURIBOR plus 275 basis points. The loan contains a minimum of 1.1 debt service capacity covenant ratio based on operations of Interxion Real Estate V B.V.
In April 2014, the Group completed a €9.2 million financing. The
facility is secured by a mortgage on the data centre property in Belgium, which was acquired by Interxion Real Estate IX N.V. on 9 January 2014, a pledge on the lease agreement, and is guaranteed by Interxion Real Estate Holding B.V. The
facility has a maturity of fifteen years and has a variable interest rate based on EURIBOR plus 200 basis points. The principal amount is to be repaid in 59 quarterly instalments of
€153,550 of which the first quarterly instalment was paid on 31 July 2014, and a final repayment is due on 30 April 2029.
These mortgages do not conflict with the restrictions of the Indenture and the Revolving Facility Agreement.
Senior Secured Notes due 2017
On 3 June 2013, the Company announced an offer to purchase for cash any and all of its outstanding euro-denominated €260 million Senior Secured Notes
due 2017.
On 28 June 2013, holders of €256,962,000
aggregate principal amount of the €260 million Senior Secured Notes due 2017, representing 98.8% of the outstanding Notes, had validly tendered their Notes.
The total consideration for each €1,000 principal amount of the €260 million Senior Secured Notes due 2017 validly tendered prior to the consent deadline was €1,102 and after
the consent deadline €1,092 plus the accrued and unpaid interest up to, but not including, the day of settlement.
On 3 July 2013, the tender was completed and the Company discharged its obligations with respect to the remaining €3,038,000 outstanding €260 million Senior Secured Notes due 2017 not purchased in the offer in accordance
with the satisfaction and discharge provisions of the indenture governing the €260 million Senior Secured Notes due 2017. These Notes were redeemed on 2 August 2013 at a
redemption price equal to a “make-whole” amount of €1,094 for each €1,000 principal amount, as
calculated in accordance with the terms of the indenture governing the €260 million Senior Secured Notes due 2017, plus accrued and unpaid interest up to, but not including,
the redemption date.
The total redemption fees amounted to approximately
€26.5 million; in addition, the Company incurred approximately €4.5 million in non-cash expenses from
the deferred financing costs relating to the former €60 million Revolving Facility Agreement and the unamortized costs of the Senior Secured Notes due 2017.
Senior Secured Notes due 2020
On 3 July 2013, the Company issued an aggregate principal amount of €325 million 6.00% Senior Secured Notes due 2020 (the “Senior Secured Notes due
2020”).
The net proceeds of the offering were used to purchase all of the
€260 million Senior Secured Notes due 2017, which were tendered in the offer for those notes and to redeem the
€260 million Senior Secured Notes due 2017 which remained outstanding following the expiration and settlement of the tender offer and consent solicitation, to pay all related
fees, expenses and premiums and for other general corporate purposes.
The
€325 million Senior Secured Notes due 2020 are governed by an indenture dated 3 July 2013, between the Company, as issuer, and The Bank of New York Mellon, London Branch
as Trustee. The indenture contains customary restrictive covenants, including but not limited to limitations or restrictions on our ability to incur debt, grant liens, make restricted payments and sell assets. The restrictive covenants are subject
to customary exceptions and are governed by a consolidated fixed charge ratio to exceed 2.00 and a consolidated senior leverage ratio (net of cash and cash equivalents) not to exceed 4.00.
|
| 68 / INTERXION ANNUAL REPORT 2014 |
|
|
|
|
|
Consolidated Financial Statements
|
The obligations under the
€325 million Senior Secured Notes due 2020 are guaranteed by certain of the Company’s subsidiaries.
On 29 April 2014, the Company completed the issuance of
€150 million aggregate principal amount of its 6.00% Senior Secured Notes due 2020 (the “Additional Notes”). The net proceeds of the offering amount to €157.9 million, net of offering fees and expenses of €2.3 million. The net proceeds reflect the issuance of
the Additional notes at a premium of 106.75 and net of offering fees and expenses. The Additional Notes, which are guaranteed by certain subsidiaries of the Company, were issued under the indenture pursuant to which, on 3 July 2013, the Company
issued €325 million in aggregate principal amount of 6.00% Senior Secured Notes due 2020.
The Company may redeem all or part of the €475 million Senior Secured
Notes due 2020. The Company has the following redemption rights:
Optional Redemption prior to 15 July 2016 upon an equity
offering
At any time prior to 15 July 2016, upon not less than 10 nor more than 60 days’ notice, the Company may on any
one or more occasions redeem up to 35% of the aggregate principal amount of Senior Secured Notes at a redemption price of 106.000% of their principal amount, plus accrued and unpaid interest, if any, to the redemption date, with the net proceeds
from one or more equity offerings. The Company may only do this, however, if:
| |
(a) |
at least 65% of the aggregate principal amount of Senior Secured Notes that were initially issued (calculated after giving effect to the issuance of any additional notes) would remain outstanding
immediately after the proposed redemption; and |
| |
(b) |
the redemption occurs within 90 days after the closing of such equity offering. |
Optional Redemption prior to 15 July 2016
Prior to 15 July 2016, upon not less than 10 nor more than
60 days’ notice, the Company may during each 12-month period commencing on the issue date redeem up to 10% of the aggregate principal amount of the Senior Secured Notes (calculated after giving effect to the issuance of any additional notes) at
a redemption price equal to 103% of the principal amount redeemed plus accrued and unpaid interest, if any, to the redemption date.
At
any time prior to 15 July 2016, upon not less than 10 nor more than 60 days’ notice, the Company may also redeem all or part of the Senior Secured Notes at a redemption price equal to 100% of the principal amount thereof plus the
applicable redemption premium and accrued and unpaid interest to the redemption date.
Optional Redemption on or after 15 July
2016
At any time on or after 15 July 2016 and prior to maturity, upon not less than 10 nor more than 60 days’ notice,
the Company may redeem all or part of the Senior Secured Notes. These redemptions will be in amounts of €100,000 or integral multiples of €1,000 in excess thereof at the following redemption prices (expressed as percentages of their principal amount at maturity), plus accrued and unpaid interest, if any, to the redemption
date, if redeemed during the 12-month period commencing on 15 July of the years set forth below.
|
|
|
| Year |
|
Redemption price |
| 2016 |
|
104.500% |
| 2017 |
|
103.000% |
| 2018 |
|
101.500% |
| 2019 and thereafter |
|
100.000% |
Change of Control
If, at any time, directly or indirectly, a beneficial owner becomes owner of more than 50% of the total voting power of the voting stock of the
Company, a change of control occurs, then the Company shall make an offer to each holder of the Senior Secured Notes to purchase such holder’s Senior Secured Notes, in whole or in part, in a principal amount of €100,000 or in integral multiples of €1,000 in excess thereof at a purchase price in cash equal to 101% of the
principal amount thereof, plus accrued and unpaid interest, if any, to the date of purchase. Reference is made to Note 26 for disclosure on the binding agreement with Telecity Group plc on all-share merger, which is considered as a subsequent event.
€100 Million Revolving Facility Agreement
On 17 June 2013, the Company entered into a new
€100 million revolving facility agreement with ABN AMRO Bank N.V., Barclays Bank PLC, Citigroup Global Markets Limited, Credit Suisse AG, Banc of America Securities Limited,
as arrangers, the lenders thereunder, Barclays Bank PLC, as agent and Barclays Bank PLC as security trustee. This new €100 million revolving facility agreement replaced the €60 million revolving facility agreement.
On 3 July 2013, in
connection with the issue of the €325 million Senior Secured Notes due 2020, all conditions precedent to the utilisation of this revolving facility agreement were satisfied.
|
| INTERXION ANNUAL REPORT 2014 / 69 |
|
|
|
|
Consolidated Financial Statements
|
|
|
Change of control or sale of assets
If there is a sale of all or substantially all of the assets of the Group whether in a single transaction or a series of related transactions; or
a change of control that any beneficial owner gains control of the Company, then a lender under the revolving facility agreement shall not be obliged to fund a loan to the Company.
In addition, if within 30 days of the Company notifying the Agent of a change of control or sale of assets as described above, a lender wishes to
cancel its commitment under the revolving facility agreement as a result of that event, such lender’s commitments will be immediately cancelled and its participation in all outstanding loans shall, together with the accrued and unpaid interest
and all other amounts accrued and outstanding under the agreement, become due and payable within 10 business days of the date on which the relevant lender notifies the agent, unless the Company replaces such lender within such 10 business day
period. Reference is made to Note 26 for disclosure on the binding agreement with Telecity Group plc on all-share merger, which is considered as a subsequent event.
MATURITY PROFILE
The maturity profile of the gross
amounts of Senior Secured Notes and Mortgages is set out below:
|
|
|
|
|
|
|
|
|
|
|
| |
|
2014 |
|
|
2013 |
|
|
2012 |
| |
|
|
|
|
(€’000) |
|
|
|
| Within one year |
|
|
— |
|
|
|
— |
|
|
— |
| Between 1 and 5 years |
|
|
14,266 |
|
|
|
15,333 |
|
|
270,000 |
| Over 5 years |
|
|
492,727 |
|
|
|
334,500 |
|
|
— |
| |
|
|
506,993 |
|
|
|
349,833 |
|
|
270,000 |
| The Group has the following undrawn bank borrowing
facilities: |
|
|
|
|
|
|
|
|
|
|
| |
|
2014 |
|
|
2013 |
|
|
2012 |
| |
|
|
|
|
(€’000) |
|
|
|
| Expiring within one year |
|
|
— |
|
|
|
— |
|
|
— |
| Expiring between 1 and 5 years |
|
|
100,000 |
|
|
|
100,000 |
|
|
60,000 |
| |
|
|
100,000 |
|
|
|
100,000 |
|
|
60,000 |
COVENANTS
The
Revolving Facility Agreement contains various covenants that restrict, among other things and subject to certain exceptions, the ability of the Company and its subsidiaries to:
| |
● |
|
incur debt and/or guarantees; |
| |
● |
|
enter into transactions other than on an arm’s-length basis; |
| |
● |
|
pay dividends or make certain distributions or payments; |
| |
● |
|
engage, in relation to the Company, in any business activity or own assets or incur liabilities not authorised by the Revolving Facility Agreement; |
| |
● |
|
sell certain kinds of assets; |
| |
● |
|
enter into any sale and leaseback transactions; |
| |
● |
|
make certain investments or other types of restricted payments; |
| |
● |
|
substantially change the nature of the Company or the Group’s business; |
| |
● |
|
designate unrestricted subsidiaries; and |
| |
● |
|
effect mergers, consolidations or sale of assets. |
The Revolving Facility also requires the Company to maintain a specified financial ratio. The restrictive covenants are subject to customary
exceptions including, in relation to the incurrence of additional debt, a consolidated fixed charge ratio (calculated as a ratio of adjusted EBITDA to consolidated interest expense) to exceed 2.00 to 1.00 on a pro forma basis for the four full
fiscal quarters (taken as one period) for which financial statements are available immediately preceding the incurrence of such debt and, if such debt is senior debt, a consolidated senior leverage ratio (calculated as a ratio of outstanding senior
debt net of cash and cash equivalents of the Company and its restricted subsidiaries (on a consolidated basis) to pro forma adjusted EBITDA) to be less than 4.00 to 1.00 on a pro forma basis for the four full fiscal quarters (taken as one period)
for which financial statements are available immediately preceding the incurrence of such debt.
|
| 70 / INTERXION ANNUAL REPORT 2014 |
|
|
|
|
|
Consolidated Financial Statements
|
The Revolving Facility Agreement also includes a leverage ratio financial covenant (tested on a
quarterly basis) requiring total net debt (calculated as a ratio to pro forma EBITDA) not to exceed a leverage ratio of 4.00 to 1.00. In addition, the Company must ensure, under the Revolving Facility Agreement, that the guarantors represent a
certain percentage of adjusted EBITDA of the Group as a whole and a certain percentage of the consolidated net assets of the Group as a whole. Our ability to meet these covenants may be affected by events beyond our control and, as a result, we
cannot assure you that we will be able to meet the covenants. In the event of a default under our Revolving Facility, the lenders could terminate their commitments and declare all amounts owed to them to be due and payable. Borrowings under other
debt instruments that contain cross acceleration or cross default provisions, including the Senior Secured Notes, may as a result also be accelerated and become due and payable.
The breach of any of these covenants by the Company or the failure by the Company to maintain its leverage ratio could result in a default under
the Revolving Facility Agreement. As of 31 December 2014, the Company was in compliance with all covenants in the Revolving Facility Agreement. In addition, the Company does not anticipate any such breach or failure and believes that its
ability to borrow funds under the Revolving Facility Agreement will not be adversely affected by the covenants in the next 12 months.
The Senior Secured Notes due 2020 Indenture contains covenants for the benefit of the holders of the Notes that restrict, among other things and
subject to certain exceptions, the ability of the Company and its subsidiaries to:
| |
● |
|
enter into certain transactions with, or for the benefit of, an affiliate; |
| |
● |
|
create or incur certain liens; |
| |
● |
|
incur changes in control; |
| |
● |
|
pay dividends or make certain distributions or payments; |
| |
● |
|
engage in any business activity not authorised by the Indenture; |
| |
● |
|
sell certain kinds of assets; |
| |
● |
|
impair any security interest on the assets serving as collateral for the Notes; |
| |
● |
|
enter into any sale and leaseback transaction; |
| |
● |
|
make certain investments or other types of restricted payments; |
| |
● |
|
designate unrestricted subsidiaries; |
| |
● |
|
effect mergers, consolidations or sale of assets; and |
| |
● |
|
guarantees certain debt. |
The restrictive covenants are subject to
customary exceptions and are governed by a consolidated fixed-charge ratio to exceed 2.00 and a consolidated senior leverage ratio (net of cash and cash equivalents) not to exceed 4.00.
The breach of any of these covenants by the Company could result in a default under the Indenture. As of 31 December 2014, the Company was in
compliance with all covenants in the Indenture.
Interxion remained in full compliance with all its debt covenants. The Company’s
consolidated fixed charge ratio stood at 4.36 (2013: 5.40) and both the net debt ratio and the leverage ratio financial covenant stood at 3.24 (2013: 2.48).
|
| INTERXION ANNUAL REPORT 2014 / 71 |
|
|
|
|
Consolidated Financial Statements
|
|
|
FINANCIAL LEASE LIABILITIES
Financial lease liabilities relate to the acquisition of property, plant and equipment with the following repayment schedule:
|
|
|
|
|
|
|
|
|
|
|
| |
|
2014 |
|
|
2013 |
|
|
2012 |
| |
|
|
|
|
(€’000)
|
|
|
|
| Gross lease liabilities: |
|
|
|
|
|
|
|
|
|
|
| Within one year |
|
|
21,604 |
|
|
|
1,726 |
|
|
1,659 |
| Between 1 and 5 years |
|
|
31,964 |
|
|
|
7,492 |
|
|
7,215 |
| More than 5 years |
|
|
21,280 |
|
|
|
21,443 |
|
|
23,442 |
| |
|
|
74,848 |
|
|
|
30,661 |
|
|
32,316 |
| Future interest payments |
|
|
(21,991) |
|
|
|
(10,141) |
|
|
(11,955) |
| Present value of minimum lease payments |
|
|
52,857 |
|
|
|
20,520 |
|
|
20,361 |
In November 2014, the Group agreed to purchase the VIE data centre land and building. As a result of this
modification, in accordance with IAS17, as of November 2014, the lease, which was previously reported as an operating lease is reported as a financial lease. The carrying amount of the land amounts to €8,619,000, the carrying value of the building amounted to €10,097,000. The actual legal transfer was effectuated
in January 2015.
In August 2014, the Group exercised its option to purchase the AMS7 data centre land and building. The actual legal
transaction will become effective in 2023. As a result of this modification, in accordance with IAS17, as of 22 August 2014, the lease, which was previously reported as an operating lease is reported as a financial lease. The carrying amount of
the land amounts to €5,800,000, the carrying value of the building amounted to €7,600,000 as per exercise
date. The actual legal transaction will become effective in 2023.
In December 2012, the Group exercised its option to purchase the
PAR7 data centre land. The actual legal transaction will come into effect in 2019. As a result of this modification, in accordance with IAS17, as of 20 December 2012, the lease, which was previously reported as an operating lease is treated as
a financial lease. The carrying amount of the land amounts to €20,832,000.
Other
loans
The Group has a loan facility with the landlord of one of its unused data centre sites in Germany to allow the Group to invest in
improvements to the building to meet the requirements of sub-lessees. The non-current loan bears interest at 6% per annum and is repayable at the end of the lease term. As at 31 December 2014, the balance of the landlord loan was €1,605,000 (2013 and 2012: €1,605,000).
72 / INTERXION ANNUAL REPORT 2014
|
|
|
|
|
Consolidated Financial Statements
|
CREDIT RISK
Exposure to credit risk
The carrying amount of financial assets represents the maximum credit exposure. The maximum exposure to credit risk at the reporting date was:
|
|
|
|
|
|
|
|
|
|
|
| |
|
2014 |
|
|
2013 |
|
|
2012 |
| |
|
|
|
|
(€’000)
|
|
|
|
| Trade receivables |
|
|
69,224 |
|
|
|
58,405 |
|
|
51,119 |
| Accrued revenue |
|
|
35,104 |
|
|
|
21,234 |
|
|
10,778 |
| Rental and other supplier deposits |
|
|
2,714 |
|
|
|
2,093 |
|
|
2,254 |
| Cash and cash equivalents |
|
|
99,923 |
|
|
|
45,690 |
|
|
68,692 |
| |
|
|
206,965 |
|
|
|
127,422 |
|
|
132,843 |
The Group seeks to minimise the risk related to cash and cash equivalents by holding cash as widely as possible
across multiple bank institutions. Term risk is limited to deposits of no more than two weeks. The Group monitors its cash position, including counterparty and term risk, daily.
The Group seeks to minimise the credit risk related to customers by analysing new customers individually for creditworthiness before it begins to
trade. If customers are independently rated, these ratings are used. If, there is no independent rating, the credit quality of the customer is analysed taking its financial position, past experience and other factors into account.
The Group’s largest financial asset balance exposed to credit risk is with a financial institution, one of the Company’s relationships
banks, which accounts for approximately 39% of the total balance exposed to credit risk as at 31 December 2014.
The Group’s
largest customer balance exposed to credit risk is with a customer, serviced from multiple locations under multiple service contracts, which accounts for approximately 16% of the total balance exposed to credit risk as at 31 December 2014.
The maximum credit exposure on the trade receivables is limited by the deferred revenue balance of €58,232,000 as presented in Note 17 (2013: €49,155,000 and 2012: €46,530,000).
The exposure to credit risk for trade receivables at
the reporting date by geographic region was:
|
|
|
|
|
|
|
|
|
|
|
| |
|
2014 |
|
|
2013 |
|
|
2012 |
| |
|
|
|
|
(€’000)
|
|
|
|
| UK, France, Germany and the Netherlands |
|
|
55,121 |
|
|
|
44,025 |
|
|
36,960 |
| Rest of Europe |
|
|
14,103 |
|
|
|
14,380 |
|
|
14,159 |
| |
|
|
69,224 |
|
|
|
58,405 |
|
|
51,119 |
The aging of trade receivables as at the reporting date was:
|
|
|
|
|
|
|
|
|
|
|
|
|
|
|
|
|
|
|
|
|
|
|
| |
|
2014 |
|
|
2013 |
|
|
2012 |
| |
|
Gross |
|
|
Allowance |
|
|
Gross |
|
|
Allowance |
|
|
Gross |
|
|
Allowance |
| |
|
|
|
|
|
|
|
(€’000)
|
|
|
|
|
|
|
| Not past due |
|
|
57,009 |
|
|
|
— |
|
|
|
50,061 |
|
|
|
— |
|
|
|
42,184 |
|
|
— |
| Past due 1–30 days |
|
|
7,511 |
|
|
|
— |
|
|
|
4,312 |
|
|
|
— |
|
|
|
5,369 |
|
|
— |
| Past due 31–120 days |
|
|
3,640 |
|
|
|
91 |
|
|
|
3,540 |
|
|
|
— |
|
|
|
2,913 |
|
|
39 |
| Past due 121 days–1 year |
|
|
1,262 |
|
|
|
122 |
|
|
|
361 |
|
|
|
— |
|
|
|
763 |
|
|
108 |
| More than 1 year |
|
|
75 |
|
|
|
60 |
|
|
|
370 |
|
|
|
239 |
|
|
|
219 |
|
|
182 |
| |
|
|
69,497 |
|
|
|
273 |
|
|
|
58,644 |
|
|
|
239 |
|
|
|
51,448 |
|
|
329 |
|
| INTERXION ANNUAL REPORT 2014 / 73 |
|
|
|
|
Consolidated Financial Statements
|
|
|
The movement in the allowance for impairment in respect of trade receivables during the year was
as follows:
|
|
|
|
|
|
|
|
|
|
|
| |
|
2014 |
|
|
2013 |
|
|
2012 |
| |
|
|
|
|
(€’000)
|
|
|
|
| Balance as at 1 January |
|
|
239 |
|
|
|
329 |
|
|
617 |
| Impairment loss recognised |
|
|
219 |
|
|
|
156 |
|
|
372 |
| Write-offs |
|
|
(185) |
|
|
|
(246) |
|
|
(660) |
| Balance as at 31 December |
|
|
273 |
|
|
|
239 |
|
|
329 |
Based on historic default rates, the Group believes that no impairment allowance is necessary in respect of trade
receivables other than those that have been specifically provided for.
LIQUIDITY RISK
The following are the contractual maturities of financial liabilities, including interest payments and excluding the impact of netting
agreements.
|
|
|
|
|
|
|
|
|
|
|
|
|
|
|
|
|
|
|
| |
|
Carrying |
|
|
Contractual |
|
|
Less than |
|
|
Between |
|
|
More than |
| |
|
amount |
|
|
cash flows |
|
|
1 year |
|
|
1-5 years |
|
|
5 years |
| |
|
|
|
|
|
|
|
(€’000) |
|
|
|
|
|
|
| 31 DECEMBER 2014 |
|
|
|
|
|
|
|
|
|
|
|
|
|
|
|
|
|
|
|
Financial liabilities |
|
|
|
|
|
|
|
|
|
|
|
|
|
|
|
|
|
|
| Senior Secured Notes |
|
|
475,643 |
|
|
|
646,000 |
|
|
|
28,500 |
|
|
|
114,000 |
|
|
503,500 |
| Finance lease liabilities |
|
|
52,857 |
|
|
|
74,848 |
|
|
|
21,604 |
|
|
|
31,964 |
|
|
21,280 |
| Mortgages |
|
|
31,487 |
|
|
|
36,783 |
|
|
|
3,246 |
|
|
|
20,767 |
|
|
12,770 |
| Other loans |
|
|
1,605 |
|
|
|
1,726 |
|
|
|
96 |
|
|
|
1,630 |
|
|
— |
| Trade and other payables(1) |
|
|
81,919 |
|
|
|
81,919 |
|
|
|
81,919 |
|
|
|
— |
|
|
— |
| |
|
|
643,511 |
|
|
|
841,276 |
|
|
|
135,365 |
|
|
|
168,361 |
|
|
537,550 |
| 31 DECEMBER
2013 |
|
|
|
|
|
|
|
|
|
|
|
|
|
|
|
|
|
|
|
Financial liabilities |
|
|
|
|
|
|
|
|
|
|
|
|
|
|
|
|
|
|
| Senior Secured Notes |
|
|
317,610 |
|
|
|
462,150 |
|
|
|
20,150 |
|
|
|
78,000 |
|
|
364,000 |
| Finance lease liabilities |
|
|
20,520 |
|
|
|
30,661 |
|
|
|
1,726 |
|
|
|
7,492 |
|
|
21,443 |
| Mortgages |
|
|
24,257 |
|
|
|
29,148 |
|
|
|
2,552 |
|
|
|
19,398 |
|
|
7,198 |
| Other loans |
|
|
1,605 |
|
|
|
1,822 |
|
|
|
96 |
|
|
|
1,726 |
|
|
— |
| Trade and other
payables(1) |
|
|
80,225 |
|
|
|
80,225 |
|
|
|
80,225 |
|
|
|
— |
|
|
— |
| |
|
|
444,217 |
|
|
|
604,006 |
|
|
|
104,749 |
|
|
|
106,616 |
|
|
392,641 |
| 31 DECEMBER
2012 |
|
|
|
|
|
|
|
|
|
|
|
|
|
|
|
|
|
|
|
Financial liabilities |
|
|
|
|
|
|
|
|
|
|
|
|
|
|
|
|
|
|
| Senior Secured Notes |
|
|
256,268 |
|
|
|
371,150 |
|
|
|
24,700 |
|
|
|
346,450 |
|
|
— |
| Finance lease liabilities |
|
|
20,361 |
|
|
|
32,316 |
|
|
|
1,659 |
|
|
|
7,215 |
|
|
23,442 |
| Mortgages |
|
|
9,903 |
|
|
|
11,327 |
|
|
|
938 |
|
|
|
10,389 |
|
|
— |
| Other loans |
|
|
1,605 |
|
|
|
1,918 |
|
|
|
96 |
|
|
|
1,822 |
|
|
— |
| Trade and other
payables(1) |
|
|
88,517 |
|
|
|
88,517 |
|
|
|
88,517 |
|
|
|
— |
|
|
— |
| |
|
|
376,654 |
|
|
|
505,228 |
|
|
|
115,910 |
|
|
|
365,876 |
|
|
23,442 |
Notes:
(1) Excludes deferred revenues and rental holidays. Accrued interest on Senior Secured Notes and mortgages is classified under the respective liability category.
|
| 74 / INTERXION ANNUAL REPORT 2014 |
|
|
|
|
|
Consolidated Financial Statements
|
MARKET RISK
Exposure to currency risk
The following significant exchange rates applied during the year:
|
|
|
|
|
|
|
|
|
|
|
|
|
|
|
|
|
|
|
|
|
|
|
| |
|
Average rate |
|
|
Report date mid-spot rate |
| |
|
(EUR) |
|
|
(EUR) |
| |
|
2014 |
|
|
2013 |
|
|
2012 |
|
|
2014 |
|
|
2013 |
|
|
2012 |
| |
|
|
|
|
|
|
|
|
|
|
|
|
|
|
|
|
|
|
|
|
|
|
| GBP 1 |
|
|
1.241 |
|
|
|
1.179 |
|
|
|
1.233 |
|
|
|
1.278 |
|
|
|
1.198 |
|
|
1.222 |
| CHF 1 |
|
|
0.823 |
|
|
|
0.813 |
|
|
|
0.830 |
|
|
|
0.831 |
|
|
|
0.816 |
|
|
0.828 |
| DKK 1 |
|
|
0.134 |
|
|
|
0.134 |
|
|
|
0.134 |
|
|
|
0.134 |
|
|
|
0.134 |
|
|
0.134 |
| SEK 1 |
|
|
0.110 |
|
|
|
0.116 |
|
|
|
0.115 |
|
|
|
0.105 |
|
|
|
0.113 |
|
|
0.116 |
Sensitivity analysis
A 10% strengthening of the euro against the following currencies at 31 December would have increased (decreased) equity and profit or loss by
approximately the amounts shown below. This analysis assumes that all other variables, in particular interest rates, remained constant and was performed on the same basis for 2013 and 2012.
|
|
|
|
|
|
|
|
|
| |
|
Equity |
|
|
Profit or loss |
|
| |
|
(€’000) |
|
| 31 December 2014 |
|
|
|
|
|
|
|
|
| GBP |
|
|
(2,415 |
) |
|
|
(903 |
) |
| CHF |
|
|
(4,138 |
) |
|
|
(23 |
) |
| DKK |
|
|
(1,763 |
) |
|
|
(155 |
) |
| SEK |
|
|
(212 |
) |
|
|
117 |
|
|
31 December 2013 |
|
|
|
|
|
|
|
|
| GBP |
|
|
(1,337 |
) |
|
|
(420 |
) |
| CHF |
|
|
(4,015 |
) |
|
|
(23 |
) |
| DKK |
|
|
(1,587 |
) |
|
|
(148 |
) |
| SEK |
|
|
(345 |
) |
|
|
32 |
|
|
31 December 2012 |
|
|
|
|
|
|
|
|
| GBP |
|
|
(849 |
) |
|
|
(622 |
) |
| CHF |
|
|
(1,192 |
) |
|
|
146 |
|
| DKK |
|
|
(1,434 |
) |
|
|
(149 |
) |
| SEK |
|
|
(390 |
) |
|
|
43 |
|
A 10% weakening of the euro against the above currencies at 31 December would have had the equal, but
opposite, effect to the amounts shown above, on the basis that all other variables remained constant.
INTERXION ANNUAL REPORT
2014 / 75
|
|
|
|
Consolidated Financial Statements
|
|
|
Interest rate risk
Profile
At the reporting
date, the interest rate profile of the Group’s interest-bearing financial instruments was:
|
|
|
|
|
|
|
|
|
|
|
| |
|
Carrying amount |
| |
|
2014 |
|
|
2013 |
|
|
2012 |
| |
|
|
|
|
(€’000) |
|
|
|
| Fixed-rate instrument |
|
|
|
|
|
|
|
|
|
|
| Senior Secured Notes |
|
|
475,643 |
|
|
|
317,610 |
|
|
256,268 |
| Finance lease liabilities |
|
|
52,857 |
|
|
|
20,520 |
|
|
20,361 |
| Mortgages |
|
|
6,341 |
|
|
|
6,801 |
|
|
— |
| Other loans |
|
|
1,605 |
|
|
|
1,605 |
|
|
1,605 |
| |
|
|
536,446 |
|
|
|
346,536 |
|
|
278,234 |
| Variable-rate instruments |
|
|
|
|
|
|
|
|
|
|
| Mortgages |
|
|
25,146 |
|
|
|
17,456 |
|
|
9,903 |
| |
|
|
561,592 |
|
|
|
363,992 |
|
|
288,137 |
The mortgages on the PAR3 land, owned by Interxion Real Estate II Sarl, and the PAR5 land, owned by Interxion
Real Estate III Sarl have variable interest rates based on EURIBOR plus an individual margin ranging from 240 to 280 basis points. The interest rates have been fixed for 75% of the principal outstanding amount for a period of ten years, which has
been reflected in the table above.
Cash flow sensitivity analysis for fixed-rate instruments
The Group does not account for any fixed-rate financial assets and liabilities at fair value through profit and loss, and does not designate
derivatives (interest rate swaps) as hedging instruments under a fair value hedge accounting model. Therefore a change in interest rates at the end of the reporting period would not affect profit or loss.
Cash flow sensitivity analysis for variable rate instruments
A change of 100 basis points in interest rates payable at the reporting date would have increased (decreased) equity and profit or loss by the
amounts shown below. This analysis assumes that all other variables, in particular foreign currency rates, remained constant.
|
|
|
|
|
|
|
|
|
|
|
|
|
|
|
|
|
|
|
|
|
| |
|
Profit or loss |
|
Equity |
| |
|
100 bp increase |
|
100 bp decrease |
|
100 bp increase |
|
100 bp decrease |
| |
|
(€’000) |
| 31 December 2014 |
|
|
|
|
|
|
|
|
|
|
|
|
|
|
|
|
|
|
|
|
| Variable-rate instruments |
|
|
|
(251 |
) |
|
|
|
251 |
|
|
|
|
(91 |
) |
|
|
|
91 |
|
| |
|
|
|
|
|
|
|
|
|
|
|
|
|
|
|
|
|
|
|
|
| 31 December 2013 |
|
|
|
|
|
|
|
|
|
|
|
|
|
|
|
|
|
|
|
|
| Variable-rate instruments |
|
|
|
(152 |
) |
|
|
|
152 |
|
|
|
|
(51 |
) |
|
|
|
51 |
|
| |
|
|
|
|
|
|
|
|
|
|
|
|
|
|
|
|
|
|
|
|
| 31 December 2012 |
|
|
|
|
|
|
|
|
|
|
|
|
|
|
|
|
|
|
|
|
| Variable-rate instruments |
|
|
|
(40) |
|
|
|
|
40 |
|
|
|
|
— |
|
|
|
|
— |
|
FAIR VALUES AND HIERARCHY
Fair values versus carrying amounts
As of 31 December 2014, the market price of the 6.00% Senior Secured Notes due 2020 was 105.005 (2013: 106.51 and 2012: not applicable). Using this market price, the fair value of the Senior Secured Notes due 2020 would have
been approximately €499 million, compared with its nominal value of €475 million. In 2013 the value of
the notes was €346 million compared with a nominal value of €325 million.
76 / INTERXION ANNUAL REPORT 2014
|
|
|
|
|
Consolidated Financial Statements
|
At 31 December 2014, the Group had a financial asset carried at fair value, its investment
in iStreamPlanet Inc. Furthermore the Group had a cash flow hedge carried at a negative fair value, to hedge the interest rate risk of part of two mortgages.
As of 31 December 2014, the fair value of all mortgages would have been equal to their carrying amount of €31.5 million. As of 31 December 2014, the fair value of the financial lease liabilities would have been
€60.2 million compared with its carrying amount of €52.9 million.
Fair value hierarchy
The
Company regularly reviews significant unobservable inputs and valuation adjustments. If third party information, such as broker quotes or pricing services, is used to measure fair values, then the Company assesses the evidence obtained from the
third parties to support the conclusion that such valuations meet the requirements of IFRS, including the level in the fair value hierarchy in which such valuations should be classified. Significant valuation issues are reported to the
Company’s Audit Committee.
When measuring the fair value of an asset or a liability, the Company uses observable market data as
far as possible. Fair values are categorised into different levels in a fair value hierarchy based on the inputs used in the valuation techniques as follows:
|
|
|
| Level 1: |
|
quoted prices (unadjusted) in active markets for identical assets or liabilities |
|
|
| Level 2: |
|
inputs other than quoted prices included within Level 1 that are observable for the asset or liability, either directly (i.e. as prices) or indirectly (i.e. derived from prices) |
|
|
| Level 3: |
|
inputs for the asset or liability that are not based on observable market data (unobservable inputs). |
If the inputs used to measure the fair value of an asset or a liability fall into different levels of the fair
value hierarchy, then the fair value measurement is categorised in its entirety in the same level of the fair value hierarchy as the lowest level input that is significant to the entire measurement. The Company recognises transfers between levels of
the fair value hierarchy at the end of the reporting period during which the change has occurred.
The values of the instruments are:
|
|
|
|
|
|
|
|
|
|
|
|
|
|
|
|
|
| |
|
Carrying value |
|
|
|
|
Fair value |
| |
|
|
|
|
|
|
Level 1 |
|
|
Level 2 |
|
|
Level 3 |
| |
|
|
|
|
|
|
|
|
|
(€’000) |
|
|
|
| 31 December 2014 |
|
|
|
|
|
|
|
|
|
|
|
|
|
|
|
|
| Senior secured notes 6.00% due 2020 |
|
|
(475,643) |
|
|
|
|
|
(499,000 |
) |
|
|
— |
|
|
— |
| Finance leases |
|
|
(52,857) |
|
|
|
|
|
— |
|
|
|
(60,200 |
) |
|
— |
| Mortgages |
|
|
(31,487) |
|
|
|
|
|
— |
|
|
|
(31,487 |
) |
|
— |
| Interest rate swap |
|
|
(368) |
|
|
|
|
|
— |
|
|
|
(368 |
) |
|
— |
| Financial asset |
|
|
774 |
|
|
|
|
|
— |
|
|
|
— |
|
|
774 |
| |
|
|
|
|
|
|
|
|
|
|
|
|
|
|
|
|
| 31 December 2013 |
|
|
|
|
|
|
|
|
|
|
|
|
|
|
|
|
| Senior secured notes 6.00% due 2020 |
|
|
(317,610) |
|
|
|
|
|
(346,000 |
) |
|
|
— |
|
|
— |
| Finance leases |
|
|
(20,520) |
|
|
|
|
|
— |
|
|
|
(23,200 |
) |
|
— |
| Mortgages |
|
|
(24,257) |
|
|
|
|
|
— |
|
|
|
(24,257 |
) |
|
— |
| Interest rate swap |
|
|
90 |
|
|
|
|
|
— |
|
|
|
90 |
|
|
— |
| Financial asset |
|
|
774 |
|
|
|
|
|
— |
|
|
|
— |
|
|
774 |
| |
|
|
|
|
|
|
|
|
|
|
|
|
|
|
|
|
| 31 December 2012 |
|
|
|
|
|
|
|
|
|
|
|
|
|
|
|
|
| Senior secured notes 9.50% due 2017 |
|
|
(256,268) |
|
|
|
|
|
(291,000 |
) |
|
|
— |
|
|
— |
| Finance leases |
|
|
(20,361) |
|
|
|
|
|
— |
|
|
|
(19,800 |
) |
|
— |
| Mortgages |
|
|
(9,903) |
|
|
|
|
|
— |
|
|
|
(9,903 |
) |
|
— |
| Financial asset |
|
|
774 |
|
|
|
|
|
— |
|
|
|
— |
|
|
774 |
No changes in levels of hierarchy, or transfers between levels, occurred in the reporting period. Fair values
were obtained from quoted market prices in active markets or, where no active market exists, by using valuation techniques. Valuation techniques include discounted cash flow models using inputs as market interest rates and cash flows.
|
| INTERXION ANNUAL REPORT 2014 / 77 |
|
|
|
|
Consolidated Financial Statements
|
|
|
Capital management
The Board’s policy is to maintain a strong capital base so as to maintain investor, creditor and market confidence and to sustain future
development of the business. The Board of Directors monitors the return on capital.
The Group’s net debt to equity ratio at the
reporting date was as follows:
|
|
|
|
|
|
|
|
|
|
|
|
|
|
|
| |
|
2014 |
|
|
|
|
2013 |
|
|
|
|
2012 |
| |
|
|
|
|
|
|
|
|
(€’000) |
|
|
|
|
|
| Net debt |
|
|
|
|
|
|
|
|
|
|
|
|
|
|
| Total liabilities |
|
|
736,958 |
|
|
|
|
|
522,873 |
|
|
|
|
443,650 |
| Less: cash |
|
|
(99,923) |
|
|
|
|
|
(45,690) |
|
|
|
|
(68,692) |
| |
|
|
637,035 |
|
|
|
|
|
477,183 |
|
|
|
|
374,958 |
| Equity |
|
|
|
|
|
|
|
|
|
|
|
|
|
|
| Total equity |
|
|
436,145 |
|
|
|
|
|
387,902 |
|
|
|
|
375,574 |
| Net debt to equity ratio |
|
|
1.46 |
|
|
|
|
|
1.23 |
|
|
|
|
1.00 |
SUMMARY OF OUTSTANDING OPTIONS AND RESTRICTED SHARES
Share options to acquire a fixed number of shares are granted to employees and others based on a number of factors. The exercise
price is fixed at the date of the grant. The numbers of options listed below are post the reverse stock split 5:1, which was effected on completion of the initial public offering on 28 January 2011.
The terms and conditions of the grants, post reverse stock split, under the 2008 Option Plan with a euro exercise price, were as follows:
|
|
|
|
|
|
|
|
|
|
|
|
|
|
|
|
|
|
| Grant date |
|
Employees entitled |
|
Exercise |
|
Options granted |
|
Options granted |
| |
|
|
|
price |
|
outstanding |
|
outstanding, |
| |
|
|
|
|
|
|
|
vested |
| |
|
|
|
(in €) |
|
(In thousands) |
|
(In thousands) |
| 2010 |
|
Senior employees |
|
|
|
6.5-7.50 |
|
|
|
|
14 |
|
|
|
|
14 |
|
| |
|
Total share options |
|
|
|
|
|
|
|
|
14 |
|
|
|
|
14 |
|
| The terms and conditions of the grants, post
reverse stock split, under the 2011 and 2013 Option Plans with an USD exercise price, were as follows: |
|
| Grant date |
|
Employees entitled |
|
Exercise |
|
Outstanding |
|
Exercisable |
| |
|
|
|
price |
|
|
|
|
| |
|
|
|
|
|
|
|
|
| |
|
|
|
(in $) |
|
(in thousands) |
|
(in thousands) |
| 2011 |
|
Key management (Executive Director) |
|
|
|
14.74 |
|
|
|
|
600 |
|
|
|
|
600 |
|
| |
|
Non-executive Directors |
|
|
|
13.00 |
|
|
|
|
15 |
|
|
|
|
15 |
|
| |
|
Senior employees |
|
|
|
10.00-14.65 |
|
|
|
|
423 |
|
|
|
|
296 |
|
| 2012 |
|
Key management |
|
|
|
10.00-11.50 |
|
|
|
|
160 |
|
|
|
|
70 |
|
| |
|
Senior employees |
|
|
|
13.67-22.64 |
|
|
|
|
119 |
|
|
|
|
54 |
|
| 2013 |
|
Key management |
|
|
|
10.00 |
|
|
|
|
15 |
|
|
|
|
4 |
|
| |
|
Non-executive Directors |
|
|
|
18.01 |
|
|
|
|
10 |
|
|
|
|
10 |
|
| |
|
Senior employees |
|
|
|
15.00-18.00 |
|
|
|
|
122 |
|
|
|
|
37 |
|
| 2014 |
|
Senior employees |
|
|
|
17.50-23.25 |
|
|
|
|
177 |
|
|
|
|
46 |
|
| |
|
Total share options |
|
|
|
|
|
|
|
|
1,641 |
|
|
|
|
1,132 |
|
Share options granted before the year 2012, under the 2008 Option Plan, vest over four years and can be exercised
up to five years after the date of grant. Share options granted from 2011 forward, under the 2011 and 2013 Option Plans generally, vest over four years and can be exercised up to eight years after the date of grant. The options granted in 2011 to
the Company’s Executive Director, Non-executive Directors and certain employees as well as the options granted in 2012 to the Non-executive Directors have an accelerated vesting term.
78 / INTERXION ANNUAL REPORT 2014
|
|
|
|
|
Consolidated Financial Statements
|
The number and weighted average exercise prices of outstanding share options, post reverse stock
split, under the 2008 Option Plan with euro exercise prices are as follows:
|
|
|
|
|
|
|
|
|
|
|
|
|
| |
|
Weighted average exercise price in € |
|
Number of options in thousands |
| |
|
2014 |
|
2013 |
|
2012 |
|
2014 |
|
2013 |
|
2012 |
| Outstanding at 1 January |
|
5.46 |
|
4.98 |
|
3.94 |
|
112 |
|
597 |
|
2,554 |
| Granted |
|
— |
|
— |
|
— |
|
— |
|
— |
|
— |
| Exercised |
|
5.05 |
|
4.79 |
|
3.61 |
|
(94) |
|
(458) |
|
(1,939) |
| Expired |
|
— |
|
— |
|
— |
|
— |
|
— |
|
— |
| Forfeited |
|
6.50 |
|
6.12 |
|
5.22 |
|
(4) |
|
(27) |
|
(18) |
| Outstanding – 31 December |
|
7.19 |
|
5.46 |
|
4.98 |
|
14 |
|
112 |
|
597 |
| Exercisable – 31 December |
|
7.19 |
|
5.36 |
|
4.76 |
|
14 |
|
92 |
|
456 |
| The number and weighted average exercise
prices of outstanding share options, post-reverse stock split, under the 2011 and 2013 Option Plans, excluding the 12,282 restricted shares, with US dollar exercise prices are as follows: |
|
|
|
| |
|
Weighted average exercise price in $ |
|
Number of options in thousands |
| |
|
2014 |
|
2013 |
|
2012 |
|
2014 |
|
2013 |
|
2012 |
| Outstanding at 1 January |
|
14.13 |
|
13.64 |
|
13.65 |
|
1,792 |
|
1,818 |
|
1,336 |
| Granted |
|
18.46 |
|
16.75 |
|
13.43 |
|
180 |
|
247 |
|
609 |
| Exercised |
|
14.60 |
|
13.11 |
|
12.76 |
|
(266) |
|
(233) |
|
(92) |
| Expired |
|
— |
|
— |
|
— |
|
— |
|
— |
|
— |
| Forfeited |
|
18.71 |
|
13.86 |
|
13.00 |
|
(65) |
|
(41) |
|
(35) |
| Outstanding – 31 December |
|
14.35 |
|
14.13 |
|
13.64 |
|
1,641 |
|
1,792 |
|
1,818 |
| Exercisable – 31 December |
|
14.17 |
|
14.05 |
|
14.01 |
|
1,132 |
|
972 |
|
666 |
The options outstanding at 31 December 2014 have a weighted average remaining contractual life of 5.1 years
(2013: 5.7 years and 2012: 5.5 years).
The General Meeting of Shareholders held on 30 June 2014 approved the award to each
Non-executive Director of restricted shares equivalent to a value of €40,000 under the terms and conditions of the Company’s 2013 Amended International Equity Based Incentive
Plan (the “2013 Option Plan”) and containing the following key terms:
| |
● |
|
the number of restricted shares will be set on the basis of the Company’s share value at the closing of the New York Stock Exchange on the day of this Annual General Meeting;
|
| |
● |
|
all of these restricted shares will vest on the day of the next Annual General Meeting; |
| |
● |
|
the restricted shares will be locked up (be non-exercisable) for a period that will end three years from the date of award or on the date the Non-executive Director ceases to be a director of the
Company, whichever is sooner; |
| |
● |
|
on change of control, these restricted shares may vest immediately and any lock provisions will expire. Reference is made to Note 26 for disclosure on the binding agreement with Telecity Group plc.
on all-share merger, which is considered as a subsequent event. |
For the services to be delivered in the AGM year
2014-2015 (the period from June 2014 until the next year’s Annual General Meeting of Shareholders, currently anticipated to be held in June 2015), a total of 11,976 restricted shares were awarded to the Non-executive Directors (1,996 restricted
shares each). These restricted shares outstanding were awarded at a share price of $27.38 and with an exercise price of nil. As at 31 December 2014, the restricted shares are unvested and are scheduled to vest and be issued at the next Annual
General Meeting of Shareholders, which we anticipate will be held in June 2015.
For the services delivered in the AGM year 2013-2014
(the period from June 2013 until the next year’s Annual General Meeting of Shareholders which was held in June 2014), in total 12,282 restricted shares were awarded to the Non-executive Directors (2,047 restricted shares each). These restricted
shares were vested at the Annual General Meeting of Shareholders held in June 2014 and were issued and transferred to the Non-executive Directors in March 2015.
INTERXION ANNUAL REPORT
2014 / 79
|
|
|
|
Consolidated Financial Statements
|
|
|
For his contribution to the Company in 2013, the Executive Director, based on the Company’s
performance and his individual performance, earned an initial allocation of 71,979 performance shares. This number was calculated on the basis of the predetermined conditionally awarded on target equity value for 2013, the Company’s average
share value during the month of January 2013, as well as the actual Company and individual performance from 1 January 2013 to 31 December 2013. On 30 June 2014, the General Meeting of Shareholders approved to grant 17,995 performance
shares (which represented 25% of the initial allocation) to the Executive Director pursuant to the Company’s 2013 Amended International Equity Based Incentive Plan. This first instalment, 25% (17,995 performance shares) of the initial
allocation, vested immediately following the approval by the General Meeting of Shareholders of the award. To cover taxes due, the Executive Director sold 4,995 shares. The remainder of the vested shares are locked up until 31 December 2014 and
were transferred in March 2015. The remaining 75% of the initial allocation (53,984 performance shares) was subject to the Company’s relative share performance over the 24 month period from 1 January 2013 to 31 December 2014. As at
31 December 2014, the relative share performance criteria were not met, as a result, the 53,984 performance shares were forfeited and returned to the pool available for grant.
On 30 July 2014, the Board of Directors approved an award of restricted shares and an initial award of performance shares for certain members
of key management (not the Executive Director) under the terms and conditions of the Company’s 2013 Amended International Equity Based Incentive Plan. A total of 20,000 restricted shares were granted. In addition, 35,592 performance shares were
granted as initial award. The Company started recognizing related share-based payment charges in the third quarter of 2014. Of the 35,592 performance shares initially awarded 8,898 shares vested, while the remaining initial performance shares were
forfeited as per 31 December 2014 as the performance criteria with regards to the relative share performance were not met.
The
number of restricted shares outstanding at 31 December 2014, 2013 and 2012 is broken down as follows:
|
|
|
|
|
|
|
| |
|
Number of restricted shares |
| |
|
(in thousands) |
| |
|
2014 |
|
2013 |
|
2012 |
| Outstanding at 1 January |
|
12 |
|
— |
|
— |
| Granted |
|
351 |
|
12 |
|
— |
| Vested |
|
(91) |
|
— |
|
— |
| Expired |
|
— |
|
— |
|
— |
| Forfeited |
|
— |
|
— |
|
— |
| Outstanding – 31 December |
|
272 |
|
12 |
|
— |
| The unvested shares outstanding at
31 December 2014 have a weighted average remaining contractual life of 2.9 years (2013: 0.5 years).
The number of performance shares outstanding at 31 December 2014, 2013 and 2012 is broken down as follows: |
|
|
| |
|
Number of performance shares |
| |
|
(in thousands) |
| |
|
2014 |
|
2013 |
|
2012 |
| Outstanding at 1 January |
|
— |
|
— |
|
— |
| Granted |
|
107 |
|
— |
|
— |
| Vested |
|
(27) |
|
— |
|
— |
| Expired |
|
— |
|
— |
|
— |
| Forfeited |
|
(80) |
|
— |
|
— |
| Outstanding – 31 December |
|
— |
|
— |
|
— |
For the contribution to the Company in 2014, in December 2014, the Board of Directors approved the conditional
award of performance shares for certain members of key management under the terms and conditions of the Company’s 2013 Amended International Equity Based Incentive Plan. The actual initial award of 137,574 performance shares was calculated on
the basis of the predetermined on target equity value for 2014, the Company’s average share price during the month of January 2014, and the level of the actual Company and individual performance from 1 January 2014 to 31 December
2014. Of the actual initial award level, 25% will vest at the next Annual General Meeting of Shareholders anticipated to be held in June 2015. As at 31 December 2014, this conditional award was not formally granted and therefore not presented
in the table above. Of the conditional award of 137,574 performance shares, 94,485 performance shares are conditionally awarded to the Executive Director. The actual initial award is still subject to the approval of the Annual General Meeting of
Shareholders, which is anticipated to be held in June 2015.
80 / INTERXION ANNUAL REPORT 2014
|
|
|
|
|
Consolidated Financial Statements
|
The shares will be locked up until 31 December 2015. The Company started recognizing
related share-based payment charges in the fourth quarter of 2014. Another 25% of the actual initial award will vest on 1 January 2016. The remaining 50% of the actual initial allocation of performance shares is subject to the Company’s
relative share performance over the 24 month period from 1 January 2014 to 31 December 2015. Upon a change of control, the performance shares may vest immediately and any lock up provision will expire.
Reference is made to Note 26 for disclosure on the binding agreement with Telecity Group plc. on all-share merger, which is considered as a
subsequent event.
EMPLOYEE EXPENSES
In 2014, the Company recorded employee expenses of €6,576,000 related to
share-based payments (2013: €4,149,000 and 2012: €5,488,000). The 2014 share-based payments related expenses
include an amount of € 92,000 related to taxes and social security charges (2013: € 559,000 and 2012: €2,078,000).
The weighted average fair value at grant date of options
granted during the period was determined using the Black-Scholes valuation model. The following inputs were used:
|
|
|
|
|
|
|
|
|
|
|
|
|
|
|
| |
|
2014 |
|
|
2013 |
|
|
|
|
2012 |
|
| Share price in
€ at grant date (post reverse stock split) |
|
|
17.04-22.31 |
|
|
|
17.94-20.72 |
|
|
|
|
|
10.65-16.47 |
|
| Exercise price in
€ (post-reverse stock split) |
|
|
12.68-18.61 |
|
|
|
7.65-16.94 |
|
|
|
|
|
7.71-17.45 |
|
| Dividend yield |
|
|
0% |
|
|
|
0% |
|
|
|
|
|
0% |
|
| Expected volatility |
|
|
35% |
|
|
|
40% |
|
|
|
|
|
40% |
|
| Risk-free interest rate |
|
|
0.2%-0.8% |
|
|
|
0.7%-0.8% |
|
|
|
|
|
0.7%-2.0% |
|
| Expected life weighted average |
|
|
5.1 years |
|
|
|
5.1 years |
|
|
|
|
|
5.1 years |
|
The significant inputs into the model were:
| ● |
|
expected volatility is based on a combination of the performance of the Company and, given the relatively short period that the shares of the Company are traded publicly, other companies that are
considered to be comparable to the Group; |
| ● |
|
the risk-free interest rate based on the yield on zero coupon bonds issued by the European Central Bank for European Union government debt rates with a maturity similar to the expected life of the
options; |
| ● |
|
dividend yield is considered to be nil; |
| ● |
|
expected life is considered to be equal to the average of the share option exercise and vesting periods. |
The weighted average fair value at grant date of the performance shares granted during the period was determined using the Monte Carlo valuation
model. In addition to the above mentioned inputs an one year holding discount of 5.5% was used as input for the performance shares.
Change of control clauses
Some awards to key management contain change of control clauses. If after a change of control of the Company (including any of its successors),
the employment agreement is terminated or if the participant is offered a function which is a material demotion to his current position, all options, restricted and performance shares will vest and become exercisable immediately. Should the
employment agreement, other than as the result of a change of control, be terminated prior to the date that all options have vested and should the participant and the Company not have agreed that he will be providing support or services to the
Company in another capacity, the non-vested options will expire with immediate effect.
As at 31 December 2014, approximately
110,000 options, 95,000 restricted shares and 99,500 performance shares may vest in the event of a change of control. Reference is made to Note 26 for disclosure on the binding agreement with Telecity Group plc. on all-share merger, which is
considered as a subsequent event.
(NON-)CANCELLABLE OPERATING LEASE COMMITMENTS
At 31 December, the Group has future minimum commitments for (non-)cancellable operating leases with terms in excess of one year as follows:
|
|
|
|
|
|
|
|
|
|
|
| |
|
2014 |
|
|
2013 |
|
|
2012 |
| |
|
|
|
|
(€’000) |
|
|
|
| Within 1 year |
|
|
31,604 |
|
|
|
31,793 |
|
|
28,755 |
| Between 1 and 5 years |
|
|
117,009 |
|
|
|
122,087 |
|
|
118,418 |
| After 5 years |
|
|
185,194 |
|
|
|
218,161 |
|
|
223,635 |
| |
|
|
333,807 |
|
|
|
372,041 |
|
|
370,808 |
|
| INTERXION ANNUAL REPORT 2014 / 81 |
|
|
|
|
Consolidated Financial Statements
|
|
|
As at 31 December 2014, of the non-cancellable operating leases an amount of € 4,795,000 (2013: € 8,319,000 and 2012:
€11,557,000) related to the lease contracts, which were provided for as part of the provision for onerous lease contracts.
Of the total operating leases, as at 31 December 2014, an amount of
€72,688,000 (2013: €75,188,000 and 2012:
€76,188,000) is cancellable until 1 January 2016.
The total
gross operating lease expense for the year 2014 was €25,400,000 (2013: € 24,700,000 and 2012: €22,900,000).
FUTURE COMMITTED REVENUES RECEIVABLE
The Group enters into initial contracts with its customers for periods of at least one year and generally between three and five years resulting
in future committed revenues from customers. At 31 December, the Group had contracts with customers for future committed revenues receivable as follows:
|
|
|
|
|
|
|
|
|
|
|
| |
|
2014 |
|
|
2013 |
|
|
2012 |
| |
|
|
|
|
(€’000)
|
|
|
|
| Within 1 year |
|
|
253,100 |
|
|
|
219,300 |
|
|
204,164 |
| Between 1 and 5 years |
|
|
343,500 |
|
|
|
301,600 |
|
|
240,951 |
| After 5 years |
|
|
90,700 |
|
|
|
101,800 |
|
|
105,069 |
| |
|
|
687,300 |
|
|
|
622,700 |
|
|
550,184 |
| COMMITMENTS TO PURCHASE
ENERGY Where possible, for its own use, the Group seeks to
purchase power on fixed-price term agreements with local power supply companies in the cities in which it operates. In some cases the Group also commits to purchase certain minimum volumes of energy at fixed prices. At 31 December, the Group
had entered into non-cancellable energy purchase commitments as follows: |
| |
|
2014 |
|
|
2013 |
|
|
2012 |
| |
|
|
|
|
(€’000)
|
|
|
|
| Within 1 year |
|
|
28,000 |
|
|
|
25,900 |
|
|
21,600 |
| Between 1 and 5 years |
|
|
19,100 |
|
|
|
32,100 |
|
|
11,600 |
| |
|
|
47,100 |
|
|
|
58,000 |
|
|
33,200 |
At 31 December 2014, the Group had outstanding capital
commitments totalling €62,800,000 (2013: €83,800,000 and 2012: €17,900,000). These commitments are expected to be settled in the following financial year. The increase results from the timing of expansion projects.
GUARANTEES
Certain of our subsidiaries have granted guarantees to our lending banks in relation to our borrowings. The Company has granted rent guarantees
to landlords of certain of the Group’s property leases. Financial guarantees granted by the Group’s banks in respect of operating leases amount to €5,184,000 (2013: €5,175,000 and 2012: €6,456,000), with respect to construction in Marseille €5,700,000 (2013 and 2012: nil) and other guarantees amounting to €53,000 (2013: €53,000 and 2012: €211,000).
SITE RESTORATION COSTS
As at 31 December 2014, the estimated discounted cost and recognised provision relating to the restoration of data centre leasehold premises
was €1,271,000 (2013: €1,177,000 and 2012:
€716,000).
In accordance with the Group’s accounting policy
site restoration costs have only been provided in the financial statements in respect of premises where the liability is considered probable and the related costs can be estimated reliably. As at 31 December 2014, the Group estimated the
possible liability to range from nil to €20,607,000 (2013: nil to €21,100,000 and 2012: nil to €19,600,000).
Other obligations pertaining to the Company, not
appearing on the statement of financial position are disclosed in Note 36 below.
|
| 82 / INTERXION ANNUAL REPORT 2014 |
|
|
|
|
|
Consolidated Financial Statements
|
| 25 |
RELATED-PARTY TRANSACTIONS |
There are no material transactions with related parties, other
than disclosed below, and all transactions are conducted at arm’s length.
SHAREHOLDERS’ AGREEMENT
On completion of the IPO, the Company entered into a shareholders’ agreement with affiliates of Baker Capital. For so long as Baker Capital
or its affiliates continue to be the owner of shares representing more than 25% of Interxion’s outstanding ordinary shares, Baker Capital will have the right to designate for nomination a majority of the members of the Board of Directors,
including the right to nominate the Chairman of our Board of Directors.
If Baker Capital or its affiliates continues to be the owner
of shares representing less than or equal to 25% but more than 15% of the outstanding ordinary shares, Baker Capital will have the right to designate for nomination three of the seven members of the Board, at least one of whom shall satisfy the
criteria for independent directors. For so long as Baker Capital or its affiliates continue to be the owner of shares representing less than or equal to 15% but more than 10% of the outstanding ordinary shares, Baker Capital will have the right to
designate for nomination two of the seven members of our Board, none of whom shall be required to be independent. At such time that the ownership of Baker Capital or its affiliates is less than or equal to 10% but more than 5% of the outstanding
ordinary shares, Baker Capital will have the right to designate for nomination one of the seven members of our Board, who shall not be required to be independent.
In addition, for so long as Baker Capital or its affiliates continue to be the owner of shares representing more than 25% of the outstanding
ordinary shares, Baker Capital will have the right, but not the obligation, to nominate the Chairman of our Board.
So long as Baker
Capital or its affiliates continue to be the owner of shares representing more than 15% of the outstanding ordinary shares, at least one of Baker Capital’s Director nominees shall be appointed to each of our standing committees, provided that
such Baker Capital nominees shall meet any independence or other requirements of the applicable listing standards.
In February 2014,
Baker Capital notified the Board of Directors of the Company that pursuant to the shareholders agreement, they intend to designate two additional individuals to be elected at the Company’s 2014 Annual General Meeting of Shareholders, each of
whom must meet the standards for independence under the requirements of the NYSE. In June 2014, Mr F. Esser and Mr M. Heraghty have been appointed as Non-executive director by the Annual General Meeting of Shareholders.
As at 31 March 2015, private equity investment funds affiliated with Baker Capital indirectly own 26.85%, on a fully diluted basis, of
Interxion’s equity.
KEY MANAGEMENT COMPENSATION
The total compensation of key management is as follows:
|
|
|
|
|
|
|
|
|
|
|
| |
|
2014 |
|
|
2013 |
|
|
2012 |
| |
|
|
|
|
(€’000)
|
|
|
|
| Short-term employee benefits (salaries and bonuses) |
|
|
2,445 |
|
|
|
2,376 |
|
|
2,510 |
| Post-employment benefits |
|
|
50 |
|
|
|
60 |
|
|
60 |
| Share-based payments |
|
|
1,982 |
|
|
|
1,299 |
|
|
1,219 |
| Crisis wage tax |
|
|
— |
|
|
|
125 |
|
|
1,565 |
| Termination benefits |
|
|
— |
|
|
|
53 |
|
|
— |
| |
|
|
4,477 |
|
|
|
3,913 |
|
|
5,354 |
Key management’s share-based payment compensation is disclosed in Note 21, and the compensation of the
Executive Director and Non-executive Directors of the Board is disclosed on an individual basis in Note 34.
In 2013 and 2012, the
Dutch Government imposed a crisis wage tax payable by employers over the total compensation including the benefit from options exercised. The crisis wage tax payable over key management compensation including the benefit from options exercised is
presented as “Crisis wage tax” in the table above.
FRANCE IX LOAN
Interxion France is a member and co-founder of the France IX association, founded in 2010, the mission of which is to reinforce Paris as a global
peering point by developing a panel of services that meets the various, and current, needs of the market, and by gathering together French and foreign ISPs and Internet services, and content providers. In 2011, Interxion France incurred costs which
were recharged to France IX association, receipt of which has been formalised in a loan agreement, of which € 230,000 was outstanding as at 31 December 2014 (2013: €427,000 and 2012: €620,000). The receivable is presented as a current asset.
|
| INTERXION ANNUAL REPORT 2014 / 83 |
|
|
|
|
Consolidated Financial Statements
|
|
|
| 26 |
EVENTS SUBSEQUENT TO THE BALANCE SHEET DATE |
On 9 March 2015, the Company and Telecity
Group plc. announced that they have entered into a definitive agreement on an all-share merger (“Implementation Agreement”) on the terms as announced on 11 February 2015. The transaction will be structured as an offer by Telecity
Group plc to acquire all the issued and to be issued share capital of Interxion Holding N.V.
Interxion shareholders will be receiving
2.3386 new Telecity Group plc shares per Interxion share. As a result, Telecity Group plc shareholders will own approximately 55%, and Interxion shareholders approximately 45%, of the combined group. The primary listing for the combined group will
be on the London Stock Exchange with a U.S. listing for Telecity Group plc’s existing ADR programme contemplated on either the New York Stock Exchange or NASDAQ.
Due to its size, the proposed all-share merger is a Class 1 transaction under the UK Listing Rules and therefore requires the approval of Telecity
Group plc shareholders. Completion of the transaction will also be subject, amongst other things, to Telecity Group plc having received valid acceptances for at least 95 per cent of the total issued share capital of Interxion (or, at Telecity
Group plc’s election, not less than 80 per cent) and all relevant regulatory and anti-trust approvals.
Prior to launching
the tender offer, Telecity Group plc and its advisers must prepare a number of documents for filing as part of the US registration and listing process, and Interxion shall undertake consultations on the proposed transaction with relevant works
councils, trade unions and other employee organisations. Final documents are expected to be filed, alongside publication of the prospectus and circular to Telecity Group plc shareholders, in the second half of 2015. The transaction is expected to
close in the second half of 2015.
Judgments, estimates and assumptions applied by management in preparing these financial statements
are based on circumstances as of 31 December 2014 and based on Interxion operating as a stand-alone company. The closing of the proposed transaction with TelecityGroup may impact future judgments, estimates and assumptions, as applied by
management in preparing our financial statements. Given the fact that the transaction is in an early stage of the merger process, the financial impact cannot be measured in a reliable way.
On 9 March 2015, we entered into the Implementation Agreement with Telecity Group. Pursuant to the Implementation Agreement, until the
completion of the transaction, we are, among other things, restricted in our ability to: (i) create, allot, issue, redeem or repurchase any share, loan capital or other security; (ii) declare, make or pay dividends or other distributions;
(iii) borrow any money (other than by bank overdraft or similar facility or revolving loan facility in the ordinary course of business) and enter into certain derivative instruments; (iv) incur, with respect to 2015 only, any capital
expenditure in excess of an aggregate amount of GBP 10 million in any consecutive six-month period, unless such expenditure is foreseen in: (A) any published guidance given to investors prior to the date of this Agreement; or (B) a
business plan, budget or other planning document adopted before 11 February 2015; (v) grant loans and financial facilities or modify the terms of existing loans and financial facilities for the benefit of any person; and (vi) make
certain acquisitions or dispositions.
IRREVOCABLE UNDERTAKING AGREEMENTS
Related to the proposed transaction with Telecity Group plc the following Irrevocable Undertaking Agreements have been signed:
On 9 March 2015, in connection with our entry into the Implementation Agreement with Telecity Group plc, Lamont Finance N.V. and Baker
Communications Fund II, L.P. signed an irrevocable undertaking agreement with Telecity Group plc in respect of their Interxion shares to, among other things,: (i) not to sell their shares; and (ii) accept the offer to be made by Telecity
Group plc pursuant to the Implementation Agreement. In addition, Lamont Finance N.V. and Baker Communications Fund II, L.P. both agreed, subject to certain exceptions, not to sell, transfer, charge, encumber, grant any option over or otherwise
dispose of any interest in any shares of Telecity Group plc issued to such parties in connection with the proposed transaction and not distributed to their direct or indirect partners or any interest therein at any time before the date falling 180
days after the closing date of the proposed transaction.
On 9 March 2015, in connection with our entry into the Implementation
Agreement with Telecity Group plc, Mr. Ruberg signed an irrevocable undertaking agreement with Telecity Group plc in respect of his Interxion shares to, among other things,: (i) not sell his shares; and (ii) accept the offer to be
made by Telecity Group plc pursuant to the Implementation Agreement. In addition, Mr. Ruberg has undertaken to exercise his vested options related to 600,000 Interxion shares prior to the consummation of the proposed transaction, and that such
shares (after (i) sales to fund exercise costs, tax liabilities on such exercise and (ii) sales of up to $2,000,000 in net proceeds) will be exchanged in the proposed transaction.
On 9 March 2015, in connection with our entry into the Implementation Agreement with Telecity Group plc, Messrs. J. Baker, F. Esser, M.
Heraghty, J.F.H.P. Mandeville, R. Manning and R. Ruijter each signed irrevocable undertaking agreement with Telecity Group plc in respect of their Interxion shares to, among other things,: (i) not to sell their shares; and (ii) accept the
offer to be made by Telecity Group plc pursuant to the Implementation Agreement. Mr. Ruberg and the other Directors, have also agreed, subject to certain exceptions, not to not to sell, transfer, charge, encumber, grant any option over or
otherwise dispose of any interest in any shares of Telecity Group plc issued to such persons in connection with the proposed transaction at any time before the date falling 180 days after the closing date of the proposed transaction.
In addition, in order to induce Lamont Finance N.V., Baker Communications Fund II (Cayman), L.P., and Baker Communications Fund II, L.P
(“Baker Parties”) to issue and in consideration of Baker Parties issuing the Irrevocable Undertaking and other good and valuable consideration, it was agreed to pay all legal costs and expenses reasonably incurred by Baker Parties in
connection with the transaction subject to an aggregate total cap of $250,000 (inclusive of any applicable taxes and charges).
|
| 84 / INTERXION ANNUAL REPORT 2014 |
COMPANY
FINANCIAL STATEMENTS
|
| INTERXION ANNUAL REPORT 2014 / 85 |
|
|
|
|
Company Financial Statements
|
|
|
INTERXION HOLDING N.V.
COMPANY FINANCIAL STATEMENTS
COMPANY STATEMENT OF FINANCIAL POSITION
(before appropriation of results)
|
|
|
|
|
|
|
|
|
|
|
|
|
|
|
| |
|
|
|
|
|
|
|
As at 31 December
|
| |
|
Note |
|
|
2014 |
|
|
2013 |
|
|
2012 |
| |
|
|
|
|
|
|
|
(€’000)
|
|
|
|
| Non-current assets |
|
|
|
|
|
|
|
|
|
|
|
|
|
|
| Financial assets |
|
|
29 |
|
|
|
900,286 |
|
|
|
692,977 |
|
|
617,013 |
| Deferred financing costs |
|
|
|
|
|
|
1,769 |
|
|
|
2,032 |
|
|
2,145 |
| Deferred tax assets |
|
|
30 |
|
|
|
17,550 |
|
|
|
17,990 |
|
|
12,782 |
| |
|
|
|
|
|
|
919,605 |
|
|
|
712,999 |
|
|
631,940 |
| Current assets |
|
|
|
|
|
|
|
|
|
|
|
|
|
|
| Trade and other current assets |
|
|
31 |
|
|
|
262 |
|
|
|
999 |
|
|
1,485 |
| Cash and cash equivalents |
|
|
32 |
|
|
|
28,611 |
|
|
|
3,627 |
|
|
13,848 |
| |
|
|
|
|
|
|
28,873 |
|
|
|
4,626 |
|
|
15,333 |
| Total assets |
|
|
|
|
|
|
948,478 |
|
|
|
717,625 |
|
|
647,273 |
| Shareholders’ equity |
|
|
|
|
|
|
|
|
|
|
|
|
|
|
| Share capital |
|
|
33 |
|
|
|
6,932 |
|
|
|
6,887 |
|
|
6,818 |
| Share premium |
|
|
33 |
|
|
|
495,109 |
|
|
|
485,347 |
|
|
477,326 |
| Foreign currency translation reserve |
|
|
33 |
|
|
|
10,440 |
|
|
|
6,757 |
|
|
9,403 |
| Hedging reserve |
|
|
33 |
|
|
|
(247) |
|
|
|
60 |
|
|
–- |
| Accumulated deficit |
|
|
33 |
|
|
|
(111,149) |
|
|
|
(117,973) |
|
|
(149,604) |
| Profit for the year |
|
|
33 |
|
|
|
35,060 |
|
|
|
6,824 |
|
|
31,631 |
| |
|
|
33 |
|
|
|
436,145 |
|
|
|
387,902 |
|
|
375,574 |
| Non-current liabilities |
|
|
|
|
|
|
|
|
|
|
|
|
|
|
| Borrowings |
|
|
19/20 |
|
|
|
475,643 |
|
|
|
317,610 |
|
|
256,268 |
| |
|
|
|
|
|
|
475,643 |
|
|
|
317,610 |
|
|
256,268 |
| Current liabilities |
|
|
|
|
|
|
|
|
|
|
|
|
|
|
| Trade payables and other liabilities |
|
|
|
|
|
|
36,690 |
|
|
|
12,113 |
|
|
15,431 |
| Total liabilities |
|
|
|
|
|
|
512,333 |
|
|
|
329,723 |
|
|
271,699 |
| Total liabilities and shareholders’ equity |
|
|
|
|
|
|
948,478 |
|
|
|
717,625 |
|
|
647,273 |
Note:
The accompanying notes form an integral part of the Company financial statements.
|
| 86 / INTERXION ANNUAL REPORT 2014 |
|
|
|
|
|
Company Financial Statements
|
COMPANY INCOME STATEMENT
|
|
|
|
|
|
|
|
|
|
|
|
|
|
|
| |
|
|
|
|
For the years ended 31 December
|
| |
|
Note |
|
|
2014 |
|
|
2013 |
|
|
2012 |
| |
|
|
|
|
|
|
|
(€’000)
|
|
|
|
| Profit/(loss) relating to the Company |
|
|
|
|
|
|
3,530 |
|
|
|
(15,913) |
|
|
10,442 |
| Profit relating to investments in subsidiaries after tax |
|
|
29 |
|
|
|
31,530 |
|
|
|
22,737 |
|
|
21,189 |
| Profit for the year |
|
|
33 |
|
|
|
35,060 |
|
|
|
6,824 |
|
|
31,631 |
Note:
The accompanying notes form an integral part of the Company financial statements.
NOTES TO THE 2014 COMPANY
FINANCIAL STATEMENTS
The Company income statement is presented in an abbreviated form. As
provided in section 402 of the Netherlands Civil Code, Book 2, the Company income statement only shows the after-tax results of consolidated subsidiaries, because Interxion Holding N.V.’s results are included in the Consolidated Income
Statement.
The financial statements of Interxion Holding N.V. are prepared in
accordance with the Netherlands Civil Code, Book 2, Part 9, with the application of the regulations of section 362.8 allowing the use of the same accounting policies as those adopted for the consolidated financial statements as set out in Note 3.
Subsidiaries are valued using the equity method, applying the European-Union-endorsed IFRS accounting policies, as set out in Note 3
to the consolidated financial statements. Any related-party transactions between subsidiaries and with members of the Board of Directors and the (ultimate) parent company Interxion Holding N.V. are conducted on an arm’s-length basis on terms
comparable to transactions with third parties.
|
|
|
|
|
|
|
|
|
|
|
|
|
|
|
|
|
|
|
|
|
| |
|
Investments in
subsidiaries |
|
|
Receivables from
subsidiaries |
|
|
2014 |
|
|
2013 |
|
|
2012 |
|
| |
|
|
|
|
|
|
|
(€’000)
|
|
|
|
|
|
|
|
| As at 1 January |
|
|
47,876 |
|
|
|
645,101 |
|
|
|
692,977 |
|
|
|
617,013 |
|
|
|
499,997 |
|
| Movement in receivables |
|
|
— |
|
|
|
169,615 |
|
|
|
169,615 |
|
|
|
23,590 |
|
|
|
92,165 |
|
| Profit after tax |
|
|
31,530 |
|
|
|
— |
|
|
|
31,530 |
|
|
|
22,737 |
|
|
|
21,189 |
|
| (Repayment capital) / Recapitalisation |
|
|
1,963 |
|
|
|
— |
|
|
|
1,963 |
|
|
|
32,857 |
|
|
|
1,074 |
|
| Foreign currency translation differences |
|
|
4,201 |
|
|
|
— |
|
|
|
4,201 |
|
|
|
(3,220) |
|
|
|
2,588 |
|
| As at 31 December |
|
|
85,570 |
|
|
|
814,716 |
|
|
|
900,286 |
|
|
|
692,977 |
|
|
|
617,013 |
|
See also Note 9. The difference between the Group’s consolidated
deferred tax assets €30,064,000 (2013: €34,446,000 and 2012: €30,376,000) and those of the Company €17,550,000 (2013:
€17,990,000 and 2012: €12,782,000) relates to the inclusion of non-Dutch entities in the consolidated
statement of financial position.
| 31 |
TRADE AND OTHER CURRENT ASSETS |
Prepaid expenses relate to payments to creditors for costs
that relate to future periods (for example rent, maintenance contracts and insurance premiums) and VAT receivable. At 31 December 2014, €175,000 was related to the VAT
receivable (2013: €948,000 and 2012: €1,243,000).
|
| INTERXION ANNUAL REPORT 2014 / 87 |
|
|
|
|
Company Financial Statements
|
|
|
| 32 |
CASH AND CASH EQUIVALENTS |
Of the cash and cash equivalents, €1,131,000 (2013: €1,299,000: 2012:
€1,299,000) was used as collateral to support the issue of bank guarantees on behalf of a number of subsidiary companies.
|
|
|
|
|
|
|
|
|
|
|
|
|
|
|
|
|
|
|
|
|
|
|
|
|
|
|
| |
|
Note |
|
Share
capital |
|
|
Share
premium |
|
|
Foreign
currency
translation
reserve |
|
|
Hedge
reserve |
|
|
Accumulated
deficit |
|
|
Total
equity |
|
| |
|
|
|
|
|
|
|
|
|
(€’000) |
|
|
|
|
|
|
|
| Balance as at 1 January 2014 |
|
|
|
|
6,887 |
|
|
|
485,347 |
|
|
|
6,757 |
|
|
|
60 |
|
|
|
(111,149) |
|
|
|
387,902 |
|
| Profit for the year |
|
|
|
|
— |
|
|
|
— |
|
|
|
— |
|
|
|
— |
|
|
|
35,060 |
|
|
|
35,060 |
|
| Hedging result |
|
|
|
|
— |
|
|
|
— |
|
|
|
— |
|
|
|
(307) |
|
|
|
— |
|
|
|
(307) |
|
| Foreign currency translation differences |
|
|
|
|
— |
|
|
|
— |
|
|
|
3,683 |
|
|
|
— |
|
|
|
— |
|
|
|
3,683 |
|
| Total comprehensive income |
|
|
|
|
— |
|
|
|
— |
|
|
|
3,683 |
|
|
|
(307) |
|
|
|
35,060 |
|
|
|
38,436 |
|
| Exercise of options |
|
|
|
|
45 |
|
|
|
3,278 |
|
|
|
— |
|
|
|
— |
|
|
|
— |
|
|
|
3,323 |
|
| Share-based payments |
|
21 |
|
|
— |
|
|
|
6,484 |
|
|
|
— |
|
|
|
— |
|
|
|
— |
|
|
|
6,484 |
|
| Total contribution by, and distributions to, owners of the Company |
|
|
|
|
45 |
|
|
|
9,762 |
|
|
|
— |
|
|
|
— |
|
|
|
— |
|
|
|
9,807 |
|
| Balance as at 31 December 2014 |
|
|
|
|
6,932 |
|
|
|
495,109 |
|
|
|
10,440 |
|
|
|
(247) |
|
|
|
(76,089) |
|
|
|
436,145 |
|
| |
|
|
|
|
|
|
|
|
|
|
|
|
|
|
|
|
|
|
|
|
|
|
|
|
|
|
| Balance as at 1 January 2013 |
|
|
|
|
6,818 |
|
|
|
477,326 |
|
|
|
9,403 |
|
|
|
— |
|
|
|
(117,973) |
|
|
|
375,574 |
|
| Profit for the year |
|
|
|
|
— |
|
|
|
— |
|
|
|
— |
|
|
|
— |
|
|
|
6,824 |
|
|
|
6,824 |
|
| Hedging result |
|
|
|
|
— |
|
|
|
— |
|
|
|
— |
|
|
|
60 |
|
|
|
— |
|
|
|
60 |
|
| Foreign currency translation differences |
|
|
|
|
— |
|
|
|
— |
|
|
|
(2,646) |
|
|
|
— |
|
|
|
— |
|
|
|
(2,646) |
|
| Total comprehensive income |
|
|
|
|
— |
|
|
|
— |
|
|
|
(2,646) |
|
|
|
60 |
|
|
|
6,824 |
|
|
|
4,238 |
|
| Exercise of options |
|
|
|
|
69 |
|
|
|
4,431 |
|
|
|
— |
|
|
|
— |
|
|
|
— |
|
|
|
4,500 |
|
| Share-based payments |
|
21 |
|
|
— |
|
|
|
3,590 |
|
|
|
— |
|
|
|
— |
|
|
|
— |
|
|
|
3,590 |
|
| Total contribution by, and distributions to, owners of the Company |
|
|
|
|
69 |
|
|
|
8,021 |
|
|
|
— |
|
|
|
— |
|
|
|
— |
|
|
|
8,090 |
|
| Balance as at 31 December 2013 |
|
|
|
|
6,887 |
|
|
|
485,347 |
|
|
|
6,757 |
|
|
|
60 |
|
|
|
(111,149) |
|
|
|
387,902 |
|
| |
|
|
|
|
|
|
|
|
|
|
|
|
|
|
|
|
|
|
|
|
|
|
|
|
|
|
| Balance as at 1 January 2012 |
|
|
|
|
6,613 |
|
|
|
466,166 |
|
|
|
7,386 |
|
|
|
— |
|
|
|
(149,604) |
|
|
|
330,561 |
|
| Profit for the year |
|
|
|
|
— |
|
|
|
— |
|
|
|
— |
|
|
|
— |
|
|
|
31,631 |
|
|
|
31,631 |
|
| Foreign currency translation differences |
|
|
|
|
— |
|
|
|
— |
|
|
|
2,017 |
|
|
|
— |
|
|
|
— |
|
|
|
2,017 |
|
| Total comprehensive income |
|
|
|
|
— |
|
|
|
— |
|
|
|
2,017 |
|
|
|
— |
|
|
|
31,631 |
|
|
|
33,648 |
|
| Exercise of options |
|
|
|
|
205 |
|
|
|
7,750 |
|
|
|
— |
|
|
|
— |
|
|
|
— |
|
|
|
7,955 |
|
| Share-based payments |
|
21 |
|
|
— |
|
|
|
3,410 |
|
|
|
— |
|
|
|
— |
|
|
|
— |
|
|
|
3,410 |
|
| Total contribution by, and distributions to, owners of the Company |
|
|
|
|
205 |
|
|
|
11,160 |
|
|
|
— |
|
|
|
— |
|
|
|
— |
|
|
|
11,365 |
|
| Balance as at 31 December 2012 |
|
|
|
|
6,818 |
|
|
|
477,326 |
|
|
|
9,403 |
|
|
|
— |
|
|
|
(117,973) |
|
|
|
375,574 |
|
Note:
Foreign currency translation qualifies as a legal reserve.
|
| 88 / INTERXION ANNUAL REPORT 2014 |
|
|
|
|
|
Company Financial Statements
|
| 34 |
REMUNERATION OF THE EXECUTIVE DIRECTOR AND NON-EXECUTIVE DIRECTORS OF THE BOARD |
The
compensation of the Executive Director and the Non-executive Directors of the Board is presented in the tables below.
The share-based
payment charges represent the non-cash compensation component calculated in accordance with IFRS2. The 2014 share-based payment charges for Mr. Ruberg include the costs related to the 2013 and the 2014 performance share awards both awarded in
the year 2014.
|
|
|
|
|
|
|
|
|
|
|
|
|
|
|
|
|
|
|
|
|
|
|
| |
|
2014 |
|
| |
|
Salaries |
|
|
|
|
Bonus |
|
|
|
|
Share-based payment charges
(€’000) |
|
|
|
|
Total |
|
| D.C. Ruberg |
|
|
590 |
|
|
|
|
|
613 |
|
|
|
|
|
872
|
|
|
|
|
|
2,075 |
|
| J.C. Baker |
|
|
48 |
|
|
|
|
|
— |
|
|
|
|
|
40
|
|
|
|
|
|
88 |
|
| F. Esser |
|
|
33 |
|
|
|
|
|
— |
|
|
|
|
|
20
|
|
|
|
|
|
53 |
|
| M. Heraghty |
|
|
33 |
|
|
|
|
|
— |
|
|
|
|
|
20
|
|
|
|
|
|
53 |
|
| J.F.H.P. Mandeville |
|
|
63 |
|
|
|
|
|
— |
|
|
|
|
|
40
|
|
|
|
|
|
103 |
|
| R.M. Manning |
|
|
40 |
|
|
|
|
|
— |
|
|
|
|
|
40
|
|
|
|
|
|
80 |
|
| R. Ruijter |
|
|
10 |
|
|
|
|
|
— |
|
|
|
|
|
10
|
|
|
|
|
|
20 |
|
| D. Lister |
|
|
25 |
|
|
|
|
|
— |
|
|
|
|
|
22
|
|
|
|
|
|
47 |
|
| C.G. van Luijk |
|
|
38 |
|
|
|
|
|
— |
|
|
|
|
|
20
|
|
|
|
|
|
58 |
|
| M. Massart |
|
|
30 |
|
|
|
|
|
— |
|
|
|
|
|
20
|
|
|
|
|
|
50 |
|
| |
|
|
910 |
|
|
|
|
|
613 |
|
|
|
|
|
1,104
|
|
|
|
|
|
2,627 |
|
|
|
| |
|
2013 |
|
| |
|
Salaries |
|
|
|
|
Bonus |
|
|
|
|
Share-based payment charges
(€’000) |
|
|
|
|
Total |
|
| D.C. Ruberg |
|
|
540 |
|
|
|
|
|
355 |
|
|
|
|
|
277
|
|
|
|
|
|
1,172 |
|
| J.C. Baker |
|
|
50 |
|
|
|
|
|
— |
|
|
|
|
|
68
|
|
|
|
|
|
118 |
|
| J.F.H.P. Mandeville |
|
|
55 |
|
|
|
|
|
— |
|
|
|
|
|
26
|
|
|
|
|
|
81 |
|
| R.M. Manning |
|
|
40 |
|
|
|
|
|
— |
|
|
|
|
|
68
|
|
|
|
|
|
108 |
|
| D. Lister |
|
|
45 |
|
|
|
|
|
— |
|
|
|
|
|
26
|
|
|
|
|
|
71 |
|
| C.G. van Luijk |
|
|
70 |
|
|
|
|
|
— |
|
|
|
|
|
68
|
|
|
|
|
|
138 |
|
| M. Massart |
|
|
55 |
|
|
|
|
|
— |
|
|
|
|
|
47
|
|
|
|
|
|
102 |
|
| |
|
|
855 |
|
|
|
|
|
355 |
|
|
|
|
|
580
|
|
|
|
|
|
1,790 |
|
|
|
| |
|
2012 |
|
| |
|
Salaries |
|
|
|
|
Bonus |
|
|
|
|
Share-based payment charges
(€’000) |
|
|
|
|
Total |
|
| D.C. Ruberg |
|
|
540 |
|
|
|
|
|
430 |
|
|
|
|
|
887
|
|
|
|
|
|
1,857 |
|
| J.C. Baker |
|
|
50 |
|
|
|
|
|
— |
|
|
|
|
|
—
|
|
|
|
|
|
50 |
|
| J.F.H.P. Mandeville |
|
|
55 |
|
|
|
|
|
— |
|
|
|
|
|
14
|
|
|
|
|
|
69 |
|
| R.M. Manning |
|
|
40 |
|
|
|
|
|
— |
|
|
|
|
|
—
|
|
|
|
|
|
40 |
|
| D. Lister |
|
|
45 |
|
|
|
|
|
— |
|
|
|
|
|
14
|
|
|
|
|
|
59 |
|
| C.G. van Luijk |
|
|
70 |
|
|
|
|
|
— |
|
|
|
|
|
—
|
|
|
|
|
|
70 |
|
| M. Massart |
|
|
55 |
|
|
|
|
|
— |
|
|
|
|
|
57
|
|
|
|
|
|
112 |
|
| |
|
|
855 |
|
|
|
|
|
430 |
|
|
|
|
|
972
|
|
|
|
|
|
2,257 |
|
In 2013, the Dutch Government imposed a crisis wage tax which is payable by employers. The total charge over the
compensation of Directors amounted in 2013 to €63,000 (2012: €1,345,000), which is not reflected in the table
above. In 2014, this crisis wage tax was no longer applicable.
In total 12,282 restricted shares were granted to the Non-executive
Directors (2,047 restricted shares each); costs related to these grants are reflected as part of share-based payment charges.
|
| INTERXION ANNUAL REPORT 2014 / 89 |
|
|
|
|
Company Financial Statements
|
|
|
NON-CANCELLABLE OPERATING LEASES PAYABLE
The Company leases and guarantees a variety of facilities and equipment under operating leases. Future minimum commitments for non-cancellable
operating leases with terms in excess of one year are as follows:
|
|
|
|
|
|
|
|
|
|
|
| |
|
2014 |
|
|
2013 |
|
|
2012 |
| |
|
|
|
|
(€’000) |
|
|
|
| Within 1 year |
|
|
2,341 |
|
|
|
3,574 |
|
|
3,063 |
| Between 1 and 5 years |
|
|
7,076 |
|
|
|
11,481 |
|
|
11,582 |
| After 5 years |
|
|
4,689 |
|
|
|
10,205 |
|
|
12,369 |
| |
|
|
14,106 |
|
|
|
25,260 |
|
|
27,014 |
| 36 |
OBLIGATIONS NOT APPEARING IN THE STATEMENT OF FINANCIAL POSITION |
Declarations of joint and
several liability as defined in Book 2, section 403 of the Netherlands Civil Code have been given by Interxion Holding N.V. on behalf of the following Dutch subsidiaries: Interxion Telecom B.V., Interxion Nederland B.V., Interxion Consultancy
Services B.V., Interxion Trading B.V., Interxion Headquarters B.V., Interxion B.V., Interxion Data Centers B.V., Interxion Trademarks B.V. and Interxion Real Estate Holding B.V., Interxion Real Estate I B.V., Interxion Real Estate IV B.V., Interxion
Real Estate V B.V. and Interxion Operational B.V. The liabilities of these companies to third parties totalled €55,669,000 at 31 December 2014 (2013: €30,704,000 and 2012: €24,215,000).
From time to time we provide guarantees to third parties in connection with transactions entered into by our subsidiaries in the ordinary course
of business. The Company, together with Interxion B.V., Interxion Consultancy Services B.V., Interxion Headquarters B.V., Interxion Nederland B.V., Interxion Data Centers B.V. Interxion Telecom B.V., Interxion Trademarks B.V., Interxion Trading
B.V., Interxion Real Estate Holding B.V., Interxion Real Estate I B.V., Interxion Real Estate IV B.V, Interxion Real Estate V B.V. and Interxion Operational B.V. forms a fiscal group for corporate income tax purposes and they are considered to be
jointly responsible for the obligations of the fiscal group.
With reference to section 2:382a(1) and (2) of the Netherlands
Civil Code, the following fees for the financial years 2014, 2013 and 2012 were charged by KPMG Accountants N.V. or other KPMG network company to the Company, its subsidiaries and other consolidated entities:
|
|
|
|
|
|
|
|
|
|
|
|
|
|
|
|
|
|
|
|
|
|
|
|
|
|
|
|
|
|
|
|
|
|
|
|
|
|
|
|
|
| |
|
2014 |
|
|
|
|
2013 |
|
|
|
|
2012 |
|
| |
|
KPMG
Accountants
N.V. |
|
|
Other
KPMG
network |
|
|
Total
KPMG |
|
|
|
|
KPMG
Accountants
N.V. |
|
|
Other
KPMG
network |
|
|
Total
KPMG |
|
|
|
|
KPMG
Accountants
N.V. |
|
|
Other
KPMG
network |
|
|
Total
KPMG |
|
| |
|
|
|
|
|
|
|
|
|
|
|
|
(€’000) |
|
|
|
|
|
|
|
|
|
|
|
|
| Statutory audit of
annual accounts |
|
|
373 |
|
|
|
316 |
|
|
|
689 |
|
|
|
|
|
363 |
|
|
|
294 |
|
|
|
657 |
|
|
|
|
|
350 |
|
|
|
237 |
|
|
|
587 |
|
| Additional audit
procedures |
|
|
193 |
|
|
|
12 |
|
|
|
205 |
|
|
|
|
|
308 |
|
|
|
54 |
|
|
|
362 |
|
|
|
|
|
157 |
|
|
|
14 |
|
|
|
171 |
|
| Other assurance
services |
|
|
139 |
|
|
|
116 |
|
|
|
255 |
|
|
|
|
|
203 |
|
|
|
143 |
|
|
|
346 |
|
|
|
|
|
230 |
|
|
|
47 |
|
|
|
277 |
|
| Tax advisory services |
|
|
— |
|
|
|
3 |
|
|
|
3 |
|
|
|
|
|
— |
|
|
|
— |
|
|
|
— |
|
|
|
|
|
— |
|
|
|
— |
|
|
|
— |
|
| Other
non-assurance |
|
|
57 |
|
|
|
1 |
|
|
|
58 |
|
|
|
|
|
63 |
|
|
|
1 |
|
|
|
64 |
|
|
|
|
|
— |
|
|
|
— |
|
|
|
— |
|
| |
|
|
762 |
|
|
|
448 |
|
|
|
1,210 |
|
|
|
|
|
937 |
|
|
|
492 |
|
|
|
1,429 |
|
|
|
|
|
737 |
|
|
|
298 |
|
|
|
1,035 |
|
|
| 90 / INTERXION ANNUAL REPORT 2014 |
|
|
|
|
|
Company Financial Statements
|
BOARD OF DIRECTORS:
|
|
|
|
|
| |
|
|
|
|
|
|
|
| D.C. Ruberg |
|
|
|
J.C. Baker |
|
|
|
| (Chief Executive Officer, Vice-Chairman and Executive Director) |
|
|
|
(Chairman and Non-executive Director) |
|
|
|
| |
|
|
|
|
|
|
|
| F. Esser (Non-executive Director appointed June 2014) |
|
|
|
M. Heraghty |
|
|
|
|
(Non-executive Director, appointed June
2014) |
|
|
|
| |
|
|
|
|
|
|
|
| J.F.H.P. Mandeville (Non-executive Director) |
|
|
|
R.M. Manning (Non-executive Director) |
|
|
|
| |
|
|
|
|
|
|
|
| R. Ruijter (Non-executive Director, appointed November 2014) |
|
|
|
|
|
|
|
|
Schiphol-Rijk, 28 April 2015 |
|
| INTERXION ANNUAL REPORT 2014 / 91 |
|
| 92 / INTERXION ANNUAL REPORT 2014 |
|
| INTERXION ANNUAL REPORT 2014 / 93 |
OTHER INFORMATION
APPROPRIATION OF RESULT
Statutory regulation governing the distribution of profit (in accordance with article 23 paragraph 1 and 2 of the Articles of Association)
Paragraph 1: The Board shall, in its sole discretion, determine the amounts of the profits accrued in a financial year that shall
be added to the reserves of the Company.
Paragraph 2: The allocation of profits accrued in a financial year remaining after
application of Article 23.1 shall be determined by the General Meeting.
PROPOSED APPROPRIATION OF RESULTS FOR THE YEAR 2014
The Board of Directors proposes to add the profit for the year, amounting to € 35,060,000, to the other reserves (“accumulated deficit”).
|
| 94 / INTERXION ANNUAL REPORT 2014 |
INDEPENDENT AUDITOR’S REPORT
TO: THE ANNUAL GENERAL MEETING
SHAREHOLDERS OF INTERXION HOLDING N.V.
REPORT ON THE FINANCIAL STATEMENTS
We have audited the accompanying financial statements 2014 of InterXion Holding N.V., Amsterdam, (‘the Company’) as set out on pages 37
to 91. The financial statements include the consolidated financial statements and the company financial statements. The consolidated financial statements comprise the consolidated statement of financial position as at 31 December 2014, the
consolidated income statement, the consolidated statement of comprehensive income, the consolidated statement of changes in shareholders’ equity and consolidated statement of cash flows for the year then ended, and notes, comprising a summary
of the significant accounting policies and other explanatory information. The company financial statements comprise the company statement of financial position as at 31 December 2014, the company income statement for the year then ended and the
notes, comprising a summary of the accounting policies and other explanatory information.
MANAGEMENT’S RESPONSIBILITY
Management is responsible for the preparation and fair presentation of these financial statements in accordance with International
Financial Reporting Standards as adopted by the European Union and with Part 9 of Book 2 of the Netherlands Civil Code, and for the preparation of the Report of the Board of Directors in accordance with Part 9 of Book 2 of the Netherlands Civil
Code. Furthermore, management is responsible for such internal control as it determines is necessary to enable the preparation of the financial statements that are free from material misstatement, whether due to fraud or error.
AUDITOR’S RESPONSIBILITY
Our responsibility is to express an opinion on these financial statements based on our audit. We conducted our audit in accordance with Dutch law, including the Dutch Standards on Auditing. This requires that we comply with ethical
requirements and plan and perform the audit to obtain reasonable assurance about whether the financial statements are free from material misstatement.
An audit involves performing procedures to obtain audit evidence about the amounts and disclosures in the financial statements. The procedures selected depend on the auditor’s judgment, including the assessment of the risks of
material misstatement of the financial statements, whether due to fraud or error.
In making those risk assessments, the auditor
considers internal control relevant to the Company’s preparation and fair presentation of the financial statements in order to design audit procedures that are appropriate in the circumstances, but not for the purpose of expressing an opinion
on the effectiveness of the Company’s internal control. An audit also includes evaluating the appropriateness of accounting policies used and the reasonableness of accounting estimates made by management, as well as evaluating the overall
presentation of the financial statements.
We believe that the audit evidence we have obtained is sufficient and appropriate to provide a
basis for our audit opinion.
OPINION WITH RESPECT TO THE CONSOLIDATED FINANCIAL STATEMENTS
In our opinion, the consolidated financial statements give a true and fair view of the financial position of InterXion Holding N.V. as at
31 December 2014 and of its result and its cash flows for the year then ended in accordance with International Financial Reporting Standards as adopted by the European Union and with Part 9 of Book 2 of the Netherlands Civil Code.
OPINION WITH RESPECT TO THE COMPANY FINANCIAL STATEMENTS
In our opinion, the company financial statements give a true and fair view of the financial position of InterXion Holding N.V. as at
31 December 2014 and of its result for the year then ended in accordance with Part 9 of Book 2 of the Netherlands Civil Code.
REPORT ON OTHER LEGAL AND REGULATORY REQUIREMENTS
Pursuant to the legal requirements under Section 2:393 sub 5 at e and f of the Netherlands Civil Code, we have no deficiencies to report as a
result of our examination whether the Report of the Board of Directors, to the extent we can assess, has been prepared in accordance with Part 9 of Book 2 of this Code, and whether the information as required under Section 2:392 sub 1 at b - h
has been annexed. Further, we report that the Report of the Board of Directors, to the extent we can assess, is consistent with the financial statements as required by Section 2:391 sub 4 of the Netherlands Civil Code.
Rotterdam, 28 April 2015
KPMG
Accountants N.V.
A.H. Gardien RA
|
| INTERXION ANNUAL REPORT 2014 / 95 |
|
| 96 / INTERXION ANNUAL REPORT 2014 |
INTERXION ANNUAL REPORT
2014 / 97
WHERE CAN I FIND OUT MORE
WWW.INTERXION.COM
At Interxion we want our customers and prospects to be able to find the information they’re looking for quickly and simply. So whether an organisation is at the
start of the process and considering whether colocation is right for their business, or they’re further down the line and want to understand how we can help businesses in particular sectors, we have a range of information they can read and
download.
Visit www.interxion.com for more information.
|
|
|
|
|
| THE RISE OF HYBRID IT |
|
Today, a new approach to IT is emerging as organisations compute, store and distribute their data in new ways.
We are witnessing the emergence of the cloud computing era and the start of large-scale enterprise cloud adoption. Hybrid IT is quickly becoming the dominant IT model. Organisations are mixing and matching IT deployment models and how those models
are managed. The change is quite dramatic, with exclusive dependence on in-house data centres reducing quickly, as many companies are looking at alternatives.
The whitepaper ‘The Rise of Hybrid IT’ and other content is available on our website |
|

|
|
|
|
| SELECTING THE BEST EUROPEAN LOCATION |
|
If you’re expanding your operations to serve developed and/or emerging markets in Europe, the question is: where to base your offices and data
centres? This whitepaper will provide you with an insight into the strengths and weaknesses of the various European markets, based on technical, legal, regulatory, tax and cultural criteria, enabling you to make an informed decision in the selection
of your data centre location in Europe. You can download this whitepaper ‘Selecting the
best European locations for your IT infrastructure’ from our website. |
|

|
|
|
|
|
|
| |
|
|
| A PRACTICAL GUIDE TO CLOUD
ONBOARDING |
|
No IT department wants to launch itself into a cloud migration project without feeling confident that it can ultimately deliver a smooth, trouble- free
switchover to a cloud environment. The complexity of the migration process is a big part of why enterprises are hesitant about cloud adoption, despite being sold on the benefits of cloud delivery.
That’s why we’ve looked closely at this onboarding process and provided our ‘7
steps to cloud onboarding’ in this whitepaper, available from our website. |
|

|
98 / INTERXION ANNUAL REPORT 2014
FOLLOW US
WWW.INTERXION.COM
You can follow all our company news through the RSS feeds
on our website. The News area on our site, www.interxion.com/about-us/news, can be searched by year and by category and will give you all the news about Interxion you need.
Alternatively, for more Interxion updates and industry insights you can visit our blog at
www.interxion.com/blog.
If you prefer news specifically related to investor relations, subscribe to
the RSS feed at www.investors.interxion.com.
“Growth in our communities of interest, and structural drivers such as the onset of migration to cloud, are
underpinning continued demand for Interxion’s highly connected data centres.”
David Ruberg
Chief Executive Officer
To keep up to date with our company news and thought
leadership, you can also follow us on social media.
|
|
|
|
|
|
|

|
|
http://www.linkedin.com/company/interxion
|
|

|
|
http://www.youtube.com/user/interxiontube
|
|
|
|
|

|
|
https://twitter.com/interxion |
|

|
|
https://www.facebook.com/Interxion
|
|
|
|
|
|
| INTERNATIONAL HEADQUARTERS |
|
EUROPEAN CUSTOMER SERVICE CENTRE (ECSC) |
|
|
|
| Main: + 44 207 375 7070 |
|
Toll free from Europe: |
|
+ 800 00 999 222 |
| Fax: + 44 207 375 7059 |
|
Toll free from the US: |
|
185 55 999 222 |
| Email: [email protected] |
|
Email: [email protected] |
|
| 99 / INTERXION ANNUAL REPORT 2014 |


 Tweet
Tweet Share
Share