

Form 6-K Infosys Ltd For: Jun 30
 Tweet
Tweet Share
Share
UNITED STATES SECURITIES AND EXCHANGE COMMISSION
Washington, D.C. 20549
Form 6-K
Report of Foreign Private Issuer
Pursuant to Rule 13a-16 or 15d-16 of the Securities Exchange Act of 1934
For the quarter ended June 30, 2017
Commission File Number 001-35754
Infosys Limited
(Exact name of Registrant as specified in its charter)
Not Applicable
(Translation of Registrant's name into English)
Electronics City, Hosur Road, Bangalore - 560 100, Karnataka, India. +91-80-2852-0261
(Address of principal executive offices)
Indicate by check mark whether the registrant files or will file annual reports under cover Form 20-F or Form 40-F:
Form 20-F þ Form 40-F o
Indicate by check mark if the registrant is submitting the Form 6-K in paper as permitted by Regulation S-T Rule 101(b)(1) : o
Indicate by check mark if the registrant is submitting the Form 6-K in paper as permitted by Regulation S-T Rule 101(b)(7) : o
TABLE OF CONTENTS
DISCLOSURE OF RESULTS OF OPERATIONS AND FINANCIAL CONDITION
Infosys Limited (“Infosys” or “the Company” or “we”) hereby furnishes the United States Securities and Exchange Commission with copies of the following information concerning our public disclosures regarding our results of operations and financial condition for the quarter ended June 30, 2017.
The following information shall not be deemed "filed" for purposes of Section 18 of the Securities Exchange Act of 1934, as amended (the "Exchange Act"), or incorporated by reference in any filing under the Securities Act of 1933, as amended, or the Exchange Act, except as shall be expressly set forth by specific reference in such a filing.
On June 14, 2017, we announced our results of operations for the quarter ended June 30, 2017. We issued press releases announcing our results under International Financial Reporting Standards (“IFRS”) in U.S. dollars and Indian rupees, copies of which are attached to this Form 6-K as Exhibits 99.1 and 99.2, respectively.
On June 14, 2017, the leadership team were part of a common television interaction in which they answered questions from the media. The transcript of this interaction is attached to this Form 6-K as Exhibit 99.3.
On June 14, 2017, we held a press conference to announce our results, which was followed by a question and answer session. The transcript of this press conference is attached to this Form 6-K as Exhibit 99.4.
We have also made available to the public on our web site, www.infosys.com, a fact sheet that provides details on our profit and loss account summary for the quarters ended June 30, 2017 and 2016 (as per IFRS); revenue by geographical segment, service offering, project type, and industry classification; information regarding our client concentration; employee information and metrics; infrastructure information; and consolidated IT services information. We have attached this fact sheet to this Form 6-K as Exhibit 99.5.
On June 14 2017, we also held two teleconferences with investors and analysts to discuss our results. Transcripts of those two teleconferences are attached to this Form 6-K as Exhibits 99.6 and 99.7, respectively.
We placed form of releases to stock exchanges and advertisements in certain Indian newspapers concerning our results of operations for the quarter ended June 30, 2017, under Ind AS. A copy of these releases to Stock Exchanges and advertisement is attached to this Form 6-K as Exhibit 99.8.
We have made available to the public on our web site, www.infosys.com, the following: Unaudited Condensed Financial Statements in compliance with IFRS in US dollars; Audited Condensed Financial Statements in compliance with IFRS in Indian Rupees and the Auditors Report; Audited Ind AS Condensed Standalone Financial Statements and Auditors Report; Audited Ind AS Consolidated Financial Statements and Auditors Report for the quarter ended June 30, 2017. We have attached these documents to this Form 6-K as Exhibits 99.9, 99.10, 99.11 and 99.12 respectively.
Pursuant to the requirements of the Securities Exchange Act of 1934, the registrant has duly caused this report to be signed on its behalf by the undersigned, thereunto duly authorized
|
Infosys Limited /s/ A.G.S. Manikantha | |
| Date: June 19, 2017 |
A.G.S. Manikantha Company Secretary |
| Exhibit No. | Description of Document |
| 99.1 | IFRS USD press release |
| 99.2 | IFRS INR press release |
| 99.3 | Transcript of June 14, 2017 television interaction |
| 99.4 | Transcript of June 14, 2017 press conference |
| 99.5 | Fact Sheet regarding Registrant's Profit and Loss Account Summary for the quarters ended June 30, 2017 and 2016 (as per IFRS); Revenue by Geographical Segment, Service Offering, Project Type, and Industry Classification; Information regarding Client Concentration; Employee Information and Metrics; Infrastructure Information; and Consolidated IT Services Information |
| 99.6 | Transcript of June 14, 2017 11:30 a.m. IST Earnings Call |
| 99.7 | Transcript of June 14, 2017 6:00 p.m. IST Earnings Call |
| 99.8 | Form of release to stock exchanges and advertisement placed in Indian newspapers |
| 99.9 | Unaudited Condensed Financial Statements in compliance with IFRS in US Dollars |
| 99.10 | Audited Financial Statements in compliance with IFRS in Indian Rupees and the Auditors Report |
| 99.11 | Ind
AS Condensed Financial Statements |
| 99.12 | Ind
AS Consolidated Financial Statements |
Exhibit 99.1
IFRS USD Press Release
Infosys (NYSE: INFY) announces results for the Quarter ended June 30, 2017
Bangalore, India – July 14, 2017
Q1 revenues grew sequentially by 3.2% in USD terms; 2.7% in constant currency terms
Q1 revenues grew 6.0% year-on-year in USD terms
Q1 operating margin at 24.1%, flat as compared to Q1 17
Utilization excluding trainees increased by 2% to 84%
FY 18 revenue guidance retained at 6.5%-8.5% in constant currency. FY 18 operating margin guidance retained at 23%-25%
Operating cash flow was $ 644 million, as compared to $ 547 million in Q4 17
Liquid assets including cash and cash equivalents and investments were $6,091 million as on June 30, 2017 as compared to $5,979 million as on March 31, 2017
Financial Highlights
Consolidated results under International Financial Reporting Standards (IFRS) for the quarter ended June 30, 2017
· Revenues were $2,651 million for the quarter ended June 30, 2017
QoQ growth of 3.2% in reported terms; 2.7% in constant currency terms
YoY growth of 6.0% in reported terms; 6.3% in constant currency terms
· Operating profit was $638 million for the quarter ended June 30, 2017
QoQ growth of 0.7%; YoY growth of 6.0%
· Net profit was $541 million for the quarter ended June 30, 2017
QoQ decline of 0.4%;YoY growth of 5.8%
“Our persistent focus on execution in Q1 is reflected in broad-based performance on multiple fronts– revenue growth, resilient margins despite multiple headwinds, healthy cash generation and overall business results. I am encouraged by the uptick in revenue per employee for six quarters in a row, and the strong momentum in our new high growth services and software, as we accelerate our focus on innovation-led growth.” said Dr. Vishal Sikka, CEO. “The widespread adoption of our grassroots innovation and education initiatives continue to fuel our transformation, and I am proud to see Infoscions embrace and drive Infosys toward becoming a next-generation services company.”
“We had broad-based growth across geographical and industry segments. Our initiatives on operational discipline led to record levels of utilization and better realization during the quarter.” said U B Pravin Rao, COO. “Our new services and software offerings are helping us strengthen our positioning in the market.”
“Our relentless focus on strong cash generation led to a healthy operating cash flow. Further, our continued emphasis on operational efficiencies enabled us to mitigate the impact of margin headwinds during the quarter.” said M. D. Ranganath, CFO. “We successfully navigated yet another quarter of significant currency volatility through our hedging”
Outlook
The Company’s outlook (consolidated) for the fiscal year ending March 31, 2018, under IFRS is as follows:
| · | Revenues are expected to grow 6.5%-8.5% in constant currency*; |
| · | Revenues are expected to grow 7.1%-9.1% in USD terms based on the exchange rates as of June 30, 2017** |
*FY 17 constant currency rates - AUD/USD – 0.75; Euro/USD – 1.09; GBP/USD – 1.30
**Currency rates as of June 30, 2017 - AUD/USD – 0.77; Euro/USD – 1.14; GBP/USD – 1.30
BUSINESS HIGHLIGHTS
In Q1, we continued to help clients drive automation and innovation into the core of their businesses leveraging our renewed traditional services, our new services in areas such as Cloud Ecosystem, Big Data and Analytics, API and Micro Services, Data and Mainframe Modernization, Cyber Security and IoT Engineering Services, and our software-led offerings, especially our next-generation Artificial Intelligence (AI) Platform Nia. We also continued to drive our cultural transformation through education and learning, leveraging Zero Distance to drive our grassroots innovation culture, introducing new curriculum and training programs for in-demand skills of the future, and building on our strategy to leverage our global talent with the best local talent in the key markets in which we operate.
In April, we launched Infosys Nia, building on and accelerating, our work over the last 2.5 years to help clients embrace AI. With 160+ engagements across 70+ clients, Nia continues to be central to all our conversations with clients as we work with them to transform their businesses.
We further enhanced our global footprint this quarter, in line with our strategy to establish global competency centers, employ the best talent in the market and bring our education and training capabilities closer to our clients. In April, we opened a new Development Center focused on Engineering Services in Croatia. In May, we announced our commitment to hire 10,000 American workers over the next two years and establish four technology and innovation hubs in the U.S. The first will open in Indiana in August 2017 and the second hub will be opened in North Carolina. Additionally, we recently expanded our presence in China with a new campus in Shanghai, to create an ecosystem of local talent training, new tech labs and an incubator for startups.
RENEW
In Q1, we worked closely with clients to renew their traditional IT services and infrastructure, including modernizing their mission critical applications, with key engagements with Edgewell Personal Care, and more.
Edgewell Personal Care, is a US-based consumer products company that manufactures and markets a number of well-known brands, including Schick, Wilkinson Sword, Playtex, Banana Boat, Hawaiian Tropic, Wet Ones and Edge.
“Edgewell partnered with Infosys to implement a leading-edge transformation of our global ERP landscape to drive the company's IT innovation. Over the next 1-2 years, Infosys will deliver SAP S/4 HANA solutions in North America and Asia. These solutions will enable us to deliver significant process simplification and operating efficiencies. As part of this journey, we recently migrated our global Manufacturing system to SAP S/4 HANA and the project successfully went live in May 2017. Infosys is currently engaged in migrating our Order to Cash and Financial Systems to SAP S/4 HANA for North America and also deploying the SAP S/4 HANA global template solution to our Asia Pacific markets. We look forward to continuing our collaboration with Infosys in our ERP modernization journey.” - Tony Bender, Chief Information Officer & Vice President, Global Business Services
PrimeRevenue, a leader in working capital financial technology, optimizes cash flow for more than 20,000 customers in over 70 countries, and processed more than $100 billion in supply chain transactions in 2016.
“We selected Infosys to assist in optimizing our data architecture to support processing billions of dollars in supply chain finance transactions every month. In our quickly growing fintech marketplace, Infosys is one of our key partners supporting PrimeRevenue’s current phase of very high-growth.” - Wes Dean, Chief Technology Officer, PrimeRevenue, Inc.
We also continued to drive grassroots innovation in every project through our Zero Distance (ZD) initiative. We started this program in March 2015, and today, more than 16,500 ideas have been produced, of which more than 2,200 have been implemented with clients globally.
Myer, Australia’s largest department store group and a leader in Australian retailing recently leveraged our Zero Distance idea and deployed the ‘My Picker App’ for fulfilling their retail orders.
“Our ‘My Picker App’ has a huge strategic relevance for Myer, significantly reducing the time to pick and pack orders by 20%, driving down the labor cost of fulfilment by an estimated $1.8m based on FY17 units and rapidly growing our omni channel business. We have been able to reduce our fulfilment duration target from 32.5 hours to 24 hours, and increase our pick success target from 85% to 90%. Infosys proactively partnered and led the way on this project by producing a working prototype to demonstrate how this app would work, converting a concept into reality, and gelling well in a cross- functional agile team with Myer.” - Mark Cripsey, Chief Digital and Data Officer, Myer
NEW
We continued to see momentum in our new services, in our software-led offerings and in leveraging Design Thinking. The new services that we have launched over the course of the last two years are seeing strong traction in key accounts.
Our software portfolio is already forming a critical part of our business, both in terms of amplifying our existing services and in creating new business opportunities. Panaya and Skava have continued their momentum, with Skava now a full-fledged eCommerce platform, extending its reach beyond retail through its micro services based architecture.
We launched the Infosys Boundaryless Data Lake offering powered by the Information Grid Solution on Amazon Web Services (AWS).
“Infosys partnered with Levi Strauss & Co’s e-commerce business to build a first party data analytics solution on AWS. The solution, built by Infosys, enables consumer insights of clickstream and e-commerce data to activate consumer revenue growth actions across marketing touch points.” - Abigail Johnson, Senior Program Manager eCommerce, Levi Strauss & Co
“ERM, the world’s leading sustainability consulting company is working with Infosys to harness technology and data to transform our business. We have embarked on a journey to re-imagine sustainability challenges for our clients by leveraging Design Thinking principles of empathy and rapid prototyping. Innovation is at the heart of this transformation and we believe Design Thinking can help us reinvent our business and create new sources of value. In our recent Design Thinking engagement with Infosys, we believe we have taken the initial steps to transform our ways of thinking about sustainability challenges and mapping them to the Digital Technology ecosystem. I am pleased to say that with Infosys’ help we have started to build the momentum to rapidly prototype Digital solutions and embrace agile ways of working to address sustainability challenges for our global client base.” - Keryn James, Group Chief Executive, ERM
“In partnering with Infosys Consulting, their Design Thinking approach and methodologies helped our team to think out-of-the-box and through a fresh lens around how we could transform our HR onboarding process. This led to new innovations for us around our use of mobile, virtual reality and other digitally-centric experiences that will give our employees an enriching, unique connection to BP.” - Olivier Dubuisson, Employee Experience Director, BP
Adient is the global leader in automotive seating, with revenues of $17 billion and over 200 plants that supplies automotive seats and components for over 25,000,000 cars a year. In response to the rapidly evolving automotive industry, Adient leadership launched a digital transformation, with Design Thinking being a catalyst. Infosys has delivered Design Thinking innovation engagements for Adient regional centers globally, to enable and accelerate this transformation and help Adient on its goal to become an exponential company.
Infosys worked with Spark NZ to design a series of design thinking-based leadership programs for their high potential talent and teams. Over 6 months, in a ‘pop up’ design space in Auckland, 120 leaders from Spark NZ were given new skills and perspectives on how to use Design Thinking to be more competitive in a disruptive market – how to do more with less. Teams of Spark ‘DT Ninjas’ worked with Infosys over 6-8 weeks investigating, designing and Lo-Fi prototyping new ways to address long-term problems for Spark and their customers. Over this period, the teams had intensive bootcamps, ongoing coaching and real ‘fieldwork’ assignments. We’re excited that from the CXO level to the Service Desk, those involved rated this experience with Infosys as one of the most important, valuable and impactful professional development experiences they can remember. Infosys is proud to have played a role in helping add to the digital DNA of Spark NZ – helping their leaders and teams find new ways of finding, framing and solving important problems through design thinking, challenging their assumptions and moving quickly through prototyping with a focus on the customer experience.
TAFE NSW has taken a proactive approach to managing the disruptive forces impacting the training and education market in Australia by focusing on creating innovative solutions that will enable TAFE NSW to meet the needs of students and industry with greater agility. Infosys will help provide TAFE NSW a distinct advantage to drive its transformation and deliver tangible efficiencies by letting it drive its customer centric goals of being a contemporary and sustainable business skilling the NSW workforce, while optimizing, automating and managing its core finance business processes.
As one of the world's largest manufacturers of named brand home improvement and new home construction products, promotions are a critical part of Masco Corporation’s many companies.
“Infosys is helping us take the initial step towards the advanced analytics landscape and drive the predictability of sales and effectiveness of our business. As part of this effort, the Infosys Nia team helped us align our sales data across years and analyze the historical data, the effectiveness of our strategy and the impact of our decisions across various channels.” - Viren Shah, Chief Information Officer, Masco Cabinetry
"By leveraging and integrating a broad set of artificial intelligence technologies, Infosys is supporting customers on their journey toward business transformation. The modular set up of Infosys Nia allows for more flexibility when addressing diverse sets of use cases. On this journey, Infosys' expansive AI and cognitive computing capabilities provide customers with solutions that put data at the center of their service delivery strategies." - Dr. Tom Reuner, Senior Vice-President, HfS Research
The Commercial Bank, Qatar, successfully completed a pilot on a cloud-based blockchain network with Infosys Finacle.
"This pilot has demonstrated the immense potential of blockchain to provide the best customer experience for our clients and given us a glimpse of what more we could do on this powerful platform. We are delighted with the success of this pilot across the Commercial Bank Group and want to expand our cluster to form closed group networks for trade and cash transactions with more banks in South Asia, Egypt, Philippines, UAE and other countries with higher transaction volumes. We hope to leverage what is quickly becoming the largest emerging consortium, in terms of transactions, and offer a wider range of products and services to individuals and organizations alike, on this platform." - Joseph Abraham, Chief Executive Officer, Commercial Bank
Nature’s Bounty is the flagship brand of The Nature’s Bounty Co., a family of wellness brands committed to providing people with high quality products to complement lifestyles and physical health.
“Our decision to partner with Infosys to transform and upgrade our HR, compensation and payroll processes was strategic to streamline and improve HR processes, and meet global rollout deadlines. Infosys implemented innovative solutions to automate processes including CEO approval workflows, self-service applications for end users, an analytics dashboard for management, and a custom tax calculation for payroll.” - Elaine McLaughlin, Senior Director – Payroll and HR Systems, Nature’s Bounty
Leroy-Somer is a world-leading specialist in industrial alternators and drive systems, designing and manufacturing highly innovative eco-technological solutions to serve the industrial and commercial markets.
“We deployed the Oracle Transportation Management Cloud Service in just weeks – a timeframe vital to our business continuity – with the help of Infosys. In addition, we have optimized our supply chain processes, thereby improving customer service significantly.” - Olivier Couret, Logistics Director, Leroy-Somer
“Infosys has helped the College of American Pathologists drive a practice of continuous improvement in our Infrastructure and Applications Support functions. Infosys has learned about our organization, business and processes from working side by side in daily partnership with IS and business team members. They’ve identified and implemented, or helped us implement, improvements in test automation, load testing and refresh process automation, leading to a 90% manual activity reduction, significantly shorter release times, greater environment availability, increased load testing effectiveness, reduced downtime and higher quality. Through recommended process improvements, Infosys has helped us ensure more predictable, reliable, and available environments resulting in significant productivity improvement to our development and release processes. Infosys is further helping us modernize our digital infrastructure. We are actively looking at features that Infosys’ SKAVA offers for eCommerce services including multi-channel capabilities and rapid implementation cycles. SKAVA promises the opportunity to promote our applications on any handheld or desktop device - an increasingly important driver of user adoption and satisfaction.”- Greg Gleason, Chief Information Officer, College of American Pathologists
In Q1, the EdgeVerve business delivered strong performance with 36 wins (Finacle 24 + Edge 12) and 38 go lives (Finacle 21 + Edge 17) from both the Finacle and Edge suite of solutions across various market regions.
Finacle continued to strengthen its position as a platform of choice for digital transformation and enabling new business models for banks.
MauBank, Mauritius, adopted the Infosys Finacle Leasing Solution this quarter.
"MauBank is committed to being the most progressive and preferred bank in Mauritius. Our aim of ensuring world-class banking services along with industry leading growth, is tied to consolidating our operations on best of breed banking platforms. We believe the Finacle Leasing Solution will help us scale our leasing operations and boost productivity, thus positioning the service line as a key business driver." - Sayyad Khodabocus, Head - IT Applications, MauBank
INVESTMENTS & ECOSYSTEM
We continue to deepen our partnerships, invest in technology and expertise that complement our strategy, and participate with clients and partners in the technical communities that drive value for clients and create new opportunities for Infosys.
Huawei signed an Alliance MoU with Infosys to explore joint solutions in the Business Support Systems (BSS) domain bringing together Huawei’s industry leading BSS products and Infosys' strength in Consulting, Systems Integration and Application Development and Maintenance (ADM) services.
Infosys launched the joint Retail Point of Sale (RPOS) and Enterprise Device as a Service (DaaS) solutions to help businesses accelerate digital transformation for the enterprise. This was launched as part of the HP Global System Integrator (GSI) Alliance Program.
Infosys and SmartBear, a leading provider of software quality tools, entered into a strategic alliance this quarter. As part of this alliance, Infosys will support customers who leverage SmartBear tools across the world.
CULTURE
Through this quarter, we have advanced our investments in life-long learning for Infoscions. The Digital Tutor social learning platform which is now made available on cloud and accessible on mobile devices, has gained momentum with 3,528 learning videos that are accessible to our employees. Additionally, the Infosys Learning Platform has been enhanced with 177 courses on topics spanning different technologies and business effectiveness, and has witnessed over 45,000 unique users till date. Following the launch of Infosys Nia in April 2017, we have trained over 2,100 employees in this new product. Design Thinking, the driving force for change at Infosys, has now covered 142,218 employees across the organization. We recently extended our partnership with Udacity, to accelerate the pace of skill adoption in new technologies and industry skills for new trainees.
AWARDS & RECOGNITION
| · | Infosys received awards towards Best CEO, Best CFO and Best Investor Relations at the 2017 All-Asia Executive Team rankings by Institutional Investor magazine in the Technology/IT Services and Software sector |
| · | Infosys positioned as a Leader in NelsonHall Vendor Evaluation & Assessment Tool (NEAT) on Digital Transformation Services |
| · | Infosys inducted into the Winner’s Circle in the HfS Blueprint Guide: Industry 4.0 Services |
| · | Infosys positioned as a Leader in Everest Group’s IT Outsourcing in Capital Markets PEAK Matrix Assessment 2017 |
| · | Infosys positioned as a Leader in Everest Group’s IT Outsourcing in Global Banking PEAK Matrix Assessment 2017 |
| · | Infosys positioned as a Leader in Everest Group’s Independent Testing Services – PEAK Matrix Assessment 2017 |
| · | Infosys inducted into the Winner’s Circle in the HfS Utility Operations 2017 Blueprint Report |
| · | Infosys recognized for accelerating growth, business development, and for excellence in collaboration of license sales and increasing pipeline growth at the Pega Partner Awards |
| · | MongoDB recognized Infosys as its partner of the year in fourth annual MongoDB Innovation Awards |
| · | Infosys Public Services appraised at CMMI® Maturity Level 5 |
| · | Infosys Finacle, jointly with its clients won four awards for banking technology excellence by The Asian Banker |
| · | Infosys Pune became the Largest Campus in the World to Earn LEED Platinum Certification from US Green Building Council |
BEYOND BUSINESS
In India, Infosys Foundation relentlessly pursued its mission of creating a more equitable society by scaling community-driven initiatives and fostering programs aimed at uplifting the underserved. Some of the key initiatives of the quarter included upgradation and renovation of the existing pediatric ward building at Capital Hospital in Odisha, and construction of a major operation theatre complex at Kidwai Memorial Institute of Oncology, Bangalore. The Foundation also invested in the construction of 4-lane road works of Kotekar-Pathuru road near our Mangalore SEZ campus in the interest of public safety, and partnered with Visakha Jilla Nava Nirmana Samithi for distribution and channelization of water through a gravity technique to rural drought-hit villages of Andhra Pradesh.
Infosys Foundation USA hosted its third annual thought leadership conference, CrossRoads, in San Francisco. This one of a kind event in Computer Science and Maker education, featured 20+ panels with 155 participants from 133 organizations from academia, policy-making, and non-profits. The Foundation also announced the 25 winners of the 2017 Infy Maker Awards in a blog written by NASA astronaut Alvin Drew. The Foundation renewed its grant to Carnegie Mellon University to continue support of the CREATE Lab community robotics and social innovation programs at elementary schools in Georgia and Utah. Infosys Foundation USA extended its WhyIMake Maker education awareness campaign by releasing new episodes showcasing famous Makers, actor Nick Offerman and NASA astronaut Don Pettit, to TV networks and broadcasters across the US, resulting in 3,150 nationwide airings reaching over 28 million views.
About Infosys Ltd.
Infosys is a global leader in technology services and consulting. We enable clients in 45 countries to create and execute strategies for their digital transformation. From engineering to application development, knowledge management and business process management, we help our clients find the right problems to solve, and to solve these effectively. Our team of 198,000+ innovators, across the globe, is differentiated by the imagination, knowledge and experience, across industries and technologies that we bring to every project we undertake.
Visit www.infosys.com to see how Infosys (NYSE: INFY) can help your enterprise thrive in the digital age.
Safe Harbor
Certain statements mentioned in this release concerning our future growth prospects are forward-looking statements regarding our future business expectations intended to qualify for the 'safe harbor' under the Private Securities Litigation Reform Act of 1995, which involve a number of risks and uncertainties that could cause actual results to differ materially from those in such forward-looking statements. The risks and uncertainties relating to these statements include, but are not limited to, risks and uncertainties regarding fluctuations in earnings, fluctuations in foreign exchange rates, our ability to manage growth, intense competition in IT services including those factors which may affect our cost advantage, wage increases in India, our ability to attract and retain highly skilled professionals, time and cost overruns on fixed-price, fixed-time frame contracts, client concentration, restrictions on immigration, industry segment concentration, our ability to manage our international operations, reduced demand for technology in our key focus areas, disruptions in telecommunication networks or system failures, our ability to successfully complete and integrate potential acquisitions, liability for damages on our service contracts, the success of the companies in which Infosys has made strategic investments, withdrawal or expiration of governmental fiscal incentives, political instability and regional conflicts, legal restrictions on raising capital or acquiring companies outside India, and unauthorized use of our intellectual property and general economic conditions affecting our industry. Additional risks that could affect our future operating results are more fully described in our United States Securities and Exchange Commission filings including our Annual Report on Form 20-F for the fiscal year ended March 31, 2017. These filings are available at www.sec.gov. Infosys may, from time to time, make additional written and oral forward-looking statements, including statements contained in the company's filings with the Securities and Exchange Commission and our reports to shareholders. The company does not undertake to update any forward-looking statements that may be made from time to time by or on behalf of the company unless it is required by law.
Contact
| Investor Relations | Sandeep Mahindroo +91 80 3980 1018 |
|
Media Relations |
Sarah
Vanita Gideon |
Chiku
Somaiya |
Infosys Limited and subsidiaries
Unaudited Condensed Consolidated Balance Sheets as of
(Dollars in millions except equity share data)
| June 30, 2017 | March 31, 2017 | |
| ASSETS | ||
| Current assets | ||
| Cash and cash equivalents | 3,579 | 3,489 |
| Current investments | 1,609 | 1,538 |
| Trade receivables | 1,934 | 1,900 |
| Unbilled revenue | 611 | 562 |
| Prepayments and other current assets | 822 | 749 |
| Derivative financial instruments | 4 | 44 |
| Total current assets | 8,559 | 8,282 |
| Non-current assets | ||
| Property, plant and equipment | 1,834 | 1,807 |
| Goodwill | 573 | 563 |
| Intangible assets | 113 | 120 |
| Investment in associate | – | 11 |
| Non-current investments | 937 | 984 |
| Deferred income tax assets | 104 | 83 |
| Income tax assets | 941 | 881 |
| Other non-current assets | 117 | 123 |
| Total Non-current assets | 4,619 | 4,572 |
| Total assets | 13,178 | 12,854 |
| LIABILITIES AND EQUITY | ||
| Current liabilities | ||
| Trade payables | 40 | 57 |
| Derivative financial instruments | 7 | – |
| Current income tax liabilities | 703 | 599 |
| Client deposits | 2 | 5 |
| Unearned revenue | 309 | 274 |
| Employee benefit obligations | 220 | 209 |
| Provisions | 63 | 63 |
| Other current liabilities | 1,178 | 954 |
| Total current liabilities | 2,522 | 2,161 |
| Non-current liabilities | ||
| Deferred income tax liabilities | 29 | 32 |
| Other non-current liabilities | 18 | 24 |
| Total liabilities | 2,569 | 2,217 |
| Equity | ||
Share
capital-  5 ($0.16) par value 2,400,000,000 (2,400,000,000) equity shares authorized, issued and outstanding 2,285,679,962
(2,285,655,150), net of 11,264,702 (11,289,514) treasury shares as of June 30, 2017 (March 31, 2017), respectively 5 ($0.16) par value 2,400,000,000 (2,400,000,000) equity shares authorized, issued and outstanding 2,285,679,962
(2,285,655,150), net of 11,264,702 (11,289,514) treasury shares as of June 30, 2017 (March 31, 2017), respectively |
199 | 199 |
| Share premium | 594 | 587 |
| Retained earnings | 12,050 | 12,190 |
| Cash flow hedge reserve | (4) | 6 |
| Other reserves | 51 | – |
| Other components of equity | (2,281) | (2,345) |
| Total equity attributable to equity holders of the company | 10,609 | 10,637 |
| Non-controlling interests | – | – |
| Total equity | 10,609 | 10,637 |
| Total liabilities and equity | 13,178 | 12,854 |
Infosys Limited and subsidiaries
Unaudited Condensed Consolidated Statements of Comprehensive Income
(Dollars in millions except share and per equity share data)
| Three months ended June 30, 2017 | Three months ended June 30, 2016 | |
| Revenues | 2,651 | 2,501 |
| Cost of sales | 1,692 | 1,592 |
| Gross profit | 959 | 909 |
| Operating expenses: | ||
| Selling and marketing expenses | 138 | 137 |
| Administrative expenses | 183 | 170 |
| Total operating expenses | 321 | 307 |
| Operating profit | 638 | 602 |
| Other income, net | 127 | 112 |
| Share in associate's profit / (loss) | – | – |
| Write-down of investment in associate* | (11) | – |
| Profit before income taxes | 754 | 714 |
| Income tax expense | 213 | 203 |
| Net profit | 541 | 511 |
| Other comprehensive income | ||
| Items that will not be reclassified subsequently to profit or loss: | ||
| Re-measurements of the net defined benefit liability/asset | – | (2) |
| Cumulative impact on reversal of unrealized gain on quoted debt securities on adoption of IFRS 9 | – | (5) |
| Equity instruments through other comprehensive income, net | – | – |
| Items that will be reclassified subsequently to profit or loss: | ||
| Fair value changes on investments, net | 4 | – |
| Fair value changes on derivatives designated as cash flow hedge, net | (10) | – |
| Foreign currency translation | 60 | (173) |
| Total other comprehensive income, net of tax | 54 | (180) |
| Total comprehensive income | 595 | 331 |
| Profit attributable to: | ||
| Owners of the Company | 541 | 511 |
| Non-controlling interests | – | – |
| 541 | 511 | |
| Total comprehensive income attributable to: | ||
| Owners of the Company | 595 | 331 |
| Non-controlling interests | – | – |
| 595 | 331 | |
| Earnings per equity share | ||
| Basic ($) | 0.24 | 0.22 |
| Diluted ($) | 0.24 | 0.22 |
| Weighted average equity shares used in computing earnings per equity share | ||
| Basic | 2,285,657,604 | 2,285,622,329 |
| Diluted | 2,287,058,148 | 2,285,768,122 |
| * | During the quarter ended June 30, 2017, the Company has written down the entire carrying value of the investment in its associate DWA Nova LLC, an Infosys Innovation Fund Investment. The impact of write down on Q1 18 net profit is $11 million |
NOTE:
| 1. | The unaudited Condensed Consolidated Balance sheets and Condensed Consolidated Statements of Comprehensive Income for the three months ended June 30, 2017 have been taken on record at the Board meeting held on July 14, 2017 |
| 2. | A Fact Sheet providing the operating metrics of the company can be downloaded from www.infosys.com |
Exhibit 99.2
IFRS INR Press Release
Infosys (NYSE: INFY) announces results for the Quarter ended June 30, 2017
Bangalore, India – July 14, 2017
Q1 revenues grew sequentially by 3.2% in USD terms; 2.7% in constant currency terms
Q1 revenues in INR terms declined 0.2% sequentially; grew 1.8% year-on-year
Q1 operating margin at 24.1%, flat as compared to Q1 17
Utilization excluding trainees increased by 2% to 84%
FY 18 revenue guidance retained at 6.5%-8.5% in constant currency. FY 18 operating margin guidance retained at 23%-25%
Operating cash flow was 4,151 crore,
as compared to 3,625 crore in Q4 17
Liquid assets including cash and cash
equivalents and investments were 39,335 crore as on June 30, 2017 as compared to 38,773 crore as on March 31, 2017
Financial Highlights
Consolidated results under International Financial Reporting Standards (IFRS) for the quarter ended June 30, 2017
· Revenues
were 17,078 crore for the quarter ended June 30, 2017
QoQ decline of 0.2%; YoY growth of 1.8%
· Operating profit was 4,111 crore for the quarter ended June 30, 2017
QoQ decline of 2.4%; YoY growth of 1.6%
·
Net profit was 3,483 crore for the quarter ended June 30, 2017
QoQ decline of 3.3%; YoY growth of 1.4%
“Our persistent focus on execution in Q1 is reflected in broad-based performance on multiple fronts– revenue growth, resilient margins despite multiple headwinds, healthy cash generation and overall business results. I am encouraged by the uptick in revenue per employee for six quarters in a row, and the strong momentum in our new high growth services and software, as we accelerate our focus on innovation-led growth.” said Dr. Vishal Sikka, CEO. “The widespread adoption of our grassroots innovation and education initiatives continue to fuel our transformation, and I am proud to see Infoscions embrace and drive Infosys toward becoming a next-generation services company.”
“We had broad-based growth across geographical and industry segments. Our initiatives on operational discipline led to record levels of utilization and better realization during the quarter.” said U B Pravin Rao, COO. “Our new services and software offerings are helping us strengthen our positioning in the market.”
“Our relentless focus on strong cash generation led to a healthy operating cash flow. Further, our continued emphasis on operational efficiencies enabled us to mitigate the impact of margin headwinds during the quarter.” said M. D. Ranganath, CFO. “We successfully navigated yet another quarter of significant currency volatility through our hedging”
Outlook
The Company’s outlook (consolidated) for the fiscal year ending March 31, 2018, under IFRS is as follows:
| · | Revenues are expected to grow 6.5%-8.5%% in constant currency*; |
| · | Revenues are expected to grow 3.0%-5.0% in INR terms based on the exchange rates as of June 30, 2017** |
*FY 17 constant currency rates - AUD/USD – 0.75; Euro/USD – 1.09; GBP/USD – 1.30
**Currency rates as of June 30, 2017 – 1 US $ = Rs. 64.58
BUSINESS HIGHLIGHTS
In Q1, we continued to help clients drive automation and innovation into the core of their businesses leveraging our renewed traditional services, our new services in areas such as Cloud Ecosystem, Big Data and Analytics, API and Micro Services, Data and Mainframe Modernization, Cyber Security and IoT Engineering Services, and our software-led offerings, especially our next-generation Artificial Intelligence (AI) Platform Nia. We also continued to drive our cultural transformation through education and learning, leveraging Zero Distance to drive our grassroots innovation culture, introducing new curriculum and training programs for in-demand skills of the future, and building on our strategy to leverage our global talent with the best local talent in the key markets in which we operate.
In April, we launched Infosys Nia, building on and accelerating, our work over the last 2.5 years to help clients embrace AI. With 160+ engagements across 70+ clients, Nia continues to be central to all our conversations with clients as we work with them to transform their businesses.
We further enhanced our global footprint this quarter, in line with our strategy to establish global competency centers, employ the best talent in the market and bring our education and training capabilities closer to our clients. In April, we opened a new Development Center focused on Engineering Services in Croatia. In May, we announced our commitment to hire 10,000 American workers over the next two years and establish four technology and innovation hubs in the U.S. The first will open in Indiana in August 2017 and the second hub will be opened in North Carolina. Additionally, we recently expanded our presence in China with a new campus in Shanghai, to create an ecosystem of local talent training, new tech labs and an incubator for startups.
RENEW
In Q1, we worked closely with clients to renew their traditional IT services and infrastructure, including modernizing their mission critical applications, with key engagements with Edgewell Personal Care, and more.
Edgewell Personal Care, is a US-based consumer products company that manufactures and markets a number of well-known brands, including Schick, Wilkinson Sword, Playtex, Banana Boat, Hawaiian Tropic, Wet Ones and Edge.
“Edgewell partnered with Infosys to implement a leading-edge transformation of our global ERP landscape to drive the company's IT innovation. Over the next 1-2 years, Infosys will deliver SAP S/4 HANA solutions in North America and Asia. These solutions will enable us to deliver significant process simplification and operating efficiencies. As part of this journey, we recently migrated our global Manufacturing system to SAP S/4 HANA and the project successfully went live in May 2017. Infosys is currently engaged in migrating our Order to Cash and Financial Systems to SAP S/4 HANA for North America and also deploying the SAP S/4 HANA global template solution to our Asia Pacific markets. We look forward to continuing our collaboration with Infosys in our ERP modernization journey.” - Tony Bender, Chief Information Officer & Vice President, Global Business Services
PrimeRevenue, a leader in working capital financial technology, optimizes cash flow for more than 20,000 customers in over 70 countries, and processed more than $100 billion in supply chain transactions in 2016.
“We selected Infosys to assist in optimizing our data architecture to support processing billions of dollars in supply chain finance transactions every month. In our quickly growing fintech marketplace, Infosys is one of our key partners supporting PrimeRevenue’s current phase of very high-growth.” - Wes Dean, Chief Technology Officer, PrimeRevenue, Inc.
We also continued to drive grassroots innovation in every project through our Zero Distance (ZD) initiative. We started this program in March 2015, and today, more than 16,500 ideas have been produced, of which more than 2,200 have been implemented with clients globally.
Myer, Australia’s largest department store group and a leader in Australian retailing recently leveraged our Zero Distance idea and deployed the ‘My Picker App’ for fulfilling their retail orders.
“Our ‘My Picker App’ has a huge strategic relevance for Myer, significantly reducing the time to pick and pack orders by 20%, driving down the labor cost of fulfilment by an estimated $1.8m based on FY17 units and rapidly growing our omni channel business. We have been able to reduce our fulfilment duration target from 32.5 hours to 24 hours, and increase our pick success target from 85% to 90%. Infosys proactively partnered and led the way on this project by producing a working prototype to demonstrate how this app would work, converting a concept into reality, and gelling well in a cross- functional agile team with Myer.” - Mark Cripsey, Chief Digital and Data Officer, Myer
NEW
We continued to see momentum in our new services, in our software-led offerings and in leveraging Design Thinking. The new services that we have launched over the course of the last two years are seeing strong traction in key accounts.
Our software portfolio is already forming a critical part of our business, both in terms of amplifying our existing services and in creating new business opportunities. Panaya and Skava have continued their momentum, with Skava now a full-fledged eCommerce platform, extending its reach beyond retail through its micro services based architecture.
We launched the Infosys Boundaryless Data Lake offering powered by the Information Grid Solution on Amazon Web Services (AWS).
“Infosys partnered with Levi Strauss & Co’s e-commerce business to build a first party data analytics solution on AWS. The solution, built by Infosys, enables consumer insights of clickstream and e-commerce data to activate consumer revenue growth actions across marketing touch points.” - Abigail Johnson, Senior Program Manager eCommerce, Levi Strauss & Co
“ERM, the world’s leading sustainability consulting company is working with Infosys to harness technology and data to transform our business. We have embarked on a journey to re-imagine sustainability challenges for our clients by leveraging Design Thinking principles of empathy and rapid prototyping. Innovation is at the heart of this transformation and we believe Design Thinking can help us reinvent our business and create new sources of value. In our recent Design Thinking engagement with Infosys, we believe we have taken the initial steps to transform our ways of thinking about sustainability challenges and mapping them to the Digital Technology ecosystem. I am pleased to say that with Infosys’ help we have started to build the momentum to rapidly prototype Digital solutions and embrace agile ways of working to address sustainability challenges for our global client base.” - Keryn James, Group Chief Executive, ERM
“In partnering with Infosys Consulting, their Design Thinking approach and methodologies helped our team to think out-of-the-box and through a fresh lens around how we could transform our HR onboarding process. This led to new innovations for us around our use of mobile, virtual reality and other digitally-centric experiences that will give our employees an enriching, unique connection to BP.” - Olivier Dubuisson, Employee Experience Director, BP
Adient is the global leader in automotive seating, with revenues of $17 billion and over 200 plants that supplies automotive seats and components for over 25,000,000 cars a year. In response to the rapidly evolving automotive industry, Adient leadership launched a digital transformation, with Design Thinking being a catalyst. Infosys has delivered Design Thinking innovation engagements for Adient regional centers globally, to enable and accelerate this transformation and help Adient on its goal to become an exponential company.
Infosys worked with Spark NZ to design a series of design thinking-based leadership programs for their high potential talent and teams. Over 6 months, in a ‘pop up’ design space in Auckland, 120 leaders from Spark NZ were given new skills and perspectives on how to use Design Thinking to be more competitive in a disruptive market – how to do more with less. Teams of Spark ‘DT Ninjas’ worked with Infosys over 6-8 weeks investigating, designing and Lo-Fi prototyping new ways to address long-term problems for Spark and their customers. Over this period, the teams had intensive bootcamps, ongoing coaching and real ‘fieldwork’ assignments. We’re excited that from the CXO level to the Service Desk, those involved rated this experience with Infosys as one of the most important, valuable and impactful professional development experiences they can remember. Infosys is proud to have played a role in helping add to the digital DNA of Spark NZ – helping their leaders and teams find new ways of finding, framing and solving important problems through design thinking, challenging their assumptions and moving quickly through prototyping with a focus on the customer experience.
TAFE NSW has taken a proactive approach to managing the disruptive forces impacting the training and education market in Australia by focusing on creating innovative solutions that will enable TAFE NSW to meet the needs of students and industry with greater agility. Infosys will help provide TAFE NSW a distinct advantage to drive its transformation and deliver tangible efficiencies by letting it drive its customer centric goals of being a contemporary and sustainable business skilling the NSW workforce, while optimizing, automating and managing its core finance business processes.
As one of the world's largest manufacturers of named brand home improvement and new home construction products, promotions are a critical part of Masco Corporation’s many companies.
“Infosys is helping us take the initial step towards the advanced analytics landscape and drive the predictability of sales and effectiveness of our business. As part of this effort, the Infosys Nia team helped us align our sales data across years and analyze the historical data, the effectiveness of our strategy and the impact of our decisions across various channels.” - Viren Shah, Chief Information Officer, Masco Cabinetry
"By leveraging and integrating a broad set of artificial intelligence technologies, Infosys is supporting customers on their journey toward business transformation. The modular set up of Infosys Nia allows for more flexibility when addressing diverse sets of use cases. On this journey, Infosys' expansive AI and cognitive computing capabilities provide customers with solutions that put data at the center of their service delivery strategies." - Dr. Tom Reuner, Senior Vice-President, HfS Research
The Commercial Bank, Qatar, successfully completed a pilot on a cloud-based blockchain network with Infosys Finacle.
"This pilot has demonstrated the immense potential of blockchain to provide the best customer experience for our clients and given us a glimpse of what more we could do on this powerful platform. We are delighted with the success of this pilot across the Commercial Bank Group and want to expand our cluster to form closed group networks for trade and cash transactions with more banks in South Asia, Egypt, Philippines, UAE and other countries with higher transaction volumes. We hope to leverage what is quickly becoming the largest emerging consortium, in terms of transactions, and offer a wider range of products and services to individuals and organizations alike, on this platform." - Joseph Abraham, Chief Executive Officer, Commercial Bank
Nature’s Bounty is the flagship brand of The Nature’s Bounty Co., a family of wellness brands committed to providing people with high quality products to complement lifestyles and physical health.
“Our decision to partner with Infosys to transform and upgrade our HR, compensation and payroll processes was strategic to streamline and improve HR processes, and meet global rollout deadlines. Infosys implemented innovative solutions to automate processes including CEO approval workflows, self-service applications for end users, an analytics dashboard for management, and a custom tax calculation for payroll.” - Elaine McLaughlin, Senior Director – Payroll and HR Systems, Nature’s Bounty
Leroy-Somer is a world-leading specialist in industrial alternators and drive systems, designing and manufacturing highly innovative eco-technological solutions to serve the industrial and commercial markets.
“We deployed the Oracle Transportation Management Cloud Service in just weeks – a timeframe vital to our business continuity – with the help of Infosys. In addition, we have optimized our supply chain processes, thereby improving customer service significantly.” - Olivier Couret, Logistics Director, Leroy-Somer
“Infosys has helped the College of American Pathologists drive a practice of continuous improvement in our Infrastructure and Applications Support functions. Infosys has learned about our organization, business and processes from working side by side in daily partnership with IS and business team members. They’ve identified and implemented, or helped us implement, improvements in test automation, load testing and refresh process automation, leading to a 90% manual activity reduction, significantly shorter release times, greater environment availability, increased load testing effectiveness, reduced downtime and higher quality. Through recommended process improvements, Infosys has helped us ensure more predictable, reliable, and available environments resulting in significant productivity improvement to our development and release processes. Infosys is further helping us modernize our digital infrastructure. We are actively looking at features that Infosys’ SKAVA offers for eCommerce services including multi-channel capabilities and rapid implementation cycles. SKAVA promises the opportunity to promote our applications on any handheld or desktop device - an increasingly important driver of user adoption and satisfaction.”- Greg Gleason, Chief Information Officer, College of American Pathologists
In Q1, the EdgeVerve business delivered strong performance with 36 wins (Finacle 24 + Edge 12) and 38 go lives (Finacle 21 + Edge 17) from both the Finacle and Edge suite of solutions across various market regions.
Finacle continued to strengthen its position as a platform of choice for digital transformation and enabling new business models for banks.
MauBank, Mauritius, adopted the Infosys Finacle Leasing Solution this quarter.
"MauBank is committed to being the most progressive and preferred bank in Mauritius. Our aim of ensuring world-class banking services along with industry leading growth, is tied to consolidating our operations on best of breed banking platforms. We believe the Finacle Leasing Solution will help us scale our leasing operations and boost productivity, thus positioning the service line as a key business driver." - Sayyad Khodabocus, Head - IT Applications, MauBank
INVESTMENTS & ECOSYSTEM
We continue to deepen our partnerships, invest in technology and expertise that complement our strategy, and participate with clients and partners in the technical communities that drive value for clients and create new opportunities for Infosys.
Huawei signed an Alliance MoU with Infosys to explore joint solutions in the Business Support Systems (BSS) domain bringing together Huawei’s industry leading BSS products and Infosys' strength in Consulting, Systems Integration and Application Development and Maintenance (ADM) services.
Infosys launched the joint Retail Point of Sale (RPOS) and Enterprise Device as a Service (DaaS) solutions to help businesses accelerate digital transformation for the enterprise. This was launched as part of the HP Global System Integrator (GSI) Alliance Program.
Infosys and SmartBear, a leading provider of software quality tools, entered into a strategic alliance this quarter. As part of this alliance, Infosys will support customers who leverage SmartBear tools across the world.
CULTURE
Through this quarter, we have advanced our investments in life-long learning for Infoscions. The Digital Tutor social learning platform which is now made available on cloud and accessible on mobile devices, has gained momentum with 3,528 learning videos that are accessible to our employees. Additionally, the Infosys Learning Platform has been enhanced with 177 courses on topics spanning different technologies and business effectiveness, and has witnessed over 45,000 unique users till date. Following the launch of Infosys Nia in April 2017, we have trained over 2,100 employees in this new product. Design Thinking, the driving force for change at Infosys, has now covered 142,218 employees across the organization. We recently extended our partnership with Udacity, to accelerate the pace of skill adoption in new technologies and industry skills for new trainees.
AWARDS & RECOGNITION
| · | Infosys received awards towards Best CEO, Best CFO and Best Investor Relations at the 2017 All-Asia Executive Team rankings by Institutional Investor magazine in the Technology/IT Services and Software sector |
| · | Infosys positioned as a Leader in NelsonHall Vendor Evaluation & Assessment Tool (NEAT) on Digital Transformation Services |
| · | Infosys inducted into the Winner’s Circle in the HfS Blueprint Guide: Industry 4.0 Services |
| · | Infosys positioned as a Leader in Everest Group’s IT Outsourcing in Capital Markets PEAK Matrix Assessment 2017 |
| · | Infosys positioned as a Leader in Everest Group’s IT Outsourcing in Global Banking PEAK Matrix Assessment 2017 |
| · | Infosys positioned as a Leader in Everest Group’s Independent Testing Services – PEAK Matrix Assessment 2017 |
| · | Infosys inducted into the Winner’s Circle in the HfS Utility Operations 2017 Blueprint Report |
| · | Infosys recognized for accelerating growth, business development, and for excellence in collaboration of license sales and increasing pipeline growth at the Pega Partner Awards |
| · | MongoDB recognized Infosys as its partner of the year in fourth annual MongoDB Innovation Awards |
| · | Infosys Public Services appraised at CMMI® Maturity Level 5 |
| · | Infosys Finacle, jointly with its clients won four awards for banking technology excellence by The Asian Banker |
| · | Infosys Pune became the Largest Campus in the World to Earn LEED Platinum Certification from US Green Building Council |
BEYOND BUSINESS
In India, Infosys Foundation relentlessly pursued its mission of creating a more equitable society by scaling community-driven initiatives and fostering programs aimed at uplifting the underserved. Some of the key initiatives of the quarter included upgradation and renovation of the existing pediatric ward building at Capital Hospital in Odisha, and construction of a major operation theatre complex at Kidwai Memorial Institute of Oncology, Bangalore. The Foundation also invested in the construction of 4-lane road works of Kotekar-Pathuru road near our Mangalore SEZ campus in the interest of public safety, and partnered with Visakha Jilla Nava Nirmana Samithi for distribution and channelization of water through a gravity technique to rural drought-hit villages of Andhra Pradesh.
Infosys Foundation USA hosted its third annual thought leadership conference, CrossRoads, in San Francisco. This one of a kind event in Computer Science and Maker education, featured 20+ panels with 155 participants from 133 organizations from academia, policy-making, and non-profits. The Foundation also announced the 25 winners of the 2017 Infy Maker Awards in a blog written by NASA astronaut Alvin Drew. The Foundation renewed its grant to Carnegie Mellon University to continue support of the CREATE Lab community robotics and social innovation programs at elementary schools in Georgia and Utah. Infosys Foundation USA extended its WhyIMake Maker education awareness campaign by releasing new episodes showcasing famous Makers, actor Nick Offerman and NASA astronaut Don Pettit, to TV networks and broadcasters across the US, resulting in 3,150 nationwide airings reaching over 28 million views.
About Infosys Ltd.
Infosys is a global leader in technology services and consulting. We enable clients in 45 countries to create and execute strategies for their digital transformation. From engineering to application development, knowledge management and business process management, we help our clients find the right problems to solve, and to solve these effectively. Our team of 198,000+ innovators, across the globe, is differentiated by the imagination, knowledge and experience, across industries and technologies that we bring to every project we undertake.
Visit www.infosys.com to see how Infosys (NYSE: INFY) can help your enterprise thrive in the digital age.
Safe Harbor
Certain statements mentioned in this release concerning our future growth prospects are forward-looking statements regarding our future business expectations intended to qualify for the 'safe harbor' under the Private Securities Litigation Reform Act of 1995, which involve a number of risks and uncertainties that could cause actual results to differ materially from those in such forward-looking statements. The risks and uncertainties relating to these statements include, but are not limited to, risks and uncertainties regarding fluctuations in earnings, fluctuations in foreign exchange rates, our ability to manage growth, intense competition in IT services including those factors which may affect our cost advantage, wage increases in India, our ability to attract and retain highly skilled professionals, time and cost overruns on fixed-price, fixed-time frame contracts, client concentration, restrictions on immigration, industry segment concentration, our ability to manage our international operations, reduced demand for technology in our key focus areas, disruptions in telecommunication networks or system failures, our ability to successfully complete and integrate potential acquisitions, liability for damages on our service contracts, the success of the companies in which Infosys has made strategic investments, withdrawal or expiration of governmental fiscal incentives, political instability and regional conflicts, legal restrictions on raising capital or acquiring companies outside India, and unauthorized use of our intellectual property and general economic conditions affecting our industry. Additional risks that could affect our future operating results are more fully described in our United States Securities and Exchange Commission filings including our Annual Report on Form 20-F for the fiscal year ended March 31, 2017. These filings are available at www.sec.gov. Infosys may, from time to time, make additional written and oral forward-looking statements, including statements contained in the company's filings with the Securities and Exchange Commission and our reports to shareholders. The company does not undertake to update any forward-looking statements that may be made from time to time by or on behalf of the company unless it is required by law.
Contact
| Investor Relations | Sandeep Mahindroo +91 80 3980 1018 |
|
Media Relations |
Sarah
Vanita Gideon |
Chiku
Somaiya |
Infosys Limited and subsidiaries
Condensed Consolidated Balance Sheets as of
(In crore
except share data)
| June 30, 2017 | March 31, 2017 | ||
| ASSETS | |||
| Current assets | |||
| Cash and cash equivalents | 23,117 | 22,625 | |
| Current investments | 10,388 | 9,970 | |
| Trade receivables | 12,488 | 12,322 | |
| Unbilled revenue | 3,945 | 3,648 | |
| Prepayments and other current assets | 5,312 | 4,856 | |
| Derivative financial instruments | 24 | 284 | |
| Total current assets | 55,274 | 53,705 | |
| Non-current assets | |||
| Property, plant and equipment | 11,848 | 11,716 | |
| Goodwill | 3,701 | 3,652 | |
| Intangible assets | 730 | 776 | |
| Investment in associate | – | 71 | |
| Non-current investments | 6,061 | 6,382 | |
| Deferred income tax assets | 679 | 540 | |
| Income tax assets | 6,076 | 5,716 | |
| Other non-current assets | 756 | 797 | |
| Total Non-current assets | 29,851 | 29,650 | |
| Total assets | 85,125 | 83,355 | |
| LIABILITIES AND EQUITY | |||
| Current liabilities | |||
| Trade payables | 260 | 367 | |
| Derivative financial instruments | 45 | 2 | |
| Current income tax liabilities | 4,539 | 3,885 | |
| Client deposits | 16 | 32 | |
| Unearned revenue | 1,998 | 1,777 | |
| Employee benefit obligations | 1,423 | 1,359 | |
| Provisions | 404 | 405 | |
| Other current liabilities | 7,612 | 6,186 | |
| Total current liabilities | 16,297 | 14,013 | |
| Non-current liabilities | |||
| Deferred income tax liabilities | 197 | 207 | |
| Other non-current liabilities | 117 | 153 | |
| Total liabilities | 16,611 | 14,373 | |
| Equity | |||
| Share capital- 5 par value 240,00,00,000 (240,00,00,000) equity shares authorized, issued and outstanding 228,56,79,962 (228,56,55,150), net of 1,12,64,702 (1,12,89,514) treasury shares, as of June 30, 2017 (March 31, 2017), respectively |
1,144 | 1,144 | |
| Share premium | 2,401 | 2,356 | |
| Retained earnings | 64,149 | 65,056 | |
| Cash flow hedge reserves | (27) | 39 | |
| Other reserves | 329 | – | |
| Other components of equity | 518 | 387 | |
| Total equity attributable to equity holders of the company | 68,514 | 68,982 | |
| Non-controlling interests | – | – | |
| Total equity | 68,514 | 68,982 | |
| Total liabilities and equity | 85,125 | 83,355 | |
Infosys Limited and subsidiaries
Condensed Consolidated Statements of Comprehensive Income
(In crore except equity share and
per equity share data)
|
Three months ended June 30, 2017 |
Three months ended June 30, 2016 | |
| Revenues |
17,078 |
16,782 |
| Cost of sales | 10,900 | 10,681 |
| Gross profit | 6,178 | 6,101 |
| Operating expenses: | ||
| Selling and marketing expenses | 888 | 920 |
| Administrative expenses | 1,179 | 1,134 |
| Total operating expenses | 2,067 | 2,054 |
| Operating profit | 4,111 | 4,047 |
| Other income, net | 814 | 753 |
| Share in associate’s profit/(loss) | – | (2) |
| Write-down of investment in associate* | (71) | – |
| Profit before income taxes | 4,854 | 4,798 |
| Income tax expense | 1,371 | 1,362 |
| Net profit | 3,483 | 3,436 |
| Other comprehensive income | ||
| Items that will not be reclassified subsequently to profit or loss: | ||
| Re-measurement of the net defined benefit liability/asset | (3) | (17) |
| Cumulative impact on reversal of unrealized gain on quoted debt securities on adoption of IFRS 9 |
– |
(35) |
| Equity instruments through other comprehensive income, net | – | – |
| Items that will be reclassified subsequently to profit or loss: | ||
| Fair value changes on derivative designated as cash flow hedge, net | (66) | – |
| Exchange differences on translation of foreign operations | 107 | 38 |
| Fair value changes on investments, net | 27 | – |
| Total other comprehensive income, net of tax | 65 | (14) |
| Total comprehensive income | 3,548 | 3,422 |
| Profit attributable to: | ||
| Owners of the Company | 3,483 | 3,436 |
| Non-controlling interests | – | – |
| 3,483 | 3,436 | |
| Total comprehensive income attributable to: | ||
| Owners of the Company | 3,548 | 3,422 |
| Non-controlling interests | – | – |
| 3,548 | 3,422 | |
| Earnings per equity share | ||
| Basic () |
15.24 | 15.03 |
| Diluted () |
15.23 | 15.03 |
| Weighted average equity shares used in computing earnings per equity share | ||
| Basic | 2,285,657,604 | 2,285,622,329 |
| Diluted | 2,287,058,148 | 2,285,768,122 |
| * | During the quarter ended June 30, 2017, the Company has written down the entire
carrying value of the investment in its associate DWA Nova LLC, an Infosys Innovation Fund Investment. The impact of write down
on Q1 18 net profit is 71 crore |
NOTE:
| 1. | The audited Condensed Consolidated Balance Sheets and Condensed Consolidated Statements of Comprehensive Income for the three months ended June 30, 2017 have been taken on record at the Board meeting held on July 14, 2017 |
| 2. | A Fact Sheet providing the operating metrics of the company can be downloaded from www.infosys.com |
Exhibit 99.3
Common TV Call
COMMON TV CALL
Q1 FY 2018 RESULTS
July 14, 2017
CORPORATE PARTICIPANTs
Vishal Sikka
Chief Executive Officer & Managing Director
Pravin Rao
Chief Operating Officer
M.D. Ranganath
Chief Financial Officer
Ravi Kumar S.
President & Deputy COO
Mohit Joshi
President & Head – Financial Services; Head – Infosys Brazil and Infosys Mexico
Rajesh Krishnamurthy
President & Head of Energy, Utilities, Telecommunications and Services; Head—Infosys Consulting, Head of Europe
Krishnamurthy (Krish) Shankar
Executive Vice President and the Group Head of Human Resource Development
PRESS
Kritika Saxena
CNBC TV18
Maya Sharma
NDTV
Chandra Srikanth
ET NOW
Sakshi Batra
Zee Business
Nishant Desai
Bloomberg-Quint
Vishal Sikka
Good morning, I am very happy with our team’s performance in Q1. We delivered strong overall performance with the great business results in almost all categories. In the previous quarter, myself, Ranga and Pravin had talked about putting in a strong focus on execution. I am really happy to see that we have been able to deliver that and the results are reflected in our performance. We saw 3.2% revenue growth on a reported basis, 2.7% on constant currency basis, and we had good margin performance of 24.1% despite many margin pressures. I am really happy about that. For six quarters in a row, we have improved our revenue per employee. It is now just a whisker below $52,000 and this has come on the basis of strong utilization. Our utilization crossed 84% overall and including freshers, it is 80.2% which is the highest level ever, the 84% without freshers is the highest level in 15-years and the 80.2% is the highest level ever. We also had very strong adoption of automation. Our Nia platform by our delivery teams that led to the saving of several thousand-people’s worth of work in our delivery team as well as the strong adoption of automation and AI in our client base. We had very strong performance in cash generation and our cash position. Ranga will talk about this in more detail.
So overall, I am very happy with our performance. Starting this quarter as promised earlier, we are revealing the new high growth services that we have been focusing on over the last couple of years. So, there are six categories of new services in the Cloud, AI centric area. I am very happy to report that compared to two years ago when these services did not exist we have seen strong in these. Going forward, we will obviously count on strong growth coming from these services. In the last two years, roughly $2 bn in revenue growth that we have seen, half of that has come just from these new services. So, this is something that as we transform our company on the basis of emerging services, of renewing our existing services on the basis of automation and our grassroots innovation, earlier, I drove here to this venue in our own indigenously built autonomous golf cart, this is a test bed that we have built to train thousands of engineers in autonomous driving technology. As we renew our existing services on the basis of these dual forces of automation and innovation, powered by our ability to teach ourselves and growing into completely new areas both in new services and new software that I am really proud of the work that our teams are doing. Thank you.
Participant
My first question to you, Mr. Sikka, is can you elaborate on the segments that have contributed to the positiveness that you have shown in the guidance? Also what kind of impact do you see of wage hike on the margins?
To Pravin, can you give us the sense of the net hire at the end of Q1?
Mr Ranga to you, have you factored in wage hike and the margin as well and how do you aim to set off the impact of rupee appreciation, visa as well as wage hike as well? Lastly, can you give us the total contract value you have garnered by the end of Q1?
Vishal Sikka
So Pravin can talk about the segment performance. We had very strong performance; overall, our core delivery business grew faster than the company. New services that I mentioned earlier, these high growth services contributed 8.3% to our revenue and the new software that did not exist 2.5 years ago has contributed 1.6% of revenue in this quarter. So, these are clearly very high growth areas, future-oriented areas for our clients that are happening. Pravin and Ranga can address the wage hike and the margin.
Pravin Rao
In the segment side, it has been fairly broad-based. We had very strong growth in ECS vertical led by Telecom. Telecom grew on constant currency basis by over 8% quarter-on-quarter. This was led by lot of wins around consolidation and M&A activities. Similarly, in the utility space, we continue to see good traction. There is lot of investment in focusing on green energies, customer service, modernization, censor-based metering and so on and we have been able to capitalize on those opportunities. Energy in this quarter, we have seen good growth after a long time on the back of some of the ramp ups of large deals we have won in the past few quarters. But going forward, we believe that given the volatility in oil prices, the Energy sector will continue to remain sluggish. In Americas, we are seeing lot of focus on energy companies on improvement in efficiencies across the value chain. In Europe, we are seeing an interesting trend where we are seeing mid-tier energy companies trying to take advantages of the volatility in the oil prices. We are also seeing some opportunities in the Greenfield areas in trading and other spaces. Financial Services, we continue to see good traction. The growth has been on the lines of what we expected. Our competitive positioning remains extremely strong in this space and it has allowed us to capture market share in this space in the last few quarters and we continue to remain optimistic. While we have had good growth in Retail this quarter, we expect the volatility to continue. Given the strong currency US dollar, some of the global retailers and CPG companies are getting challenged by the strong US currencies and they are focusing a lot more on cost takeout. There is a lot more focus on omni-channel and supply chain opportunities there. In Manufacturing, overall growth is moderate. We are seeing uptick in Engineering and in Industrials. In Auto, it is a little bit muted. Hi Tech continues to be soft given that most of the companies in the Hi-Tech space is moving away from a high margin license-based models where there are relatively lower margin subscription model. So, there is tremendous focus on cost takeout and we are seeing some slowness there. But barring that, overall, it has been a fairly good growth across segments.
M.D.Ranganath
As Vishal was mentioning on multiple fronts, we have had a very satisfying quarter. Apart from the revenues if you look at the operating margins at 24.1% has been resilient. I will talk about it in more detail later. Likewise, the net profit margin has been at 20.4% and we had a very strong operating cash generation of $644 mn. Consequently, our cash balances have been at the highest at $6.1 bn and Rs.39,335 crores highest ever. The other key factors that I would like to emphasize is if you come to operating margins we had indicated and we have retained 23% to 25% band. If you look at first quarter, our operating margins have been at 24.1% same as Q1 of last year and sequentially it has declined by about 60 basis points. This quarter we had the rupee appreciating. If you look on average basis it is about 3.5%, that impacted the margins by about 80 basis points. At the same time we had some cross-currency advantages which offset to the extent of 20 basis points. More importantly, I think as Vishal and Pravin said, we had a very robust utilization of 84% as compared to 80.5% same quarter last year. Including trainees, it is 80.2% as compared to 76.5% same quarter last year. There have been substantive movements that gave us a positive impact of about 90 basis points. Then as always, we wanted to make sure that all these gains are given back to employees, we announced a very healthy variable pay across levels, that impacted by approximately 1%. Then again, we had higher some subcon cost this quarter. So net-net I think the margin sequentially declined by 60 basis points. However if you compare with Q1 of last year it was steady at 24.1%. So, as you know, we will be announcing the compensation hikes and we are also ramping up the US talent model and rupee continues to be uncertain, so we need to watch. So that is why our band remains as 23%-25%. So that one particular thing remains. Again, coming back to the other factor I would like to point out, you asked about the net headcount addition. This quarter again the net count addition has been negative which is -1,800 people as compared to 3,000+ people same quarter last year. So, in other words, if you look at year-on-year, our headcount has grown by 0.8% whereas the revenue has grown by 6.3%. So that is pretty much reflected in the per capita rather the revenue per employee. So I think these are the broad parameters on multiple fronts. We will continue our relentless focus on operational efficiency and cash generation. If you look at this quarter for example the onsite employee cost as a percentage of revenue if you compare to same quarter last year came down, now it is 38.5% as compared to 39.3% same quarter last year. Subcon went up but primarily because of higher utilization and to some extent onsite demand. Then similarly the overall employee cost as a percentage of revenue also came down as compared to last year. So, we are looking at intensifying the focus on efficiencies as well as the automation. Finally, we believe that whether it is automation, etc., it has to reflect in the P&L. Otherwise, we need to see those impacts on the P&L. However, at this point in time, we retain our margin guidance on account of both rupee part as well as US talent model part. We will be rolling out the compensation increases, so in the subsequent quarters, you will see some impact of this.
Kritika Saxena
Thank you, gentlemen. Kritika Saxena from CNBC TV18. To Vishal, you have increased your dollar revenue guidance, but given the beat in the first quarter, why not increase your constant currency guidance as well. Are you being cautious, is there any form of weakness expected in the coming quarters? You had reiterated last time that by the second half of FY’18, you are expecting a pick up in the deal pipeline, can I expect that you will be upping your guidance then?
To Pravin, Last time you spoke about Consulting, Retail and BFSI, being soft. You already spoke a bit about BFSI and Retail. But can you give us a timeline as to when the recovery will kick in? Even in terms of Consulting, European consulting business was being repurposed which will take about a year. Have the benefits of the repurposing kicked in yet? In terms of manufacturing, what is the reason for the slowdown in this quarter, are there any concerns there?
Ranga, you are moving to US I believe. What is the reason for that? We only know in the press release that it is business reasons. I also wanted to ask you a bit more on wage hike. You spoke that there will be an impact of wage hikes in the next quarter. Can you give us a quantum as to how that would impact margins next quarter? Even reiteration on your capital allocation policy, as Vishal pointed out, what would be the details in terms of what portion would be the dividend, what portion would be the buyback. You said FY’18, when in FY’18?
Vishal Sikka
When it comes to guidance, I have always said that we say it like we see it. As we see in the business environment emerge in front of us if we see a reason to change things and we will. We see positive signs everywhere. However, as Ranga mentioned, our net headcount has actually slightly decreased and our revenue per FTE, revenue per employee has increased for six quarters in a row. So clearly all the strategy levers that we have been working on automation, renewing our services, strong focus on operational efficiency on adoption of new services and new software, all of these things are working, we are now approaching $52,000 in revenue per employee. So this is how the transformation will take shape, this is how the transformation that we have been working on for the last three years is emerging and it is taking place. When it comes to quarterly guidance and so forth, right now, our focus is in this climate to ensure an absolute relentless focus on execution. That is what we are working on and once Q2 is done, if we see a reason to change the guidance, then obviously we will do so. We say it like we see it. If at the end of Q2, we see things differently, then of course, we will let you know.
Pravin Rao
Consulting as we said last time is a one-year recovery plan. We have just completed one quarter and so far, it is tracking to whatever our plans are and we remain optimistic about it. Fundamentally, what we are trying to do is we are trying to repurpose the consulting focus from traditional ERP implementation and consulting services around packages to focusing on new services where we are seeing lot of opportunities. That journey is underway and we are happy with what we have seen in the first quarter. On the Manufacturing side, as I said earlier, if you break down into individual sub-segments, we see fairly decent growth in the Auto space, we are seeing moderate growth in the Aerospace, but High-Tech is where it is relatively soft and we have a big exposure to High-Tech and that is in fact resulting in probably a fairly moderate growth in Manufacturing. We expect this to continue for a period of time particularly on the High-Tech side because if you look at what is happening in the High-Tech space fundamentally, you are seeing companies shifting away from a license-based model to a subscription-based model. Typically license-based model is much more profitable than a subscription-based model. So there is restructuring going on in the client organization, they are focusing on cost takeout, efficiency improvement and so on. So it will take a while for us to recover on the Hi Tech space. Overall it is a mixed bag We remain fairly optimistic about the space over a period of time.
M.D.Ranganath
Coming to the operating margin question, while we have kept it at 24.1%, it has been resilient in Q1. As I said earlier, we had to watch the rupee closely and we have announced the compensation hikes plus the ramp up of the US talent. So, we reiterate 23% to 25%. So, announcement of compensation leads to close to about 1% impact in terms of the operating margin going forward. So that is one part. You can expect that in Q2, for example. Of course, there are other levers that we will continue to focus on, on operational efficiency improvements. Coming to capital allocation policy, as we reiterated earlier, company reiterates its commitment to execute the capital allocation policy in a timely manner in this year itself. As you know, we are a globally listed company, we have a large global shareholder base. So, the distribution mechanism requires certain regulatory approvals which we are working on. So as soon as that is there, the mechanism is something that we want to finalize. So, there is a commitment as given by the company to make sure that it is executed and implemented in this fiscal itself in a very timely manner. Coming to that point, next couple of quarters, we have to focus on the US talent model execution and many other pieces. So, I think next couple of quarters that is necessary. So that is only the reason.
Vishal Sikka
Maybe I can address that as well. Ranga and I work very-very closely together in my early days. For five or six quarters Ranga was based in the US and we used to work extremely closely together and we want to get some of that back, and as you know, we are hiring 10,000 people in the US. We have already hired around 600 out of those, we are opening up new centers, there is a significant transformation happening and the nature of this transformation itself is quite different. So, I need Ranga closer in the US. So, this is why he is moving back. For now, he is moving to the US and obviously we will see how it goes.
Maya Sharma
Maya Sharma from NDTV. With Donald Trump’s heavy “Buy American, Hire American” moves, how much of a challenge is it for Infosys and do you expect any kind of cutback in growth this year and the next few years and I know Mr. Sikka you described yourself as a local hire, but you have already mentioned some figures, but how fast will this hiring be done of local talent? Were you disappointed that Prime Minister Modi did not raise the visa issues with President Trump?
Vishal Sikka
Not at all. I think that all of these point to one underlying reality, which is this is not so much about the visa. It is about innovation, about the changing nature of the workforce, about the changing nature of the priorities of businesses in this time. If you look at the American companies there we are in the throes of a massive digital transformation. The kinds of services, the kinds of capabilities that businesses need in this time are all about being close by being able to work on next-generation technologies rapidly, bringing together local talent with the best of global talent in new ways of working and so forth. So, we already saw this coming. We launched the first of this hiring in 2014 about two or three months after I joined. We launched a program to hire 2000 people in the US. That program was quite successful. We managed to do that more than 2,000 over the next 12-months at that time. We started the US Foundation which has done incredibly inspiring work in bringing computer science education to the masses in the US. So, the third phase of this which we have in fact been working on for more than a year is this 10,000 hiring plan. It is not so much motivated by visas as it is motivated by the changing nature of work, the changing nature of demand and the nature of services. So we are absolutely committed to that and we are talking about 10,000 people, in Indiana we plan to add 500 in the next two years, similar numbers in North Carolina. So we will hire 2000 people in Indiana over the next several years and similarly 2000 people in North Carolina over the next several years. We expect that they will be two or three additional hubs in the US that we will establish as we go forward so which is another reason why Ranga needs to be closer there.
Chandra Srikanth
Hi, Chandra Srikanth from ET NOW. Vishal, I am going to start with you, you know this quarter has been better than expected, but if I look at the correlation with volume and pricing, volume growth is pretty much flat, pricing has improved, so should we see this as a one quarter improvement you know maybe because of some milestone payment that has come in or is it indicative of a broader recovery that you are seeing in demand. Secondly, this quarter also there has been buzz that the promoters may want to sell their stake in Infosys, what is really happening to resolve that overhang because it continues to be an overhang on the company, on the stock, are things more amicable now between the promoters and the board?
Pravin, I did not get the TCV numbers, so if you can give us the TCV number, how close are you to that $1 bn target that you had. Also, TCS mentioned that they are seeing very mixed trends in BFSI and Retail, considering these are important verticals for you as well, is it a secular trend or are you seeing things differently?
Ranga, you mentioned some approvals pending as far as capital allocation is concerned, will these come in by Q2? A timeline that you can give. And this quarter you have been able to sort of improve margins, but with wage hike coming in, do you still have headroom as far as utilization is concerned or is this your optimal number? Thanks.
Vishal Sikka
In terms of the volume, there was no one-off thing, this is a broad-based growth and strong growth. I would even say purposeful growth because we grew in the new areas far faster than in the older areas, more traditional areas, which is exactly how we want this to be. If you look at the volume and realization situation, the volume growth was around 1.7%. We also had a good strong effect of pricing realization this quarter. The realization improved slightly and Ranga will talk about this in more detail. I attribute this to strong execution, to strong high utilization, more purposeful growth where the volume growth does correspond to revenue growth and the adoption of automation, the adoption of new software and new services across the board.
On the other matters, as you can see from our execution when we are focused on execution, good things happen and our team is focused on the business and is delivering to that then great things continue to happen and my own sense is that the promoters are incredibly distinguished people and whatever they decide to do is something that I believe will always be in the interest of the company. Something that I personally always have a high trust for, but I do not want to comment on that any further than that.
Pravin Rao
On the large deal front, it is consistent with last quarter, a big percentage of it is renewals. So going forward our belief is this metric will probably be less relevant because we have now started focusing on new services and new software, and as Vishal talked about if you look back about our growth over the last two years, more than 50% of the growth has come from new services and new software and we will start focusing more on those. New services will typically be more on newer technologies, new space and other things. Large deals are typically associated with Infra, BPO, and those kind of things, whereas new services will be in entirely different way. It is more development oriented, new technologies and so on. Our belief is in future, we are betting hugely on the new services and so on, while we continue to be competitive. We will continue to compete very strongly and winning our fair share of large deals and other things. Our belief is over a period of time that will be less relevant and we want to focus much more on the new services and new software and that is why we are not talking too much about it.
Retail again while this quarter we had a good quarter, but we expect it to be volatile. We have also seen at the same time one of the highest layoffs and store closings particularly in America and so on in the Retail space. So there the competition is very intense and with strengthening dollar, global retailers as well as CPG companies are also challenged. They continue to be focused on cost take-out and reinvestment in supply chain, reinvestment in omni-channel and so on. There are times when we will see spend coming and we are confident we will be able to pick up our share, but we expect this trend of volatility to continue. It is very difficult to predict what will happen in Retail space. BFSI, our performance this quarter relatively was lower than when you look at the track record of what we have been doing in this space, but it is similar to what we expected. We strongly believe that we have a dominant position in this space and we have been able to capture the market share over the last few quarters, so we remain optimistic about this. We are seeing stronger growth in rest of the world and Europe, relatively moderate growth in Americas. There is expectation with the increased interest rate and less focus on regulatory things, that spend will start coming back. Our belief is it will probably happen sometime in the second half or something, but we have to wait and see. We have not seen any signs of it, but there is a belief that we will start seeing some spend at least in Americas also kicking in sometime later this year.
M.D.Ranganath
Coming to the pricing point that you raised, though sequentially it has gone up, more better and true indicator would really be on a year-on-year basis. Because quarter-to-quarter, there could be some volatility on timing differences and things think like that. If you look at year-on-year, it has been flat in the sense that in fact in constant currency basis, it has slightly declined by 0.2% on a year-on-year basis, so that is on pricing. Coming back to the capital allocation policy question that you raised, we reiterate our commitment to execute that in a timely manner. As we are a globally listed company and very large global shareholder base, the mechanism of distribution requires certain regulatory approvals. AOE is only one part but there are certain regulatory approvals that we need and we are kind of want to make sure that as we have given the commitment to our shareholders, we want to close it as quickly as possible.
Chandra Srikanth
Just one follow up on this, are the decision of the promoters weighing on your minds, is that why you are holding off all capital allocation policy, are you waiting for them to take a call on what you are planning?
M.D.Ranganath
Absolutely not. As I said, it is a regulatory approval, so it has nothing to do with any other aspect. We are following it up and as soon as we have an outcome there, we will quickly execute in a timely manner.
Coming back to your other question, for the operating margin we have given a guidance of 23% -25% though we ended the last year at 24.7%, almost 1.7% decline we have shown. The reason that we have indicated that it was taking into account both the Rupee part, the US talent uptick part those were the key pieces. First quarter, yes, we have been resilient in maintaining our margins on the back of a very strong utilization, most importantly even the onsite employee cost as a percentage of revenue, total employee cost as a percentage of revenue, and also we have been prioritizing our capital expenditure. If you look at this quarter, our CAPEX was about $85 mn as compared to about close to $130 mn same period last year, so we are prioritizing, we are optimizing. Having said that if you look at our onsite mix is still high, it has crossed 30%, so we need to work on moderating it. Likewise we need to look at the onsite role ratios and see to what extent this net headcount addition or the per capita revenue that Vishal talked about, how much does that play out and help us. So these are all the factors that we have taken into account in keeping 23% to 25%. So there are levers. It is not that we depend on only one lever, there are levers because I distinctly remember when we were at 80% people said look 80% is high. I think we are also at the same time very cognizant of the fact that these levers at the same time have certain plateau, but we have to work towards overall optimization on multiple fronts, so we are at it.
Sakshi Batra
Hi, very good morning, my name is Sakshi, I am from Zee business. Vishal, my first question will be with you. First of all, many congratulations for the recent award that you got for best CEO and to the whole team and also to Ranga, many, many congratulations on that front and good set of numbers. A big sigh of relief, no one expected execution challenges like last time. I just want to ask you Vishal, first of all what kind of contribution from the new services have you got in this quarter and since your arrival was in a good style in an automated car, can we see that this is an indication of a complete shift to automation and going ahead, we will see some meaningful contribution to the top-line from these new services, if you could please elaborate on that?
Pravin, my question will be with you, looking at positive attrition numbers even this time you have got 16.9% which is a tad bit lower from the previous quarter which is again a good point, so going forward do you see any further room of reduction in attrition numbers as well?
Ranga, first of all on the operating margins front, you have maintained the guidance of 23% to 25%, we agree that there have been some pressures relating to visa costs and rupee appreciation, but were there any sort of cross-currency tailwinds this time to support you and going ahead what kind of margins, can we expect a revival further from 23% to 25%? Thank you.
Vishal Sikka
Thanks so much, Sakshi. First of all, thanks for the kind words on the award. It is actually all the extraordinary work of our amazing finance team, Ranga was the best CFO, both from the buy-side and sell-side analysts and we won several awards for our Finance and Investor Relations team, so very, very proud of that.
On the new services and new software, this is what we are really strongly focused on. When we look at the new services, they are in six different categories, these are all this cloud first, AI first categories. This quarter 8.3% of our revenue has come from new services and 1.6% from new software roughly so that is altogether about 10%. Now, when you look this, these are services that basically did not exist two years ago and if you look at the revenue growth that we have had in the last two years that is about $2 bn, that means half of that revenue growth has come from new services that did not exist more than two years ago. This is why we are so committed to these, and these are our high-growth services that our clients care about, these are about the future technologies such as autonomous driving. And when it comes from these new technologies, there is always a curve of emerging technologies just over the horizon. If you look at these days, voice technologies, chat technologies, virtual reality, augmented reality technologies as well as the strong adoption of AI-based services and AI-based applications. These are the areas that we want to work on, cyber security, modernization of legacy landscapes to the cloud, next-generation analytics and integration of the physical world into the digital with IOT and so on.
With regard to the autonomous car, Sebastian Thrun said recently that the going rate for an autonomous car engineer is several million dollars. I was talking to him about this and we created a program within Mysore to teach our engineers autonomous driving technology and as a part of that Sudeep’s engineering team under Ravi’s leadership have indigenously built this and something that we are really proud of. It is more a mechanism for us to teach our engineers how to build these technologies and so forth. It is more than anything else a symbol that we can be on the cutting edge of this technologies as good as anyone else.
Pravin Rao
On the attrition front typically quarter-1 we expect higher attrition because a lot of people leave for higher education, so in quarter-1 our attrition was 16.9%, we expect this to come down in subsequent quarters, and we also closely track high performance attrition which is much lower, it is about 11.4% or something, much lower than the overall attrition so we do not have too much concern. We continue to focus on re-skilling our employees, engaging them with lot of employee-oriented activities and that focus will continue.
M.D.Ranganath
Coming to your question on margins, if you look at the last two years, we have been successful in keeping it very, very resilient, it was in the band of 24.7% to 25% last two years and despite multiple headwinds that we saw in the last two years whether it is on volatile currency because of Brexit or the pricing or even the compensation increases on multiple fronts, so we held it very resilient last two years. Now, last year we ended at 24.7%, this year we guided 23% to 25% and we indicated that primarily on account of rupee we need to take care of at the same time we want to invest on the US talent model plus of course the compensation. Of course, first quarter, our margins have been stable same as same period last year, 24.1% and 24.1%. At the same time, it has been possible because of very strong focus on the operational efficiencies which I talked about, the utilization at 84% as compared to 80.5% same period last year. Even including trainees, it is 80.2% as compared to 76.5% same period last year. We will continue to focus on these clear operational levers and at the same time we are also aware that we have compensation increases coming up. We also know that rupee is something that we need to watch. So, taking into account though we have 24.1% in Q1 and our band remains as 23% to 25%. We are also prioritizing the capital expenditure and couple of other areas where without diluting the investments for growth that is required, we do not want to dilute that, what are all the measures we want to optimize. Another highlight of the quarter as I said earlier is a very strong and healthy operating cash generation in terms of better collections and other measures. So I think that is a strong focus area which has led to highest ever cash and cash equivalents and liquid assets balance in the balance sheet is Rs. 39,335 crores and $6.1 bn. We will continue our relentless focus on both efficiencies which can reflect in margins as well as a strong generation. We reiterate our margin guidance between 23% to 25% on the back of these additional pieces that I talked about.
Moderator
Thank you gentlemen.
Participant
Kris, just one clarification. On ramping up of US talent when the new DCs were announced, the timeline that was given to hire was about 5 odd years or so, but in terms of the pace of hiring, what kind of numbers do you see annually happening? Ravi, out of the 4 or 5 that you said would be opened in US, when exactly or what is the timeline when we can see all the four centers operational?
Ravi Kumar S.
So, thank you. So here is what we were doing in the US talent model. We otherwise hire in the US. We hire for client locations wherever we have projects. So, this endeavor was to hire for centers which we actually said we are going to hire for and convert our model from an onsite-offshore model to an nearshore-offshore model and the centers were those technology and innovation hubs. So, we said we are going to do 10,000 in 2 years and potentially 5 centers. Our criteria of the centers was we would look for client clusters, good local academic ecosystem because we are going to hire a good number from schools locally and government support. So, we did Indiana in the month of May. We did North Carolina in the month of June. We are now going to shortlist the next few centers as we go forward based on those three criteria. The idea is to hire from schools locally to repurpose and refactor talent from adjacent capabilities and to hire experienced talents, so we are replicating the model we have in India, in the US. We have already done quite a bit of hiring in the first quarter both from schools and experienced talent. We have now started doing training in the US. So last year when we hired campus hires in the US, we actually got them to Mysore. Now, we are locally training them in the US. So, our endeavor now is going to be to locally train, locally build that capability pool and cater to the clients in an onsite-near shore-offshore model. So, these near shore centers would almost become the technology and innovation hubs because work has become much more agile, much closer, the newer and the modern work. The new services which Vishal spoke about is much closer to clients. It is much sticky and it is actually shorter sprints. So that is the plan.
Participant
So you are actually no hurry to really open all the centers in the next 1 or 2 years
Ravi Kumar S.
No, we are going to open. We are going to open in the next few months as we go forward, but we will continue the process of shortlisting, talking to the local government, working with the academic institutions. So, you are going to see more announcements of the next three centers and pretty much we are going to do all of them in this financial year.
Participant
There have been lot of talk on the compensation hike being rolled out. I want to hear from the horse's mouth really what kind of hikes have been rolled out this year and also a few J6 and above what we heard have not been told whether they are going to be given a hike or not, some clarity really on that?
Krishnamurthy (Krish) Shankar
No, I think for example from first of July, we rolled out the compensation increase for all our mid to junior level people. I think these have been very differentiated based on performance and various other metrics, skills, utilizations. We have looked at everything and there has been like for example significant number of people have got double digit increases. While at the same time, there have been some have got no increases, so it has been quite differentiated. So, we have rolled that out from 1st of July. For the other levels, I think we look at it in a staggered way. For the more senior levels, we will take a call as we go and as we see the business and the visibility. I think we will come back with further details on that, but that is all clearly in our consideration. I think talent is very important to us. We want to ensure that the focus for us is really ensuring its performance base. So, we really in the last year or so, we focus a lot more on ensuring that there is differentiation, there is more focus on merit and that our high performers as a group continue to really stay with us. So, I think that would continue as a focus and I think for the other levels, we will announce overtime.
Participant
Ravi, just sense of really the client environment in the US currently, the buzz was on how probably client hike spending pickup has been quite slow and even the discretionary spends for clients is a little muted. What is your own sense when it comes to the clients out of US and what do you hear?
Ravi Kumar S.
Sure. So, what I will do, I will start and I will ask Mohit and Rajesh to add on the view from their industries. I think there is no particular upswing or downswing. It is a fairly stable environment. There are a few sectors which are continuing to change their spend. For example, banking and financial services, the expectation is there is going to be much more spend on the non-regulatory areas because of the new administration which has come in. Retail is under pressure as we know. We all know that the retail sector is under tremendous cost pressure. So, I do not think there has been a significant shift either ways. What really has changed is the spend on new technologies and the spend on digital and the embrace of digital across industries is much more broad based in comparison to the past. So every industry is figuring out what can they do to leverage technology. Every industry is actually putting a digital agenda. Every industry is actually putting an agenda on how to actually generate a revenue stream leveraging technology. So that to me is the big-big bet. Every industry is spending on securing their digital infrastructure. So, most of our customers are spending on cyber security, so that is a very common thing across industries. So Mohit, maybe you are going to add a little bit and Rajesh.
Mohit Joshi
Thanks, Ravi. I think Ravi has sort of said it quite eloquently that it is not that there is a huge cutback or a change in spend. The fact is that the role of technology now is even more important than it ever was. I feel that our software plus services story is resonating very well in the market place. Having said that, obviously in financial services for instance while we have had a moderately good quarter in line with expectations, we had shared last quarter also the fact that we feel that because of the interest rate hikes and because of the change in the regulatory regime, we hope that the spend will come back in the second half of our financial year and we are still holding to that assessment. Our competitive position is very strong. We have done extremely well overall in terms of strengthening that and the areas where we focus, the automation space, the digital space, the data space. These are the areas where our clients are spending. So while we have seen a greater sort of increase in revenues from Europe perspective and from the ROW perspective for financial services, the US remains a key market for us and we remain very optimistic about our long-term and medium-term sort of objectives. As far as insurance is concerned, I think Pravin mentioned this as well on a year-on-year basis, we have seen something like 19% growth right, which is truly spectacular and truly market leading. In other sectors as well, I think Ravi spoke a little bit about retail. Retail is in the middle of a very significant transformation. Many of our clients are traditional retailers. So they are obviously feeling the pain, but equally they are orienting their businesses towards more of the digital and AI led worlds and that in the long run will have a very positive impact for us. All the work that Ravi and his team have done on the US talent plan also goes very long way towards convincing our clients that we are a global company and that we can be a strong local partner for them also in the various parts of the US.
Rajesh Krishnamurthy
Thanks. If you look at the energy, utilities, telecom space, the telecom business has grown really well for us. Year-on-year, we have had close to 15% growth and I think it has come on the back of fairly significant consolidation which is happening in the industry. We have seen a huge number of mergers and acquisitions happening and in that space, consolidation. When consolidation happens, the higher tier vendors get an opportunity to increase their wallet share and that really what has happened. The telecom companies themselves are of course struggling. Revenues are not growing and ARPU is falling etc. They continue to make investments in better infrastructure in 5G and so on. So, I think there are a lot of niche areas where we are able to bring our software story in as well and automation, I think that is helping our game there. If you look at the energy space, while this quarter has been a good quarter, we do expect the year to be quite sluggish. The growth this quarter has primarily been on the back of ramp-ups because of deals which we won in the last couple of quarters. But clearly because of the fluctuation in the oil price, we are seeing extreme focus on cost and we are seeing that their spending is again on a wait and watch kind of perspective. Oil prices have been up and down quite a bit. If you look at the European space because of the change in fluctuation, we are seeing a lot of the mid-tier trading companies using this as an opportunity to make fresh investments and do Greenfield implementations and I think that is a great opportunity for us. Utilities in Europe, we are seeing this trend about the separation between the retail part of the business and the generation business that is creating a lot of opportunities for us. So overall, I think this year so far, we have seen this quarter has been a growth of telecom and a growth of energy, but for the rest of the year, I believe that energy will be relatively flat. We still expect that there are still more opportunities to be harnessed in the telecom space. Thank you.
Nishant Desai
Gentlemen, Nishant Desai from BloombergQuint. I wanted to understand what kind of uptake you are seeing in the financial services and the energy space as well?
Mohit Joshi
I will take the financial services and then I will let my friend Rajesh talk about the energy space. So, look financial services, we have had a moderately good quarter. I think this is in line with the expectations, 2.6% growth on a reported basis and very strong growth in Europe, very strong growth in the rest of the world. From an US perspective, growth has been relatively muted, but we had shared this earlier as well that we feel that the impact of the interest rate hikes is starting to be felt in terms of the increased profitability of the banks. We feel that the regulatory burden is lessening and therefore they will spend more money on discretionary projects and I am still hopeful that we will see that in the second half of the year. While in the rest of the world, we have already seen that. I think the important thing though is while we might see quarter-on-quarter fluctuations, the competitive position of Infosys in this industry is very strong. I feel that we have an outstanding team both in the markets and in delivery, Jasmeet Andrew, Denis, Atul, Jay, Kannan, we have a really strong team in the market and that I feel will result in along with the very powerful message that Vishal has outlined for the strategy as a company, the New-Renew and the culture. I feel that long-term sort of prospects remain extremely good.
Participant
Mohit, actually the Fed rate hike story really has been quite positive for the banking sector in Americas, but really the macro uncertainty over Trump is a big overhang. Is that really kind of reflecting on clients especially banking given the fact that every third month we are hearing that the government to be impeached or not
Mohit Joshi
We don’t want to comment on the political side of it, but it is a fact. When there is uncertainty, clients delay decision making, it is very clear. You have already seen that we have started to see that with large deals that are taking a much longer time to fructify. The overhang that is there about immigration means the clients are thinking about models. We are seeing some increase in some places of captives and degree of insourcing. On the interest rate hikes, you will understand you mentioned that you are already seeing it in the profitability and revenue of banks, but even historically there is a transformation lag between the time their revenues go up and their IT budgets go up and we feel that transformation mechanism is still working and you should give it a few months to see an increase in tax spends. As people get more comfortable that their revenue base is more stable, they will start spending more on technology.
Participant
So the transmission usually takes about 2 quarters.
Mohit Joshi
I think so. I think it takes about 6 months or so, people want to see 2 or 3 good quarters of revenue before they start looking at technology budgets. Nobody really has a fixed annual technology budget like that in 10 years ago. They look at technology budgets every 6 months or so and I think after 2 good quarters, people start to get more comfortable that the revenue base is stable and therefore they can now start looking at more discretionary spend.
Participant
Also, what are the verticals that will see stark improvement as compared to this quarter as we move on?
Mohit Joshi
I think we mentioned the fact that we have done extremely well in Rajesh's vertical. Whether it is energy, telecom, utilities, we have had a very strong performance. Insurance has done extremely well, 19% year-on-year growth. We have done very well in healthcare. Life Sciences, growth has been more moderate. Retail while we have done well this quarter, I think Pravin has also outlined the fact that there are longer term challenges in the sector lot of participants in this sector are under severe stress. The same is true for the CPG business as well. So we are a little bit more cautious about what will happen over the sector longer term, even though it is an undeniable area of strength for us. You have seen this historically, we have been the number one player in the retail CPG sector. We are seeing a lot of traction in the European market which have not been that impacted by what is happening in terms of the dominance of Amazon in the US. The manufacturing sector maybe, I will let Rajesh talk about it.
Rajesh Krishnamurthy
I think manufacturing sector, for the year we have seen there is some traction in the automotive space, renewed investments there. But otherwise because of the hi-tech, there is definite slowdown. I think there are a lot of structural changes happening there. If you look at some of the big OEM players etc., they are really shifting their product portfolios and therefore the investments which they are making are being skewed. So, I think manufacturing probably will only see moderate growth this year as well.
Participant
Thank you, gentlemen.
Rajesh Krishnamurthy
Thank you.
Exhibit 99.4
Press Conference
PRESS CONFERENCE
Q1 FY 2018 RESULTS
July 14, 2017
CORPORATE PARTICIPANTs
Vishal Sikka
Chief Executive Officer & Managing Director
Pravin Rao
Chief Operating Officer
M.D. Ranganath
Chief Financial Officer
Ravi Kumar S.
President & Deputy COO
Mohit Joshi
President & Head – Financial Services; Head – Infosys Brazil and Infosys Mexico
Rajesh Krishnamurthy
President & Head of Energy, Utilities, Telecommunications and Services; Head—Infosys Consulting, Head of Europe
ANALYSTS
Furquan
Deccan Herald
Meenu Shekar
Business India
Rukmini
CNBC
Lohiri
Reuters News
Shruti
Indian Express
Jochelle
ET
Venky
Business Line
Ayan
BS
Arnab
Reuter News
Shilpa
Times
Moderator
Good Afternoon, everyone and thank you for joining us today. Vishal wants to give us the opening remarks.
Vishal Sikka
Thanks, Sara. Good Afternoon, everyone. Welcome to our Quarterly Press Conference. We are happy about the results of our Q1. It was a strong broad-based performance by the team in all aspect of the business. Revenue growth of 3.2%, operating margin at 24.1%, which we are very happy about; record cash generation and cash situation now. Most importantly, the revenue per employee has gone up for six quarters in a row on the back of record utilization, 84% which is the highest in 15 years and including freshers at 80.2% which is the highest ever; as well as the tremendous adoption of automation that we have seen which has led to release of people’s activities as well as improvement in productivity. Overall, I am very happy with the execution in this quarter. In particular, the growth in the new services and the new software that we have now started to disclose starting today as we had promised. So this is new services that we have launched in the last two years since April of 2015, this quarter they have accounted for 8.3% of our revenue and new software which is software that did not exist in April of 2015 has accounted for 1.6% of our Q1 revenues. This means that since April ’15, out of the $2 bn that we have added to our revenue, $1 bn (half of that) has come from this new services and new software which is quite an amazing growth. Going forward, we are going to continue to stay focused on this execution at a time of great transformation in the industry and in our company.
With that, we would love to take some questions.
Participant
Hi, Vishal. Furquan here. So basically there are three-four questions from my side. What I can see your share in BFSI segment has declined by marginal extent. Though there were reports initially before the start of the quarter that due to the tax reforms in United States and the banking sector reforms happening, the BFSI segment is going to pick up. It has not happened till now. When do you expect it to pick up and how much percentage points do you think it will impact your revenues by? Another thing I would like to move on from this thing. See, I was speaking to Kris yesterday. He was telling me that Infrastructure Management revenues have reduced in the past few years for all the IT companies in general. So how far do you think they are going to go down and how do you think that new businesses are going to play a role in it? Third thing on the hiring front. How do you think how much impact does the local hiring and the increase in the hiring will have on your expenses? Fourth, what is the progress on the virtual global delivery system you have been emphasizing on off late? Fifth, about automation. How much jobs do you think is going to create in Infosys in next two to five years?
Vishal Sikka
Mohit will address the Financial, Ravi on the Infrastructure.
Mohit Joshi
Financial Services revenue has not declined. Financial Services revenue has grown by 2.6% for the quarter in reported terms. If you look at the Insurance business, it has grown by over 18% on a year-on-year basis. Even Financial Services on a year-on-year basis has grown at the same rate as the rest of the company. So, this notion that Financial Services is declining is not true. You obviously have quarter-on-quarter variations, and if you look at the past two or three years, I am very proud of the relative performance of Infosys versus our competitors. If you look at the statement about the US Reg reform and the increase in interest rates, as we had stated last quarter, we are quite hopeful that this will start to flow through into technology budget in the second half of the year and that is where we will start to see the growth. If you look at the performance in Financial Services, if you look at Accenture’s performance, if you look at TCS’ performance yesterday, they all reflect the exact same commentary - that growth is muted, but there is optimism that later in the year, the growth will pick up.
Ravi Kumar S
So I am not very sure where you have got the Infra thing. Did you say it is an Infra in the market or…?
Participant
Yes, automation in the Infrastructure Management which is happening parallelly in other companies as well.
Ravi Kumar S
Infrastructure Management is actually one of the fastest growing service lines. Last year, you can see the public reports on Infrastructure as a percentage of revenues, it is actually the fastest growing. Infrastructure Services has three or four big spend areas and we are doing very good on them -- First, there is a significant shift from capex to opex and that is a huge opportunity for us. Infrastructure-as-a service is actually to me the biggest transformation happening in the market. Second, there is a significant increase in revenues attached to cyber security. Every corporation across the industry is investing in it. That is a part of the infrastructure stack. Third, a large number of workloads are going to the Cloud. Earlier, it was just digital workloads, now, it is actually enterprise workloads. So that is a huge opportunity. Service transformation is a huge opportunity. I actually do not see Infrastructure Services muted; I see it as a big opportunity in the market. Now, our numbers are reflective of it as well.
Coming to the US talent model you spoke about? So we made an announcement early in May that we are going to do 10,000 in two years and we have been working on this plan for the last one year. Since last year, we have started ramping up the US hiring, it is in line with how our business growth is. Our business growth is very dichotomous. On one side of the spectrum, we have automation and heavy offshoring especially on the build, run and operate portfolios. On the other side of the business which is the transform side of the business where you build applications, where our new services are which Vishal spoke about. All of them need much more agile sprints, it needs closer connection to clients, and it would need much more high-end capacity to be built locally in the US. So that was a part of the journey. Last year, we hired freshers from campuses in the US, we got them to Mysore, we test-bedded them, we experimented them, now, we are scaling that up. We have launched two centers -- One in Indiana, one in North Carolina. We are going to launch two more over the next few quarters. So it is a part of our plan. There will be dichotomy on our talent pools. The mature core services will go through extreme offshoring and automation, the newer services, the transform services, the build services will need these centers, which we call them innovation and technology hubs. Our model will morph from onsite-offshore model to an onsite-nearshore, those centers that is what we call it. These are innovation and technology hub and an offshore model. So this is a part of our business plan. So really think we are doing the right thing in anticipation of how our future demand is going to be.
Vishal Sikka
In terms of VGDM, we continue to work on to create new work environments and new ways of working like Ravi talked about. In terms of automation, we have been disclosing the number of people equivalent effort that we have released because of automation. We did that also this quarter and it is 3,600 people in this quarter. But what is more important is that the adoption of our Nia platform within our delivery team has picked up significantly and this is something that we are focused on to drive a massive adoption there and development of tools and techniques from within our projects for automation to improve productivity is something that is developing. So, the cumulative result of all of this is that our revenue per employee now $51,921.
Meenu Shekar
Hi, this is Meenu Shekar. Vishal, you mentioned that new services and software accounted for 10% this quarter and Digital has contributed 23%, right? So going ahead, how much do you expect these two groups to contribute… what is your target? Two, what are the investments that you are making in them? Could you give us a sense of what is the overlap in the revenue when we spoke of new services and when we talk of digital, is there any overlap in terms of revenue? One more question, this is regarding the founders. Something you said in the morning was very interesting; you said I believe that whatever they do will always be in the interest of the company. So should we interpret that to mean differences have all been resolved because very public airing of differences did harm the image of the company which was really not in the best interest?
Vishal Sikka
On the Digital, I have always said that 100% of our work is Digital and we write systems and software and build these, implement these for digital computers and new software together is approximately 10% of our revenue this quarter, and if you look over the last two years or so since April of 2015, this has accounted for almost half of the $ 2 bn that we have added in revenue. This is quite a strong growth and this is something that we wish to focus on intensively in the time ahead. Earlier this quarter, Ranga and his team, Ravi and his team analyzed our peer’s definition of Digital and compared that to ours and our number comes to approximately 23% from that point of view and 8.3% is a part of that 23%. Obviously, going forward, this is an area that we will emphasize heavily on. With regard to the founder matter, this is something that we have addressed many times over and I do not want to add any more to that.
Rukmini
Vishal, hi, Rukmini from CNBC. Really two clarifications, very quick -- One, there is a very sharp increase in the attrition rate this quarter and the other one on the Nova business really the entire write-down that has happened, have you actually wound up that business and what is the reason for that? Is there a directional change that you are looking at for the innovation fund itself, if this is the innovation fund investment that has been written down?
Vishal Sikka
In terms of attrition this is seasonal, this quarter our employees pursue a lot of opportunities in higher education and things like that. So this is a result of that. Overall we are satisfied with where we are in attrition as well as in high performer attrition. In fact, from our point of view, we focus heavily now on high performer attrition through our next-generation talent model. From that perspective, the attrition is more or less the same as it was in Q1 of last year. Both are in the same ballpark. So we are happy with where we are on that and high performer attrition obviously continues to be an area of attention for us.
With regard to Nova, this was a spin-out technology from DreamWorks Animation Studios to bring that animation technology to other industries like retail, manufacturing, etc., an extremely promising technology. When DWA was bought by another company, the future of this business became somewhat unclear, we are a minority shareholder in this, less than 20% shareholder. The parent company has decided to wind down this company but the intellectual property is still there. However given that the operations were stopped, this was our decision to take the entire write-down. Innovation Fund is something we deeply believe in. We have to continue to work with start-up companies constantly and these are the young ones in our industry, not only from the point of view of investing in them, but also along the direction of our strategic interest but also to bring start-up companies to our clients in Mohit area, in Rajesh’s area both have done a lot of work in bringing many of the start-up companies in solutions to our clients, to large banks, to utility companies and so on. We have also from for example the engineering services team bring our capabilities into the start-up companies. So all three things that we are quite keen to continue working on.
Participant
Vishal, I need couple more clarities on this thing. So, now lot of employees go on bench regularly from Infosys. In a scenario where Automation training is taking up in Infosys, how do you deal with the employees who have been benched? Second thing, recently Governor of some state of Mexico had come and visited you guys in Bangalore facility and prior to that after Trump came into power, the High Commissioner of Mexico to India said that they would be ready to welcome IT companies in case Trump shuts down the door. Are you looking at an option there? Third thing given that you put emphasis on localization in US, are you planning something on the similar front in European countries as well? Europe?
Vishal Sikka
With regard to Mexico, I think we have a Mexican subsidiary, but the US is more than 60% of our business and it is growing and there is no shortage of opportunity there. In terms of local hiring, this is something that we do, not so much as a result of visa regulation, but Ravi mentioned this earlier in response to the nature of work that is changing, how clients are expecting transformative technology to take shape in new kinds of ways with more local presence where local people working in the rapid iteration are augmented by global talent and so forth. In terms of automation and the hiring, the important thing to keep in mind is that we have even in this quarter, even though our net headcount decreased slightly, we did hire more than 8,600, so hiring is continuing. The rate of growth is slowing down, but we do expect to continue to add more people into the company. The important thing to keep in mind there is that with the advances in automation technology, more and more of the commoditizing jobs are going away and we have to move forward towards next generation jobs towards new areas of opportunity and building new skills for that. So training our existing employees for this new skill. Last quarter we finished 3000 people trained on AI technology and of that 2100 on our Nia platform. We have trained 140,000+ people in Design Thinking and so these are all steps that we are taking to get our employees ahead of this automation curve and to get them become much more innovative.
Participant
Lohiri from Reuters News. I have a question regarding the hiring part as well. So, in July early you said that you are going to create 2000 jobs in North Carolina. So my question is after the promise that you have made regarding creating 1000 jobs in US, will there be a slowdown in hiring in India and do you see a difference when you hire in US and in India and what is the difference exactly to be?
Vishal Sikka
There is absolutely no slowdown in hiring in India. We had talked about 10,000 people in the US in 2 years. We do 10,000 in India in less than two quarters.
Pravin Rao
We have made offers for 19,000 people trainees to join this year and probably 12,000-13,000 will join. We already have more than 1,000 joiners this quarter and during the rest of the year, we will have more people joining. The hiring in US is not really impacting our hiring in India.
Shruti
Shruti here from Indian Express. I had two questions. One, I am keen to know a bit more about your investment into cloud-based Blockchain technology. A lot of banks are showing interest in this. Could you talk a bit about the milestones that you are hoping to achieve as far as this particular technology is concerned? And two is that you have hired a lot of freshers. How different is your training approach going to be in terms of equipping them for the change in the job scenario?
Vishal Sikka
We are doing a lot of work in Blockchain, perhaps Ravi and Mohit can talk about this. We launched our Blockchain network in this last quarter and we have the first clients, first banks in the United Arab Emirates and other parts of the world that have already adopted the Blockchain capabilities in our software. Ravi has built tremendous capability in this area. We are still sometime away from large scale adoption of Blockchain but when that happens, we will be prepared for that. We are already doing leading Edge work on this. What was the other question?
In terms of the training, over the last 2 years, we have very significantly revamped the way that we train our employees. In our Mysore campus, that changes in what we train on and there we have made huge investments in training in new capabilities, new areas like AI, like Design Thinking, like Agile and DevOps and Scrum and new technologies. These are vital to the future. We just crossed 142,000 people on Design Thinking. We have trained 3000 people intensively in AI technology and so forth. Earlier today, we showcased this autonomous golf cart that we have built, the cart itself is built by many industries and there was some confusion about that on Twitter. But the software in that to drive this cart is built by us indigenously together with IIIT Delhi and that work has exclusively happened in our Mysore campus. This is an example of the kind of things that we are using to teach our employees. We have built that autonomous systems in the cart in order to teach our employees to build autonomous driving technology. One particular thing that I wanted to emphasize, we implemented a new system called the Infosys Learning Platform in early 2015 and the results of that have been quite dramatic. We have changed our foundational training program. It is a real-time collaborative social learning platform and more than 100,000 Infoscions have taken classes using ILP now. For example, in the foundation program, we do not teach 1 programming language anymore, we teach 3 languages simultaneously. This program has had a dramatic impact in our trainees learning new technology. The pass rate of trainees has gone up by 20% from 45% to 65% as a result of these technologies. We have a digital tutor that we have built and all of us have built videos for this. There are more than 3500 videos on it and again more than 100,000 Infoscions have taken advantage of it. So we continue to invest heavily in not only teaching new things, but also teaching them in new kinds of ways. We have done a partnership with Udacity to teach the new kids that come into our workforce in the United States in the new skills. It is not only us teaching that, we just hired a new dean for our US education, but we have also partnered with Udacity to do this. The reason this is so important is because as technology advances, as technological advance becomes faster, we have to equip our employees with new ways to learn, with new skills to learn. So our continual investment in education is going to be absolutely crucial to make that happen.
Shruti
Just one clarification. How much of a boost was executing the GST projects since it kicked off in July? Did that help at all as far as this quarter is concerned or will it have an effect in the next quarter, just wanted to understand the contribution of that particular contract?
M.D. Ranganath
Incremental revenue from Q4 from GST was negligible.
Vishal Sikka
Although Binod is sitting right here and the GST work has boosted his weight at a little bit because of all the effort that he has put on.
Shruti
No, but will it start contributing in a meaningful fashion from the next quarter?
M.D. Ranganath
I think GST project already has a trajectory of execution based on the milestones. It has an implementation phase and maintenance phase. I think to your specific question, this particular quarter the incremental revenue as compared to last quarter from GST is negligible. It has its own trajectory.
Shruti
No, I think because I do not know I read somewhere in analyst report. They are saying the core business it has not gone up significantly, most of the segments are flat. So, they are trying to figure out if there was a boost from GST or from some other fact?
M.D. Ranganath
No
Jochelle
Jochelle from ET. Mr. Ranganath going to be relocated to the US for business reasons. Could you maybe elaborate what those reasons are? Just a second question, there was a write down of DWA, but then we also saw the sale of Cloudyn which you have got 400,000 more than you would put in, can you just give me a sense of how you determine the success of an investment in the fund and is there a metric that you look at for the fund as a whole?
Vishal Sikka
When I started, Ranga used to run my office as well as our strategic operations and he was based in the US for the first 5 or 6 quarters. We used to work extremely closely together and then he became CFO, he moved back here for some time. Now if you look at what we are doing in the US, there is a lot going on. We are hiring 10,000 people in the next 2 years. We are working on creating new environment because we are now hiring much more locally, so we have to change the processes and the benefits and all of these things. We will be putting together these new centers, the innovation centers and so on. There is a significant shift in transformation happening in the way that we are working there. So we need his help there. I need him close by again and this is again one thing that as we executed in the course of this quarter that became very clear that this is something that we need to do.
In terms of the fund, it is similar to other funds that other companies create it is around, obviously first and foremost the financial returns, but also the returns along the strategic dimensions, how much revenue downstream revenue that we are getting as a result of the investments, how much benefit are we getting to our ability to reskill our people and build new capabilities and things of this nature. So as you said Cloudyn had a nice successful exit, DWA Nova had this write down. It has been about 2.5 years since we have had the fund and this is how you work with the young companies in this industry, there is a significant failure rate and we have to be prepared to take these kinds of risk.
Venky
Venky, Business Line. Despite a good performance, improved performance, you have still not up the guidance in terms of constant currency. Are you concerned about the sustainability part of it? Any particular?
Vishal Sikka
Not concerned about anything. We are quite excited and we are focused on execution. At half way point of the year, if we see any reason to change things, then obviously we will let you know. But for now as one of the analysts had said we say it like we see it.
Ayan
Hi Vishal, Ayan from BS. So two quick questions. You have completed 3 years last month. What do you believe have been the key changes at Infosys and the second question is if you look at the headcount, net addition in Q1, this time it was 1800 less people, but if you look at Q1 2016 and 2015, almost is more or less there has been 3000 people net addition. Why is that and is it going to be a trend from now on?
Vishal Sikka
So let me take the second one first. The trend is and Ranga talked about this earlier. The rate of growth is slowing down because of better operational efficiency, utilization and especially because of automation. The number of people is coming down. As we get more software adopted, right now it is 1.6% of this quarter's number. As more software becomes part of our business, as more new services become a part of our business and as automation kicks in the work that we do, then you will see that some of the non-linear effects show up and so the rate of people growth slows down. Having said that, I do believe that we will continue to add significant number of people in the company and Pravin mentioned the statistics in that area.
In terms of the three years, last month marked the three years since I was announced and then shortly in the next couple of weeks, it will be 3 years since I started as CEO. It is quite astonishing to first of all to realize that it has already been 3 years. I think if you look back on the time when I started, our growth rate was significantly lower than the growth rate of our peers in the industry. It was half, sometimes even one-third of the growth of others and the attrition was quite high and so forth. From a basic business performance, there has been significant improvement, we are now consistently among the leading companies in the industry once again. In FY 16, we had the leading performance. In FY 17, with the exception of one company, we had a leading performance and we have achieved that while continuing a steadfast focus on margins on cash generation and so forth. But more than that what I feel really good about is the transformation in the mindset and the employees are creating a culture of grassroots innovation, embrace of software at a much wider scale and things of this nature, the education initiatives that I talked about and things like that. Ravi and I have done since March 2015 probably 40 or so Zero Distance town halls and we do these town halls where Infoscions come and present their Zero Distance initiative ideas of what they have come up with in their projects. This time around we saw an astonishing product innovation in Rajesh’s area. One of the cable companies that makes transmission cables and things like this had invented a technology to coat the cable with a coating that protects the cable itself and they challenged our team in a design session to see if they can figure out a way to get the coating into the cable. So they have invented a robot, the prototype cost us about $7000 to put together. It is a small 15 kilo robot that moves around on this cable, clean them up and coats them automatically. It is an amazing thing that this team did. I feel really proud of that to see the creative confidence of the Infosciaos the way it has jumped up.
Arnab
Hi, Vishal, Arnab from Reuters News. I was wondering if there is any update on how the $2 bn will be given back to the shareholders?
M.D. Ranganath
As you know in April, the Board announced a very specific capital allocation policy. It covered both pieces. One, how much of the future cash flow generated will be returned back to the shareholders and it talked about up to 70% of the cash flow on an ongoing basis. The second was also on out of the cash on the Balance Sheet, how much will be returned to the shareholders in Fiscal ‘18 and it was up to 13,000 crore. So it is a very clearly articulated policy. As you know, we are a globally listed company, we have significant global shareholders which essentially means any distribution mechanism to the shareholders requires multiple regulatory approvals in India and outside. We are working towards that and the commitment of the company is to execute that policy as quickly as possible. We have to wait for those approvals and we need to make sure that those approvals happen in time.
Shilpa
Would there be a casualty?
M.D. Ranganath
Well, I when we give the guidance, we gave 23% to 25% and last year was 24.7%. Last two years, we have been resilient in our operating margin despite comp hikes, despite cross currency, despite pricing. We focused on operational efficiency and delivered last two years. This year we are very conscious when we gave the 23% to 25% which looked like the reduced band as compared to the previous year for three reasons. One is of course the Rupee which has already appreciated by 3.5%, the second one is the US Talent Model and the third one of course is the compensation hikes. We have announced today for almost 80% of our employees. In the first quarter, we had 24.1% operating margin as compared to 24.1% last year as well. We had lot of headwinds this quarter, for example, the Rupee impacted the operating margin by 80 basis points and cross currency gave a benefit of only 20 basis. We increased the variable pay and there was additional subcon cost that had headwinds of 140 basis points. Of course that was offset by higher utilization, I think Ravi’s team has done a fantastic job, 80% to 84% in one year. Coming to your point, yes, we will be having a certain impact on the compensation hikes and that is already baked into our guidance.
Participant
Back to your investments in digital and the new services, new technologies etc., could you quantify the kind of investments you made till now and going ahead what kind of investments are you looking at?
Vishal Sikka
Primarily in developing skills and hiring people, in some cases because of shortage of certain business conditions subcontracting expenses, but primarily the organic way to build that is through skill building and education and then in software. Under Pervinder’s leadership, we are investing in more software capabilities and so on. All of that as Ranga said factored in the guidance that we provide.
Participant
Sir, are there some challenges on the delivery front in the erstwhile Mana account especially in McDonald’s there were challenges, more recently the Reckitt Benckiser infrastructure outage was an issue. Will it have any revenue implications, can you take us through why there has been some slipups in the delivery?
Vishal Sikka
We do not comment specifically on client issues. I do not know where this speculation is coming from around these accounts. The Nia portfolio has seen dramatic growth. We have more than 70 accounts of Nia with more than 160 scenarios deployed and this is quite a dramatic growth in the adoption of these. Beyond the automation and the impact of automation-led productivity on our existing services, the thing that has been really very inspiring to see over the last one year is the embrace of new business solutions built on the Nia platform and that is something that we are really good at. They span all the way from regulatory documents and process compliance-related work in banks and logistics companies and so forth to understanding customer behavior and forecasting revenues, forecasting costs in much more granular ways to legal world, to work in maintenance of software and source code level maintenance. It is really quite an astonishing range, in Telco and Rajesh’s area, understanding customer churn, with remarkable accuracy being able to predict customer churn with machine learning, deep learning techniques. Nia has seen quite a remarkable growth and something that we are very proud of.
Participant
Vishal, in these three years as CEO what would you say has been your biggest challenges for you personally both internally and externally in leading Infosys?
Vishal Sikka
Lots of grey hair, not enough sleep, lots of travel, not enough exercise.
Participant
On a more serious note?
Vishal Sikka
Transformation at any large-scale is never easy. Especially in our case in the case of IT services not only at Infosys but in general in the industry where our core business is being commoditized and under margin pressure, which is usually not the case when you deal with the transformation. It is never easy and we are a globally distributed leadership team. When I started, Pravin and I used to split our responsibilities and we were inheriting the company from three founders and five executive board members who used to collectively be responsible for the company. So it is not easy to lead the company in times like that. But I would say that I have been really astonished by the spirit in Infosys, by the warmth in the company and how change has been embraced, how new ideas have been embraced. I mentioned Zero Distance earlier. We have more than 16,000 ideas that the teams have come up with. Within nine months of launching the program, we have reached 100% coverage and since then we have been elevating the nature of the work that the teams do. In parallel to that we have introduced these completely new areas. Earlier today in my Earnings Call, I was describing the Design Thinking-led success at many clients like BP, Adient, RWE and companies like this. It is quite astonishing how quickly the company has embraced all these new services that we are talking about in the six categories that are around 25 sub-services. Ravi and I have been working on this for the last two years with a weekly and sometimes even daily tracking of the progress. So the embrace of change, the embrace of new ideas in the company has been quite extraordinary and I feel really proud of that.
Participant
If you see Quarter-on-Quarter and Year-on-Year, the gross client addition has been decreasing. I know you have kept your revenue guidance intact, but going forward do you think this is a bit of a concern?
Vishal Sikka
No, it is not. May be Mohit can add to this but we want to have very deep, developing, and strong growing relationships with our clients. If you look at the bulk of the clients, the growth there has been quite amazing and Mohit has put together a dedicated effort on new client addition and how we will pursue that. So on the whole this is not something that I am concerned about at all.
Mohit Joshi
Thanks Vishal. If you look at just gross clients addition, that is really not very predictable for revenue because if you look at our client base currently may be about 300 clients will account for well over 90% of our revenue. What you should really be looking at is are we adding more $50 to $100 mn clients, are we adding more $100 mn clients and the answer to that in almost every single case is ‘yes’. We are looking at our existing client base to see how we can deepen the client relationships, mine them better and when we do add clients, we want to focus on the much larger clients - the Fortune 500, the Global 2000 clients. If we are adding smaller clients, we want to add the clients that really have disruptive business process or disruptive technology or are in a part of the world where we are looking to establish our footprint. So taken by itself a lower number in a single quarter is really not a warning sign.
Participant
Just to add on that, in Q1 FY16 you actually added three clients to the 100+ mn category, but this quarter you actually lost one?
Mohit Joshi
This is just a minor fluctuation of plus or minus of few million dollars that has resulted in client moving from one bucket to the other, it is not a client loss.
Participant
On a note that you see is there is like a sense of caution among the clients, overall, is there a sense of caution?
Mohit Joshi
I do not think there is a sense of caution, IT and tech spending growth rates across the world are really very focused on the digital transformation of companies, spend across sectors continues to grow moderately. It is not a question of it falling off a cliff, but equally it is not a question that it is going to go up in an exponential fashion.
Vishal Sikka
Thank you very much.
Exhibit 99.5
Fact Sheet


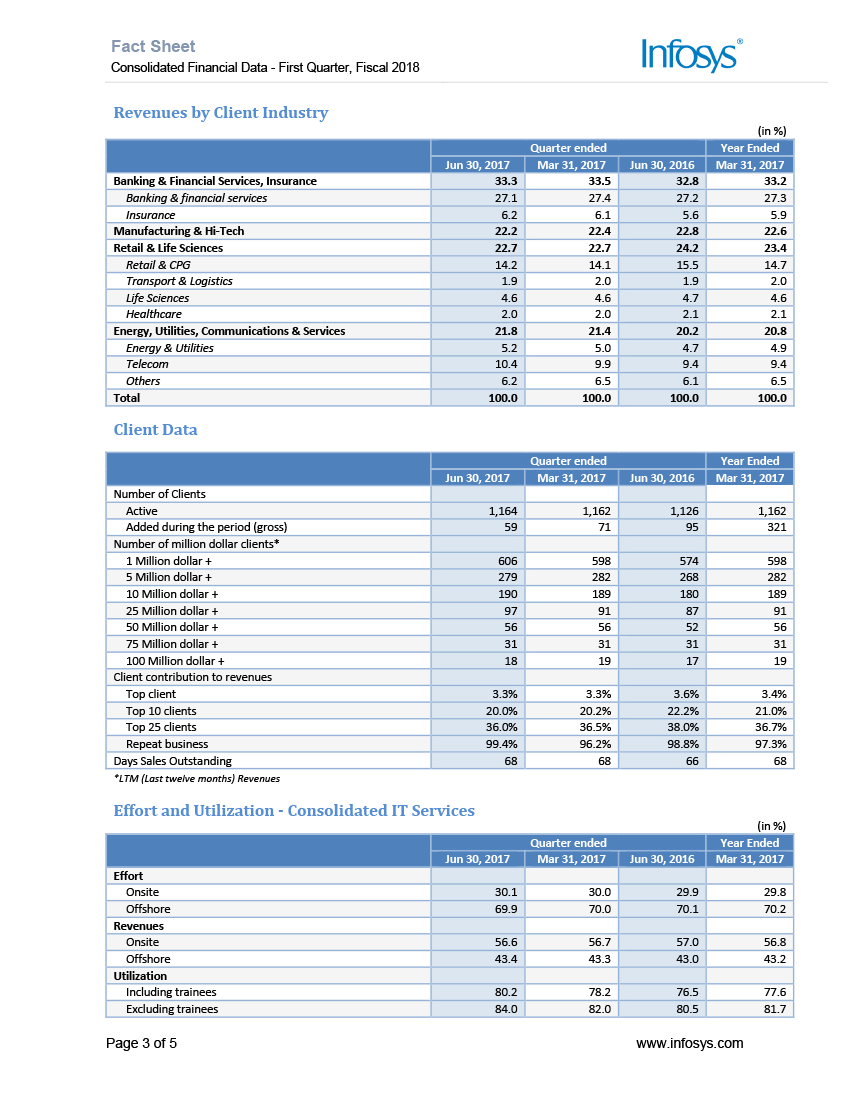


Exhibit 99.6
Earnings Call 1
EARNINGS CALL-1
Q1 2018 RESULTS
July 14, 2017
CORPORATE PARTICIPANTS
Vishal Sikka
Chief Executive Officer & Managing Director
Pravin Rao
Chief Operating Officer
M.D. Ranganath
Chief Financial Officer
Ravi Kumar S.
President & Deputy COO
Mohit Joshi
President & Head – Financial Services; Head – Infosys Brazil and Infosys Mexico
Rajesh Krishnamurthy
President & Head of Energy, Utilities, Telecommunications and Services; Head—Infosys Consulting, Head of Europe
investors
Edward Caso
Wells Fargo
Diviya Nagarajan
UBS
Viju George
JP Morgan
Yogesh Agarwal
HSBC
Priya Rohira
Axis Capital
Ashish Chopra
Motilal Oswal Securities
Sumeet Jain
Goldman Sachs
Moderator
Ladies and Gentlemen, Good Day and Welcome to the Infosys Earnings Conference Call. As a reminder, all participant lines will be in the listen-only mode and there will be an opportunity for you to ask questions after the presentation concludes. Should you need assistance during the conference call, please signal an operator by pressing ‘*’ then ‘0’ on your touchtone telephone. Please note that this conference is being recorded. I would now like to hand the conference over to Sandeep Mahindroo. Thank you and over to you sir.
Sandeep Mahindroo
Thanks, Karuna. Hello, everyone and welcome to Infosys earnings call to discuss Q1 FY18 results. I am Sandeep from the Investor Relations team in Bangalore. Joining us today on this call is CEO and M.D. Dr. Vishal Sikka; COO Mr. Pravin Rao, CFO Mr. M.D. Ranganath, Presidents and the other members of the senior management team.
We will start the call with some remarks on the performance of the company by Dr. Sikka and Ranganath, subsequent to which we will open up the call for questions. Please note that anything which we say which refers to our outlook for the future is a forward-looking statement which must be read in conjunction with the risks that the company faces. A full statement and explanation of these risks is available in our filings with the SEC which can be found on www.sec.gov
I would now like to pass it on to Dr. Sikka.
Vishal Sikka
Thanks, Sandeep. Hi, Everyone. Thanks for joining.
I am really proud of our achievements in Q1. It was the passion, focus and execution of our management team and of every Infoscion to steadfastly continue on our path to transformation. We are deeply convinced of the differentiated value that we can deliver to clients, helping them leverage the power of AI and Design Thinking to reimagine their business. We can do this through our learnability and our culture of innovation in which every Infoscion is empowered to be a proactive problem-finder.
During the previous earnings call, I had emphasized our relentless focus and our commitment to execution in Q1. This is reflected in our all-around performance in Q1 - solid constant currency revenue growth, resilient margins despite multiple headwinds, record cash generation, improvement in utilization, improvement in revenue productivity per employee and uptick in revenue per FTE. Ranga will provide more colors on this shortly.
In Q1, our revenues grew sequentially by 3.2% on reported dollar basis and 2.7% on constant currency basis. Growth was distributed between both volumes and realization with volumes growing by 1.7% quarter-on-quarter and realization growing 1.8% quarter-on-quarter. On a year-on-year basis, revenues grew by 6% on reported dollar basis and 6.3% on constant currency basis. INR revenues declined by 0.2% sequentially due to rupee appreciation and increased by 1.8% on year-on-year basis. Our utilization excluding trainees was 84% which is the highest level in 15 years and including trainees the utilization was 80.2% which is at its highest level ever.
I am happy to share that driven by our improved performance compared to the last few quarters, we are paying higher variable pay to our employees this quarter. Consistent with recent quarters, the percentage payout will be higher at lower levels and lower at senior management and leadership levels. Within each level, we will continue to strive towards higher performance differentiation through different payout level. Attrition was at 16.9% on a standalone basis as compared to 15.8% in Q1 of last year and 13.5% in Q4 of last year owing to seasonality when employees leave to pursue higher studies.
We had broad-based growth across verticals and geographies including Financial Services & Insurance, Retail, CPG, Energy and Communications Services verticals. On Financial Services, our growth is expected to pick up in the second half of the fiscal year as the impact of increased interest rates and lower regulatory pressures in the US, start to reflect in client spending.
Consistent with our commentary last quarter on higher disclosures for the high growth Cloud First, AI First areas that are strategic to our clients, this quarter we have disclosed revenues from new services and software that we started since the 1st of April 2015. 8.3% of Q1 revenues came from these new services that were launched in the last two years. Similarly, 1.6% of our Q1 revenues came from new software started since the 1st of April 2015 comprising of Edge, Nia- our next-generation AI platform, Panaya and Skava.
In management, we also welcome Inderpreet Sawhney to Infosys as our new General Counsel. Inderpreet brings to Infosys a wealth of critical experience at large complex global firms, as well as small innovative ones from India to Silicon Valley, to help us become a much more global, agile organization whilst upholding the highest standards of integrity and governance.
Finally, we announced plans to hire 10,000 American workers over the next two years and establish four innovation hubs with the first two in Indiana and North Carolina where we will hire 2,000 people each in the next few years. In Q1, more than 600 US workers have already been hired. This is a continuation of plans that we launched in 2014 starting with 2,000 Americans, to get closer to clients, deliver new high touch, high value services, leverage the best local and global talent and also build the next-generation of innovators through world-class education and training.
Now, let me share some specifics of our strategy execution. In renewing traditional services in Q1, through our Zero Distance program, we delivered grass-roots innovation leveraging Design Thinking. To-date more than 16,500 ideas have been generated and more than 2,200 of these already implemented with clients including in Australia, Myers, My Picker App that was used for fulfilling retail orders much more efficiently with a great user experience. We are now evolving to Zero Distance 3.0 with a strong focus on themes and solutions. From the 16,500 ideas, the teams have synthesized more than 75 themes including health monitoring, insurance claims adjudication, digital farming, cyber security and others with a potential for reuse, conversion into packet solutions and IP creation. We continue to drive automation into our service lines saving more than 3,500 FTEs worth of effort in Q1. Beyond saving FTEs, we have seen radical use cases of Nia within our services. Nia is being used for large scale transformation within AMS as well as to drive cost savings in managed projects. Our Zero Bench program continues to thrive with more than 42,000 work packets created and 24,000 work packets completed by the end of Q1. In addition, our talent on the bench is being reskilled and upskilled in areas such as UI, Business Intelligence and Mobile, or gaining hands-on experiences in client engagement.
In New Digital Services, we continue to build out our new higher growth, higher margin, higher RPE services which are exactly in line with clients most important business needs and we are seeing strong traction in these. Cyber Security, for example, is one of our fastest growing new services given the heightened awareness at the CXO level due to recent events.
Coming to new Software-led offering, in Q1, we saw continued momentum in Nia, Skava, Edge and Panaya. We launched Nia in April, building on and accelerating our work over the last 2.5 years with our first-generation AI platform and together with IIP and AssistEdge. Now with more than 160 AI-based scenarios across 70 clients, Nia is central to all our conversations with clients. What started as a journey of IT use cases, quickly moved to strategic areas such as sales operations, demand sensing, supply chain, digital contract engagements and other critical business areas.
In EdgeVerve, we had a strong performance with 24 wins and 21 go-lives for Finacle and 12 wins and 17 go-lives for Edge products. We launched the Pilot Blockchain Network for international remittances.
Our TradeEdge network now with more than 2,000 partners, processes approximately 3 billion transactions per month. We are now integrating our Blockchain network with this TradeEdge network to open significant monetization opportunities for clients. Skava Commerce, continues to gain traction. We are investing heavily in bringing the AI capabilities of Nia to power our next-generation digital commerce platform. Across all new areas, we continue to drive Design Thinking into all our engagements with clients and build out our strategic design consulting practice where we are helping, for example, BP to reimagine their HR onboarding experience, Adient to accelerate their transformation in the rapidly evolving automotive industry, ERM to reimagine the sustainability challenges of the future and Spark New Zealand leaders to find frame and rapidly prototype solutions to important problems in their highly disruptive markets.
Finally, in this quarter, we ramped up our efforts around the rollout of the GST program which launched on July 1st. The system has already handled a peak of more than a million logins daily with more than 40 million page views. Once complete, this will be one of the largest open source projects and the largest tax project in the world. As we speak, we are proud and humble to be handling the digital economic infrastructure for the entire country from company formation to direct and indirect tax. A project of such unprecedented scale and complexity will always present challenges during rollout which we will continue to address with agility and dedication.
Coming to culture, we continue to simplify our internal processes through automation. We deployed Nia into our iTravel System to drive efficiency. We continue to invest in education and training. I am really proud to say that our second Stanford Global Leadership Program Batch graduated with 36 graduates in Q1, bringing the total graduates to 70 so far and another 40 in the current batch. This is one of a kind program to help us build our next-generation leaders.
From a learning standpoint, the Digital Tutor Social Platform now has more than 3,500 learning videos and tutorials and the Infosys Learning Platform now has 181 courses with over 45,000 unique users to date. We have trained over 2,100 employees in Nia. Design Thinking now covers more than 142,000 employees across the organization.
Following the recent announcement to hire 10,000 American workers in the next few years, the first batch of training for these fresh hires will be conducted in-house by Udacity from July of this year. In our foundation program in training, over the last two years, the first-time pass percentage has increased from 45% to 65% and the percentage of high performers have increased from 16% to 36.4% as a result of innovation in our education and training.
Looking beyond business, some of the key initiatives of the Infosys Foundation in India in this past quarter included improvement in renovation of the existing pediatric ward building hospital in Odisha and construction of a major operation theatre complex at Kidwai Memorial Institute of Oncology here in Bangalore. The Foundation also partnered with local bodies to distribute and channel waters through a gravity technique to rural drought hit villages of Andhra Pradesh. Infosys Foundation in the US hosted its Third Annual Thought Leadership Conference CrossRoads in San Francisco. This is one of a kind event in Computer Science and Maker Education which featured 155 participants from 133 organizations from academia, policymaking and non-profits and dozens of panels featuring in this. The Foundation also announced the 25 winners of the 2017 Infy Maker Award in a blog that was written by a NASA Astronaut Alvin Drew. The Foundation extended its ‘WhyIMake Maker Education Awareness Campaign’ by releasing a new episode with famous makers to TV networks and broadcasters across the US resulting in 3,000 plus nationwide airing reaching over 28 million viewers.
Coming to guidance, I am happy with the multiple aspects of our Q1 performance. Based on our expectations for the rest of the year, we are retaining our guidance at 6.5% to 8.5% in constant currency.
In closing, I am pleased with our performance this quarter. This has further strengthened my belief that when we are focused, purposeful and empowered in our work, there are no limits to what we can achieve.
I will now hand it over to my friend, Ranga, for his comments. Thank you.
M.D. Ranganath
Thank you, Vishal, Hello, everyone. Vishal has already talked about revenues and business outlook. Apart from revenues, the key outcome of the quarter has been strong cash generation and improved operational efficiencies which is reflected in operating margins. Let me address these one-by-one.
Cash generated from operating activity as per consolidated IFRS was robust at Rs. 4,151 crores. Likewise, free cash flow (operating cash flow less capex) increased to Rs.3,598 crores. Capex for the quarter was Rs.553 crores, a reduction of Rs. 110 crores from last quarter. Due to strong cash generation, cash and cash equivalents including investment stood at Rs.39,335 crores, an increase of Rs. 562 crores from the last quarter despite a large outflow of Rs.3,363 crores on account of dividend during the quarter. Operating cash flow as a percentage of net profit remained over 100% for the fourth quarter in a row. Mohit and team have done a great job on collections during the quarter.
Coming to operational efficiencies, utilization excluding trainees increased further to 84% as compared to 80.5% in Q1 of last year. Likewise total employee cost reduced to 54.6% of revenue in Q1 this year as compared to 55% in Q1 of last year, a drop of 0.4%. However, the subcon cost as a percentage of revenue went up by 0.9% in Q1 to 6.3% of revenue, partly due to higher utilization level of 84% and onsite talent demand. Onsite mix increased to 30.1% and Ravi’s team is working towards moderating this. Ravi and team did an exemplary job in improving the operational efficiencies on multiple fronts.
Onsite volumes grew by 2% and offshore volumes grew 1.5% QoQ. Pricing realization improved by 1.8% in reported terms sequentially and 1.3% in constant currency terms. On a year-over-year basis which is a better comparison, pricing realization decreased by 0.5% in reported terms and 0.2% in constant currency terms.
Our gross margins in Q1 were 36.2%, 0.1% lower compared to Q1 last year and 0.9% lower compared to Q4.
Our operating margin for Q1’18 is at 24.1%, which is same as Q1 last year. Sequentially, operating margin declined by 60 basis points. Appreciation in rupee impacted margin negatively by 80 basis points which was partly offset by 20 basis points benefit we got from cross-currency movements. Improvement in utilization helped margins by 90 basis points while improvement in realization helped margin by 50 basis points. However, this was offset by higher employee cost due to higher variable pay, visa cost and subcon cost which impacted the margin by 140 basis points.
Yield on cash for the quarter was 7.07% as compared to 7.12% last quarter. Our hedge position as of June 30, 2017 was $1481 million.
EPS for the quarter was Rs.15.24 as compared to Rs.15.03 in Q1 last year which is a growth of 1.4%.
We ended the quarter with a total headcount of 198,553 at the group level which is a decrease of 1,811 from last quarter. Net headcount addition was 3,006 in Q1 of last year. On year-over-year basis, the headcount grew by 0.8% as compared to revenue growth of 6.0% in reported terms which is reflected in increase in revenue per employee to $51,921.
During the quarter, the company has written down the entire carrying value of the investment in its associate DWA Nova which was invested as part of Infosys Innovation Fund. The impact of write-down of this investment on Q1’18 profit is Rs.71 crores.
Coming to Capital Allocation Policy, the company reiterates its commitment to execute the capital allocation policy announced in April 2017 in a timely manner. As envisaged in the capital allocation policy, the company has identified an amount of up to Rs.13,000 crores to be paid out to shareholders during fiscal 2018 in a timely manner. As the company has a large global shareholder base and is listed in multiple countries, the manner of distribution to shareholders require compliances and approvals under several jurisdictions. We are in the process of finalizing a distribution mechanism that complies with applicable regulatory requirement in the best interests of all shareholders.
We are retaining our constant currency revenue guidance of 6.5% to 8.5% for fiscal ’18. Similarly, we expect our fiscal ’18 operating margins in the range of 23% to 25%. As you know, we have rolled out compensation increases for certain levels w.e.f. July 2017 and hence there will be an impact on operating margins in Q2. While the average compensation increase is approximately 6%, our top performers have received higher increases.
With that we will open the floor for questions.
Moderator
Thank you very much, Sir. Ladies and gentlemen, we will now begin with the question-and-answer session. Our first question is from the line of Edward Caso from Wells Fargo. Please go ahead.
Edward Caso
Good evening, I was curious if you could give some more color about what is happening in the BFSI space, the various components, and maybe US versus Europe?
Mohit Joshi
As we mentioned in the previous quarter as well, the situation is a little bit fluid. But we remain optimistic. There is a little bit of transmission time between revenue increases and the impact on tech budgets. So I am quite hopeful that we will start to see that in the second half of the year. For this quarter, growth has been in line with expectations. The overall story of software plus services is resonating quite well in the sector. Insurance has grown very very strongly at 19% for us. Overall it is moderate growth which we expect will pick up in the second half of the year.
Edward Caso
My other question is, the headcount was down sequentially similar to one of your peers, is that a trend that you expect to continue or was that a seasonal timing issue and how much more room do you have on utilization, is this 84% sort of the new level that we should be thinking about?
M.D. Ranganath
Coming to headcount, as you rightly pointed out, this quarter the net headcount addition was negative 1800 as compared to addition of 3000+ same quarter last year. The point to note is, if you look at quarter to-quarter there will be lot of variations in terms of timing of joinees and so on and so forth. The better indicator probably is really the year-on-year. Part of this from 3000+ to -800 is partly due to higher utilization as you rightly pointed out. At the same time the other indicator that we watch is, on a year-on-year basis what is the increased in headcount and how does it stand relative to the revenue growth. If you look at this quarter, Q1-over-Q1 of last year, headcount increased by 0.8% whereas the revenue reported went up by 6.0% in reported terms and 6.3% in constant currency terms. We need to watch this. Is it because of only utilization or is it because of the better automation and productivity in projects? We do not want to jump to conclusions but we would like to watch this closely for the next couple of quarters. As Vishal mentioned, the per capita revenue has improved for several quarters in a row, so we need to keep a close watch.
Coming back to the efficiency levers, I think this quarter has been very positive on the utilization levels even including trainees which is about 80.2% as compared to 76.5% last year same quarter. While we try to look at it, it is extremely important to optimize other levers at the same time. For example, onsite mix is still high at 30.1%. Apart from the utilization, the other piece I just want to highlight is onsite employee cost as a percentage of revenue this quarter was lower than the same quarter last year. This quarter, we had 38.5% of revenue as onsite employee cost as compared to 39.3% same period last year. Part of which is also due to the fixed-price projects, the overheads and we are re-looking at some of the ability to release people from fixed-price projects and redeploying them on new projects. So some of these initiatives as well as role ratio onsite. These are some of the levers still we have to work on and maybe some early pieces are reflected here. These are the pieces that we will continue to focus in the coming quarters.
Moderator
Thank you. The next question is from the line of Diviya Nagarajan from UBS. Please go ahead.
Diviya Nagarajan
Just couple of questions on the digital side, thanks for breaking out the new services, I assume that what you reported new services is essentially a part of what the overall digital exposure is. Vishal, I know your views on digital but is there any way we could get a sense on what the overall digital exposure for the company is and the trends that you see there for the next couple of years, that is question one?
Secondly, I think we have discussed this on margins, but other than utilization and wage hikes that have deferred into the next quarter, what are some of the key margins levers that we still have left going into the rest of the year? Thank you.
Vishal Sikka
Hi, Diviya, thanks for saying my views on digital. As you know there are no analog computers anymore although Professor Jennifer Hasler at Georgia Tech is working on a neuromorphic board that uses analog technology for the post Moore’s Law World and that will come in 2025, then probably less than 100% of our revenue will be digital at that point. The six new service categories that I have laid out, these are in the Cloud First, AI First, Digital Experiences, Internet of Things, Cyber Security where you have intrusion detection, API economy. The important thing about these services is that they did not exist couple of years ago, they are new. They are extremely aligned to the strategic priorities of our clients and to the spending, Therefore, we call this high-growth and similarly new software which is our new software offerings that we did not have more than two years ago, is now 1.6% of our revenue this quarter. Altogether that is about 10%. But more importantly if you look at that revenue growth in those last two years since April 2015, we have added app. $2 bn in revenue since then and $ 1 bn of that $2 bn has come from these services. So these are high-growth areas that we are really focusing on executing on in the future. We have thought a lot about how the industry characterizes digital. Even though I very strongly believed that we are the ultimate digital company and everything that we do is digital, we looked at how the peers define digital. If we look at that definition, then our digital revenues are in the neighborhood of 23% in this quarter.
M.D. Ranganath
Coming to operating margins, they are steady. Last year we had given the range of 24% to 25% and we did 24.7%. We exited the last quarter at better margins. At the same time, we also indicated the new band of 23% to 25% keeping in view three primary factors. One of course is the rupee appreciation, already the rupee has appreciated 3.5% on an average basis, so the effect of that is already reflected in Q1 as well. That was one factor. The second factor of course is the ramp up of US talent model. So apart from the compensation hikes that we effect every year. These are the three pieces which went into our margin guidance of 23% to 25% as compared to 24.7% margins last year.
Coming to this quarter, there were headwinds on rupee itself about 80 basis points and positive on cross currency about 20 basis points. Utilization helped us by 90 basis points as well as the price realization improvement helped us by 50 basis points. Both put together it was 140 basis points which was entirely offset by higher variable pay to employees, higher visa and sub-con costs. Going forward, the compensation hikes will come to affect and we have to continue to focus on the other operating levers as well. Utilization, and the onsite employee cost a percentage of revenue is another focus for us. This quarter it declined on a year-on-year basis, but we need to see what other efficiencies that we could leverage upon. Of course, the onsite mix is the second one which we need to focus on.
In the medium-term while these operating levers will kind of stabilize, the most important piece would be really how much of the productivity related pieces will start to accrue to us. That is where our real focus should be in the medium-term. In the short-term these are some of the pieces that we are working on.
Moderator
Thank you. The next question is from the line of Viju George from JP Morgan. Please go ahead.
Viju George
Vishal, you talked about the ‘New’. You have defined it, you reported it out this quarter, nice to see that. Based on your understanding of how fast these service lines are growing and also if you married this together with the legacy compression, when do you think there might be inflection point where the upward movement of the ‘New’, if you will, will start to overpower the downward impact of the old. Do you think we are 2 to 3 years away from the transition and what are the points as investors might need to follow to get that understanding?
Vishal Sikka
That is a great point Viju. Unfortunately to answer that in detail I need a whiteboard. So perhaps next time I see you we can talk about that. The reason I say that is first of all, we are defining this ‘New’ with a time horizon in mind. This is similar to the vitality index or these kinds of measures that other companies use. We will continue to add more services to this list and some of these services as time goes by will no longer be so new. There will be a change. The second part of your question is what happens to the traditional business. I mentioned earlier in response to Diviya’s question that the market does not really have a precise definition of digital. Some people have half their revenue in digital and some have 10% or whatever. When we looked at the definition by our peers, we are at roughly 23% in the so-called digital kind of services. But there is another split that I have talked to you about before. That is the split between the areas where we build software and areas where we maintain, run and operate software. This is a good capture of the commoditization of what is happening.
My sense is that the way to deal with the commoditizing services is not so much to end those and focus on the newer ones, but also to use that opportunity, use automation and Design Thinking as a springboard to transform that commoditizing engagement into an innovative engagement. So if you are doing, for example, data center maintenance in a legacy manner then you can bring in automation technology, you can bring in new ideas around cyber security and cooling to transform the way the data center is managed and operated through a massive adoption of automation. So what you will see is a transformation of the commoditizing services towards these new services. One of the new services that we have, for example, is the migration of legacy mainframe workloads to the cloud, to AWS, to Azure and so forth. This is an example where a traditional mainframe maintenance work which would be in the ADM service would go into the transformation kind of a work and so on.
Our endeavour is to get 100% of our services into this model, where we are bringing in more and more embrace of automation and innovation. People often ask me you talk about Zero Distance. I mentioned earlier we have had more than 16,500 ideas in Zero Distance. Almost half of those pertain to automation. These all come from the bottom up, from the ground up. I think that as we expand that and we bring these themes, we marry these new service lines to the Zero Distance work, more and more adoption of this will happen. Bottom line is in the end, this will all be reflected obviously in revenue growth and margin growth, but especially in revenue per FTE. As Ranga mentioned, for six quarters in a row, we have improved in revenue per FTE. For now, we are highlighting this roughly 10% that we had 8.3% in services and 1.6% in software which did not exist two years ago. I expect we are very heavily focusing on executing on this and we wish to see a high growth in these services.
Viju George
On Financial Services, we have got off the year with a somewhat muted start. Mohit I think you had mentioned in the earlier quarter that some part of revival is baked in the guidance, but if you are not seeing this in the September quarter and it you are expecting H2 to see a flush if you will, is it not a risky assumption because these are seasonally weaker quarter so if you are not seeing it in the September quarter then we will miss the BFSI revival bus altogether for this fiscal?
Mohit Joshi
No, I agree with you what you are saying Viju. But there are two things here. What you have seen in our results, is also reflected in the broader industry. You are seeing that even with the other results being announced that people are not seeing a flush of revenue growth. Having said that, I feel that our revenue growth was very competitive, 2.6% in reported terms, a very strong performance in Insurance. As you have seen yourselves, if you go back in past to six to eight quarters, you see a consistent track record of very competitive outperformance against the industry. That is our view that as and when the market picks up we will be able to gain the largest percentage of market share. I agree with you on the seasonality bit for Q3 and Q4 but please remember that our model also is changing now. Rather than purely services, this is now a software plus services model. To that extent we are hopeful that the seasonality will be a little bit muted as software does not have the same seasonal cycles as the services business.
In Europe and in the ROW, specifically in Australia we have continued to see track record of very, very strong performance. Our Insurance business grew at 19%. In the US business, we have not seen the sort of uptick that we expected to. There is still the overhang of everything happening in terms of client concerns about immigration or some level of insourcing or sourcing through the captives. Having said that, our competitive position remain strong and as and when the market picks up, I have no doubt that we will be the biggest beneficiary of that rebound. While I cannot predict what the market will be in H2 in terms of technology spend for banks, I can assure you that we will have a very strong performance relatively.
Viju George
Lastly on per capita revenue trends, I don’t know if you have answered this, but how much of the improvement you think is attributable to pure utilization uptick versus some of the most structural things that you are talking about like automation, solutions etc., playing through the model?
Vishal Sikka
It is a combination of those. Like Ranga said earlier, we do not quite have a precise answer on how much contributes to what. We have been reporting the FTE release number in the past. While it is an accurate capture of the effort that we save, it does not really reflect in the margin. Adoption of Nia in our delivery team is one of the key things. We started to see the first serious results of this emerge in this past quarter. So several hundred of this automation related FTEs saving was a result of tooling improvements in the work that our teams do. Obviously utilization getting to 84% and especially including fresher utilization at 80.2% has a huge impact on that as well. There are also other factors around the onsite mix and things like this. I would say it is a mixture of all of these, but we cannot give you more color on this.
M.D. Ranganath
Yes, that is right. I think utilization is one clear factor that will also need to be separated from the productivity piece. What is more important is whether the net headcount addition which is negative 1800 as compared to +3000 last year same quarter, how does this move on from the present utilization level is something probably we would need to closely watch. More importantly on the fixed price project is where, especially onsite, release of people and redeploying them into new projects, is where bulk of the focus would also be. We need to see the utilization part separating out plus the releasing of people from fixed price. How much of that has given the uptick to the per capita revenue and the balance of course is the automation and core productivity. I think we need to put into these three buckets on which we will give more color in the coming quarters.
Moderator
Thank you. The next question is from the line of Yogesh Agarwal from HSBC. Please go ahead.
Yogesh Agarwal
Firstly, Vishal the world is changing for Technology, Digital, Automation and you need to invest in that, it is understood. But if I look at the R&D spend, that has actually been coming down over the last few years both absolute and percentage of revenues. Also you guys expense it out everything in that year itself. So I was wondering one, why the R&D spend is not increasing? Secondly, if these are all long-term IP initiatives, why can't you capitalize it? That is the first question and secondly, any big picture in general views on the margins for the new services because these are solutionized, so are the margins better or lower for these services?
Vishal Sikka
Yogesh on the R&D, this is something we are working a lot on. I think that as you know we are operating the company in a very complex environment right now with multiple margin headwinds and so forth. That is one part of it. But really at our level, I think that we can get by with a very focused effort in our software, in our R&D in services and in R&D in training and you will see that. If we feel like there is a change in the profile and that we will let you know. But for now, I feel comfortable with how much we are spending in these areas. Earlier today, I went to the media briefing in an autonomous golf cart that was built by our engineering services team. It is something that incredibly proud of. So this kind of work I think has to been done but it has to be very deeply aligned to co-creation together with clients, as well as to building technology in a minimum viable kind of a rapid co-creation, rapid innovation, rapid prototyping kind of a model. So this is the new way to do it. When I started, we had a large lab with several hundred people and these kinds of things are irrelevant in services industry. We do invest, we make donations. For example, we donated to many areas around general purpose R&D and so forth and will continue to do that. The second question on margins, perhaps Ranga you can answer this one.
M.D. Ranganath
On the margins, we have given a band of 23% to 25% last year. Last 2 years, the margins have been steady and in a very narrow band of 24.7% to 25%. Though we exited last year on a strong margin, we did give 23% to 25% primarily on account of three reasons. One of course is the rupee appreciation, 3.5% average basis we have already seen. The second piece was on the ramp of the US talent model and the third is the compensation review and things like that. So this quarter of course margin has been stable as compared to last year same quarter at 24.1%. The headwinds of rupee was 80 basis points and cross currency gave us benefit of 20 basis points. The operational efficiencies and the utilization and price realization did help us by 90 basis points and 50 basis points respectively which clearly went back to variable pay increases, sub-con and visa costs as compared to last quarter. So we reiterate 23% to 25% while we focus on couple of other levers which I talked about earlier. So this is the band that continues for balance of the year.
Yogesh Agarwal
Ranga, I was just asking about the new services.
M.D. Ranganath
On the new services, the new services that we have called out, the operating margins are higher. Some of them are not really offered on a standalone basis to the same customer. We need to really look at much more discretely. One of the reasons why we identified the services was we did not want to give a broader number, but we wanted to tag them at the project level. So that there is a clear tagging at the project level to monitor both the financial performance as well as operating performance of those service lines. Our view is that though collectively now it is 8.3% when they get into more critical size, let us say each one of them is at certain threshold let us say 4% or 5%, we would like to call them out so that much more visibility is there to them as well. At a broader level, these new services are at higher operating margins.
Moderator
Thank you. The next question is from the line of Priya Rohira from Axis Capital. Please go ahead.
Priya Rohira
Thanks for this new disclosure on new services and new software. I just wanted to follow up on that. Ranga, you mentioned about these margins being higher, but any color on the revenue productivity or the vertical specific clients to which these services have been catered to?
M.D. Ranganath
Well, just like in the operating margins, they are certainly at a higher revenue productivity, both on a blended basis as well as the onsite and offshore basis. They have been primarily distributed, for example, certain services are more towards Retail. If you look at the digital experience and the user experience are more in the Retail areas. Hence, I would not say that they are kind of skewed in a particular vertical, they are much more broad-based.
Moderator
Thank you. Next question is from the line of Ashish Chopra from Motilal Oswal Securities. Please go ahead.
Ashish Chopra
Just a couple of questions. Firstly, Vishal you mentioned about the incremental revenues in the last 2 years from new area services and software and I think Pravin also made a comment contrastingly on the TCV of large deals in the media briefing. So just wanted to understand from you that from the way you see the buyer behavior in the market, do you think that probably it is right for you to reconsider the benchmarks or yardstick of business wins wherein maybe the $1 bn of renew deals that you were chasing earlier may not necessarily be the way to go forward and maybe you would look at it differently?
Vishal Sikka
Absolutely, Ashish. That is a great point. If you look at the new services, as Ranga mentioned they tend to be higher margins, they are higher value. But they are also shorter projects with smaller teams, more rapid iterations, agile work typically co-created together with clients and so forth. The typical maintenance projects have larger size teams working on them. These projects tend to have smaller size teams and so on. It is a very different kind of an atmosphere compared to the large maintenance projects or large operate type of projects. Therefore, we did not report the large deals numbers this quarter and instead we are reporting the new services and new software number. However, from a business priority point of view, there is still a lot of activity in that area. We did roughly the $657 odd mn or so something like that in Q1 in the large deals. Wherever there is large deal to go after that fits into our business profile, we are going to be extremely competitive and continue to go forward on that.
Ashish Chopra
In the newer services, Ranga alluded to the per capita income being higher or per capita revenue. Is it closer to the aspired number of $80,000 or just any color on around where would this land up would be very helpful?
Vishal Sikka
I think that remains to be seen and over time we will disclose that. Even though informally Ravi and I have been monitoring this for the last 2.5 years, this is the first time that we have gone into the detail at a project level and created this reporting in this quarter. So the relative performance and some of the important metrics will only start to become relevant over the next few quarters. The important thing is that we are growing very well in these areas. Majority of our growth since April of 2015 has come in these new areas, we are very excited about it. The RPP and those things, it is too early to comment on those. These new services, we will see how that goes. In terms of new software, obviously the revenue per employee in the software world is much higher.
Ashish Chopra
Lastly from my side for Ranga. So Ranga you have been tracking this number of onsite employee cost as a percentage of revenues for some time and improving on it. But is there any number that you target as to where you can get at or also where probably Infosys had been at the past at the lower end of the band that you think you can achieve. So just to get a sense on what is the kind of juice to the margins from this efficiency lever? Thanks.
M.D. Ranganath
Our focus is to look at the trajectory and see whether the trend line of the trajectory is improving, that is our focus. When we say onsite employee cost as a percentage of revenue, it is a function of both numerator and denominator. While the revenue mix led improvement in that percentage is much more medium-term and also probably tougher, I think in the short term, it is a more numerator led percentage improvement. To answer your question on specific goal, we would rather focus on that trajectory improvement because there are multiple threats here. We would rather focus on that.
Moderator
Thank you. We have next question from the line of Sumeet Jain from Goldman Sachs. Please go ahead.
Sumeet Jain
Thanks for the opportunity. Firstly, wanted to understand about the European region. We have seen both yourself and even your bigger peer has given a very strong growth in this part of the world. So in which verticals are you seeing this growth and also how is the shift towards Digital and Cloud happening in Europe versus US, if you can give some color?
Mohit Joshi
Europe growth has been broad-based across all sectors and actually reasonably spread out geographically throughout Europe as well. If you recollect about a year ago, people had concerns about what impact Brexit for instance would have on European technology spending on our revenues. We have not seen that impact so far. Financial Services which would be the most impacted sector by Brexit has continued a very strong performance. We also have a lot of greenfield opportunity in Europe. We do not have the same degree of saturation as we do in the US market for instance. Whether it is in the Nordics or in Southern Europe or even in the Benelux region, we still have a large number of prospects and the opportunity to mine existing clients very deeply. We are also continuing to invest fairly heavily in Europe in terms of local hiring, in terms of beefing up our hunting and our farming teams for our accounts. Both Rajesh and I are very optimistic about our long-term potential in this region. The currency factor does complicate things a bit but in this quarter, it has actually helped us on a reported basis.
Sumeet Jain
My next question is around the efficiency levers. We saw the utilization has picked up very strongly for us. So any theoretical levels beyond which we cannot improve it further, if Ranga can give any color around that? So what level can we really take it to using the automation tools?
Vishal Sikka
There are two parts to that. Maybe I can start and then Ravi you can add on. The question is about utilization. Right now, we are at 84%. When I started, we were in the high-70s. I remember Ranga and I used to sit and look at these things and we used to think that the wheels will come off at 77, then 78, then 80, then 82. So far the wheels have not come off. Having said that when you look at the new services, we have to think about staffing and training resources in new ways. We have to look at the sub-con spend as a lever in developing our abilities in new services and especially in new ways to bring our teaching. For example in AI, in cyber security, we have worked on new immersive ways of teaching our employees. We have crossed 3000 people in training on AI including 2100 on Nia and this fancy golf cart that we have built and things of this nature. Recruiting goes a long way in that. When it comes to automation, the release of people's effort by bringing in productivity, bringing in automation, that takes two shapes. If you do not change the nature of the work that you are doing, simply bring automation into that, then that has effect of improved margin, less number of people and things like this. Whereas typically what happens is when you bring automation into the program, then there is more a business process improvement that ends up being flavor of what you end up doing so there is that dimension to that as well. Then the project that you are working on becomes more transformed in the client landscape. It is a mix of all of these things and the three important things in the end - revenue growth, margin growth and especially revenue per employee. Ravi, you want to add anything on the utilization, how much room there is and all that?
Ravi Kumar S.
Utilization is a fairly broad-based set of metrics which is impacted by the quality of demand, the ability to take the pyramid of talent and staff on projects. So you need fairly good quality of demand. Most of what we have is at the bottom of the pyramid. If we really have to push the utilization to that level where we are today, you just need to work at the bottom of the pyramid because top of the pyramid is extremely easy to staff and in onsite, we run a tight shop. The zero bench initiative helped us to get the bottom of the pyramid much more enabled and ready for projects even without getting into a project at the first place. That is one of the reasons why I think structurally our utilization has consistently gone up in the last few quarters. The quality of demand, the ability to tighten in the operational metrics, take out any waste in the system and more importantly look for improving utilization at the bottom. In fact, our utilization including trainees shot up as well because we have had a very healthy bottom of the pyramid uplift into the system. But what is in store for the future is also dependent on how our US talent plan pans out. Because the US talent plan will actually infuse a large number of campus hires in the US and it is going to infuse the pyramid in many ways. So our ability to keep it at the levels we are depends on how well we can absorb the transition to the new talent model.
Moderator
Thank you. Ladies and gentlemen, this was the last question for today. I would now like to hand over the conference back to Mr. Sandeep Mahindroo for his closing comments. Over to you, sir.
Sandeep Mahindroo
Thanks everyone for spending time with us on this call. We look forward to talking to you again during the quarter. Have a good day.
Exhibit 99.7
Earnings Call 2
EARNINGS CALL-2
Q1-FY 2018 RESULTS
July 14, 2017
CORPORATE PARTICIPANTs
Vishal Sikka
Chief Executive Officer & Managing Director
Pravin Rao
Chief Operating Officer
M.D. Ranganath
Executive Vice President and Chief Financial Officer
Ravi Kumar S.
President & Deputy COO
Mohit Joshi
President & Head – Financial Services; Head – Infosys Brazil and Infosys Mexico
Rajesh Krishnamurthy
President & Head of Energy, Utilities, Telecommunications and Services; Head—Infosys Consulting, Head of Europe
ANALYSTS
Moshe Katri
Wedbush
Joseph Foresi
Cantor
Bryan Bergin
Cowen & Co.
David Koning
Baird
James Friedman
Susquehanna Financial Group
Anil Doradla
William Blair & Company
Shashi Bhushan
IDFC Securities
Moderator
Ladies and Gentlemen, Good Day and Welcome to the Infosys Earnings Conference Call. As a reminder, all participant lines will be in the listen-only mode and there will be an opportunity for you to ask questions after the presentation concludes. Should you need assistance during the conference call, please signal an operator by pressing ‘*’ then ‘0’ on your touchtone telephone. Please note that this conference is being recorded. I would now like to hand the conference over to Sandeep Mahindroo. Thank you and over to you, sir.
Sandeep Mahindroo
Hello, everyone and Welcome to Infosys Earnings Call to discuss Q1 FY18 Results. This is Sandeep from the Investor Relations Team in Bangalore. Joining us today on this earnings call is CEO and M.D. Dr. Vishal Sikka; COO Pravin Rao; CFO M.D. Ranganath, Presidents and the other members of the senior management team.
We will start the call with some remarks on the performance of the company by Dr. Sikka and Mr. Ranganath, subsequent to which we will open up the call for questions. Please note that anything which we say which refers to our outlook for the future is a forward-looking statement which must be read in conjunction with the risks that the company faces. A full statement and explanation of these risks is available in our filings with the SEC which can be found on www.sec.gov.
I would now like to pass it on to Dr. Sikka.
Vishal Sikka
Thanks, Sandeep. Hey, everyone, and thanks for joining. I am really proud of our achievements in Q1. It was the passion, focus and execution of our management team and indeed every Infoscion to steadfastly continue on our path to transformation. We are deeply convinced of the differentiated value that we can deliver to clients, helping them leverage the power of Artificial Intelligence and Design Thinking to reimagine their businesses. We can do this through our learnability, our culture of innovation, in which every Infoscion is empowered to be a proactive problem-finder. During the previous earnings call, I had emphasized our relentless focus and our commitment to execution in Q1. We did this and this is reflected in the all-round performance in Q1. Solid constant currency revenue growth, resilient margins despite multiple headwinds, record cash generation, improvement in utilization to a record level, revenue productivity per person and uptick in revenue per FTE. Ranga will provide more color on this shortly.
In Q1, our revenues grew sequentially by 3.2% on reported dollar basis and 2.7% on constant currency basis. Growth was distributed between both volumes and realization with volumes growing by 1.7% quarter-on-quarter and realization growing 1.8% quarter-on-quarter. On year-over-year basis, revenues grew by 6% on reported dollar basis and 6.3% on constant currency basis. INR revenues declined by 0.2% sequentially due to rupee appreciation, and increased by 1.8% on year-on-year basis. Our utilization excluding trainees was 84% which is the highest level in 15-years. Including trainees, utilization was 80.2% which is the highest level ever.
I am happy to share that driven by our improved performance compared to the last few quarters, we are paying higher variable pay to our employees this quarter. Consistent with recent quarters, the percentage payout will be higher at lower level and lower at senior management and leadership level. Within each level, we will continue to strive towards higher performance differentiation through different payout level.
Our attrition was at 16.9% on a standalone basis as compared to 15.8% in Q1 last year and 13.5% in Q4 last year owing to Q1 seasonality when employees leave to pursue higher studies. We had broad-based growth across verticals and geographies including Financial Services, Insurance, Retail, CPG and our ECS verticals. On Financial Services, our growth is expected to pick up in the second half of the fiscal year as the impact of increased interest rates and lower regulatory pressures from the US, start to reflect in our client spending.
Consistent with our commentary last quarter on higher disclosure, this quarter we have disclosed revenues from new services on software that we started since the 1st of April 2015. 8.3% of our Q1 revenues came from new services in the Cloud First, AI First, Digital experience service areas that are strategic to our clients and that were launched in the past two years. Similarly, 1.6% of our Q1 revenues came from new software started since the 1st of April 2015 comprising of Edge, Nia, our next-generation AI platform, Panaya and Skava.
In management, we also welcome Inderpreet Sawhney to Infosys as our new General Counsel. Inderpreet brings to Infosys a wealth of critical experience in large complex global firms as well as small innovative ones from India to Silicon Valley to help us become a much more global, agile organization while upholding the highest standards of integrity and governance.
Finally, we announced plans to hire 10,000 American workers over the next two years and establish four innovation hubs with the first two in Indiana and North Carolina, where we will hire 2,000 people each in the next few years. In Q1, 600 plus US workers have already been hired. This is a continuation of plans that we launched in 2014, starting with 2,000 Americans hires to get closer to the clients, deliver new high touch, high value services, leverage the best local and global talent, and build the next-generation of innovators through world-class education and training.
Now, let me share some specifics of our “Strategy Execution.” In renewed traditional services in Q1, through our Zero Distance program, we delivered grass-roots innovation leveraging Design Thinking and to-date more than 16,500 ideas have been generated from our project teams and more than 2,200 of these have already been implemented with clients including Myer, My Picker App in Australia for fulfilling retail orders with more efficiency and better user experience. We are now evolving to Zero Distance 3.0 with a focus on themes and solutions. From the 16,500 ideas, the teams have synthesized 75 plus themes in areas like Insurance claims adjudication, digital farming, cyber security and others with the potential for reuse, conversion into packet business solution or an IP creation. Zero Distance is at the heart of transforming at a grass-root level our efforts towards innovation and automation. We continue to drive automation into our service lines, saving more than 3,500 FTEs worth of effort in Q1. Beyond saving FTEs, we have seen radical use cases of Nia within our services. Nia is being used for large scale transformation within our AMS services as well as to drive cost savings in managed projects.
Our Zero Bench program continues to thrive with 42,000 work packets created and 24,000 work packets completed by the end of Q1. This is one of the key reasons that fresher utilization has gone up significantly.
Coming to New Digital Services, we continue to build out our new higher growth, higher margin, higher RPE services, which are exactly in line with clients most important business needs and we are seeing strong traction in these. Cyber Security, for example, is one of our fastest growing new services given the heightened awareness at the CXO level due to recent incidents.
Coming to new Software-led offering, in Q1, we saw continued momentum in Nia, Skava, Edge and Panaya. We launched Nia in April, building on and accelerating our work over the last 2.5-years with our first-generation AI platform with IIP and with AssistEdge. With more than 160 AI-based scenarios across 70-clients, Nia is central to all our conversations with clients. What started as a journey of IT used cases has quickly moved to strategic business areas like sales operations, demand sensing, supply chain, digital contracts and policy management and other critical business areas, where we are seeing even greater traction.
In EdgeVerve, we had a strong performance with 24 wins and 21 go-lives for Finacle and 12 wins and 17 go-lives for Edge products. We launched the pilot Blockchain Network for international remittances which is already live in some banks.
Across all new areas, we continue to drive Design Thinking into all our engagements with clients and build out our strategic design consulting practice where we are helping BP for example to reimagine their HR onboarding experience, ADNs to accelerate their transformation in the rapidly evolving automotive industry, ERM to reimagine the sustainability challenges of the future and SPARK in New Zealand where leaders can find frame and rapidly prototype solutions to the most important problems in their highly disruptive markets.
Finally, this quarter, we ramped up our efforts around the rollout of GST in India which was launched on the 1st of July. The system has already handled the peak of 1.2 million daily login and more than 40 million-page views and between 20,000 and 40,000 concurrent users at its peak. Once complete, this will be one of the largest open source projects and the largest tax project in the world.
As we speak, we are proud and humble to be handling the digital economic infrastructure for the entire country from company formation to direct and indirect tax. A project of such unprecedented scale and complexity will always present challenges during rollout which we will continue to address with agility and dedication.
Coming to culture, we continue to simplify our internal processes through automation. We deployed Nia into our iTravel system to drive efficiency. We continue to invest in education and training and I am really proud to say that our Second Stanford Global Leadership Program Batch graduated with 36 Graduates in Q1, bringing the total graduates to 70 so far and another 40 plus in the current batch. This is one of a kind program to build our next-generation leaders.
We have trained over 2,100 employees in Nia and Design Thinking now covers 142,000 plus employees across the entire organization.
Looking at beyond business, some of the key initiatives of the Infosys Foundation in India in the quarter, included improvement and renovation of the existing pediatric ward building of a hospital in Odisha and construction of a major operation theatre complex at Kidwai Memorial Institute of Oncology in Bangalore. The Foundation also partnered with local bodies to distribute and channelize waters through a gravity technique in rural drought hit villages in Andhra Pradesh. The Infosys Foundation in the US hosted its Third Annual Thought Leadership Conference CrossRoads in conjunction with our flagship confluence planned events in San Francisco in May of this year. This is one of a kind event in Computer Science and Maker Education featured 20 plus panels with 155 participants from 133 organizations across academia, policymaking and non-profits. The Foundation also announced the 25 winners of the 2017 Infy Maker Award in a blog written by an NASA Astronaut, Alvindrew. The Foundation extended its WhyIMake Maker Education Awareness Campaign by releasing a new episode with famous makers to US TV networks and broadcasters resulting in 3,000 nationwide airing reaching over 28 million views.
Coming to guidance, I am happy with multiple aspects of our Q1 performance. Based on our expectations for the rest of FY’18 and our visibility at this point, we are retaining our FY’18 guidance at 6.5% to 8.5% in constant currency.
In closing, I am pleased with our performance this quarter. All around execution has led to a solid performance as well as strong growth in the new strategic area. This has further strengthened my belief that when we are focused, purposeful and empowered in our work, there are no limits to what we can achieve.
I will now hand it over to my friend, Ranga, for his comments. Thank you.
M.D. Ranganath
Thank you, Vishal, Hello, everyone. Vishal has already talked about revenues and business outlook. Apart from revenues, the key outcome of the quarter has been strong cash generation and improved operational efficiency which is reflected in operating margins. Let me address these one by one. Cash provided from operating activity as per consolidated IFRS was robust at $644 mn. Likewise, free cash flow which is operating cash flow less capital expenditure increased to $558 mn. CAPEX for the quarter was $86 mn, a reduction of $14 mn from last quarter. Due to strong cash generation, cash and cash equivalents including investment stood at a record high of $6,091 mn, an increase of $112 mn from the last quarter despite large outflow of $522 mn on account of dividend during the quarter. Operating cash as a percentage of net profit remained over 100% for the fourth quarter in a row. Mohit and team have done a great job on collections.
Coming to operational efficiency, utilization excluding trainees increased further to 84% as compared to 80.5% in Q1 last year. Likewise, total employee cost as a percentage of revenue reduced to 54.6% in Q1 this year from 55% in June last year. However, subcon cost as a percentage of revenue went up by 0.9% in Q1 ’18 to 6.3%, partly due to high utilization levels in onsite talent demand. Onsite mix increased to 30.1%. Ravi’s team is working towards moderating this. Ravi and team did an exemplary job on improving operational efficiency on multiple fronts.
Onsite volumes grew 2% and offshore volumes grew 1.5% QoQ. Pricing realization improved by 1.8% in reported terms and 1.3% in constant currency terms sequentially. On a year-over-year basis, which is the better comparison, pricing realization decreased by 0.5% in reported terms and 0.2% in constant currency terms.
Our gross margins in Q1 were 36.2%, 0.1% lower compared to Q1 last year and 1% lower compared to Q4. Our operating margin for Q1’18 is at 24.1%, which is same as Q1 last year. Sequentially, operating margins declined by 60 basis points. Appreciation in rupee during the quarter impacted the margin negatively by 80 basis points, which was partly offset by 20 basis points of cross-currency movement benefit. Improvement in utilization helped margins by 90 basis points while improvement in realization helped margin by 50 basis points. However, this was offset by higher employee variable pay, higher visa and subcon cost which impacted the margin by 140 basis points, all put together.
Yield on cash for the quarter was 7.07% as compared to 7.12% last quarter. Our hedge position as of June 30th was $1481 mn.
EPS for the quarter was $0.24 which is a growth of 5.8% as compared to Q1 last year.
We ended the quarter with a total headcount of 198,553 at the group level which is a decrease of 1,811 from last quarter. Net headcount addition was 3,006 in Q1 of last year. On year-over-year basis, headcount grew at the group level by 0.8% while the revenue grew by 6.3% in constant currency and 6.0% in reported terms which is reflected in increase in revenue per employee to $51,921.
During the quarter, the company has written down the entire carrying value of the investments in its associate DWA Nova LLC. The impact of write-down of this investment on Q1’18 net profit is $11 mn.
Coming to Capital Allocation Policy, the company reiterates its commitment to execute the capital allocation policy announced in April in a timely manner. As envisaged in the capital allocation policy, the company has identified an amount of up to Rs.13,000 crores, about $2 bn to be paid out to shareholders during the fiscal 2018. As the company has a large global shareholder base and is listed in multiple countries, the manner of distribution to shareholders require compliances and approvals in several jurisdictions. We are in the process of finalizing the distribution mechanism that comply with applicable regulatory requirement in the best interests of all shareholders in a timely manner.
We are retaining our constant currency revenue guidance at 6.5% to 8.5% for fiscal ’18. Similarly, we expect our fiscal ’18 operating margins in the range of 23% to 25% as stated in the beginning of the year. We have rolled out compensation increases for certain levels w.e.f. July and hence there will be an impact on the same on margins for Q2. While the average compensation increase is approximately 6%, our top performers have received higher increases.
With that we will open the floor for questions.
Moderator
Thank you. Ladies and gentlemen, we will now begin with the question-and-answer session. First question is from the line of Moshe Katri from Wedbush. Please go ahead.
Moshe Katri
You had a significant uptick in utilization rates during the quarter, I think you reached about 84% ex-trainees. Is it maxed out here? What is left in terms of leverage for sustaining margins within the guided range?
Ravi Kumar S
On utilization, we have been working very hard on how to get this to where we have got. Starting from working on the quality of demand to working at the bottom of the pyramid that is where utilization is the hardest to achieve. We still have a little more buffer out there if I may. Also, looking at the way we do role mix in our projects. From here on, depending on how the quality of demand is, we can continue to work hard on streamlining it. Remember, one thing in the last two to three years the firm actually went through a federated sales structure and the consolidated delivery structure. That gave us a kind of a platform to make the efficiency work and to get to here. That helped us to take out any pockets or any silos in the structure. So, a bunch of things we could continue to do from here on to keep the momentum up assuming the pricing drop does not happen or assuming the pricing can hold up, we have a bunch of levers. The onsite mix has still gone up a little bit from last few quarters and we might have to look at how to keep it in control as Ranga earlier said. There is still an opportunity to do more automation. We have had a good runway on automation this quarter. We are hoping to see more accelerated benefits of automation as we go forward. But what would also happen is we are also hiring talent in the US. If we can actually get that talent into projects, then I think that will help us on our model. So these are a few other levers we can actually start working on from here on. The last one I want to talk about in terms of margin is the ability to get newer services which are much more profitable as a higher proportion of our revenues because it just helps us to keep the trajectory up.
Vishal Sikka
Thanks, Ravi. Moshe, just to add to what Ravi said, when I started we were at 76-77% utilization and we used to hear that wheels would come off at 78% and then the wheels would come off at 80% and the wheels would come off at 82%. So we are at 84% now and the wheels still have not come off. So there is probably a little bit more room, not much perhaps but like Ravi said, there are the various operating parameters in terms of optimizing the execution efficiency. But the most important one obviously is automation and especially bringing more and more automation into the fixed price projects, into the maintenance projects, the large scale managed service projects and so forth. New services tend to give a higher margin and especially new software. So more that we emphasize on those aspects of the business, the more of effect that we can start to have on margins.
M.D. Ranganath
Just to add on, if we look at the other focus area, it has been on the onsite employee cost as a percentage of revenue as well as the total employee cost as a percentage of revenue. It is not just utilization which drives this, there are also elements of roll ratios in a project. For example, fixed price projects onsite are where bulk of our focus is, how do we release top heavy projects with more senior resources because the revenue is not going to be impacted but how to be released them and efficiency redeploy in other projects with higher billing rates and so on. This will also address better efficiencies onsite. That is one focus area for us. Not just this quarter, over the last couple of quarters as well. So, as a result, if you look at our onsite employee cost as a percentage of revenue has come down to 38.5% as compared to 39.3% same quarter last year despite pricing decline and so on. So likewise, the overall employee cost. One of the elements is the net headcount, of course the part of it is because of higher utilization, net headcount this quarter was negative 1,800 as compared to +3,000 previous quarter. Most importantly, if you look at the year-on-year revenue growth, while it has been 6.3%, the headcount growth has been 0.8%. So I think the multiple parts we need to look at. But while we appreciate and we clearly recognize the fact that operating levers in the medium-term will kind of plateau out, the primary focus needs to be from the other measures that I talked about.
Moshe Katri
Just as a follow-up, so when asked about quarterly bookings or TCV in your earlier media appearance, I think Pravin indicated that you had mostly renewals this quarter and that down the road this metric will become less and less relevant given the company’s increased focus on new digital areas. So, one, can you confirm your commentary on renewals? Then two, are your selling efforts now will exclusively be focusing on digital and pretty much less and less legacy services?
Pravin Rao
Hi, this is Pravin here. On the large deals, the run rate is similar to what we have seen in earlier quarters on an average around $657 mn. A big percentage of it is renewals and over the last few quarters. We have been focusing on building out on new services and new software and for the first time this quarter we published our metrics on that. We believe that these are the services that will be the future for us in the coming years as we embark on our transformation journey. So large deals and other things will probably become irrelevant over a period of time because most of the focus will be on newer technologies, ticket sizes will be much smaller and so on. Having said that, we will continue to compete aggressively on large deals, we will continue to win our fair share of large deals. We are not walking away from that. But as a metric, we are focusing on fewer metrics which will probably be more relevant in future. Just to clarify, the total TCV for this quarter is $657mn for large deals.
Moderator
Thank you. The next question is from the line of Joseph Foresi from Cantor. Please go ahead.
Joseph Foresi
Hi, so everyone at this point has been talking about having digital practices. I am wondering could you clarify for us what your differentiator is in those newer digital practices. Is this a case for everybody’s kind of participating in this wave or where do you feel at some point it is going to become a market share game like the other businesses?
Vishal Sikka
Hey, Joseph, that is a great question. For the last couple of years, I have said that when people ask me how much of your business is digital, I always say it is 100% because we write software for digital computers. Joking aside, the reality is that as you said, there is always an adoption curve in these things. At any given point in time, there is an emerging set of services, emerging set of technologies that require a new skill development, new capability development and bringing new solutions and even new IP into the market to do that. On the one hand, we have to commoditize and bring a large scale to these technologies as much as possible and on the other hand we want to do that as early as possible when typically, the scale and skill development is not there yet. So if you look at today’s status for instance, virtual reality and augmented reality technologies or voice interfaces, Alexa or the Amazon voice service just crossed 15,000 skills that are available for Alexa by the end of June. If you look at various voice and chat interfaces, AI and machine learning technologies, autonomous driving technologies, one of the programs that we have put in place here is to train several thousand people in autonomous driving technology. Earlier today, I demonstrated one of our indigenously built autonomous system for a golf cart and that was done right here in our Mysore facility by our engineering services team to train our employees on autonomous and autonomous driving technologies. So, there is always this emerging set of areas where the sooner you can start building capability and skills, the better you can monetize the higher value, higher margin, higher RPE kinds of services.
Coming back to the point of 8.3% in new services and 1.6% in new software is all examples of services and software that we did not have on April 1st, 2015. So this is completely new revenue from the last, a little bit more than two years. If you look at the $2 bn in growth that we have had since then, $1 bn of that $2 bn has come from the new software and new services and this is something that we are really proud of. So we are counting on much higher growth in these areas which tend to be the AI First, Cloud First kinds of areas, Cyber Security, IoT, things like this where we are building next-generation capabilities. Earlier today somebody asked me about how does this compare to the digital revenue and we did despite my repeatedly saying everything we do is digital, we benchmarked our services compared to the way other peers of our do in the industry. That number is approximately 23%. So approximately 23% of our revenue is from these digital services and the 8.3% and 1.6% that I talked about is part of that 23%.
Joseph Foresi
Did you give a number on the growth rate of 23%?
Vishal Sikka
No, not yet, this is the first quarter that we have done this fine grain auditable reporting of these numbers. So going forward you will be able to measure the growth rate, but when it comes to the new services what I can say is that the revenue from this was zero in April 2015 so that means that all of the roughly billion dollars now is new.
Joseph Foresi
You talked about the confidence in rebound in financial services in the second half of the year. Are these actual conversations or contracts to your visibility to that or is that more of a macro call and the fact that interest rates have gotten a little bit better and the spreads have widened a little bit for banks?
Mohit Joshi
Joseph, at this point of time this is a belief that we have, again as you rightly pointed out based on the macro trends that we are seeing and also from the greater degree of client confidence that we are seeing. This is a very US specific thing, if you see our results in Europe and in Australia, we continue to have a very strong performance for the sector. For Insurance, we continue to have a very strong performance.
Joseph Foresi
Final from me, we saw pricing take up, can you give us an update on the pricing environment and how do you think about that relations to margins going forward? Thanks.
Vishal Sikka
The way we see that is the new services demand a higher pricing premium and so the more that we focus on those things the better. By bringing automation into the traditional services and being able to get more productive at it that is another way that we can stem this declining pricing tide. So those are some of the factors that have gone into this.
Moderator
Thank you. Next question is from the line of Bryan Bergin from Cowen & Co. Please go ahead.
Bryan Bergin
A bit of a follow up here on the competitive dynamics in the new service areas, are you mostly self-sourcing a lot of this work?
Ravi Kumar S.
In new services, the challenge is not as much about demand, it is actually about how you build talent and capabilities to address them. A large part of that is already available as opportunities in the market. With existing customers, a lot of them which are very contemporary and new are actually coming to us based on existing relationships. Slightly mature ones which actually need a sense of steady state, those are the ones which actually go through a procurement process and RFP process. But if we can call it out early, we obviously have a shot at it. The key message is in new services, majority of them is all about how you build talent and competency pools to fulfill them. That to me is the key. It is not as much the demand build as much about how do you build capabilities to fulfill the demand.
Mohit Joshi
I just wanted to add one small point to this. Wherever we are able to use our own software, those discussions get to be more of sole-source discussion. So if we are able to sell Nia platform or sell the idea of the used case around Nia to a client, then the attached new services will be sole-source. So for instance, for a US-based bank, we were able to sell consulting and our Infosys Gamification Platform because they were looking to incentivize their field force for a greater cross-sell, so something like this would be sole-sourced.
Bryan Bergin
The change of approach at all is really industry alliances and potentially increasingly M&A in new service area to accelerate growth there?
Vishal Sikka
Bryan, when it comes to the acquisition of talent as Ravi talked about, acquisition of skills, using agencies, subcontracting and also using acquihires and acquisition as a strategy to hire some of these talented something that we are working on. The longer term sustained approach obviously is to develop our own training and as I mentioned earlier, we have built the world’s largest ever Design Thinking training endeavor and we have trained more than 142,000 people on this, so similarly we are now working on developing more detailed, more deeper design engagement kinds of initiative and so that you can participate in the transformational journey of the clients and not just be on the receiving end of a particular services project or something of this nature. When it comes to M&A and so forth obviously, those are all mechanisms available to us to develop more capability and more talent in this. The Skava platform also helps in getting into some of these areas as does the Nia platform in bringing the AI capability and so that the software can amplify our productivity, our profitability, and our ability to build new kinds of scenarios.
Bryan Bergin
My follow-up on the GST contract, can you comment on scale of that and really I guess whether it is kind of a one-time type of contract or if that carries forward as you continue to implement solutions there, I am just trying to understand how that will have impact on the quarter?
M.D. Ranganath
First of all this quarter, the incremental revenue from GST was negligible, it was less than $3 mn that is one point. So GST hardly provided any incremental revenue this quarter. Second, if you look at the ROW incremental revenue that we saw this quarter is primarily from Australia, which is a very profitable market. Coming to GST and trajectory, as you know GST has two phases, build phase and maintenance phase. We are pretty much at the fag-end of the build phase, then the maintenance phase would kick start. The trajectory is also from now onwards, we do not expect too much of lumpiness, much more gradual progress. They are all linked to certain milestones and deliverables, so that is what we visualize on GST at this point.
Moderator
Thank you. The next question is from the line of David Koning from Baird. Please go ahead.
David Koning
I guess first of all the margin this quarter was a little bit above the midpoint of your full-year guidance, usually Q1 is a low point and I believe a lot of that may be have to do with the timing of the wage increases, but is it fair to think this year Q1 might not be the low point of your margins for the year?
M.D. Ranganath
If you look at this year’s Q1, 24.1% is same as last year same quarter’s 24.1%. We were impacted by 80 basis points on rupee which was offset to some extent by the cross currency by about 20 basis points. Large part of margin uptick was also due to the utilization and the pricing realization which gave us 90 basis points and 50 basis points. We increased the variable pay to employees this year based on the revenue performance, so sequentially that played, plus some of the subcon cost had additional headwind of 140 basis points, so that is the broad math. But coming to your question, we have actually announced some compensation increases effective July and the incremental delta would be around 0.7% to 0.8%. That would be the broad impact on the compensation increases.
David Koning
So Q2 might be sequentially down a little bit based on that?
M.D. Ranganath
That is one. As you know the margin trajectory for the any quarter apart from the compensation increase is also a factor of how much is the sequential revenue as well as how the trajectory of rupee and some of the other levers that we talked about earlier. I think it will be a combination of all these factors.
David Koning
Maybe one follow-up, the interest and other income remains quite strong, the yield is good obviously on cash in India, was there anything one-off in the $127 mn of interests other that might not carry in to the following quarters or is that a pretty good base to keep building on in future quarters?
M.D. Ranganath
I think there is nothing unusual about it, consistently it has interest income and the income from the other investments that we have. At the same time, we also have these hedges, any profits made on hedges also flow into other income and it has been consistent across all the quarters.
David Koning
Is July the new ongoing wage increase quarter, you think in future years that is going to be the same timing?
M.D. Ranganath
If you look at the last year while for the junior employees, we started early and for the senior employees, we kind of gradually split it over quarters depending upon the progress of the revenue trajectory last year and in our BPO business that has been there for quite some time. This year of course we have done some increases effective July, and rest we will consider as the quarter moves forward.
Moderator
Thank you. Next question is from the line of James Friedman from Susquehanna Financial Group. Please go ahead.
James Friedman
My first question was with regard to Pravin’s comment about the $657 mn of large deal TCV. My question is if you look at that on a vertical basis, is there anything in there Pravin that suggests that there will be an acceleration in BFS consistent with what you are contemplating for the second half?
Mohit Joshi
BFS has always been a fairly significant contributor to the overall large deal volume, not just for this quarter but consistently for the past six to eight quarters. That is the trend that even this quarter’s vertical breakup will show. In terms of large deal pipeline and large deal momentum we are seeing reasonable momentum. Deal cycles have become a bit longer especially in the US, decision timeframes are taking longer, but there is nothing unusually radical that we see there. Again I think Joseph had asked this question earlier about why we are making a call and it is primarily a macro call which is supplemented by the discussions that we are having with our clients. While you would notice that we have not seen a significant uptick in their budgets, there is a lot more confidence, there is a lot more pressure from business on discretionary spend, there is a lot more focus on spending on new technology areas like AI and Digital. So it is a subjective call based on all those factors. Finally, I will also mention that given the fact that in this Financial Services business, we have such a huge concentration of clients, just one or two clients can really make or break a quarter. $5 mn or $6 mn or $10 mn increase or decrease for a single client can really impact the sequential growth and in this case we have a couple of clients where growth has been lagging for the past three or four quarters. We expect that in this client specific instances, their spends will pick up in the second half of our financial year.
Vishal Sikka
Just to add to that, we are not giving up on large deals. We are simply saying that the large deals in the commoditizing services are increasingly going to be not so relevant and that is why we are publishing and focusing on the new services and new software areas. When it comes to large deals wherever there are large deals, obviously we will be vigorously and with a lot of focus and attention, competing for those. We have spent a lot of effort in becoming much more competitive and winning large deals by using better solutioning, bringing AI and especially brining Design Thinking into the solutions, more deeply understanding the problems at the root of the large deals that are being proposed and also in our engagement process, you see a significant improvement in our large deal wins and conversion rates over the last many quarters. Having said that, it is just the commoditizing services and going after big projects which is not something that we see as a strategic area as much as we see the new services and the new software. So this is what you are seeing in our commentary.
James Friedman
Ranga, I just wanted to ask you about the subcontractor cost. I realize that it may to some degree be a function of utilization heat because it was up a 100 basis points Year-over-Year on my math, is where should we anticipate that travelling to over the course of the year?
M.D. Ranganath
Yes you are right, primary uptick if you recollect few quarters ago it had gone up to 6.3% in Q3 of FY16 and we had very consciously brought it down to 5.3% two quarters ago and it has started again inching upwards. One of the key pieces is really the higher utilization levels. The second one is typically what we are trying to do is to prioritize the subcon costs for new services where the billing rates are higher and the margins are better. So one way is to move away from the subcon costs in the other services and move towards this, even if the percentage of revenue is high. If we at least look at the profitability of those subcon expenses and redirect the expenses to more profitable service lines, so that is one approach. In the short-term we do see this being at this levels till we have much more efficiencies in talent planning kicking in and as our onsite hiring picks up.
Moderator
Thank you. The next question is from the line of Anil Doradla from William Blair & Company. Please go ahead.
Anil Doradla
Couple of questions, Vishal, you talked about 10,000 employees in the US and I think your initial focus is a couple of thousand, so where are you today, have you started the job requisitions, are they out today and what is going to be the mix between experience and new hires here?
Ravi Kumar S.
Thanks for the question. We put a plan for 10,000 hires in two years. We wanted to do it in 4 to 5 centers depending on how we get there. We have put a set of criteria on how to establish those centers. I had earlier spoken about how the model which we operate on which is an onsite-offshore model will kind of morph to on-site nearshore-offshore model and the nearshore centers are the one which we are talking about which is primarily the innovation and technology hubs where we believe Infosys employees and clients can come together and work on an agile fashion. The experience talent which we hired in the US is an ongoing process, that has not stopped, that will continue to go forward. We would hire for deploying to client sites. Now, the next step of hiring is to hire into the centers so that we could transition into the on-site nearshore-offshore model and use them under the cluster of clients which are in and around those centers.
Last quarter, almost 600+ joined us last quarter, we have already hired from campuses across the US, they are going to join us. The first batch has actually joined us and they are going to continue to join us for the next few months and we will keep hiring round the year till the end of the year. So the idea is to train them there, build those capabilities, and actually have them into projects in the 3-Tier model I spoke about. A lot of it is in contemporary skill, so we are actually hiring them in and around the clusters of where those locations are and then we are going to train staff and push them into projects. The journey has already started. Campus hiring is round the year. The experience talent that is the normal thing it continues to happen for our client locations, and then the third feeder which will get in is refactoring talent in adjacent areas so that is the third feeder in the 10,000, freshers, experienced, hires, and refactored talent. That is something we will kick off as well, so we are doing a local enablement, local training, local hiring, and then deploying them into projects.
Anil Doradla
I think Ranga you talked about focusing on new metrics, now this business models are changing, you are seeing a lot of automation in new digital technologies, are there some metrics that we as an industry are not looking at today could potentially be part of your kind of financial model? Are there some metrics that you might introduce over the next year or two as the business models change?
M.D. Ranganath
Well, I think primarily whichever service line that we look at, it is extremely important for us to focus on three key elements which is the per capita revenue, per capita revenue of the service line as well as the onsite mix of the service line and the profitability which is resultant of both put together. What we have attempted this quarter is really by calling out new services, we want to give a view to the investors on the trajectory of the new services as a percentage of total revenue as well as the incremental revenue. For example, this quarter we stated it is 8.3%, so next quarter, the investors would be getting a perspective on how this trajectory of 8.3% both in relative and absolute terms is changing. As we move forward in couple of quarters certainly as some of those services become a critical size, for example, about group of six services contributing to 8.3% and one of them might even pick up to let us say 4%, 5%, etc., at that point in time, we want to call out some of the three metrics that I talked about. Essentially, that is one thing clearly on our mind in the coming quarters.
Anil Doradla
As it becomes bigger, each of these could be further broken down by some of the metrics that you are talking about?
M.D. Ranganath
Absolutely.
Moderator
Thank you. The next question is from the line of Shashi Bhushan from IDFC Securities. Please go ahead.
Shashi Bhushan
Two-and-half year back when we started the journey towards the transformation which had acquisition as an integral part, however, there has been no action over the last few quarters. Is there any change in strategy or we are not finding the right fit at right price, can you elaborate on a new strategy for the same?
Vishal Sikka
It is more of the latter, it is finding the right companies at the right price. The right companies meaning companies that are companies of tomorrow with technology and advanced technology in strategic areas that we want to be and not buying companies of yesterday and the right price obviously is the right price. So that combination is not easy obviously, but we are committed to it. Last quarter, we bought a small company called Skytree which had very unique machine learning expertise to make it a part of our Nia platform. Wherever we see opportunities like this, we will continue to do that but we do wish to see acquisition as the key part of our story going forward but we do not want to buy backward-looking technologies. We do not want to buy market share or revenue growth, we want to buy purposeful technologies for the future.
Shashi Bhushan
My second question is, from two quarters of low-single digit growth due to client specific issues, this quarter performance was a good positive surprise I would say. Would it be fair to say that top client specific issues are behind and follow up to that is our second half tend to be weaker over the last few years barring few exceptions, and given our deal win and pipeline, any color on the same, how it looks in FY18?
Vishal Sikka
It is too early to talk about the second half of the year, although as our Software business becomes bigger obviously, some of the seasonality would not apply, but obviously it would continue to apply to the services business. In some of these super large clients, we already have a very large market share and so that is where we are, but we are generally adding. When I started, we had 12 $100 mn accounts, that number went up to 19 in previous quarter and now 18. 18 is just because one client had a couple of million-dollar movement, so it put them out of the $100 mn number for the quarter, but I am not particularly worried about that. We have a dedicated focus on top clients and the second tier below the top 25 are actually growing quite robustly. So, we want to continue to make sure that there is a healthy balance there between the focus on the top clients and the Second-Tier ones. I know some of the analysts have written about this, but I do not see anything in particular in what is going on with the top client.
Shashi Bhushan
Any reason why we have stopped sharing some of the client buckets like $200 mn and $300 mn, even top 5 clients in this quarter?
M.D. Ranganath
We wanted to focus on the $100+ mn and these typically includes $200mn and $300mn, but if the question is there a decline in the number of $200mn or $300mn clients this quarter, no, that is not the reason. We have seen the same number of $200 mn clients and $300 mn clients in this quarter as it was last quarter, there is no decline there. $100 mn there is a decline by one which was a narrow miss by maybe $2 mn or something so beyond that there is nothing more to read to it and we will continue to publish the $100 mn which is our core focus.
Moderator
Thank you. Ladies and Gentlemen, this was the last question for today. I would now like to hand over the floor back to Mr. Sandeep Mahindroo for his closing comments. Over to you, Sir.
Sandeep Mahindroo
We would like to thank everyone for joining us on this call. Wish you a good weekend ahead and look forward to talking to you again.
Moderator
Thank you very much, Sir. Ladies and Gentlemen, on behalf of Infosys that concludes this conference call. Thank you for joining us and you may now disconnect your lines.
Exhibit 99.8
Form of Releases to Stock Exchanges and Advertisement
|
Infosys Limited Regd. office: Electronics City, Hosur Road, Bengaluru – 560 100, India |
CIN : L85110KA1981PLC013115 Website: www.infosys.com email: [email protected] T: 91 80 2852 0261, |
Audited consolidated financial results of Infosys Limited and its subsidiaries for the quarter ended June 30, 2017 prepared in compliance with the Indian Accounting Standards (Ind-AS)
(in crore, except per equity share data)
| Particulars | Quarter ended June 30, |
Quarter ended March 31, |
Quarter ended June 30, |
Year ended March 31, |
| 2017 | 2017 | 2016 | 2017 | |
| Audited | Audited | Audited | Audited | |
| Revenue from operations | 17,078 | 17,120 | 16,782 | 68,484 |
| Other income, net | 814 | 746 | 753 | 3,080 |
| Total Income | 17,892 | 17,866 | 17,535 | 71,564 |
| Expenses | ||||
| Employee benefit expenses | 9,366 | 9,309 | 9,282 | 37,659 |
| Cost of technical sub-contractors | 1,061 | 1,000 | 917 | 3,833 |
| Travel expenses | 527 | 474 | 740 | 2,235 |
| Cost of software packages and others | 440 | 478 | 276 | 1,597 |
| Communication expenses | 125 | 149 | 120 | 549 |
| Consultancy and professional charges | 246 | 229 | 175 | 763 |
| Depreciation and amortisation expenses | 450 | 446 | 400 | 1,703 |
| Other expenses | 752 | 823 | 825 | 3,244 |
| Total expenses | 12,967 | 12,908 | 12,735 | 51,583 |
| Profit before non-controlling interest / share in net profit / (loss) of associate | 4,925 | 4,958 | 4,800 | 19,981 |
| Share in net profit/(loss) of associate | – | (7) | (2) | (12) |
| Write-down of investment in associate* | (71) | (18) | – | (18) |
| Profit before tax | 4,854 | 4,933 | 4,798 | 19,951 |
| Tax expense: | ||||
| Current tax | 1,499 | 1,249 | 1,467 | 5,653 |
| Deferred tax | (128) | 81 | (105) | (55) |
| Profit for the period | 3,483 | 3,603 | 3,436 | 14,353 |
| Other comprehensive income | ||||
| Items that will not be reclassified subsequently to profit or loss | ||||
| Remeasurement of the net defined benefit liability/asset | (3) | 20 | (17) | (45) |
| Equity instruments through other comprehensive income, net | – | (5) | – | (5) |
| Items that will be reclassified subsequently to profit or loss | ||||
| Fair value changes on derivatives designated as cash flow hedges, net | (66) | 11 | – | 39 |
| Exchange differences on translation of foreign operations | 107 | (197) | 38 | (257) |
| Fair value changes on investments, net | 27 | (10) | – | (10) |
| Total other comprehensive income, net of tax | 65 | (181) | 21 | (278) |
| Total comprehensive income for the period | 3,548 | 3,422 | 3,457 | 14,075 |
| Paid up share capital (par value 5/- each, fully paid) |
1,144 | 1,144 | 1,144 | 1,144 |
| Other equity | 67,838 | 67,838 | 60,600 | 67,838 |
| Earnings per equity share (par value 5/- each) |
||||
| Basic () |
15.24 | 15.77 | 15.03 | 62.80 |
| Diluted () |
15.23 | 15.76 | 15.03 | 62.77 |
| * | During the quarter ended June 30, 2017, the Company has written down the entire
carrying value of the investment in its associate DWA Nova LLC amounting to 71 crore. The write-down in the carrying value of
investment in associate DWA Nova LLC during the quarter and year ended March 31, 2017 was 18 crore. |
Notes:
| 1. | The audited interim consolidated financial statements for the quarter ended June 30, 2017 have been taken on record by the Board of Directors at its meeting held on July 14, 2017. The statutory auditors have expressed an unqualified audit opinion. The information presented above is extracted from the audited interim consolidated financial statements. The interim consolidated financial statements are prepared in accordance with the Indian Accounting Standards (Ind-AS) as prescribed under Section 133 of the Companies Act, 2013 read with Rule 3 of the Companies (Indian Accounting Standards) Rules, 2015 and Companies (Indian Accounting Standards) Amendment Rules, 2016. |
| 2. | Changes to the Board |
| The Board appointed D. Sundaram as an Independent Director of the Company effective July 14, 2017 based on the recommendations of the Nomination and Remuneration Committee of the Board. |
| 3. | Management Change |
| (1) | The Company has appointed Inderpreet Sawhney as Group General Counsel and Chief Compliance Officer effective July 3, 2017. The Board in their meeting held on July 14, 2017 resolved to include Inderpreet Sawhney as key managerial personnel (KMP) as defined under Ind AS-24 - Related Party Disclosures and designate her as an Executive Officer of the Company for purposes of reporting under the rules of the Securities Exchange Commission effective from the date of the meeting. |
| The Board of Directors in their meeting held on July 14, 2017, on recommendation of Nomination and Remuneration Committee, have approved the annual compensation of Inderpreet Sawhney. The cash compensation is $ 0.90 million comprising of a fixed component of $ 0.55 million, variable compensation of upto $ 0.35 million and annual performance based stock grants. Accordingly, the Nomination and Remuneration committee approved the grant of 19,450 RSUs and 44,450 stock options with effect from August 1, 2017 under the 2015 Stock Incentive Compensation Plan (2015 Plan). These RSUs and stock options shall vest over a period of 4 years from the date of grant and shall be exercisable within the period as approved by the committee. The exercise price of the RSUs will be equal to the par value of shares and the exercise price of the stock options would be the market price as on the date of grant. |
| Additionally, the Board of Directors in their meeting held on July 14, 2017, on recommendation of Nomination and Remuneration Committee approved a one time joining bonus of $25,000 and a one-time grant of 38,700 RSUs to be granted with effect from August 1, 2017 based on the approval of the Nomination and remuneration committee at its meeting held on July 13, 2017. These RSUs will vest over a period of 2 years from the date of grant in the ratio of 60:40 and the exercise price will be equal to the par value of the shares. |
| (2) | Gopi Krishnan Radhakrishnan, Acting General Counsel, resigned from the company effective June 24, 2017. The Board placed on record its appreciation for the services rendered by him during his tenure. |
| (3) | Sandeep Dadlani, President , resigned from the company effective July 14, 2017. The Board placed on record its appreciation for the services rendered by him during his tenure. |
| 4. | The company has asked, for business reasons, M.D Ranganath, the CFO to operate from the US. Accordingly, the Board of Directors in their meeting held on July 14, 2017, on recommendation of Nomination and Remuneration Committee, have approved a revision to his salary comprising of fixed pay of $ 0.69 million and a variable compensation of upto $0.56 million effective July 1, 2017. In addition, in line with the executive compensation policy, he would be eligible for stock incentives as may be decided by Nomination and Remuneration committee from time to time based on performance. |
| 5. | On July 14, 2017, the Board of Directors of Infosys authorized the Company to execute a Business Transfer Agreement and related documents with Noah Consulting LLC, a wholly owned subsidiary, to transfer the business of Noah Consulting LLC to Infosys Limited, subject to securing the requisite regulatory approvals for a consideration based on an independent valuation. The transfer of assets and liabilities between entities under common control will be accounted for at carrying values and will not have any impact on the consolidated financial statements. |
| 6. | Information on dividends for the quarter ended June 30, 2017 |
(in )
| Particulars | Quarter ended June 30, |
Quarter ended March 31, |
Quarter ended June 30, |
Year ended March 31, |
| 2017 | 2017 | 2016 | 2017 | |
| Dividend per share (par value 5/- each) |
||||
| Interim dividend | – | – | – | 11.00 |
| Final dividend | – | 14.75 | – | 14.75 |
| 7. | Audited financial results of Infosys Limited (Standalone Information) |
(in crore)
| Particulars | Quarter ended June 30, |
Quarter ended March 31, |
Quarter ended June 30, |
Year ended March 31, |
| 2017 | 2017 | 2016 | 2017 | |
| Revenue from operations | 14,971 | 14,920 | 14,420 | 59,289 |
| Profit before tax | 4,716 | 4,783 | 4,460 | 18,938 |
| Profit for the period | 3,415 | 3,562 | 3,180 | 13,818 |
Note: The audited results of Infosys Limited for the above mentioned periods are available on our website, www.infosys.com and on the Stock Exchange website www.nseindia.com and www.bseindia.com. The information above has been extracted from the audited interim condensed financial statements as stated.
| 8. | Segment reporting (Consolidated - Audited) |
(in crore)
| Particulars | Quarter ended June 30, |
Quarter ended March 31, |
Quarter ended June 30, |
Year ended March 31, |
| 2017 | 2017 | 2016 | 2017 | |
| Revenue by business segment | – | |||
| Financial Services (FS) | 4,594 | 4,655 | 4,551 | 18,555 |
| Manufacturing (MFG) | 1,863 | 1,918 | 1,844 | 7,507 |
| Energy & utilities, Communication and Services (ECS) | 3,957 | 3,963 | 3,719 | 15,430 |
| Retail, Consumer packaged goods and Logistics (RCL) | 2,695 | 2,710 | 2,861 | 11,225 |
| Life Sciences, Healthcare and Insurance (HILIFE) | 2,170 | 2,148 | 2,004 | 8,437 |
| Hi-Tech | 1,235 | 1,211 | 1,322 | 5,122 |
| All other segments | 564 | 515 | 481 | 2,208 |
| Total | 17,078 | 17,120 | 16,782 | 68,484 |
| Less: Inter-segment revenue | – | – | – | – |
| Net revenue from operations | 17,078 | 17,120 | 16,782 | 68,484 |
| Segment profit before tax, depreciation and non-controlling interests: | – | |||
| Financial Services (FS) | 1,295 | 1,328 | 1,267 | 5,209 |
| Manufacturing (MFG) | 424 | 472 | 451 | 1,848 |
| Energy & utilities, Communication and Services (ECS) | 1,073 | 1,120 | 1,066 | 4,431 |
| Retail, Consumer packaged goods and Logistics (RCL) | 775 | 784 | 802 | 3,249 |
| Life Sciences, Healthcare and Insurance (HILIFE) | 598 | 596 | 522 | 2,308 |
| Hi-Tech | 273 | 291 | 321 | 1,277 |
| All other segments | 124 | 70 | 21 | 292 |
| Total | 4,562 | 4,661 | 4,450 | 18,614 |
| Less: Other unallocable expenditure | 451 | 449 | 403 | 1,713 |
| Add: Unallocable other income | 814 | 746 | 753 | 3,080 |
| Add: Share in net profit/(loss) of associate | – | (7) | (2) | (12) |
| Less: Write-down of investment in associate | 71 | 18 | – | 18 |
| Profit before tax and non-controlling interests | 4,854 | 4,933 | 4,798 | 19,951 |
Notes on segment information
Business segments
Based on the "management approach" as defined in Ind-AS 108 - Operating Segments, the Chief Operating Decision Maker evaluates the Company's performance and allocates resources based on an analysis of various performance indicators by business segments. Accordingly, information has been presented along these business segments. The accounting principles used in the preparation of the financial statements are consistently applied to record revenue and expenditure in individual segments.
Segmental capital employed
Assets and liabilities used in the Company's business are not identified to any of the reportable segments, as these are used interchangeably between segments. The Management believes that it is not practicable to provide segment disclosures relating to total assets and liabilities since a meaningful segregation of the available data is onerous.
| By order of the Board | |
| for Infosys Limited | |
| Bengaluru, India | Dr. Vishal Sikka |
| July 14, 2017 | Chief Executive Officer and Managing Director |
The Board has also taken on record the unaudited condensed consolidated results of Infosys Limited and its subsidiaries for the quarter ended June 30, 2017, prepared as per International Financial Reporting Standards (IFRS) and reported in US dollars. A summary of the financial statements is as follows:
(in US$ million, except per equity share data)
| Particulars | Quarter ended June 30, | Quarter ended March 31, |
Quarter ended June 30, | Year ended March 31, |
| 2017 | 2017 | 2016 | 2017 | |
| Revenues | 2,651 | 2,569 | 2,501 | 10,208 |
| Cost of sales | 1,692 | 1,614 | 1,592 | 6,446 |
| Gross profit | 959 | 955 | 909 | 3,762 |
| Net profit | 541 | 543 | 511 | 2,140 |
| Earnings per equity share | ||||
| Basic | 0.24 | 0.24 | 0.22 | 0.94 |
| Diluted | 0.24 | 0.24 | 0.22 | 0.94 |
| Total assets | 13,178 | 12,854 | 11,317 | 12,854 |
| Cash and cash equivalents including current investments | 5,184 | 5,027 | 4,681 | 5,027 |
Certain statements in these releases concerning our future growth prospects are forward-looking statements regarding our future business expectations intended to qualify for the 'safe harbor' under the Private Securities Litigation Reform Act of 1995, which involve a number of risks and uncertainties that could cause actual results to differ materially from those in such forward-looking statements. The risks and uncertainties relating to these statements include, but are not limited to, risks and uncertainties regarding fluctuations in earnings, fluctuations in foreign exchange rates, our ability to manage growth, intense competition in IT services including those factors which may affect our cost advantage, wage increases in India, our ability to attract and retain highly skilled professionals, time and cost overruns on fixed-price, fixed-time-frame contracts, client concentration, restrictions on immigration, industry segment concentration, our ability to manage our international operations, reduced demand for technology in our key focus areas, disruptions in telecommunication networks or system failures, our ability to successfully complete and integrate potential acquisitions, liability for damages on our service contracts, the success of the companies in which Infosys has made strategic investments, withdrawal or expiration of governmental fiscal incentives, political instability and regional conflicts, legal restrictions on raising capital or acquiring Companies outside India, and unauthorized use of our intellectual property and general economic conditions affecting our industry. Additional risks that could affect our future operating results are more fully described in our United States Securities and Exchange Commission filings including our Annual Report on Form 20-F for the fiscal year ended March 31, 2017. These filings are available at www.sec.gov. Infosys may, from time to time, make additional written and oral forward-looking statements, including statements contained in the company's filings with the Securities and Exchange Commission and our reports to shareholders. In addition, please note that the date of these results is July 14, 2017, and any forward-looking statements contained herein are based on assumptions that we believe to be reasonable as of this date. The Company does not undertake to update any forward-looking statements that may be made from time to time by or on behalf of the Company unless it is required by law.
|
Infosys Limited Regd. office: Electronics City, Hosur Road, Bengaluru – 560 100, India |
CIN : L85110KA1981PLC013115 Website: www.infosys.com email: [email protected] T: 91 80 2852 0261, |
Extract of audited consolidated financial results of Infosys Limited and its subsidiaries for the quarter ended June 30, 2017, prepared in compliance with the Indian Accounting Standards (Ind-AS)
( in crore except equity share data)
| Particulars | Quarter ended June 30, | Year ended March 31, | Quarter ended June 30, |
| 2017 | 2017 | 2016 | |
| Revenue from operations | 17,078 | 68,484 | 16,782 |
| Profit before tax | 4,854 | 19,951 | 4,798 |
| Net profit after tax | 3,483 | 14,353 | 3,436 |
| Total comprehensive income for the period (comprising profit for the period after tax and other comprehensive income after tax) | 3,548 | 14,075 | 3,457 |
| Paid-up equity share capital (par value 5/- each, fully paid) |
1,144 | 1,144 | 1,144 |
| Other equity | 67,838 | 67,838 | 60,600 |
| Earnings per share (par value 5/- each) |
|||
| Basic | 15.24 | 62.80 | 15.03 |
| Diluted | 15.23 | 62.77 | 15.03 |
| * | During the quarter ended June 30, 2017, the Company has written down the entire
carrying value of the investment in its associate DWA Nova LLC amounting to 71 crore. The write-down in the carrying value of
investment in associate DWA Nova LLC during the quarter and year ended March 31, 2017 was 18 crore. |
| 1. | The audited interim consolidated financial statements for the quarter ended June 30, 2017 have been taken on record by the Board of Directors at its meeting held on July 14, 2017. The statutory auditors have expressed an unqualified audit opinion. The information presented above is extracted from the audited interim consolidated financial statements. The interim consolidated financial statements are prepared in accordance with the Indian Accounting Standards (Ind-AS) as prescribed under Section 133 of the Companies Act, 2013 read with Rule 3 of the Companies (Indian Accounting Standards) Rules, 2015 and Companies (Indian Accounting Standards) Amendment Rules, 2016. |
| 2. | Changes to the Board |
The Board appointed D. Sundaram as an Independent Director of the Company effective July 14, 2017 based on the recommendations of the Nomination and Remuneration Committee of the Board.
| 3. | Management Change |
| (1) | The Company has appointed Inderpreet Sawhney as Group General Counsel and Chief Compliance Officer effective July 3, 2017. The Board in their meeting held on July 14, 2017 resolved to include Inderpreet Sawhney as key managerial personnel (KMP) as defined under Ind AS-24 - Related Party Disclosures and designate her as an Executive Officer of the Company for purposes of reporting under the rules of the Securities Exchange Commission effective from the date of the meeting. |
The Board of Directors in their meeting held on July 14, 2017, on recommendation of Nomination and Remuneration Committee, have approved the annual compensation of Inderpreet Sawhney. The cash compensation is $ 0.90 million comprising of a fixed component of $ 0.55 million, variable compensation of upto $ 0.35 million and annual performance based stock grants. Accordingly, the Nomination and Remuneration committee approved the grant of 19,450 RSUs and 44,450 stock options with effect from August 1, 2017 under the 2015 Stock Incentive Compensation Plan (2015 Plan). These RSUs and stock options shall vest over a period of 4 years from the date of grant and shall be exercisable within the period as approved by the committee. The exercise price of the RSUs will be equal to the par value of shares and the exercise price of the stock options would be the market price as on the date of grant.
Additionally, the Board of Directors in their meeting held on July 14, 2017, on recommendation of Nomination and Remuneration Committee approved a one time joining bonus of $ 25,000 and a one-time grant of 38,700 RSUs to be granted with effect from August 1, 2017 based on the approval of the Nomination and Remuneration committee at its meeting held on July 13, 2017. These RSUs will vest over a period of 2 years from the date of grant in the ratio of 60:40 and the exercise price will be equal to the par value of the shares.
| (2) | Gopi Krishnan Radhakrishnan, Acting General Counsel, resigned from the company effective June 24, 2017. The Board placed on record its appreciation for the services rendered by him during his tenure. |
| (3) | Sandeep Dadlani, President resigned from the company effective July 14, 2017. The Board placed on record its appreciation for the services rendered by him during his tenure. |
| 4. | The company has asked, for business reasons, M. D. Ranganath, the CFO to operate from the US. Accordingly, the Board of Directors in their meeting held on July 14, 2017, on recommendation of Nomination and Remuneration Committee, have approved a revision to his salary comprising of fixed pay of $ 0.69 million and a variable compensation of upto $0.56 million effective July 1, 2017. In addition, in line with the executive compensation policy, he would be eligible for stock incentives as may be decided by Nomination and Remuneration committee from time to time based on performance. |
| 5. | On July 14, 2017, the Board of Directors of Infosys authorized the Company to execute a Business Transfer Agreement and related documents with Noah Consulting LLC, a wholly owned subsidiary, to transfer the business of Noah Consulting LLC to Infosys Limited, subject to securing the requisite regulatory approvals for a consideration based on an independent valuation. The transfer of assets and liabilities between entities under common control will be accounted for at carrying values and will not have any impact on the consolidated financial statements. |
| 6. | Information on dividends for the quarter ended June 30, 2017 |
(in )
| Particulars | Quarter ended June 30, | Year ended March 31, | Quarter ended June 30, |
| 2017 | 2017 | 2016 | |
| Dividend per share (par value 5/- each) |
|||
| Interim dividend | – | 11.00 | – |
| Final dividend | – | 14.75 | – |
| 7. | Audited financial results of Infosys Limited (Standalone information) |
(in crore)
| Particulars | Quarter ended June 30, | Year ended March 31, | Quarter ended June 30, |
| 2017 | 2017 | 2016 | |
| Revenue from operations | 14,971 | 59,289 | 14,420 |
| Profit before tax | 4,716 | 18,938 | 4,460 |
| Profit for the period | 3,415 | 13,818 | 3,180 |
The above is an extract of the detailed format of Quarterly Financial Results filed with Stock Exchanges under Regulation 33 of the SEBI (Listing and Other Disclosure Requirements) Regulations, 2015. The full format of the Quarterly Financial Results are available on the Stock Exchange websites, www.nseindia.com and www.bseindia.com, and on the Company's website, www.infosys.com.
Certain statements in these results concerning our future growth prospects are forward-looking statements regarding our future business expectations intended to qualify for the 'safe harbor' under the Private Securities Litigation Reform Act of 1995, which involve a number of risks and uncertainties that could cause actual results to differ materially from those in such forward-looking statements. The risks and uncertainties relating to these statements include, but are not limited to, risks and uncertainties regarding fluctuations in earnings, fluctuations in foreign exchange rates, our ability to manage growth, intense competition in IT services including those factors which may affect our cost advantage, wage increases in India, our ability to attract and retain highly skilled professionals, time and cost overruns on fixed-price, fixed-time-frame contracts, client concentration, restrictions on immigration, industry segment concentration, our ability to manage our international operations, reduced demand for technology in our key focus areas, disruptions in telecommunication networks or system failures, our ability to successfully complete and integrate potential acquisitions, liability for damages on our service contracts, the success of the companies in which Infosys has made strategic investments, withdrawal or expiration of governmental fiscal incentives, political instability and regional conflicts, legal restrictions on raising capital or acquiring companies outside India, and unauthorized use of our intellectual property and general economic conditions affecting our industry. Additional risks that could affect our future operating results are more fully described in our United States Securities and Exchange Commission filings including our Annual Report on Form 20-F for the fiscal year ended March 31, 2017. These filings are available at www.sec.gov. Infosys may, from time to time, make additional written and oral forward-looking statements, including statements contained in the Company's filings with the Securities and Exchange Commission and our reports to shareholders. In addition, please note that the date of these results is July 14, 2017, and any forward-looking statements contained herein are based on assumptions that we believe to be reasonable as of this date. The Company does not undertake to update any forward-looking statements that may be made from time to time by or on behalf of the Company unless it is required by law.
|
Infosys Limited Regd. office: Electronics City, Hosur Road, Bengaluru – 560 100, India |
CIN : L85110KA1981PLC013115 Website: www.infosys.com email: [email protected] T: 91 80 2852 0261, |
Audited financial results of Infosys Limited for the quarter ended June 30, 2017 prepared in compliance with the Indian Accounting Standards (Ind-AS)
(in crore, except per equity share data)
| Particulars | Quarter Ended June 30, |
Quarter Ended March 31, |
Quarter Ended June 30, |
Year Ended March 31, |
| 2017 | 2017 | 2016 | 2017 | |
| Audited | Audited | Audited | Audited | |
| Revenue from operations | 14,971 | 14,920 | 14,420 | 59,289 |
| Other income, net | 723 | 733 | 761 | 3,062 |
| Total income | 15,694 | 15,653 | 15,181 | 62,351 |
| Expenses | ||||
| Employee benefit expenses | 7,752 | 7,667 | 7,605 | 30,944 |
| Cost of technical sub-contractors | 1,334 | 1,263 | 1,135 | 4,809 |
| Travel expenses | 391 | 342 | 576 | 1,638 |
| Cost of software packages and others | 314 | 341 | 224 | 1,235 |
| Communication expenses | 83 | 104 | 82 | 372 |
| Consultancy and professional charges | 185 | 176 | 119 | 538 |
| Depreciation and amortisation expense | 343 | 336 | 319 | 1,331 |
| Other expenses | 576 | 641 | 661 | 2,546 |
| Total expenses | 10,978 | 10,870 | 10,721 | 43,413 |
| Profit before tax | 4,716 | 4,783 | 4,460 | 18,938 |
| Tax expense: | ||||
| Current tax | 1,394 | 1,141 | 1,314 | 5,068 |
| Deferred tax | (93) | 80 | (34) | 52 |
| Profit for the period | 3,415 | 3,562 | 3,180 | 13,818 |
| Other comprehensive income | ||||
| Items that will not be reclassified subsequently to profit or loss | ||||
| Remeasurement of the net defined benefit liability / asset | (2) | 16 | (17) | (42) |
| Equity instruments through other comprehensive income, net | – | (5) | – | (5) |
| Items that will be reclassified subsequently to profit or loss | ||||
| Fair value changes on derivatives designated as cash flow hedges, net | (66) | 11 | – | 39 |
| Fair value changes on investments, net | 25 | (10) | – | (10) |
| Total other comprehensive income, net of tax | (43) | 12 | (17) | (18) |
| Total comprehensive income, for the period | 3,372 | 3,574 | 3,163 | 13,800 |
| Paid-up share capital (par value 5/- each fully paid) |
1,148 | 1,148 | 1,148 | 1,148 |
| Other Equity | 66,869 | 66,869 | 59,934 | 66,869 |
| Earnings per equity share ( par value 5 /- each) |
||||
| Basic () |
14.87 | 15.51 | 13.85 | 60.16 |
| Diluted () |
14.86 | 15.51 | 13.85 | 60.15 |
Notes:
| 1. | The audited interim condensed financial statements for the quarter ended June 30, 2017 have been taken on record by the Board of Directors at its meeting held on July 14, 2017. The statutory auditors have expressed an unqualified audit opinion. The information presented above is extracted from the audited interim condensed financial statements. The interim condensed financial statements are prepared in accordance with the Indian Accounting Standards (Ind-AS) as prescribed under Section 133 of the Companies Act, 2013 read with Rule 3 of the Companies (Indian Accounting Standards) Rules, 2015 and Companies (Indian Accounting Standards) Amendment Rules, 2016. |
| 2. | Changes to the Board |
| The Board appointed D. Sundaram as an Independent Director of the Company effective July 14, 2017 based on the recommendations of the Nomination and Remuneration Committee of the Board. |
| 3. | Management Change |
| (1) | The Company has appointed Inderpreet Sawhney as Group General Counsel and Chief Compliance Officer effective July 3, 2017. The Board in their meeting held on July 14, 2017 resolved to include Inderpreet Sawhney as key managerial personnel (KMP) as defined under Ind AS-24 - Related Party Disclosures and designate her as an Executive Officer of the Company for purposes of reporting under the rules of the Securities Exchange Commission effective from the date of the meeting |
| The Board of Directors in their meeting held on July 14, 2017, on recommendation of Nomination and Remuneration Committee, have approved the annual compensation of Inderpreet Sawhney. The cash compensation is $ 0.90 million comprising of a fixed component of $ 0.55 million, variable compensation of upto $ 0.35 million and annual performance based stock grants. Accordingly, the Nomination and Remuneration committee approved the grant of 19,450 RSUs and 44,450 stock options with effect from August 1, 2017 under the 2015 Stock Incentive Compensation Plan (2015 Plan). These RSUs and stock options shall vest over a period of 4 years from the date of grant and shall be exercisable within the period as approved by the committee. The exercise price of the RSUs will be equal to the par value of shares and the exercise price of the stock options would be the market price as on the date of grant. |
| Additionally, the Board of Directors in their meeting held on July 14, 2017, on recommendation of Nomination and Remuneration Committee approved a one time joining bonus of $25,000 and a one-time grant of 38,700 RSUs to be granted with effect from August 1, 2017 based on the approval of the Nomination and remuneration committee at its meeting held on July 13, 2017. These RSUs will vest over a period of 2 years from the date of grant in the ratio of 60:40 and the exercise price will be equal to the par value of the shares. |
| (2) | Gopi Krishnan Radhakrishnan, Acting General Counsel, resigned from the company effective June 24, 2017. The Board placed on record its appreciation for the services rendered by him during his tenure. |
| (3) | Sandeep Dadlani, President, resigned from the company effective July 14, 2017. The Board placed on record its appreciation for the services rendered by him during his tenure. |
| 4. | The company has asked, for business reasons, M.D Ranganath, the CFO to operate from the US. Accordingly, the Board of Directors in their meeting held on July 14, 2017, on recommendation of Nomination and Remuneration Committee, have approved a revision to his salary comprising of fixed pay of $ 0.69 million and a variable compensation of upto $0.56 million effective July 1, 2017. In addition, in line with the executive compensation policy, he would be eligible for stock incentives as may be decided by Nomination and Remuneration committee from time to time based on performance. |
| 5. | On July 14, 2017, the Board of Directors of Infosys authorized the Company to execute a Business Transfer Agreement and related documents with Noah Consulting LLC, a wholly owned subsidiary, to transfer the business of Noah Consulting LLC to Infosys Limited, subject to securing the requisite regulatory approvals for a consideration based on an independent valuation. The transfer of assets and liabilities between entities under common control will be accounted for at carrying values and will not have any impact on the consolidated financial statements. |
| 6. | Information on dividends for the quarter ended June 30, 2017 |
(in )
| Particulars | Quarter Ended June 30, |
Quarter Ended March 31, |
Quarter Ended June 30, |
Year Ended March 31, |
| 2017 | 2017 | 2016 | 2017 | |
| Dividend per share (par value 5/- each) |
||||
| Interim dividend | – | – | – | 11.00 |
| Final dividend | – | 14.75 | – | 14.75 |
| 7. | Segment reporting (Standalone-Audited) |
(in crore)
| Particulars | Quarter ended June 30, |
Quarter ended March 31, |
Quarter ended June 30, |
Year ended March 31, |
| 2017 | 2017 | 2016 | 2017 | |
| Revenue by business segment | ||||
| Financial services (FS) | 3,897 | 3,924 | 3,873 | 15,735 |
| Manufacturing (MFG) | 1,556 | 1,566 | 1,472 | 6,086 |
| Energy & utilities, communication and services (ECS) | 3,654 | 3,630 | 3,341 | 13,999 |
| Retail, consumer packaged goods and logistics (RCL) | 2,501 | 2,503 | 2,583 | 10,280 |
| Life sciences, healthcare and insurance (HILIFE) | 1,862 | 1,860 | 1,627 | 7,065 |
| Hi-Tech | 1,155 | 1,157 | 1,270 | 4,901 |
| All Other Segments | 346 | 280 | 254 | 1,223 |
| Total | 14,971 | 14,920 | 14,420 | 59,289 |
| Less: Inter-segment revenue | – | – | – | – |
| Net revenue from operations | 14,971 | 14,920 | 14,420 | 59,289 |
| Segment profit before tax and depreciation: | ||||
| Financial Services (FS) | 1,070 | 1,115 | 1,026 | 4,291 |
| Manufacturing (MFG) | 414 | 458 | 410 | 1,770 |
| Energy & utilities, communication and services (ECS) | 1,101 | 1,126 | 1,022 | 4,355 |
| Retail, consumer packaged goods and logistics (RCL) | 768 | 757 | 771 | 3,159 |
| Life sciences, healthcare and insurance (HILIFE) | 569 | 573 | 451 | 2,089 |
| Hi-Tech | 296 | 308 | 341 | 1,354 |
| All other segments | 119 | 52 | – | 199 |
| Total | 4,337 | 4,389 | 4,021 | 17,217 |
| Less:Other unallocable expenditure | 344 | 339 | 322 | 1,341 |
| Add:Unallocable other income | 723 | 733 | 761 | 3,062 |
| Profit before tax | 4,716 | 4,783 | 4,460 | 18,938 |
Notes on segment information:
Business segments
Based on the "management approach" as defined in Ind-AS 108 - Operating Segments, the Chief Operating Decision Marker evaluates the Company's performance and allocates resources based on an analysis of various performance indicators by business segments. Accordingly, information has been presented along these business segments. The accounting principles used in the preparation of the financial statements are consistently applied to record revenue and expenditure in individual segments
Segmental capital employed
Assets and liabilities used in the company's business are not identified to any of the reportable segments, as these are used interchangeably between segments. The Management believes that it is not practicable to provide segment disclosures relating to total assets and liabilities since a meaningful segregation of the available data is onerous.
| By order of the Board | |
| for Infosys Limited | |
| Bengaluru, India | Dr. Vishal Sikka |
| July 14, 2017 | Chief Executive Officer and Managing Director |
Certain statements in these results concerning our future growth prospects are forward-looking statements regarding our future business expectations intended to qualify for the 'safe harbor' under the Private Securities Litigation Reform Act of 1995, which involve a number of risks and uncertainties that could cause actual results to differ materially from those in such forward-looking statements. The risks and uncertainties relating to these statements include, but are not limited to, risks and uncertainties regarding fluctuations in earnings, fluctuations in foreign exchange rates, our ability to manage growth, intense competition in IT services including those factors which may affect our cost advantage, wage increases in India, our ability to attract and retain highly skilled professionals, time and cost overruns on fixed-price, fixed-time-frame contracts, client concentration, restrictions on immigration, industry segment concentration, our ability to manage our international operations, reduced demand for technology in our key focus areas, disruptions in telecommunication networks or system failures, our ability to successfully complete and integrate potential acquisitions, liability for damages on our service contracts, the success of the companies in which Infosys has made strategic investments, withdrawal or expiration of governmental fiscal incentives, political instability and regional conflicts, an inability to accurately predict economic or industry trends, legal restrictions on raising capital or acquiring companies outside India, and unauthorized use of our intellectual property and general economic conditions affecting our industry. Additional risks that could affect our future operating results are more fully described in our United States Securities and Exchange Commission filings including our Annual Report on Form 20-F for the fiscal year ended March 31, 2017. These filings are available at www.sec.gov. Infosys may, from time to time, make additional written and oral forward-looking statements, including statements contained in the Company's filings with the Securities and Exchange Commission and our reports to shareholders. In addition, please note that the date of these results is July 14, 2017, and any forward-looking statements contained herein are based on assumptions that we believe to be reasonable as of this date. The Company does not undertake to update any forward-looking statements that may be made from time to time by or on behalf of the Company unless it is required by law.
Exhibit 99.9
IFRS USD Earning Release
Infosys Limited and Subsidiaries
Unaudited Condensed Consolidated Balance Sheets as of
(Dollars in millions except equity share data)
| Note | June 30, 2017 | March 31, 2017 | |
| ASSETS | |||
| Current assets | |||
| Cash and cash equivalents | 2.1 | 3,579 | 3,489 |
| Current investments | 2.2 | 1,609 | 1,538 |
| Trade receivables | 1,934 | 1,900 | |
| Unbilled revenue | 611 | 562 | |
| Prepayments and other current assets | 2.4 | 822 | 749 |
| Derivative financial instruments | 2.3 | 4 | 44 |
| Total current assets | 8,559 | 8,282 | |
| Non-current assets | |||
| Property, plant and equipment | 2.7 | 1,834 | 1,807 |
| Goodwill | 2.8 | 573 | 563 |
| Intangible assets | 113 | 120 | |
| Investment in associate | 2.13 | – | 11 |
| Non-current investments | 2.2 | 937 | 984 |
| Deferred income tax assets | 104 | 83 | |
| Income tax assets | 941 | 881 | |
| Other non-current assets | 2.4 | 117 | 123 |
| Total Non-current assets | 4,619 | 4,572 | |
| Total assets | 13,178 | 12,854 | |
| LIABILITIES AND EQUITY | |||
| Current liabilities | |||
| Trade payables | 40 | 57 | |
| Derivative financial instruments | 2.3 | 7 | – |
| Current income tax liabilities | 703 | 599 | |
| Client deposits | 2 | 5 | |
| Unearned revenue | 309 | 274 | |
| Employee benefit obligations | 220 | 209 | |
| Provisions | 2.6 | 63 | 63 |
| Other current liabilities | 2.5 | 1,178 | 954 |
| Total current liabilities | 2,522 | 2,161 | |
| Non-current liabilities | |||
| Deferred income tax liabilities | 29 | 32 | |
| Other non-current liabilities | 2.5 | 18 | 24 |
| Total liabilities | 2,569 | 2,217 | |
| Equity | |||
| Share capital - 5/- ($0.16) par value 2,400,000,000 (2,400,000,000) equity shares authorized, issued and outstanding 2,285,679,962 (2,285,655,150), net of 11,264,702 (11,289,514) treasury shares, as of June 30, 2017 (March 31, 2017), respectively |
199 | 199 | |
| Share premium | 594 | 587 | |
| Retained earnings | 12,050 | 12,190 | |
| Cash flow hedge reserve | (4) | 6 | |
| Other reserves | 51 | – | |
| Other components of equity | (2,281) | (2,345) | |
| Total equity attributable to equity holders of the Company | 10,609 | 10,637 | |
| Non-controlling interests | – | – | |
| Total equity | 10,609 | 10,637 | |
| Total liabilities and equity | 13,178 | 12,854 |
The accompanying notes form an integral part of the unaudited interim consolidated financial statements
for and on behalf of the Board of Directors of Infosys Limited
| R. Seshasayee Chairman |
Ravi Venkatesan Co- Chairman |
Dr. Vishal Sikka Chief Executive Officer and Managing Director |
U. B. Pravin Rao Chief Operating Officer and Whole-time Director |
| Bengaluru July 14, 2017 |
Roopa Kudva Director |
M. D. Ranganath Chief Financial Officer |
A. G. S. Manikantha Company Secretary |
Infosys Limited and Subsidiaries
Unaudited Condensed Consolidated Statement of Comprehensive Income
(Dollars in millions except equity share and per equity share data)
| Note | Three months ended June 30, | ||
| 2017 | 2016 | ||
| Revenues | 2,651 | 2,501 | |
| Cost of sales | 2.15 | 1,692 | 1,592 |
| Gross profit | 959 | 909 | |
| Operating expenses: | |||
| Selling and marketing expenses | 2.15 | 138 | 137 |
| Administrative expenses | 2.15 | 183 | 170 |
| Total operating expenses | 321 | 307 | |
| Operating profit | 638 | 602 | |
| Other income, net | 127 | 112 | |
| Share in associate's profit/ (loss) | – | – | |
| Write down of investment in associate | 2.13 | (11) | – |
| Profit before income taxes | 754 | 714 | |
| Income tax expense | 2.11 | 213 | 203 |
| Net profit | 541 | 511 | |
| Other comprehensive income | |||
| Items that will not be reclassified subsequently to profit or loss: | |||
| Re-measurements of the net defined benefit liability/asset | – | (2) | |
| Cumulative impact on reversal of unrealised gain on quoted debt securities on adoption of IFRS 9 | – | (5) | |
| Equity instruments through other comprehensive income, net | – | – | |
| – | (7) | ||
| Items that will be reclassified subsequently to profit or loss: | |||
| Fair value changes on investments, net | 2.2 | 4 | – |
| Fair value changes on derivatives designated as cash flow hedge, net | (10) | – | |
| Foreign currency translation | 60 | (173) | |
| 54 | (173) | ||
| Total other comprehensive income, net of tax | 54 | (180) | |
| Total comprehensive income | 595 | 331 | |
| Profit attributable to: | |||
| Owners of the Company | 541 | 511 | |
| Non-controlling interests | – | – | |
| 541 | 511 | ||
| Total comprehensive income | |||
| Owners of the Company | 595 | 331 | |
| Non-controlling interests | – | – | |
| 595 | 331 | ||
| Earnings per equity share | |||
| Basic ($) | 0.24 | 0.22 | |
| Diluted ($) | 0.24 | 0.22 | |
| Weighted average equity shares used in computing earnings per equity share | 2.12 | ||
| Basic | 2,285,657,604 | 2,285,622,329 | |
| Diluted | 2,287,058,148 | 2,285,768,122 | |
The accompanying notes form an integral part of the unaudited interim consolidated financial statements
for and on behalf of the Board of Directors of Infosys Limited
| R. Seshasayee Chairman |
Ravi Venkatesan Co- Chairman |
Dr. Vishal Sikka Chief Executive Officer and Managing Director |
U. B. Pravin Rao Chief Operating Officer and Whole-time Director |
| Bengaluru July 14, 2017 |
Roopa Kudva Director |
M. D. Ranganath Chief Financial Officer |
A. G. S. Manikantha Company Secretary |
Unaudited Condensed Consolidated Statement of Changes in Equity
(Dollars in millions except equity share data)
| Shares(1) | Share capital | Share premium | Retained earnings | Other reserves(2) | Cash flow hedge reserve | Other components of equity | Total equity attributable to equity holders of the Company | |
| Balance as of April 1, 2016 | 2,285,621,088 | 199 | 570 | 11,083 | – | – | (2,528) | 9,324 |
| Changes in equity for the three months ended June 30, 2016 | ||||||||
| Cumulative impact of reversal of unrealized gain on quoted debt securities on adoption of IFRS 9 (3) | – | – | – | – | – | – | (5) | (5) |
| Shares issued on exercise of employee stock options (Refer note 2.10) | 12,406 | – | – | – | – | – | – | – |
| Transfer to other reserves | – | – | – | (41) | 41 | – | – | – |
| Transfer from other reserves on utilization | – | – | – | 41 | (41) | – | – | – |
| Employee stock compensation expense (Refer note 2.10) | – | – | 1 | – | – | – | – | 1 |
| Remeasurement of the net defined benefit liability/asset, net of tax effect | – | – | – | – | – | – | (2) | (2) |
| Dividends (including corporate dividend tax) | – | – | – | (580) | – | – | – | (580) |
| Net profit | – | – | – | 511 | – | – | – | 511 |
| Foreign currency translation | – | – | – | – | – | – | (173) | (173) |
| Balance as of June 30, 2016 | 2,285,633,494 | 199 | 571 | 11,014 | – | – | (2,708) | 9,076 |
| Balance as of April 1, 2017 | 2,285,655,150 | 199 | 587 | 12,190 | – | 6 | (2,345) | 10,637 |
| Changes in equity for the three months ended June 30, 2017 | ||||||||
| Shares issued on exercise of employee stock options (Refer note 2.10) | 24,812 | – | – | – | – | – | – | – |
| Transfer to other reserves | – | – | – | (75) | 75 | – | – | – |
| Transfer from other reserves on utilization | – | – | – | 24 | (24) | – | – | – |
| Employee stock compensation expense (Refer note 2.10) | – | – | 7 | – | – | – | – | 7 |
| Fair value changes on derivatives designated as cash flow hedge, net of taxes (Refer note 2.3) | – | – | – | – | – | (10) | – | (10) |
| Equity instruments through other comprehensive income, net of taxes (Refer note 2.2) | – | – | – | – | – | – | – | – |
| Fair value changes on investments, net of taxes (Refer note 2.2) | – | – | – | – | – | – | 4 | 4 |
| Remeasurement of the net defined benefit liability/asset, net of tax effect | – | – | – | – | – | – | – | – |
| Dividends (including corporate dividend tax) | – | – | – | (630) | – | – | – | (630) |
| Net profit | – | – | – | 541 | – | – | – | 541 |
| Foreign currency translation | – | – | – | – | – | – | 60 | 60 |
| Balance as of June 30, 2017 | 2,285,679,962 | 199 | 594 | 12,050 | 51 | (4) | (2,281) | 10,609 |
| (1) | excludes treasury shares of 11,264,702 as of June 30, 2017, 11,289,514 as of April 1, 2017, 11,311,170 as of June 30, 2016 and 11,323,576 as of April 1, 2016, held by consolidated trust |
| (2) |
Represents the Special Economic Zone Re-investment reserve created out of the profit of the eligible SEZ unit in terms of the provisions of Sec 10AA(1)(ii) of Income Tax Act,1961. The reserve should be utilized by the Company for acquiring new plant and machinery for the purpose of its business in terms of the provisions of the Sec 10AA(2) of the Income Tax Act, 1961. |
| (3) |
Represents cumulative impact on account of adoption of IFRS 9, recorded in other comprehensive income during the year ended March 31, 2017. The adoption of IFRS 9 did not have a material impact on the financial statements. |
The accompanying notes form an integral part of the unaudited interim consolidated financial statements
for and on behalf of the Board of Directors of Infosys Limited
| R. Seshasayee Chairman |
Ravi Venkatesan Co- Chairman |
Dr. Vishal Sikka Chief Executive Officer and Managing Director |
U. B. Pravin Rao Chief Operating Officer and Whole-time Director |
| Bengaluru July 14, 2017 |
Roopa Kudva Director |
M. D. Ranganath Chief Financial Officer |
A. G. S. Manikantha Company Secretary |
Unaudited Condensed Consolidated Statement of Cash Flows
(Dollars in millions)
| Note | Three months ended June 30, | ||
| 2017 | 2016 | ||
| Operating activities: | |||
| Net Profit | 541 | 511 | |
| Adjustments to reconcile net profit to net cash provided by operating activities : | |||
| Depreciation and amortisation | 2.15 | 70 | 60 |
| Income on investments | (37) | (8) | |
| Income tax expense | 2.11 | 213 | 203 |
| Effect of exchange rate changes on assets and liabilities | (1) | 3 | |
| Impairment loss on financial assets | (1) | 2 | |
| Other adjustments | 10 | 10 | |
| Changes in Working Capital | |||
| Trade receivables and unbilled revenue | (72) | (122) | |
| Prepayments and other assets | (25) | (127) | |
| Trade payables | (17) | (18) | |
| Client deposits | (3) | – | |
| Unearned revenue | 35 | 31 | |
| Other liabilities and provisions | 118 | 18 | |
| Cash generated from operations | 831 | 563 | |
| Income taxes paid | (187) | (111) | |
| Net cash provided by operating activities | 644 | 452 | |
| Investing activities: | |||
| Expenditure on property, plant and equipment, net of sale proceeds, including changes in retention money and capital creditors | (86) | (128) | |
| Loans to employees | 3 | 3 | |
| Deposits placed with corporation | (1) | (9) | |
| Income on investments | 13 | 4 | |
| Payment of contingent consideration pertaining to acquisition of business | 2.9 | (5) | (5) |
| Investment in equity and preference securities | (2) | (4) | |
| Investment in others | (1) | – | |
| Investment in quoted debt securities | – | (1) | |
| Redemption of quoted debt securities | 1 | 1 | |
| Investment in certificate of deposits | (44) | – | |
| Redemption of certificate of deposits | 23 | – | |
| Investment in liquid mutual fund units and fixed maturity plan securities | (2,557) | (1,587) | |
| Redemption of liquid mutual fund units and fixed maturity plan securities | 2,604 | 1,515 | |
| Net cash used in investing activities | (52) | (211) | |
| Financing activities: | |||
| Payment of dividend | (522) | (481) | |
| Net cash used in financing activities | (522) | (481) | |
| Effect of exchange rate changes on cash and cash equivalents | 20 | (97) | |
| Net increase/(decrease) in cash and cash equivalents | 70 | (240) | |
| Cash and cash equivalents at the beginning of the period | 2.1 | 3,489 | 4,935 |
| Cash and cash equivalents at the end of the period | 2.1 | 3,579 | 4,598 |
| Supplementary information: | |||
| Restricted cash balance | 2.1 | 93 | 76 |
The accompanying notes form an integral part of the unaudited interim consolidated financial statements
for and on behalf of the Board of Directors of Infosys Limited
| R. Seshasayee Chairman |
Ravi Venkatesan Co- Chairman |
Dr. Vishal Sikka Chief Executive Officer and Managing Director |
U. B. Pravin Rao Chief Operating Officer and Whole-time Director |
| Bengaluru July 14, 2017 |
Roopa Kudva Director |
M. D. Ranganath Chief Financial Officer |
A. G. S. Manikantha Company Secretary |
Notes to the Unaudited Condensed Consolidated Interim Financial Statements
1. Company Overview and Significant Accounting Policies
1.1 Company overview
Infosys is a leading provider in consulting,
technology, outsourcing and next-generation services and software. Along with its subsidiaries, Infosys provides Business IT services
(comprising application development and maintenance, independent validation, infrastructure management, engineering services comprising
product engineering and life cycle solutions and business process management); Consulting and systems integration services (comprising
consulting, enterprise solutions, systems integration and advanced technologies); Products, business platforms and solutions to
accelerate intellectual property-led innovation. Its new offerings span areas like digital, big data and analytics, cloud, data
and mainframe modernization, cyber security, IoT engineering Services and API & micro services.
Infosys together with its subsidiaries and controlled trusts is herein after referred to as the "Group".
The Company is a public limited Company incorporated and domiciled in India and has its registered office at Bengaluru, Karnataka, India. The Company has its primary listings on the BSE Ltd. and National Stock Exchange of India Limited. The Company’s American Depositary Shares representing equity shares are also listed on the New York Stock Exchange (NYSE), Euronext London and Euronext Paris.
The Group's unaudited condensed consolidated interim financial statements are authorized for issue by the company's Board of Directors on July 14, 2017.
1.2 Basis of preparation of financial statements
These condensed consolidated interim financial statements have been prepared in accordance with IAS 34, Interim Financial Reporting, as issued by the International Accounting Standards Board (IASB), under the historical cost convention on the accrual basis except for certain financial instruments which have been measured at fair values. Accordingly, these condensed consolidated interim financial statements do not include all the information required for a complete set of financial statements. These condensed consolidated interim financial statements should be read in conjunction with the consolidated financial statements and related notes included in the company’s Annual Report on Form 20-F for the year ended March 31, 2017. Accounting policies have been applied consistently to all periods presented in these unaudited condensed consolidated interim financial statements.
1.3 Basis of consolidation
Infosys consolidates entities which it owns or controls. The consolidated interim financial statements comprise the financial statements of the company, its controlled trusts, its subsidiaries and associate. Control exists when the parent has power over the entity, is exposed, or has rights, to variable returns from its involvement with the entity and has the ability to affect those returns by using its power over the entity. Power is demonstrated through existing rights that give the ability to direct relevant activities, those which significantly affect the entity's returns. Subsidiaries are consolidated from the date control commences until the date control ceases.
The financial statements of the Group companies are consolidated on a line-by-line basis and intra-group balances and transactions including unrealized gain / loss from such transactions are eliminated upon consolidation. These financial statements are prepared by applying uniform accounting policies in use at the Group. Non-controlling interests which represent part of the net profit or loss and net assets of subsidiaries that are not, directly or indirectly, owned or controlled by the company, are excluded.
Associates are entities over which the group has significant influence but not control. Investments in associates are accounted for using the equity method of accounting. The investment is initially recognized at cost, and the carrying amount is increased or decreased to recognize the investor’s share of the profit or loss of the investee after the acquisition date. The group’s investment in associates includes goodwill identified on acquisition.
1.4 Use of estimates
The preparation of the financial statements in conformity with IFRS requires management to make estimates, judgments and assumptions. These estimates, judgments and assumptions affect the application of accounting policies and the reported amounts of assets and liabilities, the disclosures of contingent assets and liabilities at the date of the financial statements and reported amounts of revenues and expenses during the period. Application of accounting policies that require critical accounting estimates involving complex and subjective judgments and the use of assumptions in these financial statements have been disclosed in Note 1.5. Accounting estimates could change from period to period. Actual results could differ from those estimates. Appropriate changes in estimates are made as management becomes aware of changes in circumstances surrounding the estimates. Changes in estimates are reflected in the financial statements in the period in which changes are made and, if material, their effects are disclosed in the notes to the condensed consolidated interim financial statements.
1.5 Critical accounting estimates
a. Revenue recognition
The group uses the percentage-of-completion method in accounting for its fixed-price contracts. Use of the percentage-of-completion method requires the group to estimate the efforts or costs expended to date as a proportion of the total efforts or costs to be expended. Efforts or costs expended have been used to measure progress towards completion as there is a direct relationship between input and productivity. Provisions for estimated losses, if any, on uncompleted contracts are recorded in the period in which such losses become probable based on the expected contract estimates at the reporting date.
b. Income taxes
The company's two major tax jurisdictions are India and the U.S., though the Company also files tax returns in other overseas jurisdictions. Significant judgments are involved in determining the provision for income taxes, including amount expected to be paid/recovered for uncertain tax positions (also refer to note 2.11).
c. Business combinations and intangible assets
Business combinations are accounted for using IFRS 3 (Revised), Business Combinations. IFRS 3 requires the identifiable intangible assets and contingent consideration to be fair valued in order to ascertain the net fair value of identifiable assets, liabilities and contingent liabilities of the acquiree. Significant estimates are required to be made in determining the value of contingent consideration and intangible assets. These valuations are conducted by independent valuation experts.
d. Property, plant and equipment
Property, plant and equipment represent a significant proportion of the asset base of the Group. The charge in respect of periodic depreciation is derived after determining an estimate of an asset’s expected useful life and the expected residual value at the end of its life. The useful lives and residual values of the Group's assets are determined by management at the time the asset is acquired and reviewed periodically, including at each financial year end. The lives are based on historical experience with similar assets as well as anticipation of future events, which may impact their life, such as changes in technology.
e. Impairment of Goodwill
Goodwill is tested for impairment on an annual basis and whenever there is an indication that the recoverable amount of a cash generating unit is less than its carrying amount based on a number of factors including operating results, business plans, future cash flows and economic conditions. The recoverable amount of cash generating units is determined based on higher of value-in-use and fair value less cost to sell. The goodwill impairment test is performed at the level of the cash-generating unit or groups of cash-generating units which are benefitting from the synergies of the acquisition and which represents the lowest level at which goodwill is monitored for internal management purposes.
Market related information and estimates are used to determine the recoverable amount. Key assumptions on which management has based its determination of recoverable amount include estimated long term growth rates, weighted average cost of capital and estimated operating margins. Cash flow projections take into account past experience and represent management’s best estimate about future developments.
1.6 Revenue recognition
The company derives revenues primarily from software development and related services and from the licensing of software products. Arrangements with customers for software related services are mainly either on a fixed-price, fixed-timeframe or on a time-and-material basis.
Revenue on time-and-material contracts are recognized as the related services are performed and revenue from the end of the last billing to the balance sheet date is recognized as unbilled revenues. Revenue from fixed-price, fixed-timeframe contracts, where there is no uncertainty as to measurement or collectability of consideration, is recognized as per the percentage-of-completion method. When there is uncertainty as to measurement or ultimate collectability, revenue recognition is postponed until such uncertainty is resolved. Efforts or costs expended have been used to measure progress towards completion as there is a direct relationship between input and productivity. Provisions for estimated losses, if any, on uncompleted contracts are recorded in the period in which such losses become probable based on the current contract estimates. Costs and earnings in excess of billings are classified as unbilled revenue while billings in excess of costs and earnings are classified as unearned revenue. Deferred contract costs are amortized over the term of the contract. Maintenance revenue is recognized ratably over the term of the underlying maintenance arrangement.
In arrangements for software development and related services and maintenance services, the Company has applied the guidance in IAS 18, Revenue, by applying the revenue recognition criteria for each separately identifiable component of a single transaction. The arrangements generally meet the criteria for considering software development and related services as separately identifiable components. For allocating the consideration, the company has measured the revenue in respect of each separable component of a transaction at its fair value, in accordance with principles given in IAS 18. The price that is regularly charged for an item when sold separately is the best evidence of its fair value. In cases where the company is unable to establish objective and reliable evidence of fair value for the software development and related services, the company has used a residual method to allocate the arrangement consideration. In these cases the balance of the consideration, after allocating the fair values of undelivered components of a transaction has been allocated to the delivered components for which specific fair values do not exist.
License fee revenues are recognized when the general revenue recognition criteria given in IAS 18 are met. Arrangements to deliver software products generally have three elements: license, implementation and Annual Technical Services (ATS). The company has applied the principles given in IAS 18 to account for revenues from these multiple element arrangements. Objective and reliable evidence of fair value has been established for ATS. Objective and reliable evidence of fair value is the price charged when the element is sold separately. When other services are provided in conjunction with the licensing arrangement and objective and reliable evidence of their fair values have been established, the revenue from such contracts are allocated to each component of the contract in a manner, whereby revenue is deferred for the undelivered services and the residual amounts are recognized as revenue for delivered elements. In the absence of objective and reliable evidence of fair value for implementation, the entire arrangement fee for license and implementation is recognized using the percentage-of-completion method as the implementation is performed. Revenue from client training, support and other services arising due to the sale of software products is recognized as the services are performed. ATS revenue is recognized rateably over the period in which the services are rendered.
Advances received for services and products are reported as client deposits until all conditions for revenue recognition are met.
The company accounts for volume discounts and pricing incentives to customers as a reduction of revenue based on the ratable allocation of the discounts/ incentives amount to each of the underlying revenue transaction that results in progress by the customer towards earning the discount/ incentive. Also, when the level of discount varies with increases in levels of revenue transactions, the company recognizes the liability based on its estimate of the customer's future purchases. If it is probable that the criteria for the discount will not be met, or if the amount thereof cannot be estimated reliably, then discount is not recognized until the payment is probable and the amount can be estimated reliably. The Company recognizes changes in the estimated amount of obligations for discounts in the period in which the change occurs. The discounts are passed on to the customer either as direct payments or as a reduction of payments due from the customer.
The company presents revenues net of value-added taxes in its statement of comprehensive income.
1.7 Property, plant and equipment
Property, plant and equipment are stated at cost, less accumulated depreciation and impairment, if any. Costs directly attributable to acquisition are capitalized until the property, plant and equipment are ready for use, as intended by management. The group depreciates property, plant and equipment over their estimated useful lives using the straight-line method. The estimated useful lives of assets are as follows:
| Building | 22-25 years |
| Plant and machinery | 5 years |
| Computer equipment | 3-5 years |
| Furniture and fixtures | 5 years |
| Vehicles | 5 years |
Depreciation methods, useful lives and residual values are reviewed periodically, including at each financial year end. (Refer note 2.7)
Advances paid towards the acquisition of property, plant and equipment outstanding at each balance sheet date and the cost of assets not put to use before such date are disclosed under ‘Capital work-in-progress’. Subsequent expenditures relating to property, plant and equipment is capitalized only when it is probable that future economic benefits associated with these will flow to the Group and the cost of the item can be measured reliably. Repairs and maintenance costs are recognized in net profit in the statement of comprehensive income when incurred. The cost and related accumulated depreciation are eliminated from the financial statements upon sale or retirement of the asset and the resultant gains or losses are recognized in net profit in the statement of comprehensive income. Assets to be disposed of are reported at the lower of the carrying value or the fair value less cost to sell.
1.8 Business combinations
Business combinations have been accounted for using the acquisition method under the provisions of IFRS 3 (Revised), Business Combinations.
The cost of an acquisition is measured at the fair value of the assets transferred, equity instruments issued and liabilities incurred or assumed at the date of acquisition, which is the date on which control is transferred to the Group. The cost of acquisition also includes the fair value of any contingent consideration. Identifiable assets acquired and liabilities and contingent liabilities assumed in a business combination are measured initially at their fair value on the date of acquisition.
Business combinations between entities under common control is outside the scope of IFRS 3 (Revised), Business Combinations and is accounted for at carrying value.
Transaction costs that the Group incurs in connection with a business combination such as finders’ fees, legal fees, due diligence fees, and other professional and consulting fees are expensed as incurred.
1.9 Financial instruments
Effective April 1, 2016, the group has elected
to early adopt IFRS 9 - Financial Instruments considering April 1, 2015 as the date of initial application of the standard even
though the stipulated effective date for adoption is April 1, 2018.
As per IFRS 9, the group has classified its financial assets into the following categories based on the business model for managing
those assets and the contractual cash flow characteristics:
- Financial assets carried at amortised cost
- Financial assets fair valued through other comprehensive income
- Financial assets fair valued through profit and loss
The adoption of IFRS 9 did not have any other material impact on the consolidated financial statements.
1.9.1 Initial recognition
The group recognizes financial assets and financial liabilities when it becomes a party to the contractual provisions of the instrument. All financial assets and liabilities are recognized at fair value on initial recognition, except for trade receivables which are initially measured at transaction price. Transaction costs that are directly attributable to the acquisition or issue of financial assets and financial liabilities, that are not at fair value through profit or loss, are added to the fair value on initial recognition. Regular way purchase and sale of financial assets are accounted for at trade date.
1.9.2 Subsequent measurement
a. Non-derivative financial instruments
(i) Financial assets carried at amortised cost
A financial asset is subsequently measured at amortised cost if it is held within a business model whose objective is to hold the asset in order to collect contractual cash flows and the contractual terms of the financial asset give rise on specified dates to cash flows that are solely payments of principal and interest on the principal amount outstanding.
(ii) Financial assets at fair value through other comprehensive income
A financial asset is subsequently measured at fair value through other comprehensive income if it is held within a business model whose objective is achieved by both collecting contractual cash flows and selling financial assets and the contractual terms of the financial asset give rise on specified dates to cash flows that are solely payments of principal and interest on the principal amount outstanding. Further, in cases where the Group has made an irrevocable election based on its business model, for its investments which are classified as equity instruments, the subsequent changes in fair value are recognized in other comprehensive income.
(iii) Financial assets at fair value through profit or loss
A financial asset which is not classified in any of the above categories is subsequently fair valued through profit or loss.
(iv) Financial liabilities
Financial liabilities are subsequently carried at amortized cost using the effective interest method, except for contingent consideration recognized in a business combination which is subsequently measured at fair value through profit and loss. For trade and other payables maturing within one year from the balance sheet date, the carrying amounts approximate fair value due to the short maturity of these instruments.
b. Derivative financial instruments
The group holds derivative financial instruments such as foreign exchange forward and option contracts to mitigate the risk of changes in exchange rates on foreign currency exposures. The counterparty for these contracts is generally a bank.
(i) Financial assets or financial liabilities, at fair value through profit or loss.
This category has derivative financial assets or liabilities which are not designated as hedges.
Although the group believes that these derivatives constitute hedges from an economic perspective, they may not qualify for hedge accounting under IFRS 9, Financial Instruments. Any derivative that is either not designated a hedge, or is so designated but is ineffective as per IFRS 9, is categorized as a financial asset or financial liability, at fair value through profit or loss.
Derivatives not designated as hedges are recognized initially at fair value and attributable transaction costs are recognized in net profit in the statement of comprehensive income when incurred. Subsequent to initial recognition, these derivatives are measured at fair value through profit or loss and the resulting exchange gains or losses are included in other income. Assets/ liabilities in this category are presented as current assets/current liabilities if they are either held for trading or are expected to be realized within 12 months after the balance sheet date.
(ii) Cash flow hedge
The group designates certain foreign exchange
forward and options contracts as cash flow hedges to mitigate the risk of foreign exchange exposure on highly probable forecast
cash transactions.
When a derivative is designated as a cash flow hedging instrument, the effective portion of changes in the fair value of the derivative
is recognized in other comprehensive income and accumulated in the cash flow hedging reserve. Any ineffective portion of changes
in the fair value of the derivative is recognized immediately in the net profit in the statement of comprehensive income. If the
hedging instrument no longer meets the criteria for hedge accounting, then hedge accounting is discontinued prospectively. If the
hedging instrument expires or is sold, terminated or exercised, the cumulative gain or loss on the hedging instrument recognized
in cash flow hedging reserve till the period the hedge was effective remains in cash flow hedging reserve until the forecasted
transaction occurs. The cumulative gain or loss previously recognized in the cash flow hedging reserve is transferred to the net
profit in the statement of comprehensive income upon the occurrence of the related forecasted transaction. If the forecasted transaction
is no longer expected to occur, then the amount accumulated in cash flow hedging reserve is reclassified to net profit in the statement
of comprehensive income.
c. Share capital and treasury shares
(i) Ordinary Shares
Ordinary shares are classified as equity. Incremental costs directly attributable to the issuance of new ordinary shares and share options are recognized as a deduction from equity, net of any tax effects.
(ii) Treasury Shares
When any entity within the Group purchases the company's ordinary shares, the consideration paid including any directly attributable incremental cost is presented as a deduction from total equity, until they are cancelled, sold or reissued. When treasury shares are sold or reissued subsequently, the amount received is recognized as an increase in equity, and the resulting surplus or deficit on the transaction is transferred to/ from share premium.
1.9.3 Derecognition of financial instruments
The group derecognizes a financial asset when the contractual rights to the cash flows from the financial asset expire or it transfers the financial asset and the transfer qualifies for derecognition under IFRS 9. A financial liability (or a part of a financial liability) is derecognized from the group's balance sheet when the obligation specified in the contract is discharged or cancelled or expires.
1.10 Fair value of financial instruments
In determining the fair value of its financial instruments, the group uses a variety of methods and assumptions that are based on market conditions and risks existing at each reporting date. The methods used to determine fair value include discounted cash flow analysis, available quoted market prices and dealer quotes. All methods of assessing fair value result in general approximation of value, and such value may never actually be realized.
Refer to Note 2.3 for the disclosure on carrying value and fair value of financial assets and liabilities. For financial assets
and liabilities maturing within one year from the balance sheet date and which are not carried at fair value, the carrying amounts
approximate fair value due to the short maturity of these instruments.
1.11 Impairment
a. Financial assets
The Group recognizes loss allowances using the expected credit loss (ECL) model for the financial assets which are not fair valued through profit or loss. Loss allowance for trade receivables with no significant financing component is measured at an amount equal to lifetime ECL. For all other financial assets, expected credit losses are measured at an amount equal to the 12-month ECL, unless there has been a significant increase in credit risk from initial recognition in which case those are measured at lifetime ECL. The amount of expected credit losses (or reversal) that is required to adjust the loss allowance at the reporting date to the amount that is required to be recognized is recognized as an impairment gain or loss in statement of profit or loss.
b. Non-financial assets
(i) Goodwill
Goodwill is tested for impairment on an annual basis and whenever there is an indication that goodwill may be impaired, relying on a number of factors including operating results, business plans and future cash flows. For the purpose of impairment testing, goodwill acquired in a business combination is allocated to the Group's cash generating units (CGU) or groups of CGU’s expected to benefit from the synergies arising from the business combination. A CGU is the smallest identifiable group of assets that generates cash inflows that are largely independent of the cash inflows from other assets or group of assets. Impairment occurs when the carrying amount of a CGU including the goodwill, exceeds the estimated recoverable amount of the CGU. The recoverable amount of a CGU is the higher of its fair value less cost to sell and its value-in-use. Value-in-use is the present value of future cash flows expected to be derived from the CGU.
Total impairment loss of a CGU is allocated first to reduce the carrying amount of goodwill allocated to the CGU and then to the other assets of the CGU pro-rata on the basis of the carrying amount of each asset in the CGU. An impairment loss on goodwill is recognized in net profit in the statement of comprehensive income and is not reversed in the subsequent period.
(ii) Intangible assets and property, plant and equipment
Intangible assets and property, plant and equipment are evaluated for recoverability whenever events or changes in circumstances indicate that their carrying amounts may not be recoverable. For the purpose of impairment testing, the recoverable amount (i.e. the higher of the fair value less cost to sell and the value-in-use) is determined on an individual asset basis unless the asset does not generate cash flows that are largely independent of those from other assets. In such cases, the recoverable amount is determined for the CGU to which the asset belongs.
If such assets are considered to be impaired, the impairment to be recognized in net profit in the statement of comprehensive income is measured by the amount by which the carrying value of the assets exceeds the estimated recoverable amount of the asset. An impairment loss is reversed in net profit in the statement of comprehensive income if there has been a change in the estimates used to determine the recoverable amount. The carrying amount of the asset is increased to its revised recoverable amount, provided that this amount does not exceed the carrying amount that would have been determined (net of any accumulated amortization or depreciation) had no impairment loss been recognized for the asset in prior years.
1.12 Employee benefits
1.12.1 Gratuity
The Group provides for gratuity, a defined benefit retirement plan ('the Gratuity Plan') covering eligible employees of Infosys and its Indian subsidiaries. The Gratuity Plan provides a lump-sum payment to vested employees at retirement, death, incapacitation or termination of employment, of an amount based on the respective employee's salary and the tenure of employment with the Group.
Liabilities with regard to the Gratuity Plan are determined by actuarial valuation, performed by an independent actuary, at each balance sheet date using the projected unit credit method. The Company fully contributes all ascertained liabilities to the Infosys Limited Employees' Gratuity Fund Trust (the Trust). In case of Infosys BPO and EdgeVerve, contributions are made to the Infosys BPO's Employees' Gratuity Fund Trust and EdgeVerve Systems Limited Employees' Gratuity Fund Trust, respectively. Trustees administer contributions made to the Trusts and contributions are invested in a scheme with Life Insurance Corporation of India as permitted by Indian law.
The Group recognizes the net obligation of a defined benefit plan in its balance sheet as an asset or liability. Gains and losses through re-measurements of the net defined benefit liability / asset are recognized in other comprehensive income and not reclassified to profit and loss in subsequent period. The actual return of the portfolio of plan assets, in excess of the yields computed by applying the discount rate used to measure the defined benefit obligation is recognized in other comprehensive income. The effect of any plan amendments are recognized in net profits in the statement of comprehensive income.
1.12.2 Superannuation
Certain employees of Infosys, Infosys BPO and EdgeVerve are participants in a defined contribution plan. The Group has no further obligations to the Plan beyond its monthly contributions which are periodically contributed to a trust fund, the corpus of which is invested with the Life Insurance Corporation of India.
1.12.3 Provident fund
Eligible employees of Infosys receive benefits from a provident fund, which is a defined benefit plan. Both the eligible employee and the company make monthly contributions to the provident fund plan equal to a specified percentage of the covered employee's salary. The company contributes a portion of the contributions to the Infosys Limited Employees' Provident Fund Trust. The trust invests in specific designated instruments as permitted by Indian law. The remaining portion is contributed to the government administered pension fund. The rate at which the annual interest is payable to the beneficiaries by the trust is being administered by the government. The company has an obligation to make good the shortfall, if any, between the return from the investments of the Trust and the notified interest rate.
In respect of Indian subsidiaries, eligible employees receive benefits from a provident fund, which is a defined contribution plan. Both the eligible employee and the respective companies make monthly contributions to this provident fund plan equal to a specified percentage of the covered employee's salary. Amounts collected under the provident fund plan are deposited in a government administered provident fund. The companies have no further obligation to the plan beyond their monthly contributions.
1.12.4 Compensated absences
The Group has a policy on compensated absences which are both accumulating and non-accumulating in nature. The expected cost of accumulating compensated absences is determined by actuarial valuation performed by an independent actuary at each balance sheet date using projected unit credit method on the additional amount expected to be paid/availed as a result of the unused entitlement that has accumulated at the balance sheet date. Expense on non-accumulating compensated absences is recognized in the period in which the absences occur.
1.13 Share - based compensation
The Group recognizes compensation expense relating to share-based payments in net profit using a fair-value in accordance with IFRS 2, Share-Based Payment. The estimated fair value of awards is charged to income on a straight-line basis over the requisite service period for each separately vesting portion of the award as if the award was in-substance, multiple awards with a corresponding increase to share premium.
Amendment to IFRS 2:
During the quarter, the company has early adopted amendment to IFRS 2 which provides specific guidance to measurement of cash-settled awards, modification of cash-settled awards and awards that include a net settlement feature in respect of withholding taxes. The adoption of the amendment did not have any material effect on the consolidated financial statements.
1.14 Earnings per equity share
Basic earnings per equity share is computed by dividing the net profit attributable to the equity holders of the Company by the weighted average number of equity shares outstanding during the period. Diluted earnings per equity share is computed by dividing the net profit attributable to the equity holders of the company by the weighted average number of equity shares considered for deriving basic earnings per equity share and also the weighted average number of equity shares that could have been issued upon conversion of all dilutive potential equity shares. The dilutive potential equity shares are adjusted for the proceeds receivable had the equity shares been actually issued at fair value (i.e. the average market value of the outstanding equity shares). Dilutive potential equity shares are deemed converted as of the beginning of the period, unless issued at a later date. Dilutive potential equity shares are determined independently for each period presented.
The number of equity shares and potentially dilutive equity shares are adjusted retrospectively for all periods presented for any share splits and bonus shares issues including for changes effected prior to the approval of the financial statements by the Board of Directors.
1.15 Cash Flow Statement
Cash flows are reported using the indirect method, whereby profit for the period is adjusted for the effects of transactions of a non-cash nature, any deferrals or accruals of past or future operating cash receipts or payments and item of income or expenses associated with investing or financing cash flows. The cash flows from operating, investing and financing activities of the Company are segregated.
Amendment to IAS 7:
During the quarter, the company adopted the amendment to IAS 7, which require the entities to provide disclosures that enable users of financial statements to evaluate changes in liabilities arising from financing activities, including both changes arising from cash flows and non-cash changes, suggesting inclusion of a reconciliation between the opening and closing balances in the Balance Sheet for liabilities arising from financing activities, to meet the disclosure requirement. The adoption of amendment did not have any material effect on the consolidated financial statements.
1.16 Recent accounting pronouncements
1.16.1 Standards issued but not yet effective
IFRS 15 Revenue from Contract with Customers:
In May 2014, the International Accounting Standards Board (IASB) issued IFRS 15, Revenue from Contract with Customers. The core
principle of the new standard is that an entity should recognize revenue to depict the transfer of promised goods or services to
customers in an amount that reflects the consideration to which the entity expects to be entitled in exchange for those goods or
services. Further the new standard requires enhanced disclosures about the nature, amount, timing and uncertainty of revenue and
cash flows arising from the entity’s contracts with customers.
The standard permits two possible methods of transition:
| • | Retrospective approach - Under this approach the standard will be applied retrospectively to each prior reporting period presented in accordance with IAS 8- Accounting Policies, Changes in Accounting Estimates and Errors |
| • | Retrospectively with cumulative effect of initially applying the standard recognized at the date of initial application (Cumulative catch - up approach)
The effective date for adoption of IFRS 15 is annual periods beginning on or after January 1, 2018, though early adoption is permitted.The Group does not plan to early adopt IFRS 15 and will adopt the same on April 1, 2018 by using the full retrospective transition method to restate each prior reporting period presented.
The Group derives revenues primarily from software development and related services and from the licensing of software products and is currently evaluating the effect of IFRS 15 on its consolidated financial statements and related disclosures. |
IFRS 16 Leases : On January 13, 2016,
the International Accounting Standards Board issued the final version of IFRS 16, Leases. IFRS 16 will replace the existing leases
Standard, IAS 17 Leases, and related Interpretations. The Standard sets out the principles for the recognition, measurement, presentation
and disclosure of leases for both parties to a contract i.e., the lessee and the lessor. IFRS 16 introduces a single lessee accounting
model and requires a lessee to recognize assets and liabilities for all leases with a term of more than 12 months, unless the underlying
asset is of low value. Currently, operating lease expenses are charged to the statement of comprehensive income. The Standard also
contains enhanced disclosure requirements for lessees. IFRS 16 substantially carries forward the lessor accounting requirements
in IAS 17.
The effective date for adoption of IFRS 16 is annual periods beginning on or after January 1, 2019, though early adoption is permitted
for companies applying IFRS 15 Revenue from Contracts with Customers. The Group is yet to evaluate the requirements of IFRS 16
and the impact on the consolidated financial statements.
IFRIC 22, Foreign currency transactions and Advance consideration: On December 8, 2016, the IFRS interpretations committee of the International Accounting Standards Board (IASB) issued IFRS interpretation, IFRIC 22, Foreign currency transactions and Advance consideration which clarifies the date of the transaction for the purpose of determining the exchange rate to use on initial recognition of the related asset, expense or income, when an entity has received or paid advance consideration in a foreign currency. The effective date for adoption of IFRIC 22 is annual reporting periods beginning on or after January 1, 2018, though early adoption is permitted. The Group is currently evaluating the effect of IFRIC 22 on the consolidated financial statements.
IFRIC 23, Uncertainty over Income Tax Treatments: In June 2017, the International Accounting Standards Board (IASB) issued IFRS interpretation IFRIC 23 Uncertainty over Income Tax Treatments which is to be applied while performing the determination of taxable profit (or loss), tax bases, unused tax losses, unused tax credits and tax rates, when there is uncertainty over income tax treatments under IAS 12. According to IFRIC 23, companies need to determine the probability of the relevant tax authority accepting each tax treatment, or group of tax treatments, that the companies have used or plan to use in their income tax filing which has to be considered to compute the most likely amount or the expected value of the tax treatment when determining taxable profit (tax loss), tax bases, unused tax losses, unused tax credits and tax rates.
The standard permits two possible methods of transition:
Full retrospective approach – Under this approach, IFRIC 23 will be applied retrospectively to each prior reporting period presented in accordance with IAS 8 – Accounting Policies, Changes in Accounting Estimates and Errors.
Retrospectively with cumulative effect of initially applying IFRIC 23 recognized by adjusting equity on initial application, without adjusting comparatives
The effective date for adoption of IFRIC 23 is annual periods beginning on or after January 1, 2019, though early adoption is permitted. The Group is yet to evaluate the effect of IFRIC 23 on the consolidated financial statements.
2. Notes to the condensed consolidated interim financial statements
2.1 Cash and cash equivalents
Cash and cash equivalents consist of the following:
(Dollars in millions)
| As of | ||
| June 30, 2017 | March 31, 2017 | |
| Cash and bank deposits | 2,398 | 2,296 |
| Deposits with financial institutions | 1,181 | 1,193 |
| 3,579 | 3,489 | |
Cash and cash equivalents as of June 30, 2017 and March 31, 2017 include restricted cash and bank balances of $93 million and $88 million, respectively. The restrictions are primarily on account of cash and bank balances held by irrevocable trusts controlled by the Company, bank balances held as margin money deposits against guarantees and balances held in unpaid dividend bank accounts.
The deposits maintained by the Group with banks and financial institutions comprise of time deposits, which can be withdrawn by the Group at any point without prior notice or penalty on the principal.
The table below provides details of cash and cash equivalents :
(Dollars in millions)
| As of | ||
| June 30, 2017 | March 31, 2017 | |
| Current accounts | ||
| ANZ Bank, Taiwan | 1 | – |
| Banamex Bank, Mexico (U.S. Dollar account) | 1 | 1 |
| Bank of America, Mexico | 12 | 8 |
| Bank of America, USA | 149 | 159 |
| Bank Zachodni WBK S.A, Poland | 2 | 1 |
| Barclays Bank, UK | 1 | – |
| Bank Leumi, Israel (US Dollar account) | 6 | – |
| Bank Leumi, Israel | 1 | 2 |
| BNP Paribas Bank, Norway | 7 | 3 |
| China Merchants Bank, China | – | 1 |
| Citibank N.A, China | 24 | 10 |
| Citibank N.A., China (U.S. Dollar account) | 3 | 2 |
| Citibank N.A., Costa Rica | – | 1 |
| Citibank N.A., Australia | 8 | 3 |
| Citibank N.A., Brazil | 3 | 5 |
| Citibank N.A., Japan | 1 | 2 |
| Citibank N.A., New Zealand | 1 | 2 |
| Citibank N.A., South Africa | 2 | 2 |
| Citibank N.A., USA | 14 | 12 |
| Citibank N.A., EEFC (U.S. Dollar account) | 9 | – |
| Commerzbank, Germany | 3 | 3 |
| Deutsche Bank, India | 2 | 2 |
| Deutsche Bank, Philippines | 1 | 1 |
| Deutsche Bank, Philippines (U.S. Dollar account) | – | 1 |
| Deutsche Bank, Poland | 2 | 2 |
| Deutsche Bank, Poland (Euro account) | – | 1 |
| Deutsche Bank, EEFC (Australian Dollar account) | – | 6 |
| Deutsche Bank, EEFC (Euro account) | 5 | 4 |
| Deutsche Bank, EEFC (U.S. Dollar account) | 13 | 12 |
| Deutsche Bank, EEFC (United Kingdom Pound Sterling account) | 1 | 2 |
| Deutsche Bank, Belgium | 10 | 2 |
| Deutsche Bank, Malaysia | – | 1 |
| Deutsche Bank, Czech Republic | 2 | 1 |
| Deutsche Bank, Czech Republic (Euro account) | 1 | 1 |
| Deutsche Bank, Czech Republic (U.S. Dollar account) | 5 | 5 |
| Deutsche Bank, France | 1 | 1 |
| Deutsche Bank, Germany | 2 | 8 |
| Deutsche Bank, Netherlands | 1 | – |
| Deutsche Bank, Russia | 1 | – |
| Deutsche Bank, Russia (U.S. Dollar account) | 1 | – |
| Deutsche Bank, Singapore | – | 1 |
| Deutsche Bank, Switzerland | 4 | 1 |
| Deutsche Bank, United Kingdom | 7 | 4 |
| Deutsche Bank, USA | – | 2 |
| ICICI Bank, India | 7 | 8 |
| ICICI Bank, EEFC (U.S. Dollar account) | 3 | 1 |
| ICICI Bank - Unpaid dividend account | 4 | 2 |
| Nordbanken, Sweden | 3 | 5 |
| Punjab National Bank, India | 2 | 1 |
| Raiffeisen Bank, Czech Republic | 1 | 1 |
| Raiffeisen Bank, Romania | 1 | 1 |
| Royal Bank of Canada, Canada | 19 | 13 |
| State Bank of India, India | 9 | 1 |
| Silicon Valley Bank, USA | 1 | 1 |
| Silicon Valley Bank, (Euro account) | 2 | 3 |
| Union Bank of Switzerland AG, (Euro account) | – | 1 |
| Wells Fargo Bank N.A., USA | 6 | 5 |
| Yes Bank, India | 1 | – |
| 366 | 318 | |
| Deposit accounts | ||
| Axis Bank | 167 | 181 |
| Bank BGZ BNP Paribas S.A | 24 | 28 |
| Barclays Bank | 128 | 127 |
| Canara Bank | 40 | 40 |
| Citibank | 23 | 26 |
| Deutsche Bank, Poland | 16 | 11 |
| HDFC Bank | 378 | 72 |
| HSBC Bank | 77 | 77 |
| ICICI Bank | 840 | 751 |
| IDBI Bank | – | 270 |
| IDFC Bank | 31 | 31 |
| IndusInd Bank | 30 | 29 |
| Kotak Mahindra Bank Limited | 83 | 83 |
| South Indian Bank | 70 | 69 |
| Standard Chartered Bank | – | 77 |
| Syndicate Bank | 8 | 8 |
| Yes Bank | 117 | 98 |
| 2,032 | 1,978 | |
| Deposits with financial institutions | ||
| HDFC Limited, India | 1,073 | 1,085 |
| LIC Housing Finance Limited | 108 | 108 |
| 1,181 | 1,193 | |
| Total | 3,579 | 3,489 |
2.2 Investments
The carrying value of investments are as follows:
(Dollars in millions)
| As of | ||
| June 30, 2017 | March 31, 2017 | |
| (i) Current | ||
| Amortised cost | ||
| Quoted debt securities | ||
| Cost | 1 | 2 |
| Fair value through profit and loss | ||
| Liquid mutual funds | ||
| Fair Value | 242 | 278 |
| Fixed maturity plan securities | ||
| Fair Value | 24 | 23 |
| Fair Value through Other comprehensive income | ||
| Quoted debt securities | ||
| Fair value | 74 | 16 |
| Certificate of deposits | ||
| Fair value | 1,264 | 1,219 |
| Unquoted equity and preference securities | ||
| Fair value | 4 | – |
| 1,609 | 1,538 | |
| (ii) Non-current | ||
| Amortised cost | ||
| Quoted debt securities | ||
| Cost | 294 | 293 |
| Fair value through Other comprehensive income | ||
| Quoted debt securities | ||
| Fair value | 549 | 597 |
| Unquoted equity and preference securities | ||
| Fair value | 23 | 25 |
| Fair value through profit and loss | ||
| Unquoted convertible promissory note | ||
| Fair value | 1 | 1 |
| Fixed maturity plan securities | ||
| Fair Value | 64 | 63 |
| Others | ||
| Fair value | 6 | 5 |
| 937 | 984 | |
| Total investments | 2,546 | 2,522 |
| Investments carried at amortized cost | 295 | 295 |
| Investments carried at fair value through other comprehensive income | 1,914 | 1,857 |
| Investments carried at fair value through profit and loss | 337 | 370 |
Liquid mutual funds:
The fair value of liquid mutual funds as of June 30, 2017 was $242 million and as of March 31, 2017 was $278 million. The fair value is based on quoted prices.
Fixed maturity plan securities:
The fair value as of June 30, 2017 is $88 million and as of March 31, 2017 was $86 million. The fair value is based on market observable inputs.
Quoted debt securities carried at amortised cost:
Investment in quoted debt securities represents the investments made in debt securities issued by government and quasi government organisations. The fair value of quoted debt securities (including interest accrued) as on June 30, 2017 and March 31, 2017 was $344 million and $334 million, respectively. The fair value is based on the quoted prices and market observable inputs.
Quoted debt securities fair valued through other comprehensive income:
Investment in quoted debt securities represents investments made in non-convertible debentures issued by government aided institutions. The fair value of non-convertible debentures (including interest accrued) as of June 30, 2017 was $623 million and as of March 31, 2017 was $613 million. The fair value is based on quoted prices and market observable inputs. The unrealised gain of $4 million, net of taxes of less than $1 million, has been recognized in other comprehensive income for the three months ended June 30, 2017.
Certificate of deposits:
The fair value of certificate of deposits as of June 30, 2017 was $1,264 million and as of March 31, 2017 was $1,219 million. The fair value is based on market observable inputs. The unrealised loss of less than $1 million, net of taxes of less than $1 million, has been recognized in other comprehensive income for the three months ended June 30, 2017.
Unquoted equity, preference and other investments
The fair value is determined using Level 3 inputs like Discounted cash flows method, Market multiples method, Option pricing model, etc.
2.3 Financial instruments
Financial instruments by category
The carrying value and fair value of financial instruments by categories as of June 30, 2017 were as follows:
(Dollars in millions)
| Amortised cost | Financial assets/ liabilities at fair value through profit or loss | Financial assets/liabilities at fair value through OCI | Total carrying value | Total fair value | |||
| Designated upon initial recognition | Mandatory | Equity instruments designated upon initial recognition | Mandatory | ||||
| Assets: | |||||||
| Cash and cash equivalents (Refer Note 2.1) | 3,579 | – | – | – | – | 3,579 | 3,579 |
| Investments (Refer Note 2.2) | |||||||
| Liquid mutual funds | – | – | 242 | – | – | 242 | 242 |
| Fixed maturity plan securities | – | – | 88 | – | – | 88 | 88 |
| Quoted debt securities | 295 | – | – | – | 623 | 918 | 967(1) |
| Certificate of deposits | – | – | – | – | 1,264 | 1,264 | 1,264 |
| Unquoted equity and preference securities | – | – | – | 27 | – | 27 | 27 |
| Unquoted investments others | – | – | 6 | – | – | 6 | 6 |
| Unquoted convertible promissory note | – | – | 1 | – | – | 1 | 1 |
| Trade receivables | 1,934 | – | – | – | – | 1,934 | 1,934 |
| Unbilled revenue | 611 | – | – | – | – | 611 | 611 |
| Prepayments and other assets (Refer Note 2.4) | 459 | – | – | – | – | 459 | 459 |
| Derivative financial instruments | – | – | 4 | – | – | 4 | 4 |
| Total | 6,878 | – | 341 | 27 | 1,887 | 9,133 | |
| Liabilities: | |||||||
| Trade payables | 40 | – | – | – | – | 40 | 40 |
| Derivative financial instruments | – | – | 1 | – | 6 | 7 | 7 |
| Client deposits | 2 | – | – | – | – | 2 | 2 |
| Other liabilities including contingent consideration (Refer Note 2.5) | 869 | – | 6 | – | – | 875 | 875 |
| Total | 911 | – | 7 | – | 6 | 924 | |
(1) On account of fair value changes including interest accrued
The carrying value and fair value of financial instruments by categories as of March 31, 2017 were as follows:
(Dollars in millions)
| Amortised cost | Financial assets/ liabilities at fair value through profit or loss | Financial assets/liabilities at fair value through OCI | Total carrying value | Total fair value | |||
| Designated upon initial recognition | Mandatory | Equity instruments designated upon initial recognition | Mandatory | ||||
| Assets: | |||||||
| Cash and cash equivalents (Refer Note 2.1) | 3,489 | – | – | – | – | 3,489 | 3,489 |
| Investments (Refer Note 2.2) | – | ||||||
| Liquid mutual funds | – | – | 278 | – | – | 278 | 278 |
| Fixed maturity plan securities | – | – | 86 | – | – | 86 | 86 |
| Quoted debt securities | 295 | – | – | – | 613 | 908 | 947(1) |
| Certificate of deposits | – | – | – | – | 1,219 | 1,219 | 1,219 |
| Unquoted equity and preference securities | – | – | – | 25 | – | 25 | 25 |
| Unquoted investments others | – | – | 5 | – | – | 5 | 5 |
| Unquoted convertible promissory note | – | – | 1 | – | – | 1 | 1 |
| Trade receivables | 1,900 | – | – | – | – | 1,900 | 1,900 |
| Unbilled revenue | 562 | – | – | – | – | 562 | 562 |
| Prepayments and other assets (Refer Note 2.4) | 410 | – | – | – | – | 410 | 410 |
| Derivative financial instruments | – | – | 36 | – | 8 | 44 | 44 |
| Total | 6,656 | – | 406 | 25 | 1,840 | 8,927 | |
| Liabilities: | |||||||
| Trade payables | 57 | – | – | – | – | 57 | 57 |
| Derivative financial instruments | – | – | – | – | – | – | – |
| Client deposits | 5 | – | – | – | – | 5 | 5 |
| Other liabilities including contingent consideration (Refer Note 2.5) | 763 | – | 13 | – | – | 776 | 776 |
| Total | 825 | – | 13 | – | – | 838 | |
(1) On account of fair value changes including interest accrued
Fair value hierarchy
Level 1- Quoted prices (unadjusted) in active markets for identical assets or liabilities.
Level 2– Inputs other than quoted prices included within Level 1 that are observable for the asset or liability, either directly (i.e. as prices) or indirectly (i.e. derived from prices).
Level 3- Inputs for the assets or liabilities that are not based on observable market data (unobservable inputs).
The fair value hierarchy of assets and liabilities as of June 30, 2017 is as follows:
(Dollars in millions)
| As of June 30, 2017 |
Fair value measurement at end of the reporting period / year using | |||
| Level 1 | Level 2 | Level 3 | ||
| Assets | ||||
| Investments in liquid mutual fund units (Refer Note 2.2) | 242 | 242 | – | – |
| Investments in fixed maturity plan securities (Refer Note 2.2) | 88 | – | 88 | – |
| Investments in quoted debt securities (Refer Note 2.2) | 967 | 851 | 116 | – |
| Investments in certificate of deposit (Refer Note 2.2) | 1,264 | – | 1,264 | – |
| Investments in equity and preference securities (Refer Note 2.2) | 27 | – | – | 27 |
| Investment in unquoted investments others (Refer Note 2.2) | 6 | – | – | 6 |
| Investments in unquoted convertible promissory note (Refer Note 2.2) | 1 | – | – | 1 |
| Derivative financial instruments- gain on outstanding foreign exchange forward and option contracts | 4 | – | 4 | – |
| Liabilities | – | |||
| Derivative financial instruments- loss on outstanding foreign exchange forward and option contracts | 1 | – | 1 | – |
| Liability towards contingent consideration (Refer Note 2.5)* | 6 | – | – | 6 |
During the three months ended June 30, 2017, quoted debt securities of $277 million were transferred from Level 2 to Level 1 of fair value hierarchy, since these were valued based on quoted prices.
*Discounted $7 million at 14%.
The fair value hierarchy of assets and liabilities as of March 31, 2017 is as follows:
(Dollars in millions)
| As of March 31, 2017 |
Fair value measurement at end of the reporting period / year using | |||
| Level 1 | Level 2 | Level 3 | ||
| Assets | ||||
| Investments in liquid mutual fund units (Refer Note 2.2) | 278 | 278 | – | – |
| Investments in fixed maturity plan securities (Refer Note 2.2) | 86 | – | 86 | – |
| Investments in quoted debt securities (Refer Note 2.2) | 947 | 565 | 382 | – |
| Investments in certificate of deposit (Refer Note 2.2) | 1,219 | – | 1,219 | – |
| Investments in equity and preference securities (Refer Note 2.2) | 25 | – | – | 25 |
| Investment in unquoted investments others (Refer Note 2.2) | 5 | – | – | 5 |
| Investments in unquoted convertible promissory note (Refer Note 2.2) | 1 | – | – | 1 |
| Derivative financial instruments- gain on outstanding foreign exchange forward and option contracts | 44 | – | 44 | – |
| Liabilities | ||||
| Derivative financial instruments- loss on outstanding foreign exchange forward and option contracts | – | – | – | – |
| Liability towards contingent consideration (Refer Note 2.5)* | 13 | – | – | 13 |
*Discounted $14 million at 14.2%.
A one percentage point change in the unobservable inputs used in fair valuation of the contingent consideration does not have a significant impact in its value.
The movement in contingent consideration as of June 30, 2017 from March 31, 2017 is on account of settlement of contingent consideration of $7 million and change in discount rates and passage of time.
Income from financial assets or liabilities is as follows:
(Dollars in millions)
| Three months ended June 30, | ||
| 2017 | 2016 | |
| Interest income on financial assets carried at amortized cost | 66 | 97 |
| Interest income on financial assets fair valued through other comprehensive income | 32 | – |
| Dividend income on investments carried at fair value through profit or loss | – | 3 |
| Gain / (loss) on investments carried at fair value through profit or loss | 11 | – |
| 109 | 100 | |
Financial risk management
Financial risk factors
The Group's activities expose it to a variety of financial risks - market risk, credit risk and liquidity risk. The Group's primary focus is to foresee the unpredictability of financial markets and seek to minimize potential adverse effects on its financial performance. The primary market risk to the Group is foreign exchange risk. The Group uses derivative financial instruments to mitigate foreign exchange related risk exposures. The Group's exposure to credit risk is influenced mainly by the individual characteristic of each customer and the concentration of risk from the top few customers.
Market risk
The Group operates internationally and a major portion of the business is transacted in several currencies and consequently the Group is exposed to foreign exchange risk through its sales and services in the United States and elsewhere, and purchases from overseas suppliers in various foreign currencies. The Group holds derivative financial instruments such as foreign exchange forward and option contracts to mitigate the risk of changes in exchange rates on foreign currency exposures. The exchange rate between the rupee and foreign currencies has changed substantially in recent years and may fluctuate substantially in the future. Consequently, the results of the Group’s operations are adversely affected as the Indian rupee appreciates / depreciates against these currencies.
The following table analyses foreign currency risk from financial instruments as of June 30, 2017:
(Dollars in millions)
| U.S. dollars | Euro | United Kingdom Pound Sterling | Australian dollars | Other currencies | Total | |
| Cash and cash equivalents | 215 | 25 | 9 | 24 | 132 | 405 |
| Trade receivables | 1,291 | 207 | 118 | 100 | 109 | 1,825 |
| Unbilled revenue | 336 | 75 | 50 | 23 | 50 | 534 |
| Other assets | 59 | 7 | 3 | 3 | 14 | 86 |
| Trade payables | (12) | (6) | (5) | (1) | (13) | (37) |
| Client deposits | (1) | – | – | – | (1) | (2) |
| Accrued expenses | (158) | (32) | (26) | (6) | (21) | (243) |
| Employee benefit obligation | (88) | (14) | (3) | (24) | (23) | (152) |
| Other liabilities | (133) | (22) | (8) | (4) | (40) | (207) |
| Net assets / (liabilities) | 1,509 | 240 | 138 | 115 | 207 | 2,209 |
The following table analyses foreign currency risk from financial instruments as of March 31, 2017:
(Dollars in millions)
| U.S. dollars | Euro | United Kingdom Pound Sterling | Australian dollars | Other currencies | Total | |
| Cash and cash equivalents | 206 | 20 | 6 | 28 | 108 | 368 |
| Trade receivables | 1,287 | 192 | 119 | 87 | 108 | 1,793 |
| Unbilled revenue | 376 | 68 | 50 | 19 | 47 | 560 |
| Other assets | 65 | 15 | 7 | 6 | 15 | 108 |
| Trade payables | (18) | (5) | (2) | (1) | (24) | (50) |
| Client deposits | (2) | – | (2) | – | (1) | (5) |
| Accrued expenses | (147) | (33) | (22) | (6) | (23) | (231) |
| Employee benefit obligation | (86) | (13) | (3) | (23) | (19) | (144) |
| Other liabilities | (94) | (17) | (5) | (3) | (42) | (161) |
| Net assets / (liabilities) | 1,587 | 227 | 148 | 107 | 169 | 2,238 |
For each of the three months ended June 30, 2017 and June 30, 2016, every percentage point depreciation / appreciation in the exchange rate between the Indian rupee and the U.S. dollar has affected the company's incremental operating margins by approximately 0.49%.
Sensitivity analysis is computed based on the changes in the income and expenses in foreign currency upon conversion into functional currency, due to exchange rate fluctuations between the previous reporting period and the current reporting period.
Derivative financial instruments
The Group holds derivative financial instruments such as foreign exchange forward and option contracts to mitigate the risk of changes in exchange rates on foreign currency exposures. The counterparty for these contracts is generally a bank. These derivative financial instruments are valued based on quoted prices for similar assets and liabilities in active markets or inputs that are directly or indirectly observable in the marketplace.
The following table gives details in respect of outstanding foreign exchange forward and options contracts:
(In millions)
| As of | ||
| June 30, 2017 | March 31, 2017 | |
| Derivatives designated as cash flow hedges | ||
| Forward contracts | ||
| In Euro | 70 | 95 |
| In United Kingdom Pound Sterling | 45 | 40 |
| In Australian dollars | 90 | 130 |
| Option Contracts | ||
| In Euro | 65 | 40 |
| In United Kingdom Pound Sterling | 10 | – |
| In Australian dollars | 40 | – |
| Other derivatives | ||
| Forward contracts | ||
| In U.S. dollars | 566 | 526 |
| In Euro | 91 | 114 |
| In United Kingdom Pound Sterling | 97 | 75 |
| In Australian dollars | 35 | 35 |
| In Swiss Franc | – | 10 |
| In Singapore dollars | 5 | 5 |
| In Swedish Krona | 50 | 50 |
| In New Zealand dollars | 5 | – |
| In Canadian dollars | 13 | – |
| In Polish Zloty | 37 | – |
| Options contracts | ||
| In U.S. dollars | 223 | 195 |
| In Euro | 45 | 25 |
| In United Kingdom Pound Sterling | 20 | 30 |
| In Canadian dollars | – | 13 |
The Group recognized a net gain on derivative financial instruments of $3 million for the three months ended June 30, 2017 and $7 million for the three months ended June 30, 2016, which is included under other income.
The foreign exchange forward and option contracts mature within 12 months. The table below analyses the derivative financial instruments into relevant maturity groupings based on the remaining period as of the balance sheet date:
(Dollars in millions)
| As of | ||
| June 30, 2017 | March 31, 2017 | |
| Not later than one month | 434 | 355 |
| Later than one month and not later than three months | 786 | 666 |
| Later than three months and not later than one year | 261 | 329 |
| 1,481 | 1,350 | |
During the three months ended June 30, 2017, the group has designated certain foreign exchange forward contracts as cash flow hedges to mitigate the risk of foreign exchange exposure on highly probable forecast cash transactions. The related hedge transactions for balance in cash flow hedging reserve are expected to occur and reclassified to revenue in the statement of comprehensive income within 3 months.
Hedge effectiveness is determined at the inception of the hedge relationship, and through periodic prospective effectiveness assessments to ensure that an economic relationship exists between the hedged item and hedging instrument, including whether the hedging instrument is expected to offset changes in cash flows of hedged items.
If the hedge ratio for risk management purposes is no longer optimal but the risk management objective remains unchanged and the hedge continues to qualify for hedge accounting, the hedge relationship will be rebalanced by adjusting either the volume of the hedging instrument or the volume of the hedged item so that the hedge ratio aligns with the ratio used for risk management purposes. Any hedge ineffectiveness is calculated and accounted for in profit or loss at the time of the hedge relationship rebalancing.
The following table provides the reconciliation of cash flow hedge reserve for the three months ended June 30, 2017:
(Dollars in millions)
| Three months ended June 30, 2017 | |
| Balance at the beginning of the period | 6 |
| Gain / (Loss) recognised in other comprehensive income during the period | (6) |
| Amount reclassified to revenue during the period | (7) |
| Tax impact on above | 3 |
| Balance at the end of the period | (4) |
The group offsets a financial asset and a financial liability when it currently has a legally enforceable right to set off the recognized amounts and the group intends either to settle on a net basis, or to realise the asset and settle the liability simultaneously.
The following table provides quantitative information about offsetting of derivative financial assets and derivative financial liabilities:
(Dollars in millions)
| As of | ||||
| June 30, 2017 | March 31, 2017 | |||
| Derivative financial asset | Derivative financial liability | Derivative financial asset |
Derivative financial liability | |
| Gross amount of recognized financial asset/liability | 7 | (10) | 44 | – |
| Amount set off | (3) | 3 | – | – |
| Net amount presented in balance sheet | 4 | (7) | 44 | – |
Credit risk
Credit risk refers to the risk of default on its obligation by the counterparty resulting in a financial loss. The maximum exposure to the credit risk at the reporting date is primarily from trade receivables amounting to $1,934 million and $1,900 million as of June 30, 2017 and March 31, 2017, respectively and unbilled revenue amounting to $611 million and $562 million as of June 30, 2017 and March 31, 2017, respectively. Trade receivables and unbilled revenue are typically unsecured and are derived from revenue earned from customers primarily located in the United States. Credit risk is managed through credit approvals, establishing credit limits and continuously monitoring the creditworthiness of customers to which the Group grants credit terms in the normal course of business. On account of adoption of IFRS 9, the Group uses expected credit loss model to assess the impairment loss or gain. The group uses a provision matrix to compute the expected credit loss allowance for trade receivables and unbilled revenues. The provision matrix takes into account available external and internal credit risk factors such as credit default swap quotes, credit ratings from international credit rating agencies and the Group's historical experience for customers.
The following table gives details in respect of percentage of revenues generated from top customer and top ten customers:
(In %)
| Three months ended June 30, | ||
| 2017 | 2016 | |
| Revenue from top customer | 3.3 | 3.6 |
| Revenue from top ten customers | 20.0 | 22.2 |
Credit risk exposure
The reversal of allowance for lifetime expected credit loss on customer balances for the three months ended June 30, 2017 was $1 million and allowance for lifetime expected credit loss on customer balances was $2 million for the three months ended June 30, 2016.
(Dollars in millions)
| Three months ended June 30, | ||
| 2017 | 2016 | |
| Balance at the beginning | 63 | 44 |
| Translation differences | 1 | (1) |
| Impairment loss recognized/(reversed) | (1) | 2 |
| Write offs | – | – |
| Balance at the end | 63 | 45 |
The Company’s credit period generally ranges from 30-60 days.
(Dollars in millions except otherwise stated)
| As of | ||
| June 30, 2017 | March 31, 2017 | |
| Trade receivables | 1,934 | 1,900 |
| Unbilled revenues | 611 | 562 |
| Days Sales Outstanding- DSO (days) | 68 | 68 |
Credit risk on cash and cash equivalents is limited as we generally invest in deposits with banks and financial institutions with high credit ratings assigned by international and domestic credit rating agencies. Investments primarily include investment in liquid mutual fund units, fixed maturity plan securities, quoted bonds issued by government and quasi government organizations, non convertible debentures and certificates of deposits.
Liquidity risk
The Group's principal sources of liquidity are cash and cash equivalents and the cash flow that is generated from operations. The Group has no outstanding bank borrowings. The Group believes that the working capital is sufficient to meet its current requirements.
As of June 30, 2017, the Group had a working capital of $6,037 million including cash and cash equivalents of $3,579 million and current investments of $1,609 million. As of March 31, 2017, the Group had a working capital of $6,121 million including cash and cash equivalents of $3,489 million and current investments of $1,538 million.
As of June 30, 2017 and March 31, 2017, the outstanding employee benefit obligations were $220 million and $209 million, respectively, which have been substantially funded. Accordingly, no liquidity risk is perceived.
The table below provides details regarding the contractual maturities of significant financial liabilities as of June 30, 2017:
(Dollars in millions)
| Particulars | Less than 1 year | 1-2 years | 2-4 years | 4-7 years | Total |
| Trade payables | 40 | – | – | – | 40 |
| Client deposits | 2 | – | – | – | 2 |
| Other liabilities (excluding liability towards contingent consideration) - Refer Note 2.5 | 864 | 5 | – | – | 869 |
| Liability towards contingent consideration on an undiscounted basis -Refer Note 2.5 | 7 | – | – | – | 7 |
The table below provides details regarding the contractual maturities of significant financial liabilities as of March 31, 2017:
(Dollars in millions)
| Particulars | Less than 1 year | 1-2 years | 2-4 years | 4-7 years | Total |
| Trade payables | 57 | – | – | – | 57 |
| Client deposits | 5 | – | – | – | 5 |
| Other liabilities (excluding liability towards contingent consideration) - Refer Note 2.5 | 758 | 5 | – | – | 763 |
| Liability towards contingent consideration on an undiscounted basis -Refer Note 2.5 | 7 | 7 | – | – | 14 |
2.4 Prepayments and other assets
Prepayments and other assets consist of the following:
(Dollars in millions)
| As of | ||
| June 30, 2017 | March 31, 2017 | |
| Current | ||
| Rental deposits | 2 | 1 |
| Security deposits | 1 | 2 |
| Loans to employees | 39 | 42 |
| Prepaid expenses (1) | 78 | 68 |
| Interest accrued and not due | 132 | 89 |
| Withholding taxes and others(1) | 312 | 291 |
| Advance payments to vendors for supply of goods (1) | 13 | 20 |
| Deposit with corporations | 221 | 218 |
| Deferred contract cost(1) | 12 | 12 |
| Other assets | 12 | 6 |
| 822 | 749 | |
| Non-current | ||
| Loans to employees | 4 | 5 |
| Security deposits | 14 | 13 |
| Deposit with corporations | 7 | 7 |
| Prepaid gratuity (1) | 6 | 12 |
| Prepaid expenses (1) | 17 | 15 |
| Deferred contract cost (1) | 42 | 44 |
| Rental Deposits | 27 | 27 |
| 117 | 123 | |
| 939 | 872 | |
| Financial assets in prepayments and other assets | 459 | 410 |
(1) Non financial assets
Withholding taxes and others primarily consist of input tax credits. Other assets primarily represent travel advances and other recoverable. Security deposits relate principally to leased telephone lines and electricity supplies. Deferred contract costs are upfront costs incurred for the contract and are amortised over the term of the contract.
Deposit with corporation represents amounts deposited to settle certain employee-related obligations as and when they arise during the normal course of business.
2.5 Other liabilities
Other liabilities comprise the following:
(Dollars in millions)
| As of | ||
| June 30, 2017 | March 31, 2017 | |
| Current | ||
| Accrued compensation to employees | 357 | 290 |
| Accrued expenses | 441 | 399 |
| Withholding taxes and others (1) | 199 | 189 |
| Retainage | 31 | 34 |
| Liabilities of controlled trusts | 22 | 22 |
| Liability towards contingent consideration (Refer note 2.9) | 6 | 7 |
| Tax on dividend (1) | 107 | – |
| Deferred rent(1) | 2 | – |
| Others | 13 | 13 |
| 1,178 | 954 | |
| Non-Current | ||
| Liability towards contingent consideration (Refer note 2.9) | – | 6 |
| Accrued compensation to employees | 5 | 5 |
| Deferred income - government grant on land use rights (1) | 7 | 6 |
| Deferred income (1) | 6 | 7 |
| 18 | 24 | |
| 1,196 | 978 | |
| Financial liabilities included in other liabilities | 875 | 776 |
| Contingent consideration on undiscounted basis | 7 | 14 |
(1) Non financial liabilities
Accrued expenses primarily relate to cost of technical sub-contractors, telecommunication charges, legal and professional charges, brand building expenses, overseas travel expenses and office maintenance. Others include unpaid dividend balances and capital creditors.
2.6 Provisions
Provisions comprise the following:
(Dollars in millions)
| As of | ||
| June 30, 2017 | March 31, 2017 | |
| Provision for post sales client support and other provisions | 63 | 63 |
| 63 | 63 | |
Provision for post sales client support and other provisions represents costs associated with providing sales support services which are accrued at the time of recognition of revenues and are expected to be utilized over a period of 6 months to 1 year. The movement in the provision for post sales client support and other provisions is as follows:
(Dollars in millions)
| Three months ended June 30, 2017 | |
| Balance at the beginning | 63 |
| Translation differences | – |
| Provision recognized/(reversed) | 2 |
| Provision utilized | (2) |
| Balance at the end | 63 |
Provision for post sales client support and other provisions is included in cost of sales in the statement of comprehensive income.
As of June 30, 2017 and March 31, 2017, claims
against the Company, not acknowledged as debts, net of amounts paid (excluding demands from Indian income tax authorities - Refer
to Note 2.11) amounted to $47 million (301 crore) and $46 million (301 crore), respectively.
The Company is subject to legal proceedings and claims, which have arisen in the ordinary course of business. The Company’s management does not reasonably expect that these legal actions, when ultimately concluded and determined, will have a material and adverse effect on the Company’s results of operations or financial condition.
2.7 Property, plant and equipment
Following are the changes in the carrying value of property, plant and equipment for the three months ended June 30, 2017:
(Dollars in millions)
| Land | Buildings | Plant and machinery | Computer equipment | Furniture and fixtures | Vehicles | Total | |
| Gross carrying value as of April 1, 2017 | 272 | 1,123 | 466 | 700 | 261 | 5 | 2,827 |
| Additions | – | 8 | 9 | 25 | 6 | – | 48 |
| Deletions | – | – | – | (5) | – | – | (5) |
| Translation difference | 1 | 5 | 2 | 4 | 2 | – | 14 |
| Gross carrying value as of June 30, 2017 | 273 | 1,136 | 477 | 724 | 269 | 5 | 2,884 |
| Accumulated depreciation as of April 1, 2017 | (4) | (376) | (301) | (471) | (168) | (3) | (1,323) |
| Depreciation | – | (10) | (16) | (26) | (10) | – | (62) |
| Accumulated depreciation on deletions | – | – | – | 5 | – | – | 5 |
| Translation difference | – | (2) | (1) | (3) | (1) | – | (7) |
| Accumulated depreciation as of June 30, 2017 | (4) | (388) | (318) | (495) | (179) | (3) | (1,387) |
| Capital work-in progress as of June 30, 2017 | 337 | ||||||
| Carrying value as of June 30, 2017 | 269 | 748 | 159 | 229 | 90 | 2 | 1,834 |
| Capital work-in progress as of April 1, 2017 | 303 | ||||||
| Carrying value as of April 1, 2017 | 268 | 747 | 165 | 229 | 93 | 2 | 1,807 |
Following are the changes in the carrying value of property, plant and equipment for the three months ended June 30, 2016:
(Dollars in millions)
| Land | Buildings | Plant and machinery | Computer equipment | Furniture and fixtures | Vehicles | Total | |
| Gross carrying value as of April 1, 2016 | 244 | 955 | 392 | 615 | 218 | 4 | 2,428 |
| Additions | 1 | 5 | 24 | 27 | 8 | – | 65 |
| Deletions | – | – | – | (2) | – | – | (2) |
| Translation difference | (4) | (18) | (8) | (12) | (5) | 1 | (46) |
| Gross carrying value as of June 30, 2016 | 241 | 942 | 408 | 628 | 221 | 5 | 2,445 |
| Accumulated depreciation as of April 1, 2016 | (3) | (332) | (243) | (395) | (149) | (3) | (1,125) |
| Depreciation | – | (8) | (13) | (24) | (7) | – | (52) |
| Accumulated depreciation on deletions | – | – | – | 2 | – | – | 2 |
| Translation difference | – | 6 | 5 | 7 | 4 | – | 22 |
| Accumulated depreciation as of June 30, 2016 | (3) | (334) | (251) | (410) | (152) | (3) | (1,153) |
| Capital work-in progress as of June 30, 2016 | 332 | ||||||
| Carrying value as of June 30, 2016 | 238 | 608 | 157 | 218 | 69 | 2 | 1,624 |
| Capital work-in progress as of April 1, 2016 | 286 | ||||||
| Carrying value as of April 1, 2016 | 241 | 623 | 149 | 220 | 69 | 1 | 1,589 |
Following are the changes in the carrying value of property, plant and equipment for the year ended March 31, 2017:
(Dollars in millions)
| Land | Buildings | Plant and machinery | Computer equipment | Furniture and fixtures | Vehicles | Total | |
| Gross carrying value as of April 1, 2016 | 244 | 955 | 392 | 615 | 218 | 4 | 2,428 |
| Additions | 22 | 147 | 73 | 120 | 57 | 1 | 420 |
| Deletions | – | – | (8) | (47) | (17) | (1) | (73) |
| Translation difference | 6 | 21 | 9 | 12 | 3 | 1 | 52 |
| Gross carrying value as of March 31, 2017 | 272 | 1,123 | 466 | 700 | 261 | 5 | 2,827 |
| Accumulated depreciation as of April 1, 2016 | (3) | (332) | (243) | (395) | (149) | (3) | (1,125) |
| Depreciation | (1) | (35) | (57) | (101) | (31) | (1) | (226) |
| Accumulated depreciation on deletions | – | – | 5 | 34 | 14 | 1 | 54 |
| Translation difference | – | (9) | (6) | (9) | (2) | – | (26) |
| Accumulated depreciation as of March 31, 2017 | (4) | (376) | (301) | (471) | (168) | (3) | (1,323) |
| Capital work-in progress as of March 31, 2017 | 303 | ||||||
| Carrying value as of March 31, 2017 | 268 | 747 | 165 | 229 | 93 | 2 | 1,807 |
| Capital work-in progress as of April 1, 2016 | 286 | ||||||
| Carrying value as of April 1, 2016 | 241 | 623 | 149 | 220 | 69 | 1 | 1,589 |
The depreciation expense is included in cost of sales in the consolidated statement of comprehensive income.
Carrying value of land includes $99 million as of June 30, 2017 and March 31, 2017 each, towards deposits paid under certain lease-cum-sale agreements to acquire land, including agreements where the company has an option to either purchase the properties or renew the lease on expiry of the lease period.
The contractual commitments for capital expenditure were $138 million and $177 million as of June 30, 2017 and March 31, 2017, respectively.
2.8 Goodwill
Following is a summary of changes in the carrying amount of goodwill:
(Dollars in millions)
| As of | ||
| June 30, 2017 | March 31, 2017 | |
| Carrying value at the beginning | 563 | 568 |
| Translation differences | 10 | (5) |
| Carrying value at the end | 573 | 563 |
For the purpose of impairment testing, goodwill acquired in a business combination is allocated to the cash generating units (CGU) or groups of CGUs, which benefit from the synergies of the acquisition. The chief operating decision maker reviews the goodwill for any impairment at the operating segment level, which is represented through groups of CGUs.
The following table presents the allocation of goodwill to operating segments as at March 31, 2017:
(Dollars in millions)
| Segment | As of March 31, 2017 |
| Financial services | 127 |
| Manufacturing | 63 |
| Retail, Consumer packaged goods and Logistics | 86 |
| Life Sciences, Healthcare and Insurance | 98 |
| Energy & utilities, Communication and Services | 118 |
| 492 | |
| Operating segments without significant goodwill | 71 |
| Total | 563 |
The entire goodwill relating to Infosys BPO’s acquisition of McCamish has been allocated to the group of CGUs which is represented by the Life Sciences, Healthcare and Insurance segment.
The goodwill relating to Infosys Lodestone, Portland, Panaya and Kallidus d.b.a Skava acquisitions has been allocated to the groups of CGUs which are represented by a majority of the entity’s operating segment.
The entire goodwill relating to Noah acquisition has been allocated to the group of CGUs which is represented by the Energy & utilities, Communication and Services segment.
The recoverable amount of a CGU is the higher of its fair value less cost to sell and its value-in-use. The fair value of a CGU is determined based on the market capitalization. The value-in-use is determined based on specific calculations. These calculations use pre-tax cash flow projections over a period of five years. As of March 31, 2017, the estimated recoverable amount of the CGU exceeded its carrying amount. The recoverable amount was computed based on the fair value being higher than value-in-use and the carrying amount of the CGU was computed by allocating the net assets to operating segments for the purpose of impairment testing. The key assumptions used for the calculations are as follows:
In %
| As of March 31, 2017 | |
| Long term growth rate | 8-10 |
| Operating margins | 17-20 |
| Discount rate | 14.4 |
The above discount rate is based on the Weighted Average Cost of Capital (WACC) of the Company. These estimates are likely to differ from future actual results of operations and cash flows.
2.9 Business combination
Noah Consulting LLC
On November 16, 2015, Infosys acquired 100% membership interest in Noah Consulting, LLC (Noah), a leading provider of advanced information management consulting services for the oil and gas industry. The business acquisition was conducted by entering into a share purchase agreement for cash consideration of $33 million, contingent consideration of upto $5 million and an additional consideration of upto $32 million, referred to as retention bonus payable to the employees of Noah at each anniversary year following the acquisition date for the next three years, subject to their continuous employment with the group at each anniversary. During the year ended March 31, 2016 based on an assessment of Noah achieving the targets for the year ended December 31, 2015 and year ended December 31, 2016, the entire contingent consideration has been reversed in the consolidated statement of comprehensive income.
The retention bonus is treated as a post-acquisition employee remuneration expense as per IFRS 3. For the three months ended June 30, 2017 and June 30, 2016 , a post-acquisition employee remuneration expense of $2 million and $5 million has been recorded in the statement of comprehensive income.
Proposed business transfer
On July 14, 2017, the Board of Directors of Infosys authorized the Company to execute a Business Transfer Agreement and related documents with Noah Consulting LLC, a wholly owned subsidiary, to transfer the business of Noah Consulting LLC to Infosys Limited, subject to securing the requisite regulatory approvals for a consideration based on an independent valuation. The transfer of assets and liabilities between entities under common control will be accounted for at carrying values and will not have any impact on the consolidated financial statements.
Kallidus Inc. (d.b.a Skava)
On June 2, 2015, Infosys acquired 100% of the voting interests in Kallidus Inc., US (Kallidus), a leading provider of digital experience solutions, including mobile commerce and in-store shopping experiences to large retail clients and 100% of the voting interests of Skava Systems Private Limited, an affiliate of Kallidus. The business acquisition was conducted by entering into a share purchase agreement for cash consideration of $91 million and a contingent consideration of up to $20 million.
The payment of contingent consideration to sellers of Kallidus is dependent upon the achievement of certain financial targets by Kallidus over a period of 3 years ending on December 31, 2017.
The fair value of contingent consideration is determined by discounting the estimated amount payable to the sellers of Kallidus on achievement of certain financial targets. At the acquisition date, the key inputs used in determination of the fair value of contingent consideration are the discount rate of 14% and the probabilities of achievement of the financial targets.
During the three months ended June 30, 2017 contingent consideration of $7 million was paid to the sellers of Kallidus on the achievement of certain financial targets. The balance contingent consideration as of June 30, 2017 and March 31, 2017 is $7 million and $14 million on an undiscounted basis.
2.10 Employees' Stock Option Plans (ESOP)
2015 Stock Incentive Compensation Plan (the 2015 Plan): On March 31, 2016, pursuant to the approval by the shareholders through postal ballot, the Board has been authorized to introduce, offer, issue and allot share-based incentives to eligible employees of the Company and its subsidiaries under the 2015 Stock Incentive Compensation Plan (the 2015 Plan). The maximum number of shares under the 2015 plan shall not exceed 24,038,883 equity shares (this includes 1,12,23,576 equity shares which are held by the trust towards the 2011 Plan as at March 31, 2016). Out of this 17,038,883 equity shares will be issued as RSUs at par value and 7,000,000 equity shares will be issued as stock options at market price on the date of the grant. These instruments will vest over a period of 4 years and the Company expects to grant the instruments under the 2015 Plan over the period of 4 to 7 years.
Controlled trust holds 11,264,702 and 11,289,514 shares, as of June 30, 2017 and March 31, 2017, respectively under the 2015 plan, out of which 100,000 equity shares have been earmarked for welfare activities of the employees.
Stock incentives granted to CEO:
Pursuant to the approval from the shareholders through postal ballot on March 31, 2016, Dr. Vishal Sikka is eligible to receive under the 2015 Plan, an annual grant of time-based RSUs of fair value $2 million which vest over time, subject to continued service, and an annual grant of performance based equity and stock options of $5 million subject to achievement of performance targets set by the Board or its committee, which vest over time. Time based RSUs of fair value of $2 million for financial year 2017 was granted on August 1, 2016 amounting to 120,700 RSUs in equity shares represented by ADSs.
Based on fiscal 2017 performance evaluation, the Board, on the recommendations of nomination and remuneration committee, approved on April 13, 2017, performance based equity and stock options for fiscal 2017 comprising 132,483 RSUs amounting to $1.9 million and 330,525 ESOPs amounting to $0.96 million .. Further, the Board, also approved the annual time-based vesting grant for fiscal 2018 to Dr. Vishal Sikka, comprising of 137,741 RSUs amounting to $2 million. These RSUs and ESOPs have been granted effective May 2, 2017. The exercise price of the RSU's will be equal to the par value of the shares and the exercise price of the stock options would be the market price as on the date of grant, as approved by the shareholders. Though the performance based awards for fiscal 2018 and the time based RSU’s for the remaining employment term have not been granted as of June 30, 2017, in accordance with IFRS 2 Share-based Payment, the company has recorded employee stock based compensation expense.
Stock incentives granted to COO:
The Nomination and Remuneration Committee in its meeting held on October 14, 2016 recommended a grant of 27,250 RSUs and 43,000 ESOPs to U.B.Pravin Rao, under the 2015 Plan and the same was approved by the shareholders through postal ballot on March 31, 2017. These RSUs and ESOPs have been granted w.e.f May 2, 2017. These RSUs and stock options would vest over a period of 4 years and shall be exercisable within the period as approved by the Committee. The exercise price of the RSU's will be equal to the par value of the shares and the exercise price of the stock options would be the market price as on the date of grant, as approved by the shareholders.
Stock incentives granted to KMP (other than CEO and COO)
On November 1, 2016, 245,750 RSUs and 502,550 stock options were granted under the 2015 plan, to key management personnel, excluding CEO and COO, based on fiscal 2016 performance. Additionally, on November 1, 2016, 1,500 RSUs were granted to the Acting General Counsel and the same were outstanding as of June 30, 2017. These RSUs and stock options will vest over a period of 4 years and shall be exercisable within the period as approved by the Committee. The exercise price of the RSUs will be equal to the par value of the shares and the exercise price of the stock options would be the market price as on the date of grant.
During the three months ended June 30, 2017 and June 30, 2016, we recorded an employee stock compensation expense of $2 million and $1 million, respectively towards key managerial personnel including CEO and COO.
Stock incentive granted to other employees:
During fiscal 2017, the company granted 2,506,740 RSUs and 703,300 ESOPs and 112,210 incentive units (cash settled) to certain eligible employees at mid and senior levels under the 2015 plan. Further, on May 2, 2017, the company granted 37,090 RSUs (includes equity shares and equity shares represented by ADS) at par value, 73,600 employee stock options (ESOPs) (including equity shares and equity shares represented by ADS) to be exercised at market price at the time of grant, to certain employees at the senior management level. These instruments will vest over a period of 4 years and are subject to continued service.
The company recorded an employee stock compensation expense in the statement of comprehensive income for the three months ended June 30, 2017 and June 30, 2016 of $7 million and $1 million, respectively. Further , the cash settled stock compensation expense (included above) for the three months ended June 30, 2017 and June 30, 2016 was less than $1 million and Nil, respectively. This comprises of expense pertaining to CEO, COO, other KMP and other employees. As of June 30, 2017 and March 31, 2017 94,090 and 106,845 incentive units were outstanding (net of forfeitures).
2011 RSU Plan (the 2011 Plan) now called 2015 Stock Incentive Compensation Plan ( the 2015 Plan):The Company had a 2011 RSU Plan which provided for the grant of restricted stock units (RSUs) to eligible employees of the Company. The Board of Directors recommended the establishment of the 2011 Plan to the shareholders on August 30, 2011 and the shareholders approved the recommendation of the Board of Directors on October 17, 2011 through a postal ballot. The maximum aggregate number of shares that may be awarded under the plan was 1,13,34,400 as on date of approval of plan adjusted for bonus shares and the plan was expected to continue in effect for a term of 10 years from the date of initial grant under the plan. Awards have been granted to Dr. Vishal Sikka under the 2011 RSU plan as detailed below. Further the Company has earmarked 1,00,000 equity shares for welfare activities of the employees, approved by the shareholders vide postal ballot which ended on March 31, 2016. The equity shares as of March 31, 2016 held under this plan, i.e. 1,12,23,576 equity shares (this includes the aggregate number of equity shares that may be awarded under the 2011 Plan as reduced by 10,824 equity shares already exercised by Dr. Vishal Sikka and 1,00,000 equity shares which have been earmarked for welfare activities of the employees) have been subsumed under the 2015 Plan.
During the year ended March 31, 2015, the company made a grant of 108,268 restricted stock units (adjusted for bonus issues) to Dr. Vishal Sikka, Chief Executive Officer and Managing Director. The Board in its meeting held on June 22, 2015, on recommendation of Nomination and Remuneration Committee, further granted 1,24,061 RSUs to Dr. Vishal Sikka. These RSUs are vesting over a period of four years from the date of the grant in the proportions specified in the award agreement. The RSUs will vest subject to achievement of certain key performance indicators as set forth in the award agreement for each applicable year of the vesting tranche and continued employment through each vesting date.
The award granted to Dr. Vishal Sikka on June 22, 2015 was modified by the Nomination and remuneration committee on April 14, 2016. There is no modification or change in the total number of RSUs granted or the vesting period (which is four years). The modifications relate to the criteria of vesting for each of the years. Based on the modification, the first tranche of the RSUs will vest subject to achievement of certain key performance indicators for the year ended March 31, 2016. Subsequent vesting of RSU's for each of the remaining years would be subject to continued employment.
The activity in the 2015 Plan (formerly 2011 RSU Plan) for equity-settled share based payment transaction during the three months ended June 30, 2017 and June 30, 2016 is set out below:
| Particulars | Three months ended June 30, 2017 | Three months ended June 30, 2016 | ||
| Shares arising out of options | Weighted average exercise price () |
Shares arising out of options | Weighted average exercise price () | |
| 2015 Plan Indian equity shares (RSU - IES) | ||||
| Outstanding at the beginning* | 2,003,928 | 5 | 221,505 | 5 |
| Granted | 31,750 | 5 | – | – |
| Forfeited and expired | 31,695 | 5 | – | – |
| Exercised | 24,812 | 5 | 12,406 | 5 |
| Outstanding at the end | 1,979,171 | 5 | 209,099 | 5 |
| Exercisable at the end | – | – | – | – |
| 2015 Plan Employee Stock Options (ESOPs- IES) | ||||
| Outstanding at the beginning | 309,650 | 998 | – | – |
| Granted | 50,200 | 919 | – | – |
| Forfeited and expired | – | – | – | – |
| Exercised | – | – | – | – |
| Outstanding at the end | 359,850 | 987 | – | – |
| Exercisable at the end | – | – | – | – |
| Particulars | Three months ended June 30, 2017 | |
| Shares arising out of options | Weighted average exercise price ($) | |
| 2015 Plan American Depository Shares (RSU - ADS) | ||
| Outstanding at the beginning | 957,445 | 0.07 |
| Granted | 302,814 | 0.07 |
| Forfeited and expired | 13,425 | 0.07 |
| Exercised | – | – |
| Outstanding at the end | 1,246,834 | 0.07 |
| Exercisable at the end | – | – |
| 2015 Plan Employee Stock Options (ESOPs- ADS) | ||
| Outstanding at the beginning | 888,000 | 15.26 |
| Granted | 396,925 | 14.54 |
| Forfeited and expired | – | – |
| Exercised | – | – |
| Outstanding at the end | 1,284,925 | 15.05 |
| Exercisable at the end | – | – |
There was no activity in 2015 plan during the three months ended June 30, 2016 involving equity shares represented by ADS
During the three months ended June 30, 2017, the weighted average share price of options exercised under the 2015 Plan on the date of exercise was $14.60.
During the three months ended June 30, 2016, the weighted average share price of options exercised under the 2015 Plan on the date of exercise was $18.
The following table summarizes information about equity settled RSUs and ESOPs outstanding as of June 30, 2017
| Options outstanding | |||
| Range of exercise prices per share ($) | No. of shares arising out of options | Weighted average remaining contractual life | Weighted average exercise price ($) |
| 2015 Plan: ADS and IES | |||
| 0.07 (RSU) | 3,226,005 | 1.71 | 0.07 |
| 14 - 16 (ESOP) | 1,644,775 | 6.98 | 15.09 |
| 4,870,780 | 3.49 | 5.15 | |
The following table summarizes information about equity settled RSUs and ESOPs outstanding as of March 31, 2017
| Options outstanding | |||
| Range of exercise prices per share ($) | No. of shares arising out of options | Weighted average remaining contractual life | Weighted average exercise price ($) |
| 2015 Plan: ADS and IES | |||
| 0.07 (RSU) | 2,961,373 | 1.88 | 0.07 |
| 14 - 16 (ESOP) | 1,197,650 | 7.09 | 15.83 |
| 4,159,023 | 3.38 | 4.61 | |
The fair value of each equity settled RSU is estimated on the date of grant using the Black-Scholes-Merton model with the following assumptions:
| Particulars | For options granted in | |||
| Fiscal 2018- Equity Shares-RSU |
Fiscal 2018- Equity shares ESOP |
Fiscal 2018- ADS-RSU |
Fiscal 2018- ADS- ESOP | |
| Weighted average share price () / ($- ADS) |
923 | 923 | 14.52 | 14.52 |
| Exercise price ()/ ($- ADS) |
5.00 | 919 | 0.07 | 14.54 |
| Expected volatility (%) | 21-25 | 25-28 | 23-26 | 25-31 |
| Expected life of the option (years) | 1 - 4 | 3 - 7 | 1 - 4 | 3 - 7 |
| Expected dividends (%) | 2.78 | 2.78 | 2.74 | 2.74 |
| Risk-free interest rate (%) | 6 - 7 | 6 - 7 | 1 - 2 | 1 - 2 |
| Weighted average fair value as on grant date () / ($- ADS) |
857 | 254 | 13.50 | 2.91 |
| Particulars | For options granted in | |||
| Fiscal 2017- Equity Shares-RSU |
Fiscal 2017- Equity shares ESOP |
Fiscal 2017- ADS-RSU |
Fiscal 2017- ADS- ESOP | |
| Weighted average share price () / ($- ADS) |
1,067 | 989 | 15.77 | 15.26 |
| Exercise price ()/ ($- ADS) |
5.00 | 998 | 0.07 | 15.26 |
| Expected volatility (%) | 24-29 | 27-29 | 26-29 | 27-31 |
| Expected life of the option (years) | 1 - 4 | 3 - 7 | 1 - 4 | 3 - 7 |
| Expected dividends (%) | 2.37 | 2.37 | 2.29 | 2.29 |
| Risk-free interest rate (%) | 6- 7 | 6- 7 | 1 - 2 | 1 - 2 |
| Weighted average fair value as on grant date () / ($- ADS) |
1,002 | 285 | 14.84 | 3.46 |
The expected life of the RSU / ESOP is estimated based on the vesting term and contractual term of the RSU / ESOP, as well as expected exercise behaviour of the employee who receives the RSU / ESOP. Expected volatility during the expected term of the RSU / ESOP is based on historical volatility of the observed market prices of the company's publicly traded equity shares during a period equivalent to the expected term of the RSU / ESOP.
2.11 Income taxes
Income tax expense in the consolidated statement of comprehensive income comprises:
(Dollars in millions)
| Three months ended June 30, | ||
| 2017 | 2016 | |
| Current taxes | ||
| Domestic taxes | 167 | 163 |
| Foreign taxes | 66 | 56 |
| 233 | 219 | |
| Deferred taxes | ||
| Domestic taxes | (14) | (5) |
| Foreign taxes | (6) | (11) |
| (20) | (16) | |
| Income tax expense | 213 | 203 |
Income tax expense for the three months ended June 30, 2017 and June 30, 2016 includes reversals (net of provisions) of $2 million and provisions (net of reversals) of $1 million respectively, pertaining to prior periods.
Entire deferred income tax for the three months ended June 30, 2017 and June 30, 2016 relates to origination and reversal of temporary differences.
A reconciliation of the income tax provision to the amount computed by applying the statutory income tax rate to the income before income taxes is summarized below:
(Dollars in millions)
| Three months ended June 30, | ||
| 2017 | 2016 | |
| Profit before income taxes | 754 | 714 |
| Enacted tax rates in India | 34.61% | 34.61% |
| Computed expected tax expense | 261 | 248 |
| Tax effect due to non-taxable income for Indian tax purposes | (93) | (72) |
| Overseas taxes | 35 | 28 |
| Tax provision (reversals), overseas and domestic | (2) | 1 |
| Effect of differential overseas tax rates | 2 | – |
| Effect of exempt non operating income | (3) | (4) |
| Effect of unrecognized deferred tax assets | 11 | – |
| Effect of non-deductible expenses | 5 | 5 |
| Additional deduction on research and development expense | (1) | (2) |
| Others | (2) | (1) |
| Income tax expense | 213 | 203 |
The applicable Indian statutory tax rate for fiscal 2018 and fiscal 2017 is 34.61%.
During the quarter ended June 30, 2017 and June 30, 2016, the Group has claimed weighted tax deduction on eligible research and development expenditure based on the approval received from Department of Scientific and Industrial Research (DSIR) which was valid upto March 31, 2017. The weighted tax deduction is equal to 150% for quarter ended June 30, 2017 and 200% for quarter ended June 30, 2016 of such expenditure incurred. The company has applied for renewal of the R&D recognition with DSIR which is pending approval.
The foreign tax expense is due to income taxes payable overseas, principally in the United States. In India, the Company has benefited from certain tax incentives that the Government of India has provided to the export of software for the units registered under the Special Economic Zones Act, 2005 (SEZ). SEZ units which began the provision of services on or after April 1, 2005 are eligible for a deduction of 100 percent of profits or gains derived from the export of services for the first five years from the financial year in which the unit commenced the provision of services and 50 percent of such profits or gains for further five years. Up to 50% of such profits or gains is also available for a further five years subject to creation of a Special Economic Zone Reinvestment Reserve out of the profit for the eligible SEZ units and utilization of such reserve by the Company for acquiring new plant and machinery for the purpose of its business as per the provisions of the Income Tax Act, 1961.
As of June 30, 2017, claims against the group
not acknowledged as debts from the Indian Income tax authorities net of amount paid to statutory authorities of $771 million (4,982
crore) amounted to $230 million (1,489 crore).
As of March 31, 2017, claims against the group
not acknowledged as debts from the Indian Income tax authorities net of amount paid to statutory authorities of $722 million (4,682
crore) amounted to $262 million (1,696 crore).
Claims against the company not acknowledged as debts as on June 30, 2017 include demand from the Indian Income tax authorities for payment of tax including interest upon completion of their tax assessment for fiscal 2007, 2008, 2009, 2010, 2011, 2012 and 2013. Demands were paid to statutory tax authorities in full except for fiscal year 2009, 2011, 2012 and 2013.
Demand for fiscal 2007, 2008 and 2009 includes disallowance of a portion of the deduction claimed by the company under Section 10A of the income Tax Act as determined by the ratio of export turnover to total turnover. The disallowance arose from certain expenses incurred in foreign currency being reduced from export turnover but not reduced from total turnover. Demand for fiscal 2007, 2008, 2009, 2010 and 2011 also includes disallowance of portion of profit earned outside India from the STP units under section 10A of the Income Tax Act and disallowance of profits earned from SEZ units under section 10AA of the Income Tax Act. During the quarter the Company has received the appeal order for fiscal 2007, 2008 and 2009 allowing deduction under section 10AA of the Income Tax Act for the units and deduction of foreign currency expenditure from export and total turnover. The order giving effect for the above mentioned years has not been received. The Company is in the process of filing appeal for fiscal 2007, 2008 and 2009 before Hon'ble Income Tax Appellate tribunal against the issues which are held against the Company by the Commissioner of Income Tax (Appeals) Bangalore. Demand for fiscal 2012 and 2013 includes disallowance of certain expenses incurred in foreign currency being reduced from export turnover but not reduced from total turnover and disallowance of profits earned from SEZ units which commenced operations before April 1, 2009 under section 10AA of the Income Tax Act and also others. The matters for fiscal 2013 is pending before the Commissioner of Income Tax (Appeals) Bangalore. The matter for fiscal 2010, fiscal 2011 and fiscal 2012 is pending before Hon’ble Income Tax Appellate Tribal (ITAT) Bangalore.
The Company is contesting the demand and the management including its tax advisors believes that its position will likely be upheld in the appellate process. The management believes that the ultimate outcome of these proceedings will not have a material adverse effect on the Company's financial position and results of operations.
2.12 Reconciliation of basic and diluted shares used in computing earnings per share
The following is a reconciliation of the equity shares used in the computation of basic and diluted earnings per equity share:
| Three months ended June 30, | ||
| 2017 | 2016 | |
| Basic earnings per equity share - weighted average number of equity shares outstanding(1) | 2,285,657,604 | 2,285,622,329 |
| Effect of dilutive common equivalent shares- share options outstanding | 1,400,544 | 145,793 |
| Diluted earnings per equity share - weighted average number of equity shares and common equivalent shares outstanding | 2,287,058,148 | 2,285,768,122 |
(1) excludes treasury shares
For the three months ended June 30, 2017, 264,886 number of options to purchase equity shares had an anti-dilutive effect.
For the three months ended June 30, 2016 there were no outstanding options to purchase equity shares which had an anti-dilutive effect.
2.13 Related party transactions
Infosys has provided guarantee for performance of certain contracts entered into by its subsidiaries.
Transactions with key management personnel
The following were the changes in key management personnel:-
| • | Gopi Krishnan Radhakrishnan, Acting General Counsel, resigned from the company effective June 24, 2017 |
| • | Inderpreet Sawhney, Group General Counsel and Chief Compliance Officer, appointed as an Executive Officer effective July 14, 2017 |
| • | Sandeep Dadlani, President, resigned from the company effective July 14, 2017 |
The table below describes the compensation to key management personnel which comprise directors and executive officers:
(Dollars in millions)
| Three months ended June 30, | ||
| 2017 | 2016 | |
| Salaries and other employee benefits to whole-time directors and executive officers(1) | 4 | 3 |
| Commission and other benefits to non-executive/ independent directors | 1 | – |
| Total | 5 | 3 |
| (1) | Includes employee stock compensation expense of $2 million and $1 million for the three months ended June 30, 2017 and June 30, 2016, respectively towards key management personnel . Refer to note 2.10 |
Investment in Associate
During the quarter ended June 30, 2017, the Company has written down the entire carrying value of the investment in its associate DWA Nova LLC amounting to $11 million.
2.14 Segment Reporting
IFRS 8 establishes standards for the way that public business enterprises report information about operating segments and related disclosures about products and services, geographic areas, and major customers. The group's operations predominantly relate to providing end-to-end business solutions to enable clients to enhance business performance. Based on the "management approach" as defined in IFRS 8, the Chief Operating Decision Maker (CODM) evaluates the group's performance and allocates resources based on an analysis of various performance indicators by business segments and geographic segments. Accordingly, information has been presented both along business segments and geographic segments. The accounting principles used in the preparation of the financial statements are consistently applied to record revenue and expenditure in individual segments, and are as set out in the significant accounting policies.
Business segments of the Group are primarily enterprises in Financial Services (FS), enterprises in Manufacturing (MFG), enterprises in Retail, Consumer packaged goods and Logistics (RCL), enterprises in the Energy & utilities, Communication and Services (ECS), enterprises in Hi-Tech (Hi-Tech), enterprises in Life Sciences, Healthcare and Insurance (HILIFE) and all other segments. The FS reportable segments has been aggregated to include the Financial Services operating segment and the Finacle operating segment. All other segments represents the operating segments of businesses in India, Japan, China and IPS. Geographic segmentation is based on business sourced from that geographic region and delivered from both on-site and off-shore locations. North America comprises the United States of America, Canada and Mexico, Europe includes continental Europe (both the east and the west), Ireland and the United Kingdom, and the Rest of the World comprising all other places except those mentioned above and India.
Revenue and identifiable operating expenses in relation to segments are categorized based on items that are individually identifiable to that segment. Revenue for “all other segments” represents revenue generated by IPS and revenue generated from customers located in India, Japan and China. Allocated expenses of segments include expenses incurred for rendering services from the Company's offshore software development centres and on-site expenses, which are categorized in relation to the associated turnover of the segment. Certain expenses such as depreciation, which form a significant component of total expenses, are not specifically allocable to specific segments as the underlying assets are used interchangeably. Management believes that it is not practical to provide segment disclosures relating to those costs and expenses, and accordingly these expenses are separately disclosed as "unallocated" and adjusted against the total income of the Group.
Assets and liabilities used in the Group's business are not identified to any of the reportable segments, as these are used interchangeably between segments. Management believes that it is currently not practicable to provide segment disclosures relating to total assets and liabilities since a meaningful segregation of the available data is onerous.
Geographical information on revenue and business segment revenue information is collated based on individual customers invoiced or in relation to which the revenue is otherwise recognized.
2.14.1 Business Segments
Three months ended June 30, 2017 and June 30, 2016
(Dollars in millions)
| FS | MFG | ECS | RCL | HILIFE | Hi-Tech | All other segments | Total | |
| Revenues | 713 | 289 | 614 | 418 | 337 | 192 | 88 | 2,651 |
| 678 | 275 | 554 | 426 | 299 | 197 | 72 | 2,501 | |
| Identifiable operating expenses | 357 | 156 | 306 | 201 | 166 | 105 | 48 | 1,339 |
| 334 | 142 | 262 | 204 | 149 | 102 | 51 | 1,244 | |
| Allocated expenses | 155 | 67 | 142 | 97 | 78 | 45 | 20 | 604 |
| 156 | 66 | 133 | 103 | 72 | 47 | 18 | 595 | |
| Segment profit | 201 | 66 | 166 | 120 | 93 | 42 | 20 | 708 |
| 188 | 67 | 159 | 119 | 78 | 48 | 3 | 662 | |
| Unallocable expenses | 70 | |||||||
| 60 | ||||||||
| Operating profit | 638 | |||||||
| 602 | ||||||||
| Other income, net | 127 | |||||||
| 112 | ||||||||
| Share in associate's profit / (loss) | – | |||||||
| – | ||||||||
| Write-down of investment in associate | (11) | |||||||
| – | ||||||||
| Profit before income taxes | 754 | |||||||
| 714 | ||||||||
| Income tax expense | 213 | |||||||
| 203 | ||||||||
| Net profit | 541 | |||||||
| 511 | ||||||||
| Depreciation and amortisation | 70 | |||||||
| 60 | ||||||||
| Non-cash expenses other than depreciation and amortisation | – | |||||||
| – |
2.14.2 Geographic Segments
Three months ended June 30, 2017 and June 30, 2016
(Dollars in millions)
| North America | Europe | India | Rest of the World | Total | |
| Revenues | 1,621 | 594 | 94 | 342 | 2,651 |
| 1,550 | 576 | 68 | 307 | 2,501 | |
| Identifiable operating expenses | 841 | 309 | 32 | 157 | 1,339 |
| 796 | 275 | 37 | 136 | 1,244 | |
| Allocated expenses | 375 | 137 | 19 | 73 | 604 |
| 373 | 138 | 14 | 70 | 595 | |
| Segment profit | 405 | 148 | 43 | 112 | 708 |
| 381 | 163 | 17 | 101 | 662 | |
| Unallocable expenses | 70 | ||||
| 60 | |||||
| Operating profit | 638 | ||||
| 602 | |||||
| Other income, net | 127 | ||||
| 112 | |||||
| Share in associate's profit / (loss) | – | ||||
| – | |||||
| Write-down of investment in associate | (11) | ||||
| – | |||||
| Profit before income taxes | 754 | ||||
| 714 | |||||
| Income tax expense | 213 | ||||
| 203 | |||||
| Net profit | 541 | ||||
| 511 | |||||
| Depreciation and amortisation | 70 | ||||
| 60 | |||||
| Non-cash expenses other than depreciation and amortisation | – | ||||
| – |
2.14.3 Significant clients
No client individually accounted for more than 10% of the revenues for the three months ended June 30, 2017 and June 30, 2016.
2.15 Break-up of expenses
Cost of sales
(Dollars in millions)
| Three months ended June 30, | ||
| 2017 | 2016 | |
| Employee benefit costs | 1,293 | 1,235 |
| Depreciation and amortisation | 70 | 60 |
| Travelling costs | 61 | 84 |
| Cost of technical sub-contractors | 165 | 137 |
| Cost of software packages for own use | 34 | 27 |
| Third party items bought for service delivery to clients | 34 | 14 |
| Operating lease payments | 12 | 11 |
| Consultancy and professional charges | 2 | 1 |
| Communication costs | 8 | 8 |
| Repairs and maintenance | 11 | 12 |
| Provision for post-sales client support | 2 | 3 |
| Total | 1,692 | 1,592 |
Sales and marketing expenses
(Dollars in millions)
| Three months ended June 30, | ||
| 2017 | 2016 | |
| Employee benefit costs | 104 | 99 |
| Travelling costs | 12 | 15 |
| Branding and marketing | 14 | 17 |
| Operating lease payments | 3 | 2 |
| Consultancy and professional charges | 2 | 2 |
| Communication costs | 1 | 1 |
| Others | 2 | 1 |
| Total | 138 | 137 |
Administrative expenses
(Dollars in millions)
| Three months ended June 30, | ||
| 2017 | 2016 | |
| Employee benefit costs | 57 | 50 |
| Consultancy and professional charges | 34 | 25 |
| Repairs and maintenance | 35 | 38 |
| Power and fuel | 8 | 9 |
| Communication costs | 10 | 9 |
| Travelling costs | 9 | 11 |
| Rates and taxes | 8 | 6 |
| Operating lease payments | 5 | 3 |
| Insurance charges | 2 | 2 |
| Impairment loss recognised/(reversed) on financial assets | 1 | 2 |
| Contributions towards Corporate Social Responsibility | 7 | 7 |
| Others | 7 | 8 |
| Total | 183 | 170 |
2.16 Dividends
The Company declares and pays dividends in Indian rupees. The remittance of dividends outside India is governed by Indian law on foreign exchange and is subject to applicable distribution taxes.
The amount of per share dividend recognized
as distributions to equity shareholders for the three months ended June 30, 2017 and June 30, 2016 was 14.75/- per equity share
(approximately $0.23 per equity share) and 14.25/- per equity share (approximately $0.22 per equity share) respectively.
2.17 Capital allocation policy
The Board, in its meeting on April 13, 2017, reviewed and approved a revised Capital Allocation Policy of the Company after taking into consideration the strategic and operational cash requirements of the Company in the medium term:
The key aspects of the Capital Allocation Policy are:
1. The Company’s current policy is to pay dividends of up to 50% of post-tax profits of the Financial Year. Effective from Financial Year 2018, the Company expects to payout up to 70% of the free cash flow of the corresponding Financial Year in such manner (including by way of dividend and/or share buyback) as may be decided by the Board from time to time, subject to applicable laws and requisite approvals, if any. Free cash flow is defined as net cash provided by operating activities less capital expenditure as per the consolidated statement of cash flows prepared under IFRS. Dividend payout includes dividend distribution tax.
2. Additionally, the Board has identified an
amount of up to 13,000 crore ($2 billion) to be paid out to shareholders during Financial Year 2018, in such manner (including
by way of dividend and/ or share buyback), to be decided by the Board, subject to applicable laws and requisite approvals, if any.
2.18 Share capital and share premium
The Company has only one class of shares referred
to as equity shares having a par value of 5/- each. 11,264,702 and 11,289,514 shares were held by controlled trust, as of June
30, 2017 and March 31, 2017, respectively.
The amount received in excess of the par value has been classified as share premium. Additionally, share-based compensation recognized in net profit in the consolidated statement of comprehensive income is credited to share premium. Amounts have been utilized for bonus issue from share premium account.
The accompanying notes form an integral part of the interim consolidated financial statements
for and on behalf of the Board of Directors of Infosys Limited
| R. Seshasayee Chairman |
Ravi Venkatesan Co- Chairman |
Dr. Vishal Sikka Chief Executive Officer and Managing Director |
U. B. Pravin Rao Chief Operating Officer and Whole-time Director |
| Bengaluru July 14, 2017 |
Roopa Kudva Director |
M. D. Ranganath Chief Financial Officer |
A. G. S. Manikantha Company Secretary |
Exhibit 99.10
IFRS INR Earning Release
Infosys Limited and subsidiaries
(In crore except equity share data)
| Condensed Consolidated Balance Sheets as of | Note | June 30, 2017 | March 31, 2017 |
| ASSETS | |||
| Current assets | |||
| Cash and cash equivalents | 2.1 | 23,117 | 22,625 |
| Current investments | 2.2 | 10,388 | 9,970 |
| Trade receivables | 12,488 | 12,322 | |
| Unbilled revenue | 3,945 | 3,648 | |
| Prepayments and other current assets | 2.4 | 5,312 | 4,856 |
| Derivative financial instruments | 2.3 | 24 | 284 |
| Total current assets | 55,274 | 53,705 | |
| Non-current assets | |||
| Property, plant and equipment | 2.7 | 11,848 | 11,716 |
| Goodwill | 2.8 | 3,701 | 3,652 |
| Intangible assets | 730 | 776 | |
| Investment in associate | 2.13 | – | 71 |
| Non-current investments | 2.2 | 6,061 | 6,382 |
| Deferred income tax assets | 679 | 540 | |
| Income tax assets | 6,076 | 5,716 | |
| Other non-current assets | 2.4 | 756 | 797 |
| Total non-current assets | 29,851 | 29,650 | |
| Total assets | 85,125 | 83,355 | |
| LIABILITIES AND EQUITY | |||
| Current liabilities | |||
| Trade payables | 260 | 367 | |
| Derivative financial instruments | 2.3 | 45 | 2 |
| Current income tax liabilities | 4,539 | 3,885 | |
| Client deposits | 16 | 32 | |
| Unearned revenue | 1,998 | 1,777 | |
| Employee benefit obligations | 1,423 | 1,359 | |
| Provisions | 2.6 | 404 | 405 |
| Other current liabilities | 2.5 | 7,612 | 6,186 |
| Total current liabilities | 16,297 | 14,013 | |
| Non-current liabilities | |||
| Deferred income tax liabilities | 197 | 207 | |
| Other non-current liabilities | 2.5 | 117 | 153 |
| Total liabilities | 16,611 | 14,373 | |
| Equity | |||
| Share capital - 5 par value 240,00,00,000 (240,00,00,000) equity shares authorized, issued and outstanding 2,28,56,79,962 (2,28,56,55,150), net of 1,12,64,702 (1,12,89,514) treasury shares as of June 30, 2017 (March 31, 2017), respectively |
1,144 | 1,144 | |
| Share premium | 2,401 | 2,356 | |
| Retained earnings | 64,149 | 65,056 | |
| Cash flow hedge reserves | (27) | 39 | |
| Other reserves | 329 | – | |
| Other components of equity | 518 | 387 | |
| Total equity attributable to equity holders of the Company | 68,514 | 68,982 | |
| Non-controlling interests | – | – | |
| Total equity | 68,514 | 68,982 | |
| Total liabilities and equity | 85,125 | 83,355 |
The accompanying notes form an integral part of the interim condensed financial statements.
As per our report of even date attached
| for Deloitte Haskins & Sells LLP | for and on behalf of the Board of Directors of Infosys Limited |
| Chartered Accountants | |
| Firm's Registration Number: | |
| 117366W/W-100018 |
|
P. R. Ramesh Partner Membership No. 70928 |
R. Seshasayee Chairman |
Ravi Venkatesan Co-Chairman |
Dr. Vishal Sikka Chief Executive Officer and Managing Director |
U.B. Pravin Rao Chief Operating Officer and Whole-time Director |
|
Bengaluru July 14, 2017 |
Roopa Kudva Director |
M. D. Ranganath Chief Financial Officer |
A.G.S. Manikantha Company Secretary |
Infosys Limited and subsidiaries
(In crore
except equity share and per equity share data)
| Condensed Consolidated Statements of Comprehensive Income | Note | Three months ended June 30, | |
| 2017 | 2016 | ||
| Revenues | 17,078 | 16,782 | |
| Cost of sales | 2.15 | 10,900 | 10,681 |
| Gross profit | 6,178 | 6,101 | |
| Operating expenses: | |||
| Selling and marketing expenses | 2.15 | 888 | 920 |
| Administrative expenses | 2.15 | 1,179 | 1,134 |
| Total operating expenses | 2,067 | 2,054 | |
| Operating profit | 4,111 | 4,047 | |
| Other income, net | 814 | 753 | |
| Share in associate's profit/ (loss) | – | (2) | |
| Write-down of investment in associate | 2.13 | (71) | – |
| Profit before income taxes | 4,854 | 4,798 | |
| Income tax expense | 2.11 | 1,371 | 1,362 |
| Net profit | 3,483 | 3,436 | |
| Other comprehensive income | |||
| Items that will not be reclassified subsequently to profit or loss | |||
| Remeasurement of the net defined benefit liability/asset | (3) | (17) | |
| Cumulative impact on reversal of unrealised gain on quoted debt securities on adoption of IFRS 9 | – | (35) | |
| Equity instruments through other comprehensive income, net | – | – | |
| (3) | (52) | ||
| Items that will be reclassified subsequently to profit or loss | |||
| Fair value changes on derivatives designated as cash flow hedge, net | (66) | – | |
| Exchange differences on translation of foreign operations | 107 | 38 | |
| Fair value changes on investments, net | 2.2 | 27 | – |
| 68 | 38 | ||
| Total other comprehensive income, net of tax | 65 | (14) | |
| Total comprehensive income | 3,548 | 3,422 | |
| Profit attributable to: | |||
| Owners of the Company | 3,483 | 3,436 | |
| Non-controlling interests | – | – | |
| 3,483 | 3,436 | ||
| Total comprehensive income attributable to: | |||
| Owners of the Company | 3,548 | 3,422 | |
| Non-controlling interests | – | – | |
| 3,548 | 3,422 | ||
| Earnings per equity share | |||
| Basic () |
15.24 | 15.03 | |
| Diluted () |
15.23 | 15.03 | |
| Weighted average equity shares used in computing earnings per equity share | 2.12 | ||
| Basic | 228,56,57,604 | 228,56,22,329 | |
| Diluted | 228,70,58,148 | 228,57,68,122 | |
The accompanying notes form an integral part of the interim condensed financial statements.
As per our report of even date attached
| for Deloitte Haskins & Sells LLP | for and on behalf of the Board of Directors of Infosys Limited |
| Chartered Accountants | |
| Firm's Registration Number: | |
| 117366W / W-100018 |
|
P. R. Ramesh Partner Membership No. 70928 |
R. Seshasayee Chairman |
Ravi Venkatesan Co-Chairman |
Dr. Vishal Sikka Chief Executive Officer and Managing Director |
U.B. Pravin Rao Chief Operating Officer and Whole-time Director |
|
Bengaluru July 14, 2017 |
Roopa Kudva Director |
M. D. Ranganath Chief Financial Officer |
A.G.S. Manikantha Company Secretary |
Infosys Limited and subsidiaries
Condensed Consolidated Statement of Changes in Equity
(In crore except equity share
data)
| Shares(1) | Share capital | Share premium | Retained earnings | Other reserves(2) | Other components of equity | Cash flow hedge reserve | Total equity attributable to equity holders of the Company | |
| Balance as of April 1, 2016 | 228,56,21,088 | 1,144 | 2,241 | 57,655 | – | 739 | – | 61,779 |
| Changes in equity for the three months ended June 30, 2016 | ||||||||
| Cumulative impact on reversal of unrealised gain on quoted debt securities on adoption of IFRS 9 (3) | – | – | – | – | – | (35) | – | (35) |
| Shares issued on exercise of employee stock options (Refer note 2.10) | 12,406 | – | – | – | – | – | – | – |
| Employee stock compensation expense (refer to note 2.10) | – | – | 9 | – | – | – | – | 9 |
| Transferred to other reserves | – | – | – | (276) | 276 | – | – | – |
| Transferred from other reserves on utilisation | – | – | – | 276 | (276) | – | – | – |
| Remeasurement of the net defined benefit liability/asset, net of tax effect | – | – | – | – | – | (17) | – | (17) |
| Dividends (including corporate dividend tax) | – | – | – | (3,923) | – | – | – | (3,923) |
| Net profit | – | – | – | 3,436 | – | – | – | 3,436 |
| Exchange differences on translation of foreign operations | – | – | – | – | – | 38 | – | 38 |
| Balance as of June 30, 2016 | 228,56,33,494 | 1,144 | 2,250 | 57,168 | – | 725 | – | 61,287 |
| Balance as of April 1, 2017 | 228,56,55,150 | 1,144 | 2,356 | 65,056 | – | 387 | 39 | 68,982 |
| Changes in equity for the three months ended June 30, 2017 | ||||||||
| Shares issued on exercise of employee stock options (Refer note 2.10) | 24,812 | – | – | – | – | – | – | – |
| Income tax benefit arising on exercise of stock options | – | – | – | – | – | – | – | – |
| Employee stock compensation expense (refer to note 2.10) | – | – | 45 | – | – | – | – | 45 |
| Transferred to other reserves | – | – | – | (483) | 483 | – | – | – |
| Transferred from other reserves on utilisation | – | – | – | 154 | (154) | – | – | – |
| Fair value changes on derivatives designated as cash flow hedge, net (Refer note 2.3) | – | – | – | – | – | – | (66) | (66) |
| Equity instruments through other comprehensive income, net of tax effect (Refer note 2.2) | – | – | – | – | – | – | – | – |
| Fair value changes on investments, net of tax effect (Refer note 2.2) | – | – | – | – | – | 27 | – | 27 |
| Remeasurement of the net defined benefit liability/asset, net of tax effect | – | – | – | – | – | (3) | (3) | |
| Dividends (including corporate dividend tax) | – | – | – | (4,061) | – | – | – | (4,061) |
| Net profit | – | – | – | 3,483 | – | – | – | 3,483 |
| Exchange differences on translation of foreign operations | – | – | – | – | – | 107 | – | 107 |
| Balance as of June 30, 2017 | 2,28,56,79,962 | 1,144 | 2,401 | 64,149 | 329 | 518 | (27) | 68,514 |
| (1) | excludes treasury shares of 1,12,64,702 as of June 30, 2017, 1,12,89,514 as of April 1, 2017, 1,13,11,170 as of June 30, 2016 and 1,13,23,576 as of April 1, 2016, held by consolidated trust. |
| (2) | Represents the Special Economic Zone Re-investment reserve created out of the profit of the eligible SEZ unit in terms of the provisions of Sec 10AA(1)(ii) of Income Tax Act,1961. The reserve should be utilized by the Company for acquiring new plant and machinery for the purpose of its business in terms of the provisions of the Sec 10AA(2) of the Income Tax Act, 1961. |
| (3) | Represents cumulative impact on account of adoption of IFRS 9, recorded in other comprehensive income during the year ended March 31, 2017. The adoption of IFRS 9 did not have a material impact on the financial statements. |
The accompanying notes form an integral part of the interim condensed financial statements.
As per our report of even date attached
| for Deloitte Haskins & Sells LLP | for and on behalf of the Board of Directors of Infosys Limited |
| Chartered Accountants | |
| Firm's Registration Number: | |
| 117366W / W-100018 |
|
P. R. Ramesh Partner Membership No. 70928 |
R. Seshasayee Chairman |
Ravi Venkatesan Co-Chairman |
Dr. Vishal Sikka Chief Executive Officer and Managing Director |
U.B. Pravin Rao Chief Operating Officer and Whole-time Director |
|
Bengaluru July 14, 2017 |
Roopa Kudva Director |
M. D. Ranganath Chief Financial Officer |
A.G.S. Manikantha Company Secretary |
Infosys Limited and subsidiaries
(In crore)
| Condensed Consolidated Statement of Cash Flows | Note | Three months ended June 30, | |
| 2017 | 2016 | ||
| Operating activities: | |||
| Net Profit | 3,483 | 3,436 | |
| Adjustments to reconcile net profit to net cash provided by operating activities: | |||
| Depreciation and amortization | 2.15 | 450 | 400 |
| Income tax expense | 2.11 | 1,371 | 1,362 |
| Income on investments | (240) | (50) | |
| Effect of exchange rate changes on assets and liabilities | (3) | 18 | |
| Impairment loss on financial assets | (4) | 15 | |
| Other adjustments | 65 | 69 | |
| Changes in working capital | |||
| Trade receivables and unbilled revenue | (459) | (818) | |
| Prepayments and other assets | (164) | (852) | |
| Trade payables | (107) | (124) | |
| Client deposits | (16) | (2) | |
| Unearned revenue | 221 | 207 | |
| Other liabilities and provisions | 759 | 122 | |
| Cash generated from operations | 5,356 | 3,783 | |
| Income taxes paid | (1,205) | (744) | |
| Net cash provided by operating activities | 4,151 | 3,039 | |
| Investing activities: | |||
| Expenditure on property, plant and equipment net of sale proceeds, including changes in retention money and capital creditors | (553) | (859) | |
| Loans to employees | 23 | 20 | |
| Deposits placed with corporation | (9) | (60) | |
| Income on investments | 86 | 28 | |
| Payment of contingent consideration pertaining to acquisition of business | 2.9 | (33) | (36) |
| Investment in equity and preference securities | (13) | (26) | |
| Investment in others | (9) | – | |
| Investment in certificates of deposit | (281) | – | |
| Redemption of certificates of deposit | 150 | – | |
| Investment in quoted debt securities | (1) | (5) | |
| Redemption of quoted debt securities | 4 | 4 | |
| Investment in liquid mutual fund units and fixed maturity plan securities | (16,472) | (10,669) | |
| Redemption of liquid mutual fund units and fixed maturity plan securities | 16,774 | 10,183 | |
| Net cash used in investing activities | (334) | (1,420) | |
| Financing activities: | |||
| Payment of dividends | (3,363) | (3,256 | |
| Net cash used in financing activities | (3,363) | (3,256) | |
| Effect of exchange rate changes on cash and cash equivalents | 38 | (10) | |
| Net increase/(decrease) in cash and cash equivalents | 454 | (1,637) | |
| Cash and cash equivalents at the beginning of the period | 2.1 | 22,625 | 32,697 |
| Cash and cash equivalents at the end of the period | 2.1 | 23,117 | 31,050 |
| Supplementary information: | |||
| Restricted cash balance | 2.1 | 601 | 512 |
The accompanying notes form an integral part of the interim condensed financial statements.
As per our report of even date attached
| for Deloitte Haskins & Sells LLP | for and on behalf of the Board of Directors of Infosys Limited |
| Chartered Accountants | |
| Firm's Registration Number: | |
| 117366W / W-100018 |
|
P. R. Ramesh Partner Membership No. 70928 |
R. Seshasayee Chairman |
Ravi Venkatesan Co-Chairman |
Dr. Vishal Sikka Chief Executive Officer and Managing Director |
U.B. Pravin Rao Chief Operating Officer and Whole-time Director |
|
Bengaluru July 14, 2017 |
Roopa Kudva Director |
M. D. Ranganath Chief Financial Officer |
A.G.S. Manikantha Company Secretary |
Notes to the Interim Condensed Consolidated Financial Statements
1. Company Overview and Significant Accounting Policies
1.1 Company overview
Infosys is a leading provider in consulting, technology, outsourcing and next-generation services and software. Along with its subsidiaries, Infosys provides Business IT services (comprising application development and maintenance, independent validation, infrastructure management, engineering services comprising product engineering and life cycle solutions and business process management); Consulting and systems integration services (comprising consulting, enterprise solutions, systems integration and advanced technologies); Products, business platforms and solutions to accelerate intellectual property-led innovation. Its new offerings span areas like digital, big data and analytics, cloud, data and mainframe modernization, cyber security, IoT engineering Services and API & micro services.
Infosys together with its subsidiaries and controlled trusts is herein after referred to as the "Group".
The Company is a public limited company incorporated and domiciled in India and has its registered office at Bengaluru, Karnataka, India. The Company has its primary listings on the BSE Limited and National Stock Exchange of India Limited in India. The Company’s American Depositary Shares (ADS) representing equity shares are also listed on the New York Stock Exchange (NYSE), Euronext London and Euronext Paris.
The Group's interim condensed consolidated financial statements are authorized for issue by the Company's Board of Directors on July 14, 2017.
1.2 Basis of preparation of financial statements
These interim condensed consolidated financial statements have been prepared in accordance with IAS 34, Interim Financial Reporting as issued by the International Accounting Standards Board (IFRS), under the historical cost convention on the accrual basis except for certain financial instruments which have been measured at fair values. Accordingly, these interim condensed consolidated financial statements do not include all the information required for a complete set of financial statements. These interim condensed consolidated financial statements should be read in conjunction with the consolidated financial statements and related notes included in the Company’s annual consolidated financial statements for the year ended March 31, 2017. Accounting policies have been applied consistently to all periods presented in these interim condensed consolidated financial statements
1.3 Basis of consolidation
Infosys consolidates entities which it owns or controls. The interim consolidated financial statements comprise the financial statements of the Company, its controlled trusts, its subsidiaries and associate. Control exists when the parent has power over the entity, is exposed, or has rights, to variable returns from its involvement with the entity and has the ability to affect those returns by using its power over the entity. Power is demonstrated through existing rights that give the ability to direct relevant activities, those which significantly affect the entity's returns. Subsidiaries are consolidated from the date control commences until the date control ceases.
The financial statements of the Group Companies are consolidated on a line-by-line basis and intra-group balances and transactions including unrealized gain / loss from such transactions are eliminated upon consolidation. These financial statements are prepared by applying uniform accounting policies in use at the Group. Non-controlling interests which represent part of the net profit or loss and net assets of subsidiaries that are not, directly or indirectly, owned or controlled by the Company, are excluded.
Associates are entities over which the Group has significant influence but not control. Investments in associates are accounted for using the equity method of accounting. The investment is initially recognized at cost, and the carrying amount is increased or decreased to recognize the investor’s share of the profit or loss of the investee after the acquisition date. The Group’s investment in associates includes goodwill identified on acquisition.
1.4 Use of estimates
The preparation of the financial statements in conformity with IFRS requires management to make estimates, judgments and assumptions. These estimates, judgments and assumptions affect the application of accounting policies and the reported amounts of assets and liabilities, the disclosures of contingent assets and liabilities at the date of the financial statements and reported amounts of revenues and expenses during the period. Application of accounting policies that require critical accounting estimates involving complex and subjective judgments and the use of assumptions in these financial statements have been disclosed in Note 1.5. Accounting estimates could change from period to period. Actual results could differ from those estimates. Appropriate changes in estimates are made as management becomes aware of changes in circumstances surrounding the estimates. Changes in estimates are reflected in the financial statements in the period in which changes are made and, if material, their effects are disclosed in the notes to the interim condensed consolidated financial statements.
1.5 Critical accounting estimates
a. Revenue recognition
The Group uses the percentage-of-completion method in accounting for its fixed-price contracts. Use of the percentage-of-completion method requires the Group to estimate the efforts or costs expended to date as a proportion of the total efforts or costs to be expended. Efforts or costs expended have been used to measure progress towards completion as there is a direct relationship between input and productivity. Provisions for estimated losses, if any, on uncompleted contracts are recorded in the period in which such losses become probable based on the expected contract estimates at the reporting date.
b. Income taxes
The Company's two major tax jurisdictions are India and the U.S., though the Company also files tax returns in other overseas jurisdictions. Significant judgments are involved in determining the provision for income taxes, including amount expected to be paid/recovered for uncertain tax positions. Also refer to Note 2.11.
c. Business combinations and intangible assets
Business combinations are accounted for using IFRS 3 (Revised), Business Combinations. IFRS 3 requires the identifiable intangible assets and contingent consideration to be fair valued in order to ascertain the net fair value of identifiable assets, liabilities and contingent liabilities of the acquiree. Significant estimates are required to be made in determining the value of contingent consideration and intangible assets. These valuations are conducted by independent valuation experts.
d. Property, plant and equipment
Property, plant and equipment represent a significant proportion of the asset base of the Group. The charge in respect of periodic depreciation is derived after determining an estimate of an asset’s expected useful life and the expected residual value at the end of its life. The useful lives and residual values of Group's assets are determined by management at the time the asset is acquired and reviewed periodically, including at each financial year end. The lives are based on historical experience with similar assets as well as anticipation of future events, which may impact their life, such as changes in technology.
e. Impairement of Goodwill
Goodwill is tested for impairment on an annual basis and whenever there is an indication that the recoverable amount of a cash generating unit is less than its carrying amount based on a number of factors including operating results, business plans, future cash flows and economic conditions. The recoverable amount of cash generating units is determined based on higher of value-in-use and fair value less cost to sell. The goodwill impairment test is performed at the level of the cash-generating unit or groups of cash-generating units which are benefitting from the synergies of the acquisition and which represents the lowest level at which goodwill is monitored for internal management purposes.
Market related information and estimates are used to determine the recoverable amount. Key assumptions on which management has based its determination of recoverable amount include estimated long term growth rates, weighted average cost of capital and estimated operating margins. Cash flow projections take into account past experience and represent management’s best estimate about future developments.
1.6 Revenue recognition
The Company derives revenues primarily from software development and related services and from the licensing of software products. Arrangements with customers for software related services are either on a fixed-price, fixed-timeframe or on a time-and-material basis.
Revenue on time-and-material contracts are recognized as the related services are performed and revenue from the end of the last billing to the balance sheet date is recognized as unbilled revenues. Revenue from fixed-price, fixed-timeframe contracts, where there is no uncertainty as to measurement or collectability of consideration, is recognized as per the percentage-of-completion method. When there is uncertainty as to measurement or ultimate collectability, revenue recognition is postponed until such uncertainty is resolved. Efforts or costs expended have been used to measure progress towards completion as there is a direct relationship between input and productivity. Provisions for estimated losses, if any, on uncompleted contracts are recorded in the period in which such losses become probable based on the current contract estimates. Costs and earnings in excess of billings are classified as unbilled revenue while billings in excess of costs and earnings are classified as unearned revenue. Deferred contract costs are amortized over the term of the contract. Maintenance revenue is recognized ratably over the term of the underlying maintenance arrangement.
In arrangements for software development and related services and maintenance services, the Company has applied the guidance in IAS 18, Revenue, by applying the revenue recognition criteria for each separately identifiable component of a single transaction. The arrangements generally meet the criteria for considering software development and related services as separately identifiable components. For allocating the consideration, the Company has measured the revenue in respect of each separable component of a transaction at its fair value, in accordance with principles given in IAS 18. The price that is regularly charged for an item when sold separately is the best evidence of its fair value. In cases where the Company is unable to establish objective and reliable evidence of fair value for the software development and related services, the Company has used a residual method to allocate the arrangement consideration. In these cases the balance of the consideration, after allocating the fair values of undelivered components of a transaction has been allocated to the delivered components for which specific fair values do not exist.
License fee revenues are recognized when the general revenue recognition criteria given in IAS 18 are met. Arrangements to deliver software products generally have three elements: license, implementation and Annual Technical Services (ATS). The Company has applied the principles given in IAS 18 to account for revenues from these multiple element arrangements. Objective and reliable evidence of fair value has been established for ATS. Objective and reliable evidence of fair value is the price charged when the element is sold separately. When other services are provided in conjunction with the licensing arrangement and objective and reliable evidence of their fair values have been established, the revenue from such contracts are allocated to each component of the contract in a manner, whereby revenue is deferred for the undelivered services and the residual amounts are recognized as revenue for delivered elements. In the absence of objective and reliable evidence of fair value for implementation, the entire arrangement fee for license and implementation is recognized using the percentage-of-completion method as the implementation is performed. Revenue from client training, support and other services arising due to the sale of software products is recognized as the services are performed. ATS revenue is recognized ratably over the period in which the services are rendered.
Advances received for services and products are reported as client deposits until all conditions for revenue recognition are met.
The Company accounts for volume discounts and pricing incentives to customers as a reduction of revenue based on the ratable allocation of the discounts/ incentives amount to each of the underlying revenue transaction that results in progress by the customer towards earning the discount/ incentive. Also, when the level of discount varies with increases in levels of revenue transactions, the Company recognizes the liability based on its estimate of the customer's future purchases. If it is probable that the criteria for the discount will not be met, or if the amount thereof cannot be estimated reliably, then discount is not recognized until the payment is probable and the amount can be estimated reliably. The Company recognizes changes in the estimated amount of obligations for discounts in the period in which the change occurs. The discounts are passed on to the customer either as direct payments or as a reduction of payments due from the customer.
The Company presents revenues net of value-added taxes in its statement of comprehensive income.
1.7 Property, plant and equipment
Property, plant and equipment are stated at cost, less accumulated depreciation and impairment, if any. Costs directly attributable to acquisition are capitalized until the property, plant and equipment are ready for use, as intended by management. The Group depreciates property, plant and equipment over their estimated useful lives using the straight-line method. The estimated useful lives of assets are as follows:
| Building | 22-25 years |
| Plant and machinery | 5 years |
| Computer equipment | 3-5 years |
| Furniture and fixtures | 5 years |
| Vehicles | 5 years |
Depreciation methods, useful lives and residual values are reviewed periodically, including at each financial year end. (Refer note 2.7)
Advances paid towards the acquisition of property, plant and equipment outstanding at each balance sheet date and the cost of assets not put to use before such date are disclosed under ‘Capital work-in-progress’. Subsequent expenditures relating to property, plant and equipment is capitalized only when it is probable that future economic benefits associated with these will flow to the Group and the cost of the item can be measured reliably. Repairs and maintenance costs are recognized in net profit in the statement of comprehensive income when incurred. The cost and related accumulated depreciation are eliminated from the financial statements upon sale or retirement of the asset and the resultant gains or losses are recognized in net profit in the statement of comprehensive income. Assets to be disposed off are reported at the lower of the carrying value or the fair value less cost to sell.
1.8 Business combinations
Business combinations have been accounted for using the acquisition method under the provisions of IFRS 3 (Revised), Business Combinations.
The cost of an acquisition is measured at the fair value of the assets transferred, equity instruments issued and liabilities incurred or assumed at the date of acquisition, which is the date on which control is transferred to the Group. The cost of acquisition also includes the fair value of any contingent consideration. Identifiable assets acquired and liabilities and contingent liabilities assumed in a business combination are measured initially at their fair value on the date of acquisition.
Business combinations between entities under common control is outside the scope of IFRS 3 (Revised), Business Combinations and is accounted for at carrying value.
Transaction costs that the Group incurs in connection with a business combination such as finders’ fees, legal fees, due diligence fees, and other professional and consulting fees are expensed as incurred.
1.9 Financial instruments
Effective April 1, 2016, the Group has elected to early adopt IFRS 9 - Financial Instruments considering April 1, 2015 as the date of initial application of the standard even though the stipulated effective date for adoption is April 1, 2018.
As per IFRS 9, the Group has classified its financial assets into the following categories based on the business model for managing those assets and the contractual cash flow characteristics:
| - | Financial assets carried at amortised cost |
| - | Financial assets fair valued through other comprehensive income |
| - | Financial assets fair valued through profit and loss |
The adoption of IFRS 9 did not have any other material impact on the interim condensed consolidated financial statements.
1.9.1 Initial recognition
The Group recognizes financial assets and financial liabilities when it becomes a party to the contractual provisions of the instrument. All financial assets and liabilities are recognized at fair value on initial recognition, except for trade receivables which are initially measured at transaction price. Transaction costs that are directly attributable to the acquisition or issue of financial assets and financial liabilities, that are not at fair value through profit or loss, are added to the fair value on initial recognition. Regular way purchase and sale of financial assets are accounted for at trade date.
1.9.2 Subsequent measurement
a. Non-derivative financial instruments
(i) Financial assets carried at amortised cost
A financial asset is subsequently measured at amortised cost if it is held within a business model whose objective is to hold the asset in order to collect contractual cash flows and the contractual terms of the financial asset give rise on specified dates to cash flows that are solely payments of principal and interest on the principal amount outstanding.
(ii) Financial assets at fair value through other comprehensive income
A financial asset is subsequently measured at fair value through other comprehensive income if it is held within a business model whose objective is achieved by both collecting contractual cash flows and selling financial assets and the contractual terms of the financial asset give rise on specified dates to cash flows that are solely payments of principal and interest on the principal amount outstanding. Further, in cases where the Group has made an irrevocable election based on its business model, for its investments which are classified as equity instruments, the subsequent changes in fair value are recognized in other comprehensive income.
(iii) Financial assets at fair value through profit or loss
A financial asset which is not classified in any of the above categories is subsequently fair valued through profit or loss.
(iv) Financial liabilities
Financial liabilities are subsequently carried at amortized cost using the effective interest method, except for contingent consideration recognized in a business combination which is subsequently measured at fair value through profit and loss. For trade and other payables maturing within one year from the balance sheet date, the carrying amounts approximate fair value due to the short maturity of these instruments.
b. Derivative financial instruments
The Group holds derivative financial instruments such as foreign exchange forward and option contracts to mitigate the risk of changes in exchange rates on foreign currency exposures. The counterparty for these contracts is generally a bank.
(i) Financial assets or financial liabilities, at fair value through profit or loss
This category has derivative financial assets or liabilities which are not designated as hedges.
Although the Group believes that these derivatives constitute hedges from an economic perspective, they may not qualify for hedge accounting under IFRS 9, Financial Instruments. Any derivative that is either not designated a hedge, or is so designated but is ineffective as per IFRS 9, is categorized as a financial asset or financial liability, at fair value through profit or loss.
Derivatives not designated as hedges are recognized initially at fair value and attributable transaction costs are recognized in net profit in the statement of comprehensive income when incurred. Subsequent to initial recognition, these derivatives are measured at fair value through profit or loss and the resulting exchange gains or losses are included in other income. Assets/ liabilities in this category are presented as current assets/current liabilities if they are either held for trading or are expected to be realized within 12 months after the Balance Sheet date.
(ii) Cash flow hedge
The Group designates certain foreign exchange forward and options contracts as cash flow hedges to mitigate the risk of foreign exchange exposure on highly probable forecast cash transactions.
When a derivative is designated as a cash flow hedging instrument, the effective portion of changes in the fair value of the derivative is recognized in other comprehensive income and accumulated in the cash flow hedging reserve. Any ineffective portion of changes in the fair value of the derivative is recognized immediately in the net profit in the statement of comprehensive income. If the hedging instrument no longer meets the criteria for hedge accounting, then hedge accounting is discontinued prospectively. If the hedging instrument expires or is sold, terminated or exercised, the cumulative gain or loss on the hedging instrument recognized in cash flow hedging reserve till the period the hedge was effective remains in cash flow hedging reserve until the forecasted transaction occurs. The cumulative gain or loss previously recognized in the cash flow hedging reserve is transferred to the net profit in the statement of comprehensive income upon the occurrence of the related forecasted transaction. If the forecasted transaction is no longer expected to occur, then the amount accumulated in cash flow hedging reserve is reclassified to net profit in the statement of comprehensive income.
c. Share capital and treasury shares
(i) Ordinary Shares
Ordinary shares are classified as equity. Incremental costs directly attributable to the issuance of new ordinary shares and share options are recognized as a deduction from equity, net of any tax effects.
(ii) Treasury Shares
When any entity within the Group purchases the Company's ordinary shares, the consideration paid including any directly attributable incremental cost is presented as a deduction from total equity, until they are cancelled, sold or reissued. When treasury shares are sold or reissued subsequently, the amount received is recognized as an increase in equity, and the resulting surplus or deficit on the transaction is transferred to/ from share premium.
1.9.3 Derecognition of financial instruments
The Group derecognizes a financial asset when the contractual rights to the cash flows from the financial asset expire or it transfers the financial asset and the transfer qualifies for derecognition under IFRS 9. A financial liability (or a part of a financial liability) is derecognized from the Group's Balance Sheet when the obligation specified in the contract is discharged or cancelled or expires.
1.10 Fair value of financial instruments
In determining the fair value of its financial instruments, the Group uses a variety of methods and assumptions that are based on market conditions and risks existing at each reporting date. The methods used to determine fair value include discounted cash flow analysis, available quoted market prices and dealer quotes. All methods of assessing fair value result in general approximation of value, and such value may never actually be realized.
Refer to Note 2.3 for the disclosure on carrying value and fair value of financial assets and liabilities. For financial assets and liabilities maturing within one year from the balance sheet date and which are not carried at fair value, the carrying amounts approximate fair value due to the short maturity of those instruments.
1.11 Impairment
a. Financial assets
The Group recognizes loss allowances using the expected credit loss (ECL) model for the financial assets which are not fair valued through profit or loss. Loss allowance for trade receivables with no significant financing component is measured at an amount equal to lifetime ECL. For all other financial assets, expected credit losses are measured at an amount equal to the 12-month ECL, unless there has been a significant increase in credit risk from initial recognition in which case those are measured at lifetime ECL. The amount of expected credit losses (or reversal) that is required to adjust the loss allowance at the reporting date to the amount that is required to be recognized is recognized as an impairment gain or loss in profit or loss.
b. Non-financial assets
(i) Goodwill
Goodwill is tested for impairment on an annual basis and whenever there is an indication that goodwill may be impaired, relying on a number of factors including operating results, business plans and future cash flows. For the purpose of impairment testing, goodwill acquired in a business combination is allocated to the Group's cash generating units (CGU) or groups of CGU’s expected to benefit from the synergies arising from the business combination. A CGU is the smallest identifiable group of assets that generates cash inflows that are largely independent of the cash inflows from other assets or group of assets. Impairment occurs when the carrying amount of a CGU including the goodwill, exceeds the estimated recoverable amount of the CGU. The recoverable amount of a CGU is the higher of its fair value less cost to sell and its value-in-use. Value-in-use is the present value of future cash flows expected to be derived from the CGU.
Total impairment loss of a CGU is allocated first to reduce the carrying amount of goodwill allocated to the CGU and then to the other assets of the CGU pro-rata on the basis of the carrying amount of each asset in the CGU. An impairment loss on goodwill is recognized in net profit in the statement of comprehensive income and is not reversed in the subsequent period.
(ii) Intangible assets and property, plant and equipment
Intangible assets and property, plant and equipment are evaluated for recoverability whenever events or changes in circumstances indicate that their carrying amounts may not be recoverable. For the purpose of impairment testing, the recoverable amount (i.e. the higher of the fair value less cost to sell and the value-in-use) is determined on an individual asset basis unless the asset does not generate cash flows that are largely independent of those from other assets. In such cases, the recoverable amount is determined for the CGU to which the asset belongs.
If such assets are considered to be impaired, the impairment to be recognized in net profit in the statement of comprehensive income is measured by the amount by which the carrying value of the assets exceeds the estimated recoverable amount of the asset. An impairment loss is reversed in net profit in the statement of comprehensive income if there has been a change in the estimates used to determine the recoverable amount. The carrying amount of the asset is increased to its revised recoverable amount, provided that this amount does not exceed the carrying amount that would have been determined (net of any accumulated amortization or depreciation) had no impairment loss been recognized for the asset in prior years.
1.12 Employee benefits
1.12.1 Gratuity
The Group provides for gratuity, a defined benefit retirement plan ('the Gratuity Plan') covering eligible employees of Infosys and its Indian subsidiaries. The Gratuity Plan provides a lump-sum payment to vested employees at retirement, death, incapacitation or termination of employment, of an amount based on the respective employee's salary and the tenure of employment with the Group.
Liabilities with regard to the Gratuity Plan are determined by actuarial valuation, performed by an independent actuary, at each balance sheet date using the projected unit credit method. The Company fully contributes all ascertained liabilities to the Infosys Limited Employees' Gratuity Fund Trust (the Trust). In case of Infosys BPO and EdgeVerve, contributions are made to the Infosys BPO's Employees' Gratuity Fund Trust and EdgeVerve Systems Limited Employees' Gratuity Fund Trust, respectively. Trustees administer contributions made to the Trusts and contributions are invested in a scheme with Life Insurance Corporation of India as permitted by Indian law.
The Group recognizes the net obligation of a defined benefit plan in its Balance Sheet as an asset or liability. Gains and losses through re-measurements of the net defined benefit liability/(asset) are recognized in other comprehensive income and not reclassified to profit and loss in subsequent period. The actual return of the portfolio of plan assets, in excess of the yields computed by applying the discount rate used to measure the defined benefit obligation is recognized in other comprehensive income. The effect of any plan amendments are recognized in net profits in the statement of comprehensive income.
1.12.2 Superannuation
Certain employees of Infosys, Infosys BPO and EdgeVerve are participants in a defined contribution plan. The Group has no further obligations to the Plan beyond its monthly contributions which are periodically contributed to a trust fund, the corpus of which is invested with the Life Insurance Corporation of India.
1.12.3 Provident fund
Eligible employees of Infosys receive benefits from a provident fund, which is a defined benefit plan. Both the eligible employee and the Company make monthly contributions to the provident fund plan equal to a specified percentage of the covered employee's salary. The Company contributes a portion to the Infosys Limited Employees' Provident Fund Trust. The trust invests in specific designated instruments as permitted by Indian law. The remaining portion is contributed to the government administered pension fund. The rate at which the annual interest is payable to the beneficiaries by the trust is being administered by the government. The Company has an obligation to make good the shortfall, if any, between the return from the investments of the Trust and the notified interest rate.
In respect of Indian subsidiaries, eligible employees receive benefits from a provident fund, which is a defined contribution plan. Both the eligible employee and the respective companies make monthly contributions to this provident fund plan equal to a specified percentage of the covered employee's salary. Amounts collected under the provident fund plan are deposited in a government administered provident fund. The Companies have no further obligation to the plan beyond its monthly contributions.
1.12.4 Compensated absences
The Group has a policy on compensated absences which are both accumulating and non-accumulating in nature. The expected cost of accumulating compensated absences is determined by actuarial valuation performed by an independent actuary at each Balance Sheet date using projected unit credit method on the additional amount expected to be paid/availed as a result of the unused entitlement that has accumulated at the Balance Sheet date. Expense on non-accumulating compensated absences is recognized in the period in which the absences occur.
1.13 Share-based compensation
The Group recognizes compensation expense relating to share-based payments in net profit using fair-value in accordance with IFRS 2, Share-Based Payment. The estimated fair value of awards is charged to income on a straight-line basis over the requisite service period for each separately vesting portion of the award as if the award was in-substance, multiple awards with a corresponding increase to share premium.
Amendment to IFRS 2:
During the quarter, the Company has early adopted amendment to IFRS 2 which provides specific guidance to measurement of cash-settled awards, modification of cash-settled awards and awards that include a net settlement feature in respect of withholding taxes. The adoption of the amendment did not have any material effect on the consolidated financial statements.
1.14 Earnings per equity share
Basic earnings per equity share is computed by dividing the net profit attributable to the equity holders of the Company by the weighted average number of equity shares outstanding during the period. Diluted earnings per equity share is computed by dividing the net profit attributable to the equity holders of the Company by the weighted average number of equity shares considered for deriving basic earnings per equity share and also the weighted average number of equity shares that could have been issued upon conversion of all dilutive potential equity shares. The dilutive potential equity shares are adjusted for the proceeds receivable had the equity shares been actually issued at fair value (i.e. the average market value of the outstanding equity shares). Dilutive potential equity shares are deemed converted as of the beginning of the period, unless issued at a later date. Dilutive potential equity shares are determined independently for each period presented.
The number of equity shares and potentially dilutive equity shares are adjusted retrospectively for all periods presented for any share splits and bonus shares issues including for changes effected prior to the approval of the financial statements by the Board of Directors.
1.15 Cash Flow Statement
Cash flows are reported using the indirect method, whereby profit for the period is adjusted for the effects of transactions of a non-cash nature, any deferrals or accruals of past or future operating cash receipts or payments and item of income or expenses associated with investing or financing cash flows. The cash flows from operating, investing and financing activities of the Company are segregated.
Amendment to IAS 7:
During the quarter, the Company adopted the amendment to IAS 7, which require the entities to provide disclosures that enable users of financial statements to evaluate changes in liabilities arising from financing activities, including both changes arising from cash flows and non-cash changes, suggesting inclusion of a reconciliation between the opening and closing balances in the Balance Sheet for liabilities arising from financing activities, to meet the disclosure requirement. The adoption of amendment did not have any material effect on the consolidated financial statements.
1.16 Recent accounting pronouncements
1.16.1 Standards issued but not yet effective
IFRS 15 Revenue from Contract with Customers: In May 2014, the International Accounting Standards Board (IASB) issued IFRS 15, Revenue from Contract with Customers. The core principle of the new standard is that an entity should recognize revenue to depict the transfer of promised goods or services to customers in an amount that reflects the consideration to which the entity expects to be entitled in exchange for those goods or services. Further the new standard requires enhanced disclosures about the nature, amount, timing and uncertainty of revenue and cash flows arising from the entity’s contracts with customers.
The standard permits two possible methods of transition:
| • | Retrospective approach - Under this approach the standard will be applied retrospectively to each prior reporting period presented in accordance with IAS 8- Accounting Policies, Changes in Accounting Estimates and Errors |
| • | Retrospectively with cumulative effect of initially applying the standard recognized at the date of initial application (Cumulative catch - up approach) |
The effective date for adoption of IFRS 15 is annual periods beginning on or after January 1, 2018, though early adoption is permitted.
The Group does not plan to early adopt IFRS 15 and will adopt the same on April 1, 2018 by using the full retrospective transition method to restate each prior reporting period presented. The Group derives revenues primarily from software development and related services and from the licensing of software products and is currently evaluating the effect of IFRS 15 on its consolidated financial statements and related disclosures.
IFRS 16 Leases :On January 13, 2016, the International Accounting Standards Board issued the final version of IFRS 16, Leases. IFRS 16 will replace the existing leases Standard, IAS 17 Leases, and related Interpretations. The Standard sets out the principles for the recognition, measurement, presentation and disclosure of leases for both parties to a contract i.e., the lessee and the lessor. IFRS 16 introduces a single lessee accounting model and requires a lessee to recognize assets and liabilities for all leases with a term of more than 12 months, unless the underlying asset is of low value. Currently, operating lease expenses are charged to the statement of comprehensive income. The Standard also contains enhanced disclosure requirements for lessees. IFRS 16 substantially carries forward the lessor accounting requirements in IAS 17.
The effective date for adoption of IFRS 16 is annual periods beginning on or after January 1, 2019, though early adoption is permitted for companies applying IFRS 15 Revenue from Contracts with Customers. The Group is yet to evaluate the requirements of IFRS 16 and the impact on the consolidated financial statements.
IFRIC 22, Foreign currency transactions and advance consideration: On December 8, 2016, the IFRS interpretations committee of the International Accounting Standards Board (IASB) issued IFRS interpretation, IFRIC 22, Foreign currency transactions and Advance consideration which clarifies the date of the transaction for the purpose of determining the exchange rate to use on initial recognition of the related asset, expense or income, when an entity has received or paid advance consideration in a foreign currency. The effective date for adoption of IFRIC 22 is annual reporting periods beginning on or after January 1, 2018, though early adoption is permitted. The Group is currently evaluating the effect of IFRIC 22 on the consolidated financial statements.
IFRIC 23, Uncertainty over Income Tax Treatments: In June 2017, the International Accounting Standards Board (IASB) issued IFRS interpretation IFRIC 23 Uncertainty over Income Tax Treatments which is to be applied while performing the determination of taxable profit (or loss), tax bases, unused tax losses, unused tax credits and tax rates, when there is uncertainty over income tax treatments under IAS 12. According to IFRIC 23, companies need to determine the probability of the relevant tax authority accepting each tax treatment, or group of tax treatments, that the companies have used or plan to use in their income tax filing which has to be considered to compute the most likely amount or the expected value of the tax treatment when determining taxable profit (tax loss), tax bases, unused tax losses, unused tax credits and tax rates.
The standard permits two possible methods of transition:
| - | Full retrospective approach – Under this approach, IFRIC 23 will be applied retrospectively to each prior reporting period presented in accordance with IAS 8 – Accounting Policies, Changes in Accounting Estimates and Errors. |
| - | Retrospectively with cumulative effect of initially applying IFRIC 23 recognized by adjusting equity on initial application, without adjusting comparatives |
| - | The effective date for adoption of IFRIC 23 is annual periods beginning on or after January 1, 2019, though early adoption is permitted. The Group is yet to evaluate the effect of IFRIC 23 on the consolidated financial statements. |
2. Notes to the condensed consolidated interim financial statements
2.1 Cash and cash equivalents
Cash and cash equivalents consist of the following:
(In crore)
| As of | ||
| June 30, 2017 | March 31, 2017 | |
| Cash and bank deposits | 15,493 | 14,889 |
| Deposits with financial institution | 7,624 | 7,736 |
| 23,117 | 22,625 | |
Cash and cash equivalents as of
June 30, 2017 and March 31, 2017 include restricted cash and bank balances of 601 crore and 572 crore, respectively. The restrictions
are primarily on account of cash and bank balances held by irrevocable trusts controlled by the Company, bank balances held as
margin money deposits against guarantees and balances held in unpaid dividend bank accounts.
The deposits maintained by the Group with banks and financial institution comprise of time deposits, which can be withdrawn by the Group at any point without prior notice or penalty on the principal.
The table below provides details of cash and cash equivalents:
(In crore)
| As of | ||
| June 30, 2017 | March 31, 2017 | |
| Current Accounts | ||
| ANZ Bank, Taiwan | 6 | 3 |
| Axis Bank, India | 1 | 1 |
| Axis Bank - Unpaid Dividend Account | 2 | 2 |
| Banamex Bank, Mexico | 2 | 2 |
| Banamex Bank, Mexico (U.S. Dollar account) | 8 | 8 |
| Bank of America, Mexico | 74 | 54 |
| Bank of America, USA | 960 | 1,030 |
| Bank of Baroda, Mauritius | 1 | – |
| Bank Zachodni WBK S.A, Poland | 10 | 4 |
| Bank of Tokyo-Mitsubishi UFJ Ltd., Japan | 2 | – |
| Barclays Bank, UK | 7 | 1 |
| Bank Leumi, Israel (US Dollar account) | 36 | 2 |
| Bank Leumi, Israel | 8 | 11 |
| Bank Leumi, Israel (YEN account) | 2 | – |
| BNP Paribas Bank, Norway | 43 | 17 |
| China Merchants Bank, China | 2 | 9 |
| Citibank N.A, China | 146 | 61 |
| Citibank N.A., China (U.S. Dollar account) | 19 | 11 |
| Citibank N.A., Costa Rica | 2 | 5 |
| Citibank N.A., Australia | 48 | 19 |
| Citibank N.A., Brazil | 20 | 30 |
| Citibank N.A., Dubai | 1 | 1 |
| Citibank N.A., Hungary | 3 | 3 |
| Citibank N.A., India | 2 | 3 |
| Citibank N.A., Japan | 6 | 12 |
| Citibank N.A., New Zealand | 8 | 10 |
| Citibank N.A., Portugal | 2 | 2 |
| Citibank N.A., Singapore | – | 2 |
| Citibank N.A., South Korea | – | 1 |
| Citibank N.A., South Africa | 15 | 9 |
| CitiBank N.A., South Africa (Euro account) | 1 | 1 |
| Citibank N.A., Philippines, (U.S. Dollar account) | – | 1 |
| CitiBank N.A., USA | 92 | 78 |
| Citibank N.A., EEFC (U.S. Dollar account) | 56 | 1 |
| Commerzbank, Germany | 21 | 18 |
| Danske Bank, Sweden | 1 | – |
| Deutsche Bank, India | 11 | 12 |
| Deutsche Bank, Philippines | 4 | 5 |
| Deutsche Bank, Philippines (U.S. Dollar account) | 3 | 4 |
| Deutsche Bank, Poland | 9 | 12 |
| Deutsche Bank, Poland (Euro account) | 3 | 4 |
| Deutsche Bank, EEFC (Australian Dollar account) | 2 | 38 |
| Deutsche Bank, EEFC (Euro account) | 28 | 25 |
| Deutsche Bank, EEFC (Swiss Franc account) | 1 | 2 |
| Deutsche Bank, EEFC (U.S. Dollar account) | 83 | 76 |
| Deutsche Bank, EEFC (United Kingdom Pound Sterling account) | 5 | 10 |
| Deutsche Bank, Belgium | 65 | 10 |
| Deutsche Bank, Malaysia | – | 7 |
| Deutsche Bank, Czech Republic | 10 | 8 |
| Deutsche Bank, Czech Republic (Euro account) | 6 | 7 |
| Deutsche Bank, Czech Republic (U.S. Dollar account) | 29 | 30 |
| Deutsche Bank, France | 9 | 8 |
| Deutsche Bank, Germany | 13 | 48 |
| Deutsche Bank, Netherlands | 9 | 2 |
| Deutsche Bank, Russia | 9 | 3 |
| Deutsche Bank, Russia (U.S. Dollar account) | 8 | 1 |
| Deutsche Bank, Singapore | 1 | 6 |
| Deutsche Bank, Spain | 1 | – |
| Deutsche Bank, Switzerland | 22 | 9 |
| Deutsche Bank, Switzerland (U.S. Dollar account) | – | 1 |
| Deutsche Bank, United Kingdom | 43 | 26 |
| Deutsche Bank, USA | 2 | 12 |
| HDFC Bank-Unpaid dividend account | 2 | 2 |
| HSBC Bank, Brazil | – | 1 |
| HSBC Bank, Hong Kong | 1 | 1 |
| ICICI Bank, India | 47 | 53 |
| ICICI Bank, EEFC (Euro account) | – | 1 |
| ICICI Bank, EEFC (U.S. Dollar account) | 17 | 5 |
| ICICI Bank, EEFC (United Kingdom Pound Sterling account) | 1 | 1 |
| ICICI Bank - Unpaid dividend account | 21 | 13 |
| ING Bank, Belgium | 2 | 2 |
| Nordbanken, Sweden | 20 | 33 |
| Punjab National Bank, India | 13 | 6 |
| Raiffeisen Bank, Czech Republic | 4 | 4 |
| Raiffeisen Bank, Romania | 6 | 4 |
| Royal Bank of Canada, Canada | 118 | 83 |
| Santander Bank, Argentina | 2 | 1 |
| State Bank of India, India | 55 | 7 |
| Silicon Valley Bank, USA | 7 | 4 |
| Silicon Valley Bank, EEFC (U.S. Dollar account) | 1 | – |
| Silicon Valley Bank (Euro account) | 14 | 19 |
| Silicon Valley Bank (United Kingdom Pound Sterling account) | 3 | 2 |
| Union Bank of Switzerland AG | – | 3 |
| Union Bank of Switzerland AG, (Euro account) | – | 4 |
| Union Bank of Switzerland AG, (Hong Kong Dollar account) | 1 | – |
| Wells Fargo Bank N.A., USA | 39 | 33 |
| Westpac, Australia | 1 | 1 |
| Yes Bank, India | 9 | – |
| 2,367 | 2,061 | |
| Deposit Accounts | ||
| Axis Bank | 1,081 | 1,175 |
| Bank BGZ BNP Paribas S.A | 157 | 183 |
| Barclays Bank | 825 | 825 |
| Canara Bank | 259 | 261 |
| Citibank | 148 | 167 |
| Deutsche Bank, Poland | 105 | 71 |
| HDFC Bank | 2,444 | 469 |
| HSBC Bank | 500 | 500 |
| ICICI Bank | 5,425 | 4,869 |
| IDBI Bank | – | 1,750 |
| IDFC Bank | 200 | 200 |
| IndusInd Bank | 191 | 191 |
| Kotak Mahindra Bank | 535 | 535 |
| South Indian Bank | 450 | 450 |
| Standard Chartered Bank | – | 500 |
| Syndicate Bank | 49 | 49 |
| Yes Bank | 757 | 633 |
| 13,126 | 12,828 | |
| Deposits with financial institution | ||
| HDFC Limited, India | 6,924 | 7,036 |
| LIC Housing Finance Limited | 700 | 700 |
| 7,624 | 7,736 | |
| Total | 23,117 | 22,625 |
2.2 Investments
The carrying value of the investments are as follows:
(In crore)
| As of | ||
| June 30, 2017 | March 31, 2017 | |
| (i) Current | ||
| Amortised Cost | ||
| Quoted debt securities | ||
| Cost | 6 | 9 |
| Fair Value through profit and loss | ||
| Liquid mutual funds | ||
| Fair value | 1,560 | 1,803 |
| Fixed Maturity Plan Securuties | ||
| Fair value | 154 | 151 |
| Fair Value through other comprehensive income | ||
| Quoted Debt Securities | ||
| Fair value | 476 | 102 |
| Certificates of deposit | ||
| Fair value | 8,165 | 7,905 |
| Unquoted equity and preference securities | ||
| Fair value | 27 | – |
| 10,388 | 9,970 | |
| (ii) Non-current | ||
| Amortised Cost | ||
| Quoted debt securities | ||
| Cost | 1,898 | 1,898 |
| Fair Value through other comprehensive income | ||
| Quoted debt securities | ||
| Fair value | 3,545 | 3,873 |
| Unquoted equity and preference securities | ||
| Fair value | 147 | 159 |
| Fair Value through profit and loss | ||
| Unquoted convertible promissory note | ||
| Fair value | 11 | 10 |
| Fixed Maturity Plan Securuties | ||
| Fair value | 414 | 407 |
| Others | ||
| Fair value | 46 | 35 |
| 6,061 | 6,382 | |
| Total investments | 16,449 | 16,352 |
| Investments carried at amortised cost | 1,904 | 1,907 |
| Investments carried at fair value through other comprehensive income | 12,360 | 12,039 |
| Investments carried at fair value through profit or loss | 2,185 | 2,406 |
Liquid mutual funds:
The fair value of liquid mutual funds as of
June 30, 2017 was 1,560 crore and as of March 31, 2017 was 1,803 crore. The fair value is based on quoted price.
Fixed maturity plan securities:
The fair value of fixed matutrity plan securities
as of June 30, 2017 was 568 crore and as of March 31, 2017 was 558 crore. The fair value is based on market observable inputs.
Quoted debt securities carried at amortized cost:
Investment in quoted debt securities represents
the investments made in debt securities issued by government and quasi governement organisations.The fair value of quoted debt
securities (including interest accrued) as of June 30, 2017 and March 31, 2017 was 2,222 crore and 2,168 crore, respectively.
The fair value is based on quoted prices and market observable inputs.
Quoted debt securities fair valued through other comprehensive income:
Investment in quoted debt securities represents
investments made in non-convertible debentures issued by government aided institutions. The fair value of non-convertible debentures
(including interest accrued) as of June 30, 2017 and March 31, 2017 was 4,021 crore and 3,975 crore, respectively. The fair value
is based on quoted prices and market observable inputs. The unrealised gain of 28 crore, net of taxes of 2 crore, has been recognized
in other comprehensive income for the three months ended June 30, 2017.
Certificates of deposit
The fair value of certificate of deposits as
of June 30, 2017 was 8,165 crore and as of March 31, 2017 was 7,905 crore. The fair value is based on market observable inputs.
The unrealised loss of 1 crore, net of taxes of less than 1 crore, has been recognized in other comprehensive income for the
three months ended June 30, 2017.
Unquoted equity and preference and other securities:
The fair value is determined using Level 3 inputs like Discounted cash flows, Market multiple method, Option pricing model, etc.
2.3 Financial instruments
Financial instruments by category
The carrying value and fair value of financial instruments by categories as of June 30, 2017 were as follows:
(In crore)
| Amortised cost | Financial assets / liabilities at fair value through profit or loss | Financial assets / liabilities at fair value through OCI | Total carrying value | Total fair value | |||
| Designated upon initial recognition | Mandatory | Equity instruments designated upon initial recognition | Mandatory | ||||
| Assets: | |||||||
| Cash and cash equivalents (Refer Note 2.1) | 23,117 | – | – | – | – | 23,117 | 23,117 |
| Investments (Refer Note 2.2) | |||||||
| Liquid mutual funds | – | – | 1,560 | – | – | 1,560 | 1,560 |
| Fixed maturity plan securities | – | – | 568 | – | – | 568 | 568 |
| Quoted debt securities | 1,904 | – | – | – | 4,021 | 5,925 | 6243* |
| Certificates of deposit | – | – | – | – | 8,165 | 8,165 | 8,165 |
| Unquoted equity and preference securities | – | – | – | 174 | – | 174 | 174 |
| Unquoted investment others | – | – | 46 | – | – | 46 | 46 |
| Unquoted convertible promissory notes | – | – | 11 | – | – | 11 | 11 |
| Trade receivables | 12,488 | – | – | – | – | 12,488 | 12,488 |
| Unbilled revenue | 3,945 | – | – | – | – | 3,945 | 3,945 |
| Prepayments and other assets (Refer to Note 2.4) | 2,960 | – | – | – | – | 2,960 | 2,960 |
| Derivative financial instruments | – | – | 24 | – | – | 24 | 24 |
| Total | 44,414 | – | 2,209 | 174 | 12,186 | 58,983 | |
| Liabilities: | |||||||
| Trade payables | 260 | – | – | – | – | 260 | 260 |
| Derivative financial instruments | – | – | 8 | – | 37 | 45 | 45 |
| Client deposits | 16 | – | – | – | – | 16 | 16 |
| Other liabilities including contingent consideration (Refer to Note 2.5) | 5,614 | – | 41 | – | – | 5,655 | 5,655 |
| Total | 5,890 | – | 49 | – | 37 | 5,976 | |
* On account of fair value changes including interest accrued
The carrying value and fair value of financial instruments by categories as of March 31, 2017 were as follows:
(In crore)
| Amortised cost | Financial assets/ liabilities at fair value through profit or loss | Financial assets/liabilities at fair value through OCI | Total carrying value | Total fair value | |||
| Designated upon initial recognition | Mandatory | Equity instruments designated upon initial recognition | Mandatory | ||||
| Assets: | |||||||
| Cash and cash equivalents (Refer to Note 2.1) | 22,625 | – | – | – | – | 22,625 | 22,625 |
| Investments (Refer to Note 2.2) | |||||||
| Liquid mutual funds | – | – | 1,803 | – | – | 1,803 | 1,803 |
| Fixed maturity plan securities | – | – | 558 | – | – | 558 | 558 |
| Quoted debt securities | 1,907 | – | – | – | 3,975 | 5,882 | 6143* |
| Certificates of deposit | – | – | – | – | 7,905 | 7,905 | 7,905 |
| Unquoted equity and preference securities: | – | – | – | 159 | – | 159 | 159 |
| Unquoted investments others | – | – | 35 | – | – | 35 | 35 |
| Unquoted convertible promissory note | – | – | 10 | – | – | 10 | 10 |
| Trade receivables | 12,322 | – | – | – | – | 12,322 | 12,322 |
| Unbilled revenue | 3,648 | – | – | – | – | 3,648 | 3,648 |
| Prepayments and other assets (Refer to Note 2.4) | 2,658 | – | – | – | – | 2,658 | 2,658 |
| Derivative financial instruments | – | – | 232 | – | 52 | 284 | 284 |
| Total | 43,160 | – | 2,638 | 159 | 11,932 | 57,889 | |
| Liabilities: | |||||||
| Trade payables | 367 | – | – | – | – | 367 | 367 |
| Derivative financial instruments | – | – | 2 | – | – | 2 | 2 |
| Client deposits | 32 | – | – | – | – | 32 | 32 |
| Other liabilities including contingent consideration (Refer to Note 2.5) | 4,941 | – | 85 | – | – | 5,026 | 5,026 |
| Total | 5,340 | – | 87 | – | – | 5,427 | |
* On account of fair value changes including interest accrued
Fair value hierarchy
Level 1- Quoted prices (unadjusted) in active markets for identical assets or liabilities.
Level 2– Inputs other than quoted prices included within Level 1 that are observable for the asset or liability, either directly (i.e. as prices) or indirectly (i.e. derived from prices).
Level 3- Inputs for the assets or liabilities that are not based on observable market data (unobservable inputs).
The fair value hierarchy of assets and liabilities as of June 30, 2017 is as follows:
(In crore)
| As of June 30, 2017 | Fair value measurement at end of the reporting period / year using | |||
| Level 1 | Level 2 | Level 3 | ||
| Assets | ||||
| Investments in liquid mutual fund units (Refer to Note 2.2) | 1,560 | 1,560 | – | – |
| Investments in fixed maturity plan securities (Refer to Note 2.2) | 568 | – | 568 | – |
| Investments in quoted debt securities (Refer to Note 2.2) | 6,243 | 5,494 | 749 | – |
| Investments in certificates of deposit (Refer to Note 2.2) | 8,165 | – | 8,165 | – |
| Investments in equity and preference securities (Refer to Note 2.2) | 174 | – | – | 174 |
| Investment in unquoted investments others (Refer to Note 2.2) | 46 | – | – | 46 |
| Investment in unquoted convertible promissory note (Refer to Note 2.2) | 11 | – | – | 11 |
| Derivative financial instruments - gain on outstanding foreign exchange forward and option contracts | 24 | – | 24 | – |
| Liabilities | ||||
| Derivative financial instruments - loss on outstanding foreign exchange forward and option contracts | 45 | – | 45 | – |
| Liability towards contingent consideration (Refer to Note 2.5)* | 41 | – | – | 41 |
*Discounted $7 million (approximately 45 crore)
at 14%
During the three months ended June 30, 2017, quoted
debt securities of 1,792 crore, were transferred from Level 2 to Level 1 of fair value hierarchy, since these were valued based
on quoted price.
The fair value hierarchy of assets and liabilities measured as of March 31, 2017 is as follows:
(In crore)
| As of March 31, 2017 | Fair value measurement at end of the reporting period / year using | |||
| Level 1 | Level 2 | Level 3 | ||
| Assets | ||||
| Investments in liquid mutual fund units (Refer to Note 2.2) | 1,803 | 1,803 | – | – |
| Investments in fixed maturity plan securities (Refer to Note 2.2) | 558 | – | 558 | – |
| Investments in quoted debt securities (Refer to Note 2.2) | 6,143 | 3,662 | 2,481 | – |
| Investments in certificates of deposit (Refer to Note 2.2) | 7,905 | – | 7,905 | – |
| Investments in equity securities and preference securities(Refer to Note 2.2) | 159 | – | – | 159 |
| Investment in unquoted investments others (Refer to Note 2.2) | 35 | – | – | 35 |
| Investment in unquoted convertible promissory note (Refer to Note 2.2) | 10 | – | – | 10 |
| Derivative financial instruments- gain on outstanding foreign exchange forward and option contracts | 284 | – | 284 | – |
| Liabilities | ||||
| Derivative financial instruments- loss on outstanding foreign exchange forward and option contracts | 2 | – | 2 | – |
| Liability towards contingent consideration (Refer to Note 2.5)* | 85 | – | – | 85 |
* Discounted $14 million (approximately
91 crore) at 14.2%
A one percentage point change in the unobservable inputs used in fair valuation of the contingent consideration does not have a significant impact in its value.
The movement in contingent consideration as of
June 30, 2017 from March 31, 2017 is on account of settlement of contingent consideration of 45 crore and change in discount rates
and passage of time.
Income from financial assets or liabilities is as follows:
(In
crore)
| Three months ended June 30, | ||
| 2017 | 2016 | |
| Interest income from financial assets carried at amortised cost | 427 | 651 |
| Interest income on financial assets fair valued through other comprehensive income | 203 | – |
| Dividend income from investments carried at fair value through profit or loss | 1 | 19 |
| Gain / (loss) on investments carried at fair value through profit or loss | 69 | – |
| 700 | 670 | |
Financial risk management
Financial risk factors
The Group's activities expose it to a variety of financial risks: market risk, credit risk and liquidity risk. The Group's primary focus is to foresee the unpredictability of financial markets and seek to minimize potential adverse effects on its financial performance. The primary market risk to the Group is foreign exchange risk. The Group uses derivative financial instruments to mitigate foreign exchange related risk exposures. The Group's exposure to credit risk is influenced mainly by the individual characteristic of each customer and the concentration of risk from the top few customers.
Market risk
The Group operates internationally and a major portion of the business is transacted in several currencies and consequently the Group is exposed to foreign exchange risk through its sales and services in the United States and elsewhere, and purchases from overseas suppliers in various foreign currencies. The Group holds derivative financial instruments such as foreign exchange forward and option contracts to mitigate the risk of changes in exchange rates on foreign currency exposures. The exchange rate between the Indian rupee and foreign currencies has changed substantially in recent years and may fluctuate substantially in the future. Consequently, the results of the Group’s operations are adversely affected as the rupee appreciates/ depreciates against these currencies.
The following table analyzes foreign currency risk from financial instruments as of June 30, 2017:
(In crore)
| U.S. dollars | Euro | United Kingdom Pound Sterling | Australian dollars | Other currencies | Total | |
| Cash and cash equivalents | 1,392 | 160 | 55 | 156 | 851 | 2,614 |
| Trade receivables | 8,337 | 1,335 | 760 | 648 | 703 | 11,783 |
| Unbilled revenue | 2,172 | 487 | 325 | 147 | 318 | 3,449 |
| Other assets | 383 | 47 | 19 | 14 | 91 | 554 |
| Trade payables | (80) | (36) | (31) | (5) | (82) | (234) |
| Client deposits | (10) | (2) | – | – | (4) | (16) |
| Accrued Expenses | (1,022) | (203) | (170) | (40) | (132) | (1,567) |
| Employee benefit obligations | (565) | (93) | (22) | (154) | (148) | (982) |
| Other liabilities | (861) | (145) | (48) | 26 | (258) | (1,338) |
| Net assets / (liabilities) | 9,746 | 1,550 | 888 | 740 | 1,339 | 14,263 |
The following table analyzes foreign currency risk from financial instruments as of March 31, 2017:
(In crore)
| U.S. dollars | Euro | United Kingdom Pound Sterling | Australian dollars | Other currencies | Total | |
| Cash and cash equivalents | 1,334 | 131 | 36 | 183 | 700 | 2,384 |
| Trade receivables | 8,345 | 1,244 | 775 | 561 | 702 | 11,627 |
| Unbilled revenue | 2,439 | 440 | 325 | 123 | 306 | 3,633 |
| Other assets | 423 | 95 | 47 | 36 | 97 | 698 |
| Trade payables | (115) | (32) | (13) | (5) | (158) | (323) |
| Client deposits | (11) | (3) | (14) | – | (5) | (33) |
| Accrued expenses | (954) | (215) | (140) | (39) | (148) | (1,496) |
| Employee benefit obligations | (556) | (79) | (22) | (150) | (125) | (932) |
| Other liabilities | (608) | (109) | (35) | (22) | (269) | (1,043) |
| Net assets / (liabilities) | 10,297 | 1,472 | 959 | 687 | 1,100 | 14,515 |
For each of the three months ended June 30, 2017 and June 30, 2016, every percentage point depreciation / appreciation in the exchange rate between the Indian rupee and U.S. dollar, has affected the Company's incremental operating margins by approximately 0.49%.
Sensitivity analysis is computed based on the changes in the income and expenses in foreign currency upon conversion into functional currency, due to exchange rate fluctuations between the previous reporting period and the current reporting period.
Derivative financial instruments
The Group holds derivative financial instruments such as foreign exchange forward and option contracts to mitigate the risk of changes in exchange rates on foreign currency exposures. The counterparty for these contracts is generally a bank. These derivative financial instruments are valued based on quoted prices for similar assets and liabilities in active markets or inputs that are directly or indirectly observable in the marketplace.
The following table gives details in respect of outstanding foreign exchange forward and option contracts:
| As of | ||||
| June 30, 2017 | March 31, 2017 | |||
| In million | In crore |
In million | In crore | |
| Derivatives designated as cash flow hedges | ||||
| Forward contracts | ||||
| In Euro | 70 | 516 | 95 | 658 |
| In United Kingdom Pound Sterling | 45 | 377 | 40 | 324 |
| In Australian dollars | 90 | 447 | 130 | 644 |
| Option Contracts | ||||
| In Euro | 65 | 479 | 40 | 277 |
| In United Kingdom Pound Sterling | 10 | 84 | – | – |
| In Australian dollars | 40 | 198 | – | – |
| Other derivatives | ||||
| Forward contracts | ||||
| In U.S. dollars | 566 | 3,655 | 526 | 3,411 |
| In Euro | 91 | 671 | 114 | 786 |
| In United Kingdom Pound Sterling | 97 | 813 | 75 | 609 |
| In Australian dollars | 35 | 174 | 35 | 174 |
| In Swiss Franc | – | – | 10 | 65 |
| In Singapore dollars | 5 | 23 | 5 | 23 |
| In Swedish Krona | 50 | 38 | 50 | 36 |
| In New Zealand dollars | 5 | 24 | – | – |
| In Canadian dollars | 13 | 65 | – | – |
| In Polish Zloty | 37 | 64 | – | – |
| Option Contracts | ||||
| In U.S. dollars | 223 | 1,437 | 195 | 1,265 |
| In Euro | 45 | 332 | 25 | 173 |
| In United Kingdom Pound Sterling | 20 | 167 | 30 | 243 |
| In Canadian dollars | – | – | 13 | 65 |
| Total forwards & options | 9,564 | 8,753 | ||
The Group recognized a net gain of 21 crore on
derivative financial instruments during the three months ended June 30, 2017 and 47 crore during the three months ended June 30,
2016, which are included in other income.
The foreign exchange forward and option contracts mature within twelve months. The table below analyzes the derivative financial instruments into relevant maturity groupings based on the remaining period as of the balance sheet date:
(In crore)
| As of | ||
| June 30, 2017 | March 31, 2017 | |
| Not later than one month | 2,803 | 2,303 |
| Later than one month and not later than three months | 5,075 | 4,316 |
| Later than three months and not later than one year | 1,686 | 2,134 |
| 9,564 | 8,753 | |
During the three months ended June 30, 2017, the Group has designated certain foreign exchange forward contracts as cash flow hedges to mitigate the risk of foreign exchange exposure on highly probable forecast cash transactions. The related hedge transactions for balance in cash flow hedging reserve are expected to occur and reclassified to the statement of comprehensive income within 3 months.
Hedge effectiveness is determined at the inception of the hedge relationship, and through periodic prospective effectiveness assessments to ensure that an economic relationship exists between the hedged item and hedging instrument, including whether the hedging instrument is expected to offset changes in cash flows of hedged items.
If the hedge ratio for risk management purposes is no longer optimal but the risk management objective remains unchanged and the hedge continues to qualify for hedge accounting, the hedge relationship will be rebalanced by adjusting either the volume of the hedging instrument or the volume of the hedged item so that the hedge ratio aligns with the ratio used for risk management purposes. Any hedge ineffectiveness is calculated and accounted for in profit or loss at the time of the hedge relationship rebalancing.
The following table provides the reconciliation of cash flow hedge reserve for the three months ended June 30, 2017:
(In crore)
| Three months ended June 30, 2017 | |
| Balance at the beginning of the period | 39 |
| Gain / (loss) recognised in other comprehensive income during the period | (41) |
| Amount reclassified to revenue during the period | (47) |
| Tax impact on above | 22 |
| Balance at the end of the period | (27) |
The Group offsets a financial asset and a financial liability when it currently has a legally enforceable right to set off the recognized amounts and the Group intends either to settle on a net basis, or to realise the asset and settle the liability simultaneously.
The following table provides quantitative information about offsetting of derivative financial assets and derivative financial liabilities:
(In crore)
| As of | ||||
| June 30, 2017 | March 31, 2017 | |||
| Derivative financial asset |
Derivative financial liability | Derivative financial asset |
Derivative financial liability | |
| Gross amount of recognized financial asset/liability | 45 | (66) | 285 | (3) |
| Amount set off | (21) | 21 | (1) | 1 |
| Net amount presented in balance sheet | 24 | (45) | 284 | (2) |
Credit risk
Credit risk refers to the risk of default on
its obligation by the counterparty resulting in a financial loss. The maximum exposure to the credit risk at the reporting date
is primarily from trade receivables amounting to 12,488 crore and 12,322 crore as of June 30, 2017 and March 31, 2017, respectively
and unbilled revenue amounting to 3,945 crore and 3,648 crore as of June 30, 2017 and March 31, 2017, respectively. Trade receivables
and unbilled revenue are typically unsecured and are derived from revenue earned from customers primarily located in the United
States. Credit risk has always been managed by the Group through credit approvals, establishing credit limits and continuously
monitoring the creditworthiness of customers to which the Group grants credit terms in the normal course of business. On account
of adoption of IFRS 9, the Group uses expected credit loss model to assess the impairment loss or gain. The Group uses a provision
matrix to compute the expected credit loss allowance for trade receivables and unbilled revenues. The provision matrix takes into
account available external and internal credit risk factors such as credit default swap quotes, credit ratings from international
credit rating agencies and the Group's historical experience for customers.
The following table gives details in respect of percentage of revenues generated from top customer and top ten customers:
(In %)
| Three months ended June 30, | ||
| 2017 | 2016 | |
| Revenue from top customer | 3.3 | 3.6 |
| Revenue from top ten customers | 20.0 | 22.2 |
Credit risk exposure
The reversal of allowance for lifetime expected
credit losses on customer balances for the three months ended June 30, 2017 was 4 crore. The allowance for lifetime expected credit
loss on customer balances for the three months ended June 30, 2016 was 15 crore respectively.
(In crore)
| Three months ended | ||
| June 30, 2017 | June 30, 2016 | |
| Balance at the beginning | 411 | 289 |
| Translation differences | 1 | 1 |
| Impairment loss recognised / (reversed) | (4) | 15 |
| Write-offs | (3) | – |
| Balance at the end | 405 | 305 |
The Company’s credit period generally ranges from 30-60 days.
(In crore except otherwise stated)
| As of | ||
| June 30, 2017 | March 31, 2017 | |
| Trade receivables | 12,488 | 12,322 |
| Unbilled revenues | 3,945 | 3,648 |
| Days Sales Outstanding- DSO (days) | 68 | 68 |
Credit risk on cash and cash equivalents is limited as we generally invest in deposits with banks and financial institutions with high credit ratings assigned by international and domestic credit rating agencies. Investments primarily include investment in liquid mutual fund units, fixed maturity plan securities, quoted bonds issued by government and quasi government organizations, non convertible debentures and certificates of deposit.
Liquidity risk
The Group's principal sources of liquidity are cash and cash equivalents and the cash flow that is generated from operations. The Group has no outstanding bank borrowings. The Group believes that the working capital is sufficient to meet its current requirements.
As of June 30, 2017, the Group had a working
capital of 38,977 crore including cash and cash equivalents of 23,117 crore and current investments of 10,388 crore. As of March
31, 2017, the Group had a working capital of 39,692 crore including cash and cash equivalents of 22,625 crore and current investments
of 9,970 crore.
As of June 30, 2017 and March 31, 2017, the
outstanding employee benefit obligations were 1,423 crore and 1,359 crore, respectively, which have been substantially funded.
Accordingly, no liquidity risk is perceived.
The table below provides details regarding the contractual maturities of significant financial liabilities as of June 30, 2017:
(In crore)
| Particulars | Less than 1 year | 1-2 years | 2-4 years | 4-7 years | Total |
| Trade payables | 260 | – | – | – | 260 |
| Client deposits | 16 | – | – | – | 16 |
| Other liabilities (excluding liability towards contingent consideration) (Refer to Note 2.5) | 5,579 | 36 | – | – | 5,615 |
| Liability towards contingent consideration on an undiscounted basis (Refer to Note 2.5) | 45 | – | – | – | 45 |
The table below provides details regarding the contractual maturities of significant financial liabilities as of March 31, 2017:
(In crore)
| Particulars | Less than 1 year | 1-2 years | 2-4 years | 4-7 years | Total |
| Trade payables | 367 | – | – | – | 367 |
| Client deposits | 32 | – | – | – | 32 |
| Other liabilities (excluding liability towards contingent consideration) (Refer to Note 2.5) | 4,911 | 31 | – | – | 4,942 |
| Liability towards contingent consideration on an undiscounted basis (Refer to Note 2.5) | 45 | 46 | – | – | 91 |
2.4 Prepayments and other assets
Prepayments and other assets consist of the following:
(In crore)
| As of | ||
| June 30, 2017 | March 31, 2017 | |
| Current | ||
| Rental deposits | 14 | 9 |
| Security deposits | 7 | 10 |
| Loans to employees | 255 | 272 |
| Prepaid expenses(1) | 502 | 441 |
| Interest accrued and not due | 851 | 576 |
| Withholding taxes and others(1) | 2,016 | 1,886 |
| Advance payments to vendors for supply of goods(1) | 87 | 131 |
| Deposit with corporations | 1,425 | 1,416 |
| Deferred contract cost(1) | 78 | 78 |
| Other assets | 77 | 37 |
| 5,312 | 4,856 | |
| Non-current | ||
| Loans to employees | 23 | 29 |
| Deposit with corporations | 48 | 48 |
| Rental deposits | 171 | 175 |
| Security deposits | 89 | 86 |
| Deferred contract cost(1) | 272 | 284 |
| Prepaid expenses(1) | 114 | 96 |
| Prepaid gratuity(1) | 39 | 79 |
| 756 | 797 | |
| 6,068 | 5,653 | |
| Financial assets in prepayments and other assets | 2,960 | 2,658 |
(1) Non financial assets
Withholding taxes primarily consist of input tax credits. Other assets primarily represent travel advances and other recoverables. Security deposits relate principally to leased telephone lines and electricity supplies. Deferred contract costs are upfront cost incurred for the contract and are amortised over the term of the contract.
Deposit with corporations represents amounts deposited to settle certain employee-related obligations as and when they arise during the normal course of business.
2.5 Other liabilities
Other liabilities comprise the following :
(In crore)
| As of | ||
| June 30, 2017 | March 31, 2017 | |
| Current | ||
| Accrued compensation to employees | 2,304 | 1,881 |
| Accrued expenses | 2,846 | 2,585 |
| Withholding taxes and others(1) | 1,288 | 1,226 |
| Retainage | 202 | 220 |
| Liabilities of controlled trusts | 140 | 145 |
| Deferred income - government grant on land use rights(1) | 1 | 1 |
| Accrued gratutity (1) | 1 | 1 |
| Liability towards contingent consideration (Refer to Note 2.9) | 41 | 45 |
| Tax on dividend (1) | 690 | – |
| Deferred rent (1) | 12 | 2 |
| Others | 87 | 80 |
| 7,612 | 6,186 | |
| Non-current | ||
| Liability towards contingent consideration (Refer to Note 2.9) | – | 40 |
| Accrued compensation to employees | 35 | 30 |
| Deferred income - government grant on land use rights(1) | 42 | 41 |
| Deferred income(1) | 40 | 42 |
| 117 | 153 | |
| 7,729 | 6,339 | |
| Financial liabilities included in other liabilities | 5,655 | 5,026 |
| Financial liability towards contingent consideration on an undiscounted basis - Refer to Note 2.9 | 45 | 91 |
(1) Non financial liabilities
Accrued expenses primarily relates to cost of technical sub-contractors, telecommunication charges, legal and professional charges, brand building expenses, overseas travel expenses and office maintenance. Others include unpaid dividend balances and capital creditors.
2.6 Provisions
Provisions comprise the following:
(In crore)
| As of | ||
| June 30, 2017 | March 31, 2017 | |
| Provision for post sales client support and other provisions | 404 | 405 |
| 404 | 405 | |
Provision for post sales client support and other provisions represents cost associated with providing post sales support services which are accrued at the time of recognition of revenues and are expected to be utilized over a period of 6 months to 1 year. The movement in the provision for post sales client support and other provisions is as follows:
(In crore)
| Three months ended June 30, 2017 | |
| Balance as of April 1, 2017 | 405 |
| Provision recognized / (reversed) | 15 |
| Provision utilized | (15) |
| Translation difference | (1) |
| Balance as of June 30, 2017 | 404 |
Provision for post sales client support and other provisions is included in cost of sales in the statement of comprehensive income.
As of June 30, 2017 and March 31, 2017, claims
against the Company, not acknowledged as debts, net of amounts paid (excluding demands from Indian Income tax authorities- Refer
to Note 2.11) amounted to 301 crore, each.
The Company is subject to legal proceedings and claims, which have arisen in the ordinary course of business. The Company’s management does not reasonably expect that these legal actions, when ultimately concluded and determined, will have a material and adverse effect on the Company’s results of operations or financial condition.
2.7 Property, plant and equipment
Following are the changes in the carrying value of property, plant and equipment for the three months ended June 30, 2017:
(In crore)
| Land | Buildings | Plant and machinery | Computer equipment | Furniture and fixtures | Vehicles | Total | |
| Gross carrying value as of April 1, 2017 | 1,764 | 7,279 | 3,023 | 4,541 | 1,694 | 31 | 18,332 |
| Additions | – | 52 | 56 | 159 | 41 | 2 | 310 |
| Deletions | – | – | (2) | (31) | (2) | (2) | (37) |
| Translation difference | – | 10 | 2 | 5 | 5 | – | 22 |
| Gross carrying value as of June 30, 2017 | 1,764 | 7,341 | 3,079 | 4,674 | 1,738 | 31 | 18,627 |
| Accumulated depreciation as of April 1, 2017 | (27) | (2,440) | (1,952) | (3,052) | (1,093) | (17) | (8,581) |
| Depreciation | (1) | (67) | (100) | (170) | (62) | (1) | (401) |
| Accumulated depreciation on deletions | – | – | 1 | 31 | 2 | 1 | 35 |
| Translation difference | – | – | (1) | (5) | (3) | – | (9) |
| Accumulated depreciation as of June 30, 2017 | (28) | (2,507) | (2,052) | (3,196) | (1,156) | (17) | (8,956) |
| Capital work-in progress as of June 30, 2017 | 2,177 | ||||||
| Carrying value as of June 30, 2017 | 1,736 | 4,834 | 1,027 | 1,478 | 582 | 14 | 11,848 |
| Capital work-in progress as of April 1, 2017 | 1,965 | ||||||
| Carrying value as of April 1, 2017 | 1,737 | 4,839 | 1,071 | 1,489 | 601 | 14 | 11,716 |
Following are the changes in the carrying value of property, plant and equipment for the three months ended June 30, 2016:
(In crore)
| Land | Buildings | Plant and machinery | Computer equipment | Furniture and fixtures | Vehicles | Total | |
| Gross carrying value as of April 1, 2016 | 1,620 | 6,325 | 2,598 | 4,072 | 1,444 | 29 | 16,088 |
| Additions | 9 | 36 | 162 | 184 | 52 | 3 | 446 |
| Deletions | – | – | (3) | (15) | (1) | (1) | (20) |
| Translation difference | – | – | – | – | (1) | – | (1) |
| Gross carrying value as of June 30, 2016 | 1,629 | 6,361 | 2,757 | 4,241 | 1,494 | 31 | 16,513 |
| Accumulated depreciation as of April 1, 2016 | (22) | (2,201) | (1,608) | (2,617) | (986) | (17) | (7,451) |
| Depreciation | (1) | (57) | (90) | (164) | (45) | (1) | (358) |
| Accumulated depreciation on deletions | – | – | 3 | 15 | 1 | 1 | 20 |
| Translation difference | – | – | – | – | 1 | (1) | – |
| Accumulated depreciation as of June 30, 2016 | (23) | (2,258) | (1,695) | (2,766) | (1,029) | (18) | (7,789) |
| Capital work-in progress as of June 30, 2016 | 2,241 | ||||||
| Carrying value as of June 30, 2016 | 1,606 | 4,103 | 1,062 | 1,475 | 465 | 13 | 10,965 |
| Capital work-in progress as of April 1, 2016 | 1,893 | ||||||
| Carrying value as of April 1, 2016 | 1,598 | 4,124 | 990 | 1,455 | 458 | 12 | 10,530 |
Following are the changes in the carrying value of property, plant and equipment for the year ended March 31, 2017:
(In crore)
| Land | Buildings | Plant and machinery | Computer equipment | Furniture and fixtures | Vehicles | Total | |
| Gross carrying value as of April 1, 2016 | 1,620 | 6,325 | 2,598 | 4,072 | 1,444 | 29 | 16,088 |
| Additions | 144 | 981 | 487 | 801 | 379 | 8 | 2,800 |
| Deletions | – | – | (56) | (315) | (113) | (6) | (490) |
| Translation difference | – | (27) | (6) | (17) | (16) | – | (66) |
| Gross carrying value as of March 31, 2017 | 1,764 | 7,279 | 3,023 | 4,541 | 1,694 | 31 | 18,332 |
| Accumulated depreciation as of April 1, 2016 | (22) | (2,201) | (1,608) | (2,617) | (986) | (17) | (7,451) |
| Depreciation | (5) | (239) | (380) | (678) | (210) | (5) | (1,517) |
| Accumulated depreciation on deletions | – | – | 31 | 230 | 92 | 5 | 358 |
| Translation difference | – | – | 5 | 13 | 11 | – | 29 |
| Accumulated depreciation as of March 31, 2017 | (27) | (2,440) | (1,952) | (3,052) | (1,093) | (17) | (8,581) |
| Capital work-in progress as of March 31, 2017 | 1,965 | ||||||
| Carrying value as of March 31, 2017 | 1,737 | 4,839 | 1,071 | 1,489 | 601 | 14 | 11,716 |
| Capital work-in progress as of April 1, 2016 | 1,893 | ||||||
| Carrying value as of April 1, 2016 | 1,598 | 4,124 | 990 | 1,455 | 458 | 12 | 10,530 |
The depreciation expense is included in cost of sales in the consolidated statement of comprehensive income.
Carrying value of land includes 643 crore and
644 crore as of June 30, 2017 and March 31, 2017, respectively, towards deposits paid under certain lease-cum-sale agreements
to acquire land including agreements where the Company has an option to either purchase or renew the properties on expiry of the
lease period. The contractual commitments for capital expenditure were 891 crore and 1,149 crore, as of June 30, 2017 and March
31, 2017, respectively.
2.8 Goodwill
Following is a summary of changes in the carrying amount of goodwill:
(In crore)
| As of | ||
| June 30, 2017 | March 31, 2017 | |
| Carrying value at the beginning | 3,652 | 3,764 |
| Translation differences | 49 | (112) |
| Carrying value at the end | 3,701 | 3,652 |
For the purpose of impairment testing, goodwill acquired in a business combination is allocated to the cash generate units (CGU) or groups of CGU’s, which benefit from the synergies of the acquisition. The chief operating decision maker reviews the goodwill for any impairment at the operating segment level, which is represented through groups of CGU’s.
The following table presents the allocation of goodwill to operating segments as at March 31, 2017:
(In crore)
| Segment | As of |
| March 31, 2017 | |
| Financial services | 826 |
| Manufacturing | 409 |
| Retail, Consumer packaged goods and Logistics | 556 |
| Life Sciences, Healthcare and Insurance | 638 |
| Energy & Utilities, Communication and Services | 765 |
| 3,194 | |
| Operating segments without significant goodwill | 458 |
| Total | 3,652 |
The entire goodwill relating to Infosys BPO’s acquisition of McCamish has been allocated to the Groups of CGU’s which are represented by the Life Sciences, Healthcare and Insurance segment.
The goodwill relating to Infosys Lodestone, Portland, Panaya and Kallidus d.b.a Skava acquisitions has been allocated to the groups of CGU’s which are represented by a majority of the entity’s operating segment.
The entire goodwill relating to Noah acquisition has been allocated to the group of CGU's which is represented by the Energy & Utilities, Communication and Services segment.
The recoverable amount of a CGU is the higher of its fair value less cost to sell and its value-in-use. The fair value of a CGU is determined based on the market capitalization. The value-in-use is determined based on specific calculations. These calculations use pre-tax cash flow projections over a period of five years. An average of the range of each assumption used is mentioned below. As of March 31, 2017, the estimated recoverable amount of the CGU exceeded its carrying amount. The recoverable amount was computed based on the fair value being higher than value-in-use and the carrying amount of the CGU was computed by allocating the net assets to operating segments for the purpose of impairment testing. The key assumptions used for the calculations are as follows:
(in %)
| March 31, 2017 | |
| Long term growth rate | 8-10 |
| Operating margins | 17-20 |
| Discount rate | 14.4 |
The above discount rate is based on the Weighted Average Cost of Capital (WACC) of the Company. These estimates are likely to differ from future actual results of operations and cash flows.
2.9 Business combinations
Noah Consulting LLC
On November 16, 2015, Infosys has acquired 100%
membership interest in Noah Consulting, LLC (Noah), a leading provider of advanced information management consulting services for
the oil and gas industry. The business acquisition was conducted by entering into a share purchase agreement for cash consideration
of $33 million (approximately 216 crore), contingent consideration of upto $5 million (approximately 33 crore on acquisition
date) and an additional consideration of upto $32 million (approximately 212 crore on acquisition date), referred to as retention
bonus, payable to the employees of Noah at each anniversary year following the acquisition date over the next three years, subject
to their continuous employment with the Group at each anniversary. During the year ended March 31, 2016 based on an assessment
of Noah acheiving the targets for the year ended December 31, 2015 and year ended December 31, 2016, the entire contingent consideration
has been reversed in the statement of comprehensive income.
The retention bonus is treated as a post-acquisition
employee remuneration expense as per IFRS 3. For the three months ended June 30, 2017 and June 30, 2016, a post-acquisition employee
remuneration expense of 13 crore and 31 crore, has been recorded in the statement of comprehensive income.
Proposed business transfer
On July 14, 2017, the Board of Directors of Infosys authorized the Company to execute a Business Transfer Agreement and related documents with Noah Consulting LLC, a wholly owned subsidiary, to transfer the business of Noah Consulting LLC to Infosys Limited, subject to securing the requisite regulatory approvals for a consideration based on an independent valuation. The transfer of assets and liabilities between entities under common control will be accounted for at carrying values and will not have any impact on the consolidated financial statements.
Kallidus Inc. (d.b.a Skava)
On June 2, 2015, Infosys acquired 100% of the
voting interests in Kallidus Inc., US (Kallidus), a leading provider of digital experience solutions, including mobile commerce
and in-store shopping experiences to large retail clients and 100% of the voting interests of Skava Systems Private Limited, India,
an affiliate of Kallidus. The business acquisition was conducted by entering into a share purchase agreement for cash consideration
of $91 million (approximately 578 crore) and a contingent consideration of up to $20 million (approximately 128 crore on acquisition
date).
The payment of contingent consideration to sellers of Kallidus is dependent upon the achievement of certain financial targets by Kallidus over a period of 3 years ending on December 31, 2017.
The fair value of contingent consideration is determined by discounting the estimated amount payable to the sellers of Kallidus on achievement of certain financial targets. At acquisition date, the key inputs used in determination of the fair value of contingent consideration are the discount rate of 14% and the probabilities of achievement of the financial targets.
During the three months ended June 30, 2017
contingent consideration of 45 crore was paid to the sellers of Kallidus on the achievement of the certain financial targets.
The balance contingent consideration as of June 30, 2017 and March 31, 2017 is 45 crore and 91 crore respectively, on an undiscounted
basis.
2.10 Employees' Stock Option Plans (ESOP)
2015 Stock Incentive Compensation Plan (the 2015 Plan): On March 31, 2016, pursuant to the approval by the shareholders through postal ballot, the Board has been authorized to introduce, offer, issue and allot share-based incentives to eligible employees of the Company and its subsidiaries under the 2015 Stock Incentive Compensation Plan (the 2015 Plan). The maximum number of shares under the 2015 plan shall not exceed 24,038,883 equity shares (this includes 1,12,23,576 equity shares which are held by the trust towards the 2011 Plan as at March 31, 2016). Out of this 17,038,883 equity shares will be issued as RSUs at par value and 7,000,000 equity shares will be issued as stock options at market price on the date of the grant. These instruments will vest over a period of 4 years and the Company expects to grant the instruments under the 2015 Plan over the period of 4 to 7 years.
Controlled trust holds 1,12,64,702 and 1,12,89,514 shares, as of June 30, 2017 and March 31, 2017, respectively under the 2015 plan, out of which 100,000 equity shares have been earmarked for welfare activities of the employees.
Stock incentives granted to CEO:
Pursuant to the approval from the
shareholders through postal ballot on March 31, 2016, Dr. Vishal Sikka is eligible to receive under the 2015 Plan, an annual grant
of time-based RSUs of fair value $2 million which vest over time, subject to continued service, and an annual grant of performance
based equity and stock options of $5 million subject to achievement of performance targets set by the Board or its committee, which
vest over time. Time based RSUs of fair value of $2 million (approximately 13.42 crore) for financial year 2017 was granted on
August 1, 2016 amounting to 120,700 RSUs in equity shares represented by ADSs.
Based on fiscal 2017 performance evaluation,
the Board, on the recommendations of The Nomination and Remuneration committee, approved on April 13, 2017, performance based equity
and stock options for fiscal 2017 comprising 1,32,483 RSUs amounting to US$ 1.9 million (approximately 12.91 crore) and 3,30,525
ESOPs amounting to US$ 0.96 million (approximately 6.46 crore). Further, the Board, also approved the annual time-based vesting
grant for fiscal 2018 to Dr. Vishal Sikka, comprising of 1,37,741 RSUs amounting to US$2 million (approximately 12.97 crore).These
RSUs and ESOPs have been granted effective May 2, 2017. The exercise price of the RSU's will be equal to the par value of the shares
and the exercise price of the stock options would be the market price as on the date of grant, as approved by the shareholders.
Though the performance based awards for fiscal 2018 and the time based RSU’s for the remaining employment term have not been
granted as of June 30, 2017, in accordance with IFRS 2 Share-based Payment, the Company has recorded employee stock based compensation
expense. The Company has recorded employee stock based compensation expense of 10 crore and 9 crore during the three months ended
June 30, 2017 and June 30, 2016 towards CEO compensation.
Stock incentives granted to COO:
The Nomination and Remuneration Committee
in its meeting held on October 14, 2016 recommended a grant of 27,250 RSUs and 43,000 ESOPs amounting to 4 crore to U.B.Pravin
Rao, under the 2015 Plan and the same was approved by the shareholders through postal ballot on March 31, 2017. These RSUs and
ESOPs have been granted w.e.f May 2, 2017. These RSUs and stock options would vest over a period of 4 years and shall be exercisable
within the period as approved by the Committee. The exercise price of the RSU's will be equal to the par value of the shares and
the exercise price of the stock options would be the market price as on the date of grant, as approved by the shareholders.
Stock incentives granted to KMP (other than CEO and COO)
On November 1, 2016, 245,750 RSUs and 502,550 stock options were granted under the 2015 plan, to key management personnel, excluding CEO and COO, based on fiscal 2016 performance. Additionally, on November 1, 2016, 1,500 RSUs were granted to the Acting General Counsel and the same were outstanding as of June 30, 2017. These RSUs and stock options will vest over a period of 4 years and shall be exercisable within the period as approved by the Committee. The exercise price of the RSUs will be equal to the par value of the shares and the exercise price of the stock options would be the market price as on the date of grant.
During the three months ended June
30, 2017 and June 30, 2016, we recorded an employee stock compensation expense of 12 crore and 9 crore, respectively towards
key managerial personnel including CEO and COO.
Stock incentive granted to other employees:
During fiscal 2017, the Company granted 2,506,740 RSUs and 703,300 ESOPs and 112,210 incentive units (cash settled) to certain eligible employees at mid and senior levels under the 2015 plan. Further, on May 2, 2017, the Company granted 37,090 RSUs (includes equity shares and equity shares represented by ADS) at par value, 73,600 employee stock options (ESOPs) (including equity shares and equity shares represented by ADS) to be exercised at market price at the time of grant, to certain employees at the senior management level. These instruments will vest over a period of 4 years and are subject to continued service.
The Company recorded an employee stock
compensation expense in the statement of profit and loss for the three months ended June 30, 2017 and June 30, 2016 of 46 crore
and 9 crore respectively. Further, the cash settled stock compensation expense (included above) for the three months ended June
30, 2017 and June 30, 2016 was 1 crore and Nil respectively. This comprises of expense pertaining to CEO, COO, other KMP and other
employees. As of June 30, 2017 and March 31, 2017 94,090 and 106,845 incentive units were outstanding (net of forfeitures).
2011 RSU Plan (the 2011 Plan) now called 2015 Stock Incentive Compensation Plan ( the 2015 Plan):The Company had a 2011 RSU Plan which provided for the grant of restricted stock units (RSUs) to eligible employees of the Company. The Board of Directors recommended the establishment of the 2011 Plan to the shareholders on August 30, 2011 and the shareholders approved the recommendation of the Board of Directors on October 17, 2011 through a postal ballot. The maximum aggregate number of shares that may be awarded under the plan was 1,13,34,400 as on date of approval of plan adjusted for bonus shares and the plan was expected to continue in effect for a term of 10 years from the date of initial grant under the plan. Awards have been granted to Dr. Vishal Sikka under the 2011 RSU plan as detailed below. Further the Company has earmarked 1,00,000 equity shares for welfare activities of the employees, approved by the shareholders vide postal ballot which ended on March 31, 2016. The equity shares as of March 31, 2016 held under this plan, i.e. 1,12,23,576 equity shares (this includes the aggregate number of equity shares that may be awarded under the 2011 Plan as reduced by 10,824 equity shares already exercised by Dr. Vishal Sikka and 1,00,000 equity shares which have been earmarked for welfare activities of the employees) have been subsumed under the 2015 Plan.
During the year ended March 31, 2015, the company made a grant of 108,268 restricted stock units (adjusted for bonus issues) to Dr. Vishal Sikka, Chief Executive Officer and Managing Director. The Board in its meeting held on June 22, 2015, on recommendation of Nomination and Remuneration Committee, further granted 1,24,061 RSUs to Dr. Vishal Sikka. These RSUs are vesting over a period of four years from the date of the grant in the proportions specified in the award agreement. The RSUs will vest subject to achievement of certain key performance indicators as set forth in the award agreement for each applicable year of the vesting tranche and continued employment through each vesting date.
The award granted to Dr. Vishal Sikka on June 22, 2015 was modified by the Nomination and remuneration committee on April 14, 2016. There is no modification or change in the total number of RSUs granted or the vesting period (which is four years). The modifications relate to the criteria of vesting for each of the years. Based on the modification, the first tranche of the RSUs will vest subject to achievement of certain key performance indicators for the year ended March 31, 2016. Subsequent vesting of RSU's for each of the remaining years would be subject to continued employment.
The activity in the 2015 Plan (formerly 2011 RSU Plan) for equity-settled share based payment transactions during the three months ended June 30, 2017 and June 30, 2016 is set out below:
| Particulars | Three months ended June 30, 2017 |
Three months ended June 30, 2016 | ||
| Shares arising out of options | Weighted average exercise price () |
Shares arising out of options | Weighted average exercise price () | |
| 2015 Plan: Indian equity shares (RSU - IES) | ||||
| Outstanding at the beginning | 20,03,928 | 5 | 2,21,505 | 5 |
| Granted | 31,750 | 5 | – | – |
| Forfeited and expired | 31,695 | 5 | – | – |
| Exercised | 24,812 | 5 | 12,406 | 5 |
| Outstanding at the end | 19,79,171 | 5 | 2,09,099 | 5 |
| Exercisable at the end | – | – | – | – |
| 2015 Plan: Employee Stock Options (ESOPs- IES) | ||||
| Outstanding at the beginning | 3,09,650 | 998 | – | – |
| Granted | 50,200 | 919 | – | – |
| Forfeited and expired | – | – | – | – |
| Exercised | – | – | – | – |
| Outstanding at the end | 3,59,850 | 987 | – | – |
| Exercisable at the end | – | – | – | – |
| Particulars | Three months ended June 30, 2017 | |
| Shares arising out of options | Weighted average exercise price ($) | |
| 2015 Plan: American Depository Shares (RSU - ADS) | ||
| Outstanding at the beginning | 9,57,445 | 0.07 |
| Granted | 3,02,814 | 0.07 |
| Forfeited and expired | 13,425 | 0.07 |
| Exercised | – | – |
| Outstanding at the end | 12,46,834 | 0.07 |
| Exercisable at the end | – | – |
| 2015 Plan: Employee Stock Options (ESOPs- ADS) | ||
| Outstanding at the beginning | 8,88,000 | 15.26 |
| Granted | 3,96,925 | 14.54 |
| Forfeited and expired | – | – |
| Exercised | – | – |
| Outstanding at the end | 12,84,925 | 15.05 |
| Exercisable at the end | – | – |
There was no activity in 2015 plan during the three months ended June 30, 2016 involving equity shares represented by ADS
During the three months ended June 30,
2017, the weighted average share price of options exercised under the 2015 Plan on the date of exercise was 943/-
During the three months ended June 30,
2016, the weighted average share price of options exercised under the 2015 Plan on the date of exercise was 1,206/-
The following table summarizes information about equity settled RSUs and ESOPs outstanding as of June 30, 2017:
| Options outstanding | |||
| Range of exercise prices per share () |
No. of shares arising out of options | Weighted average remaining contractual life | Weighted average exercise price () |
| 2015 Plan: ADS and IES | |||
| 0 - 5 (RSU) | 32,26,005 | 1.71 | 5.00 |
| 900 - 1100 (ESOP) | 16,44,775 | 6.98 | 974.50 |
| 48,70,780 | 3.49 | 332.38 | |
The following table summarizes information about equity settled RSUs and ESOPs outstanding as of March 31, 2017:
| Options outstanding | |||
| Range of exercise prices per share () |
No. of shares arising out of options | Weighted average remaining contractual life | Weighted average exercise price () |
| 2015 Plan: ADS and IES | |||
| 0 - 5 (RSU) | 29,61,373 | 1.88 | 5.00 |
| 900 - 1100 (ESOP) | 11,97,650 | 7.09 | 1,026.50 |
| 41,59,023 | 3.38 | 299.16 | |
The fair value of each equity settled RSU is estimated on the date of grant using the Black-Scholes-Merton model with the following assumptions:
| Particulars | For options granted in | |||
| Fiscal 2018- Equity Shares-RSU |
Fiscal 2018- Equity shares ESOP |
Fiscal 2018- ADS-RSU |
Fiscal 2018- ADS- ESOP | |
| Weighted average share price () / ($- ADS) |
923 | 923 | 14.52 | 14.52 |
| Exercise price ()/ ($- ADS) |
5.00 | 919 | 0.07 | 14.54 |
| Expected volatility (%) | 21-25 | 25-28 | 23-26 | 25-31 |
| Expected life of the option (years) | 1 - 4 | 3 - 7 | 1 - 4 | 3 - 7 |
| Expected dividends (%) | 2.78 | 2.78 | 2.74 | 2.74 |
| Risk-free interest rate (%) | 6 - 7 | 6 - 7 | 1 - 2 | 1 - 2 |
| Weighted average fair value as on grant date () / ($- ADS) |
857 | 254 | 13.50 | 2.91 |
| Particulars | For options granted in | |||
| Fiscal 2017- Equity Shares-RSU |
Fiscal 2017- Equity shares ESOP |
Fiscal 2017- ADS-RSU |
Fiscal 2017- ADS- ESOP | |
| Weighted average share price () / ($- ADS) |
1,067 | 989 | 15.77 | 15.26 |
| Exercise price ()/ ($- ADS) |
5.00 | 998 | 0.07 | 15.26 |
| Expected volatility (%) | 24-29 | 27-29 | 26-29 | 27-31 |
| Expected life of the option (years) | 1 - 4 | 3 - 7 | 1 - 4 | 3 - 7 |
| Expected dividends (%) | 2.37 | 2.37 | 2.29 | 2.29 |
| Risk-free interest rate (%) | 6- 7 | 6- 7 | 1 - 2 | 1 - 2 |
| Weighted average fair value as on grant date () / ($- ADS) |
1,002 | 285 | 14.84 | 3.46 |
The expected life of the RSU / ESOP is estimated based on the vesting term and contractual term of the RSU / ESOP, as well as expected exercise behaviour of the employee who receives the RSU / ESOP. Expected volatility during the expected term of the RSU / ESOP is based on historical volatility of the observed market prices of the Company's publicly traded equity shares during a period equivalent to the expected term of the RSU / ESOP.
2.11 Income taxes
Income tax expense in the consolidated statement of comprehensive income comprises:
(In crore)
| Three month ended June 30, | ||
| 2017 | 2016 | |
| Current taxes | ||
| Domestic taxes | 1,076 | 1,094 |
| Foreign taxes | 423 | 373 |
| 1,499 | 1,467 | |
| Deferred taxes | ||
| Domestic taxes | (89) | (29) |
| Foreign taxes | (39) | (76) |
| (128) | (105) | |
| Income tax expense | 1,371 | 1,362 |
Income tax expense for the three months ended
June 30, 2017 and June 30, 2016 includes reversals (net of provisions) of 15 crore and provisions (net of reversals) of 8 crore,
respectively, pertaining to prior periods.
Entire deferred income tax for the three months ended June 30, 2017 and June 30, 2016 relates to origination and reversal of temporary differences.
A reconciliation of the income tax provision to the amount computed by applying the statutory income tax rate to the income before income taxes is summarized below:
(In crore)
| Three months ended June 30, | ||
| 2017 | 2016 | |
| Profit before income taxes | 4,854 | 4,798 |
| Enacted tax rates in India | 34.61% | 34.61% |
| Computed expected tax expense | 1,680 | 1,661 |
| Tax effect due to non-taxable income for Indian tax purposes | (597) | (484) |
| Overseas taxes | 223 | 190 |
| Tax provision (reversals), overseas and domestic | (15) | 8 |
| Effect of exempt non-operating income | (17) | (28) |
| Effect of unrecognized deferred tax assets | 72 | (3) |
| Effect of differential overseas tax rates | 9 | 2 |
| Effect of non-deductible expenses | 33 | 32 |
| Additional deduction on research and development expense | (4) | (14) |
| Others | (13) | (2) |
| Income tax expense | 1,371 | 1,362 |
The applicable Indian statutory tax rates for fiscal 2018 and fiscal 2017 is 34.61%, respectively.
During the quarter ended June 30, 2017 and June 30, 2016, the Group has claimed weighted tax deduction on eligible research and development expenditure based on the approval received from Department of Scientific and Industrial Research (DSIR) which was valid upto March 31, 2017. The weighted tax deduction is equal to 150% for quarter ended June 30, 2017 and 200% for quarter ended June 30, 2016 of such expenditure incurred. The Company has applied for renewal of the R&D recognition with DSIR which is pending approval.
The foreign tax expense is due to income taxes payable overseas, principally in the United States. In India, the company has benefited from certain tax incentives that the Government of India has provided to the export of software for the units registered under the Special Economic Zones Act, 2005 (SEZ). SEZ units which began the provision of services on or after April 1, 2005 are eligible for a deduction of 100 percent of profits or gains derived from the export of services for the first five years from the financial year in which the unit commenced the provision of services and 50 percent of such profits or gains for further five years. Up to 50% of such profits or gains is also available for a further five years subject to creation of a Special Economic Zone Reinvestment Reserve out of the profit of the eligible SEZ units and utilization of such reserve by the Company for acquiring new plant and machinery for the purpose of its business as per the provisions of the Income Tax Act, 1961.
As of June 30, 2017 and March 31, 2017, claims
against the group not acknowledged as debts from the Indian Income tax authorities (net of amount paid to statutory authorities
of 4,982 crore and 4,682 crore) amounted to 1,489 crore and 1,696 crore respectively.
Claims against the Company not acknowledged as debts as on June 30, 2017 include demand from the Indian Income tax authorities for payment of tax including interest upon completion of their tax assessment for fiscal 2007, 2008, 2009, 2010, 2011, 2012 and 2013. Demands were paid to statutory tax authorities in full except for fiscal year 2009, 2011, 2012 and 2013.
Demand for fiscal 2007, 2008 and 2009 includes disallowance of a portion of the deduction claimed by the company under Section 10A of the income Tax Act as determined by the ratio of export turnover to total turnover. The disallowance arose from certain expenses incurred in foreign currency being reduced from export turnover but not reduced from total turnover. Demand for fiscal 2007, 2008, 2009, 2010 and 2011 also includes disallowance of portion of profit earned outside India from the STP units under section 10A of the Income Tax Act and disallowance of profits earned from SEZ units under section 10AA of the Income Tax Act. During the quarter, the Company has received the appeal order for fiscal 2007, 2008 and 2009 allowing deduction under section 10AA of the Income Tax Act for the units and deduction of foreign currency expenditure from export and total turnover. The order giving effect for the above mentioned years has not been received. The Company is in the process of filing appeal for fiscal 2007, 2008 and 2009 before Hon'ble Income Tax Appellate tribunal against the issues which are held against the Company by the Commissioner of Income Tax (Appeals) Bangalore. Demand for fiscal 2012 and 2013 includes disallowance of certain expenses incurred in foreign currency being reduced from export turnover but not reduced from total turnover and disallowance of profits earned from SEZ units which commenced operations before April 1, 2009 under section 10AA of the Income Tax Act and also others. The matters for fiscal 2013 is pending before the Commissioner of Income Tax (Appeals) Bangalore. The matter for fiscal 2010, fiscal 2011 and fiscal 2012 is pending before Hon’ble Income Tax Appellate Tribunal (ITAT) Bangalore.
The Company is contesting the demand and the management including its tax advisors believes that its position will likely be upheld in the appellate process. The management believes that the ultimate outcome of these proceedings will not have a material adverse effect on the Company's financial position and results of operations.
2.12 Reconciliation of basic and diluted shares used in computing earnings per share
The following is a reconciliation of the equity shares used in the computation of basic and diluted earnings per equity share:
| Three month ended June 30, | ||
| 2017 | 2016 | |
| Basic earnings per equity share - weighted average number of equity shares outstanding(1) | 228,56,57,604 | 228,56,22,329 |
| Effect of dilutive common equivalent shares - share options outstanding | 14,00,544 | 1,45,793 |
| Diluted earnings per equity share - weighted average number of equity shares and common equivalent shares outstanding | 228,70,58,148 | 228,57,68,122 |
| (1) | excludes treasury shares |
For the three months ended June 30, 2017, 264,886 number of options to purchase equity shares had an anti-dilutive effect. For the three months ended June 30, 2016, there were no outstanding option to purchase equity shares which had an anti-dilutive effect.
2.13 Related party transactions
Infosys has provided guarantee for performance of certain contracts entered into by its subsidiaries.
Transactions with key management personnel
The following were the changes in key management personnel:-
| • | Gopi Krishnan Radhakrishnan, Acting General Counsel, resigned from the company effective
June 24, 2017 |
|
| • | Inderpreet Sawhney, Group General Counsel and Chief Compliance Officer, appointed as an Executive Officer effective July 14, 2017 | |
| • | Sandeep Dadlani, President, resigned from the company effective July 14, 2017 |
The table below describes the compensation to key management personnel which comprise directors and executive officers:
(In crore)
| Three months ended June 30, | ||
| 2017 | 2016 | |
| Salaries and other employee benefits to whole-time directors and executive officers(1) | 26 | 21 |
| Commission and other benefits to non-executive/independent directors | 3 | 3 |
| Total | 29 | 24 |
| (1) | Includes employee stock compensation expense of 12 crore and 9 crore for the
three months ended June 30, 2017 and June 30, 2016, respectively towards key managerial personnel (Refer Note 2.10) |
Investment in Associate
During the quarter ended June 30, 2017, the
Company has written down the entire carrying value of the investment in its associate DWA Nova LLC amounting to 71 crore.
2.14 Segment reporting
IFRS 8 establishes standards for the way that public business enterprises report information about operating segments and related disclosures about products and services, geographic areas, and major customers. The Group's operations predominantly relate to providing end-to-end business solutions to enable clients to enhance business performance. Based on the "management approach" as defined in IFRS 8, the Chief Operating Decision Maker (CODM) evaluates the Group's performance and allocates resources based on an analysis of various performance indicators by business segments and geographic segments. Accordingly, information has been presented both along business segments and geographic segments. The accounting principles used in the preparation of the financial statements are consistently applied to record revenue and expenditure in individual segments, and are as set out in the significant accounting policies.
Business segments of the Group are primarily enterprises in Financial Services (FS), enterprises in Manufacturing (MFG), enterprises in Retail, Consumer packaged goods and Logistics (RCL), enterprises in the Energy & utilities, Communication and Services (ECS), enterprises in Hi-tech (Hi-TECH), enterprises in Life Sciences, Healthcare and Insurance (HILIFE) and all other segments. The FS reportable segments has been aggregated to include the Financial Services operating segment and the Finacle operating segment. All other segments represents the operating segments of businesses in India, Japan, China and IPS. Geographic segmentation is based on business sourced from that geographic region and delivered from both on-site and off-shore locations. North America comprises the United States of America, Canada and Mexico, Europe includes continental Europe (both the east and the west), Ireland and the United Kingdom, and the Rest of the World comprising all other places except those mentioned above and India.
Revenue and identifiable operating expenses in relation to segments are categorized based on items that are individually identifiable to that segment. Revenue for “all other segments” represents revenue generated by IPS and revenue generated from customers located in India, Japan and China. Allocated expenses of segments include expenses incurred for rendering services from the Company's offshore software development centres and on-site expenses, which are categorized in relation to the associated turnover of the segment. Certain expenses such as depreciation, which form a significant component of total expenses, are not specifically allocable to specific segments as the underlying assets are used interchangeably. Management believes that it is not practical to provide segment disclosures relating to those costs and expenses, and accordingly these expenses are separately disclosed as "unallocated" and adjusted against the total income of the Group.
Assets and liabilities used in the Group's business are not identified to any of the reportable segments, as these are used interchangeably between segments. Management believes that it is currently not practicable to provide segment disclosures relating to total assets and liabilities since a meaningful segregation of the available data is onerous.
Geographical information on revenue and business segment revenue information is collated based on individual customers invoiced or in relation to which the revenue is otherwise recognized.
2.14.1 Business segments
Three months ended June 30, 2017 and June 30, 2016
(In
crore)
| Particulars | FS | MFG | ECS | RCL | HILIFE | Hi-TECH | All other segments | Total |
| Revenues | 4,594 | 1,863 | 3,957 | 2,695 | 2,170 | 1,235 | 564 | 17,078 |
| 4,551 | 1,844 | 3,719 | 2,861 | 2,004 | 1,322 | 481 | 16,782 | |
| Identifiable operating expenses | 2,301 | 1,007 | 1,967 | 1,296 | 1,069 | 676 | 309 | 8,625 |
| 2,238 | 949 | 1,757 | 1,370 | 1,000 | 683 | 344 | 8,341 | |
| Allocated expenses | 998 | 432 | 917 | 624 | 503 | 286 | 131 | 3,891 |
| 1,046 | 444 | 896 | 689 | 482 | 318 | 116 | 3,991 | |
| Segment profit | 1,295 | 424 | 1,073 | 775 | 598 | 273 | 124 | 4,562 |
| 1,267 | 451 | 1,066 | 802 | 522 | 321 | 21 | 4,450 | |
| Unallocable expenses | 451 | |||||||
| 403 | ||||||||
| Operating profit | 4,111 | |||||||
| 4,047 | ||||||||
| Other income, net | 814 | |||||||
| 753 | ||||||||
| Share in associate's profit / (loss) | – | |||||||
| (2) | ||||||||
| Write-down of investment in associate | (71) | |||||||
| – | ||||||||
| Profit before income taxes | 4,854 | |||||||
| 4,798 | ||||||||
| Income tax expense | 1,371 | |||||||
| 1,362 | ||||||||
| Net profit | 3,483 | |||||||
| 3,436 | ||||||||
| Depreciation and amortization | 450 | |||||||
| 400 | ||||||||
| Non-cash expenses other than depreciation and amortization | 1 | |||||||
| 3 |
2.14.2 Geographic segments
Three months ended June 30, 2017 and June 30, 2016
(In crore)
| Particulars | North America | Europe | India | Rest of the World | Total |
| Revenues | 10,441 | 3,831 | 605 | 2,201 | 17,078 |
| 10,400 | 3,868 | 457 | 2,057 | 16,782 | |
| Identifiable operating expenses | 5,417 | 1,990 | 209 | 1,009 | 8,625 |
| 5,336 | 1,845 | 247 | 913 | 8,341 | |
| Allocated expenses | 2,415 | 884 | 119 | 473 | 3,891 |
| 2,503 | 928 | 95 | 465 | 3,991 | |
| Segment profit | 2,609 | 957 | 277 | 719 | 4,562 |
| 2,561 | 1,095 | 115 | 679 | 4,450 | |
| Unallocable expenses | 451 | ||||
| 403 | |||||
| Operating profit | 4,111 | ||||
| 4,047 | |||||
| Other income, net | 814 | ||||
| 753 | |||||
| Share in associate's profit / (loss) | – | ||||
| (2) | |||||
| Write-down of investment in associate | (71) | ||||
| – | |||||
| Profit before income taxes | 4,854 | ||||
| 4,798 | |||||
| Income tax expense | 1,371 | ||||
| 1,362 | |||||
| Net profit | 3,483 | ||||
| 3,436 | |||||
| Depreciation and amortization | 450 | ||||
| 400 | |||||
| Non-cash expenses other than depreciation and amortization | 1 | ||||
| 3 |
2.14.3 Significant clients
No client individually accounted for more than 10% of the revenues in the three months ended June 30, 2017 and June 30, 2016.
2.15 Break-up of expenses
Cost of sales
(In crore)
| Three months ended June 30, | ||
| 2017 | 2016 | |
| Employee benefit costs | 8,329 | 8,286 |
| Depreciation and amortization | 450 | 400 |
| Travelling costs | 390 | 566 |
| Cost of Software packages for own use | 218 | 183 |
| Consultancy and professional charges | 13 | 7 |
| Third party items bought for service delivery to clients | 221 | 93 |
| Cost of technical sub-contractors | 1,061 | 917 |
| Operating lease payments | 77 | 73 |
| Communication costs | 54 | 54 |
| Repairs and maintenance | 74 | 77 |
| Provision for post-sales client support | 10 | 21 |
| Others | 3 | 4 |
| Total | 10,900 | 10,681 |
Selling and marketing expenses
(In crore)
| Three months ended June 30, | ||
| 2017 | 2016 | |
| Employee benefit costs | 668 | 661 |
| Travelling costs | 80 | 102 |
| Branding and marketing | 92 | 116 |
| Operating lease payments | 19 | 14 |
| Communication costs | 5 | 5 |
| Consultancy and professional charges | 14 | 12 |
| Others | 10 | 10 |
| Total | 888 | 920 |
Administrative expenses
(In crore)
| Three months ended June 30, | ||
| 2017 | 2016 | |
| Employee benefit costs | 369 | 335 |
| Consultancy and professional charges | 219 | 165 |
| Repairs and maintenance | 228 | 252 |
| Power and fuel | 49 | 63 |
| Communication costs | 67 | 62 |
| Travelling costs | 57 | 72 |
| Impairment loss recognised/(reversed) on financial assets | (2) | 15 |
| Rates and taxes | 49 | 40 |
| Insurance charges | 13 | 14 |
| Operating lease payments | 33 | 22 |
| Commission to non-whole time directors | 3 | 3 |
| Contribution towards Corporate Social Responsibility | 47 | 49 |
| Others | 47 | 42 |
| Total | 1,179 | 1,134 |
2.16 Dividends
The Company declares and pays dividends in Indian rupees. The remittance of dividends outside India is governed by Indian law on foreign exchange and is subject to applicable distribution taxes.
The amount of per share dividend recognized
as distributions to equity shareholders for the three months ended June 30, 2017 and June 30, 2016 was 14.75/- and 14.25/- respectively.
2.17 Capital allocation policy
The Board, in its meeting on April 13, 2017, reviewed and approved a revised Capital Allocation Policy of the Company after taking into consideration the strategic and operational cash requirements of the Company in the medium term:
The key aspects of the Capital Allocation Policy are:
| 1. | The Company’s current policy is to pay dividends of up to 50% of post-tax profits of the Financial Year. Effective from Financial Year 2018, the Company expects to payout up to 70% of the free cash flow of the corresponding Financial Year in such manner (including by way of dividend and/or share buyback) as may be decided by the Board from time to time, subject to applicable laws and requisite approvals, if any. Free cash flow is defined as net cash provided by operating activities less capital expenditure as per the consolidated statement of cash flows prepared under IFRS. Dividend payout includes dividend distribution tax. |
| 2. | Additionally, the Board has identified an amount of up to 13,000 crore ($2 billion)
to be paid out to shareholders during Financial Year 2018, in such manner (including by way of dividend and/ or share buyback),
to be decided by the Board, subject to applicable laws and requisite approvals, if any. |
2.18 Share capital and share premium
The Company has only one class of shares referred
to as equity shares having a par value of 5/- each. 11,264,702 and 11,289,514 shares were held by controlled trust, as of June
30, 2017 and March 31, 2017, respectively.
The amount received in excess of the par value has been classified as share premium. Additionally, share-based compensation recognized in net profit in the consolidated statement of comprehensive income is credited to share premium. Amounts have been utilized for bonus issue from share premium account.
for and on behalf of the Board of Directors of Infosys Limited
| R. Seshasayee | Ravi Venkatesan | Dr. Vishal Sikka | U. B. Pravin Rao |
| Chairman | Co-Chairman | Chief Executive Officer and Managing Director | Chief Operating Officer and Whole-time Director |
| Bengaluru | Roopa Kudva | M. D. Ranganath | A.G.S. Manikantha |
| July 14, 2017 | Director | Chief Financial Officer | Company Secretary |
INDEPENDENT AUDITOR'S REPORT
TO THE BOARD OF DIRECTORS OF INFOSYS LIMITED
Report on the Interim Condensed Consolidated Financial Statements
We have audited the accompanying Interim Condensed Consolidated Financial Statements of INFOSYS LIMITED (“the Company") and its subsidiaries (the Company and its subsidiaries together referred to as "the Group"), which comprise the Condensed Consolidated Balance Sheet as at June 30, 2017, the Condensed Consolidated Statement of Comprehensive Income, the Condensed Consolidated Statement of Changes in Equity, the Condensed Consolidated Statement of Cash Flows, for the three months period then ended, and a summary of the significant accounting policies and other explanatory information (hereinafter referred to as "the interim condensed consolidated financial statements").
Management's Responsibility for the Interim Condensed Consolidated Financial Statements
The Company's Board of Directors are responsible for the preparation of these interim condensed consolidated financial statements that give a true and fair view of the consolidated financial position, consolidated financial performance, consolidated total comprehensive income, consolidated changes in equity and consolidated cash flows of the Group in accordance with International Accounting Standard 34 “Interim Financial Reporting” (“IAS 34”) as issued by the International Accounting Standards Board (“IASB”).
This responsibility also includes maintenance of adequate accounting records, for safeguarding the assets of the Group and for preventing and detecting frauds and other irregularities; the selection and application of appropriate accounting policies; making judgments and estimates that are reasonable and prudent; and the design, implementation and maintenance of adequate internal financial controls, that were operating effectively for ensuring the accuracy and completeness of the accounting records, relevant to the preparation and presentation of the financial statements that give a true and fair view and are free from material misstatement, whether due to fraud or error.
Auditor's Responsibility
Our responsibility is to express an opinion on these interim condensed consolidated financial statements based on our audit.
We conducted our audit in accordance with the Standards on Auditing issued by the Institute of Chartered Accountants of India. Those Standards require that we comply with ethical requirements and plan and perform the audit to obtain reasonable assurance about whether the interim condensed consolidated financial statements are free from material misstatement.
An audit involves performing procedures to obtain audit evidence about the amounts and the disclosures in the interim condensed consolidated financial statements. The procedures selected depend on the auditor's judgment, including the assessment of the risks of material misstatement of the interim condensed consolidated financial statements, whether due to fraud or error. In making those risk assessments, the auditor considers internal financial control relevant to the Company's preparation and presentation of the interim condensed consolidated financial statements that give a true and fair view in order to design audit procedures that are appropriate in the circumstances, but not for the purpose of expressing an opinion on whether the Company has in place an adequate internal financial controls system over financial reporting and the operating effectiveness of such controls. An audit also includes evaluating the appropriateness of the accounting policies used and the reasonableness of the accounting estimates made by the Company's Board of Directors, as well as evaluating the overall presentation of the interim condensed consolidated financial statements.
We believe that the audit evidence obtained by us is sufficient and appropriate to provide a basis for our audit opinion on the interim condensed consolidated financial statements.
Opinion
In our opinion and to the best of our information and according to the explanations given to us, the aforesaid interim condensed consolidated financial statements give a true and fair view in conformity with the aforesaid accounting principles, of the consolidated state of affairs of the Group as at June 30, 2017, and their consolidated profit, consolidated total comprehensive income, consolidated changes in equity and their consolidated cash flows for the three months period ended on that date.
For DELOITTE HASKINS & SELLS LLP
Chartered Accountants
(Firm’s Registration No. 117366W/W-100018)
P. R. RAMESH
Partner
(Membership No.70928)
Bengaluru, July 14, 2017
Exhibit 99.11
Ind AS Standalone
INDEPENDENT AUDITOR’S REPORT
TO THE BOARD OF DIRECTORS OF INFOSYS LIMITED
Report on the Interim Condensed Standalone Financial Statements
We have audited the accompanying Interim Condensed Standalone Financial statements of INFOSYS LIMITED (“the Company”), which comprise the Condensed Balance Sheet as at June 30, 2017, and the Condensed Statement of Profit and Loss (including Other Comprehensive Income), the Condensed Statement of Changes in Equity and the Condensed Statement of Cash Flows for the three months period then ended, and a summary of the significant accounting policies and other explanatory information (hereinafter referred to as "the interim condensed standalone financial statements").
Management’s Responsibility for the Interim Condensed Standalone Financial Statements
The Company’s Board of Directors is responsible for the preparation of these interim condensed standalone financial statements that give a true and fair view of the financial position, financial performance, total comprehensive income, changes in equity and cash flows of the Company in accordance with Indian Accounting Standard 34 “Interim Financial Reporting” (“Ind AS 34”) prescribed under Section 133 of the Companies Act, 2013 (“the Act”), read with relevant rules issued thereunder and other accounting principles generally accepted in India.
This responsibility also includes maintenance of adequate accounting records in accordance with the provisions of the Act for safeguarding the assets of the Company and for preventing and detecting frauds and other irregularities; selection and application of appropriate accounting policies; making judgments and estimates that are reasonable and prudent; and design, implementation and maintenance of adequate internal financial controls, that were operating effectively for ensuring the accuracy and completeness of the accounting records, relevant to the preparation and presentation of the interim condensed standalone financial statements that give a true and fair view and are free from material misstatement, whether due to fraud or error.
Auditor’s Responsibility
Our responsibility is to express an opinion on these interim condensed standalone financial statements based on our audit.
We conducted our audit of the interim condensed standalone financial statements in accordance with the Standards on Auditing specified under Section 143(10) of the Act. Those Standards require that we comply with ethical requirements and plan and perform the audit to obtain reasonable assurance about whether the interim condensed standalone financial statements are free from material misstatement.
An audit involves performing procedures to obtain audit evidence about the amounts and the disclosures in the interim condensed standalone financial statements. The procedures selected depend on the auditor’s judgment, including the assessment of the risks of material misstatement of the interim condensed standalone financial statements, whether due to fraud or error. In making those risk assessments, the auditor considers internal financial control relevant to the Company’s preparation and presentation of the interim condensed standalone financial statements that give a true and fair view in order to design audit procedures that are appropriate in the circumstances, but not for the purpose of expressing an opinion on whether the Company has in place an adequate internal financial controls system over financial reporting and the operating effectiveness of such controls. An audit also includes evaluating the appropriateness of the accounting policies used and the reasonableness of the accounting estimates made by the Company’s Board of Directors, as well as evaluating the overall presentation of the interim condensed standalone financial statements.
We believe that the audit evidence obtained by us, is sufficient and appropriate to provide a basis for our audit opinion on the interim condensed standalone financial statements.
Opinion
In our opinion and to the best of our information and according to the explanations given to us, the aforesaid interim condensed standalone financial statements give a true and fair view in conformity with Ind AS 34 and accounting principles generally accepted in India, of the state of affairs of the Company as at June 30, 2017, and its profit, total comprehensive income, changes in equity and its cash flows for the three months period ended on that date.
For DELOITTE HASKINS & SELLS LLP
Chartered Accountants
(Firm’s Registration No. 117366W/W-100018)
P. R. RAMESH
Partner
(Membership No.70928)
Bengaluru, July 14, 2017
INFOSYS LIMITED
In crore
| Condensed Balance Sheet as at | Note | June 30, 2017 | March 31, 2017 |
| ASSETS | |||
| Non-current assets | |||
| Property, plant and equipment | 2.1 | 8,519 | 8,605 |
| Capital work-in-progress | 1,507 | 1,247 | |
| Intangible assets | – | – | |
| Financial assets | |||
| Investments | 2.2 | 15,124 | 15,334 |
| Loans | 2.3 | 4 | 5 |
| Other financial assets | 2.4 | 215 | 216 |
| Deferred tax assets (net) | 462 | 346 | |
| Other non-current assets | 2.7 | 888 | 996 |
| Income tax assets (net) | 5,754 | 5,454 | |
| Total non - current Assets | 32,473 | 32,203 | |
| Current assets | |||
| Financial assets | |||
| Investments | 2.2 | 9,793 | 9,643 |
| Trade receivables | 2.5 | 11,262 | 10,960 |
| Cash and cash equivalents | 2.6 | 19,360 | 19,153 |
| Loans | 2.3 | 294 | 310 |
| Other financial assets | 2.4 | 5,597 | 5,403 |
| Other current assets | 2.7 | 2,426 | 2,213 |
| Total current assets | 48,732 | 47,682 | |
| Total Assets | 81,205 | 79,885 | |
| EQUITY AND LIABILITIES | |||
| Equity | |||
| Equity share capital | 2.9 | 1,148 | 1,148 |
| Other equity | 66,208 | 66,869 | |
| Total equity | 67,356 | 68,017 | |
| LIABILITIES | |||
| Non-current liabilities | |||
| Financial liabilities | |||
| Other financial liabilities | 2.10 | – | 40 |
| Other non-current liabilities | 2.12 | 40 | 42 |
| Deferred tax liabilities (net) | 3 | – | |
| Total non - current liabilities | 43 | 82 | |
| Current liabilities | |||
| Financial liabilities | |||
| Trade payables | 2.11 | 485 | 269 |
| Other financial liabilities | 2.10 | 5,316 | 5,056 |
| Other current liabilities | 2.12 | 3,254 | 2,349 |
| Provisions | 2.13 | 344 | 350 |
| Income tax liabilities (net) | 4,407 | 3,762 | |
| Total current liabilities | 13,806 | 11,786 | |
| Total equity and liabilities | 81,205 | 79,885 |
The accompanying notes form an integral part of the interim condensed financial statements.
As per our report of even date attached
| for Deloitte Haskins & Sells LLP | for and on behalf of the Board of Directors of Infosys Limited |
| Chartered Accountants | |
| Firm's Registration Number: | |
| 117366W/W-100018 |
|
P. R. Ramesh Partner Membership No. 70928 |
R. Seshasayee Chairman |
Ravi Venkatesan Co-Chairman |
Dr. Vishal Sikka Chief Executive Officer and Managing Director |
U.B. Pravin Rao Chief Operating Officer and Whole-time Director |
|
Bengaluru July 14, 2017 |
Roopa Kudva Director |
M. D. Ranganath Chief Financial Officer |
A.G.S. Manikantha Company Secretary |
INFOSYS LIMITED
In crore, except equity share and
per equity share data
| Condensed Statement of Profit and Loss for the | Note | Three months ended June 30, | |
| 2017 | 2016 | ||
| Revenue from operations | 2.15 | 14,971 | 14,420 |
| Other income, net | 2.16 | 723 | 761 |
| Total income | 15,694 | 15,181 | |
| Expenses | |||
| Employee benefit expenses | 2.17 | 7,752 | 7,605 |
| Cost of technical sub-contractors | 1,334 | 1,135 | |
| Travel expenses | 391 | 576 | |
| Cost of software packages and others | 2.17 | 314 | 224 |
| Communication expenses | 83 | 82 | |
| Consultancy and professional charges | 185 | 119 | |
| Depreciation and amortisation expense | 2.1 | 343 | 319 |
| Other expenses | 2.17 | 576 | 661 |
| Total expenses | 10,978 | 10,721 | |
| Profit before tax | 4,716 | 4,460 | |
| Tax expense: | |||
| Current tax | 2.14 | 1,394 | 1,314 |
| Deferred tax | 2.14 | (93) | (34) |
| Profit for the period | 3,415 | 3,180 | |
| Other comprehensive income | |||
| Items that will not be reclassified subsequently to profit or loss | |||
| Remeasurement of the net defined benefit liability/asset | (2) | (17) | |
| Equity instruments through other comprehensive income, net | 2.2 & 2.14 | – | – |
| Items that will be reclassified subsequently to profit or loss | |||
| Fair value changes on derivatives designated as cash flow hedge, net | (66) | – | |
| Fair value changes on investments, net | 2.2 | 25 | – |
| Total other comprehensive income, net of tax | (43) | (17) | |
| Total comprehensive income for the period | 3,372 | 3,163 | |
| Earnings per equity share | |||
| Equity shares of par value In 5/- each |
|||
| Basic (In ) |
14.87 | 13.85 | |
| Diluted (In ) |
14.86 | 13.85 | |
| Weighted average equity shares used in computing earnings per equity share | |||
| Basic | 2.18 | 2,296,944,664 | 2,296,944,664 |
| Diluted | 2.18 | 2,297,491,678 | 2,296,944,664 |
The accompanying notes form an integral part of the interim condensed financial statements.
As per our report of even date attached
| for Deloitte Haskins & Sells LLP | for and on behalf of the Board of Directors of Infosys Limited |
| Chartered Accountants | |
| Firm's Registration Number: | |
| 117366W/W-100018 |
|
P. R. Ramesh Partner Membership No. 70928 |
R. Seshasayee Chairman |
Ravi Venkatesan Co-Chairman |
Dr. Vishal Sikka Chief Executive Officer and Managing Director |
U.B. Pravin Rao Chief Operating Officer and Whole-time Director |
|
Bengaluru July 14, 2017 |
Roopa Kudva Director |
M. D. Ranganath Chief Financial Officer |
A.G.S. Manikantha Company Secretary |
INFOSYS LIMITED
Condensed Statement of Changes in Equity
In
crore
| Particulars | Equity Share Capital | Other Equity | Total equity attributable to equity holders of the Company | |||||||||
| Reserves & Surplus | Other comprehensive income | |||||||||||
| Securities premium reserve |
Retained earnings | Capital reserve | General reserve | Share Options Outstanding Account | Special Economic Zone Re-investment reserve(1) | Business transfer adjustment reserve(2) | Equity Instruments through other comprehensive income | Cash flow hedge reserve | Other items of other comprehensive income | |||
| Balance as of April 1, 2016 | 1,148 | 2,204 | 44,698 | 54 | 9,508 | 9 | – | 3,448 | – | – | 13 | 61,082 |
| Changes in equity for the three month ended June 30, 2016 | ||||||||||||
| Transfer to general reserve | – | – | (1,579) | – | 1,579 | – | – | – | – | – | – | – |
| Transferred to Special Economic Zone Re-investment reserve | – | – | (276) | – | – | – | 276 | – | – | – | – | – |
| Transferred from Special Economic Zone Re-investment reserve on utilization | – | – | 276 | – | – | – | (276) | – | – | – | – | – |
| Exercise of stock options (refer to note 2.9) | – | 1 | – | – | – | (1) | – | – | – | – | – | – |
| Income tax benefit arising on exercise of stock options | – | – | – | – | – | – | – | – | – | – | – | – |
| Share based payment to employees of the group (refer to note 2.9) | – | – | – | – | – | 9 | – | – | – | – | – | 9 |
| Remeasurement of the net defined benefit liability/asset, net of tax effect | – | – | – | – | – | – | – | – | – | – | (17) | (17) |
| Dividends (including corporate dividend tax) | – | – | (3,939) | – | – | – | – | – | – | – | – | (3,939) |
| Profit for the period | – | – | 3,180 | – | – | – | – | – | – | – | – | 3,180 |
| Balance as of June 30, 2016 | 1,148 | 2,205 | 42,360 | 54 | 11,087 | 17 | – | 3,448 | – | – | (4) | 60,315 |
INFOSYS LIMITED
Condensed Statement of Changes in Equity
In crore
| Particulars | Equity Share Capital | Other Equity | Total equity attributable to equity holders of the Company | |||||||||
| Reserves & Surplus | Other comprehensive income | |||||||||||
| Securities premium reserve |
Retained earnings | Capital reserve | General reserve | Share Options Outstanding Account | Special Economic Zone Re-investment reserve(1) | Business transfer adjustment reserve(2) | Equity Instruments through other comprehensive income | Cash flow hedge reserve | Other items of other comprehensive income | |||
| Balance as of April 1, 2017 | 1,148 | 2,208 | 49,957 | 54 | 11,087 | 120 | – | 3,448 | (5) | 39 | (39) | 68,017 |
| Changes in equity for the three month ended June 30, 2017 | ||||||||||||
| Transfer to general reserve | – | – | (1,382) | – | 1,382 | – | – | – | – | – | – | – |
| Transferred to Special Economic Zone Re-investment reserve | – | – | (468) | – | – | – | 468 | – | – | – | – | – |
| Transferred from Special Economic Zone Re-investment reserve on utilization | – | – | 146 | – | – | – | (146) | – | – | – | – | – |
| Exercise of stock options (refer to note 2.9) | – | 2 | – | – | – | (2) | – | – | – | – | – | – |
| Share based payment to employees of the group (refer to note 2.9) | – | – | – | – | – | 45 | – | – | – | – | – | 45 |
| Remeasurement of the net defined benefit liability/asset, net of tax effect | – | – | – | – | – | – | – | – | – | – | (2) | (2) |
| Fair value changes on cash flow hedge, net of tax (Refer note 2.8) |
– | – | – | – | – | – | – | – | – | (66) | – | (66) |
| Fair valuation of investments, net of tax effect (Refer note 2.2) |
– | – | – | – | – | – | – | – | – | – | 25 | 25 |
| Dividends (including corporate dividend tax) | – | – | (4,078) | – | – | – | – | – | – | – | – | (4,078) |
| Profit for the period | – | – | 3,415 | – | – | – | – | – | – | – | – | 3,415 |
| Balance as of June 30, 2017 | 1,148 | 2,210 | 47,590 | 54 | 12,469 | 163 | 322 | 3,448 | (5) | (27) | (16) | 67,356 |
| (1) | The Special Economic Zone Re-investment Reserve has been created out of the profit of eligible SEZ units in terms of the provisions of Sec 10AA(1)(ii) of Income Tax Act,1961. The reserve should be utilized by the Company for acquiring new plant and machinery for the purpose of its business in the terms of the Sec 10AA(2) of the Income Tax Act, 1961. |
| (2) |
Profit on transfer of business between entities under common control taken to reserve on account of transition to Indian Accounting Standards (Ind AS) |
The accompanying notes form an integral part of the interim condensed financial statements.
As per our report of even date attached
| for Deloitte Haskins & Sells LLP | for and on behalf of the Board of Directors of Infosys Limited |
| Chartered Accountants | |
| Firm's Registration Number: | |
| 117366W/W-100018 |
|
P. R. Ramesh Partner Membership No. 70928 |
R. Seshasayee Chairman |
Ravi Venkatesan Co-Chairman |
Dr. Vishal Sikka Chief Executive Officer and Managing Director |
U.B. Pravin Rao Chief Operating Officer and Whole-time Director |
|
Bengaluru July 14, 2017 |
Roopa Kudva Director |
M. D. Ranganath Chief Financial Officer |
A.G.S. Manikantha Company Secretary |
INFOSYS LIMITED
(In crore)
| Condensed Statement of Cash Flows | Three months ended June 30, | |
| 2017 | 2016 | |
| Cash flow from operating activities: | ||
| Profit for the period | 3,415 | 3,180 |
| Adjustments to reconcile net profit to net cash provided by operating activities: | ||
| Depreciation and amortization | 343 | 319 |
| Income tax expense | 1,301 | 1,280 |
| Allowance for credit losses on financial assets | (8) | 23 |
| Interest and dividend income | (615) | (671) |
| Other adjustments | 71 | 26 |
| Exchange differences on translation of assets and liabilities | (4) | 16 |
| Changes in assets and liabilities | ||
| Trade receivables and unbilled revenue | (424) | (797) |
| Loans and other financial assets and other assets | 49 | (179) |
| Trade payables | 216 | (322) |
| Other financial liabilities, other liabilities and provisions | 396 | 249 |
| Cash generated from operations | 4,740 | 3,124 |
| Income taxes paid | (1,049) | (569) |
| Net cash generated by operating activities | 3,691 | 2,555 |
| Cash flow from investing activities: | ||
| Expenditure on property, plant and equipment net of sale proceeds, including changes in retention money and capital creditors | (489) | (647) |
| Deposits with corporations | (7) | (59) |
| Loans to employees | 18 | 19 |
| Investment in subsidiaries | (209) | (185) |
| Payment towards contingent consideration pertaining to acquisition | (33) | (36) |
| Payments to acquire financial assets | ||
| Preference securities | – | (26) |
| Liquid mutual fund and fixed maturity plan securities | (15,539) | (10,087) |
| Certificates of Deposit | (281) | – |
| Government Bond | (1) | – |
| Proceeds on sale of financial assets | ||
| Liquid mutual fund and fixed maturity plan securities | 16,078 | 9,757 |
| Certificates of Deposit | 150 | – |
| Interest and dividend received on investments | 206 | 123 |
| Net cash used in investing activities | (107) | (1,141) |
| Cash flow from financing activities: | ||
| Payment of dividends | (3,380) | (3,272) |
| Net cash used in financing activities | (3,380) | (3,272) |
| Effect of exchange differences on translation of foreign currency cash and cash equivalents | 3 | (7) |
| Net decrease in cash and cash equivalents | 204 | (1,858) |
| Cash and cash equivalents at the beginning of the period | 19,153 | 29,176 |
| Cash and cash equivalents at the end of the period | 19,360 | 27,311 |
| Supplementary information: | ||
| Restricted cash balance | 435 | 359 |
The accompanying notes form an integral part of the interim condensed financial statements.
As per our report of even date attached
| for Deloitte Haskins & Sells LLP | for and on behalf of the Board of Directors of Infosys Limited |
| Chartered Accountants | |
| Firm's Registration Number: | |
| 117366W/W-100018 |
|
P. R. Ramesh Partner Membership No. 70928 |
R. Seshasayee Chairman |
Ravi Venkatesan Co-Chairman |
Dr. Vishal Sikka Chief Executive Officer and Managing Director |
U.B. Pravin Rao Chief Operating Officer and Whole-time Director |
|
Bengaluru July 14, 2017 |
Roopa Kudva Director |
M. D. Ranganath Chief Financial Officer |
A.G.S. Manikantha Company Secretary |
INFOSYS LIMITED
Notes to the Interim Condensed Financial Statements
1. Company Overview and Significant Accounting Policies
1.1 Company overview
Infosys ('the Company') is a leading provider in consulting, technology, outsourcing and next-generation services. Along with its subsidiaries, Infosys provides Business IT services (comprising application development and maintenance, independent validation, infrastructure management, engineering services comprising product engineering and life cycle solutions and business process management); Consulting and systems integration services (comprising consulting, enterprise solutions, systems integration and advanced technologies); Products, business platforms and solutions to accelerate intellectual property-led innovation. Its new offerings span areas like digital, big data and analytics, cloud, data and mainframe modernization, cyber security, IoT engineering Services and API & micro services.
The Company is a public limited company incorporated and domiciled in India and has its registered office at Bengaluru, Karnataka, India. The Company has its primary listings on the BSE Limited and National Stock Exchange of India Limited. The Company’s American Depositary Shares representing equity shares are also listed on the New York Stock Exchange (NYSE), Euronext London and Euronext Paris.
The interim condensed financial statements are approved for issue by the Company's Board of Directors on July 14, 2017.
1.2 Basis of preparation of financial statements
These interim condensed financial
statements are prepared in accordance with Indian Accounting Standard 34 (Ind AS 34), 'Interim Financial Reporting; under the historical
cost convention on the accrual basis except for certain financial instruments which are measured at fair values, the provisions
of the Companies Act , 2013 (In ‘Act') (to the extent notified) and guidelines issued by the Securities and Exchange Board of India
(SEBI). The Ind AS are prescribed under Section 133 of the Act read with Rule 3 of the Companies (Indian Accounting Standards)
Rules, 2015 and Companies (Indian Accounting Standards) Amendment Rules, 2016.
Effective April 1, 2016, the Company has adopted all the Ind AS standards and the adoption was carried out in accordance with Ind
AS 101 First time adoption of Indian Accounting Standards,with April 1, 2015 as the transition date. The transition was
carried out from Indian Accounting Principles generally accepted in India as prescribed under Section 133 of the Act, read with
Rule 7 of the Companies (Accounts) Rules, 2014 (IGAAP), which was the previous GAAP.
Accounting policies have been consistently applied except where a newly issued accounting standard is initially adopted or a revision
to an existing accounting standard requires a change in the accounting policy hitherto in use.
1.3 Use of estimates
The preparation of the financial statements in conformity with Ind AS requires the management to make estimates, judgments and assumptions. These estimates, judgments and assumptions affect the application of accounting policies and the reported amounts of assets and liabilities, the disclosures of contingent assets and liabilities at the date of the financial statements and reported amounts of revenues and expenses during the period. The application of accounting policies that require critical accounting estimates involving complex and subjective judgments and the use of assumptions in these condensed interim financial statements have been disclosed in note 1.4. Accounting estimates could change from period to period. Actual results could differ from those estimates. Appropriate changes in estimates are made as management becomes aware of changes in circumstances surrounding the estimates. Changes in estimates are reflected in the financial statements in the period in which changes are made and, if material, their effects are disclosed in the notes to the interim condensed financial statements.
1.4 Critical accounting estimates
a. Revenue recognition
The Company uses the percentage-of-completion method in accounting for its fixed-price contracts. The use of the percentage-of-completion method requires the Company to estimate the efforts or costs expended to date as a proportion of the total efforts or costs to be expended. Efforts or costs expended have been used to measure progress towards completion as there is a direct relationship between input and productivity. Provisions for estimated losses, if any, on uncompleted contracts are recorded in the period in which such losses become probable based on the expected contract estimates at the reporting date.
b. Income taxes
The Company's two major tax jurisdictions are India and the U.S., though the Company also files tax returns in other overseas jurisdictions. Significant judgements are involved in determining the provision for income taxes, including amount expected to be paid/recovered for uncertain tax positions. Also refer to Note 2.14 and Note 2.19.
c. Property, plant and equipment
Property, plant and equipment represent a significant proportion of the asset base of the Company. The charge in respect of periodic depreciation is derived after determining an estimate of an asset’s expected useful life and the expected residual value at the end of its life. The useful lives and residual values of Company's assets are determined by the management at the time the asset is acquired and reviewed periodically, including at each financial year end. The lives are based on historical experience with similar assets as well as anticipation of future events, which may impact their life, such as changes in technology.
1.5 Revenue recognition
The Company derives revenues primarily from software development and related services and from the licensing of software products. Arrangements with customers for software related services are mainly either on a fixed-price, fixed-timeframe or on a time-and-material basis.
Revenue on time-and-material contracts are recognized as the related services are performed and revenue from the end of the last billing to the Balance Sheet date is recognized as unbilled revenues. Revenue from fixed-price, fixed-timeframe contracts, where there is no uncertainty as to measurement or collectability of consideration, is recognized as per the percentage-of-completion method. When there is uncertainty as to measurement or ultimate collectability, revenue recognition is postponed until such uncertainty is resolved. Efforts or costs expended have been used to measure progress towards completion as there is a direct relationship between input and productivity. Provisions for estimated losses, if any, on uncompleted contracts are recorded in the period in which such losses become probable based on the current contract estimates. Costs and earnings in excess of billings are classified as unbilled revenue while billings in excess of costs and earnings are classified as unearned revenue. Deferred contract costs are amortized over the term of the contract. Maintenance revenue is recognized rateably over the term of the underlying maintenance arrangement.
In arrangements for software development and related services and maintenance services, the Company has applied the guidance in Ind AS 18, Revenue, by applying the revenue recognition criteria for each separately identifiable component of a single transaction. The arrangements generally meet the criteria for considering software development and related services as separately identifiable components. For allocating the consideration, the Company has measured the revenue in respect of each separable component of a transaction at its fair value, in accordance with principles given in Ind AS 18. The price that is regularly charged for an item when sold separately is the best evidence of its fair value. In cases where the Company is unable to establish objective and reliable evidence of fair value for the software development and related services, the Company has used a residual method to allocate the arrangement consideration. In these cases, the balance of the consideration, after allocating the fair values of undelivered components of a transaction, has been allocated to the delivered components for which specific fair values do not exist.
License fee revenues are recognized when the general revenue recognition criteria given in Ind AS 18 are met. Arrangements to deliver software products generally have three elements: license, implementation and Annual Technical Services (ATS). The Company has applied the principles given in Ind AS 18 to account for revenues from these multiple element arrangements. Objective and reliable evidence of fair value has been established for ATS. Objective and reliable evidence of fair value is the price charged when the element is sold separately. When other services are provided in conjunction with the licensing arrangement and objective and reliable evidence of their fair values have been established, the revenue from such contracts are allocated to each component of the contract in a manner, whereby revenue is deferred for the undelivered services and the residual amounts are recognized as revenue for delivered elements. In the absence of objective and reliable evidence of fair value for implementation, the entire arrangement fee for license and implementation is recognized using the percentage-of-completion method as the implementation is performed. Revenue from client training, support and other services arising due to the sale of software products is recognized as the services are performed. ATS revenue is recognized rateably over the period in which the services are rendered.
Advances received for services and products are reported as client deposits until all conditions for revenue recognition are met.
The Company accounts for volume discounts and pricing incentives to customers as a reduction of revenue based on the ratable allocation of the discounts/ incentives amount to each of the underlying revenue transaction that results in progress by the customer towards earning the discount/ incentive. Also, when the level of discount varies with increases in levels of revenue transactions, the Company recognizes the liability based on its estimate of the customer's future purchases. If it is probable that the criteria for the discount will not be met, or if the amount thereof cannot be estimated reliably, then discount is not recognized until the payment is probable and the amount can be estimated reliably. The Company recognizes changes in the estimated amount of obligations for discounts in the period in which the change occurs. The discounts are passed on to the customer either as direct payments or as a reduction of payments due from the customer.
The Company presents revenues net of value-added taxes in its Statement of Profit and Loss.
1.6 Property, plant and equipment
Property, plant and equipment are stated at cost, less accumulated depreciation and impairment, if any. Costs directly attributable to acquisition are capitalized until the property, plant and equipment are ready for use, as intended by the management. The Company depreciates property, plant and equipment over their estimated useful lives using the straight-line method. The estimated useful lives of assets are as follows:
| Building(1) | 22-25 years |
| Plant and machinery(1) | 5 years |
| Office equipment | 5 years |
| Computer equipment(1) | 3-5 years |
| Furniture and fixtures(1) | 5 years |
| Vehicles(1) | 5 years |
Depreciation methods, useful lives and residual values are reviewed periodically, including at each financial year end.
| (1) | Based on technical evaluation, the management believes that the useful lives as given above best represent the period over which management expects to use these assets. Hence, the useful lives for these assets is different from the useful lives as prescribed under Part C of Schedule II of the Companies Act 2013. |
Advances paid towards the acquisition of property, plant and equipment outstanding at each Balance Sheet date is classified as capital advances under other non-current assets and the cost of assets not put to use before such date are disclosed under ‘Capital work-in-progress’. Subsequent expenditures relating to property, plant and equipment is capitalized only when it is probable that future economic benefits associated with these will flow to the Company and the cost of the item can be measured reliably. Repairs and maintenance costs are recognized in net profit in the Statement of Profit and Loss when incurred. The cost and related accumulated depreciation are eliminated from the financial statements upon sale or retirement of the asset and the resultant gains or losses are recognized in the Statement of Profit and Loss. Assets to be disposed off are reported at the lower of the carrying value or the fair value less cost to sell.
1.7 Intangible assets
Intangible assets are stated at cost less accumulated amortization and impairment. Intangible assets are amortized over their respective individual estimated useful lives on a straight-line basis, from the date that they are available for use. The estimated useful life of an identifiable intangible asset is based on a number of factors including the effects of obsolescence, demand, competition, and other economic factors (such as the stability of the industry, and known technological advances), and the level of maintenance expenditures required to obtain the expected future cash flows from the asset. Amortization methods and useful lives are reviewed periodically including at each financial year end.
Research costs are expensed as incurred. Software product development costs are expensed as incurred unless technical and commercial feasibility of the project is demonstrated, future economic benefits are probable, the Company has an intention and ability to complete and use or sell the software and the costs can be measured reliably. The costs which can be capitalized include the cost of material, direct labour, overhead costs that are directly attributable to preparing the asset for its intended use. Research and development costs and software development costs incurred under contractual arrangements with customers are accounted as expenses in the Statement of Profit and Loss.
1.8 Financial instruments
1.8.1 Initial recognition
The Company recognizes financial assets and financial liabilities when it becomes a party to the contractual provisions of the instrument. All financial assets and liabilities are recognized at fair value on initial recognition, except for trade receivables which are initially measured at transaction price. Transaction costs that are directly attributable to the acquisition or issue of financial assets and financial liabilities, that are not at fair value through profit or loss, are added to the fair value on initial recognition. Regular way purchase and sale of financial assets are accounted for at trade date.
1.8.2 Subsequent measurement
a. Non-derivative financial instruments
(i) Financial assets carried at amortised cost
A financial asset is subsequently measured at amortised cost if it is held within a business model whose objective is to hold the asset in order to collect contractual cash flows and the contractual terms of the financial asset give rise on specified dates to cash flows that are solely payments of principal and interest on the principal amount outstanding.
(ii) Financial assets at fair value through other comprehensive income
A financial asset is subsequently measured at fair value through other comprehensive income if it is held within a business model whose objective is achieved by both collecting contractual cash flows and selling financial assets and the contractual terms of the financial asset give rise on specified dates to cash flows that are solely payments of principal and interest on the principal amount outstanding. The Company has made an irrevocable election for its investments which are classified as equity instruments to present the subsequent changes in fair value in other comprehensive income based on its business model. Further, in cases where the Company has made an irrevocable election based on its business model, for its investments which are classified as equity instruments, the subsequent changes in fair value are recognized in other comprehensive income.
(iii) Financial assets at fair value through profit or loss
A financial asset which is not classified in any of the above categories are subsequently fair valued through profit or loss.
(iv) Financial liabilities
Financial liabilities are subsequently carried at amortized cost using the effective interest method, except for contingent consideration recognized in a business combination which is subsequently measured at fair value through profit and loss. For trade and other payables maturing within one year from the Balance Sheet date, the carrying amounts approximate fair value due to the short maturity of these instruments.
(v) Investment in subsidiaries
Investment in subsidiaries is carried at cost in the separate financial statements.
b. Derivative financial instruments
The Company holds derivative financial instruments such as foreign exchange forward and option contracts to mitigate the risk of changes in exchange rates on foreign currency exposures. The counterparty for these contracts is generally a bank.
(i) Financial assets or financial liabilities, at fair value through profit or loss.
This category has derivative financial assets or liabilities which are not designated as hedges.
Although the Company believes that these derivatives constitute hedges from an economic perspective, they may not qualify for hedge accounting under Ind AS 109, Financial Instruments. Any derivative that is either not designated a hedge, or is so designated but is ineffective as per Ind AS 109, is categorized as a financial asset or financial liability, at fair value through profit or loss.
Derivatives not designated as hedges are recognized initially at fair value and attributable transaction costs are recognized in net profit in the Statement of Profit and Loss when incurred. Subsequent to initial recognition, these derivatives are measured at fair value through profit or loss and the resulting exchange gains or losses are included in other income. Assets/ liabilities in this category are presented as current assets/current liabilities if they are either held for trading or are expected to be realized within 12 months after the Balance Sheet date.
(ii) Cash flow hedge
The Company designates certain foreign exchange
forward and options contracts as cash flow hedges to mitigate the risk foreign exchange exposure on highly probable forecast cash
transactions.
When a derivative is designated as a cash flow hedging instrument, the effective portion of changes in the fair value of the derivative
is recognized in other comprehensive income and accumulated in the cash flow hedging reserve. Any ineffective portion of changes
in the fair value of the derivative is recognized immediately in the net profit in the Statement of Profit and Loss. If the hedging
instrument no longer meets the criteria for hedge accounting, then hedge accounting is discontinued prospectively. If the hedging
instrument expires or is sold, terminated or exercised, the cumulative gain or loss on the hedging instrument recognized in cash
flow hedging reserve till the period the hedge was effective remains in cash flow hedging reserve until the forecasted transaction
occurs. The cumulative gain or loss previously recognized in the cash flow hedging reserve is transferred to the net profit in
the Statement of Profit and Loss upon the occurrence of the related forecasted transaction. If the forecasted transaction is no
longer expected to occur, then the amount accumulated in cash flow hedging reserve is reclassified to net profit in the Statement
of Profit and Loss.
c. Share capital
Ordinary Shares
Ordinary shares are classified as equity. Incremental costs directly attributable to the issuance of new ordinary shares and share options are recognized as a deduction from equity, net of any tax effects.
1.8.3 Derecognition of financial instruments
The Company derecognizes a financial asset when the contractual rights to the cash flows from the financial asset expire or it transfers the financial asset and the transfer qualifies for derecognition under Ind AS 109. A financial liability (or a part of a financial liability) is derecognized from the Company's Balance Sheet when the obligation specified in the contract is discharged or cancelled or expires.
1.9 Fair value of financial instruments
In determining the fair value of its financial instruments, the Company uses a variety of methods and assumptions that are based on market conditions and risks existing at each reporting date. The methods used to determine fair value include discounted cash flow analysis, available quoted market prices and dealer quotes. All methods of assessing fair value result in general approximation of value, and such value may never actually be realized.
Refer to Note 2.8 for the disclosure on carrying value and fair value of financial assets and liabilities. For financial assets and liabilities maturing within one year from the Balance Sheet date and which are not carried at fair value, the carrying amounts approximate fair value due to the short maturity of these instruments.
1.10 Impairment
a. Financial assets
The Company recognizes loss allowances using the expected credit loss (ECL) model for the financial assets which are not fair valued through profit or loss. Loss allowance for trade receivables with no significant financing component is measured at an amount equal to lifetime ECL. For all other financial assets, expected credit losses are measured at an amount equal to the 12-month ECL, unless there has been a significant increase in credit risk from initial recognition in which case those are measured at lifetime ECL. The amount of expected credit losses (or reversal) that is required to adjust the loss allowance at the reporting date to the amount that is required to be recognised is recognized as an impairment gain or loss in profit or loss.
b. Non-financial assets
(i) Intangible assets and property, plant and equipment
Intangible assets and property, plant and equipment are evaluated for recoverability whenever events or changes in circumstances indicate that their carrying amounts may not be recoverable. For the purpose of impairment testing, the recoverable amount (i.e. the higher of the fair value less cost to sell and the value-in-use) is determined on an individual asset basis unless the asset does not generate cash flows that are largely independent of those from other assets. In such cases, the recoverable amount is determined for the CGU to which the asset belongs.
If such assets are considered to be impaired, the impairment to be recognized in the Statement of Profit and Loss is measured by the amount by which the carrying value of the assets exceeds the estimated recoverable amount of the asset. An impairment loss is reversed in the statement of profit and loss if there has been a change in the estimates used to determine the recoverable amount. The carrying amount of the asset is increased to its revised recoverable amount, provided that this amount does not exceed the carrying amount that would have been determined (net of any accumulated amortization or depreciation) had no impairment loss been recognized for the asset in prior years.
1.11 Provisions
A provision is recognized if, as a result of a past event, the Company has a present legal or constructive obligation that is reasonably estimable, and it is probable that an outflow of economic benefits will be required to settle the obligation. Provisions are determined by discounting the expected future cash flows at a pre-tax rate that reflects current market assessments of the time value of money and the risks specific to the liability.
a. Post sales client support
The Company provides its clients with a fixed-period post sales support for corrections of errors and support on all its fixed-price, fixed-timeframe contracts. Costs associated with such support services are accrued at the time related revenues are recorded in the Statement of Profit and Loss. The Company estimates such costs based on historical experience and estimates are reviewed on a periodic basis for any material changes in assumptions and likelihood of occurrence.
b. Onerous contracts
Provisions for onerous contracts are recognized when the expected benefits to be derived by the Company from a contract are lower than the unavoidable costs of meeting the future obligations under the contract. The provision is measured at the present value of the lower of the expected cost of terminating the contract and the expected net cost of continuing with the contract. Before a provision is established, the Company recognizes any impairment loss on the assets associated with that contract.
1.12 Foreign currency
Functional currency
The functional currency of the Company is the Indian rupee. These interim condensed financial statements are presented in Indian rupees (rounded off to crore; one crore equals ten million).
Transactions and translations
Foreign-currency denominated monetary assets and liabilities are translated into the relevant functional currency at exchange rates in effect at the Balance Sheet date. The gains or losses resulting from such translations are included in net profit in the Statement of Profit and Loss. Non-monetary assets and non-monetary liabilities denominated in a foreign currency and measured at fair value are translated at the exchange rate prevalent at the date when the fair value was determined. Non-monetary assets and non-monetary liabilities denominated in a foreign currency and measured at historical cost are translated at the exchange rate prevalent at the date of the transaction.
Transaction gains or losses realized upon settlement of foreign currency transactions are included in determining net profit for the period in which the transaction is settled. Revenue, expense and cash-flow items denominated in foreign currencies are translated into the relevant functional currencies using the exchange rate in effect on the date of the transaction.
1.13 Earnings per equity share
Basic earnings per equity share is computed by dividing the net profit attributable to the equity holders of the Company by the weighted average number of equity shares outstanding during the period. Diluted earnings per equity share iscomputed by dividing the net profit attributable to the equity holders of the Company by the weighted average number of equity shares considered for deriving basic earnings per equity share and also the weighted average number of equity shares that could have been issued upon conversion of all dilutive potential equity shares. The dilutive potential equity shares are adjusted for the proceeds receivable had the equity shares been actually issued at fair value (i.e. the average market value of the outstanding equity shares). Dilutive potential equity shares are deemed converted as of the beginning of the period, unless issued at a later date. Dilutive potential equity shares are determined independently for each period presented.
The number of equity shares and potentially dilutive equity shares are adjusted retrospectively for all periods presented for any share splits and bonus shares issues including for changes effected prior to the approval of the financial statements by the Board of Directors.
1.14 Income taxes
Income tax expense comprises current and deferred income tax. Income tax expense is recognized in net profit in the Statement of Profit and Loss except to the extent that it relates to items recognized directly in equity, in which case it is recognized in other comprehensive income. Current income tax for current and prior periods is recognized at the amount expected to be paid to or recovered from the tax authorities, using the tax rates and tax laws that have been enacted or substantively enacted by the Balance Sheet date. Deferred income tax assets and liabilities are recognized for all temporary differences arising between the tax bases of assets and liabilities and their carrying amounts in the financial statements. Deferred tax assets are reviewed at each reporting date and are reduced to the extent that it is no longer probable that the related tax benefit will be realized.
Deferred income tax assets and liabilities are measured using tax rates and tax laws that have been enacted or substantively enacted by the Balance Sheet date and are expected to apply to taxable income in the years in which those temporary differences are expected to be recovered or settled. The effect of changes in tax rates on deferred income tax assets and liabilities is recognized as income or expense in the period that includes the enactment or the substantive enactment date. A deferred income tax asset is recognized to the extent that it is probable that future taxable profit will be available against which the deductible temporary differences and tax losses can be utilized. Deferred income taxes are not provided on the undistributed earnings of subsidiaries and branches where it is expected that the earnings of the subsidiary or branch will not be distributed in the foreseeable future. The Company offsets current tax assets and current tax liabilities, where it has a legally enforceable right to set off the recognized amounts and where it intends either to settle on a net basis, or to realize the asset and settle the liability simultaneously. The income tax provision for the interim period is made based on the best estimate of the annual average tax rate expected to be applicable for the full financial year. Tax benefits of deductions earned on exercise of employee share options in excess of compensation charged to income are credited to share premium.
1.15 Employee benefits
1.15.1 Gratuity
The Company provides for gratuity, a defined benefit retirement plan ('the Gratuity Plan') covering eligible employees. The Gratuity Plan provides a lump-sum payment to vested employees at retirement, death, incapacitation or termination of employment, of an amount based on the respective employee's salary and the tenure of employment with the Company.
Liabilities with regard to the Gratuity Plan are determined by actuarial valuation, performed by an independent actuary, at each Balance Sheet date using the projected unit credit method. The Company fully contributes all ascertained liabilities to the Infosys Limited Employees' Gratuity Fund Trust (the Trust). Trustees administer contributions made to the Trusts and contributions are invested in a scheme with Life Insurance Corporation of India as permitted by Indian law.
The Company recognizes the net obligation of a defined benefit plan in its Balance Sheet as an asset or liability. Gains and losses through re-measurements of the net defined benefit liability/(asset) are recognized in other comprehensive income. The actual return of the portfolio of plan assets, in excess of the yields computed by applying the discount rate used to measure the defined benefit obligation is recognized in other comprehensive income. The effect of any plan amendments are recognized in net profit in the Statement of Profit and Loss.
1.15.2 Superannuation
Certain employees of Infosys are participants in a defined contribution plan. The Company has no further obligations to the Plan beyond its monthly contributions which are periodically contributed to a trust fund, the corpus of which is invested with the Life Insurance Corporation of India.
1.15.3 Provident fund
Eligible employees of Infosys receive benefits from a provident fund, which is a defined benefit plan. Both the eligible employee and the Company make monthly contributions to the provident fund plan equal to a specified percentage of the covered employee's salary. The Company contributes a portion to the Infosys Limited Employees' Provident Fund Trust. The trust invests in specific designated instruments as permitted by Indian law. The remaining portion is contributed to the government administered pension fund. The rate at which the annual interest is payable to the beneficiaries by the trust is being administered by the government. The Company has an obligation to make good the shortfall, if any, between the return from the investments of the Trust and the notified interest rate.
1.15.4 Compensated absences
The Company has a policy on compensated absences which are both accumulating and non-accumulating in nature. The expected cost of accumulating compensated absences is determined by actuarial valuation performed by an independent actuary at each Balance Sheet date using projected unit credit method on the additional amount expected to be paid/availed as a result of the unused entitlement that has accumulated at the Balance Sheet date. Expense on non-accumulating compensated absences is recognized in the period in which the absences occur.
1.16 Share-based compensation
The Company recognizes compensation expense relating to share-based payments in net profit using fair-value in accordance with Ind AS 102, Share-Based Payment. The estimated fair value of awards is charged to income on a straight-line basis over the requisite service period for each separately vesting portion of the award as if the award was in-substance, multiple awards with a corresponding increase to share options outstanding account.
Amendment to Ind AS 102:
During the quarter, the Company adopted amendment to Ind AS 102 which provides specific guidance to measurement of cash-settled awards, modification of cash-settled awards and awards that include a net settlement feature in respect of withholding taxes. The adoption of amendment did not have any material effect on the interim condensed financial statements.
1.17 Cash Flow Statement
Cash flows are reported using the indirect method, whereby profit for the period is adjusted for the effects of transactions of a non-cash nature, any deferrals or accruals of past or future operating cash receipts or payments and item of income or expenses associated with investing or financing cash flows. The cash flows from operating, investing and financing activities of the Company are segregated.
Amendment to Ind AS 7:
During the quarter, the Company adopted the amendment to Ind AS 7, which require the entities to provide disclosures that enable users of financial statements to evaluate changes in liabilities arising from financing activities, including both changes arising from cash flows and non-cash changes, suggesting inclusion of a reconciliation between the opening and closing balances in the Balance Sheet for liabilities arising from financing activities, to meet the disclosure requirement. The adoption of amendment did not have any material the effect on the interim financial statements.
2.1 PROPERTY, PLANT AND EQUIPMENT
The changes in the carrying value of property, plant and equipment for the three months ended June 30, 2017 are as follows:
(In crore)
| Particulars | Land- Freehold | Land- Leasehold | Buildings (1)(2) | Plant and machinery(2) | Office Equipment (2) | Computer equipment (2) | Furniture and fixtures (2) | Vehicles | Total |
| Gross carrying value as of April 1, 2017 | 1,093 | 659 | 6,483 | 2,019 | 769 | 3,886 | 1,277 | 24 | 16,210 |
| Additions | – | – | 52 | 31 | 22 | 121 | 30 | 2 | 258 |
| Deletions | – | – | – | – | (1) | (5) | (1) | – | (7) |
| Gross carrying value as of June 30, 2017 | 1,093 | 659 | 6,535 | 2,050 | 790 | 4,002 | 1,306 | 26 | 16,461 |
| Accumulated depreciation as of April 1, 2017 | – | (26) | (2,377) | (1,290) | (472) | (2,603) | (823) | (14) | (7,605) |
| Depreciation | – | (1) | (60) | (66) | (30) | (143) | (42) | (1) | (343) |
| Accumulated depreciation on deletions | – | – | – | – | 1 | 4 | 1 | – | 6 |
| Accumulated depreciation as of June 30, 2017 | – | (27) | (2,437) | (1,356) | (501) | (2,742) | (864) | (15) | (7,942) |
| Carrying value as of June 30, 2017 | 1,093 | 632 | 4,098 | 694 | 289 | 1,260 | 442 | 11 | 8,519 |
| Carrying value as of April 1, 2017 | 1,093 | 633 | 4,106 | 729 | 297 | 1,283 | 454 | 10 | 8,605 |
The changes in the carrying value of property, plant and equipment for the three months ended June 30, 2016 are as follows:
(In crore)
| Particulars | Land- Freehold | Land- Leasehold | Buildings (1)(2) | Plant and machinery(2) | Office Equipment (2) | Computer equipment (2) | Furniture and fixtures (2) | Vehicles | Total |
| Gross carrying value as of April 1, 2016 | 970 | 638 | 6,173 | 1,679 | 679 | 3,481 | 1,070 | 19 | 14,709 |
| Additions | 4 | 5 | 35 | 113 | 48 | 141 | 49 | 2 | 397 |
| Deletions | – | – | – | (1) | – | (5) | (1) | – | (7) |
| Gross carrying value as of June 30, 2016 | 974 | 643 | 6,208 | 1,791 | 727 | 3,617 | 1,118 | 21 | 15,099 |
| Accumulated depreciation as of April 1, 2016 | – | (21) | (2,150) | (1,044) | (369) | (2,195) | (671) | (11) | (6,461) |
| Depreciation | – | (1) | (56) | (59) | (26) | (140) | (36) | (1) | (319) |
| Accumulated depreciation on deletions | – | – | – | 1 | – | 5 | 1 | – | 7 |
| Accumulated depreciation as of June 30, 2016 | – | (22) | (2,206) | (1,102) | (395) | (2,330) | (706) | (12) | (6,773) |
| Carrying value as of June 30, 2016 | 974 | 621 | 4,002 | 689 | 332 | 1,287 | 412 | 9 | 8,326 |
| Carrying value as of April 1, 2016 | 970 | 617 | 4,023 | 635 | 310 | 1,286 | 399 | 8 | 8,248 |
The changes in the carrying value of property, plant and equipment for the year ended March 31, 2017 are as follows:
(In crore)
| Particulars | Land- Freehold | Land- Leasehold | Buildings (1)(2) | Plant and machinery(2) | Office Equipment (2) | Computer equipment (2) | Furniture and fixtures (2) | Vehicles | Total |
| Gross carrying value as of April 1, 2016 | 970 | 638 | 6,173 | 1,679 | 679 | 3,481 | 1,070 | 19 | 14,709 |
| Additions | 123 | 21 | 310 | 344 | 122 | 654 | 237 | 6 | 1,817 |
| Deletions | – | – | – | (4) | (32) | (249) | (30) | (1) | (316) |
| Gross carrying value as of March 31, 2017 | 1,093 | 659 | 6,483 | 2,019 | 769 | 3,886 | 1,277 | 24 | 16,210 |
| Accumulated depreciation as of April 1, 2016 | – | (21) | (2,150) | (1,044) | (369) | (2,195) | (671) | (11) | (6,461) |
| Depreciation | – | (5) | (227) | (250) | (111) | (572) | (162) | (4) | (1,331) |
| Accumulated depreciation on deletions | – | – | – | 4 | 8 | 164 | 10 | 1 | 187 |
| Accumulated depreciation as of March 31, 2017 | – | (26) | (2,377) | (1,290) | (472) | (2,603) | (823) | (14) | (7,605) |
| Carrying value as of March 31, 2017 | 1,093 | 633 | 4,106 | 729 | 297 | 1,283 | 454 | 10 | 8,605 |
| Carrying value as of April 1, 2016 | 970 | 617 | 4,023 | 635 | 310 | 1,286 | 399 | 8 | 8,248 |
| (1) | Buildings include 250/- being the value of 5 shares of 50/- each in Mittal Towers
Premises Co-operative Society Limited. |
| (2) | Includes certain assets provided on cancellable operating lease to subsidiaries |
Gross carrying value of leasehold land represents amounts paid under certain lease-cum-sale agreements to acquire land including agreements where the Company has an option to purchase or renew the properties on expiry of the lease period.
The aggregate depreciation has been included under depreciation and amortisation expense in the Statement of Profit and Loss.
Tangible assets provided on operating lease to subsidiaries as at June 30, 2017 and March 31, 2017 are as follows:
(In crore)
| Particulars | Cost | Accumulated depreciation | Net book value |
| Buildings | 198 | 83 | 115 |
| 197 | 82 | 115 | |
| Plant and machinery | 33 | 21 | 12 |
| 33 | 19 | 14 | |
| Furniture and fixtures | 25 | 17 | 8 |
| 25 | 16 | 9 | |
| Computer Equipment | 3 | 2 | 1 |
| 3 | 2 | 1 | |
| Office equipment | 18 | 11 | 7 |
| 18 | 10 | 8 |
The aggregate depreciation charged on the above
assets during the three months ended June 30, 2017 and June 30, 2016 amounted to 5 crore and 6 crore respectively.
The rental income from subsidiaries for the three
months ended June 30, 2017 and June 30, 2016 amounted to 17 crore and 16 crore respectively.
2.2 INVESTMENTS
(In crore)
| Particulars | As at | |
| June 30, 2017 | March 31, 2017 | |
| Non-current investments | ||
| Equity instruments of subsidiaries | 7,420 | 7,305 |
| Debentures of subsidiary | 2,129 | 2,129 |
| Preference securities and equity investments | 132 | 132 |
| Others | 3 | 3 |
| Tax free bonds | 1,833 | 1,833 |
| Fixed maturity plans securities | 363 | 357 |
| Non convertible debentures | 3,244 | 3,575 |
| 15,124 | 15,334 | |
| Current investments | ||
| Liquid mutual fund units | 1,270 | 1,755 |
| Fixed maturity plans securities | 154 | 151 |
| Certificates of deposit | 7,892 | 7,635 |
| Government bonds | 1 | – |
| Non convertible debentures | 476 | 102 |
| 9,793 | 9,643 | |
| Total carrying value | 24,917 | 24,977 |
In crore, except as otherwise stated
| Particulars | As at | |
| June 30, 2017 | March 31, 2017 | |
| Non-current investments | ||
| Unquoted | ||
| Investment carried at cost | ||
| Investments in equity instruments of subsidiaries | ||
| Infosys BPO Limited | 659 | 659 |
| 3,38,22,319 (3,38,22,319) equity shares of 10/- each, fully paid |
||
| Infosys Technologies (China) Co. Limited | 333 | 236 |
| Infosys Technologies (Australia) Pty Limited | 66 | 66 |
| 1,01,08,869 (1,01,08,869) equity shares of AUD 0.11 par value, fully paid | ||
| Infosys Technologies, S. de R.L. de C.V., Mexico | 65 | 65 |
| 17,49,99,990 (17,49,99,990) equity shares of MXN 1 par value, fully paid up | ||
| Infosys Technologies (Sweden) AB | 76 | 76 |
| 1,000 (1,000) equity shares of SEK 100 par value, fully paid | ||
| Infosys Technologia do Brasil Ltda | 149 | 149 |
| 5,91,24,348 (5,91,24,348) shares of BRL 1.00 par value, fully paid | ||
| Infosys Technologies (Shanghai) Company Limited | 900 | 826 |
| Infosys Public Services, Inc. | 99 | 99 |
| 3,50,00,000 (3,50,00,000) shares of USD 0.50 par value, fully paid | ||
| Infosys Consulting Holding AG (formerly Lodestone Holding AG) | 1,323 | 1,323 |
| 23,350 (23,350) - Class A shares of CHF 1,000 each and 29,400 | ||
| (29,400) - Class B Shares of CHF 100 each, fully paid up | ||
| Infosys Americas Inc. | 1 | 1 |
| 10,000 (10,000) shares of USD 10 per share, fully paid up | ||
| EdgeVerve Systems Limited | 1,312 | 1,312 |
| 131,18,40,000 (131,18,40,000) equity shares of 10/- each, fully paid |
||
| Panaya Inc. | 1,436 | 1,398 |
| 2 (2) shares of USD 0.01 per share, fully paid up | ||
| Infosys Nova Holdings LLC * | – | 94 |
| Kallidus Inc. | 619 | 619 |
| 10,21,35,416 (10,21,35,416) shares | ||
| Skava Systems Private Limited | 59 | 59 |
| 25,000 (25,000) shares of 10/- per share, fully paid up |
||
| Noah Consulting LLC | 313 | 313 |
| Infosys Consulting Pte Ltd (formerly Lodestone Management Consultants Pte Ltd) | 10 | 10 |
| 10,990,000 (10,990,000) shares of SGD 1.00 par value, fully paid | ||
| 7,420 | 7,305 | |
| Investment carried at amortised cost | ||
| Investment in debentures of subsidiary | ||
| EdgeVerve Systems Limited | ||
| 21,29,00,000 (21,29,00,000) Unsecured redeemable, non-convertible debentures of 100/- each fully paid up |
2,129 | 2,129 |
| 2,129 | 2,129 | |
| 9,549 | 9,434 | |
| Investments carried at fair value through profit or loss | ||
| Others | 3 | 3 |
| 3 | 3 | |
| Investment carried at fair value through other comprehensive income (FVOCI) | ||
| Preference securities | 131 | 131 |
| Equity instruments | 1 | 1 |
| 132 | 132 | |
| Quoted | ||
| Investments carried at amortized cost | ||
| Tax free bonds | 1,833 | 1,833 |
| 1,833 | 1,833 | |
| Investments carried at fair value through profit or loss | ||
| Fixed Maturity Plans | 363 | 357 |
| 363 | 357 | |
| Investments carried at fair value through other comprehensive income | ||
| Non convertible debentures | 3,244 | 3,575 |
| 3,244 | 3,575 | |
| Total non-current investments | 15,124 | 15,334 |
| Current investments | ||
| Unquoted | ||
| Investments carried at fair value through profit or loss | ||
| Liquid mutual fund units | 1,270 | 1,755 |
| 1,270 | 1,755 | |
| Investments carried at fair value through other comprehensive income | ||
| Certificates of Deposit | 7,892 | 7,635 |
| 7,892 | 7,635 | |
| Quoted | ||
| Investments carried at amortized cost | ||
| Government bonds | 1 | – |
| 1 | – | |
| Investments carried at fair value through profit or loss | ||
| Fixed Maturity Plans | 154 | 151 |
| 154 | 151 | |
| Investments carried at fair value through other comprehensive income | ||
| Non convertible debentures | 476 | 102 |
| 476 | 102 | |
| Total current investments | 9,793 | 9,643 |
| Total investments | 24,917 | 24,977 |
| Aggregate amount of quoted investments | 6,071 | 6,018 |
| Market value of quoted investments (including interest accrued) | 6,376 | 6,327 |
| Aggregate amount of unquoted investments | 18,846 | 18,959 |
| Aggregate amount of impairment in value of investments | 100 | 6 |
| Investments carried at cost | 7,420 | 7,305 |
| Investments carried at amortised cost | 3,963 | 3,962 |
| Investments carried at fair value through other comprehensive income | 11,744 | 11,444 |
| Investments carried at fair value through profit or loss | 1,790 | 2,266 |
| * | During the quarter ended June 30, 2017, Infosys Nova Holding LLC has written down
the entire carrying value of its investment in its associate DWA Nova LLC. Consequently,the Company has written down the entire
carrying value of the investment in its subsidiary Infosys Nova Holdings LLC, amounting to 94 crore. |
Proposed business transfer
On July 14, 2017, the Board of Directors of Infosys authorized the Company to execute a Business Transfer Agreement and related documents with Noah Consulting LLC, a wholly owned subsidiary, to transfer the business of Noah Consulting LLC to Infosys Limited, subject to securing the requisite regulatory approvals for a consideration based on an independent valuation.
2.3 LOANS
(In crore)
| Particulars | As at | |
| June 30, 2017 | March 31, 2017 | |
| Non- Current | ||
| Unsecured, considered good | ||
| Other Loans | ||
| Loans to employees | 4 | 5 |
| 4 | 5 | |
| Unsecured, considered doubtful | ||
| Loans to employees | 17 | 17 |
| 21 | 22 | |
| Less: Allowance for doubtful loans to employees | 17 | 17 |
| 4 | 5 | |
| Current | ||
| Unsecured, considered good | ||
| Loans to subsidiaries (Refer note 2.20) | 70 | 69 |
| Other Loans | ||
| Loans to employees | 224 | 241 |
| 294 | 310 | |
| Total Loans | 298 | 315 |
2.4 OTHER FINANCIAL ASSETS
(In crore)
| Particulars | As at | |
| June 30, 2017 | March 31, 2017 | |
| Non-current | ||
| Security deposits (1) | 84 | 81 |
| Rental deposits (1) | 131 | 135 |
| 215 | 216 | |
| Current | ||
| Security deposits (1) | 1 | 2 |
| Rental deposits (1) | 6 | 2 |
| Restricted deposits (1) | 1,316 | 1,309 |
| Unbilled revenues (1)(4) | 3,330 | 3,200 |
| Interest accrued but not due (1) | 778 | 514 |
| Foreign currency forward and options contracts (2)(3) | 20 | 268 |
| Others (1)(5) | 146 | 108 |
| 5,597 | 5,403 | |
| Total | 5,812 | 5,619 |
| (1) Financial assets carried at amortized cost | 5,792 | 5,351 |
| (2) Financial assets carried at fair value through other comprehensive income | – | 52 |
| (3) Financial assets carried at fair value through Profit or Loss | 20 | 216 |
| (4) Includes dues from subsidiaries (Refer note 2.20) | 2 | 47 |
| (5) Includes dues from subsidiaries (Refer note 2.20) | 26 | 18 |
Restricted deposits represent deposit with financial institutions to settle employee related obligations as and when they arise during the normal course of business.
2.5 TRADE RECEIVABLES (1)
(In crore)
| Particulars | As at | |
| June 30, 2017 | March 31, 2017 | |
| Current | ||
| Unsecured | ||
| Considered good(2) | 11,262 | 10,960 |
| Considered doubtful | 266 | 289 |
| 11,528 | 11,249 | |
| Less: Allowances for credit losses | 266 | 289 |
| 11,262 | 10,960 | |
| (1) Includes dues from companies where directors are interested | 1 | 1 |
| (2) Includes dues from subsidiaries (refer note 2.20) | 299 | 235 |
2.6 CASH AND CASH EQUIVALENTS
(In crore)
| Particulars | As at | |
| June 30, 2017 | March 31, 2017 | |
| Balances with banks | ||
| In current and deposit accounts | 12,429 | 12,222 |
| Cash on hand | – | – |
| Others | ||
| Deposits with financial institution | 6,931 | 6,931 |
| 19,360 | 19,153 | |
| Balances with banks in unpaid dividend accounts | 25 | 17 |
| Deposit with more than 12 months maturity | 6,765 | 6,765 |
| Balances with banks held as margin money deposits against guarantees | 410 | 394 |
Cash and cash equivalents as of June 30, 2017 and
March 31, 2017 include restricted cash and bank balances of 435 crore and 411 crore, respectively. The restrictions are primarily
on account of bank balances held as margin money deposits against guarantees and balances held in unpaid dividend bank accounts.
The deposits maintained by the Company with banks and financial institution comprise of time deposits, which can be withdrawn by the Company at any point without prior notice or penalty on the principal.
The details of balances as on balance sheet dates with banks are as follows:
(In
crore)
| Particulars | As at | |
| June 30, 2017 | March 31, 2017 | |
| In current accounts | ||
| ANZ Bank, Taiwan | 6 | 3 |
| Bank of America, USA | 728 | 769 |
| Bank of Baroda, Mauritius | 1 | – |
| Bank of Tokyo, Japan | 1 | – |
| BNP Paribas Bank, Norway | 38 | 7 |
| Citibank N.A., Australia | 24 | 8 |
| Citibank N.A., India | 2 | 2 |
| Citibank N.A., Dubai | 1 | 1 |
| Citibank N.A., EEFC (U.S. Dollar account) | 56 | 1 |
| Citibank N.A., Hungary | 3 | 3 |
| Citibank N.A., Japan | 6 | 12 |
| Citibank N.A., New Zealand | 4 | 6 |
| Citibank N.A., South Africa | 15 | 9 |
| Citibank N.A., South Korea | – | 1 |
| Deutsche Bank, Philippines | 2 | 4 |
| Deutsche Bank, India | 9 | 9 |
| Deutsche Bank, EEFC (Euro account) | 8 | 11 |
| Deutsche Bank, EEFC (United Kingdom Pound Sterling account) | 4 | 8 |
| Deutsche Bank, EEFC (Australian Dollar account) | 2 | 38 |
| Deutsche Bank, EEFC (U.S. Dollar account) | 81 | 73 |
| Deutsche Bank, EEFC (Swiss Franc account) | 1 | 2 |
| Deutsche Bank, Belgium | 65 | 10 |
| Deutsche Bank, France | 9 | 8 |
| Deutsche Bank, Germany | 12 | 48 |
| Deutsche Bank, Malaysia | – | 7 |
| Deutsche Bank, Netherlands | 9 | 2 |
| Deutsche Bank, Russia (U.S. Dollar account) | 8 | 1 |
| Deutsche Bank, Russia | 9 | 3 |
| Deutsche Bank, Singapore | 1 | 6 |
| Deutsche Bank, Spain | 1 | – |
| Deutsche Bank, Switzerland | 5 | 5 |
| Deutsche Bank, Switzerland (U.S. Dollar Account) | – | 1 |
| Deutsche Bank, United Kingdom | 38 | 25 |
| HSBC Bank, Hong Kong | 1 | 1 |
| ICICI Bank, India | 8 | 40 |
| ICICI Bank, EEFC (U.S. Dollar account) | 6 | 3 |
| Nordbanken, Sweden | 2 | 22 |
| Punjab National Bank, India | 13 | 6 |
| Royal Bank of Canada, Canada | 10 | 5 |
| State Bank of India | 54 | 6 |
| 1,243 | 1,166 | |
(In
crore)
| Particulars | As at | |
| June 30, 2017 | March 31, 2017 | |
| In deposit accounts | ||
| Axis Bank | 945 | 945 |
| Barclays Bank | 825 | 825 |
| HDFC Bank | 2,299 | 349 |
| HSBC Bank | 500 | 500 |
| ICICI Bank | 4,557 | 4,351 |
| IDBI Bank | – | 1,750 |
| IndusInd Bank | 191 | 191 |
| Kotak Mahindra Bank | 500 | 500 |
| South Indian Bank | 200 | 200 |
| Standard Chartered Bank | – | 500 |
| Syndicate Bank | 49 | 49 |
| Yes Bank | 685 | 485 |
| 10,751 | 10,645 | |
| In unpaid dividend accounts | ||
| Axis Bank - Unpaid dividend account | 2 | 2 |
| HDFC Bank - Unpaid dividend account | 2 | 2 |
| ICICI Bank - Unpaid dividend account | 21 | 13 |
| 25 | 17 | |
| In margin money deposits against guarantees | ||
| Canara Bank | 175 | 177 |
| ICICI Bank | 235 | 217 |
| 410 | 394 | |
| Deposits with financial institution | ||
| HDFC Limited | 6,231 | 6,231 |
| LIC Housing Finance Limited | 700 | 700 |
| 6,931 | 6,931 | |
| Total cash and cash equivalents as per Balance Sheet | 19,360 | 19,153 |
2.7 OTHER ASSETS
(In crore)
| Particulars | As at | |
| June 30, 2017 | March 31, 2017 | |
| Non-current | ||
| Capital advances | 504 | 562 |
| Advances other than capital advance | ||
| Prepaid gratuity | 22 | 56 |
| Others | ||
| Prepaid expenses | 91 | 95 |
| Deferred contract cost | 271 | 283 |
| 888 | 996 | |
| Current | ||
| Advances other than capital advance | ||
| Payment to vendors for supply of goods | 65 | 87 |
| Others | ||
| Prepaid expenses (1) | 473 | 387 |
| Deferred contract cost | 75 | 74 |
| Withholding taxes and others | 1,813 | 1,665 |
| 2,426 | 2,213 | |
| Total other assets | 3,314 | 3,209 |
| (1) Includes dues from subsidiaries (Refer note 2.20) | 91 | 56 |
Deferred contract costs are upfront costs incurred for the contract and are amortized over the term of the contract. Withholding taxes and others primarily consist of input tax credits.
2.8 FINANCIAL INSTRUMENTS
Financial instruments by category
The carrying value and fair value of financial instruments by categories as of June 30, 2017 were as follows:
(In
crore)
| Particulars | Amortised cost |
Financial assets/ liabilities at fair value through profit or loss |
Financial assets/liabilities at fair value through OCI |
Total carrying value | Total fair value | ||
| Designated upon initial recognition | Mandatory | Equity instruments designated upon initial recognition | Mandatory | ||||
| Assets: | |||||||
| Cash and cash equivalents (Refer Note 2.6) | 19,360 | – | – | – | – | 19,360 | 19,360 |
| Investments (Refer note 2.2) | |||||||
| Equity and preference securities and others | – | – | 3 | 132 | – | 135 | 135 |
| Tax free bonds and government bonds | 1,834 | – | – | – | – | 1,834 | 2,139 |
| Liquid mutual fund units | – | – | 1,270 | – | – | 1,270 | 1,270 |
| Redeemable, non-convertible debentures (1) | 2,129 | – | – | – | – | 2,129 | 2,129 |
| Fixed maturity plans | – | – | 517 | – | – | 517 | 517 |
| Certificates of deposit | – | – | – | – | 7,892 | 7,892 | 7,892 |
| Non convertible debentures | – | – | – | – | 3,720 | 3,720 | 3,720 |
| Trade receivables (Refer Note 2.5) | 11,262 | – | – | – | – | 11,262 | 11,262 |
| Loans (Refer note 2.3) | 298 | – | – | – | – | 298 | 298 |
| Other financial assets (Refer Note 2.4) | 5,792 | – | 20 | – | – | 5,812 | 5,812 |
| Total | 40,675 | – | 1,810 | 132 | 11,612 | 54,229 | |
| Liabilities: | |||||||
| Trade payables (Refer Note 2.11) | 485 | – | – | – | – | 485 | 485 |
| Other financial liabilities (Refer Note 2.10) | 4,050 | – | 48 | – | 37 | 4,135 | 4,135 |
| Total | 4,535 | – | 48 | – | 37 | 4,620 | |
(1) The carrying value of debentures approximates fair value as the instruments are at prevailing market rates
* On account of fair value changes including interest accrued
The carrying value and fair value of financial instruments by categories as of March 31, 2017 were as follows:
(In
crore)
| Particulars | Amortised cost |
Financial assets/ liabilities at fair value through profit or loss |
Financial assets/liabilities at fair value through OCI |
Total carrying value | Total fair value | ||
| Designated upon initial recognition | Mandatory | Equity instruments designated upon initial recognition | Mandatory | ||||
| Assets: | |||||||
| Cash and cash equivalents (Refer Note 2.6) | 19,153 | – | – | – | – | 19,153 | 19,153 |
| Investments (Refer Note 2.2) | |||||||
| Equity and preference securities | – | – | 3 | 132 | – | 135 | 135 |
| Tax free bonds and government bonds | 1,833 | – | – | – | – | 1,833 | 2,142 |
| Liquid mutual fund units | – | – | 1,755 | – | – | 1,755 | 1,755 |
| Redeemable, non-convertible debentures (1) | 2,129 | – | – | – | – | 2,129 | 2,129 |
| Fixed maturity plans | – | – | 508 | – | – | 508 | 508 |
| Certificates of deposit | – | – | – | – | 7,635 | 7,635 | 7,635 |
| Non convertible debentures | – | – | – | – | 3,677 | 3,677 | 3,677 |
| Trade receivables (Refer Note 2.5) | 10,960 | – | – | – | – | 10,960 | 10,960 |
| Loans (Refer note 2.3) | 315 | – | – | – | – | 315 | 315 |
| Other financial assets (Refer Note 2.4) | 5,351 | – | 216 | – | 52 | 5,619 | 5,619 |
| Total | 39,741 | – | 2,482 | 132 | 11,364 | 53,719 | |
| Liabilities: | |||||||
| Trade payables (Refer note 2.11) | 269 | – | – | – | – | 269 | 269 |
| Other financial liabilities (Refer Note 2.10) | 3,867 | – | 87 | – | – | 3,954 | 3,954 |
| Total | 4,136 | – | 87 | – | – | 4,223 | |
(1) The carrying value of debentures approximates fair value as the instruments are at prevailing market rates
* On account of fair value changes including interest accrued
Fair value hierarchy
Level 1- Quoted prices (unadjusted) in active markets for identical assets or liabilities.
Level 2– Inputs other than quoted prices included within Level 1 that are observable for the asset or liability, either directly (i.e. as prices) or indirectly (i.e. derived from prices).
Level 3- Inputs for the assets or liabilities that are not based on observable market data (unobservable inputs).
The following table presents fair value hierarchy of assets and liabilities measured at fair value on a recurring basis as of June 30, 2017:
(In crore)
| Particulars | As of June 30, 2017 |
Fair value measurement at end of
the | ||
| Level 1 | Level 2 | Level 3 | ||
| Assets | ||||
| Investments in liquid mutual fund units (Refer Note 2.2) | 1,270 | 1,270 | – | – |
| Investments in tax free bonds (Refer Note 2.2) | 2,138 | 1,966 | 172 | – |
| Investments in government bonds (Refer Note 2.2) | 1 | 1 | – | – |
| Investments in equity instruments (Refer Note 2.2) | 1 | – | – | 1 |
| Investments in preference securities (Refer Note 2.2) | 131 | – | – | 131 |
| Investments in fixed maturity plans (Refer Note 2.2) | 517 | – | 517 | – |
| Investments in certificates of deposit (Refer Note 2.2) | 7,892 | – | 7,892 | – |
| Investments in non convertible debentures (Refer Note 2.2) | 3,720 | 3,193 | 527 | – |
| Other investments (Refer Note 2.2) | 3 | – | – | 3 |
| Derivative financial instruments - gain on foreign currency forward and option contracts (Refer Note 2.4) | 20 | – | 20 | – |
| Liabilities | ||||
| Derivative financial instruments -loss on foreign currency forward and option contracts (Refer Note 2.10) | 44 | – | 44 | – |
| Liability towards contingent consideration (Refer note 2.10)(1)(2) | 41 | – | – | 41 |
| (1) | Pertains to contingent consideration payable to selling shareholders of Kallidus as per the share purchase agreement. |
| (2) | Discounted $7 million (approximately 45 crore)
at 14% |
During the three months ended June 30, 2017, tax
free bonds of 1,753 crore were transferred from Level 2 to Level 1 of fair value hierarchy, since these were valued based on
quoted prices.
The following table presents fair value hierarchy of assets and liabilities measured at fair value on a recurring basis as of March 31, 2017:
(In
crore)
| Particulars | As of March 31, 2017 |
Fair value measurement at end of the reporting period/year using | ||
| Level 1 | Level 2 | Level 3 | ||
| Assets | ||||
| Investments in liquid mutual fund units (Refer Note 2.2) | 1,755 | 1,755 | – | – |
| Investments in tax free bonds (Refer Note 2.2) | 2,142 | 206 | 1,936 | – |
| Investments in equity instruments (Refer Note 2.2) | 1 | – | – | 1 |
| Investments in preference securities (Refer Note 2.2) | 131 | – | – | 131 |
| Investments in fixed maturity plans (Refer Note 2.2) | 508 | – | 508 | – |
| Investments in certificates of deposit (Refer Note 2.2) | 7,635 | – | 7,635 | – |
| Investments in non convertible debentures (Refer Note 2.2) | 3,677 | 3,160 | 517 | – |
| Other investments (Refer Note 2.2) | 3 | – | – | 3 |
| Derivative financial instruments - gain on outstanding foreign currency forward and option contracts (Refer Note 2.4) | 268 | – | 268 | – |
| Liabilities | ||||
| Derivative financial instruments - loss on outstanding foreign currency forward and option contracts (Refer note 2.10) | 2 | – | 2 | – |
| Liability towards contingent consideration (Refer note 2.10)(1)(2) | 85 | – | – | 85 |
| (1) | Pertains to contingent consideration payable to selling shareholders of Kallidus as per the share purchase agreement. |
| (2) | Discounted $14 million (approximately
91 crore) at 14.2% |
A one percentage point change in the unobservable inputs used in fair valuation of Level 3 assets and liabilities does not have a significant impact in its value.
The movement in contingent consideration
as of June 30, 2017 from March 31, 2017 is on account of settlement of contingent consideration of 45 crore and change in discount
rate and passage of time.
The fair value of liquid mutual funds is based on quoted price. The fair value of tax free bonds and government bonds is based on quoted prices and market observable inputs. The fair value is of non-convertible debentures is based on quoted prices and market observable inputs. The fair value of fixed maturity plan securities and certificates of deposit is based on market observable inputs. Derivative financial instruments are valued based on quoted prices for similar assets and liabilities in active markets or inputs that are directly or indirectly observable in the marketplace. The fair value of investments in unquoted equity, preference and other investments is determined using Level 3 inputs like Discounted cash flows, Market multiple method, Option pricing model, etc.
Financial risk management
Financial risk factors
The Company's activities expose it to a variety of financial risks: market risk, credit risk and liquidity risk. The Company's focus is to foresee the unpredictability of financial markets and seek to minimize potential adverse effects on its financial performance. The primary market risk to the Company is foreign exchange risk. The Company uses derivative financial instruments to mitigate foreign exchange related risk exposures. The Company's exposure to credit risk is influenced mainly by the individual characteristic of each customer and the concentration of risk from the top few customers.
Market risk
The Company operates internationally and a major portion of the business is transacted in several currencies and consequently the Company is exposed to foreign exchange risk through its sales and services in the United States and elsewhere, and purchases from overseas suppliers in various foreign currencies. The Company holds derivative financial instruments such as foreign exchange forward and option contracts to mitigate the risk of changes in exchange rates on foreign currency exposures. The exchange rate between the rupee and foreign currencies has changed substantially in recent years and may fluctuate substantially in the future. Consequently, the results of the Company’s operations are adversely affected as the rupee appreciates/ depreciates against these currencies.
The following table analyzes foreign currency risk from financial instruments as of June 30, 2017:
(In crore)
| Particulars | U.S. dollars | Euro | United Kingdom Pound Sterling | Australian dollars | Other currencies | Total |
| Cash and cash equivalents | 879 | 102 | 42 | 26 | 108 | 1,157 |
| Trade receivables | 7,651 | 1,141 | 802 | 603 | 406 | 10,603 |
| Other financials assets ( including loans) | 2,349 | 437 | 338 | 150 | 131 | 3,405 |
| Trade payables | (234) | (18) | (29) | (35) | (35) | (351) |
| Other financial liabilities | (2,011) | (256) | (182) | (183) | (107) | (2,739) |
| Net assets / (liabilities) | 8,634 | 1,406 | 971 | 561 | 503 | 12,075 |
The following table analyzes foreign currency risk from financial instruments as of March 31, 2017:
(In crore)
| Particulars | U.S. dollars | Euro | United Kingdom Pound Sterling | Australian dollars | Other currencies | Total |
| Cash and cash equivalents | 849 | 79 | 33 | 45 | 97 | 1,103 |
| Trade Receivables | 7,611 | 1,005 | 793 | 533 | 361 | 10,303 |
| Other financials assets ( including loans) | 2,686 | 436 | 365 | 148 | 136 | 3,771 |
| Trade payables | (145) | (5) | (11) | (12) | (22) | (195) |
| Other financial liabilities | (1,847) | (227) | (169) | (186) | (137) | (2,566) |
| Net assets / (liabilities) | 9,154 | 1,288 | 1,011 | 528 | 435 | 12,416 |
For the three months ended June 30, 2017 and June 30, 2016, every percentage point depreciation / appreciation in the exchange rate between the Indian rupee and U.S. dollar, has affected the Company's incremental operating margins by approximately 0.52% and 0.50%, respectively.
Sensitivity analysis is computed based on the changes in the income and expenses in foreign currency upon conversion into functional currency, due to exchange rate fluctuations between the previous reporting period and the current reporting period.
Derivative financial instruments
The Company holds derivative financial instruments such as foreign currency forward and option contracts to mitigate the risk of changes in exchange rates on foreign currency exposures. The counterparty for these contracts is generally a bank. These derivative financial instruments are valued based on quoted prices for similar assets and liabilities in active markets or inputs that are directly or indirectly observable in the marketplace.
The following table gives details in respect of outstanding foreign exchange forward and option contracts:
| Particulars | As of | |||
| June 30, 2017 | March 31, 2017 | |||
| In million | In
crore |
In million | In
crore | |
| Derivatives designated as cash flow hedges | ||||
| Forward contracts | ||||
| In Euro | 70 | 516 | 95 | 658 |
| In United Kingdom Pound Sterling | 45 | 377 | 40 | 324 |
| In Australian dollars | 90 | 447 | 130 | 644 |
| Option Contracts | ||||
| In Euro | 65 | 479 | 40 | 277 |
| In United Kingdom Pound Sterling | 10 | 84 | – | – |
| In Australian dollars | 40 | 198 | – | – |
| Other derivatives | ||||
| Forward contracts | ||||
| In U.S. dollars | 515 | 3,326 | 480 | 3,113 |
| In Euro | 86 | 634 | 106 | 735 |
| In United Kingdom Pound Sterling | 90 | 754 | 70 | 566 |
| In Australian dollars | 30 | 149 | 30 | 149 |
| In Swiss Franc | – | – | 10 | 65 |
| In Singapore dollars | 5 | 23 | 5 | 23 |
| In Swedish Krona | 50 | 38 | 50 | 36 |
| In New Zealand dollars | 5 | 24 | – | – |
| In Canadian dollars | 13 | 65 | – | – |
| Option Contracts | ||||
| In U.S. dollars | 223 | 1,437 | 195 | 1,265 |
| In Euro | 45 | 332 | 25 | 173 |
| In United Kingdom Pound Sterling | 20 | 167 | 30 | 243 |
| In Canadian dollars | – | – | 13 | 65 |
| Total forwards and options | 9,050 | 8,336 | ||
The foreign exchange forward and option contracts mature within twelve months. The table below analyzes the derivative financial instruments into relevant maturity groupings based on the remaining period as of the balance sheet date:
(In crore)
| Particulars | As of | |
| June 30, 2017 | March 31, 2017 | |
| Not later than one month | 2,708 | 2,215 |
| Later than one month and not later than three months | 4,790 | 4,103 |
| Later than three months and not later than one year | 1,552 | 2,018 |
| 9,050 | 8,336 | |
During the three months ended June 30, 2017, the Company has designated certain derivative contracts as cash flow hedges to mitigate the risk of foreign exchange exposure on highly probable forecast cash transactions. The related hedge transactions for balance in cash flow hedging reserve are expected to occur and reclassified to revenue in the statement of profit or loss within 3 months.
Hedge effectiveness is determined at the inception of the hedge relationship, and through periodic prospective effectiveness assessments to ensure that an economic relationship exists between the hedged item and hedging instrument, including whether the hedging instrument is expected to offset changes in cash flows of hedged items.
If the hedge ratio for risk management purposes is no longer optimal but the risk management objective remains unchanged and the hedge continues to qualify for hedge accounting, the hedge relationship will be rebalanced by adjusting either the volume of the hedging instrument or the volume of the hedged item so that the hedge ratio aligns with the ratio used for risk management purposes. Any hedge ineffectiveness is calculated and accounted for in profit or loss at the time of the hedge relationship rebalancing.
The following table provides the reconciliation of cash flow hedge reserve for the three months ended June 30, 2017:
(In crore)
| Three months ended June 30, 2017 | |
| Balance at the beginning of the period | 39 |
| Gain / (Loss) recognised in other comprehensive income during the period | (41) |
| Amount reclassified to revenue during the period | (47) |
| Tax impact on above | 22 |
| Balance at the end of the period | (27) |
The Company offsets a financial asset and a financial liability when it currently has a legally enforceable right to set off the recognized amounts and the Company intends either to settle on a net basis, or to realise the asset and settle the liability simultaneously.
The following table provides quantitative information about offsetting of derivative financial assets and derivative financial liabilities:
(In crore)
| Particulars | As of | |||
| June 30, 2017 | March 31, 2017 | |||
| Derivative financial asset | Derivative financial liability | Derivative financial asset |
Derivative financial liability | |
| Gross amount of recognized financial asset/liability | 40 | (64) | 269 | (3) |
| Amount set off | (20) | 20 | (1) | 1 |
| Net amount presented in balance sheet | 20 | (44) | 268 | (2) |
Credit risk
Credit risk refers to the risk of default on
its obligation by the counterparty resulting in a financial loss. The maximum exposure to the credit risk at the reporting date
is primarily from trade receivables amounting to 11,262 crore and 10,960 crore as of June 30, 2017 and March 31, 2017, respectively
and unbilled revenue amounting to 3,330 crore and 3,200 crore as of June 30, 2017 and March 31, 2017, respectively. Trade receivables
and unbilled revenue are typically unsecured and are derived from revenue earned from customers primarily located in the United
States. Credit risk has always been managed by the group through credit approvals, establishing credit limits and continuously
monitoring the creditworthiness of customers to which the Group grants credit terms in the normal course of business. On account
of adoption of Ind AS 109, the group uses expected credit loss model to assess the impairment loss or gain. The group uses a provision
matrix to compute the expected credit loss allowance for trade receivables and unbilled revenues. The provision matrix takes into
account available external and internal credit risk factors such as credit default swap quotes, credit ratings from international
credit rating agencies and the Group's historical experience for customers.
The following table gives details in respect of percentage of revenues generated from top customer and top ten customers:
(In %)
| Particulars | Three months ended, | |
| June 30, 2017 | June 30, 2016 | |
| Revenue from top customer | 3.8 | 4.1 |
| Revenue from top ten customers | 21.8 | 24.9 |
Credit risk exposure
The reversal for lifetime expected credit loss
on customer balances for the three months ended June 30, 2017 was 8 crore .The allowance for lifetime expected credit loss on
customer balances for the three months ended June 30, 2016 was 23 crore.
(In
crore)
| Particulars | Three months ended June 30, | |
| 2017 | 2016 | |
| Balance at the beginning | 379 | 249 |
| Impairment loss recognised/ reversed | (8) | 23 |
| Amounts written off | (3) | – |
| Translation differences | 1 | 3 |
| Balance at the end | 369 | 275 |
Credit risk on cash and cash equivalents is limited as we generally invest in deposits with banks and financial institutions with high credit ratings assigned by international and domestic credit rating agencies. Investments primarily include investment in liquid mutual fund units, fixed maturity plan securities, quoted bonds issued by government and quasi government organizations, non convertible debentures issued by government aided institutions and certificates of deposit.
Liquidity risk
The Company's principal sources of liquidity are cash and cash equivalents and the cash flow that is generated from operations. The Company has no outstanding bank borrowings. The Company believes that the working capital is sufficient to meet its current requirements. Accordingly, no liquidity risk is perceived.
As of June 30, 2017, the Company had a working
capital of 34,926 crore including cash and cash equivalents of
19,360 crore and current investments of
9,793 crore. As of March 31, 2017, the Company had a working capital of 35,896 crore including cash and cash equivalents
of 19,153 crore and current investments of 9,643 crore.
As of June 30, 2017 and March 31, 2017, the outstanding
compensated absences were 1,181 crore and 1,142 crore, respectively, which have been substantially funded. Accordingly, no liquidity
risk is perceived.
The table below provides details regarding the contractual maturities of significant financial liabilities as of June 30, 2017:
(In crore)
| Particulars | Less than 1 year | 1-2 years | 2-4 years | 4-7 years | Total |
| Trade payables | 485 | – | – | – | 485 |
| Other financial liabilities (excluding liability towards acquisition) (Refer Note 2.10) | 4,050 | – | – | – | 4,050 |
| Liability towards acquisitions on an undiscounted basis (including contingent consideration) | 45 | – | – | – | 45 |
The table below provides details regarding the contractual maturities of significant financial liabilities as of March 31, 2017:
(In crore)
| Particulars | Less than 1 year | 1-2 years | 2-4 years | 4-7 years | Total |
| Trade payables | 269 | – | – | – | 269 |
| Other liabilities (excluding liability towards acquisition) (Refer Note 2.10) | 3,867 | – | – | – | 3,867 |
| Liability towards acquisitions on an undiscounted basis (including contingent consideration) | 45 | 46 | – | – | 91 |
2.9 EQUITY
EQUITY SHARE CAPITAL
In crore,except as otherwise stated
| Particulars | As at | |
| June 30, 2017 | March 31, 2017 | |
| Authorized | ||
| Equity shares, 5/- par value |
||
| 240,00,00,000 (240,00,00,000(2)) equity shares | 1,200 | 1,200 |
| Issued, Subscribed and Paid-Up | ||
| Equity shares, 5/- par value (1) |
1,148 | 1,148 |
| 229,69,44,664 (229,69,44,664(2)) equity shares fully paid-up | ||
| 1,148 | 1,148 | |
(1) Refer note 2.18 for details of basic and diluted shares
(2) Represents number of shares as of March 31, 2017
Forfeited shares amounted to 1,500/- (1,500/-)
The Company has only one class of shares referred
to as equity shares having a par value of 5/-. Each holder of equity shares is entitled to one vote per share. The equity shares
represented by American Depositary Shares (ADS) carry similar rights to voting and dividends as the other equity shares. Each ADS
represents one underlying equity share.
Dividends
The Company declares and pays dividends in Indian rupees. The remittance of dividends outside India is governed by Indian law on foreign exchange and is subject to applicable distribution taxes.
The amount of per share dividend recognized as
distributions to equity shareholders for the three months ended June 30, 2017 was 14.75/- per equity share. The amount was recognized
as distributions to equity shareholders during the quarter ended June 30, 2017 and the total appropriation was 4,078 crore, including
corporate dividend tax.
The amount of per share dividend recognized as
distributions to equity shareholders for the three months ended June 30, 2016 was 14.25/- per equity share. The amount was recognized
as distributions to equity shareholders during the quarter ended June 30, 2016 and the total appropriation was 3,939 crore, including
corporate dividend tax.
Capital allocation policy
The Board, in its meeting on April 13, 2017, reviewed
and approved a revised Capital Allocation Policy of the Company after taking into consideration the strategic and operational cash
requirements of the Company in the medium term:
The key aspects of the Capital Allocation Policy are:
1. The Company’s current policy is to pay dividends of up to 50% of post-tax profits of the Financial Year. Effective from
Financial Year 2018, the Company expects to payout up to 70% of the free cash flow of the corresponding Financial Year in such
manner (including by way of dividend and/or share buyback) as may be decided by the Board from time to time, subject to applicable
laws and requisite approvals, if any. Free cash flow is defined as net cash provided by operating activities less capital expenditure
as per the consolidated statement of cash flows prepared under IFRS. Dividend payout includes dividend distribution tax.
2. Additionally, the Board has identified an amount of up to 13,000 crore ($2 billion) to be paid out to shareholders during Financial
Year 2018, in such manner (including by way of dividend and/ or share buyback), to be decided by the Board, subject to applicable
laws and requisite approvals, if any.
Employee Stock Option Plan (ESOP):
2015 Stock Incentive Compensation Plan (the 2015 Plan): On March 31, 2016, pursuant to the approval by the shareholders through postal ballot, the Board has been authorized to introduce, offer, issue and allot share-based incentives to eligible employees of the Company and its subsidiaries under the 2015 Stock Incentive Compensation Plan (the 2015 Plan). The maximum number of shares under the 2015 plan shall not exceed 24,038,883 equity shares (this includes 1,12,23,576 equity shares which are held by the trust towards the 2011 Plan as at March 31, 2016). Out of this 17,038,883 equity shares will be issued as RSUs at par value and 7,000,000 equity shares will be issued as stock options at market price on the date of the grant. These instruments will vest over a period of 4 years and the Company expects to grant the instruments under the 2015 Plan over the period of 4 to 7 years.
Controlled trust holds 1,12,64,702 and 1,12,89,514 shares, as of June 30, 2017 and March 31, 2017, respectively under the 2015 plan, out of which 100,000 equity shares have been earmarked for welfare activities of the employees.
Stock incentives granted to CEO:
Pursuant to the approval from the shareholders
through postal ballot on March 31, 2016, Dr. Vishal Sikka is eligible to receive under the 2015 Plan, an annual grant of time-based
RSUs of fair value $2 million which vest over time, subject to continued service, and an annual grant of performance based equity
and stock options of $5 million subject to achievement of performance targets set by the Board or its committee, which vest over
time. Time based RSUs of fair value of $2 million (approximately 13.42 crore) for financial year 2017 was granted on August 1,
2016 amounting to 120,700 RSUs in equity shares represented by ADSs.
Based on fiscal 2017 performance evaluation, the
Board, on the recommendations of nomination and remuneration committee, approved on April 13, 2017, performance based equity and
stock options for fiscal 2017 comprising 1,32,483 RSUs amounting to US$ 1.9 million (approximately 12.91 crore) and 3,30,525 ESOPs
amounting to US$ 0.96 million (approximately 6.46 crore). Further, the Board, also approved the annual time-based vesting grant
for fiscal 2018 to Dr. Vishal Sikka, comprising of 1,37,741 RSUs amounting to US$2 million (approximately 12.97 crore).These RSUs
and ESOPs have been granted effective May 2, 2017. The exercise price of the RSU's will be equal to the par value of the shares
and the exercise price of the stock options would be the market price as on the date of grant, as approved by the shareholders.
Though the performance based awards for fiscal 2018 and the time based RSU’s for the remaining employment term have not been
granted as of June 30, 2017, in accordance with Ind AS 102 Share-based Payment, the Company has recorded employee stock based compensation
expense. The Company has recorded employee stock based compensation expense of 10 crore and 9 crore during the three months ended
June 30, 2017 and June 30, 2016 towards CEO compensation.
Stock incentives granted to COO:
The Nomination and Remuneration Committee in its
meeting held on October 14, 2016 recommended a grant of 27,250 RSUs and 43,000 ESOPs amounting to 4 crore to U.B.Pravin Rao, under
the 2015 Plan and the same was approved by the shareholders through postal ballot on March 31, 2017. These RSUs and ESOPs have
been granted w.e.f May 2, 2017. These RSUs and stock options would vest over a period of 4 years and shall be exercisable within
the period as approved by the Committee. The exercise price of the RSU's will be equal to the par value of the shares and the exercise
price of the stock options would be the market price as on the date of grant, as approved by the shareholders.
Stock incentives granted to KMP (other than CEO and COO)
On November 1, 2016, 245,750 RSUs and 502,550 stock options were granted under the 2015 plan, to key management personnel, excluding CEO and COO, based on fiscal 2016 performance. Additionally, on November 1, 2016, 1,500 RSUs were granted to the Acting General Counsel and the same were outstanding as of June 30, 2017. These RSUs and stock options will vest over a period of 4 years and shall be exercisable within the period as approved by the Committee. The exercise price of the RSUs will be equal to the par value of the shares and the exercise price of the stock options would be the market price as on the date of grant.
During the three months ended June 30, 2017 and
June 30, 2016, we recorded an employee stock compensation expense of 12 crore and 9 crore, respectively towards key managerial
personnel including CEO and COO.
Stock incentive granted to other employees:
During fiscal 2017, the Company granted 2,506,740 RSUs and 703,300 ESOPs and 112,210 incentive units (cash settled) to certain eligible employees at mid and senior levels under the 2015 plan. Further, on May 2, 2017, the Company granted 37,090 RSUs (includes equity shares and equity shares represented by ADS) at par value, 73,600 employee stock options (ESOPs) (including equity shares and equity shares represented by ADS) to be exercised at market price at the time of grant, to certain employees at the senior management level. These instruments will vest over a period of 4 years and are subject to continued service.
The Company recorded an employee stock compensation
expense in the Statement of Profit and Loss for the three months ended June 30, 2017 and June 30, 2016 of 43 crore and 9 crore
respectively. Further, the cash settled stock compensation expense (included above) for the three months ended June 30, 2017 and
June 30, 2016 was less than 1 crore and Nil respectively. This comprises of expense pertaining to CEO, COO, other KMP and other
employees. As of June 30, 2017 and March 31, 2017 94,090 and 106,845 incentive units were outstanding (net of forfeitures).
2011 RSU Plan (the 2011 Plan) now called 2015
Stock Incentive Compensation Plan ( the 2015 Plan):The Company had a 2011 RSU Plan which provided for the grant of restricted
stock units (RSUs) to eligible employees of the Company. The Board of Directors recommended the establishment of the 2011 Plan
to the shareholders on August 30, 2011 and the shareholders approved the recommendation of the Board of Directors on October 17,
2011 through a postal ballot. The maximum aggregate number of shares that may be awarded under the plan was 1,13,34,400 as on date
of approval of plan adjusted for bonus shares and the plan was expected to continue in effect for a term of 10 years from the date
of initial grant under the plan. Awards have been granted to Dr. Vishal Sikka under the 2011 RSU plan as detailed below. Further
the Company has earmarked 1,00,000 equity shares for welfare activities of the employees, approved by the shareholders vide postal
ballot which ended on March 31, 2016. The equity shares as of March 31, 2016 held under this plan, i.e. 1,12,23,576 equity shares
(this includes the aggregate number of equity shares that may be awarded under the 2011 Plan as reduced by 10,824 equity shares
already exercised by Dr. Vishal Sikka and 1,00,000 equity shares which have been earmarked for welfare activities of the employees)
have been subsumed under the 2015 Plan.
During the year ended March 31, 2015, the Company made a grant of 108,268 restricted stock units (adjusted for bonus issues) to
Dr. Vishal Sikka, Chief Executive Officer and Managing Director. The Board in its meeting held on June 22, 2015, on recommendation
of The Nomination and Remuneration Committee, further granted 1,24,061 RSUs to Dr. Vishal Sikka. These RSUs are vesting over a
period of four years from the date of the grant in the proportions specified in the award agreement. The RSUs will vest subject
to achievement of certain key performance indicators as set forth in the award agreement for each applicable year of the vesting
tranche and continued employment through each vesting date.
The award granted to Dr. Vishal Sikka on June 22, 2015 was modified by the Nomination and remuneration committee on April 14, 2016.
There is no modification or change in the total number of RSUs granted or the vesting period (which is four years). The modifications
relate to the criteria of vesting for each of the years. Based on the modification, the first tranche of the RSUs will vest subject
to achievement of certain key performance indicators for the year ended March 31, 2016. Subsequent vesting of RSU's for each of
the remaining years would be subject to continued employment.
The activity in the 2015 Plan (formerly 2011 RSU Plan) for equity-settled share based payment transactions during the three months ended June 30, 2017 and June 30, 2016 is set out below:
| Particulars | Three months ended June 30, 2017 |
Three months ended June 30, 2016 | ||
| Shares arising out of options | Weighted average exercise price () |
Shares arising out of options | Weighted average exercise price () | |
| 2015 Plan Indian equity shares (RSU - IES) | ||||
| Outstanding at the beginning | 2,003,928 | 5 | 221,505 | 5 |
| Granted | 31,750 | 5 | – | – |
| Forfeited and expired | 31,695 | 5 | – | – |
| Exercised | 24,812 | 5 | 12,406 | 5 |
| Outstanding at the end | 1,979,171 | 5 | 209,099 | 5 |
| Exercisable at the end | – | – | – | – |
| 2015 Plan Employee Stock Options (ESOPs- IES) | ||||
| Outstanding at the beginning | 309,650 | 998 | – | – |
| Granted | 50,200 | 919 | – | – |
| Forfeited and expired | – | – | – | – |
| Exercised | – | – | – | – |
| Outstanding at the end | 359,850 | 987 | – | – |
| Exercisable at the end | – | – | – | – |
| Particulars | Three months ended June 30, 2017 | |
| Shares arising out of options | Weighted average exercise price ($) | |
| 2015 Plan American Depository Shares (RSU - ADS) | ||
| Outstanding at the beginning | 957,445 | 0.07 |
| Granted | 302,814 | 0.07 |
| Forfeited and expired | 13,425 | 0.07 |
| Exercised | – | – |
| Outstanding at the end | 1,246,834 | 0.07 |
| Exercisable at the end | – | – |
| 2015 Plan Employee Stock Options (ESOPs- ADS) | ||
| Outstanding at the beginning | 888,000 | 15.26 |
| Granted | 396,925 | 14.54 |
| Forfeited and expired | – | – |
| Exercised | – | – |
| Outstanding at the end | 1,284,925 | 15.05 |
| Exercisable at the end | – | – |
There was no activity in 2015 plan during the three months ended June 30, 2016 involving equity shares represented by ADS
During the three months ended June 30, 2017, the
weighted average share price of options exercised under the 2015 Plan on the date of exercise was 943/-
During the three months ended June 30, 2016, the
weighted average share price of options exercised under the 2015 Plan on the date of exercise was 1,206/-
The following table summarizes information about equity settled RSUs and ESOPs outstanding as of June 30, 2017:
| Options outstanding | |||
| Range of exercise prices per share () |
No. of shares arising out of options | Weighted average remaining contractual life | Weighted average exercise price () |
| 2015 Plan: ADS and IES | |||
| 0 - 5 (RSU) | 3,226,005 | 1.71 | 5.00 |
| 900 - 1100 (ESOP) | 1,644,775 | 6.98 | 974.50 |
| 4,870,780 | 3.49 | 332.38 | |
The following table summarizes information about equity settled RSUs and ESOPs outstanding as of March 31, 2017:
| Range of exercise prices per share () |
No. of shares arising out of options | Weighted average remaining contractual life | Weighted average exercise price () |
| 2015 Plan: ADS and IES | |||
| 0 - 5 (RSU) | 2,961,373 | 1.88 | 5.00 |
| 900 - 1100 (ESOP) | 1,197,650 | 7.09 | 1,026.50 |
| 4,159,023 | 3.38 | 299.16 |
The fair value of each equity settled RSU is estimated on the date of grant using the Black-Scholes-Merton model with the following assumptions:
| Particulars | For options granted in | |||
| Fiscal 2018- Equity Shares-RSU |
Fiscal 2018- Equity shares ESOP |
Fiscal 2018- ADS-RSU |
Fiscal 2018- ADS- ESOP | |
| Weighted average share price () / ($- ADS) |
923 | 923 | 14.52 | 14.52 |
| Exercise price ()/ ($- ADS) |
5.00 | 919 | 0.07 | 14.54 |
| Expected volatility (%) | 21-25 | 25-28 | 23-26 | 25-31 |
| Expected life of the option (years) | 1 - 4 | 3 - 7 | 1 - 4 | 3 - 7 |
| Expected dividends (%) | 2.78 | 2.78 | 2.74 | 2.74 |
| Risk-free interest rate (%) | 6 - 7 | 6 - 7 | 1 - 2 | 1 - 2 |
| Weighted average fair value as on grant date () / ($- ADS) |
857 | 254 | 13.50 | 2.91 |
| Particulars | For options granted in | |||
| Fiscal 2017- Equity Shares-RSU |
Fiscal 2017- Equity shares ESOP |
Fiscal 2017- ADS-RSU |
Fiscal 2017- ADS- ESOP | |
| Weighted average share price () / ($- ADS) |
1,067 | 989 | 15.77 | 15.26 |
| Exercise price ()/ ($- ADS) |
5.00 | 998 | $0.07 | 15.26 |
| Expected volatility (%) | 24-29 | 27-29 | 26-29 | 27-31 |
| Expected life of the option (years) | 1 - 4 | 3 - 7 | 1 - 4 | 3 - 7 |
| Expected dividends (%) | 2.37 | 2.37 | 2.29 | 2.29 |
| Risk-free interest rate (%) | 6- 7 | 6- 7 | 1 - 2 | 1 - 2 |
| Weighted average fair value as on grant date () / ($- ADS) |
1,002 | 285 | 14.84 | 3.46 |
The expected life of the RSU / ESOP is estimated based on the vesting term and contractual term of the RSU / ESOP, as well as expected exercise behaviour of the employee who receives the RSU / ESOP. Expected volatility during the expected term of the RSU / ESOP is based on historical volatility of the observed market prices of the Company's publicly traded equity shares during a period equivalent to the expected term of the RSU / ESOP.
2.10 OTHER FINANCIAL LIABILITIES
(In crore)
| Particulars | As at | |
| June 30, 2017 | March 31, 2017 | |
| Non-current | ||
| Payable for acquisition of business | – | 40 |
| – | 40 | |
| Current | ||
| Unpaid dividends | 25 | 17 |
| Others | ||
| Accrued compensation to employees | 1,809 | 1,404 |
| Accrued expenses (1) | 2,033 | 2,013 |
| Retention monies | 133 | 153 |
| Payable for acquisition of business | ||
| -Contingent consideration | 41 | 45 |
| Client deposits | 9 | 25 |
| Capital creditors | 25 | 36 |
| Compensated absences | 1,181 | 1,142 |
| Other payables (2) | 16 | 219 |
| Foreign currency forward and options contracts | 44 | 2 |
| 5,316 | 5,056 | |
| Total financial liabilities | 5,316 | 5,096 |
| Financial liability carried at amortized cost | 4,050 | 3,867 |
| Financial liability carried at fair value through profit or loss | 48 | 87 |
| Financial liability carried at fair value through other comprehensive income | 37 | – |
| Liability towards acquisition of business on undiscounted basis | 45 | 91 |
| (1) Includes dues to subsidiaries (Refer note 2.20) | – | 3 |
| (2) Includes dues to subsidiaries (Refer note 2.20) | 4 | 14 |
2.11 TRADE PAYABLES
(In crore)
| Particulars | As at | |
| June 30, 2017 | March 31, 2017 | |
| Trade payables * | 485 | 269 |
| 485 | 269 | |
| *Includes dues to subsidiaries (refer note 2.20) | 138 | 135 |
2.12 OTHER LIABILITIES
(In crore)
| Particulars | As at | |
| June 30, 2017 | March 31, 2017 | |
| Non current | ||
| Deferred income | 40 | 42 |
| 40 | 42 | |
| Unearned revenue | 1,520 | 1,320 |
| Others | ||
| Tax on dividend | 690 | – |
| Withholding taxes and others | 1,033 | 1,027 |
| Deferred rent | 11 | 2 |
| 3,254 | 2,349 | |
| 3,294 | 2,391 | |
2.13 PROVISIONS
(In crore)
| Particulars | As at | |
| June 30, 2017 | March 31, 2017 | |
| Current | ||
| Others | ||
| Post-sales client support and warranties and others | 344 | 350 |
| 344 | 350 | |
Provision for post-sales client support and warranties and others
The movement in the provision for post-sales client support and warranties and others is as follows :
(In crore)
| Particulars | Three months ended June 30, 2017 |
| Balance at the beginning | 350 |
| Provision recognized/(reversed) | 11 |
| Provision utilized | (15) |
| Exchange difference | (2) |
| Balance at the end | 344 |
Provision for post-sales client support and warranties and other provisions are expected to be utilized over a period of 6 months to 1 year.
2.14 INCOME TAXES
Income tax expense in the statement of profit and loss comprises:
(In crore)
| Particulars | Three months ended June 30, | |
| 2017 | 2016 | |
| Current taxes | 1,394 | 1,314 |
| Deferred taxes | (93) | (34) |
| Income tax expense | 1,301 | 1,280 |
Current tax expense for the three months ended
June 30, 2017 and June 30, 2016 includes reversals (net of provisions) amounting to 15 crore and nil respectively pertaining to
prior periods.
2.15 REVENUE FROM OPERATIONS
(In crore)
| Particulars | Three months ended June 30, | |
| 2017 | 2016 | |
| Revenue from software services | 14,970 | 14,416 |
| Revenue from software products | 1 | 4 |
| 14,971 | 14,420 | |
2.16 OTHER INCOME, NET
(In crore)
| Particulars | Three months ended June 30, | |
| 2017 | 2016 | |
| Interest received on financial assets- Carried at amortised cost | ||
| Tax free bonds and government bonds | 34 | 84 |
| Deposit with Bank and others | 386 | 569 |
| Interest received on financial assets fair valued through other comprehensive income | ||
| Non convertible debentures and certificates of deposit | 194 | – |
| Dividend received on investments carried at fair value through profit or loss | ||
| Mutual fund units | 1 | – |
| Gain / (loss) on investments carried at fair value through profit or loss | 63 | 18 |
| Exchange gains/(losses) on foreign currency forward and options contracts | 18 | 45 |
| Exchange gains/(losses) on translation of other assets and liabilities | 65 | 4 |
| Write-down of investment in subsidiary (Refer note 2.2) | (94) | – |
| Miscellaneous income, net | 56 | 41 |
| 723 | 761 | |
2.17 EXPENSES
(In crore)
| Particulars | Three months ended June 30, | |
| 2017 | 2016 | |
| Employee benefit expenses | ||
| Salaries including bonus | 7,527 | 7,430 |
| Contribution to provident and other funds | 168 | 143 |
| Share based payments to employees ( Refer note 2.9 ) | 43 | 9 |
| Staff welfare | 14 | 23 |
| 7,752 | 7,605 | |
| Cost of software packages and others | ||
| For own use | 190 | 171 |
| Third party items bought for service delivery to clients | 124 | 53 |
| 314 | 224 | |
| Other expenses | ||
| Power and fuel | 39 | 52 |
| Brand and Marketing | 78 | 97 |
| Operating lease payments | 81 | 57 |
| Rates and taxes | 36 | 31 |
| Repairs and Maintenance | 247 | 284 |
| Consumables | 6 | 7 |
| Insurance | 12 | 11 |
| Provision for post-sales client support and warranties | 6 | 28 |
| Commission to non-whole time directors | 3 | 2 |
| Impairment loss recognized / (reversed) on financial assets | (7) | 23 |
| Auditor's remuneration | ||
| Statutory audit fees | 1 | – |
| Other services | – | – |
| Reimbursement of expenses | – | – |
| Bank Charges and commission | 2 | 2 |
| Contributions towards Corporate Social Responsibility | 43 | 45 |
| Others | 29 | 22 |
| 576 | 661 | |
2.18 RECONCILIATION OF BASIC AND DILUTED SHARES USED IN COMPUTING EARNING PER SHARE
The following is a reconciliation of the equity shares used in the computation of basic and diluted earnings per equity share:
| Particulars | Three months ended June 30, | |
| 2017 | 2016 | |
| Basic earnings per equity share - weighted average number of equity shares outstanding | 229,69,44,664 | 229,69,44,664 |
| Effect of dilutive common equivalent shares - share options outstanding | 5,47,014 | – |
| Diluted earnings per equity share - weighted average number of equity shares and common equivalent shares outstanding | 229,74,91,678 | 229,69,44,664 |
For the three months ended June 30, 2017, 169,984 number of options to purchase equity shares had an anti-dilutive effect.
For the three months ended June 30, 2016 there were no outstanding options to purchase equity shares which had an anti-dilutive effect.
2.19 CONTINGENT LIABILITIES AND COMMITMENTS (TO THE EXTENT NOT PROVIDED FOR)
(In
crore)
| Particulars | As at | |
| June 30, 2017 | March 31, 2017 | |
| Contingent liabilities : | ||
| Claims against the Company, not acknowledged as debts(1) | 1,694 | 1,902 |
| [Net of amount paid to statutory authorities 4,994 crore (4,694 crore)] |
||
| Commitments : | ||
| Estimated amount of contracts remaining to be executed on capital contracts and not provided for | 860 | 1,094 |
| (net of advances and deposits) | ||
| Other Commitments* | 38 | 37 |
* Uncalled capital pertaining to investments
(1) Claims
against the Company not acknowledged as debts as on June 30, 2017 include demand from the Indian Income tax
authorities for payment of tax including interest upon completion of their tax assessment for fiscals 2007, 2008, 2009, 2010,
2011, 2012 and 2013. Demands were paid to statutory tax authorities in full except for fiscals 2009, 2011, 2012 and
2013.
Demand for fiscals 2007, 2008 and 2009 includes disallowance of a portion of the deduction claimed by the
Company under Section 10A of the income Tax Act as determined by the ratio of export turnover to total turnover. The
disallowance arose from certain expenses incurred in foreign currency being reduced from export turnover but not reduced from
total turnover. Demand for fiscals 2007, 2008, 2009, 2010 and 2011 also includes disallowance of portion of profit earned
outside India from the STP units under section 10A of the Income Tax Act and disallowance of profits earned from SEZ units
under section 10AA of the Income Tax Act. During the quarter, the Company has received the appeal order for fiscals 2007,
2008 and 2009 allowing deduction under section 10AA of the Income Tax Act for the units and deduction of foreign currency
expenditure from export and total turnover. The order giving effect for the above mentioned years has not been received. The
Company is in the process of filing appeal for fiscals 2007, 2008 and 2009 before Hon'ble Income Tax Appellate tribunal
against the issues which are held against the Company by the Commissioner of Income Tax (Appeals) Bengaluru. Demand for
fiscals 2012 and 2013 includes disallowance of certain expenses incurred in foreign currency being reduced from export
turnover but not reduced from total turnover and disallowance of profits earned from SEZ units which commenced operations
before April 1, 2009 under section 10AA of the Income Tax Act and also others. The matters for fiscal 2013 is pending before
the Commissioner of Income Tax (Appeals) Bengaluru. The matter for fiscals 2010, 2011 and 2012 is pending before
Hon’ble Income Tax Appellate Tribunal (ITAT) Bengaluru.
The Company is contesting the demand and the management including its tax advisors believes that its position will likely be upheld in the appellate process. The management believes that the ultimate outcome of these proceedings will not have a material adverse effect on the Company's financial position and results of operations.
The Company is subject to legal proceedings and claims, which have arisen in the ordinary course of business. The Company’s management does not reasonably expect that these legal actions, when ultimately concluded and determined, will have a material and adverse effect on the Company’s results of operations or financial condition.
2.20 RELATED PARTY TRANSACTIONS
Refer to the Company's Annual Report for the year ended March 31, 2017 for the full names and other details of the Company's subsidiaries, associate and controlled trusts.
The details of amounts due to or due from related parties as at June 30, 2017 and March 31, 2017 are as follows:
(In crore)
| Particulars | As at | |
| June 30, 2017 | March 31, 2017 | |
| Investment in debentures | ||
| EdgeVerve(2) | 2,129 | 2,129 |
| 2,129 | 2,129 | |
| Trade receivables | ||
| Infosys China | 46 | 41 |
| Infosys Mexico | 2 | 2 |
| Infosys Brasil | – | 1 |
| Infosys BPO | 6 | 5 |
| Infy Consulting Company Ltd. | 85 | 73 |
| EdgeVerve | 40 | – |
| Infosys Public Services | 55 | 61 |
| Infosys Shanghai | 1 | – |
| Infosys Sweden | 1 | 1 |
| Kallidus | – | 6 |
| Infosys McCamish Systems LLC | 5 | 1 |
| Panaya Ltd | 58 | 44 |
| 299 | 235 | |
| Loans(1) | ||
| Infosys Technologies China | 70 | 69 |
| 70 | 69 | |
| Prepaid and other financial assets | ||
| Infosys BPO | 8 | 5 |
| Panaya Ltd. | 92 | 57 |
| Infosys Technologies (Australia) Pty. Limited | 1 | – |
| Infosys Consulting SAS | 3 | 3 |
| Infosys Consulting GmbH | 1 | 1 |
| Infosys China | 1 | 1 |
| Infy Consulting Company Ltd. | 5 | 4 |
| Infosys Consulting AG | 1 | 1 |
| Infy Consulting B.V. | 2 | 1 |
| Infosys Consulting Pte Ltd. | 1 | 1 |
| Kallidus | 1 | – |
| Skava Systems Pvt. Ltd. | 1 | – |
| 117 | 74 | |
| Unbilled revenues | ||
| EdgeVerve | – | 45 |
| Kallidus | 2 | 2 |
| 2 | 47 | |
| Trade payables | ||
| Infosys China | 9 | 10 |
| Infosys BPO | 38 | 33 |
| Infosys (Czech Republic) Limited s.r.o. | 4 | 3 |
| Infosys Mexico | 2 | 2 |
| Infosys Sweden | 5 | 5 |
| Infosys Shanghai | 10 | – |
| Infosys Management Consulting Pty Limited | 9 | 8 |
| Infosys Consulting Pte Ltd. | 4 | 4 |
| Infy Consulting Company Ltd. | 7 | 9 |
| Infosys Brasil | 1 | 1 |
| Noah Consulting LLC | 16 | 17 |
| Panaya Ltd. | 15 | 1 |
| Infosys Public Services | 3 | 3 |
| Kallidus | 14 | 35 |
| Noah Information Management Consulting Inc. | – | 3 |
| Infosys Poland Sp Z.o.o | 1 | 1 |
| 138 | 135 | |
| Other financial liabilities | ||
| Infosys BPO | 1 | 2 |
| Infosys Mexico | 1 | 1 |
| Infosys Consulting Holding AG | – | 10 |
| Infosys Consulting BV | 1 | – |
| Infosys Consulting GmbH | 1 | 1 |
| 4 | 14 | |
| Accrued expenses | ||
| Panaya Ltd | – | 3 |
| – | 3 | |
| (1) | The above loan was given in accordance with the terms and conditions of the loan agreement and carries an interest rate of 6% per annum and is repayable within a period of one year from the date of grant for Infosys China. |
| (2) | At an interest rate of 7.7% per annum. |
The details of the related parties transactions entered into by the Company for the three months ended June 30, 2017 and June 30, 2016 are as follows:
(In
crore)
| Particulars | Three months ended June 30, | |
| 2017 | 2016 | |
| Capital transactions: | ||
| Financing transactions | ||
| Equity | ||
| Panaya Ltd. | 38 | – |
| Infosys China | 97 | 67 |
| Infosys Sweden | – | 51 |
| Infosys Shanghai | 74 | 67 |
| 209 | 185 | |
| Loans (net of repayment) | ||
| Infosys China | 1 | 1 |
| 1 | 1 | |
| Revenue transactions: | ||
| Purchase of services | ||
| Infosys China | 25 | 29 |
| Infosys Management Consulting Pty Limited | 26 | 32 |
| Infy Consulting Company Limited | 169 | 187 |
| Infosys Consulting Pte Ltd. | 14 | 8 |
| Portland Group Pty Ltd | 1 | – |
| Infosys (Czech Republic) Limited s.r.o. | 10 | 7 |
| Infosys BPO | 108 | 92 |
| Infosys Sweden | 15 | 24 |
| Infosys Shanghai | 10 | – |
| Infosys Mexico | 6 | 5 |
| Infosys Public Services | 8 | 4 |
| Panaya Ltd. | 21 | 9 |
| Infosys Brasil | 3 | 1 |
| Infosys Poland Sp Z.o.o | 2 | 1 |
| Kallidus | 13 | 1 |
| Noah Consulting, LLC | 47 | 29 |
| Noah Information Management Consulting Inc. | 1 | 1 |
| 479 | 430 | |
| Purchase of shared services including facilities and personnel | ||
| Panaya Ltd. | – | 1 |
| Infosys BPO | 3 | 3 |
| Infosys Mexico | 1 | – |
| 4 | 4 | |
| Interest income | ||
| Infosys China | 1 | 1 |
| EdgeVerve | 41 | 54 |
| 42 | 55 | |
| Sale of services | ||
| Infosys China | 5 | 4 |
| Infosys Mexico | 5 | 8 |
| Infy Consulting Company Limited | 10 | 17 |
| Infosys Brasil | 2 | 2 |
| Infosys BPO | 17 | 14 |
| McCamish Systems LLC | 7 | – |
| Infosys Sweden | 4 | 4 |
| Infosys Shanghai | 1 | – |
| EdgeVerve | 96 | – |
| Infosys Public Services | 169 | 235 |
| 316 | 284 | |
| Sale of shared services including facilities and personnel | ||
| EdgeVerve | 10 | 68 |
| Panaya Ltd. | 12 | 6 |
| Infy Consulting Company Limited | 1 | – |
| Infy Consulting B.V | 1 | – |
| Infosys BPO | 16 | 11 |
| Infosys Public Services | 2 | – |
| 42 | 85 | |
Transactions with key management personnel
The following were the changes in key management personnel:-
| • | Gopi Krishnan Radhakrishnan, Acting General Counsel, resigned from the company effective June 24, 2017 |
| • | Inderpreet Sawhney, Group General Counsel and Chief Compliance Officer, appointed as an Executive Officer effective July 14, 2017 |
| • | Sandeep Dadlani, President, resigned from the company effective July 14, 2017 |
The table below describes the compensation to key managerial personnel which comprise directors and executive officers under Ind AS 24:
(In
crore)
| Particulars | Three months ended June 30, | |
| 2017 | 2016 | |
| Salaries and other employee benefits to whole-time directors and executive officers (1) | 27 | 21 |
| Commission and other benefits to non-executive/independent directors | 3 | 3 |
| Total | 30 | 24 |
| (1) | Includes stock compensation expense of 12 crore and 9 crore for the three months
ended June 30, 2017 and June 30, 2016 respectively (Refer note 2.9) |
2.21 SEGMENT REPORTING
Ind AS 108 establishes standards for the way that public business enterprises report information about operating segments and related disclosures about products and services, geographic areas, and major customers. The Company's operations predominantly relate to providing end-to-end business solutions to enable clients to enhance business performance. Based on the 'management approach' as defined in Ind AS 108, the Chief Operating Decision Maker (CODM) evaluates the Company's performance and allocates resources based on an analysis of various performance indicators by business segments and geographic segments. Accordingly, information has been presented both along business segments and geographic segments. The accounting principles used in the preparation of the financial statements are consistently applied to record revenue and expenditure in individual segments, and are as set out in the significant accounting policies.
Business segments of the Company are primarily enterprises in Financial Services (FS), enterprises in Manufacturing (MFG), enterprises in Retail, Consumer packaged goods and Logistics (RCL), enterprises in the Energy & utilities, Communication and Services (ECS), enterprises in Hi-tech (Hi-tech), enterprises in Life Sciences, Healthcare and Insurance (HILIFE) and all other segments. All other segments represents the operating segments of businesses in India, Japan and China. Geographic segmentation is based on business sourced from that geographic region and delivered from both on-site and off-shore locations. North America comprises the United States of America, Canada and Mexico, Europe includes continental Europe (both the east and the west), Ireland and the United Kingdom, and the Rest of the World comprising all other places except those mentioned above and India.
Revenue and identifiable operating expenses in relation to segments are categorized based on items that are individually identifiable to that segment. Revenue for “all other segments” represents revenue generated from customers located in India, Japan and China. Allocated expenses of segments include expenses incurred for rendering services from the Company's offshore software development centres and on-site expenses, which are categorized in relation to the associated turnover of the segment. Certain expenses such as depreciation, which form a significant component of total expenses, are not specifically allocable to specific segments as the underlying assets are used interchangeably. The management believes that it is not practical to provide segment disclosures relating to those costs and expenses, and accordingly these expenses are separately disclosed as "unallocated" and adjusted against the total income of the Company.
Assets and liabilities used in the Company's business are not identified to any of the reportable segments, as these are used interchangeably between segments. Management believes that it is currently not practicable to provide segment disclosures relating to total assets and liabilities since a meaningful segregation of the available data is onerous.
Geographical information on revenue and business segment revenue information is collated based on individual customers invoiced or in relation to which the revenue is otherwise recognized.
Business segments
Three months ended June 30, 2017 and June 30, 2016
(In
crore)
| Particulars | FS | MFG | ECS | RCL | HILIFE | Hi-tech | All other segments | Total |
| Revenue from operations | 3,897 | 1,556 | 3,654 | 2,501 | 1,862 | 1,155 | 346 | 14,971 |
| 3,873 | 1,472 | 3,341 | 2,583 | 1,627 | 1,270 | 254 | 14,420 | |
| Identifiable operating expenses | 2,084 | 843 | 1,851 | 1,252 | 935 | 637 | 161 | 7,763 |
| 2,056 | 761 | 1,636 | 1,284 | 843 | 669 | 202 | 7,451 | |
| Allocated expenses | 743 | 299 | 702 | 481 | 358 | 222 | 66 | 2,871 |
| 791 | 301 | 683 | 528 | 333 | 260 | 52 | 2,948 | |
| Segment operating income | 1,070 | 414 | 1,101 | 768 | 569 | 296 | 119 | 4,337 |
| 1,026 | 410 | 1,022 | 771 | 451 | 341 | – | 4,021 | |
| Unallocable expenses | 344 | |||||||
| 322 | ||||||||
| Operating profit | 3,993 | |||||||
| 3,699 | ||||||||
| Other income, net | 723 | |||||||
| 761 | ||||||||
| Profit before income taxes | 4,716 | |||||||
| 4,460 | ||||||||
| Income tax expense | 1,301 | |||||||
| 1,280 | ||||||||
| Net profit | 3,415 | |||||||
| 3,180 | ||||||||
| Depreciation and amortization | 343 | |||||||
| 319 | ||||||||
| Non-cash expenses other than depreciation and amortization | 1 | |||||||
| 3 |
Geographic segments
Three months ended June 30, 2017 and June 30, 2016
(In crore)
| Particulars | North America | Europe | India | Rest of the World | Total |
| Revenue from operations | 9,594 | 3,284 | 493 | 1,600 | 14,971 |
| 9,410 | 3,244 | 336 | 1,430 | 14,420 | |
| Identifiable operating expenses | 5,117 | 1,762 | 140 | 744 | 7,763 |
| 5,002 | 1,591 | 187 | 671 | 7,451 | |
| Allocated expenses | 1,843 | 630 | 95 | 303 | 2,871 |
| 1,925 | 664 | 68 | 291 | 2,948 | |
| Segment operating income | 2,634 | 892 | 258 | 553 | 4,337 |
| 2,483 | 989 | 81 | 468 | 4,021 | |
| Unallocable expenses | 344 | ||||
| 322 | |||||
| Operating profit | 3,993 | ||||
| 3,699 | |||||
| Other income, net | 723 | ||||
| 761 | |||||
| Profit before income taxes | 4,716 | ||||
| 4,460 | |||||
| Income tax expense | 1,301 | ||||
| 1,280 | |||||
| Net profit | 3,415 | ||||
| 3,180 | |||||
| Depreciation and amortization | 343 | ||||
| 319 | |||||
| Non-cash expenses other than depreciation and amortization | 1 | ||||
| 3 |
Significant clients
No client individually accounted for more than 10% of the revenues in the three months ended June 30, 2017 and June 30, 2016.
2.22 Function-wise classification of Condensed Statement of Profit and Loss
(In crore)
| Particulars | Three months ended June 30, | |
| 2017 | 2016 | |
| Revenue from operations | 14,971 | 14,420 |
| Cost of sales | 9,389 | 9,167 |
| Gross Profit | 5,582 | 5,253 |
| Operating expenses | ||
| Selling and marketing expenses | 684 | 699 |
| General and administration expenses | 905 | 855 |
| Total operating expenses | 1,589 | 1,554 |
| Operating profit | 3,993 | 3,699 |
| Other income, net | 723 | 761 |
| Profit before tax | 4,716 | 4,460 |
| Tax expense: | ||
| Current tax | 1,394 | 1,314 |
| Deferred tax | (93) | (34) |
| Profit for the period | 3,415 | 3,180 |
| Other comprehensive income | ||
| Items that will not be reclassified subsequently to profit or loss | ||
| Remeasurement of the net defined benefit liability/asset | (2) | (17) |
| Equity instruments through other comprehensive income | – | – |
| Items that will be reclassified subsequently to profit or loss | ||
| Fair value changes on derivatives designated as cash flow hedge, net | (66) | – |
| Fair value changes on investments, net | 25 | – |
| Total other comprehensive income, net of tax | (43) | (17) |
| Total comprehensive income for the period | 3,372 | 3,163 |
for and on behalf of the Board of Directors of Infosys Limited
|
R. Seshasayee Chairman |
Ravi Venkatesan Co-Chairman |
Dr. Vishal Sikka Chief Executive Officer and Managing Director |
U.B. Pravin Rao Chief Operating Officer and Whole-time Director |
|
Roopa Kudva Director |
M. D. Ranganath Chief Financial Officer |
A.G.S. Manikantha Company Secretary |
INDEPENDENT Auditor’s Report on audit of interim financial results
To The Board of Directors of Infosys Limited
| 1. | We have audited the accompanying Statement of Standalone Financial Results of INFOSYS LIMITED (“the Company”), for the three months period ended June 30, 2017 (“the Statement”), being submitted by the Company pursuant to the requirement of Regulation 33 of the SEBI (Listing Obligations and Disclosure Requirements) Regulations, 2015, as modified by Circular No. CIR/CFD/FAC/62/2016 dated July 5, 2016. |
This Statement, which is the responsibility of the Company’s Management and approved by the Board of Directors, has been compiled from the related interim condensed standalone financial statements which has been prepared in accordance with Indian Accounting Standard 34 “Interim Financial Reporting” (“Ind AS 34”), prescribed under Section 133 of the Companies Act, 2013 read with relevant rules issued thereunder (“Ind AS”) and other accounting principles generally accepted in India. Our responsibility is to express an opinion on the Statement based on our audit of such interim condensed standalone financial statements.
| 2. | We conducted our audit in accordance with the Standards on Auditing issued by the Institute of Chartered Accountants of India. Those Standards require that we comply with ethical requirements and plan and perform the audit to obtain reasonable assurance about whether the Statement is free from material misstatement. |
An audit involves performing procedures to obtain audit evidence about the amounts and the disclosures in the Statement. The procedures selected depend on the auditor’s judgment, including the assessment of the risks of material misstatement of the Statement, whether due to fraud or error. In making those risk assessments, the auditor considers internal control relevant to the Company’s preparation and fair presentation of the Statement in order to design audit procedures that are appropriate in the circumstances, but not for the purpose of expressing an opinion on the effectiveness of the Company’s internal control. An audit also includes evaluating the appropriateness of the accounting policies used and the reasonableness of the accounting estimates made by the Management, as well as evaluating the overall presentation of the Statement.
We believe that the audit evidence obtained by us, is sufficient and appropriate to provide a basis for our audit opinion.
| 3. | In our opinion and to the best of our information and according to the explanations given to us, the Statement: |
| (i) | is presented in accordance with the requirements of Regulation 33 of the SEBI (Listing Obligations and Disclosure Requirements) Regulations, 2015, as modified by Circular No. CIR/CFD/FAC/62/2016 dated July 5, 2016; and |
| (ii) | gives a true and fair view in conformity with the aforesaid Indian Accounting Standards and other accounting principles generally accepted in India of the net profit, total comprehensive income and other financial information of the Company for the three months period ended June 30, 2017. |
For DELOITTE HASKINS & SELLS LLP
Chartered Accountants
(Firm’s Registration No. 117366W/W-100018)

P. R. RAMESH
Partner
(Membership No.70928)
Bengaluru, July 14, 2017
Exhibit 99.12
Ind AS Consolidated
INDEPENDENT AUDITOR'S REPORT
TO THE BOARD OF DIRECTORS OF INFOSYS LIMITED
Report on the Interim Consolidated Financial Statements
We have audited the accompanying Interim Consolidated Financial Statements of INFOSYS LIMITED ("the Company") and its subsidiaries (the Company and its subsidiaries together referred to as "the Group"), which comprise the Consolidated Balance Sheet as at June 30, 2017, the Consolidated Statement of Profit and Loss (including Other Comprehensive Income), the Consolidated Statement of Changes in Equity and the Consolidated Statement of Cash Flows for the three months period then ended, and a summary of the significant accounting policies and other explanatory information (hereinafter referred to as "the interim consolidated financial statements").
Management's Responsibility for the Interim Consolidated Financial Statements
The Company's Board of Directors is responsible for the preparation of these interim consolidated financial statements that give a true and fair view of the consolidated financial position, consolidated financial performance, consolidated total comprehensive income, consolidated changes in equity and consolidated cash flows of the Group in accordance with Indian Accounting Standard 34 “Interim Financial Reporting” (“Ind AS 34”) prescribed under Section 133 of the Companies Act, 2013 (“the Act”), read with relevant rules issued thereunder.
This responsibility also includes maintenance of adequate accounting records in accordance with the provisions of the Act for safeguarding the assets of the Group and for preventing and detecting frauds and other irregularities; the selection and application of appropriate accounting policies; making judgments and estimates that are reasonable and prudent; and the design, implementation and maintenance of adequate internal financial controls, that were operating effectively for ensuring the accuracy and completeness of the accounting records, relevant to the preparation and presentation of the interim consolidated financial statements that give a true and fair view and are free from material misstatement, whether due to fraud or error.
Auditor's Responsibility
Our responsibility is to express an opinion on these interim consolidated financial statements based on our audit.
We conducted our audit in accordance with the Standards on Auditing specified under Section 143(10) of the Act. Those Standards require that we comply with ethical requirements and plan and perform the audit to obtain reasonable assurance about whether the interim consolidated financial statements are free from material misstatement.
An audit involves performing procedures to obtain audit evidence about the amounts and the disclosures in the interim consolidated financial statements. The procedures selected depend on the auditor's judgment, including the assessment of the risks of material misstatement of the interim consolidated financial statements, whether due to fraud or error. In making those risk assessments, the auditor considers internal financial control relevant to the Company's preparation and presentation of the interim consolidated financial statements that give a true and fair view in order to design audit procedures that are appropriate in the circumstances, but not for the purpose of expressing an opinion on whether the Company has in place an adequate internal financial controls system over financial reporting and the operating effectiveness of such controls. An audit also includes evaluating the appropriateness of the accounting policies used and the reasonableness of the accounting estimates made by the Company's Board of Directors, as well as evaluating the overall presentation of the interim consolidated financial statements.
We believe that the audit evidence obtained by us is sufficient and appropriate to provide a basis for our audit opinion on the interim consolidated financial statements.
Opinion
In our opinion and to the best of our information and according to the explanations given to us, the aforesaid interim consolidated financial statements give a true and fair view in conformity with Ind AS 34 and accounting principles generally accepted in India, of the consolidated state of affairs of the Group as at June 30, 2017, and their consolidated profit, consolidated total comprehensive income, consolidated changes in equity and their consolidated cash flows for the three months period ended on that date.
For DELOITTE HASKINS & SELLS LLP
Chartered Accountants
(Firm’s Registration No. 117366W/W-100018)
P. R. RAMESH
Partner
(Membership No.70928)
Bengaluru, July 14, 2017
INFOSYS LIMITED AND SUBSIDIARIES
crore
| Consolidated Balance Sheets as at | Note | June 30, 2017 | March 31, 2017 |
| ASSETS | |||
| Non-current assets | |||
| Property, plant and equipment | 2.4 | 9,671 | 9,751 |
| Capital work-in-progress | 1,672 | 1,365 | |
| Goodwill | 2.5 | 3,701 | 3,652 |
| Other intangible assets | 2.5 | 730 | 776 |
| Investment in associate | 2.25 | – | 71 |
| Financial assets: | |||
| Investments | 2.6 | 6,061 | 6,382 |
| Loans | 2.7 | 23 | 29 |
| Other financial assets | 2.8 | 308 | 309 |
| Deferred tax assets (net) | 2.17 | 679 | 540 |
| Income tax assets (net) | 2.17 | 6,076 | 5,716 |
| Other non-current assets | 2.11 | 930 | 1,059 |
| Total non-current assets | 29,851 | 29,650 | |
| Current assets | |||
| Financial assets: | |||
| Investments | 2.6 | 10,388 | 9,970 |
| Trade receivables | 2.9 | 12,488 | 12,322 |
| Cash and cash equivalents | 2.10 | 23,117 | 22,625 |
| Loans | 2.7 | 255 | 272 |
| Other financial assets | 2.8 | 6,343 | 5,980 |
| Other Current assets | 2.11 | 2,683 | 2,536 |
| Total current assets | 55,274 | 53,705 | |
| Total assets | 85,125 | 83,355 | |
| EQUITY AND LIABILITIES | |||
| Equity | |||
| Equity share capital | 2.13 | 1,144 | 1,144 |
| Other equity | 67,370 | 67,838 | |
| Total equity attributable to equity holders of the Company | 68,514 | 68,982 | |
| Non-controlling interests | – | – | |
| Total equity | 68,514 | 68,982 | |
| Liabilities | |||
| Non-current liabilities | |||
| Financial Liabilities | |||
| Other financial liabilities | 2.14 | 35 | 70 |
| Deferred tax liabilities (net) | 2.17 | 197 | 207 |
| Other non-current liabilities | 2.15 | 82 | 83 |
| Total non-current liabilities | 314 | 360 | |
| Current liabilities | |||
| Financial Liabilities | |||
| Trade payables | 260 | 367 | |
| Other financial liabilities | 2.14 | 7,104 | 6,349 |
| Other current liabilities | 2.15 | 3,990 | 3,007 |
| Provisions | 2.16 | 404 | 405 |
| Income tax liabilities (net) | 2.17 | 4,539 | 3,885 |
| Total current liabilities | 16,297 | 14,013 | |
| Total equity and liabilities | 85,125 | 83,355 |
The accompanying notes form an integral part of the interim consolidated financial statements
As per our report of even date attached
| for Deloitte Haskins & Sells LLP | for and on behalf of the Board of Directors of Infosys Limited |
Chartered Accountants
Firm’s Registration No :
117366W/ W-100018
P. R. Ramesh
Membership No. 70928 |
R. Seshasayee Chairman |
Ravi Venkatesan Co- Chairman |
Dr. Vishal Sikka Chief Executive Officer and Managing Director |
U. B. Pravin Rao Chief Operating Officer and Whole-time Director |
| Bengaluru July 14, 2017 |
Roopa Kudva Director |
M. D. Ranganath Chief Financial Officer |
A. G. S. Manikantha Company Secretary | |
INFOSYS LIMITED AND SUBSIDIARIES
In crore, except equity share and
per equity share data
| Consolidated Statement of Profit and Loss | Note | Three months ended June 30, | |
| 2017 | 2016 | ||
| Revenue from operations | 2.18 | 17,078 | 16,782 |
| Other income, net | 2.19 | 814 | 753 |
| Total income | 17,892 | 17,535 | |
| Expenses | |||
| Employee benefit expenses | 2.20 | 9,366 | 9,282 |
| Cost of technical sub-contractors | 1,061 | 917 | |
| Travel expenses | 527 | 740 | |
| Cost of software packages and others | 2.20 | 440 | 276 |
| Communication expenses | 125 | 120 | |
| Consultancy and professional charges | 246 | 175 | |
| Depreciation and amortisation expenses | 2.4 and 2.5 | 450 | 400 |
| Other expenses | 2.20 | 752 | 825 |
| Total expenses | 12,967 | 12,735 | |
| Profit before non-controlling interests/share in net profit/(loss) of associate | 4,925 | 4,800 | |
| Share in net profit/(loss) of associate | – | (2) | |
| Write-down of investment in associate | 2.25 | (71) | – |
| Profit before tax | 4,854 | 4,798 | |
| Tax expense: | |||
| Current tax | 2.17 | 1,499 | 1,467 |
| Deferred tax | 2.17 | (128) | (105) |
| Profit for the period | 3,483 | 3,436 | |
| Other comprehensive income | |||
| Items that will not be reclassified subsequently to profit or loss | |||
| Remeasurement of the net defined benefit liability/asset | (3) | (17) | |
| Equity instruments through other comprehensive income, net | – | – | |
| (3) | (17) | ||
| Items that will be reclassified subsequently to profit or loss | |||
| Fair value changes on derivatives designated as cash flow hedge, net | 2.12 | (66) | – |
| Exchange differences on translation of foreign operations | 107 | 38 | |
| Fair value changes on investments, net | 27 | – | |
| 68 | 38 | ||
| Total other comprehensive income, net of tax | 65 | 21 | |
| Total comprehensive income for the period | 3,548 | 3,457 | |
| Profit attributable to: | |||
| Owners of the Company | 3,483 | 3,436 | |
| Non-controlling interests | – | – | |
| 3,483 | 3,436 | ||
| Total comprehensive income attributable to: | |||
| Owners of the Company | 3,548 | 3,457 | |
| Non-controlling interests | – | – | |
| 3,548 | 3,457 | ||
| Earnings per Equity share | |||
| Equity shares of par value 5/- each |
|||
| Basic () |
15.24 | 15.03 | |
| Diluted () |
15.23 | 15.03 | |
| Weighted average equity shares used in computing earnings per equity share | 2.23 | ||
| Basic | 228,56,57,604 | 228,56,22,329 | |
| Diluted | 228,70,58,148 | 228,57,68,122 | |
The accompanying notes form an integral part of the interim consolidated financial statements
As per our report of even date attached
| for Deloitte Haskins & Sells LLP | for and on behalf of the Board of Directors of Infosys Limited |
Chartered Accountants
Firm’s Registration No :
117366W/ W-100018
P. R. Ramesh Membership No. 70928 |
R. Seshasayee Chairman |
Ravi Venkatesan Co- Chairman |
Dr. Vishal Sikka Chief Executive Officer and Managing Director |
U. B. Pravin Rao Chief Operating Officer and Whole-time Director |
| Bengaluru July 14, 2017 |
Roopa Kudva Director |
M. D. Ranganath Chief Financial Officer |
A. G. S. Manikantha Company Secretary | |
INFOSYS LIMITED AND SUBSIDIARIES
Consolidated Statement of Changes in Equity
In crore
| Particulars | Equity Share capital (1) | OTHER EQUITY | Total equity attributable to equity holders of the Company | ||||||||||
| RESERVES & SURPLUS | Other comprehensive income | ||||||||||||
| Securities premium reserve |
Retained earnings | Capital reserve | General reserve | Share Options Outstanding Account | Special Economic Zone Re-investment reserve(2) | Other reserves(3) | Equity instruments through other comprehensive income | Exchange differences on translating the financial statements of a foreign operation | Cash flow hedge reserve | Other items of other comprehensive income | |||
| Balance as of April 1, 2016 | 1,144 | 2,213 | 47,063 | 54 | 10,553 | 8 | – | 5 | – | 715 | – | (11) | 61,744 |
| Changes in equity for the three months ended June 30, 2016 | |||||||||||||
| Income tax benefit arising on exercise of stock options | – | 1 | – | – | – | (1) | – | – | – | – | – | – | – |
| Dividends (including corporate dividend tax) | – | – | (3,923) | – | – | – | – | – | – | – | – | – | (3,923) |
| Transfer to general reserve | – | – | (1,579) | – | 1,579 | – | – | – | – | – | – | – | – |
| Transferred to Special Economic Zone Re-investment reserve | – | – | (276) | – | – | – | 276 | – | – | – | – | – | – |
| Transferred from Special Economic Zone Re-investment reserve on utilization | – | – | 276 | – | – | – | (276) | – | – | – | – | – | – |
| Share based payments to employees (refer note 2.13) | – | – | – | – | – | 9 | – | – | – | – | – | – | 9 |
| Remeasurement of the net defined benefit liability/asset, net of tax effect (refer note 2.22.1 and 2.17) | – | – | – | – | – | – | – | – | – | – | – | (17) | (17) |
| Profit for the period | – | – | 3,436 | – | – | – | – | – | – | – | – | – | 3,436 |
| Exchange differences on translation of foreign operations | – | – | – | – | – | – | – | – | – | 38 | – | – | 38 |
| Balance as of June 30, 2016 | 1,144 | 2,214 | 44,997 | 54 | 12,132 | 16 | – | 5 | – | 753 | – | (28) | 61,287 |
Consolidated Statement of Changes in Equity (contd.)
In crore
| Particulars | Equity Share capital (1) | OTHER EQUITY | Total equity attributable to equity holders of the Company | ||||||||||
| RESERVES & SURPLUS | Other comprehensive income | ||||||||||||
| Securities premium reserve |
Retained earnings | Capital reserve | General reserve | Share Options Outstanding Account | Special Economic Zone Re-investment reserve(2) | Other reserves(3) | Equity instruments through Other comprehensive income | Exchange differences on translating the financial statements of a foreign operation | Cash flow hedge reserve | Other items of other comprehensive income | |||
| Balance as of April 1, 2017 | 1,144 | 2,216 | 52,882 | 54 | 12,135 | 120 | – | 5 | (5) | 458 | 39 | (66) | 68,982 |
| Changes in equity for the three months ended June 30, 2017 | |||||||||||||
| Share based payments to employees (refer to note 2.13) | – | – | – | – | – | 45 | – | – | – | – | – | – | 45 |
| Excercise of stock options (refer to note 2.13) | – | 2 | – | – | – | (2) | – | – | – | – | – | – | – |
| Dividends (including corporate dividend tax) | – | – | (4,061) | – | – | – | – | – | – | – | – | – | (4,061) |
| Transfer to general reserve | – | – | (1,382) | – | 1,382 | – | – | – | – | – | – | – | – |
| Transferred to Special Economic Zone Re-investment reserve | – | – | (483) | – | – | – | 483 | – | – | – | – | – | – |
| Transferred from Special Economic Zone Re-investment reserve on utilization | – | – | 154 | – | – | – | (154) | – | – | – | – | – | – |
| Remeasurement of the net defined benefit liability/asset, net of tax effect (refer note 2.22.1 and 2.17) | – | – | – | – | – | – | – | – | – | – | – | (3) | (3) |
| Equity instruments through other comprehensive income | – | – | – | – | – | – | – | – | – | – | – | – | |
| Fair value changes on investments , net of tax effect | – | – | – | – | – | – | – | – | – | – | – | 27 | 27 |
| Fair value changes on derivatives designated as cash flow hedge, net of tax (refer note 2.12) | – | – | – | – | – | – | – | – | – | – | (66) | – | (66) |
| Profit for the period | – | – | 3,483 | – | – | – | – | – | – | – | – | – | 3,483 |
| Exchange differences on translation of foreign operations | – | – | – | – | – | – | – | – | – | 107 | – | – | 107 |
| Balance as of June 30, 2017 | 1,144 | 2,218 | 50,593 | 54 | 13,517 | 163 | 329 | 5 | (5) | 565 | (27) | (42) | 68,514 |
The non controlling interest for each
of the above periods is less than 1 crore
| (1) | Net of treasury shares |
| (2) | The Special Economic Zone Re-investment Reserve has been created out of the profit of eligible SEZ units in terms of the provisions of Sec 10AA(1)(ii) of Income Tax Act,1961. The reserve should be utilized by the Company for acquiring new plant and machinery for the purpose of its business in the terms of the Sec 10AA(2) of the Income Tax Act, 1961. |
| (3) | Under the Swiss Code of Obligation, few subsidiaries of Infosys Lodestone are required to appropriate a certain percentage of the annual profit to legal reserve which may be used only to cover losses or for measures designed to sustain the Company through difficult times, to prevent unemployment or to mitigate its consequences. |
The accompanying notes form an integral part of the interim consolidated financial statements
As per our report of even date attached
| for Deloitte Haskins & Sells LLP | for and on behalf of the Board of Directors of Infosys Limited |
Chartered Accountants
Firm’s Registration No :
117366W/ W-100018
P. R. Ramesh Membership No. 70928 |
R. Seshasayee Chairman |
Ravi Venkatesan Co- Chairman |
Dr. Vishal Sikka Chief Executive Officer and Managing Director |
U. B. Pravin Rao Chief Operating Officer and Whole-time Director |
| Bengaluru July 14, 2017 |
Roopa Kudva Director |
M. D. Ranganath Chief Financial Officer |
A. G. S. Manikantha Company Secretary | |
INFOSYS LIMITED AND SUBSIDIARIES
In crore
| Consolidated Statement of Cash Flows | Three months ended June 30, | |
| 2017 | 2016 | |
| Cash flow from operating activities | ||
| Profit for the period | 3,483 | 3,436 |
| Adjustments to reconcile net profit to net cash provided by operating activities: | ||
| Income tax expense | 1,371 | 1,362 |
| Depreciation and amortization | 450 | 400 |
| Interest and dividend income | (631) | (670) |
| Impairment loss on financial assets | (4) | 15 |
| Exchange differences on translation of assets and liabilities | (3) | 18 |
| Other adjustments | 65 | 69 |
| Changes in assets and liabilities | ||
| Trade receivables and unbilled revenue | (459) | (818) |
| Loans, other financial assets and other assets | 103 | (327) |
| Trade payables | (107) | (124) |
| Other financial liabilities, other liabilities and provisions | 964 | 327 |
| Cash generated from operations | 5,232 | 3,688 |
| Income taxes paid | (1,205) | (744) |
| Net cash generated by operating activities | 4,027 | 2,944 |
| Cash flows from investing activities | ||
| Expenditure on property, plant and equipment net of sale proceeds, including changes in retention money and capital creditors | (553) | (859) |
| Loans to employees | 23 | 20 |
| Deposits placed with corporation | (9) | (60) |
| Interest and dividend received on investments | 210 | 123 |
| Payment of contingent consideration for acquisition of business | (33) | (36) |
| Payments to acquire financial assets | ||
| Preference and equity securities | (13) | (26) |
| Tax free bonds and government bonds | (1) | (5) |
| Liquid mutual funds and fixed maturity plan securities | (16,472) | (10,669) |
| Certificates of deposit | (281) | – |
| Others | (9) | – |
| Proceeds on sale of financial assets | ||
| Tax free bonds and government bonds | 4 | 4 |
| Redemption of certificates of deposit | 150 | – |
| Liquid mutual funds and fixed maturity plan securities | 16,774 | 10,183 |
| Net cash used in investing activities | (210) | (1,325) |
| Cash flows from financing activities: | ||
| Payment of dividends | (3,363) | (3,256) |
| Net cash used in financing activities | (3,363) | (3,256) |
| Net increase / (decrease) in cash and cash equivalents | 454 | (1,637) |
| Cash and cash equivalents at the beginning of the period | 22,625 | 32,697 |
| Effect of exchange rate changes on cash and cash equivalents | 38 | (10) |
| Cash and cash equivalents at the end of the period | 23,117 | 31,050 |
| Supplementary information: | ||
| Restricted cash balance | 601 | 512 |
The accompanying notes form an integral part of the interim consolidated financial statements
As per our report of even date attached
| for Deloitte Haskins & Sells LLP | for and on behalf of the Board of Directors of Infosys Limited |
Chartered Accountants
Firm’s Registration No :
117366W/ W-100018
P. R. Ramesh Membership No. 70928 |
R. Seshasayee Chairman |
Ravi Venkatesan Co- Chairman |
Dr. Vishal Sikka Chief Executive Officer and Managing Director |
U. B. Pravin Rao Chief Operating Officer and Whole-time Director |
| Bengaluru July 14, 2017 |
Roopa Kudva Director |
M. D. Ranganath Chief Financial Officer |
A. G. S. Manikantha Company Secretary | |
INFOSYS LIMITED AND SUBSIDIARIES
Notes to the interim consolidated financial statements
1. Company overview and significant accounting policies
1.1 Company overview
Infosys is a leading provider in consulting, technology, outsourcing and next-generation services and software. Along with its subsidiaries, Infosys provides Business IT services (comprising application development and maintenance, independent validation, infrastructure management, engineering services comprising product engineering and life cycle solutions and business process management); Consulting and systems integration services (comprising consulting, enterprise solutions, systems integration and advanced technologies); Products, business platforms and solutions to accelerate intellectual property-led innovation. Its new offerings span areas like digital, big data and analytics, cloud, data and mainframe modernization, cyber security, IoT engineering Services and API & micro services.
Infosys together with its subsidiaries and controlled trusts is herein after referred to as 'the Group'.
The Company is a public limited company incorporated and domiciled in India and has its registered office at Bengaluru, Karnataka, India. The Company has its primary listings on the BSE Limited and National Stock Exchange of India Limited in India. The Company’s American Depositary Shares (ADSs) representing equity shares are also listed on the New York Stock Exchange (NYSE), Euronext London and Euronext Paris.
The Group's interim consolidated financial statements are approved for issue by the Company's Board of Directors on July 14, 2017.
1.2 Basis of preparation of financial statements
These interim consolidated financial statements are prepared in accordance with Indian Accounting Standards (Ind AS) under the historical cost convention on the accrual basis except for certain financial instruments which are measured at fair values, the provisions of the Companies Act, 2013 ('the Act') (to the extent notified) and guidelines issued by the Securities and Exchange Board of India (SEBI). The Ind AS are prescribed under Section 133 of the Act read with Rule 3 of the Companies (Indian Accounting Standards) Rules, 2015 and Companies (Indian Accounting Standards) Amendment Rules, 2016.
Effective April 1, 2016, the Group has adopted all the Ind AS standards and the adoption was carried out in accordance with Ind AS 101 - First time adoption of Indian Accounting Standards, with April 1, 2015 as the transition date. The transition was carried out from Indian Accounting Principles generally accepted in India as prescribed under Sec 133 of the Act, read with Rule 7 of the Companies (Accounts) Rules, 2014 (IGAAP), which was the previous GAAP.
Accounting policies have been consistently applied except where a newly issued accounting standard is initially adopted or a revision to an existing accounting standard requires a change in the accounting policy hitherto in use.
1.3 Basis of consolidation
Infosys consolidates entities which it owns or controls. The consolidated financial statements comprise the financial statements of the Company, its controlled trusts, its subsidiaries and associate, as disclosed in Note 2.25. Control exists when the parent has power over the entity, is exposed, or has rights, to variable returns from its involvement with the entity and has the ability to affect those returns by using its power over the entity. Power is demonstrated through existing rights that give the ability to direct relevant activities, those which significantly affect the entity's returns. Subsidiaries are consolidated from the date control commences until the date control ceases.
The financial statements of the Group Companies are consolidated on a line-by-line basis and intra-group balances and transactions including unrealized gain / loss from such transactions are eliminated upon consolidation. These financial statements are prepared by applying uniform accounting policies in use at the Group. Non-controlling interests which represent part of the net profit or loss and net assets of subsidiaries that are not, directly or indirectly, owned or controlled by the company, are excluded.
Associates are entities over which the Group has significant influence but not control. Investments in associates are accounted for using the equity method of accounting. The investment is initially recognized at cost, and the carrying amount is increased or decreased to recognize the investor’s share of the profit or loss of the investee after the acquisition date. The Group’s investment in associates includes goodwill identified on acquisition.
1.4 Use of estimates
The preparation of the financial statements in conformity with Ind AS requires the management to make estimates, judgements and assumptions. These estimates, judgements and assumptions affect the application of accounting policies and the reported amounts of assets and liabilities, the disclosures of contingent assets and liabilities at the date of the financial statements and reported amounts of revenues and expenses during the period. Application of accounting policies that require critical accounting estimates involving complex and subjective judgements and the use of assumptions in these financial statements have been disclosed in Note 1.5. Accounting estimates could change from period to period. Actual results could differ from those estimates. Appropriate changes in estimates are made as management becomes aware of changes in circumstances surrounding the estimates. Changes in estimates are reflected in the financial statements in the period in which changes are made and, if material, their effects are disclosed in the notes to the consolidated financial statements.
1.5 Critical accounting estimates
a. Revenue recognition
The Group uses the percentage-of-completion method in accounting for its fixed-price contracts. Use of the percentage-of-completion method requires the Group to estimate the efforts or costs expended to date as a proportion of the total efforts or costs to be expended. Efforts or costs expended have been used to measure progress towards completion as there is a direct relationship between input and productivity. Provisions for estimated losses, if any, on uncompleted contracts are recorded in the period in which such losses become probable based on the expected contract estimates at the reporting date.
b. Income taxes
The Company's two major tax jurisdictions are India and the U.S., though the Company also files tax returns in other overseas jurisdictions. Significant judgements are involved in determining the provision for income taxes, including amount expected to be paid/recovered for uncertain tax positions. Also refer to Note 2.17.
c. Business combinations and intangible assets
Business combinations are accounted for using Ind AS 103, Business Combinations. Ind AS 103 requires the identifiable intangible assets and contingent consideration to be fair valued in order to ascertain the net fair value of identifiable assets, liabilities and contingent liabilities of the acquiree. Significant estimates are required to be made in determining the value of contingent consideration and intangible assets. These valuations are conducted by independent valuation experts.
d. Property, plant and equipment
Property, plant and equipment represent a significant proportion of the asset base of the Group. The charge in respect of periodic depreciation is derived after determining an estimate of an asset’s expected useful life and the expected residual value at the end of its life. The useful lives and residual values of Group's assets are determined by management at the time the asset is acquired and reviewed periodically, including at each financial year end. The lives are based on historical experience with similar assets as well as anticipation of future events, which may impact their life, such as changes in technology.
e. Impairment of Goodwill
Goodwill is tested for impairment on an annual basis and whenever there is an indication that the recoverable amount of a cash generating unit (CGUs) is less than its carrying amount based on a number of factors including operating results, business plans, future cash flows and economic conditions. The recoverable amount of CGUs is determined based on higher of value-in-use and fair value less cost to sell. The goodwill impairment test is performed at the level of the CGU or groups of cash-generating units which are benefiting from the synergies of the acquisition and which represents the lowest level at which goodwill is monitored for internal management purposes.
Market related information and estimates are used to determine the recoverable amount. Key assumptions on which management has based its determination of recoverable amount include estimated long term growth rates, weighted average cost of capital and estimated operating margins. Cash flow projections take into account past experience and represent management’s best estimate about future developments.
1.6 Revenue recognition
The Company derives revenues primarily from software development and related services and from the licensing of software products. Arrangements with customers for software related services are either on a fixed-price, fixed-timeframe or on a time-and-material basis.
Revenue on time-and-material contracts are recognized as the related services are performed and revenue from the end of the last billing to the Balance Sheet date is recognized as unbilled revenues. Revenue from fixed-price, fixed-timeframe contracts, where there is no uncertainty as to measurement or collectability of consideration, is recognized as per the percentage-of-completion method. When there is uncertainty as to measurement or ultimate collectability, revenue recognition is postponed until such uncertainty is resolved. Efforts or costs expended have been used to measure progress towards completion as there is a direct relationship between input and productivity. Provisions for estimated losses, if any, on uncompleted contracts are recorded in the period in which such losses become probable based on the current contract estimates. Costs and earnings in excess of billings are classified as unbilled revenue, while billings in excess of costs and earnings are classified as unearned revenue. Deferred contract costs are amortized over the term of the contract. Maintenance revenue is recognized rateably over the term of the underlying maintenance arrangement.
In arrangements for software development and related services and maintenance services, the Company has applied the guidance in Ind AS 18, Revenue, by applying the revenue recognition criteria for each separately identifiable component of a single transaction. The arrangements generally meet the criteria for considering software development and related services as separately identifiable components. For allocating the consideration, the Company has measured the revenue in respect of each separable component of a transaction at its fair value, in accordance with principles given in Ind AS 18. The price that is regularly charged for an item when sold separately is the best evidence of its fair value. In cases where the Company is unable to establish objective and reliable evidence of fair value for the software development and related services, the Company has used a residual method to allocate the arrangement consideration. In these cases the balance of the consideration, after allocating the fair values of undelivered components of a transaction has been allocated to the delivered components for which specific fair values do not exist.
License fee revenues are recognized when the general revenue recognition criteria given in Ind AS 18 are met. Arrangements to deliver software products generally have three elements: license, implementation and Annual Technical Services (ATS). The Company has applied the principles given in Ind AS 18 to account for revenues from these multiple element arrangements. Objective and reliable evidence of fair value has been established for ATS. Objective and reliable evidence of fair value is the price charged when the element is sold separately. When other services are provided in conjunction with the licensing arrangement and objective and reliable evidence of their fair values have been established, the revenue from such contracts are allocated to each component of the contract in a manner, whereby revenue is deferred for the undelivered services and the residual amounts are recognized as revenue for delivered elements. In the absence of objective and reliable evidence of fair value for implementation, the entire arrangement fee for license and implementation is recognized using the percentage-of-completion method as the implementation is performed. Revenue from client training, support and other services arising due to the sale of software products is recognized as the services are performed. ATS revenue is recognized rateably over the period in which the services are rendered.
Advances received for services and products are reported as client deposits until all conditions for revenue recognition are met.
The Group accounts for volume discounts and pricing incentives to customers as a reduction of revenue based on the rateable allocation of the discounts/ incentives amount to each of the underlying revenue transaction that results in progress by the customer towards earning the discount/ incentive. Also, when the level of discount varies with increase in levels of revenue transactions, the company recognizes the liability based on its estimate of the customer's future purchases. If it is probable that the criteria for the discount will not be met, or if the amount thereof cannot be estimated reliably, then discount is not recognized until the payment is probable and the amount can be estimated reliably. The Company recognizes changes in the estimated amount of obligations for discounts in the period in which the change occurs. The discounts are passed on to the customer either as direct payments or as a reduction of payments due from the customer.
The Company presents revenues net of value-added taxes in its Statement of Profit and Loss.
1.7 Property, plant and equipment
Property, plant and equipment are stated at cost, less accumulated depreciation and impairment, if any. Costs directly attributable to acquisition are capitalized until the property, plant and equipment are ready for use, as intended by management. The Group depreciates property, plant and equipment over their estimated useful lives using the straight-line method. The estimated useful lives of assets are as follows:
| Buildings (1) | 22-25 years |
| Plant and machinery (1) | 5 years |
| Office equipment | 5 years |
| Computer equipment (1) | 3-5 years |
| Furniture and fixtures (1) | 5 years |
| Vehicles(1) | 5 years |
| (1) | Based on technical evaluation, the management believes that the useful lives as given above best represent the period over which management expects to use these assets. Hence, the useful lives for these assets is different from the useful lives as prescribed under Part C of Schedule II of the Companies Act 2013. |
Depreciation methods, useful lives and residual values are reviewed periodically, including at each financial year end.
Advances paid towards the acquisition of property, plant and equipment outstanding at each Balance Sheet date is classified as capital advances under other non-current assets and the cost of assets not put to use before such date are disclosed under ‘Capital work-in-progress’. Subsequent expenditures relating to property, plant and equipment is capitalized only when it is probable that future economic benefits associated with these will flow to the Group and the cost of the item can be measured reliably. Repairs and maintenance costs are recognized in net profit in the Statement of Profit and Loss when incurred. The cost and related accumulated depreciation are eliminated from the financial statements upon sale or retirement of the asset and the resultant gains or losses are recognized in the Statement of Profit and Loss. Assets to be disposed off are reported at the lower of the carrying value or the fair value less cost to sell.
1.8 Business combinations
Business combinations have been accounted for using the acquisition method under the provisions of Ind AS 103, Business Combinations.
The cost of an acquisition is measured at the fair value of the assets transferred, equity instruments issued and liabilities incurred or assumed at the date of acquisition, which is the date on which control is transferred to the Group. The cost of acquisition also includes the fair value of any contingent consideration. Identifiable assets acquired and liabilities and contingent liabilities assumed in a business combination are measured initially at their fair value on the date of acquisition.
Business combinations between entities under common control is accounted for at carrying value.
Transaction costs that the Group incurs in connection with a business combination such as finder’s fees, legal fees, due diligence fees, and other professional and consulting fees are expensed as incurred.
1.9 Goodwill
Goodwill represents the cost of business acquisition in excess of the Group's interest in the net fair value of identifiable assets, liabilities and contingent liabilities of the acquiree. When the net fair value of the identifiable assets, liabilities and contingent liabilities acquired exceeds the cost of business acquisition, a gain is recognized immediately in net profit in the Statement of Profit and Loss. Goodwill is measured at cost less accumulated impairment losses.
1.10 Intangible assets
Intangible assets are stated at cost less accumulated amortization and impairment. Intangible assets are amortized over their respective individual estimated useful lives on a straight-line basis, from the date that they are available for use. The estimated useful life of an identifiable intangible asset is based on a number of factors including the effects of obsolescence, demand, competition, and other economic factors (such as the stability of the industry, and known technological advances), and the level of maintenance expenditures required to obtain the expected future cash flows from the asset. Amortization methods and useful lives are reviewed periodically including at each financial year end.
Research costs are expensed as incurred. Software product development costs are expensed as incurred unless technical and commercial feasibility of the project is demonstrated, future economic benefits are probable, the Company has an intention and ability to complete and use or sell the software and the costs can be measured reliably. The costs which can be capitalized include the cost of material, direct labour, overhead costs that are directly attributable to preparing the asset for its intended use. Research and development costs and software development costs incurred under contractual arrangements with customers are accounted in the statement of Profit and Loss.
1.11 Financial instruments
1.11.1 Initial recognition
The Group recognizes financial assets and financial liabilities when it becomes a party to the contractual provisions of the instrument. All financial assets and liabilities are recognized at fair value on initial recognition, except for trade receivables which are initially measured at transaction price. Transaction costs that are directly attributable to the acquisition or issue of financial assets and financial liabilities, that are not at fair value through profit or loss, are added to the fair value on initial recognition. Regular way purchase and sale of financial assets are accounted for at trade date.
1.11.2 Subsequent measurement
a. Non-derivative financial instruments
(i) Financial assets carried at amortized cost
A financial asset is subsequently measured at amortized cost if it is held within a business model whose objective is to hold the asset in order to collect contractual cash flows and the contractual terms of the financial asset give rise on specified dates to cash flows that are solely payments of principal and interest on the principal amount outstanding.
(ii) Financial assets at fair value through other comprehensive income(FVOCI)
A financial asset is subsequently measured at fair value through other comprehensive income if it is held within a business model whose objective is achieved by both collecting contractual cash flows and selling financial assets and the contractual terms of the financial asset give rise on specified dates to cash flows that are solely payments of principal and interest on the principal amount outstanding. Further, in cases where the Group has made an irrevocable election based on its business model, for its investments which are classified as equity instruments, the subsequent changes in fair value are recognized in other comprehensive income(OCI).
(iii) Financial assets at fair value through profit or loss
A financial asset which is not classified in any of the above categories is subsequently fair valued through profit or loss.
(iv) Financial liabilities
Financial liabilities are subsequently carried at amortized cost using the effective interest method, except for contingent consideration recognized in a business combination which is subsequently measured at fair value through profit and loss. For trade and other payables maturing within one year from the Balance Sheet date, the carrying amounts approximate the fair value due to the short maturity of these instruments.
b. Derivative financial instruments
The Group holds derivative financial instruments such as foreign exchange forward and option contracts to mitigate the risk of changes in exchange rates on foreign currency exposures. The counterparty for these contracts is generally a bank.
(i) Financial assets or financial liabilities, at fair value through profit or loss.
This category has derivative financial assets or liabilities which are not designated as hedges.
Although the group believes that these derivatives constitute hedges from an economic perspective, they may not qualify for hedge accounting under Ind AS 109, Financial Instruments. Any derivative that is either not designated a hedge, or is so designated but is ineffective as per Ind AS 109, is categorized as a financial asset or financial liability, at fair value through profit or loss.
Derivatives not designated as hedges are recognized initially at fair value and attributable transaction costs are recognized in net profit in the Statement of Profit and Loss when incurred. Subsequent to initial recognition, these derivatives are measured at fair value through profit or loss and the resulting exchange gains or losses are included in other income. Assets/ liabilities in this category are presented as current assets/current liabilities if they are either held for trading or are expected to be realized within 12 months after the Balance Sheet date.
(ii) Cash flow hedge
The Group designates certain foreign exchange forward and options contracts as cash flow hedges to mitigate the risk of foreign exchange exposure on highly probable forecast cash transactions.
When a derivative is designated as a cash flow hedging instrument, the effective portion of changes in the fair value of the derivative is recognized in other comprehensive income and accumulated in the cash flow hedging reserve. Any ineffective portion of changes in the fair value of the derivative is recognized immediately in the net profit in the Statement of Profit and Loss. If the hedging instrument no longer meets the criteria for hedge accounting, then hedge accounting is discontinued prospectively. If the hedging instrument expires or is sold, terminated or exercised, the cumulative gain or loss on the hedging instrument recognized in cash flow hedging reserve till the period the hedge was effective remains in cash flow hedging reserve until the forecasted transaction occurs. The cumulative gain or loss previously recognized in the cash flow hedging reserve is transferred to the net profit in the Statement of Profit and Loss upon the occurrence of the related forecasted transaction. If the forecasted transaction is no longer expected to occur, then the amount accumulated in cash flow hedging reserve is reclassified to net profit in the Statement of Profit and Loss.
c. Share capital and treasury shares
(i) Ordinary Shares
Ordinary shares are classified as equity. Incremental costs directly attributable to the issuance of new ordinary shares and share options are recognized as a deduction from equity, net of any tax effects.
(ii) Treasury Shares
When any entity within the Group purchases the Company's ordinary shares, the consideration paid including any directly attributable incremental cost, is presented as a deduction from total equity, until they are cancelled, sold or reissued. When treasury shares are sold or reissued subsequently, the amount received is recognized as an increase in equity, and the resulting surplus or deficit on the transaction is transferred to/ from share premium.
1.11.3 Derecognition of financial instruments
The Group derecognizes a financial asset when the contractual rights to the cash flows from the financial asset expire or it transfers the financial asset and the transfer qualifies for derecognition under Ind AS 109. A financial liability (or a part of a financial liability) is derecognized from the Group's Balance Sheet when the obligation specified in the contract is discharged or cancelled or expires.
1.12 Fair value of financial instruments
In determining the fair value of its financial instruments, the Group uses a variety of methods and assumptions that are based on market conditions and risks existing at each reporting date. The methods used to determine fair value include discounted cash flow analysis, available quoted market prices and dealer quotes. All methods of assessing fair value result in general approximation of value, and such value may never actually be realized.
Refer to Note 2.12 for the disclosure on carrying value and fair value of financial assets and liabilities. For financial assets and liabilities maturing within one year from the Balance Sheet date and which are not carried at fair value, the carrying amounts approximates fair value due to the short maturity of those instruments.
1.13 Impairment
a. Financial assets
The Group recognizes loss allowances using the expected credit loss (ECL) model for the financial assets which are not fair valued through profit or loss. Loss allowance for trade receivables with no significant financing component is measured at an amount equal to lifetime ECL. For all other financial assets, ECLs are measured at an amount equal to the 12-month ECL, unless there has been a significant increase in credit risk from initial recognition in which case those are measured at lifetime ECL. The amount of ECLs (or reversal) that is required to adjust the loss allowance at the reporting date to the amount that is required to be recognised is recognized as an impairment gain or loss in Statement of Profit or Loss.
b. Non-financial assets
(i) Goodwill
Goodwill is tested for impairment on an annual basis and whenever there is an indication that goodwill may be impaired, relying on a number of factors including operating results, business plans and future cash flows. For the purpose of impairment testing, goodwill acquired in a business combination is allocated to the Group's cash generating units (CGU) or groups of CGU’s expected to benefit from the synergies arising from the business combination. A CGU is the smallest identifiable group of assets that generates cash inflows that are largely independent of the cash inflows from other assets or group of assets. Impairment occurs when the carrying amount of a CGU including the goodwill, exceeds the estimated recoverable amount of the CGU. The recoverable amount of a CGU is the higher of its fair value less cost to sell and its value-in-use. Value-in-use is the present value of future cash flows expected to be derived from the CGU.
Total impairment loss of a CGU is allocated first to reduce the carrying amount of goodwill allocated to the CGU and then to the other assets of the CGU pro-rata on the basis of the carrying amount of each asset in the CGU. An impairment loss on goodwill is recognized in net profit in the Statement of Profit and Loss and is not reversed in the subsequent period.
(ii) Intangible assets and property, plant and equipment
Intangible assets and property, plant and equipment are evaluated for recoverability whenever events or changes in circumstances indicate that their carrying amounts may not be recoverable. For the purpose of impairment testing, the recoverable amount (i.e. the higher of the fair value less cost to sell and the value-in-use) is determined on an individual asset basis unless the asset does not generate cash flows that are largely independent of those from other assets. In such cases, the recoverable amount is determined for the CGU to which the asset belongs.
If such assets are considered to be impaired, the impairment to be recognized in the Statement of Profit and Loss is measured by the amount by which the carrying value of the assets exceeds the estimated recoverable amount of the asset. An impairment loss is reversed in the Statement of Profit and Loss if there has been a change in the estimates used to determine the recoverable amount. The carrying amount of the asset is increased to its revised recoverable amount, provided that this amount does not exceed the carrying amount that would have been determined (net of any accumulated amortization or depreciation) had no impairment loss been recognized for the asset in prior years.
1.14 Provisions
A provision is recognized if, as a result of a past event, the Group has a present legal or constructive obligation that is reasonably estimable, and it is probable that an outflow of economic benefits will be required to settle the obligation. Provisions are determined by discounting the expected future cash flows at a pre-tax rate that reflects current market assessments of the time value of money and the risks specific to the liability.
a. Post sales client support
The Group provides its clients with a fixed-period post sales support for corrections of errors and support on all its fixed-price, fixed-timeframe contracts. Costs associated with such support services are accrued at the time related revenues are recorded and included in cost of sales. The Group estimates such costs based on historical experience and estimates are reviewed on a periodic basis for any material changes in assumptions and likelihood of occurrence.
b. Onerous contracts
Provisions for onerous contracts are recognized when the expected benefits to be derived by the Group from a contract are lower than the unavoidable costs of meeting the future obligations under the contract. The provision is measured at the present value of the lower of the expected cost of terminating the contract and the expected net cost of continuing with the contract. Before a provision is established the Group recognizes any impairment loss on the assets associated with that contract.
1.15 Foreign currency
Functional currency
The functional currency of Infosys, Infosys BPO, controlled trusts, EdgeVerve and Skava is the Indian rupee. The functional currencies for Infosys Australia, Infosys China, Infosys Mexico, Infosys Sweden, Infosys Brasil, Infosys Public Services, Infosys Shanghai, Infosys Lodestone, Infosys Americas, Infosys Nova, Infosys Consulting Pte Ltd., Panaya, Kallidus and Noah are the respective local currencies. These financial statements are presented in Indian rupees (rounded off to crore; one crore equals ten million).
Transactions and translations
Foreign-currency denominated monetary assets and liabilities are translated into the relevant functional currency at exchange rates in effect at the Balance Sheet date. The gains or losses resulting from such translations are included in net profit in the Statement of Profit and Loss. Non-monetary assets and non-monetary liabilities denominated in a foreign currency and measured at fair value are translated at the exchange rate prevalent at the date when the fair value was determined. Non-monetary assets and non-monetary liabilities denominated in a foreign currency and measured at historical cost are translated at the exchange rate prevalent at the date of transaction.
Transaction gains or losses realized upon settlement of foreign currency transactions are included in determining net profit for the period in which the transaction is settled. Revenue, expense and cash-flow items denominated in foreign currencies are translated into the relevant functional currencies using the exchange rate in effect on the date of the transaction.
The translation of financial statements of the foreign subsidiaries to the presentation currency is performed for assets and liabilities using the exchange rate in effect at the Balance Sheet date and for revenue, expense and cash-flow items using the average exchange rate for the respective periods. The gains or losses resulting from such translation are included in currency translation reserves under other components of equity. When a subsidiary is disposed off, in full, the relevant amount is transferred to net profit in the Statement of Profit and Loss. However when a change in the parent's ownership does not result in loss of control of a subsidiary, such changes are recorded through equity.
Goodwill and fair value adjustments arising on the acquisition of a foreign entity are treated as assets and liabilities of the foreign entity and translated at the exchange rate in effect at the Balance Sheet date.
1.16 Earnings per equity share
Basic earnings per equity share is computed by dividing the net profit attributable to the equity holders of the Company by the weighted average number of equity shares outstanding during the period. Diluted earnings per equity share is computed by dividing the net profit attributable to the equity holders of the Company by the weighted average number of equity shares considered for deriving basic earnings per equity share and also the weighted average number of equity shares that could have been issued upon conversion of all dilutive potential equity shares. The dilutive potential equity shares are adjusted for the proceeds receivable had the equity shares been actually issued at fair value (i.e. the average market value of the outstanding equity shares). Dilutive potential equity shares are deemed converted as of the beginning of the period, unless issued at a later date. Dilutive potential equity shares are determined independently for each period presented.
The number of equity shares and potentially dilutive equity shares are adjusted retrospectively for all periods presented for any share splits and bonus shares issues including for changes effected prior to the approval of the financial statements by the Board of Directors.
1.17 Income taxes
Income tax expense comprises current and deferred income tax. Income tax expense is recognized in net profit in the Statement of Profit and Loss except to the extent that it relates to items recognized directly in equity, in which case it is recognized in other comprehensive income. Current income tax for current and prior periods is recognized at the amount expected to be paid to or recovered from the tax authorities, using the tax rates and tax laws that have been enacted or substantively enacted by the Balance Sheet date. Deferred income tax assets and liabilities are recognized for all temporary differences arising between the tax bases of assets and liabilities and their carrying amounts in the financial statements except when the deferred income tax arises from the initial recognition of goodwill or an asset or liability in a transaction that is not a business combination and affects neither accounting nor taxable profit or loss at the time of the transaction. Deferred tax assets are reviewed at each reporting date and are reduced to the extent that it is no longer probable that the related tax benefit will be realized.
Deferred income tax assets and liabilities are measured using tax rates and tax laws that have been enacted or substantively enacted by the Balance Sheet date and are expected to apply to taxable income in the years in which those temporary differences are expected to be recovered or settled. The effect of changes in tax rates on deferred income tax assets and liabilities is recognized as income or expense in the period that includes the enactment or the substantive enactment date. A deferred income tax asset is recognized to the extent that it is probable that future taxable profit will be available against which the deductible temporary differences and tax losses can be utilized. Deferred income taxes are not provided on the undistributed earnings of subsidiaries and branches where it is expected that the earnings of the subsidiary or branch will not be distributed in the foreseeable future. The Group offsets current tax assets and current tax liabilities, where it has a legally enforceable right to set off the recognized amounts and where it intends either to settle on a net basis, or to realize the asset and settle the liability simultaneously. The income tax provision for the interim period is made based on the best estimate of the annual average tax rate expected to be applicable for the full financial year. Tax benefits of deductions earned on exercise of employee share options in excess of compensation charged to income are credited to share premium.
1.18 Employee benefits
1.18.1 Gratuity
The Group provides for gratuity, a defined benefit retirement plan ('the Gratuity Plan') covering eligible employees of Infosys and its Indian subsidiaries. The Gratuity Plan provides a lump-sum payment to vested employees at retirement, death, incapacitation or termination of employment, of an amount based on the respective employee's salary and the tenure of employment with the Group.
Liabilities with regard to the Gratuity Plan are determined by actuarial valuation, performed by an independent actuary, at each Balance Sheet date using the projected unit credit method. The Company fully contributes all ascertained liabilities to the Infosys Limited Employees' Gratuity Fund Trust (the Trust). In case of Infosys BPO and EdgeVerve, contributions are made to the Infosys BPO's Employees' Gratuity Fund Trust and EdgeVerve Systems Limited Employees' Gratuity Fund Trust, respectively. Trustees administer contributions made to the Trusts and contributions are invested in a scheme with the Life Insurance Corporation of India as permitted by Indian law.
The Group recognizes the net obligation of a defined benefit plan in its Balance Sheet as an asset or liability. Gains and losses through re-measurements of the net defined benefit liability/(asset) are recognized in other comprehensive income and are not reclassified to profit or loss in subsequent periods. The actual return of the portfolio of plan assets, in excess of the yields computed by applying the discount rate used to measure the defined benefit obligation is recognized in other comprehensive income. The effect of any plan amendments is recognized in net profits in the Statement of Profit and Loss.
1.18.2 Superannuation
Certain employees of Infosys, Infosys BPO and EdgeVerve are participants in a defined contribution plan. The Group has no further obligations to the plan beyond its monthly contributions which are periodically contributed to a trust fund, the corpus of which is invested with the Life Insurance Corporation of India.
1.18.3 Provident fund
Eligible employees of Infosys receive benefits from a provident fund, which is a defined benefit plan. Both the eligible employee and the Company make monthly contributions to the provident fund plan equal to a specified percentage of the covered employee's salary. The Company contributes a portion to the Infosys Limited Employees' Provident Fund Trust. The trust invests in specific designated instruments as permitted by Indian law. The remaining portion is contributed to the government administered pension fund. The rate at which the annual interest is payable to the beneficiaries by the trust is being administered by the government. The Company has an obligation to make good the shortfall, if any, between the return from the investments of the trust and the notified interest rate.
In respect of Indian subsidiaries, eligible employees receive benefits from a provident fund, which is a defined contribution plan. Both the eligible employee and the respective companies make monthly contributions to this provident fund plan equal to a specified percentage of the covered employee's salary. Amounts collected under the provident fund plan are deposited in a government administered provident fund. The companies have no further obligation to the plan beyond its monthly contributions.
1.18.4 Compensated absences
The Group has a policy on compensated absences which are both accumulating and non-accumulating in nature. The expected cost of accumulating compensated absences is determined by actuarial valuation performed by an independent actuary at each Balance Sheet date using projected unit credit method on the additional amount expected to be paid/availed as a result of the unused entitlement that has accumulated at the Balance Sheet date. Expense on non-accumulating compensated absences is recognized in the period in which the absences occur.
1.19 Share-based compensation
The Group recognizes compensation expense relating to share-based payments in net profit using fair value in accordance with Ind AS 102, Share-Based Payment. The estimated fair value of awards is charged to income on a straight-line basis over the requisite service period for each separately vesting portion of the award as if the award was in-substance, multiple awards with a corresponding increase to share options outstanding account.
Amendment to Ind AS 102:
During the quarter, the Company adopted amendment to Ind AS 102 which provides specific guidance to measurement of cash-settled awards, modification of cash-settled awards and awards that include a net settlement feature in respect of withholding taxes. The adoption of amendment did not have any material effect on the interim consolidated financial statements.
1.20 Cash Flow Statement
Cash flows are reported using the indirect method, whereby profit for the period is adjusted for the effects of transactions of a non-cash nature, any deferrals or accruals of past or future operating cash receipts or payments and item of income or expenses associated with investing or financing cash flows. The cash flows from operating, investing and financing activities of the Company are segregated.
Amendment to Ind AS 7:
During the quarter, the Company adopted the amendment to Ind AS 7, which require the entities to provide disclosures that enable users of financial statements to evaluate changes in liabilities arising from financing activities, including both changes arising from cash flows and non-cash changes, suggesting inclusion of a reconciliation between the opening and closing balances in the Balance Sheet for liabilities arising from financing activities, to meet the disclosure requirement. The adoption of amendment did not have any material effect on the interim consolidated financial statements.
1.21 Dividends
The final dividend on shares is recorded as a liability on the date of approval by the shareholders and interim dividends are recorded as a liability on the date of declaration by the Company's Board of Directors.
1.22 Other income
Other income is comprised primarily of interest income, dividend income, gain/loss on investment and exchange gain/loss on forward and options contracts and on translation of other assets and liabilities. Interest income is recognized using the effective interest method. Dividend income is recognized when the right to receive payment is established.
1.23 Leases
Leases under which the group assumes substantially all the risks and rewards of ownership are classified as finance leases. When acquired, such assets are capitalized at fair value or present value of the minimum lease payments at the inception of the lease, whichever is lower. Lease payments under operating leases are recognized as an expense on a straight line basis in net profit in the Statement of Profit and Loss over the lease term.
1.24 Government grants
The Group recognizes government grants only when there is reasonable assurance that the conditions attached to them shall be complied with, and the grants will be received. Government grants related to assets are treated as deferred income and are recognized in net profit in the Statement of Profit and Loss on a systematic and rational basis over the useful life of the asset. Government grants related to revenue are recognized on a systematic basis in net profit in the Statement of Profit and Loss over the periods necessary to match them with the related costs which they are intended to compensate.
2.3 Business combinations
Noah Consulting LLC
On November 16, 2015, Infosys has acquired 100%
membership interest in Noah Consulting, LLC (Noah), a leading provider of advanced information management consulting services for
the oil and gas industry. The business acquisition was conducted by entering into a share purchase agreement for cash consideration
of $33 million (approximately 216 crore), contingent consideration of upto $5 million (approximately 33 crore on acquisition
date) and an additional consideration of upto $32 million (approximately 212 crore on acquisition date), referred to as retention
bonus, payable to the employees of Noah at each anniversary year following the acquisition date over the next three years, subject
to their continuous employment with the group at each anniversary. During the year ended March 31, 2016 based on an assessment
of Noah achieving the targets for the year ended December 31, 2015 and year ended December 31, 2016, the entire contingent consideration
has been reversed in the statement of profit and loss.
The retention bonus is treated as a post-acquisition
employee remuneration expense as per Ind AS 103. Post-acquisition employee remuneration expense of 13 crore has been recorded
in the Statement of Profit and Loss for the three months ended June 30, 2017 and 31 crore for the three months ended June 30,
2016.
Proposed business transfer
On July 14, 2017, the Board of Directors of Infosys authorized the Company to execute a Business Transfer Agreement and related documents with Noah Consulting LLC, a wholly owned subsidiary, to transfer the business of Noah Consulting LLC to Infosys Limited, subject to securing the requisite regulatory approvals for a consideration based on an independent valuation. The transfer of assets and liabilities between entities under common control will be accounted for at carrying values and will not have any impact on the consolidated financial statements.
Kallidus Inc. (d.b.a Skava)
On June 2, 2015, Infosys acquired 100% of the
voting interests in Kallidus Inc., US (Kallidus), a leading provider of digital experience solutions, including mobile commerce
and in-store shopping experiences to large retail clients and 100% of the voting interests of Skava Systems Private Limited, India,
an affiliate of Kallidus. The business acquisition was conducted by entering into a share purchase agreement for cash consideration
of $91 million (approximately 578 crore) and a contingent consideration of up to $20 million (approximately 128 crore on acquisition
date).
The payment of contingent consideration to sellers of Kallidus is dependent upon the achievement of certain financial targets by Kallidus over a period of 3 years ending on December 31, 2017.
The fair value of contingent consideration is determined by discounting the estimated amount payable to the sellers of Kallidus on achievement of certain financial targets. At acquisition date, the key inputs used in determination of the fair value of contingent consideration are the discount rate of 14% and the probabilities of achievement of the financial targets.
During the three months ended June 30, 2017,
contingent consideration of 45 crore was paid to the sellers of Kallidus on the achievement of certain financial targets. The
balance contingent consideration as of June 30, 2017 and March 31, 2017 is 45 crore and 91 crore, respectively, on an undiscounted
basis.
2.4 PROPERTY, PLANT AND EQUIPMENT
Following are the changes in the carrying value of property, plant and equipment for the three months ended June 30, 2017:
In crore
| Particulars | Land- Freehold | Land- Leasehold | Buildings (1) | Plant and machinery | Office Equipment | Computer equipment | Furniture and fixtures | Vehicles | Total |
| Gross carrying value as of April 1, 2017 | 1,095 | 671 | 7,279 | 2,101 | 922 | 4,540 | 1,693 | 31 | 18,332 |
| Additions | – | – | 52 | 32 | 24 | 159 | 42 | 1 | 310 |
| Deletions | – | – | – | (1) | (1) | (31) | (2) | (2) | (37) |
| Translation difference | – | – | 10 | 1 | 1 | 5 | 5 | – | 22 |
| Gross carrying value as of June 30, 2017 | 1,095 | 671 | 7,341 | 2,133 | 946 | 4,673 | 1,738 | 30 | 18,627 |
| Accumulated depreciation as of April 1, 2017 | – | (27) | (2,440) | (1,353) | (599) | (3,053) | (1,092) | (17) | (8,581) |
| Depreciation | – | (1) | (67) | (68) | (33) | (169) | (62) | (1) | (401) |
| Accumulated depreciation on deletions | – | – | – | – | 1 | 31 | 2 | 1 | 35 |
| Translation difference | – | – | – | – | (1) | (4) | (4) | – | (9) |
| Accumulated depreciation as of June 30, 2017 | – | (28) | (2,507) | (1,421) | (632) | (3,195) | (1,156) | (17) | (8,956) |
| Carrying value as of June 30, 2017 | 1,095 | 643 | 4,834 | 712 | 314 | 1,478 | 582 | 13 | 9,671 |
| Carrying value as of April 1, 2017 | 1,095 | 644 | 4,839 | 748 | 323 | 1,487 | 601 | 14 | 9,751 |
Following are the changes in the carrying value of property, plant and equipment for the three months ended June 30, 2016:
In crore
| Land- Freehold | Land- Leasehold | Buildings (1) | Plant and machinery | Office Equipment | Computer equipment | Furniture and fixtures | Vehicles | Total | |
| Gross carrying value as of April 1, 2016 | 972 | 650 | 6,325 | 1,759 | 839 | 4,072 | 1,444 | 29 | 16,090 |
| Additions | 4 | 5 | 36 | 114 | 48 | 184 | 52 | 3 | 446 |
| Deletions | – | – | – | (1) | (2) | (16) | (1) | (1) | (21) |
| Translation difference | – | – | – | – | – | – | (1) | – | (1) |
| Gross carrying value as of June 30, 2016 | 976 | 655 | 6,361 | 1,872 | 885 | 4,240 | 1,494 | 31 | 16,514 |
| Accumulated depreciation as of April 1, 2016 | – | (22) | (2,201) | (1,100) | (509) | (2,618) | (986) | (17) | (7,453) |
| Depreciation | – | (1) | (57) | (62) | (28) | (164) | (45) | (1) | (358) |
| Accumulated depreciation on deletions | – | – | – | 1 | 2 | 15 | 1 | 1 | 20 |
| Translation difference | – | – | – | – | – | – | 1 | – | 1 |
| Accumulated depreciation as of June 30, 2016 | – | (23) | (2,258) | (1,161) | (535) | (2,767) | (1,029) | (17) | (7,790) |
| Carrying value as of June 30, 2016 | 976 | 632 | 4,103 | 711 | 350 | 1,473 | 465 | 14 | 8,724 |
| Carrying value as of April 1, 2016 | 972 | 628 | 4,124 | 659 | 330 | 1,454 | 458 | 12 | 8,637 |
Following are the changes in the carrying value of property, plant and equipment for the year ended March 31, 2017:
In crore
| Land- Freehold | Land- Leasehold | Buildings (1) | Plant and machinery | Office Equipment | Computer equipment | Furniture and fixtures | Vehicles | Total | |
| Gross carrying value as of April 1, 2016 | 972 | 650 | 6,325 | 1,759 | 839 | 4,072 | 1,444 | 29 | 16,090 |
| Additions | 123 | 21 | 981 | 349 | 138 | 800 | 379 | 8 | 2,799 |
| Deletions | – | – | – | (4) | (52) | (315) | (113) | (6) | (490) |
| Translation difference | – | – | (27) | (3) | (3) | (17) | (17) | – | (67) |
| Gross carrying value as of March 31, 2017 | 1,095 | 671 | 7,279 | 2,101 | 922 | 4,540 | 1,693 | 31 | 18,332 |
| Accumulated depreciation as of April 1, 2016 | – | (22) | (2,201) | (1,100) | (509) | (2,618) | (986) | (17) | (7,453) |
| Depreciation | – | (5) | (239) | (261) | (119) | (678) | (210) | (5) | (1,517) |
| Accumulated depreciation on deletions | – | – | – | 4 | 27 | 230 | 92 | 5 | 358 |
| Translation difference | – | – | – | 4 | 2 | 13 | 12 | – | 31 |
| Accumulated depreciation as of March 31, 2017 | – | (27) | (2,440) | (1,353) | (599) | (3,053) | (1,092) | (17) | (8,581) |
| Carrying value as of March 31, 2017 | 1,095 | 644 | 4,839 | 748 | 323 | 1,487 | 601 | 14 | 9,751 |
| Carrying value as of April 1, 2016 | 972 | 628 | 4,124 | 659 | 330 | 1,454 | 458 | 12 | 8,637 |
Notes: (1) Buildings include 250/-
being the value of 5 shares of 50/- each in Mittal Towers Premises Co-operative Society Limited.
Gross carrying value of lease hold land represents amounts paid under certain lease-cum-sale agreements to acquire land including agreements where the Company has an option to purchase or renew the properties on expiry of the lease period.
The aggregate depreciation has been included under depreciation and amortisation expense in the consolidated Statement of Profit and Loss.
2.5 GOODWILL AND OTHER INTANGIBLE ASSETS
Following is a summary of changes in the carrying amount of goodwill:
In crore
| Particulars | As at | |
| June 30, 2017 | March 31, 2017 | |
| Carrying value at the beginning | 3,652 | 3,764 |
| Translation differences | 49 | (112) |
| Carrying value at the end | 3,701 | 3,652 |
For the purpose of impairment testing, goodwill acquired in a business combination is allocated to the CGU or groups of CGUs, which benefit from the synergies of the acquisition. The chief operating decision maker reviews the goodwill for any impairment at the operating segment level, which is represented through groups of CGUs.
The goodwill has been allocated to the operating segments as at March 31, 2017:
(In
crore)
| Segment | As at |
| March 31, 2017 | |
| Financial services | 826 |
| Manufacturing | 409 |
| Retail, Consumer packaged goods and Logistics | 556 |
| Life Sciences, Healthcare and Insurance | 638 |
| Energy & Utilities, Communication and Services | 765 |
| 3,194 | |
| Operating segments without significant goodwill | 458 |
| Total | 3,652 |
The entire goodwill relating to Infosys BPO’s acquisition of McCamish has been allocated to the groups of CGUs which are represented by the Life Sciences, Healthcare and Insurance segment.
The goodwill relating to Infosys BPO, Infosys Lodestone, Portland, Panaya and Kallidus d.b.a Skava has been allocated to the groups of CGUs which are represented by a majority of the entity’s operating segment.
The entire goodwill relating to Noah acquisition has been allocated to the group of CGUs which is represented by the Energy & Utilities, Communication and Services segment.
The recoverable amount of a CGU is the higher of its fair value less cost to sell and its value-in-use. The fair value of a CGU is determined based on the market capitalization. The value-in-use is determined based on specific calculations. These calculations use pre-tax cash flow projections for a CGU / groups of CGUs over a period of five years. An average of the range of each assumption used is mentioned below. As of March 31, 2017, the estimated recoverable amount of the CGU exceeded its carrying amount. The recoverable amount was computed based on the fair value less cost to sell being higher than value-in-use. The carrying amount of the CGU was computed by allocating the net assets to operating segments for the purpose of impairment testing. The key assumptions used for the calculations are as follows:
(in %)
| As at | |
| March 31, 2017 | |
| Long term growth rate | 8-10 |
| Operating margins | 17-20 |
| Discount rate | 14.4 |
The above discount rate is based on the Weighted Average Cost of Capital (WACC) of the Company. These estimates are likely to differ from future actual results of operations and cash flows.
Following are the changes in the carrying value of acquired intangible assets for the three months ended June 30, 2017:
In crore
| Particulars | Customer related | Software related | Sub-contracting rights related | Intellectual property rights related | Land use- rights related | Brand or Trademark Related | Others | Total |
| Gross carrying value as of April 1, 2017 | 750 | 405 | 21 | 1 | 66 | 90 | 62 | 1,395 |
| Additions during the period | – | – | – | – | – | – | – | – |
| Deletions during the period | – | – | – | – | – | – | – | – |
| Translation difference | 7 | (1) | – | – | 1 | – | – | 7 |
| Gross carrying value as of June 30, 2017 | 757 | 404 | 21 | 1 | 67 | 90 | 62 | 1,402 |
| Accumulated amortization as of April 1, 2017 | (382) | (121) | (21) | (1) | (7) | (49) | (38) | (619) |
| Amortization expense | (22) | (20) | – | – | – | (3) | (4) | (49) |
| Deletion during the period | – | – | – | – | – | – | – | – |
| Translation differences | (3) | 1 | – | – | – | (2) | – | (4) |
| Accumulated amortization as of June 30, 2017 | (407) | (140) | (21) | (1) | (7) | (54) | (42) | (672) |
| Carrying value as of April 1, 2017 | 368 | 284 | – | – | 59 | 41 | 24 | 776 |
| Carrying value as of June 30, 2017 | 350 | 264 | – | – | 60 | 36 | 20 | 730 |
| Estimated Useful Life (in years) | 3-10 | 5-8 | – | – | 50 | 3-10 | 3-5 | |
| Estimated Remaining Useful Life (in years) | 1-6 | 3-6 | – | – | 44 | 1-8 | 1-3 |
Following are the changes in the carrying value of acquired intangible assets for the three months ended June 30, 2016:
In crore
| Particulars | Customer related | Software related | Sub-contracting rights related | Intellectual property rights related | Land use- rights related | Brand or Trademark Related | Others | Total |
| Gross carrying value as of April 1, 2016 | 775 | 414 | 21 | 1 | 72 | 93 | 63 | 1,439 |
| Additions during the period | – | – | – | – | – | – | – | – |
| Deletions during the period | – | – | – | – | – | – | – | – |
| Translation difference | 9 | 8 | – | – | – | 1 | 1 | 19 |
| Gross carrying value as of June 30, 2016 | 784 | 422 | 21 | 1 | 72 | 94 | 64 | 1,458 |
| Accumulated amortization as of April 1, 2016 | (303) | (62) | (21) | (1) | (6) | (38) | (23) | (454) |
| Amortization expense | (23) | (11) | – | – | – | (4) | (4) | (42) |
| Deletions during the period | – | – | – | – | – | – | – | – |
| Translation differences | (3) | (1) | – | – | – | – | – | (4) |
| Accumulated amortization as of June 30, 2016 | (329) | (74) | (21) | (1) | (6) | (42) | (27) | (500) |
| Carrying value as of April 1, 2016 | 472 | 352 | – | – | 66 | 55 | 40 | 985 |
| Carrying value as of June 30, 2016 | 455 | 348 | – | – | 66 | 52 | 37 | 958 |
Following are the changes in the carrying value of acquired intangible assets for the year ended March 31, 2017:
In crore
| Particulars | Customer related | Software related | Sub-contracting rights related | Intellectual property rights related | Land use- rights related | Brand or Trademark Related | Others | Total |
| Gross carrying value as of April 1, 2016 | 775 | 414 | 21 | 1 | 72 | 93 | 63 | 1,439 |
| Additions during the period | – | – | – | – | – | – | – | – |
| Deletions during the period | – | – | – | – | – | – | – | – |
| Translation difference | (25) | (9) | – | – | (6) | (3) | (1) | (44) |
| Gross carrying value as of March 31, 2017 | 750 | 405 | 21 | 1 | 66 | 90 | 62 | 1,395 |
| Accumulated amortization as of April 1, 2016 | (303) | (62) | (21) | (1) | (6) | (38) | (23) | (454) |
| Amortization expense | (91) | (63) | – | – | (1) | (14) | (17) | (186) |
| Deletion during the period | – | – | – | – | – | – | – | – |
| Translation differences | 12 | 4 | – | – | – | 3 | 2 | 21 |
| Accumulated amortization as of March 31, 2017 | (382) | (121) | (21) | (1) | (7) | (49) | (38) | (619) |
| Carrying value as of April 1, 2016 | 472 | 352 | – | – | 66 | 55 | 40 | 985 |
| Carrying value as of March 31, 2017 | 368 | 284 | – | – | 59 | 41 | 24 | 776 |
| Estimated Useful Life (in years) | 3-10 | 5-8 | – | – | 50 | 3-10 | 3-5 | |
| Estimated Remaining Useful Life (in years) | 1-6 | 3-6 | – | – | 44 | 1-8 | 1-4 |
During the year ended March 31, 2017, the management
based on an internal evaluation reassessed the remaining useful life of certain technology assets acquired as a part of business
combinations. Accordingly, the remaining useful life of the said asset which was 8 years has been revised to 3 years. Amortization
expense for the year ended March 31, 2017 is higher by 19 crore due to the revision.
The amortization expense has been included under depreciation and amortization expense in the consolidated statement of profit and loss.
Research and development expense recognized
in net profit in the consolidated Statement of Profit and Loss for the three months ended June 30, 2017 and June 30, 2016 is 198
crore and 184 crore respectively.
2.6 INVESTMENTS
In crore
| Particulars | As at | |
| June 30, 2017 | March 31, 2017 | |
| Non-current | ||
| Unquoted | ||
| Investments carried at fair value through other comprehensive income(refer note 2.6.1) | ||
| Preference securities | 131 | 144 |
| Equity instruments | 16 | 15 |
| 147 | 159 | |
| Investments carried at fair value through profit and loss(refer note 2.6.1) | ||
| Convertible promissory note | 11 | 10 |
| Others | 46 | 35 |
| 57 | 45 | |
| Quoted | ||
| Investment carried at amortized cost(refer note 2.6.2) | ||
| Tax free bonds | 1,898 | 1,898 |
| 1,898 | 1,898 | |
| Investments carried at fair value through profit and loss(refer note 2.6.3) | ||
| Fixed maturity plan securities | 414 | 407 |
| 414 | 407 | |
| Investments carried at fair value through other comprehensive income(refer note 2.6.4) | ||
| Non convertible debentures | 3,545 | 3,873 |
| 3,545 | 3,873 | |
| Total non-current investments | 6,061 | 6,382 |
| Current | ||
| Unquoted | ||
| Investments carried at fair value through profit or loss(refer note 2.6.3) | ||
| Liquid mutual fund units | 1,560 | 1,803 |
| 1,560 | 1,803 | |
| Investments carried at fair value through other comprehensive income | ||
| Certificates of deposit (refer note 2.6.4) | 8,165 | 7,905 |
| Preference Securities (refer note 2.6.1) | 27 | – |
| 8,192 | 7,905 | |
| Quoted | ||
| Investment carried at amortized cost(refer note 2.6.2) | ||
| Government Bonds | 6 | 9 |
| 6 | 9 | |
| Investments carried at fair value through profit or loss(refer note 2.6.3) | ||
| Fixed maturity plan securities | 154 | 151 |
| 154 | 151 | |
| Investments carried at fair value through other comprehensive income(refer note 2.6.4) | ||
| Non convertible debentures | 476 | 102 |
| 476 | 102 | |
| Total current investments | 10,388 | 9,970 |
| Total investments | 16,449 | 16,352 |
| Aggregate amount of quoted investments | 6,493 | 6,440 |
| Market value of quoted investments (including interest accrued) | 6,811 | 6,701 |
| Aggregate amount of unquoted investments (including investment in associate) | 9,956 | 9,983 |
| Aggregate amount of impairment made for non-current unquoted investments (including investment in associate) | 95 | 24 |
| Investments carried at amortized cost | 1,904 | 1,907 |
| Investments carried at fair value through other comprehensive income | 12,360 | 12,039 |
| Investments carried at fair value through profit or loss | 2,185 | 2,406 |
2.6.1 Details of investments
The details of investments in preference, equity and other instruments at June 30, 2017 and March 31, 2017 are as follows:
In crore, except otherwise stated
| Particulars | As at | |
| June 30, 2017 | March 31, 2017 | |
| Preference securities | ||
| Airviz Inc. | 9 | 9 |
| 2,82,279 (2,82,279) Series A Preferred Stock, fully paid up, par value USD 0.001 each | ||
| ANSR Consulting | 10 | 10 |
| 52,631 (52,631) Series A Preferred Stock, fully paid up, par value USD 0.001 each | ||
| Whoop Inc | 15 | 15 |
| 16,48,352 (16,48,352) Series B Preferred Stock, fully paid up, par value USD 0.0001 each | ||
| CloudEndure Ltd. | 37 | 37 |
| 25,59,290 (25,59,290) Preferred Series B Shares, fully paid up, par value ILS 0.01 each | ||
| Nivetti Systems Private Limited | 10 | 10 |
| 2,28,501 (2,28,501) Preferred Stock, fully paid up, par value 1 each |
||
| Waterline Data Science, Inc | 24 | 24 |
| 39,33,910 (39,33,910) Preferred Series B Shares, fully paid up, par value USD 0.00001 each | ||
| Trifacta Inc. | 26 | 26 |
| 11,80,358 (11,80,358) Preferred Stock | ||
| Cloudyn Software Ltd | 27 | 13 |
| 54,044 (27,022) Preferred Series B-3 shares, fully paid up, par value ILS 0.01 each | ||
| Equity Instruments | ||
| OnMobile Systems Inc., USA | – | – |
| 21,54,100 (21,54,100) common stock at USD 0.4348 each, fully paid up, par value USD 0.001 each | ||
| Merasport Technologies Private Limited | – | – |
| 2,420 (2,420) equity shares at 8,052 each, fully paid up, par value 10 each |
||
| Global Innovation and Technology Alliance | 1 | 1 |
| 15,000 (15,000) equity shares at 1,000 each, fully paid up, par value 1,000 each |
||
| Unsilo A/S | 15 | 14 |
| 69,894 (69,894) Equity Shares, fully paid up, par value DKK 1 each | ||
| Others | ||
| Stellaris Venture Partners India I | 3 | 3 |
| Vertex Ventures US Fund L.L.P | 43 | 32 |
| Convertible promissory note | ||
| Tidalscale | 11 | 10 |
| 231 | 204 |
2.6.2 Details of investments in tax free bonds and government bonds
The balances held in tax free bonds as at June 30, 2017 and March 31, 2017 are as follows:
In crore, except as otherwise stated
| Particulars | As at June 30, 2017 | As at March 31, 2017 | |||
| Face Value |
Units | Amount | Units | Amount | |
| 7.04% Indian Railway Finance Corporation Limited Bonds 03MAR2026 | 10,00,000/- | 470 | 50 | 470 | 50 |
| 7.16% Power Finance Corporation Ltd Bonds 17JUL2025 | 10,00,000/- | 1,000 | 107 | 1,000 | 107 |
| 7.18% Indian Railway Finance Corporation Limited Bonds 19FEB2023 | 1,000/- | 20,00,000 | 201 | 20,00,000 | 201 |
| 7.28% Indian Railway Finance Corporation Limited 21DEC2030 | 1,000/- | 4,22,800 | 42 | 4,22,800 | 42 |
| 7.28% National Highways Authority of India Bonds 18SEP2030 | 10,00,000/- | 3,300 | 343 | 3,300 | 343 |
| 7.34% Indian Railway Finance Corporation Limited Bonds 19FEB2028 | 1,000/- | 21,00,000 | 211 | 21,00,000 | 211 |
| 7.35% National Highways Authority of India Bonds 11JAN2031 | 1,000/- | 5,71,396 | 57 | 5,71,396 | 57 |
| 7.93% Rural Electrification Corporation Limited Bonds 27MAR2022 | 1,000/- | 2,00,000 | 21 | 2,00,000 | 21 |
| 8.00% Indian Railway Finance Corporation Limited Bonds 2022 | 1,000/- | 1,50,000 | 15 | 1,50,000 | 15 |
| 8.10% Indian Railway Finance Corporation Limited Bonds 23FEB2027 | 1,000/- | 5,00,000 | 53 | 5,00,000 | 53 |
| 8.20% Power Finance Corporation Limited Bonds 2022 | 1,000/- | 5,00,000 | 50 | 5,00,000 | 50 |
| 8.26% India Infrastructure Finance Company Limited Bonds 23AUG2028 | 10,00,000/- | 1,000 | 100 | 1,000 | 100 |
| 8.30% National Highways Authority of India Bonds 25JAN2027 | 1,000/- | 5,00,000 | 53 | 5,00,000 | 53 |
| 8.35% National Highways Authority of India Bonds 22NOV2023 | 10,00,000/- | 1,500 | 150 | 1,500 | 150 |
| 8.46% India Infrastructure Finance Company Limited Bonds 30AUG2028 | 10,00,000/- | 2,000 | 200 | 2,000 | 200 |
| 8.46% Power Finance Corporation Limited Bonds 30AUG2028 | 10,00,000/- | 1,500 | 150 | 1,500 | 150 |
| 8.48% India Infrastructure Finance Company Limited Bonds 05SEP2028 | 10,00,000/- | 450 | 45 | 450 | 45 |
| 8.54% Power Finance Corporation Limited Bonds 16NOV2028 | 1,000/- | 5,00,000 | 50 | 5,00,000 | 50 |
| 74,55,416 | 1,898 | 74,55,416 | 1,898 | ||
The balances held in government bonds as at June 30, 2017 and March 31, 2017 are as follows:
In crore, except as otherwise stated
| Particulars | Face Value PHP | As at June 30, 2017 | As at March 31, 2017 | ||
| Units | Amount | Units | Amount | ||
| Treasury Notes PHY6972FWQ99 MAT DATE 07 Jun 2017 | 100 | – | – | 3,40,000 | 4 |
| Treasury Notes PIBL1217E082 MAT DATE 09 May 2018 | 100 | 1,00,000 | 1 | – | – |
| Treasury Notes PIBL1217C056 MAT DATE 14 Mar 2018 | 100 | 4,00,000 | 5 | 4,00,000 | 5 |
| 5,00,000 | 6 | 7,40,000 | 9 | ||
2.6.3 Details of investments in liquid mutual fund units and fixed maturity plans
The balances held in liquid mutual fund units as at June 30, 2017 and March 31, 2017 are as follows:
In crore, except as otherwise stated
| Particulars | As at June 30, 2017 | As at March 31, 2017 | ||
| Units | Amount | Units | Amount | |
| Birla Sun Life Cash Plus- Growth- Direct Plan | 19,67,474 | 52 | 1,45,22,491 | 380 |
| Birla Sun Life Floating Rate Fund- Short Term Plan- Growth Direct Plan | 1,43,25,061 | 316 | – | – |
| BSL Cash Manager - Growth | 2,29,989 | 9 | 2,66,264 | 11 |
| HDFC Liquid Fund- Direct Plan- Growth Option | 8,26,701 | 269 | – | – |
| ICICI Prudential Liquid- Direct Plan- Growth | 1,38,92,060 | 340 | 1,03,88,743 | 250 |
| ICICI Prudential Money Market Fund- Direct Plan - Growth | 11,38,787 | 26 | – | – |
| IDFC Cash Fund- Direct Plan- Growth | 8,34,497 | 168 | 12,65,679 | 250 |
| Kotak Low Duration Fund Direct Growth (Ultra Short Term) | – | – | 15,02,564 | 305 |
| L&T Liquid Fund Direct Plan Growth | – | – | 6,72,806 | 150 |
| Reliance Liquid Fund Cash Plan | 28,305 | 8 | 28,305 | 7 |
| Reliance Liquid Fund- Treasury Plan- Direct Growth Plan- Growth Option | 8,47,956 | 342 | 8,82,465 | 350 |
| SBI Premier Liquid Fund- Direct Plan- Growth | 1,15,696 | 30 | 3,91,909 | 100 |
| 3,42,06,526 | 1,560 | 2,99,21,226 | 1,803 | |
The balances held in fixed maturity plans as at June 30, 2017 and March 31, 2017 are as follows:
| Particulars | As at June 30, 2017 | As at March 31, 2017 | ||
| Units | Amount | Units | Amount | |
| Birla Sun Life Fixed Term Plan- Series OD 1145 Days- GR Direct | 6,00,00,000 | 61 | 6,00,00,000 | 61 |
| Birla Sun Life Fixed Term Plan- Series OE 1153 Days- GR Direct | 2,50,00,000 | 26 | 2,50,00,000 | 25 |
| HDFC FMP 1155D Feb 2017- Direct Growth Series 37 | 3,80,00,000 | 39 | 3,80,00,000 | 38 |
| HDFC FMP 1169D Feb 2017- Direct- Quarterly Dividend- Series 37 | 4,50,00,000 | 45 | 4,50,00,000 | 45 |
| ICICI FMP Series 80-1194 D Plan F Div | 5,50,00,000 | 57 | 5,50,00,000 | 55 |
| ICICI Prudential Fixed Maturity Plan Series 80- 1187 Days Plan G Direct Plan | 4,20,00,000 | 43 | 4,20,00,000 | 42 |
| ICICI Prudential Fixed Maturity Plan Series 80- 1253 Days Plan J Direct Plan | 3,00,00,000 | 31 | 3,00,00,000 | 30 |
| IDFC Fixed Term Plan Series 129 Direct Plan- Growth 1147 Days | 1,00,00,000 | 10 | 1,00,00,000 | 10 |
| IDFC Fixed Term Plan Series 131 Direct Plan- Growth 1139 Days | 1,50,00,000 | 15 | 1,50,00,000 | 15 |
| Kotak FMP Series 199 Direct- Growth | 3,50,00,000 | 36 | 3,50,00,000 | 36 |
| Reliance Fixed Horizon Fund- XXXII Series 8- Dividend Plan | 5,00,00,000 | 51 | 5,00,00,000 | 50 |
| Reliance Yearly Interval Fund Series 1- Direct Plan- Growth Plan | 10,69,06,898 | 154 | 10,69,06,898 | 151 |
| 51,19,06,898 | 568 | 51,19,06,898 | 558 | |
2.6.4 Details of investments in non convertible debentures and certificates of deposit
The balances held in non convertible debenture units as at June 30, 2017 and March 31, 2017 is as follows:
In crore, except as otherwise stated
| Particulars | As at June 30, 2017 | As at March 31, 2017 | |||
| Face Valu e |
Units | Amount | Units | Amount | |
| 7.48% Housing Development Finance Corporation Ltd 18NOV2019 | 1,00,00,000/- | 50 | 53 | 50 | 52 |
| 7.58% LIC Housing Finance Ltd 28FEB2020 | 10,00,000/- | 1,000 | 104 | 1,000 | 100 |
| 7.58% LIC Housing Finance Ltd 11JUN2020 | 10,00,000/- | 500 | 52 | 500 | 51 |
| 7.59% LIC Housing Finance Ltd 14OCT2021 | 10,00,000/- | 3,000 | 319 | 3,000 | 309 |
| 7.75% LIC Housing Finance Ltd 27AUG2021 | 10,00,000/- | 1,250 | 134 | 1,250 | 129 |
| 7.79% LIC Housing Finance Ltd 19JUN2020 | 10,00,000/- | 500 | 51 | 500 | 52 |
| 7.80% Housing Development Finance Corporation Ltd 11NOV2019 | 1,00,00,000/- | 150 | 159 | 150 | 155 |
| 7.81% LIC Housing Finance Ltd 27APR2020 | 10,00,000/- | 2,000 | 205 | 2,000 | 208 |
| 7.95% Housing Development Finance Corporation Ltd 23SEP2019 | 1,00,00,000/- | 50 | 54 | 50 | 53 |
| 8.02% LIC Housing Finance Ltd 18FEB2020 | 10,00,000/- | 500 | 52 | 500 | 51 |
| 8.26% Housing Development Finance Corporation Ltd 12AUG2019 | 1,00,00,000/- | 100 | 109 | 100 | 106 |
| 8.34% Housing Development Finance Corporation Ltd 06MAR2019 | 1,00,00,000/- | 200 | 206 | 200 | 217 |
| 8.37% LIC Housing Finance Ltd 03OCT2019 | 10,00,000/- | 2,000 | 207 | 2,000 | 218 |
| 8.37% LIC Housing Finance Ltd 10MAY2021 | 10,00,000/- | 500 | 52 | 500 | 55 |
| 8.43% IDFC Bank Limited 30JAN2018 | 10,00,000/- | 1,000 | 104 | 1,000 | 102 |
| 8.46% Housing Development Finance Corporation Ltd 11MAR2019 | 1,00,00,000/- | 50 | 51 | 50 | 54 |
| 8.47% LIC Housing Finance Ltd 21JAN2020 | 10,00,000/- | 500 | 53 | 500 | 52 |
| 8.49% Housing Development Finance Corporation Ltd 27APR2020 | 5,00,000/- | 900 | 47 | 900 | 49 |
| 8.50% Housing Development Finance Corporation Ltd 31AUG2020 | 1,00,00,000/- | 100 | 110 | 100 | 108 |
| 8.54% IDFC Bank Limited 30MAY2018 | 10,00,000/- | 1,500 | 185 | 1,500 | 182 |
| 8.59% Housing Development Finance Corporation Ltd 14JUN2019 | 1,00,00,000/- | 50 | 53 | 50 | 51 |
| 8.60% LIC Housing Finance Ltd 22JUL2020 | 10,00,000/- | 1,000 | 111 | 1,000 | 108 |
| 8.60% LIC Housing Finance Ltd 29JUL2020 | 10,00,000/- | 1,750 | 194 | 1,750 | 190 |
| 8.61% LIC Housing Finance Ltd 11DEC2019 | 10,00,000/- | 1,000 | 107 | 1,000 | 104 |
| 8.66% IDFC Bank Limited 25JUN2018 | 10,00,000/- | 1,520 | 187 | 1,520 | 184 |
| 8.66% IDFC Bank Limited 27DEC2018 | 10,00,000/- | 400 | 50 | 400 | 49 |
| 8.72% Housing Development Finance Corporation Ltd 15APR2019 | 1,00,00,000/- | 75 | 78 | 75 | 77 |
| 8.75% Housing Development Finance Corporation Ltd 13JAN2020 | 5,00,000/- | 5,000 | 267 | 5,000 | 260 |
| 8.75% LIC Housing Finance Ltd 14JAN2020 | 10,00,000/- | 1,070 | 115 | 1,070 | 112 |
| 8.75% LIC Housing Finance Ltd 21DEC2020 | 10,00,000/- | 1,000 | 107 | 1,000 | 104 |
| 8.97% LIC Housing Finance Ltd 29OCT2019 | 10,00,000/- | 500 | 55 | 500 | 53 |
| 9.45% Housing Development Finance Corporation Ltd 21AUG2019 | 10,00,000/- | 3,000 | 336 | 3,000 | 327 |
| 9.65% Housing Development Finance Corporation Ltd 19JAN2019 | 10,00,000/- | 500 | 54 | 500 | 53 |
| 32,715 | 4,021 | 32,715 | 3,975 | ||
The balances held in certificates of deposit as at June 30, 2017 and March 31, 2017 are as follows:
In crore, except as otherwise stated
| Particulars | As at June 30, 2017 | As at March 31, 2017 | |||
| Face Valu e |
Units | Amount | Units | Amount | |
| Andhra Bank | 1,00,000/- | 25,000 | 249 | 35,000 | 344 |
| Axis Bank | 1,00,000/- | 3,05,600 | 2,963 | 3,05,600 | 2,914 |
| Corporation Bank | 1,00,000/- | 33,500 | 331 | 33,500 | 327 |
| DBS Bank | 1,00,000/- | – | – | 5,000 | 49 |
| ICICI Bank | 1,00,000/- | 42,500 | 419 | 42,500 | 413 |
| IDFC Bank | 1,00,000/- | 1,40,000 | 1,350 | 1,40,000 | 1,328 |
| IndusInd Bank | 1,00,000/- | 1,06,400 | 1,027 | 1,06,400 | 1,011 |
| Kotak Bank | 1,00,000/- | 1,15,500 | 1,109 | 85,500 | 813 |
| Vijaya Bank | 1,00,000/- | 14,000 | 139 | 14,000 | 137 |
| Yes Bank | 1,00,000/- | 60,000 | 578 | 60,000 | 569 |
| 8,42,500 | 8,165 | 8,27,500 | 7,905 | ||
2.7 LOANS
In crore
| Particulars | As at | |
| June 30, 2017 | March 31, 2017 | |
| Non Current | ||
| Unsecured, considered good | ||
| Other loans | ||
| Loans to employees | 23 | 29 |
| 23 | 29 | |
| Unsecured, considered doubtful | ||
| Loans to employees | 25 | 24 |
| 48 | 53 | |
| Less: Allowance for doubtful loans to employees | 25 | 24 |
| 23 | 29 | |
| Current | ||
| Unsecured, considered good | ||
| Other loans | ||
| Loans to employees | 255 | 272 |
| 255 | 272 | |
| Total loans | 278 | 301 |
2.8 OTHER FINANCIAL ASSETS
In crore
| Particulars | As at | |
| June 30, 2017 | March 31, 2017 | |
| Non Current | ||
| Security deposits (1) | 89 | 86 |
| Rental deposits (1) | 171 | 175 |
| Restricted deposits(1) | 48 | 48 |
| 308 | 309 | |
| Current | ||
| Security deposits (1) | 7 | 10 |
| Rental deposits (1) | 14 | 9 |
| Restricted deposits (1) | 1,425 | 1,416 |
| Unbilled revenues (1) | 3,945 | 3,648 |
| Interest accrued but not due (1) | 851 | 576 |
| Foreign currency forward and options contracts (2) (3) | 24 | 284 |
| Others (1) | 77 | 37 |
| 6,343 | 5,980 | |
| Total financial assets | 6,651 | 6,289 |
| (1) Financial assets carried at amortized cost | 6,627 | 6,005 |
| (2) Financial assets carried at fair value through other comprehensive income | – | 52 |
| (3) Financial assets carried at fair value through profit or loss | 24 | 232 |
Restricted deposits represent deposits with financial institutions to settle employee-related obligations as and when they arise during the normal course of business. Security deposits relate principally to leased telephone lines and electricity supplies. Other assets primarily represent travel advances and other recoverables.
2.9 TRADE RECEIVABLES (1)
In crore
| Particulars | As at | |
| June 30, 2017 | March 31, 2017 | |
| Current | ||
| Unsecured | ||
| Considered good | 12,488 | 12,322 |
| Considered doubtful | 297 | 318 |
| 12,785 | 12,640 | |
| Less: Allowances for credit loss | 297 | 318 |
| 12,488 | 12,322 | |
| (1) Includes dues from companies where directors are interested | 5 | 1 |
2.10 CASH AND CASH EQUIVALENTS
In crore
| Particulars | As at | |
| June 30, 2017 | March 31, 2017 | |
| Balances with banks | ||
| In current and deposit accounts | 15,493 | 14,889 |
| Cash on hand | – | – |
| Others | ||
| Deposits with financial institutions | 7,624 | 7,736 |
| 23,117 | 22,625 | |
| Balances with banks in unpaid dividend accounts | 25 | 17 |
| Deposit with more than 12 months maturity | 6,953 | 6,954 |
| Balances with banks held as margin money deposits against guarantees | 420 | 404 |
Cash and cash equivalents as of June 30, 2017
and March 31, 2017 include restricted cash and bank balances of 601 crore and 572 crore, respectively.
The restrictions are primarily on account of cash and bank balances held by irrevocable trusts controlled by the Company, bank
balances held as margin money deposits against guarantees and balances held in unpaid dividend bank accounts.
The deposits maintained by the Group with banks and financial institutions comprise of time deposits, which can be withdrawn by the Group at any point without prior notice or penalty on the principal.
The details of balances as on Balance Sheet dates with banks are as follows:
In crore
| Particulars | As at | |
| June 30, 2017 | March 31, 2017 | |
| Current accounts | ||
| ANZ Bank, Taiwan | 6 | 3 |
| Axis Bank, India | 1 | 1 |
| Banamex Bank, Mexico | 2 | 2 |
| Banamex Bank, Mexico (U.S. Dollar account) | 8 | 8 |
| Bank of America, Mexico | 74 | 54 |
| Bank of America, USA | 960 | 1,030 |
| Bank of Baroda, Mauritius | 1 | – |
| Bank Zachodni WBK S.A, Poland | 10 | 4 |
| Bank of Tokyo-Mitsubishi UFJ Ltd., Japan | 2 | – |
| Barclays Bank, UK | 7 | 1 |
| Bank Leumi, Israel (US Dollar account) | 36 | 2 |
| Bank Leumi, Israel | 8 | 11 |
| Bank Leumi, Israel (YEN account) | 2 | – |
| BNP Paribas Bank, Norway | 43 | 17 |
| China Merchants Bank, China | 2 | 9 |
| Citibank N.A, China | 146 | 61 |
| Citibank N.A., China (U.S. Dollar account) | 19 | 11 |
| Citibank N.A., Costa Rica | 2 | 5 |
| Citibank N.A., Australia | 48 | 19 |
| Citibank N.A., Brazil | 20 | 30 |
| Citibank N.A., Dubai | 1 | 1 |
| Citibank N.A., Hungary | 3 | 3 |
| Citibank N.A., India | 2 | 3 |
| Citibank N.A., Japan | 6 | 12 |
| Citibank N.A., New Zealand | 8 | 10 |
| Citibank N.A., Portugal | 2 | 2 |
| Citibank N.A., Singapore | – | 2 |
| Citibank N.A., South Korea | – | 1 |
| Citibank N.A., South Africa | 15 | 9 |
| Citibank N.A., South Africa (Euro account) | 1 | 1 |
| Citibank N.A., Philippines, (U.S. Dollar account) | – | 1 |
| Citibank N.A., USA | 92 | 78 |
| Citibank N.A., EEFC (U.S. Dollar account) | 56 | 1 |
| Commerzbank, Germany | 21 | 18 |
| Danske Bank, Sweden | 1 | – |
| Deutsche Bank, India | 11 | 12 |
| Deutsche Bank, Philippines | 4 | 5 |
| Deutsche Bank, Philippines (U.S. Dollar account) | 3 | 4 |
| Deutsche Bank, Poland | 9 | 12 |
| Deutsche Bank, Poland (Euro account) | 3 | 4 |
| Deutsche Bank, EEFC (Australian Dollar account) | 2 | 38 |
| Deutsche Bank, EEFC (Euro account) | 28 | 25 |
| Deutsche Bank, EEFC (Swiss Franc account) | 1 | 2 |
| Deutsche Bank, EEFC (U.S. Dollar account) | 83 | 76 |
| Deutsche Bank, EEFC (United Kingdom Pound Sterling account) | 5 | 10 |
| Deutsche Bank, Belgium | 65 | 10 |
| Deutsche Bank, Malaysia | – | 7 |
| Deutsche Bank, Czech Republic | 10 | 8 |
| Deutsche Bank, Czech Republic (Euro account) | 6 | 7 |
| Deutsche Bank, Czech Republic (U.S. Dollar account) | 29 | 30 |
| Deutsche Bank, France | 9 | 8 |
| Deutsche Bank, Germany | 13 | 48 |
| Deutsche Bank, Netherlands | 9 | 2 |
| Deutsche Bank, Russia | 9 | 3 |
| Deutsche Bank, Russia (U.S. Dollar account) | 8 | 1 |
| Deutsche Bank, Singapore | 1 | 6 |
| Deutsche Bank, Spain | 1 | – |
| Deutsche Bank, Switzerland | 22 | 9 |
| Deutsche Bank, Switzerland (U.S. Dollar account) | – | 1 |
| Deutsche Bank, United Kingdom | 43 | 26 |
| Deutsche Bank, USA | 2 | 12 |
| HSBC Bank, Brazil | – | 1 |
| HSBC Bank, Hong Kong | 1 | 1 |
| ICICI Bank, India | 47 | 53 |
| ICICI Bank, EEFC (Euro account) | – | 1 |
| ICICI Bank, EEFC (U.S. Dollar account) | 17 | 5 |
| ICICI Bank, EEFC (United Kingdom Pound Sterling account) | 1 | 1 |
| ING Bank, Belgium | 2 | 2 |
| Nordbanken, Sweden | 20 | 33 |
| Punjab National Bank, India | 13 | 6 |
| Raiffeisen Bank, Czech Republic | 4 | 4 |
| Raiffeisen Bank, Romania | 6 | 4 |
| Royal Bank of Canada, Canada | 118 | 83 |
| Santander Bank, Argentina | 2 | 1 |
| State Bank of India, India | 55 | 7 |
| Silicon Valley Bank, USA | 7 | 4 |
| Silicon Valley Bank, EEFC (U.S. Dollar account) | 1 | – |
| Silicon Valley Bank (Euro account) | 14 | 19 |
| Silicon Valley Bank (United Kingdom Pound Sterling account) | 3 | 2 |
| Union Bank of Switzerland AG | – | 3 |
| Union Bank of Switzerland AG, (Euro account) | – | 4 |
| Union Bank of Switzerland AG, (Hong Kong Dollar account) | 1 | – |
| Wells Fargo Bank N.A., USA | 39 | 33 |
| Westpac, Australia | 1 | 1 |
| Yes Bank, India | 9 | – |
| 2,342 | 2,044 | |
In crore
| Particulars | As at | |
| June 30, 2017 | March 31, 2017 | |
| Deposit accounts | ||
| Axis Bank | 1,081 | 1,175 |
| Bank BGZ BNP Paribas S.A | 157 | 183 |
| Barclays Bank | 825 | 825 |
| Canara Bank | 84 | 84 |
| Citibank | 146 | 165 |
| Deutsche Bank, Poland | 105 | 71 |
| HDFC Bank | 2,444 | 469 |
| HSBC Bank | 500 | 500 |
| ICICI Bank | 5,182 | 4,644 |
| IDBI Bank | – | 1,750 |
| IDFC Bank | 200 | 200 |
| IndusInd Bank | 191 | 191 |
| Kotak Mahindra Bank | 535 | 535 |
| South Indian Bank | 450 | 450 |
| Standard Chartered Bank | – | 500 |
| Syndicate Bank | 49 | 49 |
| Yes Bank | 757 | 633 |
| 12,706 | 12,424 | |
| Unpaid dividend accounts | ||
| Axis Bank - Unpaid dividend account | 2 | 2 |
| HDFC Bank - Unpaid dividend account | 2 | 2 |
| ICICI Bank - Unpaid dividend account | 21 | 13 |
| 25 | 17 | |
| Margin money deposits against guarantees | ||
| Canara Bank | 175 | 177 |
| Citibank | 2 | 2 |
| ICICI Bank | 243 | 225 |
| 420 | 404 | |
| Deposits with financial institutions | ||
| HDFC Limited | 6,924 | 7,036 |
| LIC Housing Finance Limited | 700 | 700 |
| 7,624 | 7,736 | |
| Total cash and cash equivalents | 23,117 | 22,625 |
2.11 OTHER ASSETS
In crore
| Particulars | As at | |
| June 30, 2017 | March 31, 2017 | |
| Non Current | ||
| Capital advances | 505 | 600 |
| Advances other than capital advances | ||
| Prepaid gratuity (refer note 2.22.1) | 39 | 79 |
| Others | ||
| Deferred Contract Cost | 272 | 284 |
| Prepaid expenses | 114 | 96 |
| 930 | 1,059 | |
| Current | ||
| Advances other than capital advances | ||
| Payment to vendors for supply of goods | 87 | 131 |
| Others | ||
| Withholding taxes and others | 2,016 | 1,886 |
| Prepaid expenses | 502 | 441 |
| Deferred Contract Cost | 78 | 78 |
| 2,683 | 2,536 | |
| Total other assets | 3,613 | 3,595 |
Deferred contract costs are upfront costs incurred for the contract and are amortized over the term of the contract. Withholding taxes and others primarily consist of input tax credits.
2.12 FINANCIAL INSTRUMENTS
Financial instruments by category
The carrying value and fair value of financial instruments by categories as of June 30, 2017 are as follows:
(In crore)
| Particulars | Amortized cost | Financial assets/ liabilities at fair value through profit or loss | Financial assets/liabilities at fair value through OCI | Total carrying value | Total fair value | ||
| Designated upon initial recognition | Mandatory | Equity instruments designated upon initial recognition | Mandatory | ||||
| Assets: | |||||||
| Cash and cash equivalents (Refer Note 2.10) | 23,117 | – | – | – | – | 23,117 | 23,117 |
| Investments (Refer Note 2.6) | |||||||
| Equity and preference securities | – | – | – | 174 | – | 174 | 174 |
| Tax-free bonds and government bonds | 1,904 | – | – | – | – | 1,904 | 2,222* |
| Liquid mutual fund units | – | – | 1,560 | – | – | 1,560 | 1,560 |
| Non convertible debentures | – | – | – | – | 4,021 | 4,021 | 4,021 |
| Certificates of deposit | – | – | – | – | 8,165 | 8,165 | 8,165 |
| Convertible promissory note | – | – | 11 | – | – | 11 | 11 |
| Other investments | – | – | 46 | – | – | 46 | 46 |
| Fixed maturity plan securities | – | – | 568 | – | – | 568 | 568 |
| Trade receivables (Refer Note 2.9) | 12,488 | – | – | – | – | 12,488 | 12,488 |
| Loans (Refer Note 2.7) | 278 | – | – | – | – | 278 | 278 |
| Other financials assets (Refer Note 2.8) | 6,627 | – | 24 | – | – | 6,651 | 6,651 |
| Total | 44,414 | – | 2,209 | 174 | 12,186 | 58,983 | |
| Liabilities: | |||||||
| Trade payables | 260 | – | – | – | – | 260 | 260 |
| Other financial liabilities (Refer Note 2.14) | 5,630 | – | 49 | – | 37 | 5,716 | 5,716 |
| Total | 5,890 | – | 49 | – | 37 | 5,976 | |
* On account of fair value changes including interest accrued
The carrying value and fair value of financial instruments by categories as of March 31, 2017 were as follows:
(In crore)
| Amortised cost | Financial assets/ liabilities at fair value through profit or loss | Financial assets/liabilities at fair value through OCI | Total carrying value | Total fair value | |||
| Designated upon initial recognition | Mandatory | Equity instruments designated upon initial recognition | Mandatory | ||||
| Assets: | |||||||
| Cash and cash equivalents (Refer Note 2.10) | 22,625 | – | – | – | – | 22,625 | 22,625 |
| Investments (Refer Note 2.6) | |||||||
| Equity and preference securities | – | – | – | 159 | – | 159 | 159 |
| Tax-free bonds and government bonds | 1,907 | – | – | – | – | 1,907 | 2,168* |
| Liquid mutual fund units | – | – | 1,803 | – | – | 1,803 | 1,803 |
| Non convertible debentures | – | – | – | – | 3,975 | 3,975 | 3,975 |
| Certificates of deposit | – | – | – | – | 7,905 | 7,905 | 7,905 |
| Convertible promissory note | – | – | 10 | – | – | 10 | 10 |
| Other investments | – | – | 35 | – | – | 35 | 35 |
| Fixed maturity plan securities | – | – | 558 | – | – | 558 | 558 |
| Trade receivables (Refer Note 2.9) | 12,322 | – | – | – | – | 12,322 | 12,322 |
| Loans (Refer Note 2.7) | 301 | – | – | – | – | 301 | 301 |
| Other financials assets (Refer Note 2.8) | 6,005 | – | 232 | – | 52 | 6,289 | 6,289 |
| Total | 43,160 | – | 2,638 | 159 | 11,932 | 57,889 | |
| Liabilities: | |||||||
| Trade payables | 367 | – | – | – | – | 367 | 367 |
| Other financial liabilities (Refer Note 2.14) | 4,973 | – | 87 | – | – | 5,060 | 5,060 |
| Total | 5,340 | – | 87 | – | – | 5,427 | |
* On account of fair value changes including interest accrued
Fair value hierarchy
Level 1- Quoted prices (unadjusted) in active markets for identical assets or liabilities.
Level 2– Inputs other than quoted prices included within Level 1 that are observable for the asset or liability, either directly (i.e. as prices) or indirectly (i.e. derived from prices).
Level 3- Inputs for the assets or liabilities that are not based on observable market data (unobservable inputs).
The following table presents fair value hierarchy of assets and liabilities measured at fair value on a recurring basis as of June 30, 2017:
(In crore)
| As of June 30, 2017 | Fair value measurement at end of the reporting period/year using | |||
| Level 1 | Level 2 | Level 3 | ||
| Assets | ||||
| Investments in liquid mutual funds (Refer Note 2.6) | 1,560 | 1,560 | – | – |
| Investments in tax-free bonds (Refer Note 2.6) | 2,216 | 2,044 | 172 | – |
| Investments in government bonds (Refer Note 2.6) | 6 | 6 | – | – |
| Investments in equity instruments (Refer Note 2.6) | 16 | – | – | 16 |
| Investments in preference securities (Refer Note 2.6) | 158 | – | – | 158 |
| Investments in non convertible debentures (Refer Note 2.6) | 4,021 | 3,444 | 577 | – |
| Investments in certificates of deposit (Refer Note 2.6) | 8,165 | – | 8,165 | – |
| Investments in fixed maturity plan securities (Refer Note 2.6) | 568 | – | 568 | – |
| Investments in convertible promissory note (Refer Note 2.6) | 11 | – | – | 11 |
| Other investments (Refer Note 2.6) | 46 | – | – | 46 |
| Derivative financial instruments - gain on outstanding foreign currency forward and option contracts (Refer Note 2.8) | 24 | – | 24 | – |
| Liabilities | ||||
| Derivative financial instruments - loss on outstanding foreign currency forward and option contracts (Refer Note 2.14) | 45 | – | 45 | – |
| Liability towards contingent consideration (Refer note 2.14)* | 41 | – | – | 41 |
*Discounted $7 million (approximately 45 crore)
at 14.0%
During the three months ended June 30, 2017,
tax free bonds & non convertible debentures of 1,792 crore were transferred from Level 2 to Level 1 of fair value hierarchy,
since these were valued based on quoted price.
The following table presents fair value hierarchy of assets and liabilities measured at fair value on a recurring basis as of March 31, 2017:
(In crore)
| As of March 31, 2017 | Fair value measurement at end of the reporting period/year using | |||
| Level 1 | Level 2 | Level 3 | ||
| Assets | ||||
| Investments in liquid mutual funds (Refer Note 2.6) | 1,803 | 1,803 | – | – |
| Investments in tax free bonds (Refer Note 2.6) | 2,159 | 282 | 1,877 | – |
| Investments in government bonds (Refer Note 2.6) | 9 | 9 | – | – |
| Investments in equity instruments (Refer Note 2.6) | 15 | – | – | 15 |
| Investments in preference securities (Refer Note 2.6) | 144 | – | – | 144 |
| Investments in non convertible debentures (Refer Note 2.6) | 3,975 | 3,371 | 604 | – |
| Investments in certificates of deposit (Refer Note 2.6) | 7,905 | – | 7,905 | – |
| Investments in fixed maturity plan securities (Refer Note 2.6) | 558 | – | 558 | – |
| Investments in convertible promissory note (Refer Note 2.6) | 10 | – | – | 10 |
| Other investments (Refer Note 2.6) | 35 | – | – | 35 |
| Derivative financial instruments - gain on outstanding foreign currency forward and option contracts (Refer Note 2.8) | 284 | – | 284 | – |
| Liabilities | ||||
| Derivative financial instruments - loss on outstanding foreign currency forward and option contracts (Refer Note 2.14) | 2 | – | 2 | – |
| Liability towards contingent consideration (Refer note 2.14)* | 85 | – | – | 85 |
*Discounted $14 million (approximately 91
crore) at 14.2%
A one percentage point change in the unobservable inputs used in fair valuation of the contingent consideration does not have a significant impact in its value.
The movement in contingent consideration as
of June 30, 2017 from March 31, 2017 is on account of settlement of contingent consideration of 45 crore and change in discount
rate and passage of time.
The fair value of liquid mutual funds is based on quoted price. The fair value of tax-free bonds and government bonds is based on quoted prices and market observable inputs. The fair value is of non-convertible debentures is based on quoted prices and market observable inputs. The fair value of fixed maturity plan securities and certificates of deposit is based on market observable inputs. Derivative financial instruments are valued based on quoted prices for similar assets and liabilities in active markets or inputs that are directly or indirectly observable in the marketplace. The fair value of investments in unquoted equity, preference and other securities is determined using Level 3 inputs like Discounted cash flows, Market multiple method, Option pricing model, etc.
Financial risk management
Financial risk factors
The Group's activities expose it to a variety of financial risks: market risk, credit risk and liquidity risk. The Group's focus is to foresee the unpredictability of financial markets and seek to minimize potential adverse effects on its financial performance. The primary market risk to the Group is foreign exchange risk. The Group uses derivative financial instruments to mitigate foreign exchange related risk exposures. The Group's exposure to credit risk is influenced mainly by the individual characteristic of each customer and the concentration of risk from the top few customers.
Market risk
The Group operates internationally and a major portion of the business is transacted in several currencies and consequently the Group is exposed to foreign exchange risk through its sales and services in the United States and elsewhere, and purchases from overseas suppliers in various foreign currencies. The Group holds derivative financial instruments such as foreign exchange forward and option contracts to mitigate the risk of changes in exchange rates on foreign currency exposures. The exchange rate between the Indian rupee and foreign currencies has changed substantially in recent years and may fluctuate substantially in the future. Consequently, the results of the Group’s operations are adversely affected as the rupee appreciates/ depreciates against these currencies.
The following table analyzes foreign currency risk from financial instruments as of June 30, 2017:
(In crore)
| Particulars | U.S. dollars | Euro | United Kingdom Pound Sterling | Australian dollars | Other currencies | Total |
| Cash and cash equivalents | 1,392 | 160 | 55 | 156 | 851 | 2,614 |
| Trade receivables | 8,337 | 1,335 | 760 | 648 | 703 | 11,783 |
| Other financial assets (including loans) | 2,555 | 534 | 344 | 161 | 409 | 4,003 |
| Trade payables | (80) | (36) | (31) | (5) | (82) | (234) |
| Other financial liabilities | (2,458) | (443) | (240) | (220) | (542) | (3,903) |
| Net assets / (liabilities) | 9,746 | 1,550 | 888 | 740 | 1,339 | 14,263 |
The following table analyzes foreign currency risk from financial instruments as of March 31, 2017:
(In crore)
| U.S. dollars | Euro | United Kingdom Pound Sterling | Australian dollars | Other currencies | Total | |
| Cash and cash equivalents | 1,334 | 131 | 36 | 183 | 700 | 2,384 |
| Trade receivables | 8,345 | 1,244 | 775 | 561 | 702 | 11,627 |
| Other financial assets (including loans) | 2,862 | 535 | 372 | 159 | 403 | 4,331 |
| Trade payables | (115) | (32) | (13) | (5) | (158) | (323) |
| Other financial liabilities | (2,129) | (406) | (211) | (211) | (547) | (3,504) |
| Net assets / (liabilities) | 10,297 | 1,472 | 959 | 687 | 1,100 | 14,515 |
For each of the three months ended June 30, 2017 and June 30, 2016, every percentage point depreciation / appreciation in the exchange rate between the Indian rupee and U.S. dollar, has affected the Company's incremental operating margins by approximately 0.49%.
Sensitivity analysis is computed based on the changes in the income and expenses in foreign currency upon conversion into functional currency, due to exchange rate fluctuations between the previous reporting period and the current reporting period.
Derivative financial instruments
The Group holds derivative financial instruments such as foreign currency forward and option contracts to mitigate the risk of changes in exchange rates on foreign currency exposures. The counterparty for these contracts is generally a bank. These derivative financial instruments are valued based on quoted prices for similar assets and liabilities in active markets or inputs that are directly or indirectly observable in the marketplace.
The following table gives details in respect of outstanding foreign currency forward and option contracts:
| As of | As of | |||
| June 30, 2017 | March 31, 2017 | |||
| In million | In
crore |
In million | In
crore | |
| Derivatives designated as cash flow hedges | ||||
| Forward contracts | ||||
| In Euro | 70 | 516 | 95 | 658 |
| In United Kingdom Pound Sterling | 45 | 377 | 40 | 324 |
| In Australian dollars | 90 | 447 | 130 | 644 |
| Option Contracts | ||||
| In Euro | 65 | 479 | 40 | 277 |
| In United Kingdom Pound Sterling | 10 | 84 | – | – |
| In Australian dollars | 40 | 198 | – | – |
| Other derivatives | ||||
| Forward contracts | ||||
| In U.S. dollars | 566 | 3,655 | 526 | 3,411 |
| In Euro | 91 | 671 | 114 | 786 |
| In United Kingdom Pound Sterling | 97 | 813 | 75 | 609 |
| In Australian dollars | 35 | 174 | 35 | 174 |
| In Swiss Franc | – | – | 10 | 65 |
| In Singapore dollars | 5 | 23 | 5 | 23 |
| In Swedish Krona | 50 | 38 | 50 | 36 |
| In New Zealand dollars | 5 | 24 | – | – |
| In Canadian dollars | 13 | 65 | – | – |
| In Polish Zloty | 37 | 64 | – | – |
| Option Contracts | ||||
| In U.S. dollars | 223 | 1,437 | 195 | 1,265 |
| In Euro | 45 | 332 | 25 | 173 |
| In United Kingdom Pound Sterling | 20 | 167 | 30 | 243 |
| In Canadian dollars | – | – | 13 | 65 |
| Total forwards and options | 9,564 | 8,753 | ||
The foreign exchange forward and option contracts mature within twelve months. The table below analyzes the derivative financial instruments into relevant maturity groupings based on the remaining period as of the Balance Sheet date:
(In crore)
| Particulars | As of | |
| June 30, 2017 | March 31, 2017 | |
| Not later than one month | 2,803 | 2,303 |
| Later than one month and not later than three months | 5,075 | 4,316 |
| Later than three months and not later than one year | 1,686 | 2,134 |
| 9,564 | 8,753 |
During the three months ended June 30, 2017, the group has designated certain foreign exchange forward contracts as cash flow hedges to mitigate the risk of foreign exchange exposure on highly probable forecast cash transactions. The related hedge transactions for balance in cash flow hedging reserve are expected to occur and reclassified to revenue in the statement of profit or loss within 3 months.
Hedge effectiveness is determined at the inception of the hedge relationship, and through periodic prospective effectiveness assessments to ensure that an economic relationship exists between the hedged item and hedging instrument, including whether the hedging instrument is expected to offset changes in cash flows of hedged items.
If the hedge ratio for risk management purposes is no longer optimal but the risk management objective remains unchanged and the hedge continues to qualify for hedge accounting, the hedge relationship will be rebalanced by adjusting either the volume of the hedging instrument or the volume of the hedged item so that the hedge ratio aligns with the ratio used for risk management purposes. Any hedge ineffectiveness is calculated and accounted for in profit or loss at the time of the hedge relationship rebalancing.
The following table provides the reconciliation of cash flow hedge reserve for the three months ended June 30, 2017:
(In crore)
| Three months ended June 30, 2017 | |
| Balance at the beginning of the period | 39 |
| Gain / (Loss) recognised in other comprehensive income during the period | (41) |
| Amount reclassified to revenue during the period | (47) |
| Tax impact on above | 22 |
| Balance at the end of the period | (27) |
The Group offsets a financial asset and a financial liability when it currently has a legally enforceable right to set off the recognized amounts and the group intends either to settle on a net basis, or to realise the asset and settle the liability simultaneously.
The following table provides quantitative information about offsetting of derivative financial assets and derivative financial liabilities:
(In crore)
| As of | As of | |||
| June 30, 2017 | March 31, 2017 | |||
| Derivative financial asset | Derivative financial liability | Derivative financial asset |
Derivative financial liability | |
| Gross amount of recognized financial asset/liability | 45 | (66) | 285 | (3) |
| Amount set off | (21) | 21 | (1) | 1 |
| Net amount presented in Balance Sheet | 24 | (45) | 284 | (2) |
Credit risk
Credit risk refers to the risk of default on
its obligation by the counterparty resulting in a financial loss. The maximum exposure to the credit risk at the reporting date
is primarily from trade receivables amounting to 12,488 crore and 12,322 crore as of June 30, 2017 and March 31, 2017, respectively
and unbilled revenues amounting to 3,945 crore and 3,648 crore as of June 30, 2017 and March 31, 2017, respectively. Trade receivables
and unbilled revenues are typically unsecured and are derived from revenue earned from customers primarily located in the United
States. Credit risk has always been managed by the Group through credit approvals, establishing credit limits and continuously
monitoring the creditworthiness of customers to which the Group grants credit terms in the normal course of business. On account
of adoption of Ind AS 109, the group uses expected credit loss model to assess the impairment loss or gain. The Group uses a provision
matrix to compute the expected credit loss allowance for trade receivables and unbilled revenues. The provision matrix takes into
account available external and internal credit risk factors such as credit default swap quotes, credit ratings from international
credit rating agencies and the Group's historical experience for customers.
The following table gives details in respect of percentage of revenues generated from top customer and top ten customers:
(In %)
| Three months ended June 30, | ||
| 2017 | 2016 | |
| Revenue from top customer | 3.3 | 3.6 |
| Revenue from top ten customers | 20.0 | 22.2 |
Credit risk exposure
The reversal of lifetime expected credit loss
on customer balances for the three months June 30, 2017 was 4 crore and and allowance for lifetime expected credit loss was 15
crore for the three months ended June 30, 2016.
(In crore)
| Three months ended June 30, | ||
| 2017 | 2016 | |
| Balance at the beginning | 411 | 289 |
| Impairment loss recognized / (reversed) | (4) | 15 |
| Amounts written off | (3) | – |
| Translation differences | 1 | 1 |
| Balance at the end | 405 | 305 |
The Company’s credit period generally ranges from 30-60 days.
(In crore except otherwise stated)
| As of | ||
| June 30, 2017 | March 31, 2017 | |
| Trade receivables | 12,488 | 12,322 |
| Unbilled revenues | 3,945 | 3,648 |
| Days Sales Outstanding- DSO (days) | 68 | 68 |
Credit risk on cash and cash equivalents is limited as we generally invest in deposits with banks and financial institutions with high credit ratings assigned by international and domestic credit rating agencies. Investments primarily include investment in liquid mutual fund units, fixed maturity plan securities, certificates of deposit, quoted bonds issued by government and quasi government organizations and non convertible debentures.
Liquidity risk
The Group's principal sources of liquidity are cash and cash equivalents and the cash flow that is generated from operations. The Group has no outstanding bank borrowings. The Group believes that the working capital is sufficient to meet its current requirements.
As of June 30, 2017, the Group had a working
capital of 38,977 crore including cash and cash equivalents of 23,117 crore and current investments of 10,388 crore. As of March
31, 2017, the Group had a working capital of 39,692 crore including cash and cash equivalents of 22,625 crore and current investments
of 9,970 crore.
As of June 30, 2017 and March 31, 2017, the
outstanding employee compensated absences were 1,423 crore and 1,359 crore, respectively, which have been substantially funded.
Accordingly no liquidity risk is perceived.
The table below provides details regarding the contractual maturities of significant financial liabilities as of June 30, 2017:
(In crore)
| Particulars | Less than 1 year | 1-2 years | 2-4 years | 4-7 years | Total |
| Trade payables | 260 | – | – | – | 260 |
| Other financial liabilities (excluding liability towards acquisition) (Refer Note 2.14) | 5,595 | 36 | – | – | 5,631 |
| Liability towards acquisitions on an undiscounted basis (including contingent consideration) (Refer Note 2.14) | 45 | – | – | – | 45 |
The table below provides details regarding the contractual maturities of significant financial liabilities as of March 31, 2017:
(In crore)
| Particulars | Less than 1 year | 1-2 years | 2-4 years | 4-7 years | Total |
| Trade payables | 367 | – | – | – | 367 |
| Other financial liabilities (excluding liability towards acquisition) (Refer Note 2.14) | 4,943 | 31 | – | – | 4,974 |
| Liability towards acquisitions on an undiscounted basis (including contingent consideration) (Refer Note 2.14) | 45 | 46 | – | – | 91 |
2.13 EQUITY
SHARE CAPITAL
In crore, except as otherwise
stated
| Particulars | As at | |
| June 30, 2017 | March 31, 2017 | |
| Authorized | ||
| Equity shares, 5 par value |
||
| 2,40,00,00,000 (2,40,00,00,000) equity shares | 1,200 | 1,200 |
| Issued, Subscribed and Paid-Up | ||
| Equity shares, 5 par value (1) |
1,144 | 1,144 |
| 2,28,56,79,962 (2,28,56,55,150) equity shares fully paid-up(2) | ||
| 1,144 | 1,144 |
Forfeited shares amounted to 1,500 (1,500)
(1) Refer note 2.23 for details of basic and diluted shares
(2) Net of treasury shares 1,12,64,702 (1,12,89,514)
The Company has only one class of shares referred
to as equity shares having a par value of 5/-. Each holder of equity shares is entitled to one vote per share. The equity shares
represented by American Depositary Shares (ADS) carry similar rights to voting and dividends as the other equity shares. Each ADS
represents one underlying equity share.
The Company declares and pays dividends in Indian rupees. The dividend proposed by the Board of Directors (the Board) is subject to the approval of the shareholders in the ensuing Annual General Meeting. The remittance of dividends outside India is governed by Indian law on foreign exchange and is subject to applicable distribution taxes.
In the period of five years immediately preceding June 30 2017:
The Company has allotted 1,14,84,72,332 and
57,42,36,166 fully paid-up shares of face value 5/- each during the quarter ended June 30, 2015 and December 31, 2014, pursuant
to bonus issue approved by the shareholders through postal ballot. For both the bonus issues, bonus share of one equity share for
every equity share held, and a stock dividend of one ADS for every ADS held, respectively, has been allotted. Consequently, the
ratio of equity shares underlying the ADSs held by an American Depositary Receipt holder remains unchanged. Options granted under
the restricted stock unit plan(RSU) have been adjusted for bonus shares.
In the event of liquidation of the Company, the holders of equity shares will be entitled to receive any of the remaining assets of the Company in proportion to the number of equity shares held by the shareholders, after distribution of all preferential amounts. However, no such preferential amounts exist currently, other than the amounts held by irrevocable controlled trusts. For irrevocable controlled trusts, the corpus would be settled in favour of the beneficiaries.
Dividends
The Board, in its meeting on April 15, 2016,
proposed a final dividend of 14.25/- per equity share and the same was approved by the shareholders at the Annual General Meeting
held on June 18, 2016. The amount was recognized as distributions to equity shareholders during the year ended March 31, 2017 and
the total appropriation was 3,923 crore (excluding dividend on treasury shares), including corporate dividend tax.
The amount of per share dividend recognized
as distributions to equity shareholders during the year ended March 31, 2016 was 29.50/- per equity share (not adjusted for June
17, 2015 bonus issue).
The Board of directors in their meeting on October
14, 2016 declared an interim dividend of 11/- per equity share, which resulted in cash outflow of 3,029 crore, (excluding dividend
paid on treasury shares) inclusive of corporate dividend tax
The Board of Directors, in its meeting on April
13, 2017, proposed a final dividend of 14.75/- per equity share for the financial year ended March 31, 2017 and the same was approved
by the shareholders at the Annual General Meeting held on June 24, 2017. The amount was recognized as distributions to equity shareholders
during the quarter ended June 30, 2017 and the total appropriation was 4,061 crore (excluding dividend on treasury shares), including
corporate dividend tax.
The Board has increased dividend pay-out ratio from up to 40% to up to 50% of post-tax consolidated profits effective fiscal 2015.
Capital allocation policy
The Board, in its meeting on April 13, 2017, reviewed and approved a revised Capital Allocation Policy of the Company after taking into consideration the strategic and operational cash requirements of the Company in the medium term:
The key aspects of the Capital Allocation Policy are:
1. The Company’s current policy is to pay dividends of up to 50% of post-tax profits of the Financial Year. Effective from Financial Year 2018, the Company expects to payout up to 70% of the free cash flow of the corresponding Financial Year in such manner (including by way of dividend and/or share buyback) as may be decided by the Board from time to time, subject to applicable laws and requisite approvals, if any. Free cash flow is defined as net cash provided by operating activities less capital expenditure as per the consolidated statement of cash flows prepared under IFRS. Dividend payout includes dividend distribution tax.
2. Additionally, the Board has identified an
amount of up to 13,000 crore ($2 billion) to be paid out to shareholders during Financial Year 2018, in such manner (including
by way of dividend and/ or share buyback), to be decided by the Board, subject to applicable laws and requisite approvals, if any.
The details of shareholder holding more than 5% shares as at June 30, 2017 and March 31, 2017 are set out below :
| Name of the shareholder | As at June 30, 2017 | As at March 31, 2017 | ||
| Number of shares | % held | Number of shares | % held | |
| Deutsche Bank Trust Company Americas (Depository of ADR's - legal ownership) | 38,32,97,937 | 16.69 | 38,33,17,937 | 16.69 |
| Life Insurance Corporation of India | 16,14,48,093 | 7.03 | 16,14,36,123 | 7.03 |
The reconciliation of the number of shares outstanding and the amount of share capital as at June 30, 2017 and March 31, 2017 is as follows:
In crore, except as stated otherwise
| Particulars | As at June 30, 2017 | As at March 31, 2017 | ||
| Number of shares | Amount | Number of shares | Amount | |
| At the beginning of the period | 228,56,55,150 | 1,144 | 228,56,21,088 | 1,144 |
| Add: Shares issued on exercise of employee stock options | 24,812 | – | 34,062 | – |
| Less: Increase in treasury shares consequent to bonus issue | – | – | – | – |
| At the end of the period | 228,56,79,962 | 1,144 | 228,56,55,150 | 1,144 |
Employee Stock Option Plan (ESOP):
2015 Stock Incentive Compensation Plan (the 2015 Plan): On March 31, 2016, pursuant to the approval by the shareholders through postal ballot, the Board has been authorized to introduce, offer, issue and allot share-based incentives to eligible employees of the Company and its subsidiaries under the 2015 Stock Incentive Compensation Plan (the 2015 Plan). The maximum number of shares under the 2015 plan shall not exceed 2,40,38,883 equity shares (this includes 1,12,23,576 equity shares which are held by the trust towards the 2011 Plan as at March 31, 2016). Out of this 1,70,38,883 equity shares will be issued as RSUs at par value and 70,00,000 equity shares will be issued as stock options at market price on the date of the grant. These instruments will vest over a period of 4 years and the Company expects to grant the instruments under the 2015 Plan over the period of 4 to 7 years.
Controlled trust holds 1,12,64,702 and 1,12,89,514 shares, as of June 30, 2017 and March 31, 2017, respectively under the 2015 plan, out of which 1,00,000 equity shares have been earmarked for welfare activities of the employees.
Stock incentives granted to CEO:
Pursuant to the approval from the shareholders
through postal ballot on March 31, 2016, Dr. Vishal Sikka is eligible to receive under the 2015 Plan, an annual grant of time-based
RSUs of fair value $2 million which vest over time, subject to continued service, and an annual grant of performance based equity
and stock options of $5 million subject to achievement of performance targets set by the Board or its committee, which vest over
time. Time based RSUs of fair value of $2 million (approximately 13.42 crore) for financial year 2017 was granted on August 1,
2016 amounting to 1,20,700 RSUs in equity shares represented by ADSs.
Based on fiscal 2017 performance evaluation,
the Board, on the recommendations of nomination and remuneration committee, approved on April 13, 2017, performance based equity
and stock options for fiscal 2017 comprising 1,32,483 RSUs amounting to US$ 1.9 million (approximately 12.91 crore) and 3,30,525
ESOPs amounting to US$ 0.96 million (approximately 6.46 crore). Further, the Board, also approved the annual time-based vesting
grant for fiscal 2018 to Dr. Vishal Sikka, comprising of 1,37,741 RSUs amounting to US$2 million (approximately 12.97 crore).These
RSUs and ESOPs have been granted effective May 2, 2017. The exercise price of the RSU's will be equal to the par value of the shares
and the exercise price of the stock options would be the market price as on the date of grant, as approved by the shareholders.
Though the performance based awards for fiscal 2018 and the time based RSU’s for the remaining employment term have not been
granted as of June 30, 2017, in accordance with Ind AS 102 Share-based Payment, the company has recorded employee stock based compensation
expense. The company has recorded employee stock based compensation expense of 10 crore and 9 crore during the three months ended
June 30, 2017 and June 30, 2016 towards CEO compensation.
Stock incentives granted to COO:
The Nomination and Remuneration Committee in
its meeting held on October 14, 2016 recommended a grant of 27,250 RSUs and 43,000 ESOPs amounting to 4 crore to U.B.Pravin Rao,
under the 2015 Plan and the same was approved by the shareholders through postal ballot on March 31, 2017. These RSUs and ESOPs
have been granted w.e.f May 2, 2017. These RSUs and stock options would vest over a period of 4 years and shall be exercisable
within the period as approved by the Committee. The exercise price of the RSU's will be equal to the par value of the shares and
the exercise price of the stock options would be the market price as on the date of grant, as approved by the shareholders.
Stock incentives granted to KMP (other than CEO and COO)
On November 1, 2016, 2,45,750 RSUs and 5,02,550 stock options were granted under the 2015 plan, to key management personnel, excluding CEO and COO, based on fiscal 2016 performance. Additionally, on November 1, 2016, 1,500 RSUs were granted to the Acting General Counsel and the same were outstanding as of June 30, 2017. These RSUs and stock options will vest over a period of 4 years and shall be exercisable within the period as approved by the Committee. The exercise price of the RSUs will be equal to the par value of the shares and the exercise price of the stock options would be the market price as on the date of grant.
During the three months ended June 30, 2017
and June 30, 2016, we recorded an employee stock compensation expense of 12 crore and 9 crore, respectively towards key managerial
personnel including CEO and COO.
Stock incentive granted to other employees:
During fiscal 2017, the company granted 2,506,740 RSUs and 7,03,300 ESOPs and 112,210 incentive units (cash settled) to certain eligible employees at mid and senior levels under the 2015 plan. Further, on May 2, 2017, the company granted 37,090 RSUs (includes equity shares and equity shares represented by ADS) at par value, 73,600 employee stock options (ESOPs) (including equity shares and equity shares represented by ADS) to be exercised at market price at the time of grant, to certain employees at the senior management level. These instruments will vest over a period of 4 years and are subject to continued service.
The company recorded an employee stock compensation
expense in the statement of profit and loss for the three months ended June 30, 2017 and June 30, 2016 of 46 crore and 9 crore
respectively. Further, the cash settled stock compensation expense (included above) for the three months ended June 30, 2017 and
June 30, 2016 was 1 crore and Nil respectively. This comprises of expense pertaining to CEO, COO, other KMP and other employees.
As of June 30, 2017 and March 31, 2017 94,090 and 1,06,845 incentive units were outstanding (net of forfeitures).
2011 RSU Plan (the 2011 Plan) now called 2015 Stock Incentive Compensation Plan ( the 2015 Plan):The Company had a 2011 RSU Plan which provided for the grant of restricted stock units (RSUs) to eligible employees of the Company. The Board of Directors recommended the establishment of the 2011 Plan to the shareholders on August 30, 2011 and the shareholders approved the recommendation of the Board of Directors on October 17, 2011 through a postal ballot. The maximum aggregate number of shares that may be awarded under the plan was 1,13,34,400 as on date of approval of plan adjusted for bonus shares and the plan was expected to continue in effect for a term of 10 years from the date of initial grant under the plan. Awards have been granted to Dr. Vishal Sikka under the 2011 RSU plan as detailed below. Further the Company has earmarked 1,00,000 equity shares for welfare activities of the employees, approved by the shareholders vide postal ballot which ended on March 31, 2016. The equity shares as of March 31, 2016 held under this plan, i.e. 1,12,23,576 equity shares (this includes the aggregate number of equity shares that may be awarded under the 2011 Plan as reduced by 10,824 equity shares already exercised by Dr. Vishal Sikka and 1,00,000 equity shares which have been earmarked for welfare activities of the employees) have been subsumed under the 2015 Plan.
During the year ended March 31, 2015, the company made a grant of 108,268 restricted stock units (adjusted for bonus issues) to Dr. Vishal Sikka, Chief Executive Officer and Managing Director. The Board in its meeting held on June 22, 2015, on recommendation of Nomination and Remuneration Committee, further granted 1,24,061 RSUs to Dr. Vishal Sikka. These RSUs are vesting over a period of four years from the date of the grant in the proportions specified in the award agreement. The RSUs will vest subject to achievement of certain key performance indicators as set forth in the award agreement for each applicable year of the vesting tranche and continued employment through each vesting date.
The award granted to Dr. Vishal Sikka on June 22, 2015 was modified by the Nomination and remuneration committee on April 14, 2016. There is no modification or change in the total number of RSUs granted or the vesting period (which is four years). The modifications relate to the criteria of vesting for each of the years. Based on the modification, the first tranche of the RSUs will vest subject to achievement of certain key performance indicators for the year ended March 31, 2016. Subsequent vesting of RSU's for each of the remaining years would be subject to continued employment.
The activity in the 2015 Plan (formerly 2011 RSU Plan) for equity-settled share based payment transactions during the three months ended June 30, 2017 and June 30, 2016 is set out below:
| Particulars | Three months ended June 30, 2017 |
Three months ended June 30, 2016 | ||
| Shares arising out of options | Weighted average exercise price () |
Shares arising out of options | Weighted average exercise price () | |
| 2015 Plan: Indian equity shares (RSU - IES) | ||||
| Outstanding at the beginning | 20,03,928 | 5 | 2,21,505 | 5 |
| Granted | 31,750 | 5 | – | – |
| Forfeited and expired | 31,695 | 5 | – | – |
| Exercised | 24,812 | 5 | 12,406 | 5 |
| Outstanding at the end | 19,79,171 | 5 | 2,09,099 | 5 |
| Exercisable at the end | – | – | – | – |
| 2015 Plan: Employee Stock Options (ESOPs- IES) | ||||
| Outstanding at the beginning | 3,09,650 | 998 | – | – |
| Granted | 50,200 | 919 | – | – |
| Forfeited and expired | – | – | – | – |
| Exercised | – | – | – | – |
| Outstanding at the end | 3,59,850 | 987 | – | – |
| Exercisable at the end | – | – | – | – |
| Particulars | Three months ended June 30, 2017 | |
| Shares arising out of options | Weighted average exercise price ($) | |
| 2015 Plan: American Depository Shares (RSU - ADS) | ||
| Outstanding at the beginning | 9,57,445 | 0.07 |
| Granted | 3,02,814 | 0.07 |
| Forfeited and expired | 13,425 | 0.07 |
| Exercised | – | – |
| Outstanding at the end | 12,46,834 | 0.07 |
| Exercisable at the end | – | – |
| 2015 Plan: Employee Stock Options (ESOPs- ADS) | ||
| Outstanding at the beginning | 8,88,000 | 15.26 |
| Granted | 3,96,925 | 14.54 |
| Forfeited and expired | – | – |
| Exercised | – | – |
| Outstanding at the end | 12,84,925 | 15.05 |
| Exercisable at the end | – | – |
There was no activity in 2015 plan during the three months ended June 30, 2016 involving equity shares represented by ADS
During the three months ended June 30, 2017,
the weighted average share price of options exercised under the 2015 Plan on the date of exercise was 943/-
During the three months ended June 30, 2016,
the weighted average share price of options exercised under the 2015 Plan on the date of exercise was 1,206/-
The following table summarizes information about equity settled RSUs and ESOPs outstanding as of June 30, 2017:
| Options outstanding | |||
| Range of exercise prices per share () |
No. of shares arising out of options | Weighted average remaining contractual life | Weighted average exercise price () |
| 2015 Plan: ADS and IES | |||
| 0 - 5 (RSU) | 32,26,005 | 1.71 | 5.00 |
| 900 - 1100 (ESOP) | 16,44,775 | 6.98 | 974.50 |
| 48,70,780 | 3.49 | 332.38 | |
The following table summarizes information about equity settled RSUs and ESOPs outstanding as of March 31, 2017:
| Options outstanding | |||
| Range of exercise prices per share () |
No. of shares arising out of options | Weighted average remaining contractual life | Weighted average exercise price () |
| 2015 Plan: ADS and IES | |||
| 0 - 5 (RSU) | 29,61,373 | 1.88 | 5.00 |
| 900 - 1100 (ESOP) | 11,97,650 | 7.09 | 1,026.50 |
| 41,59,023 | 3.38 | 299.16 | |
The fair value of each equity settled RSU is estimated on the date of grant using the Black-Scholes-Merton model with the following assumptions:
| Particulars | For options granted in | |||
| Fiscal 2018- Equity Shares-RSU |
Fiscal 2018- Equity shares ESOP |
Fiscal 2018- ADS-RSU |
Fiscal 2018- ADS- ESOP | |
| Weighted average share price () / ($- ADS) |
923 | 923 | 14.52 | 14.52 |
| Exercise price ()/ ($- ADS) |
5.00 | 919 | 0.07 | 14.54 |
| Expected volatility (%) | 21-25 | 25-28 | 23-26 | 25-31 |
| Expected life of the option (years) | 1 - 4 | 3 - 7 | 1 - 4 | 3 - 7 |
| Expected dividends (%) | 2.78 | 2.78 | 2.74 | 2.74 |
| Risk-free interest rate (%) | 6 - 7 | 6 - 7 | 1 - 2 | 1 - 2 |
| Weighted average fair value as on grant date () / ($- ADS) |
857 | 254 | 13.50 | 2.91 |
| Particulars | For options granted in | |||
| Fiscal 2017- Equity Shares-RSU |
Fiscal 2017- Equity shares ESOP |
Fiscal 2017- ADS-RSU |
Fiscal 2017- ADS- ESOP | |
| Weighted average share price () / ($- ADS) |
1,067 | 989 | 15.77 | 15.26 |
| Exercise price ()/ ($- ADS) |
5.00 | 998 | 0.07 | 15.26 |
| Expected volatility (%) | 24-29 | 27-29 | 26-29 | 27-31 |
| Expected life of the option (years) | 1 - 4 | 3 - 7 | 1 - 4 | 3 - 7 |
| Expected dividends (%) | 2.37 | 2.37 | 2.29 | 2.29 |
| Risk-free interest rate (%) | 6- 7 | 6- 7 | 1 - 2 | 1 - 2 |
| Weighted average fair value as on grant date () / ($- ADS) |
1,002 | 285 | 14.84 | 3.46 |
The expected life of the RSU / ESOP is estimated based on the vesting term and contractual term of the RSU / ESOP, as well as expected exercise behaviour of the employee who receives the RSU / ESOP. Expected volatility during the expected term of the RSU / ESOP is based on historical volatility of the observed market prices of the company's publicly traded equity shares during a period equivalent to the expected term of the RSU / ESOP.
2.14 OTHER FINANCIAL LIABILITIES
In crore
| Particulars | As at | |
| June 30, 2017 | March 31, 2017 | |
| Non-current | ||
| Others | ||
| Accrued compensation to employees (1) | 35 | 30 |
| Payable for acquisition of business (refer note 2.3) (2) | ||
| Contingent consideration | – | 40 |
| 35 | 70 | |
| Current | ||
| Unpaid dividends (1) | 25 | 17 |
| Others | ||
| Accrued compensation to employees (1) | 2,304 | 1,881 |
| Accrued expenses (1) | 2,846 | 2,585 |
| Retention monies (1) | 202 | 220 |
| Payable for acquisition of business | ||
| Contingent consideration (refer note 2.3) (2) | 41 | 45 |
| Client deposits (1) | 16 | 32 |
| Payable by controlled trusts (1) | 140 | 145 |
| Compensated absences | 1,423 | 1,359 |
| Foreign currency forward and options contracts (2)(3) | 45 | 2 |
| Capital creditors (1) | 32 | 48 |
| Other payables (1) | 30 | 15 |
| 7,104 | 6,349 | |
| Total financial liabilities | 7,139 | 6,419 |
| (1) Financial liability carried at amortized cost | 5,630 | 4,973 |
| (2) Financial liability carried at fair value through profit and loss | 49 | 87 |
| (3) Financial liability carried at fair value through other comprehensive income | 37 | – |
| Contingent consideration on undiscounted basis | 45 | 91 |
2.15 OTHER LIABILITIES
In crore
| Particulars | As at | |
| June 30, 2017 | March 31, 2017 | |
| Non-current | ||
| Others | ||
| Deferred income - government grant on land use rights | 42 | 41 |
| Deferred income | 40 | 42 |
| 82 | 83 | |
| Current | ||
| Unearned revenue | 1,998 | 1,777 |
| Others | ||
| Withholding taxes and others | 1,288 | 1,226 |
| Accrued gratuity (refer note 2.22.1) | 1 | 1 |
| Tax on dividend | 690 | – |
| Deferred rent | 12 | 2 |
| Deferred income - government grant on land use rights | 1 | 1 |
| 3,990 | 3,007 | |
2.16 PROVISIONS
In crore
| Particulars | As at | |
| June 30, 2017 | March 31, 2017 | |
| Current | ||
| Others | ||
| Post-sales client support and warranties and others | 404 | 405 |
| 404 | 405 | |
Provision for post-sales client support and warranties and others
The movement in the provision for post-sales client support and warranties and others is as follows :
In crore
| Particulars | Three months ended June 30, 2017 |
| Balance at the beginning | 405 |
| Provision recognized/(reversed) | 15 |
| Provision utilized | (15) |
| Exchange difference | (1) |
| Balance at the end | 404 |
Provision for post-sales client support and warranties and other provisions are expected to be utilized over a period of 6 months to 1 year.
2.17 INCOME TAXES
Income tax expense in the consolidated Statement of Profit and Loss comprises:
In crore
| Three months ended June 30, | ||
| 2017 | 2016 | |
| Current taxes | 1,499 | 1,467 |
| Deferred taxes | (128) | (105) |
| Income tax expense | 1,371 | 1,362 |
Income tax expense for the three months ended
June 30, 2017 and June 30, 2016 includes reversals (net of provisions) of 15 crore and provisions (net of reversals) of 8 crore,
respectively, pertaining to prior periods.
Entire deferred income tax for the three months June 30, 2017 and June 30, 2016 relates to origination and reversal of temporary differences.
During the three months ended June 30, 2017
and June 30, 2016, a current tax credit of 1 crore and 5 crore respectively have been recorded in other comprehensive income
pertaining to remeasurement of defined benefit plan asset.
During the three months ended June 30, 2017,
a deferred tax asset of 22 crore and a deferred tax liability of 2 crore has been recorded in other comprehensive income pertaining
to unrealized gains on derivatives designated as cash flow hedges and unrealized gain on investment in quoted debt securities.
A reconciliation of the income tax provision to the amount computed by applying the statutory income tax rate to the income before income taxes is summarized below:
In crore
| Three months ended June 30, | ||
| 2017 | 2016 | |
| Profit before income taxes | 4,854 | 4,798 |
| Enacted tax rates in India | 34.61% | 34.61% |
| Computed expected tax expense | 1,680 | 1,661 |
| Tax effect due to non-taxable income for Indian tax purposes | (597) | (484) |
| Overseas taxes | 223 | 190 |
| Tax provision (reversals), overseas and domestic | (15) | 8 |
| Effect of exempt non-operating income | (17) | (28) |
| Effect of unrecognized deferred tax assets | 72 | (3) |
| Effect of differential overseas tax rates | 9 | 2 |
| Effect of non-deductible expenses | 33 | 32 |
| Additional deduction on research and development expense | (4) | (14) |
| Others | (13) | (2) |
| Income tax expense | 1,371 | 1,362 |
The applicable Indian statutory tax rates for fiscal 2018 and fiscal 2017 is 34.61%, respectively.
During the quarter ended June 30, 2017 and June 30, 2016, the Group has claimed weighted tax deduction on eligible research and development expenditure based on the approval received from Department of Scientific and Industrial Research (DSIR) which was valid upto March 31, 2017. The weighted tax deduction is equal to 150% for quarter ended June 30, 2017 and 200% for quarter ended June 30, 2016 of such expenditure incurred. The company has applied for renewal of the R&D recognition with DSIR which is pending approval.
The foreign expense is due to income taxes payable overseas principally in the United States. In India, the company has benefited from certain tax incentives that the Government of India had provided for export of software from the units registered under the Special Economic Zones (SEZs) Act, 2005. SEZ units which began the provision of services on or after April 1, 2005 are eligible for a deduction of 100% of profits or gains derived from the export of services for the first five years from the financial year in which the unit commenced the provision of services and 50% of such profits or gains for further five years. Up to 50% of such profits or gains is also available for a further five years subject to creation of a Special Economic Zone re-Investment Reserve out of the profit of the eligible SEZ units and utilization of such reserve by the Company for acquiring new plant and machinery for the purpose of its business as per the provisions of the Income Tax Act, 1961.
Infosys is subject to a 15% Branch Profit Tax
(BPT) in the U.S. to the extent its U.S. branch's net profit during the year is greater than the increase in the net assets of
the U.S. branch during the year, computed in accordance with the Internal Revenue Code. As of March 31, 2017, Infosys' U.S. branch
net assets amounted to approximately 5,995 crore. As of June 30, 2017, the Company has provided for branch profit tax of 326
crore for its U.S branch, as the Company estimates that these branch profits are expected to be distributed in the foreseeable
future. The change in provision for branch profit tax of 1 crore is on account of exchange rate during the three months ended
June 30, 2017.
Deferred income tax liabilities have not been
recognized on temporary differences amounting to 5,533 crore and 5,309 crore as of June 30, 2017 and March 31, 2017, respectively,
associated with investments in subsidiaries and branches as it is probable that the temporary differences will not reverse in the
foreseeable future.
The following table provides the details of income tax assets and income tax liabilities as of June 30, 2017 and March 31, 2017:
In crore
| Particulars | As at | |
| June 30, 2017 | March 31, 2017 | |
| Income tax assets | 6,076 | 5,716 |
| Current income tax liabilities | 4,539 | 3,885 |
| Net current income tax asset/ (liability) at the end | 1,537 | 1,831 |
The gross movement in the current income tax asset/ (liability) for the three months ended June 30, 2017 and June 30, 2016 is as follows:
In crore
| Three months ended June 30, | ||
| 2017 | 2016 | |
| Net current income tax asset/ (liability) at the beginning | 1,831 | 1,820 |
| Translation differences | (1) | – |
| Income tax paid | 1,205 | 744 |
| Current income tax expense | (1,499) | (1,467) |
| Income tax on other comprehensive income | 1 | 5 |
| Net current income tax asset/ (liability) at the end | 1,537 | 1,102 |
The tax effects of significant temporary differences that resulted in deferred income tax assets and liabilities are as follows:
In crore
| As at | ||
| June 30, 2017 | March 31, 2017 | |
| Deferred income tax assets | ||
| Property, plant and equipment | 147 | 138 |
| Computer software | 41 | 40 |
| Accrued compensation to employees | 76 | 57 |
| Trade receivables | 132 | 136 |
| Compensated absences | 388 | 374 |
| Post sales client support | 94 | 97 |
| Intangibles | 24 | 22 |
| Others | 146 | 143 |
| Total deferred income tax assets | 1,048 | 1007 |
| Deferred income tax liabilities | ||
| Intangible asset | (196) | (206) |
| Temporary difference related to branch profits | (326) | (327) |
| Others | (44) | (141) |
| Total deferred income tax liabilities | (566) | (674) |
| Deferred income tax assets after set off | 679 | 540 |
| Deferred income tax liabilities after set off | (197) | (207) |
Deferred tax assets and deferred tax liabilities have been offset wherever the Group has a legally enforceable right to set off current tax assets against current tax liabilities and where the deferred tax assets and deferred tax liabilities relate to income taxes levied by the same taxation authority.
In assessing the reliability of deferred income tax assets, the management considers whether some portion or all of the deferred income tax assets will not be realized. The ultimate realization of deferred income tax assets is dependent upon the generation of future taxable income during the periods in which the temporary differences become deductible. The management considers the scheduled reversals of deferred income tax liabilities, projected future taxable income, and tax planning strategies in making this assessment. Based on the level of historical taxable income and projections for future taxable income over the periods in which the deferred income tax assets are deductible, management believes that the Group will realize the benefits of those deductible differences. The amount of the deferred income tax assets considered realizable, however, could be reduced in the near term if estimates of future taxable income during the carry forward period are reduced.
The gross movement in the deferred income tax account for the three months ended June 30, 2017 and June 30, 2016, is as follows:
In crore
| Three months ended June 30, | ||
| 2017 | 2016 | |
| Net deferred income tax asset at the beginning | 333 | 284 |
| Translation differences | 1 | (11) |
| Credits / (charge) relating to temporary differences | 128 | 105 |
| Temporary differences on other comprehensive income | 20 | – |
| Net deferred income tax asset at the end | 482 | 378 |
The credit relating to temporary differences during the three months ended June 30, 2017 are primarily on account of property plant and equipment, accrued compensation to employees and compensated absences partially offset by trade receivables and post sales client support. The credits relating to temporary differences during the three months ended June 30, 2016 are primarily on account of trade receivables, accrued compensation to employees, compensated absences and post sales client support partially offset by property, plant and equipments.
2.18 REVENUE FROM OPERATIONS
In crore
| Particulars | Three months ended June 30, | |
| 2017 | 2016 | |
| Revenue from software services | 16,550 | 16,279 |
| Revenue from software products | 528 | 503 |
| 17,078 | 16,782 | |
2.19 OTHER INCOME
In crore
| Particulars | Three months ended June 30, | |
| 2017 | 2016 | |
| Interest received on financial assets carried at amortized cost: | ||
| Bonds and government bonds | 36 | 31 |
| Deposit with Bank and others | 391 | 620 |
| Interest received on financial assets carried at fair value through other comprehensive income: | ||
| Non convertible debentures | 73 | – |
| Certificates of deposit | 130 | – |
| Income received on investment carried at fair value through profit or loss | ||
| Dividend received on liquid mutual fund units | 1 | 19 |
| Gains/(losses) on liquid mutual fund units | 69 | – |
| Exchange gains/ (losses) on foreign currency forward and options contracts | 21 | 47 |
| Exchange gains/ (losses) on translation of other assets and liabilities | 51 | 9 |
| Others | 42 | 27 |
| 814 | 753 | |
2.20 EXPENSES
In crore
| Particulars | Three months ended June 30, | |
| 2017 | 2016 | |
| Employee benefit expenses | ||
| Salaries including bonus | 9,074 | 9,043 |
| Contribution to provident and other funds | 201 | 173 |
| Share based payments to employees (Refer note 2.13) | 46 | 9 |
| Staff welfare | 45 | 57 |
| 9,366 | 9,282 | |
| Cost of software packages and others | ||
| For own use | 219 | 183 |
| Third party items bought for service delivery to clients | 221 | 93 |
| 440 | 276 | |
| Other expenses | ||
| Repairs and maintenance | 295 | 322 |
| Power and fuel | 49 | 64 |
| Brand and marketing | 93 | 116 |
| Operating lease payments | 129 | 109 |
| Rates and taxes | 49 | 40 |
| Consumables | 8 | 9 |
| Insurance | 15 | 14 |
| Provision for post-sales client support and warranties | 10 | 21 |
| Commission to non-whole time directors | 3 | 3 |
| Impairment loss recognized / (reversed) on financial assets | (2) | 15 |
| Auditor's remuneration | ||
| Statutory audit fees | 2 | 2 |
| Taxation matters | – | – |
| Other services | – | – |
| Reimbursement of expenses | – | – |
| Contributions towards Corporate Social responsibility | 47 | 48 |
| Others | 54 | 62 |
| 752 | 825 | |
2.21 LEASES
The lease rentals charged during the period is as follows:
In crore
| Particulars | Three months ended June 30, | |
| 2017 | 2016 | |
| Lease rentals recognized during the period | 129 | 109 |
The obligations on long-term, non-cancellable operating leases payable as per the rentals stated in the respective agreements are as follows:
In crore
| As at | ||
| Future minimum lease payable | June 30, 2017 | March 31, 2017 |
| Not later than 1 year | 446 | 461 |
| Later than 1 year and not later than 5 years | 1,196 | 1,237 |
| Later than 5 years | 926 | 740 |
The operating lease arrangements, are renewable on a periodic basis and for most of the leases extend upto a maximum of ten years from their respective dates of inception and relates to rented premises. Some of these lease agreements have price escalation clauses.
2.22 EMPLOYEE BENEFITS
2.22.1 Gratuity
The following tables set out the funded status of the gratuity plans and the amounts recognized in the Group's financial statements as of June 30, 2017 and March 31, 2017:
(In crore)
| Particulars | As of | |
| June 30, 2017 | March 31, 2017 | |
| Change in benefit obligations | ||
| Benefit obligations at the beginning | 1,117 | 944 |
| Service cost | 38 | 129 |
| Interest expense | 19 | 69 |
| Remeasurements - Actuarial (gains)/ losses | 7 | 67 |
| Curtailment gain | – | (3) |
| Benefits paid | (26) | (89) |
| Benefit obligations at the end | 1,155 | 1,117 |
| Change in plan assets | ||
| Fair value of plan assets at the beginning | 1,195 | 947 |
| Interest income | 21 | 79 |
| Remeasurements- Return on plan assets excluding amounts included in interest income | 3 | 12 |
| Contributions | – | 246 |
| Benefits paid | (26) | (89) |
| Fair value of plan assets at the end | 1,193 | 1,195 |
| Funded status | 38 | 78 |
| Prepaid gratuity benefit | 39 | 79 |
| Accrued gratuity | (1) | (1) |
Amount for the three months ended June 30, 2017 and June 30, 2016 recognized in the Statement of Profit and Loss under employee benefit expense:
(In crore)
| Particulars | Three months ended June 30, | |
| 2017 | 2016 | |
| Service cost | 38 | 32 |
| Net interest on the net defined benefit liability/asset | (2) | – |
| Curtailment gain | – | (3) |
| Net gratuity cost | 36 | 29 |
Amount for the three months ended June 30, 2017 and June 30, 2016 recognized in the statement of other comprehensive income:
(In crore)
| Particulars | Three months ended June 30, | |
| 2017 | 2016 | |
| Remeasurements of the net defined benefit liability/ (asset) | ||
| Actuarial (gains) / losses | 7 | 25 |
| (Return) / loss on plan assets excluding amounts included in the net interest on the net defined benefit liability/(asset) | (3) | (3) |
| 4 | 22 | |
(In crore)
| Particulars | Three months ended June 30, | |
| 2017 | 2016 | |
| (Gain)/loss from change in demographic assumptions | – | – |
| (Gain)/loss from change in financial assumptions | 20 | 11 |
| (Gain)/loss from experience adjustment | (13) | – |
| 7 | 11 | |
The weighted-average assumptions used to determine benefit obligations as of June 30, 2017 and March 31, 2017 are set out below:
(in %)
| Particulars | As of | |
| June 30, 2017 | March 31, 2017 | |
| Discount rate | 6.6 | 6.9 |
| Weighted average rate of increase in compensation levels | 8.0 | 8.0 |
The weighted-average assumptions used to determine net periodic benefit cost for the three months June 30, 2017 and June 30, 2016 are set out below:
| Particulars | Three months ended June 30, | |
| 2017 | 2016 | |
| Discount rate(%) | 6.9 | 7.8 |
| Weighted average rate of increase in compensation levels(%) | 8.0 | 8.0 |
| Weighted average duration of defined benefit obligation(years) | 6.1 | 6.4 |
Assumptions regarding future mortality experience are set in accordance with the published statistics by the Life Insurance Corporation of India.
The Company assesses these assumptions with its projected long-term plans of growth and prevalent industry standards. The discount rate is based on the government securities yield.
As of June 30, 2017, every percentage point
increase / decrease in discount rate will affect our gratuity benefit obligation by approximately 60 crore.
As of June 30, 2017, every percentage point
increase / decrease in weighted average rate of increase in compensation levels will affect our gratuity benefit obligation by
approximately 51 crore.
Sensitivity to significant actuarial assumptions is computed by varying one actuarial assumption used for the valuation of the defined benefit obligation by one percentage, keeping all other actuarial assumptions constant.
Gratuity is applicable only to employees drawing a salary in Indian rupees and there are no other foreign defined benefit gratuity plans.
The Company contributes all ascertained liabilities towards gratuity to the Infosys Limited Employees' Gratuity Fund Trust. In case of Infosys BPO and EdgeVerve, contributions are made to the Infosys BPO Employees' Gratuity Fund Trust and EdgeVerve Systems Limited Employees Gratuity Fund Trust, respectively. Trustees administer contributions made to the trust. As of June 30, 2017 and March 31, 2017, the plan assets have been primarily invested in insurer managed funds.
Actual return on assets for the three months
ended June 30, 2017, and June 30, 2016 were 24 crore and 21 crore, respectively.
The Group expects to contribute 80 crore to
the gratuity trusts during the remainder of fiscal 2018.
Maturity profile of defined benefit obligation:
(In crore)
| Within 1 year | 161 |
| 1-2 year | 166 |
| 2-3 year | 174 |
| 3-4 year | 189 |
| 4-5 year | 200 |
| 5-10 years | 963 |
2.22.2 Superannuation
The group contributed 42 crore and 41 crore
to the superannuation plan during the three months ended June 30, 2017 and June 30, 2016, respectively and same has been recognized
in the Statement of profit and loss account under the head employee benefit expense.
2.22.3 Provident fund
Infosys has an obligation to fund any shortfall on the yield of the trust’s investments over the administered interest rates on an annual basis. These administered rates are determined annually predominantly considering the social rather than economic factors and in most cases the actual return earned by the Company has been higher in the past years. The actuary has provided a valuation for provident fund liabilities on the basis of guidance issued by Actuarial Society of India and based on the assumptions provided below there is no shortfall as at June 30, 2017 and March 31, 2017, respectively.
The details of fund and plan asset position are as follows:
(In crore)
| Particulars | As of | |
| June 30, 2017 | March 31, 2017 | |
| Plan assets at period end, at fair value | 4,532 | 4,459 |
| Present value of benefit obligation at period end | 4,532 | 4,459 |
| Asset recognized in Balance Sheet | – | – |
The plan assets have been primarily invested in government securities.
Assumptions used in determining the present value obligation of the interest rate guarantee under the Deterministic Approach:
| Particulars | As of | |
| June 30, 2017 | March 31, 2017 | |
| Government of India (GOI) bond yield (%) | 6.60 | 6.90 |
| Remaining term to maturity of portfolio (years) | 6 | 6 |
| Expected guaranteed interest rate (%) - First year: | 8.60 | 8.60 |
| - Thereafter: | 8.60 | 8.60 |
The Group contributed 116 crore and 113 crore
to the provident fund during the three months ended June 30, 2017 and June 30, 2016, respectively. The same has been recognized
in the Statement of Profit and Loss under the head employee benefit expense.
The provident plans are applicable only to employees drawing a salary in Indian rupees and there are no other significant foreign defined benefit plans.
2.22.4 Employee benefit costs include:
(In crore)
| Particulars | Three months ended June 30, | |
| 2017 | 2016 | |
| Salaries and bonus* | 9,172 | 9,099 |
| Defined contribution plans | 63 | 61 |
| Defined benefit plans | 131 | 122 |
| 9,366 | 9,282 | |
| * | Includes stock compensation expense of 46 crore and 9 crore for three months
ended June 30, 2017 and June 30, 2016 respectively. Refer note 2.13 |
2.23RECONCILIATION OF BASIC AND DILUTED SHARES USED IN COMPUTING EARNINGS PER SHARE
| Particulars | Three months ended June 30, | |
| 2017 | 2016 | |
| Basic earnings per equity share - weighted average number of equity shares outstanding(1) | 228,56,57,604 | 228,56,22,329 |
| Effect of dilutive common equivalent shares - share options outstanding | 14,00,544 | 1,45,793 |
| Diluted earnings per equity share - weighted average number of equity shares and common equivalent shares outstanding | 228,70,58,148 | 228,57,68,122 |
(1) Excludes treasury shares
For the three months ended June 30, 2017, 2,64,886 options to purchase equity shares had an anti-dilutive effect. For the three months June 30, 2016, no outstanding option to purchase equity shares had an anti-dilutive effect.
2.24CONTINGENT LIABILITIES AND COMMITMENTS (TO THE EXTENT NOT PROVIDED FOR)
In crore
| Particulars | As at | |
| June 30, 2017 | March 31, 2017 | |
| Contingent liabilities : | ||
| Claims against the Company, not acknowledged as debts(1) | 1,790 | 1,997 |
| [Net of amount paid to statutory authorities 5,017 crore (4,717 crore)] |
||
| Commitments : | ||
| Estimated amount of contracts remaining to be executed on capital contracts and not provided for (net of advances and deposits) | 891 | 1,149 |
| Other commitments* | 94 | 114 |
*Uncalled capital pertaining to investments
| (1) | Claims against the Company not acknowledged as debts as on June 30, 2017 include demand from the Indian Income tax authorities for payment of tax including interest upon completion of their tax assessment for fiscals 2007, 2008, 2009, 2010, 2011, 2012 and 2013. Demands were paid to statutory tax authorities in full except for fiscals 2009, 2011, 2012 and 2013. |
Demand for fiscals 2007, 2008 and 2009 includes disallowance of a portion of the deduction claimed by the company under Section 10A of the income Tax Act as determined by the ratio of export turnover to total turnover. The disallowance arose from certain expenses incurred in foreign currency being reduced from export turnover but not reduced from total turnover. Demand for fiscals 2007, 2008, 2009, 2010 and 2011 also includes disallowance of portion of profit earned outside India from the STP units under section 10A of the Income Tax Act and disallowance of profits earned from SEZ units under section 10AA of the Income Tax Act. During the quarter the company has received the appeal order for fiscals 2007, 2008 and 2009 allowing deduction under section 10AA of the Income Tax Act for the units and deduction of foreign currency expenditure from export and total turnover. The order giving effect for the above mentioned years has not been received. The Company is in the process of filing appeal for fiscals 2007, 2008 and 2009 before Hon'ble Income Tax Appellate tribunal against the issues which are held against the company by the Commissioner of Income Tax (Appeals) Bengaluru. Demands for fiscal 2012 and 2013 includes disallowance of certain expenses incurred in foreign currency being reduced from export turnover but not reduced from total turnover and disallowance of profits earned from SEZ units which commenced operations before April 1, 2009 under section 10AA of the Income Tax Act and also others. The matters for fiscal 2013 is pending before the Commissioner of Income Tax (Appeals) Bengaluru. The matter for fiscal 2010, fiscal 2011 and fiscal 2012 is pending before Hon’ble Income Tax Appellate Tribunal (ITAT) Bengaluru.
The Company is contesting the demand and the management including its tax advisors believes that its position will likely be upheld in the appellate process. The management believes that the ultimate outcome of these proceedings will not have a material adverse effect on the Company's financial position and results of operations.
The Company is subject to legal proceedings and claims, which have arisen in the ordinary course of business. The Company’s management does not reasonably expect that these legal actions, when ultimately concluded and determined, will have a material and adverse effect on the Company’s results of operations or financial condition.
2.25 RELATED PARTY TRANSACTIONS
List of related parties:
| Name of subsidiaries | Country | Holdings as at | |
| June 30, 2017 | March 31, 2017 | ||
| Infosys BPO Limited (Infosys BPO) | India | 99.98% | 99.98% |
| Infosys Technologies (China) Co. Limited (Infosys China) | China | 100% | 100% |
| Infosys Technologies S. de R. L. de C. V. (Infosys Mexico) | Mexico | 100% | 100% |
| Infosys Technologies (Sweden) AB. (Infosys Sweden) | Sweden | 100% | 100% |
| Infosys Technologies (Shanghai) Company Limited (Infosys Shanghai) | China | 100% | 100% |
| Infosys Tecnologia DO Brasil LTDA. (Infosys Brasil) | Brazil | 100% | 100% |
| Infosys Public Services, Inc. USA (Infosys Public Services) | U.S. | 100% | 100% |
| Infosys Americas Inc., (Infosys Americas) | U.S. | 100% | 100% |
| Infosys (Czech Republic) Limited s.r.o. (formerly Infosys BPO s. r. o) (1) | Czech Republic | 99.98% | 99.98% |
| Infosys Poland, Sp z.o.o (formerly Infosys BPO Poland, Sp z.o.o)(1) | Poland | 99.98% | 99.98% |
| Infosys BPO S.de.R.L.de.C.V(1)(13) | Mexico | – | – |
| Infosys McCamish Systems LLC (1) | U.S. | 99.98% | 99.98% |
| Portland Group Pty Ltd(1) | Australia | 99.98% | 99.98% |
| Infosys BPO Americas LLC.(1)(12) | U.S. | 99.98% | 99.98% |
| Infosys Technologies (Australia) Pty. Limited (Infosys Australia) (2) | Australia | 100% | 100% |
| EdgeVerve Systems Limited (EdgeVerve) | India | 100% | 100% |
| Infosys Consulting Holding AG (Infosys Lodestone) (formerly Lodestone Holding AG) | Switzerland | 100% | 100% |
| Lodestone Management Consultants Inc. (3) | U.S. | 100% | 100% |
| Infosys Management Consulting Pty Limited (formerly Lodestone Management Consultants Pty Limited) (3) | Australia | 100% | 100% |
| Infosys Consulting AG (formerly Lodestone Management Consultants AG) (3) | Switzerland | 100% | 100% |
| Lodestone Augmentis AG (5)(14) | Switzerland | – | – |
| Lodestone GmbH (formerly Hafner Bauer & Ödman GmbH) (3)(16) | Switzerland | – | – |
| Infosys Consulting (Belgium) NV (formerly Lodestone Management Consultants (Belgium) S.A.) (4) | Belgium | 99.90% | 99.90% |
| Infosys Consulting GmbH (formerly Lodestone Management Consultants GmbH) (3) | Germany | 100% | 100% |
| Infosys Consulting Pte Ltd. (formerly Lodestone Management Consultants Pte Ltd) (17) | Singapore | 100% | 100% |
| Infosys Consulting SAS (formerly Lodestone Management Consultants SAS) (3) | France | 100% | 100% |
| Infosys Consulting s.r.o.(formerly Lodestone Management Consultants s.r.o.) (3) | Czech Republic | 100% | 100% |
| Lodestone Management Consultants GmbH (3) | Austria | 100% | 100% |
| Lodestone Management Consultants Co., Ltd. (3) | China | 100% | 100% |
| Infy Consulting Company Ltd. (formerly Lodestone Management Consultants Ltd.) (3) | U.K. | 100% | 100% |
| Infy Consulting B.V. (Lodestone Management Consultants B.V.) (3) | The Netherlands | 100% | 100% |
| Infosys Consulting Ltda. (formerly Lodestone Management Consultants Ltda.) (4) | Brazil | 99.99% | 99.99% |
| Infosys Consulting Sp. z.o.o (formerly Lodestone Management Consultants Sp. z o.o.) (3) | Poland | 100% | 100% |
| Lodestone Management Consultants Portugal, Unipessoal, Lda. (3) | Portugal | 100% | 100% |
| S.C. Infosys Consulting S.R.L.(formerly S.C. Lodestone Management Consultants S.R.L.) (3) | Romania | 100% | 100% |
| Infosys Consulting S.R.L. (formerly Lodestone Management Consultants S.R.L.) (3) | Argentina | 100% | 100% |
| Infosys Canada Public Services Ltd.(6)(18) | Canada | – | – |
| Infosys Nova Holdings LLC. (Infosys Nova) | U.S. | 100% | 100% |
| Panaya Inc. (Panaya) | U.S. | 100% | 100% |
| Panaya Ltd.(7) | Israel | 100% | 100% |
| Panaya GmbH (7) | Germany | 100% | 100% |
| Panaya Pty Ltd.(7)(15) | Australia | – | – |
| Panaya Japan Co. Ltd.(7) | Japan | 100% | 100% |
| Skava Systems Pvt. Ltd. (Skava Systems) (8) | India | 100% | 100% |
| Kallidus Inc. (Kallidus) (9) | U.S. | 100% | 100% |
| Noah Consulting LLC (Noah) (10) | U.S. | 100% | 100% |
| Noah Information Management Consulting Inc. (Noah Canada) (11) | Canada | 100% | 100% |
| (1) | Wholly owned subsidiary of Infosys BPO. |
| (2) | Under liquidation |
| (3) | Wholly owned subsidiaries of Infosys Consulting Holding AG (formerly Lodestone Holding AG) |
| (4) | Majority owned and controlled subsidiaries of Infosys Consulting Holding AG (formerly Lodestone Holding AG) |
| (5) | Wholly owned subsidiary of Infosys Consulting AG (formerly Lodestone Management Consultants AG) |
| (6) | Wholly owned subsidiary of Infosys Public Services, Inc. |
| (7) | Wholly owned subsidiary of Panaya Inc. |
| (8) | On June 2, 2015, Infosys acquired 100% of the voting interest in Skava Systems |
| (9) | On June 2, 2015, Infosys acquired 100% of the voting interest in Kallidus |
| (10) | On November 16, 2015, Infosys acquired 100% of the membership interests in Noah |
| (11) | Wholly owned subsidiary of Noah |
| (12) | Incorporated effective November 20, 2015 |
| (13) | Liquidated effective March 15, 2016 |
| (14) | Liquidated effective October 5, 2016 |
| (15) | Liquidated effective November 16, 2016 |
| (16) | Liquidated effective December 21, 2016 |
| (17) | Wholly owned subsidiary of Infosys |
| (18) | Liquidated effective May 9, 2017 |
Infosys has provided guarantee for performance of certain contracts entered into by its subsidiaries.
| Name of Associates | Country | Holdings as at | |
| June 30, 2017 | March 31, 2017 | ||
| DWA Nova LLC(1) | U.S. | 16% | 16% |
(1) Associate of Infosys Nova Holding LLC
During the quarter ended June 30, 2017, the Company
has written down the entire carrying value of the investment in its associate DWA Nova LLC amounting to 71 crore.
List of other related party
| Particulars | Country | Nature of relationship |
| Infosys Limited Employees' Gratuity Fund Trust | India | Post-employment benefit plan of Infosys |
| Infosys Limited Employees' Provident Fund Trust | India | Post-employment benefit plan of Infosys |
| Infosys Limited Employees' Superannuation Fund Trust | India | Post-employment benefit plan of Infosys |
| Infosys BPO Limited Employees' Superannuation Fund Trust | India | Post-employment benefit plan of Infosys BPO |
| Infosys BPO Limited Employees' Gratuity Fund Trust | India | Post-employment benefit plan of Infosys BPO |
| EdgeVerve Systems Limited Employees Gratuity Fund Trust |
India | Post-employment benefit plan of EdgeVerve |
| EdgeVerve Systems Limited Employees Superannuation Fund Trust |
India | Post-employment benefit plan of EdgeVerve |
| Infosys Employees Welfare Trust | India | Controlled trust |
| Infosys Employee Benefits Trust | India | Controlled trust |
| Infosys Science Foundation | India | Controlled trust |
Refer Notes 2.22 for information on transactions with post-employment benefit plans mentioned above.
List of key management personnel
Whole-time directors
U. B. Pravin Rao
Dr. Vishal Sikka
Non-whole-time directors
Prof. Jeffrey S. Lehman
R. Seshasayee
Ravi Venkatesan
Kiran Mazumdar-Shaw
Prof. John W. Etchemendy
Roopa Kudva
Dr. Punita Kumar-Sinha
D. N. Prahlad (appointed effective October 14, 2016)
Executive Officers
M. D. Ranganath, Chief Financial Officer
David D. Kennedy, General Counsel and Chief Compliance Officer (till December 31, 2016)
Mohit Joshi, President (effective October 13, 2016)
Rajesh K. Murthy, President (effective October 13, 2016)
Ravi Kumar S, President and Deputy Chief Operating Officer (effective October 13, 2016)
Sandeep Dadlani, President (till July 14, 2017)
Krishnamurthy Shankar, Group Head - Human Resources (effective October 13, 2016)
Gopi Krishnan Radhakrishnan - Acting General Counsel (till June 24, 2017)
Inderpreet Sawhney, Group General Counsel and Chief Compliance Officer (appointed as executive officer effective July 14, 2017)
Company Secretary
A.G.S. Manikantha
Transaction with key management personnel:
The table below describes the compensation to key managerial personnel which comprise directors and executive officers:
In crore
| Particulars | Three months ended June 30, | |
| 2017 | 2016 | |
| Salaries and other employee benefits to whole-time directors and executive officers (1) | 26 | 21 |
| Commission and other benefits to non-executive/independent directors | 3 | 3 |
| Total | 29 | 24 |
| (1) | Includes stock compensation expense of 12 crore and 9 crore for three months
ended June 30, 2017 and June 30, 2016 respectively, towards key managerial personnel. Refer note 2.13 |
2.26 SEGMENT REPORTING
Ind AS 108 establishes standards for the way that public business enterprises report information about operating segments and related disclosures about products and services, geographic areas, and major customers. The group's operations predominantly relate to providing end-to-end business solutions to enable clients to enhance business performance. Based on the 'management approach' as defined in Ind AS 108, the Chief Operating Decision Maker (CODM) evaluates the Group's performance and allocates resources based on an analysis of various performance indicators by business segments and geographic segments. Accordingly, information has been presented both along business segments and geographic segments. The accounting principles used in the preparation of the financial statements are consistently applied to record revenue and expenditure in individual segments, and are as set out in the significant accounting policies.
Business segments of the Group are primarily enterprises in Financial Services (FS), enterprises in Manufacturing (MFG), enterprises in Retail, Consumer packaged goods and Logistics (RCL), enterprises in the Energy & utilities, Communication and Services (ECS), enterprises in Hi-tech (Hi-tech), enterprises in Life Sciences, Healthcare and Insurance (HILIFE) and all other segments. The FS reportable segments has been aggregated to include the Financial Services operating segment and the Finacle operating segment because of the similarity of the economic characteristics. All other segments represents the operating segments of businesses in India, Japan and China and IPS. Geographic segmentation is based on business sourced from that geographic region and delivered from both on-site and off-shore locations. North America comprises the United States of America, Canada and Mexico, Europe includes continental Europe (both the east and the west), Ireland and the United Kingdom, and the Rest of the World comprising all other places except those mentioned above and India.
Revenue and identifiable operating expenses in relation to segments are categorized based on items that are individually identifiable to that segment. Revenue for 'all other segments' represents revenue generated by IPS and revenue generated from customers located in India, Japan and China. Allocated expenses of segments include expenses incurred for rendering services from the Group's offshore software development centres and on-site expenses, which are categorized in relation to the associated turnover of the segment. Certain expenses such as depreciation, which form a significant component of total expenses, are not specifically allocable to specific segments as the underlying assets are used interchangeably. The management believes that it is not practical to provide segment disclosures relating to those costs and expenses, and accordingly these expenses are separately disclosed as "unallocated" and adjusted against the total income of the Group.
Assets and liabilities used in the Group's business are not identified to any of the reportable segments, as these are used interchangeably between segments. The management believes that it is currently not practicable to provide segment disclosures relating to total assets and liabilities since a meaningful segregation of the available data is onerous.
Geographical information on revenue and business segment revenue information is collated based on individual customers invoiced or in relation to which the revenue is otherwise recognized.
Business Segments
Three months ended June 30, 2017 and June 30, 2016:
In crore
| Particulars | FS | MFG | ECS | RCL | HILIFE | Hi-Tech | All other segments | Total |
| Revenue from operations | 4,594 | 1,863 | 3,957 | 2,695 | 2,170 | 1,235 | 564 | 17,078 |
| 4,551 | 1,844 | 3,719 | 2,861 | 2,004 | 1,322 | 481 | 16,782 | |
| Identifiable operating expenses | 2,301 | 1,007 | 1,967 | 1,296 | 1,069 | 676 | 309 | 8,625 |
| 2,238 | 949 | 1,757 | 1,370 | 1,000 | 683 | 344 | 8,341 | |
| Allocated expenses | 998 | 432 | 917 | 624 | 503 | 286 | 131 | 3,891 |
| 1,046 | 444 | 896 | 689 | 482 | 318 | 116 | 3,991 | |
| Segmental operating income | 1,295 | 424 | 1,073 | 775 | 598 | 273 | 124 | 4,562 |
| 1,267 | 451 | 1,066 | 802 | 522 | 321 | 21 | 4,450 | |
| Unallocable expenses | 451 | |||||||
| 403 | ||||||||
| Other income, net | 814 | |||||||
| 753 | ||||||||
| Share in net profit/(loss) of associate | – | |||||||
| (2) | ||||||||
| Write-down of investment in associate | (71) | |||||||
| – | ||||||||
| Profit before tax | 4,854 | |||||||
| 4,798 | ||||||||
| Tax expense | 1,371 | |||||||
| 1,362 | ||||||||
| Profit for the period | 3,483 | |||||||
| 3,436 | ||||||||
| Depreciation and amortization | 450 | |||||||
| 400 | ||||||||
| Non-cash expenses other than depreciation and amortization | 1 | |||||||
| 3 |
Geographic Segments
Three months ended June 30, 2017 and June 30, 2016:
In crore
| Particulars | North America | Europe | India | Rest of the World | Total |
| Revenue from operations | 10,441 | 3,831 | 605 | 2,201 | 17,078 |
| 10,400 | 3,868 | 457 | 2,057 | 16,782 | |
| Identifiable operating expenses | 5,417 | 1,990 | 209 | 1,009 | 8,625 |
| 5,336 | 1,845 | 247 | 913 | 8,341 | |
| Allocated expenses | 2,415 | 884 | 119 | 473 | 3,891 |
| 2,503 | 928 | 95 | 465 | 3,991 | |
| Segmental operating income | 2,609 | 957 | 277 | 719 | 4,562 |
| 2,561 | 1,095 | 115 | 679 | 4,450 | |
| Unallocable expenses | 451 | ||||
| 403 | |||||
| Other income, net | 814 | ||||
| 753 | |||||
| Share in net profit/(loss) of associate | – | ||||
| (2) | |||||
| Write-down of investment in associate | (71) | ||||
| – | |||||
| Profit before tax | 4,854 | ||||
| 4,798 | |||||
| Tax expense | 1,371 | ||||
| 1,362 | |||||
| Profit for the period | 3,483 | ||||
| 3,436 | |||||
| Depreciation and amortization | 450 | ||||
| 400 | |||||
| Non-cash expenses other than depreciation and amortization | 1 | ||||
| 3 |
Significant clients
No client individually accounted for more than 10% of the revenues in the three months ended June 30, 2017 and June 30, 2016.
2.27 FUNCTION WISE CLASSIFICATION OF CONSOLIDATED STATEMENT OF PROFIT AND LOSS
In crore
| Particulars | Three months ended June 30, | |
| 2017 | 2016 | |
| Revenue from operations | 17,078 | 16,782 |
| Cost of Sales | 10,900 | 10,681 |
| Gross profit | 6,178 | 6,101 |
| Operating expenses | ||
| Selling and marketing expenses | 888 | 920 |
| General and administration expenses | 1,179 | 1,134 |
| Total operating expenses | 2,067 | 2,054 |
| Operating profit | 4,111 | 4,047 |
| Other income | 814 | 753 |
| Profit before non controlling interest / Share in net profit / (loss) of associate | 4,925 | 4,800 |
| Share in net profit/(loss) of associate | – | (2) |
| Write-down of investment in associate | (71) | – |
| Profit before tax | 4,854 | 4,798 |
| Tax expense: | ||
| Current tax | 1,499 | 1,467 |
| Deferred tax | (128) | (105) |
| Profit for the period | 3,483 | 3,436 |
| Other comprehensive income | ||
| Items that will not be reclassified subsequently to profit or loss | ||
| Remeasurement of the net defined benefit liability/asset | (3) | (17) |
| Equity instruments through other comprehensive income, net | – | – |
| (3) | (17) | |
| Items that will be reclassified subsequently to profit or loss | ||
| Fair value changes on derivatives designated as cash flow hedge, net | (66) | – |
| Exchange differences on translation of foreign operations | 107 | 38 |
| Fair value changes on investments, net | 27 | – |
| 68 | 38 | |
| Total other comprehensive income, net of tax | 65 | 21 |
| Total comprehensive income for the period | 3,548 | 3,457 |
| Profit attributable to: | ||
| Owners of the Company | 3,483 | 3,436 |
| Non-controlling interests | – | – |
| 3,483 | 3,436 | |
| Total comprehensive income attributable to: | ||
| Owners of the Company | 3,548 | 3,457 |
| Non-controlling interests | – | – |
| 3,548 | 3,457 | |
for and on behalf of the Board of Directors of Infosys Limited
| R. Seshasayee Chairman |
Ravi Venkatesan Co- Chairman |
Dr. Vishal Sikka Chief Executive Officer and Managing Director |
U. B. Pravin Rao Chief Operating Officer and Whole-time Director |
| Bengaluru July 14, 2017 |
Roopa Kudva Director |
M. D. Ranganath Chief Financial Officer |
A. G. S. Manikantha Company Secretary |
INDEPENDENT Auditor’s Report on audit of interim financial results
To The Board of Directors of Infosys Limited
| 1. | We have audited the accompanying Statement of Consolidated Financial Results of INFOSYS LIMITED (“the Company”) and its subsidiaries (the Company and its subsidiaries together referred to as “the Group”) for the three months period ended June 30, 2017 (“the Statement”), being submitted by the Company pursuant to the requirement of Regulation 33 of the SEBI (Listing Obligations and Disclosure Requirements) Regulations, 2015, as modified by Circular No. CIR/CFD/FAC/62/2016 dated July 5, 2016. |
This Statement, which is the responsibility of the Company’s Management and approved by the Board of Directors, has been compiled from the related interim consolidated financial statements which have been prepared in accordance with Indian Accounting Standards 34 “Interim Financial Reporting” (“Ind AS 34”) prescribed under Section 133 of the Companies Act, 2013, read with relevant rules issued thereunder and other accounting principles generally accepted in India. Our responsibility is to express an opinion on the Statement based on our audit of such interim consolidated financial statements.
| 2. | We conducted our audit in accordance with the Standards on Auditing issued by the Institute of Chartered Accountants of India. Those Standards require that we comply with ethical requirements and plan and perform the audit to obtain reasonable assurance about whether the Statement is free from material misstatement. |
An audit involves performing procedures to obtain audit evidence about the amounts and the disclosures in the Statement. The procedures selected depend on the auditor’s judgment, including the assessment of the risks of material misstatement of the Statement, whether due to fraud or error. In making those risk assessments, the auditor considers internal control relevant to the Company’s preparation and fair presentation of the Statement in order to design audit procedures that are appropriate in the circumstances, but not for the purpose of expressing an opinion on the effectiveness of the Company’s internal control. An audit also includes evaluating the appropriateness of the accounting policies used and the reasonableness of the accounting estimates made by the Management, as well as evaluating the overall presentation of the Statement.
We believe that the audit evidence obtained by us, is sufficient and appropriate to provide a basis for our audit opinion.
| 3. | In our opinion and to the best of our information and according to the explanations given to us, the Statement: |
| a. | includes the results of the subsidiaries and associate as given in the Annexure to this report; |
| b. | is presented in accordance with the requirements of SEBI (Listing Obligations and Disclosure Requirements) Regulations, 2015, as modified by Circular No. CIR/CFD/FAC/62/2016 dated July 5, 2016; and |
| c. | gives a true and fair view in conformity with the aforesaid Indian Accounting Standards and other accounting principles generally accepted in India of the net profit and total comprehensive income for the period and other financial information of the Group for the three months period ended June 30, 2017. |
For DELOITTE HASKINS & SELLS LLP
Chartered Accountants
(Firm’s Registration No. 117366W/W-100018)
P. R. RAMESH
Partner
(Membership No.70928)
Bengaluru, July 14, 2017
Annexure to Auditors’ Report
List of Subsidiaries:
| 1. | Infosys BPO Limited |
| 2. | Infosys Technologies (China) Co. Limited |
| 3. | Infosys Technologies S. de R. L. de C. V. |
| 4. | Infosys Technologies (Sweden) AB. |
| 5. | Infosys Technologies (Shanghai) Company Limited |
| 6. | Infosys Tecnologia do Brasil Ltda. |
| 7. | Infosys Public Services, Inc. |
| 8. | Infosys Americas Inc. |
| 9. | Infosys (Czech Republic) Limited s.r.o. |
| 10. | Infosys Poland Sp Z.o.o |
| 11. | Infosys McCamish Systems LLC |
| 12. | Portland Group Pty Limited |
| 13. | Infosys BPO Americas LLC. |
| 14. | Infosys Technologies (Australia) Pty. Limited |
| 15. | EdgeVerve Systems Limited |
| 16. | Infosys Consulting Holding AG |
| 17. | Lodestone Management Consultants Inc. |
| 18. | Infosys Management Consulting Pty Limited |
| 19. | Infosys Consulting AG |
| 20. | Infosys Consulting (Belgium) NV |
| 21. | Infosys Consulting GmbH |
| 22. | Infosys Consulting Pte Limited. |
| 23. | Infosys Consulting SAS |
| 24. | Infosys Consulting s.r.o. |
| 25. | Lodestone Management Consultants GmbH |
| 26. | Lodestone Management Consultants Co. Limited |
| 27. | Infy Consulting Company Limited |
| 28. | Infy Consulting B.V. |
| 29. | Infosys Consulting Ltda. |
| 30. | Infosys Consulting Sp. Z.o.o. |
| 31. | Lodestone Management Consultants Portugal,Unipessoal, Lda |
| 32. | S.C. Infosys Consulting S.R.L. |
| 33. | Infosys Consulting S.R.L. |
| 34. | Infosys Canada Public Services Limited. |
| 35. | Infosys Nova Holdings LLC. |
| 36. | Panaya Inc. |
| 37. | Panaya Limited. |
| 38. | Panaya GmbH |
| 39. | Panaya Japan Co. Limited. |
| 40. | Skava Systems Pvt. Limited. |
| 41. | Kallidus Inc. |
| 42. | Noah Consulting LLC |
| 43. | Noah Information Management Consulting Inc. |
| 44. | Infosys Science Foundation |
| 45. | Infosys Limited Employees’Welfare Trust |
| 46. | Infosys Employee Benefits Trust |
List of Associates:
| 1. | DWA Nova LLC |
Serious News for Serious Traders! Try StreetInsider.com Premium Free!
You May Also Be Interested In
- Infosys Technologies (INFY) PT Lowered to $14 at Susquehanna
- TabaPay to Acquire the Assets of Synapse Financial Technologies, Inc.
- Three From Lyons & Simmons Selected Among Best Lawyers in Dallas
Create E-mail Alert Related Categories
SEC FilingsSign up for StreetInsider Free!
Receive full access to all new and archived articles, unlimited portfolio tracking, e-mail alerts, custom newswires and RSS feeds - and more!
