

Form 6-K ING GROEP NV For: May 06
 Tweet
Tweet Share
ShareUNITED STATES
SECURITIES AND EXCHANGE COMMISSION
Washington, D.C. 20549
Form 6-K
REPORT OF FOREIGN PRIVATE ISSUER PURSUANT TO RULE 13a-16 OR 15d-16 UNDER THE SECURITIES EXCHANGE ACT OF 1934
For them month of May 2022
Commission File Number: 001-14642
ING Groep N.V.
(Translation of registrant's name into English)
Bijlmerplein 888
1102 MG Amsterdam
The Netherlands
(Address of principal executive office)
Indicate by check mark whether the registrant files or will file annual reports under cover of Form 20-F or Form 40-F.
Form 20-F [ X ] Form 40-F [ ]
Indicate by check mark if the registrant is submitting the Form 6-K in paper as permitted by Regulation S-T Rule 101(b)(1):
Note: Regulation S-T Rule 101(b)(1) only permits the submission in paper of a Form 6-K if submitted solely to provide an attached annual report to security holders.
Indicate by check mark if the registrant is submitting the Form 6-K in paper as permitted by Regulation S-T Rule 101(b)(7):
Note: Regulation S-T Rule 101(b)(7) only permits the submission in paper of a Form 6-K if submitted to furnish a report or other document that the registrant foreign private issuer must furnish and make public under the laws of the jurisdiction in which the registrant is incorporated, domiciled or legally organized (the registrant's "home country"), or under the rules of the home country exchange on which the registrant's securities are traded, as long as the report or other document is not a press release, is not required to be and has not been distributed to the registrant's security holders, and, if discussing a material event, has already been the subject of a Form 6-K submission or other Commission filing on EDGAR.
On May 6, 2022, the Registrant issued a press release, a copy of which is attached hereto as Exhibit 99.1 and is incorporated herein by reference.
(c) Exhibit 99.1. Press release dated May 6, 2022
SIGNATURES
Pursuant to the requirements of the Securities Exchange Act of 1934, the registrant has duly caused this report to be signed on its behalf by the undersigned, thereunto duly authorized.
| ING Groep N.V. | ||
| (Registrant) | ||
| Date: May 6, 2022 | /s/ Raymond Vermeulen | |
| Raymond Vermeulen | ||
| Head of Media Relations | ||
Exhibit 99.1

ING posts 1Q2022 net result of €429 million and strong pre - provision pro fi t 1Q2022 pro fi t before tax of €668 million; CET1 ratio remains robust at 14.9% • Income strong with robust net interest income and continued increase in fee income • Operating expenses under control, lower than a year ago and sequentially • Retail Banking result 20% higher than in 1Q2021 on lower expenses and risk costs, despite impairment on TTB • Wholesale Banking results impacted by €834 million risk costs linked to Russia - related exposure • Additional capital distribution of €1.25 billion CEO Statement “The fi rst quarter of 2022 was marked by the terrible invasion of Ukraine, which is having a devastating impact on people’s lives and is threatening international stability and security,” said ING CEO Steven van Rijswijk. “Our fi rst priority is to support our colleagues and their families, our clients and the humanitarian e ff orts in Ukraine and surrounding countries. Global and local ING initiatives have raised more than €12 million to date for humanitarian aid in Ukraine and for those who have fl ed to other countries. We're waiving fees for personal transactions to Ukraine so customers can send money to their loved ones for free. I’m inspired by our Ukrainian employees and the colleagues across ING who are supporting them in various ways. In addition, we stopped doing new business with Russian companies. We continue to monitor the situation closely, managing and controlling risks while assisting our colleagues and clients wherever possible. “The geopolitical situation has also impacted our fi nancial results, as the increased risk on our Russia - related exposure led us to book additional provisions in Wholesale Banking. Income was strong this quarter, supported by resilient net interest income and continued fee growth. We also maintained good cost control despite pressure from in fl ation. As our capital position remains strong, we announce an additional capital distribution to our shareholders of €1.25 billion. “ING aims to be a banking leader when it comes to sustainability and the transition to a low - carbon economy. We worked hard over the years to build a power generation lending book that’s 60% renewables, outperforming by far the most ambitious climate goal of the Paris Agreement. We went a step further in March and announced that we aim to grow new fi nancing of renewable energy by 50% by year - end 2025 from 2021 and will no longer provide dedicated fi nance to new oil & gas fi elds. These steps are aligned with the International Energy Agency’s Net - Zero Emissions by 2050 Roadmap. “Delivering value through a superior customer experience remains important. An example from this quarter is how we became the fi rst bank in Spain to o ff er instant lending for new clients, with tailor - made pricing based on our analysis of the applicant’s data. And as we digitalise our product o ff ering, we launched Self Invest via mobile in Belgium, expanding the possibilities for our customers when it comes to online trading. Customers continue to choose for investment products, as total number of investment accounts globally rose nearly 13% year - on - year. “The global uncertainty and supply chain disruptions are impacting the price of energy and other goods and services. This has caused in fl ation to rise strongly, impacting economic growth at least in the short term. In line with our strategy, we continue to focus on providing our customers with a superior experience, helped by our technology foundations, and facilitating the transition to a low carbon economy, supported by our prudent risk approach." Investor enquiries E: [email protected] Press enquiries T: +31 (0)20 576 5000 E: [email protected] Analyst call 6 May 2022 at 9:00 am CET +31 (0)20 341 8221 (NL) +44 203 365 3209 (UK) +1 866 349 6092 (US) Live audio webcast at www.ing.com Media call 6 May 2022 at 11:00 am CET +31 (0)20 531 5855 (NL) +44 203 365 3210 (UK) Live audio webcast at www.ing.com Press release ING Corporate Communications Amsterdam, 6 May 2022

2 ING Press Release 1Q2022 Consolidated Results Business Highlights Primary customers 14.0 mln stable since 4Q2021 Mobile - only customers 52% in % of total active customers vs 51% at 4Q2021 Net result €429 mln - 57% vs 1Q2021 Fee income €933 mln +9% vs 1Q2021 CET1 ratio 14.9% - 1.0% - point vs 4Q2021 Return on equity (4 - qtr rolling avg) 8.0% +2.6% - points vs 1Q2021 We had 14 million primary customers at the end of March. This is 4% higher than a year ago and stable compared to last quarter, with notable increases in Germany and Romania. This number excludes the three retail countries we announced we’d exit. The pandemic has catalysed digital commerce and mobile payments at the expense of cash and traditional plastic cards. We’re still seeing a record number of mobile card payments, and we are taking steps to make it easier for our small and medium - sized business customers to receive those payments. In Poland, for example, we began o ff ering an app that turns a smartphone into a mobile card terminal. This makes us the fi rst bank in the country to o ff er our own ‘point of sale’ app, integrated into our channels. We’ve launched a similar app in Romania in the fi rst quarter of 2022. Our focus on customer experience was recognised in Germany, where we were named ‘most preferred bank’ and ‘online broker of the year’ in a survey conducted by Euro magazine. In Poland, we were named ‘institution of the year’ by mojebankowanie.pl based on interactions with clients; as well as ‘best bank in Poland’, ‘best mobile app’, ‘best online banking’ and ‘best mortgage service’. Customer experience NPS score: Ranked #1 in 6 of 11 Retail markets (excl. France) Sustainability is at the heart of what we do, so we are looking at where we can further integrate and professionalise it into our business. As we report on the number of sustainability deals, we now include deals that are in line with each sector’s sustainability market standards, such as those de fi ned in the EU Taxonomy. We’ve also updated our Green Bond Framework to meet higher standards on transparency and disclosure. This strengthens our sustainable debt strategy and contributes to a diversi fi ed investor base. The framework is now aligned with the ICMA Green Bond Principles 2021 and where possible with the EU Taxonomy (EUT) Regulation and the EUT Delegated Act. We’re increasing our sustainability o ff ering for Retail and Business Banking customers. We launched a green mortgage product in the Netherlands, our biggest market, and have the ambition to roll out similar products in all markets in the coming years. We also introduced a green lending proposition in Business Banking in Turkey. In the Netherlands, we launched a payment card made from recycled plastic, which will gradually replace all payment cards in the country. Research shows that the production of cards made from recycled PVC emits 19% less greenhouse gasses than those made with 'new' PVC. Other retail countries are also working on this. In the fi rst quarter, ING was joint bookrunner for Vodafone Ziggo’s debut €2.1 billion sustainability - linked bond. This builds on our earlier role as sustainability advisor for the update of the telecommunications company’s sustainability framework. Two ING deals closed in 2021 won top awards in March 2022 at the Environmental Finance Awards, re fl ecting industry recognition of ING’s strategy in action. The sustainability - linked loan of the year was our $3.25 billion deal with building materials company CEMEX, and the asset - backed/asset - based green bond of the year was the inaugural $1.35 billion green securitisation for technology infrastructure company Aligned. Sustainability Sustainability deals supported by ING: 77 in 1Q22 vs 73 in 1Q21

3 ING Press Release 1Q2022 Consolidated Results Consolidated results 1Q2022 1Q2021 Change 4Q2021 Change Profit or loss (in € million) Net interest income 3,415 3,513 - 2.8% 3,374 1.2% Net fee and commission income 933 854 9.3% 925 0.9% Investment income 29 39 - 25.6% 15 93.3% Other income 222 296 - 25.0% 310 - 28.4% Total income 4,600 4,702 - 2.2% 4,624 - 0.5% Expenses excl. regulatory costs 2,296 2,429 - 5.5% 2,562 - 10.4% Regulatory costs 1) 649 587 10.6% 385 68.6% Operating expenses 2,945 3,016 - 2.4% 2,947 - 0.1% Gross result 1,655 1,686 - 1.8% 1,677 - 1.3% Addition to loan loss provisions 2) 987 223 342.6% 346 185.3% Result before tax 668 1,463 - 54.3% 1,331 - 49.8% Taxation 194 439 - 55.8% 351 - 44.7% Non - controlling interests 46 18 155.6% 35 31.4% Net result 429 1,005 - 57.3% 945 - 54.6% Profitability and efficiency Interest margin 1.37% 1.46% 1.37% Cost/income ratio 64.0% 64.1% 63.7% Risk costs in bps of average customer lending 62 15 22 Return on equity based on IFRS - EU equity 3) 3.3% 7.8% 7.2% ING Group common equity Tier 1 ratio 14.9% 15.5% 15.9% Risk - weighted assets (end of period, in € billion) 334.9 311.0 7.7% 313.1 7.0% Customer balances (in € billion) Customer lending 633.9 623.5 1.7% 632.8 0.2% Customer deposits 629.9 628.2 0.3% 617.3 2.0% Net core lending growth (in € billion) 4) 0.4 17.8 13.4 Net core deposits growth (in € billion) 4) - 0.7 8.1 - 2.1 1) Regulatory costs comprise bank taxes and contributions to the deposit guarantee schemes (‘DGS’) and the (European) Single Resolution Fund (‘SRF’). 2) The amount presented in 'Addition to loan loss provisions' is equivalent to risk costs. 3) Annualised net result divided by average IFRS - EU shareholders' equity excluding reserved pro fi ts not included in CET1 capital. 4) Net core lending growth represents the development in loans and advances to customers excluding provisions for loan losses, adjusted for currency impacts, Treasury and run - o ff portfolios. Net core deposits growth represents customer deposits adjusted for currency impacts, Treasury and run - o ff portfolios. Total income Total income in 1Q2022 was strong at €4,600 million, supported by resilient net interest income, higher fee income and positive valuation adjustments in other income. Other income included an impairment of €150 million on our equity stake in TMBThanachart Bank (hereafter: TTB), which was caused by an adjustment of the carrying value based on updated parameters and outlook. Excluding this impairment, income increased slightly on both comparable quarters. Net interest income was €3,415 million in 1Q2022 and included a €82 million ECB funding rate bene fi t from the TLTRO III programme. In 4Q2021 the TLTRO III bene fi t was €84 million. In 1Q2021, the bene fi t amount was signi fi cantly higher at €233 million, as it included the cumulative recognition of the funding rate bene fi t for the period 24 June 2020 until 31 March 2021. Excluding the aforementioned TLTRO III bene fi ts, net interest income increased by €53 million compared with 1Q2021, mainly due to higher Treasury - related interest results and higher net interest income in Financial Markets. Lending recorded volume growth year - on - year, both in mortgages and in other lending, at slightly lower margins. On the liability side of the balance sheet, average balances slightly declined, while the margin on customer deposits was stable year - on - year. Sequentially, net interest income excluding TLTRO III bene fi ts increased by €43 million, mainly driven by higher Treasury - related interest income and furthermore supported by higher margins on liabilities in a rising interest rate environment, while 4Q2021 had contained a € - 23 million reclassi fi cation in Retail Belgium from other income to net interest income. 3,374 3,513 3,415 3,340 3,388 Net interest income excl. TLTRO 1Q2021 2Q2021 3Q2021 4Q2021 1Q2022 Net interest income TLTRO 3,280 3,333 3,304 84 233 82 83 84 1.39% 1.37% 1.40% 1.40% 1.37% 3,290 1.46% 1.42% 1.37% 1.38% 1.36% 3,257 The net interest margin compared with 4Q2021 was stable at 1.37%, as an increase in net interest income was o ff set by an increase in the average balance sheet. In line with the previous quarter, the TLTRO III bene fi t contributed three basis points to the average net interest margin. Net interest income (in € million) and net interest margin (in %) 4,000 1.80 Net interest margin Net interest margin 4 - quarter rolling average 2,000 2,500 3,000 3,500 1.65 1.50 1.35 1.20

4 ING Press Release 1Q2022 Consolidated Results Net core lending growth, which is customer lending growth adjusted for currency impacts and excluding developments in Treasury lending and in the WUB run - o ff portfolio, was €0.4 billion in 1Q2022. Net core lending growth in Retail Banking was €5.6 billion and consisted of €3.8 billion growth in residential mortgages (primarily in Germany, Australia and Spain) and €1.8 billion growth in other retail lending. In Wholesale Banking, net core lending growth was € - 5.2 billion, mainly due to a decrease in TLTRO - related short - term facilities in Financial Markets. Net core deposits growth was € - 0.7 billion in 1Q2022. In Retail Banking, net customer deposits decreased by €7.0 billion, caused by a €7.3 billion out fl ow in Germany, primarily re fl ecting the impact of the introduction of negative interest rate charging to clients with liability balances over €50,000. In Wholesale Banking, net customer deposits increased by €6.3 billion, mainly re fl ecting higher current account balances in daily banking. Net fee and commission income amounted to €933 million and rose 9.3% from 1Q2021, with both Retail and Wholesale Banking contributing to the increase. In Retail Banking, this was mainly due to higher fees for payment packages, while fees on investment products were lower than in 1Q2021, which had included increased trading activity in Germany. Fee income for Wholesale Banking grew 16.5% year - on - year, supported by improved syndicated deal activity in Lending and higher commodity prices, which supported fees in Trade & Commodity Finance. Compared with the strong 4Q2021, total fee income rose 0.9%. In Retail Banking, this was mainly driven by higher fees for investment products. In Wholesale Banking, higher fees for Lending were largely o ff set by a decline in fees from Financial Markets and Corporate Finance transactions after a peak in deal fl ow in 4Q2021. Investment income was €29 million in 1Q2022, re fl ecting lower realised gains on the disposal of debt instruments compared with 1Q2021. Sequentially, these gains were higher. Other income was €222 million in 1Q2022. Excluding the €150 million impairment on ING’s equity stake in TTB, other income increased on both comparable quarters, mainly in Group Treasury due to hedge ine ff ectiveness and positive revaluations of instruments not in hedge accounting. 4Q2021 had included a €28 million gain on an investment in an associate and a reclassi fi cation of € - 23 million from other income to net interest income. Operating expenses Total operating expenses decreased to €2,945 million, as we maintained good cost control despite pressure from in fl ation. Excluding regulatory costs and incidental items, expenses decreased by €49 million, or 2.1%, compared with 1Q2021. The impact of annual salary increases was more than compensated by a reduction in FTEs and IT costs. Compared with 4Q2021, expenses excluding regulatory costs and incidental items decreased by € 100 million, or 4 . 2 % . This was mainly due to lower performance - related sta ff expenses and lower marketing costs . Operating expenses (in € million) 1,500 2,000 2,500 3,000 2,296 649 84 587 2,345 2,333 172 2,331 121 233 2,396 1Q2021 2Q2021 3Q2021 4Q2021 1Q2022 Expenses excl. regulatory costs and incidental items Regulatory costs Incidental items 166 385 39 There were no incidental expense items in this quarter, while 1Q2021 had €84 million of incidental items, consisting of €73 million of redundancy and restructuring costs for the branch network and the retail advice organisation in the Netherlands, as well as €11 million of restructuring costs following the announcement to leave the retail banking market in the Czech Republic. The fourth quarter of 2021 included €166 million of incidental items. This consisted of €141 million of redundancy provisions and impairments related to the announcement to leave the retail banking market in France, €14 million of provisions and impairments for other Retail C&G countries and €11 million of additional redundancy provisions and costs related to the accelerated closure of branches in the Netherlands. Regulatory costs were €649 million and are usually high in the fi rst quarter of the year. This re fl ects the requirement to recognise certain annual charges in full in the fi rst quarter, such as the contributions to the European Single Resolution Fund (SRF) and the Belgian deposit guarantee scheme, as well as the Belgian bank tax (whereas the annual Dutch bank tax is usually recorded in the fourth quarter). The increase in regulatory costs compared with 1Q2021 was mainly caused by a higher tari ff for the European SRF contribution to catch up with a stronger - than - expected increase in covered deposits in the Banking Union . Addition to loan loss provisions Net additions to loan loss provisions were €987 million in 1Q2022, which is equivalent to 62 basis points of average customer lending. The geopolitical situation, with the Russian invasion of Ukraine, had a signi fi cant impact on the risk costs in this quarter, with €834 million of risk costs associated with our Russia - related exposure. Of this amount, €71 million were individual risk costs in Stage 3. The majority was in Stage 2 due to negative rating migration following the sovereign rating downgrade and the transfer of certain clients to the watch list, as well as a management overlay on our Russian exposure. As per the end of 1Q2022, €2.5 billion has been included in CET1 capital to cover for expected and unexpected losses on our Russia - related exposure. This consists of the aforementioned €0.8 billion of loan loss provisions and €1.7

5 ING Press Release 1Q2022 Consolidated Results billion of CET1 capital equivalent (at 12.5%) of €13.3 billion total credit RWA on Russia - related exposure. Excluding our Russia - related exposure, risk costs were limited to €153 million compared with €223 million in 1Q2021 and €346 million in 4Q2021. A collective Stage 2 provision of €178 million was recorded, re fl ecting an update of the macroeconomic indicators, while €124 million was released from Covid sector overlays taken in previous quarters. Addition to loan loss provisions (in € million) - 500 0 500 1,000 - 91 39 223 987 346 1Q2021 2Q2021 3Q2021 4Q2021 1Q2022 Stage 3 S2a%# 9 A ',!*3"',% - oR a*a,!# 1&##2 a," + - "'m!a2' - ,1 R'1) ! - 121 ', .1 - $ a4#0a%# !312 - +#0 *#,"',% Ia,,3a*'1#"K - 50 50 100 62 3 22 - 6 0 15 Total net additions to Stage 3 provisions in 1Q2022 were €154 million compared with €386 million in the previous quarter. Stage 1 and Stage 2 risk costs (including o ff - balance sheet provisioning and modi fi cations) were €833 million versus a net release of €39 million in 4Q2021. Net result ING’s 1Q2022 net result was €429 million, which was lower than in both comparable quarters. The decrease was due to higher risk costs and the impairment on TTB. The e ff ective tax rate was 29.0% in 1Q2022 compared with 30.0% in 1Q2021 and 26.4% in 4Q2021. The higher quarterly e ff ective tax rate of 29.0% compared with the full - year 2021 e ff ective tax rate of 27.7% takes into account the aforementioned TTB impairment, which is not tax - deductible. Return on equity ING Group (in %) 15 0 10 1Q2021 2Q2021 3Q2021 4Q2021 1Q2022 Return on IFRS - EU equity (quarter) Return on IFRS - EU equity (4 - quarter rolling average) 9.2 8.0 3.3 5.4 5 8.8 7.8 11.2 10.4 7.2 7.7 In 1Q2022, ING’s return on average IFRS - EU equity decreased to 3.3%. On a four - quarter rolling average basis, the return on ING’s average IFRS - EU equity declined to 8.0% from 9.2% in the previous four - quarter rolling period. This was due to a lower four - quarter rolling net result and a slight increase in average equity. ING’s return on equity is calculated using IFRS - EU shareholders' equity after excluding 'reserved pro fi t not included in CET1 capital', which amounted to €1,783 million as per the end of 1Q2022. This fi gure re fl ects 50% of both the FY2021 and 1Q2022 resilient net pro fi t, which has been reserved for distribution in line with our policy, minus the amount for the interim dividend 2021, which was paid in October. The resilient net pro fi t over 1Q2022, which is de fi ned as net pro fi t adjusted for signi fi cant items not linked to the normal course of business, was equal to net pro fi t.

6 ING Press Release 1Q2022 Capital, Liquidity and Funding Consolidated Balance Sheet Balance sheet In 1Q2022, ING’s balance sheet increased by €56.6 billion to €1,007.9 billion, including €4.0 billion of positive currency impacts. The increase was mainly due to higher fi nancial assets at fair value through pro fi t or loss (primarily reverse repos) and higher cash and balances with central banks. Customer lending increased by €1.1 billion, with the growth in Retail Banking largely o ff set by lower short - term lending in Wholesale Banking. The increase in other assets was mainly related to an increase in fi nancial transactions to be settled. On the liability side of the balance sheet, the main increase was in fi nancial liabilities at fair value through pro fi t or loss (predominantly repos, mirroring the development on the asset side of the balance sheet). Customer deposits were up by €12.6 billion. This was predominantly due to higher corporate deposits in Treasury and Wholesale Banking (mainly Bank Mendes Gans), while there was an out fl ow in Retail Germany following the charging of negative interest rates. Debt securities in issue were up by €7.3 billion, almost fully attributable to a higher amount of certi fi cates of deposits and commercial paper (CD/CPs). Other (mainly long term) debt securities in issue remained stable, as new issuances were o ff set by maturities. Other liabilities increased mainly due to an increase in fi nancial transactions to be settled. Shareholders’ equity Change in shareholders’ equity in € million 1Q2022 Shareholders' equity beginning of period 53,919 Net result for the period 429 (Un)realised gains/losses fair value through OCI - 67 (Un)realised other revaluations 0 Change in cash fl ow hedge reserve - 1,090 Change in liability credit reserve 147 De fi ned bene fi t remeasurement 4 Exchange rate di ff erences 127 Change in treasury shares - 140 Change in employee stock options and share plans 8 Other changes 139 Total changes - 444 Shareholders' equity end of period 53,475 Shareholders’ equity in 1Q2022 decreased by €444 million, primarily due to a €1,090 million negative change in the cash fl ow hedge reserve, which was mainly a result of interest rate movements. The decrease was partly o ff set by the €429 million net result recorded in 1Q2022. Shareholders’ equity per share decreased to €14.20 on 31 March 2022 from €14.28 on 31 December 2021. Consolidated balance sheet in € million 31 Mar. 22 31 Dec. 21 31 Mar. 22 31 Dec. 21 Assets Cash and balances with central banks Loans and advances to banks Financial assets at fair value through pro fi t or loss - trading assets - non - trading derivatives - designated as at fair value through pro fi t or loss - mandatorily at fair value through pro fi t or loss Financial assets at fair value through OCI - equity securities fair value through OCI - debt securities fair value through OCI - loans and advances fair value through OCI Securities at amortised cost Loans and advances to customers - customer lending - provision for loan losses Investments in associates and joint ventures Property and equipment Intangible assets Other assets 131,374 26,180 128,397 55,609 1,868 6,409 64,512 29,825 2,539 26,468 819 48,214 628,072 633,850 - 5,778 1,490 2,540 1,136 10,694 106,520 23,592 101,956 51,381 1,536 6,355 42,684 30,635 2,457 27,340 838 48,319 627,508 632,782 - 5,274 1,587 2,515 1,156 7,502 Liabilities Deposits from banks Customer deposits - savings accounts - credit balances on customer accounts - corporate deposits - other Financial liabilities at fair value through pro fi t or loss - trading liabilities - non - trading derivatives - designated as at fair value through pro fi t or loss Other liabilities Debt securities in issue Subordinated loans 88,742 629,870 307,981 285,663 35,157 1,069 99,367 34,627 2,661 62,079 20,368 99,111 16,388 85,092 617,296 314,893 279,805 22,174 424 71,041 27,113 2,120 41,808 14,707 91,784 16,715 Total liabilities 953,846 896,635 Equity Shareholders' equity Non - controlling interests 53,475 601 53,919 736 Total equity 54,076 54,654 Total assets 1,007,922 951,290 Total liabilities and equity 1,007,922 951,290
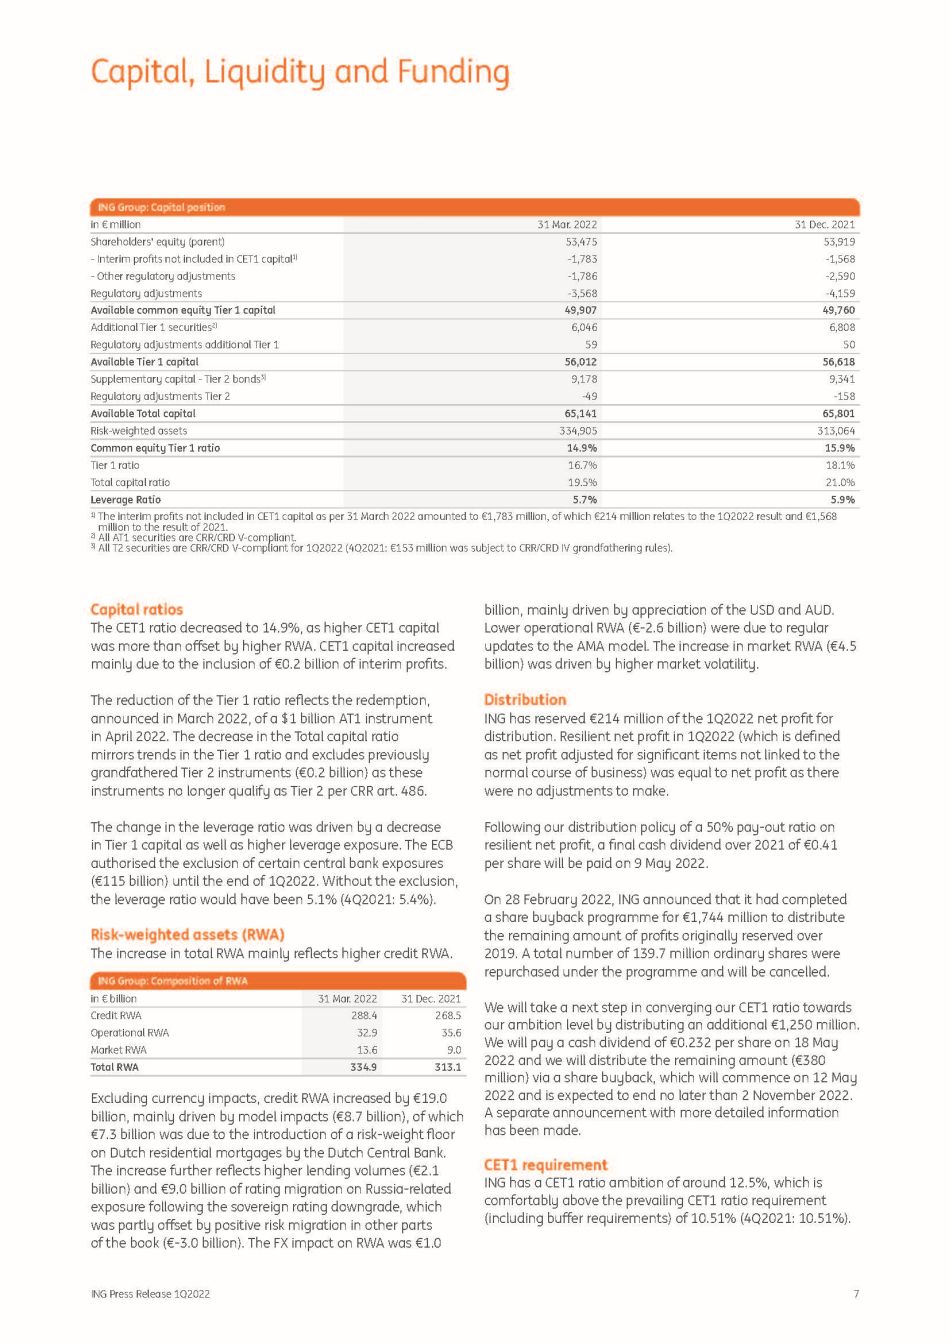
7 ING Press Release 1Q2022 Capital, Liquidity and Funding ING Group: Capital position in € million 31 Mar. 2022 31 Dec. 2021 Shareholders' equity (parent) 53,475 53,919 - Interim pro fi ts not included in CET1 capital 1) - 1,783 - 1,568 - Other regulatory adjustments - 1,786 - 2,590 Regulatory adjustments - 3,568 - 4,159 Available common equity Tier 1 capital 49,907 49,760 Additional Tier 1 securities 2) 6,046 6,808 Regulatory adjustments additional Tier 1 59 50 Available Tier 1 capital 56,012 56,618 Supplementary capital - Tier 2 bonds 3) 9,178 9,341 Regulatory adjustments Tier 2 - 49 - 158 Available Total capital 65,141 65,801 Risk - weighted assets 334,905 313,064 Common equity Tier 1 ratio 14.9% 15.9% Tier 1 ratio 16.7% 18.1% Total capital ratio 19.5% 21.0% Leverage Ratio 5.7% 5.9% 1) The interim pro fi ts not included in CET1 capital as per 31 March 2022 amounted to €1,783 million, of which €214 million relates to the 1Q2022 result and €1,568 million to the result of 2021. 2) All AT1 securities are CRR/CRD V - compliant. 3) All T2 securities are CRR/CRD V - compliant for 1Q2022 (4Q2021: €153 million was subject to CRR/CRD IV grandfathering rules). Capital ratios The CET1 ratio decreased to 14.9%, as higher CET1 capital was more than o ff set by higher RWA. CET1 capital increased mainly due to the inclusion of €0.2 billion of interim pro fi ts. The reduction of the Tier 1 ratio re fl ects the redemption, announced in March 2022, of a $1 billion AT1 instrument in April 2022. The decrease in the Total capital ratio mirrors trends in the Tier 1 ratio and excludes previously grandfathered Tier 2 instruments (€0.2 billion) as these instruments no longer qualify as Tier 2 per CRR art. 486. The change in the leverage ratio was driven by a decrease in Tier 1 capital as well as higher leverage exposure. The ECB authorised the exclusion of certain central bank exposures (€115 billion) until the end of 1Q2022. Without the exclusion, the leverage ratio would have been 5.1% (4Q2021: 5.4%). Risk - weighted assets (RWA) The increase in total RWA mainly re fl ects higher credit RWA. ING Group: Composition of RWA in € billion 31 Mar. 2022 31 Dec. 2021 Credit RWA 288.4 268.5 Operational RWA 32.9 35.6 Market RWA 13.6 9.0 Total RWA 334.9 313.1 Excluding currency impacts, credit RWA increased by €19.0 billion, mainly driven by model impacts (€8.7 billion), of which €7.3 billion was due to the introduction of a risk - weight fl oor on Dutch residential mortgages by the Dutch Central Bank. The increase further re fl ects higher lending volumes (€2.1 billion) and €9.0 billion of rating migration on Russia - related exposure following the sovereign rating downgrade, which was partly o ff set by positive risk migration in other parts of the book (€ - 3.0 billion). The FX impact on RWA was €1.0 billion, mainly driven by appreciation of the USD and AUD. Lower operational RWA (€ - 2.6 billion) were due to regular updates to the AMA model. The increase in market RWA (€4.5 billion) was driven by higher market volatility. Distribution ING has reserved €214 million of the 1Q2022 net pro fi t for distribution. Resilient net pro fi t in 1Q2022 (which is de fi ned as net pro fi t adjusted for signi fi cant items not linked to the normal course of business) was equal to net pro fi t as there were no adjustments to make. Following our distribution policy of a 50 % pay - out ratio on resilient net pro fi t, a fi nal cash dividend over 2021 of € 0 . 41 per share will be paid on 9 May 2022 . On 28 February 2022, ING announced that it had completed a share buyback programme for €1,744 million to distribute the remaining amount of pro fi ts originally reserved over 2019. A total number of 139.7 million ordinary shares were repurchased under the programme and will be cancelled. We will take a next step in converging our CET1 ratio towards our ambition level by distributing an additional €1,250 million. We will pay a cash dividend of €0.232 per share on 18 May 2022 and we will distribute the remaining amount (€380 million) via a share buyback, which will commence on 12 May 2022 and is expected to end no later than 2 November 2022. A separate announcement with more detailed information has been made. CET1 requirement ING has a CET1 ratio ambition of around 12.5%, which is comfortably above the prevailing CET1 ratio requirement (including bu ff er requirements) of 10.51% (4Q2021: 10.51%).

8 ING Press Release 1Q2022 Risk Management Capital, Liquidity and Funding TLAC and MREL requirements Total Loss Absorption Capacity (TLAC) and Minimum Required Eligible Liabilities (MREL) requirements apply to ING Group at the consolidated level of the resolution group. The available TLAC and MREL capacity consists of own funds and senior debt instruments issued by ING Group. TLAC requirements increased from 21.03% to 23.03% of RWA and from 6.0% to 6.75% of leverage exposure (LR). The TLAC surpluses decreased due to these higher TLAC requirements as well as higher RWA/leverage exposure, which were partly o ff set by increased TLAC capacity following the issuance of senior debt instruments (total €6.6 billion). ING Group: TLAC requirement in € million 31 Mar. 2022 31 Dec. 2021 TLAC capacity 101,439 95,815 TLAC (as a percentage of RWA) 30.3% 30.6% TLAC (as a percentage of leverage exposure) 10.3% 10.1% TLAC surplus (shortage) based on LR 35,238 38,639 1) TLAC surplus (shortage) based on RWA 24,319 29,978 1) The prior period surplus has been updated to improve consistency Intermediate MREL requirements of 27.32% of RWA and 5.97% of LR apply as per 1 January 2022. MREL surpluses increased as a higher MREL capacity following the issuance of senior debt instruments was only partly o ff set by higher RWA/leverage exposure. ING Group: MREL requirement in € million 31 Mar. 2022 31 Dec. 2021 MREL capacity 102,016 95,880 MREL (as a percentage of RWA) 30.5% 30.6% MREL (as a percentage of leverage exposure) 10.4% 10.1% MREL surplus (shortage) based on LR 1) 43,465 38,990 2) MREL surplus (shortage) based on RWA 1) 10,529 10,357 1) The MREL surplus is based on the intermediate MREL requirements that are binding as per 1 January 2022 2) The prior period surplus has been updated to improve consistency Liquidity and funding In 1Q2022, the 12 - month moving average Liquidity Coverage Ratio (LCR) decreased from 139% to 138%. LCR 12 - month moving average in € billion 31 Mar. 2022 31 Dec. 2021 Level 1 160.6 154.8 Level 2A 5.3 5.0 Level 2B 5.8 5.6 Total HQLA 171.7 165.4 Stressed Out fl ow 214.8 206.6 Stressed In fl ow 90.5 87.5 LCR 138% 139% In line with the Net Stable Funding Ratio (NSFR) regulatory requirement, which has been e ff ective since 2Q2021, in 1Q2022 the NSFR of ING remained comfortably above the regulatory minimum of 100%. The funding mix in 1Q2022 stayed largely the same as in 4Q2021. A decrease in the share of retail deposits was observed, compensated by an increase in the share of lending/repurchase agreements and corporate deposits. ING Group: Loan - to - deposit ratio and funding mix In % 31 Mar. 2022 31 Dec. 2021 Loan - to - deposit ratio 1.00 1.02 Key figures Customer deposits (retail) 48% 51% Customer deposits (corporate) 22% 21% Lending / repurchase agreements 8% 5% Interbank 9% 9% CD/CP 4% 3% Long - term senior debt 8% 8% Subordinated debt 2% 2% Total 1) 100% 100% 1) Liabilities excluding trading securities and IFRS equity. ING’s long - term debt position increased by €3.6 billion versus 4Q2021. The increase was due to €6.6 billion Senior HoldCo issuance and €3.75 billion covered bond issuance in Germany (€1.5 billion) and in the Netherlands (€2.25 billion), o ff set by maturities of €6.7 billion. Long - term debt maturity ladder per currency, 31 March 2022 in € billion Total ʹ 22 ʹ 23 ʹ 24 ʹ 25 ʹ 26 '27 > ʹ 27 EUR 54 2 5 1 5 3 5 33 USD 19 1 3 1 0 4 3 8 Other 8 0 1 1 0 2 0 3 Total 81 4 9 3 6 9 8 44 Ratings The ratings and outlook from S&P, Moody’s, Fitch and GBB - Rating remained unchanged in the quarter. S&P Moody's Fitch ING Groep N.V. Issuer rating Long - term A - n/a A+ Short - term A - 2 n/a F1 Outlook Stable Stable 1) Stable Senior unsecured rating A - Baa1 A+ ING Bank N.V. Issuer rating Long - term A+ A1 AA - Short - term A - 1 P - 1 F1+ Outlook Stable Stable Stable Senior unsecured rating A+ A1 AA - Credit ratings of ING on 5 May 2022 1) Outlook refers to the senior unsecured rating.
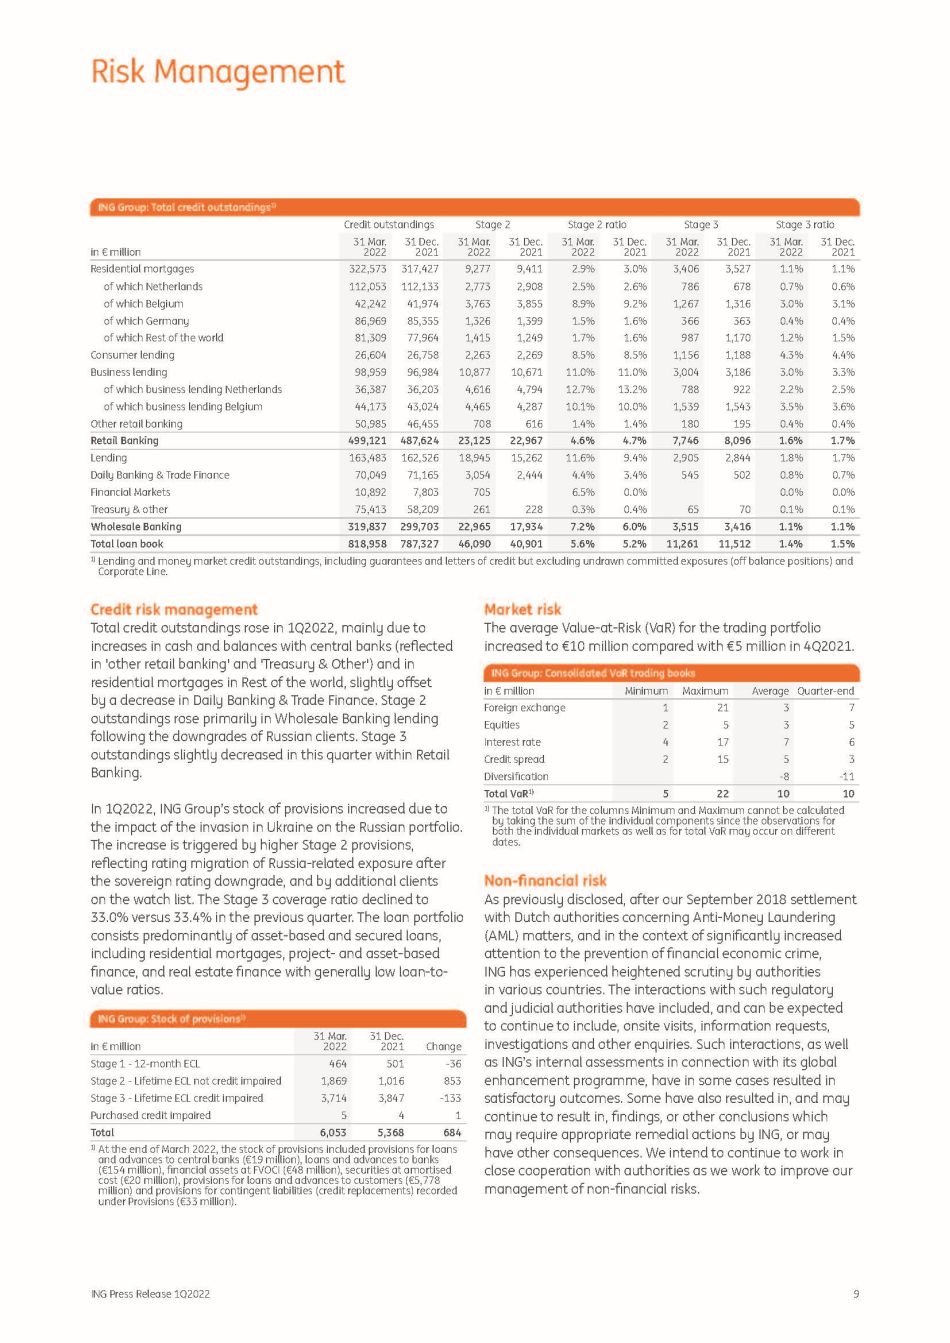
9 ING Press Release 1Q2022 Risk Management in € million 31 Mar. 2022 31 Dec. 2021 31 Mar. 2022 31 Dec. 2021 31 Mar. 2022 31 Dec. 2021 31 Mar. 2022 31 Dec. 2021 31 Mar. 2022 31 Dec. 2021 Residential mortgages of which Netherlands of which Belgium of which Germany of which Rest of the world Consumer lending Business lending of which business lending Netherlands of which business lending Belgium Other retail banking 322,573 112,053 42,242 86,969 81,309 26,604 98,959 36,387 44,173 50,985 317,427 112,133 41,974 85,355 77,964 26,758 96,984 36,203 43,024 46,455 9,277 2,773 3,763 1,326 1,415 2,263 10,877 4,616 4,465 708 9,411 2,908 3,855 1,399 1,249 2,269 10,671 4,794 4,287 616 2.9% 2.5% 8.9% 1.5% 1.7% 8.5% 11.0% 12.7% 10.1% 1.4% 3.0% 2.6% 9.2% 1.6% 1.6% 8.5% 11.0% 13.2% 10.0% 1.4% 3,406 786 1,267 366 987 1,156 3,004 788 1,539 180 3,527 678 1,316 363 1,170 1,188 3,186 922 1,543 195 1.1% 0.7% 3.0% 0.4% 1.2% 4.3% 3.0% 2.2% 3.5% 0.4% 1.1% 0.6% 3.1% 0.4% 1.5% 4.4% 3.3% 2.5% 3.6% 0.4% Retail Banking 499,121 487,624 23,125 22,967 4.6% 4.7% 7,746 8,096 1.6% 1.7% Lending Daily Banking & Trade Finance Financial Markets Treasury & other 163,483 70,049 10,892 75,413 162,526 71,165 7,803 58,209 18,945 3,054 705 261 15,262 2,444 228 11.6% 4.4% 6.5% 0.3% 9.4% 3.4% 0.0% 0.4% 2,905 545 65 2,844 502 70 1.8% 0.8% 0.0% 0.1% 1.7% 0.7% 0.0% 0.1% Wholesale Banking 319,837 299,703 22,965 17,934 7.2% 6.0% 3,515 3,416 1.1% 1.1% Total loan book 818,958 787,327 46,090 40,901 5.6% 5.2% 11,261 11,512 1.4% 1.5% ING Group: Total credit outstandings 1) Credit outstandings Stage 2 Stage 2 ratio Stage 3 Stage 3 ratio 1) Lending and money market credit outstandings, including guarantees and letters of credit but excluding undrawn committed exposures (o ff balance positions) and Corporate Line. Credit risk management Total credit outstandings rose in 1Q2022, mainly due to increases in cash and balances with central banks (re fl ected in 'other retail banking' and 'Treasury & Other') and in residential mortgages in Rest of the world, slightly o ff set by a decrease in Daily Banking & Trade Finance. Stage 2 outstandings rose primarily in Wholesale Banking lending following the downgrades of Russian clients. Stage 3 outstandings slightly decreased in this quarter within Retail Banking. In 1Q2022, ING Group’s stock of provisions increased due to the impact of the invasion in Ukraine on the Russian portfolio. The increase is triggered by higher Stage 2 provisions, re fl ecting rating migration of Russia - related exposure after the sovereign rating downgrade, and by additional clients on the watch list. The Stage 3 coverage ratio declined to 33.0% versus 33.4% in the previous quarter. The loan portfolio consists predominantly of asset - based and secured loans, including residential mortgages, project - and asset - based fi nance, and real estate fi nance with generally low loan - to - value ratios. ING Group: Stock of provisions 1) in € million 31 Mar. 2022 31 Dec. 2021 Change Stage 1 - 12 - month ECL 464 501 - 36 Stage 2 - Lifetime ECL not credit impaired 1,869 1,016 853 Stage 3 - Lifetime ECL credit impaired 3,714 3,847 - 133 Purchased credit impaired 5 4 1 Total 6,053 5,368 684 1) At the end of March 2022, the stock of provisions included provisions for loans and advances to central banks (€19 million), loans and advances to banks (€154 million), fi nancial assets at FVOCI (€48 million), securities at amortised cost (€20 million), provisions for loans and advances to customers (€5,778 million) and provisions for contingent liabilities (credit replacements) recorded under Provisions (€33 million). Market risk The average Value - at - Risk (VaR) for the trading portfolio increased to €10 million compared with €5 million in 4Q2021. ING Group: Consolidated VaR trading books in € million Minimum Maximum Average Quarter - end Foreign exchange 1 21 3 7 Equities 2 5 3 5 Interest rate 4 17 7 6 Credit spread 2 15 5 3 Diversi fi cation - 8 - 11 Total VaR 1) 5 22 10 10 1) The total VaR for the columns Minimum and Maximum cannot be calculated by taking the sum of the individual components since the observations for both the individual markets as well as for total VaR may occur on di ff erent dates. Non - fi nancial risk As previously disclosed, after our September 2018 settlement with Dutch authorities concerning Anti - Money Laundering (AML) matters, and in the context of signi fi cantly increased attention to the prevention of fi nancial economic crime, ING has experienced heightened scrutiny by authorities in various countries. The interactions with such regulatory and judicial authorities have included, and can be expected to continue to include, onsite visits, information requests, investigations and other enquiries. Such interactions, as well as ING’s internal assessments in connection with its global enhancement programme, have in some cases resulted in satisfactory outcomes. Some have also resulted in, and may continue to result in, fi ndings, or other conclusions which may require appropriate remedial actions by ING, or may have other consequences. We intend to continue to work in close cooperation with authorities as we work to improve our management of non - fi nancial risks.

10 ING Press Release 1Q2022 Segment Reporting: Retail Banking Risk Management ING is also aware, including as a result of media reports, that other parties may, among other things, seek to commence legal proceedings against ING in connection with the subject matter of the settlement.
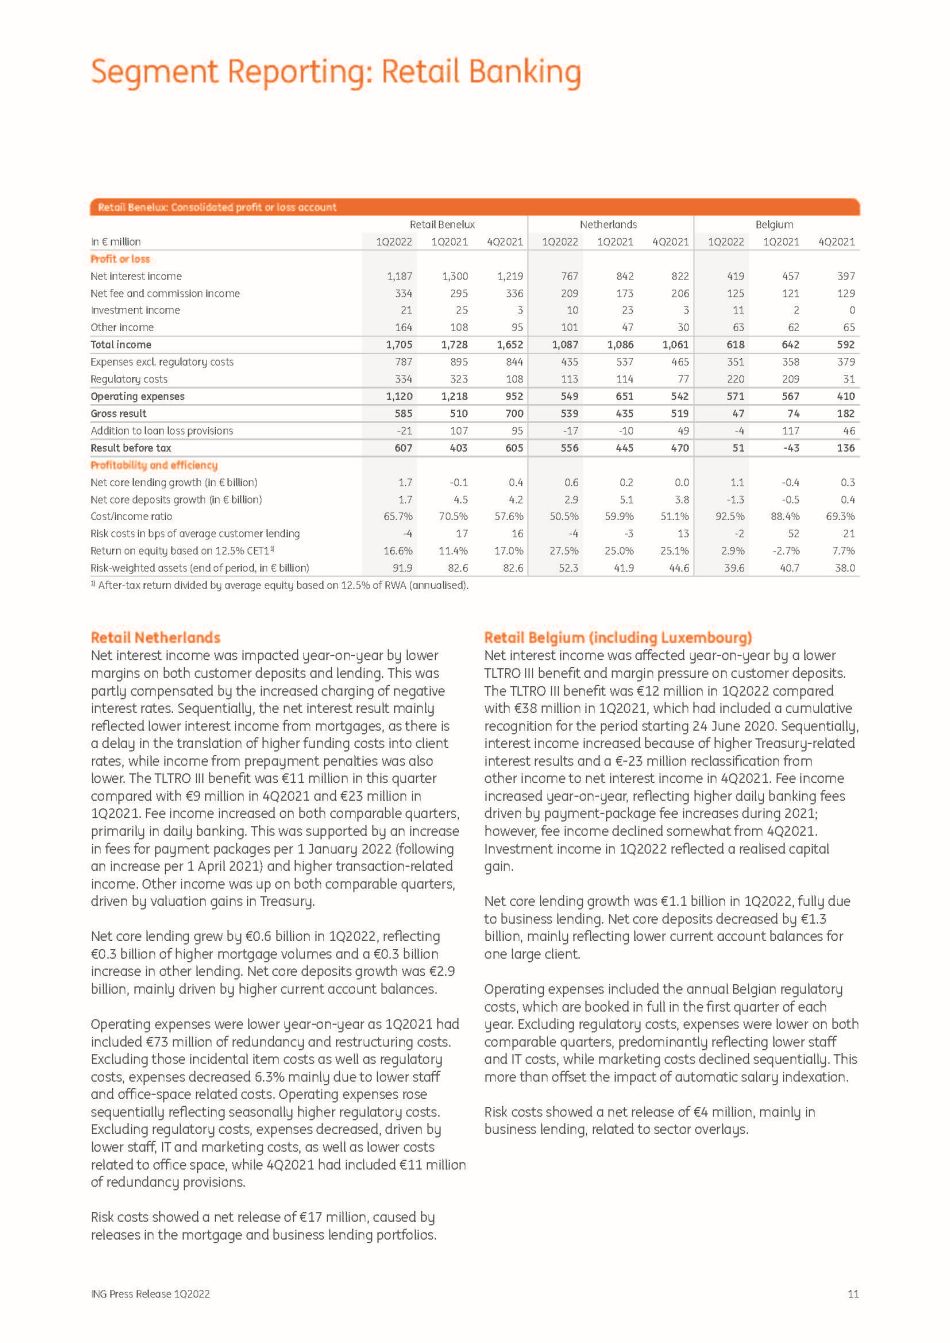
11 ING Press Release 1Q2022 Segment Reporting: Retail Banking Retail Benelux: Consolidated pro fi t or loss account In € million Retail Benelux 1Q2022 1Q2021 4Q2021 Netherlands Belgium 1Q2022 1Q2021 4Q2021 1Q2022 1Q2021 4Q2021 Profit or loss Net interest income 1,187 1,300 1,219 767 842 822 419 457 397 Net fee and commission income 334 295 336 209 173 206 125 121 129 Investment income 21 25 3 10 23 3 11 2 0 Other income 164 108 95 101 47 30 63 62 65 Total income 1,705 1,728 1,652 1,087 1,086 1,061 618 642 592 Expenses excl. regulatory costs 787 895 844 435 537 465 351 358 379 Regulatory costs 334 323 108 113 114 77 220 209 31 Operating expenses 1,120 1,218 952 549 651 542 571 567 410 Gross result 585 510 700 539 435 519 47 74 182 Addition to loan loss provisions - 21 107 95 - 17 - 10 49 - 4 117 46 Result before tax 607 403 605 556 445 470 51 - 43 136 Profitability and efficiency Net core lending growth (in € billion) 1.7 - 0.1 0.4 0.6 0.2 0.0 1.1 - 0.4 0.3 Net core deposits growth (in € billion) 1.7 4.5 4.2 2.9 5.1 3.8 - 1.3 - 0.5 0.4 Cost/income ratio 65.7% 70.5% 57.6% 50.5% 59.9% 51.1% 92.5% 88.4% 69.3% Risk costs in bps of average customer lending - 4 17 16 - 4 - 3 13 - 2 52 21 Return on equity based on 12.5% CET1 1) 16.6% 11.4% 17.0% 27.5% 25.0% 25.1% 2.9% - 2.7% 7.7% Risk - weighted assets (end of period, in € billion) 91.9 82.6 82.6 52.3 41.9 44.6 39.6 40.7 38.0 1) After - tax return divided by average equity based on 12.5% of RWA (annualised). Retail Netherlands Net interest income was impacted year - on - year by lower margins on both customer deposits and lending. This was partly compensated by the increased charging of negative interest rates. Sequentially, the net interest result mainly re fl ected lower interest income from mortgages, as there is a delay in the translation of higher funding costs into client rates, while income from prepayment penalties was also lower. The TLTRO III bene fi t was €11 million in this quarter compared with €9 million in 4Q2021 and €23 million in 1Q2021. Fee income increased on both comparable quarters, primarily in daily banking. This was supported by an increase in fees for payment packages per 1 January 2022 (following an increase per 1 April 2021) and higher transaction - related income. Other income was up on both comparable quarters, driven by valuation gains in Treasury. Net core lending grew by €0.6 billion in 1Q2022, re fl ecting €0.3 billion of higher mortgage volumes and a €0.3 billion increase in other lending. Net core deposits growth was €2.9 billion, mainly driven by higher current account balances. Operating expenses were lower year - on - year as 1Q2021 had included €73 million of redundancy and restructuring costs. Excluding those incidental item costs as well as regulatory costs, expenses decreased 6.3% mainly due to lower sta ff and o ffi ce - space related costs. Operating expenses rose sequentially re fl ecting seasonally higher regulatory costs. Excluding regulatory costs, expenses decreased, driven by lower sta ff , IT and marketing costs, as well as lower costs related to o ffi ce space, while 4Q2021 had included €11 million of redundancy provisions. Risk costs showed a net release of €17 million, caused by releases in the mortgage and business lending portfolios. Retail Belgium (including Luxembourg) Net interest income was a ff ected year - on - year by a lower TLTRO III bene fi t and margin pressure on customer deposits. The TLTRO III bene fi t was €12 million in 1Q2022 compared with €38 million in 1Q2021, which had included a cumulative recognition for the period starting 24 June 2020. Sequentially, interest income increased because of higher Treasury - related interest results and a € - 23 million reclassi fi cation from other income to net interest income in 4Q2021. Fee income increased year - on - year, re fl ecting higher daily banking fees driven by payment - package fee increases during 2021; however, fee income declined somewhat from 4Q2021. Investment income in 1Q2022 re fl ected a realised capital gain. Net core lending growth was €1.1 billion in 1Q2022, fully due to business lending. Net core deposits decreased by €1.3 billion, mainly re fl ecting lower current account balances for one large client. Operating expenses included the annual Belgian regulatory costs, which are booked in full in the fi rst quarter of each year. Excluding regulatory costs, expenses were lower on both comparable quarters, predominantly re fl ecting lower sta ff and IT costs, while marketing costs declined sequentially. This more than o ff set the impact of automatic salary indexation. Risk costs showed a net release of €4 million, mainly in business lending, related to sector overlays.

12 ING Press Release 1Q2022 Segment Reporting: Wholesale Banking Segment Reporting: Retail Banking Retail Germany (including Austria in 2021) Net interest income was supported by strong mortgage volume growth, which partly compensated for margin pressure on liabilities year - on - year. Sequentially, interest income increased, mainly re fl ecting higher liability income due to the introduction of negative interest rate charging for all clients with liability balances above €50,000 who gave consent. This o ff set the impact of lower margins on mortgages. Fee income decreased compared with 1Q2021, mainly in investment products after a record - high level in 1Q2021. Sequentially, fee income increased, predominantly due to a higher number of brokerage trades in investment products. Investment income in 4Q2021 had included €8 million for the partial reversal of the estimated loss related to the transfer of ING’s retail activities in Austria to bank99. Other income increased strongly versus both comparable quarters, mainly driven by exceptionally high Treasury - related revenues. Net core lending continued to grow and rose by €1.7 billion in 1Q2022, of which €1.6 billion was in mortgages. Net core deposits showed an out fl ow of €7.3 billion, primarily re fl ecting the impact of the introduction of negative interest rate charging to clients with liability balances above €50,000. Operating expenses increased year - on - year and sequentially, mainly attributable to higher regulatory costs. Risk costs were €22 million in 1Q2022 and primarily related to consumer lending. Retail Other Challengers & Growth Markets Higher net interest income in 1Q2022 was supported by increased lending volumes and better margins on liabilities, notably in Poland. Fee income was €139 million, which was higher than one year ago; the growth was driven by daily banking and insurance fees. Sequentially, fee income was lower, re fl ecting higher daily banking fees in the fourth quarter. Other income included a €150 million impairment on ING’s equity stake in TTB. Excluding this impairment, other income increased on both comparable quarters, mainly as a result of higher Treasury - related income. Net core lending growth was €2.3 billion in 1Q2022, mainly driven by mortgage growth in Australia and Spain, and business lending growth in Poland. Net customer deposits decreased by €1.4 billion, of which €1.7 billion was in France following the announced discontinuation of our retail activities in that market. Excluding incidental items and regulatory costs, expenses were lower on both comparable quarters. In 4Q2021, expenses included €155 million of incidental items, mainly consisting of impairments and restructuring provisions related to ING's exit of the French retail market. The fi rst quarter of 2021 had included €11 million of incidental items related to the closure of the retail activities in the Czech Republic. Risk costs were €47 million, mainly re fl ecting net additions in Poland and Spain. Retail Challengers & Growth Markets: Consolidated pro fi t or loss account In € million Retail Challengers & Growth Markets 1Q2022 1Q2021 4Q2021 Germany Other Challengers & Growth Markets 1Q2022 1Q2021 4Q2021 1Q2022 1Q2021 4Q2021 Profit or loss Net interest income 1,087 1,057 1,031 352 378 348 735 679 683 Net fee and commission income 275 278 269 136 148 125 139 130 144 Investment income 2 6 12 1 6 8 1 0 4 Other income - 21 62 88 62 15 29 - 83 47 59 Total income 1,344 1,403 1,400 552 548 510 792 855 890 Expenses excl. regulatory costs 752 780 926 258 256 263 495 524 663 Regulatory costs 144 117 100 46 33 32 99 84 67 Operating expenses 897 897 1,026 303 289 296 593 608 730 Gross result 447 505 374 249 259 214 198 247 160 Addition to loan loss provisions 70 85 35 22 3 7 47 82 27 Result before tax 377 420 339 226 255 207 151 165 132 Profitability and efficiency Net core lending growth (in € billion) 3.9 2.8 4.4 1.7 1.3 2.2 2.3 1.5 2.2 Net core deposits growth (in € billion) - 8.7 0.2 - 1.5 - 7.3 1.7 - 5.0 - 1.4 - 1.5 3.5 Cost/income ratio 66.7% 64.0% 73.3% 54.9% 52.8% 58.0% 75.0% 71.1% 82.0% Risk costs in bps of average customer lending 14 18 7 9 1 3 17 33 10 Return on equity based on 12.5% CET1 1) 10.9% 11.8% 9.6% 20.2% 18.3% 15.2% 5.2% 7.9% 6.1% Risk - weighted assets (end of period, in € billion) 76.5 78.5 77.8 28.7 29.8 29.4 47.8 48.7 48.4 1) After - tax return divided by average equity based on 12.5% of RWA (annualised).
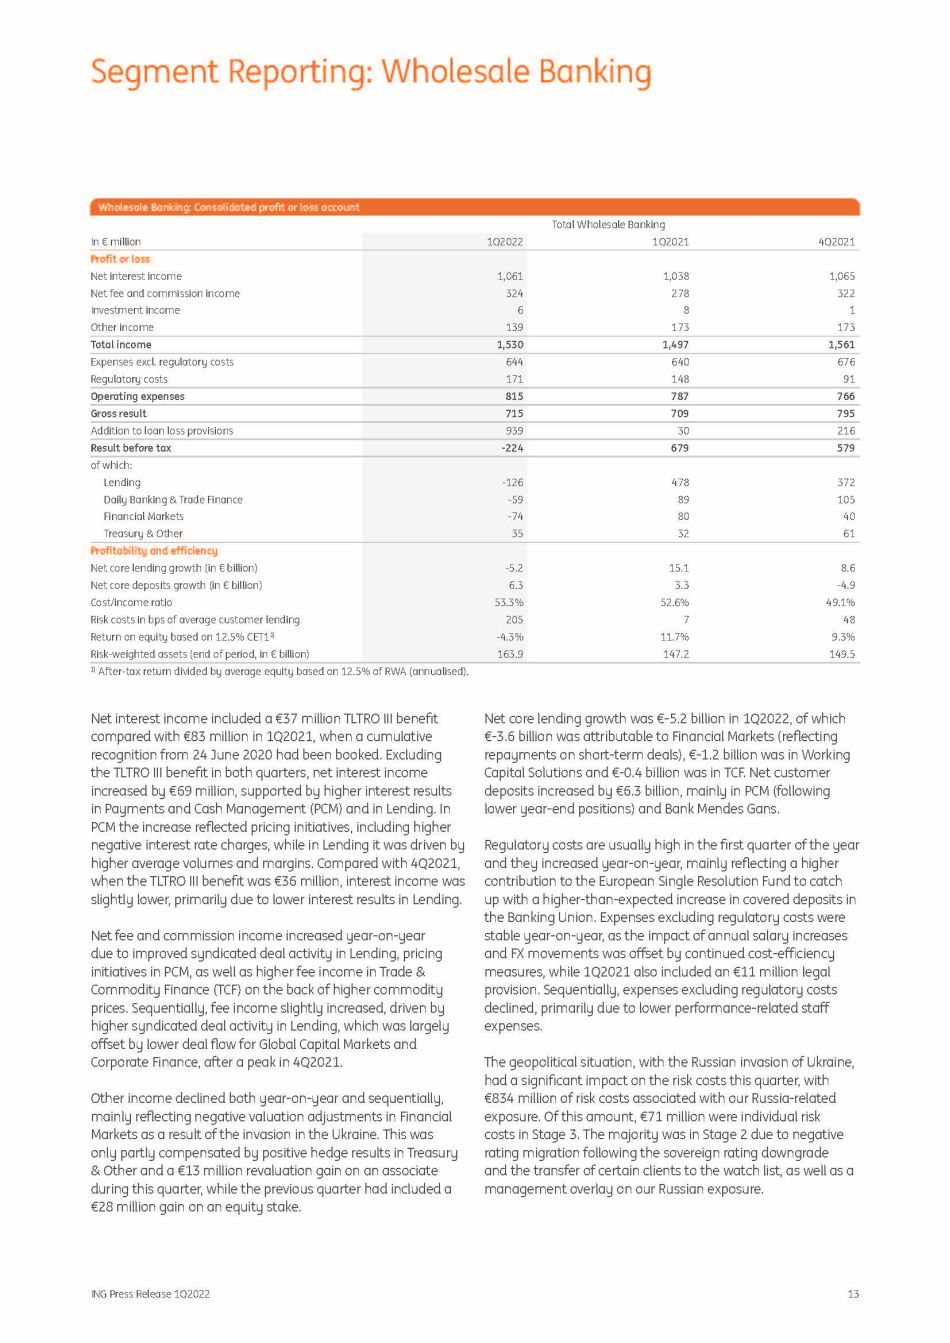
13 ING Press Release 1Q2022 Segment Reporting: Wholesale Banking Net interest income included a €37 million TLTRO III bene fi t compared with €83 million in 1Q2021, when a cumulative recognition from 24 June 2020 had been booked. Excluding the TLTRO III bene fi t in both quarters, net interest income increased by €69 million, supported by higher interest results in Payments and Cash Management (PCM) and in Lending. In PCM the increase re fl ected pricing initiatives, including higher negative interest rate charges, while in Lending it was driven by higher average volumes and margins. Compared with 4Q2021, when the TLTRO III bene fi t was €36 million, interest income was slightly lower, primarily due to lower interest results in Lending. Net fee and commission income increased year - on - year due to improved syndicated deal activity in Lending, pricing initiatives in PCM, as well as higher fee income in Trade & Commodity Finance (TCF) on the back of higher commodity prices. Sequentially, fee income slightly increased, driven by higher syndicated deal activity in Lending, which was largely o ff set by lower deal fl ow for Global Capital Markets and Corporate Finance, after a peak in 4Q2021. Other income declined both year - on - year and sequentially, mainly re fl ecting negative valuation adjustments in Financial Markets as a result of the invasion in the Ukraine. This was only partly compensated by positive hedge results in Treasury & Other and a €13 million revaluation gain on an associate during this quarter, while the previous quarter had included a €28 million gain on an equity stake. Net core lending growth was € - 5.2 billion in 1Q2022, of which € - 3.6 billion was attributable to Financial Markets (re fl ecting repayments on short - term deals), € - 1.2 billion was in Working Capital Solutions and € - 0.4 billion was in TCF. Net customer deposits increased by €6.3 billion, mainly in PCM (following lower year - end positions) and Bank Mendes Gans. Regulatory costs are usually high in the fi rst quarter of the year and they increased year - on - year, mainly re fl ecting a higher contribution to the European Single Resolution Fund to catch up with a higher - than - expected increase in covered deposits in the Banking Union. Expenses excluding regulatory costs were stable year - on - year, as the impact of annual salary increases and FX movements was o ff set by continued cost - e ffi ciency measures, while 1Q2021 also included an €11 million legal provision. Sequentially, expenses excluding regulatory costs declined, primarily due to lower performance - related sta ff expenses. The geopolitical situation, with the Russian invasion of Ukraine, had a signi fi cant impact on the risk costs this quarter, with €834 million of risk costs associated with our Russia - related exposure. Of this amount, €71 million were individual risk costs in Stage 3. The majority was in Stage 2 due to negative rating migration following the sovereign rating downgrade and the transfer of certain clients to the watch list, as well as a management overlay on our Russian exposure. In € million 1Q2022 1Q2021 4Q2021 Profit or loss Net interest income 1,061 1,038 1,065 Net fee and commission income 324 278 322 Investment income 6 8 1 Other income 139 173 173 Total income 1,530 1,497 1,561 Expenses excl. regulatory costs 644 640 676 Regulatory costs 171 148 91 Operating expenses 815 787 766 Gross result 715 709 795 Addition to loan loss provisions 939 30 216 Result before tax - 224 679 579 of which: Lending - 126 478 372 Daily Banking & Trade Finance - 59 89 105 Financial Markets - 74 80 40 Treasury & Other 35 32 61 Profitability and efficiency Net core lending growth (in € billion) - 5.2 15.1 8.6 Net core deposits growth (in € billion) 6.3 3.3 - 4.9 Cost/income ratio 53.3% 52.6% 49.1% Risk costs in bps of average customer lending 205 7 48 Return on equity based on 12.5% CET1 1) - 4.3% 11.7% 9.3% Risk - weighted assets (end of period, in € billion) 163.9 147.2 149.5 Wholesale Banking: Consolidated pro fi t or loss account Total Wholesale Banking 1) After - tax return divided by average equity based on 12.5% of RWA (annualised).

14 ING Press Release 1Q2022 Segment Reporting: Corporate Line Segment Reporting: Wholesale Banking The 1Q2022 result before tax of Lending was impacted by strongly elevated risk costs. The TLTRO III bene fi t was €22 million in 1Q2022 compared with €43 million in 1Q2021 and €20 million in 4Q2021. Excluding the TLTRO III bene fi t, income increased year - on - year, driven by higher fee income related to increased syndicated deal activity and higher average volumes and interest margins. Sequentially, Lending income was slightly down. Expenses excluding regulatory costs were at the same level as in the previous quarter, but increased year - on - year, partly due to higher sta ff expenses. The quarterly result before tax of Daily Banking & Trade Finance was a ff ected by strongly elevated risk costs. This was partly compensated by higher income for PCM (re fl ecting pricing initiatives) and TCF (on the back of higher average commodity prices and improved margins) as well as a €13 million revaluation gain on an associate. The TLTRO III bene fi t was €7 million in 1Q2022 compared with €7 million in 1Q2021 and €8 million in 4Q2021. Expenses excluding regulatory costs decreased both year - on - year and sequentially. Income of Financial Markets was impacted by negative valuation adjustments following the market turmoil that was driven by macroeconomic and geopolitical concerns. This was partly o ff set by higher trading results, which were supported by high market volatility in the second half of the quarter. The fi rst quarter of 2022 included a €7 million TLTRO III bene fi t compared with €29 million in 1Q2021 and €8 million in 4Q2021. Expenses excluding regulatory costs were stable year - on - year but declined compared with the previous quarter, which had higher performance - related sta ff costs. Financial Markets recorded €70 million of risk costs in 1Q2022, driven by Russia - related exposures. The quarterly result before tax of Treasury & Other increased year - on - year, despite higher risk costs. Income was up by €29 million on 1Q2021. This re fl ected mark - to - market gains from hedge ine ff ectiveness and credit default swap positions, which were partly o ff set by a revaluation loss on the investment portfolio. Compared with the prior quarter, the increase in income was limited to €10 million, as 4Q2021 had included a €28 million gain on an equity stake and higher fee income from Corporate Finance deals.

15 ING Press Release 1Q2022 Segment Reporting: Corporate Line Total income in the Corporate Line was €21 million and included a €18 million funding rate bene fi t related to TLTRO III versus a €79 million bene fi t in 1Q2021, when a cumulative recognition from 24 June 2020 onwards was booked. The remaining bene fi t from TLTRO III was recorded as net interest income in the respective business segments. Year - on - year, total income decreased, entirely due to the aforementioned TLTRO III funding rate bene fi t. This was partly o ff set by lower legacy funding costs resulting from the replacement of short - term funding with long - term funding during 2012 and 2013. Operating expenses in 1Q2022 were stable compared with 1Q2021. Sequentially, operating expenses decreased by €89 million, almost entirely due to an incidental 50% increase in the Dutch bank tax in 4Q2021, which resulted in €87 million of additional regulatory costs that were not allocated to the business segments. Corporate Line: Consolidated pro fi t or loss account In € million 1Q2022 1Q2021 4Q2021 Profit or loss Net interest income 80 118 59 Net fee and commission income 0 4 - 2 Investment income 0 0 0 Other income - 60 - 47 - 47 Total income 21 75 10 Expenses excl. regulatory costs 113 113 115 Regulatory costs 0 0 87 Operating expenses 113 113 202 Gross result - 92 - 39 - 192 Addition to loan loss provisions 0 0 0 Result before tax - 92 - 39 - 192 of which: Income on capital surplus - 10 3 - 8 Foreign currency ratio hedging 97 81 68 Other Group Treasury - 68 - 13 - 55 Group Treasury 19 71 5 Other Corporate Line - 111 - 109 - 197
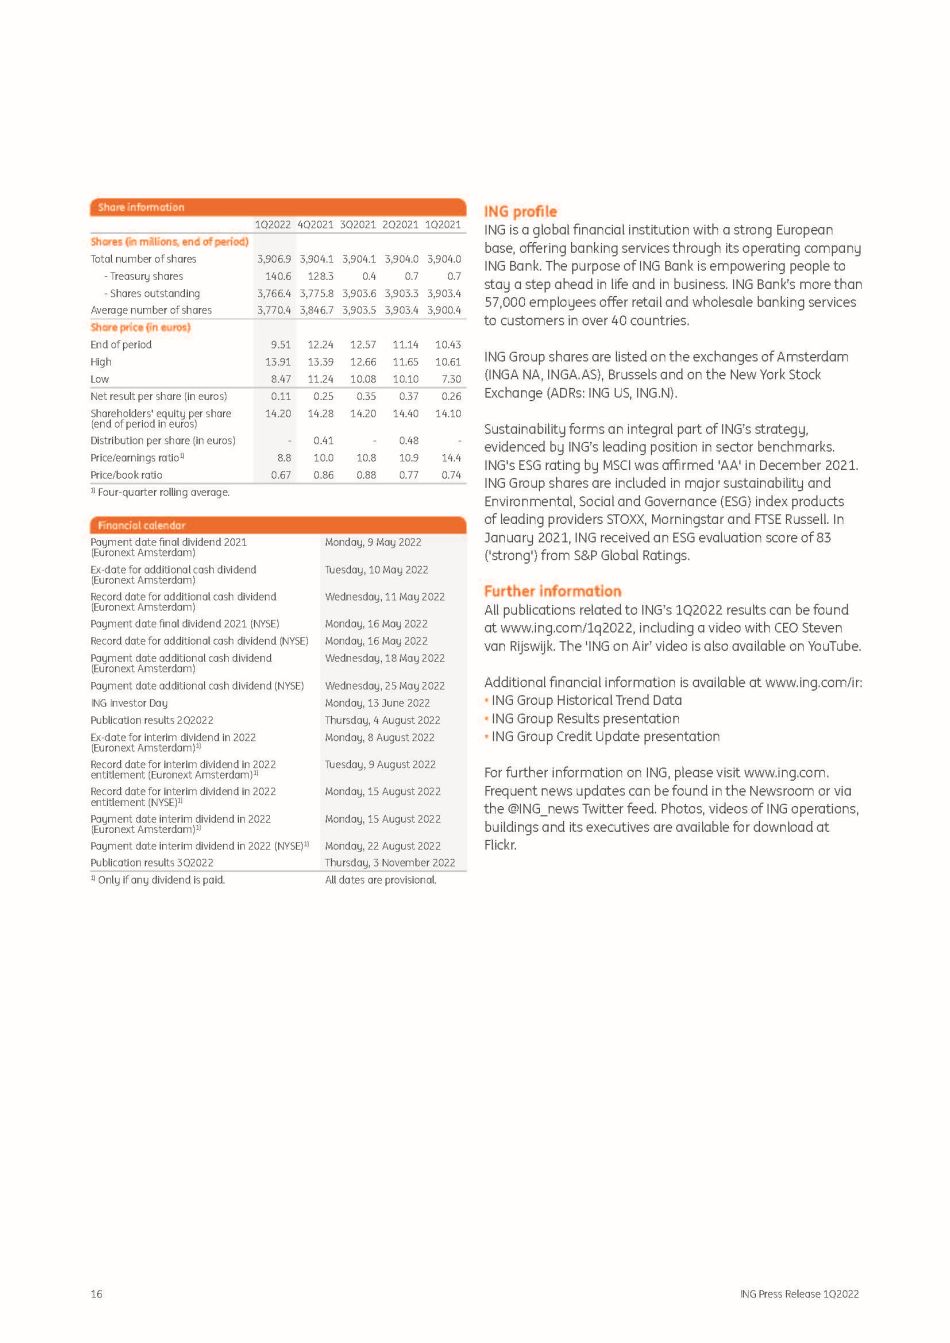
16 ING Press Release 1Q2022 ING pro fi le ING is a global fi nancial institution with a strong European base, o ff ering banking services through its operating company ING Bank. The purpose of ING Bank is empowering people to stay a step ahead in life and in business. ING Bank’s more than 57,000 employees o ff er retail and wholesale banking services to customers in over 40 countries. ING Group shares are listed on the exchanges of Amsterdam (INGA NA, INGA.AS), Brussels and on the New York Stock Exchange (ADRs: ING US, ING.N). Sustainability forms an integral part of ING’s strategy, evidenced by ING’s leading position in sector benchmarks. ING's ESG rating by MSCI was a ffi rmed 'AA' in December 2021. ING Group shares are included in major sustainability and Environmental, Social and Governance (ESG) index products of leading providers STOXX, Morningstar and FTSE Russell. In January 2021, ING received an ESG evaluation score of 83 ('strong') from S&P Global Ratings. Further information All publications related to ING’s 1Q2022 results can be found at www.ing.com/1q2022, including a video with CEO Steven van Rijswijk. The 'ING on Air’ video is also available on YouTube. Additional fi nancial information is available at www.ing.com/ir: • ING Group Historical Trend Data • ING Group Results presentation • ING Group Credit Update presentation For further information on ING, please visit www.ing.com. Frequent news updates can be found in the Newsroom or via the @ING_news Twitter feed. Photos, videos of ING operations, buildings and its executives are available for download at Flickr. Share information 1Q2022 4Q2021 3Q2021 2Q2021 1Q2021 Shares (in millions, end of period) Total number of shares 3,906.9 3,904.1 3,904.1 3,904.0 3,904.0 - Treasury shares 140.6 128.3 0.4 0.7 0.7 - Shares outstanding 3,766.4 3,775.8 3,903.6 3,903.3 3,903.4 Average number of shares 3,770.4 3,846.7 3,903.5 3,903.4 3,900.4 Share price (in euros) End of period 9.51 12.24 12.57 11.14 10.43 High 13.91 13.39 12.66 11.65 10.61 Low 8.47 11.24 10.08 10.10 7.30 Net result per share (in euros) 0.11 0.25 0.35 0.37 0.26 Shareholders' equity per share (end of period in euros) 14.20 14.28 14.20 14.40 14.10 Distribution per share (in euros) - 0.41 - 0.48 - Price/earnings ratio 1) 8.8 10.0 10.8 10.9 14.4 Price/book ratio 0.67 0.86 0.88 0.77 0.74 1) Four - quarter rolling average. Financial calendar Payment date fi nal dividend 2021 (Euronext Amsterdam) Ex - date for additional cash dividend (Euronext Amsterdam) Record date for additional cash dividend (Euronext Amsterdam) Payment date fi nal dividend 2021 (NYSE) Record date for additional cash dividend (NYSE) Payment date additional cash dividend (Euronext Amsterdam) Payment date additional cash dividend (NYSE) ING Investor Day Publication results 2Q2022 Ex - date for interim dividend in 2022 (Euronext Amsterdam) 1) Record date for interim dividend in 2022 entitlement (Euronext Amsterdam) 1) Record date for interim dividend in 2022 entitlement (NYSE) 1) Payment date interim dividend in 2022 (Euronext Amsterdam) 1) Payment date interim dividend in 2022 (NYSE) 1) Publication results 3Q2022 Monday, 9 May 2022 Tuesday, 10 May 2022 Wednesday, 11 May 2022 Monday, 16 May 2022 Monday, 16 May 2022 Wednesday, 18 May 2022 Wednesday, 25 May 2022 Monday, 13 June 2022 Thursday, 4 August 2022 Monday, 8 August 2022 Tuesday, 9 August 2022 Monday, 15 August 2022 Monday, 15 August 2022 Monday, 22 August 2022 Thursday, 3 November 2022 1) Only if any dividend is paid. All dates are provisional.

17 Important legal information Elements of this press release contain or may contain information about ING Groep N.V. and / or ING Bank N.V. within the meaning of Article 7(1) to (4) of EU Regulation No 596/2014. ING Group’s annual accounts are prepared in accordance with International Financial Reporting Standards as adopted by the European Union (‘IFRS - EU’). In preparing the fi nancial information in this document, except as described otherwise, the same accounting principles are applied as in the 2021 ING Group consolidated annual accounts. All fi gures in this document are unaudited. Small di ff erences are possible in the tables due to rounding. Certain of the statements contained herein are not historical facts, including, without limitation, certain statements made of future expectations and other forward - looking statements that are based on management’s current views and assumptions and involve known and unknown risks and uncertainties that could cause actual results, performance or events to di ff er materially from those expressed or implied in such statements. Actual results, performance or events may di ff er materially from those in such statements due to a number of factors, including, without limitation: (1) changes in general economic conditions and customer behaviour, in particular economic conditions in ING’s core markets, including changes a ff ecting currency exchange rates and the regional and global economic impact of the invasion of Russia into Ukraine and related international response measures (2) e ff ects of the Covid - 19 pandemic and related response measures, including lockdowns and travel restrictions, on economic conditions in countries in which ING operates, on ING’s business and operations and on ING’s employees, customers and counterparties (3) changes a ff ecting interest rate levels (4) any default of a major market participant and related market disruption (5) changes in performance of fi nancial markets, including in Europe and developing markets (6) fi scal uncertainty in Europe and the United States (7) discontinuation of or changes in ‘benchmark’ indices (8) in fl ation and de fl ation in our principal markets (9) changes in conditions in the credit and capital markets generally, including changes in borrower and counterparty creditworthiness (10) failures of banks falling under the scope of state compensation schemes (11) non - compliance with or changes in laws and regulations, including those concerning fi nancial services, fi nancial economic crimes and tax laws, and the interpretation and application thereof (12) geopolitical risks, political instabilities and policies and actions of governmental and regulatory authorities, including in connection with the invasion of Russia into Ukraine and related international response measures (13) legal and regulatory risks in certain countries with less developed legal and regulatory frameworks (14) prudential supervision and regulations, including in relation to stress tests and regulatory restrictions on dividends and distributions (also among members of the group) (15) regulatory consequences of the United Kingdom’s withdrawal from the European Union, including authorizations and equivalence decisions (16) ING’s ability to meet minimum capital and other prudential regulatory requirements (17) changes in regulation of US commodities and derivatives businesses of ING and its customers (18) application of bank recovery and resolution regimes, including write - down and conversion powers in relation to our securities (19) outcome of current and future litigation, enforcement proceedings, investigations or other regulatory actions, including claims by customers or stakeholders who feel misled or treated unfairly, and other conduct issues (20) changes in tax laws and regulations and risks of non - compliance or investigation in connection with tax laws, including FATCA (21) operational and IT risks, such as system disruptions or failures, breaches of security, cyber - attacks, human error, changes in operational practices or inadequate controls including in respect of third parties with which we do business (22) risks and challenges related to cybercrime including the e ff ects of cyberattacks and changes in legislation and regulation related to cybersecurity and data privacy (23) changes in general competitive factors, including ability to increase or maintain market share (24) inability to protect our intellectual property and infringement claims by third parties (25) inability of counterparties to meet fi nancial obligations or ability to enforce rights against such counterparties (26) changes in credit ratings (27) business, operational, regulatory, reputation, transition and other risks and challenges in connection with climate change and ESG - related matters (28) inability to attract and retain key personnel (29) future liabilities under de fi ned bene fi t retirement plans (30) failure to manage business risks, including in connection with use of models, use of derivatives, or maintaining appropriate policies and guidelines (31) changes in capital and credit markets, including interbank funding, as well as customer deposits, which provide the liquidity and capital required to fund our operations, and (32) the other risks and uncertainties detailed in the most recent annual report of ING Groep N.V. (including the Risk Factors contained therein) and ING’s more recent disclosures, including press releases, which are available on www.ING.com. This document may contain inactive textual addresses to internet websites operated by us and third parties. Reference to such websites is made for information purposes only, and information found at such websites is not incorporated by reference into this document. ING does not make any representation or warranty with respect to the accuracy or completeness of, or take any responsibility for, any information found at any websites operated by third parties. ING speci fi cally disclaims any liability with respect to any information found at websites operated by third parties. ING cannot guarantee that websites operated by third parties remain available following the publication of this document, or that any information found at such websites will not change following the fi ling of this document. Many of those factors are beyond ING’s control. Any forward looking statements made by or on behalf of ING speak only as of the date they are made, and ING assumes no obligation to publicly update or revise any forward - looking statements, whether as a result of new information or for any other reason . This document does not constitute an o ff er to sell, or a solicitation of an o ff er to purchase, any securities in the United States or any other jurisdiction . ING Press Release 1 Q 2022
Serious News for Serious Traders! Try StreetInsider.com Premium Free!
You May Also Be Interested In
- Unleashing the Meme Revolution: CashPepe Empowers Creators in the Digital Age
- Commissioner Lara Proposes Minimal Oversight, Secrecy of Black-Box Wildfire Insurance Models, Says Consumer Watchdog
- Popilush Introduces Bluetag COOLING Collection with Body-Cooling Technology
Create E-mail Alert Related Categories
SEC FilingsSign up for StreetInsider Free!
Receive full access to all new and archived articles, unlimited portfolio tracking, e-mail alerts, custom newswires and RSS feeds - and more!
