

Form 6-K IAMGOLD CORP For: Nov 05
 Tweet
Tweet Share
ShareFORM 6-K
UNITED STATES
SECURITIES AND EXCHANGE COMMISSION
Washington, D.C.
20549
Report of Foreign Private Issuer
Pursuant to Rule 13a-16 or 15d-16
of the
Securities Exchange Act of 1934
Date: November 5, 2018
Commission File Number 001-31528
IAMGOLD
Corporation
(Translation of registrant's name into
English)
401 Bay Street Suite 3200, PO Box 153
Toronto,
Ontario, Canada M5H 2Y4
Tel: (416) 360-4710
(Address of
principal executive offices)
Indicate by check mark whether the registrant files or will file annual reports under cover Form 20-F or Form 40-F.
| Form 20- F [ ] | Form 40-F [X] |
Indicate by check mark if the registrant is submitting the Form 6-K in paper as permitted by Regulation S-T Rule 101(b)(1): ____
Note: Regulation S-T Rule 101(b)(1) only permits the submission in paper of a Form 6-K if submitted solely to provide an attached annual report to security holders.
Indicate by check mark if the registrant is submitting the Form 6-K in paper as permitted by Regulation S-T Rule 101(b)(7): ____
Note: Regulation S-T Rule 101(b)(7) only permits the submission in paper of a Form 6-K if submitted to furnish a report or other document that the registrant foreign private issuer must furnish and make public under the laws of the jurisdiction in which the registrant is incorporated, domiciled or legally organized (the registrant’s “home country”), or under the rules of the home country exchange on which the registrant’s securities are traded, as long as the report or other document is not a press release, is not required to be and has not been distributed to the registrant’s security holders, and, if discussing a material event, has already been the subject of a Form 6-K submission or other Commission filing on EDGAR.
Indicate by check mark whether by furnishing the information contained in this Form, the registrant is also thereby furnishing the information to the Commission pursuant to Rule 12g3-2(b) under the Securities Exchange Act of 1934.
Yes [ ] No [X]
If “Yes” is marked, indicate below the file number assigned to the registrant in connection with Rule 12g3-2(b): 82-_
Description of Exhibit
| Exhibit | Description of Exhibit |
| 99.1 | NI 43-101 Technical Report on the Rosebel Gold Mine, Brokopondo District, Suriname (effective September 23, 2018) dated November 5, 2018 |
-2-
Signatures
Pursuant to the requirements of the Securities Exchange Act of 1934, the registrant has duly caused this report to be signed on its behalf by the undersigned, thereunto duly authorized.
| IAMGOLD CORPORATION | ||
| Date: November 5, 2018 | By: | /s/ Tim Bradburn |
| Vice President, Legal and Corporate Secretary | ||
-3-
![]()
| IAMGOLD CORPORATION |
TECHNICAL REPORT ON THE
ROSEBEL GOLD MINE,
SURINAME
NI 43-101 Report
Qualified Persons:
Michel Payeur, Eng., M.A.Sc.
Raphaël Dutaut, P.Geo.
Adam Doucette, P.Eng.
Stéphane Rivard, P.Eng.
Dominic Chartier, P.Geo.
Oy Leuangthong, PhD, P.Eng.
| November 5, 2018 |
| Effective Date: September 23, 2018 |
| IAMGOLD Corporation 401 Bay Street, Suite 3200, Toronto, Ontario M5H 2Y4 I T +1 416-360-4710 I www.iamgold.com |
TABLE OF CONTENTS
| PAGE | |||
| 1 | SUMMARY | 1-1 | |
| 1.1 | Executive Summary | 1-1 | |
| 1.2 | Technical Summary | 1-6 | |
| 2 | INTRODUCTION | 2-1 | |
| 2.1 | Sources of Information | 2-1 | |
| 2.2 | Effective Dates | 2-3 | |
| 2.3 | List of Abbreviations | 2-4 | |
| 3 | RELIANCE ON OTHER EXPERTS | 3-1 | |
| 4 | PROPERTY DESCRIPTION AND LOCATION | 4-1 | |
| 4.1 | RGM Property | 4-1 | |
| 4.2 | Saramacca Property | 4-7 | |
| 4.3 | Discussion | 4-11 | |
| 5 | ACCESSIBILITY, CLIMATE, LOCAL RESOURCES, INFRASTRUCTURE AND PHYSIOGRAPHY | 5-1 | |
| 5.1 | Topography, Elevation, and Vegetation | 5-1 | |
| 5.2 | Accessibility | 5-1 | |
| 5.3 | Climate and Length of Operating Season | 5-2 | |
| 5.4 | Surface Area and Physical Resources | 5-3 | |
| 6 | HISTORY | 6-1 | |
| 6.1 | RGM - Ownership, Exploration, and Development History | 6-1 | |
| 6.2 | Saramacca – Ownership, Exploration, and Development History | 6-6 | |
| 7 | GEOLOGICAL SETTING AND MINERALIZATION | 7-1 | |
| 7.1 | Regional Geology | 7-1 | |
| 7.2 | RGM Concession | 7-3 | |
| 7.3 | Saramacca Concession | 7-7 | |
| 8 | DEPOSIT TYPES | 8-1 | |
| 9 | EXPLORATION | 9-1 | |
| 9.1 | RGM Concession, Exploration Program 2017-2018 | 9-1 | |
| 9.2 | Saramacca Concession | 9-3 | |
| 9.3 | Regional Exploration | 9-6 | |
| 10 | DRILLING | 10- 1 | |
| 10.1 | Introduction | 10- 1 | |
| 10.2 | Saramacca Concession Drilling | 10-5 | |
| 11 | SAMPLE PREPARATION, ANALYSES AND SECURITY | 11-1 | |
| 11.1 | RGM Concession | 11-1 | |
| 11.2 | Saramacca Concession | 11-6 | |
| 12 | DATA VERIFICATION | 12-1 | |
| IAMGOLD Corporation - Rosebel Gold Mine | |
| Technical Report NI 43- 101 – November 5, 2018 | Page i |
| 12.1 | RGM Concession Data Verification | 12-1 | |
| 12.2 | Saramacca Concession Data Verification | 12-2 | |
| 13 | MINERAL PROCESSING AND METALLURGICAL TESTING | 13-1 | |
| 13.1 | RGM Metallurgical Testing | 13-1 | |
| 13.2 | Saramacca Metallurgical Testing | 13-15 | |
| 14 | MINERAL RESOURCE ESTIMATE | 14-1 | |
| 14.1 | Summary | 14-1 | |
| 14.2 | RGM Concession | 14-2 | |
| 14.3 | Saramacca Concession | 14-22 | |
| 15 | MINERAL RESERVE ESTIMATES | 15-1 | |
| 15.1 | Summary | 15-1 | |
| 15.2 | Resource Models | 15-2 | |
| 15.3 | Dilution | 15-2 | |
| 15.4 | Mining Losses | 15-3 | |
| 15.5 | Mine Optimization Methodology | 15-3 | |
| 15.6 | Cut-Off Grade | 15-4 | |
| 15.7 | Pit Slope Designs | 15-7 | |
| 15.8 | Mine Plan | 15-10 | |
| 15.9 | Design Summary | 15-25 | |
| 15.10 | Stockpiles | 15-26 | |
| 15.11 | Mineral Reserves | 15-26 | |
| 16 | MINING METHODS | 16-1 | |
| 16.1 | Saramacca Mining Fleet | 16-1 | |
| 16.2 | RGM Mining Fleet | 16-1 | |
| 16.3 | Production Drilling | 16-2 | |
| 16.4 | Mine Operations | 16-3 | |
| 16.5 | Life of Mine Production Schedule | 16-8 | |
| 17 | RECOVERY METHODS | 17-1 | |
| 17.1 | Overview of the Existing Processing Plant | 17-2 | |
| 17.2 | Conclusion | 17-7 | |
| 17.3 | Integration of Saramacca into the Existing Processing Plant | 17-8 | |
| 18 | PROJECT INFRASTRUCTURE | 18-1 | |
| 18.1 | RGM Site | 18-1 | |
| 18.2 | Saramacca Site | 18-10 | |
| 18.3 | Tailings Storage Facility | 18-11 | |
| 19 | MARKET STUDIES AND CONTRACTS | 19-1 | |
| 19.1 | Markets | 19-1 | |
| 19.2 | Contracts | 19-1 | |
| 20 | ENVIRONMENTAL STUDIES, PERMITTING, AND SOCIAL OR COMMUNITY IMPACT | 20-1 | |
| 20.1 | Current Status | 20-1 | |
| 20.2 | Future Permitting | 20-2 | |
| IAMGOLD Corporation - Rosebel Gold Mine | |
| Technical Report NI 43- 101 – November 5, 2018 | Page ii |
| 20.3 | Environmental and Socio-Economic Studies | 20-4 | |
| 20.4 | Social Environment | 20-5 | |
| 20.5 | Management Plans and Controls | 20-8 | |
| 20.6 | Waste and Tailings Disposal, Site Monitoring, and Water Management | 20-11 | |
| 20.7 | Mine Closure and Reclamation Plan | 20-13 | |
| 21 | CAPITAL AND OPERATING COSTS | 21-1 | |
| 21.1 | Capital Costs | 21-1 | |
| 21.2 | Operating Costs | 21-6 | |
| 22 | ECONOMIC ANALYSIS | 22-1 | |
| 23 | ADJACENT PROPERTIES | 23-1 | |
| 24 | OTHER RELEVANT DATA AND INFORMATION | 24-1 | |
| 25 | INTERPRETATION AND CONCLUSIONS | 25-1 | |
| 26 | RECOMMENDATIONS | 26-1 | |
| 27 | REFERENCES | 27-1 | |
| 28 | DATE AND SIGNATURE PAGE | 28-1 | |
| 29 | CERTIFICATE OF QUALIFIED PERSON | 29-1 | |
| APPENDIX A | A-1 | ||
| APPENDIX B | B-1 | ||
| APPENDIX C | C-1 | ||
LIST OF TABLES
| PAGE | ||
| Table 1-1 | Consolidated Mineral Resource Statement - Rosebel Gold Mine, Including Saramacca Gold Deposit | 1-2 |
| Table 1-2 | Consolidated Mineral Reserve Statement – Rosebel Gold Mine, Including Saramacca Gold Deposit | 1-3 |
| Table 1-3 | Exploration Activities on the Rosebel Concession - Past Three Years | 1-11 |
| Table 1-4 | Exploration Activities on the Saramacca Concession Since 2002 | 1-11 |
| Table 6-1 | Past Production | 6-5 |
| Table 6-2 | Previous Mineral Resource Statement for Saramacca Property, SRK Consulting (Canada) Inc., Effective August 28, 2017 | 6-8 |
| Table 9-1 | Summary of Exploration Work Completed on the RGM Concession | 9-2 |
| Table 9-2 | Summary of Exploration Work Completed by Golden Star and Newmont at the Saramacca Gold Project | 9-3 |
| Table 9-3 | Main Exploration Activity Statistics per Period of Activity | 9-14 |
| Table 9-4 | Statistics of Brokolonko Concession Exploration Activity by IAMGOLD-RGM . | 9-15 |
| Table 9-5 | Statistics of Exploration Activity by IAMGOLD-RGM on the Saramacca Concession Outside of the Saramacca Development Area | 9-16 |
| Table 10-1 | 2004 – 2018 RGM Diamond Drilling and Reverse Circulation Drilling | 10-1 |
| Table 10-2 | Statistics of Drilling Conducted on the Saramacca Gold Project to May 2018 | 10-5 |
| IAMGOLD Corporation - Rosebel Gold Mine | |
| Technical Report NI 43- 101 – November 5, 2018 | Page iii |
| Table 10-3 | Summary of Drilling Performed by IAMGOLD-RGM between July 2017 and May 2018 | 10-8 |
| Table 11-1 | Pulverize and Leach Standard Reference Material Summary 2017 | 11-5 |
| Table 11-2 | Standard Procedure for Quality Control Sample Insertion Rates, Saramacca Project | 11-9 |
| Table 11-3 | Summary of Certified Reference Materials used by IAMGOLD-RGM from July 2017 to April 2018 | 11-10 |
| Table 12-1 | Summary of Analytical Quality Control Data Produced By IAMGOLD-RGM on the Saramacca Gold Project (July 2017 – April 2018) | 12-5 |
| Table 13-1 | Optimization Metallurgical Test Work Performed | 13-2 |
| Table 13-2 | Average Mineral Abundance by Rock Type | 13-5 |
| Table 13-3 | Overall Grindability Statistics | 13-7 |
| Table 13-4 | Average Grindability Results per Rock Type | 13-8 |
| Table 13-5 | Axb and Bond Work Index Per Pit in Function of the Type of Ore | 13-8 |
| Table 13-6 | Cyanidation Test Results (Whole Ore Leach)* | 13-12 |
| Table 13-7 | Cyanide Consumption Data | 13-13 |
| Table 13-8 | Assumed Recoveries Per Rock Type and Pit | 13-14 |
| Table 13-9 | Scoping Study Recoveries per Rock Type | 13-15 |
| Table 13-10 | Metallurgical Test Plan | 13-17 |
| Table 13-11 | CM Head Assays | 13-19 |
| Table 13-12 | VT Head Assays | 13-20 |
| Table 13-13 | Composites Head Assays | 13-21 |
| Table 13-14 | Composite Tails MineraLogy | 13-21 |
| Table 13-15 | Summary of SMC and Bond Comminution Test Results | 13-25 |
| Table 13-16 | Summary of Comminution Test Results for Composites Samples | 13-25 |
| Table 13-17 | Comparison of Saramacca and Rosebel Comminution Data for Fresh Rock | 13-27 |
| Table 13-18 | Gravity Test Results | 13-28 |
| Table 13-19 | Bulk Gravity Test Results | 13-28 |
| Table 13-20 | Leaching Test Conditions | 13-29 |
| Table 13-21 | Whole Ore Leach Average Test Results | 13-29 |
| Table 13-22 | Size by Size Analysis of Gold in Cyanidation Tails of Whole Ore Leach | 13-31 |
| Table 13-23 | Gold Recovery in Fine Ground Ores | 13-32 |
| Table 13-24 | Comparison of COREM and SGS Lakefield Leach Results | 13-33 |
| Table 13-25 | Gold Recovery in STR Leaching and Bottle Roll Comparison | 13-34 |
| Table 13-26 | Flotation Flowsheet Summary | 13-35 |
| Table 13-27 | Overall Recovery by Rock Type for Saramacca | 13-36 |
| Table 13-28 | Comparison of Main Design Criteria for Saramacca vs RGM | 13-39 |
| Table 14-1 | Consolidated Mineral Resource Statement - Rosebel Gold Mine, Including Saramacca Gold Deposit | 14-1 |
| Table 14-2 | Drill Hole Data Collection Used for Resources Estimation | 14-3 |
| Table 14-3 | RGM Resources – Bulk Density Data | 14-6 |
| Table 14-4 | Grade Control Reverse Circulation Drilling - Assays Statistics | 14-7 |
| Table 14-5 | Diamond Drill Hole and exploration Reverse Circulation Drilling - Assay Statistics | 14-8 |
| Table 14-6 | Block Models Properties | 14-9 |
| Table 14-7 | Detailed Block Model Parameters. | 14-10 |
| Table 14-8 | Estimation Parameters Used during Interpolation | 14-12 |
| Table 14-9 | RGM Measured, Indicated, and Inferred MIneral Resource Estimation as of September 1, 2018 | 14-18 |
| Table 14-10 | RGM Previous Mineral Resource Estimates | 14-22 |
| IAMGOLD Corporation - Rosebel Gold Mine | |
| Technical Report NI 43- 101 – November 5, 2018 | Page iv |
| Table 14-11 | Drilling Database for Saramacca Gold Project | 14-25 |
| Table 14-12 | Mineral Resource Domains with Rock Codes | 14-31 |
| Table 14-13 | Assay Statistics for Saramacca Gold Project | 14-33 |
| Table 14-14 | Uncapped and Capped Composite Statistics | 14-34 |
| Table 14-15 | Cap Values for Specific Gravity | 14-36 |
| Table 14-16 | Gold Variograms by Domain | 14-36 |
| Table 14-17 | Saramacca Gold Project GEMS Block Model Definition | 14-37 |
| Table 14-18 | Estimation Parameters for Gold and Specific Gravity (last row) | 14-40 |
| Table 14-19 | Classified Mineral Resources by Weathering Zone*, Saramacca Gold Project, SRK Consulting (Canada) Inc., September 13, 2018 | 14-47 |
| Table 14-20 | Global Block Model Quantity and Grade Estimates* at Various Cut-off Grades | 14-48 |
| Table 14-21 | Mineral Resource Statement*, Saramacca Gold Project, Suriname, SRK Consulting (Canada) Inc., August 28, 2017 | 14-51 |
| Table 14-22 | Comparison between 2017 and 2018 Mineral Resource Statements | 14-51 |
| Table 15-1 | Consolidated Mineral Reserve Statement – Rosebel Gold Mine, Including Saramacca Gold Deposit | 15-1 |
| Table 15-2 | Resource Block models | 15-2 |
| Table 15-3 | Pit Optimization Cost and Revenue Assumptions | 15-5 |
| Table 15-4 | Summary of 2018 Pit Optimization COGs at US$1,200/oz | 15-5 |
| Table 15-5 | Summary of Pit Optimization Parameters | 15-6 |
| Table 15-6 | Pit Design Slope Recommendations per Rock Type | 15-9 |
| Table 15-7 | Stockpile Status as of September 1, 2018 | 15-26 |
| Table 15-8 | RGM Proven and Probable Mineral Reserves | 15-27 |
| Table 16-1 | Maximum Estimated Life of Mine Primary Mine Equipment Fleet | 16-2 |
| Table 16-2 | Reverse Circulation Grade Control Parameters | 16-5 |
| Table 16-3 | Drill and Blast Parameters | 16-7 |
| Table 16-4 | Weighting Factors per deposit | 16-8 |
| Table 16-5 | Life of Mine Plan | 16-11 |
| Table 17-1 | Mill Consumables | 17-7 |
| Table 18-1 | Projected Life of Mine Power Demand | 18-9 |
| Table 20-1 | Saramacca Completed ESIA Environmental and Socio-Economic Studies | 20-5 |
| Table 20-2 | Waste Rock by Pit | 20-12 |
| Table 20-3 | Rosebel Closed Site Summary Description | 20-15 |
| Table 21-1 | Major Equipment Purchase Replacement Schedule | 21-5 |
LIST OF FIGURES
| PAGE | ||
| Figure 4-1 | Location Map | 4-2 |
| Figure 4-2 | RGM Concession and Exploration Concessions | 4-3 |
| Figure 7-1 | Guiana Shield – Simplified Geological Map | 7-2 |
| Figure 7-2 | RGM Concession and Charmagne Exploration Concession – Geological Map 7-5 | |
| Figure 7-3 | Rosebel Property – N-S Geological Cross Section | 7-6 |
| Figure 7-4 | Example of Typical Brittle Features, Faya Bergi Fault | 7-9 |
| Figure 7-5 | Example of Typical Ductile Features, Faya Bergi Fault (SRK, 2017a) | 7-10 |
| Figure 9-1 | Location of Historical Exploration Work Conducted by Golden Star and Golden Star/Newmont | 9-4 |
| IAMGOLD Corporation - Rosebel Gold Mine | |
| Technical Report NI 43- 101 – November 5, 2018 | Page v |
| Figure 9-2 | RGM Mine Concession and Adjacent Exploration Properties | 9-7 |
| Figure 10-1 | Location of all Drilling Performed on the Saramacca Gold Project | 10-6 |
| Figure 10-2 | Reverse Circulation Drilling Sample Flowchart | 10-15 |
| Figure 13-1 | Main Expansion Initiatives Since 2004 | 13-3 |
| Figure 13-2 | Average Mineral Abundance by Rock Type | 13-6 |
| Figure 13-3 | CEET™ Forecast | 13-10 |
| Figure 13-4 | Average Gravity Gold Recovery by Deposit Using Mozley Table | 13-11 |
| Figure 13-5 | Overall Average Gold Recovery by Rock Type | 13-12 |
| Figure 13-6 | Overall Average Recovery by Pit | 13-13 |
| Figure 13-7 | Spatial Localization of the Variability Samples | 13-18 |
| Figure 13-8 | Spatial Localization of the Composites | 13-19 |
| Figure 13-9 | Gold Associations in Concentrates by Rock Type | 13-23 |
| Figure 13-10 | Gold Grain Size for Saprolite | 13-24 |
| Figure 13-11 | Gold Grain Size for Transition and Fresh Rock | 13-24 |
| Figure 13-12 | SPI Results for Saramacca and Rosebel | 13-26 |
| Figure 13-13 | Gold Recovery With and Without Carbon for the Composites | 13-33 |
| Figure 13-14 | TSS in Function of Flocculant Dosage | 13-37 |
| Figure 13-15 | Average NaCN Consumption by Saramacca Rock Types | 13-38 |
| Figure 13-16 | Average CaO Consumption of Saramacca Rock Types vs RGM Rock Types | 13-38 |
| Figure 14-1 | Isometric View – Northern Deposits Ore Zones | 14-5 |
| Figure 14-2 | DDH Variogram Models Used for Model 4 | 14-14 |
| Figure 14-3 | Swath Plots for Royal Hill Block Model | 14-16 |
| Figure 14-4 | Percentage Change in Ounces for the Range of Gold Prices Between US$1,000 and US$2,000/oz Compared to the US$1,500/oz Au Price | 14-21 |
| Figure 14-5 | Plan and Long Section Showing the Modelled Saramacca Gold Project Lithological and Grade Domains | 14-27 |
| Figure 14- 6 | Vertical Section 1700NW Showing Modelled Saramacca Gold Project Lithology and Grade Domains in Relation to Drilling | 14-28 |
| Figure 14- 7 | Vertical Section 1100NW Showing Modelled Saramacca Gold Project Lithology and Grade Domains in Relation to Drilling | 14-29 |
| Figure 14- 8 | Vertical Section 575NW Showing Modelled Saramacca Gold Project Lithology and Grade Domains in Relation to Drilling | 14-30 |
| Figure 14- 9 | Boxplot of Specific Gravity by Weathering Zone | 14-32 |
| Figure 14- 10 | Assay Lengths for Combined Historical and IAMGOLD Data | 14-33 |
| Figure 14- 11 | Grade Probability Plot (Left) and Capping Sensitivity Curve (Right) for Fault LG Domain | 14-35 |
| Figure 14- 12 | Gold Variogram for Fault Low Grade Zone | 14-37 |
| Figure 14- 13 | Contact Plots Between Low- and High-Grade Zones in the Fault Zone (left) and Pillow Basalt (right) | 14-41 |
| Figure 14- 14 | Swath Plot of Block Models, Oriented Along Strike | 14-42 |
| Figure 14-15 | Comparison of Quantile- Quantile Plot for Block Model Grades and Declustered and Change of Support Corrected Distribution (left) and Grade Tonnage Curves (right) for Fault Low Grade (top row) and Fault High Grade (bottom row) | 14-43 |
| Figure 14-16 | Distribution of Average Distance of Informing Composites for Indicated Blocks | 14-44 |
| Figure 14-17 | Plan Showing Estimated Blocks Above 0.25 g/t Gold Relative to the Conceptual Pit | 14-46 |
| Figure 14-18 | Global Grade- Tonnage Curves – Oxide (top) Transitional (mid) and Fresh Material (bottom) | 14-49 |
| Figure 15-1 | Pay Caro Ultimate Pit | 15-11 |
| IAMGOLD Corporation - Rosebel Gold Mine | |
| Technical Report NI 43- 101 – November 5, 2018 | Page vi |
| Figure 15-2 | Pay Caro Waste Dumps | 15-12 |
| Figure 15-3 | J Zone Ultimate Pit | 15-13 |
| Figure 15-4 | J Zone Dump | 15-14 |
| Figure 15-5 | Koolhoven Ultimate pit | 15-15 |
| Figure 15-6 | Koolhoven Dump | 15-16 |
| Figure 15-7 | Royal Hill Ultimate Pit | 15-17 |
| Figure 15-8 | Royal Hill Waste Dumps | 15-18 |
| Figure 15-9 | Mayo Ultimate Pit | 15-19 |
| Figure 15-10 | Mayo Pit Waste Dumps | 15-20 |
| Figure 15-11 | Rosebel Ultimate Pit | 15-21 |
| Figure 15-12 | Rosebel Pit Waste Dump | 15-22 |
| Figure 15-13 | Roma Pit Phase RMW | 15-23 |
| Figure 15- 14 | Saramacca Ultimate Pit | 15-25 |
| Figure 16- 1 | Saramacca to Maya Haul Road and Proximity to the RGM Operations | 16-4 |
| Figure 16- 2 | Mining by Pit – RGM and Saramacca 2019 Life of Mine Plan | 16-9 |
| Figure 16- 3 | Mill Feed – RGM and Saramacca 2019 Life of Mine Plan | 16-10 |
| Figure 17- 1 | Ore Processed and Hard Rock Ratio | 17-2 |
| Figure 17- 2 | RGM Process Flowsheet | 17-3 |
| Figure 18- 1 | Processing Plant Area | 18-3 |
| Figure 18- 2 | Potable Water Plant Facility | 18-5 |
| Figure 18- 3 | Fire Protection Pump Facility | 18-6 |
| Figure 18- 4 | Rosebel 5 MW Solar Power Plant | 18-8 |
| Figure 18- 5 | Tailings Storage Facility | 18-13 |
| Figure 20- 1 | ESIA Process Flowsheet | 20-3 |
| Figure 21- 1 | Life of Mine Expenditure | 21-2 |
| Figure 21- 2 | Capitalized Waste Stripping | 21-4 |
| IAMGOLD Corporation - Rosebel Gold Mine | |
| Technical Report NI 43- 101 – November 5, 2018 | Page vii |
| 1 |
SUMMARY |
| 1.1 |
EXECUTIVE SUMMARY |
This Technical Report was prepared by Rosebel Gold Mines N.V. (RGM), IAMGOLD Corporation’s (IAMGOLD) subsidiary for the Rosebel Gold Mine, located in Suriname, and SRK Consulting (Canada) Inc. (SRK) to support the disclosure of the current Mineral Resource and Mineral Reserve estimates for the Rosebel Gold Mine, including the Saramacca property located approximately 25 km southwest of the Rosebel processing plant. This Technical Report conforms to National Instrument 43-101 Standards of Disclosure for Mineral Projects (NI 43-101).
IAMGOLD is a mid-tier mining company with four operating gold mines and several exploration properties on three continents. IAMGOLD, through its wholly-owned subsidiary RGM, owns 95% of the RGM concession in Suriname, with the Government of Suriname holding the remaining 5%. The mine has been operating commercially since February 2004.
The Saramacca property, included in the disclosed Mineral Resource and Mineral Reserve estimate, is owned under a joint venture agreement in which RGM holds a 70% interest and the Republic of Suriname holds the remaining 30% interest. Commercial production at the Saramacca property is currently scheduled for the second half of 2019.
Table 1-1 summarizes the consolidated Mineral Resource estimates for the Rosebel Gold Mine, inclusive of the Saramacca deposit. The effective dates of the estimates are September 1, 2018 for the Rosebel Gold Mine and September 13, 2018 for Saramacca property. Mineral Resources and Mineral Reserves have been prepared in accordance with the Canadian Institute of Mining, Metallurgy and Petroleum (CIM) Definition Standards for Mineral Resources and Mineral Reserves dated May 10, 2014 (CIM definitions).
| IAMGOLD Corporation - Rosebel Gold Mine | |
| Technical Report NI 43- 101 – November 5, 2018 | Page 1-1 |
TABLE 1-1 CONSOLIDATED MINERAL
RESOURCE STATEMENT -
ROSEBEL GOLD MINE, INCLUDING SARAMACCA GOLD
DEPOSIT
| Deposit | Classification | Tonnes (000) |
Grade (g/t Au) |
Contained Ounces (000) 100% Basis |
Attributable Contained Ounces (000) |
| Measured | 34,216 | 0.6 | 696 | 661 | |
| RGM | Indicated | 261,108 | 0.9 | 7,817 | 7,426 |
| Measured & Indicated | 295,324 | 0.9 | 8,513 | 8,087 | |
| Inferred | 65,154 | 0.9 | 1,797 | 1,707 | |
| Indicated | 27,938 | 2.0 | 1,763 | 1,172 | |
| Saramacca | Inferred | 11,824 | 0.7 | 273 | 182 |
| Measured | 34,216 | 0.6 | 696 | 661 | |
| Indicated | 289,047 | 1.0 | 9,580 | 8,598 | |
| Consolidated | Measured & Indicated | 323,262 | 1.0 | 10,276 | 9,260 |
| Inferred | 76,978 | 0.8 | 2,070 | 1,889 |
Notes:
| 1. |
Attributable ounces: 95% for Rosebel (excluding Saramacca), 66.5% for Saramacca. | |
| 2. |
CIM definitions were followed for classification of Mineral Resources. | |
| 3. |
Mineral Resources reported at a weighted average cut-off grade for Rosebel (excluding Saramacca) of 0.18 g/t Au for saprolite, 0.23 g/t Au for transition material and 0.35 g/t Au for fresh rock material. Average cut-off grades for Saramacca are 0.25 g/t Au for laterite and saprolite, 0.30 g/t Au for transition material and 0.50 g/t Au for fresh rock material. | |
| 4. |
Mineral Resources for RGM include 2018 depletion prior to September 1, 2018. | |
| 5. |
Mineral Resources are constrained within a pit shell estimated using a long-term gold price of US$1,500/oz. | |
| 6. |
Mineral Resources are inclusive of Mineral Reserves. | |
| 7. |
Numbers may not add due to rounding. | |
| 8. |
Effective date for Rosebel (excluding Saramacca) is September 1, 2018 . Effective date for Saramacca is September 13, 2018. |
IAMGOLD and SRK are not aware of any environmental, permitting, legal, title, taxation, socioeconomic, marketing, political, or other relevant factors that could materially affect the Mineral Resource estimate.
Table 1-2 summarizes the consolidated Mineral Reserve estimate for the Rosebel Gold Mine inclusive of the Saramacca deposit.
| IAMGOLD Corporation - Rosebel Gold Mine | |
| Technical Report NI 43- 101 – November 5, 2018 | Page 1-2 |
TABLE 1-2 CONSOLIDATED MINERAL
RESERVE STATEMENT – ROSEBEL
GOLD MINE, INCLUDING SARAMACCA GOLD DEPOSIT
| Deposit | Classification | Tonnes (000) |
Grade (g/t Au) |
Contained Ounces (000) 100% Basis |
Attributable Contained Ounces (000) |
| RGM | Proven & Probable | 117,872 | 1.0 | 3,632 | 3,450 |
| Stockpiles | 15,803 | 0.6 | 283 | 269 | |
| Saramacca | Proven & Probable | 26,549 | 1.8 | 1,542 | 1,025 |
| Total | 160,224 | 1.1 | 5,457 | 4,745 |
Notes:
| 1. |
Attributable ounces: 95% for Rosebel (excluding Saramacca), 66.5% for Saramacca. | |
| 2. |
CIM definitions were followed for Mineral Reserves . | |
| 3. |
Mineral Reserves are estimated assuming open pit mining methods. | |
| 4. |
Mineral Reserves are estimated using an average long-term gold price of US$1,200/oz. | |
| 5. |
Average weighted process recovery of 89.8%. | |
| 6. |
Mining cost: $2.19/t mined. Processing costs: $4.79/t milled. Power costs: $3.13/t milled. General and Administrative costs of $2.16/t milled. | |
| 7. |
Mineral Reserves include 2018 depletion prior to September 1, 2018. | |
| 8. |
Mineral Reserves include material from all pits, including Saramacca. | |
| 9. |
Bulk density is variable by rock type. | |
| 10. |
Numbers may not add due to rounding. | |
| 11. |
Effective date for Rosebel (excluding Saramacca) is September 1, 2018 . Effective date for Saramacca is September 13, 2018. |
RGM is not aware of any mining, metallurgical, infrastructure, permitting, or other relevant factors that could materially affect the Mineral Reserve estimate.
The Mineral Resource and Mineral Reserve estimates have been completed to a level appropriate for feasibility studies, and are consistent with CIM definitions and are suitable for public reporting. As such, the Mineral Reserves are based on Measured and Indicated Mineral Resources, and do not include any Inferred Mineral Resources.
All currency is in US dollars unless noted otherwise.
| 1.1.1 |
CONCLUSIONS |
IAMGOLD has the following conclusions and observations for the RGM Mineral Resource and Mineral Reserve update:
| • | The Mineral Resource and Mineral Reserve estimates have been prepared in accordance with CIM definitions. | |
| • | Work completed to date by the geological staff is appropriate. |
| IAMGOLD Corporation - Rosebel Gold Mine | |
| Technical Report NI 43- 101 – November 5, 2018 | Page 1-3 |
| • | The geological model employed by RGM geologists is reasonably well understood and is well supported by field observations in both outcrop, pit mapping, and drill intersections. | |
| • | The resource models have been prepared using appropriate methodology and assumptions. These parameters include: |
| o | Treatment of high assays; | |
| o | Compositing length; | |
| o | Search parameters; | |
| o | Bulk density; | |
| o | Cut-off grade; | |
| o | Classification. |
| • |
The block models have been validated using a reasonable level of rigour consistent with common industry practice. | |
|
| ||
| • |
The resource estimates reported herein are a reasonable representation of the Mineral Resources delineated at the Rosebel Gold Mine as of September 1, 2018. | |
|
| ||
| • |
The current drill spacing in all deposits is judged adequate to develop a reasonable model of the mineralization distribution and to quantify its volume and quality with a good level of confidence in all areas of the project. | |
|
| ||
| • |
Based on visual verification, the RGM models (Rock Type, Density, and Au Grade) were found to be globally representative of the known geological and structural controls of mineralization at the RGM deposit. | |
|
| ||
| • |
Statistical analysis demonstrates that the block model provides a reasonable estimate of the Mineral Resources of the RGM deposits. | |
|
| ||
| • |
Validation of the block models, using different interpolation methods, indicated that tonnages, grades, and gold contents are similar. | |
|
| ||
| • |
Block models at RGM were also compared and reconciled with production data and are considered as being appropriate. | |
|
| ||
| • |
Swath plots for Indicated and Inferred Mineral Resources, by vertical sections for the RGM pits, indicate that peaks and lows in gold content generally match peaks and lows in composite frequency; no bias was found in the resource estimate in this regard. | |
|
| ||
| • |
A review of the information stored in the RGM database found it to be in good standing. | |
|
| ||
| • |
Sampling and assaying have been carried out following standard industry quality assurance/quality control (QA/QC) practices. These practices include, but are not limited to, sampling, assaying, chain of custody of the samples, sample storage, use of third-party laboratories, standards, blanks, and duplicates. | |
|
| ||
| • |
The mine design and Mineral Reserve estimate have been completed to a level appropriate for an operating mine. |
| IAMGOLD Corporation - Rosebel Gold Mine | |
| Technical Report NI 43- 101 – November 5, 2018 | Page 1-4 |
| • |
The economic assumptions and methodology used for estimation of the Mineral Reserves are appropriate. | |
|
| ||
| • |
The Mineral Reserve estimate is consistent with CIM definitions and is suitable for public reporting. As such, the Mineral Reserves are based on Measured and Indicated Mineral Resources and do not include any Inferred Mineral Resources. | |
|
| ||
| • |
Current production statistics indicate that the process flow sheet is adequate and suitable for processing the Rosebel Gold Mine ore types. |
SRK and IAMGOLD have the following conclusions and observations for the Saramacca Mineral Resource and Mineral Reserve update:
| • |
Mineral Resources and Mineral Reserves have been prepared in accordance with the CIM definitions. | |
|
| ||
| • |
Exploration data collected to date by IAMGOLD use procedures consistent with generally accepted industry best practices, and are sufficiently reliable to interpret with confidence the boundaries of the gold mineralization of the Saramacca gold deposit. | |
|
| ||
| • |
The geological model, constructed by SRK with the assistance of RGM geologists, is a reasonable representation of the gold mineralization at the current level of sampling. | |
|
| ||
| • |
The resource model has been prepared using appropriate methodology and assumptions: |
| o | Gold grades were estimated into a block model informed by composited gold assays, capped where appropriate, and using an ordinary kriging estimator. | |
| o | Specific gravity was estimated into the blocks, using an inverse distance squared estimator, to convert volumes into tonnage. |
| • |
The block model has been validated by both SRK and IAMGOLD using various methodologies, including statistical comparisons between composites and block model distributions, estimation using different estimation methods, and visual checks with informing composites. These validation steps demonstrate that the block model provides a reasonable estimate of the Mineral Resources of the Saramacca deposit. | |
|
| ||
| • |
The resource evaluations reported herein is a reasonable representation of the Mineral Resources delineated at the Saramacca deposit as of September 13, 2018. | |
|
| ||
| • |
The mine design and Mineral Reserve estimate have been completed to a level appropriate for an operating mine. | |
|
| ||
| • |
The economic assumptions and methodology used for estimation of the Mineral Reserves are appropriate. | |
|
| ||
| • |
The Mineral Reserve estimate is consistent with CIM definitions and is suitable for public reporting. As such, the Mineral Reserves are based on Measured and Indicated Mineral Resources and do not include any Inferred Mineral Resources. |
| IAMGOLD Corporation - Rosebel Gold Mine | |
| Technical Report NI 43- 101 – November 5, 2018 | Page 1-5 |
| • | Current production statistics indicate that the process flow sheet is adequate and suitable for processing the Saramacca deposit ore types. |
| 1.1.2 |
RECOMMENDATIONS |
IAMGOLD and SRK have the following recommendations:
| • | Continue the process of updating the resource models to incorporate the remaining deposits and update of the geological models of the current orebodies. | |
| • | Continue upgrading the Inferred Mineral Resources to Indicated Mineral Resources. | |
| • | Implement a stringent planning and operations process for following the variable cut- off grades in production, and closely monitor the reconciliation between planning and production. | |
| • | Further refine the mine cost model for future input to the long term planning and scheduling designs. | |
| • | Complete geological studies to build on existing knowledge and improve the understanding of the geological and structural setting of the Rosebel Gold Mine and Saramacca deposits. This may include further infill drilling to improve classification. | |
| • | Test the lateral and depth extent of the Rosebel Gold Mine and Saramacca gold mineralization to potentially expand the Mineral Resources. | |
| • | Continue optimization of the development of the Saramacca project, notably relevant to increasing metallurgical recovery, achieving pit slope dewatering to improve overall slope angles in saprolite, and optimized waste dump designs to reduce berm construction requirements. | |
| • | Investigate underground development potential for the Saramacca deposit. |
| 1.2 |
TECHNICAL SUMMARY |
| 1.2.1 |
PROPERTY DESCRIPTION AND LOCATION |
The Rosebel property is located in Suriname, South America, approximately 80 km south of the city of Paramaribo, the capital of Suriname. Suriname is a former Dutch colony located on the northeastern coast of South America.
| 1.2.2 |
LAND TENURE |
The Rosebel Gold Mine area consists of the following RGM concessions: Gross Rosebel concession (or the RGM concession), which contains the Royal Hill, Mayo, Roma, Rosebel, Koolhoven, Pay Caro, East Pay Caro, and J Zone deposits, seven exploration concessions (Headley’s Reef, Charmagne 1, Charmagne 2, Charmagne West, Thunder Mountain, Anjoemara en Lef Resources, and Brokolonko, all located on contiguous ground), and the Saramacca exploration concession. The Saramacca concession is located approximately 25 km southwest of the Rosebel Gold Mine milling facility.
| IAMGOLD Corporation - Rosebel Gold Mine | |
| Technical Report NI 43- 101 – November 5, 2018 | Page 1-6 |
All these concessions are owned by RGM, which is a Surinamese company created for the purpose of exploring for and developing all minerals including gold, precious metals, base metals and stones and operating the Rosebel Gold Mine. IAMGOLD owns a 95% interest in RGM, while the Republic of Suriname has a 5% free-carried interest. The Saramacca concession is owned under a joint venture agreement between RGM holding 70% and the Republic of Suriname holding the remaining 30% interest.
| 1.2.3 |
HISTORY |
| 1.2.3.1 |
RGM CONCESSION |
Golden Star Resources Ltd. (Golden Star) was granted the Right of Exploration (ROE) for the Rosebel property for five years in 1994, pursuant to a Mineral Agreement signed between Golden Star, NV Grassalco (Grassalco), and the Government of Suriname on April 7, 1994. Golden Star entered into an agreement with Cambior Inc. (Cambior) on June 7, 1994, granting Cambior the option to earn an undivided 50% of Golden Star’s interest in the 1994 Mineral Agreement and the Rosebel property.
On October 26, 2001, Golden Star sold its 50% interest in the Rosebel property to Cambior for a cash consideration of $8 million and a gold price participation right on future production from Rosebel. Under its gold price participation right, Golden Star would receive a quarterly payment of an amount equal to 10% of the excess, if any, of the average quarterly market price above US$300/oz for gold production from RGM’s soft and transitional rock portions and above US$350/oz from RGM’s hard rock portion, up to a maximum of seven million ounces produced.
Commercial production at Rosebel Gold Mine began in February 2004. In 2004, Golden Star sold the royalty interest in production at the Rosebel property to Euro Resources SA (Euro Resources - formerly Guyanor Resources SA). In November 2006, IAMGOLD acquired a 100% interest in Cambior (the previous owner of RGM), thereby acquiring 95% of RGM. In December 2008, IAMGOLD acquired 84.55% of the current share capital of Euro Resources.
| IAMGOLD Corporation - Rosebel Gold Mine | |
| Technical Report NI 43- 101 – November 5, 2018 | Page 1-7 |
In June 2013, IAMGOLD, RGM, Grasshopper Aluminum Company N.V., and the Republic of Suriname executed the Second Amendment to the Mineral Agreement. The Second Amendment created a new Unincorporated Joint Venture vehicle (UJV) in which the Republic of Suriname would hold, through NV1, a wholly owned subsidiary of the Republic, a paid 30% interest and RGM would hold a 70% interest. Under the terms of the Second Amendment, NV1 has been granted an option to acquire an increased interest in production from the RGM concession if RGM approves a Significant Expansion of the existing mill and if NV1 elects to participate in the Significant Expansion by funding 30% of the capital required for the expansion.
In December 2015, IAMGOLD announced the closing of a simplified tender offer for Euro Resources through the Euronext Paris Stock Exchange (Euronext Paris), thereby owning approximately 90% of the outstanding common shares of Euro Resources.
| 1.2.3.2 |
SARAMACCA CONCESSION |
The first recorded exploration on the Saramacca gold project was undertaken by Golden Star in 1994. During this time, the Saramacca concession was part of a larger grants package known as Kleine Saramacca.
In August 2006, Golden Star signed a joint venture with Newmont Mining Corporation (Newmont), whereby Golden Star would remain the operator of the Saramacca gold project. In 2007 and 2008 Newmont funded all exploration activities at Saramacca, with Golden Star personnel managing the project. During 2009, Newmont earned a 51% interest in the Saramacca gold project by spending $6.0 million on exploration expenditures, and took over management of the programs.
In November 2009, Golden Star entered into an agreement to sell its interest in the Saramacca joint venture to Newmont for approximately $8.0 million. In December 2012, all requirements for the sale and transfer were met, and ownership and control of the Saramacca gold project was turned over to Newmont for total consideration of $9.0 million in cash.
In 2013, the Saramacca gold property was returned to the Republic of Suriname.
RGM signed a Letter of Agreement with the Republic of Suriname on August 30, 2016, to acquire the rights to the Saramacca gold property. The terms of the Letter of Agreement included an initial payment of $200,000 which enabled immediate access to the property for IAMGOLD-RGM’s exploration team to conduct due diligence, as well as access to historical data from previous exploration activity at the Saramacca property.
| IAMGOLD Corporation - Rosebel Gold Mine | |
| Technical Report NI 43- 101 – November 5, 2018 | Page 1-8 |
On September 29, 2016, IAMGOLD ratified the Letter of Agreement by Ratification Letter and amended the Letter of Agreement on December 12, 2016 to acquire the Saramacca property. IAMGOLD subsequently paid $10 million in cash and agreed to issue 3.125 million IAMGOLD common shares to the Republic of Suriname in three approximately equal annual instalments on each successive anniversary of the date the right of exploration was transferred to RGM.
| 1.2.4 |
GEOLOGY AND MINERALIZATION |
The RGM concession lies within a greenstone belt of the Paleoproterozoic Guiana Shield which stretches from the Amazon River in Brazil to the Orinoco River in Venezuela and covers an area of more than 900,000 km2. In Suriname, sedimentary and volcanic units of the greenstone belt are grouped into the Marowijne Supergroup which is divided itself into two formations: the Paramaka Formation constituted of volcanic rocks, and the Armina Formation constituted of flysch sequences represented by greywacke, mudstone, and conglomerate.
| 1.2.4.1 |
RGM CONCESSION |
The Rosebel deposits are hosted by a volcano-sedimentary sequence of the Marowijne Supergroup and by the overlying detrital sedimentary sequence of the Rosebel Formation. Five types of rocks are distinguished on the property: felsic to mafic volcanic rocks, flysch sequence, arenitic sedimentary rocks, felsic intrusion, and late diabase dykes. Economical gold mineralization has been recognized in sedimentary and volcanic rocks while the intrusion only shows rare gold occurrences and the late diabase dykes are devoid of any mineralization.
Two phases of deformation are recognized on the property. The first one has affected the older volcanic rocks only, while the second phase of deformation has affected the volcanic rocks and both sedimentary sequences. The veins show no signs of deformation and so the mineralization is interpreted as being emplaced during the latest stage of the last deformation event.
Three mineralized domains are found on the property: the North, Central, and South domains. The northern domain includes the J Zone and Koolhoven deposits along a trend to the north of the volcanic rocks and the Pay Caro-East and Pay Caro deposits along a trend south of the volcanic rocks. The two trends follow a WNW-ESE orientation. The central domain only includes one deposit, Rosebel, which is striking east-west. The southern domain is also striking east-west and hosts the Mayo, Roma, and Royal Hill deposits.
| IAMGOLD Corporation - Rosebel Gold Mine | |
| Technical Report NI 43- 101 – November 5, 2018 | Page 1-9 |
| 1.2.4.2 |
SARAMACCA CONCESSION |
The Saramacca gold project is underlain by metabasalt of the Paramaka Formation. Younging from southwest to northeast, the main units of the Paramaka Formation are a massive basalt overlain by a thinner amygdular basalt unit and a thick unit of pillowed basalts. The massive basalt is a homogeneous, green, medium-grained unit in which leucoxene sporadically develops. The amygdular basalt unit is a greenish-grey to buff color where hydrothermally altered.
Located at the contact between the massive and pillowed basalts, the Faya Bergi fault zone is a major brittle-ductile vertical dip-slip fault zone with which gold mineralization is associated. Typical brittle features include cataclasite, gouge, fractured zones and striated fault slip planes, and typical ductile features include shear foliation and minor folding. Several sub-parallel minor shear zones occur on either side of the fault zone.
Mineralization at the Saramacca gold project is principally hosted within a series of north-northwest trending structures ranging between two metres and 40 m in width over a strike length of 2.2 km, and is open along strike. Several sub-parallel structures have been identified, however, the Faya Bergi and Brokolonko structures are the primarily mineralized structures over a continuous distance.
| 1.2.5 |
EXPLORATION STATUS |
| 1.2.5.1 |
RGM CONCESSION |
Table 1-3 provides a summary of exploration activities on the Rosebel concession over the past three years.
| IAMGOLD Corporation - Rosebel Gold Mine | |
| Technical Report NI 43- 101 – November 5, 2018 | Page 1-10 |
TABLE 1-3 EXPLORATION ACTIVITIES ON
THE ROSEBEL CONCESSION -
PAST THREE YEARS
| 2015 | • |
Intense detailed pit mapping in East Pay Caro, J Zone, Rosebel and Royal Hill to be used in further development of the pits, identifying optimal drilling directions for MinEx and RC grade control and new geological interpretation | |
| • |
Mapping and grab sampling of quartz veins in Mamakreek and Compagnie Creek | ||
| • |
Small shallow auger program of 66 holes at Royal Hill SE pits of SSM tailings was conducted by MinEx | ||
| 2016 | • |
Intense detailed pit mapping in East Pay Caro, West Pay Caro, J Zone, Rosebel, Royal Hill, Roma, Overman and Mayo to be used in further development of the pits, identifying optimal drilling directions for MinEx and RC grade control and update geological interpretation | |
| 2017 | • |
MineEx conducted pit mapping/grab sampling and pit testing in Koolhoven-J Zone, West Pay Caro, and Rosebella |
| 1.2.5.2 |
SARAMACCA CONCESSION |
Table 1-4 provides a summary of exploration drilling at Saramacca since 2002. From 2016 to 2018, exploration work conducted by IAMGOLD on the Saramacca concession was performed by the Suriname Exploration department (SurEx) focused on exploration work conducted outside of the RGM concession. Exploration activities in the first and second quarter of 2018 were performed by the Mine Exploration department (MinEx).
TABLE 1-4 EXPLORATION ACTIVITIES ON
THE SARAMACCA CONCESSION
SINCE 2002
| Goldstar | Goldstar/Newmont | Goldstar/Newmont | IAMGOLD-RGM | Total | ||||||||
| Hole Type | 2002-2005 | 2006-2008 | 2009-2010 | SurEx 2016- 2018 | MinEx 2018 | |||||||
| No. | (m) | No. | (m) | No. | (m) | No. | (m) | No. | (m) | No. | (m) | |
| Undefined | 157 | 1,160 | 241 | 1,905 | - | - | - | - | - | - | 398 | 3,065 |
| Diamond Drilling | 24 | 1,307 | 30 | 3,566 | 36 | 4,420 | 286 | 60,701 | 66 | 15,472 | 442 | 85,466 |
| Reverse Circulation Drilling | - | - | - | - | - | - | 41 | 4,986 | - | - | 41 | 4,986 |
| 1.2.6 |
MINERAL RESOURCES |
| 1.2.6.1 |
RGM CONCESSION |
Excluding the Saramacca deposit, the Mineral Resource estimate at September 1, 2018 for the Rosebel Gold Mine is 295 million tonnes (Mt) at an average grade of 0.9 g/t Au, containing 8.513 Moz in the Measured and Indicated category. There is an additional 65 Mt at an average grade of 0.9 g/t Au, containing 1.789 Moz in the Inferred category.
| IAMGOLD Corporation - Rosebel Gold Mine | |
| Technical Report NI 43- 101 – November 5, 2018 | Page 1-11 |
This Mineral Resource is estimated within pit shells optimized at a US$1,500/oz Au price and corresponding cut-off grades and includes the Measured, Indicated, and Inferred Mineral Resource categories. A volumetric analysis using GEMS is performed to determine the tonnage and grade of the Measured, Indicated, and Inferred Mineral Resources inside each of these shells. The stockpile inventory is classified as Measured and is included in the total.
| 1.2.6.2 |
SARAMACCA CONCESSION |
The Mineral Resource estimate for the Saramacca gold project, at September 13, 2018, is 28 Mt at an average grade of 2.0 g/t Au, containing 1.763 Moz in the Indicated category, and 12 Mt at an average grade of 0.7 g/t Au for 0.273 Moz in the Inferred category. This estimate is based on open pit extraction, using a conceptual open pit shell developed by BBA Inc. (BBA) using the same optimization parameters as those used in the Mineral Reserve study. Mining, processing, and general and administrative (G&A) costs are based on a Mineral Reserve cost model, which was developed using an activity-based costing approach. Other pit optimization parameters include:
| • |
Overall slope angle 22° in laterite and saprolite, 36° in transition, and 45° in fresh rock. | |
| • |
Metallurgical gold recovery of 94.0% for laterite, 91.0% for saprolite, 89.6% for transition, and 74.8% for fresh rock. | |
| • |
Gold price of US$1,500 per troy ounce. |
After review of optimization results, and through discussions with IAMGOLD, SRK considers that it is reasonable to report as Mineral Resource amenable to open pit extraction those classified blocks located within the conceptual pit shell above a cut-off grade of 0.25 g/t Au for laterite and saprolite, 0.30 g/t Au for transition material, and 0.50 g/t Au for fresh rock material.
| 1.2.7 |
MINERAL RESERVES |
The Mineral Reserve estimate is based on updated resource models at year-end 2017 for all pits, with the exception of Saramacca which is based on an updated resource model from June 2018. All resource models were updated by RGM in GEMS format except for the Saramacca model which was prepared by SRK. All resource models were depleted to the September 1, 2018 surveyed surfaces.
The Mineral Reserve estimate only contains Measured and Indicated Mineral Resources within pit designs described in this document and is based on a pit optimization at $1,200/oz Au. Ore/waste allocation has been defined by the life of mine (LOM) schedule.
| IAMGOLD Corporation - Rosebel Gold Mine | |
| Technical Report NI 43- 101 – November 5, 2018 | Page 1-12 |
The Mineral Reserve estimate is based on open pit mining methods and includes 160.2 Mt at an average grade of 1.1 g/t Au, containing 5.5 Moz in the Proven and Probable category on a 100% basis.
The Mineral Reserve has been determined based on the latest LOM plan. This was developed to maximize cash flow analysis based on an activity-based cost accounting, the theory of constraints as well as developing pit phasing and multi-pit scheduling. This strategy allowed IAMGOLD to maximize the net present value (NPV) of the operation while satisfying the operational constrains to achieve a sustainable mine operation and gold production profile.
The Mineral Reserve estimate includes a mining dilution of 8% for saprolite (soft) and 10% for transition and fresh rock (hard) ore. The percentage of dilution is a function of blasting which displaces the in-situ ore zones. As a result, soft ore that requires less blasting than transition or hard ore has a relatively lower dilution percentage. The dilution tonnes have been estimated at zero grade.
As described above, the dilution in relation to the ore type has been incorporated in the pit optimisation and mine planning process. The application of this dilution methodology effectively increases the mineralized tonnage by, for example 10% in transition and hard ore, with no change to final in-situ gold reserves thus reducing the gold head grade from the modelled in-situ to the diluted grade.
Historical Ore tonnage production has shown a consistent positive reconciliation at the Rosebel Gold Mine. As such, no mining losses are applied to the Mineral Reserve estimate resulting in a 100% mining recovery. The same methodology has been applied to the Mineral Reserve estimate at the Saramacca deposit.
| 1.2.8 |
MINING |
The mining operation at Rosebel Gold Mine is a conventional truck and shovel, drill and blast, open pit operation, with an owner fleet.
In 2019, the annual ex-pit mining target is projected to be 67.3 Mt at stripping ratio of 5.49. The LOM plan for 2019 has 12.4 Mt processed at the Rosebel processing plant at an average grade 0.91 g/t Au to yield approximately 335 thousand ounces (koz) of recovered gold. This includes mining 0.99 Mt at Saramacca, at a stripping ratio of 3.43. During 2019, 0.22 Mt of Saramacca ore will be processed at the Rosebel processing plant at an average grade of 0.85 g/t Au for a total of 5.7 koz of recovered gold.
| IAMGOLD Corporation - Rosebel Gold Mine | |
| Technical Report NI 43- 101 – November 5, 2018 | Page 1-13 |
A new primary mining fleet is planned for Saramacca and will consist of one Caterpillar (CAT) 6030 face shovel, two Komatsu PC2000 backhoes, and one PC1250 excavator with the support of one CAT 993 loader used at the run of mine (ROM) stockpile to load long-haul trucks. The proposed haulage fleet will consist of 20 CAT 785 haul trucks within the pit and 10 Haul-Max trucks to haul ROM from Saramacca to the Rosebel processing plant.
The RGM loading fleet consists of five CAT 6030 shovels and four CAT 5130 shovels using both the excavator and front shovel configuration supported by one CAT 993 loader used for ROM stockpile reclaim and one CAT 993 loader used in pit. The hauling fleet consists of 36 CAT 777 and 18 CAT 785 haul trucks. Dust control is accomplished with four CAT 777 and one CAT 769 water truck. RGM’s ancillary equipment includes, fuel trucks, mobile light plants, and service trucks.
The drilling fleet consists of a mixed fleet of 13 drills. Drill and blast parameters vary for each pit due to different material type and pit designs. All drill holes are 165 mm diameter. All blasting activities on site are executed by RGM employees. Holes are loaded with bulk explosive matrix and initiated with non-electric detonators.
Reverse circulation (RC) grade control drilling is planned on grid spacing of 12 m x 6 m pattern using inclined holes. In order to improve the definition of the ore zones, the preferred method for grade control is through RC drilling in all pits. Blast hole sampling is used for grade control in areas where RC grade control drilling is not completed. A fleet of five Shram Buggy rigs are used for RC drilling.
The mining schedule and production rate for the LOM have been established to feed the mill to its power capacity while respecting annual mining rate constraints, phase drop down rates, and minimizing truck peak requirements.
The processing rate of the Rosebel processing plant has a limit of 12.77 million tonnes per annum (Mtpa) for all rock types combined. The feed is also limited by rock hardness; which is taken into account as “Factored Tonnes”; where fresh rock has a higher factor than soft or transition. The total factored tonne limit at the mill is 8.827 Mtpa. Diluted ore tonnages were accounted for in determining the processing rate limits at plant.
| IAMGOLD Corporation - Rosebel Gold Mine | |
| Technical Report NI 43- 101 – November 5, 2018 | Page 1-14 |
From 2019 until 2024 the plant is operated at its maximum processing capacity and from 2025 onwards, the tonnage of fresh rock increase and mill feed is reduced to approximately 9 Mtpa, due to the factored tonnes limit.
The production starts at a rate of 67.3 Mtpa in 2019 and steadily increases to a rate of 74.0 Mtpa from the RGM pits and 30 Mtpa from the Saramacca pit until 2021. The production rate stays relatively constant until 2026 from the RGM pits and is steady at 30 Mtpa from the Saramacca pit until 2029, then it starts to decline until the end of production in 2033. In the later years, production rates are reduced due to longer haulage distances, higher percentage of fresh rock, and the number of available working areas at the pit bottoms, which are not as productive as on the upper benches.
While the schedule targets softer ore in the earlier years, the proportion of hard rock in the mill feed varies from a maximum of 50% between 2019 and 2024, increases slowly from 66% to 92% between 2025 and 2029, and becomes 100% of the mill feed between 2031 and 2033.
| 1.2.9 |
MINERAL PROCESSING |
The metallurgical process is conventional grinding followed by leach, carbon in leach (CIL) with a gravity circuit installation in the grinding circuit for the recovery of gravity recoverable gold. Gold recovery facilities include acid washing, carbon stripping, and electro winning, followed by bullion smelting and carbon regeneration. The process was developed to accommodate varying ratios of soft rock, transition, and hard rock ores. The process used at RGM was developed through various pilot plant programs and through additional initiatives by mill personnel to improve the process further since commissioning. Further process optimization continues to target constraints and opportunities to further increase plant capacity and performance.
The nameplate capacity of the Rosebel processing plant is 12.5 Mtpa. The plant has been operating near this capacity on a sustained long term basis. A sustained rate, at or near the nameplate design capacity, is expected for 2018 and beyond.
| IAMGOLD Corporation - Rosebel Gold Mine | |
| Technical Report NI 43- 101 – November 5, 2018 | Page 1-15 |
| 1.2.10 |
SITE INFRASTRUCTURE |
RGM site infrastructure includes:
| • | Site roads; | |
| • | Mine facilities, such as the truck shop, warehouse, and administration services; | |
| • | Administration buildings; | |
| • | Processing plant and associated buildings; | |
| • | Truck shop and associated buildings; | |
| • | Warehouse; | |
| • | Fuel storage; | |
| • | Municipal services; | |
| • | Aggregate plant; | |
| • | Camp complex; | |
| • | Grid power supply with installed capacity of 189 megawatts (MW) with RGM power demand at 31.9 MW in 2017; | |
| • | 5 MW solar power plant; | |
| • | Emergency generators; | |
| • | Communications and IT systems; | |
| • | Tailings storage facility. |
The Saramacca gold project is a satellite operation to the current RGM mine site. Infrastructure on site will include:
| • | Access road, approximately 23 km in length, between the southern end of the RGM mine site and the Saramacca deposit; | |
| • | ROM ore storage pad; | |
| • | Facilities pad, including a maintenance shop, warehouse, fuel storage tanks, generator, lunch room, washroom, and office facilities; | |
| • | Water management ponds and ditches; | |
| • | A water treatment facility; | |
| • | Mining haul roads; | |
| • | Waste rock storage facilities. |
| 1.2.11 |
MARKET STUDIES AND CONTRACTS |
Gold is the principal commodity produced at RGM and is freely traded at prices that are widely known, so that prospects for sale of any production are virtually assured. All gold produced by IAMGOLD is in the form of doré bars, which is then shipped to a refiner who refined the doré into bullion. The bullion is then sold directly on the open market to gold trading institutions at prevailing market prices.
| IAMGOLD Corporation - Rosebel Gold Mine | |
| Technical Report NI 43- 101 – November 5, 2018 | Page 1-16 |
RGM finalizes long term or annual contracts for all major spends which are required for the operations. Contracts are negotiated by going out on tenders. Contracts with values higher than $5 million per year include fuel, lubricants, process plant reagents, grinding media, mill liners, mining components, and RC drilling.
| 1.2.12 |
ENVIRONMENTAL STUDIES, PERMITTING, AND SOCIAL OR COMMUNITY IMPACT |
| 1.2.12.1 |
RGM CONCESSION |
A Feasibility Study and Environmental Impact Assessment (EIA) for the Rosebel project was first completed in 1997. After further exploration, a final Feasibility Study was completed and submitted to the Government of Suriname in August 2002. RGM received a Right of Exploitation from the Government of Suriname after the approval of the final Feasibility Study and the accompanying EIA in 2002. A Social Impact Assessment was also completed in 2002. Commercial production at Rosebel Gold Mines began in February 2004.
In 2012, RGM submitted an Environmental and Social Impact Assessment (ESIA) and obtained approval to expand the tailings storage facility (TSF). An expansion of the TSF was required to support increases in production levels and mine life. The TSF expansion consisted of the construction of a second containment basin immediately adjacent to the existing facility.
The existing Right of Exploitation provides the necessary approvals for mining and processing within the RGM concession.
| 1.2.12.2 |
SARAMACCA CONCESSION |
Mining of the Saramacca deposit requires Government of Suriname approval of a Feasibility Study and an ESIA in order to proceed. Consistent with the National Institute for Environment and Development in Suriname (NIMOS) guidance, RGM initiated the ESIA process for the Saramacca project in April 2018 with the submission of an ESIA Terms of Reference (TOR) for the Saramacca project.
The scope of the Saramacca project for ESIA purposes is for the planned infrastructure and activities during the construction, operations, and closure phases of mining within the Saramacca concession and includes the transportation corridor between Saramacca and the RGM concessions. The ESIA was based on the engineering and mine planning available at the time of its submission in July 2018.
| IAMGOLD Corporation - Rosebel Gold Mine | |
| Technical Report NI 43- 101 – November 5, 2018 | Page 1-17 |
The Review Phase of the ESIA for the Saramacca project has been completed with comments on the ESIA provided by NIMOS on October 2, 2018. RGM is currently responding to these comments and preparing a final ESIA submission. NIMOS must approve the final ESIA as a precursor to issuing a Right of Exploitation for mining within the Saramacca concession.
A Community Relations Plan with supporting guideline and procedures was developed to minimize the mine’s impact on communities and the environment.
There is one active community, Nieuw-Koffiekamp, within the boundaries of the RGM concession. Nieuw Koffiekamp is a Maroon village with a population of approximately 500 permanent inhabitants belonging primarily to the Aukan Maroon tribegroup, but with some representation by the Saramaka and Matawai tribe as well.
In the immediate surroundings of the RGM concession, there are eleven other Maroon villages that are considered by RGM communities of interest (CoIs) with the potential to be directly impacted by or have influence over RGM operations and the Saramacca project. These villages are; Marshallkreek, Klaaskreek, Nieuw-Lombe, Balingsoela, Brownsweg, and Kwakoeugron in Brokopondo District; and Nieuw Jacobkondre, Baling, Misalibi, and Bilawatra in Sipaliwini District. These, along with Nieuw-Koffiekamp are considered the direct area of influence of the company’s operations.
RGM has a regular program of engagement and community investment with all CoIs, led by the Community Relations Department. In the case of the CoIs in Brokopondo District, this relationship has been established and ongoing for many years. In the case of the four Sipaliwini CoIs of Nieuw Jacobkondre, Baling, Bilawatra and Misalibi, the program is in its beginning stages as the Saramacca project starts up. Community investment projects are selected with input from community members and traditional authorities. RGM continues to adapt and refine its community engagement and investment approach to meet community needs, particularly as considerations for post-closure sustainability and continuity become more important.
| IAMGOLD Corporation - Rosebel Gold Mine | |
| Technical Report NI 43- 101 – November 5, 2018 | Page 1-18 |
| 1.2.13 |
CAPITAL AND OPERATING COST ESTIMATES |
A total of $1,109 million of capital is planned to be spent over the remaining LOM, which equates to $7.45/t milled or $244/oz of Au. The total capital expenditure excluding expansion capital associated with the development of the Saramacca gold project is $941 million, which equates to $6.32/t milled or $207/oz of Au.
Sustaining capital, inclusive of the Saramacca deposit, is the largest capital cost estimated at $477 million, representing 44% of the LOM remaining capital expenditure.
The mine operating costs are estimated on the basis of the physical quantities of the mine plan, realistic equipment productivity assumptions, overall equipment efficiencies, and updated consumable prices.
Average mine operating costs over the LOM are estimated at $2.19/t mined, based on assumed diesel costs of the LOM of $0.63/l. The average LOM total milling cost (inclusive of power) is estimated to be $7.92/t milled. The average LOM G&A cost is $2.16/t milled and assumes an annual spend of $23 million until 2029, after which G&A costs will gradually decrease as the operation will approach the end of life.
| IAMGOLD Corporation - Rosebel Gold Mine | |
| Technical Report NI 43- 101 – November 5, 2018 | Page 1-19 |
| 2 |
INTRODUCTION |
This Technical Report was prepared by Rosebel Gold Mines N.V. (RGM), IAMGOLD Corporation’s (IAMGOLD) subsidiary, for the Rosebel Gold Mine, located in Suriname, and SRK Consulting (Canada) Inc. (SRK). The purpose of this Technical Report is to support the disclosure of the current Mineral Resource and Mineral Reserve estimates for the Rosebel Gold Mine, including the Saramacca property. This Technical Report conforms to National Instrument 43-101 Standards of Disclosure for Mineral Projects (NI 43-101).
IAMGOLD is a mid-tier mining company with four operating gold mines and several exploration properties on three continents. IAMGOLD, through its wholly-owned subsidiary RGM, owns 95% of the RGM concession in Suriname, with the Government of Suriname holding the remaining 5%. The mine has been operating commercially since February 2004.
The Saramacca property, included in the disclosed Resource and Reserve estimate, is owned under a joint venture agreement in which the Republic of Suriname holds a 30% interest and RGM holds the remaining 70%. Details of the ownership structure are provided in Section 6. Commercial production has not started at the Saramacca property, and is currently scheduled for the second half of 2019.
All currency is in US dollars unless noted otherwise.
| 2.1 |
SOURCES OF INFORMATION |
This Technical Report was prepared by RGM, IAMGOLD, and SRK personnel.
The construction of the Saramacca Mineral Resource model was a collaborative effort between IAMGOLD and SRK staff. IAMGOLD provided the technical support and assistance related to the drill database. Dr. Jean-Francois Couture, P.Geo. (APGO#0197) provided insight to the structural geology controls of gold mineralization. The data review and geological modelling were performed by Mr. Dominic Chartier, P.Geo. (OGQ #874, APGO #2775). Grade estimation and associated sensitivity analyses, and Mineral Resource classification were performed by Dr. Oy Leuangthong, P.Eng. (PEO #90563867). Pit optimization review was conducted by Mr. Nicolas Szwedska Eng. (OIQ #5010178), a BBA open pit mining engineer. The overall process was reviewed by Mr. Glen Cole, P.Geo. (APGO #1416). Additional contributions to the Technical Report were provided by Ms. Joycelyn Smith, P.Geo. (APGO #2963).
| IAMGOLD Corporation - Rosebel Gold Mine | |
| Technical Report NI 43- 101 – November 5, 2018 | Page 2-1 |
The RGM Mineral Resource model was constructed by Raphaël Dutaut (OGQ #1301), RGM, with the help of external experts Clayton V. Deutsch (APEGA 4329) and John Manchuk, P.Eng. (APEGA #73916).
The RGM and Saramacca Mineral Reserve was estimated based on a Mine Schedule developed by Nicolas Szwedska, Eng. (OIQ #5010178) and Jeffrey Cassoff, Eng. (OIQ #5002252), with guidance and review provided by IAMGOLD Qualified Persons (QP) Adam Doucette, P.Eng. (PEO #100200823) and Michel Payeur, Eng. (OIQ #127646).
The Saramacca process testwork was carried out under the supervision of Dr. Seref Girgin, Ph.D. from BBA, Véronique Aube, Eng. M.A.Sc. (OIQ #128900) and Stéphane Rivard, Eng. (OIQ #118538) from IAMGOLD. Process review for RGM was carried by Véronique Aube and Stéphane Rivard.
By virtue of their education, membership to a recognized professional association and relevant work experience, Mr. Payeur, Mr. Dutaut, Mr. Rivard, Mr. Doucette, Dr. Leuangthong, and Mr. Chartier are QPs as this term is defined by NI 43-101. As well, Dr. Leuangthong and Mr. Chartier are independent QPs as this term is defined by NI 43-101.
| 2.1.1 |
SITE VISIT |
In accordance with NI 43-101 guidelines, Dominic Chartier, P.Geo (OGQ #874, APGO #2775), visited the Saramacca gold project on January 22 to 26, 2018, accompanied by Caroline Laplante and Samuelle Gariepy, Geologists with IAMGOLD-RGM’s Suriname Exploration department.
The purpose of the site visit was to review the updated exploration database and validation procedures, review exploration procedures, examine drill core, interview project personnel, reassess geological modelling procedures, update the geological model, and collect all relevant information for the preparation of a revised Mineral Resource model and the compilation of a technical report.
| IAMGOLD Corporation - Rosebel Gold Mine | |
| Technical Report NI 43- 101 – November 5, 2018 | Page 2-2 |
SRK was given full access to relevant data and conducted interviews with IAMGOLD-RGM personnel to obtain information on the past exploration work, to understand procedures used to collect, record, store and analyze historical and current exploration data.
Stéphane Rivard and Michel Payeur visited RGM mine site multiple times, the last one being from October 20 to 23, 2018. Adam Doucette and Raphaël Dutaut actively work on regular rotations at RGM and Saramacca and were last on site during the month of October 2018.
The QPs for this Technical Report, their responsibilities, and dates of personal inspections of RGM are provided in Section 29. The documentation reviewed, and other sources of information, are listed at the end of this report in Section 27 References.
| 2.2 |
EFFECTIVE DATES |
The effective date of this Technical Report is September 23, 2018, the date of the public disclosure of the Mineral Resource and Mineral Reserve estimate for RGM and the Saramacca property.
The cut-off date for drilling and laboratory data used in the models developed for the RGM Mineral Resource estimates is January 15, 2018.
The cut-off date for the drilling and laboratory data used in the models developed for the Saramacca Mineral Resource estimates is May 22, 2018.
The effective date for the RGM Mineral Resource and Mineral Reserve estimates is September 1, 2018, which takes into account depletion up to the effective date.
The effective date for the Saramacca Mineral Resource and Mineral Reserve estimates is September 13, 2018.
| IAMGOLD Corporation - Rosebel Gold Mine | |
| Technical Report NI 43- 101 – November 5, 2018 | Page 2-3 |
| 2.3 |
LIST OF ABBREVIATIONS |
Units of measurement used in this report conform to the metric system.
| Au | gold | kW | kilowatt |
| a | annum | kWh | kilowatt-hour |
| A | ampere | L | litre |
| AEM | airborne electromagnetic | lb | pound |
| Ai | Bond abrasion testing | LIMS | Laboratory Information Management System |
| AISC | all-in sustaining cost | LOM | life of mine |
| bbl | barrels | L/s | litres per second |
| btu | British thermal units | m | metre |
| BWI | Bond ball mill grindability | M | mega (million); molar |
| °C | degree Celsius | m2 | square metre |
| C$ | Canadian dollars | m3 | cubic metre |
| cal | calorie | µ | micron |
| CAPEX | capital expenditure | MASL | metres above sea level |
| CEET | Comminution Economic Evaluation Tool | µg | microgram |
| cfm | cubic feet per minute | m3/h | cubic metres per hour |
| CIL | carbon in leach | mi | mile |
| cm | centimetre | min | minute |
| cm2 | square centimetre | µm | micrometre |
| CoG | cut-off grade | mm | millimetre |
| CWI | Bond Crusher Work Index | MMI | mobile metal ions |
| CWS | capitalized waste stripping | mph | miles per hour |
| d | day | MVA | megavolt-amperes |
| D1 | first phase of deformation | MW | megawatt |
| D2 | second phase of deformation | MWh | megawatt-hour |
| DD | diamond drill | NQ | 47.6 mm drill core size |
| dia | diameter | oz | Troy ounce (31.1035g) |
| dmt | dry metric tonne | oz/st, opt | ounce per short ton |
| dwt | dead-weight ton | PAL | Pulverize and Leach |
| DWT | JK Drop-Weight Test | pH | potential of hydrogen |
| °F | degree Fahrenheit | ppb | part per billion |
| ft | foot | ppm | part per million |
| ft2 | square foot | psia | pound per square inch absolute |
| ft3 | cubic foot | psig | pound per square inch gauge |
| ft/s | foot per second | QA/QC | quality assurance/quality control |
| g | gram | Qemscan | Quantitative Evaluation of Minerals by SCANning electron microscopy |
| G | giga (billion) | UJV | Unincorporated Joint Venture |
| Ga | billion years | US$ | United States dollars |
| Gal | Imperial gallon | RC | reverse circulation |
| g/L | gram per litre | RL | relative elevation |
| GMD | Geological Mining Department | ROE | Right of Exploration |
| Gpm | Imperial gallons per minute | RQD | rock quality designation |
| g/t | gram per tonne | s | second |
| gr/ft3 | grain per cubic foot | SAG | Semi Autogenous Grinding Mill |
| gr/m3 | grain per cubic metre | SMC | drop-weight testing |
| IAMGOLD Corporation - Rosebel Gold Mine | |
| Technical Report NI 43- 101 – November 5, 2018 | Page 2-4 |
| G&A | general and administrative | SPI | Semi Autogenous Grinding Mill Power Index |
| ha | hectare | SRM | standard reference material |
| hp | horsepower | st | short ton |
| hr | hour | stpa | short ton per year |
| HQ | 63.5 mm drill core size | stpd | short ton per day |
| Hz | hertz | t | metric tonne |
| IASB | International Accounting Standards Board | tpa | metric tonne per year |
| IFRIC | International Financial Reporting Interpretations Committee | tpd | metric tonne per day |
| in. | inch | TTG | tonalite-trondjhemite-granodiorite |
| in2 | square inch | US$ | United States dollar |
| J | joule | USg | United States gallon |
| IP | Induced polarization | USgpm | US gallon per minute |
| k | kilo (thousand) | V | volt |
| kcal | kilocalorie | W | watt |
| kg | kilogram | wmt | wet metric tonne |
| km | kilometre | wt% | weight percent |
| km2 | square kilometre | w/v | Weight per volume |
| km/h | kilometre per hour | w/w | weight per weight |
| kPa | kilopascal | yd3 | cubic yard |
| kVA | kilovolt-amperes | yr | year |
| IAMGOLD Corporation - Rosebel Gold Mine | |
| Technical Report NI 43- 101 – November 5, 2018 | Page 2-5 |
| 3 |
RELIANCE ON OTHER EXPERTS |
This Technical Report was prepared by RGM, IAMGOLD, and SRK personnel. For the purpose of this report, QPs have relied on the following subject matter experts:
Section 4 – Property Description and Location
The QP has relied on ownership information provided by Ms. Sharmila Jadnanansing, IAMGOLD’s legal counsel in Suriname, regarding title to the RGM concession. Ms. Jadnanansing provided a legal review and opinion dated October 18, 2018. This information was used in Sections 1 and 4 of this report.
| IAMGOLD Corporation - Rosebel Gold Mine | |
| Technical Report NI 43- 101 – November 5, 2018 | Page 3-1 |
| 4 |
PROPERTY DESCRIPTION AND LOCATION |
| 4.1 |
RGM PROPERTY |
The Gross Rosebel concession (RGM concession) (Geological Mining Department (GMD) No. 468/02) covers an area of 170.0 km² in the north central part of the Republic of Suriname at a latitude of 5° 25’ North and a longitude of 55° 10’ West. The RGM concession lies in the district of Brokopondo, between the Suriname River to the east and the Saramacca River to the west, approximately 80 km south of the capital city of Paramaribo (Figure 4-1).
| 4.1.1 |
LAND TENURE |
The Rosebel Gold Mine area consists of the following concessions: Gross Rosebel concession (or the RGM concession), which contains the Royal Hill, Mayo, Roma, Rosebel, Koolhoven, Pay Caro, East Pay Caro, and J Zone deposits, and seven exploration concessions (Headley’s Reef, Charmagne 1, Charmagne 2, Charmagne West, Thunder Mountain, Anjoemara en Lef Resources, and Brokolonko), all located on contiguous ground (Figure 4-2).
All these concessions are owned by RGM which is a Surinamese company created for the purpose of exploring for and developing all minerals including gold, precious metals, base metals and stones and operating the Rosebel Gold Mine. IAMGOLD owns a 95% interest in RGM, while the Republic of Suriname has a 5% free-carried interest.
| IAMGOLD Corporation - Rosebel Gold Mine | |
| Technical Report NI 43- 101 – November 5, 2018 | Page 4-1 |
FIGURE 4-1 LOCATION MAP

| IAMGOLD Corporation - Rosebel Gold Mine | |
| Technical Report NI 43- 101 – November 5, 2018 | Page 4-2 |
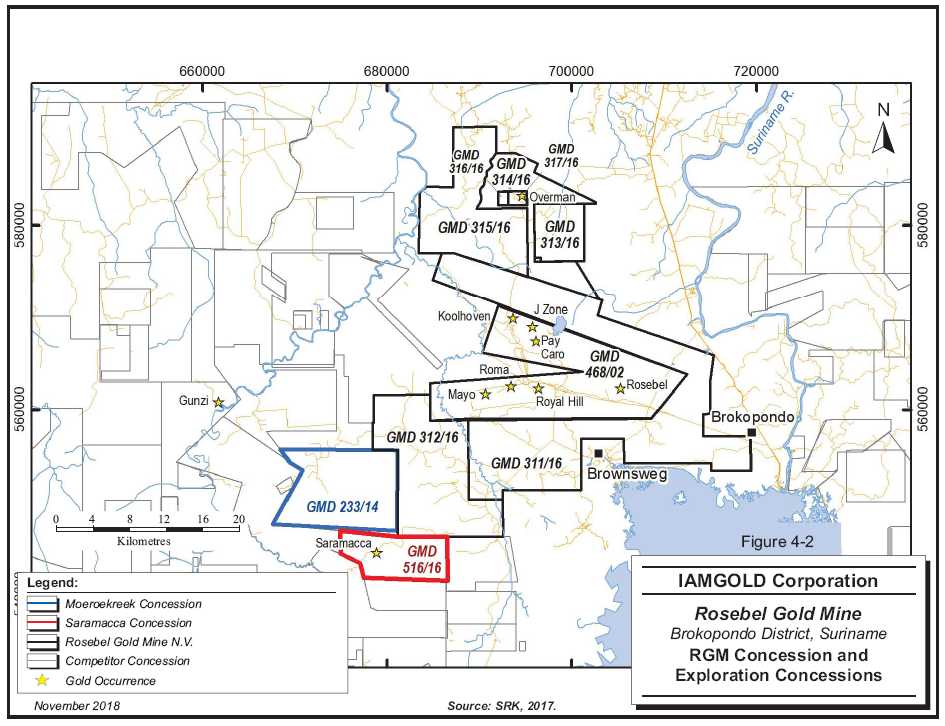
| IAMGOLD Corporation - Rosebel Gold Mine | |
| Technical Report NI 43- 101 – November 5, 2018 | Page 4-3 |
| 4.1.2 |
MINING PERMIT |
The rights to the Rosebel mine property were initially held through a Right of Exploration (ROE) granted by the Ministry of Natural Resources, valid and renewable for two-year periods. The ROE was renewed and extended for two years as from February 25, 2002, in favour of Golden Star. On May 16, 2002, Golden Star assigned, conveyed, and transferred its Gross Rosebel ROE to RGM. Finally on December 16, 2002, RGM was granted a 25-year renewable Right of Exploitation for the Rosebel mine from the Republic of Suriname, following the Government’s approval of the updated feasibility study and environmental impact assessment. The term of the Rosebel concession can be extended by a period of 15 years from its current expiration date.
In addition to the 5% interest in RGM, the Republic of Suriname receives, through a Government owned company, a 2% fixed royalty of production paid in-kind. Further, RGM pays an excess royalty of 6.5% in case the gold price is in excess of US$425/oz. Royalties on production are also paid out to Euro Resources SA (Euro Resources). The royalty is applicable to the first seven million ounces of gold produced, with payments based on 10% of the excess gold market price above US$300/oz for soft and transitional ore, and above US$350/oz for hard rock ore, after deduction of royalties to the Republic of Suriname.
The Republic of Suriname also collects various taxes and duties as specified by the Mineral Agreements and its Amendments, Mining Code, and the applicable Tax Laws, such as corporate taxes, payroll taxes, consent and static rights, as well as surface rights.
| 4.1.3 |
EXPLORATION PERMITS |
The RGM concession is surrounded by seven ROEs which currently cover a total area of 948.20 km2 and by Project Lands covering a total area of 10.2 km2 (Figure 4-2). The Minister of Natural Resources has approved the request of RGM for the use of Triangle area as a Project with a total area of 44.95 km². The approval was communicated by letter dated June 29, 2018.
Two exploration concessions are directly adjacent to the RGM concession and include Headley’s Reef and Thunder Mountain concessions which were in the past renewed in favour of Golden Star and thereafter assigned, conveyed and transferred to RGM simultaneously with the RGM concession. The total area of the two ROEs is 424.15 km2 and surrounds the RGM concession.
| IAMGOLD Corporation - Rosebel Gold Mine | |
| Technical Report NI 43- 101 – November 5, 2018 | Page 4-4 |
The Overman project is located within the Charmagne property, located about 12-15 km north of the RGM concession. The Charmagne property consists of four concessions that involve two companies: Charmagne Mining Company who was the registered owner of three ROEs and LEF Resources who was the registered owner of one ROE. RGM negotiated the option to acquire 100% interest in the mineral rights of the two companies and option agreements were signed in January 2008. The options were exercised by RGM and duly filed with the relevant Government Authorities, followed by issuance of rights of exploration to RGM as mentioned under the Second Amendment.
Another ROE has been granted to RGM directly to the west of the Charmagne property and is referred to as Charmagne West.
The Brokolonko exploration concession was granted to RGM on February 7, 2018 after RGM applied for the ROE.
Information related to the exploration concessions is listed in Table 4-1. The Minister of Natural Resources has recently re-issued the seven exploration rights as agreed in the Second Amendment 2013. The seven ROEs are in good standing and valid until August 2020 subject to two extensions of two years as provided in the Mining Decree 1986 of the Republic of Suriname.
TABLE 4-1 EXPLORATION PERMIT DETAILS
| Concession Name | GMD No. | Expiry Date (date of validity) |
Surface Area (ha) |
Surface Area (km2) |
| ROSEBEL MINE Area | ||||
| Gross Rosebel Mine | Exploitation Concession | 2027-12-16 | 17,000 | 170.00 |
| GMD No. 468/02 | ||||
| Total | 17,000 | 170.00 | ||
| Thunder Mountain | Exploration Concession | 2020-08-25 | 28,850 | 288.50 |
| GMD No. 311/16 | ||||
| Headley's Reef | Exploration Concession | 2020-08-25 | 13,565 | 135.65 |
| GMD No. 312/16 | ||||
| Total | 42,415 | 424.15 |
| IAMGOLD Corporation - Rosebel Gold Mine | |
| Technical Report NI 43- 101 – November 5, 2018 | Page 4-5 |
| Concession Name | GMD No. | Expiry Date (date of validity) |
Surface Area (ha) |
Surface Area (km2 ) |
| CHARMAGNE Property | ||||
| Charmagne - LEF | Exploration Concession | 2020-08-25 | 300 | 3.00 |
| GMD No. 317/16 | ||||
| Charmagne 1 | Exploration Concession | 2020-08-25 | 5,831 | 58.31 |
| GMD No. 314/16 | ||||
| Charmagne 2 | Exploration Concession | 2020-08-25 | 3,281 | 32.81 |
| GMD No. 313/16 | ||||
| Charmagne - Anjoemara | Exploration Concession | 2020-08-25 | 156 | 1.56 |
| GMD No. 316/16 | ||||
| Total | 9,568 | 95.68 | ||
| CHARMAGNE WEST Property | ||||
| Charmagne West | Exploration Concession | 2020-08-25 | 10,768 | 107.68 |
| GMD No. 315/16 | ||||
| BROKOLONKO Property | ||||
| Brokolonko | Exploration Concession | 2021-02-07 | 10,082.5 | 100.83 |
| GMD No. 1157/17 | ||||
| SARAMACCA Property | ||||
| Saramacca | Exploration Concession | 2019-08-31 | 4,986 | 49.86 |
| GMD No. 516/16 | ||||
| TOTAL SURFACE | 94,819.5 | 948.20 |
For information on the Saramacca exploration concession see Section 4.2, Saramacca property.
The Mining Decree 1986 of Suriname states that, exploration concessions are held for a maximum of seven years (an initial term of three years, a first extension of two years, and a second extension of two years). After the initial three years, 25% relinquishment is required followed by 25% in the subsequent two extensions, and then a final relinquishment after the seventh year. Some exploration concessions are currently in the renewal process. The Mining Decree 1986 gives the ROE holder the exclusive right to explore for the minerals requested on the surface and subsurface within the boundaries of the exploration concession.
The Mining Decree 1986 of Suriname also provides for the holder of the ROE to apply for a Right of Exploitation.
The different ROEs fall also within the Area of Interest or the new Unincorporated Joint Venture (UJV) area as defined in The Second Amendment of the Mineral Agreement with the Republic of Suriname of June 6, 2013. The Second Amendment establishes a UJV vehicle under which RGM holds a 70% participating interest and the Republic of Suriname could acquire a 30% participating interest on a fully-paid basis, via a fully owned designated company.
| IAMGOLD Corporation - Rosebel Gold Mine | |
| Technical Report NI 43- 101 – November 5, 2018 | Page 4-6 |
| 4.1.4 |
SURFACE RIGHTS |
Surface rights in the area of the Gross Rosebel Mining Concession belong to the Republic of Suriname. Utilization of the surface rights is granted by the RGM concession under certain conditions. All the annual fees and taxes relating to Gross Rosebel and other ROEs have been paid to date and the concessions are in good standing.
| 4.1.5 |
PERMITTING REQUIREMENTS AND STATUS OF PERMITS |
The Right of Exploitation of the RGM concession property is governed by the following major Instruments, Agreements, and National Laws:
| 1. |
The Instrument granting the Right of Exploitation to RGM under GMD No. 468/02. | |
| 2. |
Approval Instrument issued by the Ministry of Natural Resources to transfer the ROE from Golden Star to RGM. | |
| 3. |
The Second Amendment to the Mineral Agreement, June 6, 2013. | |
| 4. |
The Mineral Agreement April 7, 1994, as amended and supplemented on March 13, 2003. | |
| 5. |
The Mining Decree of Suriname May 8, 1986. | |
| 6. |
National Institute for Environment and Development in Suriname (NIMOS) for the Environmental and Social Impact Assessment (ESIA). |
The ROE for Minerals is granted by the Ministry of Natural Resources subject to terms and conditions stipulated in the Mining Decree 1986. Following issuance of such a right the holder is required to file quarterly and annual reports with the GMD.
Furthermore, the instrument granting the ROE enumerates all the conditions which need to be considered and complied with during the exploration phase. There are no specific pre-environmental requirements in this phase, however, the ROE stipulates that exploration activities should be conducted conform to Environmental Standards of the World Bank.
| 4.2 |
SARAMACCA PROPERTY |
The Saramacca gold project is located approximately 25 km southwest of the Rosebel Gold Mine milling facility (Figure 4-2). The Saramacca property covers an area of approximately 4,986 ha, straddling the Brokopondo and Sipaliwini districts of Suriname. To the northeast, the property is adjoined to the Headley’s Reef concession, which is 95% owned by RGM and 5% owned by the Republic of Suriname. The property is also adjacent to the Moeroekreek exploration concession, which is under a lease agreement with the option to acquire this concession from Sarafina N.V., a Surinamese mining company.
| IAMGOLD Corporation - Rosebel Gold Mine | |
| Technical Report NI 43- 101 – November 5, 2018 | Page 4-7 |
The centre of the property is located at an approximate latitude of 4° 55’ North and a longitude of 55° 22’ West.
| 4.2.1 |
MINERAL TENURE |
RGM holds a 70% interest in the Saramacca gold project (IAMGOLD’s effective interest is 66.5%) . The mineral rights comprise a single exploration concession (GMD No. 516/16) covering an area of 4,986 ha (Figure 4-2).
On August 30, 2016, IAMGOLD signed a Letter of Agreement (LOA) with the Republic of Suriname to acquire the rights to the Saramacca property, with the intent of defining an NI 43-101 Mineral Resource within 24 months. The terms of the LOA included an initial payment of US$200,000 which enabled immediate access to the property for IAMGOLD-RGM’s exploration team to conduct due diligence, as well as access to historical data from previous exploration activity at the Saramacca property.
On September 29, 2016, having been satisfied with the results of the due diligence, IAMGOLD ratified the LOA by Ratification Letter and amended the amended LOA on December 12, 2016 to acquire the Saramacca property. IAMGOLD subsequently paid $10 million in cash and agreed to issue 3.125 million IAMGOLD common shares to the Republic of Suriname in three approximately equal annual instalments on each successive anniversary of the date the ROE was transferred to RGM. The ROE to the Saramacca property was legally transferred by Notarial Deed to Rosebel on December 14, 2016 and subsequently registered as such in the formal Mortgage Registry office, the GLIS Management Institute.
In addition, the amended LOA provides for a potential upward adjustment to the purchase price to a maximum of $10 million, based on the contained gold ounces identified by RGM in CIM Measured and Indicated Mineral Resource categories, within a certain Whittle shell within the first 24 months.
| IAMGOLD Corporation - Rosebel Gold Mine | |
| Technical Report NI 43- 101 – November 5, 2018 | Page 4-8 |
The Saramacca property falls within the Area of Interest or the Unincorporated Joint Venture (UJV) area as defined in The Second Amendment of the Mineral Agreement with the Republic of Suriname of June 6, 20131.
The Second Amendment establishes a UJV under which Rosebel holds a 70% participating interest and the Republic of Suriname will acquire a 30% participating interest on a fully-paid basis, via a fully owned designated company.
The Mining Decree of 1986 of Suriname states that, exploration concessions are held for a maximum of seven years; an initial term of three years, a first extension of two years and a second extension of two years. After the initial three years, 25% relinquishment is required, followed by 25% in the subsequent two extensions, and then a final relinquishment after the seventh year. The Saramacca concession is currently in the second year of exploration of the initial three years.
The Mining Decree of 1986 of Suriname also provides for the holder of the ROE to apply for a Right of Exploitation.
For the Saramacca gold project, the granting of the Right of Exploitation is subject to specific terms and conditions as stated in the Second Amendment under the condition that an Environmental and Social Impact Assessment (ESIA) is required relative to the planned exploitation activities and any impacts resulting thereof, in accordance with the Surinamese law.
| 4.2.2 |
UNDERLYING AGREEMENTS |
IAMGOLD is currently the registered owner of 95% in RGM and RGM is currently the registered owner of 100% interest in the Saramacca exploration concession. RGM is subject to the Unincorporated Joint Venture vehicle under which RGM will hold a 70% participating interest and the Republic of Suriname will acquire a 30% participating interest on a fully-paid basis.
_________________________________________________
1
The Second Amendment of the Mineral Agreement between Republic of Suriname,
Grasshopper Aluminium Company N.V., IAMGOLD Corporation and Rosebel Gold Mines
N.V. of April 7, 1994 and as amended on March 13, 2003.
| IAMGOLD Corporation - Rosebel Gold Mine | |
| Technical Report NI 43- 101 – November 5, 2018 | Page 4-9 |
| 4.2.3 |
PERMITS AND AUTHORIZATION |
The ROE of the Saramacca property is governed by the following major Instruments, Agreements, and National Laws:
| 1. |
The letter of Agreement dated August 30, 2016. | |
| 2. |
Ratification Letter dated September 29, 2016. | |
| 3. |
Amendment to the Letter of Agreement dated December 12, 2016. | |
| 4. |
The Notarial Deed of transfer of the Right of Exploration of the Saramacca property dated December 12, 2016, from the wholly Republic of Suriname owned Company, NV 1, to Rosebel Gold Mines N.V. | |
| 5. |
The Instrument granting the Right of Exploration under GMD No. 516/16. | |
| 6. |
Approval Instrument issued by the Ministry of Natural Resources to transfer this Right of Exploration (GMD No. 706/16). | |
| 7. |
Mortgage extract from the GLIS Management Institute effectuating the transfer of the title to the Saramacca property to Rosebel Gold Mines N.V. as of December 14, 2016. | |
| 8. |
The second amendment to the Mineral Agreement dated June 6, 2013. | |
| 9. |
The Mineral Agreement of April 7, 1994, as amended and supplemented on March 13, 2003. | |
| 10. |
The Mining Decree of May 8, 1986 (Mining Law of Suriname). | |
| 11. |
National Institute for Environment and Development in Suriname (NIMOS) for the Environmental and Social Impact Assessment (ESIA). |
The ROE for Minerals are granted by the Ministry of Natural Resources, subject to terms and conditions stipulated in the Mining Decree of 1986. Following issuance of such a right, the holder is required to file quarterly and annual reports with the GMD.
Furthermore, the instrument granting the ROE enumerates all the conditions which need to be considered and complied with during the exploration phase. There are no specific pre-environmental requirements in this phase, however, the ROE stipulates that exploration activities should be conducted in a way which conform to the Environmental Standards of the World Bank.
| IAMGOLD Corporation - Rosebel Gold Mine | |
| Technical Report NI 43- 101 – November 5, 2018 | Page 4-10 |
| 4.3 |
DISCUSSION |
Other than the royalty on the revenues from mineral production to the Republic of Suriname as well as royalties to Euro Resources, IAMGOLD is not aware of any royalties, back-in rights, payments, or other agreements and encumbrances to which the property is subject.
IAMGOLD is not aware of any environmental liabilities on the property. IAMGOLD has all required permits to conduct the proposed work on the property. IAMGOLD is not aware of any other significant factors and risks that may affect access, title, or the right or ability to perform the proposed work program on the property.
| IAMGOLD Corporation - Rosebel Gold Mine | |
| Technical Report NI 43- 101 – November 5, 2018 | Page 4-11 |
| 5 |
ACCESSIBILITY, CLIMATE, LOCAL RESOURCES, INFRASTRUCTURE AND PHYSIOGRAPHY |
| 5.1 |
TOPOGRAPHY, ELEVATION, AND VEGETATION |
The physical geography of Suriname is divided into three areas: the Coastal Plain, the Savannah Belt, and the Guiana Shield. The Guiana Shield comprises approximately 80 to 85% of the total land area of Suriname, and extends into French Guiana to the east, Brazil to the south, and Guyana, Columbia and Venezuela to the west. RGM is located within the Guiana Shield.
The Guiana Shield is mostly low-lying (below 250 m) and hilly (with discrete ranges reaching 1,200 metres above sea level (MASL). Most of Guiana Shield is pristine and covered with dry land forest, except where poor soil or repeated burning of the vegetation have led to the creation of savannas.
The Saramacca gold project lies along the Brokolonko Ridge, a northwest trending ridge of nearly 30 km and reaching an elevation of 530 MASL. Although the ridge can locally be steep, the Saramacca property is located on the northeastern side of the ridge in an area where slopes are moderate and the crest remains below 450 m. The ridge is dissected by the Saramacca River near its northwestern extremity.
The ridge crest is generally covered by a thick duricrust layer of up to 6 m in thickness. Slopes are either pisolithic clays, clays or colluvium. A mature tropical forest grows on the Brokolonko ridge and on the surrounding lower-lying plains. Rock outcrops are scarce and limited to road cuts and creek beds.
| 5.2 |
ACCESSIBILITY |
There are presently two access routes from Paramaribo to the Rosebel project. One route utilizes a 30 km paved road which connects Paramaribo to Paranam. From Paranam, a paved road courses south following the Afobaka road. From there an unpaved road travels south and west to reach the property. The other route is a paved road which connects Paramaribo to the international airport at Zanderij. A newly paved road connects Zanderij to the Afobaka road halfway between Paranam and Afobaka. The route then follows the Afobaka, Brownsweg, and Nieuw-Koffiekamp roads until reaching the property access road. Travel distance for both routes from Paramaribo is approximately 100 km.
| IAMGOLD Corporation - Rosebel Gold Mine | |
| Technical Report NI 43- 101 – November 5, 2018 | Page 5-1 |
The Saramacca gold project is located approximately 25 km southwest of the Rosebel Gold Mine milling facility. Access is via the paved Afobaka road heading south from Paramaribo and then to Brownsweg. From Brownsweg, the road continues south to Atjoni/Pokigron. The turnoff to Saramacca occurs 25 km after Brownsweg. The project is located a further 14 km westward along a reasonable quality all weather active logging road. During the dry season, it takes approximately 1.5 hours to travel from the Rosebel Gold Mine site to the Saramacca concession.
A 36 km unsealed road was built from the Rosebel mine site to the Saramacca concession in 2016. Access roads in the area are typically saprolite and are not accessible year-round, as they wash out or become hazardous in the wet seasons. The logging road to the project area is generally well maintained and can be driven on with caution during the wet season.
| 5.3 |
CLIMATE AND LENGTH OF OPERATING SEASON |
The climate of Suriname is classified as tropical, i.e. warm during the entire year with the mean temperature of the coldest month being higher than 20°C. The average monthly rainfall is greater than 60 mm in the driest month(s). Like much of Suriname, the Rosebel property is characterized by consistently warm temperatures and high humidity with little seasonal variation.
Suriname weather is dictated mainly by a north-east and south-east wind called the Inter-Tropical Convergence Zone (“ITC” zone, also known as the “Equatorial Trough”). The ITC zone passes over Suriname twice a year and results in four seasons:
| • | Late February to late April, a short dry season; | |
| • | Late April to mid-August, a long rainy season; | |
| • | Mid-August to early December, a long dry season; | |
| • | Early December to late February, a short rainy season. |
| IAMGOLD Corporation - Rosebel Gold Mine | |
| Technical Report NI 43- 101 – November 5, 2018 | Page 5-2 |
Exploration and production activities can be carried out in all seasons.
Weather data is collected on the Rosebel property on a regular basis since 2003 using a manual weather station (Old Camp) and since 2005 using an automated weather station (tailings area).
Based on Old Camp data from 2004 to 2016, the average annual precipitation was estimated to be 2,288 mm per year, while the mean annual temperature for Rosebel is 25.0°C. The daily fluctuation in temperature in the interior of Suriname, including the Rosebel area, is approximately 10 to 12°C. The average monthly relative humidity at Rosebel ranges from 84.8% in February to 93.5% in June, with an annual average of 89%. This relative humidity trend results from rainfall and temperature changes.
The most common wind direction is from the east (approximately 20% of the time) followed by the south-east (approximately 9% to 14% of the time). Based on data, the Rosebel site does not experience sustained strong winds, i.e. hourly average wind speeds greater 5.0 m/s. The most common wind speed range is 1.0 m/s to 2.5 m/s.
| 5.4 |
SURFACE AREA AND PHYSICAL RESOURCES |
The Rosebel area currently hosts the small village of Nieuw-Koffiekamp, located approximately 2 km from the old exploration base camp and about 1 km from the Royal Hill pits. The village consists of approximately 500 permanent inhabitants belonging primarily to the Maroon group, who are descendants of African slaves.
The economy of the village remains dependent on the Surinamese coastal economy. Main activities include subsistence agriculture on relatively poor land, small-scale gold mining, forestry, and trade.
The village, originally named Koffie Kamp, relocated to its present site in 1964 when the previous site was flooded as a result of the development of the Brokopondo hydroelectric project. Relations between the project management and the villagers have occasionally been strained due primarily to the conduct of illegal mining activities on the Rosebel property by the villagers and others.
| IAMGOLD Corporation - Rosebel Gold Mine | |
| Technical Report NI 43- 101 – November 5, 2018 | Page 5-3 |
Other than the road between Paramaribo and the mine site, the local infrastructure consists of site roads that include access from the main gate to the camp, pits, tailing area, the process plant area, and administration building area. These roads are constructed using laterite and are typically between 10 m and 30 m wide, depending on the equipment in use. Culverts are installed and ditching is installed to provide adequate drainage.
An existing airstrip with an approximate length of 1.2 km is used for emergency evacuation. The airstrip is located 6 km from the administration building.
The camp complex is located approximately 0.5 km to the south of the process plant and truck shop/administration building. The camp complex includes a kitchen, recreation area, camp offices, and different types of dormitories.
Miscellaneous outbuildings such as core storage, laboratories, security gates, lunchrooms, and solar panels are found throughout the concession.
Electrical energy is purchased directly from the Surinamese government. Power is delivered from the Afobaka hydroelectric generating station.
Potable and process water is supplied from water wells located along the Mamanari Creek near the camp complex.
| IAMGOLD Corporation - Rosebel Gold Mine | |
| Technical Report NI 43- 101 – November 5, 2018 | Page 5-4 |
| 6 |
HISTORY |
| 6.1 |
RGM - OWNERSHIP, EXPLORATION, AND DEVELOPMENT HISTORY |
Documentation on the history of gold production on the Rosebel property is fragmentary. Records were either not kept or, in most cases, have disappeared. Gold was first discovered in the area in 1879, when approximately 600 small scale miners were reported to be working on the property, and since that time approximately half of the recorded production of Suriname has been produced from the district.
Between 1885 and 1939, several large companies exploited alluvial material, surface deposits, and veins. Various methods of mechanized mining were tried, including dredges, stamp mills, and hydro-sluicing, with varying degrees of success. The larger companies eventually subleased concessions to miners, who continued exploitation using manual recovery methods. Some of the more prominent companies that operated in the area, and for which records still exist, are listed below.
Guyana Gold Placer Company operated dredges in Niew Foto and Groote Louis Creeks of the Koolhoven area circa 1910. That company sub-leased some ground in the Koolhoven area to an American group, who underground-mined on a series of quartz veins up to 5 m wide. Production was said to include a “nugget” of nearly eight ounces.
De Jong Brothers owned the Royal Hill area, which was mined manually by adits, shafts, and open cuts during the 1920s and early 1930s. Records indicate that from 1924 to 1933 the average output was 1,600 ounces of gold a year.
White Water Mines Ltd. acquired the aforementioned area from De Jong in 1935. Widespread veins were mined by shafts and adits, ore being carried to a central mill by narrow-gauge railway. Production ceased in 1939, at the start of the Second World War, and no record is available.
Van Emden Gold Mines Ltd. operated three mines in the area in the 1930s: Mayo, Koolhoven, and Donderbari. These were the best-planned, operated, and capitalized operations to date, using large-size ball and stamp mills and extensive narrow-gauge railway systems.
| IAMGOLD Corporation - Rosebel Gold Mine | |
| Technical Report NI 43- 101 – November 5, 2018 | Page 6-1 |
The Suriname Government, which operated the deposit intermittently from 1950 to 1952, reports some production from Royal Hill. Since that time, several companies or individuals have carried out resource estimations on the Rosebel gold deposits. Historical Mineral Resource estimates presented in this section are historical in nature and should not be relied upon. They are superseded by the Mineral Resource estimates discussed in Section 14 of this Technical Report.
| 6.1.1 |
PRIOR OWNERSHIP |
| 6.1.1.1 |
SURPLACER – 1976 |
In 1974, the present property was granted to Surplacer, a joint venture between Placer Development Ltd. (Placer) of Vancouver, and the Surinamese Government. The exploration program identified several kilometre-long gold anomalies, located along two major trends, one in the North and the other in the South of the area. Detailed follow-up work, involving 900 hand auger holes, 4 km of bulldozer trenches and 43 reverse circulation (RC) drill holes, partially delineated surficial and near-surface gold mineralization: the Royal Hill, Mayo, and Rosebel areas in the south and Pay Caro in the north. When Placer terminated the joint venture and left Suriname in 1977, the resource estimate indicated nearly 700,000 ounces of gold.
| 6.1.1.2 |
GRASSALCO – 1984 |
On July 26, 1979 the Rosebel property was awarded to NV Grassalco (Grassalco), which carried out a new resource estimate based on 1,500 hand auger holes, and excluded the Placer data. Grassalco was forced to abandon operations in the middle of 1985, due to an unstable political situation.
| 6.1.1.3 |
SMITH – 1987 |
The last work performed in respect of the Rosebel property and prior to its acquisition by Golden Star Resources, was a Ph.D. thesis by I.H. Smith, of the University College of Cardiff, Wales in 1987. That thesis evaluated resources from several gold deposits in Suriname using a statistical interpretation of results.
| 6.1.1.4 |
GOLDEN STAR |
Golden Star acquired the ROE to the Rosebel property pursuant to a Preliminary Mineral Agreement between Golden Star, Grassalco, and the Government of Suriname dated May 8, 1992. The 1994 Mineral Agreement between Golden Star, Grassalco, and the Government of Suriname was signed on April 7, 1994 and replaced the 1992 agreement; in accordance with the 1994 Mineral Agreement, Golden Star was granted the ROE for the Rosebel property for five years.
| IAMGOLD Corporation - Rosebel Gold Mine | |
| Technical Report NI 43- 101 – November 5, 2018 | Page 6-2 |
Golden Star entered into an agreement with Cambior Inc. (Cambior) on June 7, 1994, granting Cambior the option to earn an undivided 50% of Golden Star’s interest in the 1994 Mineral Agreement and the Rosebel property. This agreement provided that Cambior shall exercise its option by funding approximately $6.1 million in exploration and development expenditures on the Rosebel property by June 30, 1996.
A Feasibility Study and an Environmental Impact Statement were filed with the Government of Suriname in May 1997. Following additional drilling on the property, a revised Feasibility Study was submitted to the Government of Suriname in December 1997. In 1998, 1999, and 2000, the Rosebel project remained on care and maintenance.
In December 2000, a Pre-feasibility Study was delivered to the Ministry of Natural Resources covering only the mining and processing of the soft rock and transition ore portions of the Rosebel deposits, then reducing the project’s estimated capital expenditures to $80 million from the $175 million contemplated in the original 1997 Feasibility Study. The Feasibility Study completed in August 2002 replaces both the November 1997 and December 2000 studies.
On October 26, 2001, Cambior agreed to acquire Golden Star’s 50% interest in the Rosebel property. Golden Star agreed to sell its 50% interest in Rosebel for a cash consideration of $8 million and a gold price participation right on future production from Rosebel; $5 million was paid at closing (May 2002) and the remainder in three equal installments were paid over a three-year period. Under its gold price participation right, Golden Star would receive a quarterly payment of an amount equal to 10% of the excess, if any, of the average quarterly market price above US$300/oz for gold production from RGM’s soft and transitional rock portions and above US$350/oz from RGM’s hard rock portion, up to a maximum of seven million ounces produced. In addition, Golden Star transferred its rights in the Headley’s Reef and Thunder Mountain exploration properties adjacent to Rosebel.
Commercial production at Rosebel Gold Mines began in February 2004. In 2004, Golden Star sold the royalty interest in production at the Rosebel property to Euro Resources (formerly Guyanor Resources SA).
| IAMGOLD Corporation - Rosebel Gold Mine | |
| Technical Report NI 43- 101 – November 5, 2018 | Page 6-3 |
| 6.1.2 |
IAMGOLD |
In November 2006, IAMGOLD acquired a 100% interest in Cambior (the previous owner of RGM), thereby acquiring 95% of RGM.
In December 2008, IAMGOLD acquired 84.55% of the current share capital of Euro Resources.
In June 2013, IAMGOLD, RGM, Grasshopper Aluminum Company N.V., and the Republic of Suriname executed the Second Amendment to the Mineral Agreement. The Second Amendment created a new Unincorporated Joint Venture vehicle (UJV) in which the Republic of Suriname would hold, through NV1, a wholly owned subsidiary of the Republic, a paid 30% interest and RGM would hold a 70% interest. Under the terms of the Second Amendment, NV1 has been granted an option to acquire an increased interest in production from the RGM concession if RGM approves a Significant Expansion of the existing mill and if NV1 elects to participate in the Significant Expansion by funding 30% of the capital required for the expansion. A Significant Expansion is defined in the Second Amendment as an increase in the milling capacity of the Rosebel mill of 3.0 Mtpa or as otherwise agreed by the UJV partners, NV1, and RGM. At the present time, RGM has not approved a Significant Expansion and the UJV partners are not actively evaluating a potential Significant Expansion of the Rosebel mill.
In December 2015, IAMGOLD announced the closing of a simplified tender offer for Euro Resources through the Euronext Paris. At the closing of the simplified tender, in conjunction with purchases made by IAMGOLD through the facilities of the Euronext Paris since the submission of the draft offer to the French Autorité des Marchés Financiers, IAMGOLD owns and controls approximately 90% of the outstanding common shares of Euro Resources.
| 6.1.3 |
RGM - PAST PRODUCTION |
Table 6-1 summarizes production from 2004 through 2017.
| IAMGOLD Corporation - Rosebel Gold Mine | |
| Technical Report NI 43- 101 – November 5, 2018 | Page 6-4 |
TABLE 6-1 PAST PRODUCTION
| Total | 2004 | 2005 | 2006 | 2007 | 2008 | 2009 | 2010 | 2011 | 2012 | 2013 | 2014 | 2015 | 2016 | 2017 | ||
| Ore | Mt | 161.4 | 6.3 | 6.9 | 7.0 | 7.8 | 8.9 | 12.4 | 13.4 | 13.3 | 14.1 | 13.6 | 13.9 | 14.1 | 14.7 | 15.0 |
| Grade | g/t Au | 1.02 | 1.73 | 1.57 | 1.40 | 1.27 | 1.26 | 1.22 | 1.05 | 0.98 | 0.97 | 0.89 | 0.80 | 0.74 | 0.78 | 0.72 |
| Waste | Mt | 517.4 | 10.6 | 15.1 | 21.6 | 28.2 | 35.5 | 41.0 | 38.9 | 39.8 | 43.1 | 47.8 | 49.2 | 49.4 | 49.4 | 47.8 |
| Total | Mt | 678.7 | 16.9 | 21.9 | 28.6 | 36.0 | 44.4 | 53.4 | 52.3 | 53.1 | 57.2 | 61.4 | 63.1 | 63.5 | 64.1 | 62.8 |
| Strip Ratio | 3.2 | 1.7 | 2.2 | 3.1 | 3.6 | 4.0 | 3.3 | 2.9 | 3.0 | 3.1 | 3.5 | 3.6 | 3.5 | 3.4 | 3.2 | |
| Milled | Mt | 148.3 | 5.1 | 7.2 | 7.7 | 7.5 | 8.3 | 11.1 | 12.8 | 12.9 | 12.8 | 12.3 | 12.9 | 12.3 | 12.6 | 12.8 |
| Ounces Produced | ‘000 oz | 4,826 | 282 | 339 | 300 | 277 | 331 | 412 | 416 | 406 | 401 | 386 | 344 | 302 | 312 | 318 |
| IAMGOLD Corporation - Rosebel Gold Mine | |
| Technical Report NI 43- 101 – November 5, 2018 | Page 6 - 5 |
| 6.2 |
SARAMACCA – OWNERSHIP, EXPLORATION, AND DEVELOPMENT HISTORY |
Exploration in Suriname began between 1600 and 1800 when British, Dutch, and French colonists explored the main rivers of the Guianas in search for gold and other resources. Expeditions at the end of the 19th century evolved to be more political, centred around progressing geological research for economic exploitation of the natural resources in the interior, especially for gold.
In more recent years the Republic of Suriname, through a geological reconnaissance program lead jointly by the Geological and Mining Service of Suriname (Geologisch Mijnbouwkundige Dienst van Suriname, abbreviated to GMD) and the University of Amsterdam, conducted large-scale mapping over vast portions of the country, including the Saramacca area. Various photogeological studies, field studies, and mapping programs, focussing primarily on gold and bauxite, were performed until the 1970s by the GMD. No specific study appears to have been executed on the Saramacca gold project area during that time.
| 6.2.1 |
PRIOR OWNERSHIP AND CHANGES |
The first recorded exploration on the Saramacca gold project was undertaken by Golden Star in 1994. During this time, the Saramacca concession was part of a larger grants package known as Kleine Saramacca.
In August 2006, Golden Star signed a joint venture with Newmont Mining Corporation (Newmont), whereby Golden Star would remain the operator of the Saramacca gold project. In 2007 and 2008 Newmont funded all exploration activities at Saramacca, with Golden Star personnel managing the project. During 2009, Newmont earned a 51% interest in the Saramacca gold project by spending $6.0 million on exploration expenditures and took over management of the programs.
In November 2009, Golden Star entered into an agreement to sell their interest in the Saramacca joint venture to Newmont for approximately $8.0 million. In December 2012, all requirements for the sale and transfer were met, and ownership and control of the Saramacca gold project was turned over to Newmont for a total consideration of $9.0 million in cash.
| IAMGOLD Corporation - Rosebel Gold Mine | |
| Technical Report NI 43- 101 – November 5, 2018 | Page 6-6 |
In 2013, the property was returned to the Republic of Suriname. RGM signed a Letter of Agreement with the Republic of Suriname on August 30, 2016, to acquire the rights to the Saramacca gold property.
| 6.2.2 |
PREVIOUS EXPLORATION WORK |
The Saramacca property has been explored since the 1990s, principally by Golden Star and later as a joint venture between Golden Star and Newmont. Much of the work focussed on the discovery and delineation of Anomaly M, which was the subject of successive auger and diamond drilling (DD) programs, with over 200 auger holes and 90 DD holes completed in the anomaly area. Anomaly M became the Saramacca gold project after IAMGOLD-RGM carried out exploration work in 2016 and 2017.
| 6.2.3 |
PREVIOUS MINERAL RESOURCE ESTIMATES |
Historical Mineral Resource estimates presented in this section are superseded by the Mineral Resource estimate discussed in Section 14 of this Technical Report. The information presented in this section is relevant to provide context but should not to be relied upon.
In October 2017, SRK prepared a NI 43-101 Technical Report (SRK, 2017b) in support of the maiden Mineral Resource estimate disclosed by IAMGOLD-RGM on August 28, 2017 for the Saramacca property (Table 6-2).
The 2017 Mineral Resource statement can be found on SEDAR (www.sedar.com), filed under IAMGOLD.
| IAMGOLD Corporation - Rosebel Gold Mine | |
| Technical Report NI 43- 101 – November 5, 2018 | Page 6-7 |
TABLE 6-2 PREVIOUS MINERAL RESOURCE
STATEMENT FOR SARAMACCA
PROPERTY, SRK CONSULTING (CANADA) INC., EFFECTIVE
AUGUST 28, 2017
| Category | Weathering Zone |
Cut-off Grade (g/t Au) |
Tonnes (000) |
Grade (g/t Au) |
Contained Ounces (000) 100% Basis |
| Indicated | Laterite | 0.25 | 2,372 | 1.20 | 91 |
| Saprolite | 0.25 | 5,573 | 2.43 | 436 | |
| Transition | 0.35 | 2,526 | 2.17 | 176 | |
| Fresh | 0.45 | 3,973 | 2.49 | 318 | |
| Total Indicated | 14,444 | 2.20 | 1,022 | ||
| Inferred | Laterite | 0.25 | 4,455 | 0.69 | 98 |
| Saprolite | 0.25 | 4,790 | 0.82 | 126 | |
| Transition | 0.35 | 1,349 | 1.97 | 86 | |
| Fresh | 0.45 | 3,039 | 2.13 | 208 | |
| Total Inferred | 13,632 | 1.18 | 518 |
Notes:
| 1. |
Mineral Resources are not Mineral Reserves and have not demonstrated economic viability. | |
| 2. |
CIM definitions were followed for classification of Mineral Resources. | |
| 3. |
All figures have been rounded to reflect the relative accuracy of the estimates. | |
| 4. |
Reported at open pit resource cut-off grades of 0.25 g/t Au for laterite and saprolite, 0.35 g/t Au for transition and 0.45 g/t Au for fresh. | |
| 5. |
Reported within a conceptual open pit shell optimized at a gold price of US$1,500 per troy ounce and assuming metallurgical recoveries of 97% for laterite and saprolite, 76% for transition and 82% for fresh. |
| IAMGOLD Corporation - Rosebel Gold Mine | |
| Technical Report NI 43- 101 – November 5, 2018 | Page 6-8 |
| 7 |
GEOLOGICAL SETTING AND MINERALIZATION |
| 7.1 |
REGIONAL GEOLOGY |
The RGM concession lies within a greenstone belt of the Paleoproterozoic Guiana Shield which stretches from the Amazon River in Brazil to the Orinoco River in Venezuela and covers an area of more than 900,000 km2. Most of the rocks of the Guiana Shield have been formed during the Paleoproterozoic Transamazonian or Late-Transamazonian orogeny. In its general distribution, the Proterozoic part of the Guiana Shield shows a south-westward younging of units with: tonalite-trondjhemite-granodiorite (TTG) greenstone belt to the North, granitoid succession mainly in the central part, and Late Paleoproterozoic to Mesoproterozoic volcanic, intrusive, and sedimentary rocks in the southernmost part (Figure 7-1). The geological evolution of the Guiana Shield is divided in four distinct stages which are either related to formation or reworking of in-place rocks. The four stages are: Formation of the Archean basement – Main Transamazonian orogeny – Late Transamazonian orogeny – subsequent Proterozoic and Paleozoic anorogenic events.
The main Transamazonian orogeny (D1), constrained between 2.26 -2.08 Ga, consisted of a crustal growth event that generated the TTG – greenstone belts found North of the Guiana Shield. The evolution of the orogeny has led to the development of strike-slip structures forming pull-apart basins along the North Guiana Trough. The lithostratigraphic succession of the greenstone belts is defined by:
| • | a lower unit of oceanic pulverizer basalts overlain by |
| o | mainly calc-alkaline volcanic suite including felsic to mafic members, and | |
| o | various types of sedimentary rocks such as greywacke, pelite, chert, and conglomerate. |
| IAMGOLD Corporation - Rosebel Gold Mine | |
| Technical Report NI 43- 101 – November 5, 2018 | Page 7-1 |

| IAMGOLD Corporation - Rosebel Gold Mine | |
| Technical Report NI 43- 101 – November 5, 2018 | Page 7-2 |
In Suriname, sedimentary and volcanic units of the greenstone belt are grouped into the Marowijne Supergroup which is divided itself into two formations: the Paramaka Formation and the Armina Formation. The Paramaka Formation is constituted of volcanic rocks, whereas the Armina Formation is constituted of flysch sequences represented by greywacke, mudstone, and conglomerate. The volcanic succession is associated in time and space to TTG plutonism.
In Suriname the plutonic and volcanic rocks are unconformably overlain by the upper detrital series of the Rosebel Formation which consists of arenitic quartz-rich sequences interlayered with conglomerates. This sedimentary sequence is interpreted as being deposited in the intracontinental pull-apart basins during the latest stages of the Main Transamazonian Orogeny between 2.11 Ga and 2.08 Ga. Synchronously with the formation of those basins, granitic magmatism took place in the eastern part of the Guiana Shield (Suriname, French Guiana, and Brazil).
The whole Guiana Shield has undergone prolonged chemical weathering, reflecting a humid, tropical paleo-climate that may have started as far back as the Cretaceous period. The chemical weathering has produced a laterite/saprolite profile which locally reaches up to 100 m below surface. In the Rosebel area, fresh rock can be observed around 30 m depth in valleys, where the water table is less affected by seasonal fluctuations. The thick cover of rain forest vegetation has protected the soil from erosion, and the thin soil profile is generally preserved. The chemical effects of the deep weathering include leaching of mobile constituents (alkali and alkali earths), partial leaching of SiO2 and Al2O3, formation of stable secondary minerals (clays, Fe-Ti, and Al-oxides), mobilization and partial precipitation of Fe and Mn, and concentration of resistant minerals (zircon, magnetite, and quartz).
| 7.2 |
RGM CONCESSION |
The Rosebel deposits are hosted by a volcano-sedimentary sequence of the Marowijne Supergroup and by the overlying detrital sedimentary sequence of the Rosebel Formation. Five types of rocks are distinguished on the property: felsic to mafic volcanic rocks, flysch sequence, arenitic sedimentary rocks, felsic intrusion, and late diabase dykes. Economical gold mineralization has been recognized in sedimentary and volcanic rocks while the intrusion only shows rare gold occurrences and the late diabase dykes are devoid of any mineralization.
| IAMGOLD Corporation - Rosebel Gold Mine | |
| Technical Report NI 43- 101 – November 5, 2018 | Page 7-3 |
The regional metamorphism is restricted from low-greenschist to greenschist facies. The main regional fabric varies from east-west in the Southern part of the property to WNW-ESE to the North and follows the regional tectonic. Two phases of deformation are recognized on the property. The first one has affected the older volcanic rocks only, while the second phase of deformation has affected the volcanic rocks and both sedimentary sequences. The veins show no signs of deformation and so the mineralization is interpreted as being emplaced during the latest stage of the last deformation event (Daoust et al., 2011).
Volcanic rocks are found to the north and in the southern part of the mining concession. In the southern part they surround the tonalite intrusion (Brinks intrusion), while in the northern part, up to Charmagne concession, they form bands a few kilometres thick alternating with the sedimentary rocks of the Armina Formation (Figure 7-2).
The arenitic sequence of the Rosebel Formation forms the central sedimentary basin which unconformably overlays the volcanic rocks. The whole sequence is folded into a syncline and is crosscut by several major faults. On the eastern part of the concession (near the Rosebel deposit) the rocks are intruded by three post mineralization north-south diabase dykes, pertaining to the Permo-Triassic Apatoe dyke swarm.
Three mineralized domains are found on the property: the North, Central, and South domains. The northern domain includes the J Zone and Koolhoven deposits along a trend to the north of the volcanic rocks and the Pay Caro-East and Pay Caro deposits along a trend south of the volcanic rocks. The two trends follow a WNW-ESE orientation. The central domain only includes one deposit, Rosebel, which is striking east-west. The southern domain is also striking east-west and hosts the Mayo, Roma, and Royal Hill deposits.
| IAMGOLD Corporation - Rosebel Gold Mine | |
| Technical Report NI 43- 101 – November 5, 2018 | Page 7-4 |
![]()
| IAMGOLD Corporation - Rosebel Gold Mine | |
| Technical Report NI 43- 101 – November 5, 2018 | Page 7-5 |

| IAMGOLD Corporation - Rosebel Gold Mine | |
| Technical Report NI 43- 101 – November 5, 2018 | Page 7-6 |
| 7.3 |
SARAMACCA CONCESSION |
The Saramacca gold project is underlain by metabasalt of the Paramaka Formation. Younging from southwest to northeast, the main units of the Paramaka Formation are a massive basalt overlain by a thinner amygdular basalt unit and a thick unit of pillowed basalts. Rocks have been metamorphosed to the greenschist facies and have developed an assemblage of actinolite-chlorite-epidote-plagioclase. Rare, barren, thin felsic dykes crosscut the pile.
The massive basalt is a homogeneous, green, medium-grained unit in which leucoxene sporadically develops. The true thickness of the unit is unknown, exceeding 50 m. The basalt’s northeastern contact with the amygdular unit is commonly obliterated by hydrothermal alteration.
The amygdular basalt unit is a greenish-grey to buff colour where hydrothermally altered. Quartz amygdules are generally one to three millimetres in diameter and constitute up to 5% of the rock.
The pillowed basalt is over 75 m thick and exhibits typical periodic arcuate selvages in the core. It is of a medium to dark green colour and is commonly moderately magnetic.
Some graphitic shears appear to be spatially associated to the main mineralized structure.
A review of the structural geology at the Saramacca gold deposit was undertaken by SRK to assist with geological interpretation and modelling (SRK, 2017a). The structural study focussed on the following aspects:
| • |
Reviewing available core to identify and characterize the main structures controlling gold mineralization. | |
| • |
Reviewing available oriented core to extract key information about the orientation of controlling structures and integrate the data in the geological model. | |
| • |
Defining the preferential orientation and the controls on higher grade gold mineralization and determine whether high grade sub- domains should be modelled within the existing gold domains. | |
| • |
Investigating the distribution, geometry, and kinematics of post-mineralization structures that could have displaced the gold domains. | |
| • |
Characterizing the nature, geometry, and distribution of gold-bearing breccia and vein fields to ensure that the modelled gold domains properly reflect their distribution. |
| IAMGOLD Corporation - Rosebel Gold Mine | |
| Technical Report NI 43- 101 – November 5, 2018 | Page 7-7 |
Located at the contact between the massive and pillowed basalts, the Faya Bergi fault zone is a major brittle-ductile vertical dip-slip fault zone with which gold mineralization is associated with. Typical brittle features include cataclasite, gouge, fractured zones, and striated fault slip planes (Figure 7-4) and typical ductile features include shear foliation and minor folding (Figure 7-5). Several sub-parallel minor shear zones occur on either side of the fault zone.
Mineralization at the Saramacca gold project is principally hosted within a series of north-northwest trending structures ranging between 2 m and 40 m in width over a strike length of 2.2 km, and is open along strike. Several sub-parallel structures have been identified, however, the Faya Bergi and Brokolonko structures are the primary mineralized structures over a continuous distance. The other structures are variably mineralized, though more drilling is required to test their prospectivity.
| IAMGOLD Corporation - Rosebel Gold Mine | |
| Technical Report NI 43- 101 – November 5, 2018 | Page 7-8 |
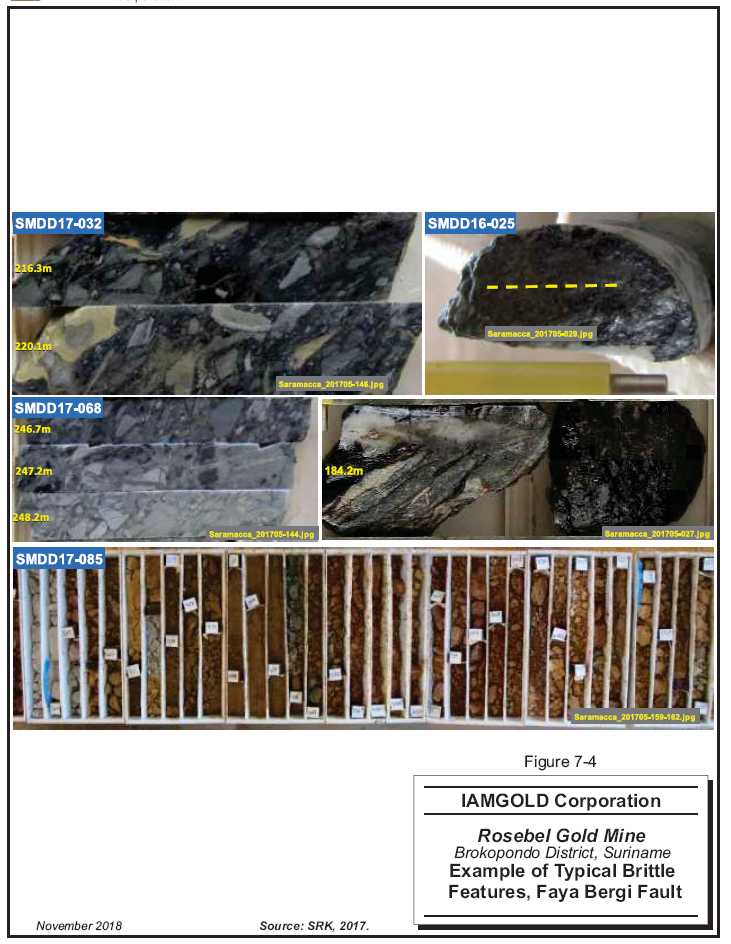
| IAMGOLD Corporation - Rosebel Gold Mine | |
| Technical Report NI 43- 101 – November 5, 2018 | Page 7-9 |

| IAMGOLD Corporation - Rosebel Gold Mine | |
| Technical Report NI 43- 101 – November 5, 2018 | Page 7-10 |
The Faya Bergi and Brokolonko structures are related to a major brittle-ductile vertical dip-slip fault zone located at the contact between the sequence of massive and pillowed basalt along the thinner amygdular unit. Various kinematics suggest that the northeast block moved up relative to the southwest block.
Mineralization is open at depth in fresh rock and extends to the surface into the thick soft saprolite and laterite surficial layers. Mineralization is contemporaneous with brittle and ductile features and is associated with hydrothermal dolomite (veins and breccias) and pyrite, and minor arsenopyrite.
Dolomite breccias are characterized by repeated “crack/seal” and dilational infilling textures. These veins are also boudinaged and folded, forming within an active dip slip environment. Higher grade gold is typically associated with dolomite breccias and pyrite mineralization, with the best gold grades located along thick fault segments to the northwest.
The alteration pattern enclosing the fault zone shows the destruction of magnetite and the formation of leucoxene at distal ranges. Carbonate-chlorite alteration becomes more dominant with increasing proximity to the Faya Bergi fault. Within the fault zone, the protolith is destroyed by quartz-dolomite-pyrite and minor mica. The alteration footprint is commonly wider in the northeast block (pillow basalt) and can extend up to 50 m from the fault zone, while in the southwest block (amygdaloidal and massive basalts) it is observed up to 15 m to 20 m from the fault zone. The larger northeast alteration footprint may be ascribed to the presence of smaller, variably mineralized, subsidiary fault and shear zones northeast of the Faya Bergi fault.
| IAMGOLD Corporation - Rosebel Gold Mine | |
| Technical Report NI 43- 101 – November 5, 2018 | Page 7-11 |
| 8 |
DEPOSIT TYPES |
Gold mineralization in the RGM and Saramacca gold deposits is structurally controlled and exhibits similar geological, structural, and metallogenic characteristics to orogenic greenstone-hosted gold deposits as described by Robert et al. (2007). Orogenic gold deposit characteristics include:
| • | Complex arrays of quartz-carbonate veins with significant vertical continuity | |
| • | Mineralization rich in silver and arsenic with varying amounts of tungsten | |
| • | Gold to silver ratios greater than five | |
| • | Mineralization may be enriched in boron, tellurium, bismuth, and molybdenum | |
| • | Dominant sulphide mineral is pyrrhotite in amphibolite metamorphic settings | |
| • | Spatial association with regional shear zones | |
| • | Greenstone hosted gold deposit are characterized by: |
| o | Combination of steeply-dipping laminated quartz-carbonate veins with arrays of shallow-dipping extension veins | |
| o | Distributed along regional compressional structures | |
| o | Locations at boundaries between contrasting lithologies | |
| o | Occurring near an unconformity at the base of conglomerate sequences (this placement is especially true for large deposits) | |
| o | Universal presence of crustal-scale shear zones and faults | |
| o | Lithologies that commonly include Fe-rich rocks such as tholeiitic basalts and felsic intrusive porphyries |
This type of deposit is found worldwide along shear zones in volcanic terranes and is characterized by quartz and quartz carbonate veins and sheeted veins primarily in dilational zones where fluid permeability was higher compared to the surrounding rocks at the time of formation. These deposits typically display a complex array of quartz-carbonate veins with significant vertical continuity. While the overall sulphide content is low, the most abundant sulphide mineral is pyrrhotite.
| IAMGOLD Corporation - Rosebel Gold Mine | |
| Technical Report NI 43- 101 – November 5, 2018 | Page 8-1 |
| 9 |
EXPLORATION |
| 9.1 |
RGM CONCESSION, EXPLORATION PROGRAM 2017-2018 |
The RGM concession has seen various levels of exploration work over the past 140 years. Table 9-1 summarizes some of the more recent exploration worked carried over the past 40 years.
In the last three years, an important effort of local and regional mapping was carried out to build a new regional 3D geological model (including lithology, alteration, and structures).
| IAMGOLD Corporation - Rosebel Gold Mine | |
| Technical Report NI 43- 101 – November 5, 2018 | Page 9-1 |
TABLE 9-1 SUMMARY OF EXPLORATION WORK COMPLETED ON THE ROSEBEL GOLD MINE CONCESSION
| Year | Company |
Type of Work |
| 1976 | Surplacer |
Detailed follow-up work, involving 900 hand auger holes, 4 km of bulldozer trenches and 43 Reverse Circulation (RC) drillholes |
| 1979 | Grassalco |
Carried out 1,500 hand auger holes for new resource estimate |
| 2002 | Cambior |
Airborne 14,750 line-km survey including magnetic and radiometric lines, spaced 200 m apart |
| 2005 | Cambior |
Deep augering and small trenches conducted by Suriname Exploration department (SurEx) at Compagnie Creek |
| 2006 | Cambior |
Continuation of deep augering and small trenches conducted by Surex at Compagnie Creek |
| 2007 | IAMGOLD |
Continuation of deep augering and small trenches conducted by Surex at Compagnie Creek |
| 2008 | IAMGOLD |
Partial Geophysical compilation of resistivity, conductivity, and metal factor of the Rosebel deposit |
| 2010 | IAMGOLD |
Two exploration trenches executed in ETR and North J-Zone |
| 2010 | IAMGOLD |
Two deep auger programs performed by the Mine Exploration department (MinEx), one in West- Koolhoven area (65 holes of 10 m spacing in four lines totalling 383.7 m), and one in North Tailings Pond (six holes) |
| 2010 | IAMGOLD |
MinEx performed regular grab sampling, field reconnaissance, and mapping of outcrops in the South Triangle area during the exploration drilling campaign |
| 2010 | IAMGOLD |
Pit mapping performed at Koolhoven, East Pay Caro, Royal Hill, and Mayo Pits |
| 2011 | IAMGOLD |
MinEx conducted pit mapping, grab samples of quartz veins and surface alluvial sampling at ETR, KH, Roma, Mayo, RB East (currently known as Rosebella), East of EPC, and Blauwe Tent |
| 2013 | IAMGOLD |
MinEx conducted pit mapping, grab samples of quartz veins, and surface alluvial sampling at Rosebel pit, Mamakreek, Compagnie Creek, Spin Zone and Tailings Pond, Jzone, and West Pay Caro |
| 2013 | IAMGOLD |
In West Koolhoven a total of 34 grab samples were taken of quartz veins along road cuts |
| 2013 | IAMGOLD |
Spin Zone grab samples collected of quartz veins along new completed road cuts |
| 2013 | IAMGOLD |
MinEx conducted three pit tests and collected 12 quartz vein grab samples in Rosebel East and six pit tests in Rosebel central area |
| 2013 | IAMGOLD |
MinEx conducted a small trench in Roma-West to test the continuation of mineralization in the projected waste dump area. No significant results |
| 2013 | IAMGOLD |
Detailed geological mapping was also carried out by Surex over outcrops found along exposed small scale miners areas in the Koemboe area (within the concession) |
| 2014 | IAMGOLD |
MinEx conducted pit mapping, grab sampling, and pit testing in Mayo, Pay Caro, J Zone, Royal Hill South, Roma, Rosebel, NW Koolhoven, ETR, Mamakreek, Compagnie Creek, Watapat, Brinky, and the road to Mindrineti Creek |
| 2014 | IAMGOLD |
Induced Polarization (IP) Survey of 11.7 km on eight lines with a spacing of 200 m was conducted by Surex at Rosebel East and West |
| 2014 | IAMGOLD |
Surex conducted an AEM survey (2,775 km) covering the RGM concession, Thunder Mountain concession, and parts of Charmagne West, Charmagne, and Headley’s Reef concessions |
| 2014 | IAMGOLD |
Surex conducted several IP surveys in the RGM concession including South Roma, EPC, and Rosebel |
| 2014 | IAMGOLD |
Surex conducted several manual and mechanical augering programs in the RGM concession including Mamakreek, Compagnie Creek, and Koolhoven West |
| 2015 | IAMGOLD |
Intense detailed pit mapping in East Pay Caro, J Zone, Rosebel, and Royal Hill to be used in further development of the pits, identifying optimal drilling directions for MinEx and RC grade control, and new geological interpretation |
| 2015 | IAMGOLD |
Mapping and grab sampling of quartz veins in Mamakreek and Compagnie Creek |
| 2015 | IAMGOLD |
Small shallow auger program of 66 holes at Royal Hill SE pits of SSM tailings was conducted by MinEx |
| 2016 | IAMGOLD |
Intense detailed pit mapping in East Pay Caro, West Pay Caro, J Zone, Rosebel, Royal Hill, Roma, Overman, and Mayo to be used in further development of the pits, identifying optimal drilling directions for MinEx and RC grade control and update geological interpretation |
| 2017 | IAMGOLD |
MinEx conducted pit mapping, grab sampling, and pit testing in Koolhoven-Jzone, West Pay Caro, and Rosebel |
| IAMGOLD Corporation - Rosebel Gold Mine | |
| Technical Report NI 43- 101 – November 5, 2018 | Page 9-1 |
| 9.2 |
SARAMACCA CONCESSION |
| 9.2.1 |
GOLDEN STAR AND NEWMONT (1994 – 2010) |
The Saramacca concession was formerly part of a larger grants package owned by Golden Star, formerly known as Kleine Saramacca. Other concessions of the package included Moeroekreek (often referred to as the Sarafina concession) to the northwest, and the Saramacca grant (now called Brokolonko) to the northwest of the Moeroekreek concession.
Historical regional-scale reconnaissance work was performed over an extent greater than the entire package and without consideration of the concession boundaries. The exploration work performed by Golden Star and subsequently by a joint venture between Golden Star and Newmont is summarized in Table 9-2 and shown in Figure 9-1. More drilling information is presented in Section 10.
TABLE 9-2 SUMMARY OF EXPLORATION WORK
COMPLETED BY GOLDEN
STAR AND NEWMONT AT THE SARAMACCA GOLD PROJECT
| Year |
Type of Work |
Comments | ||
| Golden Star Resources Ltd |
1994 |
Regional airborne magnetic and radiometric survey |
Over Saramacca grant package and Rosebel area concessions | |
| 1997 |
Stream sediment sampling on 8 to 15 km2 drainage basin for Bulk Leach Extractable Gold (BLEG) |
Identification of anomalous alluvium in slopes of Brokolonko Range | ||
| 1998 |
Stream sediment sampling on > 6 km2 drainage basin for BLEG |
|||
| 2002-2005 |
Shallow soil sampling on 800 m by 100 m grid (locally 1,200 m by 100 m) along Brokolonko Range |
Several gold anomalies highlighted, amongst them, Anomaly M, which was sampled with a smaller grid defining a 4.5 km long >100 ppb soil anomaly | ||
| 2005 |
Deep auger sampling on 200 m by 50 m grid over Anomaly M |
Definition of a 2,000 m by 500 m >200 ppb anomaly | ||
| 2005 |
24 DD holes for 1,307.24 m |
Confirmation of the existence of in situ mineralization | ||
| Golden Star – Newmont JV |
2006-2007 |
IP Survey over geochemical anomaly and drilled area |
The initial gradient array survey defined a series of linear chargeability and resistivity features, trending roughly parallel to the ridge. Following this, several dipole-dipole survey lines were done perpendicular to these features, giving a three-dimensional view of the IP characteristics of the target area | |
| 2008 |
30 DD holes drilled for 3,566.27 m |
Confirmation of subvertical mineralized structures with a continuity along strike (130°) | ||
| 2010 |
36 DD holes drilled for 4,419.97 m . In total 90 DD holes have been drilled for 9,293.48 m |
| IAMGOLD Corporation - Rosebel Gold Mine | |
| Technical Report NI 43- 101 – November 5, 2018 | Page 9-3 |

| IAMGOLD Corporation - Rosebel Gold Mine | |
| Technical Report NI 43- 101 – November 5, 2018 | Page 9-4 |
| 9.2.2 |
IAMGOLD-RGM (2016 – 2018) |
Prior to 2018, exploration work conducted by IAMGOLD-RGM on the Saramacca concession was performed by the Suriname Exploration department (SurEx) focussed on exploration work conducted outside of the Rosebel mining concession. Exploration activities in the first and second quarter of 2018 were performed by the Mine Exploration department (MinEx). The main exploration activities carried out by IAMGOLD-RGM since its involvement in the Saramacca gold project include DD and RC drilling, and some mapping.
Geological and regolith mapping was completed from January to March 2017 by SurEx, over the footprint of the Saramacca resource area. Road and drill pad construction created numerous cuts in the topography to expose the regolith and enable detailed mapping on a scale of 1:500. The northern slope of the Brokolonko Ridge area is dominated by colluvium overlying saprolite, or massive to mottle clay. The colluvium comprises of unsorted clasts of iron oxide, duricrust, indurated saprolite, and pisoliths floating in a beige clayey matrix. This colluvium layer varies in thickness from 1 m to 3.5 m and is in contact with saprolite or mottled zone. The top of the ridge is covered with discontinuous duricrust carapace which can locally reach 6 m in thickness. Large blocks of ferricrete up to 5 m in diameter sit on top of the duricrust in the northwestern portion of the area.
In 2017 and 2018 IAMGOLD-RGM completed a mapping campaign coupled with IP and Mobile Metal Ions (MMI) geophysical surveys focussed along the southern extensions of the concession where new access was being built. The mapping area is commonly covered by a very thin colluvium layer (approximately 0.5 m in thickness) and recent cuts exposed a basalt saprolite. Subvertical graphitic shears oriented southeast-northwest characterized by strong graphite and kaolinite alteration with minor quartz veining were mapped and sampled. Assay results from samples collected in the northwest of Saramacca close to the Faya-Tigri road reveal no significant intercepts.
In 2017, orientation MMI surveying was carried out along section line 1650NW to determine the MMI signature of the Saramacca ore zones for future application in adjacent exploration areas. The orientation line covers both barren and mineralized portions and was conducted at a 50 m sample pit spacing. At each pit, four samples were collected at 10 cm intervals to a maximum depth of 40 cm beneath the organic layer to establish optimum sample depth. A total of 149 samples were collected, including field duplicates.
| IAMGOLD Corporation - Rosebel Gold Mine | |
| Technical Report NI 43- 101 – November 5, 2018 | Page 9-5 |
| 9.3 |
REGIONAL EXPLORATION |
Surrounding the RGM concession are Thunder Mountain, Headley’s Reef, Charmagne, LEF, Charmagne West, Moeroekreek, and Saramacca ROEs all of which are held by RGM (Figure 9-2). RGM has been engaged in a long-term exploration effort on these exploration concessions up until 2015 when the focus of exploration work shifted to the Saramacca Gold Trend on the following concessions, where exploration activities are currently underway:
| • | Saramacca, acquired by RGM in 2016 | |
| • | Moeroekreek concession, which was explored under an agreement with a third party, and | |
| • | Brokolonko concession, acquired in 2018. |
| IAMGOLD Corporation - Rosebel Gold Mine | |
| Technical Report NI 43- 101 – November 5, 2018 | Page 9-6 |

| IAMGOLD Corporation - Rosebel Gold Mine | |
| Technical Report NI 43- 101 – November 5, 2018 | Page 9-7 |
| 9.3.1 |
THUNDER MOUNTAIN RIGHT OF EXPLORATION |
The Thunder Mountain concession covers a V-shaped area that is continuous with the northern, eastern, and southern boundaries of the RGM concession. Exploration targets occur within a similar geological setting and in part, cover the extensions of the Rosebel mineralized trends.
Exploration activities completed by RGM since 2004 have included; geochemical surveys, ground magnetic surveys and IP surveys, the latter focused in the northern part of the concession. Detailed geological mapping has also been carried out over outcrops found along cut lines or exposed in small scale miner’s areas. In 1990, an airborne magnetic survey flown by Golden Star, covering the whole concession, has since been reprocessed. In 2011 another airborne magnetic survey was flown by Aeroquest over the RGM concession with partial coverage of Thunder Mountain.
In 2013, in house IP equipment has been used for surveying and this has become a systematic exploration tool.
An AEM survey (2,775 km) was completed in 2014 covering the RGM concession, Thunder Mountain concession, and parts of Charmagne West, Charmagne, and Headley’s Reef concessions. IP surveys were also completed on several prospects in Thunder Mountain and RGM concession. Geochemistry was also undertaken on these prospects utilizing contractor crews for manual augering and mechanical augering in areas of savannah.
Systematic augering surveys utilizing manual and mechanical augers were used to assess priority areas selected for their favourable geological setting and location relative to the known mineralized trends extending from the RGM concession. These priority areas are: Mamakreek, Dabikwen Drainage, Compagnie Creek, and Afobaka.
Mamakreek is on the same trend as the Koolhoven and J-Zone deposits and straddles RGM concession and Thunder Mountain concession. In 2009, 35 DD holes totalling 4,850 m and 25 RC drill holes totalling 1,675 m were completed between March and November. The majority of drilling performed was within the Thunder Mountain concession and tested known near-surface mineralization, structural targets, geochemical anomalies, and anomalous geophysical responses (magnetic and IP). Drilling identified an envelope with poorly confined, scattered quartz veins. Quartz veining generally returned low levels of gold, reducing the likelihood of resource development but mineralization remains open along strike and at depth. In 2013 and 2014, the Mine Exploration department carried out brief drilling programs in the southern part of the area where previous diamond holes were drilled (see Section 10).
| IAMGOLD Corporation - Rosebel Gold Mine | |
| Technical Report NI 43- 101 – November 5, 2018 | Page 9-8 |
South of RGM concession, the Koemboe Creek anomaly is located near the south border of the Brinks pluton. In 2010 and 2011 this gold anomaly was drilled. In 2011, DD drilling (20 holes, 3,135 m) and RC drilling (33 holes, 1,341 m) were performed in this area. In 2012, a second phase of the DD drilling campaign was performed (21 holes, 3,043 m). Between 2012 and 2013 an additional nine holes were completed for 1,275 m. A Gemcom geological and weathering model was developed in 2013 to complete an initial resource estimate based on the 50 DD holes (7,453 m total diamond drilling). Detailed geological mapping was also carried out over outcrops found along exposed small scale miners areas. Small scale mining has increased dramatically in the Koemboe area over 2012-2013. This mining is destroying outcrops and mining saprolite where gold-bearing structures had been discovered. Surface resources have been affected. Mapping and channel sampling in small scale mine workings identified an anomalous area east of Koemboe. In 2012, three reconnaissance drill holes were completed in East Koemboe for a total of 510 m.
The Compagnie Creek prospect is located at the south-east limit of the RGM concession. In 2012, surface geological mapping and a first phase of DD drilling (13 holes, 622.5 m) were carried out. In 2013, a second phase of diamond drilling consisting of 13 holes totalling 1,326 m was completed on the Companie Creek prospect. Part of this 2013 drilling campaign included completing two holes totalling 204 m on the Rosebella prospect and an additional two holes on the Intersection target totalling 196 m.
In 2012, a DD campaign (16 holes, 4,000 m) was also performed on the eastern extension of the actual Rosebel pit, outside the RGM concession in an area known as East Rosebel.
Exploration in 2014 was completed on the Afobaka and Dabikwen prospect areas. Exploration occurred along the Royal Hill trend where it extends outside the RGM concession towards the Afobaka dam. The prospect is 8 km long and was highlighted by historical anomalous geochemistry.
| IAMGOLD Corporation - Rosebel Gold Mine | |
| Technical Report NI 43- 101 – November 5, 2018 | Page 9-9 |
Exploration activities in 2014 included deep auger (1,325 holes for 8,610 m), IP (31 line km), RC drilling (11 holes for 1,690 m), and DD drilling (11 holes for 1,767 m).
In 2015, exploration activities focused on the West Afobaka prospect and the Dabikwen prospect, both of which are located on the Royal Hill trend, an area where significant small scale mining is being undertaken. These prospects are located on the contact of the Paramaca volcanics and sediments of the Rosebel Formation, in the vicinity of late cross cutting dykes.
Exploration activities in 2014 included deep auger (254 holes for 1,614 m), mechanical auger (75 holes for 765 m), and RC drilling 14 holes for 1,740 m).
No exploration, other than target generation activities, has been completed since 2015.
| 9.3.2 |
HEADLEY’S REEF RIGHT OF EXPLORATION |
The Headley’s Reef concession lies to the south-west of the RGM concession and borders the Thunder Mountain concession to the east. Exploration activities have revealed that the northern part of the concession, covering the western extension of the mineralized trend, which hosts the Royal Hill, Roma, and Mayo deposits, is underlain by a similar geology to the RGM concession. The southern part is underlain, at least in part, by volcanic and sedimentary units of the older Paramaka Formation and the granite-gneiss units of the younger Saramacca Complex.
Exploration work carried out by RGM since 2004 has involved geochemical auger sampling and geological mapping over outcrops found along lines cut or exposed in small-scale mining areas. The Golden Star airborne geophysical survey carried out in 1990 covers the entire concession. The new airborne magnetic survey flown in 2011 by Aeroquest covers partly Headley’s Reef.
The principal targets, the Kraboe Doin “A” and “B” areas, were initially defined by anomalous stream sediment sampling results and lie close to the largest known area of small-scale mining activity located at the common boundary of Headley’s Reef and Thunder Mountain concessions. Systematic deep auger sampling and detailed geological mapping defined several targets for diamond drilling. The southern extension of the Blauwe Tent trend (from the RGM concession) and the Koemboe Creek area of Headley’s Reef (direct extensions of Koemboe Creek area of the Thunder Mountain concession and north of Kraboe Doin) are additional areas where deep auger sampling and mapping have been carried out. In 2011, at Kraboe Doin, diamond drilling (24 holes, 3,605 m) and line cutting (32 km) were performed in the Kraboe Doin “A” and “B” targets. In 2012, a single hole (130 m) was completed in the Kraboe Doin “A” target as a follow-up, in late 2013, an additional two diamond drill holes were completed In Kraboe Doin “A”, for a total of 320.4 m.
| IAMGOLD Corporation - Rosebel Gold Mine | |
| Technical Report NI 43- 101 – November 5, 2018 | Page 9-10 |
Drilling was completed at the Saisamauw project where 2,500 m of DD drilling was completed, targeting similar geological structures as the Mayo Pit. In 2012, a total of 2,500 m in 10 holes was drilled to test this geological contact.
In 2014, satellite photography and AEM was flown over the Headley’s Reef concession.
No exploration, other than target generation activities, has been completed since 2014.
| 9.3.3 |
CHARMAGNE |
The Charmagne/LEF concession includes the Overman advanced project (as part of RGM resources, thus included in more detail in Section 9 of this report). In 2010, the Regional Exploration department completed 10,387 m of DD drilling in 76 holes on this advanced project.
Following the positive results of a concept study, a program totalling 10,293 m of diamond drilling in 78 holes was completed in 2011 by the Mine Exploration department for resource development purposes. In 2011, the Regional Exploration department conducted deep augering (872 holes), line cutting, MMI geochemistry, soil sampling, field mapping, airborne magnetic survey coverage by Aeroquest, and diamond drilling (11 holes, 1,774 m) in the distant extension of the silica body hosting the gold mineralization.
In 2012, the Regional Exploration team carried out surface geochemistry, augering, and diamond drilling in Charmagne/LEF ROE. In 2012, the Mine Exploration team performed 7,258.5 m of diamond drilling, specifically on the Overman project.
In 2013, the Regional Exploration team completed two deep auger programs (306 holes, 2,320 m), trenching (4), an IP ground survey (24.95 km), and diamond drilling (5 holes, 799 m) in Central Charmagne approximately 2 km southeast of the Overman project.
| IAMGOLD Corporation - Rosebel Gold Mine | |
| Technical Report NI 43- 101 – November 5, 2018 | Page 9-11 |
In 2014 an AEM and satellite photography survey was flown.
| 9.3.4 |
CHARMAGNE WEST |
The Charmagne West concession borders the Thunder Mountain and the Charmagne concessions to the South and to the East respectively. An aeromagnetic and radiometric survey was conducted in 2011 over both Charmagne and Charmagne West concessions. SRK was commissioned to develop a lithological and structural interpretation of the data; to define key controls on the distribution of gold mineralization to aid regional exploration; and to delineate target areas for follow-up exploration. One of the identified targets, interpreted as a strained intrusive, lies within the Charmagne West concession.
In 2012, the Regional Exploration team completed a concession wide stream sediment and pan sampling program (112 samples), a deep auger campaign on the strained intrusive (1008 holes, 4,499 m), geological mapping, and an IP/Resistivity ground survey (19.8 km).
In 2013, the IP anomaly identified in 2012 was followed up by deep auger (187 holes, 1,442 m), mechanized auger (126 holes, 327 m), trenching (1), and IP/resistivity (3.5 km) programs.
In 2014, an AEM (HeliTEM) survey was completed over the area, along with a satellite image acquisition.
No other exploration, other than target generation activities, have been completed since 2015.
| 9.3.5 |
MOEROEKREEK (SARAFINA) |
The Moeroekreek (Sarafina) concession borders the Saramacca and the Headley’s Reef concessions to the southeast and to the east respectively. The concession is being explored under a right of small scale exploitation owned by a third party with which IAMGOLD has an agreement to conduct exploration work. The concession had been previously explored by Golden Star.
In March 2014, IAMGOLD initiated several programs on the property, such as geochemistry, field mapping, IP surveys, trenching, and drilling.
| IAMGOLD Corporation - Rosebel Gold Mine | |
| Technical Report NI 43- 101 – November 5, 2018 | Page 9-12 |
Deep auger and manual auger geochemical program started in 2014 along the Brokolonko ridge and was mainly concentrated near the vicinity of the historical anomalies and small scale mining pits. It was carried out on an 800 m by 50 m grid, with a subsequent infill with lines at a 400 m and then 200 m line spacing. 580 holes have been augered totalling at 4,067 m. In addition, a mechanized auger program was performed on existing roads at a 50 m distance. Also, 31.75 km of IP lines covering the Brokolonko ridge were completed in 2014.
These programs helped defining new drilling targets referred to as Puma, Ocelot, and Lynx.
In 2015 and 2016, additional intense deep augering program was carried out to expand the four main targets (Tigri, Puma, Ocelot, and Lynx). XRF and ICP analysis were conducted on 7,573 deep auger and drilling pulps for a geochemical studies and geological interpretation of main lithological units. Other programs included IP lines (completed on the Ocelot prospect) and field mapping, which was carried out on road cuts, SSM pit faces and drill pads.
Those were followed up with 28 trenches, excavated between 2014 and 2016 for a target evaluation purpose on selected deep auger and IP anomalies; the trenches exposed shear zones graded up to 46.2 g/t Au (Ocelot) and multiple quartz veins.
The 2014-2016 drilling program consisted of several phases and was focussed on four prospects:
| • | Puma was initially tested with 10 RC holes in 2014 (1,468 m) followed by six RC holes (750 m) and six DD holes (969 m) in 2015; | |
| • | Tigri was tested by 11 DD holes (1,614 m) in 2014, followed by three DD holes (501 m) and 10 RC holes (1,470 m) in 2015; | |
| • | Lynx was drilled in 2014 with 10 RC holes (1,432 m); | |
| • | Ocelot was the most intensively drilled target, with 20 DD holes in 2015 (2,470.5 m) and 19 DD holes in 2016 (2,700 m). |
The drilling program returned encouraging intersects, though lacking continuity.
In 2017- 2018, the exploration activity consisted of MMI surveys around and between the four main prospects, processing of historic airborne gamma-ray spectrometry and magnetometry data obtained after the 1998 survey over the region, and reinterpretation of geological and geochemical data. Based on that information, targets for the upcoming 2018-2019 program have been selected, and the initial phase of a new drilling program is currently underway.
| IAMGOLD Corporation - Rosebel Gold Mine | |
| Technical Report NI 43- 101 – November 5, 2018 | Page 9-13 |
Table 9-3 summarizes work done by IAMGOLD on the Sarafina concession GMD No. 233/14 since its involvement in the project area.
TABLE 9-3 MAIN EXPLORATION ACTIVITY STATISTICS PER PERIOD OF ACTIVITY
| Sarafina Concession | IAMGOLD–RGM | IAMGOLD–RGM | IAMGOLD–RGM | IAMGOLD–RGM |
| GMD No 233/14 | Mar 6, 2014 to | Feb 6, 2015 to | Feb 6, 2016 to | Feb 6, 2017 to |
| Feb 5, 2015 | Feb 5, 2016 | Feb 5, 2017 | Aug 31, 2018 | |
| Number of grab samples | 129 | 245+ | 332+ | - |
| Number of channel samples | - | - | 222 | - |
| Geological Reconnaissance | Complete | Complete | Complete | - |
| Geology Mapping | Complete | In progress | In progress | - |
| Structural Interpretation | - | - | In progress | In progress |
| Ground IP Survey (km) | 31.75 | - | 7.825 | - |
| MMI (number of samples) | - | - | - | 372 |
| Line cutting (in km) | 37 | 54 | 10 | 23 |
| Deep Auger (number of holes) | 512 | 999 | 76 | - |
| Deep Auger (number of samples) | 3,639 | 6,346 | 259 | - |
| Mechanized Auger (number of holes/ samples) | 178 / 1263 | - | - | - |
| XRF Analyses | 2,505 | 7,573 | - | - |
| Trenches (quantity / total length, m) | - | - | 28 / 1,440 | - |
| RC drilling (number of holes / m) | 24 / 3,477 | 15 / 2,220 | 0 | - |
| Diamond drilling (number of holes / m) | 11 / 1,614 | 21 / 3,310 | 19 / 2,700 | - |
| 9.3.6 |
BROKOLONKO |
The Brokolonko property was acquired in February 2018 due to its high exploration potential. The property is characterized with direct signs of gold mineralization (long term alluvial and SSM operations, finding of gold nuggets, historic shafts), geochemical anomalies (soil, shallow and deep auger) after historic exploration, completed by Gold Star and Golden Star-Newmont JV, and positive results from an orientation BLEG survey.
The IAMGOLD-RGM exploration program commenced in February 2018. It includes: processing and re-interpretation of an historic (1998) airborne gamma-ray spectrometry and magnetometry survey, geology mapping on SSM pits, and a verification of an historic deep auger geochemical survey on the priority target area (Pompoekompoe). Based on positive results from this work, a drill program was carried out on the Pompoekompoe prospect, consisting of 20 RC holes at 2,942 m and 25 DD holes at 4,109 m. The program returned narrow low grade mineralization (from 0.4 to 2.8 g/t Au) in a complex, metamorphic environment cut by multiple felsic and intermediate intrusions; only minor amounts of tectonites, graphitic shear, and quartz material was observed in the holes. Two high grade intersects, up to 88.55 g/t Au over a 1.1 m interval were recovered on the outermost southeast drill line, keeping the mineralization open in both directions. Follow-up on that is considered along with exploration on other targets outside of the Pompoekompoe area, with additional geochemical, mapping, and drilling programs planned for years 2019-2020.
| IAMGOLD Corporation - Rosebel Gold Mine | |
| Technical Report NI 43- 101 – November 5, 2018 | Page 9-14 |
Table 9-4 summarizes the work carried out on the Brokolonko concession GMD No. 1157/17 by IAMGOLD-RGM since the involvement in the project area.
TABLE 9-4 STATISTICS OF BROKOLONKO
CONCESSION EXPLORATION
ACTIVITY BY IAMGOLD-RGM
| Brokolonko Concession | IAMGOLD – RGM |
| GMD No. 1157/17 | February-August 2018 |
| Number of grab samples | 149 |
| Number of channel samples | 18 |
| Geological Reconnaissance | In progress |
| Geology Mapping | In progress |
| Structural Interpretation | In progress |
| Geophysical Data Interpretation | In progress |
| Deep Auger (number of holes / m / samples) | 37 / 290 /192 |
| RC Drilling (number of holes / m) | 20 / 2,942 |
| DD Drilling (number of holes / m) | 25 / 4,109 |
| 9.3.7 |
SARAMACCA |
Exploration activity on the Saramacca concession has continued outside of the resource area. It is focused on northwest striking zones parallel to the Faya Bregi fault and characterized with elevated Au values after MMI. Other exploration targets are: potential contact with a pyroclastic unit situated northeast of the Faya Bergi fault and potential continuation of the Saramacca mineralization along the fault on its southeast and northwest extensions. The targets are characterized with magnetic features similar to those on the Saramacca deposit, identified after an unsupervised classification of an historic airborne magnetometry survey.
The exploration activity includes: processing of historic 1998 airborne magnetometry and gamma-ray spectrometry surveys, geochemical research, MMI survey on the target areas and infill lines, and diamond drilling on the northwest extension of the Faya Bergi fault, outside of the resources area. The diamond drilling commenced in August 2018 and consisted of eight DD holes totalling 1,410 m as of Sep 01, 2018 which have identified weak mineralization, which however, could be a possible extension of the Saramacca resources.
| IAMGOLD Corporation - Rosebel Gold Mine | |
| Technical Report NI 43- 101 – November 5, 2018 | Page 9-15 |
The summary of the above-described exploration activity, which was mostly commenced in 2018 and currently ongoing, is found in the Table 9-5.
TABLE 9-5 STATISTICS OF EXPLORATION
ACTIVITY BY IAMGOLD-RGM ON
THE SARAMACCA CONCESSION OUTSIDE OF THE SARAMACCA
DEVELOPMENT AREA
| Saramacca Concession | |
| (outside of the Saramacca Development | IAMGOLD – RGM |
| area) | |
| December 2017- | |
| GMD No. 5167/16 | August 2018 |
| Number of grab samples | 59 |
| Number of channel samples | 18 |
| Geological Reconnaissance | In progress |
| Geology Mapping | In progress |
| Structural Interpretation | In progress |
| Geophysical Data Interpretation | In progress |
| MMI (number of m / samples) | 11,000 /1,272 |
| RC Drilling (number of holes / m) | 8 / 1,410 |
| IAMGOLD Corporation - Rosebel Gold Mine | |
| Technical Report NI 43- 101 – November 5, 2018 | Page 9-16 |
| 10 |
DRILLING |
| 10.1 |
INTRODUCTION |
| 10.1.1 |
RGM CONCESSION |
Intensive diamond drilling programs were carried out on the RGM concession between 1992 and 1997. Between 1998 and 2000, the Rosebel project remained on care and maintenance and no additional drilling was undertaken. Drilling resumed in 2002 with the objective of sterilizing the waste dump at Pay Caro and with additional geotechnical drilling at the mill site and tailings pond. Exploration/definition drilling resumed in 2004. Table 10-1 lists the DD drilling and RC drilling quantities by year from 2004 to 2018. Since 2004, a total of 763,811 m of DD drilling and 62,507 m of RC drilling has been carried out. Since 2018, the same drilling procedure is used at both the RGM and Saramacca projects.
| TABLE 10-1
2004 – 2018 RGM DIAMOND DRILLING AND REVERSE CIRCULATION DRILLING |
| Year | DD (m) | RC (m)* |
| 2004 | 33,803 | - |
| 2005 | 54,854 | - |
| 2006 | 64,553 | - |
| 2007 | 52,914 | - |
| 2008 | 64,758 | - |
| 2009 | 85,843 | - |
| 2010 | 94,537 | - |
| 2011 | 88,706 | - |
| 2012 | 104,061 | - |
| 2013 | 65,557 | - |
| 2014 | 14,488 | 13,566 |
| 2015 | 12,229 | 6,234 |
| 2016 | 19,066 | 10,762 |
| 2017 | 8,442 | 31,945 |
| 2018 | - | - |
| Total | 763,811 | 62,507 |
*excluding grade control drilling
Several types of drill rigs were used in the past. Major Drilling International Inc. (Major Drilling) has been the drilling contractor on the Rosebel property since 2004. Major Drilling uses UDR-200D track mounted rigs. Production is generally 50 m per shift at an average recovery rate higher than 90%. Since 2017, a RC rig has been used by Major Drilling for expansion and exploration drilling. Others types of drilling were used in the past mostly for geochemical exploration work, including: Auger and RC Scout. During 2017, one diamond drill rig and one RC drill rig were running, for alternating periods of time.
| IAMGOLD Corporation - Rosebel Gold Mine | |
| Technical Report NI 43- 101 – November 5, 2018 | Page 10-1 |
| 10.1.2 |
PLANNING |
The drill planning takes into consideration four different purposes; infill/development, expansion, exploration, and condemnation.
The infill or development drilling is targeting a better definition of the resources or reserves within the whittle shells or pit design. The spacing for infill drilling is usually 50 m or 25 m, depending on the level of geological comprehension of the deposits or on the geological complexities related to the mineralization.
The expansion and/or exploration drilling are targeting the extension of mineralization outside the pit designs, either laterally or at depth. Some exploration/reconnaissance drilling also occurs in new or less advanced exploration areas; in that case there are no reserves defined and the drilling is based on preliminary geological interpretation rather than on extension of known ore zones. There is no particular spacing in that case, as the drilling can be tight in order to make a follow up on good results, or it can be more spread out in order to cover a larger area.
The condemnation drilling is carried out to ensure that there is no mineralization where the waste dumps are planned to be located. The spacing is approximately 150 m to 200 m using staggered patterns or continuous fences, although sometimes the condemnation drilling can be useful in getting a better comprehension of the geology surrounding the deposits, and in such a situation the drilling pattern may differ.
Even though in the past three years the amount of drilling has decreased, most of the pits are being drilled every year with respect to the three main purposes presented above. The distribution of metres and targets for each pit depends on the amount of historical drilling in each pit, on the infill needed according to the geological complexity, and the potential at depth and laterally, or the open exploration.
| IAMGOLD Corporation - Rosebel Gold Mine | |
| Technical Report NI 43- 101 – November 5, 2018 | Page 10-2 |
| 10.1.3 |
METHODOLOGY – DIAMOND DRILLING |
Before drilling a hole, the field technician’s spot the planned hole by using old drill holes, as a reference, and a hand-held GPS. The Minex field technicians survey the planned locations using a ground-based high-precision Leica GPS unit. Under supervision, the contractor sets the diamond drill onto the collar and the field technician aligns the drill with the help of the front sights.
Holes are drilled using HQ size wireline equipment in saprolite, usually reducing to NQ size in transitional to hard rock. The recovery being usually very good (>90%), drill holes with unacceptably low recovery in mineralized zones are re-drilled until reaching an acceptable level of representativeness (minimum of 65% on short intervals and an average of 75-80%). Core recovery in saprolite and transition material is improved by using polymer additives combined with high concentrations of bentonite.
Drill-hole surveys are completed using Flex-IT/Reflex singleshot/multishot instrument which can also provide magnetometric data down the length of the hole. A single shot (one measurement) is always taken at a depth of 10 m to 15 m to make sure that the orientation and the dip are in line with the planned hole. If the deviation is higher (as decided by the geologist) the hole is stopped and re-started a couple of metres next to the first hole. For drill holes longer than about 150 m, a single shot is also taken every 50 m, while drilling, to ensure that the hole will meet the target. When a hole is completed, a multi shot survey is carried out starting at the bottom of the hole, by taking a measurement every 3 m. For the interval of survey taken inside the magnetic casing (generally less than 50 m), the trace is estimated from the last measurement before entering the casing and on the single-shot measurement that was taken after the first 15 m of the hole.
When the diamond drill leaves the location, the drill hole collar is identified by a 75 mm by 75 mm wood post that is placed in the hole left by the steel rods and the hole is re-surveyed. The sump containing the cutting rejects generated by the drilling processes is closed and the pad is leveled with a dozer.
Core is packed in corrugated plastic boxes at the drill site, prior to being transported to the core shack. At the core shack, the core is washed to remove the drilling fluids and to expose structures in the soft saprolite material. Geotechnical logging is carried out afterwards by recording the core recovery, rock quality designation (RQD), rock hardness, and fracture density. The core is then logged in detail (lithology, alteration, veins, etc.) and samples are identified. The drill holes are sampled continuously from top to bottom of the hole with a length generally between 1.0 m and 1.5 m. Pictures of the core are systematically taken before splitting and then the samplers start splitting the core and sampling the intervals. The second half of the core is always kept in the core racks for reference and/or further testing.
| IAMGOLD Corporation - Rosebel Gold Mine | |
| Technical Report NI 43- 101 – November 5, 2018 | Page 10-3 |
| 10.1.4 |
METHODOLOGY – REVERSE CIRCULATION DRILLING |
RC drilling follows similar procedure as for diamond drilling. Before executing a hole, the field technician spots the planned hole by using existing drill holes, as reference, and a hand GPS. The rig operator sets the RC drill onto the collar and the field technician aligns the drill with the help of the front sights. Holes are drilled using a 114 mm or 136 mm rod size. The recovery is variable and tends to increase with the depth. The RC rig can drill holes up to 150 m using a compressor to collect good quality of dry samples. Down holes surveys are taken at the end of the hole.
When the RC rig leaves the location, a wooden stick with flagging tape is used to identify the hole. The holes are surveyed with a Leica GPS. As the rig is not using water, no sumps are required.
The cuttings are going through a cyclone, a rotary splitter, and two plastic bags placed at the end for sampling. Samples are taken every 2 m and generally consist of two 5 kg bags: one bag for assaying and the other one for logging the samples and as a field duplicate and/or for re-assay. A small amount of the logging sample bag is placed on the logging table where the geologist describes the material (alteration, lithology, presence of quartz, pyrite). Pictures of cuttings are taken before placing the material in chip trays. If no picture of the cutting is taken, a picture of the chip tray is taken instead. For each interval, the sample bag for assaying is sent to the laboratory for analysis, the other bag being kept at the core shack until results are obtained and no further sampling is required.
| 10.1.5 |
RGM CONCESSION DRILLING PROGRAM 2018 |
In 2018, no diamond drilling was carried out on the property.
| IAMGOLD Corporation - Rosebel Gold Mine | |
| Technical Report NI 43- 101 – November 5, 2018 | Page 10-4 |
A total of 184,450 m of RC grade control drilling was performed since the last resource update (NI43-101, June 2017) and has been used in the present resource estimate. The database was closed as of January 15, 2018 for the RGM concession.
| 10.2 |
SARAMACCA CONCESSION DRILLING |
Golden Star, and later as a joint venture with Newmont, conducted three phases of DD drilling totalling 90 holes (9,293 m) between 2002 and 2010 on the Saramacca concession.
Exploration activities, consisting mainly of DD and RC drilling, resumed in October 2016 after RGM signed a Letter of Agreement with the Republic of Suriname to acquire the rights to the Saramacca gold property. In total, 442 DD holes (85,446 m) and 41 RC holes (4,986 m) have been completed on the Saramacca mineralized zone, to date, with a few holes completed on the peripheral deep auger or IP anomalies. A breakdown of the drilling, by period, and by company, up to May 22, 2018 is presented in Table 10-2.
TABLE 10-2 STATISTICS OF DRILLING
CONDUCTED ON THE SARAMACCA
GOLD PROJECT TO MAY 2018
| Goldstar | Goldstar/Newmont | Goldstar/Newmont | IAMGOLD-RGM | Total | ||||||||
| Hole Type | 2002-2005 | 2006-2008 | 2009-2010 | SurEx 2016-2018 | MinEx 2018 | |||||||
| No. | (m) | No. | (m) | No. | (m) | No. | (m) | No. | (m) | No. | (m) | |
| Undefined | 157 | 1,160 | 241 | 1,905 | - | - | - | - | - | - | 398 | 3,065 |
| DD | 24 | 1,307 | 30 | 3,566 | 36 | 4,420 | 286 | 60,701 | 66 | 15,472 | 442 | 85,466 |
| RC | - | - | - | - | - | - | 41 | 4,986 | - | - | 41 | 4,986 |
| 10.2.1 |
GOLDEN STAR AND GOLDEN STAR-NEWMONT JV (2005 – 2010) |
An initial program of 24 shallow DD holes totalling 1,307.2 m was carried out on soil anomaly M during 2005 by Golden Star (Figure 10-1). Boreholes were 50 to 70 m in vertical depth and did not exceed 81 m in drilled depth. Drill orientations were 215°E (grid south), except for MA020 and MA021 which were at 035° (grid north) and MA023 and MA024 which were at 250.5° . Borehole inclinations were -45° except for MA001, MA002, and MA022 which were at -55°, and MA023 and MA024 which were at -50°. Several DD holes intersected mineralized shear zones.
| IAMGOLD Corporation - Rosebel Gold Mine | |
| Technical Report NI 43- 101 – November 5, 2018 | Page 10-5 |

| IAMGOLD Corporation - Rosebel Gold Mine | |
| Technical Report NI 43- 101 – November 5, 2018 | Page 10-6 |
Following geological mapping and an intensive deep auger program, a second phase of DD drilling was carried out from May to November 2008 under the joint venture with Newmont (Figure 10-1). A set of 30 DD holes totalling 3,566.3 m tested the strike and depth extension of the mineralized shears encountered in previous boreholes, the main IP anomalies, and other geochemical targets on the Saramacca property. The deepest borehole drilled was 200.8 m. Canadian-owned, and Suriname-based, SureCore Portable Diamond Drilling was contracted to execute the drilling activities.
Newmont performed a third phase of DD drilling comprising 36 holes totaling 4,420 m between May and November 2010 covering the extent of the mineralized footprint (Figure 10-1). Drill orientations were 215°E (grid south), except for GMDH-033 and GMDH-034 which were at 035° (grid north). Borehole inclinations were systematically -50°. The maximum borehole depth was 198 m, while the average borehole depth was 123 m. Drilling included three short boreholes (GMDH-051 to GMDH-054) that were less than 13.5 m deep to collect duricrust samples for metallurgical tests. SureCore Portable Diamond Drilling was contracted to execute the drilling activities.
Although geological and assay data were available in the data package provided by the Republic of Suriname, there is no documentation on the drilling and sampling processes.
| 10.2.2 |
IAMGOLD-RGM (2016 – 2018) |
IAMGOLD-RGM drilled 180 DD holes totalling 34,225 m and 37 RC holes totalling 4,506 m in a two-phase drilling program executed between October 2016 and April 2017.
Included in the first phase of drilling, IAMGOLD-RGM twinned 17 of the 90 historical boreholes with DD holes as part of a due diligence process from October to December 2016. The program aimed to expand the mineralized footprint by testing the continuity along strike at a 50 m by 100 m spacing.
From January to April 2017, IAMGOLD-RGM followed up on 2016 drilling results and initiated an infill DD drilling program at a 50 m by 50 m spacing, with focus on delineating a potential saprolite resource. One additional historical borehole was twinned to ensure a good spatial distribution of IAMGOLD-RGM boreholes across the mineralized footprint.
| IAMGOLD Corporation - Rosebel Gold Mine | |
| Technical Report NI 43- 101 – November 5, 2018 | Page 10-7 |
IAMGOLD-RGM has drilled an additional 176 DD holes for 43,397 m and four RC holes for 480 m since the maiden Mineral Resource model was disclosed publicly by IAMGOLD-RGM in a news release dated September 5, 2017 (Table 10-3 and Figure 10-1. The database was closed on May 31, 2018 for the Saramacca concession.
| TABLE 10-3 SUMMARY OF DRILLING PERFORMED BY IAMGOLD-RGM |
| BETWEEN JULY 2017 AND MAY 2018 |
| Borehole Type |
SurEx | MinEx | Total | |||
| No. | (m) | No. | (m) | No. | (m) | |
| DD | 110 | 27,925 | 66 | 15,472 | 176 | 43,397 |
| RC | 4 | 480 | - | - | 4 | 480 |
| Total | 104 | 19,128 | 66 | 15,472 | 217 | 38,731 |
| 10.2.3 |
DRILLING PROCEDURES AND APPROACH |
| 10.2.3.1 |
GOLDEN STAR AND NEWMONT (2005 – 2016) |
IAMGOLD-RGM did not receive information from the Republic of Suriname regarding the drilling procedures, methodology, and approach historically used by Golden Star and Newmont. SureCore Portable Diamond Drilling was contracted by Golden Star and Newmont for the 2008 and 2010 drilling programs.
| 10.2.3.2 |
IAMGOLD-RGM SUREX (OCTOBER 2016 – DECEMBER 2017) |
All DD drilling was performed by Major Drilling using three UDR 200D track-mounted drill rigs. RC drilling was contracted to FTE Forage, who used one Schramm T450 RC drill rig. An ancillary support of Hurricane B6 booster and Sullair 1,350 cubic feet per minute (cfm) at 350 pounds per square inch (psi) or 1,100 cfm at 500 psi compressors was added to push off groundwater. The same procedure as for DD drilling is implemented during the pre-drilling, rig set-up, and post-drilling stages.
Borehole azimuth was typically 215°, apart from a few being scissor holes designed at 035° to confirm the width or dip of the mineralized zone, test the footwall at higher elevation, and/or circumvent areas with poor ground conditions. Boreholes were generally drilled at -50° with some between -47° and -55°. All DD holes were drilled with HQ core rods to penetrate a few metres into fresh rock. When boreholes reached solid fresh rock, they were downsized to NQ until the end of hole. DD hole length varied from 23.5 m to 483 m. RC hole diameter was 140 mm, with an average length of 121.6 m and a maximum length of 150 m.
| IAMGOLD Corporation - Rosebel Gold Mine | |
| Technical Report NI 43- 101 – November 5, 2018 | Page 10-8 |
Prior to building drilling pads, proposed boreholes were located by hand-held GPS. In October and November 2016, boreholes were located by IAMGOLD-RGM technicians with a hand-held Garmin GPS. Starting in November 2016, a surveyor using a total station was contracted to locate all boreholes. IAMGOLD-RGM uses UTM coordinates set in Zone 21N, WGS 1984.
An inventory of trees to be cut is completed before any earthwork is initiated. Once access and pads are completed, a pre-drilling inspection is signed off for every borehole by a representative from IAMGOLD-RGM and a Major Drilling foreman. When approved, IAMGOLD’s technicians install three front sights for the rig to align along the planned azimuth. The drill rig is mobilized to the pad under the supervision of a Major Drilling foreman, and alignment is done under the supervision of IAMGOLD-RGM technicians. Once the rig is set up, the inclination of the mast is measured by a clinometer and drilling can commence.
Down hole surveys are done using a Reflex EZ-TRAC, taking single and multi-shot readings starting at 20 m, and every 50 m thereafter until the borehole is terminated by the geologist. When drilling is complete, multi-shot readings are taken every 3 m as the rods are pulled out. Down hole surveys are downloaded from the Reflex EZ-TRAC to a laptop at the Saramacca camp and the file is imported directly into the main database. From April 6 to 19, 2017, the Reflex EZ-TRAC became defective. IAMGOLD-RGM resorted to using a Tropari to perform the down hole surveys of the 18 boreholes drilled during this period.
Once a borehole is complete, a capped PVC pipe is inserted into the collar. The borehole ID is written with permanent marker on the PVC pipes and an aluminum tag engraved with the borehole ID is attached to the PVC. Contracted professional surveyors of CM-Engineering from Paramaribo, Suriname determine the final coordinates of the collar using a Total Station and the coordinates are sent to the database manager for import. At the end of the drilling campaign, 20 boreholes were re-surveyed by the same surveyor as part of validation using Differential GPS (DGPS).
Core orientation using a Reflex ACTII tool was done on 40 DD holes. The orientation point is reflected on the bottom of the core by a mark and an extended line on the side emanating from the orientation mark at the bottom. To begin measurements of structural data, the orientation mark is extended over the core, where applicable, with arrows pointing down-hole using a red china marker. Core orientation measurement is mostly done by a protractor-ruler and a wrap-around protractor. Some boreholes were measured using Reflex IQLOGGER in March and April 2017, as a first trial to test this technology.
| IAMGOLD Corporation - Rosebel Gold Mine | |
| Technical Report NI 43- 101 – November 5, 2018 | Page 10-9 |
Throughout the drilling campaign, IAMGOLD-RGM staff continuously monitored the different facets of drilling to ensure adherence to health and safety, environmental and drilling protocols of the company.
All geological logging including lithology, alteration, mineralization, and down hole structure was performed by IAMGOLD-RGM geologists. Data entry was done directly in CoreLogger (Gems module) using Panasonic Toughbooks. CoreLogger includes some validation tools to prevent nested intervals, intervals deeper than the end of a hole and duplicate sample numbers.
All digital data generated is stored in RGM’s servers at the mine site.
| 10.2.3.3 |
IAMGOLD-RGM MINEX (JANUARY 2018 – MAY 2018) |
Drilling procedures used by IAMGOLD-RGM MinEx department largely mirror that of SurEx with few minor differences.
All diamond drilling was performed by Major Drilling using UDR 200D track-mounted drill rigs with borehole azimuths typically 215°, apart from a few being scissor holes designed at 035°. Boreholes were generally drilled at -50° with some between -47° and -55°. DD hole length varied from 75 m to 453 m.
Prior to building drilling pads, the MinEx field technicians spot the hole with the assistance of older drill holes as reference, where available, and a ground-based high-precision Leica GPS unit. Drill alignment is performed under the supervision of the field technician with the help of front sights.
Core recovery is usually very good, however, where recovery is less than 65% to 75% in mineralized zones, the hole is re-drilled until the recovery is considered acceptable. Polymer additives, combined with high concentrations of bentonite, are occasionally used in the saprolite and transition material zones to increase core recovery.
| IAMGOLD Corporation - Rosebel Gold Mine | |
| Technical Report NI 43- 101 – November 5, 2018 | Page 10-10 |
Down hole surveys are performed using Flex-IT single-shot and Reflex multi-shot instruments. Single-shots are taken at a depth of 10 to 15 m and at an interval of 50 m for boreholes longer than 150 m. Upon completion of the borehole, a multi-shot survey is carried out for the entire length of the hole, starting at the bottom and taken at intervals of 3 m.
Once a borehole is complete, a 75 mm by 75 mm wood post is placed into the collar and the collar location is resurveyed. Core is packed in plastic core trays at the drill site.
| 10.2.4 |
CORE SAMPLING METHOD AND APPROACH |
| 10.2.4.1 |
IAMGOLD-RGM SUREX (2005 – 2010) |
IAMGOLD-RGM did not receive information from the Republic of Suriname regarding the sampling method and approach historically used by Golden Star and Newmont.
| 10.2.4.2 |
IAMGOLD-RGM SUREX (OCTOBER 2016 – DECEMBER 2017) |
Core Drilling
IAMGOLD-RGM SurEx implements standard operating procedures (SOP) of all sampling methods strictly followed by its staff and personnel. These procedures are reviewed on a regular basis dependent on site conditions and other specific requirements. All logging and sample information is stored in a secure database customized for IAMGOLD by GEMCOM.
Core boxes are brought from the drill pads to the Saramacca exploration camp by IAMGOLD-RGM technicians on a daily basis. Geotechnical and geological logging, as well as the marking of all sampling intervals, is done at the Saramacca camp by IAMGOLD-RGM geotechnicians and geologists. Core boxes are then transported to the RGM mine site for splitting and sampling of half core. Core shack leaders insert control samples, as per the geologists’ instructions, and prepare shipments to the primary assay laboratory, Filab Suriname N.V. (Filab) in Paramaribo. A chain of custody (COC) form is signed off at each step by the recipient and always accompanies the core.
Sampling interval ranges from 0.5 m to 1.5 m, however, in rare cases where core recovery is poor, the interval is extended to enclose fixed metre marks. Visual geological indicators, such as changes in lithology, weathering, alteration, mineralization and structure, and changes in hole diameter are taken into consideration in the identification of sampling boundaries. Core is entirely sampled from top to bottom. The sampling procedure is as follows:
| IAMGOLD Corporation - Rosebel Gold Mine | |
| Technical Report NI 43- 101 – November 5, 2018 | Page 10-11 |
At the Saramacca exploration camp:
| • |
Core is reassembled and cleaned, as needed, and orientation lines are drawn by the geologist or geotechnicians with arrows along the line pointing downhole. | |
| • |
Geotechnical logging is completed by the geotechnicians, who records core recovery, hardness of the core, RQD, joints, fractures, and the weathering facies into GemsLogger software using a laptop. Meter marks are placed on the side of the core box. | |
| • |
Geological logging is performed by IAMGOLD-RGM geologists who verify the geotechnical logging, mark the sampling intervals with a red china marker, assign the sample number, and insert a sample tag at the end of each sampling interval. A vertical line is drawn with a red china marker on the side of the core box at sample boundaries with two arrows on each side pointing away from the line to indicate the beginning and end of a sample interval. In fresh rock, the same markings are done additionally on the core. | |
| • |
A black cutting line is drawn along the core and perpendicular to the main fabric by the geologist or technicians to delineate two symmetrical halves. This line serves as a guide for core splitting at the RGM mine site. | |
| • |
Where core orientation is available, the core is split along the orientation line; the orientation being preserved by the arrows along the line pointing downhole. | |
| • |
A sampling log is prepared by IAMGOLD-RGM geologists with required control samples (blanks and certified reference materials, CRM) as per quality assurance and quality control procedure. For the beginning of every hole, a rock blank is inserted. Then, CRM and blanks are inserted alternately every 10 samples. | |
| • |
Location of specific gravity (SG) determination samples are marked by blue flagging tape tagged on the side of the core tray divider, on which the geologist writes the FROM and TO of the SG sample to later be collected at the RGM mine site. | |
| • |
Preliminary core photographs of all core boxes are taken before they are transported to the RGM mine site. Boxes are loaded onto a truck owned by Vonkel, a long-term contractor who also provides field work services. The chain of custody accompanies the core boxes and is signed off at each step from the drill pad to the final delivery to the laboratory. | |
| • |
The completed digital geological and geotechnical logs are then sent through email to the database manager to be imported into the database. |
At the RGM mine site:
| • |
Sampling is carried out by IAMGOLD-RGM samplers and geotechnicians under the supervision of IAMGOLD-RGM geologists and core shack supervisors who insert control samples and prepare shipment to the laboratory. | |
|
| ||
| • |
Once at the RGM mine site core shack, core boxes are sorted on logging tables. | |
|
| ||
| • |
Photographs of wet and dry core with inserted sample tags are taken of every core box prior to cutting. |
| IAMGOLD Corporation - Rosebel Gold Mine | |
| Technical Report NI 43- 101 – November 5, 2018 | Page 10-12 |
| • | A machete is used to cut soft and saprolite rock in two symmetrical halves while a diamond core saw is employed for hard rock. Core is halved along cutting lines or orientation lines previously drawn at the Saramacca camp. | |
|
| ||
| • |
Half core is consistently collected from one side and put into a plastic sample bag with the sample ID marked and corresponding sample tag attached to bag. | |
|
| ||
| • |
Wood blocks are inserted in core trays at one metre intervals to secure the position of core in the boxes | |
|
| ||
| • |
SG samples, previously identified in core trays by blue flagging tape, are collected (10 to 20 cm of half-core) and a sample tag with a unique SG sample ID is tagged to the core tray where the sample was taken. The core shack leader writes a list of all SG samples taken with their sample ID and from and to values. The list is entered in the database by either the geologist who logged the hole or the database manager. Note that SG samples are collected after assay samples are taken to ensure entire intervals are assayed and there is no gap where an SG sample was collected. | |
|
| ||
| • |
Using the sampling list provided by IAMGOLD-RGM geologists, the core shack leader prepares control samples (blanks and CRM) to be inserted with core samples and takes a photograph of the control samples with their sample tags attached. The core shack leader then erases the manufacturer’s labels from the aluminum foil sachets and places tagged control samples in individually labeled sample bags. | |
|
| ||
| • |
Control samples are sequentially inserted amongst samples by the core shack leader. | |
|
| ||
| • |
Samples are packed in groups of four in rice bags labelled with the Company name (IAMGOLD), the sample number interval, the internal project code number, total number of samples in the bag, and the rice bag number. | |
|
| ||
| • |
The core shack leader prepares one submittal form per borehole so that one submittal contains only one complete borehole and then signs the chain of custody form. | |
|
| ||
| • |
Rice bags and accompanying submittal and chain of custody forms are transported to Filab by a truck owned and operated by Vonkel. | |
|
| ||
| • |
The closed core boxes are piled chronologically, per hole, on a wooden pallet and kept for future reference. |
Reverse Circulation Drilling
Sampling is supervised by an IAMGOLD-RGM geologist or technician at the drill site. FTE Forage drilling personnel collect the samples from the Metzke cyclone splitter, while IAMGOLD-RGM personnel are responsible for further handling of the samples including weighing, tagging, and logging using GemsLogger on a laptop or tablet. All further sample handling in preparation for shipment to Filab is done at Saramacca camp.
| IAMGOLD Corporation - Rosebel Gold Mine | |
| Technical Report NI 43- 101 – November 5, 2018 | Page 10-13 |
At the drilling site:
| • |
IAMGOLD-RGM’s technician and/or geologist ensures that the drill crew has all necessary material required to start drilling including pre-labelled sample bags (clearly stating only the hole number and sample interval) and nylon cable ties or flagging tape. | |
| • |
The drill crew must level the cyclone splitter before drilling to ensure drill cutting distribution between the four chutes remains constant. | |
| • |
Three samples are collected from the cyclone splitter per two- metre interval, as shown in Figure 10- 2. | |
| • |
The sample distribution in the cyclone splitter is arranged so that the assay sample weighs approximately three kilograms, while the remaining drill cuttings are collected as back-up sample. | |
| • |
The samples are collected by the drill crew with utmost care to avoid contamination. The assay and back-up samples are collected continuously from the first and second chute, and the third chute is used every 25 samples to collect a field duplicate. | |
| • |
The assay samples are weighed, tagged, and logged at the drill site (logged if a geologist is present at the drill site). A representative scoop of sample is taken from the sample bag and placed in a chip tray for future reference. | |
| • |
The back-up samples are tied, sorted in sequence with the sample bag opening folded down, covered with a tarpaulin, and left on the drill pad. Once assay results are received and quality assurance and quality control procedures are completed, the decision can be made to store or discard the back-up samples. | |
| • |
The cyclone splitter is cleaned before drilling a new hole and at each rod change to minimize contamination. | |
| • |
Assay samples are transported to the Saramacca camp by the IAMGOLD-RGM crew. |
At the Saramacca camp:
| • | The samples are sorted in sequence. Irregularities, such as missing samples, are reported to the IAMGOLD-RGM geologist responsible for RC drilling. | |
| • | If not already done in the field, the geologist logs the drill cuttings accordingly, paying attention to weathering, alteration, texture, structure, mineralization, and veining. Sample weight and sample numbers are entered into GemsLogger. | |
| • | Control samples are inserted into the sequence by the geologist. | |
| • | A photo of the chip trays for each borehole is taken for future reference. | |
| • | Sample tags are assigned by the geologist. | |
| • | Sample bags are placed in rice bags. The sample number intervals and total number of samples in that bag are written on the rice bag. | |
| • | Rice bags are shipped along with accompanying submittal and chain of custody forms to Filab by a truck owned and operated by Vonkel. |
| IAMGOLD Corporation - Rosebel Gold Mine | |
| Technical Report NI 43- 101 – November 5, 2018 | Page 10-14 |
FIGURE 10-2 REVERSE CIRCULATION DRILLING SAMPLE FLOWCHART

Sample Identification
Borehole identification codes comprise four parts: the project ID (SM for Saramacca), the type of drilling (DD for core drilling or RC for reverse circulation drilling), the year (16 or 17) and a sequential sample number starting at 001 for the first DD hole drilled in 2016 to 180 for the last borehole drilled in 2017, or 037 for the last RC hole drilled. For example, hole SMDD17-101 was drilled on the Saramacca project as a DD hole drilled in 2017 and is the 101st DD hole drilled by IAMGOLD-RGM since the beginning of the drilling program.
Sample identification codes consists of only one unique sequential number comprising seven digits. For example, #1060615.
All digital data associated with sampling is stored on the Suriname Exploration computer servers at the RGM mine site.
| 10.2.4.3 | IAMGOLD-RGM MINEX (JANUARY 2018 – MAY 2018) |
Core Drilling
Core processing and logging procedures mirror that of IAMGOLD-RGM SurEx department.
| IAMGOLD Corporation - Rosebel Gold Mine | |
| Technical Report NI 43- 101 – November 5, 2018 | Page 10-15 |
Sample Identification
Borehole identification codes comprise three parts: the project ID (SM for Saramacca), the type of drilling (D for core drilling) and a sequential drill hole number starting at 0001 for the first borehole drilled in 2018 to 0020 for the last borehole drilled in May 2018.
Similar to SurEx sampling protocol, sample identification codes consist of only one unique sequential number comprising seven digits.
All digital data associated with sampling is stored on the Suriname Exploration computer servers at the RGM mine site.
| 10.2.5 |
SPECIFIC GRAVITY |
A total of 4,776 samples were sent to IAMGOLD’s Rosebel Gold Mine site laboratory for SG determination at Saramacca. SG samples comprise segments of 10 to 20 cm of half core deemed representative of their respective unit. Samples are typically collected every 10 m in soft oxidized material down to the transition zone, and thereafter every 25 m in fresh rock. The frequency may locally increase to cover rapid changes in lithology to ensure all lithotypes are sampled.
SG samples were collected from the top to the bottom of each DD hole in both mineralized and barren material. Soft samples are wrapped in plastic film and the wrapped sample with a tag is then put inside a thick paper sachet identified with a sample tag. Fresh, hard samples are not required to be wrapped.
SG is determined by the gravimetric method, where the material is covered in a paraffin wax coat and weighed in air and then suspended in water.
Once SG determination is completed, the laboratory returns the samples, which are then put back in their original core boxes. Results are transmitted electronically and entered in the database by the database manager.
As part of the quality assurance and quality control procedure, 147 samples were sent to ALS Mineral (ALS) in Vancouver (secondary laboratory) for verification in 2017.
| IAMGOLD Corporation - Rosebel Gold Mine | |
| Technical Report NI 43- 101 – November 5, 2018 | Page 10-16 |
SG sample identification codes comprise five parts: The prefix SG-, the project ID (SM for Saramacca), the type of drilling (DD for core drilling), the year, and a sequential sample number starting at 001 for the first SG sample collected in 2016. For example, SG-SMDD17-2004 is a SG sample collected in 2017 from a core borehole drilled at Saramacca and is the 2,004th SG sample collected by IAMGOLD-RGM since the beginning of the drilling program.
| 10.2.6 |
SRK COMMENTS |
SRK is of the opinion that the drilling and sampling procedures adopted at Saramacca by IAMGOLD-RGM are consistent with generally recognized industry best practices. The applied drill pattern is sufficiently dense to interpret the geometry and the boundaries of the gold mineralization with confidence. The core samples were collected by competent personnel using procedures meeting generally accepted industry best practices. The sampling was undertaken or supervised by qualified IAMGOLD-RGM geologists. SRK concludes that the samples are representative of the source materials and there is no evidence that the sampling process introduced a bias.
| IAMGOLD Corporation - Rosebel Gold Mine | |
| Technical Report NI 43- 101 – November 5, 2018 | Page 10-17 |
| 11 | SAMPLE PREPARATION, ANALYSES AND SECURITY |
In 2018, all RGM samples (RC grade control) were analyzed using the Pulverize and Leach (PAL) procedure, and all the Saramacca samples (DDH) were analyzed using the Fire Assay (FA) procedure.
In the IAMGOLD’s and SRK’s opinion, the sample preparation, analysis, and security procedures at RGM and Saramacca are adequate for use in the estimation of Mineral Resources.
| 11.1 |
RGM CONCESSION |
| 11.1.1 |
SAMPLE PREPARATION |
| 11.1.1.1 |
RGM SAMPLE PREPARATION FOR FIRE ASSAY |
The whole samples (4 kg) are placed in large drying pans and placed in the dryer for about four hours at 105°C in order to be completely dry. Cooled samples are first crushed to approximately 75% passing -8 mesh. One in every 21 samples is screened for percentage passing – 8 mesh. After this first step of comminution, this material is called a “coarse” sample.
The samples are then riffle split to approximately 800 g and the rest of the coarse sample is kept by the laboratory until the geology department decides which coarse rejects can be discarded. The coarse samples are then pulverized to approximately 95% passing – 170 mesh. This material is now called “pulp”. One in every 21 samples is screened for percentage passing – 170 mesh. Thirty grams of pulp are sampled and the rest of the pulp sample is kept by the lab until the geology department decides which pulp rejects can be discarded.
| 11.1.1.2 |
RGM SAMPLE PREPARATION FOR PULVERIZING AND LEACHING |
The whole samples (5 kg) are placed in large drying pans and placed in the dryer for about four hours at 105°C in order to be completely dry. Cooled samples are first crushed to approximately 75% passing -8 mesh. One in every 52 samples is screened for percentage passing – 8 mesh. After this first step of comminution, this material is called a “coarse” sample.
| IAMGOLD Corporation - Rosebel Gold Mine | |
| Technical Report NI 43- 101 – November 5, 2018 | Page 11-1 |
The samples are then riffle split to approximately 800 g and the rest of the coarse sample is kept by the lab until the geology department decides which rejects can be discarded. Three hundred grams of coarse material are sampled for assaying.
| 11.1.1.3 |
FILAB SAMPLE PREPARATION FOR FIRE ASSAY |
The SurEx 2017 campaign was analysed at Filab, an external laboratory. The procedure is similar to that used at the RGM Laboratory. The only change is the proportion of samples kept after splitting around 300g of coarse material and the 50g sent for assaying.
| 11.1.2 |
ANALYSIS |
| 11.1.2.1 |
LABORATORY |
After the samples have been split and put in pre-identified plastic bags, they are delivered by the core shack personnel to the RGM Laboratory or transported by a contractor to an external Laboratory in Paramaribo (since 2009). Since 2014, Filab and ENZA are used as check laboratories by RGM Laboratory for the Fire Assay process. For the PAL samples, RGM Laboratory is using, as external laboratories, CRS-Actlab, Merian Gold Mine Laboratory (Suriname, Newmont), and ENZA Analytical Services.
The RGM Laboratory, associated with the Mill, is fenced and has security posted at the entrance. As soon as they arrive at the laboratory site, samples are registered either into the Laboratory Information Management System (LIMS, RGM), are scanned and given an internal ID (Filab), and are then stored. To ensure the integrity of each sample shipment, the core shack supervisor/geologist from the Mine Exploration department, using the submittal sheet, verifies that all samples are accounted for when the samples are shipped out. A submittal sheet is forwarded, as well, to the laboratories to verify, at the receiving end, that no sample is missing.
| 11.1.2.2 |
RGM FIRE ASSAY |
Approximately 30 g of the pulp 95% passing approximately 170 mesh is used for the fire assay manipulation. This pulp material is mixed with the appropriate flux and silver nitrate solution and is placed in a crucible. Fusion of the sample occurs in a furnace for 45 minutes at 900°C. When cooled, the lead-button containing gold is separated and put in a pre-fired cupel which is positioned in the furnace for 30 minutes at around 950°C. When no more molten lead is visible, the gold-silver bead stays in the cupel. The sample is ready for the atomic absorption finishing.
| IAMGOLD Corporation - Rosebel Gold Mine | |
| Technical Report NI 43- 101 – November 5, 2018 | Page 11-2 |
| 11.1.2.3 |
RGM PULVERIZE AND LEACH SYSTEM |
Around 300 g of the coarse material > 75% passing 8 mesh is precisely measured and used for the PAL manipulation. This pulp material is put in an iron container with 1,000 ml of water, two cyanide assay tabs, and with a few steel balls (two balls of 36 mm, four balls of 27 mm, and 1 kg of 12 mm). The PAL machine grinds and leaches the material for 90 minutes. An aliquot of 10 ml is collected per pot (The PAL runs 52 pots at the same time). The aliquot is sent for atomic absorption analysis after having filtered the grind media out.
| 11.1.2.4 |
FILAB FIRE ASSAY |
The analysis procedure of Filab remain the same as the RGM Laboratory with the exception that 50 g of the pulp is used for the fire assay manipulation.
| 11.1.2.5 |
ATOMIC ABSORPTION AND GRAVIMETRY |
The majority of the analyses are made by atomic absorption. This technique makes use of absorption spectrometry to assess the concentration of an analyte in a sample.
For Fire Assay, the gold is not analyzed directly, but rather in solution. The sample is placed in test tubes and digested into HNO3 HCL (aqua regia) before readings on the atomic absorption spectrometer.
For PAL, the solution collected out of the PAL process is read by the atomic absorption spectrometer by direct aspiration.
In case of a high concentration of gold, the sample may be subject to gravimetric finishing by directly weighing the gold. A computer is connected to the machine and records all the collected assays.
| 11.1.3 |
QUALITY ASSURANCE AND QUALITY CONTROL |
| 11.1.3.1 |
BLANKS |
The blanks are chronologically plotted. The safety limit is defined by two times the detection limit for pulp blank and by three times the detection limit for coarse blank. The RGM Laboratory detection limit adds up to 0.014 g/t Au.
| IAMGOLD Corporation - Rosebel Gold Mine | |
| Technical Report NI 43- 101 – November 5, 2018 | Page 11-3 |
If any blank is higher than any of these defined safety limits, a contamination issue is detected and the batch or the sequence of samples related to this contaminated blank has to be re-assayed.
A contamination period is considered when 10% of the coarse blanks or 5% of the pulp blanks exceed the safety limit. In that case, all the assays between problematic blanks have to be assayed again and a long term investigation has to be run.
| 11.1.3.2 |
STANDARD REFERENCE MATERIAL |
Different charts are used to analyze the standard reference material (SRM) assays:
| • |
A classical control chart, plotting the results in chronological order as well as the SRM reference value, the experimental mean and the experimental standard deviation (σ). This first chart is usually useful to detect quickly outliers (all values outside the interval defined by the experimental mean +/- 3*σ). | |
| • |
A bias chart with moving average of the assays plotting within confidence intervals. This visual approach highlights the portions of the moving average exceeding the limits of the confidence interval and shows up the batches that need to be re-analyzed. |
If any standard fails, all the samples between this standard reference material and the next one and the previous one have to be re-assayed. If a trend or bias is observed, an investigation has to be run to solve the origin of this abnormal behavior.
| 11.1.3.3 |
DUPLICATES AND CHECK ASSAYS |
Two different graphs are used to plot this kind of control:
| • |
The first one is a scatter plot of the duplicate/check assays versus the original sample assays to visually detect outliers. All the pairs of data outside the two rejected curves are considered as outliers. | |
| • |
The second one is a relative difference control chart. The relative difference is computed with the original sample assays and the duplicate/check assays. It is plotted in function of the original sample grades. A moving average is also calculated to help the reading of the chart. |
| 11.1.3.4 |
MINE GEOLOGY DEPARTMENT QUALITY CONTROL PROCEDURES |
Since the needs of the Mine Exploration department and Mine Geology department differ to some extent, the bulk of the procedure is the same as for the Mine Exploration department. The quality control process will show slight differences, however, the overall goal remains the same, to ensure that both departments can rely on the assay results.
| IAMGOLD Corporation - Rosebel Gold Mine | |
| Technical Report NI 43- 101 – November 5, 2018 | Page 11-4 |
The RGM Laboratory quality control is made internally and by the client (Mine Geology department) in order to maintain the highest possible standard controls. Quality control is provided by the Mine Geology department for the RC samples and the blast hole samples by requiring regular re-tagged coarse reject duplicates and by submitting Field Duplicates. Since the blast holes assays are not used in the resource and reserve estimations, the quality assurance/quality control (QA/QC) results will be developed only for the RC assays (Table 11-1):
| • |
Coarse Reject Duplicates: 1% of the unused fraction of the crushed rock sample has been retagged. They are used to evaluate the reproducibility of results. | |
|
| ||
| • |
RC Field Duplicates: 3-5% of the remaining half-split of a RC-sample is afterwards mixed / split / and retagged with a different number. They are used to verify the homogeneity of a sample after splitting out in the field. | |
|
| ||
| • |
Standard Reference Materiel: 0.2% of the sample send to RGM lab are SRM used to check the QA/QC of the RGM Lab. |
No major bias has been observed in 2017.
| TABLE 11-1 PULVERIZE AND LEACH STANDARD REFERENCE MATERIAL |
| SUMMARY 2017 |
| Mine Geology Department Quality Control | |
| Type of samples | RC |
| Assaying Method | PAL |
| Number of Sample | 200,498 |
| Number of SRM | 325 |
| % of SRM | 0.2% |
| Number of SRM Outlier | 26 |
| % of SRM Outlier | 8.0% |
| Number of Coarse Reject Duplicate | 824 |
| % of Coarse Reject Duplicate | 0.41% |
| Number of Coarse Reject Duplicate Outliers | 34 |
| % of Coarse Reject Duplicate Outliers | 4.13% |
| Number of Field Duplicate | 6,982 |
| % of Field Duplicate | 3.48% |
| Number of Field Duplicate Outliers | 294 |
| % of Field Duplicate Outliers | 4.21% |
| IAMGOLD Corporation - Rosebel Gold Mine | |
| Technical Report NI 43- 101 – November 5, 2018 | Page 11-5 |
| 11.2 |
SARAMACCA CONCESSION |
| 11.2.1 |
SAMPLE PREPARATION AND ANALYSES |
No information exists regarding laboratories used by Golden Star and Newmont for exploration samples collected between 2005 and 2010.
Exploration samples collected by IAMGOLD-RGM SurEx from 2016 to 2018 were submitted to Filab in Paramaribo, Suriname, the representative of ALS Global in Suriname, N.V. Samples collected by IAMGOLD-RGM MinEx in 2018 were submitted to RGM laboratory (RGM lab). Umpire testing of samples from both MinEx and SurEx groups was conducted through ALS Minerals laboratory (ALS) in Vancouver, Canada. Filab and ALS are autonomous, commercial geochemical laboratories that operate independently of IAMGOLD-RGM. The RGM laboratory is an internal mine laboratory operated by IAMGOLD-RGM.
Filab and ALS have been accredited to ISO/IEC 17025 for geochemical analyses, including those used by IAMGOLD-RGM. Filab and RGM lab are audited, at least bi-monthly, by IAMGOLD-RGM staff. ALS is accredited to ISO/IEC 17025 by the Canadian Association for Laboratory Accreditation, Inc. (CARLA) with registration number A1719, including those used by IAMGOLD-RGM. RGM lab has been accredited to ISO 17025 (accreditation number A3711) and has been audited by IAMGOLD-RGM staff a total of 19 times between January and April 2018.
| 11.2.2 |
GOLDEN STAR AND NEWMONT (PRE-2016) |
Sample preparation, analysis and security procedures for samples taken by Golden Star and Newmont from 2005 to 2010 are undocumented and therefore unavailable for review.
| 11.2.3 |
IAMGOLD-RGM (2016 – 2018) |
Sampling procedures are described in Section 10. All samples were collected by, or under the secure supervision of, IAMGOLD-RGM personnel, from the time of sampling through to being received at the primary laboratory.
Samples are transported exclusively by IAMGOLD-RGM personnel or by an independent contractor, Vonkel, between the drill site, Saramacca camp, RGM lab, and Filab. The samples are recorded on the chain of custody (COC) form, grouped by borehole and signed off by both the sender and receiver of samples at each transportation stage between the drill site and laboratory. The signed chain of custody forms are scanned, filed, and stored, both digitally and as a hard-copy. Reference halved-core, pulps, and rejects are stored within a secured perimeter at the RGM mine site.
| IAMGOLD Corporation - Rosebel Gold Mine | |
| Technical Report NI 43- 101 – November 5, 2018 | Page 11-6 |
| 11.2.4 |
SUREX (OCTOBER 2016 – DECEMBER 2017) |
Samples collected from DD and RC drilling by IAMGOLD-RGM SurEx are transported in sealed bags to Filab where they were weighed, dried, coarse-crushed to <2.5 mm and between 350 to 450 g were pulverized to 85% passing <100 microns. Gold was analyzed in both DD and RC samples at Filab using 50 g charges by fire assay with atomic absorption finish to a detection limit of 0.005 g/t (Filab code FA50). After 2017, samples exceeding 5 ppm were reanalyzed with a gravimetric finish. The pulps from the 2016 DD drilling campaign were also assayed for a suite of 40 elements using four acid digestion and inductively-coupled plasma emission spectroscopy (ICP-ES) (Filab code ICP40). Representative samples of each rock type are taken from each drill hole for bulk density measurements.
The excess material coarse rejects and pulps of DD and RC samples sent to Filab were returned to IAMGOLD-RGM and stored securely on site. A portion of these samples (approximately 8% of total samples) were selected for check assay testing either randomly or to corroborate specific assay results at the umpire laboratory. Check assay analysis was completed at ALS by fire assay using 50 g charges with an atomic absorption finish to a detection limit of 0.005 g/t Au (method code FA-AA25).
| 11.2.5 |
MINEX (JAN 2018 – APRIL 2018) |
Core samples collected through DDH drilling by IAMGOLD-RGM MinEx were submitted to the RGM Laboratory. Samples are dried in large drying pans in the dryer for four hours at 105° C. Once cooled, samples are crushed with a Bico-Badger crusher to approximately 75% passing a -8 mesh, however, a primary crusher is required if the samples are coarse (>50 mm). The samples are then rifle split to approximately 800 g. The remainder of the sample is stored in plastic bags as coarse reject.
Coarse samples are pulverized to approximately 95% passing -170 mesh with a Bico UA pulverizer. Thirty grams is homogenized by rolling and used for analysis. The remaining material is stored in a plastic bag as the pulp reject. Gold is analyzed by fire assay on 30 g charges with an atomic absorption spectroscopy finish to a detection limit of 0.014 g/t Au (RGM method code FA-AAS).
| IAMGOLD Corporation - Rosebel Gold Mine | |
| Technical Report NI 43- 101 – November 5, 2018 | Page 11-7 |
A sand wash is used between pulverizing samples to clean the tool surfaces and prevent contamination.
The RGM laboratory is fenced and the entrance is guarded by security. Samples are registered into the LIMS upon arrival at the laboratory to manage assay data and automatically collect assay information and store it securely on the server.
Umpire check assays were performed at ALS in Vancouver on pulp and coarse reject material by fire assay using 50 g charges with an atomic absorption finish to detection limits of 0.005 g/t Au on 50 g charges (ALS method code FA-AA25). Samples grading over 5 g/t Au are analyzed by gravimetric finish.
| 11.2.6 |
QUALITY ASSURANCE AND QUALITY CONTROL PROGRAMS |
Quality assurance and quality control programs are typically set in place to ensure the reliability and trustworthiness of the exploration data. They include written field procedures and independent verifications of aspects such as drilling, surveying, sampling and assaying, data management, and database integrity. Appropriate documentation of quality control measures and regular analysis of quality control data are important as a safeguard for the project data and form the basis for the quality assurance program implemented during exploration.
Analytical control measures typically involve internal and external laboratory control measures implemented to monitor the precision and accuracy of the sampling, preparation, and assaying. They are also important to prevent sample mix-up and monitor the voluntary or inadvertent contamination of samples. Assaying protocols typically involve regular duplicate and replicate assays and insertion of quality control samples. Check assaying is typically performed as an additional reliability test of assaying results. This typically involves re-assaying a set number of rejects and pulps at an umpire laboratory.
| 11.2.6.1 |
GOLDEN STAR AND NEWMONT (PRE-2016) |
There are no records of quality assurance and quality control protocols or performance for exploration work performed by Golden Star and Newmont from 2005 to 2010.
| IAMGOLD Corporation - Rosebel Gold Mine | |
| Technical Report NI 43- 101 – November 5, 2018 | Page 11-8 |
| 11.2.6.2 |
IAMGOLD-RGM (2016- 2018) |
IAMGOLD-RGM follows a quality assurance/quality control protocol which involves:
| • | The insertion of CRM | |
| • | The insertion of certified pulp and rock blanks | |
| • | The insertion of uncertified commercial rock blanks, which were tested to be barren | |
| • | Field duplicates in RC holes | |
| • | Check assays (coarse rejects and pulps) | |
| • | Periodic audits at the primary laboratories, Filab, and RGM laboratory |
IAMGOLD-RGM’s procedures for quality control sample insertion rates are outlined in Table 11-2.
TABLE 11-2 STANDARD PROCEDURE FOR
QUALITY CONTROL SAMPLE
INSERTION RATES, SARAMACCA PROJECT
| Blanks | CRMs | Field Duplicates | Check Assays (Pulps) (%) |
Check Assays (Rejects) (%) | |
| SurEx | |||||
| DD drilling | 1 every 20 | 1 every 20 | None | 5% to ALS | 5% to ALS |
| RC drilling | 1 every 20 | 1 every 20 | None | 5% to ALS | 5% to ALS |
| Failure limit | 0.1 g/t | +/- 3 SD* | +/- 20 percent | - | - |
| Corrective action | Reject or resend (+/- 10 samples) |
Reject or resend (+/- 10 samples) |
- | - | - |
| MinEx | |||||
| DD drilling | 1 every 30 | 1 every 30 | None | 5% to ALS 2% to RGM |
5% to ALS 2% to RGM |
| Failure limit | 0.048 g/t | +/- 3 SD* | - | - | - |
| Corrective action | ¼ core resampled between two acceptable blanks |
Pulps resent between two acceptable standards |
- | - | - |
* Standard deviation
Commercial CRM were sourced from Ore Research & Exploration Pty Ltd Of Australia (OREAS) and Rocklabs Ltd. Of Auckland, New Zealand (Rocklabs). IAMGOLD-RGM has used a total of 11 CRM types between July 2017 and April 2018 ranging from 0.20 g/t Au to 14.18 g/t Au and include both the oxide and sulfide facies, summarized in Table 11-3.
| IAMGOLD Corporation - Rosebel Gold Mine | |
| Technical Report NI 43- 101 – November 5, 2018 | Page 11-9 |
Blank materials 24c and 26b utilized by SurEx were sourced from OREAS with a certified value of 0.01 g/t Au. Field blank material was sourced locally from a sill known to be barren with respect to gold and is considered a coarse blank.
In the case of a failure of control samples, quartered DD or RC pulps between two acceptable CRM or blanks surrounding the significant failure are resubmitted to the primary and secondary lab respectively. New control samples are inserted at the same frequency as for primary samples.
In addition to the inserted control samples, IAMGOLD-RGM SurEx collected one field duplicate every 25 samples from RC holes. No field duplicates were systematically collected in drill core.
Check assaying of coarse reject and pulp material was performed on approximately 2 percent of MinEx samples at the primary laboratory, chosen randomly or to corroborate specific assay results. Approximately 3 percent of SurEx coarse duplicate samples were submitted for similar check assaying to the primary laboratory.
As part of the analytical data verification, SurEx and MinEx submitted sample pulps to ALS in Vancouver for umpire check assay testing between July 2017 and April 2018. The samples cover a range of gold values and were assayed by fire assay with an atomic absorption finish (ALS method code FA-AA25 or FA-AA26).
TABLE 11-3 SUMMARY OF CERTIFIED
REFERENCE MATERIALS USED BY
IAMGOLD-RGM FROM JULY 2017 TO APRIL 2018
| Low grade Gold (0-1 ppm) | Medium Grade Gold (1-5 ppm) | High Grade Gold (>5 ppm) | |||||||||||
| Standard
ID |
Expected Value |
SD* | Inserts | Standard ID |
Expected Value |
SD* | Inserts | Standard ID |
Expected Value |
SD* | Inserts | ||
| SurEx | |||||||||||||
| 250 | 0.309 | 0.013 | 288 | 209 | 1.58 | 0.044 | 296 | 210 | 5.49 | 0.152 | 126 | ||
| 252 | 0.674 | 0.022 | 228 | 254 | 2.55 | 0.076 | 30 | 257 | 14.18 | 0.264 | 7 | ||
| 202 | 0.752 | 0.026 | 385 | ||||||||||
| MinEx | |||||||||||||
| OXC88 | 0.203 | 0.01 | 157 | SG56 | 1.027 | 0.033 | 95 | ||||||
| SE58 | 0.607 | 0.019 | 18 | SJ53 | 2.637 | 0.048 | 67 | ||||||
| Total | 288 | Total | 326 | Total | 133 | ||||||||
* Standard Deviation
| IAMGOLD Corporation - Rosebel Gold Mine | |
| Technical Report NI 43- 101 – November 5, 2018 | Page 11-10 |
| 11.2.7 |
SRK COMMENTS |
SRK reviewed the field procedures and analytical quality control measures used at the IAMGOLD-RGM Saramacca gold project. In the opinion of SRK, company personnel used care in the collection and management of the field and assaying exploration and production data.
With the handover of the project to MinEx in early 2018 the samples are now being analyzed at the internal RGM laboratory. Based on SRK’s review, the RGM internal laboratory used procedures and equipment that are adequate for the analysis of gold from the Saramacca project.
In the opinion of SRK, the sampling preparation, security, and analytical procedures used by IAMGOLD-RGM are consistent with generally accepted industry best practices and are, therefore, adequate for informing Mineral Resources.
| IAMGOLD Corporation - Rosebel Gold Mine | |
| Technical Report NI 43- 101 – November 5, 2018 | Page 11-11 |
| 12 |
DATA VERIFICATION |
| 12.1 |
RGM CONCESSION DATA VERIFICATION |
| 12.1.1 |
DATABASE ORGANIZATION |
The whole mineral inventory is monitored through GEMS 6.7 by Dassault Systèmes which is supported by centralized SQL Server 2014 databases. These SQL databases are hosted on a virtual SQL server under the responsibility of the IT department while the databases themselves are under the responsibility of the database administrator.
GEMS is mainly used by: 1) the geologists for reserve and resource estimations, geological modelling, management of the drilling campaign, and packet design; 2) the mine planners to complete pit designs, short term planning, and whittle shells and; 3) the surveyors to record spatial information.
Each pit in the RGM concession forms a distinct GEMS project and so, constitutes an individual database. The GEMS projects are made of different workspaces which are a grouping of data within a project on the basis of type, such as points, drill holes, polylines, polygons, and triangulations (solids and surfaces). Workspaces are organized into tables, with each workspace consisting of at least one header table and potentially an unlimited number of sub-tables.
The database has a high security level administered in SQL via SQL Server Management Studio, a graphical interface of SQL 2014. The mine employees requiring the use of GEMS are first added to the SQL server users list through SQL Server Management Studio with their Domain Login names. Then, for each database, the user is added to a role, which is a SQL group of users with specific permissions.
In SQL, for each project there are six main roles having distinct permissions for each workspace (BLOCK, SUR, PLN, GEO, ENG, and OC). When a user is added to a role, he/she automatically gets the permissions attributed to this role. Special restrictions are applied for critical data: 1) the block model workspaces can only be modified by the resource geologists and the database administrator; 2) the assays table from drill holes are read-only once the results have been imported. The management of those permissions is monitored by a limited number of qualified persons.
| IAMGOLD Corporation - Rosebel Gold Mine | |
| Technical Report NI 43- 101 – November 5, 2018 | Page 12-1 |
Backups of the databases are made daily under the supervision of the database administrator. These backups are part of a back-up plan that automatically runs every night. The last six backups are kept on the server and one backup, a week, is transferred to another server and is kept for five weeks. The IT department also carries out a complete backup of the server VROSGEMS01 every day and monthly. Daily backups are incremental and the monthly backups are stored on tape.
| 12.1.2 |
DRILL HOLE VALIDATION |
The geological data from the exploration program is imported in the database via LogChief, a logging software provided by Maxwell Geoservices, which is linked to the central database.
After the logging and assaying information have been imported into GEMS through the logger, the geologist who logged the hole and his supervisor are responsible to do a validation of his data including: 1) visual validation of the drill hole in Gems; 2) cross check for overlapping and missing intervals using the Gemcom validation tool; 3) do the quality control (QC) check on the samples when the results are received.
When the QC has been completed and all of the data has been validated, confidence in this data is considered adequate to be used in the Mineral Resource estimations. Beyond this, an extra validation is completed by the resource geologist to ensure the integrity of the data used.
It is the QP’s opinion that the logging, sampling procedures, and data entries were completed to industry standards. It is the QP’s opinion that the database is adequate to support a Mineral Resource estimate on the RGM property.
| 12.2 |
SARAMACCA CONCESSION DATA VERIFICATION |
| 12.2.1 |
VERIFICATIONS BY IAMGOLD-RGM |
IAMGOLD-RGM employed quality control procedures and quality assurance actions to provide adequate confidence in data collection and processing. During drilling, experienced IAMGOLD-RGM geologists implemented industry standard measures designed to ensure the reliability and trustworthiness of exploration data.
| IAMGOLD Corporation - Rosebel Gold Mine | |
| Technical Report NI 43- 101 – November 5, 2018 | Page 12-2 |
Database verifications consisted of monitoring all data imported into the database for errors, such as overlapping sample intervals or missing information. Monitoring of data was completed manually, and with the use of a database program.
Regular analysis of analytical quality control data was undertaken by IAMGOLD-RGM following the IAMGOLD Fire Assay Guidelines. These guidelines state that when a quality control failure occurs, all samples between two acceptable standards surrounding the failure must have their rejects and pulps re-assayed with new control samples, and the project geologist is notified of the failure. A quality control failure was defined by IAMGOLD-RGM as, for any given sample batch, the analysis of two standard samples outside of two standard deviations, or one standard sample outside of three standard deviations.
| 12.2.1.1 |
SUREX |
As part of the analytical data verification, IAMGOLD-RGM SurEx submitted 1,188 sample pulps to ALS in Vancouver for umpire testing between July 2017 and April 2018. The samples cover a range of gold values and were assayed by fire assay with an atomic absorption finish (ALS method code FA-AA25). Additionally, routine monthly audits of Filab were performed by IAMGOLD-RGM SurEx staff.
IAMGOLD-RGM SurEx staff reviewed and documented the performance of CRM and duplicate testing in monthly internal reports. SurEx staff identified quality control material failures and investigated the cause of each, supported by laboratory audits. In March of 2018, a field duplicate bias was identified and after investigation it was reported to be due to improper alignment of the cyclone splitter during sampling and was corrected.
| 12.2.1.2 |
MINEX |
Monthly internal QA/QC reports document in detail the monitoring of quality control samples performance from January to April 2018. Where MinEx personnel have identified CRM failures, sample batches have been resubmitted for repeat analysis and the new certificates were used in replacement of the originals. In March 2018, a positive bias of duplicate assay results was detected by MinEx staff. Although an investigation with the primary laboratory did not reveal any issues, 30 additional samples were sent to the umpire laboratory for repeat analysis to ensure the reliability of the assay results.
| IAMGOLD Corporation - Rosebel Gold Mine | |
| Technical Report NI 43- 101 – November 5, 2018 | Page 12-3 |
Umpire testing by IAMGOLD-RGM MinEx in 2018 involved submitting 374 sample pulps to ALS in Vancouver for analysis by fire assay with an atomic absorption finish (ALS method code FA-AA26). Additionally, routine weekly audits of RGM lab were performed by IAMGOLD-RGM MinEx personnel.
| 12.2.2 |
VERIFICATIONS BY SRK |
| 12.2.2.1 |
SITE VISIT |
In accordance with NI 43-101 guidelines, Dominic Chartier, P.Geo. (OGQ #874, APGO #2775), visited the Saramacca gold project from January 22 to 26, 2018, accompanied by Caroline Laplante and Samuelle Gariepy, geologists with IAMGOLD-RGM’s Suriname Exploration department.
The purpose of the site visit was to review the updated exploration database and validation procedures, review exploration procedures, examine drill core, interview project personnel, reassess geological modelling procedures, update the geological model, and collect all relevant information for the preparation of a revised Mineral Resource model and the compilation of a technical report.
SRK was given full access to relevant data and conducted interviews with IAMGOLD-RGM personnel to obtain information on the past exploration work, to understand procedures used to collect, record, store and analyze historical and current exploration data.
| 12.2.2.2 |
VERIFICATIONS OF ANALYTICAL QUALITY CONTROL DATA |
Drilling data on the Saramacca gold project between 2016 and July 2017 was verified within the 2017 Technical Report (SRK, 2017b). SRK deemed the analytical results delivered by Filab laboratory as sufficiently reliable for the purpose of Mineral Resource estimation.
SRK analyzed the analytical quality control data produced by IAMGOLD-RGM from the drilling programs conducted by SurEx and MinEx on the Saramacca gold project since the September 5, 2017 Mineral Resource estimate. All data were provided to SRK in Microsoft Excel spreadsheets. SRK aggregated the assay results of the external analytical control samples for further analysis. Control samples (blanks and CRM) were summarized on time series plots to highlight their performance. Paired data (preparation, pulp, umpire, and laboratory internal pulp duplicate assays) were analyzed using bias charts, quantile-quantile, and relative precision plots. A selection of the charted data is presented in Appendix A. The type of analytical quality control data collected, and their associated performances are discussed below and summarized in Table 12-1.
| IAMGOLD Corporation - Rosebel Gold Mine | |
| Technical Report NI 43- 101 – November 5, 2018 | Page 12-4 |
TABLE 12-1 SUMMARY OF ANALYTICAL
QUALITY CONTROL DATA
PRODUCED BY IAMGOLD-RGM ON THE SARAMACCA GOLD PROJECT
(JULY
2017 – APRIL 2018)
| Gold | |||||||||||||||||
| SurEx | (%) | MinEx | (%) | Total | (%) | Comment | (g/t) | ||||||||||
| Sample Count | 14,404 | 10,582 | 24,986 | ||||||||||||||
| Blanks | 1,449 | 10.06 | 459 | 4.34 | 1,908 | 7.64 | |||||||||||
| Blanks – Field | 378 | 459 | 837 | Barren Sill | |||||||||||||
| Blanks – 26b | 476 | 476 | OREAS | ||||||||||||||
| Blanks – 24c | 595 | 595 | OREAS | ||||||||||||||
| QC samples | 1,360 | 9.44 | 337 | 3.18 | 1,697 | 6.79 | |||||||||||
| OXC88 | 157 | Rocklabs | 0.203 | ||||||||||||||
| 250 | 288 | - | OREAS | 0.309 | |||||||||||||
| SE58 | 18 | Rocklabs | 0.607 | ||||||||||||||
| 252 | 228 | - | OREAS | 0.674 | |||||||||||||
| 202 | 385 | - | OREAS | 0.752 | |||||||||||||
| SG56 | - | 95 | Rocklabs | 1.027 | |||||||||||||
| 204 | - | - | OREAS | 1.043 | |||||||||||||
| 209 | 296 | - | OREAS | 1.58 | |||||||||||||
| 16a | - | - | OREAS | 1.81 | |||||||||||||
| 254 | 30 | - | OREAS | 2.55 | |||||||||||||
| SJ53 | - | 67 | Rocklabs | 2.637 | |||||||||||||
| 17c | - | - | OREAS | 3.04 | |||||||||||||
| 210 | 126 | - | OREAS | 5.49 | |||||||||||||
| 257 | 7 | - | OREAS | 14.18 | |||||||||||||
| Coarse Duplicates | 433 | 3.01 | 186 | 1.76 | 619 | 2.48 | Blind Checks | ||||||||||
| Pulp Duplicates | - | - | 205 | 1.94 | 205 | 0.82 | Blind Checks | ||||||||||
| Total QC Samples | 3,242 | 22.51 | 1,187 | 11.22 | 4,429 | 17.73 | |||||||||||
| Check Assays | 2,121 | 8.49 | |||||||||||||||
| Filab and ALS | 4,693* | * | *2016 to 2017 | ||||||||||||||
| RGM-ALS | 467 | 4.41 | 467 | 1.87% | Coarse Rejects | ||||||||||||
| RGM-ALS | 466 | 4.40 | 466 | 1.87% | Pulps |
| IAMGOLD Corporation - Rosebel Gold Mine | |
| Technical Report NI 43- 101 – November 5, 2018 | Page 12-5 |
| 12.2.2.3 |
SUREX |
The performance of control samples analyzed by Filab is considered acceptable. Over 98% of the certified and uncertified blanks returned values below ten times the detection limit, indicating no apparent contamination during the sample preparation stage.
CRM performed reasonably with most of failures due to the probable mislabelling of standards. Most certified standards assayed within two standard deviations of the expected limit. Samples outside the range of two standard deviations appear to be largely due to the mislabelling of standards. Some bias, however, is observed with reference materials OREAS 250, OREAS 252, OREAS 254, and OREAS 210 and further investigation is recommended. The results indicate poor analytical accuracy for of these standards potentially due to poor calibration. Analytical bias is not detected for other reference materials used during the same time period.
Paired data of coarse reject duplicate samples submitted during the 2017 to 2018 RC and DD drilling programs indicate that Filab had moderate difficulty in reproducing the results. Ranked half absolute relative difference (HARD) plots suggest that 38.8% of the coarse reject duplicates have HARD below 10%. Poor reproducibility of coarse duplicates, however, is not unexpected for sampling mineralization characterized by this type of deposit. Results for samples grading less than 0.3 g/t Au appear to have a minor negative bias when coarse reject material is re-assayed. This affect is minimal, and no bias is detected with samples of higher grade.
Approximately five percent of samples analyzed by Filab were chosen either randomly or as representations of significant intercepts from additional pulp material and sent to ALS for repeat analysis between 2016 and 2018. Ranked HARD plots suggested that 32% of the umpire check assays conducted on pulps, had HARD values below 10%, suggesting poor reproducibility between the two laboratories. This may be due to insufficient pulp sample homogenization at the primary laboratory.
| 12.2.2.4 |
MINEX |
The performance of control samples analyzed by RGM Lab Suriname is considered acceptable. All blank material samples returned values below ten times the detection limit, indicating that contamination during the sample preparation has not been identified or very minimal.
| IAMGOLD Corporation - Rosebel Gold Mine | |
| Technical Report NI 43- 101 – November 5, 2018 | Page 12-6 |
CRM performed reasonably for an internal mine laboratory with the majority of failures monitored closely and investigated by IAMGOLD-RGM staff. Most certified standards assayed within two standard deviations of the expected limit, however failure rates for standards SG56 and SJ53 are over 30%. The results may indicate poor analytical precision or reference material homogenization in the case of these standards and the issue cannot be rectified at the lab, replacement should be considered.
Paired data of coarse reject duplicate samples submitted during the 2018 DD drilling program indicate that RGM lab had little difficulty in reproducing the results. Ranked HARD plots suggest that 63.3% of the coarse reject duplicates have HARD values below 10% with no obvious bias detected. Paired data of sample pulp duplicates indicate that RGM lab had moderate difficulty in reproducing the results. Ranked HARD plots suggest that 51.1% of the pulp duplicates have HARD values below 10% with no obvious bias detected. Poorer reproducibility of pulp duplicates compared to coarse rejects is unexpected as the pulp should be more homogeneous. The reason for the difference is unknown.
Approximately nine percent of samples analyzed by RGM Lab were chosen either randomly or as representations of significant intercepts from additional coarse reject or pulp material and sent to ALS in Vancouver for umpire check analysis. Ranked HARD plots suggested that 46% of the umpire check assays conducted on coarse rejects, and 57.7% for pulps, had HARD values below 10%, suggesting moderately poor reproducibility between the two laboratories but within expected ranges for this type of deposit.
| 12.2.3 |
SRK COMMENTS |
SRK carried out a detailed quality control review including the review of analytical quality control programs carried out by IAMGOLD-RGM from July 2017 to April 2018. The aim of this review was to verify the reliability of exploration data generated during this period to be used in the Mineral Resource update and feasibility study. This review is in addition to that conducted and discussed in the 2017 report which deemed the analytical results delivered by Filab as sufficiently reliable for the purpose of Mineral Resource estimation.
In its review of quality control data, SRK identified a high failure rate for certain control samples used by MinEx and submitted to RGM Laboratory. IAMGOLD is proactive in discussing and investigating failures with all laboratories, and continued diligence in monitoring quality control data and implementing appropriate corrective action is strongly encouraged.
| IAMGOLD Corporation - Rosebel Gold Mine | |
| Technical Report NI 43- 101 – November 5, 2018 | Page 12-7 |
In the opinion of SRK, the paired data results are mostly consistent with results expected for this type of gold mineralization. Pulp replicate results are poorer than expected for both SurEx and MinEx sampling and suggest insufficient homogenization during the sample preparation stage at the primary laboratories. The umpire check assays show that the results produced by Filab can be reproduced within acceptable limits by ALS. Umpire laboratory testing for RGM laboratory reveals the moderately poor reproducibility but within expected ranges and no bias.
Overall, IAMGOLD-RGM has a well monitored and robust quality assurance and quality control program in place for the Saramacca gold project. Laboratory audits and monthly quality control data analysis by both SurEx and MinEx departments are well documented. SRK considers analytical results from RC and DD sampling conducted at Saramacca are globally sufficiently reliable for the purpose of resource estimation. The data examined by SRK do not present obvious evidence of analytical bias.
| IAMGOLD Corporation - Rosebel Gold Mine | |
| Technical Report NI 43- 101 – November 5, 2018 | Page 12-8 |
| 13 | MINERAL PROCESSING AND METALLURGICAL TESTING |
Metallurgical testing on the RGM deposits has been carried out since 1995 in order to understand the metallurgical characteristics of the deposits. The Rosebel Gold Mine has been in operation since 2004, hence this section summarizes the work, completed to date, to define the metallurgical characteristics of current and remaining ores in the RGM deposits.
| 13.1 |
RGM METALLURGICAL TESTING |
| 13.1.1 |
INTRODUCTION |
Since 1995, several metallurgical test work campaigns were carried out on composite samples from each of the pits at Rosebel Gold Mine. The test work included programs at Hazen Laboratory (1995), Mineral Resources Limited (1996), and Kappes Cassiday Associates (1999). The outcome of this test work dictated the design of the original plant.
According to the life of mine (LOM) plan and historical data, the processing plant faced new challenges in limitations to processing ore with a greater hard rock ratio (10% and up). Based on this limitation, IAMGOLD made a decision to perform numerous plant surveys and ore type characterization to better understand the bottlenecks and to predict the future mill performance. In addition to that main objective, the application of results obtained through RGM’s Plant Optimization Program (POP) has shown benefits to Rosebel mill performance, specifically recovery and throughput.
This section summarizes the major conclusions and outcomes from the metallurgical testing completed since operations began in 2004. Table 13-1 summarizes the optimization phases:
| IAMGOLD Corporation - Rosebel Gold Mine | |
| Technical Report NI 43- 101 – November 5, 2018 | Page 13-1 |
TABLE 13-1 OPTIMIZATION METALLURGICAL TEST WORK PERFORMED
| From | Report | Title | Date | Information |
| An Investigation into | ||||
| the Grindability | ||||
| SGS1 | 11700-001 - Final Report | Characteristics of | 27-Feb- 08 | Grindability tests (BWI, AL, CWI, RWI) |
| Samples | ||||
| A Plant Audit | ||||
| Investigation into the | This report covers the grinding audit | |||
| SGS | 12322-001 - Final Report #2 | Rosebel | 06-Dec-10 | activities (Audit 1 & 2) and is an update of |
| Concentrator | the report issued on 23-Dec-09 | |||
| Test work was conducted on carbon and | ||||
| pulp samples from the CIL plant at Rosebel | ||||
| An Investigation into | to determine the activity of plant regenerated | |||
| the Efficiency of the | carbon relative to fresh carbon samples, and | |||
| SGS | 12322-001 - Report 3 | Rosebel CIL Plant | 09-Dec-10 | to conduct bench-scale characterization test |
| Operation | work (including comminution, mineralogy, | |||
| and chemical analysis) and metallurgical | ||||
| variability testing (including gravity | ||||
| separation and cyanidation). | ||||
| The Characterization | ||||
| SGS | 12322-002 - Final | of Rosebel Ore | 08-Dec-10 | |
| Types | ||||
| An Investigation into | ||||
| the Capacity of the | The results of the surveys performed under | |||
| SGS | 12322-004 - Final Report | Rosebel Grinding | 23-Feb- 11 | SGS project 123322-001 were used to |
| Circuit Throughout | develop a comminution production forecast | |||
| the Life of Mine | model | |||
| An Investigation into | ||||
| the Grindability | Bond low energy impact testing of three rock | |||
| SGS | 13249-002 | Characteristics of | 28- Jun-12 | |
| Three Samples from | samples from Rosebel deposit | |||
| Rosebel Mine | ||||
| Geology study for sample selection, | ||||
| Forecasting and | grindability test work, geostatistical analysis | |||
| Optimization of the | of the data and distribution to the mine | |||
| SGS | 13249-001 - Final Report | Rosebel | 31-Mar-14 | blocks, reconciliation of the CEET™ model |
| Concentrator Using | using historical data and throughput | |||
| CEET™ | forecasting based on the mine plan. | |||
| Determine the amount of gold and the | ||||
| IAMGOLD Rosebel | deportment of gold within the gravity circuit, | |||
| Sepro2 | Mine Gravity Circuit | 10-Dec-10 | as well as the proportion of gravity | |
| Audit | recoverable free gold at various places | |||
| within the circuit | ||||
| Gravity Circuit | ||||
| Knelson3 | 101220- 0600-143 | 10-Dec-10 | Gravity circuit modelling | |
| Considerations | ||||
| PICA Carbon Testing | Audit on activated carbon quality, acid | |||
| PICA4 | & Circuit Auditing | 14-Dec-10 | washing, elution, regeneration, and gold | |
| Circuit | adsorption properties | |||
| The Grinding Circuit | ||||
| Benchmarking and | ||||
| CEET2 Model | Survey of the grinding circuit, update the | |||
| SGS | 13249-003 - Final Report | Development for the | 10-Jul-18 | CEET2 model and revise the LOM |
| Rosebel | throughput forecasting simulations | |||
| Concentrator |
Notes:
| 1 |
SGS Lakefield Research Limited (SGS Lakefield) | |
| 2 |
Sepro Mineral Systems Corp. (Sepro) | |
| 3 |
Knelson Gravity Solutions (Knelson – now FLSmidth Knelson) | |
| 4 |
PICA SASU (now Jacobi Carbons) |
Figure 13-1 summarizes the main expansion initiatives since 2004 in order to increase the throughput and accommodate the amount of hard rock treated while maintaining the same gold recoveries.
| IAMGOLD Corporation - Rosebel Gold Mine | |
| Technical Report NI 43- 101 – November 5, 2018 | Page 13-2 |
FIGURE 13-1 MAIN EXPANSION INITIATIVES SINCE 2004
![]()
| 13.1.2 |
METALLURGICAL CHARACTERIZATION |
A metallurgical characterization program, developed in collaboration with SGS Lakefield and the site laboratory was implemented at Rosebel in late 2009 to optimize the current mill and support its evolution towards the processing of higher proportions of hard rock. Sepro and Knelson also performed a gravity investigation.
As the Rosebel processing plant receives fresh ore, on average, from seven different pits per year the forecasting of throughput is very challenging due to the wide range in ore grindability. A sampling strategy was developed and executed in 2009 with the geology team on site. The objective of the first step was to take samples from available drill cores to form composites that would characterize the different deposits in terms of major geological and mineralogical ore domains. The characterization program was carried out by SGS Lakefield focussing on hard rock material.
| IAMGOLD Corporation - Rosebel Gold Mine | |
| Technical Report NI 43- 101 – November 5, 2018 | Page 13-3 |
The information from the metallurgical characterization program was also used for the calibration of a Comminution Economic Evaluation Tool (CEET™) Model. This tool was used in conjunction with the grindability values and the mine block model to forecast the grinding circuit capability and to identify potential bottlenecks. Through this characterization program the following steps were achieved:
| 1. |
Drill core samples composite characterizations; | |
| 2. |
Plant audit, including detailed surveys with a focus on the effect of the hard rock ratio; |
| a. |
First audit in December 2009, consisting of three grinding surveys; | |
| b. |
Second audit in March 2010, consisting of three grinding surveys; | |
| c. |
Third audit in February 2012, consisting of five grinding surveys with and without pre- crushed ore; | |
| d. |
Fourth audit in February 2017, consisting of four grinding surveys |
| 3. |
Modelling of the circuit based on the ore surveyed; | |
| 4. |
Grinding circuit evaluation using the CEET™ Model: maximum hard rock capacity of the current plant |
The outcomes are used to estimate the maximum capacity of the existing circuit based on the yearly LOM update and to determine the equipment additions required to process more hard rock, going forward. To date, based on the conclusions from these studies, several additions have been made to the mill (Figure 13-1):
| • | A mobile pre-crushing circuit further replaced by a permanent pre-crushing circuit; | |
| • | A third ball mill; | |
| • | A gravity circuit; | |
| • | An intensive leach (Acacia reactor). |
| 13.1.3 |
MINERAL COMPOSITION AND DISTRIBUTION |
Table 13-2 and Figure 13-2 show the average mineral abundance, by rock type, measured by QEMSCAN. QEMSCAN is an abbreviation standing for Quantitative Evaluation of Minerals by SCANning electron microscopy.
| IAMGOLD Corporation - Rosebel Gold Mine | |
| Technical Report NI 43- 101 – November 5, 2018 | Page 13-4 |
TABLE 13-2 AVERAGE MINERAL ABUNDANCE BY ROCK TYPE
| Average Mineral Mass (%) | |||
| Sample | Saprolite | Transition | Hard Rock |
| Cu-Sulphides | 0.00 | 0.03 | 0.05 |
| Pyrite | 0.13 | 1.41 | 0.96 |
| Pyrrhotite | 0.00 | 0.01 | 0.42 |
| Sphalerite | 0.00 | - | - |
| Other Sulphides | 0.00 | 0.01 | - |
| Quartz | 36.50 | 39.00 | 28.90 |
| K- Feldspar | 0.11 | 0.30 | 0.52 |
| Plagioclase | 1.72 | 10.40 | 22.90 |
| Amphiboles | 0.11 | 0.20 | 0.72 |
| Biotite | 0.42 | 0.50 | 0.18 |
| Clays | 34.30 | 20.00 | 9.82 |
| Muscovite | 13.40 | 14.50 | 8.28 |
| Chlorites | 3.52 | 8.15 | 13.10 |
| Mag/Hematite | 1.61 | 0.88 | 0.77 |
| Goethite | 5.54 | 2.41 | 0.54 |
| Fe- Ti oxides | 2.50 | 1.63 | 1.54 |
| Calcite | 0.01 | 0.01 | 0.95 |
| Ankerite | 0.03 | 0.26 | 9.58 |
| Siderite | 0.05 | 0.06 | 0.34 |
| Gypsum | 0.01 | 0.02 | 0.01 |
| Apatite | 0.02 | 0.12 | 0.35 |
| Zircon | 0.05 | 0.01 | 0.02 |
| Other | 0.00 | 0.01 | 0.05 |
| Total | 100 | 100 | 100 |
| IAMGOLD Corporation - Rosebel Gold Mine | |
| Technical Report NI 43- 101 – November 5, 2018 | Page 13-5 |
FIGURE 13-2 AVERAGE MINERAL ABUNDANCE BY ROCK TYPE
![]()
Mineral abundance analysis has indicated that there is low exposure to deleterious elements which would represent a significant impact to the process. However, operationally, it has been observed that pyrrhotite, in higher concentrations, has negatively impacted leach dissolved oxygen levels with consequences to the leach kinetics. Additionally, ores with copper in higher concentration, have seen CIL carbon copper loading increase to concerning levels. In order to mitigate the above mentioned scenarios, actions have been to limit the problematic ore type reporting to the plant, which has allowed for normalized plant operation without an impact to the process performance.
| IAMGOLD Corporation - Rosebel Gold Mine | |
| Technical Report NI 43- 101 – November 5, 2018 | Page 13-6 |
| 13.1.4 |
GRINDABILITY TESTING |
| 13.1.4.1 |
DROP-WEIGHT TESTS |
From 2004 to 2017 SMC testing (Drop-weight) was performed on the hard rock samples only. The SMC test is an abbreviated version of the standard JKTech drop-weight performed on 18 samples from a single size fraction (-22.4/+19.0 mm).
| 13.1.4.2 |
BOND BALL MILL GRINDABILITY TEST |
From 2004 to 2017, a total of 63 drill core samples, comprised of four saprolite samples, 22 transition samples, and 37 hard rock samples, were submitted for Bond ball mill index (BWI) testing and the Bond abrasion testing (Ai).
The results are shown as overall grindability statistics in Table 13-3 below. The average grindability results by rock type in Table 13-4. The Axb and Bond Work Index per pit as a function of rock type is shown in Table 13-5.
TABLE 13-3 OVERALL GRINDABILITY STATISTICS
| JK | JK | JK | |||||||
| BWI | BWI | Relative | Parameter | Parameter | Parameter | MacPherson | MacPherson | ||
| (kWh/t)1 | (kWh/t)2 | AI (g) | Density | A x b3 | A x b4 | ta | Test (kg/h) | Test (kg/h) | |
| Average | 12.0 | 10.1 | 0.235 | 2.71 | 50.1 | 78.2 | 0.33 | 18.49 | 4.69 |
| Standard Deviation | 3.5 | 4.5 | 0.143 | 0.21 | 10.7 | 183.3 | 0.12 | 7.11 | 1.40 |
| Minimum | 2.7 | 0.8 | - | 1.77 | 37.7 | 22.4 | 0.21 | 13.35 | 3.15 |
| 10th percentile | 7.2 | 2.7 | 0.058 | 2.64 | 41.3 | 25.4 | 0.23 | 13.78 | 3.53 |
| 25th percentile | 10.5 | 6.4 | 0.133 | 2.73 | 46.7 | 26.9 | 0.25 | 14.44 | 4.09 |
| Medium | 12.6 | 11.7 | 0.229 | 2.76 | 55.6 | 31.4 | 0.28 | 15.53 | 5.03 |
| 75th percentile | 14.1 | 13.3 | 0.305 | 2.80 | 56.2 | 38.8 | 0.35 | 21.06 | 5.46 |
| 90th percentile | 15.0 | 14.6 | 0.414 | 2.82 | 56.6 | 66.7 | 0.55 | 24.39 | 5.72 |
| Maximum | 21.5 | 17.9 | 0.618 | 2.84 | 56.8 | 851.5 | 0.61 | 26.60 | 5.89 |
| AWI | CWI | CEET™ | SPI | Mod Bond | |
| (kWh/t) | (kWh/t) | Ci | (min) | (kWh/t) | |
| Average | 7.10 | 19.52 | 8.41 | 101.42 | 12.84 |
| Standard Deviation | 4.10 | 1.52 | 9.57 | 77.74 | 3.75 |
| Minimum | 2.72 | 18.37 | 0.59 | 0.27 | 1.26 |
| 10th percentile | 3.72 | 18.51 | 1.41 | 5.98 | 8.64 |
| 25th percentile | 5.22 | 18.72 | 1.98 | 23.68 | 10.77 |
| Medium | 7.71 | 18.98 | 3.64 | 101.72 | 13.90 |
| 75th percentile | 9.28 | 19.78 | 12.44 | 167.45 | 15.56 |
| 90th percentile | 10.23 | 20.96 | 21.90 | 210.38 | 16.22 |
| Maximum | 10.85 | 21.75 | 45.90 | 262.83 | 17.07 |
Notes:
| 1 |
Measured Work Index |
| IAMGOLD Corporation - Rosebel Gold Mine | |
| Technical Report NI 43- 101 – November 5, 2018 | Page 13-7 |
| 2 |
Recalculated Work Index with fines | |
| 3 |
A x b from DWT | |
| 4 |
A x b from SMC |
TABLE 13-4 AVERAGE GRINDABILITY RESULTS PER ROCK TYPE
| Rock Type | Number of Samples |
BWI (kWh/t)1 |
BWI
(kWh/t)2 |
AI (g) |
| Saprolite | 4 | 19.1 | 5.0 | 0.148 |
| Transition | 22 | 8.7 | 4.2 | 0.071 |
| Hard Rock | 37 | 13.1 | 13.0 | 0.267 |
Notes:
| 1 |
Measured Work Index | |
| 2 |
Recalculated Work Index with fines |
TABLE 13-5 AXB AND BOND WORK INDEX
PER PIT IN FUNCTION OF THE
TYPE OF ORE
| BWI, kWh/t | ||||
| Pit | A x b | Hard Rock | Saprolite | Transition |
| Pay Caro | 28.2 | 13.2 | 2.6 | 4.7 |
| East Pay Caro | 29.0 | 13.3 | 2.6 | 6.9 |
| Koolhoven | 36.8 | 12.7 | 2.6 | 5.1 |
| J Zone | 60.9 | 9.5 | 2.6 | 4.7 |
| Royal Hill | 28.5 | 13.4 | 2.3 | 4.7 |
| Mayo | 25.5 | 15.9 | 2.9 | 4.0 |
| Roma | 26.5 | 14.6 | 2.6 | 4.7 |
| Rosebel | 27.1 | 12.0 | 2.6 | 4.7 |
From the whole grindability test results the following conclusions were made:
| • | The average relative density ranged from 1.77 to 2.84; | |
| • | Rock hardness, Axb, varied from 25.5 to 36.8 (very hard to hard) with one sample at 60.9. According to these grindability results; |
| o | The BWI of hard rock varied from 9.5 kWh/t to 15.9 kWh/t (medium to hard); | |
| o | The recalculated BWI of transition with fines ranged from 4.0 kWh/t to 6.9 kWh/t (very soft to soft); | |
| o | The recalculated BWI of saprolite with fines ranged from 2.3 kWh/t to 2.9 kWh/t (very soft); | |
| o | Abrasion Index, Ai, varies between 0.2 and 0.45 for hard rock with an average of 0.267. This was used to evaluate the steel consumption; |
| IAMGOLD Corporation - Rosebel Gold Mine | |
| Technical Report NI 43- 101 – November 5, 2018 | Page 13-8 |
| 13.1.5 |
GRINDING CIRCUIT SURVEYS |
The first audit clearly showed the limitation of the existing mill to process more than 10% hard rock. Preliminary simulations were performed using JKSimMet, initially, and resulted in some challenges to forecast and predict the impact of pre-crushing on the grinding circuit. Therefore, a decision was made to use a CEET™ model. Once well calibrated, the CEET™ model is useful to forecast production. In order to calibrate the CEET™ model, one of the metallurgical parameters required is the semi autogenous grinding (SAG) Power Index (SPI) which is determined in the laboratory. The SPI is a measure of the hardness of the ore from the perspective of semi and fully autogenous milling (SAG/AG). It measures the time, in minutes, required to grind 2 kg of ore sample from 80% passing ½” (12.7 mm) to 80% passing 10 mesh (1.7 mm). Given that SPI values were not available from previous drill core characterization, a correlation was developed to convert available Axb values to SPI values in order to perform the first simulations.
Based on positive results from simulations, by using pre-crushing and benchmarking, it was decided in March 2012 to pre-crush the ore at the aggregate plant on site from run-of-mine down to -101 mm and send it to the mill for a trial. Based on the results, pre-crushing can increase hard rock grinding capacity by about 30%. This was confirmed by using a mobile crushing unit with different particle sizes (-101 mm, -75 mm, and -50 mm). The mobile crushing unit, with a capacity of 500 tonnes per hour (tph), was installed at the crushing plant from 2012 to 2016. The processing plant was able to maintain hard rock ratio as per predicted. In 2016, a permanent pre-crushing circuit was commissioned to replace the mobile circuit. With this new circuit the hard rock grinding capacity increased by about 15%.
Based on the surveys and simulations completed, a pebble crusher was installed in 2012 to maintain the increase in the hard rock ratio.
Optimization was also performed on the SAG mill in order to increase the throughput. Hard ore throughput rates are maximized via the use of aggressive lifter designs that project the largest amount of grinding media onto the toe of the mill charge.
For all subsequent grinding surveys the samples were characterized for SPI values in order to calibrate the CEET™ model. The model was subsequently updated with these SPI values. Figure 13-3 illustrates the latest update of the CEET™ model (Project 13249-003 – Final Report). The model is used to estimate the plant throughput of three scenarios with respect to hard rock competency, i.e. 1) hard; 2) medium; and 3) soft.
| IAMGOLD Corporation - Rosebel Gold Mine | |
| Technical Report NI 43- 101 – November 5, 2018 | Page 13-9 |
FIGURE 13-3 CEET™ FORECAST
![]()
| 13.1.6 |
GRAVITY AND LEACHING TEST WORK |
In 2010, the test work program performed at SGS Lakefield consisted of 24 samples, comprised of eight saprolite, four transition, and 12 hard rock which were submitted to metallurgical variability tests. A simplified gravity test was completed on the samples using a Knelson concentrator and a Mozley table to remove the coarse gold particles. This mimics the existing process flow sheet using gravity separation before the leach/CIL circuit.
Based on historical data, different surveys and laboratory test work performed in collaboration with Sepro and Knelson, an encouraging potential was shown for gravity concentration. Figure 13-4 shows the gravity recoveries obtained at SGS Lakefield.
| IAMGOLD Corporation - Rosebel Gold Mine | |
| Technical Report NI 43- 101 – November 5, 2018 | Page 13-10 |
FIGURE 13-4 AVERAGE GRAVITY GOLD
RECOVERY BY DEPOSIT USING
MOZLEY TABLE
![]()
Based on surveys and e-GRG (Extended-Gravity Recoverable Gold), Knelson performed a simulation with Rosebel data to evaluate recoveries for different scenarios and the maximum recovery achievable for different gravity throughputs. From these tests, three Falcon gravity concentrator units and an intensive leach system (Acacia) were installed.
Regarding the overall mill recovery assumed by rock type and per pit, two groups of results were used:
| • | Whole ore leach tests on fresh ore completed in 2008 by SGS Lakefield (project 11700- 001) on 20 samples, mainly hard rock, were submitted to 48 hours of cyanidation at 45% solid (w/w) using 0.5 g/L NaCN; | |
| • | Gravity tails leach tests completed in 2010 on 24 samples (project 12322-002), listed above, were submitted to 48 hours of cyanidation after gravity separation at 50% solid (w/w) and 0.23 g/L NaCN. |
Table 13-6 summarizes the whole ore leach test results from 2008.
| IAMGOLD Corporation - Rosebel Gold Mine | |
| Technical Report NI 43- 101 – November 5, 2018 | Page 13-11 |
TABLE 13-6 CYANIDATION TEST RESULTS (WHOLE ORE LEACH)*
| Feed | NaCN | 48h Gold | Residue | Head Gade (g/t Au) | ||
| Size | Consumption | Extraction | Grade | |||
| Grade | P80 µm | g/t of CN Feed | (%) | (g/t Au) | Calc. | Direct |
| Minimum | 41 | 0.06 | 91.0 | 0.02 | 0.62 | 0.60 |
| Maximum | 107 | 0.56 | 98.6 | 0.16 | 5.53 | 5.60 |
| Average | 76 | 0.26 | 95.7 | 0.07 | 1.84 | 1.75 |
*Excluding results from RH002
Figure 13-5 summarizes the overall recovery from gravity and gravity tails leach tests from the 2010 project, by rock type and Figure 13-6 summarizes the overall recoveries, per pit.
FIGURE 13-5 OVERALL AVERAGE GOLD RECOVERY BY ROCK TYPE
![]()
| IAMGOLD Corporation - Rosebel Gold Mine | |
| Technical Report NI 43- 101 – November 5, 2018 | Page 13-12 |
FIGURE 13-6 OVERALL AVERAGE RECOVERY BY PIT
![]()
Average gold extraction for the whole ore leach tests was approximately 96% and ranged from 77.3% (Sample RH002) to a high of 98.6% (Sample S002). Nineteen of the 20 gold extraction values were 91% or higher.
In the 2010 batch tests, the recombined Knelson + Mozley tailings from each of the 24 variability samples were cyanide leached. Overall, average gold recoveries ranged from a low of 86.8%, in the case of the Koolhoven deposit, to a high of 96.3% from the Rosebel deposit. The average is 93%. Cyanide addition and consumption values were quite low and similar, regardless of the rock type or deposit. The minimum, maximum, and average cyanide addition and consumption values for the 24 variability composite tests are shown in Table 13-7.
TABLE 13-7 CYANIDE CONSUMPTION DATA
| kg of NaCN per tonne of Leach Feed | ||||||||
| Overall | Hard Rock | Transition | Saprolite | |||||
| Added | Cons | Added | Cons | Added | Cons | Added | Cons | |
| Minimum | 0.23 | 0.01 | 0.23 | 0.01 | 0.24 | 0.01 | 0.25 | 0.01 |
| Maximum | 0.36 | 0.11 | 0.33 | 0.1 | 0.36 | 0.11 | 0.33 | 0.07 |
| Average | 0.27 | 0.03 | 0.27 | 0.03 | 0.27 | 0.05 | 0.28 | 0.03 |
Based on the results obtained from the 2007 and 2010 programs, Table 13-8 shows the assumed recoveries per rock type and pit.
| IAMGOLD Corporation - Rosebel Gold Mine | |
| Technical Report NI 43- 101 – November 5, 2018 | Page 13-13 |
TABLE 13-8 ASSUMED RECOVERIES PER ROCK TYPE AND PIT
| Pit name | Mill Overall Recovery (%) per rock types | ||
| Hard Rock | Transition | Saprolite | |
| East Pay Caro (EPC) | 94.8 | 95.4 | 96.0 |
| Pay Caro (PC) | 96.4 | 95.1 | 93.7 |
| Koolhoven (KH) | 88.7 | 85.9 | 83.0 |
| J Zone (JZ) | 94.0 | 94.5 | 95.0 |
| ETR | 94.8 | 95.1 | 95.4 |
| Royal Hill (RH) | 96.0 | 96.9 | 97.8 |
| Mayo (MA) | 90.0 | 93.0 | 96.0 |
| Rosebel (RB) | 96.7 | 96.8 | 96.8 |
| Roma (RM) | 94.2 | 95.1 | 96.0 |
| 13.1.7 |
ONGOING TEST WORK |
The IAMGOLD-Rosebel mine requested SGS Lakefield to update the previous CEET™ Model. Surveys are in progress, using different blends of hard rock, saprolite, and/or transition ores. The circuit will also be surveyed, in closed and open circuit, in an attempt to quantify the impact of not recirculating the pebbles to the SAG mill. The survey results will then be used to update the model. After the survey modelling, the model will be further fine-tuned through plant data reconciliation using four to six months of plant data. Finally, LOM throughput forecasting simulations will be carried out using the updated CEET™ model.
The program has been broken-down into the following steps:
| • | Plant data review and survey preparation; | |
| • | Plant audit and circuit survey; | |
| • | Comminution testing; | |
| • | Mass balances, grinding circuit modelling, and plant data reconciliation; | |
| • | LOM throughput forecasting simulations. |
Similar to the last survey, it has been assumed that all the survey samples will be sized and the % solids will be determined at the mine site by Rosebel personnel. The following grindability tests will be performed on the selected SAG feed survey samples so that the CEET™ model can be calibrated:
| • | SPI test; | |
| • | Bond ball mill grindability test. |
| IAMGOLD Corporation - Rosebel Gold Mine | |
| Technical Report NI 43- 101 – November 5, 2018 | Page 13-14 |
SAG mill feed sample will also be submitted for the DWT, in order to model the circuit using JKSimMet in parallel. The JKSimMet model will be required to estimate the performance of the grinding circuit for the two alternative circuit configurations. The plan also investigates options to optimize the pebble crushing circuit.
Results from this work were successfully used to continuously upgrade the mill to face an increasing amount of hard rock and to optimize gold recoveries. Rosebel is regularly updating the CEET™ model in order to forecast the mill throughput as a function of the LOM.
| 13.2 |
SARAMACCA METALLURGICAL TESTING |
| 13.2.1 |
INTRODUCTION |
Preliminary metallurgical testing on the Saramacca deposit was performed by ALS and a summary of this program can be found in the October 2017 SRK report (SRK, 2017b). The following samples were tested:
| • | Three composites C1 to C3 (C1 = Saprolite, C2 and C3 = Fresh Rock) were sent for sample characterization (chemical content, mineralogical content; dynamic SIMS (DSIMS) analyses, Trace Mineral Search analyses (TMS)); | |
| • | Six composites, V1 to V6, representing variability within the rock types (V1 and V2 = Saprolite, V3 and V4 = Transition, and V5 and V6 = Fresh Rock) were sent for metallurgical testing (comminution, gravity, cyanidation). |
Table 13-9 summarizes the recoveries obtained from tests results performed by ALS.
TABLE 13-9 SCOPING STUDY RECOVERIES PER ROCK TYPE
| Average | |
| Rock Type | Recovery |
| (%) | |
| Saprolite | 97.7 |
| Transition | 76.3 |
| Hard Rock | 81.9 |
The metallurgical test program for the Feasibility Study started in January 22, 2018 under the supervision of IAMGOLD. The metallurgical test plan included both composite and variability samples. The material tested was collected from both the southeast and northwest areas of the pit and from the saddle area in between. The material also covers all rock types including duricrust, laterite, saprolite, transition, and fresh rock. The test plan aimed to determine the response of Saramacca material to the existing Rosebel flowsheet and to identify any possible flowsheet modifications required to optimize recovery.
| IAMGOLD Corporation - Rosebel Gold Mine | |
| Technical Report NI 43- 101 – November 5, 2018 | Page 13-15 |
Table 13-10 indicates the type of tests that were performed. As indicated in Table 13-10, COREM’s laboratory in Quebec City was selected to provide the majority of the metallurgical services required, with some work outsourced to SGS Lakefield. The testwork included:
| • | Sample and composite preparation; | |
| • | Head assays; | |
| • | Mineralogical analysis; | |
| • | Comminution testing: |
| o | Bond low energy impact test or crusher work index (CWi); | |
| o | JK Drop Weight test (DWT); | |
| o | SAG Pomwer Index (SPI); | |
| o | SAG Mill Comminution (SMC), | |
| o | Bond ball mill work index (BWi), | |
| o | Abrasion index (Ai); |
| • | Gravity testwork (e-GRG and bulk gravity tests); | |
| • | Leaching testwork (bottle rolls and stirred reactor testing); |
| o | Baseline recovery testing: whole ore leach and gravity tails leach | |
| o | Preg-robbing assessment; | |
| o | Optimization testwork: whole ore leach at fine grind size, flotation followed by leaching of flotation products; |
| • | Reagent optimization tests (lime consumption tests); | |
| • | Thickening testwork. |
| IAMGOLD Corporation - Rosebel Gold Mine | |
| Technical Report NI 43- 101 – November 5, 2018 | Page 13-16 |
TABLE 13-10 METALLURGICAL TEST PLAN
| Test | Supplier | |
| Head assays | Chemical composition of samples | COREM |
| Mineralogy | Overall mineralogy and gold deportment | COREM |
| Grinding | Bond low energy impact test (CWi) | COREM |
| JK Drop Weight test (DWT) | COREM | |
| SAG Power Index (SPI) | SGS | |
| SAG Mill Comminution (SMC) | SGS | |
| Bond Ball Work Index (BWi) | COREM | |
| Abrasion Index (Ai) | COREM/SGS | |
| Gravity | Gravity (e-GRG test) | COREM |
| Leaching | Bottle rolls, Stirred tank reactor | COREM/SGS |
| Thickening | Settling rate | SGS/SNF* |
Note: *SNF Floerger
Most of metallurgical test results from this FS program can be found in COREM’s report entitled “Rosebel Saramacca Metallurgical Testing for the Feasibility Study no. T2300”, (COREM, 2018).
| 13.2.2 |
FEASIBILITY STUDY SAMPLE SELECTION |
The sample selection was aimed at identifying the variability response of Saramacca ore in terms of grindability and metallurgy for each of the rock types, and then to confirm the correlation of these results with composites samples.
The variability samples were selected based on lithology, gold grade, spatial distribution, and proportionally to the in-pit resources by weathering from the 2017 SRK Technical Report (SRK 2017b). Figure 13-7 illustrates the spatial localization of the variability samples within the pit shell. There are two types of variability samples:
| • | CM: variability samples for comminution testing (in blue) | |
| • | VT: variability samples for metallurgical testing (in red) |
| IAMGOLD Corporation - Rosebel Gold Mine | |
| Technical Report NI 43- 101 – November 5, 2018 | Page 13-17 |
FIGURE 13-7 SPATIAL LOCALIZATION OF THE VARIABILITY SAMPLES
![]()
In total, 23 comminution samples (CM) and 31 metallurgical samples (VT) and were selected.
For the composites, a total of six drill holes in full HQ core were dedicated to the test work. The laterite and the saprolite were only tested for the Bond ball mill work index and extractive metallurgical tests whereas the transition and fresh rock were also tested for other comminution parameters (Bond low energy, JK Drop Weight, SPI, SMC, and Bond abrasion index) and extractive metallurgical tests. The three holes located to the northwest (NW) of the pit will be used for the preparation of the four composites by rock type and the three holes located to the southeast (SE) of the pit will be used to form also four composites by rock type. Figure 13-8 illustrates the spatial localization of the composites within the pit shell.
| IAMGOLD Corporation - Rosebel Gold Mine | |
| Technical Report NI 43- 101 – November 5, 2018 | Page 13-18 |
FIGURE 13-8 SPATIAL LOCALIZATION OF THE COMPOSITES
![]()
| 13.2.3 |
MATERIAL CHARACTERISATION |
| 13.2.3.1 |
HEAD ASSAYS |
Samples from both the comminution and recovery testwork (CM, VT, and composites) were submitted for head assays in order to evaluate Au, Ag, S, and graphitic carbon content as well as specific gravity. Additional chemical analyses were performed to determine elemental concentrations of Si, Al, Mg, Ca, K, Ti, Mn, P, Co, Cr, Cu, Fe, Ni, Pb, Zn, Hg, and As. The results of some elements from the analyses are presented in Table 13-11, Table 13-12, and Table 13-13.
TABLE 13-11 CM HEAD ASSAYS
| Composite | Rock Type | Zone | Au (g/t) |
Ag (g/t) |
Graphitic C (%) |
S (%) |
As (g/t) |
Fe (%) |
Al2O3 (%) |
Cu (%) |
Zn (%) |
| CM001 | Laterite | SE | 2.53 | - | - | - | 806 | 19.30 | 43.0 | - | - |
| CM002 | Laterite | SE | 0.38 | 0.5 | 0.14 | - | 1,120 | 29.50 | 26.9 | - | - |
| CM003 | Laterite | NW | 0.36 | - | - | - | 371 | 15.60 | 29.1 | - | - |
| CM005 | Laterite | NW | 0.82 | - | - | - | 974 | 27.40 | 24.2 | - | - |
| CM006 | Laterite | NW | 0.41 | - | - | - | 178 | 34.90 | 26.2 | - | - |
| CM007 | Saprolite | SE | 0.32 | - | - | - | 118 | 0.77 | 19.3 | - | - |
| CM008 | Saprolite | SE | 2.15 | 0.6 | - | - | 2,500 | 27.20 | 20.5 | - | 0.03 |
| CM009 | Saprolite | SE | 2.23 | - | - | - | 278 | 15.70 | 31.3 | - | - |
| CM010 | Saprolite | SE | 5.55 | - | - | - | 969 | 7.42 | 34.0 | - | - |
| CM011 | Saprolite | SE | 3.07 | - | - | - | 999 | 12.80 | 30.5 | - | - |
| CM012 | Saprolite | SE | 3.78 | 0.3 | - | - | 435 | 5.84 | 35.8 | - | - |
| CM013 | Saprolite | NW | 1.57 | - | - | - | 781 | 6.47 | 16.1 | - | - |
| CM014 | Saprolite | NW | 1.53 | 0.6 | - | - | 336 | 18.40 | 25.4 | - | - |
| IAMGOLD Corporation - Rosebel Gold Mine | |
| Technical Report NI 43- 101 – November 5, 2018 | Page 13-19 |
| Composite | Rock Type | Zone | Au (g/t) |
Ag (g/t) |
Graphitic C (%) |
S (%) |
As (g/t) |
Fe (%) |
Al2O3 (%) |
Cu (%) |
Zn (%) |
| CM015 | Transition | SE | 1.51 | - | - | 0.9 | 1,890 | 6.06 | 18.1 | - | - |
| CM016 | Transition | NW | 10.96 | - | - | - | 1,300 | 9.28 | 9.2 | - | - |
| CM017 | Transition | NW | 4.80 | - | - | 3.4 | 3,960 | 12.50 | 12.0 | - | - |
| CM018 | Fresh Rock | NW | 1.49 | - | 1.05 | 0.6 | 480 | 9.73 | 12.7 | - | - |
| CM019 | Fresh Rock | NW | 1.72 | 0.3 | - | 1.0 | 103 | 7.93 | 11.8 | - | - |
| CM020 | Fresh Rock | NW | 1.15 | - | - | 1.6 | 3,610 | 8.44 | 10.9 | - | - |
| CM021 | Fresh Rock | NW | 0.64 | - | - | 1.5 | 497 | 6.48 | 8.0 | - | - |
| CM022 | Fresh Rock | NW | 5.75 | 0.8 | - | 3.9 | 845 | 7.74 | 7.0 | - | - |
| CM023 | Fresh Rock | NW | 1.43 | - | - | 1.6 | 144 | 8.65 | 11.5 | - | - |
TABLE 13-12 VT HEAD ASSAYS
| Composite | Rock Type | Zone | Au (g/t) |
Ag (g/t) |
Graphitic C (%) |
S (%) |
As (g/t) |
Fe (%) |
Al2O3 (%) |
Cu (%) |
Zn (%) |
| VT001 | Laterite | SE | 0.55 | - | - | - | 453 | 20.40 | 39.0 | - | |
| VT002 | Laterite | SE | 1.95 | - | 0.10 | - | 1,040 | 22.10 | 45.4 | - | - |
| VT003 | Laterite | SE | 2.02 | - | 0.13 | - | 583 | 19.70 | 40.3 | - | - |
| VT004 | Laterite | SE | 1.58 | 2.2 | 0.13 | - | 692 | 28.50 | 30.1 | - | - |
| VT005 | Laterite | SE | 8.51 | - | 0.15 | 0.10 | 2,280 | 36.80 | 27.7 | - | - |
| VT006 | Laterite | NW | 1.80 | 0.4 | - | - | 2,100 | 21.10 | 28.3 | - | - |
| VT007 | Laterite | NW | 2.46 | 0.3 | - | - | 716 | 27.20 | 26.3 | - | - |
| VT008 | Saprolite | SE | 0.78 | - | - | - | 839 | 13.70 | 32.5 | - | - |
| VT009 | Saprolite | SE | 0.34 | - | - | - | 805 | 12.10 | 33.6 | - | - |
| VT010 | Saprolite | SE | 0.82 | - | 0.16 | - | 343 | 6.81 | 9.8 | - | - |
| VT011 | Saprolite | SE | 0.53 | - | - | - | 519 | 5.52 | 16.1 | - | - |
| VT012 | Saprolite | SE | 2.33 | - | - | - | 370 | 5.83 | 16.9 | - | - |
| VT013 | Saprolite | NW | 13.67 | - | - | - | 2,490 | 12.90 | 21.4 | - | - |
| VT014 | Saprolite | SE | 1.85 | 0.6 | - | 1.10 | 118 | 6.59 | 18.3 | - | - |
| VT015 | Saprolite | NW | 2.21 | 10.2 | - | - | 1,600 | 41.20 | 12.5 | - | 0.02 |
| VT016 | Saprolite | NW | 0.60 | - | - | 0.40 | 72 | 15.60 | 16.8 | - | - |
| VT017 | Saprolite | NW | 0.56 | - | - | - | 757 | 6.35 | 37.0 | - | - |
| VT018 | Saprolite | NW | 1.06 | - | - | - | 307 | 6.57 | 21.8 | - | - |
| VT019 | Saprolite | NW | 6.35 | - | - | - | 1,560 | 12.40 | 14.2 | - | - |
| VT020 | Fresh Rock | SE | 7.10 | - | - | - | 1,640 | 7.23 | 19.7 | - | - |
| VT021 | Fresh Rock | SE | 0.48 | - | 0.17 | - | 249 | 12.30 | 6.9 | - | - |
| VT022 | Fresh Rock | NW | 3.16 | 0.3 | - | 1.60 | 3,930 | 6.25 | 18.5 | - | - |
| VT023 | Fresh Rock | NW | 1.19 | - | - | 0.80 | 244 | 3.72 | - | - | - |
| VT024 | Fresh Rock | SE | 2.33 | - | - | 0.60 | 309 | 7.95 | 11.5 | - | - |
| VT025 | Fresh Rock | NW | 2.81 | 0.5 | 0.22 | 1.50 | 3,450 | 5.86 | 9.2 | - | - |
| VT026 | Fresh Rock | NW | 1.14 | - | - | 0.60 | 154 | 8.54 | 10.7 | - | - |
| VT027 | Fresh Rock | NW | - | - | - | - | 37 | 8.79 | 11.7 | - | - |
| VT028 | Fresh Rock | NW | 0.61 | - | - | 0.30 | 90 | 8.48 | 11.3 | - | - |
| VT029 | Fresh Rock | NW | 6.13 | 0.7 | - | 3.80 | 2,110 | 7.54 | 5.4 | - | - |
| VT030 | Fresh Rock | NW | 3.60 | 0.8 | - | 4.80 | 1,120 | 9.87 | 8.0 | - | - |
| IAMGOLD Corporation - Rosebel Gold Mine | |
| Technical Report NI 43- 101 – November 5, 2018 | Page 13-20 |
| Composite | Rock Type | Zone | Au (g/t) |
Ag (g/t) |
Graphitic C (%) |
S (%) |
As (g/t) |
Fe (%) |
Al2O3 (%) |
Cu (%) |
Zn (%) |
| VT031 | Fresh Rock | NW | 2.55 | 0.6 | - | 0.70 | 230 | 8.06 | 11.4 | - | - |
TABLE 13-13 COMPOSITES HEAD ASSAYS
| Composite | Au (g/t) |
Ag (g/t) |
Graphitic C (%) |
S (%) |
As (g/t) |
Fe (%) |
Al2O3 (%) |
Cu (%) |
Zn (%) |
| Duricrust | 1.23 | 1.3 | < 0.1 | 0.1 | 2,290 | 43.2 | 20.3 | < 0.01 | < 0.02 |
| NW LAT | 0.88 | 1.3 | < 0.1 | < 0.1 | 833 | 35.3 | 21.7 | < 0.01 | < 0.02 |
| SE LAT | 2.52 | 1.0 | < 0.1 | 0.1 | 510 | 21.4 | 39.7 | < 0.01 | < 0.02 |
| NW SAP | 4.83 | 0.9 | < 0.1 | < 0.1 | 1,270 | 16.3 | 26.1 | < 0.01 | < 0.02 |
| SE SAP | 0.93 | 0.6 | < 0.1 | < 0.1 | 330 | 8.7 | 28.8 | < 0.01 | < 0.02 |
| NW TR | 6.43 | 0.5 | < 0.1 | < 0.1 | 1,220 | 11.4 | 16.2 | < 0.01 | < 0.02 |
| SE TR | 2.47 | < 0.3 | < 0.1 | < 0.1 | 1,840 | 7.6 | 17.8 | < 0.01 | < 0.02 |
| NW HR | 0.98 | < 0.3 | < 0.1 | 0.6 | 132 | 6.4 | 9.2 | < 0.01 | < 0.02 |
| SE HR | 0.07 | < 0.3 | < 0.1 | < 0.1 | 101 | 9.8 | 12.9 | < 0.01 | < 0.02 |
| 13.2.4 |
MINERAL COMPOSITION AND DISTRIBUTION |
Composites representing the four rock types, laterite, saprolite, transition, and fresh rock, were prepared for each of the NW and SE zones. The composites were first submitted to gravity pre-treatment using a Knelson concentrator, and the tailings were subsequently analysed to determine each sample’s mineral make-up. Table 13-14 summarizes the mineralogy of the composites’ tails.
TABLE 13-14 COMPOSITE TAILS MINERALOGY
| Mineral Proportion (%) | ||||||||
| Rock Type | Samples | Quartz | Goethite | Clays | Micas | Carbonates | Sulphides | Other |
| NW LAT | VT006 | 1 | 26 | 34 | 0 | 0 | 0 | 2 |
| VT002 | ||||||||
| VT003 | 0 | 30 | 68 | 1 | 0 | 0 | 1 | |
| SE LAT | VT004 | |||||||
| VT013 | ||||||||
| VT014 | ||||||||
| NW SAP | VT015 | 32 | 20 | 13 | 32 | 0 | < 1 | 5 |
| VT018 | ||||||||
| VT019 | ||||||||
| SE SAP | VT012 | 52 | 6 | 10 | 27 | 0 | 0 | 2.5 |
| NW TR | VT022 | 67 | 1 | 1 | 22 | 0 | 2.5 | 6.5 |
| VT023 | ||||||||
| SE TR | VT020 | 49 | 6 | 17 | 26 | 0 | 0 | 2 |
| VT026 | ||||||||
| IAMGOLD Corporation - Rosebel Gold Mine | |
| Technical Report NI 43- 101 – November 5, 2018 | Page 13-21 |
| Mineral Proportion (%) | ||||||||
| Rock Type | Samples | Quartz | Goethite | Clays | Micas | Carbonates | Sulphides | Other |
| VT029 | 32 | 0 | 4 | 16 | 40 | 5 | 3 | |
| NW HR | VT030 | |||||||
| VT031 | ||||||||
| SE HR | VT024 | 30 | 2 | 5 | 20 | 38 | 1 | 4 |
Major mineral composition in each rock type gravity tails is as follows;
| • | Laterite: goethite, clays, micas (negligible sulphide, carbonates and quartz) | |
| • | Saprolite: quartz, micas, goethite, clays, (no carbonates, sulphides) | |
| • | Transition: Quartz, micas, clays (minimal goethite), sulphides 0-2.5% | |
| • | Fresh rock: carbonates, quartz, micas, minimal clays and goethite, sulphides 1-5%. |
Following the overall mineralogy and the preliminary mineralogical observation on problematic cyanidation tails, the laterite and saprolite tails were submitted to the Jackson method to dissolve limonite and part of goethite using citrate to gain better access to locked gold particles. The transition and fresh rock samples were further concentrated using sulphide flotation. The flotation concentrates were further concentrated using a Mozley table.
Sulphide concentrate in transition and hard rock samples showed that the majority of Au association is with pyrrhotite (47-73%). Over 50% of the gold grains in each sample were 1-5 micron, with the balance 5-10 micron. Negligible grains (<5%) greater than 10 micron were identified after gravity pre-treatment. Figure 13-9 illustrates the gold associations in transition and fresh rock samples. Figure 13-9 summarizes the gold associations from laterite and saprolite, transition and fresh rock samples by zone. No figure has been produced for the laterite zone since only one gold grain was observed in the NW Lat zone and no gold grains were observed in the SE Lat concentrate. Figures 13-10 and 13-11 show the distribution of gold grain size for each concentrate. In concentrate, NW Sap coarse gold grains were observed (≈30 µm).
| IAMGOLD Corporation - Rosebel Gold Mine | |
| Technical Report NI 43- 101 – November 5, 2018 | Page 13-22 |
FIGURE 13-9 GOLD ASSOCIATIONS IN CONCENTRATES BY ROCK TYPE
![]()
| IAMGOLD Corporation - Rosebel Gold Mine | |
| Technical Report NI 43- 101 – November 5, 2018 | Page 13-23 |
FIGURE 13-10 GOLD GRAIN SIZE FOR SAPROLITE
![]()
FIGURE 13-11 GOLD GRAIN SIZE FOR TRANSITION AND FRESH ROCK
![]()
| 13.2.5 |
COMMINUTION TESTING – SARAMACCA |
The results of the comminution test work for the ores are presented in Table 13-15 and the results of the comminution test work for the master composites are presented in Table 13-16. The tests conducted at COREM were not pre-screened ahead of BWi testing. Since the laterite and saprolite samples are generally soft material, only some of CM samples were selected for Bond test.
| IAMGOLD Corporation - Rosebel Gold Mine | |
| Technical Report NI 43- 101 – November 5, 2018 | Page 13-24 |
TABLE 13-15 SUMMARY OF SMC AND BOND COMMINUTION TEST RESULTS
| Composite ID | Rock Type | Zone | SMC (Axb) |
SPI (min) |
BWi (kWh/t) |
| CM-01 | Laterite | SE | - | 24.1 | 12.5 |
| CM-03 | Laterite | SE | - | 1.3 | 4.0 |
| CM-08 | Saprolite | SE | - | 1.0 | 11.5 |
| CM-10 | Saprolite | SE | - | 0.9 | 1.3 |
| CM-12 | Saprolite | SE | - | - | 4.2 |
| CM-13 | Saprolite | NW | - | - | 4.2 |
| CM-15 | Transition | SE | 103.0 | 8.0 | 5.5 |
| CM-16 | Transition | NW | 78.3 | 16.3 | 10.9 |
| CM-17 | Transition | NW | - | 37.6 | 10.3 |
| CM-18 | Fresh Rock | NW | 40.2 | 70.4 | 17.4 |
| CM-19 | Fresh Rock | NW | - | 118.1 | 15.3 |
| CM-20 | Fresh Rock | NW | - | 131.1 | 15.5 |
| CM-21 | Fresh Rock | NW | - | 104.4 | 12.6 |
| CM-22 | Fresh Rock | NW | - | 84.6 | 13.0 |
| CM-23 | Fresh Rock | NW | 29.5 | 129.1 | 16.3 |
TABLE 13-16 SUMMARY OF COMMINUTION
TEST RESULTS FOR
COMPOSITES SAMPLES
| Sample | BWi | AI | CWI | SMC | SPI | |
| Rock Type | Zone | (kWh/t) | (g) | (kWh/t) | (kWh/m3) | (min) |
| Fresh Rock | NW | 14.1 | 0.148 | 22.5 | 8.7 | 152.9 |
| Fresh Rock | SE | 13.0 | 0.032 | 12.9 | 8.9 | 85.1 |
| Transition | NW | 5.6 | 0.0014 | 6.6 | 2.5 | 15.6 |
| Transition | SE | 4.1 | - | 3.8 | 1.1 | 5.3 |
| Laterite | NW | 14.1 | 0.0051 | - | - | - |
| Saprolite | SE | 4.1 | - | - | - | - |
| Saprolite | NW | 7.0 | - | - | - | - |
The SMC tests were conducted using particles in the -22.4/+19.0 mm particle size range. Significant variability was observed with Axb results ranging from 29.5 to 207. The SMC test results conducted at SGS Lakefield were calibrated using the JK database. In the absence of JK Drop Weight testing (DWT) results on Saramacca material, the SMC results were calibrated against the old results from a grinding survey conducted by SGS Lakefield at the Rosebel processing plant in 2009.
SPI testing was conducted on selected laterite, saprolite, transition, and fresh rock samples. The results indicated that Saramacca transition and fresh rock samples, while considered hard, are softer than the average of the existing database of Rosebel fresh rock samples tested in the past. A comparison of SPI results for Saramacca and Rosebel is shown in Figure 13-12 (ref. Report 15306-004, SGS).
| IAMGOLD Corporation - Rosebel Gold Mine | |
| Technical Report NI 43- 101 – November 5, 2018 | Page 13-25 |
FIGURE 13-12 SPI RESULTS FOR SARAMACCA AND ROSEBEL
![]()
Based on the BWi results, the majority of laterite and saprolite samples were classified in the very soft to medium range in terms of hardness with values ranging from 1.3 -14.1 kWh/t. The transition and fresh rock values ranged from very soft at 4.1 kWh/t to hard at 17.4 kWh/t. While the saprolite and laterite samples appear to have BWi values higher than those observed in other deposits feeding RGM, it is due to the difference in test procedure used. For RGM ores, the soft material samples were soaked in water and wet-screened on a 150-mesh screen. The tests were performed on the screen oversize and the BWi were obtained on the oversize fractions are referred as “direct” BWi. The calculated overall work indices take into account the amount of fines material that was removed.
Extremely low Ai values (<0.05) were observed for the transition and fresh rock samples tested at COREM. Duplicate samples were tested at SGS Lakefield, and the results, while higher, are considered non-abrasive as the values fall below the 10th percentile threshold of the SGS Lakefield database.
| IAMGOLD Corporation - Rosebel Gold Mine | |
| Technical Report NI 43- 101 – November 5, 2018 | Page 13-26 |
| 13.2.5.1 |
COMPARISON WITH RGM COMMINUTION VALUES |
In order to evaluate the impact of introducing Saramacca material to RGM, the average comminution results from the current Saramacca test work program were compared to historical Rosebel test work reports. A comparison of the available data is presented in Table 13-17. Saramacca results are from both comminution composites (CM) and metallurgical variability samples (VT). The comparison was focussed on fresh rock, as this is the material most likely to be problematic to the operation of the crushing and grinding circuits.
TABLE 13-17 COMPARISON OF SARAMACCA
AND ROSEBEL COMMINUTION
DATA FOR FRESH ROCK
| Saramacca | ||||||
| Test | Unit | Zone | Min | Max | Avg. | RGM |
| kWh/t | NW | 15.0 | 33.8 | 22.5 | ||
| CWi | SE | 5.4 | 19.2 | 12.9 | 21.8 | |
| - | NW | 29.5 | 40.2 | 33.8 | ||
| SMC | SE | - | - | 30.0 | 33.8 | |
| Min | NW | 70 | 153 | 113 | ||
| SPI | SE | - | - | 85 | 143 | |
| kWh/t | NW | 12.6 | 17.4 | 14.9 | ||
| BWi | SE | - | - | 13.0 | 13.4 | |
| g | NW | - | - | 0.148 | ||
| Ai | SE | - | - | 0.032 | 0.28 |
Based on the comminution test work conducted and the current performance of the RGM grinding circuit, there are no indications that the RGM crushing and grinding circuit will require modifications to accommodate the introduction of Saramacca material.
| 13.2.6 |
GRAVITY AND LEACHING TEST WORK |
| 13.2.6.1 |
EXTENDED GRAVITY RECOVERABLE GOLD TEST (E-GRG) |
The master composites for all rock types were submitted to GRG testing. The results indicated that the amount of gravity recoverable gold was not significant (low GRG) in most samples. Good GRG values were observed for the NW transition and fresh rock samples, as well as for the SE fresh rock, however, the concentrate gold grades were relatively low at 504 g/t, 32 g/t, and 9 g/t respectively. The gravity test results are presented in Table 13-18.
| IAMGOLD Corporation - Rosebel Gold Mine | |
| Technical Report NI 43- 101 – November 5, 2018 | Page 13-27 |
TABLE 13-18 GRAVITY TEST RESULTS
| Gravity | ||||||
| Recovery | ||||||
| Composite | Head Grade Measured (g/t Au) |
Head Grade Calculated (g/t Au) |
Weight (%) |
GRG (%) |
Concentrate Grade (g/t Au) |
Upgrade Ratio |
| NW Laterite | 0.33 | 1.06 | 0.22 | 5.0 | 24 | 22.3 |
| SE Laterite | 2.52 | 2.62 | 0.23 | 15.2 | 21 | 7.9 |
| NW Saprolite | 4.83 | 4.52 | 0.22 | 19.4 | 401 | 88.7 |
| SE Saprolite | 0.93 | 1.05 | 0.42 | 17.5 | 39 | 37.0 |
| NW Transition | 6.43 | 7.70 | 0.73 | 63.2 | 504 | 65.4 |
| SE Transition | 2.47 | 2.73 | 1.30 | 16.0 | 32 | 11.9 |
| NW Fresh Rock | 0.98 | 1.34 | 1.19 | 60.7 | 54 | 40.3 |
| SE Fresh Rock | 0.07 | 0.42 | 1.85 | 47.9 | 9 | 20.5 |
| 13.2.6.2 |
BULK GRAVITY TEST |
Prior to recovery test work, the master composites were ground to 100% passing 850 micron before being submitted to a gravity pre-treatment using a Knelson concentrator. The bulk gravity test results are presented in Table 13-19.
TABLE 13-19 BULK GRAVITY TEST RESULTS
| Gravity | ||||||
| Recovery | ||||||
| Composite | Head Grade Measured (g/t Au) |
Head Grade Calculated (g/t Au) |
Weight (%) |
GRG (%) |
Concentrate Grade (g/t Au) |
Upgrade Ratio |
| Duricrust | 1.23 | 1.42 | 1.30 | 13.7 | 15.2 | 12.3 |
| Nw Laterite | 0.88 | 0.91 | 1.10 | 11.0 | 8.9 | 10.0 |
| SE Laterite | 2.52 | 2.52 | 1.20 | 5.5 | 11.2 | 4.4 |
| NW Saprolite | 4.83 | 3.77 | 1.20 | 22.9 | 70.7 | 14.6 |
| SE Saprolite | 0.93 | 0.96 | 0.70 | 9.0 | 11.8 | 12.7 |
| NW Transition | 6.43 | 7.98 | 1.00 | 28.2 | 218 | 33.9 |
| SE Transition | 2.47 | 2.54 | 0.90 | 6.3 | 18.1 | 7.3 |
| NW Fresh Rock | 0.98 | 0.80 | 2.50 | 5.7 | 1.8 | 1.8 |
| SE Fresh Rock | 0.07 | 0.07 | 1.10 | 1.1 | 0.07 | 1.0 |
Both the GRG and bulk gravity test work results showed similar trends which suggested Saramacca material is not ideally suited for gravity recovery. Some samples demonstrated a moderate level gravity recoverable gold content. In general, this was more pronounced in samples from the NW zone when compared to those from SE. Also, samples with higher head grade tended to show higher GRG values and gold upgrade ratios.
| IAMGOLD Corporation - Rosebel Gold Mine | |
| Technical Report NI 43- 101 – November 5, 2018 | Page 13-28 |
Further testing was performed on two samples (CT-005 and CT-007) at a P80 of 75 micron and a P80 of 850 micron each. For sample CT-005, the recovery at P80 of 75 micron was slightly lower compared to the recovery at a P80 of 850 micron, however, for sample CT-007 the recovery was significantly higher at a P80 of 75 micron compared to the recovery at a P80 of 850 micron.
| 13.2.6.3 |
LEACHING TEST WORK |
The leaching test work program consisted mainly of bottle roll tests conducted in duplicate at each set of test work conditions (Table 13-20). The variability samples were tested to determine their metallurgical response to whole ore leaching (WOL) as well as to cyanidation of gravity tailings. All leaching tests conducted on variability samples were conducted with carbon (10 g/L). The master composite gravity tailings were submitted to cyanidation tests with and without carbon to assess the preg-robbing tendency of the material.
TABLE 13-20 LEACHING TEST CONDITIONS
| Variability | Variability – CN of | Master Comp – | ||
| Test | Units | – WOL | Gravity Tails | Gravity Tails |
| Carbon | g/L | 10 | 10 | 0/30 |
| Pulp Density | % w/w | 50 | ||
| Time | hours | 48 | ||
| Temperature | oC | 20-23 | ||
| NaCN initial/maintained | g/L | 500/350 | ||
| DO | ppm | Air saturation | ||
| pH maintained with lime | 10.5-11 |
| 13.2.6.4 |
WHOLE ORE LEACHING |
The results of gold recovery and reagent consumption after 48 hours cyanidation are presented in Table 13-21.
TABLE 13-21 WHOLE ORE LEACH AVERAGE TEST RESULTS
| Reagent | ||||||
| Consumption | ||||||
| Sample ID |
Sub-Rock Type | Rock Type | Head Grade (g/t Au) |
NaCn (kg/t) |
CaO (kg/t) |
Au Recovery 48h (%) |
| VT001 | Laterite | Laterite | 0.55 | 182 | 12,250 | 94.55 |
| VT002 | Laterite | 1.95 | 312 | 6,470 | 93.33 | |
| VT003 | Laterite | 2.02 | 257 | 9,786 | 95.05 | |
| IAMGOLD Corporation - Rosebel Gold Mine | |
| Technical Report NI 43- 101 – November 5, 2018 | Page 13-29 |
| Reagent | ||||||
| Consumption | ||||||
| Sample ID |
Sub-Rock Type | Rock Type | Head Grade (g/t Au) |
NaCn (kg/t) |
CaO (kg/t) |
Au Recovery 48h (%) |
| VT004 | Laterite | 1.58 | 297 | 12,610 | 97.47 | |
| VT005 | Laterite | 8.51 | 305 | 10,896 | 96.53 | |
| VT006 | Laterite | 1.80 | 151 | 3,891 | 91.94 | |
| VT007 | Laterite | 2.46 | 210 | 5,514 | 73.98 | |
| VT008 | Pillow Basalt | 0.78 | 162 | 3,589 | 90.38 | |
| VT009 | Pillow Basalt | 0.34 | 99 | 4,221 | 85.29 | |
| VT010 | Combined FB & B Fault Zone | 0.82 | 82 | 3,143 | 87.20 | |
| VT011 | Pillow Basalt | 0.53 | 400 | 2,186 | 89.62 | |
| VT012 | Pillow Basalt | 2.33 | 117 | 2,852 | 96.14 | |
| VT013 | Pillow Basalt | Saprolite | 13.67 | 149 | 2,632 | 94.55 |
| VT014 | Pillow Basalt | 1.85 | 242 | 2,802 | 92.43 | |
| VT015 | Combined FB & B Fault Zone | 2.21 | 493 | 4,091 | 88.01 | |
| VT016 | Pillow Basalt | 0.60 | 274 | 3,992 | 91.67 | |
| VT017 | Pillow Basalt | 0.55 | 197 | 2,368 | 94.55 | |
| VT018 | Pillow Basalt | 1.06 | 265 | 2,522 | 97.17 | |
| VT019 | Fault Low Grade (Fault LG) | 6.35 | 159 | 2,609 | 95.91 | |
| VT020 | Pillow Basalt | 7.10 | 188 | 2,348 | 99.37 | |
| VT021 | Fault LG | Transition | 0.46 | 160 | 2,340 | 68.48 |
| VT022 | Fault LG | 3.25 | 349 | 2,822 | 57.54 | |
| VT023 | Fault LG | 1.19 | 108 | 1,645 | 79.83 | |
| VT024 | Pillow Basalt | 2.33 | 609 | 2,901 | 73.39 | |
| VT025 | Combined FB & B Fault Zone | 2.81 | 435 | 2,722 | 25.80 | |
| VT026 | Pillow Basalt | 1.14 | 595 | 2,916 | 86.40 | |
| VT027 | Pillow Basalt | 0.07 | 367 | 2,849 | 71.43 | |
| Fresh Rock | ||||||
| VT028 | Pillow Basalt | 0.61 | 526 | 1,774 | 79.69 | |
| VT029 | Fault LG/Fault HG | 6.13 | 295 | 2,367 | 73.65 | |
| VT030 | Combined FB & B Fault Zone | 3.60 | 421 | 2,290 | 64.44 | |
| VT031 | Fault LG | 2.55 | 422 | 2,750 | 79.61 | |
Note. Fault LG - Fault Low Grade
The highest gold recoveries were obtained for the laterite and saprolite ores (VT001 through VT019) whereas the transition and fresh rock ores (VT020 to VT031) exhibited lower gold recoveries. The recoveries of saprolite, laterite, and transition ores tended to improve with increasing gold grade, whereas the recovery in fresh rock ores tended to worsen with the increase of gold grade.
| IAMGOLD Corporation - Rosebel Gold Mine | |
| Technical Report NI 43- 101 – November 5, 2018 | Page 13-30 |
The results indicate that certain samples of transition zone and mainly fresh rock reveal very low recoveries indicating the presence of partial refractoriness in the ore, which is related to the gold associations with arsenopyrite, pyrite, and pyrrhotite. It was also noticed that the low recovery samples are mainly populated in fault zone particularly in the saddle zone between NW and SE.
The mineralogy suggested that the majority of the gold is fine in the Saramacca ore, and this is confirmed during the size by size analysis of gold in the whole ore leach tails which also suggests that most of the gold in the cyanidation tailings were in the -38 μm fraction (see Table 13-22). For that reason, the effect of finer grinding on the gold recovery of whole ore in variability samples VT025 and VT029 was investigated to evaluate the opportunity to increase the gold recovery in the refractory portion of the ore. The results are provided in Table 13-23.
TABLE 13-22 SIZE BY SIZE ANALYSIS OF
GOLD IN CYANIDATION TAILS OF
WHOLE ORE LEACH
| Au Repartition (%) | |||||||
| Rock Type | Sample ID |
+ 150 µm | + 106 µm | + 75 µm | + 53 µm | + 38 µm | - 38 µm |
| Laterite | VT001 | 7 | 5 | 5 | 5 | 4 | 75 |
| VT002 | 5 | 3 | 23 | 12 | 7 | 50 | |
| VT003 | 14 | 8 | 10 | 10 | 10 | 47 | |
| VT004 | 6 | 3 | 7 | 10 | 11 | 64 | |
| VT005 | 8 | 1 | 7 | 6 | 4 | 74 | |
| VT006 | 39 | 7 | 6 | 5 | 4 | 38 | |
| VT007 | 37 | 18 | 14 | 10 | 7 | 14 | |
| Saprolite | VT008 | 58 | 5 | 4 | 4 | 3 | 26 |
| VT009 | 47 | 5 | 4 | 3 | 2 | 39 | |
| VT010 | 20 | 9 | 13 | 12 | 10 | 36 | |
| VT011 | 10 | 5 | 6 | 5 | 4 | 71 | |
| VT012 | 21 | 9 | 6 | 5 | 1 | 59 | |
| VT013 | 12 | 13 | 15 | 11 | 9 | 40 | |
| VT014 | 11 | 2 | 24 | 17 | 11 | 36 | |
| VT015 | 15 | 15 | 13 | 11 | 8 | 38 | |
| VT016 | 11 | 15 | 16 | 12 | 7 | 39 | |
| VT017 | 19 | 2 | 2 | 2 | 2 | 73 | |
| VT018 | 12 | 6 | 5 | 4 | 3 | 70 | |
| VT019 | 16 | 13 | 11 | 11 | 7 | 42 | |
| Transition | VT020 | 14 | 6 | 6 | 6 | 5 | 62 |
| VT021 | 12 | 8 | 7 | 4 | 3 | 65 | |
| VT022 | 9 | 4 | 16 | 15 | 11 | 46 | |
| VT023 | 21 | 17 | 17 | 15 | 10 | 21 | |
| IAMGOLD Corporation - Rosebel Gold Mine | |
| Technical Report NI 43- 101 – November 5, 2018 | Page 13-31 |
| Au Repartition (%) | |||||||
| Rock Type | Sample ID |
+ 150 µm | + 106 µm | + 75 µm | + 53 µm | + 38 µm | - 38 µm |
| Fresh Rock | VT024 | 8 | 2 | 13 | 14 | 12 | 51 |
| VT025 | 4 | 4 | 10 | 9 | 6 | 67 | |
| VT026 | 12 | 11 | 10 | 18 | 10 | 39 | |
| VT027 | 10 | 4 | 5 | 6 | 6 | 69 | |
| VT028 | 16 | 12 | 11 | 11 | 7 | 43 | |
| VT029 | 21 | 2 | 22 | 12 | 8 | 35 | |
| VT030 | 24 | 19 | 16 | 9 | 7 | 25 | |
| VT031 | 30 | 18 | 17 | 9 | 7 | 19 | |
TABLE 13-23 GOLD RECOVERY IN FINE GROUND ORES
| Au Recovery (%) | ||||
| Rock Type | Sample ID | Head
Grade (g/t Au) |
P100 = 20 µm | P80 = 75 µm |
| Fresh Rock | VT025 | 2.81 | 43.1 | 25.8 |
| VT025 | 2.81 | 42.0 | 25.8 | |
| Fresh Rock | VT029 | 6.13 | 83.0 | 73.6 |
| VT029 | 6.13 | 82.5 | 73.6 | |
Higher gold recoveries were obtained when the ores were ground finer. An average gold recovery of 42.5% and 82.75 % was obtained as compared to 25.8% and 73.6% when the grind size was P80 = 75 μm. The lower gold recovery in VT025 was attributed to its high refractoriness (arsenic and pyrite). The gold leaching kinetics suggested that for the fine ground whole ores VT025 and VT029, the majority of the gold was leached within 24 hours.
Given the positive results described above, a set of exploratory flotation tests were planned to float sulphides followed by ultrafine grinding and leaching of the concentrate to increase the recovery of the refractory portion of the Saramacca transition ore and fresh rock.
| 13.2.6.5 |
COMPOSITES LEACHED WITH AND WITHOUT CARBON |
The results of the comparison of leaching with and without activated carbon are presented in Figure 13-13. The head grade of the SE (FRESH) composite was too low and the leaching with and without carbon test was not performed.
| IAMGOLD Corporation - Rosebel Gold Mine | |
| Technical Report NI 43- 101 – November 5, 2018 | Page 13-32 |
FIGURE 13-13 GOLD RECOVERY WITH AND
WITHOUT CARBON FOR THE
COMPOSITES
![]()
Following this testing it was observed that for all the tested ores types there is no clear potential for preg-robbing.
| 13.2.6.6 |
VALIDATION OF LEACHING RESULTS |
In order to confirm the accuracy of the leaching test work results obtained at COREM, selected samples were sent to SGS Lakefield for replicate testing. The repeated tests included whole ore leaching of variability samples VT001, 003, 008, 011, 013, 015, 021, 025, 029, and 030 as well as leaching of Knelson tails (KT) from variability samples VT007, 010, and 022. The comparison of the COREM and SGS Lakefield results are presented in Table 13-24.
TABLE 13-24 COMPARISON OF COREM AND
SGS LAKEFIELD LEACH
RESULTS
| COREM | SGS Lakefield | |||
| Head Grade (g/t | Au Recovery | Head Grade (g/t | Au Recovery | |
| Sample ID | Au) | (%) | Au) | (%) |
| VT001 | 0.55 | 94.55 | 0.58 | 93.97 |
| VT003 | 2.02 | 95.05 | 2.20 | 95.00 |
| VT008 | 0.78 | 90.38 | 0.71 | 88.73 |
| VT011 | 0.53 | 89.62 | 0.53 | 88.68 |
| VT013 | 13.67 | 94.55 | 8.10 | 89.38 |
| VT015 | 2.21 | 88.01 | 2.11 | 85.07 |
| VT021 | 0.46 | 68.48 | 0.51 | 67.65 |
| VT025 | 2.81 | 25.80 | 2.82 | 26.06 |
| VT029 | 6.13 | 73.65 | 5.56 | 61.06 |
| VT030 | 3.60 | 64.40 | 3.60 | 65.69 |
| IAMGOLD Corporation - Rosebel Gold Mine | |
| Technical Report NI 43- 101 – November 5, 2018 | Page 13-33 |
| COREM | SGS Lakefield | |||
| Head Grade (g/t | Au Recovery | Head Grade (g/t | Au Recovery | |
| Sample ID | Au) | (%) | Au) | (%) |
| KTV007 | 2.64 | 81.28 | 2.68 | 77.61 |
| KTV010 | 0.81 | 80.27 | 0.79 | 79.75 |
| KTV022 | 3.11 | 53.06 | 3.18 | 56.29 |
In general, consistency was observed between the results of the original tests performed at COREM and the replicated tests conducted at SGS Lakefield. The majority of test results were within 5% of each other with the exception of VT029. The 17% difference observed between the gold recovery results was likely due to the high head grade of the sample.
| 13.2.6.7 |
STIRRED TESTS |
Stirred tank reactor leaching was performed on the whole ores of variability samples VT008, VT021, and VT029, with and without activated carbon, to investigate the variation of gold recovery between two different systems (Bottle roll vs reactor) through a better controlled air addition and DO as well as mixing in a stirred reactor. The results of this test are displayed in Table 13-25.
TABLE 13-25 GOLD RECOVERY IN STR
LEACHING AND BOTTLE ROLL
COMPARISON
| Sample ID |
Rock Type | Head Grade (g/t Au) |
STR Recovery % (No Carbon) |
STR Recovery % (10 g/t Carbon) |
Bottle Roll Recovery % (10 g/t Carbon) |
| VT008 | Saprolite | 0.78 | 89.8 | 88.3 | 90.38 |
| VT021 | Transition | 0.46 | 39.3 | 67.3 | 68.48 |
| VT029 | Fresh Rock | 6.13 | 64.6 | 73.6 | 73.65 |
VT008 yields a similar gold recovery in the presence and absence of activated carbon, showing that VT 008 does not present appreciable preg-robbing characteristics.
VT021 and VT029 samples however showed a difference of 28% and 9% in the gold recovery in the presence and absence of activated carbon, respectively. Such a difference could be explained by the presence of graphitic carbon and/or the presence of minerals with preg-robbing properties in these two samples.
No material difference was observed between the gold recovery in bottle roll and the STR cyanidation in presence of 10 g/L of activated carbon. Overall results suggest that bottle roll tests results are reliable as no potential recovery loss could be attributed to a change in leaching regime. This remains to be demonstrated for clayish laterite ore.
| IAMGOLD Corporation - Rosebel Gold Mine | |
| Technical Report NI 43- 101 – November 5, 2018 | Page 13-34 |
| 13.2.7 |
FLOWSHEET OPTIMIZATION |
| 13.2.7.1 |
FLOTATION TEST WORK |
Preliminary flotation testing was performed on four samples: SE (TRANS), NW (TRANS), SE (FRESH), and NW (FRESH) composed with VT samples, in order to identify the opportunities to recover “inaccessible” gold through a potential flotation + ultrafine grinding+ cyanidation circuit. Flotation was investigated to decrease the mass pull to ultrafine grinding, which would reduce the project costs when compared with whole ore grinding.
A total of eight flotation tests and a production test were performed in order to identify the gold form in the sample sorted by ore type and location (four tests). The analysis was for each stream, separate the talc, the sulfur minerals, and the silicate minerals (four tests), and produce enough talc concentrate, sulfur concentrate, and silicate tailing to evaluate gold leaching in those three streams. The results of these eight tests are presented in Table 13-26.
TABLE 13-26 FLOTATION FLOWSHEET SUMMARY
| Talc Concentrate | Sulfur Concentrate | Flotation Concentrate | |||||
| Au | Au | Au | |||||
| Au Grade | Recovery | Au Grade | Recovery | Au Grade | Recovery | ||
| Test No. | Sample | (mg/kg) | (%) | (mg/kg) | (%) | (mg/kg) | (%) |
| 1 | SE Fresh | - | - | 14.34 | 63.49 | 0.81 | 36.51 |
| 2 | NW Fresh | - | - | 3.78 | 78.02 | 0.66 | 21.98 |
| 3 | NW Trans | - | - | 7.94 | 46.29 | 7.94 | 43.71 |
| 4 | SE Trans | - | - | 31.45 | 56.16 | 2.59 | 43.84 |
| 5 | NW Fresh | 3.94 | 43.65 | 12.40 | 20.55 | 1.06 | 35.80 |
| 6 | NW Trans | 5.71 | 29.82 | 14.10 | 18.96 | 1.08 | 51.22 |
| 7 | NW Trans | 15.90 | 17.29 | 7.13 | 56.53 | 0.51 | 26.09 |
| 8 | NW Fresh | 6.06 | 40.97 | 8.45 | 39.28 | 0.48 | 19.75 |
| Production | NW Trans | 14.50 | 17.80 | 5.30 | 60.98 | 0.43 | 21.22 |
As shown by the metallurgical performances of NW (TRANS) and NW (FRESH) and the production test, addition of multiple steps of activation and numerous scavenger steps improved the recovery of sulfur and gold in the sulfur concentrate. However, it was not optimized and 21.22% of the gold was left in the tailings, and optimization of gold recovery should be performed to reduce the losses. The approach taken during this test work was to float the talc and unfortunately probably lost gold units through entrainment during the flotation. Multiples steps of talc cleaning were tried in order to reduce gold units in the talc without complete success. A complete mineralogy study is currently in progress in order to understand why the flotation was not as successful as planned and to align further testing accordingly.
| IAMGOLD Corporation - Rosebel Gold Mine | |
| Technical Report NI 43- 101 – November 5, 2018 | Page 13-35 |
| 13.2.8 |
RECOVERY |
Table 13-27 shows the weighted average of recoveries per rock type and prorated with the latest mine plan.
TABLE 13-27 OVERALL RECOVERY BY ROCK TYPE FOR SARAMACCA
| Au Recovery | |
| Rock Type | Gravity + Cyanidation |
| (%) | |
| Duricrust | 95.2 |
| Laterite | 93.2 |
| Saprolite | 91.0 |
| Transition Rock | 89.6 |
| Hard Rock | 74.8 |
It is to be mentioned that one composite sample of duricrust was tested, however, because the amount of duricrust in the total LOM is marginal. No more extensive testing was performed on this type of ore and the recovery was not deemed problematic. An overall recovery of 94%for laterite (inclusive of duricrust) was applied for the pit optimizations.
| 13.2.9 |
THICKENING TESTING |
Static settling tests were conducted at SGS Lakefield on individual laterite, saprolite, and hard rock samples from both the NW and SE zones. Based on the results of flocculant screening tests, initial settling tests were done using Magnafloc 10 on all samples. Additional tests on laterite and saprolite materials were conducted with the reagent currently used at RGM – SNF Flomin AN923VHM. The clay-like nature of the laterite and saprolite makes it difficult to settle these materials. Given that the individual Saramacca rock types tested will never be fed to the RGM thickener in the absence of Rosebel material, the thickening test work program at SGS Lakefield was suspended. During a routine visit to RGM, SNF representatives conducted preliminary tests on blends of Saramacca and Rosebel material. The SNF report entitled ‘’SNF Floerger IAMGOLD Lab Evaluation’’, May 2018 reports the testing performed. Figure 13-14 summarizes the settling rate in function of different dosages of AN923VHM.
| IAMGOLD Corporation - Rosebel Gold Mine | |
| Technical Report NI 43- 101 – November 5, 2018 | Page 13-36 |
FIGURE 13-14 TSS IN FUNCTION OF FLOCCULANT DOSAGE
![]()
The settling characteristics observed during these scoping tests confirmed that the introduction of Saramacca ore into the plant would not adversely affect thickener performance. Further testing is planned in order to verify the settling rate for additional blends between RGM and Saramacca ore.
| 13.2.10 |
REAGENT CONSUMPTION |
Major consumables in the process are sodium cyanide and lime. The average cyanide and lime consumption values per rock type during leaching of the Saramacca samples are presented in Figures 13-15 and 13-16, respectively. The latter also shows the lime consumption for Saramacca vs RGM rock types.
| IAMGOLD Corporation - Rosebel Gold Mine | |
| Technical Report NI 43- 101 – November 5, 2018 | Page 13-37 |
FIGURE 13-15 AVERAGE NACN CONSUMPTION
BY SARAMACCA ROCK
TYPES
![]()
FIGURE 13-16 AVERAGE CAO CONSUMPTION
OF SARAMACCA ROCK
TYPES VS RGM ROCK TYPES
![]()
Higher reagent consumptions were observed during leaching of Saramacca samples in terms of both lime and cyanide consumption when compared to RGM, however, lime consumption for laterite and saprolite were considered excessive (with some individual samples reaching 16 kg/t particularly for laterites). A series of diagnostic tests were performed to better understand this phenomenon. It was concluded that the viscosity of laterite slurries did not allow the full dissolution of lime and therefore resulted in an apparent increase in consumption. Increased cyanide consumption could be explained due to higher levels of sulphide minerals observed in Saramacca ore. Further testing is planned using mixtures of fresh rock and saprolite/laterite to improve the rheological conditions of the slurry and to better reflect the leaching environment at RGM.
| IAMGOLD Corporation - Rosebel Gold Mine | |
| Technical Report NI 43- 101 – November 5, 2018 | Page 13-38 |
| 13.2.11 |
CONCLUSIONS AND RECOMMENDATIONS – SARAMACCA |
The metallurgical results obtained during the FS program are in-line with the results in the previous program published in the SRK 2017 Technical Report (SRK 2017b) report. Comminution results, gravity, leaching, and reagent consumption are in the same range.
The FS testwork performed demonstrate lower recoveries for fresh rock and transition ore compared to the actual RGM recoveries while treated in a similar flowsheet as the existing plant. Table 13-28 summarizes the design criteria of Saramacca compared to RMG.
TABLE 13-28 COMPARISON OF MAIN DESIGN
CRITERIA FOR SARAMACCA
VS RGM
| Design Criteria | |||
| Parameter | Unit | Saramacca | RGM |
| Comminution Characteristics | |||
| (Hard Rock) | |||
| CWi | kWh/t | 18.6 | 21.8 |
| SPI | min | 109 | 143 |
| Axb | - | 32.8 | 33.8 |
| BWi | kWh/t | 14.7 | 13.4 |
| Ai | g | 0.09 | 0.28 |
| Gold Recovery | |||
| Laterite | % | 93.2 | - |
| Saprolite | % | 91.0 | 94.4 |
| Transition | % | 89.6 | 94.2 |
| Hard Rock | % | 74.8 | 94.0 |
| NaCN Consumption | |||
| Laterite | g/t | 246 | |
| Saprolite | g/t | 173 | 314* |
| Transition | g/t | 186 | |
| Hard Rock | g/t | 417 | |
| IAMGOLD Corporation - Rosebel Gold Mine | |
| Technical Report NI 43- 101 – November 5, 2018 | Page 13-39 |
| Design Criteria | |||
| Parameter | Unit | Saramacca | RGM |
| Comminution Characteristics | |||
| CaO Consumption | |||
| Laterite | g/t | 9,520 | |
| Saprolite | g/t | 2,919 | 811* |
| Transition | g/t | 2,572 | |
| Hard Rock | g/t | 2,510 | |
Note. *The NaCN and CaO consumption rates for RGM were calculated from projected mill throughput (mix between rock types) and mill consumables presented in the RGM NI43-101 issued on September 5, 2017.
As an opportunity, additional test work is recommended to optimize metallurgical performances for each rock type. Additional tests would also help to identify problematic zones or lithologies within the deposit.
The following tests are proposed:
| • | Detailed process mineralogy study to better identify the gold associations and refractoriness | |
| • | Stirred tests | |
| • | Fine grinding + leaching | |
| • | Flotation + leaching | |
| • | Flotation + fine grinding + leaching | |
| • | Oxygen vs. Air addition to the leach | |
| • | Thickening on different blends | |
| • | P80 optimization remains in the tests proposed | |
| • | Blend of Rosebel and Saramacca ore | |
| • | Test additional fresh rock samples for comminution and metallurgical response as the update LOM integrates more fresh rock compared to the previous one. |
| IAMGOLD Corporation - Rosebel Gold Mine | |
| Technical Report NI 43- 101 – November 5, 2018 | Page 13-40 |
| 14 |
MINERAL RESOURCE ESTIMATE |
| 14.1 |
SUMMARY |
The consolidated Mineral Resource Statement, at September 1, 2018 for RGM and at September 13, 2018 for Saramacca, is summarized in Table 14-1 and is reported on a 100% basis. The RGM Mineral Resource estimate was prepared by, or under immediate supervision of, Raphaël Dutaut, P.Geo., an IAMGOLD employee. The Saramacca Mineral Resource estimate was prepared by, or under immediate supervision of, Dominic Chartier, P.Geo., and Oy Leuangthong, P.Eng., of SRK. Messrs. Dutaut and Chartier and Dr. Leuangthong are QPs as defined by NI 43-101.
Mineral Resources and Mineral Reserves have been prepared in accordance with the Canadian Institute of Mining, Metallurgy and Petroleum (CIM) Definition Standards for Mineral Resources and Mineral Reserves dated May 10, 2014 (CIM definitions).
TABLE 14-1 CONSOLIDATED MINERAL RESOURCE STATEMENT - ROSEBEL
GOLD MINE, INCLUDING SARAMACCA GOLD DEPOSIT
| Deposit | Classification | Tonnes (000) |
Grade (g/t Au) |
Contained Ounces (000s) 100% Basis |
Attributable Contained Ounces (000s) |
| Measured | 34,216 | 0.6 | 696 | 661 | |
| Indicated | 261,108 | 0.9 | 7,817 | 7,426 | |
| RGM | Measured & Indicated | 295,324 | 0.9 | 8,513 | 8,087 |
| Inferred | 65,154 | 0.9 | 1,797 | 1,707 | |
| Indicated | 27,938 | 2.0 | 1,763 | 1,172 | |
| Saramacca | Inferred | 11,824 | 0.7 | 273 | 182 |
| Measured | 34,216 | 0.6 | 696 | 661 | |
| Indicated | 289,047 | 1.0 | 9,580 | 8,598 | |
| Consolidated | Measured & Indicated | 323,262 | 1.0 | 10,276 | 9,260 |
| Inferred | 76,978 | 0.8 | 2,070 | 1,889 |
Notes:
| 1. |
Attributable ounces: 95% for Rosebel (excluding Saramacca), 66.5% for Saramacca. | |
| 2. |
CIM definitions were followed for classification of Mineral Resources. | |
| 3. |
Mineral Resources reported at a weighted average cut-off grade for Rosebel (excluding Saramacca) of 0.18 g/t Au for saprolite, 0.23 g/t Au for transition material, and 0.35 g/t Au for fresh rock material. Average cut-off grades for Saramacca are 0.25 g/t Au for laterite and saprolite, 0.30 g/t Au for transition material, and 0.50 g/t Au for fresh rock material. | |
| 4. |
Mineral Resources for RGM include 2018 depletion prior to September 1, 2018. | |
| 5. |
Mineral Resources are constrained within a pit shell estimated using a long-term gold price of US$1,500/oz. |
| IAMGOLD Corporation - Rosebel Gold Mine | |
| Technical Report NI 43- 101 – November 5, 2018 | Page 14-1 |
| 6. |
Mineral Resources are inclusive of Mineral Reserves. | |
| 7. |
Numbers may not add due to rounding. | |
| 8. |
Effective date for Rosebel (excluding Saramacca) is September 1, 2018 . Effective date for Saramacca is September 13, 2018. |
The QPs are not aware of any environmental, permitting, legal, title, taxation, socio-economic, marketing, political, or other relevant factors that could materially affect the Mineral Resource estimate.
| 14.2 |
RGM CONCESSION |
For the present Mineral Resource estimate, Mama Kreek (MK), East Tailing Road (ETR), and Overman (OV) block models were not updated and, as such, remain the same as the December 31, 2017 Mineral Resources.
The MK, ETR, and OV block models will subsequently be referred to as the not-updated models. The following block models have been updated and will be referred to as the updated models: Koolhoven (KH), J Zone (JZ), Pay Caro (PC), Mayo (MA), Roma West (RMW), Roma East (RME), Royal Hill (RH), and Rosebel (RB). The Mineral Resource estimate has been completed using Geovia GEMS 6.7 (GEMS) software and GSLib software using a conventional approach, including 3D geological modelling and block modelling. Two different interpolation approaches were used, depending on the area:
| • | for MK, ETR, OV (not-updated models) : an inverse distance cubed interpolator (ID3) was used; | |
| • | for KH, JZ, PC, RB, RH, RMW, RME, and MA (updated models): Localized Uniform Conditioning (LUC) grade estimation was performed. |
| 14.2.1 |
DATABASE |
The Mineral Resources at RGM are estimated using DD hole and RC hole data. All holes have been established on a local grid and the final collar locations have been surveyed and reported in UTM WGS84 zone 21N. The current Mineral Resource database is composed of 6,213 DD holes, totalling 926,533 m for 645,138 assayed samples and 31,821 RC holes, totalling 1,479,281 m for 648,491 assayed samples. The resource database includes DD holes and RC holes within and close to the pit area.
| IAMGOLD Corporation - Rosebel Gold Mine | |
| Technical Report NI 43- 101 – November 5, 2018 | Page 14-2 |
Table 14-2 shows the drill hole data that was collected and is available in the databases for each project. From these databases, the necessary information is prepared for Mineral Resource estimation (modelling, compositing, etc.).
TABLE 14-2 DRILL HOLE DATA COLLECTION USED FOR RESOURCES
ESTIMATION
| Diamond Drill | Reverse Circulation | |||||
| Pit | Holes | (m) | Intervals* | Holes | (m) | Samples |
| Koolhoven | 838 | 117,282 | 77,893 | 9 | 1278 | 639 |
| J Zone | 456 | 65,147 | 43,195 | 5,157 | 234,741 | 101,372 |
| Pay Caro | 1,274 | 214,829 | 152,629 | 6,722 | 337,864 | 159,166 |
| Mayo | 1,004 | 156,985 | 104,388 | 5,357 | 211,532 | 92,396 |
| Roma | 290 | 44,343 | 31,956 | 3,991 | 192,761 | 62,174 |
| Royal Hill | 1,087 | 164,528 | 117,298 | 3,920 | 178,768 | 76,373 |
| Rosebel | 806 | 107,713 | 71,766 | 6,640 | 320,660 | 150,618 |
| ETR | 90 | 12,078 | 8,424 | - | - | - |
| Overman | 250 | 32,167 | 21,810 | - | - | - |
| Mama Kreek | 118 | 11,461 | 15,779 | 25 | 1,677 | 1,086 |
| Total | 6,213 | 926,533 | 645,138 | 31,821 | 1,479,281 | 648,491 |
* Note: some intervals do not have assays results due to core loss or equivalent.
The drill hole database contains information including: collar information, downhole deviation surveys, gold assays, multi-elements-ICP assays, lithological descriptions, alteration, structural data, mineralization, major textures, specific gravity measurements, and vein descriptions.
The GEMS database validation routines were applied to the resource database. No errors were detected in the data tables. Based on this assessment, and the checks described in Section 12, it is the QP’s opinion that the drill hole database is appropriate to form the basis of the Mineral Resource estimate for the Rosebel Gold Mine.
| 14.2.2 |
GEOLOGICAL INTERPRETATION AND MODELLING |
Geologic modelling work is completed using the GEMS software package.
The main lithologies, structural elements, weathering profiles, and ore zone models of each deposit are constructed using 3D outlines created on 25 m evenly spaced cross sections. The weathering profiles, which include saprolite, transition, and rock are determined using geotechnical measurements taken on the core by the geotechnicians and geologists. The laterite profile is determined using geological observations of the core samples by the geologists and from the topography; it is generally modelled as a layer thinner than 5 m.
| IAMGOLD Corporation - Rosebel Gold Mine | |
| Technical Report NI 43- 101 – November 5, 2018 | Page 14-3 |
Ore zone modelling is strongly guided by a project’s geological model and refers to lithological units, structural, and deformation constraints. Generally, ore zone envelopes are drawn from drill data assays which carry a gold content higher than 0.3 g/t Au. Ore zones must be at least 4 m thick in saprolite and at least 5 m thick in transition and rock; except for the Mayo deposit where a 3 m minimum thickness may occur in some areas. From the 3D rings drawn on the sections, surfaces and solids are built and validated. For deposits with production data available (Koolhoven, Pay Caro, J Zone, Mayo, Roma, Rosebel, and Royal Hill), the ore zone modelling might also consider blast hole results for geometrical purposes. The ore zone model for the Northern deposits (KH, JZ, PC, and ETR) is presented in Figure 14-1.
| IAMGOLD Corporation - Rosebel Gold Mine | |
| Technical Report NI 43- 101 – November 5, 2018 | Page 14-4 |
![]()
| IAMGOLD Corporation - Rosebel Gold Mine | |
| Technical Report NI 43- 101 – November 5, 2018 | Page 14-5 |
| 14.2.3 |
SPECIFIC GRAVITY |
In-situ bulk density samples are taken from DD holes for each weathering type (laterite, saprolite, transition, and rock) and for specific lithology units in each project. The density is calculated by the RGM laboratory by using the wax method for soft and transitional material.
Over 18,000 specific gravity measurements were used to assign densities for the various rock types and alteration profiles. Table 14-3 presents the in-pit average densities, by material type, for the actual resources.
TABLE 14-3 RGM RESOURCES – BULK DENSITY DATA
| Average Resources density by material type | ||||
| Pit | Laterite | Saprolite | Transition | Hard Rock |
| Koolhoven/Bigi | 1.73 | 1.74 | 2.29 | 2.70 |
| J Zone | 1.73 | 1.73 | 2.32 | 2.71 |
| Pay Caro | 1.68 | 1.79 | 2.35 | 2.78 |
| Mayo | 1.73 | 1.73 | 2.23 | 2.74 |
| Roma East | 1.72 | 1.76 | 2.34 | 2.69 |
| Roma West | 1.73 | 1.74 | 2.29 | 2.70 |
| Royal Hill | 1.71 | 1.70 | 2.35 | 2.78 |
| Rosebel | 1.67 | 1.76 | 2.36 | 2.70 |
| Overman | 1.87 | 1.72 | 2.30 | 2.66 |
| East Tailings Road | 1.73 | 1.79 | 2.31 | 2.79 |
| Mama Kreek | 1.66 | 1.71 | 2.30 | 2.80 |
| 14.2.4 |
COMPOSITING, STATISTICS, AND CAPPING |
| 14.2.4.1 |
NOT-UPDATED BLOCK MODELS |
Three metre composites are generated from DD hole uncapped assays for ETR, MK, and OV.
The choice of composite length is mainly based on the following criteria: height of mining bench, ore zone thickness, length of assays, and reconciliation with production numbers. All composites are constrained within the ore zone and laterite solids first, and secondly, within the lithology and weathering solid limits. Poorly representative composites are not taken into consideration for resource estimation. These can include composites which are missing more than 50% of assays and/or where the composites that are less than 1 m (for 5 m composites) or 0.6 m (for 3 m composites). The smaller composites have possibly been created at the end of a solid interval or at the bottom of a hole. They are discarded from the composite data set.
| IAMGOLD Corporation - Rosebel Gold Mine | |
| Technical Report NI 43- 101 – November 5, 2018 | Page 14-6 |
The Mamakreek deposit differs from that last rule on the minimum length of a composite. In order to ensure representative composites, if the last interval is less than the composite length, the composite length is adjusted to make all intervals equal. For this deposit, all composites, constrained in the ore zones, are used unless they are missing more than 50% of the assays.
| 14.2.4.2 |
UPDATED BLOCK MODELS |
For DD holes, 3 m composites are created based on capped assays. Composites are created from collars to toes respecting the Ore zone contacts. For RC holes, 2 m assays are not composited.
The composite length of a DD hole is selected to approximately align with the volume of 2 m RC hole samples. The DD hole composite interval is assigned a null value if non-null samples account for less than 20% of its length (i.e. 0.6 m).
| 14.2.5 |
STATISTICS COMPOSITES |
Gold grade statistics, from the set of composites, are calculated using GEMS Geostatistical module or GSlib-type software. Statistics for raw assays and composites, used during estimation, are presented in Table 14-4 for RC holes and Table 14-5 for DD and exploration RC hole data used. The two limits (High Grade Limit and High Grade Transition Limit) that are used in the treatment of high grade results (see Section 13 - Ongoing Test Work for details) during resource estimation are determined from these statistics. The first one, the High Grade Limit, corresponds to outliers observed in histogram plots. The second one, the High Grade Transition Limit, corresponds to inflection points representing different grade domains on the curve of cumulative probability plots.
TABLE 14-4 GRADE CONTROL REVERSE
CIRCULATION DRILLING - ASSAYS
STATISTICS
| Pit | Type | Capping applied to |
Capped at |
Number | Capped n (%) |
Raw Mean |
Raw SD | Cap Mean |
Cap SD. |
| Raw Assays | 100,178 | 0.454 | 2.993 | 0.403 | 1.041 | ||||
| KH-J Zone | |||||||||
| Composites | Assays | 12 | 100,178 | 0.26 | 0.496 | 1.149 | |||
| Raw Assays | 147,087 | 0.278 | 1.969 | 0.26 | 0.69 | ||||
| Pay Caro | |||||||||
| Composites | Assays | 12 | 147,087 | 0.08 | 0.258 | 0.66 | |||
| Raw Assays | 92,386 | 0.402 | 2.464 | 0.365 | 0.986 | ||||
| Mayo | |||||||||
| Composites | Assays | 12 | 92,386 | 0.23 | 0.365 | 0.986 |
| IAMGOLD Corporation - Rosebel Gold Mine | |
| Technical Report NI 43- 101 – November 5, 2018 | Page 14-7 |
| Pit | Type | Capping applied to |
Capped at |
Number | Capped n (%) |
Raw Mean |
Raw SD |
Cap Mean |
Cap SD. |
| Roma - | Raw Assays | 48,143 | 0.225 | 1.95 | 0.194 | 0.641 | |||
| East | Composites | Assays | 10 | 48,143 | 0.17 | 0.25 | 1.95 | ||
| Roma - | Raw Assays | 14,030 | 0.395 | 2.177 | 0.33 | 0.937 | |||
| West | Composites | Assays | 9 | 14,030 | 0.46 | 0.354 | 1.2 | ||
| Raw Assays | 76,373 | 0.37 | 2.426 | 0.317 | 1.03 | ||||
| Royal Hill | |||||||||
| Composites | Assays | 11 | 76,373 | 0.37 | 0.317 | 1.03 | |||
| Raw Assays | 110,028 | 0.463 | 6.39 | 0.403 | 1.07 | ||||
| Rosebel | |||||||||
| Composites | Assays | 10 | 110,028 | 0.4 | 0.403 | 1.07 |
TABLE 14-5 DIAMOND DRILL HOLE AND
EXPLORATION REVERSE
CIRCULATION DRILLING - ASSAY STATISTICS
| Pit | Type | Capping applied to |
Comps Length (m) |
Capped at |
Number | Capped n (%) |
Raw Mean |
Raw SD |
Cap Mean |
Cap SD |
| Raw Assays | - | 109,994 | - | 0.206 | 1.335 | 0.195 | 0.927 | |||
| KH-J Zone | ||||||||||
| Composites | Assays | 3 | 22 | 53,323 | 0.07 | 0.197 | 0.693 | |||
| Pay Caro | Raw Assays | - | 159,378 | - | 0.26 | 1.638 | 0.234 | 0.898 | ||
| Composites | Assays | 3 | 11 | 74,369 | 0.29 | 0.239 | 0.72 | |||
| Mayo | Raw Assays | - | 104,388 | 0.22 | 4.45 | 0.182 | 0.815 | |||
| Composites | Assays | 3 | 16 | 50,751 | 0.19 | 0.186 | 0.63 | |||
| Roma - East | Raw Assays | - | 12,917 | - | 0.092 | 0.864 | 0.085 | 0.499 | ||
| Composites | Assays | 3 | 20 | 6,090 | 0.05 | 0.085 | 0.36 | |||
| Roma - | ||||||||||
| West | Raw Assays | - | 19,096 | 0.153 | 1.992 | 0.126 | 0.797 | |||
| Composites | Comps | 3 | 20 | 8,882 | 0.1 | 0.125 | 0.564 | |||
| Royal Hill | Raw Assays | - | 113,690 | - | 0.265 | 3.312 | 0.227 | 1.171 | ||
| Composites | Assays | 3 | 20 | 52,748 | 0.21 | 0.228 | 0.834 | |||
| Rosebel | Raw Assays | - | 71,458 | - | 0.224 | 1.542 | 0.206 | 0.907 | ||
| Composites | Assays | 3 | 18 | 35,487 | 0.11 | 0.207 | 0.664 | |||
| ETR | Raw Assays | - | 1,685 | 0.61 | 11.11 | |||||
| Composites | Comps | 3 | 9** | 1,081 | 0.55 | 0.45 | 2.04 | |||
| Overman | Raw Assays | - | 3,927 | - | 0.73 | 6.36 | ||||
| Composites | Comps | 5 | 6** | 1,136 | 0.44 | 0.63 | 1.27 | |||
| Mama Kreek | Raw Assays | - | 2,130 | 0.35 | 5.35 | |||||
| Varying | ||||||||||
| Composites | Assays | 3 | (1 to 6) | 1,037 | 0.26 | 0.64 |
* Laterite composites were capped at 3 g/t ** Laterite composites were capped at 4 g/t SD – Standard Deviation
| IAMGOLD Corporation - Rosebel Gold Mine | |
| Technical Report NI 43- 101 – November 5, 2018 | Page 14-8 |
| 14.2.6 |
BLOCK MODEL PARAMETERS |
For each pit, block models are created and interpolated using the GEMS software package for the not updated block models while interpolation was run using GSLib-style scripts for the newly updated models. Block size properties and extensions are selected to cover all the interpreted Ore zones and in accordance with RGM mining equipment and practices. Block model properties are presented in Table 14-6.
All block models are coded for Lithologies, Alterations (Weathering), and Ore zones (mineralized area) using a unique rock code assigned when at least 50% of the blocks are located inside a solid.
TABLE 14-6 BLOCK MODELS PROPERTIES
| Origin | Size | Number of block | ||||||||
| Pit | X | Y | Z | Orient.* | Column | Row | Level | Column | Row | Level |
| KH-JZ | 46,181 | 88,486 | 670 | -18 | 10 | 4 | 4 | 500 | 413 | 144 |
| Pay Caro | 47,335 | 86,843 | 700 | -18 | 10 | 4 | 4 | 400 | 492 | 175 |
| Mayo | 42,600 | 80,400 | 580 | 0 | 10 | 4 | 5 | 370 | 393 | 116 |
| Roma-East | 47,300 | 81,050 | 602 | 0 | 10 | 4 | 4 | 150 | 313 | 138 |
| Roma-West | 46,575 | 80,643 | 602 | 30 | 10 | 5 | 6 | 140 | 220 | 91 |
| Royal Hill | 48,650 | 80,400 | 580 | 0 | 10 | 4 | 4 | 310 | 550 | 150 |
| Rosebel | 56,800 | 80,700 | 598 | 0 | 10 | 4 | 6 | 425 | 369 | 100 |
| ETR | 51,766 | 85,533 | 700 | -18 | 10 | 4 | 4 | 140 | 175 | 150 |
| Overman | 47,367 | 102,657 | 620 | -26 | 10 | 5 | 5 | 400 | 165 | 60 |
| Mama Kreek | 57,000 | 86,250 | 650 | -15 | 10 | 5 | 6 | 313 | 240 | 100 |
* Using Gems ZXZ rotation system
| 14.2.7 |
NOT-UPDATED BLOCK MODELS |
Block models for East Tailing Road (ETR), Overman, (OV), and Mama Kreek (MK) were not updated recently. The last block model updates for these deposits vary from 2014 to 2017. It was considered appropriate to not update these block models as no major new drilling was completed nor was mining information added to these deposits.
Interpolations are performed in GEMS software using a conventional anisotropic ID3 interpolation. The Au grade estimates are generally generated from 5 m composites (OV) or 3 m composites (ETR, and MK). To avoid smearing gold grades from one mineralized zone to another or into the host rock, geologic and mineralized contacts were considered as hard boundaries.
| IAMGOLD Corporation - Rosebel Gold Mine | |
| Technical Report NI 43- 101 – November 5, 2018 | Page 14-9 |
A three pass interpolation strategy is performed with relaxing search parameters. The first pass ellipse size was generally about 50 m in the two main directions and 25 m in the minor direction. The second pass is selected as 75 m in the major and the intermediate direction and as 37.5 m in the minor direction. The third pass is set as the double of the second pass. Ellipsoid directions were orientated according to the interpreted mineralized ore zones or the main grade orientation (ore shoot). A spherical search method is preferred to interpolate for:
| • | Lateritic part of each deposit to follow the original topography of the deposit. | |
| • | ETR deposit due to the folding shapes of the ore zones. |
Interpolation is performed using ID3, with a maximum number of composites varying by pit from 12 to 20 in order to control smoothing. For each pass, the minimum number of composite is decreased to increase the number of blocks estimated. A maximum of two or three composites, from the same hole, is set to limit grade smearing. The parameters used to estimate gold grade in the block models are shown in Table 14-7.
TABLE 14-7 DETAILED BLOCK MODEL PARAMETERS.
| Interpolation parameters - ID3 | |||||||
| Composites | Ellipse average ranges | ||||||
| Min | Max | Restricting | |||||
| Pit | (Pass1- | Max | per | search | Pass1 | Pass2 | Pass3 |
| P2-P3) | hole | grade | |||||
| ETR | 1 - 5 - 8 | 20 | 3 | None | 50/50/50 | 75/75/75 | 150/150/150 |
| Overman | 1 - 3 - 5 | 12 | 3 | None | 50/20/50 | 75/25/75 | 150/50/150 |
| Mama Kreek | 1 - 4 - 7 | 20 | 3 | None | 50/25/50 | 75/37.5/75 | 150/75/150 |
| 14.2.8 |
UPDATED BLOCK MODELS |
Koolhoven (KH), J Zone (JZ), Pay Caro (PC), Rosebel (RB), Royal Hill (RH), Roma West (RMW), Roma East (RME) and Mayo (MA) were updated with the latest drilling and mining information; databases were closed as of December 31, 2017. For these deposits, the interpolation approach was developed with support from Clayton V. Deutsch Consultants Ltd (CVDC), an independent consulting firm based in Edmonton, Alberta (Canada).
| IAMGOLD Corporation - Rosebel Gold Mine | |
| Technical Report NI 43- 101 – November 5, 2018 | Page 14-10 |
The same geostatistical approach developed during previous estimate (NI43-101, September 5th, 2017) was used, consisting of a kriging or co-kriging of panel followed by a Localized Uniform Conditioning (LUC) support correction. These well-known geostatistical methods were used in an effort to better reflect the production reconciliation history of RGM and to incorporate new RC exploration and definition holes drilled since 2015.
In addition to the lithological and alteration (weathering) interpretation, a new sub-model was created to reflect the two different data types (DD and RC) and data spacing: grade control tight spacing (generally at 10 m by 5 m or 12 m by 6 m) and exploration-definition relatively sparse spacing (generally around 50 m by 50 m). In this approach all blocks were interpolated (inside and outside Ore zones). A total of five different geostatistical domains were defined and used for interpolation.
| • | Model 1 includes blocks within approximately 12 m from RC grade control data. These holes are generally shallow (40 m to 70 m deep) and as such represent only the upper portion of the new resources. | |
| • | Model 2 includes blocks situated within the Ore zones and at a maximum distance of 20 m from RC holes. | |
| • | Model 3 includes blocks located outside of the Ore zones and at a maximum distance of 5 m from RC holes. | |
| • | Model 4 includes blocks situated within the Ore zones not within the 20 m buffer from RC holes (model 2). | |
| • | Model 5 includes all other blocks at a maximum distance of 200 m to Ore zones or hole. |
Although the vast majority of the blocks were flagged as model 5, model 5 represents only a negligible percentage of the resources (metal) above cut-off. Most blocks classified as model 5 are either not classified or assigned the Inferred category. Most of the metal is within model 1 (grade control area) and model 4 (within interpreted Ore zones wireframes).
In order to take into consideration the two different types of data at different positions (heterotopic), an Ordinary Co-Kriged (OCK) interpolation was performed using RC hole assays (2 m) and DD hole composites (3 m). As RC holes returned possibly more consistent grade than DD holes, a trend model was first built using a moving windows average method for models 1, 2, and 3; this trend model emphasized the RC holes compared to the DD holes.
The OCK was performed using a minimum of one and a maximum of data points varying between 12 and 64, although an ellipse size is selected in order to ensure that virtually all blocks were estimated with 12 composites. Table 14-8 presents the estimation parameters used during interpolation.
| IAMGOLD Corporation - Rosebel Gold Mine | |
| Technical Report NI 43- 101 – November 5, 2018 | Page 14-11 |
TABLE 14-8 ESTIMATION PARAMETERS USED DURING INTERPOLATION
Model 1, 2, 3
| Parameter | MA | RB | RH | RMW | PC | JZ-KH |
| DDH Cap | 12 | 10 | 11 | 16 | 10 | 12 |
| Secondary search | Y | Y | Y | Y | Y | Y |
| Secondary cap | 7 | 5 | 5 | 11 | 2 | 5 |
| Secondary radius | 6 | 8 | 6 | 5 | 4 | 8 |
| Use trend | Y | Y | y | Y | Y | Y |
| Max data for kriging | 12 | 24 | 24 | 12 | 12 | 12 |
| Enforce panel grades in LUC | Y | N | N | N | N | N |
| SMU X,Y,Z | 6,5,4 | 8,5,8 | 8,8,4 | 8,8,6 | 6,5,4 | 6,5,4 |
| Nugget Effect (Model 1) | 0.6 | 1 | 1 | 0.6 | 0.5 | 0.5 |
| Nugget Effect (Model 2) | 0.6 | 1 | 1 | 0.6 | 0.45 | 0.5 |
| Nugget Effect (Model 3) | 0.6 | 1 | 1 | 0.6 | 1 | 1 |
Model 4 and 5
| Parameter | MA | RB | RH | RMW | PC | JZ-KH |
| DDH Cap | 16 | 25 | 20 | 20 | 11 | 22 |
| Secondary search | N | N | N | Y | N | N |
| Secondary cap | 20 | 10 | ||||
| Secondary radius Use trend | N | N | N | 20 Y | 10 Y | N |
| Max data for kriging (Model 4) | 12 | 48 | 48 | 64 | 48 | 12 |
| Max data for kriging (Model 5) | 12 | 12 | 12 | 36 | 12 | 12 |
| Enforce panel grades in LUC | Y | N | N | Y | N | N |
| SMU X,Y,Z | 10,10,8 | 8,5,8 | 8,8,4 | 10,10,6 | 10,8,8 | 10,6,4 |
| Nugget Effect (Model 4) | 0.4 | 1 | 1 | 0.3 | 0.3 | 0.2 |
| Nugget Effect (Model 5) | 0.2 | 0 | 0 | 0.3 | 0 | 0 |
Kriging is applied to panels of 40 m by 40 m by level height (4 m to 6 m as reported in the block property table). Localized Uniform Conditioning (LUC) is then performed using an effective SMU size of 6 m by 5 m by 4 m for MA, RH, RME, PC, JZ, KH, 8 m by 5 m by 8 m for RB and 10 m by 10 m by 8 m for RMW.
| IAMGOLD Corporation - Rosebel Gold Mine | |
| Technical Report NI 43- 101 – November 5, 2018 | Page 14-12 |
In order to perform OCK, a set of three different variograms were produced: one for RC holes only, one for DD holes only, and one cross-variogram for combined RC-DD data. The variography exercise was performed on back-transformed Normal Score experimental variograms. 3D variogram models are fitted in three directions (major, semi-major, and minor) following the geological understanding. Examples of variogram models used at Rosebel, Royal Hill, and Pay Caro for model 4 (DDH only) are presented in Figure 14-2.
| IAMGOLD Corporation - Rosebel Gold Mine | |
| Technical Report NI 43- 101 – November 5, 2018 | Page 14-13 |
FIGURE 14-2 DDH VARIOGRAM MODELS USED FOR MODEL 4
![]()
| IAMGOLD Corporation - Rosebel Gold Mine | |
| Technical Report NI 43- 101 – November 5, 2018 | Page 14-14 |
| 14.2.9 |
BLOCK MODEL VALIDATION |
As part of the validation process, a number of different interpolation runs were completed using various search strategy, number of composites, and alternative capping values. Alternative interpolation methods (Inverse Distance Squared, Ordinary Kriging, and Uniform Conditioning) were also used. The results of these runs were visually, statistically, and graphically compared (grade tonnage curves).
Other validation steps included:
| • |
Comparison of the 3D volumes and block model volumes; | |
| • |
Comparison of the basic statistics for assays, composites, and block model for each domain; | |
| • |
Verification of rock code flagging in block model attributes for consistency with 3D wireframes; | |
| • |
Visual check of variogram orientation along known geological features; | |
| • |
Naïve Cross-validation (block grade compared to input conditioning data); | |
| • |
Cumulative distribution function comparison of LUC to DGM methodology; | |
| • |
Comparison with previous grade control production data; | |
| • |
Visual check of the block and composite grades in plans and sections view. |
Swath plots were compiled on vertical sections and plan views to check the consistency of the interpolation. For the updated block models, values were compared with cell-declustered data, Nearest Neighbour model (NN). No pits were used to constrain the data as swath plots are designed to check the overall quality of an estimate.
Figure 14-3 presents the swath plots for the Royal Hill block model. In general, the LUC model is shown to reproduce the overall trend of the declustered data. The declustered data is more variable due to the relatively limited amount of data that occurs in some bins (particularly near the edges of each plot), however, its overall trends are well reproduced.
| IAMGOLD Corporation - Rosebel Gold Mine | |
| Technical Report NI 43- 101 – November 5, 2018 | Page 14-15 |
FIGURE 14-3 SWATH PLOTS FOR ROYAL HILL BLOCK MODEL
![]()
| IAMGOLD Corporation - Rosebel Gold Mine | |
| Technical Report NI 43- 101 – November 5, 2018 | Page 14-16 |
| 14.2.10 |
WHITTLE OPTIMIZATION |
Conceptual mining parameters used to generate the Mineral Resource (Whittle) shells for the various RGM deposits are presented in Section 15.
| 14.2.11 |
CLASSIFICATION |
The Mineral Resources estimations for all projects are classified according to the CIM definitions. Detailed parameters used in the estimation of each resource category are presented in Table 14-6.
| • |
Measured. Blocks estimated using grade control data (model 1) were classified as Measured; blocks inside a 5 m by 10 m or 6 m by 12 m drill hole spacing pattern. | |
| • |
Indicated. All blocks from modelss 2 and 3 were coded as Indicated, as they are within 5 and 20 m respectively from an RC hole. Blocks from model 4 were classified as indicated if a minimum of four data points from a minimum of two different holes were found within an ellipsoid of 75-50- 25 m. | |
| • |
Inferred. Blocks from models 4 and 5 were classified as inferred if at least one assay (RC or DDH) was found within an ellipsoid of 100-50-25 m. |
| 14.2.12 |
MINERAL RESOURCE REPORTING |
Excluding the Saramacca deposit, the Mineral Resource estimate at September 1, 2018 is 295 Mt at an average grade of 0.9 g/t Au, containing 8.513 Moz in the Measured and Indicated category. There is an additional 65 Mt at an average grade of 0.9 g/t Au, containing 1.789 Moz in the Inferred category.
Table 14-9 presents the Mineral Resource estimation at RGM as of September 1, 2018. This Mineral Resource is estimated within pit shells optimized at a US$1,500/oz Au price and corresponding cut-off grades and includes the Measured, Indicated, and Inferred Mineral Resource categories. A volumetric analysis using GEMS is performed to determine the tonnage and grade of the Measured, Indicated, and Inferred Mineral Resources (MI+I) inside each of these shells. The stockpile inventory is classified as Measured and is included in the total.
The consolidated RGM Mineral Resource Statement is presented in Table 14-1.
| IAMGOLD Corporation - Rosebel Gold Mine | |
| Technical Report NI 43- 101 – November 5, 2018 | Page 14-17 |
TABLE 14-9 RMD
MEASURED, INDICATED, AND INFERRED
MINERAL RESOURCE ESTIMATION AS OF
SEPTEMBER 1, 2018
Rosebel Gold Mines N.V. - 100%
Basis
Measured Mineral Resources
- September 1st, 2018
(Inside pit shell)
$1,500 / ounce
Deposit |
Cut-off Grade (g/t Au) | Laterite | Saprolite | Transition | Rock | Total | ||||||||||||
| Laterite & | Transition | Hard Rock | Tonnes | Au | Au | Tonnes | Au | Au | Tonnes | Au | Au | Tonnes | Au | Au | Tonnes | Au | Au | |
| Saprolite | (000) | (g/t) | (000 oz) | (000) | (g/t) | (000 oz) | (000) | (g/t) | (000 oz) | (000) | (g/t) | (000 oz) | (000) | (g/t) | (000 oz) | |||
| Koolhoven/Bigi | 0.18 | 0.23 | 0.34 | - | - | - | - | - | - | - | - | - | - | - | - | - | - | - |
| J Zone | 0.18 | 0.23 | 0.34 | 16 | 0.5 | 0 | 37 | 0.4 | 0 | 2,572 | 0.7 | 54 | 3,222 | 0.9 | 91 | 5,847 | 0.8 | 146 |
| Pay Caro & East Pay Caro | 0.17 | 0.23 | 0.34 | 22 | 0.3 | 0 | 373 | 0.4 | 4 | 2,451 | 0.5 | 37 | 1,757 | 0.7 | 38 | 4,603 | 0.5 | 79 |
| Mayo | 0.18 | 0.23 | 0.34 | - | - | - | 3 | 0.5 | 0 | 54 | 0.6 | 1 | 1,485 | 0.7 | 34 | 1,542 | 0.7 | 35 |
| Roma West | 0.18 | 0.24 | 0.35 | - | - | - | 96 | 0.4 | 1 | 284 | 0.4 | 4 | 751 | 0.7 | 16 | 1,131 | 0.6 | 21 |
| Royal Hill | 0.19 | 0.23 | 0.34 | - | - | - | 81 | 0.4 | 1 | 230 | 0.5 | 4 | 2,741 | 0.8 | 74 | 3,052 | 0.8 | 79 |
| Rosebel | 0.20 | 0.25 | 0.36 | 2 | 0.3 | 0 | 342 | 0.4 | 4 | 285 | 0.5 | 5 | 1,609 | 0.9 | 44 | 2,238 | 0.7 | 53 |
| TOTAL | 39 | 0.4 | 0 | 932 | 0.4 | 11 | 5,877 | 0.6 | 105 | 11,565 | 0.8 | 296 | 18,413 | 0.7 | 413 | |||
| Stockpiles | 15,803 | 0.6 | 283 | |||||||||||||||
| GRAND TOTAL | Measured Resources | 39 | 0.4 | 0 | 932 | 0.4 | 11 | 5,877 | 0.6 | 105 | 11,565 | 0.8 | 296 | 34,216 | 0.6 | 696 | ||
Indicated Mineral
Resources - September 1st,
2018 (Inside pit shell)
$1,500 / ounce
| Cut-off Grade (g/t Au) | Laterite | Saprolite | Transition | Rock | Total | |||||||||||||
| Deposit | Laterite & | Transition | Hard Rock | Tonnes | Au | Au | Tonnes | Au | Au | Tonnes | Au | Au | Tonnes | Au | Au | Tonnes | Au | Au |
| Saprolite | (000) | (g/t) | (000 oz) | (000) | (g/t) | (000 oz) | (000) | (g/t) | (000 oz) | (000) | (g/t) | (000 oz) | (000) | (g/t) | (000 oz) | |||
| Koolhoven/Bigi | 0.18 | 0.23 | 0.34 | 98 | 0.5 | 2 | 439 | 0.5 | 7 | 12,227 | 0.6 | 246 | 17,223 | 1.0 | 542 | 29,987 | 0.8 | 797 |
| J Zone | 0.18 | 0.23 | 0.34 | 259 | 0.6 | 5 | 708 | 0.6 | 14 | 3,994 | 0.6 | 79 | 13,555 | 0.9 | 404 | 18,517 | 0.8 | 501 |
| Pay Caro & East Pay Caro | 0.17 | 0.23 | 0.34 | 142 | 0.5 | 2 | 1,495 | 0.4 | 20 | 4,458 | 0.6 | 88 | 71,227 | 1.0 | 2,315 | 77,321 | 1.0 | 2,425 |
| Mayo | 0.18 | 0.23 | 0.34 | 58 | 0.5 | 1 | 1,439 | 0.5 | 24 | 1,321 | 0.6 | 26 | 22,012 | 1.0 | 680 | 24,830 | 0.9 | 731 |
| Roma West | 0.18 | 0.24 | 0.35 | 2 | 0.3 | 0 | 154 | 0.5 | 2 | 102 | 0.7 | 2 | 792 | - | 24 | 1,051 | 0.8 | 28 |
| Royal Hill | 0.19 | 0.23 | 0.34 | 90 | 0.6 | 2 | 2,301 | 0.6 | 47 | 2,691 | 0.7 | 57 | 71,631 | 1.0 | 2,320 | 76,713 | 1.0 | 2,425 |
| Rosebel | 0.20 | 0.25 | 0.36 | 147 | 0.5 | 2 | 3,120 | 0.5 | 50 | 4,042 | 0.6 | 79 | 25,379 | 1.0 | 777 | 32,689 | 0.9 | 908 |
| TOTAL | 796 | 0.5 | 13 | 9,656 | 0.5 | 164 | 28,836 | 0.6 | 577 | 221,820 | 1.0 | 7,062 | 261,108 | 0.9 | 7,817 | |||
Measured and Indicated
Mineral Resources - September
1st, 2018 (Inside pit
shell)
$1,500 / ounce
| Cut-off Grade (g/t Au) | Laterite | Saprolite | Transition | Rock | Total | |||||||||||||
| Deposit | Laterite & | Transition | Hard Rock | Tonnes | Au | Au | Tonnes | Au | Au | Tonnes | Au | Au | Tonnes | Au | Au | Tonnes | Au | Au |
| Saprolite | (000) | (g/t) | (000 oz) | (000) | (g/t) | (000 oz) | (000) | (g/t) | (000 oz) | (000) | (g/t) | (000 oz) | (000) | (g/t) | (000 oz) | |||
| Koolhoven/Bigi | 0.18 | 0.23 | 0.34 | 98 | 0.5 | 2 | 439 | 0.5 | 7 | 12,227 | 0.6 | 246 | 17,223 | 1.0 | 542 | 29,987 | 0.8 | 797 |
| J Zone | 0.18 | 0.23 | 0.34 | 275 | 0.6 | 5 | 745 | 0.6 | 14 | 6,566 | 0.6 | 133 | 16,777 | 0.9 | 495 | 24,363 | 0.8 | 648 |
| Pay Caro & East Pay Caro | 0.17 | 0.23 | 0.34 | 164 | 0.4 | 2 | 1,868 | 0.4 | 25 | 6,910 | 0.6 | 125 | 72,984 | 1.0 | 2,352 | 81,925 | 1.0 | 2,504 |
| Mayo | 0.18 | 0.23 | 0.34 | 58 | 0.5 | 1 | 1,442 | 0.5 | 24 | 1,375 | 0.6 | 27 | 23,497 | 0.9 | 714 | 26,372 | 0.9 | 766 |
| Roma West | 0.18 | 0.24 | 0.35 | 2 | 0.3 | 0 | 251 | 0.4 | 3 | 387 | 0.5 | 6 | 1,543 | 0.8 | 39 | 2,182 | 0.7 | 49 |
| Royal Hill | 0.19 | 0.23 | 0.34 | 90 | 0.6 | 2 | 2,382 | 0.6 | 48 | 2,921 | 0.6 | 61 | 74,372 | 1.0 | 2,394 | 79,765 | 1.0 | 2,504 |
| Rosebel | 0.20 | 0.25 | 0.36 | 149 | 0.5 | 2 | 3,462 | 0.5 | 54 | 4,328 | 0.6 | 84 | 26,988 | 0.9 | 821 | 34,927 | 0.9 | 962 |
| TOTAL | 835 | 0.5 | 14 | 10,588 | 0.5 | 175 | 34,713 | 0.6 | 682 | 233,385 | 1.0 | 7,358 | 279,521 | 0.9 | 8,230 | |||
| Stockpiles | 15,803 | 0.6 | 283 | |||||||||||||||
| GRAND TOTAL | M+I Resources | 835 | 0.5 | 14 | 10,588 | 0.5 | 175 | 34,713 | 0.6 | 682 | 233,385 | 1.0 | 7,358 | 295,324 | 0.9 | 8,513 | ||
| IAMGOLD Corporation - Rosebel Gold Mine | |
| Technical Report NI 43- 101 – November 5, 2018 | Page 14-18 |
Inferred Mineral Resources
- September 1st, 2018
(Inside pit shell)
$1,500 / ounce
| Cut-off Grade (g/t Au) | Laterite | Saprolite | Transition | Rock | Total | |||||||||||||
| Deposit | Laterite & | Transition | Hard Rock | Tonnes | Au | Au | Tonnes | Au | Au | Tonnes | Au | Au | Tonnes | Au | Au | Tonnes | Au | Au |
| Saprolite | (000) | (g/t) | (000 oz) | (000) | (g/t) | (000 oz) | (000) | (g/t) | (000 oz) | (000) | (g/t) | (000 oz) | (000) | (g/t) | (000 oz) | |||
| Koolhoven/Bigi | 0.18 | 0.23 | 0.34 | 97 | 0.4 | 1 | 309 | 0.4 | 4 | 1,319 | 0.7 | 27 | 5,619 | 0.9 | 165 | 7,344 | 0.8 | 197 |
| J Zone | 0.18 | 0.23 | 0.34 | 119 | 0.3 | 1 | 256 | 0.3 | 2 | 679 | 0.5 | 11 | 2,257 | 0.9 | 62 | 3,310 | 0.7 | 77 |
| Pay Caro & East Pay Caro | 0.17 | 0.23 | 0.34 | 205 | 0.3 | 2 | 1,845 | 0.4 | 22 | 1,188 | 0.5 | 19 | 6,792 | 0.9 | 193 | 10,030 | 0.7 | 236 |
| Mayo | 0.18 | 0.23 | 0.34 | 220 | 0.3 | 2 | 609 | 0.3 | 7 | 59 | 0.5 | 1 | 26 | 0.7 | 1 | 913 | 0.4 | 10 |
| Roma East | 0.00 | 0.00 | 0.00 | 51 | 0.5 | 1 | 575 | 0.6 | 11 | 1,030 | 0.8 | 25 | 769 | 1.0 | 25 | 2,425 | 0.8 | 62 |
| Roma West | 0.18 | 0.24 | 0.35 | 59 | 0.7 | 1 | 212 | - | 3 | 39 | - | 1 | 1 | 0.4 | 0 | 311 | 0.5 | 5 |
| Royal Hill | 0.18 | 0.23 | 0.34 | 333 | 0.4 | 4 | 3,210 | 0.4 | 38 | 850 | 0.5 | 13 | 15,064 | 1.0 | 499 | 19,458 | 0.9 | 555 |
| Rosebel | 0.20 | 0.25 | 0.36 | 171 | 0.5 | 3 | 1,185 | 0.4 | 17 | 474 | 0.5 | 7 | 10,023 | 1.0 | 308 | 11,853 | 0.9 | 334 |
| Overman | 0.25 | 0.30 | 0.50 | 450 | 0.5 | 8 | 163 | 0.7 | 4 | 220 | 0.7 | 5 | 5,760 | 1.3 | 232 | 6,594 | 1.2 | 248 |
| East Tailings Road | 0.21 | 0.26 | 0.41 | 51 | 0.4 | 1 | 693 | 0.5 | 12 | 1,061 | 0.9 | 30 | 234 | 1.9 | 14 | 2,038 | 0.9 | 56 |
| Mama Kreek | 0.21 | 0.25 | 0.39 | 276 | 0.5 | 4 | 494 | 0.7 | 11 | 107 | 0.8 | 3 | 1 | 0.9 | 0 | 877 | 0.6 | 17 |
| TOTAL | 2,033 | 0.4 | 28 | 9,550 | 0.4 | 129 | 7,026 | 0.6 | 142 | 46,545 | 1.0 | 1,499 | 65,154 | 0.9 | 1,798 | |||
| IAMGOLD Corporation - Rosebel Gold Mine | |
| Technical Report NI 43- 101 – November 5, 2018 | Page 14-19 |
| 14.2.13 |
ESTIMATION SENSITIVITY ASSESSMENT |
In order to examine the sensitivity of the Rosebel deposit to different gold prices, several nested pit shells at different prices were generated. The resources (Measured + Indicated + Inferred) were estimated inside the optimized Whittle pit shells. Shells were created at US$100/oz intervals estimated between US$1,000/oz Au and US$2,000/oz Au using the appropriate cut-off grades.
Whittle shells are used in sensitivity analysis as they indicate a pit size relative to gold price and can be generated quickly. They do not, however, take into account additional mining constraints such as minimum mining widths and practical mining access ramps that need to be accounted for in reality. Therefore the waste tonnage and strip ratios are higher in the final pit designs than in these sensitivity shells. The results of the sensitivity to gold price between US$1,000/oz Au and US$2,000/oz Au, for each deposit, are presented in Figure 14-4.
Globally, a US$100/oz increase in the gold price from the US$1,500/oz Whittle shell increases the resource ounces by 9%, while a US$100/oz decrease in the gold price decreases the resource ounces by 16%. The results of the sensitivity analyses are compiled in Figure 14-4, which shows the sensitivity of all pits to varying metal prices in percent ounces gained or lost (as compared to the US$1,500 Whittle shell).
| IAMGOLD Corporation - Rosebel Gold Mine | |
| Technical Report NI 43- 101 – November 5, 2018 | Page 14-20 |
FIGURE 14-4 PERCENTAGE
CHANGE IN OUNCES FOR THE RANGE OF GOLD
PRICES BETWEEN US$1,000 AND
US$2,000/OZ COMPARED TO THE
US$1,500/OZ AU PRICE
(Based on
MI+I Grade Inside Optimized Shells)
![]()
From Figure 14-4, it can be noted that a large negative or positive shift in the gold price will equally impact the deposit size in its respective direction.
| 14.2.14 |
COMPARISON WITH PREVIOUS ESTIMATES |
The present RGM Mineral Resource estimate is using a similar interpolation strategy as the last two resource disclosures (June 2017 and December 2017).
Table 14-10 presents the evolution of the Mineral Resources over the last five years. Overall, the present Mineral Resources are relatively equivalent in terms of ounces of gold content to the December 2017 resource estimate. Most of the difference is explained by mining depletion as well as changes in the economical parameter used for the Resource (Whittle) shell optimization. As a general trend, from 2012 to 2016, the decrease in Mineral Resources is mostly due to the decrease in the gold price and an increase in costs and mining depletion. In June 2017 a new estimation approach, as well as a new resource (whittle) shell optimization strategy resulted in an important increase in the Mineral Resources. The important increase in Inferred Mineral Resources in June 2017 represents potential new targets for definition drilling in order to convert the Inferred Mineral Resources to Indicated Mineral Resources.
| IAMGOLD Corporation - Rosebel Gold Mine | |
| Technical Report NI 43- 101 – November 5, 2018 | Page 14-21 |
TABLE 14-10 RGM PREVIOUS MINERAL RESOURCE ESTIMATES
| Measured + Indicated | Inferred | |||||
| Mt | Grade | M Oz | Mt | Grade | M Oz | |
| Dec-12 | 252.3 | 1.0 | 7.8 | 13.0 | 0.7 | 0.3 |
| Dec-13 | 232.3 | 1.0 | 7.5 | 14.4 | 0.7 | 0.3 |
| Dec-14 | 177.7 | 1.0 | 5.8 | 19.0 | 0.9 | 0.5 |
| Dec-15 | 199.6 | 1.0 | 6.3 | 22.5 | 0.9 | 0.6 |
| Dec-16 | 190.0 | 1.0 | 6.0 | 22.3 | 0.9 | 0.6 |
| Jun-17 | 307.1 | 0.9 | 9.3 | 84.9 | 1.0 | 2.7 |
| Dec-17 | 299.6 | 0.9 | 9.1 | 86.5 | 1.0 | 2.7 |
| Sep-18 | 295.3 | 0.9 | 8.5 | 65.1 | 0.9 | 1.8 |
| 14.3 |
SARAMACCA CONCESSION |
| 14.3.1 |
INTRODUCTION |
The Saramacca Mineral Resource Statement documented in this report represents the second Mineral Resource evaluation prepared for the Saramacca gold project in accordance with the NI 43-101.
The Mineral Resource model prepared by SRK considers results from an additional 172 DD holes for 41,861 m and four RC holes for 1,536 m drilled since the maiden Mineral Resource model was disclosed publicly by IAMGOLD in a news release on September 5, 2017. The data review and geological modelling reviews and modifications were performed by Mr. Dominic Chartier, P.Geo. (OGQ #874, APGO #2775). Grade estimation and associated sensitivity analyses, and Mineral Resource classification were performed by Dr. Oy Leuangthong, P.Eng. (PEO #90563867). Pit optimization review was conducted by Mr. Nicolas Szwedska P.Eng., a BBA open pit mining engineer. The overall process was reviewed by Mr. Glen Cole, P.Geo. (APGO #1416). Mr. Chartier and Dr. Leuangthong are independent Qualified Persons as this term is defined in NI 43-101. The effective date of the Mineral Resource Statement is September 13, 2018.
| IAMGOLD Corporation - Rosebel Gold Mine | |
| Technical Report NI 43- 101 – November 5, 2018 | Page 14-22 |
This section describes the resource estimation methodology and summarizes the key assumptions considered by SRK. In the opinion of SRK, the resource evaluation reported herein is a reasonable representation of the global gold Mineral Resources found in the Saramacca project at the current level of sampling. The Mineral Resources have been estimated in conformity with generally accepted CIM Estimation of Mineral Resources and Mineral Reserves Best Practice Guidelines (November 2003) and are reported in accordance with NI 43-101. Mineral Resources are not Mineral Reserves and have not demonstrated economic viability. There is no certainty that all or any part of the Mineral Resource will be converted into Mineral Reserve.
The database used to estimate the Saramacca gold project Mineral Resources was audited by SRK. SRK is of the opinion that the current drilling information is sufficiently reliable to interpret, with confidence, the boundaries for gold mineralization and that the assay data are sufficiently reliable to support Mineral Resource estimation.
Leapfrog Geo™ software (version 4.3.2) was used to construct the geological solids. SRK used a combination of GEOVIA GEMS™ (version 6.7.4), Leapfrog Geo™, GOCAD™, and GSLib™ software to prepare assay data for geostatistical analysis, construct the block model, estimate gold grades, and tabulate Mineral Resources
| 14.3.2 |
MINERAL RESOURCE ESTIMATION METHODOLOGY |
The evaluation of Mineral Resources for the Saramacca gold project involved the following procedures:
| • |
Database compilation and verification. | |
| • |
Construction of explicit wireframe models for major units, using stratigraphy, geological indices, and structural trends. | |
| • |
Definition and construction geostatistical Mineral Resource domains. | |
| • |
Data conditioning (compositing and capping) for geostatistical analysis and variography. | |
| • |
Selection of estimation strategy and estimation parameters. |
| IAMGOLD Corporation - Rosebel Gold Mine | |
| Technical Report NI 43- 101 – November 5, 2018 | Page 14-23 |
| • | Block modelling and grade interpolation. | |
| • | Validation, classification, and tabulation. | |
| • | Assessment of “reasonable prospects for eventual economic extraction” and selection of reporting assumptions. | |
| • | Preparation of the updated Mineral Resource Statement. |
The following sections summarize the methodology and assumptions made by SRK to construct the Mineral Resource model.
| 14.3.3 |
RESOURCE DATABASE |
IAMGOLD provided the resource database as comma-separated values (CSV) files. The header, down-hole survey, lithology intervals, and preliminary assay results were received on May 16, 2018. The final database for this updated resource estimate was received on May 22, 2018. The drilling database comprises 90 historical boreholes, 327 boreholes drilled by IAMGOLD’s SurEx group, and 66 boreholes drilled by IAMGOLD’s MinEx group. Included are 176 new boreholes since the maiden resource estimate disclosed on September 5, 2017. Historical boreholes were drilled by Golden Star (2008 to 2010) and Newmont (2005). Table 14-11 provides a summary of available boreholes. The effective date of the drilling database is May 22, 2018, with SMD-0065 as the last borehole added to the database.
All borehole collars were surveyed according to UTM coordinates (Zone 21N). Golden Star completed down-hole surveys at intervals of approximately 50 m. IAMGOLD’s down-hole surveys were completed, using a Reflex EZ-TRAC down-hole survey tool for the DD holes. For RC holes, IAMGOLD completed down-hole surveys at 10 m intervals using a gyroscopic down-hole survey tool.
| IAMGOLD Corporation - Rosebel Gold Mine | |
| Technical Report NI 43- 101 – November 5, 2018 | Page 14-24 |
TABLE 14-11 DRILLING DATABASE FOR SARAMACCA GOLD PROJECT
| Company | Diamond | Reverse Circulation | Undefined | Total | ||||
| Number | (m) | Number | (m) | Number | (m) | Number | (m) | |
| Golden Star | 37 | 4,446 | 29 | 3,540 | 66 | 7,986 | ||
| Newmont | 24 | 1,307 | 24 | 1,307 | ||||
| IAMGOLD - SurEx | 286 | 60,701 | 41 | 4,986 | 327 | 65,687 | ||
| IAMGOLD - MinEx | 66 | 15,472 | 66 | 15,472 | ||||
| Total | 413 | 81,926 | 41 | 4,986 | 29 | 3,540 | 483 | 90,452 |
Core recovery is generally good with 90% of the data collected exceeding 75% or higher core recovery. The correlation between gold grades and core recovery is less than ±0.15. Further, no spatial correlation is apparent between areas of poor recovery and higher-grade areas.
Based on SRK’s site visits completed in June 2017 and January 2018, SRK believes that drilling, logging, core handling, core storage, and analytical quality control protocols used by IAMGOLD meet generally accepted industry best practices. As a result, SRK considers that the exploration data collected by IAMGOLD and previous project operators are of sufficient quality to support Mineral Resource evaluation.
| 14.3.4 |
GEOLOGICAL INTERPRETATION AND MODELLING |
The Mineral Resource model of the Saramacca gold project is based on a structural geology investigation. The geological model includes the distribution of the main rock types and structurally controlled gold mineralized domains. Gold mineralization is associated with a major brittle-ductile vertical dip-slip fault zone located at the contact between a sequence of massive and pillowed basalt. Two main fault zones, Faya Bergi and Brokolonko, are located at the contact between amygdular basalt and pillow basalt. Several sub-parallel minor shear zones are located in the hanging wall of the main fault zone in the pillowed basalt. New drilling and logging defines a wider combined Faya Bergi and Brokolonko fault zone, especially in the southeastern part of the deposit.
The lithological domains were constructed by SRK as a geological model in Leapfrog Geo™. The main rock types modelled are from southwest to northeast: massive basalt, amygdular basalt, combined Faya Bergi and Brokolonko fault zone, pillow basalt, and pyroclastic (top left; Figure 14-5).
| IAMGOLD Corporation - Rosebel Gold Mine | |
| Technical Report NI 43- 101 – November 5, 2018 | Page 14-25 |
In addition, gold grade domains were constructed using three-dimensional implicit modelling along identified structural trends. Domains were created within the combined fault zone and within the hangingwall pillow basalt zone, based on respective gold grades of 0.1 and 1.0 g/t Au. These could be viewed as high grade and low grade domains. The gold grade domains were modelled as an indicator interpolant above the selected cut-off, not implicitly modelled on grade. The domains were interpolated along steep structural trends along the fault orientation. Smaller domains supported by two or fewer boreholes were removed from the final domains. The grade domains are shown in Figure 14-5 in plan view (top right) and on a long section looking northeast (bottom). Three representative vertical cross sections are shown in Figures 14-6, 14-7, and 14-8.
| IAMGOLD Corporation - Rosebel Gold Mine | |
| Technical Report NI 43- 101 – November 5, 2018 | Page 14-26 |
![]()
| IAMGOLD Corporation - Rosebel Gold Mine | |
| Technical Report NI 43- 101 – November 5, 2018 | Page 14-27 |
![]()
| IAMGOLD Corporation - Rosebel Gold Mine | |
| Technical Report NI 43- 101 – November 5, 2018 | Page 14-28 |
![]()
| IAMGOLD Corporation - Rosebel Gold Mine | |
| Technical Report NI 43- 101 – November 5, 2018 | Page 14-29 |
![]()
| IAMGOLD Corporation - Rosebel Gold Mine | |
| Technical Report NI 43- 101 – November 5, 2018 | Page 14-30 |
SRK also updated the weathering profile model based on the logged downhole data and core photographs. The weathering profile includes laterite, saprolite, transition zone, and fresh rock. Re-logging of the weathering profile by IAMGOLD defines a wider transition zone than previously modelled. A trough of deeper weathered rock is commonly present over the fault zones as shown in the vertical cross sections in Figures 14-6, 14-7, and 14-8.
Table 14-12 provides a listing of the domains constructed for the Saramacca gold project Mineral Resource model, including rock codes found within the GEMS project.
TABLE 14-12 MINERAL RESOURCE DOMAINS WITH ROCK CODES
| Domain | Rock Code |
| Laterite | 10 |
| Saprolite | 20 |
| Transition | 30 |
| Fresh | 40 |
| Massive Basalt | 100 |
| Amygdular Basalt | 200 |
| Combined FB&B Fault Zone | 300 |
| Fault Low Grade (LG) | 310 |
| Fault High Grade (HG) | 320 |
| Pillow Basalt | 400 |
| Pillow Basalt Low Grade (PB LG) | 410 |
| Pillow Basalt High Grade (PB HG) | 420 |
| Pyroclastic | 500 |
| 14.3.5 |
SPECIFIC GRAVITY |
Specific gravity was measured at the Rosebel Mine laboratory using a standard weight in water/weight in air methodology on core from complete sample intervals. The specific gravity database contains 4,776 measurements across all weathering zones, representing a 103 percent increase in specific gravity measurements since the August 2017 resource model. Figure 14-9 shows boxplots of the specific gravity measurements by weathering zone. Only 202 specific gravity measurements were taken on laterite material.
Interestingly, the average specific gravity in saprolite is lower than the average specific gravity in laterite. For this reason, there is a risk that the laterite specific gravity is anomalously high and may contribute to higher tonnages if associated grades are higher than the reported gold cut-off grade. As the bulk of the mineralization lies in saprolite, transition, and fresh, this risk is considered low.
| IAMGOLD Corporation - Rosebel Gold Mine | |
| Technical Report NI 43- 101 – November 5, 2018 | Page 14-31 |
FIGURE 14-9 BOXPLOT OF SPECIFIC GRAVITY BY WEATHERING ZONE
![]()
| 14.3.6 |
COMPOSITING, STATISTICS, AND CAPPING |
Table 14-13 summarizes the assay statistics for the Saramacca gold project, tagged by mineralized domains. In August 2017, SRK evaluated the historical and recent borehole databases for the maiden resource estimate of Saramacca, and decided to combine these databases as conditioning data for grade estimation. This decision was supported via a statistical review of the data types, data density and a general impact on grade estimation. This decision was not revisited in this 2018 update of the Mineral Resource model, and both databases were combined once again.
Figure 14-10 shows the distribution of assay lengths by deposit. Approximately 94% of assay samples measure 1.5 m or less. Virtually all assays are sampled in less than 2 m intervals. To maintain the number of data available for grade estimation, particularly in the high-grade domains, SRK chose to composite at 1.5 m and avoid ‘breaking’ assays to form larger composites.
| IAMGOLD Corporation - Rosebel Gold Mine | |
| Technical Report NI 43- 101 – November 5, 2018 | Page 14-32 |
TABLE 14-13 ASSAY STATISTICS FOR SARAMACCA GOLD PROJECT
| Length Weighted Assay Statistics | ||||||||
| Domain | Zone | No. | ||||||
| Data | Mean | SD | Min | Med | Max | CoV | ||
| Laterite | 10 | 2,663 | 0.71 | 1.69 | 0.00 | 0.20 | 28.43 | 2.38 |
| Massive Basalt | 100 | 8,941 | 0.02 | 0.16 | 0.00 | 0.01 | 10.04 | 7.04 |
| Amygdular Basalt | 200 | 2,281 | 0.03 | 0.16 | 0.00 | 0.01 | 3.52 | 4.70 |
| Fault | 300 | 5,653 | 0.09 | 0.56 | 0.00 | 0.02 | 15.93 | 6.64 |
| Fault LG | 310 | 1,896 | 0.93 | 2.23 | 0.00 | 0.31 | 40.68 | 2.39 |
| Fault HG | 320 | 1,217 | 7.31 | 19.33 | 0.00 | 3.23 | 456.00 | 2.65 |
| Pillow Basalt | 400 | 32,613 | 0.06 | 0.73 | 0.00 | 0.01 | 64.20 | 12.57 |
| PB LG | 410 | 4,130 | 1.37 | 5.10 | 0.00 | 0.29 | 147.60 | 3.73 |
| PB HG | 420 | 459 | 4.52 | 7.89 | 0.00 | 2.33 | 121.06 | 2.02 |
| Pyroclastic | 500 | 1,244 | 0.05 | 0.46 | 0.00 | 0.00 | 13.90 | 8.74 |
Note. SD = Standard Deviation; Min = Minimum; Med = Median; Max = Maximum; CoV = Coefficient of Variation; Fault LG – fault low grade; Fault HG – faults high grade
FIGURE 14-10 ASSAY LENGTHS FOR COMBINED HISTORICAL AND IAMGOLD DATA
![]()
Residual length composites were evaluated to determine if they should remain in the database. The general concern is that shorter composite intervals may be associated with higher grades, and the direct use of these composites in Mineral Resource estimation may lead to overestimation. This is particularly concerning if the length of the composites is not used as a weight in the estimation; as most general mine planning packages do not allow the use of weighting composite grades by length, this may be a risk in implementation. SRK reviewed the impact of residual composites by comparing the length-weighted average of assay intervals against the unweighted average of composite grades when residual composites of 50% (0.75 m) lengths were removed from the database on a by-domain basis. All domains showed less than 1% impact on the mean grade. Thus, SRK chose to exclude composites shorter than 50% of the composite length (or 0.75 m) in subsequent data analysis and block grade estimation.
| IAMGOLD Corporation - Rosebel Gold Mine | |
| Technical Report NI 43- 101 – November 5, 2018 | Page 14-33 |
To further limit the influence of high gold grade outliers during grade estimation, SRK chose to cap composites, as these are the data used explicitly in estimation. Capping was performed by grade domain and by lithology domain. SRK relied on a combination of probability plots, decile analysis, and capping sensitivity plots. Separation of grade populations characterized by inflections in the probability plot or gaps in the high tail of the grade distribution were indicators of potential capping values. Decile analysis was then used to confirm the reasonableness of the capped threshold. The chosen capped values, along with the uncapped and capped composite statistics are provided in Table 14-14. Figure 14-11 shows an example probability plot and capping sensitivity curve for the fault low grade (Fault LG) domain. Appendix B shows relevant capping plots for all other domains.
TABLE 14-14 UNCAPPED AND CAPPED COMPOSITE STATISTICS
| Domain | Zone | Uncapped Composite | ||||||
| No. Data | Mean | SD | Minimum | Median | Maximum | CoV | ||
| Laterite | 10 | 2,453 | 0.67 | 1.50 | 0.00 | 0.20 | 20.85 | 2.25 |
| Massive Basalt | 100 | 8,662 | 0.02 | 0.14 | 0.00 | 0.01 | 9.58 | 6.22 |
| Amygdular Basalt | 200 | 2,145 | 0.03 | 0.15 | 0.00 | 0.01 | 3.29 | 4.58 |
| Fault | 300 | 5,225 | 0.08 | 0.54 | 0.00 | 0.02 | 15.93 | 6.39 |
| Fault LG | 310 | 1,783 | 0.93 | 2.16 | 0.00 | 0.32 | 40.68 | 2.31 |
| Fault HG | 320 | 1,154 | 7.29 | 16.75 | 0.00 | 3.50 | 304.39 | 2.30 |
| Pillow Basalt | 400 | 32,040 | 0.06 | 0.67 | 0.00 | 0.01 | 64.20 | 11.47 |
| PB LG | 410 | 3,938 | 1.37 | 4.96 | 0.00 | 0.31 | 147.60 | 3.61 |
| PB HG | 420 | 424 | 4.52 | 7.73 | 0.00 | 2.45 | 121.06 | 1.71 |
| Pyroclastic | 500 | 1,266 | 0.06 | 0.46 | 0.00 | 0.00 | 13.90 | 8.20 |
| IAMGOLD Corporation - Rosebel Gold Mine | |
| Technical Report NI 43- 101 – November 5, 2018 | Page 14-34 |
| Domain | Zone | Capped Composites | ||||||
| Cap Value | Percentile | No. Capped | Mean | Std. Dev. | Maximum | CoV | ||
| Laterite | 10 | 7 | 98.6% | 35 | 0.62 | 1.17 | 7.00 | 1.88 |
| Massive Basalt | 100 | 1 | 99.8% | 17 | 0.02 | 0.06 | 1.00 | 3.00 |
| Amygdular Basalt | 200 | 2 | 99.8% | 5 | 0.03 | 0.13 | 2.00 | 3.91 |
| Fault | 300 | 4 | 99.7% | 14 | 0.07 | 0.31 | 4.00 | 4.25 |
| Fault LG | 310 | 14 | 99.6% | 8 | 0.90 | 1.74 | 14.00 | 1.93 |
| Fault HG | 320 | 34 | 97.3% | 31 | 5.88 | 6.81 | 34.00 | 1.16 |
| Pillow Basalt | 400 | 8 | 99.9% | 22 | 0.05 | 0.33 | 8.00 | 6.41 |
| PB LG | 410 | 25 | 99.5% | 21 | 1.24 | 3.02 | 25.00 | 2.44 |
| PB HG | 420 | 25 | 99.1% | 4 | 4.18 | 4.65 | 25.00 | 1.11 |
| Pyroclastic | 500 | 1.5 | 99.6% | 5 | 0.04 | 0.15 | 1.50 | 3.75 |
Note. SD = Standard Deviation; CoV = Coefficient of Variation
FIGURE 14-11 GRADE PROBABILITY
PLOT (LEFT) AND CAPPING
SENSITIVITY CURVE (RIGHT) FOR FAULT LG DOMAIN
![]()
Despite grade capping, the coefficient of variation (CoV) in the fault and pillow basalt zones remain significantly high, suggesting that further controls on high grade composites may be required during grade estimation. A similar observation can be made for the three un-mineralized domains, massive and amygdular basalt, and the pyroclastic zone.
Specific gravity was also estimated in the block model, based on the weathering profile. Unlike grade composites, which are 1.5 m lengths, specific gravity data are only 10 cm in length and are not collected continuously down the core. Compositing of specific gravity was not possible, and given the small support, estimation parameters for specific gravity were chosen to yield a smooth interpolation result. Specific gravity data were also capped, by weathering zone, to avoid any extreme low and/or high values for estimation. Chosen cap values for specific gravity are provided in Table 14-15. The impact of capping on the average specific gravity was less than 1% for all weathering zones.
| IAMGOLD Corporation - Rosebel Gold Mine | |
| Technical Report NI 43- 101 – November 5, 2018 | Page 14-35 |
TABLE 14-15 CAP VALUES FOR SPECIFIC GRAVITY
| Weathering | No. | |||||
| Zone | Mean | SD | Minimum | Maximum | CoV | Capped |
| Laterite | 2.01 | 0.46 | 1.33 | 3.00 | 0.23 | 8 |
| Saprolite | 1.63 | 0.27 | 1.20 | 3.00 | 0.17 | 21 |
| Transition | 2.08 | 0.35 | 1.40 | 3.00 | 0.17 | 10 |
| Fresh | 2.78 | 0.22 | 1.80 | 3.10 | 0.08 | 46 |
Note. SD = Standard Deviation; CoV = Coefficient of Variation
| 14.3.7 |
VARIOGRAPHY |
SRK used the Geostatistical Software Library (GSLib, Deutsch and Journel, 1998) to calculate and model gold variograms for the mineralized domains (Table 14-16). For each domain, SRK assessed three different spatial metrics: (1) traditional semivariogram of gold, (2) correlogram of gold, and (3) traditional semivariogram of normal scores of gold. Downhole variograms were calculated to determine the nugget effect. Figure 14-12 shows an example variogram model for the Fault LG domain; all gold domain variograms are provided in Appendix C.
TABLE 14-16 GOLD VARIOGRAMS BY DOMAIN
| Domain | Rock | GEMS | Rotation | (ADA) | Variogram Model | ||||||
| Code | Azm | Dip | Azm | Nugget | Str. No. | Type | CC | X Range | Y Range | Z Range | |
| Laterite | 10 | 0 | 0 | 0 | 0.15 | 1 | Spherical | 0.35 | 35 | 35 | 3.5 |
| 2 | Spherical | 0.5 | 35 | 35 | 20 | ||||||
| Fault | 300 | 235 | -90 | 145 | 0.15 | 1 | Spherical | 0.3 | 70 | 20 | 3 |
| 2 | Spherical | 0.55 | 70 | 90 | 10 | ||||||
| Fault LG | 310 | 235 | -90 | 145 | 0.2 | 1 | Exponential | 0.4 | 50 | 35 | 6 |
| 2 | Spherical | 0.4 | 50 | 35 | 20 | ||||||
| Fault HG | 320 | 235 | -90 | 145 | 0.3 | 1 | Exponential | 0.25 | 20 | 5 | 6 |
| 2 | Spherical | 0.2 | 20 | 48 | 30 | ||||||
| 3 | Spherical | 0.25 | 80 | 48 | 30 | ||||||
| Pillow Basalt | 400 | 235 | -90 | 145 | 0.3 | 1 | Spherical | 0.3 | 100 | 20 | 4 |
| 2 | Spherical | 0.15 | 150 | 500 | 4 | ||||||
| 3 | Spherical | 0.25 | 150 | 500 | 16 | ||||||
| IAMGOLD Corporation - Rosebel Gold Mine | |
| Technical Report NI 43- 101 – November 5, 2018 | Page 14-36 |
| Domain | Rock | GEMS | Rotation | (ADA) | Variogram Model | ||||||
| Code | Azm | Dip | Azm | Nugget | Str. No. | Type | CC | X Range | Y Range | Z Range | |
| Pillow Basalt LG | 410 | 235 | -90 | 145 | 0.2 | 1 | Spherical | 0.4 | 25 | 25 | 3 |
| 2 | Spherical | 0.4 | 110 | 110 | 9 | ||||||
| Pillow Basalt HG | 420 | 235 | -90 | 145 | 0.2 | 1 | Spherical | 0.5 | 40 | 40 | 3 |
| 2 | Spherical | 0.3 | 90 | 90 | 9 | ||||||
Note. Str. No. = structure number; CC = variance contribution
FIGURE 14-12 GOLD VARIOGRAM FOR FAULT LOW GRADE ZONE
![]()
| 14.3.8 |
BLOCK MODEL PARAMETERS |
In discussions with IAMGOLD, the block size was adjusted slightly to 5.0 m by 10.0 m by 8.0 m, with the 10.0 m dimension parallel to the strike direction and an 8.0 m vertical dimension. A rotated block model was created using GEMSTM, with a rotation angle of 35°. SRK based the block model coordinates on the local UTM grid (Zone 21N). Table 14-17 summarizes the block model definition. SRK populated grades for each of the domains into a percent block model, from which a diluted block model was then calculated.
TABLE 14-17 SARAMACCA GOLD
PROJECT GEMS BLOCK MODEL
DEFINITION
| Block Size | Origin* | Block | |
| (m) | (m) | Count | |
| X | 5 | 678,825.63 | 330 |
| Y | 10 | 542,402.00 | 300 |
| Z | 8 | 475.00 | 78 |
* Zone 21N
| IAMGOLD Corporation - Rosebel Gold Mine | |
| Technical Report NI 43- 101 – November 5, 2018 | Page 14-37 |
| 14.3.9 |
ESTIMATION |
The block model was populated with a gold value using ordinary kriging (OK) in the mineralized domains, and applying up to three estimation runs with progressively relaxed search ellipsoids and data requirements. The three un-mineralized domains (massive and amygdular basalt, and pyroclastic domains) and specific gravity within each weathering zone were estimated using inverse distance weighting with a power of 2. Table 14-18 summarizes the data requirements for gold grade estimation, while the last row provides the data requirements for specific gravity. The first estimation pass is based on an octant search with search radii up to the variogram range. The second and third passes use an ellipsoidal search with search set to 1.5 and 2.0 times the variogram range, respectively. The estimation ellipse ranges and orientations are based on the variogram models developed for the various domains within the deposit.
In all cases, gold and specific gravity were estimated using a hard boundary approach.
As with the maiden resource model, SRK chose to limit the influence of high grade composites during the estimation (see Table 14-14). This was done in the laterite, pillow basalt, and the unmineralized massive and amygdular basalts. The pyroclastic domain was added to this group of domains. These are all generally extensive domains, wherein the risk for grade smearing is high, particularly in areas of sparse drilling.
| 14.3.10 |
ESTIMATION SENSITIVITY ASSESSMENT |
In 2017, SRK assessed the sensitivity of the block estimates to the estimation strategy by varying some estimation parameters, including maximum number of boreholes used for a block estimate, and minimum and maximum number of informing composites and search types for Pass 1. This was not revisited for this update. Instead, discussions with IAMGOLD led to consideration of sensitivities associated to boundary treatment between the high- and low-grade zones, as well as an alternative variogram model for the pillow basalt zones. In all scenarios, SRK used a preliminary optimized pit to compare the quantity, grade, and contained metal at 0.25 g/t Au cut-off for laterite and saprolite, 0.35 g/t Au cut-off for transition, and 0.45 g/t Au for fresh relative to the base case.
| IAMGOLD Corporation - Rosebel Gold Mine | |
| Technical Report NI 43- 101 – November 5, 2018 | Page 14-38 |
A hard boundary between the high and low grade zones was used in the base case model. As a sensitivity, a limited soft boundary was tested which allowed low grade zone composites to influence the estimation of the high grade zone within 5 to 10 m of the boundary. The limited soft boundary scenario resulted in up to 3% less tonnage, 1% lower grade for up to 3% fewer ounces. Overall, SRK considers this impact to be immaterial.
A more extreme test was the consideration of a one-way soft boundary for the high grade zone, wherein composites from the adjacent low grade zone were also used in grade estimation. This had a significant impact in tonnage yielding 19% less tonnage, at 8% lower grade for a combined 17% less metal. SRK reviewed the contact plots between the low and high-grade zones within the fault and pillow basalt zones (Figure 14-13); these plots showed a sharp discontinuity in the average grade profile at the boundary between these two zones and suggests that the use of a hard boundary is appropriate.
A secondary aspect of the sensitivity analysis focussed on the variogram model fitted for the pillow basalt zones. An alternative shorter-range variogram model was considered, which consisted of fitting very short scale structures with a range of no more than 45 m by 45 m by 16 m for the pillow basalt zone, up to 70 m by 70 m by 9 m for the pillow basalt LG zone, and 65 m by 65 m by 10 m for the pillow basalt HG zone. The overall impact of these alternate variogram models resulted in 2% less tonnage, at 1% higher grade, for a combined impact of less than 1% reduction in overall contained metal.
| IAMGOLD Corporation - Rosebel Gold Mine | |
| Technical Report NI 43- 101 – November 5, 2018 | Page 14-39 |
TABLE 14-18 ESTIMATION PARAMETERS FOR GOLD AND SPECIFIC GRAVITY (last row)
| Octant Parameters | |||||||||||||
| No. Data | Search Ellipse | Min Num | Max Comp | HG Limited Radii | |||||||||
| Domain |
Method | Est. Pass | Search | Min | Max | Max Comp | Svx* (m) | Svy* (m) | Svz* (m) | Octants | per Oct | Radii | Grade |
| Type | per Hole | ||||||||||||
| Laterite | OK | 1 | Octant | 5 | 9 | 3 | 35 | 35 | 20 | 3 | 5 | ||
| 2 | Ellipsoidal | 4 | 12 | 3 | 70 | 70 | 40 | - | - | 20x20x20 | 5 g/t | ||
| Fault | OK | 1 | Octant | 5 | 9 | 3 | 70 | 90 | 10 | 3 | 5 | ||
| 2 | Ellipsoidal | 4 | 12 | 3 | 105 | 135 | 20 | - | - | ||||
| Fault LG | OK | 1 | Octant | 5 | 9 | 3 | 50 | 35 | 20 | 3 | 5 | ||
| 2 | Ellipsoidal | 4 | 12 | 3 | 75 | 55 | 30 | - | - | ||||
| 3 | Ellipsoidal | 1 | 15 | - | 125 | 85 | 50 | - | - | ||||
| Fault HG | OK | 1 | Octant | 5 | 9 | 3 | 80 | 50 | 30 | 3 | 5 | ||
| 2 | Ellipsoidal | 4 | 12 | 3 | 120 | 75 | 45 | - | - | ||||
| 3 | Ellipsoidal | 1 | 15 | - | 160 | 100 | 60 | - | - | ||||
| Pillow Basalt | OK | 1 | Octant | 5 | 9 | 3 | 100 | 100 | 20 | 3 | 5 | 25x25x5 | 5 g/t |
| 2 | Ellipsoidal | 4 | 12 | 3 | 200 | 200 | 40 | - | - | 25x25x5 | 5 g/t | ||
| Pillow Basalt LG | OK | 1 | Octant | 5 | 9 | 3 | 100 | 100 | 10 | 3 | 5 | ||
| 2 | Ellipsoidal | 4 | 12 | 3 | 150 | 150 | 20 | - | - | ||||
| 3 | Ellipsoidal | 1 | 15 | - | 250 | 250 | 40 | - | - | ||||
| Pillow Basalt HG | OK | 1 | Octant | 5 | 9 | 3 | 90 | 90 | 10 | 3 | 5 | ||
| 2 | Ellipsoidal | 4 | 12 | 3 | 135 | 135 | 20 | - | - | ||||
| 3 | Ellipsoidal | 1 | 15 | - | 180 | 180 | 30 | - | - | ||||
| Massive & Amygdular Basalt & Pyroclastic | ID2 | 1 | Ellipsoidal | 4 | 12 | 50 | 50 | 15 | - | - | 20x20x20 | 1 g/t | |
| 2 | Ellipsoidal | 1 | 15 | 100 | 100 | 30 | - | - | 20x20x20 | 1 g/t | |||
| Specific Gravity by Weathering Zone | ID2 | 1 | Ellipsoidal | 2 | 20 | 250 | 250 | 50 | - | - | |||
| 2 | Ellipsoidal | 1 | 40 | 500 | 500 | 100 | - | - | |||||
| IAMGOLD Corporation - Rosebel Gold Mine | |
| Technical Report NI 43- 101 – November 5, 2018 | Page 14-40 |
FIGURE 14-13 CONTACT PLOTS
BETWEEN LOW- AND HIGH-GRADE ZONES
IN THE FAULT ZONE (LEFT) AND PILLOW
BASALT (RIGHT)
![]()
| 14.3.11 |
BLOCK MODEL VALIDATION |
SRK validated the block model using a visual comparison of block estimates and informing composites, statistical comparisons between composites and block model distributions, and statistical comparisons between OK estimates and alternate estimators at zero cut-off.
SRK generated block estimates using ID3. Similar to the estimation sensitivities, SRK compared the ID3 model to the OK estimates at a 0.25 g/t Au cut-off grade for laterite and saprolite, a 0.35 g/t Au cut-off grade for transition, and a 0.45 g/t Au cut-off grade for fresh, within a preliminary pit. Results show the ID3 model yields 6% less tonnage, with an 11% increase in average grade, for an overall increase in contained ounces of 3%. These results are within reason and not unexpected given the two estimators.
A swath plot showing the OK block model, the ID3 model, and the high-grade (HG) one-way soft boundary model, clustered and nearest neighbours declustered composites is provided in Figure 14-14. This shows generally good agreement between the OK and ID3 block model and the nearest neighbours declustered data. As expected, the HG one-way soft boundary model is lower than all other models.
| IAMGOLD Corporation - Rosebel Gold Mine | |
| Technical Report NI 43- 101 – November 5, 2018 | Page 14-41 |
FIGURE 14-14 SWATH PLOT OF BLOCK MODELS, ORIENTED ALONG STRIKE
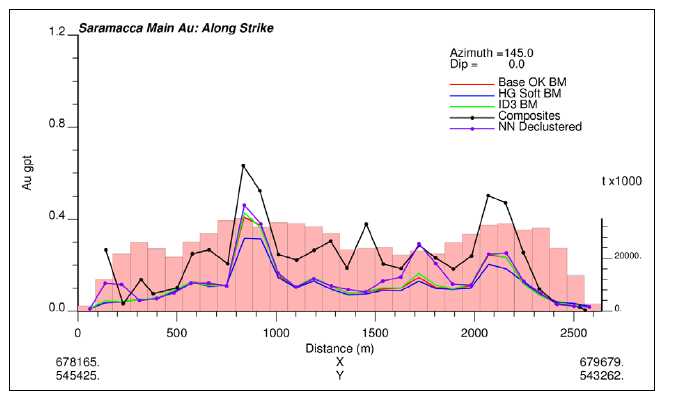
(Histogram corresponds to block model tonnage along the swath)
SRK also compared the OK block model distribution with the nearest-neighbours declustered, change-of-support corrected distribution of the informing composites for the grade domains and within the fault and pillow basalt domains. Declustering mitigates the influence of preferential sampling of borehole data; this often results in a distribution of composites whose mean statistic is often comparable to that of the estimated model. Further, a change-of-support correction is applied to account for the volume difference between the composite scale and the final block volume scale. A quantile-quantile plot and a grade-tonnage curve were plotted to compare the declustered, change-of-support corrected distribution to the estimated block model grades. Figure 14-15 shows this comparison for the Fault low and high-grade domains. In general, the base case model corresponds well to the declustered, change-of-support corrected distributions.
| IAMGOLD Corporation - Rosebel Gold Mine | |
| Technical Report NI 43- 101 – November 5, 2018 | Page 14-42 |
FIGURE 14-15 COMPARISON OF
QUANTILE-QUANTILE PLOT FOR BLOCK
MODEL GRADES AND DECLUSTERED AND
CHANGE OF SUPPORT
CORRECTED DISTRIBUTION (LEFT) AND GRADE TONNAGE
CURVES (RIGHT)
FOR FAULT LOW GRADE (TOP ROW) AND FAULT HIGH GRADE
(BOTTOM
ROW)

| 14.3.12 |
MINERAL RESOURCE CLASSIFICATION |
The block classification strategy considers borehole spacing, geologic confidence and continuity of category. SRK considers that there are no Measured blocks within the Saramacca gold project. To differentiate between Indicated and Inferred, a separate block model was created solely to assist with block classification using an estimation run. Criteria used for block classification are:
| IAMGOLD Corporation - Rosebel Gold Mine | |
| Technical Report NI 43- 101 – November 5, 2018 | Page 14-43 |
| • | Indicated: Blocks estimated within a 40 m by 40 by m 40 m search radius, using a minimum of three boreholes and belonging to Fault, Fault LG, Fault HG, Pillow Basalt HG, Pillow Basalt LG, and Laterite domains. This nominally corresponds to a borehole spacing of 50 to 60 m. The mean average distance of informing composites for this category is within 30 m (Figure 14-16). | |
| • | Inferred: All blocks not classified as Indicated, and any block with an estimated grade with a range of up to 2 times the variogram range. |
FIGURE 14-16 DISTRIBUTION OF
AVERAGE DISTANCE OF INFORMING
COMPOSITES FOR INDICATED BLOCKS
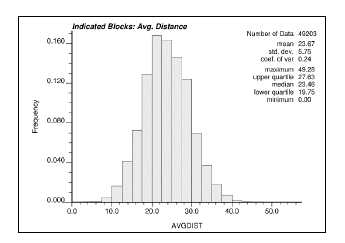
SRK examined the classification visually by inspecting sections and plans through the block model. SRK concludes that the material classified as Indicated reflects estimates made with a moderate level of confidence within the meaning of CIM definitions, and all other material is estimated at a lower confidence level. Additionally, SRK applied a post-smoothing filter on the classified material to ensure continuity within the classification categories.
| 14.3.13 | MINERAL RESOURCE REPORTING |
CIM definitions define a Mineral Resource as:
“[A] concentration or occurrence of solid material of economic interest in or on the Earth’s crust in such form, grade or quality and quantity that there are reasonable prospects for eventual economic extraction. The location, quantity, grade or quality, continuity and other geological characteristics of a Mineral Resource are known, estimated or interpreted from specific geological evidence and knowledge, including sampling.”
| IAMGOLD Corporation - Rosebel Gold Mine | |
| Technical Report NI 43- 101 – November 5, 2018 | Page 14-44 |
The “reasonable prospects for eventual economic extraction” requirement generally implies that quantity and grade estimates meet certain economic thresholds and that Mineral Resources are reported at an appropriate cut-off grade that takes into account extraction scenarios and processing recovery. SRK considers that the Saramacca gold project is primarily amenable to open pit extraction. To assist with determining which portions of the gold deposits show “reasonable prospect for eventual economic extraction” from an open pit and to assist with selecting reporting assumptions, Mr. Nicolas Szwedska, P.Eng. of BBA developed a conceptual open pit shell using the same optimization parameters as those used in the Mineral Reserve study. Mining, processing and general and administrative (G&A) costs are based on a Mineral Reserve cost model, which was developed using an activity-based costing approach. Other pit optimization parameters include:
| • |
Overall slope angle 22° in laterite and saprolite, 36° in transition, and 45° in fresh rock. | |
| • |
Metallurgical gold recovery of 94.0% for laterite, 91.0% for saprolite, 89.6% for transition and 74.8% for fresh rock. | |
| • |
Gold price of US$1,500 per troy ounce. |
After review of optimization results, and through discussions with IAMGOLD, SRK considers that it is reasonable to report as open pit Mineral Resource those classified blocks located within the conceptual pit shell above a cut-off grade of 0.25 g/t Au for laterite and saprolite, 0.30 g/t Au for transition material, and 0.50 g/t Au for fresh rock material (see Figure 14-17).
No underground Mineral Resource is reported.
| IAMGOLD Corporation - Rosebel Gold Mine | |
| Technical Report NI 43- 101 – November 5, 2018 | Page 14-45 |

| IAMGOLD Corporation - Rosebel Gold Mine | |
| Technical Report NI 43- 101 – November 5, 2018 | Page 14-46 |
SRK is satisfied that the Mineral Resources were estimated in conformity with the widely accepted CIM Estimation of Mineral Resource and Mineral Reserve Best Practices Guidelines (2003). The Mineral Resources may be affected by further infill and exploration drilling that may result in increases or decreases in subsequent Mineral Resource estimates. The Mineral Resources may also be affected by subsequent assessments of mining, environmental, processing, permitting, taxation, socio-economic, and other factors. The classified Mineral Resource estimate shown by weathering zone for the Saramacca gold project is presented in Table 14-19. The consolidated Mineral Resource Statement, including RGM, is presented in Table 14-1.
The effective date of the Saramacca Mineral Resource estimate is September 13, 2018.
TABLE 14-19 CLASSIFIED MINERAL
RESOURCES BY WEATHERING ZONE*,
SARAMACCA GOLD PROJECT, SRK CONSULTING
(CANADA) INC.,
SEPTEMBER 13, 2018
| Contained | Attributable | |||||
| Weathering | Cut-off | Tonnes | Grade | Ounces | Contained | |
| Category | Zone | Grade | (000) | (g/t Au) | (000) | Ounces |
| (g/t Au) | 100% Basis | (000s) | ||||
| 66.5% Basis | ||||||
| Indicated | Laterite | 0.25 | 4,616 | 0.87 | 130 | 86 |
| Saprolite | 0.25 | 7,226 | 1.80 | 418 | 278 | |
| Transition | 0.30 | 5,556 | 2.14 | 383 | 255 | |
| Fresh | 0.50 | 10,541 | 2.46 | 833 | 554 | |
| Total Indicated | 27,938 | 1.96 | 1,763 | 1,172 | ||
| Inferred | Laterite | 0.25 | 1,960 | 0.52 | 33 | 22 |
| Saprolite | 0.25 | 5,157 | 0.50 | 84 | 56 | |
| Transition | 0.30 | 2,261 | 0.71 | 52 | 35 | |
| Fresh | 0.50 | 2,446 | 1.33 | 105 | 70 | |
| Total Inferred | 11,825 | 0.72 | 273 | 182 |
Notes:
| 1. |
Mineral Resources are not Mineral Reserves and have not demonstrated economic viability. | |
| 2. |
CIM definitions were followed for classification of Mineral Resources. | |
| 3. |
All figures have been rounded to reflect the relative accuracy of the estimates. | |
| 4. |
Reported at open pit resource cut-off grades of 0.25 g/t Au for laterite and saprolite, 0.30 g/t Au for transition material, and 0.50 g/t Au for fresh rock material. | |
| 5. |
Reported within a conceptual open pit shell optimized at a gold price of US$1,500 per troy ounce and assuming metallurgical recoveries of 94% for laterite, 91% for saprolite, 87% for transition, and 73% for fresh. | |
| 6. |
Mineral Resources are inclusive of Mineral Reserves. |
| IAMGOLD Corporation - Rosebel Gold Mine | |
| Technical Report NI 43- 101 – November 5, 2018 | Page 14-47 |
| 14.3.14 |
GRADE SENSITIVITY ANALYSIS |
The Mineral Resources of the Saramacca gold project are fairly sensitive to the selection of the reporting cut-off grade. To illustrate this sensitivity, block model quantities and grade estimates at various cut-off grades are presented in Table 14-20 and grade tonnage curves are presented in Figure 14-18.
TABLE 14-20 GLOBAL BLOCK MODEL
QUANTITY AND GRADE ESTIMATES*
AT VARIOUS CUT-OFF GRADES
| Laterite and Saprolite | Transition | Fresh | |||||||
| Contained | Contained | Contained | |||||||
| Cut-off | Tonnes | Grade | Ounces | Tonnes | Grade | Ounces | Tonnes | Grade | Ounces |
| Au (g/t) | (000) | (000) | (000) | ||||||
| (000) | Au (g/t) | 100% Basis | (000) | Au (g/t) | 100% Basis | (000) | Au (g/t) | 100% Basis | |
| 0.10 | 30,115 | 0.75 | 723 | 13,525 | 1.07 | 466 | 28,611 | 1.16 | 1,064 |
| 0.20 | 21,741 | 0.98 | 684 | 9,571 | 1.46 | 448 | 21,665 | 1.48 | 1,032 |
| 0.25 | 18,992 | 1.09 | 664 | 8,617 | 1.59 | 442 | 19,535 | 1.62 | 1,017 |
| 0.30 | 16,740 | 1.20 | 644 | 7,841 | 1.72 | 435 | 17,806 | 1.75 | 1,002 |
| 0.35 | 14,772 | 1.31 | 624 | 7,195 | 1.85 | 428 | 16,320 | 1.88 | 986 |
| 0.40 | 13,063 | 1.44 | 603 | 6,657 | 1.97 | 421 | 15,067 | 2.01 | 971 |
| 0.45 | 11,758 | 1.55 | 586 | 6,176 | 2.09 | 415 | 13,962 | 2.13 | 956 |
| 0.50 | 10,482 | 1.68 | 566 | 5,670 | 2.23 | 407 | 13,029 | 2.25 | 942 |
| 0.60 | 8,748 | 1.90 | 536 | 5,074 | 2.43 | 397 | 11,560 | 2.47 | 916 |
| 0.70 | 7,568 | 2.10 | 511 | 4,554 | 2.64 | 386 | 10,401 | 2.67 | 892 |
| 0.80 | 6,632 | 2.29 | 489 | 4,147 | 2.82 | 376 | 9,508 | 2.85 | 871 |
| 0.90 | 5,883 | 2.48 | 468 | 3,818 | 2.99 | 367 | 8,782 | 3.01 | 851 |
| 1.00 | 5,277 | 2.65 | 450 | 3,511 | 3.17 | 358 | 8,222 | 3.15 | 834 |
| 2.00 | 2,259 | 4.36 | 317 | 1,922 | 4.62 | 285 | 4,847 | 4.36 | 679 |
| 3.00 | 1,307 | 5.75 | 242 | 1,201 | 5.93 | 229 | 3,235 | 5.31 | 552 |
| 4.00 | 829 | 7.08 | 189 | 831 | 7.03 | 188 | 2,141 | 6.24 | 429 |
| 5.00 | 561 | 8.33 | 150 | 603 | 7.99 | 155 | 1,433 | 7.12 | 328 |
| * | The reader is cautioned that the figures in this table should not be misconstrued with a Mineral Resource Statement. The figures are only presented to show the sensitivity of the block model estimates to the selection of a cut-off grade. All figures have been rounded to reflect the relative accuracy of the estimates. |
| IAMGOLD Corporation - Rosebel Gold Mine | |
| Technical Report NI 43- 101 – November 5, 2018 | Page 14-48 |
FIGURE 14-18 GLOBAL
GRADE-TONNAGE CURVES –OXIDE (TOP)
TRANSITIONAL (MID) AND FRESH
MATERIAL (BOTTOM)

| IAMGOLD Corporation - Rosebel Gold Mine | |
| Technical Report NI 43- 101 – November 5, 2018 | Page 14-49 |
| 14.3.15 | RECONCILIATION WITH THE 2017 MINERAL RESOURCE STATEMENT |
For comparison, the August 28, 2017 Mineral Resource Statement, generated by SRK, is presented in Table 14-21. Table 14-22 shows the reconciliation between the August 28, 2017 and the September 13, 2018 Mineral Resource statements for Saramacca.
IAMGOLD drilled an additional 172 boreholes for 41,861 m of drilling since the August 2017 resource model, an increase of 96%. This largely contributed to a re-interpretation of the southeastern portion of Faya Bergi and Brokolonko faults that delineate the combined fault zone and an updated weathering profile model resulting in a wider transition zone than previously modelled. The additional drilling contributed to the extension of the grade domains within the fault zone at depth and, to a limited extent, along strike. The grade domains within the pillow basalt also saw volumetric gains due to delineation of some new areas to the east. In total, this re-interpretation led to an increase of 53% more volume in the grade domains.
One consequence of the increased volume of the grade domains in the pillow basalt is the overall 23% reduction in the average grade of the remainder. This is attributed to the current grade domains capturing a greater number of higher-grading assays, which were considered too isolated in 2017 for inclusion in a grade domain. The reduction in Inferred tonnage and grade are attributed to the increased grade domain volume and corresponding decrease in volume of the remainder pillow basalt zone, and the fact that the assays outside the pillow basalt grade domains are now even lower-grading than those in 2017.
The impact of the additional drilling and updated models is a significant increase in Indicated tonnage, accompanied by a slight decrease in average grade for an overall significant increase of 59% in Indicated ounces. Correspondingly, Inferred tonnage, grade and ounces are significantly reduced, and confirms that the additional drilling by IAMGOLD was successful in upgrading the Inferred Mineral Resources in 2017 to Indicated Mineral Resources in 2018.
Economic parameters for the resource pit optimization also contributed to the increase in overall Mineral Resources. While most of the inputs were slightly adjusted to be consistent with the Mineral Reserve study, the processing cost for fresh rock was reduced by almost 30%. This reduction is likely due to the proximity of the Saramacca deposit to the Rosebel Gold Mine. The impact of the change in economic parameters accounts for 13% of the change in the Mineral Resources.
| IAMGOLD Corporation - Rosebel Gold Mine | |
| Technical Report NI 43- 101 – November 5, 2018 | Page 14-50 |
Overall, the combination of additional drilling, updated models, and updated economics results in 73% more Indicated ounces, while inferred ounces dropped by 47%.
TABLE 14-21 MINERAL RESOURCE
STATEMENT*, SARAMACCA GOLD
PROJECT, SURINAME, SRK CONSULTING (CANADA)
INC., AUGUST 28, 2017
| Contained | |||||
| Category | Weathering | Cut-off Grade | Tonnes | Grade | Ounces (000) |
| Zone | (g/t Au) | (000) | (g/t Au) | 100% Basis | |
| Indicated | Laterite | 0.25 | 2,372 | 1.20 | 91 |
| Saprolite | 0.25 | 5,573 | 2.43 | 436 | |
| Transition | 0.35 | 2,526 | 2.17 | 176 | |
| Fresh | 0.45 | 3,973 | 2.49 | 318 | |
| Total Indicated | 14,444 | 2.20 | 1,022 | ||
| Inferred | Laterite | 0.25 | 4,455 | 0.69 | 98 |
| Saprolite | 0.25 | 4,790 | 0.82 | 126 | |
| Transition | 0.35 | 1,349 | 1.97 | 86 | |
| Fresh | 0.45 | 3,039 | 2.13 | 208 | |
| Total Inferred | 13,632 | 1.18 | 518 |
Notes:
| 1. |
Mineral Resources are not Mineral Reserves and have not demonstrated economic viability. | |
| 2. |
All figures have been rounded to reflect the relative accuracy of the estimates. | |
| 3. |
Reported at open pit resource cut-off grades of 0.25 g/t Au for laterite and saprolite, 0.35 g/t Au for transition, and 0.45 g/t Au for fresh. | |
| 4. |
Reported within a conceptual open pit shell optimized at a gold price of US$1,500 per troy ounce and assuming metallurgical recoveries of 97% for laterite and saprolite, 76% for transition, and 82% for fresh. |
TABLE 14-22 COMPARISON BETWEEN
2017 AND 2018 MINERAL RESOURCE
STATEMENTS
| Contained | |||
| Classification | Tonnes | Grade | Ounces (000) |
| (000) | (g/t Au) | 100% Basis | |
| August 2017 | |||
| Indicated | 14,444 | 2.20 | 1,022 |
| Inferred | 13,632 | 1.18 | 518 |
| September 2018 | |||
| Indicated | 27,938 | 1.96 | 1,763 |
| Inferred | 11,825 | 0.72 | 273 |
| Percentage Difference | |||
| Indicated | 93% | -11% | 73% |
| Inferred | -13% | -39% | -47% |
| IAMGOLD Corporation - Rosebel Gold Mine | |
| Technical Report NI 43- 101 – November 5, 2018 | Page 14-51 |
| 15 |
MINERAL RESERVE ESTIMATES |
| 15.1 |
SUMMARY |
The current Mineral Reserve estimate for RGM and Saramacca is summarized in Table 15-1. The Mineral Reserve estimate was prepared by RGM.
TABLE 15-1 CONSOLIDATED MINERAL
RESERVE STATEMENT – ROSEBEL
GOLD MINE, INCLUDING SARAMACCA GOLD
DEPOSIT
Deposit |
Classification |
Tonnes (000) |
Grade (g/t Au) |
Contained Ounces (000) 100% Basis |
Attributable Contained Ounces (000) |
| RGM | Proven & Probable | 117,872 | 1.0 | 3,632 | 3,450 |
| Stockpiles | 15,803 | 0.6 | 283 | 269 | |
| Saramacca | Proven & Probable | 26,549 | 1.8 | 1,542 | 1,025 |
| Total | 160,224 | 1.1 | 5,457 | 4,745 |
Notes:
| 1. |
Attributable ounces: 95% for Rosebel (excluding Saramacca), 66.5% for Saramacca. | |
| 2. |
CIM definitions were followed for Mineral Reserves . | |
| 3. |
Mineral Reserves are estimated assuming open pit mining methods. | |
| 4. |
Mineral Reserves are estimated using an average long-term gold price of US$1,200/oz. | |
| 5. |
Average weighted process recovery of 89.8%. | |
| 6. |
Mining cost: $2.19/t mined. Processing costs: $4.79/t milled. Power costs: $3.13/t milled. General and Administrative costs of $2.16/t milled. | |
| 7. |
Mineral Reserves include 2018 depletion prior to September 1, 2018. | |
| 8. |
Mineral Reserves include material from all pits, including Saramacca. | |
| 9. |
Bulk density is variable by rock type. | |
| 10. |
Numbers may not add due to rounding. | |
| 11. |
Effective date for Rosebel (excluding Saramacca) is September 1, 2018 . Effective date for Saramacca is September 13, 2018. |
RGM is not aware of any known mining, metallurgical, infrastructure, permitting, or other relevant factors that could materially affect the Mineral Reserve estimate.
The mine design and Mineral Reserve estimate have been completed to a level appropriate for feasibility studies. The Mineral Reserve estimate, stated herein, is consistent with the CIM definitions and is suitable for public reporting. As such, the Mineral Reserves are based on Measured and Indicated Mineral Resources, and do not include any Inferred Mineral Resources.
| IAMGOLD Corporation - Rosebel Gold Mine | |
| Technical Report NI 43- 101 – November 5, 2018 | Page 15-1 |
| 15.2 |
RESOURCE MODELS |
The September 1, 2018 Mineral Reserve estimate is based on updated resource models at year-end 2017 for all pits, with the exception of Saramacca which is based on an updated resource model from June 2018. All resource models listed in Table 15-2 were updated by RGM in GEMS format except for the Saramacca deposit which was prepared by SRK. All resource models were depleted to the September 1, 2018 surveyed surfaces.
TABLE 15-2 RESOURCE BLOCK MODELS
| Pit/Deposit | 2018 Resource Block Models |
| Koolhoven | KJ_LOM2018 /18U1 |
| J Zone | KJ_LOM2018 /18U1 |
| Pay Caro | PCEPCLOM2018 / 2018U1 |
| Rosebel | RB_LOM2018 / 18U1 |
| Royal Hill | RHLOM2018 / 18U1 |
| Roma West | RMWLOM2018 / 2018U1 |
| Mayo | MA_LOM2018 / 18U1 |
| Saramacca | SM_LOM2018 |
| 15.3 |
DILUTION |
The Mineral Reserve estimate includes a mining dilution of 8% for saprolite (soft), and 10% for transition (trans) and fresh rock (hard) ore. The percentage of dilution is a function of blasting which displaces the in-situ ore zones. As a result, soft ore that requires less blasting than trans or hard ore has a relatively lower dilution percentage. The dilution tonnage is estimated at zero grade.
As described above, the dilution, in relation to the ore type, has been incorporated into the pit optimization and mine planning process. The application of this dilution methodology effectively increases the mineralized tonnage by, for example, 10% in trans and hard ore, with no change to final in-situ gold reserves thus reducing the gold head grade from the modelled in-situ grade to the diluted grade.
| IAMGOLD Corporation - Rosebel Gold Mine | |
| Technical Report NI 43- 101 – November 5, 2018 | Page 15-2 |
| 15.4 |
MINING LOSSES |
Historical ore tonnage production has shown a consistent positive reconciliation at RGM. As such, no mining losses are applied to the Mineral Reserve estimate resulting in a 100% mining recovery. The same methodology has been applied to the Mineral Reserve estimate at the Saramacca deposit.
| 15.5 |
MINE OPTIMIZATION METHODOLOGY |
The Mineral Reserves have been determined based on the latest LOM plan. This LOM was developed to maximize cash flow analysis based on activity-based cost accounting, the theory of constraints, as well as developing pit phasing and multi-pit scheduling. This strategy allowed IAMGOLD to maximize the net present value (NPV) of the operation while satisfying the operational constrains to achieve a sustainable mine operation and gold production profile. Whittle Consulting and BBA were mandated, respectively, to provide support to RGM in the development of this process.
Prior to developing the pit shells and Life of Mine schedule, a detailed holistic pit to mine gate assessment was conducted. The assessment determined the key cost drivers and constraints at the RGM operations. Variable and fixed key cost drivers and constraints, by time and precedents, were applied to the schedule development process.
It was determined that the primary cost driver and constraint is the SAG mill throughput. As mill throughput is a function of power availability (i.e., grinding capacity limited), the mill is relatively constrained by the volume of hard ore that can be processed, which in turn is directly related to the amount of metal recovered from the mill in this same period. Thus, the objective of the optimization methodology, in addition to maximizing the NPV of the operation, has been to optimize process throughput and revenue generated from recovered gold. The process throughput optimization is a function of the plant feed proportions of soft, trans, and hard ore types.
The activity-based cost model was developed which distinguished costs as period costs (fixed) or attributable (variable) related costs. Period costs are time related, with no direct production drivers. Attributable costs are directly related to a production driver in the system. The activity-based cost model also accounted for capital and sustaining costs.
| IAMGOLD Corporation - Rosebel Gold Mine | |
| Technical Report NI 43- 101 – November 5, 2018 | Page 15-3 |
Pit optimization was carried out for each deposit using the Pseudoflow algorithm in MineSight and Deswik mine planning software packages. A series of revenue factor pits were generated to evaluate the sensitivity of the final pit size / shape and volume relative to changes in revenue as well as period and attributable costs. The selection of the final pit limits was based on a combination of quantitative and qualitative factors, such as total contained ounces, minimum mining width, strip ratio, discounted cash flows, and proximity to local infrastructure / villages, etc. Based on the selected final pit shell and its concentric shells, a series of engineered final and intermediate pit designs, for each deposit, was completed incorporating operational and geotechnical parameters (berms, geotechnical benches, haul roads, etc.).
These designs formed the basis of the LOM schedule. The results of the LOM plan were used to calculate operational requirements, such as equipment and man-power. G&A costs are adjusted accordingly, and capital (CAPEX) costs are determined separately based on established strategic performance objectives.
| 15.6 |
CUT-OFF GRADE |
Metal prices used for Mineral Reserves are based on consensus, long term forecasts from banks, financial institutions, and other sources. For Mineral Resources, metal prices used are slightly higher than those for Mineral Reserves.
IAMGOLD uses applies flat gold price assumption for all of its sites over the LOM. The gold price assumption for estimating the Mineral Reserves at September 1, 2018 is US$1,200/oz, unchanged from the 2017 Mineral Reserve estimate gold price assumption. Cost assumptions such as fuel price, exchange rates, and royalty rates have also been included and are summarized in Table 15-3.
| IAMGOLD Corporation - Rosebel Gold Mine | |
| Technical Report NI 43- 101 – November 5, 2018 | Page 15-4 |
TABLE 15-3 PIT OPTIMIZATION COST AND REVENUE ASSUMPTIONS
| Economic Parameters | Unit | Value |
| Gold price (P) | US$/oz | 1,200 |
| Long term oil price | US$/bbl | 70 |
| SRD exchange rate | SRD/USD | 7.25 |
| Transport & refining cost | US$/oz | 3 |
| Site diesel price | US$/L | 0.59 |
| Site Heavy Fuel Oil (HFO) price | US$/L | 0.78 |
| Power cost | US$/kWh | 0.114 |
| Production Royalty (2.25%) | US$/oz | 27 |
| Cash Royalty (6.5%) | US$/oz | 50 |
| Discount rate | % | 6 |
Since 2017, IAMGOLD has employed a cash flow/NPV strategy for maximizing the value of the operations which results in a variable cut-off grade over the LOM schedule. The strategy has been to maximize mill throughput while accounting for the periodic and attributable costs. This is a departure from the conventional Mineral Reserves estimate methodology of applying a fixed cut-off grade for the LOM planning. However, for the pit optimization process, a marginal cut-off grade was applied based on the application of the activity based costing model. The resulting sterilization of Measured or Indicated Mineral Resources produced a net negative margin when only considering the cost of processing versus gross revenue at US$1,200/oz.
The summary of these values is shown in Table 15-4. Table 15-5 summarizes the pit optimization parameters by pit.
TABLE 15-4 SUMMARY OF 2018 PIT OPTIMIZATION COGS AT US$1,200/OZ
| COG by Pit | Saprolite | Transition | Rock | |
| J Zone | (g/t Au) | 0.12 | 0.21 | 0.49 |
| Koolhoven | (g/t Au) | 0.12 | 0.20 | 0.49 |
| Mayo | (g/t Au) | 0.12 | 0.21 | 0.65 |
| Pay Caro | (g/t Au) | 0.11 | 0.20 | 0.49 |
| Roma West | (g/t Au) | 0.13 | 0.21 | 0.65 |
| Rosebel | (g/t Au) | 0.14 | 0.22 | 0.51 |
| Royal Hill | (g/t Au) | 0.12 | 0.21 | 0.57 |
| Saramacca | (g/t Au) | 0.12 | 0.21 | 0.65 |
| IAMGOLD Corporation - Rosebel Gold Mine | |
| Technical Report NI 43- 101 – November 5, 2018 | Page 15-5 |
TABLE 15-5 SUMMARY OF PIT OPTIMIZATION PARAMETERS
| Ore Based Cost & COG by Deposit |
RGM Pits | Saramacca Pits | |||||
| Rock type | Saprolite | Transition | Rock | Saprolite | Transition | Rock | |
| Metallurgical Recovery (rFGO) |
% | 95% | 94% | 93% | 91% | 87% | 73% |
| Processing Cost | US$/t treated | 3.56 | 4.63 | 5.67 | 3.48 | 4.49 | 5.32 |
| Power Cost | US$/t treated | 0.79 | 1.56 | 4.13 | 0.79 | 1.56 | 4.13 |
| Total Processing Cost (Cp) | US$/t treated | 4.35 | 6.19 | 9.80 | 4.27 | 6.05 | 9.45 |
| Mining Dilution (d) | % | 8.0% | 10.0% | 10.0% | 8.0% | 10.0% | 10.0% |
| Ore Premium Mining Cost (Com) | US$/t treated | 0.10 | 0.10 | 0.09 | 1.91 | 1.91 | 1.91 |
| Ore Feed | US$/t treated | 0.22 | 0.22 | 0.22 | 0.22 | 0.22 | 0.22 |
| Tailings Storage | US$/t treated | 0.29 | 0.29 | 0.29 | 0.29 | 0.29 | 0.29 |
| G&A Cost (Ca) | US$/t treated | 1.90 | 1.90 | 2.70 | 1.90 | 1.20 | 1.70 |
| Stay-in-business Capital (Csibc) | US$/t treated | 0.40 | 0.40 | 0.40 | 0.40 | 0.40 | 0.40 |
| Ore Based Cost | US$/t treated | 7.26 | 9.10 | 13.50 | 8.99 | 10.07 | 13.97 |
| Reference Mining Cost by Deposit Material | RGM Pits | Saramacca Pits | |||||||||||
| Ore | Waste | Ore | Waste | Ore | Waste | Ore | Waste | Ore | Waste | Ore | Waste | ||
| Total Reference Mining Cost | US$/t mined | 1.69 | 1.79 | 1.96 | 2.06 | 2.11 | 2.19 | 1.73 | 1.73 | 1.90 | 1.90 | 2.00 | 2.00 |
| IAMGOLD Corporation - Rosebel Gold Mine | |
| Technical Report NI 43- 101 – November 5, 2018 | Page 15-6 |
| 15.7 |
PIT SLOPE DESIGNS |
RGM has recently increased the bench heights in all pits to 8 m in order to optimize both productivity and costs. This is with the exception of Mayo Pit where 9 m bench heights, mined in two flitches, have been adopted to minimize ore mining dilution due to the shallow dipping mineralization.
All pit design wall profiles are based on the main three weathering profiles saprolite, transition, and rock. J Zone is the exception with an additional lithology described by a more competent transition domain located stratigraphically between transition and fresh rock.
Slope designs have been based on an extensive geotechnical drilling program carried out in 2013, 2014, and 2017 which defined the domains in each deposit. In addition to the weathering domains, sectors were developed for each pit based on structural rock mass characteristics.
Five pits were targeted by the field investigation (Pay Caro, Royal Hill, Mayo, Rosebel, and J Zone). No field investigation was carried out for the small Roma pits (East and West). Pit slope parameters at the Roma pits were determined based on in-pit mapping and adjacent pit parameters (Royal Hill and Mayo). The design parameters were developed by SRK (with the exception of the Roma pits).
Between 2014 and 2018 pit slope designs have undergone slight modifications to the original parameters to accommodate modifications to the design Bench Face Angle for certain sections.
The Saramacca deposit is characterized by a significant thickness of saprolite that is depressed toward the mineralization located through the centre of the proposed pit. The geotechnical variability of the materials and the weathering profile that are to be exposed in the pit slopes will result in challenging mining and stability conditions.
SRK conducted pit slope geotechnical and hydrogeological investigations comprising 12 diamond drill holes, testing, and instrumentation installations. The field investigation work was supported with a full geotechnical review of exploration diamond core to evaluate the rock mass quality and deposit structural geology. A 3D structural geological model was developed with the field investigation and core review results.
| IAMGOLD Corporation - Rosebel Gold Mine | |
| Technical Report NI 43- 101 – November 5, 2018 | Page 15-7 |
The field investigation work was supported with a full geotechnical review of exploration diamond core to evaluate the rock mass quality and deposit structural geology. A 3D structural geological model was developed with the field investigation and core review results.
The following hydrogeological considerations were included in the pit design and mine planning work:
| • |
Initial pit development to exploit dry saprolite excavation along the ridgeline that is located above the phreatic surface. | |
| • |
A mine deployment plan that supports natural drawdown of the saprolite/structured saprolite through exposing the slopes earlier in the central and southern pit areas. Excavate shallower interim platforms that can be utilized for surface water management and provide space to install active depressurization equipment and/or horizontal drain holes, if needed. | |
| • |
In the south, a slower excavation rate is expected to provide sufficient time for the groundwater to passively draw-down within the higher Saprolite/Structural Saprolites slopes. | |
| • |
In the north, advance the pit quicker through the saprolite units to the Transition Rock to exploit under-draining of the above materials, through the higher conductive Transition and upper fresh rock units. This strategy is similar to that implemented at RGM. |
All pit slope designs are included in the current mine designs, and are reviewed yearly by SRK and are summarised in Table 15-6.
| IAMGOLD Corporation - Rosebel Gold Mine | |
| Technical Report NI 43- 101 – November 5, 2018 | Page 15-8 |
TABLE 15-6 PIT DESIGN SLOPE RECOMMENDATIONS PER ROCK TYPE
| Soft | |||||||||
| Deposit | Units | Saramacca | Koolhoven | JZone | Mayo | Rosebel | Pay Caro | Roma West | Royal Hill |
| Current Bench Height Design | m | 8 | 8 | ||||||
| Berm Width | m | 09-Nov | 7 | 7 | 8 | 8 - 7.2 | 8 | 7.3 | 08-Nov |
| Inter-Ramp Angle (IRA) | deg. | 30 - 27 | 35 | 35 | 32 | 32 - 34 | 29 - 32 | 29 | 32 - 27 |
| Bench Face Angle (BFA) | deg. | 60 | 60 | 60 | 60 | 60 | 50 - 60 | 60 | 60 |
| Maximum Stack Height | m | 32 | 32 - 40 | 32 - 40 | 30 - 32 | 32 | 29 - 32 | ||
| Geotech Berm Width | m | 25 - 40 | 15 | 15 | 15 | 15 | 15 | 15 | 15 |
| Tran | |||||||||
| Deposit | Units | Saramacca | Koolhoven | JZone | Mayo | Rosebel | Pay Caro | Roma West | Royal Hill |
| Current Bench Height Design | m | 8 | 8 | 8 | |||||
| Berm Width | m | 8 - 11.5 | 7.8 - 8.3 | 7.8 - 8.3 | 8 | 8 - 5.8 | 06-Aug | 7.3 | 08-Jul |
| Inter-Ramp Angle (IRA) | deg. | 35 - 40 | 39 - 44 | 39 - 44 | 34 | 34 - 40 | 32 - 36 | 35 | 34 - 37 |
| Bench Face Angle (BFA) | deg. | 70 - 90 | 75 - 90 | 75 - 90 | 65 | 65 | 50 - 65 | 78 | 65 |
| Maximum Stack Height | m | 56 | 32, 40 | 32, 40 | 40 | 40 | 32 - 40 | ||
| Geotech Berm Width | m | 15 | 15 | 15 | 15 | 15 | 15 | 15 | 15 |
| Hard Rock | |||||||||
| Deposit | Units | Saramacca | Koolhoven | JZone | Mayo | Rosebel | Pay Caro | Roma West | Royal Hill |
| Current Bench Height Design | m | 16 | 16 | 16 | 10 | 12 | 16 | 12 | 16 |
| Berm Width | m | 13.5 - 10 | 11-Jul | 11-Jul | 9 -7.8 | 10.5 - 11 | 7.6 - 11.5 | 4.5 | 09-Jul |
| Inter-Ramp Angle (IRA) | deg. | 45 - 50 | 46 - 55 | 46 - 55 | 50 - 39 | 47 - 46 | 44 - 55 | 52 | 50 - 55 |
| Bench Face Angle (BFA) | deg. | 70 - 75 | 75 | 75 | 75 | 75 | 70 - 90 | 89 | 75 |
| Maximum Stack Height | m | 112 | 96 | 96 | 96 | 96 | 96 | ||
| Geotech Berm Width | m | 15 | 20 | 20 | 20 | 20 | 20 | 20 | 20 |
| IAMGOLD Corporation - Rosebel Gold Mine | |
| Technical Report NI 43- 101 – November 5, 2018 | Page 15-9 |
| 15.8 |
MINE PLAN |
| 15.8.1 |
PAY CARO |
The Pay Caro pits are located northeast of the Mill site on the northern side of the RGM concession. Mining at the Pay Caro pit began in 2003 and has been mined continuously since.
In the vicinity of the Pay Caro pits is Koolhoven, located to the north-west, J Zone to the north, and the tailings area is in the north-east. Natural drainage west of the Pay Caro pit will be managed as the mining phases progress. Access to the mill and main complex is via a haul road on the south side of the active pits which links with the Rosebel main haul road.
The Pay Caro deposit (including East and West PC) contains a total of six phases:
| 1. |
PC_PH1 | |
| 2. |
PC_N | |
| 3. |
PC_F | |
| 4. |
PC_E | |
| 5. |
PC_W | |
| 6. |
PC_S |
The ultimate pit floor elevation is 224 m resulting in a total pit depth of 285 m. The ultimate pit design can be seen Figure 15-1.
The 2018 ultimate pit design is in line with the increased size realised in the 2017 LOM. Phases PC_PH1, PC_N and PC_S are within the in the central section of the final Pay Caro pit. These phases are located to the west side of the central pit with the two ramping systems:
| 1. |
Exiting on the west and south side to minimize the waste haul distance; | |
| 2. |
Exiting on the south side of the pit to minimize the ore haul distance. |
Phase PC_E is located in the eastern section of the Pay Caro pit where a push back from the current excavation to the south is planned. The ramping system in PC_E exits the pit on the south side, due to the shell expansion.
Phase PC_W is located in the western section the Pay Caro pit and is subdivided in three smaller pit bottoms.
| IAMGOLD Corporation - Rosebel Gold Mine | |
| Technical Report NI 43- 101 – November 5, 2018 | Page 15-10 |
Phase PC_F is the ultimate pit which includes PC_Ph1, PC_N & PC_S. The ultimate pit design ramping system exits the south side of the pit due to current haul roads on the north
The Mineral Reserve at Pay Caro is estimated at 37.2 Mt grading 1.09 g/t Au to yield 1.20 Moz, at a stripping ratio of 4.61 .
FIGURE 15-1 PAY CARO ULTIMATE PIT

Future dumping in the Pay Caro pits will be on the Pay Caro north and south dump. To minimize truck haul distances and reduce the environmental footprint, in-pit waste dumping may be considered in the future. Ex-pit waste dumps are illustrated in Figure 15-2.
| IAMGOLD Corporation - Rosebel Gold Mine | |
| Technical Report NI 43- 101 – November 5, 2018 | Page 15-11 |
FIGURE 15-2 PAY CARO WASTE DUMPS

| 15.8.2 |
J ZONE |
The J Zone pits are located along the northern boundary of the RGM concession, north of Pay Caro and east of Koolhoven pits. Mining at the J Zone pits began in 2014 has been mined every year since.
Due to the proximity of J Zone to the other pits, dumps, and tailings storage facility there is limited space in the surrounding area the develop infrastructure associated with mining this pit.
The primary ore haul route will be located on the southwest side of the west pit with another access off of the Pay Caro North Dump from the east pit. The central drainage zone between the two main pits will be maintained.
The J Zone deposit contains a total of four phases:
| 1. |
JZ_E | |
| 2. |
JZ_C | |
| 3. |
JZ_CE | |
| 4. |
JZ_CW |
| IAMGOLD Corporation - Rosebel Gold Mine | |
| Technical Report NI 43- 101 – November 5, 2018 | Page 15-12 |
The ultimate pit floor elevation is 404 m resulting in a total a pit depth of 150 m. The ultimate pit design can be seen in Figure 15-3.
The J Zone deposit is separated into three main pits, the east pit, the central pit, and the west pit.
Phase JZ_E is the only phase in the east. The ore and waste routes are to the southwest of the phase. Waste will be dumped in the North Pay Caro dump. Ore will be hauled along the north Pay Caro haul road.
Phase JZ_CE is the pit located between J Zone east and the major natural drainage line that traverses J Zone.
Phase JZ_C is located in the central area and includes two ramps: one north and one south for both waste and ore hauls.
The Mineral Reserve at J Zone is estimated at 12.1 Mt grading 0.84 g/t Au to yield 0.33 Moz, at a stripping ratio of 4.44:1.
FIGURE 15-3 J ZONE ULTIMATE PIT
Phase JZ_W is connected to Phase JZ_C and borders the Koolhoven deposit. Phase JZ_W has a south ramp exit for ore hauls and connects to the north ramp for waste hauls.
| IAMGOLD Corporation - Rosebel Gold Mine | |
| Technical Report NI 43- 101 – November 5, 2018 | Page 15-13 |
The phases in the J Zone central and west pit will utilize the J Zone north waste dump while the J Zone east pit will send the waste to the Pay Caro north dump as seen in Figure 15-4. The east portion of the pit will be used for in-pit dumping with waste from the Pay Caro pit whenever haulage is reduced.
FIGURE 15-4 J ZONE DUMP
| 15.8.3 |
KOOLHOVEN |
The Koolhoven pit is located on the northern boundary of the RGM concession, north of Pay Caro and West of J Zone. Mining at the Koolhoven pit has been differed for the last year to exploit higher grade ore in the remaining RGM deposits.
The primary ore haul route will be located on the south-east side of the pit with other accesses on the east side bordering the J Zone West Pit and the west side with faster access to the waste dump.
The Koolhoven deposit contains a total of five phases:
| 1. |
KH_Ph1 | |
| 2. |
KH_Ph2 | |
| 3. |
KH_Ph3 | |
| 4. |
KH_Ph4 | |
| 5. |
KH_Ph5 |
| IAMGOLD Corporation - Rosebel Gold Mine | |
| Technical Report NI 43- 101 – November 5, 2018 | Page 15-14 |
The ultimate pit floor elevation is 296 m resulting in a total a pit depth of 260 m. The ultimate pit design can be seen in Figure 15-5.
The Mineral Reserve at estimated 17.1 Mt of ore at 0.77 g/t Au to yield 0.43 Moz, at a stripping ratio of 5.78.
FIGURE 15-5 KOOLHOVEN ULTIMATE PIT

The majority of waste material from Koolhoven will be sent to the Koolhoven waste dump. Surface stripping from Phase KH_PH2 will be sent to the J Zone waste dump as it is closer.
| IAMGOLD Corporation - Rosebel Gold Mine | |
| Technical Report NI 43- 101 – November 5, 2018 | Page 15-15 |
FIGURE 15-6 KOOLHOVEN DUMP

| 15.8.4 |
ROYAL HILL |
The Royal Hill pit is located along the southern boundary of the RGM concession. Mining commenced in 2004 and has been continuous since.
The Royal Hill pit is located to the east of the Roma East pit. To the north of the Royal Hill pit is an Archeological site (burial ground), a power line, and old camp infrastructure. To the east of the Royal Hill pit lies the Nieuw Koffiekamp village which RGM has a commitment to not advance upon. The RGM concession boundary limits further expansion of the Royal Hill pit to the south.
A drainage line currently exists to the east of the Royal Hill pit and is planned to be maintained through the mine life. An additional drainage system west the pit drains surface water to a settling pond south west of the pit. Access to the mill will be via the haul road located to the north of the pit.
The Royal Hill deposit (comprised of Royal Hill NW Pit and Royal Hill SE Pit) contains a total of four phases:
| 1. |
RH_A3 | |
| 2. |
RH_A6 | |
| 3. |
RH_B31 | |
| 4. |
RH_B32 |
| IAMGOLD Corporation - Rosebel Gold Mine | |
| Technical Report NI 43- 101 – November 5, 2018 | Page 15-16 |
The ultimate pit floor elevation is 258 m resulting in a total pit depth of 250 m. The ultimate pit design can be seen in Figure 15-7.
The 2018 ultimate pit design is in line with the increased size realized in the 2017.
Phase RH_A3 and Phase RH_A6 are in the Royal Hill NW pit. These two phases are designed with the ramping section along the northwest side of the pit to minimize the ore and waste haul distances.
Phase RH_B31 has a ramping system that exits on the west side of the pit to minimize ore and waste haul distance and Phase RH_B32 ramp connects to Phase RH_A6 on elevation 442 m to exit on the west side.
There are an estimated 29.5 Mt grading 1.1 g/t Au to yield 1.06 Moz, at a stripping ratio of 7.54.
FIGURE 15-7 ROYAL HILL ULTIMATE PIT

| IAMGOLD Corporation - Rosebel Gold Mine | |
| Technical Report NI 43- 101 – November 5, 2018 | Page 15-17 |
Future dumping in the Royal Hill pits will be in the Royal Hill west dump. Due to the phasing sequence, in-pit dumping for Phase RH_B31 has been planned in the south portion of the pit to minimize truck haul distances and reduce the environmental footprint. This is illustrated in Figure 15-8.
FIGURE 15-8 ROYAL HILL WASTE DUMPS

| 15.8.5 |
MAYO |
The Mayo deposit is located at the southern boundary of the RGM concession. Mining in Mayo pit commenced in 2009 and has been mined continuously since.
To the east of the Mayo pit is the Roma West pit. Natural drainages are located north of the north Mayo dump. On the south and eastern side of the pit, diversion drains have been constructed to divert surface water away from the pit.
Access to the mill is via a haul road on the northeast side of the pit which links with the Royal Hill haul road.
The Mayo deposit contains a total of eight phases:
| IAMGOLD Corporation - Rosebel Gold Mine | |
| Technical Report NI 43- 101 – November 5, 2018 | Page 15-18 |
| 1. |
MA_1 | |
| 2. |
MA_2 | |
| 3. |
MA_3 | |
| 4. |
MA_4 | |
| 5. |
MA_5 | |
| 6. |
MA_6 | |
| 7. |
MA_7 | |
| 8. |
MA_8 |
The ultimate pit floor elevation is 360 m resulting in a total pit depth of 65 m. The ultimate pit design can be seen in Figure 15-9.
Phase MA_5 is the bottom of the existing main Mayo pit in hard rock. Phase MA_2 is a continuation of the currently stripped north-west pit. All other Mayo pits are relatively small and mainly consist of soft ore.
There are an estimated 3.3 Mt grading 0.91 g/t Au to yield 0.10 Moz, at a stripping ratio of 3.43.
FIGURE 15-9 MAYO ULTIMATE PIT

| IAMGOLD Corporation - Rosebel Gold Mine | |
| Technical Report NI 43- 101 – November 5, 2018 | Page 15-19 |
Future dumping in the Mayo pit will be on the Mayo north waste dump and the Mayo south waste dump illustrated in Figure 15-10.
FIGURE 15-10 MAYO PIT WASTE DUMPS
![]()
| 15.8.6 |
ROSEBEL |
The Rosebel pit is located approximately 12 km southeast of the Rosebel processing plant and is accessed via an 11.5 km haul road that links the east side of East Pay Caro to the Rosebel pit. Mining at the Rosebel pit began in 2012 and has been mined continuously since.
Rosebel pit is isolated from other pits and infrastructure at RGM and is located in the southeast section of the concession. Diversion drainage has been established to the north and south of the pit to control surface water. Access to the mill is via a haul road located on the north side of the pit which connects with the Pay Caro haul road near the mill.
The Rosebel deposit (which consists of Rosebel and Rosebella) contains a total of four phases:
| 1. |
RB_1 | |
| 2. |
RB_2 | |
| 3. |
RB_3 | |
| 4. |
RB_4 |
| IAMGOLD Corporation - Rosebel Gold Mine | |
| Technical Report NI 43- 101 – November 5, 2018 | Page 15-20 |
The ultimate pit floor elevation is 284 m resulting in a pit depth of 250 m. The ultimate pit floor elevation is 360 m resulting in a total pit depth of 65 m. The ultimate pit design can be seen in Figure 15-11.
Phase RB_1 and Phase RB_2 are both part of the Rosebella deposit. The phases disconnect from the RB2 pit at level 492 m, however, they share the same main exit.
Phase RB_3 is the east portion of the current Rosebel pit pushback. Phase RB_3 has a ramp exit on the north side that spirals downwards upwards from the floor of the pit. Phase RB_4 has two ramp exits;
| 1. |
from surface up to elevation 532 m, and | |
| 2. |
along the south closer to the south waste dump. |
There are an estimated 17.3 Mt grading 0.91 g/t Au in-situ with a yield of 0.51 Moz, at a stripping ratio of 7.09.
FIGURE 15-11 ROSEBEL ULTIMATE PIT

| IAMGOLD Corporation - Rosebel Gold Mine | |
| Technical Report NI 43- 101 – November 5, 2018 | Page 15-21 |
Future dumping at the Rosebel pit will be on the Rosebel north and south waste dump as well as in-pit dumping in the Rosebella deposit when mining has been complete as illustrated Figure 15-12.
FIGURE 15-12 ROSEBEL PIT WASTE DUMP

| 15.8.7 |
ROMA |
The two Roma pits, East and West, are located in the southern half of the RGM concession. Mining of the Roma pits began in 2011 and has had mining activity every year since with the exception of 2015.
Roma West has one pushback, RMW that is mainly in hard rock. The ultimate pit floor elevation for Roma West is 440 m resulting in a total pit depth of 80 m. The ultimate pit design can be seen in Figure 15-13.
In the vicinity the Roma pits is the Royal Hill area to the east and Mayo to the west. Natural surface drainage flows southwards. Access to the mill is via the Mayo haul road which is north of the pits.
Currently, the Roma East deposit has been awarded to local small scale miners under an agreement with Rosebel Gold Mines.
| IAMGOLD Corporation - Rosebel Gold Mine | |
| Technical Report NI 43- 101 – November 5, 2018 | Page 15-22 |
Waste material will be dumped in the Mayo south waste dumps. Ore is sent to the mill via the Mayo haul road.
There are an estimated 0.92 Mt grading 0.961 g/t Au available in-situ and 0.02 Moz, at a stripping ratio of 4.4:1
FIGURE 15-13 ROMA PIT PHASE RMW
| 15.8.8 |
SARAMACCA |
The Saramacca deposit is located 30 km southeast of the from Rosebel property. The Saramacca deposit has not been mined in the area where RGM plans to carry out operations. Small scaling mining has occurred nearby the Saramacca deposit.
The primary ore haul route will be located on the east side of the pit.
The Saramacca deposit contains a total of six phases:
| 1. |
SM_1 | |
| 2. |
SM_2 | |
| 3. |
SM_3 | |
| 4. |
SM_4 | |
| 5. |
SM_5 | |
| 6. |
SM_6 |
| IAMGOLD Corporation - Rosebel Gold Mine | |
| Technical Report NI 43- 101 – November 5, 2018 | Page 15-23 |
The ultimate pit floor elevation is -61 m resulting in a total pit depth of 350 m. The ultimate pit design can be seen in Figure 15-14.
Waste material from Saramacca will be selectively placed to maintain adequate stability and drainage. The Saramacca waste dump is to be constructed on shallow sloping (5° to 16°) ground to the east of the proposed pit. Drainage channels have locally incised the broader sloping topography. The dump is to be constructed to approximate heights of 120 m with a final 3:1 gradient slope comprising 15 m high dump platforms. In the early years of mining, the excavated saprolite is to form most of the dump construction materials. Supporting these internal saprolite dump platforms with downslope buttresses constructed with imported fresh rock is critical to achieving acceptable stability conditions. Furthermore, construction of rock drains down the natural gullies where peak surface water run-off is higher, and the inclusion of finger drains is to provide positive hydraulic connection with the rock drains and buttresses.
The Mineral Reserve of Saramacca is 26.5 Mt grading 1.81 g/t Au which yields 1.54 Moz recovered, at a stripping ratio of 10.83.
| IAMGOLD Corporation - Rosebel Gold Mine | |
| Technical Report NI 43- 101 – November 5, 2018 | Page 15-24 |
FIGURE 15-14 SARAMACCA ULTIMATE PIT
| 15.9 |
DESIGN SUMMARY |
The 2018 Mineral Reserve estimate is confined to material within pit design envelopes. All designs have been completed based on a practical mining sequence and geotechnical recommendation in Minesight and Deswik mine design software.
MSSO (MineSight Schedule Optimizer) scheduling software was used to complete the LOM schedule based on the pit designs. The schedule is based on satisfying the processing and mining constraints while evaluating revenue from gold recovered versus the variable and attributable costs associated with material mined per mining area. The output of the schedule is the tonnes and grade of material sent to the process plant, stockpile, and waste dump as well as material reclaimed form the stockpile.
Inferred Mineral Resources inside the pit design has been classified as waste and has no value assigned to it in the pit optimization process.
The Proven and Probable Mineral Reserves for a US$1,200/oz gold price and new open pit designs are listed in Table 15-8.
| IAMGOLD Corporation - Rosebel Gold Mine | |
| Technical Report NI 43- 101 – November 5, 2018 | Page 15-25 |
| 15.10 |
STOCKPILES |
The stockpile status as of September 1, 2018 is presented in Table 15-7. This stockpile inventory is classified as Proven Mineral Reserves. Balances are based on using surveyed volumes and truck factors. Tonnes milled are calculated using a calibrated balance. Tonnes mined are estimated using a combination of truck factors and surveyed volumes.
TABLE 15-7 STOCKPILE STATUS AS OF SEPTEMBER 1, 2018
Stockpiles |
Tonnes
(millions) |
Grade
(g/t Au) |
Contained Ounces (000) 100% Basis |
| Permanent Stockpiles | 20.2 | 0.53 | 344 |
| Temporary Stockpile | 0.2 | 0.66 | 5 |
| Total | 20.5 | 0.53 | 349 |
| 15.11 |
MINERAL RESERVES |
RGM Mineral Reserves as of September 1, 2018 are presented in Table 15-8. The Measured Mineral Resources within the pit design have been classified as Proven Mineral Reserves while Indicated Mineral Resources have been classified as Probable Mineral Reserves.
The Mineral Reserve estimated only contains Measured and Indicated Mineral Resources within pit designs described in this document and is based on a pit optimisation at US$1,200/oz Au. Ore/waste allocation has been defined by the LOM schedule.
Pits not included in this Mineral Reserve estimate are Roma East, Overman, Mamakreek, and East Tailings Road deposits.
| IAMGOLD Corporation - Rosebel Gold Mine | |
| Technical Report NI 43- 101 – November 5, 2018 | Page 15-26 |
TABLE 15-8 RGM PROVEN AND PROBABLE MINERAL RESERVES
Rosebel Gold Mines N.V. 100%
Basis
Mineral Reserve Estimates -
September 1st,
2018
$1,200/oz Pit designs and
$1,200/oz Cut-off Grades
Proven and Probable
Mineral Reserves (Total )
| Saprolite + Saprolite ( soft) | Transition | Rock | Total | |||||||||
| Deposit | Tonnes | Au | Au | Tonnes | Au | Au | Tonnes | Au | Au | Tonnes | Au | Au |
| (000) | (g/t) | (000 oz) | (000) | (g/t) | (000 oz) | (000) | (g/t) | (000 oz) | (000) | (g/t) | (000 oz) | |
| Koolhoven/Bigi | 316 | 0.60 | 6.1 | 11,470.22 | 0.58 | 213.57 | 5,352.12 | 1.19 | 205.17 | 17,138 | 0.77 | 425 |
| J Zone | 740 | 0.62 | 14.78 | 5,413.68 | 0.61 | 105.32 | 5,967.57 | 1.08 | 208.11 | 12,121 | 0.84 | 328 |
| Pay Caro & East Pay Caro | 870 | 0.43 | 12.01 | 4,645.87 | 0.55 | 81.84 | 31,659.37 | 1.09 | 1,108.93 | 37,175 | 1.01 | 1,203 |
| Mayo | 355 | 0.54 | 6.12 | 262.34 | 0.58 | 4.9 | 2,654.43 | 0.99 | 84.27 | 3,272 | 0.91 | 95 |
| Roma | 245 | 0.40 | 3.16 | 253.48 | 0.54 | 4.43 | 415.94 | 0.77 | 10.29 | 915 | 0.61 | 18 |
| Royal Hill | 1,358 | 0.57 | 24.89 | 1,898.76 | 0.62 | 38.06 | 26,296.29 | 1.17 | 992.68 | 29,553 | 1.11 | 1,056 |
| Rosebel | 2,577 | 0.53 | 44.18 | 3,013.28 | 0.61 | 58.72 | 12,107.94 | 1.04 | 404.52 | 17,698 | 0.89 | 507 |
| Saramacca | 11,275 | 1.41 | 510.28 | 5,572.02 | 2.03 | 363.32 | 9,701.82 | 2.14 | 668.35 | 26,549 | 1.81 | 1,542 |
| TOTAL | 17,736 | 0.20 | 621.52 | 32,529.65 | 0.48 | 870.16 | 94,155.49 | 1.00 | 3,682.32 | 144,421 | 1.11 | 5,174 |
| Stockpiles | 15,803 | 0.6 | 283 | |||||||||
| Proven & Probable Total | 17,736 | 0.20 | 622 | 32,530 | 0.50 | 870 | 94,155 | 1.00 | 3,682 | 160,224 | 1.1 | 5,457 |
| IAMGOLD Corporation - Rosebel Gold Mine | |
| Technical Report NI 43- 101 – November 5, 2018 | Page 15-27 |
| 16 |
MINING METHODS |
The mining operation at RGM is a conventional truck and shovel, drill and blast, open pit operation, with an owner fleet. RGM runs an owner operated fleet with sub-contractors used as support for auxiliary activities. The estimated fleet for the LOM plan is outlined in Table 16-1.
In 2019, the annual ex-pit mining target is projected to be 67.3 Mt at stripping ratio of 5.49. The LOM plan for 2019 has 12.4 Mt processed at the Rosebel processing plant at an average grade 0.91 g/t Au to yield approximately 335 koz of recovered gold. This includes mining 0.99 Mt at Saramacca, at a stripping ratio of 3.43. During 2019, 0.22 Mt of Saramacca ore will be processed at the Rosebel processing plant at an average grade of 0.85 g/t Au for a total of 5.7 koz of recovered gold.
| 16.1 |
SARAMACCA MINING FLEET |
A new primary mining fleet is planned for Saramacca and will consist of one Caterpillar (CAT) 6030 face shovel, two Komatsu PC2000 backhoes, and one PC1250 excavator with the support of one CAT 993 loader used at the run of mine (ROM) stockpile to load long-haul trucks.
The proposed haulage fleet will consist of 20 CAT 785 haul trucks within the pit and 10 Haul-Max trucks to haul ROM from Saramacca to the Rosebel processing plant.
| 16.2 |
RGM MINING FLEET |
The RGM loading fleet consists of five CAT 6030 shovels and four CAT 5130 shovels using both the excavator and front shovel configuration supported by one CAT 993 loader used for ROM stockpile reclaim and one CAT 993 loader used in pit.
The hauling fleet consists of 36 CAT 777 haul trucks and 18 CAT 785 haul trucks.
Dust control is accomplished with four CAT 777 water trucks and one CAT 769 water truck.
| IAMGOLD Corporation - Rosebel Gold Mine | |
| Technical Report NI 43- 101 – November 5, 2018 | Page 16-1 |
RGM’s ancillary equipment includes, fuel trucks, mobile light plants, and service trucks. A list of RGM’s primary mine production equipment fleet is in Table 16-1.
TABLE 16-1 MAXIMUM ESTIMATED
LIFE OF MINE PRIMARY MINE
EQUIPMENT FLEET
| Type | Model | Total | RGM | Saramacca |
| Shovel | CAT 6030 | 6 | 5 | 1 |
| CAT 5130 | 0 | 0 | 0 | |
| PC2000 Backhoe | 6 | 4 | 2 | |
| Loader | CAT 993K | 3 | 2 | 1 |
| Caterpillar 785 | 42 | 22 | 20 | |
| Truck | Caterpillar 777 | 35 | 35 | 0 |
| Long Haul Trucks | 10 | 0 | 10 | |
| Drilling | Sandvik DK45 | 6 | 4 | 2 |
| Sandvik D245S | 0 | 0 | 0 | |
| MD6290 | 15 | 11 | 4 | |
| FlexiRoc-D65 | 3 | 2 | 1 | |
| Dozer | CAT D9T | 24 | 24 | |
| CAT 824 Wheeldozer | 2 | 2 | ||
| Excavator | CAT 345/349 | 10 | 10 | |
| PC1250 | 1 | 0 | 1 | |
| Grader | CAT 16H | 1 | 1 | |
| CAT 16G | 1 | 1 | ||
| CAT 16M | 5 | 5 | ||
| Auxiliary | CAT 980/990 Loader | 3 | 3 |
| 16.3 |
PRODUCTION DRILLING |
The drilling fleet consists of a mixed fleet of 13 drills.
Drill and blast parameters vary for each pit due to different material type and pit designs. All drill holes are 165 mm diameter. All blasting activities on site are executed by RGM employees. Holes are loaded with bulk explosive matrix and initiated with non-electric detonators.
Ore movement during blasting is a critical issue at the mine. For this reason, blast movement monitors (BMMs) are systematically used when blasting mineralized areas to measure vertical and horizontal displacement which allows for the adjustment of the post blast ore packets. Blast movement is typically in the order of 4 m horizontally and about 0.8 m vertically, according to recent measurements in 2018.
| IAMGOLD Corporation - Rosebel Gold Mine | |
| Technical Report NI 43- 101 – November 5, 2018 | Page 16-2 |
| 16.4 |
MINE OPERATIONS |
| 16.4.1 |
LONG HAUL – SARAMACCA TO RGM |
The Saramacca deposit is located approximately 30 km southwest of the RGM property (Figure 16-1). Due to the significant distance between the Saramacca pit and the Rosebel processing plant, an ore haulage strategy as follows will be enacted:
| 1. |
All ore mined ex-pit will be completed by a conventional rigid mine truck and shovel operation and will be stockpiled at the ROM Pad. | |
| 2. |
A front end loader will then load long haul trucks which will haul the ore to the Rosebel processing plant via a purpose built haul road. |
In total, 10 Haulmax 3900 series trucks with a payload of 80 t will be used to for “long haul” route between Saramacca and the Rosebel processing plant. The estimated return cycle time is 94 min (1.57 hr). During the first three years of operation there is a lack of mined rock available to construct several waste dump buttresses. Due to this waste rock will be back hauled from the RGM pits. A maximum of ten trucks will be required to haul 2.24 Mtpa of ore at an average productivity of 43 to 49 tph, respectively for soft to hard rock.
A new 23 km purpose built haul road will be constructed between the Mayo deposit and the Saramacca deposit. Long haul trucks from Saramacca traversing this road will then travel along the main RGM haul road with the other RGM traffic and terminate at the main RGM complex.
| IAMGOLD Corporation - Rosebel Gold Mine | |
| Technical Report NI 43- 101 – November 5, 2018 | Page 16-3 |

| IAMGOLD Corporation - Rosebel Gold Mine | |
| Technical Report NI 43- 101 – November 5, 2018 | Page 16-4 |
| 16.4.2 |
REVERSE CIRCULATION GRADE CONTROL DRILLING |
In order to improve the definition of the ore zones, the preferred method for grade control is through RC drilling in all pits. RC grade control drilling is planned on grid spacing of 12 m x 6 m pattern using inclined holes according to the parameters as presented in Table 16-2. Blast hole sampling is used for grade control in areas where RC grade control drilling is not completed. A fleet of five Shram Buggy rigs are used for RC drilling.
TABLE 16-2 REVERSE CIRCULATION GRADE CONTROL PARAMETERS
| RC Parameters | Saprolite | Transition | Rock | |
| Drill pattern | ||||
| Hole inclination | 50° | 50° | 50° | |
| Hole diameter | in | 6.0 | 6.0 | 6.0 |
| Diameter (D) | m | 0.152 | 0.152 | 0.152 |
| Burden (B) | m | 12.0 | 12.0 | 12.0 |
| Spacing (S) | m | 6.0 | 6.0 | 6.0 |
| Subdrill (J) | m | - | - | - |
| Bench height (H) | m | 8.0 | 8.0 | 8.0 |
| Hole length (L) | m | 40.0 | 40.0 | 40.0 |
| 16.4.3 |
PRODUCTION DRILLING AND BLASTING |
RGM presently has a total fleet of 13 drills including one Atlas Copco D65, four Sandvik D45KS/D45S, and eight CAT MD6290 drills. All blast hole drills are equipped to drill 165 mm diameter holes.
Drill and blast parameters vary by pit due to different material types and pit designs. Blasts are designed based on post blast requirements from the geology, geo-tech, and operations departments.
A number of trials were conducted with both pyrotechnic and electronic detonators to identify potential opportunities for improvement in fragmentation, dilution management, and wall control. The trials included seed wave analysis using signatures shots, ground wave velocities using cross hole tests, pattern expansions, combined trim and production shots in narrow areas, Interactive shielding, etc.
| IAMGOLD Corporation - Rosebel Gold Mine | |
| Technical Report NI 43- 101 – November 5, 2018 | Page 16-5 |
Pre-splitting of selective areas of the pit walls is carried out based on the recommendations from the ground control department. Pre-split parameters are designed to achieve borehole pressure within 130-140 mega Pascals using 165 mm holes.
Blast design flexibility is limited to pit constraints including operating width, bench height, ore movement direction, etc. Most of these constraints make it necessary to identify post blast priorities of each shot and to design the shot accordingly. The achievement of optimal slope angles and stable inter-ramps, within the hard rock, requires a well implemented program of wall control blasting. The program requires a substantial reduction in the size of blasting blocks along the perimeter wall and the use of well-engineered blast designs that include free faces and suitable timing.
Drilling and blasting parameters are provided in Table 16-3.
| IAMGOLD Corporation - Rosebel Gold Mine | |
| Technical Report NI 43- 101 – November 5, 2018 | Page 16-6 |
TABLE 16-3 DRILL AND BLAST PARAMETERS
| Pit | PC, JZ, RH | MA, RM, MA | Saramacca | |||||||
| Rock Type | Soft | Trans | Hard | Soft | Trans | Hard | Soft | Trans | Hard | |
| Bench Height | m | 08-Jun | 08-Jun | 08-Jun | 08-May | 08-May | 08-May | 08-May | 08-May | 08-May |
| Burden | m | 6 - 4.9 | 5.2 - 4.4 | 5.2 - 4.4 | 6 - 3.9 | 4.4 - 3.5 | 4.4 - 3.5 | 6 - 3.9 | 4.4 - 3.5 | 4.4 - 3.5 |
| Spacing | m | 7 - 5.5 | 06-May | 06-May | 7 - 4.5 | 05-Apr | 05-Apr | 7 - 4.5 | 05-Apr | 05-Apr |
| Subdrill | m | 0 | 0.5 | 0.5 | 0.5 | 0.5 | 0.5 | 0.5 | 0.5 | 0.5 |
| Charge Length | m | 3.6 - 2.8 | 4.8 - 3 | 5.7 - 3.4 | 3.6 - 2.8 | 4.8 - 3 | 5.7 - 3.4 | 3.6 - 2.8 | 4.8 - 3 | 5.7 - 3.4 |
| Stem Length | m | 4.4 - 3.2 | 3.7 - 3 | 3.1 - 3.1 | 4.4 - 3.2 | 3.7 - 3 | 3.1 - 3.1 | 4.4 - 3.2 | 3.7 - 3 | 3.1 - 3.1 |
| Yield/Hole | t/hole | 571 - 275 | 574 - 304 | 699 - 370 | 571 - 149 | 405 - 161 | 493 - 196 | 571 - 149 | 405 - 161 | 493 - 196 |
| Yield/Metre | t/m | 71 - 46 | 72 - 47 | 87 - 57 | 71 - 30 | 48 - 29 | 58 - 36 | 71 - 30 | 48 - 29 | 58 - 36 |
| Powder Factor | kg/t | 0.26 - 0.16 | 0.25 - 0.21 | 0.3 - 0.21 | 0.48 - 0.16 | 0.48 - 0.25 | 0.44 - 0.3 | 0.48 - 0.16 | 0.48 - 0.25 | 0.44 - 0.3 |
| IAMGOLD Corporation - Rosebel Gold Mine | |
| Technical Report NI 43- 101 – November 5, 2018 | Page 16-7 |
| 16.5 |
LIFE OF MINE PRODUCTION SCHEDULE |
The LOM schedule and production rate have been established to feed the mill to its power capacity while respecting annual mining rate constraints, phase drop down rates, and minimizing truck peak requirements.
The LOM plan was completed by month for 2019, quarterly in 2020, and annually for the remainder of the schedule from 2021 to 2033. The results of the schedule are presented on an annual basis.
The processing rate of the Rosebel plant has a limit of 12.77 Mtpa for all rock types combined. The feed is also limited by rock hardness; which is taken into account as “Factored Tonnes”; where fresh rock has a higher factor than soft or transition. The total factored tonnes limit at the mill is 8.827 Mtpa. Diluted ore tonnages were accounted for in determining the processing rate limits at plant.
From 2019 until 2024 the plant is operated at its maximum processing capacity and from 2025 onwards, the tonnage of fresh rock increase and mill feed is reduced to approximately 9 Mtpa, due to the factored tonnes limit.
TABLE 16-4 WEIGHTING FACTORS PER DEPOSIT
| Deposit | Soft | Transition | Hard |
| Saramacca | 0.167 | 0.333 | 1.25 |
| Koolhoven | 0.167 | 0.333 | 1.00 |
| J Zone | 0.167 | 0.333 | 1.00 |
| Mayo | 0.167 | 0.333 | 1.50 |
| Rosebel | 0.167 | 0.333 | 1.00 |
| Pay Caro | 0.167 | 0.333 | 1.00 |
| Roma West | 0.167 | 0.333 | 1.50 |
| Royal Hill | 0.167 | 0.333 | 1.25 |
The production starts at a rate of 67.3 Mtpa in 2019 and steadily increases to a rate of 74.0 Mtpa from the RGM pits and 30 Mtpa from the Saramacca pit until 2021. The production rate stays relatively constant until 2026 from the RGM pits and is steady at 30 Mtpa from the Saramacca pit until 2029, then it starts to decline until the end of production in 2033. In the later years, production rates are reduced due to longer haulage distances, higher percentage of fresh rock, and the number of available working areas at the pit bottoms, which are not as productive as on the upper benches.
| IAMGOLD Corporation - Rosebel Gold Mine | |
| Technical Report NI 43- 101 – November 5, 2018 | Page 16-8 |
While the schedule targets softer ore in the earlier years, the proportion of hard rock in the mill feed varies from a maximum of 50% between 2019 and 2024, increases slowly from 66% to 92% between 2025 and 2029, and becomes 100% of the mill feed between 2031 and 2033.
Figure 16-2 shows the annual production, reported by pit, as well as the overall stripping ratio. Figure 16-3 shows the annual mill feed by ore type as well as the feed grade.
FIGURE 16-2 MINING BY PIT – RGM AND SARAMACCA 2019 LIFE OF MINE PLAN

| IAMGOLD Corporation - Rosebel Gold Mine | |
| Technical Report NI 43- 101 – November 5, 2018 | Page 16-9 |
FIGURE 16-3 MILL FEED – RGM AND SARAMACCA 2019 LIFE OF MINE PLAN

The LOM mine plan assumes a maximum annual vertical rate of mining advance of 64 m, with the exception of the southern portion of the Saramacca pit where the limit is 32 m. Further details on data are identified in Table 16-5.
| IAMGOLD Corporation - Rosebel Gold Mine | |
| Technical Report NI 43- 101 – November 5, 2018 | Page 16-10 |
TABLE 16-5 LIFE OF MINE PLAN
| 2019 | 2020 | 2021 | 2022 | 2023 | 2024 | 2025 | 2026 | 2027 | 2028 | 2029 | 2030 | 2031 | 2032 | 2033 | Total | ||
| Koolhoven | Ore Tonnes | 123,728 | 615,228 | 1,765,694 | 803,372 | 2,806,623 | 4,394,317 | 1,700,083 | 3,230,606 | 1,698,727 | - | - | - | - | - | - | 17,138,377 |
| g/t Au | 0.67 | 0.79 | 0.71 | 0.47 | 0.55 | 0.58 | 0.87 | 0.90 | 1.50 | - | - | - | - | - | - | 0.77 | |
| Waste Tonnes | 2,734,985 | 8,095,622 | 4,921,455 | 10,057,503 | 16,921,104 | 18,791,515 | 13,080,034 | 20,666,864 | 3,715,483 | - | - | - | - | - | - | 98,984,566 | |
| All Tonnes | 2,858,713 | 8,710,850 | 6,687,149 | 10,860,875 | 19,727,727 | 23,185,832 | 14,780,117 | 23,897,471 | 5,414,209 | - | - | - | - | - | - | 116,122,943 | |
| S/R (-) | 22.10 | 13.16 | 2.79 | 12.52 | 6.03 | 4.28 | 7.69 | 6.40 | 2.19 | - | - | - | - | - | - | 5.78 | |
| J Zone | Ore Tonnes | 1,122,029 | 692,513 | 447,615 | 3,106,024 | 348,344 | - | 121,405 | 1,289,389 | 1,294,682 | 517,287 | 2,179,728 | - | - | - | - | 11,119,016 |
| g/t Au | 0.87 | 0.87 | 0.74 | 0.95 | 0.99 | - | 0.37 | 0.45 | 0.58 | 0.84 | 1.16 | - | - | - | - | 0.86 | |
| Waste Tonnes | 6,601,069 | 3,687,617 | 3,134,615 | 7,354,214 | 570,687 | 236,544 | 6,512,460 | 9,329,148 | 5,569,207 | 1,915,773 | 5,239,457 | - | - | - | - | 50,150,792 | |
| All Tonnes | 7,723,099 | 4,380,129 | 3,582,230 | 10,460,238 | 919,031 | 236,544 | 6,633,865 | 10,618,537 | 6,863,890 | 2,433,060 | 7,419,186 | - | - | - | - | 61,269,809 | |
| S/R (-) | 5.88 | 5.32 | 7.00 | 2.37 | 1.64 | - | 53.64 | 7.24 | 4.30 | 3.70 | 2.40 | - | - | - | - | 4.51 | |
| Pay Caro | Ore Tonnes | 3,190,323 | 2,284,170 | 1,250,104 | 827 | 68,461 | 496,830 | 719,011 | 2,006,037 | 3,172,613 | 3,280,184 | 2,845,533 | 5,126,784 | 4,712,943 | 5,588,077 | 477,589 | 35,219,485 |
| g/t Au | 1.16 | 0.90 | 0.83 | 0.47 | 0.39 | 0.38 | 0.75 | 1.10 | 1.28 | 1.26 | 1.12 | 0.60 | 1.01 | 1.05 | 1.36 | 1.01 | |
| Waste Tonnes | 8,505,720 | 13,760,443 | 5,076,983 | 592,043 | 2,146,580 | 7,465,730 | 17,246,003 | 14,643,948 | 18,891,578 | 15,658,786 | 19,417,577 | 19,847,980 | 16,075,186 | 4,890,943 | 204,530 | 164,424,029 | |
| All Tonnes | 11,696,043 | 16,044,613 | 6,327,087 | 592,870 | 2,215,041 | 7,962,560 | 17,965,014 | 16,649,985 | 22,064,191 | 18,938,969 | 22,263,110 | 24,974,764 | 20,788,129 | 10,479,020 | 682,118 | 199,643,514 | |
| S/R (-) | 2.67 | 6.02 | 4.06 | 715.72 | 31.35 | 15.03 | 23.99 | 7.30 | 5.95 | 4.77 | 6.82 | 3.87 | 3.41 | 0.88 | 0.43 | 4.67 | |
| Rosebel | Ore Tonnes | 2,146,854 | 2,346,402 | 2,721,964 | 2,816,183 | 2,468,665 | 3,177,726 | 1,627,812 | - | - | - | - | - | - | - | - | 17,305,606 |
| g/t Au | 0.64 | 0.75 | 0.98 | 0.71 | 0.75 | 1.00 | 1.60 | - | - | - | - | - | - | - | - | 0.89 | |
| Waste Tonnes | 20,935,666 | 19,107,357 | 18,041,163 | 22,022,908 | 22,231,623 | 15,245,280 | 5,187,284 | - | - | - | - | - | - | - | - | 122,771,281 | |
| All Tonnes | 23,082,520 | 21,453,759 | 20,763,126 | 24,839,091 | 24,700,288 | 18,423,007 | 6,815,096 | - | - | - | - | - | - | - | - | 140,076,887 | |
| S/R (-) | 9.75 | 8.14 | 6.63 | 7.82 | 9.01 | 4.80 | 3.19 | - | - | - | - | - | - | - | - | 7.09 | |
| Mayo | Ore Tonnes | 564,780 | 929,120 | 1,023,135 | 5,309 | - | - | - | - | - | - | - | - | - | - | - | 2,522,345 |
| g/t Au | 0.88 | 0.81 | 1.01 | 0.42 | - | - | - | - | - | - | - | - | - | - | - | 0.90 | |
| Waste Tonnes | 2,009,466 | 2,028,951 | 5,293,909 | 32,179 | - | - | - | - | - | - | - | - | - | - | - | 9,364,504 | |
| All Tonnes | 2,574,246 | 2,958,071 | 6,317,044 | 37,488 | - | - | - | - | - | - | - | - | - | - | - | 11,886,849 | |
| S/R (-) | 3.56 | 2.18 | 5.17 | 6.06 | - | - | - | - | - | - | - | - | - | - | - | 3.71 | |
| Roma West | Ore Tonnes | - | - | 610,699 | 304,164 | - | - | - | - | - | - | - | - | - | - | - | 914,863 |
| g/t Au | 0.55 | 0.72 | - | - | - | - | - | - | - | - | - | - | - | 0.61 | |||
| Waste Tonnes | 3,362,833 | 696,003 | - | - | - | - | - | - | - | - | - | - | - | 4,058,835 | |||
| All Tonnes | 3,973,532 | 1,000,166 | - | - | - | - | - | - | - | - | - | - | - | 4,973,698 | |||
| S/R (-) | 5.51 | 2.29 | - | - | - | - | - | - | - | - | - | - | - | 4.44 | |||
| Royal Hill | Ore Tonnes | 3,001,564 | 1,640,706 | 1,444,832 | 1,492,403 | 2,039,078 | 3,106,711 | 3,687,242 | 3,459,677 | 1,786,506 | 2,783,672 | 2,231,346 | 359,803 | - | - | - | 27,033,539 |
| g/t Au | 1.10 | 0.96 | 0.83 | 1.07 | 1.06 | 1.21 | 1.11 | 1.17 | 1.04 | 1.17 | 1.36 | 1.18 | - | - | - | 1.12 | |
| Waste Tonnes | 15,352,735 | 14,282,417 | 23,433,095 | 23,202,976 | 22,957,639 | 21,871,110 | 21,005,026 | 18,624,465 | 23,139,623 | 22,190,627 | 9,763,672 | 381,774 | - | - | - | 216,205,157 | |
| All Tonnes | 18,354,298 | 15,923,123 | 24,877,927 | 24,695,379 | 24,996,718 | 24,977,820 | 24,692,268 | 22,084,142 | 24,926,128 | 24,974,298 | 11,995,018 | 741,577 | - | - | - | 243,238,696 | |
| S/R (-) | 5.11 | 8.71 | 16.22 | 15.55 | 11.26 | 7.04 | 5.70 | 5.38 | 12.95 | 7.97 | 4.38 | 1.06 | - | - | - | 8.00 | |
| Sarammca | Ore Tonnes | 222,668 | 1,707,779 | 1,398,889 | 2,332,549 | 2,259,878 | 2,148,883 | 2,277,647 | 2,363,618 | 2,617,700 | 2,658,439 | 1,585,209 | 1,996,726 | 1,840,410 | 1,138,590 | - | 26,548,985 |
| g/t Au | 0.85 | 1.58 | 0.81 | 1.32 | 1.72 | 1.37 | 2.17 | 1.92 | 1.54 | 2.64 | 2.61 | 0.93 | 2.32 | 2.80 | - | 1.81 | |
| Waste Tonnes | 764,428 | 8,092,491 | 28,566,151 | 27,577,515 | 27,644,907 | 21,385,405 | 27,455,658 | 27,561,573 | 27,190,561 | 27,154,703 | 28,318,833 | 23,030,211 | 11,456,813 | 1,447,244 | - | 287,646,491 | |
| All Tonnes | 987,096 | 9,800,270 | 29,965,040 | 29,910,064 | 29,904,785 | 23,534,289 | 29,733,306 | 29,925,191 | 29,808,261 | 29,813,141 | 29,904,041 | 25,026,937 | 13,297,223 | 2,585,834 | - | 314,195,477 | |
| S/R (-) | 3.43 | 4.74 | 20.42 | 11.82 | 12.23 | 9.95 | 12.05 | 11.66 | 10.39 | 10.21 | 17.86 | 11.53 | 6.23 | 1.27 | - | 10.83 | |
| Total | Ore Tonnes | 10,371,946 | 10,215,917 | 10,662,932 | 10,860,832 | 9,991,048 | 13,324,468 | 10,133,201 | 12,349,327 | 10,570,227 | 9,239,581 | 8,841,816 | 7,483,314 | 6,553,353 | 6,726,667 | 477,589 | 137,802,216 |
| G/T | 0.88 | 0.91 | 0.81 | 0.67 | 0.95 | 0.95 | 1.35 | 1.11 | 1.18 | 1.56 | 1.17 | 0.72 | 1.38 | 1.35 | 1.36 | 1.05 | |
| Waste g/t Au | 56,904,070 | 69,054,897 | 91,830,203 | 91,535,340 | 92,472,541 | 84,995,584 | 90,486,466 | 90,825,999 | 78,506,452 | 66,919,888 | 62,739,538 | 43,259,964 | 27,531,999 | 6,338,187 | 204,530 | 953,605,656 | |
| All Tonnes | 67,276,015 | 79,270,815 | 102,493,134 | 102,396,172 | 102,463,589 | 98,320,052 | 100,619,666 | 103,175,325 | 89,076,679 | 76,159,469 | 71,581,354 | 50,743,278 | 34,085,352 | 13,064,853 | 682,118 | 1,091,407,872 | |
| S/R (-) | 5.49 | 6.76 | 8.61 | 8.43 | 9.26 | 6.38 | 8.93 | 7.35 | 7.43 | 7.24 | 7.10 | 5.78 | 4.20 | 0.94 | 0.43 | 6.92 |
| IAMGOLD Corporation - Rosebel Gold Mine | |
| Technical Report NI 43- 101 – November 5, 2018 | Page 16-11 |
| 17 |
RECOVERY METHODS |
The original Rosebel processing plant was nominally designed to process 5.0 Mtpa, or approximately 14,000 tpd of ore. The gold processing plant has not been expanded since the last technical report, “Rosebel Mine, Suriname NI 43-101 Technical Report” released on September 5th, 2017.
Based on the metallurgical testwork results, the processing plant at RGM has seen a number of expansion initiatives, since commissioning in 2004, to allow for sustained throughput rates at increased hard rock ratios including:
| • |
Installation of ball mill #2 in 2009; | |
| • |
Completion of CIL train #2 in 2010; | |
| • |
Completion of additional Leach tank to increase retention time in 2010; | |
| • |
Installation of ball mill #3 in 2011; | |
| • |
Completion upgrade gravity circuit including installation 3 (three) Falcon SB 5200s, and an Acacia intensive leach reactor in 2012; | |
| • |
Installation of secondary crusher plant, commissioning of Powerflex SAG drive, SAG shell liner design change from 40 to 30 row and increased media size from 125mm to 140 mm to increase hard rock capacity in 2016. |
The nameplate capacity of the process plant is 12.5 Mtpa. The plant has been operating near this capacity on a sustained long term basis. This near nameplate design capacity, is expected for 2018 and beyond.
Figure 17-1 shows the historical ore processed and the hard rock ratio from 2004 through to 2017.
| IAMGOLD Corporation - Rosebel Gold Mine | |
| Technical Report NI 43- 101 – November 5, 2018 | Page 17-1 |
FIGURE 17-1 ORE PROCESSED AND HARD ROCK RATIO
![]()
| 17.1 |
OVERVIEW OF THE EXISTING PROCESSING PLANT |
The metallurgical process has; a conventional grinding (including gravity) circuit, dewatering circuit, leach circuit, carbon in leach (CIL) circuit, elution circuit, and refinery. Gold recovery facilities include acid washing, carbon stripping, and electro winning, followed by bullion smelting and carbon regeneration. The process was developed to accommodate varying ratios of soft rock, transition, and hard rock ores. The process used at RGM was developed through various testing programs and through additional initiatives by mill personnel to improve the process since commissioning. Further process optimization continues to target constraints and opportunities to increase plant capacity and performance. Figure 17-2 shows the present RGM process plant flowsheet.
| IAMGOLD Corporation - Rosebel Gold Mine | |
| Technical Report NI 43-101 – November 5, 2018 | Page 17-2 |

| IAMGOLD Corporation - Rosebel Gold Mine | |
| Technical Report NI 43-101 – November 5, 2018 | Page 17-3 |
| 17.1.1 |
CRUSHING, STOCKPILING AND RECLAIM |
Run-of-mine from the hard rock stockpile is delivered to the primary crushing facility by haul trucks and front-end loaders. Ore delivery from the mine is on a 24 hour per day schedule. The primary crusher incorporates a 1.37 m x 1.88 m gyratory crusher, followed by a vibrating grizzly and a 2.1 m secondary crushing system that produces the required feed for SAG mill. The crushing product sizing is set at minus 63 mm (2.5”) . An active hard rock stockpile is maintained at approximately 50,000 tonnes.
Soft rock feed is maintained through two grizzlies using one dozer and two backhoes, with an active stockpile maintained at approximately 200,000 tonnes. Hard rock/soft rock blending to the SAG feed conveyor is maintained by two 1.8 m x 6.9 m apron feeders respectively.
| 17.1.2 |
GRINDING AND CLASSIFICATION |
The two stage grinding circuit produces 80% passing 74 microns from the cyclone overflow. The first stage includes a 9.1 m x 4.0 m SAG mill driven by a 7,500 hp variable speed motor controlled by a Power Flex drive. The SAG mill is operating in an open circuit feeding two 2.4 m x 4.8 m vibratory screens. Screen oversize is processed through a cone crusher with ½” product returning to the SAG mill. Undersize from the SAG mill discharge screen is pumped to the pressure distributor where it is combined with the ball mill discharge and process water. The second grinding stage consists of two 5.0 m x 8.2 m ball mills driven by 4,500 hp motors and one 5.0 m x 9.3 m ball mill driven by 5,200 hp fixed speed motor that operate in parallel closed circuit and receive the SAG discharge screen undersize. The ball mills operate in closed circuit with each cyclone cluster consisting of eight 660 mm diameter cyclones. The cyclone cluster is fed by a combination of the SAG mill discharge, the ball mill discharge, and process water. The cyclone underflow reports back to the ball mill for further grinding, while the cyclone overflow, at 35 wt% solids and 80% passing 75 microns (200 mesh) flow by gravity to the four 25 m2 linear screens to remove trash from the slurry.
| 17.1.3 |
GRAVITY CIRCUIT |
Approximately 20% of the cyclone underflow from each cyclone cluster reports to the Sizetec 2.1 m x 4.9 m vibratory screens fitted with 10 mesh panels. Oversize reports to the ball mill discharge pump boxes, and undersize reports to the gravity circuit via a magnetic drum separator at a rate 400 tph. The plant has a gravity circuit consisting of three Falcon concentrators, a Consep Acacia intensive leach reactor, and a Deister table. The concentrate is leached with high concentration cyanide and the pregnant solution is transferred to the Electrowinning cell. The Deister table is used to upgrade the purity of the concentrate up to 75%, prior to smelting whenever the Acacia reactor is offline. Gravity recovery represents up to 30% of gold production. Gravity tails are pumped back to the SAG screen undersize pump box.
| IAMGOLD Corporation - Rosebel Gold Mine | |
| Technical Report NI 43-101 – November 5, 2018 | Page 17-4 |
| 17.1.4 |
THICKENING, LEACHING, AND ADSORPTION CIRCUIT |
Trash screen undersize reports directly to a 53 m x 2.9 m high rate thickener. The slurry is thickened from 35% (w/w) solid to 50% (w/w) solid prior pumped to the leach tanks. The thickener overflow is flowed to the process water tank.
The current leaching and adsorption circuit consist of two parallel lines consisting of two agitated leach tanks followed by seven leach-adsorption stages. Each stage of the adsorption circuit consists of a mechanically agitated tank equipped with a mechanically swept vertical 13.5 m2 carbon retaining screen. Slurry flows from tank to tank, and carbon is advanced counter current by pumping slurry upstream from tank to tank.
There is an online automatic sampler that samples the leach feed. Plant air is injected into the tanks to aid the leaching kinetics. The circuit residence time varies from approximately 28 hours to 33 hours, dependent on mill throughput and tanks availabilities. Additional leach tanks, installed with the plant expansion in 2010, provide a total tank volume of 65,000 m3 that maintains the residence time at 33 hours at 35,000 tpd and 50% (w/w) solids.
Lime is added to the grinding circuit to increase the slurry pH to 10.5 which is the alkalinity set point for cyanidation. Sodium cyanide is added to the SAG feed chute and the first leach tanks to effect gold leaching. All tanks are sparged with low pressure air to ensure sufficient oxygen is available for the gold dissolution reaction.
Granular 6 x 12 mesh activated carbon is present in the CIL slurry to absorb the gold-cyanide complex ion, and is maintained at a concentration of 10 kg/m3 to 12 kg/m3 per tank.
The tailings slurry is pumped to the tailings storage facility and the water is reclaimed for the process. Pumping of tailings slurry is maintained by three sets of three pumps in series, of which two sets are active and one set is maintained as stand-by. Slurry is pumped (at approximately 46% solids) for 6 km to three operating booster pumps which push material up to a further 5 km to various spigot points.
| IAMGOLD Corporation - Rosebel Gold Mine | |
| Technical Report NI 43-101 – November 5, 2018 | Page 17-5 |
| 17.1.5 |
CARBON STRIPPING (ELUTION) AND ELECTROWINNING |
The metal-loaded carbon is transferred to the desorption circuit using the loaded carbon transfer pump. The carbon is screened and washed with process water on the loaded carbon screen and reports to the acid wash column. Loaded carbon is then acid washed with 4% (w/v) nitric acid pumped from the acid mixing tank. The carbon is allowed to soak, with acid-soluble metals being dissolved from the loaded carbon. After soaking, the carbon is rinsed with fresh water. Spent acid solution is neutralized with caustic, prior to being pumped to the tailings pump box.
The Rosebel elution circuit utilizes a batch pressure Zadra to treat carbon in 10 t batches. To recover gold from the carbon, batches of carbon are subject to a high pressure and temperature, chemical process termed elution. A hot, 0.1% cyanide and 2% caustic solution is used to remove the gold from the carbon and dissolved into solution. There are two stripping vessels installed to maintain two strips per day, as required.
Barren strip solution is pumped through a heat recovery heat exchanger and a solution heater. The solution then flows up through the bed of carbon and overflows near the top of the stripping vessel. The pregnant solution is cooled by exchanging heat with barren solution and flows through a back pressure control valve to the pregnant solution holding tank.
Pregnant solution is pumped from the pregnant solution tank through the electrowinning cells where gold is recovered by electrolysis. Barren solution is then returned to the barren solution tank for recycle. Gold is recovered from this pregnant solution by electrowinning onto stainless steel wire wool cathodes in two electrowinning cells running in parallel with a target of 85% efficiency. The loaded cathodes are removed and pressure washed, with the gold in the form of sludge being recovered and dried. The dried gold sludge which could be combined with gravity concentrate, is mixed with fluxing chemicals and smelted on site to produce bullion bars of 88%-92% gold purity, with silver forming most of the balance of metal.
| IAMGOLD Corporation - Rosebel Gold Mine | |
| Technical Report NI 43-101 – November 5, 2018 | Page 17-6 |
The gold bullion is shipped to the contracted refinery for further processing and subsequent sale. All shipment processes are under high security control.
The fine carbon generated in the stripping circuit is collected at the educator tank and shipped out on a monthly basis to the smelter.
| 17.1.6 |
POWER |
RGM has seen continued rise in power consumption from 2004 to 2014 with various equipment additions to accommodate the increased throughput and hard rock feed ratio. Power consumption, on-site, is divided into three categories, mill grinding (52%), mill other (38%), and site infrastructure and mining (10%). The plant consumption is anticipated to be approximately 30 MW for the LOM.
| 17.1.7 |
CONSUMABLES |
Mill consumables have seen significant increases with plant expansion initiatives and consequent increases in throughput. With increased hard rock ratios an increase of grinding media consumption is expected as throughputs are expected to be maintained. Table 17-1 shows the projected five year reagent consumption.
TABLE 17-1 MILL CONSUMABLES
| Consumables - tonnes | 2019 | 2020 | 2021 | 2022 | 2023 |
| 5” Balls | 1,842 | 1,990 | 1,966 | 1,938 | 2,006 |
| 2” Balls | 5,366 | 5,822 | 5,692 | 5,644 | 5,718 |
| Lime | 12,231 | 12,507 | 12,427 | 13,064 | 13,328 |
| Cyanide | 5,313 | 5,502 | 5,603 | 5,621 | 5,569 |
| Flocculant | 167 | 171 | 170 | 170 | 169 |
| Caustic Soda | 736 | 758 | 766 | 766 | 760 |
| Nitric Acid | 2,024 | 2,085 | 2,107 | 2,107 | 2,090 |
| Carbon | 552 | 569 | 575 | 575 | 570 |
| Anti Scalant | 98 | 101 | 102 | 102 | 101 |
Note: 5 year reagent consumption based on mill feed schedule LOM V3B
| 17.2 |
CONCLUSION |
Control strategies have been implemented to improve control of plant operational parameters which result in benefits to process stabilization/automation. Comminution circuit process optimization has also been extended to re-design liners in order to improve SAG mill capacity with the higher hard rock ratio. The gravity circuit optimization and CIL optimization is a continuous process targeting improved recoveries.
| IAMGOLD Corporation - Rosebel Gold Mine | |
| Technical Report NI 43-101 – November 5, 2018 | Page 17-7 |
| 17.3 | INTEGRATION OF SARAMACCA INTO THE EXISTING PROCESSING PLANT |
| 17.3.1 |
RGM PROCESS PLANT MODIFICATIONS |
Based on the Saramacca FS test work program, it was concluded that no modification would be required at the Rosebel processing plant to accommodate the introduction of Saramacca ore. Following optimization test work results, additional equipment could be added at a later stage to the existing plant if economical.
| 17.3.2 |
SAMPLING |
While no changes are recommended to the process flowsheet, sampling systems for laterite/saprolite and transition/hard rock were added for metal reconciliation purposes mainly due to the partnership with Suriname government. The purpose of the sampling systems is to accurately account for the gold entering RGM from Saramacca.
Various options were considered for both saprolite/laterite and transition/hard rock sampling that would satisfy both IAMGOLD and the Surinamese government in terms of the need for accurate metal accounting, logistics and if possible, minimization of CAPEX and OPEX costs. The details of the selected sampling system for the current FS are summarized in the following sections.
At the Rosebel processing plant, hard and transition ore is crushed through a gyratory crusher, followed by a cone crusher producing -75mm product, which is conveyed to a large stockpile and reclaimed by feeders to the SAG mill conveyor. The saprolite ore is handled through a separate system in which ore is handled by bulldozer on the ROM pile from which backhoes feed apron feeders which in turn deliver saprolite directly onto the SAG feed conveyor, on top of crushed ore reclaimed from the crushed ore stockpile.
| IAMGOLD Corporation - Rosebel Gold Mine | |
| Technical Report NI 43-101 – November 5, 2018 | Page 17-8 |
A separate sampling system was considered for each plant feed due to differences in material characteristics and the need to sample before the materials are mixed (due to the partnership contract with government of Surinam) on the SAG feed conveyor.
| 17.3.2.1 |
LATERITE AND SAPROLITE |
Sampling of the saprolite material poses a significant challenge due to the clay-like nature of the ore and the way in which it is stockpiled and fed to the plant (using dozers and backhoes that feed grizzlies installed over chutes which then deposit material onto feeders that drop saprolite on top of crushed ore on the SAG feed conveyor). These constraints prevent sampling on the SAG feed conveyor since the material is already mixed with crushed ore, and the stickiness of the material and inconsistent feed rates of saprolite make sampling at the conveyor feed chutes or off the conveyor feeders unviable solutions. It was therefore concluded that in order to accurately account for the gold coming from Saramacca, the material arriving at RGM would need to be weighed and sampled before being stockpiled. After discussions with several sampling system vendors, a relatively simple system consisting of an auger-type pipe sampling solution was selected. While it is not considered as accurate as a cross-belt or falling stream sampler, it was simpler and less prone to problems due to the sticky nature of the material.
The proposed system consists 80 t trucks delivering material from Saramacca to RGM driving onto a weigh scale before entering the automated sampling station. Here, a machine operated lance or auger will withdraw a sample from the truck with the sample location being determined by a random number generator to avoid the introduction of operator bias. The truck then exits the sampling station and delivers the ore to the stockpile. A second record of the truck weight would then be obtained on the weight scale to account for carryback. Once the sample is collected, it is held in a sealed bucket or container and all samples accumulated over a shift are then transported to the onsite laboratory for further splitting, drying, pulverization, chemical analysis sample preparation, and assaying steps.
An important consideration for the auger sampler will be to determine the number of sample increments needed to achieve the precision required based on the agreement between IAMGOLD and the government. The sampling frequency can only be determined once the system is installed and operating.
| IAMGOLD Corporation - Rosebel Gold Mine | |
| Technical Report NI 43-101 – November 5, 2018 | Page 17-9 |
| 17.3.2.2 |
TRANSITION AND HARD ROCK |
In the case of hard rock, because both Rosebel and Saramacca materials would be processed through the crushing plant, the sampling system will be installed ahead of the stockpile where the materials are being blended.
| IAMGOLD Corporation - Rosebel Gold Mine | |
| Technical Report NI 43-101 – November 5, 2018 | Page 17-10 |
| 18 |
PROJECT INFRASTRUCTURE |
| 18.1 |
RGM SITE |
| 18.1.1 |
ROAD AND TRANSPORTATION |
| 18.1.1.1 |
MAIN ACCESS ROAD |
The RGM property lies approximately 85 km south of the capital city of Paramaribo. The best mode of travel to the site is by road, which takes about two hours from Paramaribo. The road is a paved asphalt road and is in good condition and capable of carrying heavy equipment.
| 18.1.1.2 |
AIR STRIP |
An existing airstrip with an approximate length of 1.2 km is used for emergency evacuation and gold shipment. The airstrip is located 5 km from the campsite.
| 18.1.1.3 |
SITE ROADS |
The site roads include access from the main gatehouse to the airstrip, the camp, the process plant area, the truck shop, and administration building area. It also includes road access to the Mindrineti River for water supply.
The site roads are mostly built with laterite compacted with aggregate produced by the aggregate plant and are 10 m wide. Culverts are installed and ditching is completed to provide adequate drainage.
| 18.1.2 |
BUILDINGS |
| 18.1.2.1 |
MINE BUILDINGS FACILITY |
Mine facilities, such as the truck shop, warehouse, and administration services are integrated to facilitate communication between departments. The mine building complex is approximately 300 m from the process plant.
| 18.1.2.2 |
ADMINISTRATION BUILDING |
The administration building is a single story air-conditioned building approximately 22 m wide by 95 m long. The administration building provides accommodation for the following departments:
| • | Security, Health, and Safety; | |
| • | Engineering and Geology; |
| IAMGOLD Corporation - Rosebel Gold Mine | |
| Technical Report NI 43-101 – November 5, 2018 | Page 18-1 |
| • | Accounting, Information Technology, Human Resources, Procurement, and Logistics; | |
| • | Mine offices | |
| • | Mine Dry/Lunchroom |
The security department is located at the furthest end of the building. This area provides office space, a centralized control center, and changing rooms for security personnel. Health and Safety services include space and equipment for medical assistance on site. An ambulance and fire truck are also provided. All administration services are centralized in the building with mine offices, lunchroom, and mine dry facilities closer to the truck shop.
| 18.1.2.3 |
CAMP COMPLEX |
The camp complex is located approximately 0.5 km to the south of the process plant and truck shop/administration building.
The camp complex includes a kitchen, gymnasium, recreation area, camp offices, and different types of dormitories. The accommodations are built to house 1,500 employees, on a single or double occupancy basis. The overall building is constructed with concrete slabs for the floors and concrete blocks for the walls.
Insulation is added in complement to the acoustic tile ceilings where air-conditioning is required. The floors are tile-finished. Air-conditioned buildings have double-glazed windows, and buildings with natural ventilation are provided with louvers, which include mosquito net screens. Open ceilings are used in naturally ventilated areas. The roofs are pitched and clad with pre-finished metal roofing. Municipal works, such as potable water, sewage, fire protection, and electric utilities complete the general arrangements.
| 18.1.2.4 |
PROCESSING PLANT BUILDINGS |
The processing plant main buildings consist of mill administration building, refinery, process control, mill workshop, reagent storage, and laboratory facility.
Figure 18-1 shows the processing plant area.
| IAMGOLD Corporation - Rosebel Gold Mine | |
| Technical Report NI 43-101 – November 5, 2018 | Page 18-2 |
FIGURE 18-1 PROCESSING PLANT AREA

| 18.1.2.5 |
TRUCK SHOP |
The truck shop is a structural steel building of 44 m by 36 m, covered with pre-painted metal siding and roofing. The truck shop accommodates the following services:
| • | Heavy truck maintenance | |
| • | Heavy welding shop | |
| • | Haul truck tire change | |
| • | Dozer/shovel bay for tracked equipment | |
| • | Mine auxiliary equipment maintenance and repair | |
| • | Maintenance |
Based on the building’s configuration, the truck shop is equipped with two 20 tonne electrical overhead cranes and one 5 tonne auxiliary hoist capable of handling dump boxes. Clearance under the overhead crane is 12 m to allow maintenance of the 90-tonne haul trucks. All bays are serviced by the overhead cranes.
| IAMGOLD Corporation - Rosebel Gold Mine | |
| Technical Report NI 43-101 – November 5, 2018 | Page 18-3 |
The building is open on both sides for equipment access. The shop floor is sloped for drainage purposes towards a trench that carries oil and water the length of the shop to a water-oil separator. This provides protection against accidental oil spills. Lubricant dispensers, compressed air, electrical and water outlets are provided. A concrete apron, adjacent to the truck shop is provided for tire repairs.
A concrete wash pad, 15 m wide by 15 m long is built to wash equipment prior to maintenance. It is built with steam and pressure washing units and can accommodate all types of mine equipment. Waste water is diverted through a trench connected to a settling basin and water-oil separator. Steel platforms provide elevated access.
A separate section is available for light vehicle maintenance and repairs. The area is serviced by a 5 tonne capacity overhead crane. Machine shop equipment is installed for minor equipment fabrication. Between the truck shop and the light vehicle maintenance area a tool room and maintenance offices are provided.
| 18.1.2.6 |
WAREHOUSE |
The warehouse is a structural steel building. The building is 22 m in width, 90 m in length and 10 m in height and is completely clad with pre-painted siding. The building is equipped with shelving space for inventory material on one side and pallet racking on the other side. The warehouse personnel offices are within the building. A fenced yard is adjacent to the warehouse building and is used for storage of sizeable parts and bulk material.
| 18.1.2.7 |
ASSAY AND METALLURGICAL LABORATORY |
The site has an assay laboratory with the capacity for up to 700,000 sample determinations per annum. This laboratory facility is to provide services for the RGM gold plant operation including grade control, plant assay requirements, and environmental and exploration samples. The main building contains a laboratory office, wet laboratory room, AAS room, balance room, store room, metallurgical office, receiving area, sample preparation, sample storage, fire assay, metallurgical preparation room, PAL system area, and toilets.
| 18.1.3 |
ANCILLARY BUILDINGS AND SERVICES |
| 18.1.3.1 |
FUEL STORAGE |
A fuel storage area is provided close to the truck shop. The fuel storage capacity is 60,000 US gallons and will provide for approximately one week of production. The entire tank farm is situated in a bermed enclosure, which is sized to hold 110 percent of the volume of the largest tank. Also included is a 3,000 US gallon storage capacity for gasoline as well as a dispensing system for both products.
| IAMGOLD Corporation - Rosebel Gold Mine | |
| Technical Report NI 43-101 – November 5, 2018 | Page 18-4 |
| 18.1.3.2 |
POTABLE WATER |
Potable water is supplied from 250 mm water wells located along the Mamanari Creek near the camp complex. Submersible pumps are used to pump water to a 10,000 l tank. Potable water treatment is limited to pH adjustment and chlorination before water distribution to project facilities. Figure 18-2 shows the potable water plant facility.
FIGURE 18-2 POTABLE WATER PLANT FACILITY
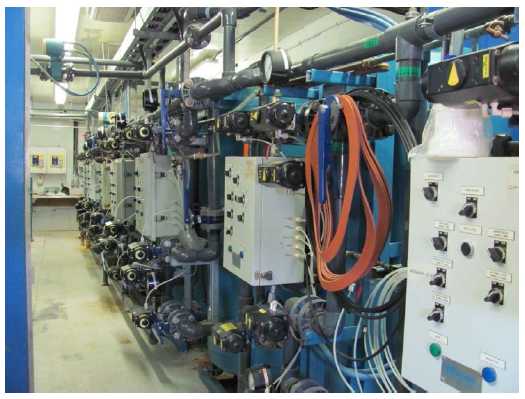
| 18.1.3.3 |
FIRE PROTECTION |
The fire protection system includes fire water pumps, a fire water distribution network, fire water hose stations, and water sprinkler systems. The fire water pumps are built for a demand of 227 cubic metres per hour (m3/hr) at a minimum terminal pressure of 345 kPa at any point in the fire water network. Hose cabinets are provided in every building and are spaced at a maximum of 15 m in any one direction. Fire hydrants are spaced at a maximum of 90 m around buildings and process facilities.
| IAMGOLD Corporation - Rosebel Gold Mine | |
| Technical Report NI 43-101 – November 5, 2018 | Page 18-5 |
A water sprinkler system is installed over covered conveyor belts and over the lubrication or hydraulic systems in the process areas.
The pumps are located adjacent to the fresh water pumps at the pumping station on the edge of the fresh water pond (Figure 18-3). There are three pumps, two main pumps of a capacity of 227 m3/hr each and one jockey pump to maintain the fire water pipe network at 345 kPa pressure at all times. The jockey pump has a capacity of 17 m3/hr. One of the main pumps is driven by an electric motor and the other is driven by a diesel engine with a control panel for automatic start. All pumps are automatically controlled to start on system pressure drop set points.
FIGURE 18-3 FIRE PROTECTION PUMP FACILITY
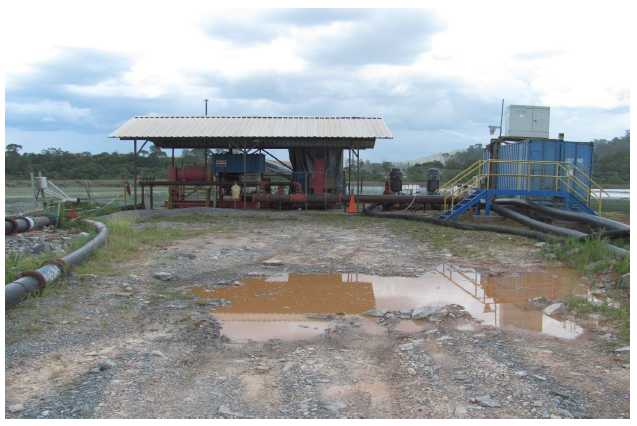
| IAMGOLD Corporation - Rosebel Gold Mine | |
| Technical Report NI 43-101 – November 5, 2018 | Page 18-6 |
| 18.1.4 |
SEWAGE AND WASTE DISPOSAL |
The sewage disposal system, including septic tanks and seepage fields, is built for the process plant, the truck shop, the administration complex, and the camp site area.
Domestic waste is buried in trenches 3 m wide by 3 m deep. The deposited waste is covered with 150 mm of saprolite daily. The trenches are approximately 100 m long and spaced 5 m, centre to centre.
| 18.1.5 |
AGGREGATES PLANT |
Different sizes of aggregates are produced at the RGM site which are used for road maintenance. The Mill department operates the quarry and Mine department supplies the waste rock. The aggregate plant was purchased on the used market and includes a primary crushing circuit and a complete second stage, including a closed loop conveyor system, a secondary crushing, and screening.
| 18.1.6 |
ELECTRICAL AND COMMUNICATION |
| 18.1.6.1 |
POWER SUPPLY |
Electrical energy is purchased directly from the Surinamese government. Power is delivered from the Afobaka hydroelectric generating station. This plant is owned and operated by Suralco, a subsidiary of Alcoa. The installed capacity of the plant is 189 megawatts (MW). Power is generated by six groups (3-30 MW and 3-33 MW).
The normal annual precipitation allows four groups to operate and generate an average of 120 MW. Suralco has priority on the first 35 MW generated for their operations, however, with the closure of the Suralco Bauxite Company, the power is available for RGM for the duration of the life of mine.
Presently, the balance of the generated energy is delivered to Energy Bedrijen Suriname N.V. (EBS), the local utility company. Delivery to EBS is carried out at Paranam through a 161/33 kilovolts (kV) step down substation. Power is delivered to Paramaribo with two double-circuit transmission lines. Power demand for RGM, at the initial production was 12 – 15 MW. Afterwards, the demand was increased with the addition of generating equipment during the second year of operation. The power demand for a mining operation is relatively constant on a 24 hours per day basis.
| IAMGOLD Corporation - Rosebel Gold Mine | |
| Technical Report NI 43-101 – November 5, 2018 | Page 18-7 |
In 2014, IAMGOLD built a 5 MW solar power plant at Rosebel. It is the country’s first renewable source of energy. The solar power plant was commissioned in June 2016. Figure 18-4 is a photograph of the solar power plant.
FIGURE 18-4 ROSEBEL 5 MW SOLAR POWER PLANT

IAMGOLD has reached an agreement with the Government of Suriname whereby RGM will purchase power at $0.14/kWh given a contribution of $50M to fund an additional 42 MW of power generation capacity in the country.
The available supply of power from the National grid and the solar power plant is sufficient to supply the power required for the Rosebel mine until the end of mine life. Table 18-1 shows the projected power demand over the life of the mine. The plant throughput is to a maximum until 2024 due to processing harder material.
| IAMGOLD Corporation - Rosebel Gold Mine | |
| Technical Report NI 43-101 – November 5, 2018 | Page 18-8 |
TABLE 18-1 PROJECTED LIFE OF MINE POWER DEMAND
| Year | MW |
| 2019 | 34.5 |
| 2020 | 34.8 |
| 2021 | 33.9 |
| 2022 | 32.3 |
| 2023 | 31.5 |
| 2024 | 30.9 |
| 2025 | 20.3 |
| 18.1.6.2 |
TRANSMISSION LINE |
The tie-in to the 161 kV grid is carried out at the Afobaka generating plant. A new switchyard has been erected to the west of the existing Suralco substation. Connection to the grid is performed outside the generating plant by a fly tap off the first span of the existing 161 kV circuits.
The 161kV breaker protections are interconnected in order that the Suralco breaker is not affected by a fault on the RGM circuit. The station is equipped with the following major equipment:
| • | 161 kV disconnect switches; | |
| • | 161 kV breaker; | |
| • | Metering and protective devices; | |
| • | Auxiliary services; and | |
| • | Steel structures to connect with aerial transmission lines. |
The 161 kV transmission line covers a distance of 32 km. It originates at the Afobaka switchyard, continues its route towards the intersection of the Brownsweg and Nieuw-Koffiekamp road, and turns towards the plant’s main substation.
| 18.1.6.3 |
PLANT MAIN SUBSTATION AND DISTRIBUTION LINES |
The plant main substation is located next to the electrical room. It transforms the incoming voltage from 161 kV to 4.16 kV. The substation size is sufficient for the present requirements and for an eventual hard rock expansion.
Distribution lines, on site, are at 12,470/7,200 V, the standard distribution voltage in Suriname. Two main circuits are provided. One circuit feeds the kitchen, the camps, and all loads east of the plant. The other circuit feeds loads west of the plant. Two 4.16 kV circuits feed the step-up transformers. The transformers are operated in parallel to improve the fault capacity.
| IAMGOLD Corporation - Rosebel Gold Mine | |
| Technical Report NI 43-101 – November 5, 2018 | Page 18-9 |
| 18.1.6.4 |
EMERGENCY GENERATORS |
RGM has three emergency generators, each with a capacity of 800 kilowatts at 480 volts. They are located at the following strategic loads:
| • |
One unit at the plant for loads such as kiln drive, agitators (in a sequential mode), etc. It also feeds loads that are required to execute plant maintenance during the scheduled power outages. This unit starts automatically. | |
|
| ||
| • |
One for the kitchen and services area. This unit starts manually. The load transfer is also carried out manually. | |
|
| ||
| • |
One at the administration complex, which is also started manually. This group also feeds the communication equipment and the truck shop. Each generator is equipped with a dyke diesel tank. |
| 18.1.6.5 |
COMMUNICATION, AND IT SYSTEMS |
The RGM site has the following communication and radio facilities:
| • | Satellite internet; | |
| • | VOIP satellite phone; | |
| • | Cell phone coverage (Digicel and Telesure operators); | |
| • | Vehicle and hand-held radios. |
Additional communications networks will be expanded and installed, as required, for the various satellite mines as development commences.
| 18.2 |
SARAMACCA SITE |
The Saramacca project is a satellite operation to the current RGM mine site. Access to Saramacca will be via a 23 km access road which will connect the southern end of the RGM mine site to Saramacca. The road will be used to transport ROM ore to the mill at Rosebel, transport personnel to work areas at Saramacca, as well as goods and supplies required to sustain the operation. The road has been sized to accommodate the ore haulage trucks; however mining equipment will also be able to use the road when required to transit between Saramacca and current RGM operations.
The Saramacca mine site will include the following facilities:
| IAMGOLD Corporation - Rosebel Gold Mine | |
| Technical Report NI 43-101 – November 5, 2018 | Page 18-10 |
| • | ROM ore storage pad | |
| • |
Facilities pad, including a maintenance shop, warehouse, fuel storage tanks, generator, lunch room, washroom, and office facilities | |
| • | Water management ponds and ditches | |
| • | A water treatment facility | |
| • | Mining haul roads | |
| • | Waste rock storage facilities |
Workers will be housed at the current RGM camp site, which is undergoing an expansion to accommodate the additional workforce at Saramacca.
Due to the fast track nature of the Saramacca project, ongoing technical studies are at various levels of advancement, ranging from prefeasibility to detailed engineering. Construction has been initiated for various elements of the project.
| 18.3 |
TAILINGS STORAGE FACILITY |
The Rosebel tailings storage facility (TSF) consists of a series of earth fill dam structures, joining topographical highs, to form two distinct basins (Figure 18-5, Main basin, and expansion basin). The original tailings facility, TSF1, consists of a series of 12 dams in operation, at a minimum elevation of 556 m (mine elevation datum). In 2014, the tailings facility was expanded to the east to form the expansion facility, namely TSF2. To date, there are a total of five additional dams in operation, with a sixth (Saddle Dam 11) due to commence in Q4, 2018, and Saddle Dam 12 planned for commencement around 2023. The current minimum elevation at TSF1 and TSF2 is 556 m and 552 m respectively. Both facilities are planned to be at 556 m by year end 2019.
The total combined area of TSF1 and TSF2 is 725 ha and when constructed to the proposed final elevation of 565 m, a total storage capacity of approximately 287 Mt (204 Mm3) is provided. A pre-feasibility study was carried out for the design of a third expansion of the facility (TSF3), to the west, to accommodate the increase in Mineral Reserves and associated milled tonnage. The projected storage capacity of TSF3 is 37 Mt, providing a combined total storage capacity of 324 Mt. This expansion design will be used as a base case to compare to other storage options that will be evaluated in the future (in-pit disposal, co-disposal, etc.). The final selection for the TSF expansion will be compliant with all permitting requirements, and will include future recommendations from the on-going Closure Plan update (refer to Section 20).
| IAMGOLD Corporation - Rosebel Gold Mine | |
| Technical Report NI 43-101 – November 5, 2018 | Page 18-11 |
Tailings are discharged into the basin by a combination of spigotting from the dam crests and end of pipe discharge. Spigotting consists of discharging tailings from a series of small diameter holes or pipes tapped into the main tailings line. This method of discharge produces a quasiplanar beach parallel to the discharge line.
Direct discharge is also utilized both on smaller dam structures and always at the end of line. This consists of discharging the entire tailings stream from the end of the main tailings line. This type of discharge creates a conical shaped beach around the discharge point, which is appropriate for smaller valleys.
The existing effluent treatment plant (ETP) is used for both tailings basins. Discharge from the facility is at a treatment rate which allows the pond to be maintained at a constant volume year over year.
| IAMGOLD Corporation - Rosebel Gold Mine | |
| Technical Report NI 43-101 – November 5, 2018 | Page 18-12 |

| IAMGOLD Corporation - Rosebel Gold Mine | |
| Technical Report NI 43-101 – November 5, 2018 | Page 18-13 |
| 19 |
MARKET STUDIES AND CONTRACTS |
| 19.1 |
MARKETS |
Gold is the principal commodity produced at RGM and is freely traded at prices that are widely known, so that prospects for sale of any production are virtually assured. All gold produced by IAMGOLD is in the form of doré bars, which is then shipped to a refiner who refined the doré into bullion. The bullion is then sold directly on the open market to gold trading institutions at prevailing market prices.
| 19.2 |
CONTRACTS |
RGM finalizes long term or annual contracts for all major spends which are required for the operations. Contracts are negotiated by going out on tenders. Contracts with values higher than $5 million per year include fuel, lubricants, process plant reagents, grinding media, mill liners, mining components, and RC drilling.
| IAMGOLD Corporation - Rosebel Gold Mine | |
| Technical Report NI 43-101 – November 5, 2018 | Page 19-1 |
| 20 | ENVIRONMENTAL STUDIES, PERMITTING, AND SOCIAL OR COMMUNITY IMPACT |
This section summarizes environmental, permitting and social or community aspects relevant to the updated Resource and Reserve estimate for RGM. Most notably, the 2018 Life of Mine Plan includes mining of the Saramacca deposit. The following is included in this Section:
| • |
A summary of current environmental and social conditions, studies and the management plans and controls established or planned; | |
| • | A summary of social and community engagement activities; | |
| • | A summary of existing environmental approvals and the status of new approvals required to facilitate the 2018 LOM; | |
| • | A summary of closure and reclamation plans for RGM. |
| 20.1 |
CURRENT STATUS |
Current mining operations at RGM are governed by the Suriname Gold Mining Project – Mineral Agreement (Mineral Agreement) dated April 7, 1994 as first amended and supplemented on March 13, 2003, followed by a second amendment on June 6, 2013. The Second Amendment of the Mineral Agreement established an Unincorporated Joint Venture (UJV) with the Government of Suriname to undertake exploration and possible exploitation in concessions surrounding Gross Rosebel. Saramacca is one of the areas subject to the UJV.
The Mineral Agreement contains contractual obligations for mineral exploration and exploitation and requires that a Feasibility Study and Environmental Impact Assessment (EIA) of the company activities be submitted to the Government of Suriname as a prerequisite to mining. The Mineral Agreement also establishes the terms and conditions under which RGM operations and development are conducted, including cross-references to the commitments made in the Rosebel EIA (EIA, 2002).
A Feasibility Study and EIA for the Rosebel project was first completed in 1997. After further exploration, a final Feasibility Study was completed and submitted to the Government of Suriname in August 2002. RGM received a Right of Exploitation from the Government of Suriname after the approval of the final Feasibility Study and the accompanying EIA in 2002.
| IAMGOLD Corporation - Rosebel Gold Mine | |
| Technical Report NI 43-101 – November 5, 2018 | Page 20-1 |
A Social Impact Assessment was also completed in 2002. Commercial production at Rosebel Gold Mines began in February 2004.
In 2012, RGM submitted an ESIA and obtained approval to expand the tailings storage facility (TSF). An expansion of the TSF was required to support increases in production levels and mine life. The TSF expansion consisted of the construction of a second containment basin immediately adjacent to the existing facility.
The existing Right of Exploitation provides the necessary approvals for mining and processing within the Gross Rosebel concession. Mining of the Saramacca deposit requires Government of Suriname approval of a Feasibility Study and an ESIA in order to proceed.
| 20.2 |
FUTURE PERMITTING |
Consistent with the National Institute for Environment and Development in Suriname (NIMOS) guidance, RGM initiated the ESIA process for the Saramacca project in April 2018 with the submission of an ESIA Terms of Reference (TOR) for the Saramacca project.
The approach to the ESIA comprises four phases identified in the NIMOS Environmental Assessment Guidelines (hereafter referred to as Guidelines) (NIMOS 2009; NIMOS 2005a; NIMOS 2017): Screening, Scoping, Impact Assessment, and Review. The Screening Phase is an initial identification of the main issues the project will be facing. During the Scoping Phase, the parameters of the baseline studies and impact assessment are identified. The Impact Assessment Phase identifies the baseline conditions for the project, measures the impacts against that baseline, and develops mitigation and management measures, where required. The Review Phase involves sharing the results of the ESIA with the public, government, and other stakeholders and receiving their comments.
This approach to the ESIA allows RGM to comply with the Guideline for an environmental assessment in Suriname as well as the relevant international and corporate standards and requirements. The ESIA process is summarized in the Figure 20-1.
The scope of the Saramacca project for ESIA purposes is for the planned infrastructure and activities during the construction, operations, and closure phases of mining within the Saramacca concession and includes the transportation corridor between Saramacca and the Rosebel concession. The ESIA was based on the engineering and mine planning available at the time of its submission in July 2018.
| IAMGOLD Corporation - Rosebel Gold Mine | |
| Technical Report NI 43-101 – November 5, 2018 | Page 20-2 |
FIGURE 20-1 ESIA PROCESS FLOWSHEET

Source: ERM, modified from NIMOS (2005a; 2009; 2017)
| IAMGOLD Corporation - Rosebel Gold Mine | |
| Technical Report NI 43-101 – November 5, 2018 | Page 20-3 |
The Review Phase of the ESIA for the Saramacca project has been completed with comments on the ESIA provided by NIMOS on October 2, 2018. RGM is currently responding to these comments and preparing a final ESIA submission. NIMOS must approve the final ESIA as a precursor to issuing a Right of Exploitation for mining within the Saramacca concession. As there have been some changes to the mine plan subsequent to the drafting of the ESIA, RGM’s final ESIA submission will include an update to planned activities and infrastructure as contemplated in the 2018 LOM and the potential effects associated with these changes.
Overall, the conclusion of the Saramacca ESIA based on the professional experience of the ESIA Study Team is that the impacts of the proposed project are manageable, and construction, operation, and closure of the Saramacca Satellite Mine (SSM) will not present irreversible or unacceptable risks to people or the environment.
The 2018 LOM will result in the generation of mine tailings that exceed the capacity of the current tailings storage facility. The 2018 LOM contemplates the construction of an addition storage cell for mine tailings available for use by 2029. An ESIA may be required for this facility. Permitting for tailings expansion is not currently a constraint to the LOM.
There are other changes to the Rosebel facilities that are required to support the 2018 LOM, however it is not currently anticipated that these changes will require additional permits or approvals. A need for any additional permitting will be assessed in due course.
| 20.3 |
ENVIRONMENTAL AND SOCIO- ECONOMIC STUDIES |
Baseline environmental and socio-economic studies have been conducted in the RGM-Saramacca area from the mid-1990s to present. A comprehensive baseline study was conducted to support development of the Rosebel EIA in 2002 and additional field work was collected to support the 2012 EIA of the tailings storage facility expansion. Most recently, detailed environmental and socio-economic baseline studies have been conducted in the Saramacca concession and the corridor between Rosebel and Saramacca in support of the ESIA filed in July 2018. Environmental and socio-economic studies are also conducted as a routine element of RGM’s operational management plans described in Section 20-4.
| IAMGOLD Corporation - Rosebel Gold Mine | |
| Technical Report NI 43-101 – November 5, 2018 | Page 20-4 |
A summary of the environmental and socio-economic studies completed to support the Saramacca ESIA are summarized in Table 20-1.
TABLE 20-1 SARAMACCA COMPLETED ESIA ENVIRONMENTAL AND SOCIOECONOMIC STUDIES
| Area | Studies |
| Hydrogeology and | Hydrogeologic and geochemical site investigation for the |
| Geochemistry (Metal | Saramacca Mine Project (2017). |
| Leaching and Acid Rock | |
| Drainage) | Hydrologic site investigation and water balance modelling for |
| Saramacca (2017). | |
| Flora (2018) | |
| Vegetation and Wildlife | Birds, large and small terrestrial and arboreal mammals (2018). |
| Bats and arboreal mammals (2017). | |
| Terrestrial Habitats | Terrestrial habitats and vegetation (2018). |
| Aquatic Habitats | Aquatic ecology of streams (2018). |
| Amphibians and reptiles (2017). | |
| Geomorphology and Soils (2017). | |
| Physical Resources | |
| Soil study in disturbed areas (2017). | |
| National census of the population, demographics, and households | |
| conducted in 2012, with data available at the district level and | |
| resort level for some indicators. | |
| Community profiles of the Brokopondo CoIs conducted in 2016- | |
| Social Environment | 2017 (Schalkwijk). |
| Baseline study of the Sipaliwini CoIs, including household survey | |
| conducted in 2018. | |
| Ecosystem services assessment in the vicinity of the Saramacca | |
| concession conducted in 2018. |
| 20.4 |
SOCIAL ENVIRONMENT |
A Community Relations Plan with supporting guideline and procedures was developed to minimize the mine’s impact on communities and the environment.
At the time of the most recent census (2012), the Algemeen Bureau voor de Statistiek (ABS - General Bureau of Statistics) reported a population in Suriname of 541,638. According to the World Bank, the population estimate in 2017 was 563,400.
| IAMGOLD Corporation - Rosebel Gold Mine | |
| Technical Report NI 43-101 – November 5, 2018 | Page 20-5 |
The main ethnic groups in Suriname are those of African descent (Maroons [22%] and Creoles [16%], which are considered two distinct ethnic groups), Indonesian descent (14%), Indian descent (27%), and Indigenous (4%). The remainder of the population is classified as mixed, unknown or “other”, and includes a sizeable population of Brazilian and Chinese nationals that have migrated to Suriname in recent years primarily for participation in the small-scale mining and service sectors.
Suriname’s economic performance from 2000 to 2012 was positive due to favorable commodity prices during this period, but has suffered from 2013 onward as a result of price slumps in the gold, bauxite and oil resources on which its economy is largely dependent. Inflation peaked at 55.5% in 2016 and GDP growth fell sharply between 2013 and 2016, but indicators have since shown some signs of recovery due to rising oil and gold prices coupled with fiscal reforms by the government.
The Rosebel and Saramacca concessions are situated in the districts of Brokopondo and Sipaliwini. These districts have a considerably different demographic profile than the country overall, with the majority of population in both districts made up by the Maroon ethnic group (83% and 76% of the district population, respectively). Both districts are major producers of timber, and local populations are also heavily reliant on gold mining (both large-scale in the case of IAMGOLD workers, and small-scale).
Brokopondo and particularly Sipaliwini districts are sparsely populated. There are no urban centers, and population centers in the vicinity of Rosebel and Saramacca consist of Maroon villages with traditional leadership.
There is one active community, Nieuw Koffiekamp, within the boundaries of the RGM concession. Nieuw Koffiekamp is a Maroon village with a population of approximately 500 permanent inhabitants belonging primarily to the Aukan Maroon tribegroup, but with some representation by the Saramaka and Matawai tribe as well. From the time that the RGM concession was granted to a multinational (initially to Golden Star in the 1990s) until the present day, there has been ongoing conflict with residents of Nieuw Koffiekamp. In more recent years, the primary issues of contention have been the conflict between RGM’s operations and small-scale mining (SSM) interests. This has necessitated RGM’s close, ongoing engagement with traditional authorities, the village’s small-scale mining association, and the population at large. Several agreements have been signed between RGM and the community over the years to allow SSM from the community to mine in selected areas of the RGM concession, under specific conditions. At this time, an agreement known as the Roma East Protocol is in force. This agreement was signed by the Government of Suriname, representatives of Nieuw Koffiekamp’s SSM association Makamboa, and RGM in 2017, allowing mining in the Roma East area of the RGM concession.
| IAMGOLD Corporation - Rosebel Gold Mine | |
| Technical Report NI 43-101 – November 5, 2018 | Page 20-6 |
In the immediate surroundings of the RGM concession, there are eleven other Maroon villages that are considered by RGM communities of interest (CoIs) with the potential to be directly impacted by or have influence over RGM operations and the Saramacca project. These villages are; Marshallkreek, Klaaskreek, Nieuw-Lombe, Balingsoela, Brownsweg and, Kwakoeugron in Brokopondo District; and Nieuw Jacobkondre, Baling, Misalibi and Bilawatra in Sipaliwini District. These, along with Nieuw Koffiekamp are considered the direct area of influence of the company’s operations.
Economic activities in of the local villages remains dependent on the Surinamese coastal economy. Main activities consist primarily of subsistence agriculture on relatively poor land, small-scale gold mining, forestry, and trade. Some villagers are also employed by government agencies including the district commissioners, the electricity company, and the forestry service. As of Q1 2018, a total of 370 residents of Brokopondo District were employed by RGM. In general, however, there are few formal employment opportunities in this area and the most lucrative income-generating activity tends to be SSM. The level of reliance on this activity varies among communities, with particularly large proportions of the Nieuw Koffiekamp, Brownsweg, Kwakoegron, Nieuw Jacobkondre, Baling, Misalibi, and Bilawatra populations relying on SSM as their primary livelihood activity.
In the case of the Saramacca concession, there are signs of past SSM activity within the concession boundaries but none is occurring there currently. The nearest communities (Nieuw Jacobkondre, Baling, Misalibi, and Bilawatra) are approximately 12 km from the concession and their current SSM activity areas do not extend into the concession area.
Other than the local Maroon villages, itinerant groups from other areas also engage in SSM activity in the vicinity of the RGM and Saramacca concessions. The number and demographic makeup of the SSM population in different areas of the country at any given time tends to be dynamic, fluctuating based on a range of factors including discovery of productive areas, gold prices, and security/law enforcement presence and policy. However, these itinerant populations tend to be primarily comprised of other Surinamese from other villages or the coastal area, or Brazilian nationals, many of whom are undocumented.
| IAMGOLD Corporation - Rosebel Gold Mine | |
| Technical Report NI 43-101 – November 5, 2018 | Page 20-7 |
RGM has a regular program of engagement and community investment with all CoIs, led by the Community Relations Department. In the case of the CoIs in Brokopondo District, this relationship has been established and ongoing for many years. In the case of the four Sipaliwini CoIs of Nieuw Jacobkondre, Baling, Bilawatra and Misalibi, the program is in its beginning stages as the Saramacca project starts up. Community investment projects are selected with input from community members and traditional authorities. Past projects have included: construction or renovation of infrastructure including school buildings, churches, village meeting houses, potable water systems and playgrounds; income generation projects such as establishment of a chicken farming operation, construction of ice machines and rice mills, and an agriculture project; delivery of training courses in subjects such as cooking and sewing; and a scholarship program for post-secondary candidates. Projects have had varying levels of success in terms of continuity, participation, and general satisfaction from the communities. RGM continues to adapt and refine its community engagement and investment approach to meet community needs, particularly as considerations for post-closure sustainability and continuity become more important.
| 20.5 |
MANAGEMENT PLANS AND CONTROLS |
IAMGOLD is committed to sustainable development and achieving and maintaining a Zero Harm culture. Environmental protection, community awareness, a commitment by all employees and contractors to a workplace free of injury and illness, protection against workplace hazards, profitability, and sustainability are integrated in all RGM’s exploration, construction, mining, mineralized material processing, transport, support, and reclamation activities. In accordance with this commitment, RGM:
| • |
recognizes environmental management as a priority and has established several policies, standards, and procedures for conducting business in an environmentally responsible manner and committed to continuous improvement, pollution prevention, and regulatory compliance; | |
| • |
has developed, implemented, and maintains an Environmental Management System certified to the ISO 14001. RGM is currently in the process of converting its EMS to comply with the new version of the ISO 14001 standard (2015 version); |
| IAMGOLD Corporation - Rosebel Gold Mine | |
| Technical Report NI 43-101 – November 5, 2018 | Page 20-8 |
| • |
has developed, designed, and operates facilities based upon the efficient use of energy, resources, and materials; | |
| • |
takes endeavors to minimize land disturbance; | |
|
| ||
| • |
has identified, assessed, and manages environmental risk; | |
|
| ||
| • |
has developed, maintains, and regularly tests emergency preparedness plans to ensure protection of the environment, employees, contractors and stakeholders; | |
| • |
conducts research towards reducing RGM’s impact on the environment via the development of improved practices and technologies; | |
| • |
encourages dialogue with stakeholder groups regarding environmental issues and endeavors to be responsive to their concerns; | |
| • |
ensures employees and contractors are appropriately trained and motivated to fulfill their environmental health and safety responsibilities; and | |
| • |
undertakes progressive reclamation and closure activities as per closure plan. |
In addition, RGM is subject to the corporate requirements of its parent company IAMGOLD, including:
Sustainability Policy – IAMGOLD believes that a commitment to sustainability and social responsibility from all its employees and contractors is fundamental to the success of its business. The company’s Sustainability Policy outlines a number of guiding principles relating to community engagement, social responsibility, and protection of the environment (IAMGOLD 2014a). IAMGOLD has also developed a management framework to support implementation of the Sustainability Policy’s principles and values (IAMGOLD 2008).
Human Rights Policy – IAMGOLD is committed to establishing an organizational culture that respects human rights as set forth in international standards (UN Declaration of Human Rights; International Labor Organization (ILO) Declaration on Fundamental Principles and Rights at Work). The company’s human rights policy outlines 11 guiding principles relating to stakeholder consultation, integration of human rights considerations in all operations, promotion of human rights to stakeholders including host governments, and respecting the rights and traditions of Indigenous Peoples (IAMGOLD 2013a).
Biodiversity Policy - IAMGOLD’s Biodiversity Management Policy recognizes the fundamental importance of protecting biodiversity and sustaining healthy ecosystems as part of their mining projects. The Policy outlines guiding principles for integrating biodiversity management and conservation activities and objectives at all stages from exploration to mine closure (IAMGOLD 2015a).
| IAMGOLD Corporation - Rosebel Gold Mine | |
| Technical Report NI 43-101 – November 5, 2018 | Page 20-9 |
Health and Safety Policy – IAMGOLD requires a commitment by all employees and contractors to maintain a workplace free of incidents and illness as part of its continuous journey to achieving and maintaining ‘zero injuries’. The company’s H&S policy outlines guiding principles relating to training, worker accountability, monitoring and reporting, and emergency preparation (IAMGOLD 2016).
Water Management Standard – IAMGOLD recognizes the importance of environmentally sustainable and socially equitable water use and is dedicated to efficient water resource management and water conservation efforts throughout all aspects of operation, including closure planning, reclamation, tailings management discharge water quality, and potable water and groundwater quality (IAMGOLD 2014b).
Energy and Greenhouse Gas Emissions Management Standard – In recognition that efficient management of energy is required to achieve its business strategy, provide benefits to stakeholders, and control environmental impacts, IAMGOLD strives to continuously improve energy performance, reduce GHG emissions, and support the introduction of clean and renewable energy. These objectives are met through a range of commitments for benchmarking and target setting, measurement and reporting, and exploring new options for integrating energy efficiency, GHG management, and clean and renewable energy options into design and operation of projects (IAMGOLD 2013b).
In addition to Surinamese national environmental laws and IAMGOLD corporate requirements and guidelines, RGM strives to be in general conformance with Canadian and international standards and guidelines as resources for social and environmental risk management. These international standards range from general guidelines applicable to private sector projects to industry-specific standards surrounding the use of cyanide in mining and the sustainable development performance of projects in the mining and metals industry:
| • |
Mining Association of Canada (MAC) and the requirements of the Towards Sustainable Mining (TSM) initiative at all of IAMGOLD international operations. TSM is a performance system that helps mining companies evaluate and manage their environmental and social responsibilities. This system focuses on six operational areas: aboriginal and community outreach; safety and health; crisis management and communications planning; biodiversity conservation management; tailings management; and energy use and greenhouse gas (GHG) emissions management. |
| IAMGOLD Corporation - Rosebel Gold Mine | |
| Technical Report NI 43-101 – November 5, 2018 | Page 20-10 |
| • |
International Finance Corporation’s Performance Standards on Environmental and Social Sustainability (IFC 2012) | |
|
| ||
| • |
International Finance Corporation’s General Guidelines on Environmental, Health and Safety (EHS) (2007). The Guidelines support actions aimed at avoiding, minimizing, and controlling EHS impacts during the construction, operation, and decommissioning phase of a project or facility. | |
|
| ||
| • |
International Finance Corporation EHS Guidelines for Mining (2007) address industry- specific impacts and management for the mining sector. The guidelines present performance levels and measures of Good International Industry Practice (GIIP) that are applicable to underground and open-pit mining, alluvial mining, solution mining, and marine dredging. |
RGM is not a signatory to the International Cyanide Code.
RGM’s Environmental, Health and Safety Management System (EHSMS) last received ISO 14001:2004 system certification in December 2017. RGM’s Community Relations Department is responsible for ongoing dialog with the Communities of Interest (COI) near RGM as well as those near to the Saramacca site as the project moves forward. The ESIA for Saramacca included fifteen project specific Environmental and Social Management Plans (ESMPs) for integration with the EHSMS.
Feedback and adjustment are an essential part of the EHSMS. Feedback systems include inspections, monitoring, and audits to confirm proper implementation of the ESMPs as well as effectiveness of recommended measures. Corrective actions include response to out-of-control situations, non-compliances, and non-conformances. Actions also include those intended to improve performance.
| 20.6 | WASTE AND TAILINGS DISPOSAL, SITE MONITORING, AND WATER MANAGEMENT |
| 20.6.1 |
WASTE ROCK DISPOSAL |
Storage areas for waste rock have been planned and designed to reduce haulage distances between pit ramp exits and storage areas, and were selected to minimize the impact on water management. In-pit mine rock waste disposal is planned where the mine phasing allows, in Pay-Caro and Royal Hill.
| IAMGOLD Corporation - Rosebel Gold Mine | |
| Technical Report NI 43-101 – November 5, 2018 | Page 20-11 |
The estimated tonnes of waste for each pit for the LOM is shown in Table 20-2.
TABLE 20-2 WASTE ROCK BY PIT
| Pit | Dump | Waste Rock | Footprint | Height | Max Elevation | |
| (Mt) | (ha) | (m) | (m) | |||
| North | 50.5 | 121 | 75 | 600 | ||
| Rosebel | South | 41.3 | 85 | 75 | 600 | |
| In-Pit | 37.0 | 9 | 751 | 1942 | 600 | |
| Koolhoven | External | 99 | 163 | 135 | 650 | |
| North | 113.5 | 190 | 135 | 665 | ||
| Pay Caro / J Zone C&E | South | 33.1 | 68 | 90 | 605 | |
| In-Pit | 30.6 | 31 | 01 | 1762 | 400 | |
| External | 46.9 | 112 | 120 | 635 | ||
| J Zone | In-Pit | 3.3 | 6 | 01 | 702 | 526 |
| External | 162.7 | 226 | 135 | 650 | ||
| Royal Hill | In-Pit | 67.6 | 30 | 01 | 702 | 547 |
| Mayo / Roma West | North | 2.8 | 137 | 90 | 615 | |
| South | 20.7 | 74 | 60 | 585 | ||
| Saramacca | External | 288 | 335 | 115 | 335 | |
1 Height calculated from the ground level
2 Height calculated from the bottom of the pit
| 20.6.2 |
TAILINGS DISPOSAL |
The mine tailings site was designed by Golder (Golder, 2018a). As noted in Section 18, the site footprint is 315 ha, with a storage capacity of 294 Mt. To ensure the infrastructure's stability, daily, monthly, and yearly inspections are carried out. Geochemical studies have shown that tailings are non-acid generating.
A program for environmental monitoring (ground water quality, fauna, and dam stability inspection) and progressive rehabilitation of the tailings site is in place, at and around, the tailings site.
An annual tailings management external audit is carried out to review the operational monitoring of the tailings site and to provide guidance to improve environmental performance.
| 20.6.3 |
SITE MONITORING |
A monitoring program is in place (at all stages of the life-of-mine) at the site. This program encompasses water quality monitoring (potable water, ground water, surface water, and pit lakes, tailings pond, air quality (dust and greenhouse gas emission), biodiversity (terrestrial and aquatic fauna), weather, acid rock drainage (ARD) and follow-up and assessment of the community investment program (health, education, potable water access, agriculture, animal husbandry, etc.) through post mortem evaluations.
| IAMGOLD Corporation - Rosebel Gold Mine | |
| Technical Report NI 43-101 – November 5, 2018 | Page 20-12 |
| 20.6.4 |
WATER MANAGEMENT |
Accumulated water in the pits is collected in a sump located in the bottom of the pit, close to the ramp system, or near the pit rim. Water is pumped out of the pit from the sump, and discharged into sedimentation ponds. Water from the pit sumps may be pumped directly in water trucks and used for dust suppression on active haul roads and secondary roads.
Tailings are thickened to a density of 40% solids before they are discharged into the tailings site. Water recovered from the tailings site, is reused in the process plant (reclaim water).
For potable water, to supply the mining camp, nine wells were drilled at new camp. Potable water treatment consists of chlorination, sediment filtration, carbon filtration, and UV treatment.
For industrial water needs, reclaim water is recycled from the tailings facility. Hydrologic design is based on 100-year floods. A water quality monitoring program (surface water, ground water, potable water, pit lake water) is in place. Additionally, the quantity of water resources is monitored (river flow, water table level, water meters, etc.). The dykes of the dams and the ponds are inspected regularly (on a daily, monthly, and annual basis).
| 20.7 |
MINE CLOSURE AND RECLAMATION PLAN |
As stated previously in this Section, mining in Suriname is governed by the Mining Decree of July 8, 1986, including Article 6 related to the Conduct of Project Operations (implementation of the EIS, reclamation and restoration, employment plan at permanent shutdown, and termination and withdrawal), and Article 17 related to relinquishment of exploitation rights. The Mineral Agreement references closure of the site and broad expectations of RGM for closure in articles 1, 6, and 18. The Government of Suriname does not require the posting of financial security.
| IAMGOLD Corporation - Rosebel Gold Mine | |
| Technical Report NI 43-101 – November 5, 2018 | Page 20-13 |
The environmental impact assessment in 2002 included mine closure and reclamation commitments and the 2012 EIA for the tailings storage facility expansion also included closure and reclamation commitments. The EIA for the Saramacca project, which is currently undergoing regulatory review, included a conceptual closure plan for the mine and its associated activities and infrastructure.
To date, no Rosebel concession land has been relinquished to the Government of Suriname and apart from the general clauses in the Mining Decree and the Mineral Agreement, there are no clear performance criteria set for relinquishment.
RGM has prepared a stand-alone Mine Closure Plan (MCP) that is periodically updated as per internal requirements. In addition, the RGM environmental department works closely with the finance department to generate RGM’s annual Asset Retirement Obligation (ARO) cost estimate that is required for accounting purposes. The most recent closure plan update was completed in August 2018.
The closed site vision at RGM is to ensure a safe, secure site that is self-sustaining in that it does not require active intervention and management post closure, minimizes short and long-term liabilities, and maintains IAMGOLD’s reputation and authority to operate.
The objectives of the mine closure and reclamation activities are listed below:
| • |
The site is self-sustaining, with physically, chemically and biologically stable landforms that are compatible with post-closure land use, including meeting site specific discharge surface water and groundwater quality criteria | |
|
| ||
| • |
Disturbed areas are revegetated actively or passively to prevent soil erosion and will encourage development of self-sustaining native plant communities | |
|
| ||
| • |
Meets the desired end land use and function, as defined through dialogue with local stakeholders | |
|
| ||
| • |
Meets applicable regulatory requirements | |
|
| ||
| • |
Supports stakeholders to sustain the socio-economic benefits of mining beyond mine closure | |
|
| ||
| • |
To implement the proposed measures and actions cost effectively with commercially available skills, equipment and materials, taking into consideration prevailing local factors such as climate, geography, demography, infrastructure, security, governance, capacity and operational reliability. |
| IAMGOLD Corporation - Rosebel Gold Mine | |
| Technical Report NI 43-101 – November 5, 2018 | Page 20-14 |
The MCP covers all areas of mining related activity within the Rosebel concession, including the mining pits, waste rock dumps, the tailings storage facility, on-site buildings and infrastructure, and all associated utilities within the operational area. The MCP also considers the interaction between RGM and the surrounding communities, as well as the activities of SSM activity on concession. SSM activity is an addition to previous versions of the MCP.
Excluded from the MCP is consideration of the lands that define the town of Nieuw Koffiekamp, which is located within the Rosebel concession. The MCP also excludes the RGM mine exploration areas that are located adjacent to the concession.
The Saramacca deposit was included in the MCP as a potential source of additional ore that, at the time, was identified as having the potential to form part of the LOM in future years and for which eventual closure needs to be considered as part of its planning and design.
| 20.7.1 |
ROSEBEL MINE |
A summary description of the closed site at Rosebel, described for each domain, is provided in Table 20-3.
TABLE 20-3 ROSEBEL CLOSED SITE SUMMARY DESCRIPTION
| Domain and |
Closed Site Summary Description |
| Feature |
|
|
| |
| Tailings management area |
Tailings will be strategically deposited during operations to generate a final solid surface slope that minimizes ponding and directs contact water to Saddle Dam number 6. |
|
| |
|
An engineered spillway will be constructed in Saddle Dam number 6 to allow water to gravity flow to the receiving environment. Temporary sediment control upstream of the spillway may be required until revegetation of the tailings beach is established. | |
|
| |
|
Current geochemical evaluation indicates that water can be released without treatment (ERM, 2018b); this will continue to be evaluated through the remainder of operations. | |
|
| |
|
The solid tailings surface will be revegetated, achieved by hydroseeding. | |
|
| |
| Waste rock dumps, stockpiles and borrow areas |
Waste rock dumps will be sloped to meet closure objectives including physical stability criteria, landscaped, receive a cover of saprolite and growth medium, and seeded. |
|
| |
|
Saprolite will be stockpiled separately from transition and hard rock and used as a cover material in future reclamation. Saprolite deficits at Koolhoven, J Zone and Mayo will be supplemented by material generated from other mining pits, or from adjacent hills (depending on the results of a trade- off study). |
| IAMGOLD Corporation - Rosebel Gold Mine | |
| Technical Report NI 43-101 – November 5, 2018 | Page 20-15 |
| Domain and |
Closed Site Summary Description |
| Feature | |
|
| |
|
Woody debris, and the top 0.3m of soil from areas of future disturbance will be salvaged and stockpiled for use as revegetation growth material. | |
|
Where topsoil is in deficit growth medium will be a combination of saprolite mixed with organic materials (eg, wood chips, compost, and leaf litter). Reclamation research will confirm the appropriate growth medium. | |
|
Koolhoven and J-Zone: An engineered cover system will be placed over WRD to mitigate ARD and metal leaching potential. Koolhoven will be used as a field test of closure design and revegetation for waste rock dumps. | |
|
There may be opportunities for progressive closure of waste rock dumps in- line with the LOM for Pay Caro South, Mayo North, Mayo South/Roma West, and Royal Hill North. These will be further investigated as an integrated part of LOM planning. | |
|
Ore stockpiles will be processed and any other stockpiles of soil and overburden will be re- contoured to match the local topography. | |
|
Borrow areas will be re-contoured to be physically stable and free draining. | |
| Mining Pits |
All open pits will be flooded to create pit lakes by stopping pit dewatering (pumping). Drainage patterns following topography will established and surface water run- off will be directed into the pit |
|
Where safe to do so, open pit slopes sloped to stable grade and hydroseeded to minimize erosion and high walls above pit lake water lines will be sloped to be geotechnically stable. | |
|
Koolhoven: has been identified for early closure by prioritized filling of the pit to reduce ML/ARD potential. Flooding will be completed as soon as possible and Koolhoven will be used as a field test of closure design for pit lakes. | |
|
J-zone: has been identified for prioritized filling as a means of ML/ARD control. Flooding will commence as soon as possible after mining ceases within the LOM plan. | |
|
Pay Caro: has been identified for accelerated filling to commence at the end of LOM to shorten the timeframe for flooding; (source water is excess TSF runoff). | |
|
Royal Hill: has been identified for accelerated filling at the end of the LOM to shorten the timeframe for filling; source water is from Roma West. | |
| Roads and pads |
Roads will be maintained to enable reclamation activities. |
|
Once no longer required, roads will be scarified and allowed to naturally revegetate. | |
|
Roads for water monitoring and access to TSF will remain beyond the reclamation phase. | |
|
Main access road and airport road remain open for access to the Solar Plant and to Nieuw Koffiekamp. | |
| Water management |
Water management will focus on establishing pit lakes, and minimizing ML/ARD risk of both the pits and dumps. This will help reduce the likelihood of requiring long-term water treatment. |
| IAMGOLD Corporation - Rosebel Gold Mine | |
| Technical Report NI 43-101 – November 5, 2018 | Page 20-16 |
| Domain and |
Closed Site Summary Description |
| Feature |
|
|
| |
|
Other site water management structures used for operations (e.g., ponds and diversions) will be backfilled and the areas re-contoured. | |
|
| |
|
Water Quality Objectives will be established at the nearest downstream receiving environment (SW21 for Mindrineti River and SW13 for Compagnie Creek). | |
|
| |
|
Active water treatment is not anticipated to be required based on current evaluation of the preferred alternative. However the water treatment plant will remain available for contingency up until monitoring shows it is not required. | |
|
| |
| Small scale mining area |
Disturbed areas inside or adjacent to RGM- mined areas will be reclaimed by RGM, where practicable. |
|
| |
| Buildings and fixed assets |
All buildings will be decontaminated, demolished, and removed. Mill plant includes some reclaimed steel. |
|
| |
|
Solar Plant (and access road) remains. | |
|
| |
| Contaminated land and waste |
An environmental site assessment will be completed prior to closure to direct reclamation efforts in the following areas: |
|
| |
|
Mill area and other areas where hazardous materials have been used or stored | |
|
| |
|
Environmental site assessments will be completed to facilitate relinquishment of land parcels to the Government of Suriname | |
|
| |
|
Hazardous and non- hazardous waste is managed according to existing waste management procedure; storage capacity at Pay Caro and TSF for closure waste is reviewed as an input to the detailed engineering and implementation study. | |
|
| |
| Social |
Activities to support social transition to closure will be undertaken during operations. A community needs assessment and closure readiness plan will be completed at least two years in advance of mine closure. |
|
| |
|
A community impact assessment will be completed five years after closure to evaluate the success of the social closure plan and to inform future projects by IAMGOLD and other companies |
| 20.7.2 |
SARAMACCA PROJECT |
Once all economically viable ore has been removed from the satellite Saramacca pit, the mine site would be reclaimed and closed. The purpose of reclamation and closure would be to reestablish to the degree feasible ecological function at the site while ensuring the site is safe. After a review of pit wall stability, final pit shell contours would be created to ensure that a significant failure of the walls would not occur. Buildings and infrastructure would be removed (i.e., mine truck maintenance shop, tank farm, sanitary sewer line, wastewater treatment plant, lunch rooms, pipes, pumps, etc.) as they became unnecessary. Facilities that can be repurposed would be kept intact and relocated. Building sites, roads, ponds and ditches would be filled or graded to approximate natural contours. Pre-mining drainage patterns would be re-stablished to the degree possible. Any contaminated soil from spills would be removed. Fencing or boulder guards would be established to prevent access to unsafe areas, such as the pit. Equipment would be removed from site when it is no longer needed.
| IAMGOLD Corporation - Rosebel Gold Mine | |
| Technical Report NI 43-101 – November 5, 2018 | Page 20-17 |
Stockpiled overburden, debris trees, and mulched material obtained during construction and excavation would be used to help re-establish habitats and vegetation. Revegetation would occur with native plants. Plant species collected ahead of site clearance and kept in a nursery would be returned to site and established. Irrigation, erosion control and pest management would take place as necessary.
Waste rock dumps (WRD) would be progressively reclaimed as each bench is completed by stacking saprolite near the crest of each lift, covering exposed rock and then applying a thin layer of topsoil and organic matter to allow vegetation to be seeded. This allows each lift to be reclaimed once each lift is complete. Other disturbed areas such as building sites, roads, pond footprints, ditches, the ore pad, and overburden pad would also be revegetated. Areas adjacent to the mine site disturbed by small-scale miners would also be revegetated.
The goal at Saramacca for water management is to re-establish to the degree possible pre-mining hydrology. This includes discharging clean water in quantities and to locations that support aquatic life. It may include re-establishing stream channels and restoring drainage patterns.
Upon completion of mining, pit dewatering pumps would be removed and the pit would be allowed to flood via a combination of precipitation, surface runoff, and groundwater infiltration. Pit water quality would be monitored. Since precipitation is estimated to exceed evaporation by approximately 1200 mm per year at the project site, the pit would eventually overflow and discharge to the environment. The ultimate water level within the pit and the direction of discharge would be controlled using a combination of spillways and ditches.
Pending geochemical characterization results, RGM may accelerate the rate of flooding of the pit to limit possible ARD and/or metal leaching from occurring at significant levels. Accelerated flooding may be achieved by diverting or pumping surface water into the pit. In the event that the water quality in the pit is not suitable for direct discharge to the environment (i.e., it does not meet water quality criteria), the water would be collected and treated prior to discharge.
| IAMGOLD Corporation - Rosebel Gold Mine | |
| Technical Report NI 43-101 – November 5, 2018 | Page 20-18 |
The re-routed public road that would circumvent the mine site, which would be used to access villages and trees harvesting areas would not be reclaimed but kept in place for these purposes.
The haul road corridor including access roads to the haul road from public roads, which would be reclaimed and closed along its entire length. The corridor would be re-graded to minimize erosion and promote revegetation. Storm water ditches would be filled to restore hydrology. Grasses would be established initially to set the stage for forest species succession. Stream crossing infrastructure such as culverts or bridges would be removed. Wildlife crossing infrastructure such as tunnels would be removed.
Closed mine components at Rosebel and Saramacca will be monitored to measure the success of reclamation against closure objectives and criteria, and to justify relinquishment. Monitoring programs and schedules will use similar parameters, methods, QA/QC protocols, and evaluation as the current operational monitoring programs, but will be refined as necessary to demonstrate that:
| • |
Sites are stable or trending towards the desired outcome, and there are no trends leading to a need for any responses or implementation of contingencies. | |
|
| ||
| • |
Observed variables are the result of natural variations (e.g., seasonal influence) or natural disturbance and sites or factors have demonstrated resilience to these natural influences. | |
|
| ||
| • |
Reclaimed sites are safe for use by others in a manner that is compatible with regional development goals. | |
|
| ||
| • |
While it is acknowledged that actual durations for post-closure monitoring will be dependent on observed trends and results, at this time, monitoring periods in closure have been set based on the following assumptions: | |
|
| ||
| • |
Building from operational monitoring, geotechnical monitoring of the TSF embankments may be able to demonstrate long-term stability within five years post closure; however, annual monitoring will continue until water quality monitoring is completed. | |
|
| ||
| • |
Revegetation surveys will be completed annually for at least five years to demonstrate that conditions trending for self-sustaining ecosystems to establish. | |
|
| ||
| • |
Water quality and flows will be monitored from defined locations within the mining concession for a period of at least 10 years after all pits have been flooded and are freely draining to demonstrate that closed domains are functioning as intended. |
| IAMGOLD Corporation - Rosebel Gold Mine | |
| Technical Report NI 43-101 – November 5, 2018 | Page 20-19 |
| • |
RGM will retain a level of on-site presence so the safety, security and reputation of the company remain protected, until the licenses and leases have been relinquished. |
| IAMGOLD Corporation - Rosebel Gold Mine | |
| Technical Report NI 43-101 – November 5, 2018 | Page 20-20 |
| 21 |
CAPITAL AND OPERATING COSTS |
| 21.1 |
CAPITAL COSTS |
Note: All costs provided in this section are reported for 2019 and forward.
The capital cost requirement over the LOM includes the following:
| • | Capitalized waste stripping; | |
| • | Resource development costs; | |
| • | Sustaining capital expenditures (including mine equipment additions and replacements, mill and site in general, tailings dam construction); | |
| • | Expansion capital (Saramacca project development). |
A total of $1,109 million of capital is planned to be spent over the remaining LOM, which equates to $7.45/t milled or $244/oz of Au. The total capital expenditure excluding expansion capital associated with the development of the Saramacca project is $941 million, which equates to $6.32/t milled or $207/oz of Au.
Sustaining capital, inclusive of the Saramacca deposit, is the largest capital cost estimated at $477 million, representing 44% of the LOM remaining capital expenditure. Figure 21-1 shows the distribution of capital over the LOM.
| IAMGOLD Corporation - Rosebel Gold Mine | |
| Technical Report NI 43- 101 – November 5, 2018 | Page 21-1 |
FIGURE 21-1 LIFE OF MINE EXPENDITURE

Capital cost estimate breakdowns and explanations are provided below.
| 21.1.1 |
RESOURCE DEVELOPMENT |
An annual resource development budget of $3 million has been allocated to continue drilling prospective Mineral Resources, with no additional funds allocated beyond 2030. The manpower levels are also forecasted accordingly. Exploration or resource development is treated as a discretionary expense which is renewable every six months. The intent of this measure is to ensure that capital is allocated with caution by progressively advancing strategic development zones.
It should be noted that continued regional exploration along the Saramacca trend is not included herein.
| IAMGOLD Corporation - Rosebel Gold Mine | |
| Technical Report NI 43- 101 – November 5, 2018 | Page 21-2 |
| 21.1.2 |
TAILINGS DAM CONSTRUCTION |
An annual budget of $3 million has been allocated for the annual raise of the tailings dams, with no additional funds allocated beyond 2030. The manpower levels are also forecasted accordingly. The cost of the tailings facility expansion is estimated to be $14.6 million. The construction schedule was not part of the pre-feasibility study completed by Golder (Golder, 2018b), so for capital appropriation purposes, the cost was allocated over two years, 2028 and 2029.
| 21.1.3 |
CAPITAL WASTE STRIPPING |
Capitalized waste stripping (CWS), or deferred stripping, is an accounting practice used to capitalize the cost of stripping waste to access future ore for future economic benefits. The definition of deferred stripping and the method of calculating these costs are outlined in International Financial Reporting Interpretations Committee (IFRIC) 20 by the International Accounting Standards Board (IASB).
Each of these components (i.e., pit or phase) is treated separately when calculating the CWS. The strip ratio over the life of the phase (LOPSR) is determined by dividing the quantity of waste by the quantity of ore for the entirety of the phase, including past mining.
The mining of waste can be considered as a deferred cost if:
| • |
The strip ratio for the period exceeds the LOPSR; whereby the waste that exceeds that of the LOPSR is capitalized; | |
| • | The stripping does not occur within one year of the end of the life of the phase. |
The CWS associated tonnages are illustrated in Figure 21-2. Most of the mined waste will be capitalized between 2019 and 2029, with minor tonnages in 2030.
| IAMGOLD Corporation - Rosebel Gold Mine | |
| Technical Report NI 43- 101 – November 5, 2018 | Page 21-3 |
FIGURE 21-2 CAPITALIZED WASTE STRIPPING

| 21.1.4 |
SUSTAINING CAPITAL - MINE EQUIPMENT CAPITAL EXPENDITURES |
As part of the mine sustaining capital, a life-of-fleet model has been prepared to track equipment hours and schedule equipment replacements based on useful life assumptions. The major equipment purchase schedule including replacements and additions is presented in Table 21-1.
As of 2019, mine equipment purchases require $144 million of capital, excluding capital spares.
| IAMGOLD Corporation - Rosebel Gold Mine | |
| Technical Report NI 43- 101 – November 5, 2018 | Page 21-4 |
TABLE 21-1 MAJOR EQUIPMENT PURCHASE REPLACEMENT SCHEDULE
| Mine Equipment Fleet (Units) | 2019 | 2020 | 2021 | 2022 | 2023 | 2024 | 2025 | 2026 | 2027 | 2028 | 2029 | 2030 | 2031 | 2032 | 2033 |
| Loading Fleet | |||||||||||||||
| PC2000 Excavator | 1 | - | 2 | 1 | - | - | |||||||||
| CAT 993 Wheel Loaders | - | - | - | 1 | - | - | 1 | - | - | ||||||
| No. Loading Units | 1 | - | 2 | 1 | - | 1 | - | - | 1 | - | - | ||||
| Hauling Fleet | |||||||||||||||
| CAT 785 Trucks | - | - | 3 | 1 | 1 | 11 | 3 | 3 | - | - | |||||
| CAT 777 Trucks | - | - | - | - | |||||||||||
| No. Haul Trucks | - | - | 3 | 1 | 1 | 11 | 3 | 3 | - | - | - | ||||
| Drill Fleet | |||||||||||||||
| CAT MD6290 | 1 | - | 2 | 3 | 4 | - | 2 | 1 | - | - | |||||
| Atlas Copco D65 | - | - | 3 | 2 | - | 1 | - | - | 1 | 2 | - | 1 | - | - | - |
| No. Drill Rigs | 1 | - | 5 | 5 | - | 3 | 3 | - | 1 | - | - | - | |||
| Ancillary Fleet | |||||||||||||||
| CAT 345/349 Excavator | 2 | 1 | 1 | 1 | - | - | - | - | |||||||
| CAT D9T Bulldozer | 4 | - | - | 2 | 4 | 4 | 3 | - | - | - | |||||
| CAT 16G/M Grader | 1 | - | - | 2 | 1 | 1 | 1 | - | - | - | |||||
| CAT 777 Water Truck | 1 | - | - | - | 1 | - | - | - | - | ||||||
| CAT 740 A/B Truck | - | 1 | 1 | - | - | - | |||||||||
| CAT 990H Loader | - | - | 1 | - | - | - | |||||||||
| CAT 980G Loader | - | - | 1 | - | 1 | - | 1 | - | - | - | |||||
| CAT 824 Wheeldozer | - | - | 2 | - | - | - | |||||||||
| No. Support Units | 8 | 2 | 12 | 10 | 6 | - | - | - | |||||||
| Total Equipment Replacements | 10 | 2 | 13 | 13 | 17 | 24 | 10 | 3 | 4 | 3 | - | 1 | - | - | - |
| IAMGOLD Corporation - Rosebel Gold Mine | |
| Technical Report NI 43- 101 – November 5, 2018 | Page 21-5 |
| 21.1.5 |
CLOSURE AND RECLAMATION COSTS |
A provision of $61 million is planned for the closure of the Rosebel Gold Mine, and $7 million for the Saramacca property. It should be noted that work is currently on-going to update the Closure Plan and associated costs, which is not included in the cost structure used to develop the reserves.
| 21.2 |
OPERATING COSTS |
The mine operating costs are estimated on the basis of the physical quantities of the mine plan, realistic equipment productivity assumptions, overall equipment efficiencies, and updated consumable prices.
Average mine operating costs over the LOM are estimated at $2.19/t mined, based on assumed diesel costs of the LOM of $0.63/L. The average LOM total milling cost (inclusive of power) is estimated to be $7.92/t milled. The average LOM G&A cost is $2.16/t milled and assumes an annual spend of $23 million until 2029, after which G&A costs will gradually decrease as the operation will approach the end of life.
| IAMGOLD Corporation - Rosebel Gold Mine | |
| Technical Report NI 43-101 – November 5, 2018 | Page 21-6 |
| 22 |
ECONOMIC ANALYSIS |
This section is not required as the Rosebel Gold Mine is currently in production and there is no material expansion of current production.
| IAMGOLD Corporation - Rosebel Gold Mine | |
| Technical Report NI 43-101 – November 5, 2018 | Page 22-1 |
| 23 |
ADJACENT PROPERTIES |
There are no significant properties to report in this section.
| IAMGOLD Corporation - Rosebel Gold Mine | |
| Technical Report NI 43-101 – November 5, 2018 | Page 23-1 |
| 24 | OTHER RELEVANT DATA AND INFORMATION |
No additional information or explanation is necessary to make this Technical Report understandable and not misleading.
| IAMGOLD Corporation - Rosebel Gold Mine | |
| Technical Report NI 43-101 – November 5, 2018 | Page 24-1 |
| 25 |
INTERPRETATION AND CONCLUSIONS |
IAMGOLD has the following conclusions and observations for the RGM Mineral Resource and Mineral Reserve update:
| • |
The Mineral Resource and Mineral Reserve estimates have been prepared in accordance with CIM definitions. | |
|
| ||
| • |
Work completed to date by the geological staff is appropriate. | |
|
| ||
| • |
The geological model employed by RGM geologists is reasonably well understood and is well supported by field observations in both outcrop, pit mapping, and drill intersections. | |
|
| ||
| • |
The resource models have been prepared using appropriate methodology and assumptions. These parameters include: |
| o | Treatment of high assays; | |
| o | Compositing length; | |
| o | Search parameters; | |
| o | Bulk density; | |
| o | Cut-off grade; | |
| o | Classification. |
| • |
The block models have been validated using a reasonable level of rigour consistent with common industry practice. | |
|
| ||
| • |
The resource estimates reported herein are a reasonable representation of the Mineral Resources delineated at the Rosebel Gold Mine as of September 1, 2018. | |
|
| ||
| • |
The current drill spacing in all deposits is judged adequate to develop a reasonable model of the mineralization distribution and to quantify its volume and quality with a good level of confidence in all areas of the project. | |
|
| ||
| • |
Based on visual verification, the RGM models (Rock Type, Density, and Au Grade) were found to be globally representative of the known geological and structural controls of mineralization at the RGM deposit. | |
|
| ||
| • |
Statistical analysis demonstrates that the block model provides a reasonable estimate of the Mineral Resources of the RGM deposits. | |
|
| ||
| • |
Validation of the block models, using different interpolation methods, indicated that tonnages, grades, and gold contents are similar. | |
|
| ||
| • |
Block models at RGM were also compared and reconciled with production data and are considered as being appropriate. |
| IAMGOLD Corporation - Rosebel Gold Mine | |
| Technical Report NI 43-101 – November 5, 2018 | Page 25-1 |
| • |
Swath plots for Indicated and Inferred Mineral Resources, by vertical sections for the RGM pits, indicate that peaks and lows in gold content generally match peaks and lows in composite frequency; no bias was found in the resource estimate in this regard. | |
|
| ||
| • |
A review of the information stored in the RGM database found it to be in good standing. | |
|
| ||
| • |
Sampling and assaying have been carried out following standard industry QA/QC practices. These practices include, but are not limited to, sampling, assaying, chain of custody of the samples, sample storage, use of third-party laboratories, standards, blanks, and duplicates. | |
|
| ||
| • |
The mine design and Mineral Reserve estimate have been completed to a level appropriate for an operating mine. | |
|
| ||
| • |
The economic assumptions and methodology used for estimation of the Mineral Reserves are appropriate. | |
|
| ||
| • |
The Mineral Reserve estimate is consistent with CIM definitions and is suitable for public reporting. As such, the Mineral Reserves are based on Measured and Indicated Mineral Resources and do not include any Inferred Mineral Resources. | |
|
| ||
| • |
Current production statistics indicate that the process flow sheet is adequate and suitable for processing the Rosebel Gold Mine ore types. |
SRK and IAMGOLD have the following conclusions and observations for the Saramacca Mineral Resource and Mineral Reserve update:
| • |
Mineral Resources and Mineral Reserves have been prepared in accordance with the CIM definitions. | |
|
| ||
| • |
Exploration data collected to date by IAMGOLD use procedures consistent with generally accepted industry best practices, and are sufficiently reliable to interpret with confidence the boundaries of the gold mineralization of the Saramacca gold deposit. | |
|
| ||
| • |
The geological model, constructed by SRK with the assistance of RGM geologists, is a reasonable representation of the gold mineralization at the current level of sampling. | |
|
| ||
| • |
The resource model has been prepared using appropriate methodology and assumptions: |
| o |
Gold grades were estimated into a block model informed by composited gold assays, capped where appropriate, and using an OK estimator. | |
| o |
Specific gravity was estimated into the blocks, using an inverse distance squared estimator, to convert volumes into tonnage. |
| • |
The block model has been validated by both SRK and IAMGOLD using various methodologies, including statistical comparisons between composites and block model distributions, estimation using different estimation methods, and visual checks with informing composites. These validation steps demonstrate that the block model provides a reasonable estimate of the Mineral Resources of the Saramacca deposit. |
| IAMGOLD Corporation - Rosebel Gold Mine | |
| Technical Report NI 43-101 – November 5, 2018 | Page 25-2 |
| • |
The resource evaluations reported herein is a reasonable representation of the Mineral Resources delineated at the Saramacca deposit as of September 13, 2018. | |
|
| ||
| • |
The mine design and Mineral Reserve estimate have been completed to a level appropriate for an operating mine. | |
|
| ||
| • |
The economic assumptions and methodology used for estimation of the Mineral Reserves are appropriate. | |
|
| ||
| • |
The Mineral Reserve estimate is consistent with the CIM definitions and is suitable for public reporting. As such, the Mineral Reserves are based on Measured and Indicated Mineral Resources and do not include any Inferred Mineral Resources. | |
|
| ||
| • |
Current production statistics indicate that the process flow sheet is adequate and suitable for processing the Saramacca deposit ore types. |
| IAMGOLD Corporation - Rosebel Gold Mine | |
| Technical Report NI 43-101 – November 5, 2018 | Page 25-3 |
| 26 |
RECOMMENDATIONS |
IAMGOLD and SRK have the following recommendations:
| • |
Continue the process of updating the resource models to incorporate the remaining deposits and update of the geological models of the current orebodies. | |
| • |
Continue upgrading the Inferred Mineral Resources to Indicated Mineral Resources. | |
| • |
Implement a stringent planning and operations process for following the variable cut- off grades in production, and closely monitor the reconciliation between planning and production. | |
| • |
Further refine the mine cost model for future input to the long term planning and scheduling designs. | |
| • |
Complete geological studies to build on existing knowledge and improve the understanding of the geological and structural setting of the Rosebel Gold Mine and Saramacca deposits. This may include further infill drilling to improve classification. | |
| • |
Test the lateral and depth extent of the Rosebel Gold Mine and Saramacca gold mineralization to potentially expand the Mineral Resources. | |
| • |
Continue optimization of the development of the Saramacca project, notably relevant to increasing metallurgical recovery, achieving pit slope dewatering to improve overall slope angles in saprolite, and optimized waste dump designs to reduce berm construction requirements. | |
| • |
Investigate underground development potential for the Saramacca deposit. |
| IAMGOLD Corporation - Rosebel Gold Mine | |
| Technical Report NI 43-101 – November 5, 2018 | Page 26-1 |
| 27 |
REFERENCES |
Agoratek International Consultants Inc., 2014. Sampling, Modeling and Reconciliations Phase 1. Prepared by Francois-Bongarcon, D., prepared for IAMGOLD Corporation, April 2014.
Agoratek International Consultants Inc., 2015. Sampling, Modeling and Reconciliations Phase 2. Prepared by Francois-Bongarcon, D., prepared for IAMGOLD Corporation, May 2015.
Aubé, V. 2017. Saramacca Metallurgical Testwork Update; Internal IAMGOLD Corporation memorandum, July 20, 2017.
COREM, 2018, Rosebel Saramacca Metallurgical Testing for the Feasibility Study no. T2300, October 31, 2018.
Daoust, C. (2016) – Caractérisation Stratigraphique, Structural et Géochimique du District Minéralisé de Rosebel (Suriname) Dans le Cadre de l’évolution Géodynamique du Bouclier Guyanais. (Doctoral Thesis). Université du Québec à Montréal.
Daoust, C., Voicu, G., Brisson, H., and Gauthier, M. 2011. Geological setting of the Paleoproterozoic Rosebel gold district, Guiana Shield, Suriname; Journal of South American Earth Sciences, v. 31(1), pp. 222-245.
Delor, C., De Roever, E. W., Lafon, J.-M., Lahondere, D., Rossi, P., Guerrot, C., & Potrel, A. 2003. The Bakhuis ultrahigh-temperature granulite belt (Suriname): II. implications for late Transamazonian crustal stretching in a revised Guiana Shield framework; Geology of France and surrounding areas, 2-3-4, p. 207-230.
Daoust, C. (2016) – Caractérisation Stratigraphique, Structural et Géochimique du District Minéralisé de Rosebel (Suriname) Dans le Cadre de l’évolution Géodynamique du Bouclier Guyanais. (Doctoral Thesis). Université du Québec a Montréal.
Clayton V. Deutsch Consultants Inc., 2016. Model Review and Recommendations, prepared for IAMGOLD Corporation. December 7, 2016.
GEOBASE CC., 2016. Analysis of Sampling Protocols and Practice at the Rosebel Gold Mining Operations, Brokopondo, Suriname, prepared by Minnitt, R.C.A., prepared for IAMGOLD Corporation, December, 2016.
Gillis, A. 2010. Sepro Gravity Investigation report. Prepared for Rosebel Gold Mine NV. December, 2012.
Golder Associates, 2013. Tailings Facility Expansion – Rosebel Gold Mines, Design Report. March 2013.
Golder Associates, 2018a. Tailings Storage Facility Deposition Plan – Rosebel Gold Mines, April 2018.
Golder Associates, 2018b. Report for Pre-Feasibility Study – Tailings Storage Facility Expansion – Rosebel Gold Mines, August 2018.
| IAMGOLD Corporation - Rosebel Gold Mine | |
| Technical Report NI 43-101 – November 5, 2018 | Page 27-1 |
IAMGOLD Corporation, 2017. Technical Report on the Rosebel Gold Mine, Brokopondo District, Suriname, NI 43-101 Report.
Kroonenberg, S. B., De Roever, E. W., Fraga, L. M., Reis, N. J., Faraco, T., Lafon, J. -M., and Wong, T. E., 2016. Paleoproterozoic evolution of the Guiana Shield in Suriname: A revised model; Netherlands Journal of Geosciences, p. 1-32. doi:10.1017/njg. 2016.10.
Lopez, C., 2010. Knelson Gravity Circuit Consideration. Prepared for Rosebel Gold Mine NV. December, 2012.
Robert, F., Brommecker, R., Bourne, B. T., Dobak, P. J., McEwan, C. J., Rowe, R. R. and Zhou, X., 2007. Models and Exploration Methods for Major Gold Deposit Types. In. "Proceedings of Exploration 07: Fifth Decennial International Conference on Mineral Exploration", Edited by B. Milkereit, 2007, pp. 691-711.
Roulston, D. and Sloan, R., 2017. Metallurgical Test Work on the Saramacca Project, Suriname, KM5252 Revision 1; May 18, 2017, Internal report prepared for IAMGOLD Corporation.
SGS Canada Inc., 2010. The Characterisation of Rosebel Ore Types, Prepared for IAMGOLD Corporation. December 2010.
SGS Canada Inc., 2010. The Investigation into The Efficiency of the Rosebel CIL Plant Operation.., Prepared for IAMGOLD Corporation. December 2010
SGS Canada Inc., 2010. The Investigation the Capacity of the Rosebel Grinding Circuit Throughout the Life of Mine. Characterisation of Rosebel Ore Types, Prepared for IAMGOLD Corporation. February 11, 2011.
Sherman, M. 2011. Rosebel Mine Comminution Circuit Review, Prepared for Rosebel Gold Mine. July 2011.
SNF, 2018 SNF Floerger, IAMGOLD Lab Evaluation, May 2018.
SRK Consulting (Canada) Inc., 2014. Rosebel Pit: Geotechnical Slope Designs and Implementation Requirements. Prepared for IAMGOLD Corporation, December 1, 2014.
SRK Consulting (Canada) Inc., 2014. J-Zone Pit: Geotechnical Slope Designs and Implementation Requirements. Prepared for IAMGOLD Corporation, December 15, 2014.
SRK Consulting (Canada) Inc., 2015. Mayo Pit: Geotechnical Slope Designs and Implementation Requirements. Prepared for IAMGOLD Corporation, February 4, 2015.
SRK Consulting (Canada) Inc., 2015. Pay Caro Pit: Geotechnical Slope Designs and Implementation Requirements. Prepared for IAMGOLD Corporation, February 4, 2015.
SRK Consulting (Canada) Inc., 2017a. Saramacca Gold Project Structural Geology Investigations on the Controls on the Distribution of the Gold Mineralization; Internal report prepared for IAMGOLD Corporation.
| IAMGOLD Corporation - Rosebel Gold Mine | |
| Technical Report NI 43-101 – November 5, 2018 | Page 27-2 |
SRK Consulting (Canada) Inc., 2017b. NI 43-101 Independent Technical Report for the Saramacca Gold Project, Suriname. Report prepared for IAMGOLD Corporation by Leuangthong, O., Cole, G., and Chartier, D. 101 pp. Effective Date September 5, 2017. Report Date October 16, 2017. Filed on SEDAR, www.sedar.com.
Thomas, K., 2010. PICA Carbon Testing and Circuit Auditing, Prepared for Rosebel Gold Mine NV. December 2012
Voicu, G., 2010. NI 43-101 Technical Report for Rosebel Mine, Suriname. Prepared for IAMGOLD Corporation.
| IAMGOLD Corporation - Rosebel Gold Mine | |
| Technical Report NI 43-101 – November 5, 2018 | Page 27-3 |
| 28 |
DATE AND SIGNATURE PAGE |
This report titled “Technical Report on the Rosebel Gold Mine, Suriname” with an effective date of September 23, 2018 was prepared and signed by the following authors:
| (Signed & Sealed) “Michel Payeur” | |
| Dated at Longueuil, QC | Michel Payeur, Eng. |
| November 5, 2018 | |
| (Signed & Sealed) “Raphaël Dutaut” | |
| Dated at Longueuil, QC | Raphaël Dutaut, P.Geo. |
| November 5, 2018 | |
| (Signed & Sealed) “Adam Doucette” | |
| Dated at Longueuil, QC | Adam Doucette, P.Eng. |
| November 5, 2018 | |
| (Signed & Sealed) “Stéphane Rivard” | |
| Dated at Longueuil, QC | Stéphane Rivard, P.Eng. CP (Met). |
| November 5, 2018 | |
| (Signed & Sealed) “Dominic Chartier” | |
| Dated at Toronto, ON | Dominic Chartier, P.Geo. |
| November 5, 2018 | |
| (Signed & Sealed) “Oy Leuangthong” | |
| Dated at Toronto, ON | Oy Leuangthong, P.Eng. |
| November 5, 2018 |
| IAMGOLD Corporation - Rosebel Gold Mine | |
| Technical Report NI 43- 101 – November 5, 2018 | Page 28-1 |
| 29 |
CERTIFICATE OF QUALIFIED PERSON |
| 29.1.1 |
MICHEL PAYEUR |
I, Michel Payeur, Eng., M.A.Sc., as an author of this report entitled “Technical Report on the Rosebel Gold Mine, Suriname” with an effective date of September 23, 2018, do hereby certify that:
| 1. |
I am the Director Strategy, Americas based in IAMGOLD Corporation offices, 1111, St. Charles Street West, Longueuil, QC, Canada, J4K 5G4. |
| 2. |
I am a graduate of École Polytechnique de Montréal, Quebec (B. Eng. in Geological Engineering) in 2001. |
| 3. |
I am registered as an Engineer in the Province of Quebec (OIQ #127646). |
| 4. |
I have been practicing as a geological engineer since 2002. My relevant experience for the purpose of the Technical Report is being Director Strategy, Americas, IAMGOLD Corporation and former Manager of Technical Services at Rosebel Gold Mines. |
| 5. |
I have read the definition of "qualified person" set out in National Instrument 43-101 (NI 43- 101) and certify that by reason of my education, affiliation with a professional association (as defined in NI 43-101) and past relevant work experience, I fulfill the requirements to be a "qualified person" for the purposes of NI 43- 101. |
| 6. |
I have visited the Rosebel Gold Mine multiple times since 2014, most recently in October 2018. |
| 7. |
I am responsible for Sections 1 to 5, Section 6 pertaining to the RGM Concession, and Sections 19 to 27 of the Technical Report. |
| 8. |
I have been working for IAMGOLD Corporation since 2014. I am a full–time employee of IAMGOLD Corporation, Canada and I own shares of IAMGOLD Corporation. |
| 9. |
I am not independent of IAMGOLD Corporation as set out in Section 1.5 of NI 43- 101, as per NI 43-101 s.8.1(2)(f), as I am a full-time employee. |
| 10. |
I have read NI 43-101, and the part of the Technical Report for which I am responsible has been prepared in compliance with NI 43-101 and Form 43-101F1. |
| 11. |
At the effective date of the Technical Report, to the best of my knowledge, information, and belief, Sections 1 to 5, Section 6 pertaining to the RGM Concession, and Sections 19 to 27 of the Technical Report for which I am responsible contain all scientific and technical information that is required to be disclosed to make the Technical Report not misleading. |
Dated this 5th day of November, 2018
(Signed & Sealed) “Michel
Payeur”
Michel Payeur, Eng., M.A.Sc., (OIQ #127646)
Director, Strategy, Americas, IAMGOLD Corporation
| IAMGOLD Corporation - Rosebel Gold Mine | |
| Technical Report NI 43-101 – November 5, 2018 | Page 29-1 |
| 29.1.2 |
RAPHAËL DUTAUT |
I, Raphaël Dutaut, P.Geo., as an author of this report entitled “Technical Report on the Rosebel Gold Mine, Suriname with an effective date of September 23, 2018, do hereby certify that:
| 1. |
I am the Chief Geologist at Rosebel Gold Mines, in the Brokopondo District, Suriname (Heerenstraat 8, P.O.Box 2973, Paramaribo, Suriname). |
| 2. |
I am a graduate of Toulouse France (B. Sc. Geology) in 2005. |
| 3. |
I am registered as a Professional Geologist in the Province of Quebec (OGQ #1301). |
| 4. |
I have practiced my profession of geologist continuously for the past 11 years. My relevant experience consists of resources estimates for gold deposits in North and South America, Africa and Europe, as well as is my former position as senior resources geologist for IAMGOLD Corporate and actual position as Chief Geologist, Rosebel Gold Mines, since February 2017. |
| 5. |
I have read the definition of "qualified person" set out in National Instrument 43-101 (NI 43- 101) and certify that by reason of my education, affiliation with a professional association (as defined in NI 43-101) and past relevant work experience, I fulfill the requirements to be a "qualified person" for the purposes of NI 43- 101. |
| 6. |
I am responsible for Sections 7 to 12, and Section 14 of the Technical Report pertaining to the RGM Concession. |
| 7. |
I have been working for IAMGOLD Corporation from 2011 to 2016 and from 2017 to 2018 as a Geology coordinator, Resources Geologist, Senior Resource Geologist, and Chief Geologist. I am a full-time employee IAMGOLD, Rosebel Gold Mines, in Suriname, and I own shares of IAMGOLD Corporation. |
| 8. |
I am not independent of IAMGOLD Corporation as set out in Section 1.5 of NI 43- 101, as per NI 43-101 s.8.1(2)(f), as I am a full-time employee. |
| 9. |
I have read NI 43-101, and the part of the Technical Report for which I am responsible has been prepared in compliance with NI 43-101 and Form 43-101F1. |
| 10. |
At the effective date of the Technical Report, to the best of my knowledge, information, and belief, Sections 7 to 12, and Section 14 of the Technical Report pertaining to the RGM Concession for which I am responsible contain all scientific and technical information that is required to be disclosed to make the Technical Report not misleading. |
Dated this 5th day of November, 2018
(Signed & Sealed) “Raphaël
Dutaut”
Raphaël Dutaut, P.Geo., (OGQ # 1301)
Chief
Geologist
IAMGOLD, Rosebel Gold Mines
| IAMGOLD Corporation - Rosebel Gold Mine | |
| Technical Report NI 43-101 – November 5, 2018 | Page 29-2 |
| 29.1.3 |
ADAM DOUCETTE |
I, Adam Doucette, P.Eng., as an author of this report entitled “Technical Report on the Rosebel Gold Mine, Suriname” with an effective date of September 23, 2018, do hereby certify that:
| 1. |
I am the Chief Engineer at Rosebel Gold Mines, in the Brokopondo District, Suriname (Heerenstraat 8, P.O.Box 2973, Paramaribo, Suriname). |
| 2. |
I am a graduate of Dalhousie University, Halifax, Nova Scotia, with a Bachelor of Mine Engineering in 2005. |
| 3. |
I am registered as a Professional Engineer in the Province of Ontario (PEO# 100200823). |
| 4. |
I have practised my profession of mining engineer continuously for the last 12 years, mostly in gold mining. My relevant experience for the purpose of the Technical Report is my position as Chief Engineer since November 2016. |
| 5. |
I have read the definition of "qualified person" set out in National Instrument 43-101 (NI 43- 101) and certify that by reason of my education, affiliation with a professional association (as defined in NI 43-101) and past relevant work experience, I fulfill the requirements to be a "qualified person" for the purposes of NI 43- 101. |
| 6. |
I am responsible for Sections 15, 16, and 18 of the Technical Report. |
| 7. |
I have been working for IAMGOLD Corporation since 2015, and previously from 2009 to 2012 as short term planner, medium term planner and chief engineer. I am a full-time employee IAMGOLD, Rosebel Gold Mines, in Suriname. |
| 8. |
I am not independent of IAMGOLD Corporation as set out in Section 1.5 of NI 43- 101, as per NI 43-101 s.8.1(2)(f), as I am a full-time employee. |
| 9. |
I have read NI 43-101, and the part of the Technical Report for which I am responsible has been prepared in compliance with NI 43-101 and Form 43-101F1. |
| 10. |
At the effective date of the Technical Report, to the best of my knowledge, information, and belief, Sections 15, 16, and 18 of the Technical Report for which I am responsible contain all scientific and technical information that is required to be disclosed to make the Technical Report not misleading. |
Dated this 5th day of November, 2018
(Signed & Sealed) “Adam
Doucette”
Adam Doucette, P.Eng., (PEO# 100200823)
Chief
Engineer, IAMGOLD, Rosebel Gold Mines
| IAMGOLD Corporation - Rosebel Gold Mine | |
| Technical Report NI 43-101 – November 5, 2018 | Page 29-3 |
| 29.1.4 |
STÉPHANE RIVARD |
I, Stéphane Rivard, P.Eng., as an author of this report entitled “Technical Report on the Rosebel Gold Mine, Suriname” with an effective date of September 23, 2018, do hereby certify that:
| 1. |
I am the Director Metallurgy at IAMGOLD Corporation offices, 1111, St. Charles Street West, Longueuil, QC, Canada, J4K 5G4. |
| 2. |
I am a graduate of the LAVAL University with a B.Sc.Eng. in Metallurgical and Material Science Engineering in 1994. |
| 3. |
I am registered as an Engineer in the Province of Quebec (OIQ #118538). |
| 4. |
I have practised my profession continuously since my graduation. My relevant experience for the purpose of the Technical Report is as Director Metallurgy for IAMGOLD Corporation, overseeing metallurgical aspect of projects such as Coté Gold project, Boto Gold project, Saramacca gold project and Essakane Heap Leach project and providing also site metallurgical governance for Essakane, Rosebel and Westwood mines. Previous employer where I have practised my relevant experiences are, Cambior Inc., Noranda Inc, Ausenco as Director M&M and PM, SNC Lavalin and Metchem. |
| 5. |
I have read the definition of "qualified person" set out in National Instrument 43-101 (NI 43- 101) and certify that by reason of my education, affiliation with a professional association (as defined in NI 43-101) and past relevant work experience, I fulfill the requirements to be a "qualified person" for the purposes of NI 43- 101. |
| 6. |
I have visited the Rosebel Gold Mine multiple times since 2017, most recently in October 2018. |
| 7. |
I am responsible for Sections 13 and 17 of the Technical Report. |
| 8. |
I have been working for IAMGOLD Corporation since 2017. I am a full-time employee IAMGOLD Corporation, and I own shares of IAMGOLD Corporation. |
| 9. |
I am not independent of IAMGOLD Corporation as set out in Section 1.5 of NI 43- 101, as per NI 43-101 s.8.1(2)(f), as I am a full-time employee. |
| 10. |
I have read NI 43-101, and the part of the Technical Report for which I am responsible has been prepared in compliance with NI 43-101 and Form 43-101F1. |
| 11. |
At the effective date of the Technical Report, to the best of my knowledge, information, and belief, Sections 13 and 17 of the Technical Report for which I am responsible contain all scientific and technical information that is required to be disclosed to make the Technical Report not misleading. |
Dated this 5th day of November, 2018
(Signed & Sealed) “Stéphane
Rivard”
Stéphane Rivard, P.Eng., (OIQ #118538)
Director
Metallurgy
IAMGOLD Corporation
| IAMGOLD Corporation - Rosebel Gold Mine | |
| Technical Report NI 43-101 – November 5, 2018 | Page 29-4 |
| 29.1.5 |
DOMINIC CHARTIER |
I, Dominic Chartier, P.Geo., as an author of this report entitled “Technical Report on the Rosebel Gold Mine, Suriname with an effective date of September 23, 2018, do hereby certify that:
| 1. |
I am a Senior Consultant (Resource Geology) with the firm of SRK Consulting (Canada) Inc. (SRK) with an office at Suite 1500, 155 University Avenue, Toronto, Ontario, Canada. |
| 2. |
I am a graduate of McGill University in Montreal, Quebec, with a B.Sc. in Earth and Planetary Sciences in 2002. I have practiced my profession continuously since 2002. I have created geological and ore deposit 3D models, analyzed the geostatistics and variography of ore deposits, completed National Instrument 43-101 compliant mineral resource estimations, evaluated the geotechnical and structural properties of ore deposits, reviewed analytical quality control sample results, and co-authored or contributed to numerous National Instrument 43- 101 technical reports focused on gold, base metal and precious metal projects in Canada, West Africa, and South America. |
| 3. |
I am a Professional Geologist, registered with the Ordre des Géologues du Québec (OGQ #874), and the Association of Professional Geoscientists of Ontario (APGO #2775). |
| 4. |
I have read the definition of Qualified Person set out in National Instrument 43 -101 and certify that by virtue of my education, affiliation to a professional association, and past relevant work experience, I fulfill the requirements to be a Qualified Person for the purposes of National Instrument 43-101 and this technical report has been prepared in compliance with National Instrument 43-101 and Form 43-101F1. |
| 5. |
I visited the Saramacca gold project from January 22 to 26, 2018. |
| 6. |
I am the co-author of this report and am responsible for Sections 6 to 12, and 14 pertaining to the Saramacca Concession of the Technical Report. |
| 7. |
I, as a Qualified Person, am independent of the issuer as defined in Section 1.5 of National Instrument 43- 101. I have not received, nor do I expect to receive, any interest, directly or indirectly, in the Saramacca gold project or securities of IAMGOLD Corporation. |
| 8. |
In 2017, I co-authored a technical report for the Saramacca gold project. Since then, I have provided ongoing intermittent geological modelling support for the Saramacca gold project. |
| 9. |
I have read NI 43-101, and the parts of the Technical Report for which I am responsible have been prepared in compliance with NI 43-101 and Form 43- 101F1. |
| 10. |
That, as of the date of this certificate, to the best of my knowledge, information, and belief, Sections 6 to 12 and 14 of the Technical Report pertaining to the Saramacca Concession for which I am responsible contain all scientific and technical information that is required to be disclosed to make the technical report not misleading. |
Dated this 5th day of November, 2018
(Signed & Sealed) “Dominic
Chartier”
Dominic Chartier, P.Geo
Senior Consultant
(Geology), SRK Consulting (Canada) Inc.
| IAMGOLD Corporation - Rosebel Gold Mine | |
| Technical Report NI 43-101 – November 5, 2018 | Page 29-5 |
| 29.1.6 |
OY LEUANGTHONG |
I, Oy Leuangthong, P.Eng., as an author of this report entitled “Technical Report on the Rosebel Gold Mine, Suriname” with an effective date of September 23, 2018, do hereby certify that:
| 1. |
I am a Principal Consultant (Geostatistics) with the firm of SRK Consulting (Canada) Inc. (SRK) with an office at Suite 1500 – 155 University Avenue, Toronto, Ontario, Canada. |
| 2. |
I am a graduate of the University of Toronto in 1998 with B.A.Sc. (Honours) in Civil Engineering. I am a graduate of the University of Alberta in 2003 with a PhD in Mining Engineering (Geostatistics). My relevant experience includes research in resource modelling and geostatistics, teaching activities in mine planning, resource estimation and advanced geostatistics, and since 2010, geostatistical support and modelling for exploration projects in the Americas, Australia, and West Africa. |
| 3. |
I am a professional Engineer registered with the Professional Engineers Ontario (PEO#90563867). |
| 4. |
I have read the definition of "qualified person" set out in National Instrument 43-101 (NI 43- 101) and certify that by reason of my education, affiliation with a professional association (as defined in NI 43-101) and past relevant work experience, I fulfill the requirements to be a "qualified person" for the purposes of NI 43- 101. |
| 5. |
I have not personally visited the project area. |
| 6. |
I am a co-author of this report and am responsible for Section 14 pertaining to the Saramacca Concession of the Technical Report. |
| 7. |
I have not received, nor do I expect to receive, any interest, directly or indirectly, in the Saramacca Concession or the Rosebel Gold Mine or securities of IAMGOLD Corporation. |
| 8. |
I am independent of IAMGOLD Corporation as set out in Section 1.5 of NI 43-101, as per NI 43-101 s.8.1(2)(f). |
| 9. |
In 2017 I co-authored a technical report for the Saramacca gold project. Since then, I have provided ongoing intermittent geostatistical and Mineral Resource modelling support to IAMGOLD Corporation for the Saramacca Concession. |
| 10. |
I have read NI 43-101, and the part of the Technical Report for which I am responsible has been prepared in compliance with NI 43-101 and Form 43-101F1. |
| 11. |
At the effective date of the Technical Report, to the best of my knowledge, information, and belief, Section 14 of the Technical Report pertaining to the Saramacca Concession for which I am responsible contain all scientific and technical information that is required to be disclosed to make the Technical Report not misleading. |
Dated this 5th day of November, 2018
(Signed & Sealed) “Oy
Leuangthong”
Oy Leuangthong, P.Eng., (PEO#90563867)
Principal Consultant (Geostatistics)
SRK Consulting (Canada) Inc.
| IAMGOLD Corporation - Rosebel Gold Mine | |
| Technical Report NI 43-101 – November 5, 2018 | Page 29-6 |
APPENDIX A
Saramacca Analytical Quality Control Data and
Relative
Precision Charts
| IAMGOLD Corporation - Rosebel Gold Mine | |
| Technical Report NI 43-101 – November 5, 2018 | Page A-1 |
Time Series Plot for SurEx Blank Material Samples Assayed by Filab between 2017 and 2018
|
Field | OREAS | ||||||
| Statistics | Blank | 26b | 24c | |||||
| Project | Saramacca | Sample Count | 375 | 476 | 595 | |||
| Data Series | 2017 - 2018 SurEx Blanks | Expected Value | 0.001 | 0.001 | 0.001 | |||
| Data Type | Core Samples | Standard Deviation | - | - | - | |||
| Commodity | Au in g/t | Data Mean | 0.003 | 0.007 | 0.003 | |||
| Laboratory | Filab | Upper Limit (10xDL) | 1% | 2% | 0% | |||
| Analytical Method | Fire Assay | |||||||
| Detection Limit | 0.005 g/t | |||||||

| IAMGOLD Corporation - Rosebel Gold Mine | |
| Technical Report NI 43-101 – November 5, 2018 | Page A-2 |
Time Series Plot for SurEx Certified Reference Material Samples Assayed by Filab in between 2017 and 2018
|
||||||||
| Statistics | 250 | 252 | 202 | 209 | 254 | 210 | ||
| Project | Saramacca | Sample Count | 288 | 228 | 385 | 296 | 30 | 126 |
| Data Series | 2017-2018 SurEx Standards | Expected Value | 0.309 | 0.674 | 0.752 | 1.580 | 2.550 | 5.490 |
| Data Type | Core Samples | Standard Deviation | 0.013 | 0.022 | 0.026 | 0.044 | 0.076 | 0.152 |
| Commodity | Au in g/t | Data Mean | 0.327 | 0.651 | 0.752 | 1.606 | 2.491 | 5.598 |
| Laboratory | Filab | Outside 2StdDev | 8% | 5% | 1% | 1% | 3% | 0% |
| Analytical Method | Fire Assay | Below 2StdDev | 0 | 11 | 2 | 1 | 1 | 0 |
| Detection Limit | 0.005 g/t | Above 2StdDev | 24 | 0 | 0 | 1 | 0 | 0 |

| IAMGOLD Corporation - Rosebel Gold Mine | |
| Technical Report NI 43-101 – November 5, 2018 | Page A-3 |
Bias Charts and Precision Plots for Blind Coarse Reject Duplicates, RC and Core Samples, Assayed by Filab between 2017 and 2018.
|
Statistics | Original | Coarse Dup. | |
| Sample Count | 433 | 433 | ||
| Project | Saramacca | Minimum Value | 0.003 | 0.003 |
| Data Series | 2017-2018 SurEx Coarse Reject Dup. | Maximum Value | 127.12 | 1,551.00 |
| Data Type | RC and Core Samples | Mean | 1.605 | 5.106 |
| Commodity | Au in g/t | Median | 0.018 | 0.008 |
| Analytical Method | Fire Assay | Standard Error | 0.418 | 3.605 |
| Detection Limit | 0.005 g/t | Standard Deviation | 8.695 | 75.005 |
| Original Dataset | Original Assays | Correlation Coefficient | 0.0940 | |
| Paired Dataset | Coarse Reject Assays | Pairs ≤ 10% HARD | 38.8% | |
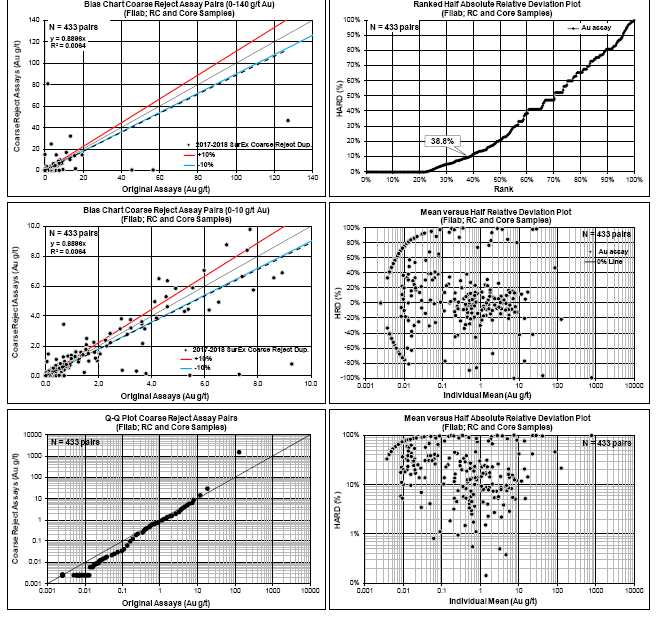
| IAMGOLD Corporation - Rosebel Gold Mine | |
| Technical Report NI 43-101 – November 5, 2018 | Page A-4 |
Bias Charts and Precision Plots for SurEx Umpire Check Assays, RC, and DD Samples, Assayed by ALS in Vancouver, Canada between 2016 and 2018.
|
Statistics | Filab | ALS | |
| Sample Count | 4,693 | 4,693 | ||
| Project | Saramacca | Minimum Value | 0.003 | 0.003 |
| Data Series | 2016-2018 SurEx Umpire Check Assays | Maximum Value | 169.25 | 187.00 |
| Data Type | Core Pulp Samples | Mean | 1.354 | 1.579 |
| Commodity | Au in g/t | Median | 0.054 | 0.030 |
| Analytical Method | Fire Assay | Standard Error | 0.083 | 0.104 |
| Detection Limit | 0.005 g/t Au | Standard Deviation | 5.653 | 7.107 |
| Original Dataset | Filab Assays | Correlation Coefficient | 0.8566 | |
| Paired Dataset | ALS Assays | Pairs ≤ 10% HARD | 32.0% | |
![]()
| IAMGOLD Corporation - Rosebel Gold Mine | |
| Technical Report NI 43-101 – November 5, 2018 | Page A-5 |
Time Series Plot for MinEx Blank and Certified Reference Material Samples Assayed by RGM lab in Suriname N.V. in 2018
|
Field | |||||||
| Statistics | Blank | OxC88 | SE58 | SG56 | SJ53 | |||
| Project | Saramacca | Sample Count | 459 | 157 | 18 | 95 | 67 | |
| Data Series | 2018 MinEx Blanks and Standards | Expected Value | 0.014 | 0.20 | 0.61 | 1.03 | 2.64 | |
| Data Type | Core Samples | Standard Deviation | - | 0.01 | 0.02 | 0.03 | 0.05 | |
| Commodity | Au in g/t | Data Mean | 0.009 | 0.21 | 0.61 | 1.04 | 2.70 | |
| Laboratory | RGM | Outside 2StdDev/UL | 0% | 10% | 11% | 37% | 31% | |
| Analytical Method | Fire assay | Below 2StdDev | - | 0 | 0 | 16 | 5 | |
| Detection Limit | 0.014 g/t | Above 2StdDev | - | 15 | 2 | 19 | 16 | |

| IAMGOLD Corporation - Rosebel Gold Mine | |
| Technical Report NI 43-101 – November 5, 2018 | Page A-6 |
Bias Charts and Precision Plots MinEx Blind Pulp Duplicate Samples Assayed by RGM lab in Suriname N.V. in 2018
|
Statistics | Original | Pulp Dup. | |
| Sample Count | 205 | 205 | ||
| Project | Saramacca | Minimum Value | 0.007 | 0.024 |
| Data Series | 2018 MinEx Pulp Dup. | Maximum Value | 35.80 | 219.35 |
| Data Type | Core Samples | Mean | 2.851 | 3.304 |
| Commodity | Au in g/t | Median | 1.114 | 0.904 |
| Analytical Method | Fire Assay | Standard Error | 0.338 | 1.087 |
| Detection Limit | 0.014 g/t | Standard Deviation | 4.835 | 15.561 |
| Original Dataset | Original Assays | Correlation Coefficient | 0.1926 | |
| Paired Dataset | Pulp Assays | Pairs ≤ 10% HARD | 41.0% | |
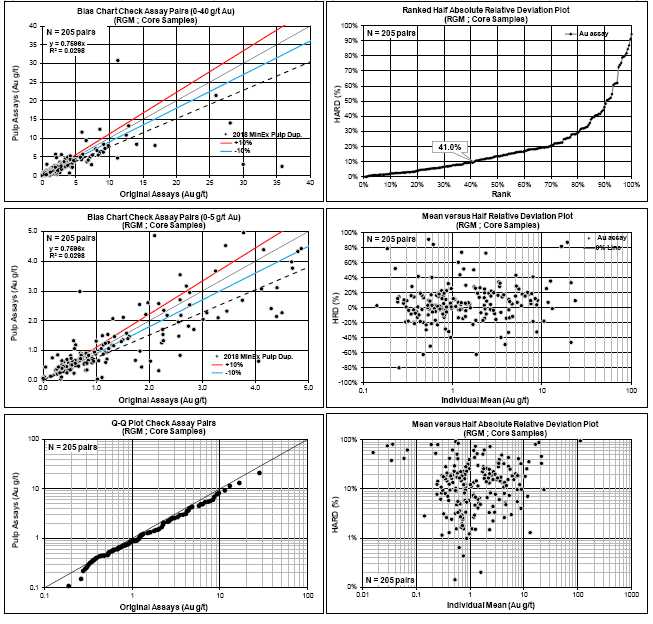
| IAMGOLD Corporation - Rosebel Gold Mine | |
| Technical Report NI 43-101 – November 5, 2018 | Page A-7 |
Bias Charts and Precision Plots for MinEx Blind Coarse Reject Duplicate Samples Assayed by RGM lab in Suriname N.V. in 2018
|
Statistics | Original | Coarse Dup. | |
| Sample Count | 186 | 186 | ||
| Project | Saramacca | Minimum Value | 0.028 | 0.007 |
| Data Series | 2018 MinEx Coarse Reject Dup. | Maximum Value | 45.09 | 26.32 |
| Data Type | Core Samples | Mean | 2.610 | 2.335 |
| Commodity | Au in g/t | Median | 1.022 | 0.824 |
| Analytical Method | Fire Assay | Standard Error | 0.377 | 0.302 |
| Detection Limit | 0.014 g/t Au | Standard Deviation | 5.148 | 4.121 |
| Original Dataset | Original Assays | Correlation Coefficient | 0.7588 | |
| Paired Dataset | Coarse Assays | Pairs ≤ 10% HARD | 32.3% | |

| IAMGOLD Corporation - Rosebel Gold Mine | |
| Technical Report NI 43-101 – November 5, 2018 | Page A-8 |
Bias Charts and Precision Plots for MinEx Umpire Check Assays, DD Coarse Reject Samples, Assayed by ALS in Vancouver, Canada in 2018.
|
Statistics | RGM | ALS | |
| Sample Count | 467 | 467 | ||
| Data Series | 2018 MinEx Umpire Check Assays | Maximum Value | 85.30 | 93.30 |
| Data Type | Core Coarse Rejects Samples | Mean | 3.166 | 3.265 |
| Commodity | Au in g/t | Median | 0.948 | 0.970 |
| Analytical Method | Fire Assay | Standard Error | 0.334 | 0.367 |
| Detection Limit | RGM: 0.014 g/t Au; ALS 0.001 g/t Au | Standard Deviation | 7.209 | 7.939 |
| Original Dataset | RGM Assays | Correlation Coefficient | 0.6674 | |
| Paired Dataset | ALS Assays | Pairs ≤ 10% HARD | 46.0% | |

| IAMGOLD Corporation - Rosebel Gold Mine | |
| Technical Report NI 43-101 – November 5, 2018 | Page A-9 |
Bias Charts and Precision Plots for SurEx Umpire Check Assays, DD Pulp Samples, Assayed by ALS in Vancouver, Canada between 2016 and 2018.
|
Statistics | RGM | ALS | |
| Sample Count | 466 | 466 | ||
| Project | Saramacca | Minimum Value | 0.007 | 0.005 |
| Data Series | 2018 MinEx Umpire Check Assays | Maximum Value | 85.30 | 94.80 |
| Data Type | Core Pulp Samples | Mean | 3.138 | 2.965 |
| Commodity | Au in g/t | Median | 0.916 | 0.950 |
| Analytical Method | Fire Assay | Standard Error | 0.368 | 0.340 |
| Detection Limit | RGM: 0.014 g/t Au; ALS 0.001 g/t Au | Standard Deviation | 7.943 | 7.345 |
| Original Dataset | RGM Assays | Correlation Coefficient | 0.9189 | |
| Paired Dataset | ALS Assays | Pairs ≤ 10% HARD | 57.7% | |

| IAMGOLD Corporation - Rosebel Gold Mine | |
| Technical Report NI 43-101 – November 5, 2018 | Page A-10 |
APPENDIX B
Saramacca Grade Capping Plots
| IAMGOLD Corporation - Rosebel Gold Mine | |
| Technical Report NI 43-101 – November 5, 2018 | Page B-1 |

| IAMGOLD Corporation - Rosebel Gold Mine | |
| Technical Report NI 43-101 – November 5, 2018 | Page B-2 |

| IAMGOLD Corporation - Rosebel Gold Mine | |
| Technical Report NI 43-101 – November 5, 2018 | Page B-3 |

| IAMGOLD Corporation - Rosebel Gold Mine | |
| Technical Report NI 43-101 – November 5, 2018 | Page B-4 |
![]()
| IAMGOLD Corporation - Rosebel Gold Mine | |
| Technical Report NI 43-101 – November 5, 2018 | Page B-5 |
APPENDIX C
RGM Variograms
JZ-KH – model 1
| IAMGOLD Corporation - Rosebel Gold Mine | |
| Technical Report NI 43-101 – November 5, 2018 | Page C-1 |
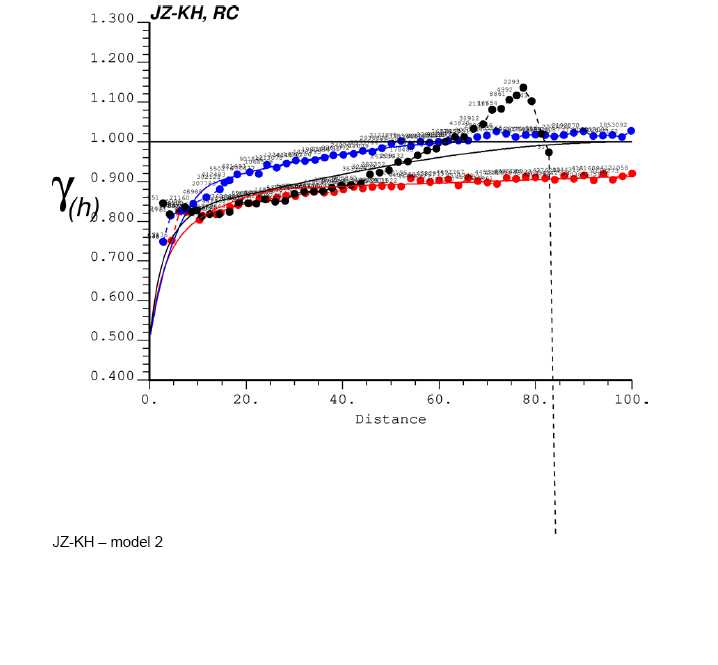
| IAMGOLD Corporation - Rosebel Gold Mine | |
| Technical Report NI 43-101 – November 5, 2018 | Page C-2 |
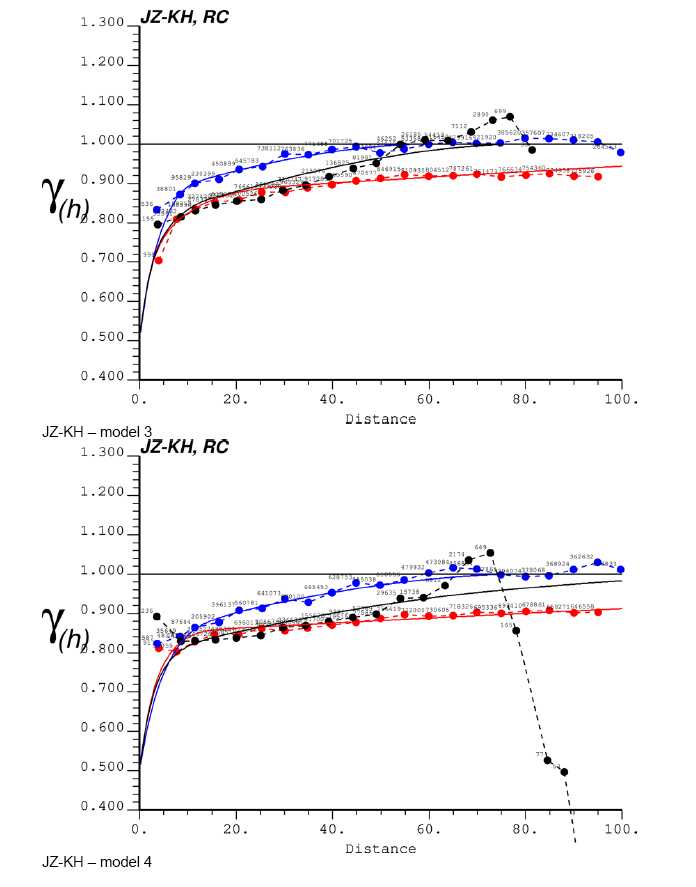
| IAMGOLD Corporation - Rosebel Gold Mine | |
| Technical Report NI 43-101 – November 5, 2018 | Page C-3 |

| IAMGOLD Corporation - Rosebel Gold Mine | |
| Technical Report NI 43-101 – November 5, 2018 | Page C-4 |

| IAMGOLD Corporation - Rosebel Gold Mine | |
| Technical Report NI 43-101 – November 5, 2018 | Page C-5 |

| IAMGOLD Corporation - Rosebel Gold Mine | |
| Technical Report NI 43-101 – November 5, 2018 | Page C-6 |
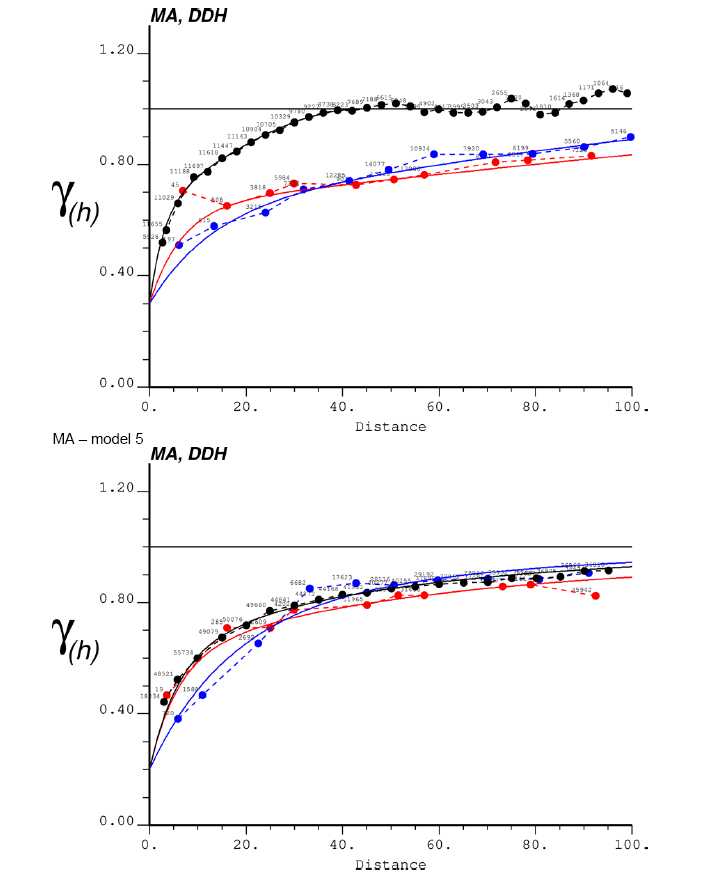
| IAMGOLD Corporation - Rosebel Gold Mine | |
| Technical Report NI 43-101 – November 5, 2018 | Page C-7 |

| IAMGOLD Corporation - Rosebel Gold Mine | |
| Technical Report NI 43-101 – November 5, 2018 | Page C-8 |

| IAMGOLD Corporation - Rosebel Gold Mine | |
| Technical Report NI 43-101 – November 5, 2018 | Page C-9 |
![]()
| IAMGOLD Corporation - Rosebel Gold Mine | |
| Technical Report NI 43-101 – November 5, 2018 | Page C-10 |

| IAMGOLD Corporation - Rosebel Gold Mine | |
| Technical Report NI 43-101 – November 5, 2018 | Page C-11 |

| IAMGOLD Corporation - Rosebel Gold Mine | |
| Technical Report NI 43-101 – November 5, 2018 | Page C-12 |

| IAMGOLD Corporation - Rosebel Gold Mine | |
| Technical Report NI 43-101 – November 5, 2018 | Page C-13 |

| IAMGOLD Corporation - Rosebel Gold Mine | |
| Technical Report NI 43-101 – November 5, 2018 | Page C-14 |
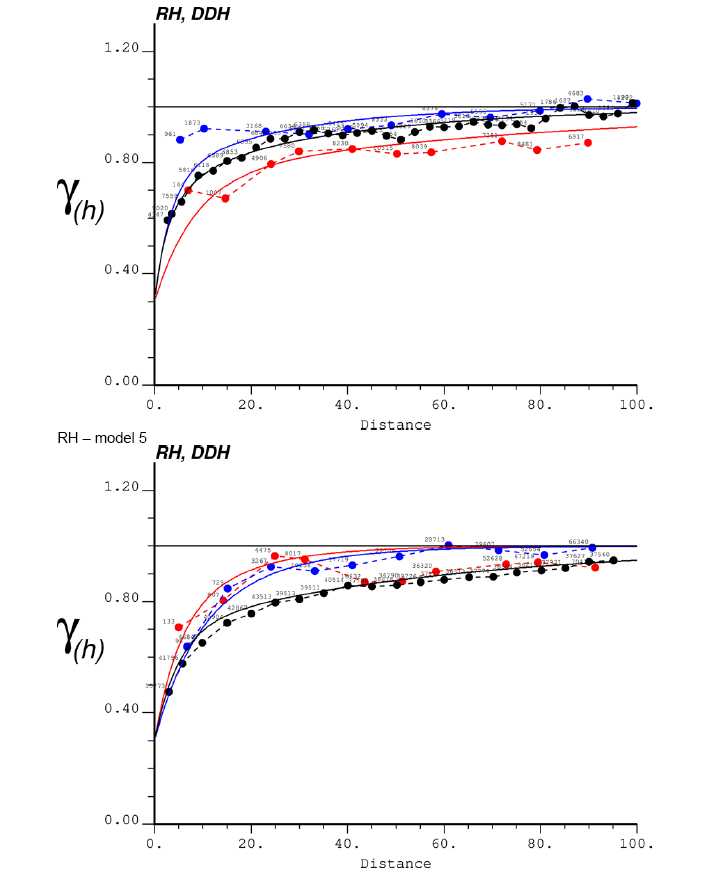
| IAMGOLD Corporation - Rosebel Gold Mine | |
| Technical Report NI 43-101 – November 5, 2018 | Page C-15 |
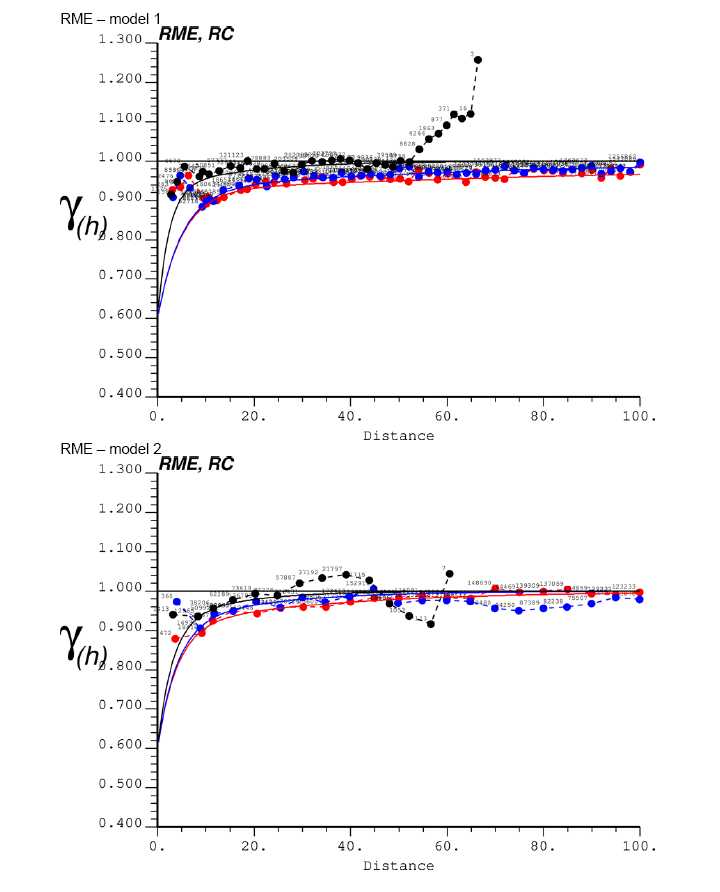
| IAMGOLD Corporation - Rosebel Gold Mine | |
| Technical Report NI 43-101 – November 5, 2018 | Page C-16 |

| IAMGOLD Corporation - Rosebel Gold Mine | |
| Technical Report NI 43-101 – November 5, 2018 | Page C-17 |

| IAMGOLD Corporation - Rosebel Gold Mine | |
| Technical Report NI 43-101 – November 5, 2018 | Page C-18 |

| IAMGOLD Corporation - Rosebel Gold Mine | |
| Technical Report NI 43-101 – November 5, 2018 | Page C-19 |
![]()
| IAMGOLD Corporation - Rosebel Gold Mine | |
| Technical Report NI 43-101 – November 5, 2018 | Page C-20 |

| IAMGOLD Corporation - Rosebel Gold Mine | |
| Technical Report NI 43-101 – November 5, 2018 | Page C-21 |

| IAMGOLD Corporation - Rosebel Gold Mine | |
| Technical Report NI 43-101 – November 5, 2018 | Page C-22 |

| IAMGOLD Corporation - Rosebel Gold Mine | |
| Technical Report NI 43-101 – November 5, 2018 | Page C-23 |
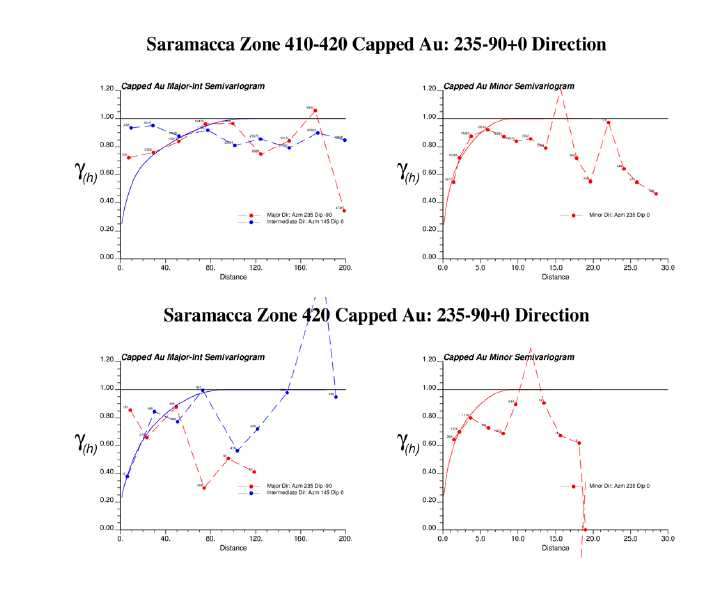
| IAMGOLD Corporation - Rosebel Gold Mine | |
| Technical Report NI 43-101 – November 5, 2018 | Page C-24 |
Serious News for Serious Traders! Try StreetInsider.com Premium Free!
You May Also Be Interested In
- IAMGOLD (IAG) PT Raised to $3.75 at Scotiabank
- Implementing AIOps: Blueprint for Enhanced IT Operations and Business Efficiency Published by Info-Tech Research Group
- U.S. Federal Magistrate Judge Recommends Invalidation of Jetaire Patents in Lawsuit Against AerSale
Create E-mail Alert Related Categories
SEC FilingsSign up for StreetInsider Free!
Receive full access to all new and archived articles, unlimited portfolio tracking, e-mail alerts, custom newswires and RSS feeds - and more!
