

Form 6-K HYDROGENICS CORP For: Jun 30
 Tweet
Tweet Share
ShareUNITED
STATES
SECURITIES AND EXCHANGE COMMISSION
Washington, D.C. 20549
FORM 6-K
REPORT OF FOREIGN PRIVATE ISSUER PURSUANT TO RULE 13a-16 OR 15d-16 UNDER THE SECURITIES EXCHANGE ACT OF 1934
For the month of August 2019.
Commission File Number: 000-31815
HYDROGENICS CORPORATION - CORPORATION HYDROGENIQUE
(Translation of registrant's name into English)
220 Admiral Boulevard, Mississauga, Ontario, L5T 2N6
(Address of principal executive office)
Indicate by check mark whether the registrant files or will file annual reports under cover of Form 20-F or Form 40-F.
Form 20-F [ ] Form 40-F [x]
Indicate by check mark if the registrant is submitting the Form 6-K in paper as permitted by Regulation S-T Rule 101(b)(1):
Indicate by check mark if the registrant is submitting the Form 6-K in paper as permitted by Regulation S-T Rule 101(b)(7):
EXHIBIT LIST
SIGNATURES
Pursuant to the requirements of the Securities Exchange Act of 1934, the registrant has duly caused this report to be signed on its behalf by the undersigned, thereunto duly authorized.
| HYDROGENICS CORPORATION - CORPORATION HYDROGENIQUE | ||
| Date: August 12, 2019 | By: | /s/ MARC BEISHEIM |
| Name: MARC BEISHEIM | ||
| Title: Chief Financial Officer | ||
EXHIBIT 99.1
Hydrogenics Reports Second Quarter 2019 Results
Outlook Improving; Acquisition by Cummins announced
MISSISSAUGA, Ontario, Aug. 12, 2019 (GLOBE NEWSWIRE) -- Hydrogenics Corporation (NASDAQ: HYGS; TSX: HYG) ("Hydrogenics" or "the Company"), a leading developer and manufacturer of hydrogen generation and hydrogen-based power modules, today reported second quarter 2019 financial results. Results are reported in US dollars and are prepared in accordance with International Financial Reporting Standards (IFRS).
Recent Highlights
“Quarterly revenue rose to $10.4 million in the quarter – up 37% year-over-year – and we continue to work towards cementing our first commercial rail production order with Alstom for fuel cell systems that will serve the Hydrail Commuter Trains in Germany,” said Daryl Wilson, President and Chief Executive Officer. “We’re very proud that our innovative heavy-duty mobility applications are setting the standard for trains and buses alike and, with partners like Alstom, the Company will be able to accelerate adoption in Asia, Europe, and the Americas faster than could be achieved on our own. In so doing, we’re helping drive the hydrogen economy of tomorrow.”
On June 28, we announced that we had entered into an arrangement agreement with Cummins Inc. (“Cummins”) and Atlantis AcquisitionCo Canada Corporation (the “Purchaser”), a subsidiary of Cummins, pursuant to which the Purchaser has agreed to acquire all of the outstanding common shares of the Company (the “Shares”), other than Shares owned by The Hydrogen Company, a wholly owned subsidiary of L’Air Liquide S.A., for US$15.00 in cash per Share (the “Transaction”). The Hydrogen Company has agreed to exchange its Shares for shares of the Purchaser pursuant to the Transaction. The consideration per Share to be received by the Company’s shareholders (the “Shareholders”) (other than The Hydrogen Company and its affiliates and any dissenting Shareholder) in connection with the Transaction represents a premium of 21.6% over the 30-day volume-weighted average price (“VWAP”) of the Shares on the NASDAQ and 38.8% over the 90-day VWAP on the NASDAQ for the period ending June 27, 2019.
There will be a special meeting of Shareholders on August 29, 2019, at which Shareholders of record as of July 15, 2019, will vote on a special resolution to approve the Transaction. Subject to the outcome of this meeting and the satisfaction or waiver of all other conditions precedent, the Company expects the Transaction to close in September 2019.
Summary of Results for the Quarter Ended June 30, 2019 (compared to the Quarter Ended June 30, 2018 unless otherwise noted)
- The Company posted revenue of $10.4 million for the second quarter of 2019, a 37% increase over the same period in 2018.
- Gross margin decreased to 12.9% in the second quarter of 2019 from 27.6% last year, primarily reflecting product mix as well as additional costs for warranty provisions and inventory obsolescence. In the prior-year period, Hydrogenics delivered equipment for several large projects with higher margins, and warranty provisions (no longer required) were extinguished in the period.
- Cash operating costs1 increased $0.1 million, to $4.7 million, in the 2019 second quarter compared to $4.6 million in 2018. Selling, General and Administrative (“SG&A”) expenses rose by $1.5 million year-over-year, primarily reflecting $0.8 million of one-time transaction and professional costs associated with the Arrangement Agreement announced June 28, 2019, whereby the Company will be acquired by Cummins, Inc. (“Cummins”). This increase was partially offset by reduction in net Research and Development (“R&D”) expenses, primarily related to the completion of non-recurring development projects.
- The Company’s Adjusted EBITDA2 loss increased $0.8 million, to $3.3 million, in the second quarter of 2019 from $2.5 million in the prior-year period. This variance reflects $0.8 million in one-time expenses associated with the aforementioned Arrangement Agreement.
- Net loss was $4.8 million, or $(0.25) per share, for the 2019 second quarter versus a similar net loss of $4.8 million, or $(0.31) per share, in the same period last year.
- The Company ended the second quarter of 2019 with a backlog at $144.1 million, securing orders of $4.4 million for Power-to-Gas systems, fueling stations, industrial gas applications and mobility systems. Order backlog movement during the second quarter (in $ millions) was as follows:
| March 31, 2019 backlog | Orders Received | FX | Orders Delivered/ Revenue Recognized | June 30, 2019 backlog | ||||||
| OnSite Generation | $ | 40.0 | $ | 3.5 | $ | 0.1 | $ | 7.6 | $ | 36.0 |
| Power Systems | 110.0 | 0.9 | - | 2.8 | 108.1 | |||||
| Total | $ | 150.0 | $ | 4.4 | $ | 0.1 | $ | 10.4 | $ | 144.1 |
- Of the above backlog of $144.1 million, the Company expects to recognize $59.9 million in the following 12 months as revenue. In addition, revenue for the year ending December 31, 2019 will also include orders both received and delivered during the balance of 2019.
Notes
- Cash operating costs are defined as the sum of SG&A and R&D, less amortization and depreciation, and stock-based compensation expense inclusive of compensation costs indexed to the Company’s share price. This is a non-IFRS measure and may not be comparable to similar measures used by other companies. Management uses this measure as a rough estimate of the amount of fixed costs to operate the Corporation and believes this is a useful measure for investors for the same purpose.
- Adjusted EBITDA is defined as net loss excluding stock-based compensation (both cash settled long term compensation indexed to share price and share based compensation), other finance income and expenses, depreciation and amortization. These items are considered by management to be outside of Hydrogenics’ ongoing operational results. Adjusted EBITDA is a non-IFRS measure and may not be comparable to similar measures used by other companies.
Conference Call Details
Hydrogenics will hold a conference call at 10:00 a.m. EDT on August 12, 2019 to review the second quarter results. The telephone number for the conference call is (877) 307-1373 or, for international callers, (678) 224-7873. A live webcast of the call will also be available on the company's website, www.hydrogenics.com.
An archived copy of the conference call and webcast will be available on the company's website, www.hydrogenics.com, approximately six hours following the call.
About Hydrogenics
Hydrogenics Corporation is a world leader in engineering and building the technologies required to enable the acceleration of a global power shift. Headquartered in Mississauga, Ontario, Hydrogenics provides hydrogen generation, energy storage and hydrogen power modules to its customers and partners around the world. Hydrogenics has manufacturing sites in Germany, Belgium and Canada and service centers in Russia, Europe, the US and Canada.
Forward-looking Statements
This release contains forward-looking statements within the meaning of the “safe harbor” provisions of the U.S. Private Securities Litigation Reform Act of 1995, and under applicable Canadian securities law. These statements are based on management’s current expectations and actual results may differ from these forward-looking statements due to numerous factors, including: the failure to obtain necessary approvals or satisfy the conditions to closing the Transaction, including the requisite approval from the Shareholders at the special meeting of Shareholders to be held on August 29, 2019; the occurrence of any event, change or other circumstance that could give rise to the termination of the arrangement agreement in respect of the Transaction; material adverse changes in the business or affairs of Hydrogenics; either party’s failure to consummate the Transaction when required; our inability to increase our revenues or raise additional funding to continue operations, execute our business plan, or to grow our business; inability to address a slow return to economic growth, and its impact on our business, results of operations and consolidated financial condition; our limited operating history; inability to implement our business strategy; fluctuations in our quarterly results; failure to maintain our customer base that generates the majority of our revenues; currency fluctuations; failure to maintain sufficient insurance coverage; changes in value of our goodwill; failure of a significant market to develop for our products; failure of hydrogen being readily available on a cost-effective basis; changes in government policies and regulations; failure of uniform codes and standards for hydrogen fueled vehicles and related infrastructure to develop; liability for environmental damages resulting from our research, development or manufacturing operations; failure to compete with other developers and manufacturers of products in our industry; failure to compete with developers and manufacturers of traditional and alternative technologies; failure to develop partnerships with original equipment manufacturers, governments, systems integrators and other third parties; inability to obtain sufficient materials and components for our products from suppliers; failure to manage expansion of our operations; failure to manage foreign sales and operations; failure to recruit, train and retain key management personnel; inability to integrate acquisitions; failure to develop adequate manufacturing processes and capabilities; failure to complete the development of commercially viable products; failure to produce cost-competitive products; failure or delay in field testing of our products; failure to produce products free of defects or errors; inability to adapt to technological advances or new codes and standards; failure to protect our intellectual property; our involvement in intellectual property litigation; exposure to product liability claims; failure to meet rules regarding passive foreign investment companies; actions of our significant and principal shareholders; dilution as a result of significant issuances of our common shares and preferred shares; inability of US investors to enforce US civil liability judgments against us; volatility of our common share price; and dilution as a result of the exercise of options. Readers should not place undue reliance on Hydrogenics’ forward-looking statements. Investors are encouraged to review the section captioned “Risk Factors” in Hydrogenics’ regulatory filings with the Canadian securities regulatory authorities and the US Securities and Exchange Commission for a more complete discussion of factors that could affect Hydrogenics’ future performance. Furthermore, the forward-looking statements contained herein are made as of the date of this release, and Hydrogenics undertakes no obligation to revise or update any forward-looking statements in order to reflect events or circumstances that may arise after the date of this release, unless otherwise required by law. The forward-looking statements contained in this release are expressly qualified by this paragraph.
Hydrogenics Contacts:
Marc Beisheim, Chief Financial Officer
Hydrogenics Corporation
(905) 361-3660
[email protected]
Chris Witty
Hydrogenics Investor Relations
(646) 438-9385
[email protected]
Reconciliation of Cash Operating Costs to Operating Costs and Adjusted EBITDA to Net Loss
(in thousands of US dollars)
(unaudited)
Cash operating costs
| Three months ended June 30, | Six months ended June 30, | ||||||||||||
| 2019 | 2018 | 2019 | 2018 | ||||||||||
| Selling, general and administrative expenses | $ | 4,476 | $ | 3,024 | $ | 8,583 | $ | 5,860 | |||||
| Research and product development expenses | 1,695 | 1,880 | 3,504 | 3,961 | |||||||||
| Total operating costs | $ | 6,171 | $ | 4,904 | $ | 12,087 | $ | 9,821 | |||||
| Less: Amortization and depreciation | (366 | ) | (89 | ) | (599 | ) | (192 | ) | |||||
| Less: Loss on disposal of assets | (2 | ) | (3 | ) | (4 | ) | (6 | ) | |||||
| Less: DSUs recovery (expense) | (971 | ) | 62 | (1,433 | ) | 388 | |||||||
| Less: Stock-based compensation expense | (151 | ) | (243 | ) | (387 | ) | (465 | ) | |||||
| Cash operating costs | $ | 4,681 | $ | 4,631 | $ | 9,664 | $ | 9,546 | |||||
Adjusted EBITDA
| Three months ended June 30 | Six months ended June 30, | |||||||||||
| 2019 | 2018 | 2019 | 2018 | |||||||||
| Net loss | $ | (4,766 | ) | $ | (4,801 | ) | $ | (7,413 | ) | $ | (6,755 | ) |
| Loss (gain) from joint ventures | (21 | ) | 1,492 | (26 | ) | 1,561 | ||||||
| Finance loss (income), net | (31 | ) | 506 | 580 | 412 | |||||||
| Income tax expense | – | – | – | 300 | ||||||||
| Amortization and depreciation | 417 | 175 | 797 | 352 | ||||||||
| DSUs expense (recovery) | 971 | (62 | ) | 1,433 | (388 | ) | ||||||
| Stock-based compensation expense | 151 | 243 | 387 | 465 | ||||||||
| Adjusted EBITDA | $ | (3,279 | ) | $ | (2,447 | ) | $ | (4,242 | ) | $ | (4,053 | ) |
Hydrogenics Corporation
Condensed Interim Consolidated Balance Sheets
(in thousands of US dollars)
(unaudited)
June 30, 2019 | December 31, 2018 | |||||
| Assets | ||||||
| Current assets | ||||||
| Cash and cash equivalents | $ | 16,741 | $ | 7,561 | ||
| Restricted cash | 769 | 935 | ||||
| Trade and other receivables | 8,022 | 6,728 | ||||
| Contract assets | 3,789 | 4,534 | ||||
| Inventories | 18,940 | 17,174 | ||||
| Prepaid expenses | 2,008 | 1,960 | ||||
| 50,269 | 38,892 | |||||
| Non-current assets | ||||||
| Restricted cash | 225 | 241 | ||||
| Contract assets | 2,795 | 1,689 | ||||
| Investment in joint ventures | 1,731 | 1,644 | ||||
| Right-of-use assets | 3,521 | – | ||||
| Property, plant and equipment | 2,846 | 2,867 | ||||
| Intangible assets | 200 | 232 | ||||
| Goodwill | 4,332 | 4,359 | ||||
| 15,650 | 11,032 | |||||
| Total assets | $ | 65,919 | $ | 49,924 | ||
| Liabilities | ||||||
| Current liabilities | ||||||
| Trade and other payables | $ | 8,628 | $ | 9,068 | ||
| Contract liabilities | 13,870 | 14,581 | ||||
| Financial liabilities | 6,121 | 3,359 | ||||
| Provisions | 1,867 | 2,041 | ||||
| Deferred funding | 1,888 | 1,744 | ||||
| 32,374 | 30,793 | |||||
| Non-current liabilities | ||||||
| Other liabilities | 7,632 | 5,711 | ||||
| Contract liabilities | 642 | 1,420 | ||||
| Provisions | 799 | 810 | ||||
| Deferred funding | 179 | 229 | ||||
| 9,252 | 8,170 | |||||
| Total liabilities | 41,626 | 38,963 | ||||
| Equity | ||||||
| Share capital | 408,456 | 387,911 | ||||
| Contributed surplus | 20,940 | 20,717 | ||||
| Accumulated other comprehensive loss | (2,704 | ) | (2,681 | ) | ||
| Deficit | (402,399 | ) | (394,986 | ) | ||
| Total equity | 24,293 | 10,961 | ||||
| Total equity and liabilities | $ | 65,919 | $ | 49,924 | ||
Hydrogenics Corporation
Condensed Interim Consolidated Statements of Operations and Comprehensive Loss
(in thousands of US dollars, except share and per share amounts)
(unaudited)
| Three months ended | Six months ended | |||||||||||
| June 30, | June 30, | |||||||||||
| 2019 | 2018 | 2019 | 2018 | |||||||||
| Revenues | $ | 10,455 | $ | 7,609 | $ | 18,539 | $ | 15,756 | ||||
| Cost of sales | 9,102 | 5,508 | 13,311 | 10,417 | ||||||||
| Gross profit | 1,353 | 2,101 | 5,228 | 5,339 | ||||||||
| Operating expenses | ||||||||||||
| Selling, general and administrative expenses | 4,476 | 3,024 | 8,583 | 5,860 | ||||||||
| Research and product development expenses | 1,695 | 1,880 | 3,504 | 3,961 | ||||||||
| 6,171 | 4,904 | 12,087 | 9,821 | |||||||||
| Loss from operations | (4,818 | ) | (2,803 | ) | (6,859 | ) | (4,482 | ) | ||||
| Gains (losses) from joint ventures | 21 | (1,492 | ) | 26 | (1,561 | ) | ||||||
| Finance income (loss) | ||||||||||||
| Interest expense, net | (288 | ) | (372 | ) | (572 | ) | (753 | ) | ||||
| Foreign currency gains (losses), net | 182 | (177 | ) | (19 | ) | 42 | ||||||
| Other finance gains, net | 137 | 43 | 11 | 299 | ||||||||
| Finance income (loss), net | 31 | (506 | ) | (580 | ) | (412 | ) | |||||
| Loss before income taxes | (4,766 | ) | (4,801 | ) | (7,413 | ) | (6,455 | ) | ||||
| Income tax expense | – | – | – | 300 | ||||||||
| Net loss for the period | (4,766 | ) | (4,801 | ) | (7,413 | ) | (6,755 | ) | ||||
| Items that may be reclassified subsequently to net loss: | ||||||||||||
| Exchange differences on translating foreign operations | 157 | (887 | ) | (23 | ) | (558 | ) | |||||
| Comprehensive loss for the period | $ | (4,609 | ) | $ | (5,688 | ) | $ | (7,436 | ) | $ | (7,313 | ) |
| Net loss per share | ||||||||||||
| Basic and diluted | $ | (0.25 | ) | $ | (0.31 | ) | $ | (0.40 | ) | $ | (0.44 | ) |
| Weighted average number of common shares outstanding, basic and diluted | 18,999,286 | 15,440,888 | 18,542,928 | 15,438,894 | ||||||||
Hydrogenics Corporation
Condensed Interim Consolidated Statements of Cash Flows
(in thousands of US dollars)
(unaudited)
| Three months ended | Six months ended | |||||||||||
| June 30, | June 30, | |||||||||||
| 2019 | 2018 | 2019 | 2018 | |||||||||
| Cash and cash equivalents provided by (used in): | ||||||||||||
| Operating activities | ||||||||||||
| Net loss for the period | $ | (4,766 | ) | $ | (4,801 | ) | $ | (7,413 | ) | $ | (6,755 | ) |
| Decrease (increase) in restricted cash | (145 | ) | (266 | ) | 178 | (279 | ) | |||||
| Items not affecting cash: | ||||||||||||
| Loss on disposal of property, plant and equipment | 2 | 3 | 4 | 6 | ||||||||
| Amortization and depreciation | 417 | 175 | 797 | 352 | ||||||||
| Gain from change in fair value of warrants | (137 | ) | (70 | ) | (11 | ) | (356 | ) | ||||
| Unrealized foreign exchange loss (gain) | 89 | (179 | ) | 119 | (203 | ) | ||||||
| Losses (gains) from joint ventures | (21 | ) | 1,492 | (26 | ) | 1,561 | ||||||
| Accreted interest and fair value adjustment | 254 | 413 | 614 | 857 | ||||||||
| Stock-based compensation | 151 | 243 | 387 | 465 | ||||||||
| Stock-based compensation – DSUs | 971 | (62 | ) | 1,433 | (388 | ) | ||||||
| Net change in non-cash operating assets and liabilities | (507 | ) | (1,416 | ) | (4,687 | ) | (859 | ) | ||||
| Cash used in operating activities | (3,692 | ) | (4,468 | ) | (8,605 | ) | (5,599 | ) | ||||
| Investing activities | ||||||||||||
| Purchase of property, plant and equipment | (148 | ) | (101 | ) | (332 | ) | (335 | ) | ||||
| Receipt (repayment) of government funding | – | 974 | (974 | ) | 974 | |||||||
| Purchase of intangible assets | (2 | ) | (1 | ) | (10 | ) | (1 | ) | ||||
| Cash provided by (used in) investing activities | (150 | ) | 872 | (1,316 | ) | 638 | ||||||
| Financing activities | ||||||||||||
| Proceeds from common shares issued and stock options exercised, net of issuance costs | 21 | 1 | 20,381 | 1 | ||||||||
| Principal repayments of long-term debt | (500 | ) | (500 | ) | (500 | ) | (750 | ) | ||||
| Interest payments | (286 | ) | (286 | ) | (330 | ) | (582 | ) | ||||
| Lease payments | (199 | ) | – | (379 | ) | – | ||||||
| Repayment of operating borrowings | – | – | – | (1,193 | ) | |||||||
| Cash provided by (used in) financing activities | (964 | ) | (785 | ) | 19,172 | (2,524 | ) | |||||
| Increase (decrease) in cash and cash equivalents during the period | (4,806 | ) | (4,381 | ) | 9,251 | (7,485 | ) | |||||
| Cash and cash equivalents – Beginning of period | 21,531 | 18,482 | 7,561 | 21,511 | ||||||||
| Effect of exchange rate fluctuations on cash and cash equivalents held | 16 | (254 | ) | (71 | ) | (179 | ) | |||||
| Cash and cash equivalents – End of period | $ | 16,741 | $ | 13,847 | $ | 16,741 | $ | 13,847 | ||||
| Hydrogenics Corporation |
EXHIBIT 99.2
![]()
Hydrogenics Corporation
Second Quarter 2019
Management’s Discussion and Analysis
| Second Quarter 2019 Management’s Discussion and Analysis | Page 1 |
Hydrogenics Corporation
The following Management’s Discussion and Analysis (“MD&A”) of Hydrogenics Corporation (“Hydrogenics” or the “Company”) should be read in conjunction with the Company’s Audited Consolidated Financial Statements and related notes for the year ended December 31, 2018. The Company prepares its unaudited condensed interim consolidated financial statements in accordance with International Financial Reporting Standards (“IFRS”) as issued by the International Accounting Standards Board (“IASB”) applicable to the preparation of interim financial statements, including International Accounting Standards 34 - Interim Financial Reporting. On January 1, 2019, the Company was required to adopt IFRS 16 - Leases. Accordingly, the Corporation has commenced reporting on this basis in these consolidated interim financial statements. While the adoption of this new standard has not had an impact on the Company’s reported net cash flows, there has been a material impact on its consolidated balance sheets and consolidated statements of operations and comprehensive loss, which is discussed further in Section 11 of this MD&A.
The Company uses certain non-IFRS financial performance measures in this MD&A. For a detailed reconciliation of each of the non-IFRS measures, please see the discussion under Section 14 of this MD&A.
Throughout this MD&A, all currency amounts (except per unit amounts) are in thousands of United States dollars (“US Dollars”), unless otherwise stated. The information presented in this MD&A is as of August 9, 2019, unless otherwise stated.
Additional information about Hydrogenics, including our 2018 Audited Consolidated Financial Statements and our Annual Report on Form 40-F for the year ended December 31, 2018 is available on our website at www.hydrogenics.com, on the SEDAR website at www.sedar.com, and on the EDGAR filers section of the U.S. Securities and Exchange Commission website at www.sec.gov.
This document contains forward-looking statements, which are qualified by reference to, and should be read together with the “Forward-looking Statements” cautionary notice in Section 17 of this MD&A.
“Hydrogenics” or the “Company” or the words “our,” “us” or “we” refer to Hydrogenics Corporation and its subsidiaries.
| Second Quarter 2019 Management’s Discussion and Analysis | Page 2 |
Hydrogenics Corporation
|
Management’s Discussion and Analysis Table of Contents
| ||
| Section | Description | Page |
| 1 | Overall Performance | 4 |
| 2 | Operating Results | 6 |
| 3 | Financial Condition | 9 |
| 4 | Summary of Quarterly Results | 10 |
| 5 | Strategy and Outlook | 11 |
| 6 | Liquidity | 13 |
| 7 | Capital Resources | 15 |
| 8 | Off-Balance Sheet Arrangements | 15 |
| 9 | Related Party Transactions | 16 |
| 10 | Critical Accounting Estimates | 16 |
| 11 | Changes in Accounting Policies and Recent Accounting Pronouncements | 16 |
| 12 | Disclosure Controls | 17 |
| 13 | Internal Control Over Financial Reporting | 18 |
| 14 | Reconciliation of Non-IFRS Measures | 18 |
| 15 | Risk Factors | 20 |
| 16 | Outstanding Share Data | 22 |
| 17 | Forward-looking Statements | 22 |
| Second Quarter 2019 Management’s Discussion and Analysis | Page 3 |
Hydrogenics Corporation
| 1 | Overall Performance |
Selected Financial information
(in thousands of US dollars, except per share amounts)
| Three months ended June 30, | Six months ended June 30, | |||||||||||||||||||||||||||||||
| 2019 | 2018 | Favourable / (Unfavourable) | 2019 | 2018 | Favourable / (Unfavourable) | |||||||||||||||||||||||||||
| OnSite Generation | $ | 7,585 | $ | 4,776 | $ | 2,809 | 59 | % | $ | 10,068 | $ | 8,537 | $ | 1,531 | 18 | % | ||||||||||||||||
| Power Systems | 2,870 | 2,833 | 37 | 1 | % | 8,471 | 7,219 | 1,252 | 17 | % | ||||||||||||||||||||||
| Total revenue | 10,455 | 7,609 | 2,846 | 37 | % | 18,539 | 15,756 | 2,783 | 18 | % | ||||||||||||||||||||||
| Gross profit | 1,353 | 2,101 | (748 | ) | (36 | )% | 5,228 | 5,339 | (111 | ) | (2 | )% | ||||||||||||||||||||
| Gross Margin % | 13 | % | 28 | % | 28 | % | 34 | % | ||||||||||||||||||||||||
| Selling, general and administrative expenses | 4,476 | 3,024 | (1,452 | ) | (48 | )% | 8,583 | 5,860 | (2,723 | ) | (46 | )% | ||||||||||||||||||||
| Research and product development expenses | 1,695 | 1,880 | 185 | 10 | % | 3,504 | 3,961 | 457 | 12 | % | ||||||||||||||||||||||
| Loss from operations | (4,818 | ) | (2,803 | ) | (2,015 | ) | (72 | )% | (6,859 | ) | (4,482 | ) | (2,377 | ) | (53 | )% | ||||||||||||||||
| Gain (loss) from joint ventures | 21 | (1,492 | ) | 1,513 | n/a | 26 | (1,561 | ) | 1,587 | n/a | ||||||||||||||||||||||
| Finance income (loss), net | 31 | (506 | ) | 537 | n/a | (580 | ) | (412 | ) | (168 | ) | (41 | )% | |||||||||||||||||||
| Income tax expense | – | – | – | 300 | (300 | ) | n/a | |||||||||||||||||||||||||
| Net loss | $ | (4,766 | ) | $ | (4,801 | ) | $ | 35 | 1 | % | $ | (7,413 | ) | $ | (6,755 | ) | $ | (658 | ) | (10 | )% | |||||||||||
| Net loss per share | $ | (0.25 | ) | $ | (0.31 | ) | $ | 0.06 | 19 | % | $ | (0.40 | ) | $ | (0.44 | ) | $ | 0.04 | 9 | % | ||||||||||||
| Cash operating costs1 | $ | 4,681 | $ | 4,631 | $ | (50 | ) | (1 | )% | $ | 9,664 | $ | 9,546 | $ | (118 | ) | (1 | )% | ||||||||||||||
| Adjusted EBITDA1 | (3,279 | ) | (2,447 | ) | (832 | ) | (34 | )% | (4,242 | ) | (4,053 | ) | (189 | ) | (5 | )% | ||||||||||||||||
| Cash used in operating activities | (3,692 | ) | (4,468 | ) | 776 | 17 | % | (8,605 | ) | (5,599 | ) | (3,006 | ) | (54 | )% | |||||||||||||||||
| Cash and cash equivalents (including restricted cash) | 17,735 | 15,003 | 2,732 | 18 | % | 17,735 | 15,003 | 2,732 | 18 | % | ||||||||||||||||||||||
| Total assets | 65,919 | 59,149 | 6,770 | 11 | % | 65,919 | 59,149 | 6,770 | 11 | % | ||||||||||||||||||||||
| Total non-current liabilities (excluding deferred funding and contract liabilities) | $ | 8,431 | $ | 8,365 | $ | (66 | ) | (1 | )% | $ | 8,431 | $ | 8,365 | $ | (66 | ) | (1 | )% | ||||||||||||||
| 1. | Cash operating costs and Adjusted EBITDA are Non-IFRS measures. Refer to Section 14 – Reconciliation of Non-IFRS Measures. |
| 2. | As noted in the introduction, the Company has adopted IFRS 16 – Leases effective January 1, 2019. Comparative information has not been restated in accordance with the permitted transitional provisions of the Standard. Refer to Section 11 and the accompanying condensed interim consolidated financial statements for more information on the effect of this change in accounting policy. |
| Second Quarter 2019 Management’s Discussion and Analysis | Page 4 |
Hydrogenics Corporation
Highlights for the three and six months ended June 30, 2019 compared to the three and six months ended June 30, 2018
| • | Revenues increased by $2.8 million for both the three and six months ended June 30, 2019 versus the comparable three and six months ended June 30, 2018. The OnSite Generation business segment realized growth in revenues through the three and six months of 2019, up $2.8 million and $1.5 million respectively. Power Systems revenue was flat for the three months ended June 30, 2019 compared to the three months ended June 30, 2018 but increased by $1.3 million for the six months period ended June 30, 2019. | |
| • | We received $30.9 million in new orders for the six months ended June 30, 2019 (2018 – $13.3 million) consisting of $25.5 million (2018 – $9.7 million) for the OnSite Generation business and $5.4 million (2018 – $3.6 million) for the Power Systems business. The OnSite Generation business achieved a net positive order intake through the first six months of $15.4 million, whereas orders delivered exceeded orders received by $3.1 million in Power Systems. Accumulated backlog remains strong and our sales pipeline remains very active across both lines of business. |
| December 31, 2018 backlog |
Orders Received |
FX | Orders Delivered/ Revenue Recognized |
June 30, 2019 backlog |
||||||||||||||||
| OnSite Generation | $ | 20.6 | $ | 25.5 | $ | (0.1 | ) | $ | 10.0 | $ | 36.0 | |||||||||
| Power Systems | 112.1 | 5.4 | (0.9 | ) | 8.5 | 108.1 | ||||||||||||||
| Total | $ | 132.7 | $ | 30.9 | $ | (1.0 | ) | $ | 18.5 | $ | 144.1 |
| • | Gross margin decreased to 13% (2018 - 28%) and 28% (2018 - 34%) for the three and six months ended June 30, 2019, respectively. Refer to Section 2 Operating Results for more discussion regarding key drivers for each business segment. | |
| • | Selling, General and Administrative (“SG&A”) expenses for the three and six months ended June 30, 2019 increased by $1.5 million and $2.7 million versus the comparative prior periods. The increase is attributable primarily to non-cash losses realized on the revaluation of DSUs due to the increase in our stock price. Net of non-cash items, SG&A expenses for the three and six months ended June 30, 2019 increased by $0.2 million and $0.6 million, respectively, as compared to the same periods in 2018. The increase for the six months ended June 30 2019 is attributable to $0.8 million of one-time expenses related to negotiating the Arrangement Agreement with Cummins Inc. described further in Section 5 Strategy and Outlook. | |
| • | Net research and product development (“R&D”) expenses for the three and six months ended June 30, 2019 decreased by $0.2 million and $0.5 million versus the comparative prior periods. Of the $3.5 million spent on net R&D year-to-date, $2.8 million relates to expanding our Fuel Cell Power Module (“FCPM”) to new mobility uses and furthering development on the next generation of our fuel cell stack platform, and $0.7 million relates to product development within our OnSite Generation business. |
| Three months ended June 30, | 2019 | 2018 | ||||||
| Research and product development expenses | $ | 2,174 | $ | 3,271 | ||||
| Government research and product development funding | (479 | ) | (1,391 | ) | ||||
| Total | $ | 1,695 | $ | 1,880 |
| Six months ended June 30, | 2019 | 2018 | ||||||
| Research and product development expenses | $ | 4,278 | $ | 6,286 | ||||
| Government research and product development funding | (774 | ) | (2,325 | ) | ||||
| Total | $ | 3,504 | $ | 3,961 | ||||
| • | Loss from operations increased by $2.0 million and $2.4 million for the three and six months ended June 30, 2019 as compared to the prior periods in 2018. The increase is attributable to the non-cash loss realized in 2019 on the revaluation of DSUs and one-time expenses associated with negotiating the Arrangement Agreement with Cummins Inc. as noted above. |
| Second Quarter 2019 Management’s Discussion and Analysis | Page 5 |
Hydrogenics Corporation
| • | Gain (loss) from joint ventures improved by $1.5 million and $1.6 million respectively for the three and six month periods ended June 30, 2019 compared to the prior periods in 2018. The comparative period included losses of $1.6 million attributable to the write down of our previous joint venture investment with Kolon. | |
| • | Net finance loss decreased by $0.5 million for the three months ended June 30, 2019 due to a $0.4 million increase in foreign exchange gains attributable to strengthening of the US dollar against the euro and Canadian dollar. The remaining $0.1 million increase is due to the expiry of warrants in May 2019. For the six months ended June 30, 2019 the net finance loss increased by $0.2 million as compared to prior period mainly due to the interest expense on lease liabilities recognized as a result of IFRS 16 adoption effective January 1, 2019. | |
| • | Net loss for the three months ended June 30, 2019 was consistent with the prior comparative period at $4.8 million and increased by $0.7 million for the six months ended June 30, 2019 as compared to the same period in 2018, driven mainly by the increase in SG&A expenses described above. | |
| • | Cash operating costs increased by $0.1 million for the three and six months ended June 30, 2019 compared to the same periods in 2018, despite incurring one-time expenses of $0.8 million related to negotiating the Arrangement Agreement with Cummins Inc.. This increase was offset in part by the reduction in net R&D expenses. | |
| • | Adjusted EBITDA increased $0.8 million and $0.2 million for the three and six months ended June 30, 2019, as compared to the same periods in 2018. The increase is primarily attributable one-time expenses of $0.8 million related to negotiating the Arrangement Agreement with Cummins Inc.. |
| 2 | Operating Results |
Business Segment Review
We report our results in two business segments, being OnSite Generation and Power Systems. Our reporting structure reflects the way we manage our business and how we classify our operations for planning and measuring performance. The corporate office and administrative support is reported under Corporate and Other.
OnSite Generation
Our OnSite Generation business segment is based in Oevel, Belgium and Mississauga, Canada and develops products for industrial gas, hydrogen fueling and the renewable energy storage markets. Refer to Section 5 Strategy and Outlook for a more extensive discussion regarding these products, markets and our business segment strategy.
Selected Financial Information
| Three months ended June 30, | Six months ended June 30, | |||||||||||||||||||||||
| 2019 | 2018 | Favourable / (Unfavourable) | 2019 | 2018 | Favourable / (Unfavourable) | |||||||||||||||||||
| Revenues | $ | 7,585 | $ | 4,776 | 59 | % | $ | 10,068 | $ | 8,537 | 18 | % | ||||||||||||
| Gross profit | 1,173 | 1,419 | (17 | )% | 1,191 | 2,655 | (55 | )% | ||||||||||||||||
| Gross margin % | 15 | % | 30 | % | (48 | )% | 12 | % | 31 | % | (62 | )% | ||||||||||||
| Selling, general and administrative expenses | 539 | 700 | 23 | % | 1,305 | 1,451 | 10 | % | ||||||||||||||||
| Research and product development expenses, net | 178 | 855 | 79 | % | 722 | 1,487 | 51 | % | ||||||||||||||||
| Segment gain (loss) | $ | 456 | $ | (136 | ) | n/a | $ | (836 | ) | $ | (283 | ) | (195 | )% | ||||||||||
Revenues increased by $2.8 million and $1.5 million for the three and six months ended June 30, 2019, respectively, versus the comparative prior periods, as a result of increased equipment deliveries. New orders awarded for the six months ended June 30, 2019 amounted to $25.5 million (2018 – $9.7 million) inclusive of the 20 megawatts (“MW”) award previously announced with Air Liquide. Backlog at June 30, 2019 was $36.0 million (June 30, 2018 - $20.5 million) with approximately $30.3 million of this backlog expected to be recognized as revenue in the next twelve months.
Gross margin decreased for the three and six months ended June 30, 2019 to 15% from 30% and 12% from 31%, respectively, versus the comparative periods in 2018. In the comparative periods, we delivered large capital projects with improved margins and released warranty provisions that were no longer required.
| Second Quarter 2019 Management’s Discussion and Analysis | Page 6 |
Hydrogenics Corporation
SG&A expenses decreased by $0.2 million and $0.1 million for the three and six months ended June 30, 2019, respectively, versus the comparative periods in 2018 mainly due to a $0.3 million recovery of trade receivables that was previously written off, partially offset by increased business development activity.
Net R&D expenses decreased by $0.7 million and $0.8 million for the three and six months ended June 30, 2019, respectively, versus the comparative periods in 2018 due primarily to the completion of the fueling station project in Mississauga, Canada. These costs amounted to $0.9 million for the six months ended June 30, 2018.
Segment gain (loss) improved by $0.6 million for the six months ended June 30, 2019, as compared to the same period in 2018, despite lower gross profit, offset by the decrease in net R&D and SG&A expenses, as described above.
Power Systems
Our Power Systems business segment is based in Mississauga, Canada, with satellite facilities in Carlsbad, California, USA, and Gladbeck, Germany and develops products for the mobility and stationary power markets. Refer to Section 5 Strategy and Outlook for a more extensive discussion regarding these products, markets and our business segment strategy.
Selected Financial Information
| Three months ended June 30, | Six months ended June 30, | |||||||||||||||||||||||
| 2019 | 2018 | Favourable / (Unfavourable) | 2019 | 2018 | Favourable / (Unfavourable) | |||||||||||||||||||
| Revenues | $ | 2,870 | $ | 2,833 | 1 | % | $ | 8,471 | $ | 7,219 | 17 | % | ||||||||||||
| Gross Profit | 180 | 682 | (74 | )% | 4,037 | 2,684 | 50 | % | ||||||||||||||||
| Gross margin % | 6 | % | 24 | % | (74 | )% | 48 | % | 37 | % | 28 | % | ||||||||||||
| Selling, general and administrative expenses | 852 | 1,057 | 19 | % | 2,053 | 2,122 | 3 | % | ||||||||||||||||
| Research and product development expenses, net | 1,499 | 1,007 | (49 | )% | 2,744 | 2,446 | (12 | )% | ||||||||||||||||
| Segment loss | $ | (2,171 | ) | $ | (1,382 | ) | (57 | )% | $ | (760 | ) | $ | (1,884 | ) | 60 | % | ||||||||
Revenues increased by 1% and 17%, respectively, for the three and six months ended June 30, 2019 versus the comparative periods in 2018. The increase is attributable to revenue recognized for licensing and support services agreements with our key customers in China. Orders awarded through 2019 amounted to $5.4 million (2018 – $3.6 million). At June 30, 2019, backlog was $108.1 million (June 30, 2018 – $111.3 million) with approximately $29.6 million of this backlog expected to be recognized as revenue in the next twelve months.
Gross margin declined from 24% to 6% for the three months period over the comparative period for 2018 due to a delay in completing a multi-year project that resulted in unexpected costs as well as additional costs recognized during the quarter for warranty provisions and our semi-annual inventory obsolescence assessment. Despite the margin variances for the three-month period, gross margin increased from 37% to 48% for the six months period over the comparative period for 2018 attributable to higher margins on license and support services revenue.
SG&A expenses decreased by $0.2 million and $0.1 million for the three and six months ended June 30, 2019 versus the comparative periods in 2018 mainly due to a $0.1 million recovery of trade receivables that was previously written off.
Net R&D expenses increased by $0.5 million and $0.3 million for the three and six months ended June 30, 2019 versus the comparative periods in 2018 mainly attributable to expansion of our FCPM to new mobility use cases, furthering development on the next generation of our fuel cell stack platform and the development of the multi-megawatt energy storage project using Proton Exchange Membrane (“PEM”) fuel cell technology.
Segment loss increased by $0.8 million for the three months ended June 30, 2019 versus the comparative period in 2018 due to decrease in gross margin and increased net R&D expenses, as described above. Segment loss decreased by $1.1 million for the six months ended June 30, 2019 versus the comparative period in 2018 due to higher margins on license and support services revenue, as described above.
| Second Quarter 2019 Management’s Discussion and Analysis | Page 7 |
Hydrogenics Corporation
Corporate and Other
Selected Financial Information
| Three months ended June 30, | Six months ended June 30, | |||||||||||||||||||||||
| 2019 | 2018 | Favourable / (Unfavourable) | 2019 | 2018 | Favourable / (Unfavourable) | |||||||||||||||||||
| Selling, general and administrative expenses | $ | 3,085 | $ | 1,267 | (143 | )% | $ | 5,225 | $ | 2,287 | (128 | )% | ||||||||||||
| Research and product development expenses, net | 18 | 18 | - | 38 | 28 | (36 | )% | |||||||||||||||||
| Losses (gains) from joint ventures | (21 | ) | 1,492 | n/a | (26 | ) | 1,561 | n/a | ||||||||||||||||
| Interest expense, net | 288 | 372 | 23 | % | 572 | 753 | 24 | % | ||||||||||||||||
| Foreign currency losses (gains), net | (182 | ) | 177 | n/a | 19 | (42 | ) | n/a | ||||||||||||||||
| Other finance gains, net | (137 | ) | (43 | ) | (219 | )% | (11 | ) | (299 | ) | (96 | )% | ||||||||||||
| Segment loss | $ | 3,051 | $ | 3,283 | 7 | % | $ | 5,817 | $ | 4,288 | (36 | )% | ||||||||||||
SG&A expenses increased by $1.8 million and $2.9 million for the three and six months ended June 30, 2019 versus the comparative periods in 2018 due to $1.0 million and $1.8 million, respectively, of non-cash fair value adjustments of DSUs resulting from the higher share price at the end of current period. Other factor contributing to the increase in SG&A expenses include $0.8 million in one-time costs associated with negotiating the Arrangement Agreement with Cummins Inc..
Net interest expense increased by $0.1 million and $0.2 million for the three and six months ended June 30, 2019 versus the comparative periods in 2018 due to interest expense on our lease obligations recognized as a result of IFRS 16 adoption in 2019, partially offset by lower interest due to principal repayments on our long-term debt.
Net foreign currency gains (losses) moved to a gain of $0.2 million for the three months ended June 30, 2019 compared to a loss of $0.2 million in the prior period, attributable to the appreciation of the US dollar against the Euro and Canadian dollar.
Other net finance gains increased by $0.1 million for the three months ended June 30, 2019 due to a gain on the expiry of warrants in May 2019.
| Second Quarter 2019 Management’s Discussion and Analysis | Page 8 |
Hydrogenics Corporation
| 3 | Financial Condition |
| June 30, | December 31, | Increase (decrease) | ||||||||||||||
| 2019 | 2018 | $ | % | |||||||||||||
| Cash, cash equivalents and restricted cash | $ | 17,735 | $ | 8,737 | $ | 8,998 | 103 | % | ||||||||
| Trade and other receivables | 8,022 | 6,728 | 1,294 | 19 | % | |||||||||||
| Contract assets – (current and non-current) | 6,584 | 6,223 | 361 | 6 | % | |||||||||||
| Inventories | 18,940 | 17,174 | 1,766 | 10 | % | |||||||||||
| Prepaid expenses | 2,008 | 1,960 | 48 | 2 | % | |||||||||||
| Trade and other payables | 8,628 | 9,068 | (440 | ) | (5 | )% | ||||||||||
| Contract liabilities – (current and non-current) | 14,512 | 16,001 | (1,489 | ) | (9 | )% | ||||||||||
| Financial liabilities | 6,121 | 3,359 | 2,762 | 82 | % | |||||||||||
| Provisions – (current and non-current) | 2,666 | 2,851 | (185 | ) | (6 | )% | ||||||||||
| Deferred funding – (current and non-current) | 2,067 | 1,973 | 94 | 5 | % | |||||||||||
| Other non-current liabilities | 7,632 | 5,711 | $ | 1,921 | 34 | % | ||||||||||
Cash, cash equivalents, restricted cash and short-term investments increased $9.0 million on a year-to-date basis in 2019, mainly due to $20.3 million in net proceeds from a private placement with The Hydrogen Company (“H2C”), partially offset by a $1.0 million repayment of government funding, $8.6 million used for operating activities, $1.2 million in debt and lease payments and $0.4 million in capital expenditures. Refer to Section 6 – Liquidity for a more detailed discussion of the change in cash, cash equivalents and restricted cash.
Trade and other receivables increased $1.3 million due to the timing of billings on equipment deliveries during the period.
Contract assets (current and non-current) increased $0.4 million due to the change in value of amounts recognized on a percentage of completion basis for a long-term Power Systems contract as well as amounts recognized for start-up and commissioning related to equipment sales.
Inventories increased $1.8 million attributable to work in progress and finished goods inventory required to support the schedule of expected deliveries against our backlog for Power Systems and OnSite Generation products over the balance of the year.
Trade and other payables decreased $0.4 million as result of repayment of $1.0 million (C$1.4 million) for unspent government funding due to the cancelation of the program in 2018, partially offset by an increase resulting from the timing of purchases and payments to the suppliers and consistent with the increase in inventory.
Contract liabilities (current and non-current) decreased due to the release of amounts related to revenue recognized in the period net of payments received on new orders.
Financial liabilities increased $2.8 million due to: i) a $1.3 million increase in the fair value of DSU liabilities, ii) a $0.7 million of current lease liabilities recognized as a result of IFRS 16 adoption in 2019; and iii) a $0.7 million increase in the current portion of our long-term debt with Export Development Canada due to the scheduled increase in principal repayments.
Provisions decreased $0.2 million reflecting the expiry of warranty periods and the release of start-up and commissioning accruals for completed projects.
Other non-current liabilities increased $1.9 million due to $2.8 million of lease liabilities recognized as a result of IFRS 16 adoption in 2019, partially offset by the reduction in our long-term debt with Export Development Canada.
| Second Quarter 2019 Management’s Discussion and Analysis | Page 9 |
Hydrogenics Corporation
| 4 | Summary of Quarterly Results |
The following table highlights selected financial information for the eight consecutive quarters ended June 30, 2019. The comparative financial information presented for 2017 has been restated to reflect the retroactive adoption of IFRS 15 in 2018.
| 2019 | 2019 | 2018 | 2018 | 2018 | 2018 | 2017 | 2017 | |||||||||||||||||||||||||
| Q2 | Q1 | Q4 | Q3 | Q2 | Q1 | Q4 | Q3 | |||||||||||||||||||||||||
| Revenues | $ | 10,455 | $ | 8,084 | $ | 10,475 | $ | 7,665 | $ | 7,609 | $ | 8,147 | $ | 19,745 | $ | 12,079 | ||||||||||||||||
| Gross profit | 1,353 | 3,875 | 1,915 | 1,471 | 2,101 | 3,238 | 5,668 | 2,897 | ||||||||||||||||||||||||
| Gross margin % | 13 | % | 48 | % | 18 | % | 19 | % | 28 | % | 40 | % | 29 | % | 24 | % | ||||||||||||||||
| Adjusted EBITDA | (3,279 | ) | (963 | ) | (2,805 | ) | (2,529 | ) | (2,447 | ) | (1,606 | ) | 175 | (1,947 | ) | |||||||||||||||||
| Net loss | (4,766 | ) | (2,647 | ) | (3,141 | ) | (3,443 | ) | (4,801 | ) | (1,954 | ) | (975 | ) | (2,032 | ) | ||||||||||||||||
| Net loss per share - basic and fully diluted | $ | (0.25 | ) | $ | (0.15 | ) | $ | (0.20 | ) | $ | (0.22 | ) | $ | (0.31 | ) | $ | (0.13 | ) | $ | (0.06 | ) | $ | (0.13 | ) | ||||||||
| Weighted average common shares outstanding | 18,999,286 | 18,081,498 | 15,441,947 | 15,442,416 | 15,440,888 | 15,436,879 | 15,133,194 | 15,232,905 |
| 1. | Adjusted EBITDA is a Non-IFRS measure, refer to Section 14 – Reconciliation of Non-IFRS Measures. |
When comparing the second quarter of 2019 to the second quarter of 2018, our net loss remained consistent at $4.8 million ($0.25 per common share in 2019 versus $0.31 per common share in 2018). Our gross margin declined to 13% from 28% mainly due to: i) a delay in completion of a multi-year project with a customer in Europe that resulted in unexpected costs; ii) costs recognized during the quarter for warranty provisions; and iii) a semi-annual inventory obsolescence provision. In the second quarter of 2018, we delivered large capital projects with improved margins. Adjusted EBITDA loss increased by $0.9 million to a loss of $3.3 million from a loss of $2.4 million attributable to a decrease in gross profit of $0.7 million and an increase of $0.1 million in cash operating costs year-over-year. The increase in cash operating costs reflects $0.2 million of additional expenditures for SG&A, partially offset by decrease in net R&D.
When comparing the first quarter of 2019 to the first quarter of 2018, our net loss increased 35% to $2.6 million ($0.15 per common share) from $2.0 million ($0.13 per common share). An increase in gross profit of $0.6 million was principally due to improved direct margins due to product mix. Adjusted EBITDA improved $0.6 million attributable to the increase in gross profit. Finance loss worsened from an income of $0.1 million to a loss of $0.6 million primarily as a result of adjustments to the fair value of outstanding warrants related to the net increase in the Company’s share price in the current quarter as compared to a net decrease in share price for the comparative quarter of March 31, 2018. SG&A expenses increased $1.3 million in the first quarter of 2019 as compared to same period in 2018 mainly due to a $0.9 million increase in mark-to-market adjustment relating to our DSUs and a $0.1 million increase in amortization and depreciation as a result of IFRS 16 adopted in 2019. Excluding non-cash items, the SG&A increased by $0.4 million attributable to an increase in business development and marketing activities. The increase in SG&A expenses was partially offset by a decrease in net R&D expenses of $0.3 million primarily due to the timing of significant projects.
When comparing the fourth quarter of 2018 to the fourth quarter of 2017, our net loss increased by $2.2 million to $3.1 million ($0.20 per common share) compared to a net loss of $1.0 million ($0.06 per common share). This increase was driven by lower revenue of $9.3 million and a decrease in gross profit of $3.8 million. Adjusted EBITDA decreased by $3.0 million to a loss of $2.8 million from a profit of $0.2 million reflecting the decrease in gross profit of $3.8 million, offset by a decrease in cash operating costs of $0.6 million. The decrease in cash operating costs is attributable to lower SG&A expenses of $1.0 million offset by higher net R&D expenses of $0.4 million due to FCPM manufacturing expansion and process improvement initiatives in the current quarter. The focus of our R&D activities in Q4-2018 also included expanding our FCPMs to new mobility use cases, such as heavy-duty commercial vehicles, and furthering development on the next generation of our fuel cell stack platform and electrolyzer products.
| Second Quarter 2019 Management’s Discussion and Analysis | Page 10 |
Hydrogenics Corporation
When comparing the third quarter of 2018 to the third quarter of 2017, our net loss increased by $1.4 million (70%) to $3.4 million ($0.22 per common share) compared to a net loss of $2.0 million ($0.13 per common share). This increase was driven by lower revenue of $4.4 million and a decrease in gross profit of $1.4 million. Adjusted EBITDA decreased by $0.6 million to a loss of $2.5 million from a loss of $1.9 million reflecting the decrease in gross profit of $1.4 million offset by an improvement in cash operating costs of $0.9 million. The improvement in cash operating costs is attributable to reduced net R&D expenses; notably, an increase in government funded FCPM manufacturing expansion and process improvement initiatives in the current quarter. The focus of our R&D activities in Q3-2018 also included expanding our FCPMs to new mobility use cases, such as heavy-duty commercial vehicles, and furthering development on the next generation of our fuel cell stack platform and electrolyzer products.
When comparing the second quarter of 2018 to the second quarter of 2017, our net loss decreased by $0.7 million (12%) to $4.8 million ($0.31 per common share) compared to a net loss of $5.4 million ($0.43 per common share). This improvement was driven by the increase in gross profit of $1.7 million reflecting a gross margin improvement to 28% from 6%, offset by an increase in losses from our joint venture with Kolon. Adjusted EBITDA improved by $1.0 million to a loss of $2.4 million from a loss of $3.4 million. The improvement reflects the additional gross profit of $1.7 million offset by an increase of $0.7 million in cash operating costs year-over-year. The increase in cash operating costs reflects $0.3 million and $0.4 million respectively of additional expenditures for SG&A and net R&D. The increase in SG&A is attributable to increased business development and marketing activities. The focus of our R&D activities in the quarter included commissioning the 2.5MW Power-to-Gas facility with Enbridge, government funded FCPM manufacturing expansion and process improvement initiatives, expanding our FCPMs to new mobility use cases, such as heavy duty commercial vehicles, and furthering development on the next generation of our fuel cell stack platform and electrolyzer products.
| 5 | Strategy and Outlook |
Potential Sale Transaction
On June 28, 2019 the Company entered into an arrangement agreement (the “Arrangement Agreement”) with Cummins Inc. (“Cummins”) and Atlantis AcquisitionCo Canada Corporation (the “Purchaser”), pursuant to which the Purchaser, a subsidiary of Cummins Inc., has agreed to acquire all of the outstanding common shares of the Company (the “Shares”), other than Shares owned by The Hydrogen Company, a wholly owned subsidiary of L’Air Liquide S.A. (“Air Liquide”), for US$15.00 in cash per Share (the “Transaction”). The Hydrogen Company has agreed to exchange its Shares for shares of the Purchaser pursuant to the Transaction. The Transaction is structured as a statutory plan of arrangement under the Canada Business Corporations Act. The Transaction requires approval of at least 66 2/3% of the votes cast by Shareholders, as well as the approval by a simple majority of votes cast by disinterested Shareholders, excluding Shares held by The Hydrogen Company and its affiliates, and any other Shareholders required to be excluded under MI 61-101. The Shareholders meeting is scheduled for August 29, 2019 to approve the Transaction.
On July 31, 2019, the Company issued a Notice of Meeting and Management Information Circular (“Circular”) setting August 29, 2019 for a Special Meeting of the Shareholders to approve the Transaction. As outlined in the Circular, the Board of Directors of the Company unanimously determined that the Arrangement Agreement was fair to Shareholders (other than Hydrogen Company and its affiliates) and is in the best interest of the Company. In making its recommendation, the Board of Directors reviewed a significant amount of information and considered a number of factors including, but not limited to, the unanimous recommendation of the Special Committee, valuation and fairness opinions received from its financial advisors, pricing terms and all cash consideration, Company prospects on a stand-alone basis and including consideration of other strategic transactions, Identity of Cummins, the Cummins and Hydrogen Company arrangement and other factors.
If approved by the Shareholders, the Transaction is expected to close in Q3 2019 and, as a result, the Company’s shares will be delisted from Toronto Stock Exchange and NASDAQ.
Strategy
Our strategy is to develop electrolyzer and fuel cell products for sale to OEMs, integrators, electric utilities, gas utilities, merchant gas companies, municipalities and other owners of mass transit applications (such as buses and trains) and end-users requiring highly reliable products offered at competitive prices. We seek to profitably grow and lead hydrogen energy solutions for these diverse applications across global markets. We continue to leverage the milestones and reference sites established in prior years to gain additional traction in the following target markets and applications:
| Second Quarter 2019 Management’s Discussion and Analysis | Page 11 |
Hydrogenics Corporation
Mobility Power – Our Power Systems business segment is based on PEM fuel cell technology, which transforms chemical energy liberated during the electrochemical reaction of hydrogen and oxygen into electrical energy. Our HyPM® branded fuel cell products are based on our extensive track record of on-bench testing and real-time deployments across a wide range of stationary and mobility power profiles. We configure our HyPM® products into multiple electrical power outputs ranging from 3kW to 1MW with ease of integration, high reliability and operating efficiency, delivered from a highly compact configuration. We feel our technology provides us with a competitive advantage based upon a design that supports a compact, integrated balance of plant and ease of modularity. Our design provides for robust cold weather reliability and a patented rapid start-up and shut down capability. Our low pressure and dry/dry design further differentiates our technology and eliminates the need for additional humidification and pump components.
Our target markets include mobility power applications, such as trains, buses, trucks, utility vehicles, aircraft, stationary power applications (including primary and back-up power) and most recently, a product development contract was signed for a marine application. Our target future addressable markets (stationary power and mobility markets) are estimated to be in excess of $2 billion specifically related to hydrogen power technology.
Our strategy in China is to work with integrators, companies that take our fuel cell technology and incorporate it into buses and other vehicles provided by original equipment manufacturers. We created a certified integrator program to execute this strategy and have established relationships with multiple parties in China to date. Despite a slowdown in production orders in 2018 and the first half of 2019, we still have the largest fleet of buses on the road in China at over 300. As well, to date, more than ten bus models incorporating our fuel cells are listed in the official Chinese government catalogue (meaning these models are approved for commercial sale). Since inception of strategy, approximately 400 units have been shipped to date and we have outstanding orders for 1,000 more units at present.
During 2018, we continued to support the roll out of commercial units for the Company’s ten-year commuter train propulsion system contract with Alstom Transport, which at €50 million, is the largest commercial order in our history. This order highlights the commercial maturity and strong competitive positioning of our fuel cell technology. Alstom Transport achieved certification of the train sets in July 2018 and placed the trains into active passenger service in September 2018. Alstom is actively working opportunities across Europe to aggregate train orders which will drive follow-on fuel cell orders envisioned under our contract including $46 million in backlog. Our first production order for 82 units is under active negotiation. Production against this order is expected to begin in 2019 with deliveries expected in late 2020.
Energy Storage – We have identified several large-scale applications which would consume 10 to 100 MW of power, which is 100 to 300 times larger than a typical industrial unit to date. On February 25, 2019, we announced the first award of such a project at 20MW for Air Liquide Canada. On December 21, 2018, we announced the signing of a Technology and Business Development Agreement (“TBDA”) with H2C, a wholly-owned subsidiary of L’Air Liquide S.A. (“Air Liquide”). The terms of the TBDA provide for the joint development of a large-scale PEM electrolysis solution focused on lowering the total cost of ownership and collaboration to bid this solution on large scale PEM electrolysis projects worldwide.
We continue our focus to improve and differentiate our PEM electrolyzer technology. Our HyLYZER 600 3MW PEM single stack electrolyzer is the smallest, most power dense unit in the market today and is ideally suited for large scale energy storage applications. Product development is underway to augment to a 5MW stack permitting cost effective modular scaling in 5MW capacity blocks including a focus on this technology within the TBDA referred to above.
We are experiencing a willingness on the part of utilities and regulatory agencies to increase spending in the growing problem areas related to energy storage and grid stabilization and our sales pipeline remains robust in this area. We are also seeing a gradual maturation around the regulatory framework needed to integrate energy storage into an overall energy framework to permit its cost-effective rollout. For example, on June 15, 2018, the European Union issued an update to its’ Renewable Energy Directive, Part II which explicitly includes hydrogen solutions towards attainment of EU transportation target attainment. In addition, we continue to witness governments in other jurisdictions showing a willingness to increase spending on alternative energy projects for the same purpose. We believe we continue to be well positioned to benefit from government initiatives in Canada, the European Union (particularly in Germany) and the United States (particularly in California), which we expect will positively impact our business. Since 2014, we installed over 16MW of capacity across 12 reference sites in Europe, Asia and North America. An increase in interest in our Power-to-Gas application and orders for energy storage and fueling stations in Europe, California, the UK and other geographies has signaled what we believe could be a significant increase in opportunities in the markets we serve.
Industrial Hydrogen – Historically, the demand for onsite generation of hydrogen gas has been driven by the manufacturing sector requiring hydrogen for industrial use and hydrogen gas resellers. A typical unit for these applications would generate 20 to 60 normal cubic meters of hydrogen and consume 100 to 300 kW of electrical energy. Our OnSite Generation products are sold to leading merchant gas companies, such as Air Liquide and Linde Gas, and end-users requiring high purity hydrogen produced on-site for industrial applications. We recently completed development of our sixth generation design, our lowest cost and most efficient alkaline product to date, which is critical to maintaining commercial success in this market.
| Second Quarter 2019 Management’s Discussion and Analysis | Page 12 |
Hydrogenics Corporation
Hydrogen Fueling – We also sell and service products for progressive oil and gas companies, requiring hydrogen fueling stations for transportation applications. Recently, the rollout of fuel cell motor vehicles and the increase in fuel cell buses and other mass transit applications, such as rail, has resulted in an increase in orders and interest for fueling stations in Europe, North America, California and elsewhere. The increasing consumption of hydrogen to support mobility applications will demand more hydrogen supply infrastructure. We have been involved with the construction of over 55 fueling stations globally and see increased demand for hydrogen fueling; particularly, when it can be linked to electrolyzed hydrogen coming from electricity that is generated from renewable sources such as wind and solar energy thus reducing the carbon footprint of the production of hydrogen. Serving both the mobility and generation markets, we believe there could be a major increase in size of both addressable markets.
Outlook Summary
The timing and full realization of the opportunities above, under the current market environment, cannot be assured or specifically established. It is, however, important to understand the magnitude of these opportunities and the transformative impact that any one of them can have on the business going forward as discussed above. Over the past several years, we took significant steps to reduce operating and product costs, streamline our operations and strengthen our consolidated financial position. We have tenaciously pursued research and product development to expand use cases across both our mobility and generation businesses. We have established significant commercial opportunities with large global companies such as Alstom, Enbridge and Air Liquide that we believe will support our trajectory to larger scale. We also continue to monitor evolving opportunities such as hydrogen powered rail.
While we may see volatility in our costs and revenues over the short-term, we expect our trend of improved cost efficiency to result in attractive operating leverage over the long term. At June 30, 2019, our order backlog was $144.1 million (December 31, 2018 – $132.7 million) spread across numerous geographical regions, of which approximately $59.9 million is expected to be recorded as revenue in the following twelve months.
As a global company, we are subject to the risks arising from adverse changes in global economic and political conditions. Political conditions such as government commitments and policies towards environmental protection and renewable energy may change over time. Economic conditions in leading and emerging economies have been, and remain, unpredictable. In particular, currency fluctuations could have the impact of significantly reducing revenue and gross margin as well as the competitive positioning of our product portfolio. These macroeconomic and geopolitical changes could result in our current or potential customers reducing purchases or delaying shipment which could cause revenue recognition on these products to shift into 2020 or beyond.
| 6 | Liquidity |
Cash Used in Operating Activities
| Three months ended June 30, | Six months ended June 30, | |||||||||||||||||||||||
| (Thousands of US dollars) | 2019 | 2018 | Change | 2019 | 2018 | Change | ||||||||||||||||||
| Net loss | $ | (4,766 | ) | $ | (4,801 | ) | $ | 35 | $ | (7,413 | ) | $ | (6,755 | ) | $ | (658 | ) | |||||||
| (Increase) decrease in restricted cash | (145 | ) | (266 | ) | 121 | 178 | (279 | ) | 457 | |||||||||||||||
| Net change in non-cash operating assets | (507 | ) | (1,416 | ) | 909 | (4,687 | ) | (859 | ) | (3,828 | ) | |||||||||||||
| Other items not affecting cash | 1,726 | 2,015 | (289 | ) | 3,317 | 2,294 | 1,023 | |||||||||||||||||
| Cash used in operating activities | $ | (3,692 | ) | $ | (4,468 | ) | $ | 776 | $ | (8,605 | ) | $ | (5,599 | ) | $ | (3,006 | ) | |||||||
Cash used in operating activities during the six months ended June 30, 2019 increased by $3.0 million versus the comparative period in 2018 primarily as a result of changes in non-cash working capital; notably, work in progress and finished goods inventory build-up required to support the schedule of expected deliveries against our backlog for Power Systems and OnSite Generation products over the balance of the year.
| Second Quarter 2019 Management’s Discussion and Analysis | Page 13 |
Hydrogenics Corporation
Cash Used in Investing Activities
| Three months ended June 30, | Six months ended June 30, | |||||||||||||||||||||||
| (Thousands of US dollars) | 2019 | 2018 | Change | 2019 | 2018 | Change | ||||||||||||||||||
| Purchases of property, plant and equipment | $ | (148 | ) | $ | (101 | ) | $ | (47 | ) | $ | (332 | ) | $ | (335 | ) | $ | 3 | |||||||
| Receipt of government funding | – | 974 | (974 | ) | (974 | ) | 974 | (1,948 | ) | |||||||||||||||
| Purchase of intangible assets | (2 | ) | (1 | ) | (1 | ) | (10 | ) | (1 | ) | (9 | ) | ||||||||||||
| Cash provided by (used in) investing activities | $ | (150 | ) | $ | 872 | $ | (1,022 | ) | $ | (1,316 | ) | $ | 638 | $ | (1,954 | ) | ||||||||
Cash used in investing activities decreased by $1.9 million during the six months ended June 30, 2019 versus the comparative period in 2018 reflecting the receipt and subsequent repayment of government funding due to cancelation of government funding program effective September 28, 2018.
Cash Provided by (Used in) Financing Activities
| Three months ended June 30, | Six months ended June 30, | |||||||||||||||||||||||
| (Thousands of US dollars) | 2019 | 2018 | Change | 2019 | 2018 | Change | ||||||||||||||||||
| Proceeds from common shares issued and stock options exercised, net of issuance costs | $ | 21 | $ | 1 | $ | 20 | $ | 20,381 | $ | 1 | $ | 20,380 | ||||||||||||
| Principal repayment of long-term debt | (500 | ) | (500 | ) | – | (500 | ) | (750 | ) | 250 | ||||||||||||||
| Interest payment | (286 | ) | (286 | ) | – | (330 | ) | (582 | ) | 252 | ||||||||||||||
| Lease payments | (199 | ) | – | (199 | ) | (379 | ) | – | (379 | ) | ||||||||||||||
| Repayment of operating borrowings | – | – | – | – | (1,193 | ) | 1,193 | |||||||||||||||||
| Cash provided by (used in) financing activities | $ | (964 | ) | $ | (785 | ) | $ | (179 | ) | $ | 19,172 | $ | (2,524 | ) | $ | 21,696 | ||||||||
Cash provided by financing activities during the six months ended June 30, 2019 increased by $21.7 million versus the comparative period in 2018 mainly attributable to a $20.3 million funding from subscription agreement with H2C partially offset by debt, interest and lease payments.
We expect to consume an additional $nil million to $6.0 million of cash over the balance of the fiscal year to fund our operations, capital expenditures and debt service. We expect this estimate to be mitigated by deposits received on new customer orders.
Contractual Obligations
| Less than | After | |||||||||||||||||||
| Total | 1 year | 1-3 years | 4-5 years | 5 years | ||||||||||||||||
| Long-term debt1, including current portion | $ | 9,611 | $ | 4,353 | $ | 5,258 | $ | – | $ | – | ||||||||||
| Purchase obligations | 25,223 | 23,050 | 2,173 | – | – | |||||||||||||||
| Lease payments | 3,482 | 990 | 1,405 | 596 | 491 | |||||||||||||||
| Total contractual obligations2 | $ | 38,316 | $ | 28,393 | $ | 8,836 | $ | 596 | $ | 491 | ||||||||||
| 1. | Represents the undiscounted amounts payable as disclosed below under “Credit and Loan Facilities”. |
| 2. | The table excludes the DSU liability of $1,995 included in our current liabilities which relate to units that are only settled once a director resigns. |
Credit and Loan Facilities
At June 30, 2019, the Company’s subsidiary in Belgium (the “Borrower”) had a joint credit and operating line facility of €7.0 million, which renewed in April 2019. Under this facility, the Borrower may borrow up to a maximum of 75% of the value of awarded sales contracts, approved by the Belgian financial institution, to a maximum of €0.5 million; and may also borrow up to €1.5 million for general business purposes, provided sufficient limit exists under the overall facility limit of €7.0 million. Of the €7.0 million facility, €2.8 million or approximately $3.1 million was drawn as standby letters of credit and bank guarantees and €nil was drawn as an operating line (December 31, 2018 - €nil). At June 30, 2019, the Company had availability of €4.2 million or $4.8 million (December 31, 2018 –$5.5 million) under this facility for use as letters of credit and bank guarantees.
At June 30, 2019, the Company also had a Canadian credit facility of C$3.0 million, with no expiration date for use only as letters of credit and bank guarantees. At June 30, 2019, C$0.1 million was drawn as standby letters of credit and bank guarantees. At June 30, 2019, the Company had C$2.9 million or $2.2 million (December 31, 2018 – $1.8 million) available under this facility for use as letters of credit and bank guarantees.
| Second Quarter 2019 Management’s Discussion and Analysis | Page 14 |
Hydrogenics Corporation
These letters of credit and bank guarantees relate primarily to obligations in connection with the terms and conditions of our sales contracts. The standby letters of credit and letters of guarantee may be drawn on by the customer if we fail to perform our obligations under the sales contracts.
On September 28, 2011, we entered into a loan agreement with the Province of Ontario’s Ministry of Economic Development, Strategic Jobs and Investment Fund for funding up to C$6.0 million. Eligible costs had to be incurred between October 1, 2010 and September 30, 2015. After this five-year period, the loan bears interest at a rate of 3.67% and requires annual repayment at a rate of 20% per year of the outstanding balance for the five years subsequent to the sixth anniversary of the first disbursement, which was November 30, 2011. There is no availability remaining under this facility at June 30, 2019. The loan is collateralized by a general security agreement covering assets of Hydrogenics Corporation. Additionally, the Corporation is required to maintain a minimum balance of cash in Canadian dollars in a Canadian financial institution at all times. We were in compliance with this covenant as at June 30, 2019.
In the fourth quarter of 2016, we entered into a loan agreement with EDC for a five-year facility of $9.0 million. The loan is structured as a five-year term loan with quarterly interest payments calculated at an annual interest rate of U.S. prime plus 10%, declining to U.S. prime plus 5% to 7% if certain annual earnings before interest, taxes, depreciation and amortization thresholds are met. The loan is secured by a second charge over the assets located within Canada. Commencing March 31, 2017, the loan principal is subject to four quarterly repayments of $0.25 million followed by 16 quarterly repayments of $0.5 million. There is an option to prepay a portion of, or the entire loan, at any quarterly repayment date.
| 7 | Capital Resources |
We consider our capital employed to consist of shareholders’ equity and total debt, net of cash and cash equivalents as follows:
| June 30, | December 31, | |||||||
| 2019 | 2018 | |||||||
| Total equity | $ | 24,293 | $ | 10,961 | ||||
| Long-term debt (EDC and Province of Ontario) | 8,025 | 8,082 | ||||||
| Total | 32,318 | 19,043 | ||||||
| Less: Cash and cash equivalents and restricted cash | 17,735 | 8,737 | ||||||
| Total capital employed | $ | 14,583 | $ | 10,306 |
The Company’s financial objective when managing capital is to make sure that we have the cash, debt capacity and financial flexibility to fund our ongoing business objectives including operating activities, research and development, investments and growth in order to provide returns for our shareholders and other stakeholders.
We monitor our capital structure and make adjustments according to market conditions in an effort to meet our objectives given the Company’s operating and financial performance and current outlook of the business and industry in general. The Company’s alternatives to fund future capital needs include cash flows from operating activities, debt or equity financing, adjustments to research and product development priorities, capital spending and/or sale of assets. These alternatives, and our capital structure, are reviewed by management and the board of directors of the Company on a regular basis to ensure the best mix of capital resources to meet the Company’s needs.
| 8 | Off-Balance Sheet Arrangements |
We do not have any material obligations under forward foreign exchange contracts, guarantee contracts, retained or contingent interests in transferred assets, outstanding derivative instruments or non-consolidated variable interests.
In the normal course of operations, we occasionally provide indemnification agreements, other than those listed above, to counterparties that would require us to compensate them for costs incurred as a result of changes in laws and regulations or as a result of litigation claims or statutory sanctions that may be suffered by the counterparty as a consequence of the transaction. The terms of these indemnification agreements will vary. The nature of the indemnification agreements prevents us from making a reasonable estimate of the maximum potential amount we could be required to pay to counterparties. No amount has been recorded in the consolidated financial statements with respect to these indemnification agreements as we are not aware of any claims.
| Second Quarter 2019 Management’s Discussion and Analysis | Page 15 |
Hydrogenics Corporation
| 9 | Related Party Transactions |
In the normal course of operations, we subcontract certain manufacturing functions to a company owned by a family member of a senior officer, director, and shareholder of the Company. During the three and six months ended June 30, 2019, Hydrogenics made purchases of $nil and $0.1 million (2018 – $nil and $0.2 million) from this related company. At June 30, 2019, the Company had an accounts payable balance due to this related party of $nil (2018 – $nil). We believe that transaction terms with this company are consistent with those we have with unrelated third parties.
The Company holds an equity investment in the joint venture 2562961 Ontario Ltd. related to the 2.5MW Power-to-Gas energy storage project with Enbridge Gas Distribution. During the three and six months ended June 30, 2019, the Company had sales to the joint venture of $nil and $0.1 million (2018 – $nil and $nil) and at the end of June 30, 2019, the Company had a net receivable of less than $0.1 million (2018 - $nil) from the joint venture.
The Company sold its 49% interest in the joint venture to Kolon Water & Energy Co. Ltd. for a nominal value of $1 and terminated the joint arrangement effective May 2, 2019. The Company has no further obligations regarding this joint venture.
| 10 | Critical Accounting Estimates |
The Company’s management make judgments in its process of applying the Company’s accounting policies in the preparation of its consolidated financial statements. The preparation of financial information requires that the we make assumptions and estimates of effects of uncertain future events on the carrying amounts of the Company’s assets and liabilities at the end of the reporting period and the reported amounts of revenue and expenses during the reporting period. Actual results will differ from those estimates as the estimation process is inherently uncertain. Estimates are reviewed on an ongoing basis based on historical experience and other factors that are considered to be relevant under the circumstances. Revisions to estimates and the resulting effects on the carrying amounts of the Company’s assets and liabilities are accounted for prospectively.
The critical judgments, estimates and assumptions applied in the preparation of Company’s financial information are reflected in Note 4 of the Company’s 2018 annual audited consolidated financial statements. The impact on critical judgments, estimates and assumptions as a result of the implementation of IFRS 16 – Leases is reflected in Note 4 of the Company’s First Quarter 2019 Condensed Interim Consolidated Financial Statements.
| 11 | Changes in Accounting Policies and Recent Accounting Pronouncements |
As described in note 4 to our First Quarter 2019 Condensed Interim Consolidated Financial Statements, the Company has adopted IFRS 16 – Leases from January 1, 2019 using modified retrospective method as permitted under the transitional provisions in the standard. On adoption of IFRS 16, the Company recognized lease liabilities in relation to leases which had previously been classified as ‘operating leases’ under the principles of IAS 17 Leases. These liabilities were measured at the present value of the remaining lease payments, discounted using the Company’s incremental borrowing rate as of January 1, 2019. The weighted average lessee’s incremental borrowing rate applied to the lease liabilities on January 1, 2019 was 4.7%. The right-of-use assets were measured at the amount equal to the lease liability adjusted by the amount of previously recognized prepaid lease payments of $40 relating to these leases. There were no onerous lease contracts that would have required an adjustment to the right-of-use assets at the date of initial application. The reclassifications and the adjustments arising from the new leasing rules are therefore recognized in the opening balance sheet on January 1, 2019.
| Second Quarter 2019 Management’s Discussion and Analysis | Page 16 |
Hydrogenics Corporation
The following tables show the impact of IFRS 16 adoption in the condensed interim consolidated balance sheet and statements of operations and comprehensive loss:
| Three months ended |
Six months ended |
|||||||
| June 30, 2019 | ||||||||
| Depreciation expense for right-of-use assets: | ||||||||
| Properties | $ | 157 | $ | 307 | ||||
| Equipment | 8 | 15 | ||||||
| Automobiles | 53 | 105 | ||||||
| Total depreciation expense for right-of-use assets | 218 | 427 | ||||||
| Interest expense on lease liabilities | 57 | 101 | ||||||
| Expense relating to variable lease payments not included in the measurement of lease liabilities | 38 | 76 | ||||||
| Expense relating to short-term leases not included in the measurement of lease liabilities | 11 | 51 | ||||||
| Expense relating to low-value leases not included in the measurement of lease liabilities | 2 | 3 | ||||||
| Total expense | $ | 326 | $ | 658 | ||||
Lease liabilities recognized as follows:
| June 30, | January 1, | |||||||
| 2019 | 2019 | |||||||
| Current lease liabilities | $ | 721 | $ | 887 | ||||
| Non-current lease liabilities | 2,774 | 2,817 | ||||||
| Total lease liabilities | $ | 3,495 | $ | 3,704 |
The recognized right-of-use assets relate to the following types of assets:
| June 30, | January 1, | |||||||
| 2019 | 2019 | |||||||
| Properties | $ | 2,840 | $ | 2,964 | ||||
| Equipment | 115 | 129 | ||||||
| Automobiles | 566 | 651 | ||||||
| Total right-of-use assets | $ | 3,521 | $ | 3,744 |
| 12 | Disclosure Controls |
We have established disclosure controls and procedures that are designed to ensure that the information required to be disclosed by the Company in the reports that it files or submits under Canadian and US securities legislation is recorded, processed, summarized, and reported within the time periods specified in such rules and forms and that such information is accumulated and communicated to management, including our principal executive officer and principal financial officer (who are our CEO (“Chief Executive Officer”) and CFO (“Chief Financial Officer”), respectively) as appropriate to allow timely decisions regarding required disclosure. In designing and evaluating our disclosure controls and procedures, management recognized that disclosure controls and procedures can provide only reasonable, not absolute, assurance that the objectives of the disclosure controls and procedures are met.
We have assessed and effected the necessary change to our current disclosure controls and procedures to reflect the impact of adopting IFRS 16 – Leases. Specifically, we have eliminated the option of operating lease accounting.
Our management, including our CEO and CFO, evaluated the effectiveness of our disclosure controls and procedures. Based on this evaluation and as described below under "Internal Control over Financial Reporting", our CEO and CFO concluded that our disclosure controls and procedures were effective as of June 30, 2019.
| Second Quarter 2019 Management’s Discussion and Analysis | Page 17 |
Hydrogenics Corporation
| 13 | Internal Control over Financial Reporting |
Our management is responsible for establishing and maintaining adequate internal control over financial reporting. Internal control over financial reporting is a process designed by, or under the supervision of, the CEO and the CFO and effected by the Board of Directors, management and other personnel to provide reasonable assurance regarding the reliability of financial reporting and the preparation of consolidated financial statements for external purposes in accordance with IFRS.
Our management, including our CEO and CFO, believes that any disclosure controls and procedures or internal control over financial reporting, no matter how well conceived and operated, can provide only reasonable, not absolute, assurance that the objectives of the control system are met. Further, the design of a control system must reflect the fact that there are resource constraints, and the benefits of controls must be considered relative to their costs. Because of the inherent limitations in all control systems, they cannot provide absolute assurance that all control issues and instances of fraud, if any, have been prevented or detected. These inherent limitations include the realities that judgments in decision-making can be faulty, and that breakdowns can occur because of a simple error or mistake. Additionally, controls can be circumvented by the individual acts of some persons, by collusion of two or more people, or by unauthorized override of the control. The design of any system of controls is based in part on certain assumptions about the likelihood of future events, and there can be no assurance that any design will succeed in achieving its stated goals under all potential future conditions. Accordingly, because of the inherent limitations in a cost-effective control system, misstatements due to error or fraud might occur and not be detected.
Management assessed the effectiveness of the Company’s internal control over financial reporting at June 30, 2019, based on the criteria set forth in Internal Control – Integrated Framework issued by the Committee of Sponsoring Organizations of the Treadway Commission as published in 2013. Based on this evaluation, management believes, at June 30, 2019, the Corporation’s internal control over financial reporting is effective. Also, management determined there were no material weaknesses in the Corporation’s internal control over financial reporting at June 30, 2019.
The effectiveness of the Company's internal control over financial reporting as of December 31, 2018, has been audited by PricewaterhouseCoopers LLP, an independent registered public accounting firm, as stated in their report, which is included in the Company’s annual audited financial statements.
| 14 | Reconciliation of Non-IFRS Measures |
Non-IFRS financial measures, including earnings before interest, taxes, depreciation and amortization (“EBITDA”), “Adjusted EBITDA” and “cash operating costs” are used by management to provide additional insight into our performance and financial condition. We believe these non-IFRS measures are an important part of the financial reporting process and are useful in communicating information that complements and supplements the consolidated financial statements.
Adjusted Earnings Before Interest, Taxes, Depreciation and Amortization
We believe Adjusted EBITDA assists investors in comparing a company’s performance on a consistent basis excluding depreciation and amortization, stock-based compensation, including both share settled PSUs and stock options, equity settled restricted share units (“RSUs”) and cash settled deferred share units (“DSUs”), which are non-cash in nature and can vary significantly due to stock price fluctuations. We believe that removing these expenses is a better measurement of operational performance. Investors should be cautioned that Adjusted EBITDA, as reported by us, may not be comparable in all instances to Adjusted EBITDA, as reported by other companies. As described in Section 11, upon the adoption of IFRS 16 – Leases on January 1, 2019, operating lease payments are no longer reflected as a charge against net income and are excluded from Adjusted EBITDA.
| Second Quarter 2019 Management’s Discussion and Analysis | Page 18 |
Hydrogenics Corporation
The following table provides a reconciliation of Adjusted EBITDA with net loss:
| Three months ended June 30, | Six months ended June 30, | |||||||||||||||
| 2019 | 2018 | 2019 | 2018 | |||||||||||||
| Net loss | $ | (4,766 | ) | $ | (4,801 | ) | $ | (7,413 | ) | $ | (6,755 | ) | ||||
| Loss (gain) from joint ventures | (21 | ) | 1,492 | (26 | ) | 1,561 | ||||||||||
| Finance loss (income), net | (31 | ) | 506 | 580 | 412 | |||||||||||
| Income tax expense | – | – | – | 300 | ||||||||||||
| Amortization and depreciation | 417 | 175 | 797 | 352 | ||||||||||||
| DSUs expense (recovery) | 971 | (62 | ) | 1,433 | (388 | ) | ||||||||||
| Stock-based compensation expense | 151 | 243 | 387 | 465 | ||||||||||||
| Adjusted EBITDA | $ | (3,279 | ) | $ | (2,447 | ) | $ | (4,242 | ) | $ | (4,053 | ) | ||||
Cash Operating Costs
We report cash operating costs because management feels they are a key measurement of the normal operating costs required to operate the ongoing business units of the Company. Cash operating costs are regularly reported to the chief operating decision maker and correspond to the definition used in our historical quarterly discussions. Investors should be cautioned that cash operating costs as reported by us may not be comparable in all instances to cash operating costs as reported by other companies. As described in Section 11, upon the adoption of IFRS 16 – Leases on January 1, 2019, operating lease payments are no longer reflected as a charge against selling, general and administrative expenses and are excluded from cash operating costs.
The following table provides a reconciliation of cash operating costs with total operating expenses consisting of SG&A and R&D expenses:
| Three months ended June 30 | Six months ended June 30, | |||||||||||||||
| 2019 | 2018 | 2019 | 2018 | |||||||||||||
| Selling, general and administrative expenses | $ | 4,476 | $ | 3,024 | $ | 8,583 | $ | 5,860 | ||||||||
| Research and product development expenses | 1,695 | 1,880 | 3,504 | 3,961 | ||||||||||||
| Total operating costs | $ | 6,171 | $ | 4,904 | $ | 12,087 | $ | 9,821 | ||||||||
| Less: Amortization and depreciation | (366 | ) | (89 | ) | (599 | ) | (192 | ) | ||||||||
| Less: loss on disposal of assets | (2 | ) | (3 | ) | (4 | ) | (6 | ) | ||||||||
| Less: DSUs recovery (expense) | (971 | ) | 62 | (1,433 | ) | 388 | ||||||||||
| Less: Stock-based compensation expense | (151 | ) | (243 | ) | (387 | ) | (465 | ) | ||||||||
| Cash operating costs | $ | 4,681 | $ | 4,631 | $ | 9,664 | $ | 9,546 | ||||||||
| Second Quarter 2019 Management’s Discussion and Analysis | Page 19 |
Hydrogenics Corporation
| 15 | Risk Factors |
An investment in our common shares involves risk. Investors should carefully consider the risks and uncertainties described below and in our Annual Information Form. The risks and uncertainties described below and in our Annual Information Form are not the only ones we face. Additional risks and uncertainties, including those that we do not know about now or that we currently deem immaterial, may also adversely affect our business. For a more complete discussion of the risks and uncertainties which apply to our business and our operating results (which are summarized below), please see our Annual Information Form and other filings with Canadian (www.sedar.com) and U.S. securities regulatory authorities (www.sec.gov/edgar.shtml).
Our business entails risks and uncertainties that affect our outlook and eventual results of our business and commercialization plans. The primary risks relate to meeting our product development and commercialization milestones, which require that our products exhibit the functionality, cost and performance required to be commercially viable against competing technologies and that we have sufficient access to capital to fund these activities. Another primary risk is that key markets for certain of our products may never develop, or that market acceptance might take longer to develop than anticipated – in particular for applications such as energy storage which require leadership at a government and regulatory level.
A summary of our identified risks and uncertainties are as follows:
Risk Factors Related to Our Financial Condition
| · | Our inability to generate sufficient cash flows, raise additional capital and actively manage our liquidity may impair our ability to execute our business plan, and result in our reducing or eliminating product development and commercialization efforts, reducing our sales and marketing efforts, and having to forego attractive business opportunities. There are uncertainties related to the timing and use of our cash resources and working capital requirements. These uncertainties include, among other things, the timing and volume of commercial sales and associated gross margins of our existing products and the development of markets for, and customer acceptance of new products. |
| · | We may not be able to implement our business strategy and the price of our common shares may decline. |
| · | The uncertain and unpredictable condition of the global economy could have a negative impact on our business, results of operations and consolidated financial condition, or our ability to accurately forecast our results, and it may cause a number of the risks that we currently face to increase in likelihood, magnitude and duration. |
| · | Our operating results may be subject to currency fluctuation. |
| · | Our mix of revenues in the recent past does not reflect our current business strategy, it may be difficult to assess our business and future prospects. |
| · | Our quarterly operating results are likely to fluctuate significantly and may fail to meet the expectations of securities analysts and investors and may cause the price of our common shares to decline. |
| · | We currently depend on a relatively limited number of customers for a majority of our revenues and a decrease in revenue from these customers could materially adversely affect our business, consolidated financial condition and results of operations. |
| · | Our insurance may not be sufficient. |
| · | Certain external factors may affect the value of goodwill, which may require us to recognize an impairment charge. |
Risk Factors Related to Our Business and Industry
| · | Significant markets for fuel cell and other hydrogen energy products may never develop or may develop more slowly than we anticipate. This would significantly harm our revenues and may cause us to be unable to recover the losses we have incurred and expect to incur in the development of our products. |
| · | Hydrogen may not be readily available on a cost-effective basis, in which case our fuel cell products may be unable to compete with existing power sources and our revenues and results of operations would be materially adversely affected. |
| · | Changes in government policies and regulations could hurt the market for our products. |
| · | Lack of new government policies and regulations for the energy storage technologies could hurt the development of the Power-to-Gas market for our hydrogen energy storage products. |
| · | The development of uniform codes and standards for hydrogen powered vehicles and related hydrogen refueling infrastructure may not develop in a timely fashion, if at all. |
| · | We could be liable for environmental damages resulting from our research, development or manufacturing operations. |
| Second Quarter 2019 Management’s Discussion and Analysis | Page 20 |
Hydrogenics Corporation
| · | We currently face and will continue to face significant competition from other developers and manufacturers of fuel cell power products and hydrogen generation systems. If we are unable to compete successfully, we could experience a loss of market share, reduced gross margins for our existing products and a failure to achieve acceptance of our proposed products. |
| · | We face competition for fuel cell power products from developers and manufacturers of traditional technologies and other alternative technologies. |
| · | Our strategy for the sale of fuel cell power products depends on developing partnerships with OEMs, governments, systems integrators, suppliers and other market channel partners who will incorporate our products into theirs. |
| · | We are dependent on third party suppliers for key materials and components for our products. If these suppliers become unable or unwilling to provide us with sufficient materials and components on a timely and cost-effective basis, we may be unable to manufacture our products cost-effectively or at all, and our revenues and gross margins would suffer. |
| · | We may not be able to manage successfully the anticipated expansion of our operations. |
| · | If we do not properly manage foreign sales and operations, our business could suffer. |
| · | We will need to recruit, train and retain key management and other qualified personnel to successfully expand our business. |
| · | We may acquire technologies or companies in the future, and these acquisitions could disrupt our business and dilute our shareholders’ interests. |
| · | We have no experience manufacturing our fuel cell products on a large-scale basis and if we do not develop adequate manufacturing processes and capabilities to do so in a timely manner, we will be unable to achieve our growth and profitability objectives. |
Risk Factors Related to Our Products and Technology
| · | We may never complete the development of commercially viable fuel cell power products and/or commercially viable hydrogen generation systems for new hydrogen energy applications, and if we fail to do so, we will not be able to meet our business and growth objectives. |
| · | We must lower the cost of our fuel cell and hydrogen generation products and demonstrate their reliability or consumers will be unlikely to purchase our products and we will therefore not generate sufficient revenues to achieve and sustain profitability. |
| · | Any failures or delays in field tests of our products could negatively affect our customer relationships and increase our manufacturing costs. |
| · | The components of our products may contain defects or errors that could negatively affect our customer relationships and increase our development, service and warranty costs. |
| · | Rapid technological advances or the adoption of new codes and standards could impair our ability to deliver our products in a timely manner and, as a result, our revenues would suffer. |
| · | We depend on intellectual property and our failure to protect that intellectual property could adversely affect our future growth and success. |
| · | Our products use flammable fuels that are inherently dangerous substances and could subject us to product liabilities. |
| · | We may experience cybersecurity threats to our information technology infrastructure and systems, and unauthorized attempts to gain access to our proprietary or confidential information, as may our customers, suppliers, subcontractors and joint venture partners. |
Risk Factors Related to Ownership of Our Common Shares
| · | If at any time we are classified as a passive foreign investment company under United State tax laws, our US shareholders may be subject to adverse tax consequences. |
| · | If we fail to maintain the requirements for continued listing on Nasdaq, our common shares could be delisted from trading on Nasdaq, which would materially adversely affect the liquidity of our common shares, the price of our common shares, and our ability to raise additional capital. | |
| · | If the contemplated sale of the Company is approved by the required majority of shareholders, all shareholders will be required to sell their common shares. |
| · | US investors may not be able to enforce US civil liability judgments against us or our directors and officers. |
| · | Our share price is volatile and we may continue to experience significant share price and volume fluctuations. |
| · | Our issuance of warrants, options, RSUs and PSUs to investors and employees may have a negative effect on the trading prices of our common stock as well as a dilutive effect. |
| Second Quarter 2019 Management’s Discussion and Analysis | Page 21 |
Hydrogenics Corporation
| 16 | Outstanding Share Data |
The authorized share capital of the Company consists of an unlimited number of common shares, with no par value, and an unlimited number of preferred shares in series, with no par value. We had 15,441,183 common shares outstanding at June 30, 2019.
| 2019 | 2018 | |||||||||||||||
| Number | Amount | Number | Amount | |||||||||||||
| Balance at January 1, | 15,447,483 | $ | 387,911 | 15,436,879 | $ | 387,746 | ||||||||||
| Issuance of common shares | 3,537,931 | 20,259 | – | – | ||||||||||||
| Issuance of common shares on exercise of stock options | 23,912 | 214 | 100 | 1 | ||||||||||||
| Issuance of common shares on exercise of restricted share units | 8,865 | 72 | – | – | ||||||||||||
| Issuance of common shares on vesting of performance share units | – | – | 4,204 | 96 | ||||||||||||
| At June 30, | 19,018,191 | $ | 408,456 | 15,441,183 | $ | 387,843 | ||||||||||
At June 30, 2019, there were 823,893 stock options and 178,217 RSUs outstanding to purchase or vest into our common shares. If these securities are exercised, our shareholders could incur dilution.
| 17 | Forward-looking Statements |
This MD&A constitutes “forward-looking information,” within the meaning of applicable Canadian securities laws and “forward-looking statements” within the meaning of the United States Private Securities Litigation Reform Act of 1995 (collectively referred to herein as “forward-looking statements”). Forward-looking statements can be identified by the use of words, such as “plans,” “expects,” or “is expected,” “budget,” “scheduled,” “estimates,” “forecasts,” “intends,” “anticipates,” or “believes” or variations of such words and phrases or state that certain actions, events or results “may,” “could,” “would,” “might” or “will” be taken, occur or be achieved. These forward-looking statements relate to, among other things, our future results, levels of activity, performance, goals or achievements or other future events. These forward-looking statements are based on current expectations and various assumptions and analyses made by us in light of our experience and our perceptions of historical trends, current conditions and expected future developments and other factors that we believe are appropriate in the circumstances. These forward-looking statements involve known and unknown risks, uncertainties and other factors that may cause actual results or events to differ materially from those anticipated in our forward-looking statements.
These risks, uncertainties and factors include, but are not limited to: our inability to execute our business plan, or to grow our business; inability to address a slow return to economic growth, and its impact on our business, results of operations and consolidated financial condition; our limited operating history; inability to implement our business strategy; fluctuations in our quarterly results; failure to maintain our customer base that generates the majority of our revenues; currency fluctuations; failure to maintain sufficient insurance coverage; changes in value of our goodwill; failure of a significant market to develop for our products; failure of hydrogen being readily available on a cost-effective basis; changes in government policies and regulations; lack of new government policies and regulations for the energy storage technologies; failure of uniform codes and standards for hydrogen fueled vehicles and related infrastructure to develop; liability for environmental damages resulting from our research, development or manufacturing operations; failure to compete with other developers and manufacturers of products in our industry; failure to compete with developers and manufacturers of traditional and alternative technologies; failure to develop partnerships with original equipment manufacturers, governments, systems integrators and other third parties; inability to obtain sufficient materials and components for our products from suppliers; failure to manage expansion of our operations; failure to manage foreign sales and operations; failure to recruit, train and retain key management personnel; inability to integrate acquisitions; failure to develop adequate manufacturing processes and capabilities; failure to complete the development of commercially viable products; failure to produce cost-competitive products; failure or delay in field testing of our products; failure to produce products free of defects or errors; inability to adapt to technological advances or new codes and standards; failure to protect our intellectual property; our involvement in intellectual property litigation; exposure to product liability claims; failure to meet rules regarding passive foreign investment companies; actions of our significant and principal shareholders; failure to maintain the requirements for continued listing on NASDAQ; dilution as a result of significant issuances of our common shares and preferred shares; inability of US investors to enforce US civil liability judgments against us; volatility of our common share price; and dilution as a result of the exercise of options.
| Second Quarter 2019 Management’s Discussion and Analysis | Page 22 |
Hydrogenics Corporation
Risks and uncertainties that may cause differences related to the contemplated sale of the Company include but are not limited to: the risk that the sale transaction may not be completed on a timely basis, if at all; the conditions to the consummation of the sale transaction may not be satisfied; the risk that the sale transaction may involve unexpected costs, liabilities or delays; the risk that, prior to the completion of the sale transaction, the company’s business may experience significant disruptions, including loss of clients or employees, due to transaction-related uncertainty or other factors; a possibility that legal proceedings may be instituted against the company and or others relating to the sale transaction and the outcome of such proceedings; a possible occurrence of an event, change or other circumstances that could result in termination of the sale transaction; risks related to the diversion of management’s attention from the company’s ongoing business operations; risks relating to the failure to obtain necessary regulatory approvals; risks related to the company’s strategy going forward, risks related to the failure to satisfy the conditions to complete the sale transaction; and other risks inherent in the industry. Failure to obtain the requisite approvals, or the failure of the parties to otherwise satisfy the conditions to or complete the sale transaction, may result in the sale transaction not being completed on the proposed terms, or at all. In addition, if the sale transaction is not completed, and the company continues in its current form, the Announcement of the sale transaction and the dedication of substantial of the company’s resources to the completion of the sale transaction could have a material adverse affect on the company’s share price, it’s current business relationships and on the current and future operations, financial condition and prospects of the company.
These factors may cause the Company’s actual performance and financial results in future periods to differ materially from any estimates or projections of future performance or results expressed or implied by such forward-looking statements. Forward-looking statements do not take into account the effect that transactions or non-recurring or other special items announced or occurring after the statements are made have on the Company’s business. For example, they do not include the effect of business dispositions, acquisitions, other business transactions, asset write-downs or other charges announced or occurring after forward-looking statements are made. The financial impact of such transactions and non-recurring and other special items can be complex and necessarily depends on the facts particular to each of them.
We believe the expectations represented by our forward-looking statements are reasonable, yet there can be no assurance that such expectations will prove to be correct. The purpose of the forward-looking statements is to provide the reader with a description of management’s expectations regarding the Company’s fiscal 2019 financial performance and may not be appropriate for other purposes. Furthermore, unless otherwise stated, the forward-looking statements contained in this report are made as of the date of this report and we do not undertake any obligation to update publicly or to revise any of the included forward-looking statements, whether as a result of new information, future events or otherwise unless required by applicable legislation or regulation. The forward-looking statements contained in this report are expressly qualified by this cautionary statement.
| Second Quarter 2019 Management’s Discussion and Analysis | Page 23 |
EXHIBIT 99.3
![]()
Hydrogenics Corporation
Second Quarter 2019
Condensed Interim Consolidated Financial Statements
| 2019 Q2 Condensed Interim Consolidated Financial Statements | Page 1 |
| Hydrogenics Corporation |
Hydrogenics Corporation
Condensed Interim Consolidated Balance Sheets
(in thousands of US dollars)
(unaudited)
| June 30, | December 31, | |||||||||
| Note | 2019 | 2018 | ||||||||
| Assets | ||||||||||
| Current assets | ||||||||||
| Cash and cash equivalents | $ | 16,741 | $ | 7,561 | ||||||
| Restricted cash | 769 | 935 | ||||||||
| Trade and other receivables | 5 | 8,022 | 6,728 | |||||||
| Contract assets | 6 | 3,789 | 4,534 | |||||||
| Inventories | 18,940 | 17,174 | ||||||||
| Prepaid expenses | 7 | 2,008 | 1,960 | |||||||
| 50,269 | 38,892 | |||||||||
| Non-current assets | ||||||||||
| Restricted cash | 225 | 241 | ||||||||
| Contract assets | 6 | 2,795 | 1,689 | |||||||
| Investment in joint ventures | 8 | 1,731 | 1,644 | |||||||
| Right-of-use assets | 4 | 3,521 | – | |||||||
| Property, plant and equipment | 2,846 | 2,867 | ||||||||
| Intangible assets | 200 | 232 | ||||||||
| Goodwill | 4,332 | 4,359 | ||||||||
| 15,650 | 11,032 | |||||||||
| Total assets | $ | 65,919 | $ | 49,924 | ||||||
| Liabilities | ||||||||||
| Current liabilities | ||||||||||
| Trade and other payables | $ | 8,628 | $ | 9,068 | ||||||
| Contract liabilities | 6 | 13,870 | 14,581 | |||||||
| Financial liabilities | 9 | 6,121 | 3,359 | |||||||
| Provisions | 10 | 1,867 | 2,041 | |||||||
| Deferred funding | 1,888 | 1,744 | ||||||||
| 32,374 | 30,793 | |||||||||
| Non-current liabilities | ||||||||||
| Other liabilities | 12 | 7,632 | 5,711 | |||||||
| Contract liabilities | 6 | 642 | 1,420 | |||||||
| Provisions | 10 | 799 | 810 | |||||||
| Deferred funding | 179 | 229 | ||||||||
| 9,252 | 8,170 | |||||||||
| Total liabilities | 41,626 | 38,963 | ||||||||
| Share capital | 13 | 408,456 | 387,911 | |||||||
| Contributed surplus | 20,940 | 20,717 | ||||||||
| Accumulated other comprehensive loss | (2,704 | ) | (2,681 | ) | ||||||
| Deficit | (402,399 | ) | (394,986 | ) | ||||||
| Total equity | 24,293 | 10,961 | ||||||||
| Total equity and liabilities | $ | 65,919 | $ | 49,924 |
Guarantees and Contingencies (notes 11 and 21)
 |
 |
|
Douglas S. Alexander Chair |
David C. Ferguson Director |
The accompanying notes form an integral part of these consolidated financial statements.
| 2019 Q2 Condensed Interim Consolidated Financial Statements | Page 2 |
| Hydrogenics Corporation |
Hydrogenics Corporation
Condensed Interim Consolidated Statements of Operations and Comprehensive Loss
(in thousands of US dollars, except share and per share amounts)
(unaudited)
| Three months ended June 30, | Six months ended June 30, | |||||||||||||||||
| Note | 2019 | 2018 | 2019 | 2018 | ||||||||||||||
| Revenues | $ | 10,455 | $ | 7,609 | $ | 18,539 | $ | 15,756 | ||||||||||
| Cost of sales | 9,102 | 5,508 | 13,311 | 10,417 | ||||||||||||||
| Gross profit | 1,353 | 2,101 | 5,228 | 5,339 | ||||||||||||||
| Operating expenses | ||||||||||||||||||
| Selling, general and administrative expenses | 4,476 | 3,024 | 8,583 | 5,860 | ||||||||||||||
| Research and product development expenses | 15 | 1,695 | 1,880 | 3,504 | 3,961 | |||||||||||||
| 6,171 | 4,904 | 12,087 | 9,821 | |||||||||||||||
| Loss from operations | (4,818 | ) | (2,803 | ) | (6,859 | ) | (4,482 | ) | ||||||||||
| Gains (losses) from joint ventures | 8 | 21 | (1,492 | ) | 26 | (1,561 | ) | |||||||||||
| Finance income (loss) | ||||||||||||||||||
| Interest expense, net | (288 | ) | (372 | ) | (572 | ) | (753 | ) | ||||||||||
| Foreign currency gains (losses), net(1) | 182 | (177 | ) | (19 | ) | 42 | ||||||||||||
| Other finance gains, net | 16 | 137 | 43 | 11 | 299 | |||||||||||||
| Finance income (loss), net | 31 | (506 | ) | (580 | ) | (412 | ) | |||||||||||
| Loss before income taxes | (4,766 | ) | (4,801 | ) | (7,413 | ) | (6,455 | ) | ||||||||||
| Income tax expense | 17 | – | – | – | 300 | |||||||||||||
| Net loss for the period | (4,766 | ) | (4,801 | ) | (7,413 | ) | (6,755 | ) | ||||||||||
| Items that may be reclassified subsequently to net loss: | ||||||||||||||||||
| Exchange differences on translating foreign operations | 157 | (887 | ) | (23 | ) | (558 | ) | |||||||||||
| Comprehensive loss for the period | $ | (4,609 | ) | $ | (5,688 | ) | $ | (7,436 | ) | $ | (7,313 | ) | ||||||
| Net loss per share - basic and diluted | 18 | $ | (0.25 | ) | $ | (0.31 | ) | $ | (0.40 | ) | $ | (0.44 | ) | |||||
| Weighted average number of common shares outstanding, basic and diluted | 18 | 18,999,286 | 15,440,888 | 18,542,928 | 15,438,894 | |||||||||||||
| (1) | For the three and six months ended June 30, 2019, respectively a loss of $49 and $91 (2018 – a gain of $62 and $143) relates to foreign exchange on borrowings. |
The accompanying notes form an integral part of these consolidated financial statements.
| 2019 Q2 Condensed Interim Consolidated Financial Statements | Page 3 |
| Hydrogenics Corporation |
Hydrogenics Corporation
Condensed Interim Consolidated Statements of Changes in Equity
(in thousands of US dollars, except share and per share amounts)
(unaudited)
| Accumulated | ||||||||||||||||||||||||||
| other | ||||||||||||||||||||||||||
| Common shares | Contributed | comprehensive | Total | |||||||||||||||||||||||
| Note | Number | Amount | surplus | Deficit | loss(1) | equity | ||||||||||||||||||||
| Balance at December 31, 2018 | 15,447,483 | $ | 387,911 | $ | 20,717 | $ | (394,986 | ) | $ | (2,681 | ) | $ | 10,961 | |||||||||||||
| Net loss | – | – | – | (7,413 | ) | – | (7,413 | ) | ||||||||||||||||||
| Other comprehensive loss | – | – | – | – | (23 | ) | (23 | ) | ||||||||||||||||||
| Total comprehensive loss | – | – | – | (7,413 | ) | (23 | ) | (7,436 | ) | |||||||||||||||||
| Issuance of common shares | 13 | 3,537,931 | 20,259 | – | – | – | 20,259 | |||||||||||||||||||
| Issuance of common shares on exercise of stock options | 13 | 23,912 | 214 | (92 | ) | – | – | 122 | ||||||||||||||||||
| Issuance of common shares on exercise of restricted share units | 13 | 8,865 | 72 | (72 | ) | – | – | – | ||||||||||||||||||
| Stock-based compensation expense | 14 | – | – | 387 | – | – | 387 | |||||||||||||||||||
| Balance at June 30, 2019 | 19,018,191 | $ | 408,456 | $ | 20,940 | $ | (402,399 | ) | $ | (2,704 | ) | $ | 24,293 | |||||||||||||
| Accumulated | ||||||||||||||||||||||||||
| other | ||||||||||||||||||||||||||
| Common shares | Contributed | comprehensive | Total | |||||||||||||||||||||||
| Note | Number | Amount | surplus | Deficit | loss(1) | equity | ||||||||||||||||||||
| Balance at December 31, 2017 | 15,436,879 | $ | 387,746 | $ | 19,885 | $ | (381,647 | ) | $ | (1,811 | ) | $ | 24,173 | |||||||||||||
| Net loss | – | – | – | (6,755 | ) | – | (6,755 | ) | ||||||||||||||||||
| Other comprehensive loss | – | – | – | – | (558 | ) | (558 | ) | ||||||||||||||||||
| Total comprehensive loss | – | – | – | (6,755 | ) | (558 | ) | (7,313 | ) | |||||||||||||||||
| Issuance of common shares on vesting of performance share units | 13 | 4,204 | 96 | (96 | ) | – | – | – | ||||||||||||||||||
| Issuance of common shares on exercise of stock options | 13 | 100 | 1 | (1 | ) | – | – | – | ||||||||||||||||||
| Stock-based compensation expense | 14 | – | – | 465 | – | – | 465 | |||||||||||||||||||
| Balance at June 30, 2018 | 15,441,183 | $ | 387,843 | $ | 20,253 | $ | (388,402 | ) | $ | (2,369 | ) | $ | 17,325 | |||||||||||||
| (1) | Accumulated other comprehensive loss represents currency translation adjustments of $2,458 as of June 30, 2019, (June 30, 2018 – ($2,054)), and loss on remeasurement of actuarial liability of $246 as of June 30, 2019 (June 30, 2018 – $315). |
The accompanying notes form an integral part of these consolidated financial statements.
| 2019 Q2 Condensed Interim Consolidated Financial Statements | Page 4 |
| Hydrogenics Corporation |
Hydrogenics Corporation
Condensed Interim Consolidated Statements of Cash Flows
(in thousands of US dollars)
(unaudited)
| Three months ended June 30, | Six months ended June 30, | |||||||||||||||||
| Note | 2019 | 2018 | 2019 | 2018 | ||||||||||||||
| Cash and cash equivalents provided by (used in): | ||||||||||||||||||
| Operating activities | ||||||||||||||||||
| Net loss for the period | $ | (4,766 | ) | $ | (4,801 | ) | $ | (7,413 | ) | $ | (6,755 | ) | ||||||
| Decrease (increase) in restricted cash | (145 | ) | (266 | ) | 178 | (279 | ) | |||||||||||
| Items not affecting cash: | ||||||||||||||||||
| Loss on disposal of property, plant and equipment | 2 | 3 | 4 | 6 | ||||||||||||||
| Amortization and depreciation | 417 | 175 | 797 | 352 | ||||||||||||||
| Gain from change in fair value of warrants | (137 | ) | (70 | ) | (11 | ) | (356 | ) | ||||||||||
| Unrealized foreign exchange loss (gain) | 89 | (179 | ) | 119 | (203 | ) | ||||||||||||
| Losses (gains) from joint ventures | (21 | ) | 1,492 | (26 | ) | 1,561 | ||||||||||||
| Accreted interest and fair value adjustment | 254 | 413 | 614 | 857 | ||||||||||||||
| Stock-based compensation | 14 | 151 | 243 | 387 | 465 | |||||||||||||
| Stock-based compensation – DSUs | 14 | 971 | (62 | ) | 1,433 | (388 | ) | |||||||||||
| Net change in non-cash operating assets and liabilities | 20 | (507 | ) | (1,416 | ) | (4,687 | ) | (859 | ) | |||||||||
| Cash used in operating activities | (3,692 | ) | (4,468 | ) | (8,605 | ) | (5,599 | ) | ||||||||||
| Investing activities | ||||||||||||||||||
| Purchase of property, plant and equipment | (148 | ) | (101 | ) | (332 | ) | (335 | ) | ||||||||||
| Receipt (repayment) of government funding | 15 | – | 974 | (974 | ) | 974 | ||||||||||||
| Purchase of intangible assets | (2 | ) | (1 | ) | (10 | ) | (1 | ) | ||||||||||
| Cash provided by (used in) investing activities | (150 | ) | 872 | (1,316 | ) | 638 | ||||||||||||
| Financing activities | ||||||||||||||||||
| Proceeds from common shares issued and stock options exercised, net of issuance costs | 21 | 1 | 20,381 | 1 | ||||||||||||||
| Principal repayments of long-term debt | (500 | ) | (500 | ) | (500 | ) | (750 | ) | ||||||||||
| Interest payments | (286 | ) | (286 | ) | (330 | ) | (582 | ) | ||||||||||
| Lease payments | 4 | (199 | ) | – | (379 | ) | – | |||||||||||
| Repayment of operating borrowings | – | – | – | (1,193 | ) | |||||||||||||
| Cash provided by (used in) financing activities | (964 | ) | (785 | ) | 19,172 | (2,524 | ) | |||||||||||
| Increase (decrease) in cash and cash equivalents during the period | (4,806 | ) | (4,381 | ) | 9,251 | (7,485 | ) | |||||||||||
| Cash and cash equivalents – Beginning of period | 21,531 | 18,482 | 7,561 | 21,511 | ||||||||||||||
| Effect of exchange rate fluctuations on cash and cash equivalents held | 16 | (254 | ) | (71 | ) | (179 | ) | |||||||||||
| Cash and cash equivalents – End of period | $ | 16,741 | $ | 13,847 | $ | 16,741 | $ | 13,847 | ||||||||||
The accompanying notes form an integral part of these consolidated financial statements.
| 2019 Q2 Condensed Interim Consolidated Financial Statements | Page 5 |
| Hydrogenics Corporation |
| Hydrogenics Corporation |
| Notes to Condensed Interim Consolidated Financial Statements |
| For the six months ended June 30, 2019 |
| (in thousands of US dollars, except share and per share amounts) |
| (unaudited) |
Note 1 – Description of Business
Hydrogenics Corporation and its subsidiaries (“Hydrogenics” or the “Corporation” or the “Company”) design, develop and manufacture hydrogen generation products using water electrolysis technology (based on alkaline and proton exchange membrane (“PEM”) electrolyzers), and fuel cell products which convert hydrogen into electricity using PEM technology. The Company has manufacturing plants in Canada and Belgium, satellite facilities in Germany and the United States, and branch offices in Russia and Indonesia. Its products are sold throughout the world.
Hydrogenics is incorporated and domiciled in Canada. The address of the Company’s registered head office is 220 Admiral Boulevard, Mississauga, Ontario, Canada. The Company’s shares trade under the symbol “HYG” on the Toronto Stock Exchange and under the symbol “HYGS” on NASDAQ.
Note 2 – Basis of Preparation
These unaudited condensed interim consolidated financial statements have been prepared in accordance with International Accounting Standard (“IAS”) 34, “Interim financial reporting”. The disclosures contained in these unaudited condensed interim consolidated financial statements do not include all of the requirements of International Financial Reporting Standards (“IFRS”) for annual consolidated financial statements. The condensed interim consolidated financial statements should be read in conjunction with the annual consolidated financial statements for the year ended December 31, 2018, which have been prepared in accordance with IFRS, as issued by the International Accounting Standards Board (“IASB”). The unaudited condensed interim consolidated financial statements are based on accounting policies as described in the 2018 annual consolidated financial statements except that effective January 1, 2019, the Company implemented IFRS 16 Leases (“IFRS 16”). Note 4 explains the impact of the adoption of IFRS 16 on the Company’s financial statements and discloses the new accounting policies that have been applied from January 1, 2019.
On August 9, 2019, the Board of Directors authorized the condensed interim consolidated financial statements for issue.
Note 3 – Accounting Standards Issued But Not Yet Applied
| i. | Amendments to References to the Conceptual Framework in IFRS Standards |
On March 29, 2018 the IASB issued a revised version of its Conceptual Framework for Financial Reporting (“the Framework”) that underpins IFRS Standards. The IASB also issued Amendments to References to the Conceptual Framework in IFRS Standards (“the Amendments”) to update references in IFRS Standards to previous versions of the Conceptual Framework.
Some IFRS Standards include references to the 1989 and 2010 versions of the Framework. The IASB has published a separate document which contains consequential amendments to affected Standards so that they refer to the new Framework, with the exception of IFRS 3 Business Combinations which continues to refer to both the 1989 and 2010 Frameworks.
Both documents are effective from January 1, 2020 with earlier application permitted. The Company does not intend to adopt the Amendments in its financial statements before the annual period beginning on January 1, 2020. The extent of the impact of the change has not yet been determined.
| ii. | Definition of a Business (Amendments to IFRS 3 Business Combinations) |
On October 22, 2018 the IASB issued amendments to IFRS 3 Business Combinations, that seek to clarify whether a transaction results in an asset or a business combination. The amendments include an election to use a concentration test. This is a simplified assessment that results in an asset acquisition if substantially all of the fair value of the gross assets is concentrated in a single identifiable asset or a group of similar identifiable assets. If a preparer chooses not to apply the concentration test, or the test is failed, then the assessment focuses on the existence of a substantive process.
The amendments apply to businesses acquired in annual reporting periods beginning on or after January 1, 2020 with earlier adoption permitted. The Corporation does not intend to adopt the amendments in its financial statements before the annual reporting period beginning on January 1, 2020. The extent of the impact of adoption of the amendments has not yet been determined.
| 2019 Q2 Condensed Interim Consolidated Financial Statements | Page 6 |
| Hydrogenics Corporation |
| Hydrogenics Corporation |
| Notes to Condensed Interim Consolidated Financial Statements |
| For the six months ended June 30, 2019 |
| (in thousands of US dollars, except share and per share amounts) |
| (unaudited) |
| iii. | Definition of Material (Amendments to IAS 1 and IAS 8) |
On October 31, 2018 the IASB refined its definition of material and removed the definition of material omissions or misstatements from IAS 8 (Accounting Policies, Changes in Accounting Estimates and Errors). The definition of material has been aligned across IFRS Standards and the Conceptual Framework for Financial Reporting. The amendments provide a definition and explanatory paragraphs in one place. Pursuant to the amendments, information is material if omitting, misstating or obscuring it could reasonably be expected to influence decisions that the primary users of general purpose financial statements make on the basis of those financial statements, which provide financial information about a specific reporting entity.
The amendments are effective for annual periods beginning on or after January 1, 2020 with earlier adoption permitted. The Company does not intend to adopt the amendments in its financial statements before the annual reporting period beginning on January 1, 2020. The extent of the impact of adoption of the amendments has not yet been determined.
Note 4 – IFRS 16 Leases
| i. | Impact of adoption: |
The Company has adopted IFRS 16 from January 1, 2019 using the modified retrospective method as permitted under the transitional provisions in the standard. The reclassifications and adjustments arising from the new leasing rules are therefore recognized in the opening balance sheet on January 1, 2019.
| a) | Adjustments recognized on adoption of IFRS 16 |
On adoption of IFRS 16, the Company recognized lease liabilities in relation to leases which had previously been classified as ‘operating leases’ under the principles of IAS 17 Leases. These liabilities were measured at the present value of the remaining lease payments, discounted using the Company’s incremental borrowing rate as of January 1, 2019. The weighted average lessee’s incremental borrowing rate applied to the lease liabilities on January 1, 2019 was 4.7%. The remeasurements to the lease liabilities were recognized as adjustments to the related right-of-use assets immediately after the date of initial application.
The following table shows the reconciliation of operating lease commitments disclosed as at December 31, 2018 to the lease liabilities recognized as at January 1, 2019 on adoption of IFRS16:
| Operating lease commitments disclosed as at December, 31 2018 | $ | 3,934 | ||
| Add finance lease liabilities recognized as at December 31, 2018 | 33 | |||
| Add extensions options recognized at January 1, 2019 | 729 | |||
| Less short-term leases recognized on a straight-line basis as expense | (137 | ) | ||
| Less low-value leases recognized on a straight-line basis as expense | (4 | ) | ||
| Total before discount | 4,555 | |||
| Discounted using the Company's incremental borrowing rate at the date of initial application | (851 | ) | ||
| Lease liabilities recognized as at January 1, 2019 | $ | 3,704 |
| 2019 Q2 Condensed Interim Consolidated Financial Statements | Page 7 |
| Hydrogenics Corporation |
| Hydrogenics Corporation |
| Notes to Condensed Interim Consolidated Financial Statements |
| For the six months ended June 30, 2019 |
| (in thousands of US dollars, except share and per share amounts) |
| (unaudited) |
| June 30, | January 1, | |||||||
| 2019 | 2019 | |||||||
| Current lease liabilities (note 9) | $ | 721 | $ | 887 | ||||
| Non-current lease liabilities | 2,774 | 2,817 | ||||||
| Total lease liabilities (note 12) | $ | 3,495 | $ | 3,704 |
The right-of-use assets were measured at the amount equal to the lease liability adjusted by the amount of previously recognized prepaid lease payments of $40 relating to these leases. There were no onerous lease contracts that would have required an adjustment to the right-of-use assets at the date of initial application. The recognized right-of-use assets relate to the following types of assets:
| June 30, | January 1, | |||||||
| 2019 | 2019 | |||||||
| Properties | $ | 2,840 | $ | 2,964 | ||||
| Equipment | 115 | 129 | ||||||
| Automobiles | 566 | 651 | ||||||
| Total right-of-use assets | $ | 3,521 | $ | 3,744 |
There were $181 additions to right-of-use assets and lease liabilities during the three and six months ended June 30, 2019. The following table shows the impact of IFRS 16 adoption in the condensed interim consolidated statements of operations and comprehensive loss:
| Three months ended | Six months ended | |||||||
| June 30, 2019 | ||||||||
| Depreciation expense for right-of-use assets: | ||||||||
| Properties | $ | 157 | $ | 307 | ||||
| Equipment | 8 | 15 | ||||||
| Automobiles | 53 | 105 | ||||||
| Total depreciation expense for right-of-use assets | 218 | 427 | ||||||
| Interest expense on lease liabilities | 57 | 101 | ||||||
| Expense relating to variable lease payments not included in the measurement of lease liabilities | 38 | 76 | ||||||
| Expense relating to short-term leases not included in the measurement of lease liabilities | 11 | 51 | ||||||
| Expense relating to low-value leases not included in the measurement of lease liabilities | 2 | 3 | ||||||
| Total expense | $ | 326 | $ | 658 |
During the three and six months ended June 30, 2019, the Company paid $199 and $379, respectively, as principal repayments of lease liabilities and $57 and $101, respectively, as interest expense on lease liabilities. The Company has future minimum lease payments under leases as follows:
| From July 1, 2019 to June 30, 2020 | $ | 990 | ||
| From July 1, 2020 to June 30, 2021 | 887 | |||
| From July 1, 2021 to June 30, 2022 | 518 | |||
| From July 1, 2022 to June 30, 2023 | 371 | |||
| From July 1, 2023 to June 30, 2024 | 225 | |||
| Thereafter | 491 | |||
| Total (excluding extension options) | $ | 3,482 |
| 2019 Q2 Condensed Interim Consolidated Financial Statements | Page 8 |
| Hydrogenics Corporation |
| Hydrogenics Corporation |
| Notes to Condensed Interim Consolidated Financial Statements |
| For the six months ended June 30, 2019 |
| (in thousands of US dollars, except share and per share amounts) |
| (unaudited) |
| b) | Practical expedients |
In applying IFRS 16 for the first time, the Company has used the following practical expedients permitted by the standard:
| · | Contracts that were previously identified as leases applying IAS 17 Leases and IFRIC 4 Determining whether an Arrangement contains a lease (“IFRIC 4”), before the date of transition have not been reassessed and contracts that were not previously identified as containing a lease applying IAS 17 and IFRIC 4 were not assessed whether they contain a lease under IFRS 16, |
| · | The use of a single discount rate for a portfolio of leases with reasonably similar characteristics, |
| · | Reliance on previous assessments on whether leases are onerous under IAS 37 Provisions, Contingent Liabilities and Contingent Assets, |
| · | The accounting for operating leases with a remaining lease term of less than 12 months as at January 1, 2019 as short-term leases, |
| · | Elected not to separate non-lease components from lease components, and instead account for each lease component and any associated non-lease components as a single lease component. |
| · | The exclusion of initial direct costs for the measurement of the right-of-use asset at the date of initial application, and |
| · | The use of hindsight in determining the lease term where the contract contains options to extend or terminate the lease. |
| ii. | Accounting Policy |
The Company leases various properties, equipment and automobiles. Lease contracts are typically made for fixed periods of three to ten years but may have extension options as described in (a) below. Lease terms are negotiated on an individual basis and contain a wide range of different terms and conditions. The lease agreements do not impose any covenants, but leased assets may not be used as security for borrowing purposes. Until the 2019 financial year, leases of property, equipment and automobiles were classified as operating leases. Payments made under operating leases were charged to the condensed interim consolidated statements of operations and comprehensive loss on a straight-line basis over the period of the lease.
From January 1, 2019, leases are recognized as a right-of-use asset and a corresponding liability at the date at which the leased asset is available for use by the Company. Each lease payment is allocated between the liability and finance cost. The finance cost is charged to the condensed interim consolidated statements of operations and comprehensive loss over the lease period so as to produce a constant periodic rate of interest on the remaining balance of the liability for each period. The right-of-use asset is depreciated over the shorter of the asset's useful life and the lease term on a straight-line basis.
Assets and liabilities arising from a lease are initially measured on a present value basis. Lease liabilities include the net present value of the following lease payments:
| · | fixed payments (including in-substance fixed payments), less any lease incentives receivable, |
| · | amounts expected to be payable by the lessee under residual value guarantees, |
| · | the exercise price of a purchase option if the lessee is reasonably certain to exercise that option, and |
| · | payments of penalties for terminating the lease, if the lease term reflects the lessee exercising that option. |
The lease payments are discounted using the interest rate implicit in the lease. If that rate cannot be determined, the Company’s incremental borrowing rate is used, being the rate that the Company would have to pay to borrow the funds necessary to obtain an asset of similar value in a similar economic environment with similar terms and conditions.
| 2019 Q2 Condensed Interim Consolidated Financial Statements | Page 9 |
| Hydrogenics Corporation |
| Hydrogenics Corporation |
| Notes to Condensed Interim Consolidated Financial Statements |
| For the six months ended June 30, 2019 |
| (in thousands of US dollars, except share and per share amounts) |
| (unaudited) |
Right-of-use assets are measured at cost comprising the following:
| · | the amount of the initial measurement of lease liability, |
| · | any lease payments made at or before the commencement date less any lease incentives received, |
| · | any initial direct costs, and |
| · | restoration costs. |
Payments associated with short-term leases and leases of low-value assets are recognized on a straight-line basis as an expense in the condensed interim consolidated statements of operations and comprehensive loss. Short-term leases are leases with a lease term of 12 months or less. Low-value assets comprise IT-equipment and small items of furniture and equipment with less $5 of future cash obligations on lease by lease basis.
| a) | Extension and termination options |
Extension and termination options are included in a number of property and equipment leases across the Company. These terms are used to maximize operational flexibility in terms of managing contracts. The majority of extension and termination options held are exercisable only by the Company and not by the respective lessor.
| b) | Critical judgements in determining the lease term |
In determining the lease term, management considers all facts and circumstances that create an economic incentive to exercise an extension option, or not exercise a termination option. Extension options (or periods after termination options) are only included in the lease term if the lease is reasonably certain to be extended (or not terminated). The assessment is reviewed if a significant event or a significant change in circumstances occurs which affects this assessment and that is within the control of the Company.
In determining the carrying amount of right-of-use assets and lease liabilities, the Company is required to estimate the incremental borrowing rate specific to each leased asset or portfolio of leased assets if the interest rate implicit in the lease is not readily determined. Management determines the incremental borrowing rate of each leased asset or portfolio of leased assets by incorporating the Company's creditworthiness, the security, term and value of the underlying leased asset, and the economic environment in which the leased asset operates in. The incremental borrowing rates are subject to change mainly due to macroeconomic changes in the environment.
Note 5 – Trade and Other Receivables
| June 30, | December 31, | |||||||
| 2019 | 2018 | |||||||
| Trade accounts receivable | $ | 4,646 | $ | 3,313 | ||||
| Less: provision for impairment (note 23) | (35 | ) | (30 | ) | ||||
| Net trade accounts receivable | 4,611 | 3,283 | ||||||
| Other receivables | 3,411 | 3,445 | ||||||
| Total trade and other receivables | $ | 8,022 | $ | 6,728 |
| 2019 Q2 Condensed Interim Consolidated Financial Statements | Page 10 |
| Hydrogenics Corporation |
| Hydrogenics Corporation |
| Notes to Condensed Interim Consolidated Financial Statements |
| For the six months ended June 30, 2019 |
| (in thousands of US dollars, except share and per share amounts) |
| (unaudited) |
Note 6 – Contract Assets and Liabilities
The Company has recognized the following assets and liabilities related to contracts with customers:
| June 30, | December 31, | |||||||||||
| 2019 | 2018 | $ change | ||||||||||
| Contract assets | $ | 6,584 | $ | 6,223 | $ | 361 | ||||||
| Less current portion | (3,789 | ) | (4,534 | ) | 745 | |||||||
| Non-current portion | 2,795 | 1,689 | 1,106 | |||||||||
| Contract liabilities | 14,512 | 16,001 | (1,489 | ) | ||||||||
| Less current portion | (13,870 | ) | (14,581 | ) | 711 | |||||||
| Non-current portion | 642 | 1,420 | (778 | ) |
| (i) | Significant changes in contract assets and liabilities |
Contract assets at June 30, 2019 includes $3,547 (December 31, 2018 – $4,048) relating to receivables which are to be billed according to progress based and specified payment schedules, typical with long-term contracts. The remainder relates to the final instalment of contract price on the sale of equipment for installation and commissioning, which is not invoiced to the customer until this work is complete. The change in the contract assets balance during the period reflects the change in the timeframe for a right to consideration to become unconditional (i.e. for the contract asset to be reclassified as a receivable).
Contract liabilities represent deposits and payments received in advance from customers for license fees, product development contracts and equipment sales. The change in the contract liabilities balance during the period reflects changes in the timeframe for performance obligations to be satisfied and the timing of receipt of deposits.
| (ii) | Revenue recognized in relation to contract liabilities |
Revenue recognized in the six months ended June 30, 2019, included in opening contract liabilities, amounted to $4,497 (2018 - $4,649). Of this amount, $2,857 (2018 - $nil) related to performance obligations that were satisfied in the prior year but which did not meet all of the criteria for revenue recognition until the current reporting period.
| (iii) | Unsatisfied performance obligations |
The following table shows unsatisfied performance obligations:
June 30, 2019 | December 31, 2018 | |||||||
| OnSite Generation | $ | 36,000 | $ | 20,600 | ||||
| Power Systems | 108,100 | 112,100 | ||||||
| Total | $ | 144,100 | $ | 132,700 |
The balance for Onsite Generation includes a project for Air Liquide Canada, a related party. The Company expects $59,900 of the balance to be recognized as revenues in the next 12 months period and the remaining $84,200 is to be recognized beyond 12 months.
| 2019 Q2 Condensed Interim Consolidated Financial Statements | Page 11 |
| Hydrogenics Corporation |
| Hydrogenics Corporation |
| Notes to Condensed Interim Consolidated Financial Statements |
| For the six months ended June 30, 2019 |
| (in thousands of US dollars, except share and per share amounts) |
| (unaudited) |
Note 7 – Prepaid Expenses
Prepaid expenses are as follows:
| June 30, | December 31, | |||||||
| 2019 | 2018 | |||||||
| Prepaid expenses | $ | 1,537 | $ | 1,593 | ||||
| Costs incurred to obtain contracts with customers | 471 | 367 | ||||||
| Total prepaid expenses | $ | 2,008 | $ | 1,960 |
The costs incurred to obtain contracts with customers relate to sales agent commissions, which are deferred until the related contract revenues with customers are recognized. The amount amortized to the consolidated statement of operations for the three and six months ended June 30, 2019 was $2 and $14 (2018 - $5 and $15), respectively.
Note 8 – Investment in Joint Ventures
On March 30, 2017, the Company entered into an arrangement with Enbridge Gas Distribution (Enbridge) to form the joint venture 2562961 Ontario Ltd. to develop, construct, own and operate a 2.5 megawatts (“MW”) Power-to-Gas energy storage facility. The Company holds a 49% equity investment in this joint venture. The Board of Directors of the joint venture has five directors consisting of three nominees from Enbridge and two nominees of Hydrogenics and all resolutions are adopted by a majority vote. The Company accounts for this joint venture using the equity method in accordance with IFRS 11, “Joint Arrangements” using the hypothetical liquidation at book value (HLBV) method due to preferential dividends and return rights of the other partner.
The energy storage facility project was commissioned and accepted by the Independent Energy Service Operator (“IESO”) in 2018. The facility began in-service operations under an IESO Regulation Services contract effective May 2018. The following table shows change in Hydrogenics investment in the joint venture:
| June 30, | June 30, | |||||||
| 2019 | 2018 | |||||||
| Balance January 1, | $ | 1,644 | $ | 1,176 | ||||
| Gain from investment in joint venture using HLBV method | 26 | – | ||||||
| Amortization of deferred loss on sale of assets to the joint venture | (4 | ) | (6 | ) | ||||
| Foreign currency translation (loss) gain | 65 | (49 | ) | |||||
| Investment in Enbridge joint venture | $ | 1,731 | $ | 1,121 |
| 2019 Q2 Condensed Interim Consolidated Financial Statements | Page 12 |
| Hydrogenics Corporation |
| Hydrogenics Corporation |
| Notes to Condensed Interim Consolidated Financial Statements |
| For the six months ended June 30, 2019 |
| (in thousands of US dollars, except share and per share amounts) |
| (unaudited) |
On May 28, 2014, the Company entered into a joint arrangement with Kolon Water & Energy Co. Ltd. (“Kolon Energy”), whereby the parties formed the joint venture Kolon Hydrogenics to launch and market potential businesses based on products and technologies produced by Hydrogenics for the Korean market. The Company has a 49% equity position in Kolon Hydrogenics and shares joint control. The Board of Directors of the joint venture has four directors consisting of two nominees from each of Hydrogenics and Kolon Energy and all resolutions are adopted by an affirmative vote of two thirds. The Company accounted for this joint venture using the equity method in accordance with IFRS 11, “Joint Arrangements”.
In June 2018, Kolon Energy and the Company commenced discussions with respect to dissolving the joint arrangement. The carrying value of the assets of Kolon Hydrogenics have been reduced to their estimated net recoverable amount based upon an assessment of fair values less costs of disposal. The Company sold its 49% interest in the joint venture to Kolon Energy for a nominal value of $1 and terminated the agreement effective May 2, 2019. The Company has no further obligations regarding this joint venture.
| 2019 | 2018 | |||||||
| Balance January 1, | $ | – | $ | 1,621 | ||||
| Share in loss of the joint venture | – | (1,561 | ) | |||||
| Foreign currency translation gain | – | (60 | ) | |||||
| Investment in Kolon Hydrogenics joint venture at June 30, | $ | – | $ | – |
Note 9 – Financial Liabilities
Financial liabilities are as follows:
| June 30, | December 31, | |||||||
| 2019 | 2018 | |||||||
| Current portion of long-term debt – Export Development Canada (note 12) | $ | 2,701 | $ | 1,983 | ||||
| Current portion of long-term debt – Province of Ontario (note 12) | 704 | 628 | ||||||
| Warrants | – | 11 | ||||||
| Deferred share unit liability (note 14) | 1,995 | 730 | ||||||
| Current portion of lease liabilities (note 4) | 721 | 7 | ||||||
| Total financial liabilities | $ | 6,121 | $ | 3,359 |
| 2019 Q2 Condensed Interim Consolidated Financial Statements | Page 13 |
| Hydrogenics Corporation |
| Hydrogenics Corporation |
| Notes to Condensed Interim Consolidated Financial Statements |
| For the six months ended June 30, 2019 |
| (in thousands of US dollars, except share and per share amounts) |
| (unaudited) |
Note 10 – Provisions
Changes in the Company’s aggregate provisions are as follows:
| Warranty | Startup and commissioning | Total | ||||||||||
| At January 1, | $ | 2,327 | $ | 524 | $ | 2,851 | ||||||
| Additional provisions | 896 | 341 | 1,237 | |||||||||
| Utilized during the period | (949 | ) | (258 | ) | (1,207 | ) | ||||||
| Unused amounts reversed | (163 | ) | (36 | ) | (199 | ) | ||||||
| Foreign currency translation | (11 | ) | (5 | ) | (16 | ) | ||||||
| Total provision at June 30, 2019 | 2,100 | 566 | 2,666 | |||||||||
| Less current portion | (1,418 | ) | (449 | ) | (1,867 | ) | ||||||
| Long-term provision at June 30, 2019 | $ | 682 | $ | 117 | $ | 799 |
| Warranty | Startup and commissioning | Total | ||||||||||
| At January 1, | $ | 2,095 | $ | 625 | $ | 2,720 | ||||||
| Additional provisions | 630 | 165 | 795 | |||||||||
| Utilized during the period | (372 | ) | (499 | ) | (871 | ) | ||||||
| Unused amounts reversed | (617 | ) | (11 | ) | (628 | ) | ||||||
| Foreign currency translation | (28 | ) | 5 | (23 | ) | |||||||
| Total provision at June 30, 2018 | 1,708 | 285 | 1,993 | |||||||||
| Less current portion | (961 | ) | (228 | ) | (1,189 | ) | ||||||
| Long-term provision at June 30, 2018 | $ | 747 | $ | 57 | $ | 804 |
Note 11 – Lines of Credit and Bank Guarantees
At June 30, 2019, the Company’s subsidiary in Belgium (the “Borrower”) had a joint credit and operating line facility of €7,000 (the “Credit Facility”), which renews annually in April upon review. Under the Credit Facility, the Borrower may borrow up to a maximum of 75% of the value of awarded sales contracts, approved by the Belgian financial institution, to a maximum of €500; and may also borrow up to €1,500 for general business purposes, provided sufficient limit exists under the overall facility limit of €7,000. Of the €7,000 facility, €2,761 or approximately $3,141 was drawn as standby letters of credit and bank guarantees and €Nil was drawn as an operating line. At June 30, 2019, the Company had availability of €4,239 or approximately $4,822 (December 31, 2018 – $5,527) under the Credit Facility of which €2,239, or approximately $2,547 can be used as letters of credit and bank guarantees and €2,000, or approximately $2,275 can be used as an operating line.
At June 30, 2019, the Company also had a Canadian credit facility of C$3,000 with no expiration date for use only as letters of credit and bank guarantees. At June 30, 2019, C$100 or $76 (December 31, 2018 $399) was drawn as standby letters of credit. At June 30, 2019, the Company had C$2,900 or $2,216 (December 31, 2018 – $1,800) available under this facility.
These letters of credit and bank guarantees relate primarily to obligations in connection with the terms and conditions of the Company’s sales contracts. The standby letters of credit and letters of guarantee may be drawn on by the customer if the Company fails to perform its obligations under the sales contracts.
| 2019 Q2 Condensed Interim Consolidated Financial Statements | Page 14 |
| Hydrogenics Corporation |
| Hydrogenics Corporation |
| Notes to Condensed Interim Consolidated Financial Statements |
| For the six months ended June 30, 2019 |
| (in thousands of US dollars, except share and per share amounts) |
| (unaudited) |
Note 12 – Other Non-current Liabilities
Other non-current liabilities are as follows:
| June 30, | December 31, | |||||||
| 2019 | 2018 | |||||||
| Long-term debt – Export Development Canada (i) | $ | 5,680 | $ | 5,958 | ||||
| Long-term debt – Province of Ontario (ii) | 2,345 | 2,091 | ||||||
| Non-current post-retirement benefit liabilities (iii) | 238 | 247 | ||||||
| Lease liabilities (note 4) | 3,495 | 33 | ||||||
| Total | 11,758 | 8,329 | ||||||
| Less current portion of long-term debt – Export Development Canada (note 9) | (2,701 | ) | (1,983 | ) | ||||
| Less current portion of long-term debt – Province of Ontario (note 9) | (704 | ) | (628 | ) | ||||
| Less current portion of lease liabilities (note 4) | (721 | ) | (7 | ) | ||||
| Total other non-current liabilities | $ | 7,632 | $ | 5,711 |
| (i) | Long-term debt – Export Development Canada (“EDC”) |
In the fourth quarter of 2016, the Company entered into a loan agreement with EDC for a five-year facility of $9,000.
The loan is structured as a five-year term loan with quarterly interest payments, currently calculated at an annual interest rate of U.S. prime plus 10%, declining to U.S. prime plus 5% to 7% if certain annual earnings before interest, taxes, depreciation and amortization thresholds are met. The loan is secured by a second charge over the assets located within Canada. Commencing March 31, 2017, the loan principal was subject to four quarterly repayments of $250 followed by 16 quarterly repayments of $500. There is an option to prepay a portion of, or the entire loan, at any quarterly repayment date.
The change in carrying value of this liability was as follows:
| 2019 | 2018 | |||||||
| At January 1, | $ | 5,958 | $ | 8,344 | ||||
| Principal repayments during the period | (500 | ) | (750 | ) | ||||
| Interest payments during the period | (229 | ) | (582 | ) | ||||
| Interest accretion during the period | 451 | 578 | ||||||
| Revaluation of variable rate long-term debt | – | 57 | ||||||
| At June 30, | $ | 5,680 | $ | 7,647 |
| (ii) | Long-term debt – Province of Ontario |
In 2011, the Company entered into a loan agreement with the Province of Ontario’s Ministry of Economic Development and Trade, Strategic Jobs and Investment Fund for funding up to C$6,000. Each draw on the loan is calculated based on 50% of eligible costs to a maximum of C$1,500 per disbursement. Eligible costs had to be incurred between October 1, 2010 and September 30, 2015. The full amount of the facility was drawn.
Commencing in the fourth quarter of 2016, the loan bears interest at a rate of 3.67% and requires repayment at a rate of 20% per year of the outstanding balance due annually each November.
The loan is collateralized by a general security agreement covering assets of Hydrogenics Corporation. Additionally, the Corporation is required to maintain a minimum balance of cash in Canadian dollars in a Canadian financial institution at all times. The Company was in compliance with this covenant at June 30, 2019.
| 2019 Q2 Condensed Interim Consolidated Financial Statements | Page 15 |
| Hydrogenics Corporation |
| Hydrogenics Corporation |
| Notes to Condensed Interim Consolidated Financial Statements |
| For the six months ended June 30, 2019 |
| (in thousands of US dollars, except share and per share amounts) |
| (unaudited) |
The change in carrying value of this liability was as follows:
| 2019 | 2018 | |||||||
| At January 1, | $ | 2,091 | $ | 2,896 | ||||
| Interest accretion during the period | 163 | 215 | ||||||
| Foreign currency translation | 91 | (143 | ) | |||||
| At June 30, | $ | 2,345 | $ | 2,968 |
| (iii) | Post-retirement benefit liabilities |
The liability at June 30, 2019 relates to defined contribution pension plans in Belgium and is payable in euros. Applicable law states that in the context of defined contribution plans, the employer must guarantee a minimum return of 3.75% on employee contributions and 3.25% on employer contributions. The minimum guaranteed return for defined contribution plans in Belgium results in the employer being exposed to financial risk for the legal obligation to pay further contributions if the fund does not hold sufficient assets to meet the minimum guaranteed return and as a consequence the plan is required to be accounted for as a defined benefit plan.
There were no actuarial remeasurements during the three and six months ended June 30, 2019.
Note 13 – Share Capital
Common shares
The authorized share capital of the Company consists of an unlimited number of common shares, with no par value, and an unlimited number of preferred shares in series, with no par value.
| 2019 | 2018 | |||||||||||||||
| Number | Amount | Number | Amount | |||||||||||||
| Balance at January 1, | 15,447,483 | $ | 387,911 | 15,436,879 | $ | 387,746 | ||||||||||
| Issuance of common shares | 3,537,931 | 20,259 | – | – | ||||||||||||
| Issuance of common shares on exercise of stock options (note 14) | 23,912 | 214 | 100 | 1 | ||||||||||||
| Issuance of common shares on exercise of restricted share units (note 14) | 8,865 | 72 | – | – | ||||||||||||
| Issuance of common shares on vesting of performance share units (note 14) | – | – | 4,204 | 96 | ||||||||||||
| At June 30, | 19,018,191 | $ | 408,456 | 15,441,183 | $ | 387,843 | ||||||||||
On December 21, 2018, the Company and The Hydrogen Company (“H2C”) entered into a subscription agreement to issue 3,537,931 common shares of Hydrogenics to H2C on a private placement basis, for gross proceeds to Hydrogenics of $20,520 or $5.80 per common share. The subscription price represented approximately a 20% premium to the 20-day volume-weighted average trading price of the Company’s common shares on the NASDAQ for the period ending December 20, 2018.
The transaction closed on January 24, 2019 and the Company received net proceeds of $20,259 after fees and expenses of $261. Subsequent to closing of the private placement, H2C’s interest in Hydrogenics is approximately 18.6% of total issued common shares.
| 2019 Q2 Condensed Interim Consolidated Financial Statements | Page 16 |
| Hydrogenics Corporation |
| Hydrogenics Corporation |
| Notes to Condensed Interim Consolidated Financial Statements |
| For the six months ended June 30, 2019 |
| (in thousands of US dollars, except share and per share amounts) |
| (unaudited) |
The subscription agreement provides, among other things, that H2C has participation rights on future offerings and the right to nominate one director to the board of directors of Hydrogenics, and that H2C will be subject to certain restrictions, including lock-up, transfer, standstill and voting restrictions, subject, in each case, to certain ownership threshold requirements or for a period of one year from the date of the subscription agreement.
Note 14 – Stock-Based Compensation
Under the Hydrogenics Omnibus Incentive Plan adopted in 2012, the Company may issue stock options, RSUs and PSUs to employees, directors and consultants as part of long-term incentive compensation. Stock options were previously granted under the Company’s Stock Option Plan.
Under the Company’s previous Stock Option Plan, 218,280 stock options were outstanding at June 30, 2019. No further stock options may be issued under this plan.
Effective May 11, 2018, the Company amended the Omnibus Incentive Plan to increase the number of shares available for issuance to 1,308,032 from 1,002,069. This was passed as a resolution by the shareholders of Hydrogenics on May 11, 2018.
Of the 1,308,032 shares available for issuance as stock options, RSUs and PSUs, under the Omnibus Incentive Plan, 605,613 have been granted as stock options and 178,217 have been granted as RSUs and were outstanding as at June 30, 2019. In addition, 12,609 previously issued PSU’s had fully vested as of June 30, 2019. The Company has 455,975 share units available for issue as stock options, RSUs and PSUs under the Omnibus Incentive Plan at June 30, 2019. Under the Company’s insider trading policy, no shares could be issued or purchased during the six months ended June 30, 2019.
Stock options
A summary of the Company’s stock option plan for the six months ended June 30, 2019 and 2018 is as follows:
| 2019 | 2018 | |||||||||||||||
| Weighted | Weighted | |||||||||||||||
| average | average | |||||||||||||||
| Number of | exercise price | Number of | exercise price | |||||||||||||
| shares | C$ | shares | C$ | |||||||||||||
| Balance at January 1, | 853,089 | $ | 8.37 | 762,173 | $ | 7.99 | ||||||||||
| Granted | – | – | 111,621 | 11.41 | ||||||||||||
| Exercised | (23,912 | ) | 6.63 | (100 | ) | 4.91 | ||||||||||
| Forfeited | – | – | (580 | ) | 13.25 | |||||||||||
| Expired | (5,284 | ) | 13.25 | (5,025 | ) | 14.50 | ||||||||||
| At June 30, | 823,893 | $ | 8.39 | 868,089 | $ | 8.32 | ||||||||||
| 2019 Q2 Condensed Interim Consolidated Financial Statements | Page 17 |
| Hydrogenics Corporation |
| Hydrogenics Corporation |
| Notes to Condensed Interim Consolidated Financial Statements |
| For the six months ended June 30, 2019 |
| (in thousands of US dollars, except share and per share amounts) |
| (unaudited) |
During the six months ended June 30, 2019, 23,912 (2018 – 100) stock options were exercised resulting in cash proceeds of $122 (2018 - $1), an increase in common shares of $214 (2018 - $1) with an offset to contributed surplus of $92 (2018 - $1).
During the six months ended June 30, 2019, $nil (2018 – 111,621) stock options were granted with an average fair value of C$nil per option (2018 – C$11.41). All options are for a term of ten years from the date of grant and vest over four years unless otherwise determined by the Board of Directors. The fair value of the stock options was determined using the Black-Scholes option pricing model with the following weighted average assumptions:
| 2019 | 2018 | |||||||
| Risk-free interest rate | n/a | 2.12 | % | |||||
| Expected volatility | n/a | 64.3 | % | |||||
| Expected life in years | n/a | 7 | ||||||
| Expected dividend | Nil | Nil |
Expected volatility was determined using the historical volatility for the Company’s share price for the seven years prior to the date of grant, as this is the expected life of the stock options.
Stock-based compensation expense for the six months ended June 30, 2019, related to stock options, was $209 (six months ended June 30, 2018 – $255) and was included in selling, general and administrative expenses with an offsetting increase to contributed surplus.
Performance Share Units (“PSUs”)
Under the Hydrogenics Omnibus Incentive Plan adopted in 2012, the Company may issue performance based share units to employees, directors and consultants. Pursuant to the Hydrogenics Omnibus Incentive Plan, participants may be granted a portion of their long-term incentive plan in the form of PSUs instead of RSUs and stock options. A PSU is a unit, equivalent in value to a common share of the Company.
Each PSU entitles the participant to receive a cash payment or common shares, at the option of the Company. The fair value of the PSUs is recognized as a compensation expense and is pro-rated over the expected vesting period with the offsetting increase to contributed surplus. Fair value is calculated as the market value of the common share at the date of grant. Each PSU is subject to vesting performance conditions. The Company estimates the length of the expected vesting period at the grant date, based on the most likely outcome of the performance conditions. The Company will revise its estimate of the length of the vesting period, if necessary, if subsequent information indicates that the length of the vesting period differs from previous estimates and any change to compensation cost will be recognized in the period in which the revised estimate is made. Forfeitures are estimated at the grant date and are revised to reflect a change in expected or actual forfeitures. The expiry date of PSUs granted is five years from the date of award.
A summary of the Company’s PSU activity is as follows:
| 2019 | 2018 | |||||||
| Balance at January 1, | – | 191,366 | ||||||
| Expired | – | (187,162 | ) | |||||
| Vested – share issuance | – | (4,204 | ) | |||||
| At June 30, | – | – |
Stock-based compensation expense for the six months ended June 30, 2019, related to PSUs, was $nil (2018 – $6) and was included in selling, general and administrative expenses with an offsetting increase to contributed surplus.
| 2019 Q2 Condensed Interim Consolidated Financial Statements | Page 18 |
| Hydrogenics Corporation |
| Hydrogenics Corporation |
| Notes to Condensed Interim Consolidated Financial Statements |
| For the six months ended June 30, 2019 |
| (in thousands of US dollars, except share and per share amounts) |
| (unaudited) |
Equity-settled Restricted Share Units (“RSUs”)
An RSU is a unit equivalent in value to a common share of the Company. The RSUs will be settled by issuance of shares in the Company. The cost of the Company’s RSUs is determined using the cliff vesting method and is charged to selling, general and administrative expenses. RSUs vest three years from grant date. The fair value of each grant of RSUs is the fair value of the Company’s share price on the date of grant. The resulting compensation expense, included in selling, general and administrative expenses, is charged to income over the period the employees unconditionally become entitled to the award, with a corresponding increase to contributed surplus.
During the six months ended June 30, 2019, $nil (six months ended June 30, 2018 – 69,523) RSUs were granted with an average fair value of C$nil per unit (2018 – C$11.41). All RSUs are for a term of three years from the date of grant, with vesting occurring at the end of the three years.
A summary of the Company’s RSU (equity-settled) activity is as follows:
| 2019 | 2018 | |||||||
| Balance at January 1, | 202,707 | 133,184 | ||||||
| Granted | – | 69,523 | ||||||
| Cancelled | (15,625 | ) | – | |||||
| Exercised | (8,865 | ) | – | |||||
| At June 30, | 178,217 | 202,707 |
Stock-based compensation expense for the six months ended June 30, 2019, related to RSUs, was $178 (six months ended June 30, 2018 – $204) and was included in selling, general and administrative expenses with an offsetting increase to contributed surplus.
Deferred Share Units (“DSUs”)
The Company has a deferred share unit plan for directors. Pursuant to the DSU Plan, non-employee directors are entitled to receive all or any portion of their annual cash retainer and meeting fees in the form of DSUs instead of cash. A DSU is a unit, equivalent in value to a common share of the Company. Each DSU entitles the participant to receive a cash payment upon termination of directorship, valued at the price of the Company’s common share on the Toronto Stock Exchange on the date of termination. Compensation cost for DSUs granted under the DSU Plan is recorded as an expense with a corresponding increase in accrued liabilities and is measured at fair value. The DSU liability is marked-to-market each reporting period with the offset recorded in selling, general and administrative expenses.
A summary of the Company’s DSU activity is as follows:
| 2019 | 2018 | |||||||||||||||
| Number | Amount | Number | Amount | |||||||||||||
| Balance at January 1, | 147,171 | 730 | 125,949 | $ | 1,406 | |||||||||||
| DSU redemptions | (20,000 | ) | (207 | ) | – | – | ||||||||||
| DSU compensation expense | 6,926 | 72 | 9,491 | 75 | ||||||||||||
| DSU fair value adjustments | – | 1,361 | – | (463 | ) | |||||||||||
| Foreign currency translation | – | 39 | – | – | ||||||||||||
| At June 30, | 134,097 | 1,995 | 135,440 | $ | 1,018 |
| 2019 Q2 Condensed Interim Consolidated Financial Statements | Page 19 |
| Hydrogenics Corporation |
| Hydrogenics Corporation |
| Notes to Condensed Interim Consolidated Financial Statements |
| For the six months ended June 30, 2019 |
| (in thousands of US dollars, except share and per share amounts) |
| (unaudited) |
For the six months ended June 30, 2019, the Company recognized $72 (2018 – $75) as an expense for the issue of new DSUs and $1,361 (2018 – $463) for the mark-to-market adjustment on the liability. The DSU liability at June 30, 2019 of $1,995 (December 31, 2018 – $730) was included in financial liabilities. DSUs vest immediately on the date of issuance.
Summary of stock-based compensation expense
| Three months ended June 30, | 2019 | 2018 | ||||||
| Stock-based compensation expense - stock options | $ | 74 | $ | 128 | ||||
| Stock-based compensation expense - PSU | – | – | ||||||
| Stock-based compensation expense - RSU (equity-settled) | 77 | 115 | ||||||
| Subtotal stock based compensation expense | 151 | 243 | ||||||
| DSU - new issuance | 37 | 34 | ||||||
| DSU - mark-to-market adjustment | 934 | (96 | ) | |||||
| Subtotal stock-based compensation expense - DSU | 971 | (62 | ) | |||||
| Total | $ | 1,122 | $ | 181 |
| Six months ended June 30, | 2019 | 2018 | ||||||
| Stock-based compensation expense - stock options | $ | 209 | $ | 255 | ||||
| Stock-based compensation expense - PSU | – | 6 | ||||||
| Stock-based compensation expense - RSU (equity-settled) | 178 | 204 | ||||||
| Subtotal stock based compensation expense | 387 | 465 | ||||||
| DSU - new issuance | 72 | 75 | ||||||
| DSU - mark-to-market adjustment | 1,361 | (463 | ) | |||||
| Subtotal stock-based compensation expense - DSU | 1,433 | (388 | ) | |||||
| Total | $ | 1,820 | $ | 77 |
Note 15 – Research and Product Development Expenses
Research and product development expenses are recorded net of non-repayable third-party program funding received or receivable. Funds received prior to incurring the related program expenses are deferred and amounted to $2,067 at June 30, 2019 (June 30, 2018 - $1,514). For the three and six months ended June 30, 2019 and 2018, research and product development expenses and non-repayable program funding, which have been received or receivable, are as follows:
| Three months ended June 30, | 2019 | 2018 | ||||||
| Research and product development expenses | $ | 2,174 | $ | 3,271 | ||||
| Government research and product development funding | (479 | ) | (1,391 | ) | ||||
| Total | $ | 1,695 | $ | 1,880 |
| Six months ended June 30, | 2019 | 2018 | ||||||
| Research and product development expenses | $ | 4,278 | $ | 6,286 | ||||
| Government research and product development funding | (774 | ) | (2,325 | ) | ||||
| Total | $ | 3,504 | $ | 3,961 |
In March 2018, the Company entered into a government grant funding agreement for C$5,000. The funding schedule provided for an initial payment of C$2,500, which was paid in May 2018, with subsequent funding pursuant to achieving specified project milestones. In August 2018, the Company received notice that the government funding program was being terminated effective September 28, 2018. In March 2019, the Company repaid C$1,361 of unused funds.
| 2019 Q2 Condensed Interim Consolidated Financial Statements | Page 20 |
| Hydrogenics Corporation |
| Hydrogenics Corporation |
| Notes to Condensed Interim Consolidated Financial Statements |
| For the six months ended June 30, 2019 |
| (in thousands of US dollars, except share and per share amounts) |
| (unaudited) |
Note 16 – Other Finance Gains and Losses, Net
Components of other finance gains and losses, net are as follows:
| Three months ended June 30, | 2019 | 2018 | ||||||
| Gain (loss) from change in fair value of outstanding warrants | $ | 137 | $ | 70 | ||||
| Revaluation of variable rate long-term debt – Export Development Canada | – | (27 | ) | |||||
| Total | $ | 137 | $ | 43 |
| Six months ended June 30, | 2019 | 2018 | ||||||
| Gain (loss) from change in fair value of outstanding warrants | $ | 11 | $ | 356 | ||||
| Revaluation of variable rate long-term debt – Export Development Canada | – | (57 | ) | |||||
| Total | $ | 11 | $ | 299 |
Note 17 – Income Taxes
The components of income tax expense included in the determination of the net loss for the period was as follows:
| Six months ended June 30, | 2019 | 2018 | ||||||
| Current tax expense | ||||||||
| Current period income tax | $ | – | $ | – | ||||
| Withholding tax | – | 300 | ||||||
| Total | $ | – | $ | 300 |
Withholding tax arises from remittances made, on behalf of the Company, by foreign based customers.
Note 18 – Net Loss Per Share
The net loss per share for the periods ended June 30, 2019 and 2018 was as follows:
| Three months ended | Six months ended | |||||||||||||||
| June 30, | June 30, | |||||||||||||||
| 2019 | 2018 | 2019 | 2018 | |||||||||||||
| Net loss | $ | (4,766 | ) | $ | (4,801 | ) | $ | (7,413 | ) | $ | (6,755 | ) | ||||
| Weighted average number of shares outstanding – basic | 18,999,286 | 15,440,888 | 18,542,928 | 15,438,894 | ||||||||||||
| Dilutive effect of stock options | – | – | – | – | ||||||||||||
| Dilutive effect of warrants | – | – | – | – | ||||||||||||
| Weighted average number of shares outstanding – diluted | 18,999,286 | 15,440,888 | 18,542,928 | 15,438,894 | ||||||||||||
| Net loss per share – basic and diluted | $ | (0.25 | ) | $ | (0.31 | ) | $ | (0.40 | ) | $ | (0.44 | ) | ||||
No effect has been given to the potential exercise of stock options and RSUs in the calculation of diluted net loss per share, as their impact would be anti-dilutive.
| 2019 Q2 Condensed Interim Consolidated Financial Statements | Page 21 |
| Hydrogenics Corporation |
| Hydrogenics Corporation |
| Notes to Condensed Interim Consolidated Financial Statements |
| For the six months ended June 30, 2019 |
| (in thousands of US dollars, except share and per share amounts) |
| (unaudited) |
Note 19 – Related Party Transactions
In the normal course of operations, the Company subcontracts certain manufacturing functions to a company owned by a family member of an executive officer and Director of the Company. During the three and six months ended June 30, 2019, Hydrogenics made purchases of $38 and $61 (2018 – $42 and $160) from this related company. At June 30, 2019, the Company had an accounts payable balance due to this related party of $12 (December 2018 – $21).
The Company holds an equity investment in the joint venture 2562961 Ontario Ltd., related to the energy storage facility project with Enbridge Gas Distribution. During the three and six months ended June 30, 2019, the Company had sales to the joint venture of $34 and $68 (2018 – $23 and $nil) and at the end of June 30, 2019, the Company had a net receivable of $26 (December 31, 2018 – $196) from the joint venture.
All related party transactions involve the parent company. There are no related party transactions to disclose for the Company’s subsidiaries.
Note 20 – Consolidated Statements of Cash Flows
Components of the net change in non-cash working capital are as follows:
| Three months ended June 30, | 2019 | 2018 | ||||||
| Decrease (increase) | ||||||||
| Trade and other receivables | $ | (1,576 | ) | $ | (1,031 | ) | ||
| Contract assets | 771 | 961 | ||||||
| Inventories | 1,871 | (455 | ) | |||||
| Prepaid expenses | (17 | ) | 83 | |||||
| Increase (decrease) | ||||||||
| Trade and other payables, including provisions | 149 | (2,509 | ) | |||||
| Contract liabilities | (1,681 | ) | 37 | |||||
| Deferred funding | (24 | ) | 1,498 | |||||
| Total | $ | (507 | ) | $ | (1,416 | ) |
| Six months ended June 30, | 2019 | 2018 | ||||||
| Decrease (increase) | ||||||||
| Trade and other receivables | $ | (1,312 | ) | $ | 704 | |||
| Contract assets | (371 | ) | 254 | |||||
| Inventories | (1,810 | ) | (3,731 | ) | ||||
| Prepaid expenses | (89 | ) | 185 | |||||
| Increase (decrease) | ||||||||
| Trade and other payables, including provisions | 247 | (2,883 | ) | |||||
| Contract liabilities | (1,456 | ) | 2,513 | |||||
| Deferred funding | 104 | 2,099 | ||||||
| Total | $ | (4,687 | ) | $ | (859 | ) |
| 2019 Q2 Condensed Interim Consolidated Financial Statements | Page 22 |
| Hydrogenics Corporation |
| Hydrogenics Corporation |
| Notes to Condensed Interim Consolidated Financial Statements |
| For the six months ended June 30, 2019 |
| (in thousands of US dollars, except share and per share amounts) |
| (unaudited) |
Note 21 – Commitments and Contingencies
Forgivable loan facility
In November 2014, Hydrogenics entered into an agreement with the IESO to provide a 2.5MW Power-to-Gas storage unit to the Province of Ontario. The target in-service period for the IESO Regulation Services contract was the second quarter of 2018. The contract was assigned to the joint venture 2562961 Ontario Ltd. in 2017. The joint venture will receive a total of C$2,950, paid in equal monthly instalments, in return for IESO’s use of the energy storage solution over the initial three-year period commencing with commissioning. The Power-to-Gas storage unit is estimated to have a potential 20-year life.
In order to partially fund the development of the unit, Hydrogenics and the Province of Ontario, through the Ministry of Research and Innovation (“MRI”), negotiated a C$4,000 forgivable loan from the Innovation Demonstration Fund Program (“IDF”). The loan bears interest at 3.23%, is expected to mature on June 30, 2020 and the principal and interest are forgivable upon the satisfaction of certain criteria.
The forgiveness of the principal and interest on the loan is contingent on a final commercialization report satisfactory to MRI, indicating successful commissioning and verification of the operation of the multi-stack 2.5MW PEM electrolyzer and demonstrated performance capabilities that would be deemed acceptable for ancillary service as per the IESO specifications. The unit achieved acceptance by IESO in May 2018. The final commercialization report is expected to be delivered in 2019. The forgivable loan has been accounted for as a government grant as management estimates there is reasonable assurance that the terms of forgiveness will be met.
| June 30, | ||||
| 2019 | ||||
| Total cumulative cost of 2.5MW Power-to-Gas unit | $ | 8,792 | ||
| Funding received from the IDF (C$4,000) | (2,941 | ) | ||
| Cumulative costs transferred to the joint venture | (3,402 | ) | ||
| Foreign exchange loss on disposal | (117 | ) | ||
| Costs recorded as research and product development costs | (2,332 | ) | ||
| Costs remaining to be transferred to the joint venture | $ | – |
Note 22 – Segmented Financial Information
The Company’s two reportable segments include OnSite Generation and Power Systems. Segmentation is based on the internal reporting and organizational structure, taking into account the different risk and income structures of the key products and production processes of the Company. Where applicable, corporate and other activities are reported separately as Corporate and Other. OnSite Generation includes the design, development, manufacture and sale of hydrogen generation products. Power Systems includes the design, development, manufacture and sale of fuel cell products.
| 2019 Q2 Condensed Interim Consolidated Financial Statements | Page 23 |
| Hydrogenics Corporation |
| Hydrogenics Corporation |
| Notes to Condensed Interim Consolidated Financial Statements |
| For the six months ended June 30, 2019 |
| (in thousands of US dollars, except share and per share amounts) |
| (unaudited) |
Financial information by reportable segment for the three and six months ended June 30, 2019 and 2018 was as follows:
| OnSite | Power | Corporate | ||||||||||||||
| Three months ended June 30, 2019 | Generation | Systems | and Other | Total | ||||||||||||
| Revenue transferred at a point in time | $ | 7,361 | $ | 2,083 | $ | – | $ | 9,444 | ||||||||
| Revenue transferred over time | 224 | 787 | – | 1,011 | ||||||||||||
| Revenues from external customers | 7,585 | 2,870 | – | 10,455 | ||||||||||||
| Gross profit | 1,173 | 180 | – | 1,353 | ||||||||||||
| Selling, general and administrative expenses | 539 | 852 | 3,085 | 4,476 | ||||||||||||
| Research and product development expenses | 178 | 1,499 | 18 | 1,695 | ||||||||||||
| Segment income (loss) | 456 | (2,171 | ) | (3,103 | ) | (4,818 | ) | |||||||||
| Interest expense, net | – | – | (288 | ) | (288 | ) | ||||||||||
| Foreign currency gains, net | – | – | 182 | 182 | ||||||||||||
| Gain from joint venture | – | – | 21 | 21 | ||||||||||||
| Other finance gains, net | – | – | 137 | 137 | ||||||||||||
| Income (loss) before income taxes | $ | 456 | $ | (2,171 | ) | $ | (3,051 | ) | (4,766 | ) | ||||||
| At June 30, 2019 | ||||||||||||||||
| Total segment assets | $ | 23,397 | $ | 26,942 | $ | 15,580 | $ | 65,919 | ||||||||
| Total segment liabilities (current and non-current) | $ | 17,919 | $ | 15,915 | $ | 7,792 | $ | 41,626 |
| OnSite | Power | Corporate | ||||||||||||||
| Three months ended June 30, 2018 | Generation | Systems | and Other | Total | ||||||||||||
| Revenue transferred at a point in time | $ | 4,637 | $ | 1,838 | $ | – | $ | 6,475 | ||||||||
| Revenue transferred over time | 139 | 995 | – | 1,134 | ||||||||||||
| Revenues from external customers | 4,776 | 2,833 | – | 7,609 | ||||||||||||
| Gross profit | 1,419 | 682 | – | 2,101 | ||||||||||||
| Selling, general and administrative expenses | 700 | 1,057 | 1,267 | 3,024 | ||||||||||||
| Research and product development expenses | 855 | 1,007 | 18 | 1,880 | ||||||||||||
| Segment loss | (136 | ) | (1,382 | ) | (1,285 | ) | (2,803 | ) | ||||||||
| Interest expense, net | – | – | (372 | ) | (372 | ) | ||||||||||
| Foreign currency losses, net | – | – | (177 | ) | (177 | ) | ||||||||||
| Loss from joint ventures | – | – | (1,492 | ) | (1,492 | ) | ||||||||||
| Other finance gains, net | – | – | 43 | 43 | ||||||||||||
| Loss before income taxes | $ | (136 | ) | $ | (1,382 | ) | $ | (3,283 | ) | $ | (4,801 | ) | ||||
| At June 30, 2018 | ||||||||||||||||
| Total segment assets | $ | 24,352 | $ | 26,721 | $ | 8,076 | $ | 59,149 | ||||||||
| Total segment liabilities (current and non-current) | $ | 12,340 | $ | 20,687 | $ | 8,797 | $ | 41,824 |
| 2019 Q2 Condensed Interim Consolidated Financial Statements | Page 24 |
| Hydrogenics Corporation |
| Hydrogenics Corporation |
| Notes to Condensed Interim Consolidated Financial Statements |
| For the six months ended June 30, 2019 |
| (in thousands of US dollars, except share and per share amounts) |
| (unaudited) |
| OnSite | Power | Corporate | ||||||||||||||
| Six months ended June 30, 2019 | Generation | Systems | and Other | Total | ||||||||||||
| Revenue transferred at a point in time | $ | 9,634 | $ | 4,435 | $ | – | $ | 14,069 | ||||||||
| Revenue transferred over time | 434 | 4,036 | 4,470 | |||||||||||||
| Revenues from external customers | 10,068 | 8,471 | – | 18,539 | ||||||||||||
| Gross profit | 1,191 | 4,037 | 5,228 | |||||||||||||
| Selling, general and administrative expenses | 1,305 | 2,053 | 5,225 | 8,583 | ||||||||||||
| Research and product development expenses | 722 | 2,744 | 38 | 3,504 | ||||||||||||
| Segment loss | (836 | ) | (760 | ) | (5,263 | ) | (6,859 | ) | ||||||||
| Interest expense, net | – | – | (572 | ) | (572 | ) | ||||||||||
| Foreign currency losses, net | – | – | (19 | ) | (19 | ) | ||||||||||
| Gain from joint venture | – | – | 26 | 26 | ||||||||||||
| Other finance gains, net | – | – | 11 | 11 | ||||||||||||
| Loss before income taxes | $ | (836 | ) | $ | (760 | ) | $ | (5,817 | ) | $ | (7,413 | ) |
| OnSite | Power | Corporate | ||||||||||||||
| Six months ended June 30, 2018 | Generation | Systems | and Other | Total | ||||||||||||
| Revenue transferred at a point in time | $ | 8,171 | $ | 5,590 | $ | – | $ | 13,761 | ||||||||
| Revenue transferred over time | 366 | 1,629 | – | 1,995 | ||||||||||||
| Revenues from external customers | 8,537 | 7,219 | – | 15,756 | ||||||||||||
| Gross profit | 2,655 | 2,684 | – | 5,339 | ||||||||||||
| Selling, general and administrative expenses | 1,451 | 2,122 | 2,287 | 5,860 | ||||||||||||
| Research and product development expenses | 1,487 | 2,446 | 28 | 3,961 | ||||||||||||
| Segment loss | (283 | ) | (1,884 | ) | (2,315 | ) | (4,482 | ) | ||||||||
| Interest expense, net | – | – | (753 | ) | (753 | ) | ||||||||||
| Foreign currency gains, net | – | – | 42 | 42 | ||||||||||||
| Loss from joint ventures | – | – | (1,561 | ) | (1,561 | ) | ||||||||||
| Other finance gains, net | – | – | 299 | 299 | ||||||||||||
| Loss before income taxes | $ | (283 | ) | $ | (1,884 | ) | $ | (4,288 | ) | $ | (6,455 | ) |
| 2019 Q2 Condensed Interim Consolidated Financial Statements | Page 25 |
| Hydrogenics Corporation |
| Hydrogenics Corporation |
| Notes to Condensed Interim Consolidated Financial Statements |
| For the six months ended June 30, 2019 |
| (in thousands of US dollars, except share and per share amounts) |
| (unaudited) |
Note 23 – Risk Management Arising From Financial Instruments
Fair value
The carrying value of cash and cash equivalents, restricted cash, trade and other receivables, trade and other payables and current portion of contract assets and contract liabilities approximates their fair value given their short-term nature. The carrying value of the non-current restricted cash, contract assets and contract liabilities and other liabilities approximates their fair value given the difference between the discount rates used to recognize the liabilities in the consolidated balance sheets and the market rates of interest is insignificant.
Fair value measurements recognized in the consolidated balance sheets must be categorized in accordance with the following levels:
| (i) | Level 1: quoted prices (unadjusted) in active markets for identical assets or liabilities; |
| (ii) | Level 2: inputs other than quoted prices included in Level 1 that are observable for the asset or liability, either directly (i.e. as prices) or indirectly (i.e. derived from prices); and |
| (iii) | Level 3: inputs for the asset or liability that are not based on observable market data (unobservable inputs). |
The fair value of the liabilities relating to the DSUs is classified as Level 1. The fair value of the warrants are classified as Level 2.
The Company has not transferred any financial instruments between Levels 1, 2, or 3 of the fair value hierarchy during the three and six months ended June 30, 2019 and 2018.
Financial instruments are classified into one of the following categories: financial assets at fair value through profit and loss; financial liabilities at fair value through profit or loss; financial assets at amortized cost, financial liabilities at amortized cost, and financial assets at fair value through other comprehensive income. The following table summarizes information regarding the carrying value of the Company’s financial instruments:
| June 30, | December 31, | |||||||
| 2019 | 2018 | |||||||
| Cash and cash equivalents | $ | 16,741 | $ | 7,561 | ||||
| Restricted cash (current and non-current) | 994 | 1,176 | ||||||
| Restricted cash – non-current | ||||||||
| Trade and other receivables, including contract assets | 14,606 | 12,951 | ||||||
| Financial assets at amortized cost | $ | 32,341 | $ | 21,688 | ||||
| Trade and other payables | $ | 8,628 | $ | 9,068 | ||||
| Long-term debt and repayable government contribution (current and non-current) | 8,025 | 8,049 | ||||||
| Contract liabilities, current and non-current | 14,512 | 16,001 | ||||||
| Lease liabilities | 3,495 | 33 | ||||||
| Financial liabilities at amortized cost | $ | 34,660 | $ | 33,151 | ||||
| DSU liability | 1,995 | 730 | ||||||
| Warrants | – | 11 | ||||||
| Financial liabilities at fair value through profit or loss | $ | 1,995 | $ | 741 |
| 2019 Q2 Condensed Interim Consolidated Financial Statements | Page 26 |
| Hydrogenics Corporation |
| Hydrogenics Corporation |
| Notes to Condensed Interim Consolidated Financial Statements |
| For the six months ended June 30, 2019 |
| (in thousands of US dollars, except share and per share amounts) |
| (unaudited) |
Liquidity risk
The Company has sustained losses and negative cash flows from operations since its inception. At June 30, 2019 the Company had $16,741 (December 31, 2018 – $7,561) of current unrestricted cash and cash equivalents. Liquidity risk is the risk the Company will encounter difficulty in meeting its financial obligations associated with financial liabilities that are settled by delivering cash or another financial asset. The Company is exposed to liquidity risk as it continues to have net cash outflows from its operations. The Company’s objective for liquidity risk management is to maintain sufficient liquid financial resources to fund the consolidated balance sheets, pursue growth and development strategies, and to meet commitments and obligations in the most cost-effective manner possible. The Company achieves this by maintaining sufficient cash and cash equivalents and managing working capital. The Company monitors its financial position on a monthly basis at minimum, and updates its expected use of cash resources based on the latest available data. Such forecasting takes into consideration the Company’s financing plans and compliance with internal targets. A significant portion of the Company’s financial liabilities is classified as current liabilities, as settlement is expected within one year.
There are uncertainties related to the timing and use of the Company’s cash resources and working capital requirements. These uncertainties include, among other things, the timing and volume of commercial sales and associated gross margin of our existing products and the development of markets for, and customer acceptance of, new products. Throughout 2019 the Company’s operations may not generate sufficient cash flow to fund our obligations. As such, these obligations will be funded out of existing and forecasted cash resources. Hydrogenics may need to take additional measures to increase its liquidity and capital resources, including obtaining additional debt or equity financing, pursuing joint-venture arrangements, equipment financings or other receivables financing arrangements. Hydrogenics may experience difficulty in obtaining satisfactory financing terms. Failure to obtain adequate financing on satisfactory terms could have a material adverse effect on Hydrogenics’ results of operations or financial condition.
Credit risk
The Company applies the simplified approach to providing for expected credit losses prescribed by IFRS 9, which permits the use of the lifetime expected loss provision for all trade receivables and contract assets. To measure the expected credit losses, trade receivables and contract assets have been grouped based on shared credit risk characteristics and the days past due. The contract assets relate to unbilled work in progress and have substantially the same risk characteristics as the trade receivables for the same type of contracts. The Company has therefore determined that the expected loss rates for trade receivables are a reasonable approximation of the loss rates for the contract assets.
The loss allowance at June 30, 2019 was determined as follows for both trade receivables and contract assets. The expected credit losses also incorporate forward looking information:
| June 30, 2019: | Not yet due | Less than 31 days past due | 31-60 days past due | More than 60 days past due | Total | |||||||||||||||
| Expected loss rate | 0.06 | % | 1.23 | % | 9.14 | % | 5.08 | % | ||||||||||||
| Gross carrying amount | $ | 10,450 | $ | 364 | $ | 68 | $ | 348 | $ | 11,230 | ||||||||||
| Loss allowance | $ | 6 | $ | 5 | $ | 6 | $ | 18 | $ | 35 |
Trade receivables and contract assets are written off when there is no reasonable expectation of recovery. During the six months ended June 30, 2019, the Company made no write-offs of trade receivables and was awarded an arbitration settlement in the amount of $376 in May 2019 for trade receivables that were previously written off.
| 2019 Q2 Condensed Interim Consolidated Financial Statements | Page 27 |
| Hydrogenics Corporation |
| Hydrogenics Corporation |
| Notes to Condensed Interim Consolidated Financial Statements |
| For the six months ended June 30, 2019 |
| (in thousands of US dollars, except share and per share amounts) |
| (unaudited) |
Foreign currency risk
Foreign currency risk arises because of fluctuations in exchange rates. The Company conducts a significant portion of its business activities in currencies other than the Company’s functional currency of US dollars and the functional currency of its Belgium and German subsidiaries in euros. This primarily includes Canadian dollar transactions at the parent company and US dollar transactions at the Company’s subsidiaries in Belgium and Germany.
The Company’s objective in managing its foreign currency risk is to minimize its net exposure to foreign currency cash flows by converting foreign denominated financial assets into the applicable currency of the foreign subsidiaries to the extent practicable to match the obligations of its financial liabilities. The Company also periodically enters into foreign exchange forward contracts to limit its exposure to foreign currency rate fluctuations. There were no foreign exchange forward contracts in place at June 30, 2019.
Financial assets and financial liabilities denominated in foreign currencies will be affected by changes in the exchange rate between the functional currency and these foreign currencies. This primarily includes cash and cash equivalents; trade and other receivables; contract assets, trade and other payables, contract liabilities and other long-term liabilities, which are denominated in foreign currencies.
Note 24 – Capital Management
The Company’s objective in managing capital is to ensure sufficient liquidity to pursue its growth strategy, fund research and product development, while at the same time, taking a conservative approach toward financial leverage and management of financial risk.
The Company’s primary uses of capital are to finance operations, increase non-cash working capital and capital expenditures. The Company currently funds these requirements from existing cash resources, cash raised through share issuances and long-term debt. The Company’s objectives when managing capital are to ensure the Company will continue to have enough liquidity so it can provide its products and services to its customers and returns to its shareholders. The Company monitors its capital on the basis of the adequacy of its cash resources to fund its business plan. In order to maximize the capacity to finance the Company’s ongoing growth, the Company does not currently pay a dividend to holders of its common shares.
The Company’s capital is composed of debt and shareholders’ equity as follows:
| June 30, | December 31, | |||||||
| 2019 | 2018 | |||||||
| Total equity | $ | 24,293 | $ | 10,961 | ||||
| Long-term debt (EDC and Province of Ontario) | 8,025 | 8,082 | ||||||
| Total | 32,318 | 19,043 | ||||||
| Less: Cash and cash equivalents and restricted cash | 17,735 | 8,737 | ||||||
| Total capital employed | $ | 14,583 | $ | 10,306 |
| 2019 Q2 Condensed Interim Consolidated Financial Statements | Page 28 |
| Hydrogenics Corporation |
| Hydrogenics Corporation |
| Notes to Condensed Interim Consolidated Financial Statements |
| For the six months ended June 30, 2019 |
| (in thousands of US dollars, except share and per share amounts) |
| (unaudited) |
Note 25 - Subsequent Events
On June 28, 2019, the Company entered into an arrangement agreement (the “Arrangement Agreement”) with Cummins Inc. (“Cummins”) and Atlantis AcquisitionCo Canada Corporation (the “Purchaser”), pursuant to which the Purchaser, a subsidiary of Cummins Inc., has agreed to acquire all of the outstanding common shares of the Company (the “Shares”), other than Shares owned by The Hydrogen Company, a wholly owned subsidiary of L’Air Liquide S.A. (“Air Liquide”), for US$15.00 in cash per Share (the “Transaction”). The Hydrogen Company has agreed to exchange its Shares for shares of the Purchaser pursuant to the Transaction. The Transaction is structured as a statutory plan of arrangement under the Canada Business Corporations Act. The Transaction requires approval of at least 66 2/3% of the votes cast by Shareholders, as well as the approval by a simple majority of votes cast by disinterested Shareholders, excluding Shares held by The Hydrogen Company and its affiliates, and any other Shareholders required to be excluded under MI 61-101.
On July 31, 2019, the Company issued a Notice of Meeting and Management Information Circular (“Circular”) setting August 29, 2019 for a Special Meeting of the Shareholders to approve the Transaction. If approved by the Shareholders, the Transaction is expected to close in Q3 2019 and, as a result, the Company’s shares will be delisted from Toronto Stock Exchange and NASDAQ. The Company has incurred $811 in costs during the six months ended June 30, 2019 related to the Transaction which was included in selling, general and administrative expenses in the condensed interim consolidated statements of operations and comprehensive loss.
| 2019 Q2 Condensed Interim Consolidated Financial Statements | Page 29 |
EXHIBIT 99.4

THE ENERGY SHIFT IS UNDERWAY Q2 2019 EARNINGS PRESENTATION August 12, 2019
Safe Harbor Statement Certain statements in the Business Update and Order Backlog sections contain forward - looking statements within the meaning of the “safe harbor” provisions of the U . S . Private Securities Litigation Reform Act of 1995 , and under applicable Canadian securities laws . These statements are based on management’s current expectations and actual results may differ from these forward - looking statements due to numerous factors, including : the failure to obtain necessary approvals or satisfy the conditions to closing the Transaction, including the requisite approval from the Shareholders at the special meeting of Shareholders to be held on August 29 , 2019 ; the occurrence of any event, change or other circumstance that could give rise to the termination of the arrangement agreement in respect of the Transaction ; material adverse changes in the business or affairs of Hydrogenics ; either party’s failure to consummate the Transaction when required ; our inability to increase our revenues or raise additional funding to continue operations, execute our business plan, or to grow our business ; our inability to address a slow return to economic growth, and its impact on our business, results of operations and consolidated financial condition ; our limited operating history ; inability to implement our business strategy ; fluctuations in our quarterly results ; failure to maintain our customer base that generates the majority of our revenues ; currency fluctuations ; failure to maintain sufficient insurance coverage ; changes in value of goodwill ; failure of a significant market to develop for our products ; failure of hydrogen being readily available on a cost - effective basis ; changes in government policies and regulations ; failure of uniform codes and standards for hydrogen fueled vehicles and related infrastructure to develop ; liability for environmental damages resulting from our research, development or manufacturing operations ; failure to compete with other developers and manufacturers of products in our industry ; failure to compete with developers and manufacturers of traditional and alternative technologies ; failure to develop partnerships with original equipment manufacturers, governments, systems integrators and other third parties ; inability to obtain sufficient materials and components for our products from suppliers ; failure to manage expansion of our operations ; failure to manage foreign sales and operations ; failure to recruit, train and retain key management personnel ; inability to integrate acquisitions ; failure to develop adequate manufacturing processes and capabilities ; failure to complete the development of commercially viable products ; failure to produce cost - competitive products ; failure or delay in field testing of our products ; failure to produce products free of defects or errors ; inability to adapt to technological advances or new codes and standards ; failure to protect our intellectual property ; our involvement in intellectual property litigation ; exposure to product liability claims ; failure to meet rules regarding passive foreign investment companies ; actions of our significant and principal shareholders ; dilution as a result of significant issuances of our common shares and preferred shares ; inability of US investors to enforce US civil liability judgments against us ; volatility of our common share price ; dilution as a result of the exercise of options ; and failure to meet continued listing requirements of Nasdaq . Readers should not place undue reliance on Hydrogenics’ forward - looking statements . Investors are encouraged to review the section captioned “Risk Factors” in our regulatory filings with the Canadian securities regulatory authorities and the US Securities and Exchange Commission for a more complete discussion of factors that could affect our future performance . Furthermore, the forward - looking statements contained herein are made as of the date of this presentation, and we undertake no obligation to revise or update any forward - looking statements in order to reflect events or circumstances that may arise after the date of this presentation, unless otherwise required by law . The forward - looking statements contained in this presentation are expressly qualified by this paragraph .

© Copyright 2019 HYDROGENICS Page 3 Q2 2019 Highlights Hydrogen rail momentum remains strong in multiple jurisdictions Financials / New Projects New Milestones New Developments / Deployments Backlog at $144M • Q2 revenue $10.4 million, up 37% over Q2 2018 • Gross margin impacted by product mix • Agreement with Halcyon Power to build first hydrogen production facility in New Zealand 4 1 2 3

© Copyright 2019 HYDROGENICS Page 4 • On June 28, 2019, we announced that we had entered into an arrangement agreement with Cummins and its subsidiary to be acquired for $15.00 per share in cash. » Values the Company at just under $300 million • The Hydrogen Company (a subsidiary of Air Liquide) has agreed to exchange its shares for shares of the Cummins subsidiary pursuant to the transaction. • Shareholders of record as of July 15, 2019 will be asked to vote on a special resolution to approve the transaction on August 29, 2019. • Subject to the outcome of this meeting and satisfaction or waiver of all other conditions precedent, the Company expects the transaction to close in September 2019. Cummins Acquisition

© Copyright 2019 HYDROGENICS Page 5 Hydrogen Rail Progress • Highly Publicized Activity • Alstom is consummating orders with customers • +100,000kms of cumulative flawless operations to date • Industry first achievements • Working with Alstom to finalize production arrangements for 81 systems • To be delivered beginning in 2020 per our 2015 exclusive agreement • Additional demand expected in Europe and the UK based o n current RFPs • Positions Hydrogenics as world leader in rail mobility fuel cells

© Copyright 2019 HYDROGENICS Page 6 Outlook for 2019 and Beyond Rail applications now growing rapidly, with Alstom serving as the driver for global adoption escalation China still under development – being impacted by ongoing trade/economic issues . Overall anticipating strong year - over - year revenue growth, with outlook for 2020 even brighter Continued cost discipline and efficiency improvements driving Company towards profitability

© Copyright 2019 HYDROGENICS Page 7 Notes Three months ended June 30, 2019 2018 2019 4.8 7.6 2.8 2.8 Power Systems OnSite Generation Revenue ($M) 10.4 7.6 Q2 Revenue OnSite Generation Power Systems 4.8 2.8 7.6 2.8 2018 2019 Revenue ($M) by Business Unit » Revenue up 37% over prior year comparative period on the strength of OnSite Generation equipment deliveries.

© Copyright 2019 HYDROGENICS Page 8 Notes Six months ended June 30, 2019 2018 2019 8.5 10.0 7.3 8.5 Power Systems OnSite Generation Revenue ($M) 18.5 15.8 YTD Revenue OnSite Generation Power Systems 8.5 7.3 10.0 8.5 2018 2019 Revenue ($M) by Business Unit » Revenue up 18% over prior year comparative period reflecting increased equipment deliveries within OnSite Generation and impr ove d license fee revenue within Power Systems.

© Copyright 2019 HYDROGENICS Page 9 Notes » Onsite Generation margin was 15.5% versus 29.7% due to the low margin earned on a custom fueling station project versus consistent target margins achieved on equipment delivered in the comparative period. » Power Systems margin was 6.3% versus 24.1% in the comparative period due to additional warranty costs and inventory provision booked on obsolete stock. Three months ended June 30, 2019 Q2 Gross Margin OnSite Generation Power Systems 29.7 24.1 15.5 6.3 2018 2019 Gross Margin (%) by Business Unit 2018 2019 Power Systems OnSite Generation Gross Margin (%) 12.9 27.6

© Copyright 2019 HYDROGENICS Page 10 Notes » Onsite Generation margin was 11.8% versus 31.1% due to shipment of a lower margin projects in the current period and the recovery of margin in the prior period due to the reversal of expired warranties. » Power Systems performance reflects the impact of higher margins earned on license fee revenue recognized during the current year. Six months ended June 30, 2019 YTD Gross Margin OnSite Generation Power Systems 31.1 37.2 11.8 47.7 2018 2019 Gross Margin (%) by Business Unit 2018 2019 Power Systems OnSite Generation Gross Margin (%) 28.2 33.9

© Copyright 2019 HYDROGENICS Page 11 Notes » Adjusted EBITDA is defined as net loss excluding : cash settled long term compensation indexed to share price, share settled stock - based compensation expense, net finance income and expenses, depreciation and amortization . » Current period includes $ 0 . 7 of one - time expenses related to the contemplated Cummins acquisition . » Adjusted EBITDA is a non - IFRS measure and may not be comparable to similar measures used by other companies . » Management uses Adjusted EBITDA as a useful measure of ongoing operational results . ($ M) Q2 Results Three months ended Jun. 30, Change 2019 2018 $ % Revenue $ 10.4 $ 7.6 2.8 37% Gross Profit 1.4 2.1 (0.7) (36)% Gross Margin % 13% 28% Operating Expenses Selling, general and administrative (excluding stock - based compensation, amortization and depreciation) 3.0 2.6 0.4 15% Research and product development 1 1.7 1.9 (0.2) (10)% Adjusted EBITDA $ (3.3) $ (2.4) 0.9 34% 1 Research and product development costs: 2019 2018 Research and product development - gross 2.2$ 3.3$ Less: research and product development funding (0.5) (1.4) Research and product development - net 1.7$ 1.9$
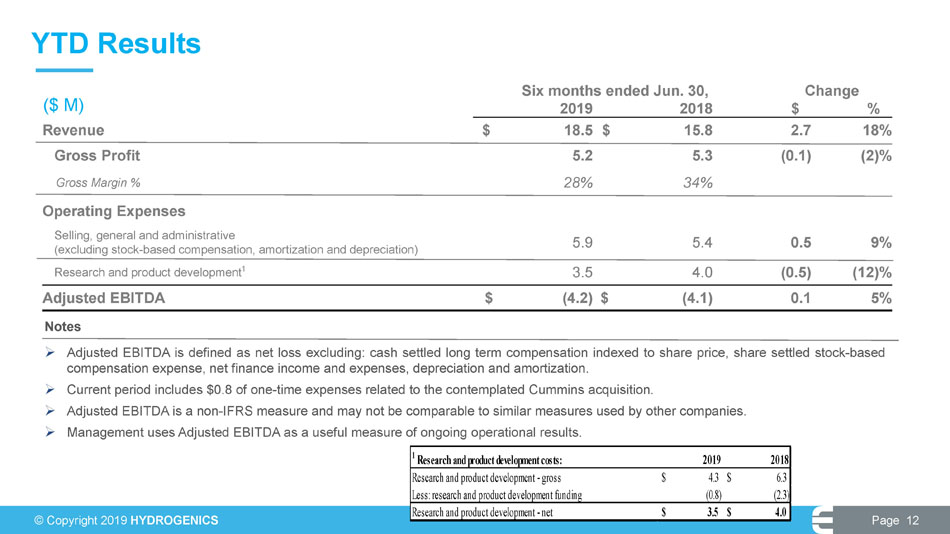
© Copyright 2019 HYDROGENICS Page 12 Notes » Adjusted EBITDA is defined as net loss excluding : cash settled long term compensation indexed to share price, share settled stock - based compensation expense, net finance income and expenses, depreciation and amortization . » Current period includes $ 0 . 8 of one - time expenses related to the contemplated Cummins acquisition . » Adjusted EBITDA is a non - IFRS measure and may not be comparable to similar measures used by other companies . » Management uses Adjusted EBITDA as a useful measure of ongoing operational results . ($ M) YTD Results Six months ended Jun. 30, Change 2019 2018 $ % Revenue $ 18.5 $ 15.8 2.7 18% Gross Profit 5.2 5.3 (0.1) (2)% Gross Margin % 28% 34% Operating Expenses Selling, general and administrative (excluding stock - based compensation, amortization and depreciation) 5.9 5.4 0.5 9% Research and product development 1 3.5 4.0 (0.5) (12)% Adjusted EBITDA $ (4.2) $ (4.1) 0.1 5% 1 Research and product development costs: 2019 2018 Research and product development - gross 4.3$ 6.3$ Less: research and product development funding (0.8) (2.3) Research and product development - net 3.5$ 4.0$

© Copyright 2019 HYDROGENICS Page 13 Order Backlog » Of the above backlog of $ 144 . 1 million, we expect to recognize approximately $ 60 million as revenue in the following twelve months . » Revenue for the year ending December 31 , 2019 will also include orders received and delivered in 2019 . As of June 30, 2019 ($M) March 31/19 Orders Orders June 30/19 Backlog Received FX Delivered Backlog OnSite Generation $ 40.0 $ 3.5 $ 0.1 $ 7.6 $ 36.0 Power Systems 110.0 0.9 - 2.8 $ 108.1 Total $ 150.0 $ 4.4 $ 0.1 $ 10.4 $ 144.1 Notes

© Copyright 2019 HYDROGENICS Page 14 Consolidated Balance Sheet Highlights ($M) Jun. 30, Dec. 31, Change 2019 2018 $ % Cash and cash equivalents and restricted cash $ 17.7 $ 8.7 9.0 103% Trade, other and grants receivable 8.0 6.7 1.3 19% Contract assets - (current and non - current) 6.6 6.2 0.4 6% Inventories 18.9 17.2 1.7 10% Trade and other payables 8.6 9.1 (0.5) (5%) Contract liabilities - (current and non - current) 14.5 16.0 1.5 (9%) Financial liabilities 6.1 3.4 2.7 82%

© Copyright 2019 HYDROGENICS Page 15 Q2 Reconciliation of Non - IFRS Measures – Adj. EBITDA ($M) Three months ended Three months ended June 30, 2019 June 30, 2018 Net loss $ (4.8) $ (4.8) Loss from joint venture - 1.5 Finance loss (income, net) - 0.6 Income tax expense - - Amortization and depreciation 0.3 0.2 Compensation indexed to share price 1.0 (0.1) Stock - based compensation expense 0.2 0.2 Adjusted EBITDA $ (3.3) $ (2.4) » Certain figures have been adjusted for rounding Notes
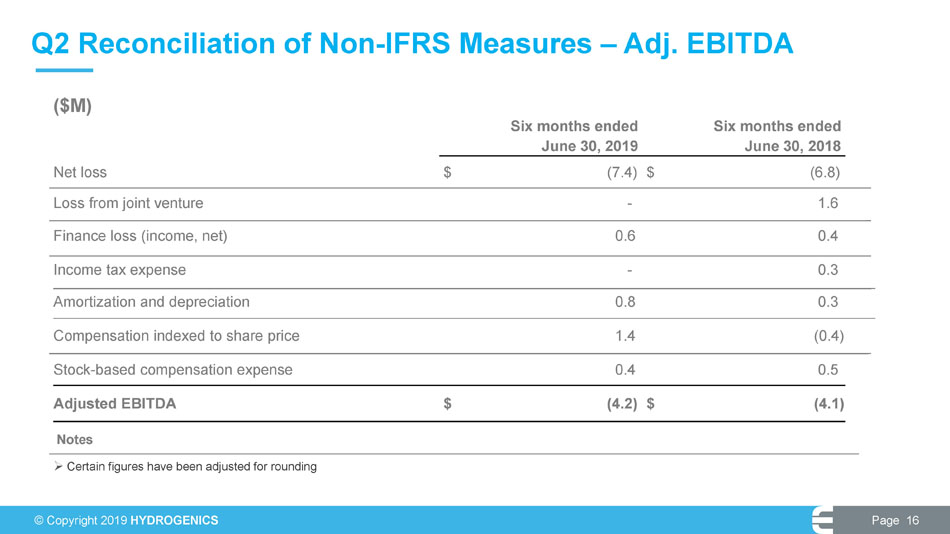
© Copyright 2019 HYDROGENICS Page 16 Q2 Reconciliation of Non - IFRS Measures – Adj. EBITDA ($M) Six months ended Six months ended June 30, 2019 June 30, 2018 Net loss $ (7.4) $ (6.8) Loss from joint venture - 1.6 Finance loss (income, net) 0 . 6 0.4 Income tax expense - 0.3 Amortization and depreciation 0.8 0.3 Compensation indexed to share price 1.4 (0.4) Stock - based compensation expense 0.4 0.5 Adjusted EBITDA $ (4.2) $ (4.1) » Certain figures have been adjusted for rounding Notes

We specialize in helping our customers succeed. Experience / Leadership / Technology The human factor
EXHIBIT 99.5
FORM 52-109F2
CERTIFICATION OF INTERIM FILINGS
FULL CERTIFICATE
I, Daryl Wilson, President and Chief Executive Officer of Hydrogenics Corporation, certify the following:
| 1. | Review: I have reviewed the interim financial report and interim MD&A (together, the “interim filings”) of Hydrogenics Corporation (the “issuer”) for the interim period ended June 30, 2019. |
| 2. | No misrepresentations: Based on my knowledge, having exercised reasonable diligence, the interim filings do not contain any untrue statement of a material fact or omit to state a material fact required to be stated or that is necessary to make a statement not misleading in light of the circumstances under which it was made, with respect to the period covered by the interim filings. |
| 3. | Fair presentation: Based on my knowledge, having exercised reasonable diligence, the interim financial report together with the other financial information included in the interim filings fairly present in all material respects the financial condition, financial performance and cash flows of the issuer, as of the date of and for the periods presented in the interim filings. |
| 4. | Responsibility: The issuer’s other certifying officer(s) and I are responsible for establishing and maintaining disclosure controls and procedures (DC&P) and internal control over financial reporting (ICFR), as those terms are defined in National Instrument 52-109 Certification of Disclosure in Issuers’ Annual and Interim Filings, for the issuer. |
| 5. | Design: Subject to the limitations, if any, described in paragraphs 5.2 and 5.3, the issuer’s other certifying officer(s) and I have, as at the end of the period covered by the interim filings |
| (a) | designed DC&P, or caused it to be designed under our supervision, to provide reasonable assurance that |
| (i) | material information relating to the issuer is made known to us by others, particularly during the period in which the interim filings are being prepared; and |
| (ii) | information required to be disclosed by the issuer in its annual filings, interim filings or other reports filed or submitted by it under securities legislation is recorded, processed, summarized and reported within the time periods specified in securities legislation; and |
| (b) | designed ICFR, or caused it to be designed under our supervision, to provide reasonable assurance regarding the reliability of financial reporting and the preparation of financial statements for external purposes in accordance with the issuer’s GAAP. |
| 5.1 | Control framework: The control framework the issuer’s other certifying officer(s) and I used to design the issuer’s ICFR is Internal Control – Integrated Framework (2013) published by the Committee of Sponsoring Organizations of the Treadway Commission (COSO). |
| 5.2 | N/A |
| 5.3 | N/A |
| 6. | Reporting changes in ICFR: The issuer has disclosed in its interim MD&A any change in the issuer’s ICFR that occurred during the period beginning on April 1, 2019 and ended on June 30, 2019 that has materially affected, or is reasonably likely to materially affect, the issuer’s ICFR. |
Date: August 12, 2019.
| /s/ Daryl Wilson |
Daryl Wilson
President and Chief Executive Officer
EXHIBIT 99.6
FORM 52-109F2
CERTIFICATION OF INTERIM FILINGS
FULL CERTIFICATE
I, Marc Beisheim, Chief Financial Officer of Hydrogenics Corporation, certify the following:
| 1. | Review: I have reviewed the interim financial report and interim MD&A (together, the “interim filings”) of Hydrogenics Corporation (the “issuer”) for the interim period ended June 30, 2019. |
| 2. | No misrepresentations: Based on my knowledge, having exercised reasonable diligence, the interim filings do not contain any untrue statement of a material fact or omit to state a material fact required to be stated or that is necessary to make a statement not misleading in light of the circumstances under which it was made, with respect to the period covered by the interim filings. |
| 3. | Fair presentation: Based on my knowledge, having exercised reasonable diligence, the interim financial report together with the other financial information included in the interim filings fairly present in all material respects the financial condition, financial performance and cash flows of the issuer, as of the date of and for the periods presented in the interim filings. |
| 4. | Responsibility: The issuer’s other certifying officer(s) and I are responsible for establishing and maintaining disclosure controls and procedures (DC&P) and internal control over financial reporting (ICFR), as those terms are defined in National Instrument 52-109 Certification of Disclosure in Issuers’ Annual and Interim Filings, for the issuer. |
| 5. | Design: Subject to the limitations, if any, described in paragraphs 5.2 and 5.3, the issuer’s other certifying officer(s) and I have, as at the end of the period covered by the interim filings |
| (a) | designed DC&P, or caused it to be designed under our supervision, to provide reasonable assurance that |
| (i) | material information relating to the issuer is made known to us by others, particularly during the period in which the interim filings are being prepared; and |
| (ii) | information required to be disclosed by the issuer in its annual filings, interim filings or other reports filed or submitted by it under securities legislation is recorded, processed, summarized and reported within the time periods specified in securities legislation; and |
| (b) | designed ICFR, or caused it to be designed under our supervision, to provide reasonable assurance regarding the reliability of financial reporting and the preparation of financial statements for external purposes in accordance with the issuer’s GAAP. |
| 5.1 | Control framework: The control framework the issuer’s other certifying officer(s) and I used to design the issuer’s ICFR is Internal Control – Integrated Framework (2013) published by the Committee of Sponsoring Organizations of the Treadway Commission (COSO). |
| 5.2 | N/A |
| 5.3 | N/A |
| 6. | Reporting changes in ICFR: The issuer has disclosed in its interim MD&A any change in the issuer’s ICFR that occurred during the period beginning on April 1, 2019 and ended on June 30, 2019 that has materially affected, or is reasonably likely to materially affect, the issuer’s ICFR. |
Date: August 12, 2019.
| /s/ Marc Beisheim |
Marc Beisheim
Chief Financial Officer
Serious News for Serious Traders! Try StreetInsider.com Premium Free!
You May Also Be Interested In
- TransBoden: A New Solana Memecoin, Successfully Launches $BODENX in a 100% Token Fair Launch
- Bragar Eagel & Squire, P.C. Reminds Investors That Class Action Lawsuits Have Been Filed Against Ocugen, QuidelOrtho, and Sharecare and Encourages Investors to Contact the Firm
- Ali Yassine Joins AiMining Technologies, a Subsidiary of iMining, as Healthcare Advisory Board Member
Create E-mail Alert Related Categories
SEC FilingsSign up for StreetInsider Free!
Receive full access to all new and archived articles, unlimited portfolio tracking, e-mail alerts, custom newswires and RSS feeds - and more!
