

Form 6-K HEXO Corp. For: Jun 14
 Tweet
Tweet Share
Share
UNITED STATES
SECURITIES AND EXCHANGE COMMISSION
Washington, D.C. 20549
FORM 6-K
REPORT OF FOREIGN PRIVATE ISSUER
PURSUANT TO RULE 13a-16 OR 15d-16
UNDER THE SECURITIES EXCHANGE ACT OF 1934
For the month of June 2021
Commission File Number: 001-38781
HEXO Corp.
(Translation of registrant’s name into English)
3000 Solandt Road
Ottawa, Ontario, Canada K2K 2X2
(Address of principal executive office)
Indicate by check mark whether the registrant files or will file annual reports under cover of Form 20-F or Form 40-F. Form 20-F ☐ Form 40-F ☒
Indicate by check mark if the registrant is submitting the Form 6-K in paper as permitted by Regulation S-T Rule 101(b)(1): ☐
Indicate by check mark if the registrant is submitting the Form 6-K in paper as permitted by Regulation S-T Rule 101(b)(7): ☐
EXPLANATORY NOTE
Exhibits 99.1 and 99.2 included with this Report on Form 6-K are hereby incorporated by reference into (i) the Registration Statement on Form F-10 of HEXO Corp. and HEXO Operations Inc. (File No. 333-256131), and (ii) the Registration Statement on Form F-10 of HEXO Corp. (File No. 333-255264).
| Exhibit |
Description | |
| 99.1 |
Condensed interim consolidated financial statements for the three and nine months ended April 30, 2021 and 2020 | |
| 99.2 |
Management’s Discussion and Analysis for the three and nine months ended April 30, 2021 | |
| 99.3 |
Form 52-109F2 — Certification of Interim Filings - CEO | |
| 99.4 |
Form 52-109F2 — Certification of Interim Filings - CFO | |
SIGNATURES
Pursuant to the requirements of the Securities Exchange Act of 1934, the registrant has duly caused this report to be signed on its behalf by the undersigned, thereunto duly authorized.
| HEXO Corp. | ||||||
| Date: June 14, 2021 | /s/ Sébastien St-Louis | |||||
| President and Chief Executive Officer | ||||||
Exhibit 99.1

HEXO Corp. Condensed Interim Consolidated Financial Statements For the three and nine months ended April 30, 2021 and 2020
Table of Contents
| Condensed Interim Consolidated Statements of Financial Position | 1 | |||
| Condensed Interim Consolidated Statements of Net Loss and Comprehensive Loss | 2 | |||
| Condensed Interim Consolidated Statements of Changes in Shareholders’ Equity | 3 | |||
| Condensed Interim Consolidated Statements of Cash Flows | 4 | |||
| Notes to the Condensed Interim Consolidated Financial Statements: | ||||
| 1. Description of Business | 5 | |||
| 2. Basis of Preparation | 5 | |||
| 3. New Accounting Policies and Pronouncements | 5 | |||
| 4. Restricted Funds | 6 | |||
| 5. Commodity Taxes Recoverable and Other Receivables | 6 | |||
| 6. Inventory | 6 | |||
| 7. Biological Assets | 7 | |||
| 8. Investments in Associates & Joint Ventures | 7 | |||
| 9. Long-term Investments | 8 | |||
| 10. Property, Plant and Equipment | 8 | |||
| 11. Intangible Assets | 9 | |||
| 12. Convertible Debenture Receivable | 9 | |||
| 13. Warrant Liabilities | 9 | |||
| 14. Convertible Debentures | 10 | |||
| 15. Lease Liabilities | 10 | |||
| 16. Term Loan | 11 | |||
| 17. Share Capital | 11 | |||
| 18. Common Share Purchase Warrants | 12 | |||
| 19. Share-based Compensation | 13 | |||
| 20. Net Loss per Share | 15 | |||
| 21. Financial Instruments | 15 | |||
| 22. Operating Expenses by Nature | 17 | |||
| 23. Other Income and Losses | 17 | |||
| 24. Related Party Disclosure | 18 | |||
| 25. Capital Management | 18 | |||
| 26. Commitments and Contingencies | 19 | |||
| 27. Fair Value of Financial Instruments | 20 | |||
| 28. Non-Controlling Interest | 20 | |||
| 29. Revenue from Sale of Goods | 21 | |||
| 30. Segmented Information | 21 | |||
| 31. Operating Cash Flow | 21 | |||
| 32. Comparative Information | 22 | |||
| 33. Income Taxes | 22 | |||
| 34. Subsequent Events | 22 | |||
Condensed Interim Consolidated Statements of Financial Position
(Unaudited, expressed in thousands of Canadian Dollars)
| As at |
Note | April 30, 2021 | July 31, 2020 | |||||||||
| Assets |
||||||||||||
| Current assets |
||||||||||||
| Cash and cash equivalents |
$ | 81,038 | $ | 184,173 | ||||||||
| Restricted funds |
4 | 32,551 | 8,261 | |||||||||
| Trade receivables |
19,049 | 19,426 | ||||||||||
| Commodity taxes recoverable and other receivables |
5 | 10,202 | 16,733 | |||||||||
| Prepaid expenses |
4,386 | 4,606 | ||||||||||
| Inventory |
6 | 95,223 | 64,933 | |||||||||
| Biological assets |
7 | 9,222 | 7,571 | |||||||||
|
|
|
|
|
|||||||||
| 251,671 | 305,703 | |||||||||||
|
|
|
|
|
|||||||||
| Non-current assets |
||||||||||||
| Property, plant and equipment |
10 | 280,183 | 285,366 | |||||||||
| Intangible assets |
11 | 16,412 | 16,008 | |||||||||
| Convertible debenture receivable |
12 | 20,246 | — | |||||||||
| Investment in associate and joint ventures |
8 | 73,379 | 76,306 | |||||||||
| Lease receivable |
3,795 | 3,865 | ||||||||||
| License and prepaid royalty |
— | 1,020 | ||||||||||
| Long-term investments |
9 | 4,402 | 3,209 | |||||||||
| Prepaid expenses |
3,101 | 1,392 | ||||||||||
|
|
|
|
|
|||||||||
| 653,189 | 692,869 | |||||||||||
|
|
|
|
|
|||||||||
| Liabilities |
||||||||||||
| Current liabilities |
||||||||||||
| Accounts payable and accrued liabilities |
42,968 | 32,451 | ||||||||||
| Excise taxes payable |
4,315 | 7,121 | ||||||||||
| Warrant liabilities |
13 | 13,037 | 3,450 | |||||||||
| Lease liability |
15 | 4,659 | 4,772 | |||||||||
| Term loan |
16 | — | 29,930 | |||||||||
| Onerous contract |
26 | 4,763 | 4,763 | |||||||||
|
|
|
|
|
|||||||||
| 69,742 | 82,487 | |||||||||||
|
|
|
|
|
|||||||||
| Non-current liabilities |
||||||||||||
| Lease liability |
15 | 22,566 | 24,344 | |||||||||
| Convertible debentures |
14 | 31,951 | 28,969 | |||||||||
| Other long-term liabilities |
1,805 | 393 | ||||||||||
|
|
|
|
|
|||||||||
| 126,064 | 136,193 | |||||||||||
|
|
|
|
|
|||||||||
| Shareholders’ equity |
||||||||||||
| Share capital |
17 | 1,031,525 | 1,023,788 | |||||||||
| Share-based payment reserve |
19 | 66,381 | 65,746 | |||||||||
| Warrant reserve |
18 | 93,429 | 95,617 | |||||||||
| Contributed surplus |
37,386 | 27,377 | ||||||||||
| Accumulated deficit |
(704,978 | ) | (659,231 | ) | ||||||||
| Accumulated other comprehensive income |
3 | — | ||||||||||
| Non-controlling interest |
28 | 3,379 | 3,379 | |||||||||
|
|
|
|
|
|||||||||
| 527,125 | 556,676 | |||||||||||
|
|
|
|
|
|||||||||
| 653,189 | 692,869 | |||||||||||
|
|
|
|
|
|||||||||
| Commitments and contingencies (Note 26) | ||||||
| Subsequent events (Note 34) |
Approved by the Board of Directors
/s/ Jason Ewart, Director
/s/ Michael Munzar, Director
1
Condensed Interim Consolidated Statements of Net Loss and Comprehensive Loss
(Unaudited, expressed in thousands of Canadian Dollars, except per share data)
| For the three months ended | For the nine months ended | |||||||||||||||||||
| Note | April 30, 2021 |
April 30, 2020 |
April 30, 2021 |
April 30, 2020 |
||||||||||||||||
| Revenue from sale of goods |
29 | 33,082 | 30,895 | 120,059 | 74,009 | |||||||||||||||
| Excise taxes |
(10,482 | ) | (8,817 | ) | (35,219 | ) | (20,516 | ) | ||||||||||||
|
|
|
|
|
|
|
|
|
|||||||||||||
| Net revenue from sale of goods |
22,600 | 22,078 | 84,840 | 53,493 | ||||||||||||||||
| Ancillary revenue |
60 | 54 | 168 | 145 | ||||||||||||||||
|
|
|
|
|
|
|
|
|
|||||||||||||
| Net revenue |
22,660 | 22,132 | 85,008 | 53,638 | ||||||||||||||||
| Cost of goods sold |
6,22 | 18,281 | 13,530 | 57,391 | 76,914 | |||||||||||||||
|
|
|
|
|
|
|
|
|
|||||||||||||
| Gross profit/(loss) before fair value adjustments |
4,379 | 8,602 | 27,617 | (23,276 | ) | |||||||||||||||
| Realized fair value amounts on inventory sold |
6 | 6,426 | 9,251 | 17,619 | 21,362 | |||||||||||||||
| Unrealized gain on changes in fair value of biological assets |
7 | (10,863 | ) | (6,379 | ) | (35,616 | ) | (21,378 | ) | |||||||||||
|
|
|
|
|
|
|
|
|
|||||||||||||
| Gross profit/(loss) |
8,816 | 5,730 | 45,614 | (23,260 | ) | |||||||||||||||
| Operating expenses |
||||||||||||||||||||
| Selling, general and administrative |
22 | 14,822 | 11,238 | 39,039 | 40,833 | |||||||||||||||
| Marketing and promotion |
2,452 | 2,131 | 6,682 | 9,621 | ||||||||||||||||
| Share-based compensation |
22 | 2,715 | 6,171 | 10,904 | 22,237 | |||||||||||||||
| Research and development |
730 | 1,017 | 2,901 | 3,962 | ||||||||||||||||
| Depreciation of property, plant and equipment |
10 | 1,612 | 1,566 | 4,369 | 4,890 | |||||||||||||||
| Amortization of intangible assets |
11 | 371 | 341 | 1,043 | 3,690 | |||||||||||||||
| Restructuring costs |
336 | 865 | 1,721 | 4,846 | ||||||||||||||||
| Impairment of property, plant and equipment |
10 | 16 | 220 | 881 | 33,004 | |||||||||||||||
| Impairment of intangible assets |
11 | — | — | — | 106,189 | |||||||||||||||
| Impairment of goodwill |
— | — | — | 111,877 | ||||||||||||||||
| Recognition of onerous contract |
— | — | — | 3,000 | ||||||||||||||||
| Disposal of long-lived assets |
— | — | 1,294 | — | ||||||||||||||||
| Loss/(gain) on disposal of property, plant and equipment |
(19 | ) | 3,237 | 45 | 3,734 | |||||||||||||||
| Acquisition and transaction costs |
1,871 | — | 2,307 | — | ||||||||||||||||
|
|
|
|
|
|
|
|
|
|||||||||||||
| 24,906 | 26,786 | 71,186 | 347,883 | |||||||||||||||||
|
|
|
|
|
|
|
|
|
|||||||||||||
| Loss from operations |
(16,090 | ) | (21,056 | ) | (25,572 | ) | (371,143 | ) | ||||||||||||
|
|
|
|
|
|
|
|
|
|||||||||||||
| Finance income (expense), net |
23 | (2,947 | ) | (2,926 | ) | (7,311 | ) | (6,073 | ) | |||||||||||
| Non-operating income (expense), net |
23 | (1,674 | ) | 4,463 | (12,864 | ) | (6,717 | ) | ||||||||||||
|
|
|
|
|
|
|
|
|
|||||||||||||
| Loss and comprehensive loss attributable to shareholders before tax |
(20,711 | ) | (19,519 | ) | (45,747 | ) | (383,933 | ) | ||||||||||||
|
|
|
|
|
|
|
|
|
|||||||||||||
| Income tax recovery |
— | — | — | 6,023 | ||||||||||||||||
|
|
|
|
|
|
|
|
|
|||||||||||||
| Other comprehensive income |
||||||||||||||||||||
| Foreign currency translation |
3 | — | 3 | — | ||||||||||||||||
|
|
|
|
|
|
|
|
|
|||||||||||||
| Net loss and comprehensive loss |
(20,708 | ) | (19,519 | ) | (45,744 | ) | (377,910 | ) | ||||||||||||
|
|
|
|
|
|
|
|
|
|||||||||||||
| Comprehensive loss attributable to: |
||||||||||||||||||||
|
|
|
|
|
|
|
|
|
|||||||||||||
| Shareholders of HEXO Corp. |
(20,708 | ) | (19,519 | ) | (45,744 | ) | (377,910 | ) | ||||||||||||
|
|
|
|
|
|
|
|
|
|||||||||||||
| Non-controlling interest |
— | — | — | — | ||||||||||||||||
|
|
|
|
|
|
|
|
|
|||||||||||||
| (20,708 | ) | (19,519 | ) | (45,744 | ) | (377,910 | ) | |||||||||||||
|
|
|
|
|
|
|
|
|
|||||||||||||
| Net loss per share, basic and diluted |
(0.17 | ) | (0.26 | ) | (0.38 | ) | (5.56 | ) | ||||||||||||
|
|
|
|
|
|
|
|
|
|||||||||||||
| Weighted average number of outstanding shares |
||||||||||||||||||||
| Basic and diluted |
20 | 122,397,731 | 73,852,844 | 121,749,456 | 67,936,412 | |||||||||||||||
|
|
|
|
|
|
|
|
|
|||||||||||||
2
Condensed Interim Consolidated Statements of Changes in Shareholders’ Equity
(Unaudited, expressed in thousands of Canadian Dollars, except per share data)
| For the nine months ended |
Note | Number of common shares |
Share capital |
Share-based payment reserve |
Warrant reserve |
Contributed surplus |
Non-controlling interest |
Other comprehensive Income |
Accumulated deficit |
Shareholders’ equity |
||||||||||||||||||||||||||||||
| Balance at July 31, 2019 |
64,245,438 | 799,706 | 40,315 | 60,433 | — | 1,000 | — | (112,742 | ) | 788,712 | ||||||||||||||||||||||||||||||
| April 2020 underwritten offering |
14,950,000 | 25,864 | — | 20,182 | — | — | — | — | 46,046 | |||||||||||||||||||||||||||||||
| $70m private placement unsecured convertible debentures |
— | — | — | — | 23,902 | — | — | — | 23,902 | |||||||||||||||||||||||||||||||
| USD$25m registered offering |
3,742,516 | 26,782 | — | — | — | — | — | — | 26,782 | |||||||||||||||||||||||||||||||
| USD$20m registered offering |
2,994,012 | 22,323 | — | — | — | — | — | — | 22,323 | |||||||||||||||||||||||||||||||
| Issuance fees |
— | (5,570 | ) | — | — | (27 | ) | — | — | — | (5,597 | ) | ||||||||||||||||||||||||||||
| Expiry of warrants |
— | — | — | (7,141 | ) | 7,141 | — | — | — | — | ||||||||||||||||||||||||||||||
| Exercise of warrants |
17,856 | 177 | — | — | — | — | — | — | 177 | |||||||||||||||||||||||||||||||
| Exercise of stock options |
19 | 29,133 | 223 | (88 | ) | — | — | — | — | — | 135 | |||||||||||||||||||||||||||||
| Expiry of stock options |
— | — | (312 | ) | — | 312 | — | — | — | — | ||||||||||||||||||||||||||||||
| Equity-settled share-based payments |
19,22 | — | — | 27,326 | — | — | — | — | — | 27,326 | ||||||||||||||||||||||||||||||
| Net loss and comprehensive loss |
— | — | — | — | — | — | — | (377,910 | ) | (377,910 | ) | |||||||||||||||||||||||||||||
|
|
|
|
|
|
|
|
|
|
|
|
|
|
|
|
|
|
|
|||||||||||||||||||||||
| Balance at April 30, 2020 |
85,978,955 | 869,505 | 67,241 | 73,474 | 31,328 | 1,000 | — | (490,652 | ) | 551,896 | ||||||||||||||||||||||||||||||
|
|
|
|
|
|
|
|
|
|
|
|
|
|
|
|
|
|
|
|||||||||||||||||||||||
| Balance at July 31, 2020 |
120,616,441 | 1,023,788 | 65,746 | 95,617 | 27,377 | 3,379 | — | (659,231 | ) | 556,676 | ||||||||||||||||||||||||||||||
| June 2020 at the market offering |
17 | 244,875 | — | — | — | — | — | — | — | — | ||||||||||||||||||||||||||||||
| Issuance fees |
— | (192 | ) | — | — | — | — | — | — | (192 | ) | |||||||||||||||||||||||||||||
| Exercise of stock options |
19 | 82,083 | 499 | (195 | ) | — | — | — | — | — | 304 | |||||||||||||||||||||||||||||
| Expiry of stock options |
— | — | (9,507 | ) | — | 9,507 | — | — | — | — | ||||||||||||||||||||||||||||||
| Exercise of warrants |
1,522,139 | 7,430 | — | (2,188 | ) | 131 | — | — | — | 5,373 | ||||||||||||||||||||||||||||||
| Expiry of warrants |
— | — | — | — | — | — | — | — | — | |||||||||||||||||||||||||||||||
| Equity-settled share-based payments |
19,22 | — | — | 10,337 | — | — | — | — | — | 10,337 | ||||||||||||||||||||||||||||||
| Other comprehensive income |
— | — | — | — | — | — | 3 | — | 3 | |||||||||||||||||||||||||||||||
| Non-controlling interest |
28 | — | — | — | — | 371 | — | — | — | 371 | ||||||||||||||||||||||||||||||
| Net loss and comprehensive loss |
— | — | — | — | — | — | — | (45,747 | ) | (45,747 | ) | |||||||||||||||||||||||||||||
|
|
|
|
|
|
|
|
|
|
|
|
|
|
|
|
|
|
|
|||||||||||||||||||||||
| Balance at April 30, 2021 |
122,465,538 | 1,031,525 | 66,381 | 93,429 | 37,386 | 3,379 | 3 | (704,978 | ) | 527,125 | ||||||||||||||||||||||||||||||
|
|
|
|
|
|
|
|
|
|
|
|
|
|
|
|
|
|
|
|||||||||||||||||||||||
3
Condensed Interim Consolidated Statements of Cash Flows
(Unaudited, expressed in thousands of Canadian Dollars)
| For the nine months ended |
Note | April 30, 2021 | April 30, 2020 | |||||||||
| Operating activities |
||||||||||||
| Total net loss |
$ | (45,744 | ) | $ | (377,910 | ) | ||||||
| Items not affecting cash |
31 | 24,102 | 343,929 | |||||||||
| Changes in non-cash operating working capital items |
31 | 4,804 | (59,650 | ) | ||||||||
|
|
|
|
|
|||||||||
| Cash used in operating activities |
(16,838 | ) | (93,631 | ) | ||||||||
|
|
|
|
|
|||||||||
| Financing activities |
||||||||||||
| Issuance of common shares |
883 | 104,748 | ||||||||||
| Issuance fees |
(192 | ) | (5,773 | ) | ||||||||
| Proceeds from the exercise of stock options |
19 | 304 | 135 | |||||||||
| Proceeds from the exercise of warrants |
18 | 5,373 | 71 | |||||||||
| Payments on term loan |
16 | (30,625 | ) | (2,625 | ) | |||||||
| Lease payments |
15 | (3,476 | ) | (3,196 | ) | |||||||
| Issuance of unsecured convertible debentures |
14 | — | 70,000 | |||||||||
| Interest paid on unsecured convertible debentures |
14 | (2,409 | ) | (1,804 | ) | |||||||
|
|
|
|
|
|||||||||
| Cash used financing activities |
(30,142 | ) | 161,556 | |||||||||
|
|
|
|
|
|||||||||
| Investing activities |
||||||||||||
| Settlement of short-term investments |
— | 24,726 | ||||||||||
| Proceeds from sale of investments |
— | 8,258 | ||||||||||
| Restricted cash |
4 | (24,290 | ) | 4,967 | ||||||||
| Issuance of convertible debenture receivable |
12 | (19,500 | ) | — | ||||||||
| Proceeds from sale of property, plant and equipment |
102 | 716 | ||||||||||
| Acquisition of property, plant and equipment |
(8,045 | ) | (95,998 | ) | ||||||||
| Purchase of intangible assets |
(1,447 | ) | (617 | ) | ||||||||
| Investment in associate and joint ventures |
8 | (2,975 | ) | (29,220 | ) | |||||||
|
|
|
|
|
|||||||||
| Cash used in investing activities |
(56,155 | ) | (87,168 | ) | ||||||||
|
|
|
|
|
|||||||||
| Cash used |
(103,135 | ) | (19,243 | ) | ||||||||
| Cash and cash equivalents, beginning of period |
184,173 | 113,568 | ||||||||||
|
|
|
|
|
|||||||||
| Cash and cash equivalents, end of period |
81,038 | 94,325 | ||||||||||
|
|
|
|
|
|||||||||
|
Supplemental cashflow information in Note 31. | ||||||
The accompanying notes are an integral part of these consolidated financial statements.
4
Notes to the Consolidated Financial Statements
For the three and nine months ended April 30, 2021 and 2020
(Unaudited, expressed in thousands of Canadian Dollars, except share amounts or where otherwise stated)
1. Description of Business
HEXO Corp. (the “Company”), is a publicly traded corporation, incorporated in Ontario. HEXO is licensed to produce and sell cannabis and cannabis products under the Cannabis Act. Its head office is located at 3000 Solandt Road Ottawa, Canada. The Company’s common shares are listed on the Toronto Stock Exchange (“TSX”) and the New York Stock Exchange (“NYSE”), both under the trading symbol “HEXO”.
COVID-19
In March 2020, the World Health Organization declared the outbreak of COVID-19 a global pandemic. In response to the outbreak, governmental authorities in Canada and internationally have introduced various recommendations and measures to try to limit the pandemic, including travel restrictions, border closures, non- essential business closures, quarantines, self-isolations, shelters-in-place and social distancing. These measures are continuously monitored and modified by the applicable governmental authorities in Canada and remained in effect as at April 30, 2021. The production and sale of cannabis in Canada was deemed an essential service throughout the three and nine months ended April 30, 2021.
The Company regularly monitors the impact of the ongoing pandemic on all aspects of its business and operations and as of April 30, 2021, we have not observed any material changes.
2. Basis of Preparation
Statement of Compliance
These condensed interim consolidated financial statements (“interim consolidated financial statements”) have been prepared in accordance with International Accounting Standard 34, Interim Financial Reporting (“IAS 34”), using accounting policies consistent with International Financial Reporting Standards as issued by the International Accounting Standards Board and IFRS Interpretations Committee (“IFRS”). These interim consolidated financial statements do not contain all the disclosures required in annual consolidated financial statements and should be read in conjunction with the amended and restated annual consolidated financial statements of the Company for the year ended July 31, 2020, prepared in accordance with IFRS.
The interim consolidated financial statements have been prepared using accounting policies consistent with those described in the annual consolidated financial statements for the year ended July 31, 2020.
These interim consolidated financial statements were approved and authorized for issue by the Board of Directors on June 14, 2021.
3. New Accounting Policies and Pronouncements
New Accounting Policy
CAPTIVE INSURANCE
Insurance coverage for the Company’s directors and officers has been secured through a Captive Cell program (“the Captive Program”). The Captive Program was effected by entering into a participation agreement with a registered insurer for the purposes of holding and managing the Company’s coverage funds through a separate cell account (the “Cell Captive”). The Company applies IFRS 10 Consolidated Financial Statements in its assessment of control as it relates to the Cell Captive. The Company’s accounting policy is to consolidate the Cell Captive. Currently the Captive Program funds are held as cash in the Cell Captive with the possibility of reinvestment into short-term investments and/or marketable securities in the future. As the funds cannot be transferred to other parts of the group without providing 6 month notice, the funds are disclosed as Restricted cash. The Company recognizes gains and losses from, interest, foreign exchange activity and/or fair market value adjustments through the Statement of Loss and Comprehensive Loss.
New Accounting Procurement Not Yet Effective
AMENDMENTS TO IAS 37: ONEROUS CONTRACTS AND THE COST OF FULFILLING A CONTRACT
The amendment specifies that the ‘cost of fulfilling’ a contract comprises the ‘costs that relate directly to the contract’. Costs that relate directly to a contract consist of both the incremental costs of fulfilling that contract or an allocation of other costs that relate directly to fulfilling contracts. The amendment is effective for annual periods beginning on or after January 1, 2022 with early application permitted. The Company is currently evaluating the potential impact of these amendments on the Company’s consolidated financial statements.
5
4. Restricted Funds
| April 30, 2021 | July 31, 2020 | |||||||
| $ | $ | |||||||
| Debt service reserve account – term loan (Note 16) | — | 8,191 | ||||||
| Letters of credit, collateral and guarantees for purchases |
2,552 | 70 | ||||||
| Captive insurance |
29,999 | — | ||||||
|
|
|
|
|
|||||
| Total |
32,551 | 8,261 | ||||||
|
|
|
|
|
|||||
5. Commodity Taxes Recoverable and Other Receivables
| April 30, 2021 | July 31, 2020 | |||||||
| Commodity taxes recoverable |
$ | 3,167 | $ | 12,821 | ||||
| Lease receivable – current1 |
630 | 630 | ||||||
| Other receivables |
6,405 | 3,282 | ||||||
|
|
|
|
|
|||||
| Total |
$ | 10,202 | $ | 16,733 | ||||
|
|
|
|
|
|||||
| 1 | A related party capital lease receivable related to Truss Limited Partnership (Note 24). |
6. Inventory
| As at April 30, 2021 | ||||||||||||
| Capitalized cost |
Biological asset fair value adjustment |
Total | ||||||||||
| Dried cannabis |
$ | 46,707 | $ | 28,309 | $ | 75,016 | ||||||
| Purchased dried cannabis |
1,666 | — | 1,666 | |||||||||
| Extracts |
10,688 | 96 | 10,784 | |||||||||
| Purchased extracts |
856 | — | 856 | |||||||||
| Hemp derived distillate |
49 | — | 49 | |||||||||
| Packaging and supplies |
6,852 | — | 6,852 | |||||||||
|
|
|
|
|
|
|
|||||||
| $ | 66,818 | $ | 28,405 | $ | 95,223 | |||||||
|
|
|
|
|
|
|
|||||||
| As at July 31, 2020 | ||||||||||||
| Capitalized cost |
Biological asset fair value adjustment |
Total | ||||||||||
| Dried cannabis |
$ | 29,702 | $ | 16,981 | $ | 46,683 | ||||||
| Purchased dried cannabis |
1,956 | — | 1,956 | |||||||||
| Extracts |
4,828 | 385 | 5,213 | |||||||||
| Purchased extracts |
5,977 | — | 5,977 | |||||||||
| Hemp derived distillate |
566 | — | 566 | |||||||||
| Packaging and supplies |
4,538 | — | 4,538 | |||||||||
|
|
|
|
|
|
|
|||||||
| $ | 47,567 | $ | 17,366 | $ | 64,933 | |||||||
|
|
|
|
|
|
|
|||||||
Capitalized costs relating to inventory expensed and included in Cost of goods sold were $17,654 and $57,934 for the three and nine months ended April 30, 2021, respectively (April 30, 2020 – $13,349 and $34,765). The unrealized fair value gain on biological asset fair value adjustments on the consolidated statement of loss for the three and nine months ended April 30, 2021 were $10,863 and $35,616, respectively (April 30, 2020 – $6,379 and $21,378). The realized fair value amounts on inventory sold on the consolidated statement of loss was $6,426 and $17,619 for the three and nine months ended April 30, 2021, respectively (April 30, 2020 – $9,251 and $21,362). During the three and nine months ended April 30, 2021, the Company reversed certain prior period inventory write downs of $nil and $1,543, respectively (April 30, 2020 – $nil and $nil) recorded in costs of sales on the consolidated statement of loss and $nil and $688 (April 30, 2020 – $nil and $nil) of fair value recorded in fair value amounts on inventory sold.
Total share-based compensation capitalized to inventory in the nine months ended April 30, 2021 was $1,283 (April 30, 2020 –$5,089). Total depreciation capitalized to inventory in the nine months ended April 30, 2021 was $10,850 (April 30, 2020 – $8,221).
6
7. Biological Assets
The Company’s biological assets consist of cannabis plants throughout the growth cycle, from mother plants to plants in propagation, vegetative and flowering stages. The changes in the carrying value of biological assets are as follows:
| For the nine months ended April 30, 2021 |
For the year ended July 31, 2020 |
|||||||
| $ | $ | |||||||
| Balance, beginning of year |
7,571 | 7,371 | ||||||
| Production costs capitalized |
23,819 | 38,638 | ||||||
| Net increase in fair value due to biological transformation and estimates |
35,616 | 29,356 | ||||||
| Transferred to inventory upon harvest |
(57,784 | ) | (67,131 | ) | ||||
| Disposal of biological assets |
— | (663 | ) | |||||
|
|
|
|
|
|||||
| Balance, end of period |
9,222 | 7,571 | ||||||
|
|
|
|
|
|||||
The valuation of biological assets is based on an income approach (Level 3) in which the fair value at the point of harvesting is estimated based on selling prices less the costs to sell. For in process biological assets, the fair value at the point of harvest is adjusted based on the stage of growth at period-end.
The significant estimates used in determining the fair value of cannabis plants are as follows:
| • | yield per plant; |
| • | stage of growth percentage estimated as costs incurred as a percentage of total cost as applied to the estimated total fair value per gram (less fulfilment costs) to arrive at an in-process fair value for estimated biological assets, which have not yet been harvested; |
| • | percentage of costs incurred for each stage of plant growth. |
| • | fair value selling price per gram less cost to complete and cost to sell. |
| • | destruction/wastage of plants during the harvesting and processing process. |
Management’s identified significant unobservable inputs, their range of values and sensitivity analysis are presented in the tables below.
| Input values | An increase or decrease of 5% applied to the unobservable input would result in a change to the fair value of approximately | |||||||
| Unobservable inputs |
April 30, 2021 | July 31, 2020 | April 30, 2021 | July 31, 2020 | ||||
| Weighted average selling price Derived from actual retail prices on a per product basis using the expected Flower and Trim yields per plant. |
$2.81 per dried gram |
$3.23 per dried gram |
$746 | $550 | ||||
| Yield per plant Derived from historical harvest cycle results on a per strain basis. |
80 – 113 grams per plant |
46 – 135 grams per plant |
$746 | $376 | ||||
| Stage of growth Derived from the estimates of stage of completion within the harvest cycle. |
Average of 50% completion |
Average of 43% completion |
$460 | $376 | ||||
| Waste Derived from the estimates of planned removal and naturally occurring waste within the cultivation and production cycle. |
0%–21% dependent upon |
0%–21% dependent upon |
No material variance | No material variance | ||||
8. Investments in Associates & Joint Ventures
| For the nine months ended April 30, 2021 | For the year ended July 31, 2020 | |||||||||||||||||||||||
| Truss LP | Other | Total | Truss LP | Other | Total | |||||||||||||||||||
| $ | $ | $ | $ | $ | $ | |||||||||||||||||||
| Opening Balance |
74,966 | 1,340 | 76,306 | 51,786 | 1,063 | 52,849 | ||||||||||||||||||
| Cash contributed to investment |
2,975 | — | 2,975 | 29,155 | 1,231 | 30,386 | ||||||||||||||||||
| Capitalized transaction costs |
— | — | — | — | 109 | 109 | ||||||||||||||||||
| Share of net (loss) |
(5,638 | ) | (264 | ) | (5,902 | ) | (5,975 | ) | (356 | ) | (6,331 | ) | ||||||||||||
| Impairment |
— | — | — | — | (707 | ) | (707 | ) | ||||||||||||||||
|
|
|
|
|
|
|
|
|
|
|
|
|
|||||||||||||
| Ending Balance |
72,303 | 1,076 | 73,379 | 74,966 | 1,340 | 76,306 | ||||||||||||||||||
|
|
|
|
|
|
|
|
|
|
|
|
|
|||||||||||||
7
Truss LP
The Truss Limited Partnership (“Truss LP”) is a joint arrangement between the Company and Molson Coors Canada (the “Partner”) and is a standalone entity, incorporated in Canada, with its own board of directors and an independent management team. The Partner holds 57,500 common shares representing 57.5% controlling interest in Truss with the Company holding 42,500 common shares and representing the remaining 42.5%. Truss is a private limited partnership and its principal operating activities consist of pursuing opportunities to develop non-alcoholic, cannabis-infused beverages (Note 24). During the nine months ended April 30, 2021 the Company contributed $2,975 of additional capital to Truss as required under the shareholders agreement.
9. Long-term Investments
| Units | Fair value July 31, 2020 |
Divestiture | Change in fair value |
Fair value April 30, 2021 |
||||||||||||||||
| $ | $ | $ | $ | |||||||||||||||||
| Level 1 Investments |
||||||||||||||||||||
| Fire and Flower common shares |
1,319,377 | 1,292 | — | 171 | 1,463 | |||||||||||||||
| Inner Spirit common shares |
8,994,500 | 1,260 | — | 1,033 | 2,293 | |||||||||||||||
| Other long-term investments |
n/a | 517 | (11 | ) | — | 506 | ||||||||||||||
| Level 3 Investments |
||||||||||||||||||||
| Segra International Corp. |
400,000 | 140 | — | — | 140 | |||||||||||||||
|
|
|
|
|
|
|
|
|
|
|
|||||||||||
| Total |
3,209 | (11 | ) | 1,204 | 4,402 | |||||||||||||||
|
|
|
|
|
|
|
|
|
|
|
|||||||||||
10. Property, Plant and Equipment
| Cost |
Land | Buildings | Leasehold improvements |
Cultivation and production equipment |
Furniture, computers, vehicles and equipment |
Construction in progress |
Right-of-Use assets |
Total | ||||||||||||||||||||||||
| $ | $ | $ | $ | $ | $ | $ | $ | |||||||||||||||||||||||||
| At July 31, 2019 |
5,339 | 150,834 | 627 | 42,029 | 10,368 | 57,550 | — | 266,747 | ||||||||||||||||||||||||
| Additions |
— | 24,432 | 1,395 | 14,969 | 9,404 | 66,246 | 24,405 | 140,851 | ||||||||||||||||||||||||
| Disposals |
(3,683 | ) | (18,260 | ) | — | (13,402 | ) | (909 | ) | (5,428 | ) | — | (41,682 | ) | ||||||||||||||||||
| Transfers |
— | 7,943 | 22,417 | (10,135 | ) | 8 | (20,233 | ) | — | — | ||||||||||||||||||||||
|
|
|
|
|
|
|
|
|
|
|
|
|
|
|
|
|
|||||||||||||||||
| At July 31, 2020 |
1,656 | 164,949 | 24,439 | 33,461 | 18,871 | 98,135 | 24,405 | 365,916 | ||||||||||||||||||||||||
|
|
|
|
|
|
|
|
|
|
|
|
|
|
|
|
|
|||||||||||||||||
| Additions |
— | 873 | 63 | 2,014 | 234 | 7,978 | — | 11,162 | ||||||||||||||||||||||||
| Disposals |
— | (5 | ) | — | (51 | ) | — | — | (1,055 | ) | (1,111 | ) | ||||||||||||||||||||
| Transfers |
— | 3,929 | 15,685 | 764 | 888 | (21,089 | ) | — | 177 | |||||||||||||||||||||||
|
|
|
|
|
|
|
|
|
|
|
|
|
|
|
|
|
|||||||||||||||||
| At April 30, 2021 |
1,656 | 169,746 | 40,187 | 36,188 | 19,993 | 85,024 | 23,350 | 376,144 | ||||||||||||||||||||||||
|
|
|
|
|
|
|
|
|
|
|
|
|
|
|
|
|
|||||||||||||||||
| Accumulated depreciation and impairments |
|
|||||||||||||||||||||||||||||||
| At July 31, 2019 |
— | 4,392 | 130 | 2,216 | 1,216 | — | — | 7,954 | ||||||||||||||||||||||||
| Depreciation |
— | 7,395 | 879 | 3,702 | 3,562 | — | 2,522 | 18,060 | ||||||||||||||||||||||||
| Transfers |
— | — | — | 271 | (271 | ) | — | — | — | |||||||||||||||||||||||
| Disposals |
— | (17,081 | ) | — | (7,435 | ) | (366 | ) | — | — | (24,882 | ) | ||||||||||||||||||||
| Impairments |
307 | 19,006 | — | 9,937 | — | 48,990 | 1,178 | 79,418 | ||||||||||||||||||||||||
|
|
|
|
|
|
|
|
|
|
|
|
|
|
|
|
|
|||||||||||||||||
| At July 31, 2020 |
307 | 13,712 | 1,009 | 8,691 | 4,141 | 48,990 | 3,700 | 80,550 | ||||||||||||||||||||||||
|
|
|
|
|
|
|
|
|
|
|
|
|
|
|
|
|
|||||||||||||||||
| Depreciation |
— | 5,529 | 1,525 | 3,481 | 2,865 | — | 1,819 | 15,219 | ||||||||||||||||||||||||
| Transfers |
— | 454 | (16 | ) | 27 | (190 | ) | — | — | 275 | ||||||||||||||||||||||
| Disposals |
— | — | — | — | — | — | (964 | ) | (964 | ) | ||||||||||||||||||||||
| Impairments |
— | — | 85 | (20 | ) | 61 | (6 | ) | 761 | 881 | ||||||||||||||||||||||
|
|
|
|
|
|
|
|
|
|
|
|
|
|
|
|
|
|||||||||||||||||
| At April 30, 2021 |
307 | 19,695 | 2,603 | 12,179 | 6,877 | 48,984 | 5,316 | 95,961 | ||||||||||||||||||||||||
|
|
|
|
|
|
|
|
|
|
|
|
|
|
|
|
|
|||||||||||||||||
| Net book value |
|
|||||||||||||||||||||||||||||||
| At July 31, 2019 |
5,339 | 146,442 | 497 | 39,813 | 9,152 | 57,550 | — | 258,793 | ||||||||||||||||||||||||
| At July 31, 2020 |
1,349 | 151,237 | 23,430 | 24,770 | 14,730 | 49,145 | 20,705 | 285,366 | ||||||||||||||||||||||||
|
|
|
|
|
|
|
|
|
|
|
|
|
|
|
|
|
|||||||||||||||||
| At April 30, 2021 |
1,349 | 150,051 | 37,584 | 24,009 | 13,116 | 36,040 | 18,034 | 280,183 | ||||||||||||||||||||||||
|
|
|
|
|
|
|
|
|
|
|
|
|
|
|
|
|
|||||||||||||||||
In the nine months ended April 30, 2021, the Company capitalized $10,850 (July 31, 2020 — $11,988) of depreciation to inventory. During the three and nine months ended April 30, 2021, depreciation expensed to the consolidated statement of loss and comprehensive loss was $1,612 and $4,369 (April 30, 2020 — $1,566 and $4,890).
Capitalized borrowing costs to buildings in the nine months ended April 30, 2021 were $1,269 (July 31, 2020 — $2,385) at an average interest rate of 5.6% (July 31, 2020 — 7.22%).
8
11. Intangible Assets
| Cost |
Cultivating and processing license |
Brand | Software | Domain names |
Patents | Total | ||||||||||||||||||
| $ | $ | $ | $ | $ | $ | |||||||||||||||||||
| At July 31, 2019 |
116,433 | 8,440 | 3,558 | 585 | 1,231 | 130,247 | ||||||||||||||||||
| Additions |
— | — | 702 | — | 875 | 1,577 | ||||||||||||||||||
| Disposals |
— | — | (550 | ) | — | (173 | ) | (723 | ) | |||||||||||||||
|
|
|
|
|
|
|
|
|
|
|
|
|
|||||||||||||
| At July 31, 2020 |
116,433 | 8,440 | 3,710 | 585 | 1,933 | 131,101 | ||||||||||||||||||
| Additions |
— | — | 896 | — | 551 | 1,447 | ||||||||||||||||||
| Disposals |
— | — | (872 | ) | — | — | (872 | ) | ||||||||||||||||
|
|
|
|
|
|
|
|
|
|
|
|
|
|||||||||||||
| At April 30, 2021 |
116,433 | 8,440 | 3,734 | 585 | 2,484 | 131,676 | ||||||||||||||||||
|
|
|
|
|
|
|
|
|
|
|
|
|
|||||||||||||
| Accumulated amortization |
||||||||||||||||||||||||
| At July 31, 2019 |
1,601 | — | 1,269 | 66 | 29 | 2,965 | ||||||||||||||||||
| Amortization |
3,167 | — | 697 | 59 | 16 | 3,939 | ||||||||||||||||||
| Impairment |
106,189 | 2,000 | — | — | — | 108,189 | ||||||||||||||||||
|
|
|
|
|
|
|
|
|
|
|
|
|
|||||||||||||
| At July 31, 2020 |
110,957 | 2,000 | 1,966 | 125 | 45 | 115,093 | ||||||||||||||||||
| Amortization |
384 | — | 521 | 44 | 94 | 1,043 | ||||||||||||||||||
| Disposals |
— | — | (872 | ) | — | — | (872 | ) | ||||||||||||||||
|
|
|
|
|
|
|
|
|
|
|
|
|
|||||||||||||
| At April 30, 2021 |
111,341 | 2,000 | 1,615 | 169 | 139 | 115,264 | ||||||||||||||||||
|
|
|
|
|
|
|
|
|
|
|
|
|
|||||||||||||
| Net book value |
||||||||||||||||||||||||
| At July 31, 2019 |
114,832 | 8,440 | 2,289 | 519 | 1,202 | 127,282 | ||||||||||||||||||
| At July 31, 2020 |
5,476 | 6,440 | 1,744 | 460 | 1,888 | 16,008 | ||||||||||||||||||
|
|
|
|
|
|
|
|
|
|
|
|
|
|||||||||||||
| At April 30, 2021 |
5,092 | 6,440 | 2,119 | 416 | 2,345 | 16,412 | ||||||||||||||||||
|
|
|
|
|
|
|
|
|
|
|
|
|
|||||||||||||
Research and development expenses in the three and nine months ended April 30, 2021 were $730 and $2,901, respectively (April 30, 2020 - $1,017 and $3,962, respectively).
12. Convertible Debenture Receivable
On February 15, 2021 Zenabis entered into an agreement with HEXO for the issuance of an unsecured convertible debenture to the Company in a principal amount of $19,500. On this date, HEXO advanced Zenabis $12,500 in cash and converted the previous supply prepayment of $7,000 to a convertible debenture receivable. The debenture is convertible into common shares of Zenabis at a conversion price equal to the 5-day volume weighted average price (“VWAP”) of the Zenabis common shares on TSX for the five trading days prior to the date of conversion. The debenture may be prepaid by Zenabis, at its option and without penalty or premium. The unsecured convertible debenture bears interest at a rate of 8% per annum and matures on February 15, 2023.
Upon initial recognition of the $19,500 face value convertible debenture receivable (Level 2) on February 16, 2021, the fair value was derived using the calculated 5-day VWAP of $0.1724 and the closing market price of $0.18. The estimated fair value upon recognition was $20,360.
The fair value of the convertible debenture receivable as at April 30, 2021 was estimated using the calculated 5-day VWAP of $0.1174 and the closing market price of $0.12. The estimated fair value as at April 30, 2021 was $20,246. The gain on revaluation of the instrument was $434.
13. Warrant Liabilities
| USD$25,000 Registered Direct Offering |
USD$20,000 Registered Direct Offering |
Total | ||||||||||
| $ | $ | $ | ||||||||||
| Balance as at July 31, 2020 |
1,917 | 1,533 | 3,450 | |||||||||
| Loss on revaluation of financial instruments |
5,326 | 4,261 | 9,587 | |||||||||
|
|
|
|
|
|
|
|||||||
| Balance as at April 30, 2021 |
7,243 | 5,794 | 13,037 | |||||||||
|
|
|
|
|
|
|
|||||||
The warrants are classified as a liability because the exercise price is denominated in US dollars, which is different to the functional currency of the Company.
The warrant liabilities were revalued on April 30, 2021 using the Black-Scholes-Merton option pricing model (Level 2) using the following assumptions:
| • | stock price of USD$6.70; |
| • | expected life of 2.5 years; |
| • | $nil dividends; |
| • | 96.54% volatility based upon historical data; |
| • | risk-free interest rate of 0.29%; and |
| • | USD/CAD exchange rate of 1.2285. |
9
USD$20,000 Registered Direct Offering – Warrants
On April 30, 2021 the Company had 1,497,007 common share purchase warrants outstanding (Note 18) with an exercise price of USD$9.80 per share with a five year-term.
The loss/(gain) on the revaluation of the warrant liability during the three and nine months ended April 30, 2021 was $170 and $4,261, respectively (April 30, 2020 – ($4,261) and ($3,071), respectively) which is recorded in Other income and losses on the consolidated statements of loss and comprehensive loss.
USD$25,000 Registered Direct Offering – Warrants
On April 30th, 2021 the Company had 1,871,259 common share purchase warrants outstanding (Note 18) with an exercise price of USD$9.80 per share with a five year- term.
The loss/(gain) on the revaluation of the warrant liability during the three and nine months ended April 30, 2021 was $212 and $5,326, respectively (April 30, 2020 – ($2,752) and ($4,508), respectively) which is recorded in Other income and losses on the consolidated statements of loss and comprehensive loss.
14. Convertible Debentures
| Balance as at July 31, 2020 |
$ | 28,969 | ||
| Interest expense |
5,391 | |||
| Interest paid |
(2,409 | ) | ||
|
|
|
|||
| Balance as at April 30, 2021 |
$ | 31,951 | ||
|
|
|
On December 5, 2019, the Company closed a $70,000 private placement of convertible debentures. The Company issued a total of $70,000 principal amount of 8.0% unsecured convertible debentures maturing on December 5, 2022 (the “Debentures”). The Debentures are convertible at the option of the holder at any time after December 7, 2020 and prior to maturity at a conversion price of $12.64 per share (the “Conversion Price”), subject to adjustment in certain events. The Company may force the conversion of all of the then outstanding Debentures at the Conversion Price at any time after December 7, 2020 and prior to maturity on 30 days’ notice if the daily volume weighted average trading price of the common shares of the Company is greater than $30.00 for any 15 consecutive trading days.
The Company had the option to at any time on or before December 4, 2020, to repay all, but not less than all, of the principal amount of the Debentures, plus accrued and unpaid interest. Upon maturity, the holders of the Debentures have the right to require the Company to repay any principal amount of their Debentures through the issuance of common shares of the Company in satisfaction of such amounts at a price equal to the volume weighted average trading price of the common shares on the TSX for the five trading days immediately preceding the payment date.
In May 2020, the Company provided notice to all holders of the Debentures of an option to voluntarily convert their Debentures into units of the Company (the “Conversion Units”) at a discounted early conversion price of $0.80 (the “Early Conversion Price”) calculated based on the 5-day volume weighted average HEXO Corp. market prices (the “VWAP”) preceding the announcement. The VWAP unitized data from both the TSX and NYSE. Each Conversion Unit will provide the holder one common share and one half common share purchase warrant (with an exercise price of $4.00 and term of three years). The early conversion occurred in two phases, the first being on June 10, 2020 followed by the second and final phase June 30, 2020. During phases one and two, $23,595 principal amount, or approximately 34%, and $6,265 principal amount, or approximately 9% of the Debentures were converted under the Early Conversion Price into 7,373,438 and 1,957,813 common shares and 3,686,719 and 978,906 common share purchase warrants of HEXO Corp, respectively.
On April 30, 2021, there remains $40,140 in principal debentures, the net present value of the debt was $26,600 and the remaining balance of $13,540, was allocated to the conversion feature.
The accrued and unpaid interest as at April 30, 2020 was $483.
15. Lease Liabilities
The following is a continuity schedule of lease liabilities for the nine months ended April 30, 2021:
| $ | ||||
| Balance as at July 31, 2020 |
29,116 | |||
| Lease disposals |
(789 | ) | ||
| Lease payments |
(3,476 | ) | ||
| Interest expense on lease liabilities |
2,374 | |||
|
|
|
|||
| Balance as at April 30, 2021 |
27,225 | |||
|
|
|
|||
| Current portion |
4,659 | |||
|
|
|
|||
| Long-term portion |
22,566 | |||
|
|
|
|||
10
The Company’s leases consist of administrative real estate leases and a production real estate property. Effective August 1, 2020, the Company exited two real estate leases and the corresponding liability was written off for a realized a gain $181 recognized in Other income and losses on the consolidated statements of loss. The Company expensed variable lease payments of $815 and $2,412, respectively for the three and nine months ended April 30, 2021 (April 30, 2020 – $895 and $2,818, respectively).
The following table is the Company’s lease obligations over the next five fiscal years and thereafter as at April 30, 2021:
| Fiscal year |
2021 | 2022 – 2023 | 2024 – 2025 | Thereafter | Total | |||||||||||||||
| $ | $ | $ | $ | $ | ||||||||||||||||
| Lease obligations |
1,143 | 9,186 | 8,749 | 31,082 | 50,160 | |||||||||||||||
16. Term Loan
Term Loan
On February 14, 2019, the Company entered into a syndicated credit facility with Canadian Imperial Bank of Commerce (“CIBC”) as Sole Bookrunner, Co-Lead Arranger and Administrative Agent and Bank of Montreal as Co-Lead Arranger and Syndication Agent (together “the Lenders”). The Lenders provided the Company with up to $65,000 in secured debt financing at a rate of interest that is expected to average in the mid-to-high 5% per annum range. The credit facility consisted of an up to $50,000 term loan (“Term Loan”) and up to a $15,000 in a revolving credit facility which is limited to the Company’s working capital assets available to support funded balances. The credit facility had a maturity date of February 14, 2022 and was secured against the Company’s property, plant and equipment. The Company was to repay at minimum 2.5% of the initial amount drawn each quarter per the terms of the credit facility agreement. On February 14, 2019, the Company received $35,000 on the Term Loan and incurred financing costs of $1,347.
Under the terms of the credit facility the Company was able to repay the loan without penalty, at any time and did so, in full, on April 30, 2021.
On July 31, 2020 the Company was not in compliance with an administrative banking covenant which mandated that the Company does not utilize a Canadian dollar operating bank account with any institution other than the Lenders. The Company was subject to the covenant 90 days after entering the syndicated credit facility on February 14, 2019. The Company received an amendment on October 29, 2020 allowing it to rectify this administrative breach by April 27, 2021. Due to the amendment being received after July 31, 2020 and within the three months ended October 31, 2020 the Company classified its Term Loan as a current liability on July 31, 2020. On April 30, 2021, the Company repaid the credit facility in full and therefore is no longer subject to the credit facilities financial or administrative covenants. The credit facility has therefore been terminated and is no longer available to the Company.
In the nine months ended April 30, 2021, total interest expenses were $990 (April 30, 2020 - $567) and total interest capitalized was $419 (April 30, 2020 - $752). The non- cash interest expense relating to the amortization of deferred financing costs was $793 for the nine months ended April 30, 2021 (April 30, 2020 - $364).
The following table illustrates the continuity schedule of the term loan as at April 30, 2021 and July 31, 2020:
| April 30, 2021 | July 31, 2020 | |||||||
| $ | $ | |||||||
| Term loan |
||||||||
| Opening balance |
30,625 | 34,125 | ||||||
| Repayments |
(30,625 | ) | (3,500 | ) | ||||
|
|
|
|
|
|||||
| Ending balance |
— | 30,625 | ||||||
|
|
|
|
|
|||||
| Deferred financing costs |
$ | $ | ||||||
| Opening balance |
(695 | ) | (751 | ) | ||||
| Additions |
(98 | ) | (445 | ) | ||||
| Amortization of deferred finance costs |
793 | 501 | ||||||
|
|
|
|
|
|||||
| Ending balance |
— | (695 | ) | |||||
|
|
|
|
|
|||||
| Total term loan |
— | 29,930 | ||||||
|
|
|
|
|
|||||
| Current portion |
— | 29,930 | ||||||
|
|
|
|
|
|||||
| Long-term portion |
— | — | ||||||
|
|
|
|
|
|||||
17. Share Capital
(a) Authorized
An unlimited number of common shares and an unlimited number of special shares, issuable in series.
(b) Consolidation Announcement
The Company finalized the share consolidation on the basis of four pre-consolidation common shares for one post-consolidation common share (4:1) by way of shareholder approval at the annual and special meeting of shareholders held December 11, 2020 (the “Consolidation”). The Consolidation was effected by the filing of articles of amendment to the Company’s articles under the Business Corporations Act (Ontario) on December 18, 2020. The purpose of the proposed share consolidation is to increase the Company’s
11
common share price to regain compliance with the USD$1.00 minimum share price continued listing standard of the New York Stock Exchange.
All balances of common shares, common share purchase warrants, stock options and restricted share units herein are reflective of the Consolidation.
(c) Issued and Outstanding
As at April 30, 2021, a total of 122,465,538 (July 31, 2020 – 120,616,441) common shares were issued and outstanding. No special shares have been issued or are outstanding.
| Number of shares | Share Capital | |||||||||||
| Balance at July 31, 2020 |
120,616,441 | $ | 1,023,788 | |||||||||
| June 2020 at the market offering |
(i | ) | 244,875 | — | ||||||||
| Exercise of warrants |
1,522,139 | 7,430 | ||||||||||
| Exercise of stock options |
82,083 | 499 | ||||||||||
| Issuance fees |
— | (192 | ) | |||||||||
|
|
|
|
|
|||||||||
| Balance at April 30, 2021 |
122,465,538 | $ | 1,031,525 | |||||||||
|
|
|
|
|
|||||||||
| (i) | June 2020 At-the-market (“ATM”) Offering |
On June 16, 2020, the Company established an ATM equity program allowing the Company to issue up to $34,500 (or its U.S. dollar equivalent) of common shares to the public. The common shares sold through the ATM program were sold through the TSX, the NYSE and other marketplaces on which the common shares were listed, quoted or otherwise traded, at the prevailing market price at the time of sale. The program closed on July 31, 2020 and a total of approximately $34,551 (after foreign exchange gains) was generated through the issuance of 8,235,620 common shares in the year ended July 31, 2020. On July 31, 2020 a receivable of $883 remained for irrevocable sales which occurred prior to year end and subsequently settled on August 5, 2020, at which time the remaining 244,875 shares were issued.
18. Common Share Purchase Warrants
The following table summarizes warrant activity during the nine months ended April 30, 2021 and year ended July 31, 2020.
| April 30, 2021 | July 31, 2020 | |||||||||||||||
| Number of | Weighted average | Number of | Weighted average | |||||||||||||
| warrants | exercise price1 | warrants | exercise price1 | |||||||||||||
| Outstanding, beginning of year |
33,379,408 | $ | 7.60 | 7,396,359 | $ | 39.80 | ||||||||||
| Expired |
(97,123 | ) | 3.92 | (3,889,871 | ) | 49.00 | ||||||||||
| Issued |
— | — | 30,976,389 | 4.96 | ||||||||||||
| Exercised |
(1,522,139 | ) | 3.85 | (1,103,469 | ) | 3.88 | ||||||||||
|
|
|
|
|
|
|
|
|
|||||||||
| Outstanding, end of year |
31,760,146 | $ | 7.66 | 33,379,408 | $ | 7.60 | ||||||||||
|
|
|
|
|
|
|
|
|
|||||||||
| 1 | USD denominated warrant’s exercise price have been converted to the CAD equivalent as at the period end for presentation purposes. |
The 97,123 expired and cancelled warrants during the nine months ended April 30, 2021 were due to cashless exercises of the Company’s April 2020 and May 2020 warrants. In lieu of cash equal to the number of warrants exercised multiplied by the exercise price, the warrant holder forgoes the corresponding number of warrants which are effectively cancelled.
The following is a consolidated summary of warrants outstanding as at April 30, 2021 and July 31, 2020.
| April 30, 2021 | July 31, 2020 | |||||||||||||||
| Number outstanding |
Book value | Number outstanding |
Book value | |||||||||||||
| Classified as Equity |
$ | $ | ||||||||||||||
| June 2019 financing warrants |
||||||||||||||||
| Exercise price of $63.16 expiring June 19, 2023 |
546,135 | 10,022 | 546,135 | 10,022 | ||||||||||||
| April 2020 underwritten public offering warrants |
||||||||||||||||
| Exercise price of $3.84 expiring April 13, 2025 |
12,459,750 | 16,821 | 14,004,375 | 18,906 | ||||||||||||
| May 2020 underwritten public offering warrants |
||||||||||||||||
| Exercise price of $4.20 expiring May 21, 2025 |
7,777,876 | 10,702 | 7,852,513 | 10,805 | ||||||||||||
| Conversion Unit warrants |
||||||||||||||||
| Exercise price of $4.00 expiring June 10, 2023 |
3,686,721 | 11,426 | 3,686,721 | 11,426 | ||||||||||||
| Exercise price of $4.00 expiring June 30, 2023 |
978,907 | 1,928 | 978,907 | 1,928 | ||||||||||||
| Broker / Consultant warrants |
||||||||||||||||
| Exercise price of $3.00 expiring November 3, 2021 |
43,905 | 78 | 43,905 | 78 | ||||||||||||
| Exercise price of $3.00 expiring March 14, 2022 |
23,571 | 66 | 23,571 | 66 | ||||||||||||
| Exercise price of $63.16 expiring June 19, 2023 |
15 | — | 15 | — | ||||||||||||
| Molson warrants |
||||||||||||||||
12
| April 30, 2021 | July 31, 2020 | |||||||||||||||
| Number outstanding |
Book value | Number outstanding |
Book value | |||||||||||||
| Exercise price of $24.00 expiring October 4, 2021 |
2,875,000 | 42,386 | 2,875,000 | 42,386 | ||||||||||||
|
|
|
|
|
|
|
|
|
|||||||||
| 28,391,880 | 93,429 | 30,011,142 | 95,617 | |||||||||||||
| Classified as Liability |
||||||||||||||||
| USD$25m Registered Direct Offering Warrants |
||||||||||||||||
| Exercise price of USD$9.80 expiring December 31, 2024 |
1,871,259 | 7,243 | 1,871,259 | 1,917 | ||||||||||||
| USD$20m Registered Direct Offering Warrants |
||||||||||||||||
| Exercise price of USD$9.80 expiring January 22, 2025 |
1,497,007 | 5,794 | 1,497,007 | 1,533 | ||||||||||||
|
|
|
|
|
|
|
|
|
|||||||||
| 3,368,266 | 13,037 | 3,368,266 | 3,450 | |||||||||||||
|
|
|
|
|
|
|
|
|
|||||||||
| 31,760,146 | 106,466 | 33,379,408 | 99,067 | |||||||||||||
|
|
|
|
|
|
|
|
|
|||||||||
19. Share-based Compensation
Stock Options
The following table summarizes stock option activity during the nine months ended April 30, 2021 and the year ended July 31, 2020.
| April 30, 2021 | July 31, 2020 | |||||||||||||||
| Number of options |
Weighted average exercise price |
Number of options |
Weighted average exercise price |
|||||||||||||
| Opening balance |
7,503,689 | $ | 16.30 | 6,072,243 | $ | 23.48 | ||||||||||
| Granted |
2,091,172 | 5.03 | 2,986,507 | 6.48 | ||||||||||||
| Forfeited |
(593,408 | ) | 13.03 | (1,145,610 | ) | 22.20 | ||||||||||
| Expired |
(462,550 | ) | 27.82 | (380,318 | ) | 26.64 | ||||||||||
| Exercised |
(82,083 | ) | 3.70 | (29,133 | ) | 4.60 | ||||||||||
|
|
|
|
|
|
|
|
|
|||||||||
| Closing balance |
8,456,820 | $ | 13.23 | 7,503,689 | $ | 16.30 | ||||||||||
|
|
|
|
|
|
|
|
|
|||||||||
The following table summarizes the stock option grants during the nine months ended April 30, 2021.
| Options granted | ||||||||||||||||||||||||
| Grant date |
Exercise price ($) |
Executives and directors |
Non-executive employees |
Total | Vesting terms | Expiry period | ||||||||||||||||||
| October 30, 2020 |
3.88 | 349,652 | 315,358 | 665,010 | Terms A | 10 years | ||||||||||||||||||
| December 22, 2020 |
5.44 | 380,673 | 960,100 | 1,340,773 | Terms A | 10 years | ||||||||||||||||||
| April 28, 2021 |
7.54 | — | 85,389 | 85,389 | Terms A | 10 years | ||||||||||||||||||
|
|
|
|
|
|
|
|||||||||||||||||||
| Total |
730,325 | 1,360,847 | 2,091,172 | |||||||||||||||||||||
|
|
|
|
|
|
|
|||||||||||||||||||
Vesting terms A – One-third of the options will vest on each of the one-year anniversaries of the date of grant over a three-year period.
The following table summarizes information concerning stock options outstanding as at April 30, 2021.
| Exercise price |
Number outstanding |
Weighted average remaining life (years) |
Number exercisable |
Weighted average remaining life (years) |
||||||||||||
| $2.32–$10.76 |
4,566,444 | 8.86 | 943,941 | 6.78 | ||||||||||||
| $15.56–$26.16 |
1,664,895 | 8.00 | 1,051,887 | 7.78 | ||||||||||||
| $28.52–$34.00 |
2,220,732 | 7.65 | 1,205,879 | 7.53 | ||||||||||||
| $47.36–$66.96 |
4,749 | 0.41 | 4,749 | 0.41 | ||||||||||||
|
|
|
|
|
|||||||||||||
| 8,456,820 | 3,206,456 | |||||||||||||||
|
|
|
|
|
|||||||||||||
Restricted Share Units (“RSUs”)
Under the Omnibus Plan, the Board of Directors is authorized to issue RSUs up to 10% of the issued and outstanding common shares, inclusive of the outstanding stock options. At the time of issuance, the Board of Directors establishes conversion values and expiry dates, which are up to 10 years from the date of issuance. The restriction criteria of the units are at the discretion of the Board of Directors and from time to time may be inclusive of Company based performance restrictions, employee-based performance restrictions or no restrictions to the units.
The following table summarizes RSU activity during the nine months ended April 30, 2021 and the year ended July 31, 2020.
13
| April 30, 2021 | July 31, 2020 | |||||||||||||||
| Value of units on | Value of units on | |||||||||||||||
| Units | grant date | Units | grant date | |||||||||||||
| Opening balance |
587,108 | $ | 8.41 | — | $ | — | ||||||||||
| Granted |
7,161 | 3.16 | 609,636 | 8.52 | ||||||||||||
| Exercised |
(25,483 | ) | 8.60 | — | — | |||||||||||
| Forfeited |
(34,801 | ) | 11.76 | (22,528 | ) | 11.76 | ||||||||||
|
|
|
|
|
|
|
|
|
|||||||||
| Closing balance |
533,985 | $ | 7.96 | 587,108 | $ | 8.41 | ||||||||||
|
|
|
|
|
|
|
|
|
|||||||||
The following table summarizes the RSUs granted during the nine months ended April 30, 2021.
| RSUs granted | ||||||||||||||||||||
| Grant date |
Unit value | Executive and directors |
Non-executive employees |
Vesting terms |
Expiry period |
|||||||||||||||
| October 30, 2020 |
$ | 3.16 | 7,161 | — | Terms A | 10 years | ||||||||||||||
|
|
|
|||||||||||||||||||
| Total |
7,161 | |||||||||||||||||||
|
|
|
|||||||||||||||||||
Vesting terms A – One-third of the units vest on each of the one-year anniversaries for the first three years after the grant date.
Share-based Compensation
Share-based compensation is measured at fair value at the date of grant and are expensed over the vesting period (See Note 22 for share-based compensation allocation by expense group). In determining the amount of share-based compensation, the Company used the Black-Scholes-Merton option pricing model to establish the fair value of stock options and RSUs granted at grant date by applying the following assumptions:
| April 30, 2021 | July 31, 2020 | |||||||
| Exercise price (weighted average) |
$ | 17.97 | $ | 26.04 | ||||
| Market price (weighted average) |
$ | 18.16 | $ | 26.44 | ||||
| Risk-free interest rate (weighted average) |
1.30 | % | 1.79 | % | ||||
| Expected life (years) of options (weighted average) |
5 | 5 | ||||||
| Expected annualized volatility (weighted average) |
83 | % | 75 | % | ||||
Volatility was estimated using the average historical volatility of the Company and comparable companies in the industry that have trading history and volatility history.
For the three and nine months ended April 30, 2021, the Company allocated to inventory $444 and $1,284, respectively (April 30, 2020 – $1,358 and $5,088) of share-based compensation applicable to direct and indirect labour in the cultivation and production process..
The cash-settled share-based compensation liability is presented in Other liabilities. The following table summarizes the Company’s equity-settled and cash-settled share- based payments for the nine months ended April 30, 2021 and 2020.
| April 30, 2021 | April 30, 2020 | |||||||
| $ | $ | |||||||
| Stock option share-based compensation |
10,337 | 18,599 | ||||||
| RSU share-based compensation |
— | — | ||||||
|
|
|
|
|
|||||
| Total equity-settled share-based compensation |
10,337 | 18,599 | ||||||
|
|
|
|
|
|||||
| RSU share-based compensation |
1,850 | — | ||||||
|
|
|
|
|
|||||
| Total cash-settled share-based compensation |
1,850 | — | ||||||
|
|
|
|
|
|||||
14
20. Net Loss per Share
The following securities could potentially dilute basic net loss per share in the future but have not been included in diluted loss per share because their effect was anti-dilutive:
| Instrument |
April 30, 2021 | July 31, 2020 | ||||||
| Stock Options |
8,456,820 | 7,503,690 | ||||||
| RSUs |
533,985 | 587,108 | ||||||
| 2019 June financing warrants |
546,135 | 546,135 | ||||||
| USD$25m registered direct offering warrants |
1,871,259 | 1,871,259 | ||||||
| USD$20m registered direct offering warrants |
1,497,007 | 1,497,007 | ||||||
| 2020 April underwritten public offering warrants |
12,459,750 | 14,004,375 | ||||||
| 2020 May underwritten public offering warrants |
7,777,876 | 7,852,513 | ||||||
| Warrants issued under conversion of debentures |
4,665,628 | 4,665,628 | ||||||
| Joint venture and Inner Spirit issued warrants |
2,875,000 | 2,875,000 | ||||||
| Convertible debenture broker/finder warrants |
67,491 | 67,491 | ||||||
|
|
|
|
|
|||||
| 40,750,951 | 41,470,206 | |||||||
|
|
|
|
|
|||||
21. Financial Instruments
Market Risk
Interest Risk
The Company has minimal exposure to interest rate risk related to any investments of cash and cash equivalents. The Company may invest cash in highly liquid investments with short terms to maturity that would accumulate interest at prevailing rates for such investments. As at April 30, 2021, the Company had no term loans (July 31, 2020 – $29,930) (Note 16).
Price Risk
Price risk is the risk of variability in fair value due to movements in equity or market prices. The Company’s level 1 and 2 investments are susceptible to price risk arising from uncertainties about their future outlook, future values and the impact of market conditions. The fair value of marketable securities and derivatives held in publicly traded entities is based on quoted market prices, which the shares of the investments can be exchanged for. The Company elected an early conversion option in the year ended July 31, 2020 in which $29,860 of the aggregate principal amount of its 8% unsecured convertible debentures (Note 14) were converted, which partially mitigates the Company’s Price Risk.
There would be no material impact (July 31, 2020 – no material impact) if the fair value of these financial assets were to increase or decrease by 10% as of April 30, 2021. The price risk exposure as at April 30, 2021 and July 31, 2020 is presented in the table below.
| April 30, 2021 | July 31, 2020 | |||||||
| $ | $ | |||||||
| Financial assets |
4,402 | 2,692 | ||||||
| Financial liabilities |
(13,037 | ) | (3,450 | ) | ||||
|
|
|
|
|
|||||
| Total exposure |
(8,635 | ) | (758 | ) | ||||
|
|
|
|
|
|||||
Credit Risk
Credit risk is the risk of financial loss to the Company if a customer or counterparty to a financial instrument fails to meet its contractual obligations and arises principally from the Company’s trade receivables and convertible debentures receivable. As at April 30, 2021, the Company was exposed to credit related losses in the event of non-performance by the counterparties.
The Company provides credit to its customers in the normal course of business and has established credit evaluation and monitoring processes to mitigate credit risk. Since the majority of the medical sales are transacted with clients that are covered under various insurance programs, and adult use sales are transacted with crown corporations, the Company has limited credit risk.
Cash and cash equivalents, certain restricted funds and short-term investments are held with four Canadian commercial banks that hold Dun and Bradstreet credit ratings of AA (July 31, 2020 – AA) and $111 is held with a credit union that does not have a publicly available credit rating. Certain restricted funds in the amount of $30,000 are managed by an insurer and are held as a cell captive within a Bermuda based private institution which does not have a publicly available credit rating; however the utilized custodian is Citibank which holds a credit rating of A+. The majority of the trade receivables balance is held with crown corporations of Quebec, Ontario and Alberta. Creditworthiness of a counterparty is evaluated prior to the granting of credit. The Company has estimated the expected credit loss using a lifetime credit loss approach. The current expected credit loss for the nine months ended April 30, 2021 is $36 (July 31, 2020 - $35).
15
In measuring the expected credit losses, the adult-use cannabis trade receivables have been assessed on a per customer basis as they consist of a low number of material contracts. Medical trade receivables have been assessed collectively as they have similar credit risk characteristics. They have been grouped based on the days past due.
Credit risk from the convertible debenture receivable arises from the possibility that principal and/or interest due may become uncollectible. The Company mitigates this risk by managing and monitoring the underlying business relationship.
The carrying amount of cash and cash equivalents, restricted cash and trade receivables represents the maximum exposure to credit risk and as at April 30, 2021; this amounted to$132,638 (July 31, 2020 – $211,860).
The following table summarizes the Company’s aging of trade receivables as at April 30, 2021 and July 31, 2020:
| April 30, 2021 |
July 31, 2020 |
|||||||
| $ | $ | |||||||
| 0–30 days |
14,830 | 15,253 | ||||||
| 31–60 days |
2,407 | 2,972 | ||||||
| 61–90 days |
375 | 412 | ||||||
| Over 90 days |
1,437 | 789 | ||||||
|
|
|
|
|
|||||
| Total |
19,049 | 19,426 | ||||||
|
|
|
|
|
|||||
Economic Dependence Risk
Economic dependence risk is the risk of reliance upon a select number of customers, which significantly impacts the financial performance of the Company. For the three months ended April 30, 2021, the Company’s recorded sales to the crown corporations; Société québécoise du cannabis (“SQDC”) the Ontario Cannabis Store (“OCS”) and the Alberta Gaming, Liquor and Cannabis agency (“ALGC”) representing 44%, 26% and 15%, respectively (April 30, 2020 – one crown corporation representing 83%) of total applicable periods gross cannabis sales.
For the nine months ended April 30, 2021, the Company’s recorded sales to the crown corporations; Société québécoise du cannabis (“SQDC”) the Ontario Cannabis Store (“OCS”) and the Alberta Gaming, Liquor and Cannabis agency (“ALGC”) representing 50%, 20% and 17%, respectively (April 30, 2020 – one crown corporation representing 75%) of total applicable periods gross cannabis sales.
The Company holds trade receivables from the crown corporations SQDC, OCS and the AGLC representing 30%, 35% and 14%, respectively, of total trade receivable, respectively as at April 30, 2021 (July 31, 2020 – two crown corps SQDC and OCS representing 47% and 25% of total trade receivables, respectively).
Liquidity Risk
Liquidity risk is the risk that the Company will not be able to meet its financial obligations as they come due. The Company manages its liquidity risk by reviewing on an ongoing basis its capital requirements. As at April 30, 2021, the Company had $81,038 (July 31, 2020 –$184,173) of cash and cash equivalents and $19,049 (July 31, 2020 –$19,426) in trade receivables.
The Company has current liabilities of $69,742 and contractual commitments of $9,472 due before July 31, 2022. The Company’s existing cash and cash equivalents and trade receivables are expected to provide sufficient liquidity to meet cash outflow requirements over the next twelve months.
The Company’s success in executing on its longer-term strategy is dependent upon its ability to fund the repayment of existing borrowings and to generate positive cash flows from operations. If additional liquidity is required, management plans to secure the necessary financing through the issuance of new public or private equity or debt instruments. There is no assurance that additional future funding will be available to the Company, or that it will be available on terms which are acceptable to management.
The carrying values of cash and cash equivalents, trade receivables and accounts payable and accrued liabilities approximate their fair values due to their short-term to maturity.
Foreign Currency Risk
On April 30, 2021, the Company holds certain financial assets and liabilities denominated in United States Dollars (“USD”) which consist of cash and cash equivalents, and warrant liabilities. The Company does not currently use foreign exchange contracts to hedge its exposure of its foreign currency cash flows as management has determined that this risk is not significant. The Company closely monitors relevant economic information to minimize its net exposure to foreign currency risk. The Company is exposed to unrealized foreign exchange risk through its cash and cash equivalents. As at April 30, 2021, approximately $35,614 (USD$29,492) (July 31, 2020 – $42,981 (USD$57,652)) of the Company’s cash and cash equivalents was in USD. A 1% change in the foreign exchange rate would result in a change of $356 to the unrealized gain or loss on foreign exchange or on the gain or loss on financial instrument revaluation of USD denominated warrants.
16
22. Operating Expenses by Nature
The following table disaggregates the selling, general and administrative expenses as presented on the Statement of Loss and Comprehensive Loss into specified classifications based upon their nature:
| For the three months ended | For the nine months ended | |||||||||||||||
| April 30, 2021 |
April 30, 2020 |
April 30, 2021 |
April 30, 2020 |
|||||||||||||
| $ | $ | $ | $ | |||||||||||||
| Salaries and benefits |
3,448 | 2,633 | 13,711 | 8,657 | ||||||||||||
| Professional fees |
3,023 | 1,924 | 8,523 | 7,534 | ||||||||||||
| Facilities |
1,348 | 1,996 | 3,822 | 5,398 | ||||||||||||
| Selling, general and administrative |
5,940 | 2,947 | 9,979 | 11,284 | ||||||||||||
| Consulting |
1,019 | 1,447 | 2,791 | 6,044 | ||||||||||||
| Travel |
44 | 291 | 213 | 1,916 | ||||||||||||
|
|
|
|
|
|
|
|
|
|||||||||
| Total |
14,822 | 11,238 | 39,039 | 40,833 | ||||||||||||
|
|
|
|
|
|
|
|
|
|||||||||
The following table summarizes the nature of share-based compensation in the period:
| For the three months ended | For the nine months ended | |||||||||||||||
| April 30, 2021 |
April 30, 2020 |
April 30, 2021 |
April 30, 2020 |
|||||||||||||
| $ | $ | $ | $ | |||||||||||||
| General and administrative related share-based compensation |
2,502 | 5,941 | 10,323 | 21,543 | ||||||||||||
| Marketing and promotion related share-based compensation |
213 | 230 | 581 | 694 | ||||||||||||
|
|
|
|
|
|
|
|
|
|||||||||
| Total operating expense related share-based compensation |
2,715 | 6,171 | 10,904 | 22,237 | ||||||||||||
| Share based compensation capitalized to inventory |
444 | 1,357 | 1,283 | 5,089 | ||||||||||||
|
|
|
|
|
|
|
|
|
|||||||||
| Total share-based compensation |
3,159 | 7,528 | 12,187 | 27,326 | ||||||||||||
|
|
|
|
|
|
|
|
|
|||||||||
The following table summarizes the total payroll related wages and benefits by nature in the period:
| For the three months ended | For the nine months ended | |||||||||||||||
| April 30, 2021 |
April 30, 2020 |
April 30, 2021 |
April 30, 2020 |
|||||||||||||
| $ | $ | $ | $ | |||||||||||||
| General and administrative related wages and benefits |
3,448 | 2,633 | 13,711 | 8,657 | ||||||||||||
| Marketing and promotion related wages and benefits |
1,560 | 1,148 | 4,064 | 3,796 | ||||||||||||
| Research and development related wages and benefits |
433 | 513 | 2,247 | 2,226 | ||||||||||||
|
|
|
|
|
|
|
|
|
|||||||||
| Total operating expense related wages and benefits |
5,441 | 4,294 | 20,022 | 14,679 | ||||||||||||
| Wages and benefits capitalized to inventory |
3,465 | 3,991 | 11,795 | 17,317 | ||||||||||||
|
|
|
|
|
|
|
|
|
|||||||||
| Total wages and benefits |
8,906 | 8,285 | 31,817 | 31,996 | ||||||||||||
|
|
|
|
|
|
|
|
|
|||||||||
23. Other Income and Losses
| For the three months ended | For the nine months ended | |||||||||||||||
| April 30, 2021 |
April 30, 2020 |
April 30, 2021 |
April 30, 2020 |
|||||||||||||
| $ | $ | $ | $ | |||||||||||||
| Interest and financing expenses |
(3,296 | ) | (3,279 | ) | (8,368 | ) | (7,312 | ) | ||||||||
| Interest income |
349 | 353 | 1,057 | 1,239 | ||||||||||||
|
|
|
|
|
|
|
|
|
|||||||||
| Finance income (expense), net |
(2,947 | ) | (2,926 | ) | (7,311 | ) | (6,073 | ) | ||||||||
|
|
|
|
|
|
|
|
|
|||||||||
| Revaluation of financial instruments gain |
(383 | ) | 4,955 | (9,587 | ) | 7,966 | ||||||||||
| Share of loss from investment in associate and joint ventures |
(2,244 | ) | (1,195 | ) | (5,902 | ) | (4,468 | ) | ||||||||
| Loss on convertible debenture receivable |
746 | (212 | ) | 746 | (3,253 | ) | ||||||||||
| Unrealized gain/(loss) on investments |
544 | (311 | ) | 1,204 | (8,535 | ) | ||||||||||
| Realized gain on investments |
— | (1,217 | ) | — | (1,444 | ) | ||||||||||
| Foreign exchange gain/(loss) |
(1,514 | ) | 2,443 | (3,836 | ) | 3,017 | ||||||||||
| Other income |
1,177 | — | 4,511 | — | ||||||||||||
|
|
|
|
|
|
|
|
|
|||||||||
| Non-operating income (expense), net |
(1,674 | ) | 4,463 | (12,864 | ) | (6,717 | ) | |||||||||
|
|
|
|
|
|
|
|
|
|||||||||
17
24. Related Party Disclosure
Compensation of Key Management
Key management personnel are those persons having the authority and responsibility for planning, directing and controlling the Company’s operations, directly or indirectly. The key management personnel of the Company are the members of the executive management team and Board of Directors.
Compensation provided to key management during the year was as follows:
| For the three months ended | For the nine months ended | |||||||||||||||
| April 30, 2021 |
April 30, 2020 |
April 30, 2021 |
April 30, 2020 |
|||||||||||||
| $ | $ | $ | $ | |||||||||||||
| Salary and/or consulting fees |
764 | 715 | 1,846 | 2,365 | ||||||||||||
| Termination benefits |
— | 427 | 1,008 | 427 | ||||||||||||
| Bonus compensation |
210 | — | 620 | 42 | ||||||||||||
| Stock-based compensation |
1,454 | 4,302 | 5,709 | 13,894 | ||||||||||||
|
|
|
|
|
|
|
|
|
|||||||||
| Total |
2,428 | 5,444 | 9,183 | 16,728 | ||||||||||||
|
|
|
|
|
|
|
|
|
|||||||||
Related Parties and Transactions
Belleville Complex Inc.
The Company holds a 25% interest in Belleville Complex Inc. (“BCI”) with the related party Olegna Holdings Inc., a company owned and controlled by a director of the Company, holding the remaining 75% in BCI. BCI purchased a configured 2,004,000 sq. ft. facility through a $20,279 loan issued and repaid during the year ended July 31, 2019. The Company will be the anchor tenant for a 15-year, with an option to renew for 15 years and additional space to rent. The Company has also subleased a portion of the space to Truss Limited Partnership (Note 8). Consideration for the 25% interest on the joint venture is deemed $nil. The carrying value of BCI as at April 30, 2021 is $479 (July 31, 2020 - $nil).
The Company leases a space in Belleville from a related party BCI, that supports its manufacturing activities and is based in Belleville, Ontario. Under this lease arrangement, the Company incurred $1,261 and $3,427 in lease and operating expenses during the three and nine months ended April 30, 2021, respectively (April 30, 2020 - $1,236 and $5,510). This lease liability is recognized on the Company’s balance sheet under IFRS 16 (Note 15).
Truss LP
The Company owns a 42.5% interest in Truss LP and accounts for the interest as an investment in an associate (Note 9).
The Company subleases section of its Belleville lease to Truss LP this sublease is recognized as a finance lease receivable on the Company’s balance sheet (Note 5). The Company recognizes a recovery on its partnership with Truss LP in Other receivables and Other income.
Under a Temporary Supply and Services Agreement (“TSSA”) with Truss LP, the Company produces and packages cannabis infused beverages in the CIB Facility (located at the Belleville Facility) and in the Gatineau Facility, an markets and sells beverages for the legal adult-use markets in Canada, in each case subject to the terms of its regulatory approvals and applicable laws, all for its own account and as a stand-alone division of HEXO. Truss LP applied to be a licensed producer of Cannabis during the period, but until the time where Truss LP obtains all regulatory approval required under the Cannabis Act (Canada), the TSSA will remain in place. Under the TSSA, Truss LP will be an exclusive supplier to the Company of all property and all services required to carry on the business, other than specific services which are required to be provided by HEXO. As a result of this arrangement, there is a receivable from Truss of $1,908 at April 30, 2021 (July 31, 2020 – $3,405). During the three and nine months ended April 30, 2021, the Company purchased $782 and $5,955 (April 30, 2020 – $nil and $nil) of raw materials from Truss LP under the arrangement and received $1,045 (April 30, 2020 – $nil) of Income.
25. Capital Management
The Company’s objectives when managing capital are to (1) safeguard their ability to continue as a going concern, so that they can continue to provide returns for shareholders and benefits for other stakeholders, and (2) maintain an optimal capital structure to reduce the cost of capital.
Management defines capital as the Company’s shareholders’ equity and interest-bearing debt. The Board of Directors does not establish quantitative return on capital criteria for management. The Company has not paid any dividends to its shareholders. The Company is not subject to any externally imposed capital requirements, with the exception of covenants related to the Company’s Term Loan as set out in Note 16.
As at April 30, 2021, total managed capital was $527,125 (July 31, 2020 – $556,676).
18
26. Commitments and Contingencies
COMMITMENTS
The Company has certain contractual financial obligations related to service agreements, purchase agreements, rental agreements and construction contracts.
Some of these contracts have optional renewal terms that the Company may exercise at its option. The annual minimum payments payable under these obligations over the next five fiscal years and thereafter are as follows:
| July 31, 2022 |
$ | 9,472 | ||
| July 31, 2023 |
5,050 | |||
| July 31, 2024 |
3,677 | |||
| July 31, 2025 |
3,531 | |||
| July 31, 2026 |
2,429 | |||
| Thereafter |
19,274 | |||
|
|
|
|||
| $ | 43,433 | |||
|
|
|
See Note 15 for recognized contractual commitments regarding the Company’s lease obligations under IFRS 16.
LETTERS OF CREDIT
On August 21, 2019, the Company entered into a five-year letter of credit with a Canadian financial institution to provide a maximum of $250 that amortizes $50 annually until its expiry on July 14, 2024. The letter of credit has not been drawn upon as at April 30, 2021. As at April 30, 2021, the $200 letter of credit is secured by cash held in collateral (Note 4).
On August 1, 2020, the Company reissued a pre-existing letter of credit with a Canadian financial institution under an agreement with a public utility provider entitling the utility provider to a maximum of $2,581, subject to certain operational requirements. The letter of credit has a one-year expiry from the date of issuance with an autorenewal feature. On January 1, 2021, the letter of credit was reduced to $2,352 by way of amendment. The letter of credit has not been drawn upon as at April 30, 2021. The letter of credit is secured by cash held in collateral (Note 4).
CONTINGENCIES
The Company may be, from time to time, subject to various administrative and other legal proceedings arising in the ordinary course of business. Contingent liabilities associated with legal proceedings are recorded when a liability is probable, and the contingent liability can be reasonably estimated.
As of April 30, 2021, the Company is named as a defendant in securities class actions that have been filed in the superior court of the province of Quebec and in the Supreme Court of the State of New York. One or more of the Company’s current and/or former officers and directors, and/or certain underwriters of past public offerings by the Company, are also named as defendants in certain of the actions. The lawsuits assert causes of action under Canadian and U.S. securities legislation in connection with statements made by the defendants that are alleged to have been materially false and/or misleading statements and their alleged failure to disclose material adverse facts. The alleged misrepresentations relate to, among other things, the Company’s forward-looking information, including but not limited to the Company’s forecast revenues for Q4 2019 and fiscal 2020, its inventory, “channel stuffing” and the Company’s supply agreement with the Province of Quebec. As at the date hereof, the amounts claimed for damages in each of these actions have not been quantified. These actions are in a preliminary stage and have not yet been certified as class actions. In November 2020, the Superior Court of Justice of Ontario ordered the discontinuance of two putative securities class actions commenced in Ontario relating to the same matters on a without costs basis. On March 9, 2021, the United States District Court for the Southern District of New York dismissed the U.S. federal securities class action pending against the company relating to the same matters on a without costs basis, with the dismissal not having been appealed from.
As of April 30, 2021, the Company was named as a defendant in a proposed consumer protection class action filed on June 18, 2020 in the Court of Queens’ Bench in Alberta on behalf of residents of Canada who purchased cannabis products over specified periods of time. Several other licensed producers are also named as co-defendants in the action. The lawsuit asserts causes of action, including for breach of contract and breach of consumer protection legislation, arising out of allegations that the Tetrahydrocannabinol (THC) or Cannabidiol (CBD) content of medicinal and recreational cannabis products sold by the Company and the other defendants to consumers was different from what was advertised on the products’ labels. Many of the cannabis products sold by the Company and other defendants were allegedly sold to consumers in containers using plastic bottles or caps that may have rapidly absorbed or degraded the THC or CBD content within them. By allegedly over-representing the true amount of THC or CBD in the products, the plaintiff claims that consumers would be required to consume substantially more product than they otherwise would have in order to obtain the desired effects or, in the alternative, would have consumed the product without obtaining the desired effects. The action has not yet been certified as a class action.
ONEROUS CONTRACT
During the year ended July 31, 2020, the Company recognized a $4,763 onerous contract provision related to a fixed price supply agreement for the supply of certain cannabis products. The supply agreement is currently the subject of legal proceedings as disclosed above. The costs and purchase obligations under the contract exceed the economic benefits expected to be received. The related loss has been included in Other gains and losses. The onerous contract liability remains as at April 30, 2021.
19
27. Fair Value of Financial Instruments
The carrying values of the financial instruments as at April 30, 2021 are summarized in the following table:
| Amortized | ||||||||||||
| cost | FVTPL | Total | ||||||||||
| Assets |
$ | $ | $ | |||||||||
| Cash and cash equivalents |
81,038 | — | 81,038 | |||||||||
| Restricted funds |
32,551 | — | 32,551 | |||||||||
| Trade receivables |
19,049 | — | 19,049 | |||||||||
| Convertible debenture receivable |
— | 20,246 | 20,246 | |||||||||
| Commodity taxes recoverable and other receivables |
10,202 | — | 10,202 | |||||||||
| Lease receivable – long term |
3,795 | — | 3,795 | |||||||||
| Long – term investments |
— | 4,402 | 4,402 | |||||||||
|
|
|
|
|
|
|
|||||||
| Liabilities |
$ | $ | $ | |||||||||
| Accounts payable and accrued liabilities |
42,968 | — | 42,968 | |||||||||
| Warrant liability |
— | 13,037 | 13,037 | |||||||||
| Lease liability – current |
4,659 | — | 4,659 | |||||||||
| Lease liability – long term |
22,566 | — | 22,566 | |||||||||
| Convertible debentures |
31,951 | — | 31,951 | |||||||||
| Term loan – current |
— | — | — | |||||||||
| Other long-term liabilities(1) |
— | 1,805 | 1,805 | |||||||||
|
|
|
|
|
|
|
|||||||
| 1 | Financial liability designated as FVTPL. |
The carrying values of the financial instruments as at July 31, 2020 are summarized in the following table:
| Amortized | ||||||||||||
| cost | FVTPL | Total | ||||||||||
| Assets |
$ | $ | $ | |||||||||
| Cash and cash equivalents |
184,173 | — | 184,173 | |||||||||
| Restricted funds |
8,261 | — | 8,261 | |||||||||
| Trade receivables |
19,426 | — | 19,426 | |||||||||
| Commodity taxes recoverable and other receivables |
16,773 | — | 16,773 | |||||||||
| Lease receivable – long term |
3,865 | — | 3,865 | |||||||||
| Long – term investments |
— | 3,209 | 3,209 | |||||||||
|
|
|
|
|
|
|
|||||||
| Liabilities |
$ | $ | $ | |||||||||
| Accounts payable and accrued liabilities |
32,451 | — | 32,451 | |||||||||
| Warrant liability |
— | 3,450 | 3,450 | |||||||||
| Lease liability – current |
4,772 | — | 4,772 | |||||||||
| Lease liability – long term |
24,344 | — | 24,344 | |||||||||
| Convertible debentures |
28,969 | — | 28,969 | |||||||||
| Term loan – current |
29,930 | — | 29,930 | |||||||||
| Other long-term liabilities(1) |
— | 393 | 393 | |||||||||
|
|
|
|
|
|
|
|||||||
| 1 | Financial liability designated as FVTPL. |
The carrying values of cash and cash equivalents, restricted funds, short term investments, trade and other receivables, lease receivables, accounts payable and accrued liabilities, lease liabilities and term loan approximate their fair values due to their relatively short periods to maturity.
28. Non-Controlling Interest
The following table summarizes the information relating to the Company’s non-controlling interests, before intercompany eliminations.
| April 30, 2021 | July 31, 2020 | |||||||
| Current assets |
$ | — | $ | — | ||||
| Non-current assets |
8,448 | 7,455 | ||||||
| Current liabilities |
— | — | ||||||
| Non-current liabilities |
— | — | ||||||
|
|
|
|
|
|||||
| Non-controlling interest (%) |
40 | % | 40 | % | ||||
|
|
|
|
|
|||||
| Non-controlling interest |
$ | 3,379 | $ | 3,379 | ||||
|
|
|
|
|
|||||
The Company holds a 60% interest in Keystone Isolation Technology Inc. (“KIT”) which is intended to principally operate out of Belleville Facility, and the remaining 40% represents the non-controlling interest held by Chroma Global Technologies Ltd (the “Partner”). Under the terms of the shareholder agreement, the Company has contributed cash of $4,699 (USD$3,100). The non-controlling interest value of $3,750 represents the value of the Partners contribution in kind for their respective equity interest in the
20
entity. During the three months ended October 31, 2020, the Partner contributed capital equipment in-kind of $371 as required under the terms of the shareholders agreement. There remains approximately $325 of an in-kind commissioning contribution to satisfy the acquisition terms of the shareholders agreement. KIT had no revenues or expenses during the nine months ended April 30, 2021 and the year ended July 31, 2020.
29. Revenue from Sale of Goods
The Company disaggregated its revenues from the sale of goods between sales of cannabis beverages (“Cannabis beverage sales”) and dried flower, vapes, and other cannabis products (“Cannabis sales excluding beverages”). The Company’s cannabis beverage sales are derived from the Cannabis Infused Beverage (“CIB”) line, which was established in order to manufacture, produce and sell cannabis beverage products. CIB operates under the Company’s cannabis licensing and in compliance with Health Canada and the Cannabis Act’s regulations. The Company has assessed the beverage revenue stream to be realized by the Company and presented on a gross basis as defined under IFRS 15. The Company will continue to operate CIB until Truss has obtained its independent licensing to manufacture and sell cannabis products, at which point these operations will shift to Truss.
| For the three months ended |
April 30, 2021 | April 30, 2020 | ||||||||||||||||||||||
| Revenue stream |
Cannabis sales excluding beverages |
Cannabis beverage sales |
Total | Cannabis sales excluding beverages |
Cannabis beverage sales |
Total | ||||||||||||||||||
| $ | $ | $ | $ | $ | $ | |||||||||||||||||||
| Retail |
29,273 | 3,330 | 32,603 | 29,316 | 465 | 29,781 | ||||||||||||||||||
| Medical |
430 | — | 430 | 774 | — | 774 | ||||||||||||||||||
| Wholesale |
49 | — | 49 | 340 | — | 340 | ||||||||||||||||||
| International |
— | — | — | — | — | — | ||||||||||||||||||
|
|
|
|
|
|
|
|
|
|
|
|
|
|||||||||||||
| Total revenue from sale of goods |
29,752 | 3,330 | 33,082 | 30,430 | — | 30,895 | ||||||||||||||||||
|
|
|
|
|
|
|
|
|
|
|
|
|
|||||||||||||
| For the nine months ended |
April 30, 2021 | April 30, 2020 | ||||||||||||||||||||||
| Revenue stream |
Cannabis sales excluding beverages |
Cannabis beverage sales |
Total | Cannabis sales excluding beverages |
Cannabis beverage sales |
Total | ||||||||||||||||||
| $ | $ | $ | $ | $ | $ | |||||||||||||||||||
| Retail |
104,587 | 10,280 | 114,867 | 70,549 | 465 | 71,014 | ||||||||||||||||||
| Medical |
1,508 | — | 1,508 | 2,655 | — | 2,655 | ||||||||||||||||||
| Wholesale |
559 | — | 559 | 340 | — | 340 | ||||||||||||||||||
| International |
3,125 | — | 3,125 | — | — | — | ||||||||||||||||||
|
|
|
|
|
|
|
|
|
|
|
|
|
|||||||||||||
| Total revenue from sale of goods |
109,779 | 10,280 | 120,059 | 73,544 | — | 74,009 | ||||||||||||||||||
|
|
|
|
|
|
|
|
|
|
|
|
|
|||||||||||||
Total revenue from the sale of goods is presented net of provisions for sales returns and price concessions. During the three and nine months ended April 30, 2021 the Company incurred $936 and $2,474 (April 30, 2020—$1,950 and $5,370) of net sales provisions and price concessions, respectively.
30. Segmented Information
The Company operates under one material operating segment. All property, plant and equipment and intangible assets are located in Canada.
31. Operating Cash Flow
The following items comprise the Company’s operating cash flow activity for the periods herein.
| For the nine months ended |
April 30, 2021 | April 30, 2020 | ||||||
| $ | $ | |||||||
| Items not affecting cash |
||||||||
| Income tax recovery |
— | (6,023 | ) | |||||
| Depreciation of property, plant and equipment |
4,369 | 4,890 | ||||||
| Depreciation of property, plant and equipment in cost of sales |
1,502 | 2,313 | ||||||
| Amortization of intangible assets |
1,043 | 3,690 | ||||||
| Loss/(gain) on convertible debentures |
(746 | ) | 3,253 | |||||
| Unrealized gain on changes in fair value of biological assets |
(35,616 | ) | (21,378 | ) | ||||
| Unrealized fair value adjustment on investments |
(1,204 | ) | 8,535 | |||||
| Amortization of deferred financing costs |
793 | — | ||||||
| Accrued interest income |
4,890 | 6,850 | ||||||
| Accretion of convertible debenture |
2,956 | — | ||||||
| Gain/(Loss) on investment |
— | 1,444 | ||||||
| License depreciation and prepaid royalty expenses |
118 | 301 | ||||||
| Write-off of inventory and biological assets |
1,001 | 2,838 | ||||||
| Write (up)/down of inventory to net realizable value |
— | 39,311 | ||||||
| Realized fair value amounts on inventory sold |
17,619 | 21,362 | ||||||
21
| For the nine months ended |
April 30, 2021 | April 30, 2020 | ||||||
| Loss from investment in associate and joint ventures |
5,902 | 4,468 | ||||||
| Share-based compensation |
12,000 | 22,237 | ||||||
| Revaluation of financial instruments (gain)/loss |
9,587 | (7,966 | ) | |||||
| Impairment losses |
(662 | ) | 251,070 | |||||
| Loss on onerous contract |
— | 3,000 | ||||||
| Loss on long lived assets and disposal of property, plant and equipment |
1,339 | 3,734 | ||||||
| Gain on exit of lease |
(789 | ) | — | |||||
|
|
|
|
|
|||||
| Total items not affecting cash |
24,102 | 343,929 | ||||||
|
|
|
|
|
|||||
| Changes in non-cash operating working capital items |
||||||||
| Trade receivables |
347 | 2,873 | ||||||
| Commodity taxes recoverable and other receivables |
5,648 | (1,479 | ) | |||||
| Prepaid expenses |
(1,851 | ) | 5,170 | |||||
| Inventory |
(36,768 | ) | (87,243 | ) | ||||
| Biological assets |
33,965 | 22,168 | ||||||
| Accounts payable and accrued liabilities |
6,269 | (1,866 | ) | |||||
| Excise taxes payable |
(2,806 | ) | 727 | |||||
|
|
|
|
|
|||||
| Total non-cash operating working capital |
4,804 | (59,650 | ) | |||||
|
|
|
|
|
|||||
Additional supplementary cash flow information is as follows:
| For the |
nine months ended April 30, 2021 |
year ended July 31, 2020 |
||||||
| $ | $ | |||||||
| Property, plant and equipment in accounts payable |
4,150 | 19,751 | ||||||
| Right-of-use asset additions |
— | 24,405 | ||||||
| Capitalized borrowing costs |
1,269 | 2,385 | ||||||
| Interest paid |
2,409 | 2,527 | ||||||
|
|
|
|
|
|||||
32. Comparative Information
The Company has reclassified Impairment loss on inventory within Cost of goods sold, to conform with the current presentation. The amount is disclosed in Note 6. The Company has reclassified purchased extracts inventory from extracts to conform with the current presentation, the amount is disclosed in Note 6.
33. Income Taxes
The Company’s effective income tax rate was nil% for the nine months ended April 30, 2021 (April 30, 2020 – 1.57%). The effective tax rate is different than the statutory rate primarily due to the non-recognition of deferred tax assets.
34. Subsequent Events
Acquisition of Zenabis Global Inc.
On February 15, 2021, the Company entered into a definitive arrangement agreement with Zenabis Global Inc.(or “Zenabis”) under which the Company sought to acquire all of Zenabis’ issued and outstanding common shares through an all-share transaction. A special meeting of the Zenabis shareholders took place May 13, 2021 where the transaction was approved by way of special resolution. The acquisition was finalized on June 1, 2021 by way of a plan of arrangement.
On June 1, 2021, all of the Zenabis issued and outstanding common shares were acquired and converted to 17,579,336 HEXO shares at the prescription exchange ratio of 0.01772 entitling each former Zenabis shareholder 0.01772 of a HEXO common share in exchange for each Zenabis common share held. The estimated value of the acquired shares is $151,358.
The transaction is expected to be treated as business acquisition under IFRS 3, accounted for using the acquisition method.
At-the-Market Offering up to $150 Million
On May 11, 2021 Company established an at-the-market equity program (the “ATM Program”) that allows the Company to issue and sell up to $150,000 (or its U.S. dollar equivalent) of common shares in the capital of the Company (the “Common Shares”) from treasury to the public, from time to time, at the Company’s discretion.
The Company expects to use the net proceeds from the ATM Program for general corporate purposes, which may include: (i) costs associated with the Company’s U.S. expansion plans including the contemplated acquisition of a facility in the State of Colorado and its subsequent retrofitting and improvement; (ii) capital expenditures, including potential capital expenditures to make additional improvements to the production lines at the Company’s Belleville, Ontario facility; (iii) potential future acquisitions; (iv) working capital, including replenishing existing cash resources and working capital which will be used to fund certain transaction and integration costs
22
and minimum debt repayments related to the Company’s proposed acquisition of Zenabis; and (v) repayment of additional debts owed by Zenabis.
The Company has raised approximately $16,897 and USD$24,852 through the issuance of 2,298,901 and 4,075,025 common shares, respectively.
Definitive Arrangement to Acquire 48North Cannabis Corp. (“48North”)
On May 17 the Company entered into a definitive arrangement agreement (the “48North Arrangement Agreement”), subject to 48North’s shareholder approval, under which the Company intends to acquire, by way of a court-approved plan of arrangement under the Business Corporations Act (British Columbia), all of 48North’s issued and outstanding common shares in an all-share transaction valued at approximately $50,000 as at May 17, 2021 (the “ 48North Transaction”). Under the terms of the 48North Arrangement Agreement, 48North’s shareholders are expected to receive 0.02366 of a HEXO common share in exchange for each 48North common share held (the “48North Exchange Ratio”).
The 48North Transaction was unanimously approved by the board of directors of each of the Company and 48North (in the case of 48Norths board of directors, after receiving the unanimous recommendation of a special committee formed for purposes of the 48North Transaction). The 48North Transaction will require approval by at least 66 2/3% of the votes cast by the shareholders of 48North present at a special meeting of 48Norths shareholders at a pending future date.
The 48North Transaction also contemplates HEXO providing 48North with a $5,000 subordinated secured bridge loan with a 6-month term within 30 days following signing of the Arrangement Agreement to fund 48North’s short term working capital requirements.
The 48North Arrangement Agreement includes customary provisions, including non-solicitation provisions, subject to the right of 48North to accept a superior proposal in certain circumstances, with HEXO having a period of five business days to exercise a right to match any such superior proposal for 48North. The 48North Arrangement Agreement also provides for a termination fee of $2,000 payable by 48North to HEXO if the 48North Transaction is terminated in certain specified circumstances, as well as reciprocal expense reimbursement provisions if the 48North Transaction is terminated by either party in certain other specified circumstances.
The 48North Transaction is expected to be treated as business acquisition under IFRS 3, accounted for using the acquisition method.
Offering of USD$360m Senior Secured Convertible Notes
On May 27, 2021, the Company closed an offering of USD$360 million aggregate principal amount of senior secured convertible notes (the “Notes”) directly to an institutional purchaser and certain of its affiliates or related funds (collectively, the “Purchaser”).
The Notes were sold at a purchase price of USD $327.6 million or approximately 91.0% of their principal amount. The Notes mature on May 1, 2023. Subject to certain limitations, the Notes will be convertible into freely tradeable common shares of the Company at the option of the Purchaser and, subject to conditions and limitations, at the option of the Company. If not previously converted, all principal repayments of the Notes will be made at a price equal to 110% of the principal amount of the Notes being repaid. The Notes do not bear interest except upon the occurrence of an event of default. The Notes will be issued in registered form, without coupons, under a trust indenture dated May 27, 2021.
Upon closing of the offering, 70% of the net proceeds have been placed into escrow with a third party. The escrowed funds may be released upon the satisfaction of certain conditions related to the proposed Redecan Definitive Arrangement (below). If the release conditions are satisfied prior to December 1, 2021 the escrowed funds and the interest earned thereon will be released to HEXO and will be used for purposes of completing the Redecan acquisition.
The Company expects to use substantially all of the net proceeds from the Offering to fund the acquisition of Redecan.
Definitive Arrangement to Acquire Redecan
On May 28, 2021 the Company entered into a definitive share purchase agreement (the “Share Purchase Agreement”) to acquire all of the outstanding shares of the entities that carry on the business of Redecan, Canada’s largest privately-owned licensed producer, for a purchase price of $925 million payable in a combination of cash and through the issuance of common shares of HEXO and subject to certain customary adjustments (the “Redecan Transaction”).
Under the terms of the Share Purchase Agreement, the $925 million purchase price will be paid to the Redecan shareholders as $400 million of consideration due on closing paid in cash and $525 million of consideration due on closing paid through the issuance of HEXO common shares at an implied price per share of $7.53.
Under TSX rules, the Redecan Transaction requires a simple majority approval of HEXO’s shareholders. HEXO expects to convene a meeting of shareholders to be held in August 2021 for the purpose of submitting the Redecan Transaction to shareholders for approval. The Redecan Transaction has been unanimously approved by HEXO’s board of directors.
The Redecan Transaction is expected to be treated as business acquisition under IFRS 3, accounted for using the acquisition method.
23
Exhibit 99.2
For the three and nine months ended April 30, 2021 and 2020
Management’s Discussion & Analysis
Table of Contents
| INTRODUCTION & DISCLAIMERS |
3 | |||
| COMPANY OVERVIEW |
4 | |||
| UPDATE ON ZENABIS ACQUISITION |
4 | |||
| STRATEGIC PRIORITIES |
5 | |||
| OPERATIONAL EXCELLENCE |
6 | |||
| INNOVATION |
7 | |||
| MARKET LEADERSHIP |
7 | |||
| HOUSE OF BRANDS |
8 | |||
| TRUSS BEVERAGE CO. |
9 | |||
| HEXO GROUP OF FACILITIES |
10 | |||
| CANADIAN CANNABIS MARKET |
11 | |||
| ADULT-USE |
11 | |||
| MEDICAL |
12 | |||
| HEXO USA |
12 | |||
| COVID-19 UPDATE |
12 | |||
| CORPORATE SOCIAL & ENVIRONMENTAL RESPONSIBILITY |
13 | |||
| OTHER CORPORATE HIGHLIGHTS AND EVENTS |
13 | |||
| OPERATIONAL AND FINANCIAL HIGHLIGHTS |
19 | |||
| SUMMARY OF RESULTS |
20 | |||
| ADJUSTED EBITDA |
28 | |||
| FINANCIAL POSITION |
30 | |||
| LIQUIDITY AND CAPITAL RESOURCES |
31 | |||
| CAPITAL RESOURCES |
31 | |||
| CAPITALIZATION TABLE |
32 | |||
| OFF-BALANCE SHEET ARRANGEMENTS AND CONTRACTUAL OBLIGATIONS |
33 | |||
| PROPOSED TRANSACTIONS |
35 | |||
| FINANCIAL RISK MANAGEMENT |
36 | |||
| CRITICAL ACCOUNTING ASSUMPTIONS |
37 | |||
| RELATED PARTY TRANSACTIONS |
38 | |||
| INTERNAL CONTROLS OVER FINANCIAL REPORTING |
39 | |||
| RISK FACTORS |
42 |
2 MD&A
Management’s Discussion and Analysis of Financial Condition and Results of Operations
for the three and nine months ended April 30, 2021
All dollar amounts in this MD&A are expressed in thousands of Canadian dollars, except for share and per share amounts, and where otherwise indicated. Amounts expressed in United States dollars (“USD”) are expressed as USD$ or US$.
Introduction & Disclaimers
This management’s discussion and analysis (“MD&A”) of the financial condition and results of operations of HEXO Corp and our subsidiaries (collectively, “we” or “us” or “our” or “Company” or “HEXO”) is for the three and nine months ended April 30, 2021. HEXO is a publicly traded corporation, incorporated in Ontario, Canada. The common shares of HEXO trade under the symbol “HEXO” on both the Toronto Stock Exchange (“TSX”) and the New York Stock Exchange (“NYSE”). This MD&A is supplemental to, and should be read in conjunction with, our condensed interim consolidated financial statements for the three and nine months ended April 30, 2021 and our audited consolidated financial statements for the year ended July 31, 2020. Our consolidated financial statements are prepared in accordance with International Financial Reporting Standards (“IFRS”) as issued by the International Accounting Standards Board.
This MD&A has been prepared by reference to the MD&A disclosure requirements established under National Instrument 51-102, Continuous Disclosure Obligations, of the Canadian Securities Administrators. Additional information regarding the Company is available on our websites at hexocorp.com/investors or through the SEDAR website at sedar.com or the EDGAR website at www.sec.gov/edgar.
Certain information in this MD&A contains or incorporates comments that constitute forward-looking information within the meaning of applicable securities legislation. Forward-looking information, in general, can be identified by the use of forward-looking terminology such as “may”, “expect”, “intend”, “estimate”, “anticipate”, “believe”, “should”, “plans”, “continue”, “objective”, or similar expressions suggesting future outcomes or events. They include, but are not limited to, statements with respect to expectations, projections or other characterizations of future events or circumstances; our objectives, goals, strategies, beliefs, intentions, plans, estimates, projections and outlook, including statements relating to our plans and objectives; estimates or predictions of actions of customers, suppliers, competitors or regulatory authorities; and statements regarding our future economic performance, as well as statements with respect to:
| • | the competitive and business strategies of the Company; |
| • | the intention to grow the business, operations and potential activities of the Company, including entering into joint ventures and partnerships and leveraging the brands of third parties through joint ventures and partnerships; |
| • | the ongoing expansion of the Company’s facilities, its costs and receipt of approval from Health Canada to complete such expansion and increase production and sale capacity; |
| • | the expansion of business activities, including current and potential acquisitions;; |
| • | the Company’s acquisition of Zenabis Global Inc. and the future impact thereof; |
| • | the Company’s proposed acquisition of 48North Cannabis Corp. and the future impact thereof; |
| • | the Company’s proposed acquisition of Redecan. and the future impact thereof; |
| • | the expected sales mix of offered products; |
| • | the development and authorization of new products, including cannabis edibles, beverages and extract products (“cannabis derivatives”), and the timing of launch of such new products; |
| • | the competitive conditions of the industry, including the Company’s ability to maintain or grow its market share; |
| • | the Company’s Truss and Truss CBD USA business ventures with Molson Coors and the future impact thereof; |
| • | the Company’s Keystone Isolation Technologies business venture and the future impact thereof; |
| • | the expansion of the Company’s business, operations and potential activities outside of the Canadian market, including but not limited to the U.S., Europe and other international jurisdictions; |
| • | whether the Company will have sufficient working capital and its ability to raise additional financing required in order to develop its business and continue operations; |
| • | the applicable laws, regulations and any amendments thereof; |
| • | the grant, renewal and impact of any licence or supplemental licence to conduct activities with cannabis or any amendments thereof; |
| • | the filing of trademark and patent applications and the successful registration of same; |
| • | the anticipated future gross margins of the Company’s operations; |
| • | the performance of the Company’s business and operations; |
| • | securities class action and other litigation to which the Company is subject; and |
| • | the impact of the COVID-19 coronavirus pandemic on the operations of the Company. |
Such statements are not historical facts but instead represent management beliefs regarding future events, many of which, by their nature, are inherently uncertain and beyond management control. We have based these forward-looking statements on our current expectations about future events and certain assumptions including, but not limited to:
| • | the Company’s ability to implement its growth strategies; |
| • | the Company’s ability to complete the conversion, improvements or buildout of its owned and leased facilities on time and on budget; |
| • | the Company’s competitive advantages; |
| • | the development of new products and product formats for the Company’s products; |
| • | the Company’s ability to obtain and maintain financing on acceptable terms; |
| • | the impact of competition; |
| • | the changes and trends in the cannabis industry; |
| • | changes in laws, rules and regulations; |
| • | the Company’s ability to maintain and renew required licences; |
| • | the Company’s ability to maintain good business relationships with its customers, distributors and other strategic partners; |
| • | the Company’s ability to keep pace with changing consumer preferences; |
3 MD&A
| • | the Company’s ability to protect intellectual property; |
| • | the Company’s ability to manage and integrate acquisitions; |
| • | the Company’s ability to retain key personnel; and |
| • | the absence of material adverse changes in the industry or global economy, including as a result of the COVID-19 pandemic. |
Although any forward-looking statements contained in this MD&A are based on what we believe are reasonable assumptions, these assumptions are subject to a number of risks beyond our control, and there can be no assurance that actual results will be consistent with these forward-looking statements. Factors that could cause actual results to differ materially from those set forth in the forward-looking statements and information include, but are not limited to, financial risks; industry competition; general economic conditions and global events; product development, facility and technological risks; changes to government laws, regulations or policies, including tax; agricultural risks; supply risks; product risks; dependence on senior management; sufficiency of insurance; and other risks and factors described from time to time in the documents filed by us with securities regulators. For more information on the risk factors that could cause our actual results to differ from current expectations, see “Risk Factors”. All forward-looking information is provided as of the date of this MD&A. We do not undertake to update any such forward-looking information whether as a result of new information, future events or otherwise, except as required by law.
We do not, and do not intend to, engage in direct or indirect business with any business that derives revenue, directly or indirectly, from the sale of cannabis, cannabis products in any jurisdiction where the sale of cannabis is unlawful under applicable laws. HEXO does not currently engage in any unlawful U.S. marijuana-related activities as defined in Canadian Securities Administrators Staff Notice 51-352 (Revised) - Issuers with U.S. Marijuana-Related Activities and will only do so in the future to the extent fully legal under all applicable U.S. federal or state laws.
On December 17, 2020, the Company completed a consolidation of all of its issued and outstanding common shares on the basis of four (4) old common shares for one (1) new common share. As a result of the share consolidation, the Company’s issued and outstanding common shares were reduced from 488,650,748 to approximately 122,162,687 (disregarding the treatment of any resulting fractional shares). In addition, the exercise or conversion price and the number of common shares issuable under the Company’s outstanding common share purchase warrants, convertible debentures, stock options and other securities exercisable for or convertible into common shares were proportionately adjusted to reflect the share consolidation in accordance with the respective terms thereof. All share and per share data presented in the Company’s consolidated financial statements and this MD&A have been retroactively adjusted to reflect the share consolidation unless otherwise noted.
This MD&A is dated June 14, 2021.
Company Overview
HEXO is an award winning, top consumer-packaged goods (“CPG”) cannabis company currently operating out of Quebec and Ontario, Canada. We are licensed to cultivate, process, market, research and develop and sell adult-use and medical cannabis, cannabis-derived extracts and derivative products in Canada under the provisions of the Cannabis Act and globally where applicable international and Canadian regulations permit. Our goal is to become a global cannabis industry leader with one of the highest market shares in Canada through a combination of organic growth and growth through acquisition. On June 1, 2021 we completed the acquisition of Zenabis Global Inc. (“Zenabis”) and we are in the process of acquiring two more established Canadian licensed producers, 48North Cannabis Corp. (“48North”) a public company listed on the TSX Venture Exchange and Redecan, a top performing licensed producer and Canada’s largest private licensed producer. We are focused on delivering a complete range of experiences for any occasion to our consumers who count on us for safe and reputable, high-quality cannabis products. We have taken HEXO international with our medical cannabis product offerings in Israel and CBD Powered by HEXO® products in the state of Colorado, USA. We have established a history of award-winning and innovative products driven by our deeply rooted passion for developing, manufacturing and bringing to market a diversified portfolio to our valued adult-use consumers and medical patients.
Our common shares are listed on the TSX in Canada and the NYSE in the U.S. under the symbol HEXO.
Update on Zenabis Acquisition
Zenabis is a significant Canadian-licensed cultivator of medical and recreational cannabis which employs staff coast-to-coast, across facilities in Atholville, New Brunswick; Langley, British Columbia; and Stellarton, Nova Scotia. Zenabis currently has 111,200 kg of licensed cannabis cultivation space across three licensed facilities in Canada, together with its cannabis import, export and processing joint venture, ZenPharm, operating from Birżebbuġa, Malta. The Company acquired all of the issued and outstanding shares of Zenabis, which was previously listed on the TSX, on June 1, 2021 by way of plan of arrangement. As of the date of this report, management’s evaluation of the Zenabis operations and their integration is still in process. The directional strategy for each site and brand is being carefully assessed in order to maximize the proforma value of the combined entity.
4 MD&A
Strategic Priorities
Our strategy is to have strong standards of operational excellence, execute at scale, grow low-cost high-quality cannabis, build targeted brands for all types of cannabis consumer segments and partner with existing fortune 500 CPG companies to introduce Powered by HEXO® products across their existing manufacturing and distribution infrastructure. We are focused on building long-term sustainable shareholder value, which we believe requires consistent and profitable sales growth, careful management of selling, general and administrative expenses and maintaining a relatively low depreciable asset base.
HEXO believes in a few years a handful of companies will control a significant portion of the global market share, and that we are positioning ourselves to be one of these companies1. The consolidation of competition has already begun and HEXO is becoming an industry leader through the acquisition of Zenabis and the announced intended acquisitions of Redecan and 48North. Through the acquisition and integration of these entities and their top performing brands, HEXO expects to increase its market share while also cross leveraging the top operations of each entity to drive synergistic value.
In Canada, our goal is to hold a top market share position for adult use cannabis through developing and introducing high-quality, innovative products and brands that resonate with specific consumer segments. We believe distribution of our products is imperative to achieve this goal. To this end, we have to maintain a strong presence in Quebec, where we currently hold number one market share and have a five-year contract as a preferred supplier with Quebec’s Société québécoise du cannabis (“SQDC”), while simultaneously accessing the growth potential of other major Canadian markets outside of Quebec, such as Ontario, Alberta and BC. HEXO covers virtually 99.6% of the Canadian population through our governmental and private retail distribution agreements across all ten Canadian provinces. Throughout the full fiscal year of 2020, only 27% of HEXO’s net revenue for adult use cannabis (excluding beverage) came from outside of Quebec. These same sales during fiscal 2021, year to date have increased to 43% and have grown to 49% in both the second and third quarters of fiscal 2021. In addition to distribution, we believe being a number one market share leader requires competing directly against the illicit market. The Canadian black market for cannabis continues to account for approximately half of the total market2. HEXO was among the first to disrupt the illicit market through the creation of Original Stash and its value formats.
Trending towards a top two position in Canada, we are creating a gateway to U.S. and the world. Internationally, our growth strategy first starts in the United States. We believe partnering with large, established, global CPG companies, who wish to enter the cannabinoid industry as a means of brand proliferation, will provide the greatest long-term value to our shareholders. Developing and bringing new products to market under major recognizable brands and Powered by HEXO® whilst using their development teams, manufacturing capabilities, distribution channels and retail relationships, we believe, will be the winning formula. We’ve already achieved the number one market share position in Canada for cannabis beverages3 with our initial partner, Molson Coors, through our joint venture Truss Beverage Co.
We have adjusted our partnering model towards a more traditional royalty-based concept, allowing future CPG partners access to our cannabis food ingredients, Powered by HEXO. We’ve also entered the U.S. through our CBD beverage manufacturing and distribution in Colorado, leveraging Molson Coors infrastructure in the U.S. We look forward to the U.S. legal landscape evolving to permit national distribution, where we expect our advanced knowledge of the technology of cannabis, paired with the strength of consumer insights and distribution networks of our present and future anticipated partners will create significant operating leverage.
| 1 | Based on: (i) analyst commentary on the development of the cannabis industry in Canaccord Genuity Corp.’s report entitled “Cannabis Monthly, February 2019”, dated February 20, 2019; (ii) the example of how the alcohol industry developed and consolidated post-prohibition, general commentary and analysis about the adult-use cannabis industry to the effect that, as a similar regulated industry, it can be expected to develop and consolidate in a similar fashion, and evidence that this is currently the trend in the industry; (iii) the Company’s review of existing and developing cannabis sales by other licensed producers since the legalization of the adult-use cannabis market; (iv) the Company’s current position in the adult-use market and its belief as to its competitive advantages arising from: (A) being a market leader in Quebec, its expansion into other select markets in Canada particularly Ontario, and increasing market share of sales in those markets; (B) offering a selection of products at a variety of price points; (C) maintaining a competitive cost structure; and (D) its joint venture with Molson Coors. |
| 2 | Source: StatsCan via BNN Bloomberg’s article: “StatsCan: Legal pot spending beat black market for first time in Q2.” |
| 3 | Derived from internal review of third-party competition data for the periods of February 1, 2021 to April 30, 2021 for Ontario, Alberta and BC and March 2021 to June 2021 for Quebec. |
5 MD&A
STRATEGIC PILLARS

Our strategy is built on three pillars: operational excellence, innovation and market leadership. In striving to achieve operational excellence our immediate focus remains on effective demand planning and production. We are continuously looking to implement more effective techniques to streamline operations, align production with market demand, lower production costs, drive meaningful improvements in yields and improve inventory velocity; all as a part of the Company’s focus on profitability. The innovation department is consistently working towards developing modern, cutting edge cannabis products for the Canadian cannabis derivatives market. We plan to invest in even better, science-backed cannabis experiences and platform technology, as we continue to develop advanced ingredients for food formulations for use with our partners. To expand our market leadership, we will continue to strengthen distribution in all major markets across the country with our brands, HEXO, UP Cannabis, HEXO Plus, Bake Sale and Original Stash to drive market share and a top position in Canada, all the while maintaining our dominant position in the Province of Quebec.
Operational Excellence
We have been cultivating cannabis since 2014 under the Cannabis Act of 2018 regulatory regime and its predecessor (“Cannabis Regulations”), growing and producing high-quality cannabis. Maximizing our cultivating practices efficiency and technology to further drive improved yields and decrease costs is of critical importance.
We chose to initially locate in Gatineau, Quebec, because we believe the province offers the ideal conditions for cannabis production: an abundant supply of renewable electricity at competitive rates, combined with abundant water resources and the availability of skilled people. These conditions allow us to continue to focus on ensuring that we maintain our low-cost production and move towards achieving profitability in the Canadian market.
On the border of Canada’s two largest consumer markets, Quebec and Ontario, our main campus in Gatineau positions us in close proximity to three of the country’s major urban areas, Montreal, Ottawa and Toronto. We have accumulated a strong and skillful workforce, as well as a top management group which provides cannabis-specific industry expertise and other relevant business knowledge derived from a variety of industries and markets.
HEXO has developed a post cultivation manufacturing centre of excellence in Belleville, Ontario to complement the Gatineau facility. The Belleville location serves our two largest markets with optimum warehousing and distribution lead times and costs. The site has been engineered to provide significant expansion for cannabis post cultivation technologies and partnerships. Today, HEXO is investing in advanced manufacturing technologies and practices to rival well developed consumer goods manufacturing capabilities. Coupled with technology, HEXO is investing in people and supply chain enablers that will deliver fresh product to the market on a continuous basis.
6 MD&A
Innovation
Empowering the world to have safe and pleasurable cannabis experiences powered by HEXO technology.
Our focus on product development through research, innovation, and technology are reflective of our strategic priorities. HEXO’s product development team draws on extensive CPG experience in creating innovation that drives consumer value. At the core of our innovation are the platform technologies that when partnered with cannabinoids provide the solution base for infusion. These platforms enable distinct product differentiators for the next generation of cannabis products. Leveraging our experience in creating award winning products we continue to invest in platform technologies that will bring a new level of experience to both the new and traditional cannabis consumer. As a result of these developments HEXO possesses one of the industry’s top IP portfolios.4
During the period, HEXO launched a first of its kind brand Bake Sale, which currently offers all-purpose, cannabis flower ideally suited for cooking and baking home cannabis goods. Along with Bake Sales, HEXO’s current 2.0 derivative products consist of Original Stash hash, KLIK5, softgels, vapes and the beverage products as disclosed in section “Truss Beverage Co.” Original Stash’s hash products represent a first of its kind portfolio of dry sift hash. KLIK distillate formulations are also a first for the Canadian market providing an enhanced experience for the cannabis consumer.
These products along with others in our portfolio are targeted at several segments of the market from net new consumers to experienced traditional black-market consumers who may otherwise purchase cannabis from unlicensed dispensaries and black-market participants. Another example of this is the Original Stash dried flower 28g value format, which was one of Canada’s first bulk product offerings intended to directly combat the illicit market. Our proven innovation capability partnered with quality cannabis that the adult-use market has come to expect, allows HEXO to offer safe, regulated products that continue to help disrupt the illicit market and allow the legalized cannabis market to gain market share.
Keystone Isolation Technologies Inc.
We have established the joint venture Keystone Isolation Technologies Inc. (“KIT”) of which HEXO holds a 60% interest. The extraction, refining and isolation technologies involved in this venture will enable HEXO to bring quality extracts to our potential partners. Through KIT we believe we will be able to provide scalable capacity, potency and purity for distillates and isolates. This top tier technology will enable our extraction, refining and isolation capabilities for cannabinoids found in both cannabis and hemp. The end result will be a consistent supply of CBD and THC for the Canadian and global market. We plan to leverage this technology through KIT’s sister entity in the U.S. (see section “HEXO USA”).
Innovation and Trim Management
Cannabis trim is a product of the harvesting process. When the flower is harvested, additional leaf and other extraneous plant matter are removed as well and comprise what is referred to as trim. As trim is a by-product to flower, the total volume of trim, by its nature, is subject to overall cultivation volumes of the Company and therefore, from harvest to harvest may increase relative to total harvested volumes. Towards the end of fiscal 2020 a trim management initiative was established to increase the Company’s trim utilization systematically reducing the balance of this inventory on hand. This inventory is being used as the primary ingredient in the manufacturing of our Original Stash hash and pre-rolls products. Historically, the buildup of trim in inventory led to increased cost of sales, impairment losses and decreased gross margin due to limited value add options for trim usage. This effort aims to tactically reduce our trim inventory and to normalize these metrics. Going forward, trim is expected to be utilized in extraction as well as within select cannabis 2.0 products. The main catalyst for this initiative is getting KIT operational which is expected within the current calendar year.
Market Leadership
From the onset of legalization, we have sought to be a leader in shaping the future of the cannabis industry in Canada. We believe that in these first formative years brand recognition power, country-wide distribution and financial strength are the pillars on which a top market position is built. The regulatory environment for the sale of adult-use cannabis across Canada, the number of large-scale licensed producers and the continuously evolving Canadian cannabis industry’s supply and demand conditions, amongst other factors, makes it clear that market penetration, market share capture and brand awareness are essential during this time. For this and other reasons we have deliberately set out to build a strong position in our initial jurisdiction, Quebec, where we maintain the number one adult-use market share6 while expanding to all ten provinces of Canada through provincial supply agreements and arrangements. In the current period, we have doubled our derived gross sales composition outside of Quebec to 49% from 24% in the same period of the prior fiscal year. We actively continue to diversify and increase our reach outside of Quebec in order to generate organic Canadian growth and increase market share. We believe by offering a diverse house of brands that resonate with consumers across market segments, representing innovation, quality and consistency of experience, we will obtain a leading Canadian market share.
| 4 | Based upon a third-party report which compares the Company’s published patent applications relative to its peers in the Canadian Cannabis market using the recently available public data. |
| 5 | KLIK is a high-quality distillate which includes purified THC and CBD and plant derived terpenes and comes in a convenient, easy-to-use applicator for mess-free, metered dosing. OS. KLIK distillate can be vaporized or inhaled. |
| 6 | Based upon sales volumes obtained from the SQDC for the period of March 2021 to June 2021. |
7 MD&A
House of Brands
HEXO is an award-winning cannabis brand that has earned a reputation for innovative products, consumer health and safety and premier customer service. All HEXO cannabis products are cultivated and processed in state-of-the-art facilities using natural biological controls.
8 MD&A
Truss Beverage Co.
We sought from the early onset of legalized adult-use cannabis in Canada to position ourselves to meet the cannabis beverage market head on. This was accomplished through the formation of Truss Limited Partnership, now Truss Beverage Co. (“Truss” or “Truss Beverage Co.”), our Canadian business venture with Molson Coors Canada (“Molson Canada”). Currently, offering one of the widest portfolios of cannabis infused beverages and extract products in the Canadian market, these “Powered by HEXO®” beverages have been made available across all Canadian provinces.
The average consumer’s appetite for smoke free alternatives to cannabis consumption7 continues to shift and solidify through the introduction of Cannabis 2.0 products into Canada. HEXO believes that through Truss beverages, a range of experiences from high CBD found in Veryvell sparkling flavored water to the latest offering XMG, which offers 10mg of THC per beverage well positions the Company to meet this demand through a well-balanced, broad suite of beverage offerings.
The total Canadian cannabis beverage category outpaced the growth of the total cannabis sector by 4%8. Although having only entered the Canadian market at the beginning of this fiscal year, Truss products have already had early success, most notably holding the top cannabis beverage market positions in the three largest Canadian markets Quebec9, Ontario10 and Alberta11. The captured market shares were 60%, 38% and 44%, respectively. Truss products also hold two of the top five beverage brand positions in Canada, including the number one position held by XMG12.
Truss is committed to developing and producing a range of cannabis beverages that focus on great taste, consistency and choice for consumers. The CBD and THC products within the portfolio have been developed with consumer input at every stage of development. The current portfolio consists of the following five brands:
Little Victory: Vibrant, naturally flavoured sparkling beverages to toast to any of life’s little victories.
House of Terpenes: A range of terpene-forward sparkling tonics that celebrate the flavours of cannabis.
Mollo: Crisp with an easy drinking taste.
Veryvell: A complete line-up of products to support your self-care journey.
XMG: A range of high intensity flavoured beverages.
The Truss beverages are produced and distributed from HEXO’s Belleville facility. Currently, the beverage related operations are conducted by HEXO (through the operations of HEXO Cannabis Infused Beverages or “HEXO CIB”) under HEXO’s licensing, until Truss obtains its own separate license (see section ‘HEXO CIB—Cannabis Infused Beverages’). We expect Truss to acquire the appropriate selling license from Health Canada during calendar year 202113, at which point sales and operations will transfer to Truss. Truss submitted their independent application to Health Canada on October 26, 2020.
The Company and Molson Coors Beverage Company have created a second Truss business venture, Truss CBD USA LLC, to explore opportunities for non-alcoholic, hemp-derived CBD beverages in the State of Colorado, USA. See the section “HEXO USA”.
| 7 | Per Deloitte’s “Seeding New Opportunities – Listening to Canada’s Cannabis Consumer” 2021 report. |
| 8 | Per Source: HiFyre Total Canada Recreational Sales from February 1, 2021 to April 30, 2021 compared to November 1, 2020 to January 31, 2021. |
| 9 | Per SQDC derived metrics based on volumes sold during the period of March 2021 to June 2021. |
| 10 | Per internal review of OCS competitive sales data for the period of February 1, 2021 to April 30, 2021. |
| 11 | Internal review of accumulated private retail data for the period of February 1, 2021 to April 30, 2021. |
| 12 | Per Headset data for first calendar quarter of 2021. |
| 13 | Due to the experienced delay in obtaining the Belleville facility’s sales license, in part, due to Health Canada and the COVID-19 pandemic related delays, the expected timing for Truss acquiring their independent license has been delayed. The Company expects to receive licensing within the 2021 calendar year. The assumption of acquiring this licensing is derived through the Company’s internal expertise and historical experience in obtaining licensing from Health Canada. |
9 MD&A
HEXO GROUP OF FACILITIES
The following provides information about HEXO’s facilities as at April 30, 2021 unless otherwise noted. The table does not reflect those facilities acquired through the Zenabis acquisition:
| Gatineau, Quebec | HEXO’s Gatineau, Quebec facility is its main cultivation facility, featuring 1,292,000 sq. ft. of greenhouse cultivation space on a 143-acre campus. The greenhouse space is comprised of a 7,000 sq. ft. greenhouse, a 35,000 sq. ft. greenhouse completed in 2016, a 250,000 sq. ft. greenhouse completed in June 2018 and a 1 million sq. ft. greenhouse completed in December 2018, known as Building 9 or B9. Except as noted below, the facility is licensed by Health Canada (Standard Cultivation, Standard Processing, Sale for Medical Purposes, (current license was amended effective April 7, 2020 and expires April 7, 2023), and Research (the previous license obtained October 25, 2019 was amended to include the Belleville and Vaughn facilities, with the result that the current license is effective August 27, 2020 and expires October 25, 2024)) and fully operational.
On January 17, 2021, the final phase of B9 received licensing, however, the space was not operational as at April 30, 2021. This zone is expected to become operational by the end of fiscal 2021.
As at April 30, 2021 the Gatineau facility is operational and directly and/or indirectly generates sales for the Company, with the exception of the final phase of B9 as stated above. The approved remaining budget is approximately $1,695 to be realized over the remaining course of fiscal 2021. The Company notes that a current incremental capital budget is under review and once approved may impact the remaining stated budget and/or the estimated timeline for completion. | |
| Brantford, Ontario (R&D) | HEXO’s Brantford, Ontario facility is currently serving as a strain development site (with additional cultivation capability) facility, featuring 14,000 sq. ft. of indoor growing space on 1 acre of land. The facility was designed and engineered to permit pharmaceutical-quality management standards utilized by Canada’s pharmaceutical manufacturers to be used in the production of cannabis in all acceptable forms. The facility is fully licensed by Health Canada (Standard Cultivation, Standard Processing and Sale for Medical Purposes (current licence effective December 6, 2019 and expiring December 6, 2022)). | |
| Belleville, Ontario (HEXO and Truss) |
HEXO’s Belleville, Ontario facility is its centralized processing, manufacturing and distribution centre, featuring 932,190 sq. ft. of leased commercial space within a larger approximately 1.5 million sq. ft. industrial facility, with rights of first offer and first refusal to lease the remaining space in the facility. The facility acts as the Company’s main production facility for processing, extraction and packaging, and the manufacturing of cannabis derivative products. Truss Beverage Co, the Company’s venture with Molson Canada, is planned to operate at this facility once it obtains a separate license from Health Canada and it currently effectively operates under HEXO’s license through HEXO CIB. The Company has subleased 183,600 sq. ft. to Truss, which Truss has then subleased back to HEXO CIB pending Truss’ licensing. The facility is owned by Belleville Complex Inc., 25% of which is owned by the Company and the balance of which is owned by Olegna Holdings Inc. a company affiliated with a director of the Company, Vincent Chiara.
The Belleville facility is licensed by Health Canada for Standard Processing and Sale for Medical Purposes (current licence effective October 21, 2020 and expiring October 21, 2023) as well as for Cannabis Research (effective August 27, 2020 and expires October 25, 2024). HEXO received an amendment to the licence to authorize non-medical sale of additional cannabis product types, including derivative products on May 29, 2020. Accordingly, the facility is now operational manufacturing and selling activity. | |
| Belleville, Ontario (KIT) |
KIT is expected to operate out of a separate area within the Belleville facility and provide the Company with high quality extraction technology to facilitate production transformation for certain of the Company’s cannabis derivative products. KIT will effectively operate under the Company’s license as described in section ‘Belleville, Ontario (HEXO)’. Previously Management anticipated KIT to be operational by the end of this current fiscal year, however, due to delays in construction zoning, in part due to COVID-19, management now expects to have KIT operational before the end of the calendar year 2021.
KIT remains non-operational as at April 30, 2021.
As at April 30, 2021 the capital budget for KIT remains in draft and is approximately $14,100 of incremental spend to prepare the site and take KIT operational. To date the Company has injected USD$3.1 million for the initial acquisition of its 60% stake in the entity as well as $993 of site preparation costs. As previously disclosed, the budget remains in its early stages of formulation and continues to be subject to material change. | |
| Montreal, Quebec (SQDC distribution) |
HEXO’s Montreal Quebec distribution facility is a warehouse and distribution centre, featuring 58,000 sq. ft. of leased commercial space. The facility serves as a warehouse and distribution centre for Quebec adult-use webstore orders for the SQDC, which are managed for the SQDC by HEXO and Metro Supply Chain Group Inc. It houses product from all the licensed producers who have contracts with the SQDC and serves as the sole distribution point for all direct-to-consumer shipments within the Province of Quebec for orders placed through the | |
10 MD&A
| SQDC online webstore. This facility is fully operational and is regulated by the SQDC and does not require licensing by Health Canada. | ||
| Vaughan, Ontario | HEXO’s Vaughan, Ontario facility is its planned cannabis research laboratory for the development of edible products and related intellectual property, featuring 14,200 sq. ft. of leased commercial space. The facility includes a sensory testing area and a complete commercial kitchen. The facility received its Cannabis Research license on August 27, 2020 which is effective until October 25, 2024. | |
| Ottawa, Ontario (Corporate headquarters) |
HEXO leases approximately 40,036 sq. ft. of office space in Ottawa, Ontario for its corporate head office. | |
| Fort Collins, CO, USA | HEXO is currently in the process of acquiring an approximate 50,000 sq.ft. facility in the state of Colorado and will provide US CPGs and consumers access to the Powered by HEXO® technology (see section “HEXO’s First US Production Facility.”) | |
Canadian Cannabis Market
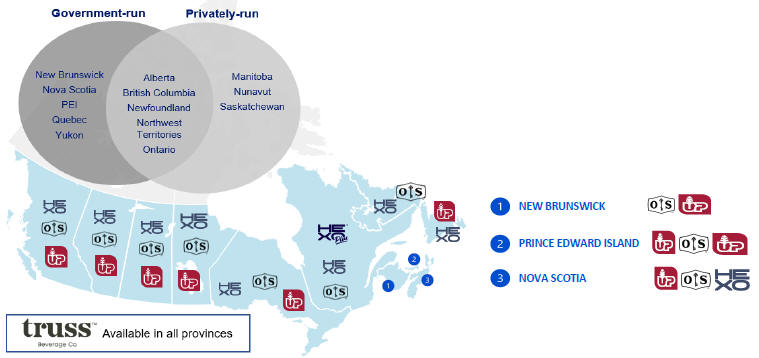
ADULT-USE
The Canadian adult-use cannabis industry was legalized on October 17, 2018. All provinces and territories established their respective cannabis market retail approach, ranging from private entities to government-owned retail, as well as a combined approach in several jurisdictions. The Company holds supply agreements and arrangements within all ten provinces of Canada, including preferred supplier status with the SQDC14, covering approximately 99.6% of the nation allowing for market access within the major population centres of Canada. The Company’s availability of products may change within certain provinces from time to time, based upon the Company’s current demands, inventories and strategic focus.
Market trends and consumer tastes and preferences continue to be shaped in these early innings of the Canadian legalized cannabis industry, specifically regarding brand loyalty and product formats. Data shows that returning customers continue to represent the largest growth opportunity representing 75% of Canada’s cannabis volume consumption as compared to new, previously non-consumers of cannabis. Additionally, of existing consumers, only approximately 54% is purchased legally.15 Therefore, there still remains a largely untapped market of future consumers who desire non-combustible formats and mostly under health and wellness premises. A sizable population of existing illicit market consumers also remains to claimed for additional market share. Through HEXO broad suite of experiences, occasions and format we aim to maximize our captured market shares in these areas and continue towards a top position.
| 14 | As previously disclosed, HEXO does not expect to reach the initially anticipated tonnage of product in the first three years of the supply contract with the SQDC beginning in October 2018. |
| 15 | Per Deloitte’s “Seeding New Opportunities – Listening to Canada’s Cannabis Consumer” 2021 report. |
11 MD&A
MEDICAL
Since our inception as a medical cannabis company in 2013 we have prided ourselves on our dedication to serving the medical market and its patients. Our focus is on product innovation, advanced natural growing techniques, and client health and safety. We offer our medical clients exceptional, bilingual customer service. We are proudly committed to serving our medical patients by offering select products from our full portfolio to expand our medical offerings and provide a broad range of options to our valued clients.
With the recent acquisition of Zenabis and with the additional two announced acquisitions of 48North and Redecan underway, management is currently developing an integration plan in order to maximize the robustness of the combined medical portfolio of the future HEXO group.
HEXO USA
The Company’s wholly owned U.S. based entity HEXO USA Inc (“HEXO USA”) was established to facilitate expansion into the U.S. hemp market. We believe that strategic partners will be able to benefit from HEXO’s innovative product development, advanced research and development, intellectual property portfolio (pending patent approvals), low production cost, licensed infrastructure and regulatory know-how. These same strategic partnerships will provide the Company with established global distribution platforms and product expertise.
During the period, the Company established the sister entity of KIT in the U.S. (“KIT USA”) which will allow for in state, HEXO controlled cannabis extraction activity to support the manufacturing of CBD beverages and future products in the U.S. We have recently appointed a general manager for HEXO’s U.S operations whose role currently includes standing up and commissioning production facilities, overseeing operations, supply chain and logistics, and building the team. The Company has recently announced the intention to acquire a 50,000 sq. ft. facility in Colorado to use for its U.S. expansion plans, and that would be used by KIT USA in particular. As of the date of this MD&A the Company is in the inspection period for acquiring the facility.
The Company is aiming to enter select U.S. states and to offer its “Powered by HEXO®” products via KIT USA and our future partners, to the U.S. CBD markets, to the extent that such activities fully comply with applicable U.S. federal and state laws, including U.S. Food and Drug Administration requirements. Our first entry was made in April 2020, through the creation of our Truss CBD USA venture in the State of Colorado with partner Molson Coors.
Truss CBD USA Joint Business Venture
The Company and Molson Coors Beverage Company (“Molson Coors”) have created a second business venture, Truss CBD USA LLC (“Truss CBD USA”). The venture was conceived to explore opportunities for non-alcoholic, hemp-derived CBD beverages in the State of Colorado. Established in Colorado, Truss CBD USA is majority owned by Molson Coors and operates as a stand-alone entity with its own board of directors, management team, resources and go-to-market strategy. All production and distribution for Truss CBD USA will be kept within Colorado state lines since it is one of a few states that has an established regulatory framework for hemp-derived CBD in food and beverages.
During the current fiscal year, Truss CBD USA was rolled out across select grocery markets within Colorado. The operations of Truss CBD USA continue to be non-material, however management continues to roll out the Truss beverages to additional stores. Truss CBD USA and HEXO’s activities in relation to it will be conducted in accordance with all applicable laws. The Company does not currently have and is not in the process of developing marijuana-related activities in U.S., even in U.S. states where such activity has been authorized within a state regulatory framework. As such, the Company is not and would not be considered in the future a “U.S. Marijuana Issuer” within the meaning set forth in CSA Staff Notice 51-352 (Revised) Issuers with U.S. Marijuana-Related Activities.
COVID-19 Update
During the three and nine months ended April 30, 2021, certain Canadian provinces, most notably Ontario, Quebec and Alberta, re-enacted increased province wide restrictions and protocols as a response to the rapid increase in COVID 19 cases, hospitalizations and new variants/mutations of the virus. Towards the end of the Company’s fiscal third quarter the provinces of Ontario, Quebec and Alberta implemented new lockdowns and restrictions in attempts to minimize the impact of COVID-19 deemed “third wave” in Canada which includes highly transmittable variants of the COVID-19 virus. These restrictions included the limitation on retail cannabis to curbside delivery only options.
The current impact of COVID-19 and the various provincial restrictions cannot be accurately quantified and may have materially impacted the Company’s earnings. Due to the speed with which the COVID-19 situation is developing and the uncertainty of its magnitude, outcome and duration, it is not possible to estimate the future impact on our business, operations or financial results; however, the impact could be material. Refer to the section “Risk Factors” section for further COVID-19 related risks to the business.
As of the date of this MD&A, the cannabis industry continues to be deemed an essential service to Canadians.
People
In response to the pandemic, we established a COVID-19 response team which is tasked to manage the Company’s information flow of COVID-19 updates, review public health and safety protocols as outlined by the appropriate governmental authorities and develop in house action plans to mitigate these risks and comply accordingly. We continue to utilize a work from home strategy, for all functions which can do so. For those functions which require to remain ‘on site’ from day one we increased our focus on social distancing,
12 MD&A
additional personal sanitation stations and through full personal safety equipment such as gloves and masks, as well as additional hand sanitizing stations throughout our manufacturing and administrative facilities. We have implemented travel restrictions for work related travel where deemed unnecessary and restricted visitor access to our facilities. We implemented mandatory 14-day quarantines for all workers returning from vacations or out of country visits during the onset of the pandemic. We initiated a program ‘Hero Pay’ to support our cultivation and manufacturing employees who continue to work during the pandemic.
Operations
We performed a full review of all Health & Safety Standard Operating Procedures with specific focus on personal protective equipment as a result of the COVID-19 outbreak. We implemented protocols back in March 2020 that exceeded government health authorities’ recommendations, which remain in effect. HEXO’s operations have been minimally impacted by COVID-19 related issues. We currently do not foresee any impact to supply to the market and therefore, continue our cultivation, manufacturing and producing activities.
Distribution
Applicable provincial bodies have deemed cannabis retail as an essential service. As such our provincial distribution remains relatively unimpeded. It remains uncertain as to whether COVID-19 has or will ultimately increase or diminish demand and sales of cannabis across Canada, however, we continue to work with provincial and private entities towards the goal of penetrating deeper into all markets and allow for the public to safely and reliably consume our products.
Supply Chain
On a day-to-day basis, we continually monitor the economic response to COVID-19 and work together with our valued supply chain partners in order to mitigate various potential disruptions to our operations. To date, there have been no indicators of material issues to our supply chain.
Liquidity
At the date of this MD&A management believes that we possess sufficient resources and capital to meet any continuing COVID-19 health requirements in order to remain operationally compliant with the healthy authorities mandated regulations.
Corporate Social & Environmental Responsibility
At HEXO, our goal is to be one of Canada’s leading cannabis producers and processors. We know that if we want to achieve our goal, we need to think about more than just our products and prices. We must also examine the way our operations impact the natural and social environment on a local, provincial and national level. HEXO is monitoring and reporting on its greenhouse gas emissions, setting targets to reduce them, and offsetting its footprint. We will also be reporting on other Environment, Social and Governance (ESG) impact areas based on Global Reporting Initiatives (GRI) standards. Our Corporate Social Responsibility Charter focuses on four priorities: People, Public, Products and Planet.
HEXO recently entered into a partnership with The Offsetters to support the Great Bear Forest Carbon Project to offset the Company’s entire carbon emissions to become carbon neutral by September 2021. The Company has also entered into a partnership with Plastic Bank through Dymapak Canada in a commitment to offset the full plastic amount used in pouch packaging, having already offset the amount of plastic used during the first half of the year.
As one of Canada’s leading cannabis producers and processors, HEXO has pledged to re-examine the way its operations impact the natural and social environment on a local, provincial and global level. In addition to offsetting its own carbon footprint, the Company has pledged to also offset the average personal emissions of its employees.
Other Corporate Highlights and Events
THIRD QUARTER OF FISCAL 2021
Announcement and Subsequent Closing of Zenabis Global Inc. Acquisition
On February 16, 2021, the Company entered into a definitive arrangement agreement (the “Zenabis Arrangement Agreement”) with Zenabis Global Inc. (“Zenabis”) to acquire all of Zenabis’ issued and outstanding common shares in an all-share transaction valued at approximately $235 million (the “Zenabis Acquisition”) at the announcement date.
The Zenabis Transaction was unanimously approved by the board of directors of each the Company and Zenabis’ (in the case of Zenabis’ board of directors, after receiving the unanimous recommendation of a special committee formed for purposes of the Transaction and independent financial and legal advice), board of directors has unanimously recommended that its shareholders vote in favour of the Transaction.
On May 13, 2021, a special meeting of the Zenabis shareholders took place, where the Zenabis Transaction was approved by way of special resolution.
On June 1, 2021, by way of way of plan of arrangement the Company finalized the acquisition of Zenabis. The Company acquired all of Zenabis’ 992,061,851 issued and outstanding common shares at the prescribed conversion ratio of 0.01772 (the “Zenabis Exchange Ratio”) of a common share of the Company in exchange for each Zenabis common share held. The result was the issuance of
13 MD&A
17,579,336 HEXO common shares with an estimated value of $151,358. Warrants, convertible debt and stock options and other incentive securities of Zenabis will be adjusted in accordance with their terms to ultimately become exercisable to receive common shares of the Company based on the Zenabis Exchange Ratio.
Appointment of General Manager of US operations
On February 8, 2021, the Company appointed Charles Bowman as General Manager of its US operations. Mr. Bowman is based in the US and will be responsible for all implementation aspects of HEXO’s US operations including stand up and commissioning of production facilities, overseeing operations, supply chain and logistics, and building the team. Mr. Bowman has held senior leadership roles at leading global ingredient suppliers including BGG and Solix Algredients (Natural Antioxidants), Solazyme, now TerraVia (Algae Oils & Proteins), CP Kelco, and Cargill (Hydrocolloids). Throughout his career, Bowman has strengthened customer partnerships, customized innovations through extraction expertise and accelerated growth in customer facing operations. An executive known for talent and leadership development, Bowman has mentored nutrition and beverage executives in US, China, Japan, Brazil and across Europe. He graduated from Virginia Tech with a Degree in Food Science & Technology and holds a Master of Business Administration from Averett University.
Launch of the First of Its Kind “Bake Sale” Value Brand
In early April 2021, the Company launched its latest brand, Bake Sale. The first of its kind, Bake Sale was created for value seekers and is ideally suited for cannabis cooking consumers who are perfecting recipes or experimenting with decarboxylation and infused food for the first time. The large-format products also offer consumers convenience and the ability to blend with and extend their higher potency products. This marked another step forward for the Company in its continued effort to help eliminate the illicit cannabis market in Canada and protect public health and safety.
Filing of $1.2 Billion Equity Base Shelf Prospectus
On May 7, 2021 the Company filed a new short form equity base shelf prospectus (the “Equity Base Shelf Prospectus”) with securities regulators in each of the provinces and territories of Canada and a corresponding shelf registration statement on Form F–10 with the United States Securities and Exchange Commission. The Base Shelf Prospectus and Registration Statement, enables HEXO to make offerings of up to $1.2 billion of common shares, warrants, subscription receipts and units or a combination thereof from time to time, separately or together, in amounts, at prices and on terms to be determined based on market conditions at the time of the offering and as set out in an accompanying prospectus supplement, during the 25-month period that the Base Shelf Prospectus and Registration Statement, when made final, remain valid. The specific terms of any future offering will be established in a prospectus supplement to the Base Shelf Prospectus (see section “Establishment and Launch At-the-Market Offering up to $150 Million”), which supplement will be filed with the applicable Canadian and U.S. securities regulatory authorities. Unless otherwise specified in the prospectus supplement relating to a particular offering of securities, the net proceeds from any sale of any securities may be used by HEXO for general corporate purposes, including expansion plans in the United States, potential future acquisitions, potential international expansion, capital projects, repaying indebtedness outstanding from time to time and funding ongoing operations and/or working capital requirements.
The Company subsequently reduced the amount available for offerings under the Equity Base Shelf Prospectus and the Equity Registration Statement from $1.2 billion to $700 million when it filed and amended and restated short form equity base shelf prospectus on May 25, 2021. See section “Filing of Preliminary $500m Debt Base Shelf Prospective.”
Early Repayment of Credit Facility
On April 30, 2021, the Company repaid the total outstanding balance on its credit facility established under its credit agreement dated February 14, 2019 with Canadian Imperial Bank of Commerce as sole bookrunner, co-lead arranger and administrative agent, and Bank of Montreal as co-lead arranger and syndication agent, together with accrued interest and associated fees, in the amount of approximately $28.9 million. The credit facility has therefore been terminated and is no longer available to the Company.
SUBSEQUENT TO APRIL 30, 2021
Establishment and Launch At-the-Market Offering up to $150 Million
On May 11, 2021 Company established an at-the-market equity program (the “ATM Program”) that allows the Company to issue and sell up to $150 million (or its U.S. dollar equivalent) of common shares in the capital of the Company (the “Common Shares”) from treasury to the public, from time to time, at the Company’s discretion. All Common Shares sold under the ATM Program will be made through “at-the-market distributions” as defined in the Canadian Securities Administrators’ National Instrument 44-102 - Shelf Distributions, including sales made through the Toronto Stock Exchange (the “TSX”), the New York Stock Exchange (the “NYSE”), or any other recognized marketplace on which the Common Shares are listed, quoted or otherwise traded in Canada and the United States.
The offering of Common Shares under the ATM Program is qualified by a prospectus supplement dated May 11, 2021 to the Company’s Canadian final short form base shelf prospectus dated May 7, 2021.
The Company expects to use the net proceeds from the ATM Program for general corporate purposes, which may include: (i) costs associated with the Company’s U.S. expansion plans including the contemplated acquisition of a facility in the State of Colorado and its subsequent retrofitting and improvement; (ii) capital expenditures, including potential capital expenditures to make additional improvements to the production lines at the Company’s Belleville, Ontario facility; (iii) potential future acquisitions; (iv) working capital, including replenishing existing cash resources and working capital which will be used to fund certain transaction and integration costs
14 MD&A
and minimum debt repayments related to the Company’s proposed acquisition of Zenabis Global Inc. (“Zenabis”); and (v) repayment of additional debts owed by Zenabis following the completion of the Zenabis acquisition.
As at the date of this MD&A the Company has raised an approximately $16,897 and USD$24,852 through the issuance of 2,298,901 and 4,075,025 common shares, respectively.
HEXO’s First US Production Facility
On May 14, 2021, the Company entered into an agreement to acquire an approximately 50,000 sq. ft. facility in Colorado to use for its U.S. expansion plans, and that would be used by KIT USA in particular. The Company anticipates the acquisition costs and subsequent capital expenditures for retrofitting and improvement of this facility will cost approximately US$6.0 million and between US$16.5 million and US$49.5 million, respectively. The Company contemplates funding any acquisition costs through existing cash resources while capital expenditures for subsequent retrofitting and improvement would occur in stages over time and be funded through future financing activities.
The closing of the transaction is subject to a due diligence period as well as usual customary closing conditions, which is anticipated in the fourth quarter.
Filing of Base Shelf Prospectus for Debt and Reduction in Previously Filed Shelf Prospectus for Equity
On May 13, 2021 the Company filed a new preliminary short form base shelf prospectus for debt securities (the “Debt Base Shelf Prospectus”) with securities regulators in each of the provinces and territories of Canada and a corresponding shelf registration statement on Form F–10 with the United States Securities and Exchange Commission (the “SEC”). The Company has also announced a planned, corresponding reduction to the final Equity Base Shelf Prospectus May 11, 2021, with securities regulators in each of the provinces and territories of Canada and the corresponding shelf registration statement on Form F–10 (with the SEC).
The Debt Base Shelf Prospectus and registration statement became final and effective on May 25, 2021, will enable HEXO to make offerings of up to $500 million of debt securities, which may consist of bonds, debentures, notes or other evidences of indebtedness of any kind, nature or description and which may be issuable in series, from time to time, in amounts, at prices and on terms to be determined based on market conditions at the time of the offering and as set out in an accompanying prospectus supplement, during the 25-month period that the Debt Base Shelf Prospectus and Registration Statement, when made final, remain valid. The Base Shelf Prospectus and registration statement will also qualify the distribution of any common shares in the capital of the Company which may be issuable on conversion or repayment of the principal amount of any such debt securities and/or interest thereon as provided for in an accompanying prospectus supplement.
The specific terms of any future offering of debt securities will be established in a prospectus supplement to the Base Shelf Prospectus, which supplement will be filed with the applicable Canadian and U.S. securities regulatory authorities. Unless otherwise specified in the prospectus supplement relating to a particular offering, the net proceeds from any sale of any securities may be used by HEXO for general corporate purposes, including funding ongoing operations and/or working capital requirements, to repay other indebtedness outstanding from time to time, expansion plans in the United States, capital projects and potential future acquisitions, including in relation to international expansion.
On May 7, 2021, the Company filed the Equity Base Shelf Prospectus with securities regulators in each of the provinces and territories of Canada and a corresponding Equity Registration Statement on Form F–10 with the SEC on May 10, 2021, which enable HEXO to make offerings of up to $1.2 billion of common shares, warrants, subscription receipts and units or a combination thereof of the Company from time to time, separately or together, in amounts, at prices and on terms to be determined based on market conditions at the time of the offering and as set out in an accompanying prospectus supplement, during the 25-month period that the Equity Base Shelf Prospectus and Equity Registration Statement remain valid. Upon the Base Shelf Prospectus and Registration Statement being made final, the Company will reduce the amount available for offerings under the Equity Base Shelf Prospectus and the Equity Registration Statement from $1.2 billion to $700 million, so that the amount available for both equity and debt offerings under the Equity Base Shelf Prospectus and Equity Registration Statement and the Base Shelf Prospectus and Registration Statement, respectively, totals $1.2 billion.
HEXO to Acquire 48North Cannabis Corp.
On May 17, 2021, HEXO entered into a definitive arrangement agreement (the “48North Arrangement Agreement”) with 48North Cannabis Corp. (“48North”), under which HEXO expects acquire all of 48North’s issued and outstanding common shares in an all-share transaction valued at approximately $50.0 million by way of court-approved plan of arrangement under the Canada Business Corporations Act (the “48North Acquisition”). Under the terms of the 48North Arrangement Agreement, 48North shareholders will receive 0.02366 of a Common Share in exchange for each 48North common share held (the “48North Exchange Ratio”). Common share purchase warrants and incentive securities of 48North will be adjusted in accordance with their terms to ultimately become exercisable to receive Common Shares based on the 48North Exchange Ratio.
The 48North Acquisition needs to be approved by at least 66 2/3% of the votes cast by the shareholders of 48North present at a special meeting of 48North shareholders to be called by 48North to seek approval for the plan of arrangement to effect the 48North Acquisition. HEXO has entered into voting and support agreements with 48North’s directors and officers with respect to all 48North shares owned by them as well as voting and support agreements with certain other shareholders covering all of those shareholders’ common shares of
15 MD&A
48North. As a result, in total approximately 25.9% of 48North’s issued and outstanding common shares are subject to signed voting and support agreements with commitments to support and vote in favour of the 48North Acquisition.
The 48North Acquisition also contemplates HEXO providing 48North with a $5.0 million subordinated secured bridge loan with a 6-month term within 30 days following signing of the 48North Arrangement Agreement to fund 48North’s short term working capital requirements. The 48North Acquisition is not considered a significant probable acquisition under the significance tests set out in Part 8 of NI 51-102 as of the date of this MD&A.
Public Offering of USD$360m Senior Secured Convertible Notes
On May 27, 2021, the Company closed an offering of USD$360 million aggregate principal amount of senior secured convertible notes (the “Notes”) directly to an institutional purchaser and certain of its affiliates or related funds (collectively, the “Purchaser”).
The Notes were sold at a purchase price of USD $327.6 million or approximately 91.0% of their principal amount. The Notes will mature on May 1, 2023 (the “Maturity Date”). Subject to certain limitations, the Notes will be convertible into freely tradeable common shares of the Company at the option of the Purchaser and, subject to conditions and limitations, at the option of the Company. If not previously converted, all principal repayments of the Notes will made be at a price equal to 110% of the principal amount of the Notes being repaid. The Notes will not bear interest except upon the occurrence of an event of default. The Notes will be issued in registered form, without coupons, under a trust indenture dated May 27, 2021 between the Company and GLAS Trust Company LLC as trustee (the “Trustee”), as supplemented and modified by resolutions of the board of directors of the Company.
Upon closing of the offering, 70% of the net proceeds have been placed into escrow with a third party. The escrows funds may be released upon the satisfaction of certain conditions related to the proposed Redecan Definitive Arrangement (below). If the release conditions are satisfied prior to December 1, 2021 funds and the interest earned thereon will be released to HEXO and will be used for purposes of completing the Redecan acquisition. The Company shall be subject to certain financial covenants associated with the Notes, including minimum cash balances effective on the closing date and certain adjusted EBITDA minimums beginning January 31, 2022.
The Company expects to use substantially all of the net proceeds from the Offering to fund the acquisition of Redecan (see “HEXO Announces Acquisition of Redecan”). The Company’s obligations under the Notes will be secured by a first priority lien on substantially all of the Company’s assets. Payment of principal, premium, if any, and interest, if any, on the Notes will be fully and unconditionally guaranteed on a secured basis by the Company’s wholly-owned subsidiary, HEXO Operations Inc.
HEXO Announces Acquisition of Redecan
On May 28, 2021 the Company entered into a definitive share purchase agreement (the “Share Purchase Agreement”) to acquire all of the outstanding shares of the entities that carry on the business of Redecan, Canada’s largest privately-owned licensed producer, with leading market share across a number of categories, for a purchase price of $925 million payable in cash and through the issuance of common shares of HEXO and subject to certain customary adjustments (the “Redecan Acquisition”).
Acquisition Details
Under the terms of the Share Purchase Agreement, the $925 million purchase price will be paid to the Redecan shareholders as follows:
| • | $400 million of consideration due on closing paid in cash; and |
| • | $525 million of consideration due on closing paid through the issuance of HEXO common shares (the “Consideration Shares”) at an implied price per share of $7.53. |
The $7.53 price per share represents the five trading day-period volume-weighted average price (VWAP) of HEXO common shares on the TSX as of the close of Canadian markets on May 27, 2021. It is anticipated that the Redecan shareholders will collectively hold approximately 31% of HEXO’s issued and outstanding common shares immediately following the closing of the Redecan Transaction on a pro forma non-diluted basis. Under TSX rules, the Redecan Transaction requires a simple majority approval of HEXO’s shareholders. HEXO expects to convene a meeting of shareholders to be held in August 2021 for the purpose of submitting the Redecan Transaction to shareholders for approval.
The Redecan Transaction is expected to close in Q1 of fiscal 2022, subject to the satisfaction of customary closing conditions, including the receipt of applicable regulatory approvals, including the approvals of the TSX and the New York Stock Exchange and the shareholder approval described above required under TSX rules. The Redecan Transaction has been unanimously approved by HEXO’s board of directors.
Financing
As outlined above, the Company closed a public offering on May 27, 2021 of USD$360 million aggregate principal amount of senior secured convertible notes due May 1, 2023 directly to an institutional purchaser and certain of its affiliates or related funds. HEXO will use substantially all of the net proceeds from the sale of the Notes to satisfy the anticipated cash portion of the purchase price in the Redecan Transaction.
16 MD&A
Non-IFRS Measures
The Company has included certain non-IFRS performance measures in this MD&A, as defined in this section. We employ these measures internally to measure our operating and financial performance. We believe that these non-IFRS financial measures, in addition to conventional measures prepared in accordance with IFRS, enable investors to evaluate our operating results, underlying performance and future prospects in a manner similar to management.
As there are no standardized methods of calculating these non-IFRS measures, our methods may differ from those used by others, and accordingly, these measures may not be directly comparable to similarly titled measures used by others. Accordingly, these non-IFRS measures are intended to provide additional information and should not be considered in isolation or as a substitute for measures of performance prepared in accordance with IFRS.
ADJUSTED EARNINGS BEFORE INTEREST, TAXES, DEPRECIATION AND AMORTIZATION (“Adjusted EBITDA”)
The Company has identified Adjusted EBITDA as a relevant industry performance indicator. Adjusted EBITDA is a non-GAAP financial measure that does not have any standardized meaning prescribed by IFRS and may not be comparable to similar measures presented by other companies. The Company calculates Adjusted EBITDA as Total net loss, plus (minus) income taxes (recovery), plus (minus) finance expense (income) net, plus depreciation, plus amortization, plus (minus) investment (gains) losses, plus (minus) non-cash fair value adjustments, plus (minus) non-recurring expenses, plus (minus) other non-cash items. See Adjusted EBITDA table for those items comprising investment (gains)/losses, non-cash fair value adjustments, non-recurring expenses and other non-cash items. Management believes this measure provides useful information as it is a commonly used measure in the capital markets to approximate operating earnings.
GROSS PROFIT BEFORE ADJUSTMENTS
This measure is utilized for those reasons as presented in “Gross profit before fair value adjustments” with the adjustment that this metric excludes the write-offs of inventory and biological assets, write downs to net realizable value and destruction costs. The Company has identified this metric as useful and relevant information as it represents the gross profit for operational purposes based on costs to produce, package and ship inventory sold, exclusive of impairments and other write downs due to changes to internal or external influences impacting the net realizable value of inventory and inventory disposal costs.
Key Operating Performance Indicators
We have included certain key operating performance indicators within this MD&A, as defined in this section. We utilize these metrics internally for a range of purposes such as critical inputs in fair valuation techniques to evaluating the operating performance results in a given period.
EXPECTED PLANT YIELD
The expected plant yield is utilized in the valuation of biological assets on hand as at the period end. This represents an unobservable input to a level 3 fair value estimate and is derived from the Company’s historical harvests as well as the expertise of the appropriate personnel. A sensitivity analysis over this input was performed and included in the ‘Biological Assets – Fair Value Measurement’ section below.
PRODUCTION CAPACITY
The production capacity disclosed throughout this MD&A represents management’s best estimate and is derived from the historical actual output of production as well as the use of cultivation expertise existing within the Company.
KILOGRAMS HARVESTED
The kilograms harvested during the period representing the amount of dried gram and dried gram equivalents harvested and produced from biological assets but not necessarily sold during the period.
Other Defined Additional IFRS Measure
We have included the below additional IFRS measures as these represent cannabis industry financial statement line items and are present within the Company’s statement of loss and comprehensive loss for the three and nine months ended April 30, 2021.
GROSS PROFIT BEFORE FAIR VALUE ADJUSTMENTS
We utilize this measure to provide a representation of performance in the period by excluding the fair value measurements as required by IFRS, realized fair value amounts on inventory sold and unrealized gain on changes in fair value of biological assets. We believe this measure provides useful information as it represents the gross profit for management purposes based on cost to produce, package and ship inventory sold, exclusive of any fair value measurements as required by IFRS. The metric is calculated by removing all amounts related to biological asset fair value accounting under IFRS, including gains on transformation of biological assets and the cost of finished harvest inventory sold, which represents the fair value measured portion of inventory cost (“fair value cost adjustment”) recognized as cost of goods sold. In accordance with CSA Staff Notice 51-357 issued in October 2018, we utilize an adjusted gross profit to provide a representation of performance in the period by excluding non-cash fair value measurements as required by IFRS. We believe this measure provides useful information as it represents the gross profit for management purposes based on cost to produce, package and ship inventory sold, exclusive of any fair value measurements as required by IFRS. The metric is calculated by removing all amounts related to biological asset fair value accounting under IFRS, including gains on transformation of biological assets and the cost of finished harvest inventory sold as well as fair value adjustments to net realizable value, which represents the fair value measured portion of inventory cost (“fair value cost adjustment”) recognized as cost of goods sold.
18 MD&A
ADULT-USE NON-BEVERAGE REVENUES & BEVERAGE REVENUES
We utilize this differentiation to allow the user to identify the revenue streams generated by the Company’s perpetual sales activity vs. the future “to be” discontinued sales stream, cannabis infused beverages. As discussed in section ‘Beverage Based Adult-Use Sales,’ the cannabis infused beverage revenues, as at the date of this MD&A, are intended to cease to be recognized by the Company as direct sales at the point in time when the business venture Truss obtains the appropriate cannabis licensing under Health Canada.
Operational and Financial Highlights
KEY FINANCIAL PERFORMANCE INDICATORS
Summary of results for the three months ended April 30, 2021 and January 31, 2021 and April 30, 2020, and the nine months ended April 30, 2021 and 2020.
| For the three months ended | For the nine months ended | |||||||||||||||||||
| Income Statement Snapshot |
April 30, 2021 |
January 31, 2021 |
April 30, 2020 |
April 30, 2021 |
April 30, 2020 |
|||||||||||||||
| $ | $ | $ | $ | $ | ||||||||||||||||
| Revenue from sale of goods |
33,082 | 45,678 | 30,895 | 120,059 | 74,009 | |||||||||||||||
| Excise taxes |
(10,482 | ) | (12,851 | ) | (8,817 | ) | (35,219 | ) | (20,516 | ) | ||||||||||
|
|
|
|
|
|
|
|
|
|
|
|||||||||||
| Net revenue from sale of goods |
22,600 | 32,827 | 22,078 | 84,840 | 53,493 | |||||||||||||||
| Ancillary revenue |
60 | 53 | 54 | 168 | 145 | |||||||||||||||
|
|
|
|
|
|
|
|
|
|
|
|||||||||||
| Total revenue |
22,660 | 32,880 | 22,132 | 85,008 | 53,638 | |||||||||||||||
| Gross profit before adjustments2 |
5,006 | 11,688 | 8,783 | 27,075 | 18,873 | |||||||||||||||
| Gross profit/(loss) before fair value adjustments2 |
4,379 | 11,314 | 8,783 | 27,617 | (23,276 | ) | ||||||||||||||
| Gross profit/(loss)2 |
8,816 | 18,584 | 5,730 | 45,614 | (23,260 | ) | ||||||||||||||
| Operating expenses |
(24,906 | ) | (25,501 | ) | (26,786 | ) | (71,186 | ) | (347,883 | ) | ||||||||||
|
|
|
|
|
|
|
|
|
|
|
|||||||||||
| Loss from operations |
(16,090 | ) | (6,917 | ) | (21,056 | ) | (25,572 | ) | (371,143 | ) | ||||||||||
| Other expenses and losses |
(4,621 | ) | (13,922 | ) | 1,537 | (20,175 | ) | (12,790 | ) | |||||||||||
|
|
|
|
|
|
|
|
|
|
|
|||||||||||
| Loss and comprehensive loss before tax |
(20,711 | ) | (20,839 | ) | (19,519 | ) | (45,747 | ) | (383,933 | ) | ||||||||||
| Tax recovery |
— | — | — | — | 6,023 | |||||||||||||||
|
|
|
|
|
|
|
|
|
|
|
|||||||||||
| Other comprehensive income |
3 | — | — | 3 | — | |||||||||||||||
|
|
|
|
|
|
|
|
|
|
|
|||||||||||
| Total Net loss and comprehensive loss |
(20,708 | ) | (20,839 | ) | (19,519 | ) | (45,744 | ) | (377,910 | ) | ||||||||||
|
|
|
|
|
|
|
|
|
|
|
|||||||||||
| 1 | The Company has adjusted the presentation of gross profit before fair value adjustments by removing inventory and biological asset write offs and impairment losses. |
| 2 | See section ‘Cost of Sales, Excise Taxes and Fair Value Adjustments’ for reconciliation of gross profits |
Operational Results
| For the three months ended |
April 30, 2021 |
January 31, 2021 |
October 31, 2020 |
July 31, 2020 |
April 30, 2020 |
|||||||||||||||
| Total kilograms harvested of dried gram equivalents (kg) |
25,833 | 25,608 | 17,462 | 16,540 | 19,130 | |||||||||||||||
| As at |
April 30, 2021 |
January 31, 2021 |
October 31, 2020 |
July 31, 2020 |
April 30, 2020 |
|||||||||||||||
| $ | $ | $ | $ | $ | ||||||||||||||||
| Total cash and cash equivalents |
81,038 | 129,355 | 149,773 | 184,173 | 94,325 | |||||||||||||||
| Working Capital |
181,929 | 242,963 | 250,312 | 223,216 | 215,661 | |||||||||||||||
| Inventory |
95,223 | 82,192 | 74,597 | 64,933 | 105,928 | |||||||||||||||
19 MD&A
Summary of Results
Revenue
The following table represents the Company disaggregated gross and net revenues by sale stream for past rolling five fiscal quarters.
| For the three months ended |
Units | Q3’21 | Q2’21 | Q1’21 | Q4’20 | Q3’20 | ||||||||||||||||
| ADULT-USE (EXCLUDING BEVERAGES) |
||||||||||||||||||||||
| Adult-use cannabis gross revenue |
$ | 29,273 | 39,417 | 35,898 | 31,164 | 29,316 | ||||||||||||||||
| Adult-use excise taxes |
$ | (10,122 | ) | (12,513 | ) | (11,554 | ) | (8,589 | ) | (8,702 | ) | |||||||||||
|
|
|
|
|
|
|
|
|
|
|
|||||||||||||
| Adult-use cannabis net revenue |
$ | 19,151 | 26,904 | 24,344 | 22,575 | 20,614 | ||||||||||||||||
| Dried grams and gram equivalents sold (kg) |
kg | 8,645 | 10,450 | 11,241 | 7,661 | 9,271 | ||||||||||||||||
|
|
|
|
|
|
|
|
|
|
|
|||||||||||||
| ADULT-USE (BEVERAGES) |
||||||||||||||||||||||
| Adult-use cannabis gross revenue |
$ | 3,330 | 3,648 | 3,302 | 2,386 | 465 | ||||||||||||||||
| Adult-use excise taxes |
$ | (281 | ) | (256 | ) | (245 | ) | (397 | ) | (34 | ) | |||||||||||
|
|
|
|
|
|
|
|
|
|
|
|||||||||||||
| Adult-use cannabis net revenue |
$ | 3,049 | 3,392 | 3,057 | 1,989 | 431 | ||||||||||||||||
| Dried grams and gram equivalents sold (kg) |
kg | 3,461 | 3,782 | 3,872 | 334 | 67 | ||||||||||||||||
|
|
|
|
|
|
|
|
|
|
|
|||||||||||||
| DOMESTIC MEDICAL |
||||||||||||||||||||||
| Domestic medical cannabis gross revenue |
$ | 430 | 504 | 574 | 644 | 774 | ||||||||||||||||
| Domestic medical excise taxes |
$ | (79 | ) | (82 | ) | (88 | ) | (96 | ) | (81 | ) | |||||||||||
|
|
|
|
|
|
|
|
|
|
|
|||||||||||||
| Domestic medical net revenue |
$ | 351 | 422 | 486 | 548 | 693 | ||||||||||||||||
| Dried grams and gram equivalents sold (kg) |
kg | 79 | 78 | 83 | 90 | 104 | ||||||||||||||||
|
|
|
|
|
|
|
|
|
|
|
|||||||||||||
| WHOLESALE |
||||||||||||||||||||||
| Wholesale cannabis gross revenue |
$ | 20 | 109 | 401 | 655 | 340 | ||||||||||||||||
| Wholesale non-cannabis gross revenue |
$ | 29 | — | — | — | — | ||||||||||||||||
| Wholesale cannabis excise taxes |
$ | — | — | — | — | — | ||||||||||||||||
| Wholesale cannabis net revenue |
$ | 49 | 109 | 401 | 655 | 340 | ||||||||||||||||
| Dried grams and gram equivalents sold (kg) |
kg | 4 | 91 | 160 | 258 | 156 | ||||||||||||||||
|
|
|
|
|
|
|
|
|
|
|
|||||||||||||
| INTERNATIONAL |
||||||||||||||||||||||
| International cannabis gross revenue |
$ | — | 2,000 | 1,125 | 1,291 | — | ||||||||||||||||
| International cannabis excise taxes |
$ | — | — | — | — | — | ||||||||||||||||
| International cannabis net revenue |
$ | — | 2,000 | 1,125 | 1,291 | — | ||||||||||||||||
| Dried grams and gram equivalents sold (kg) |
kg | — | 800 | 450 | 493 | — | ||||||||||||||||
| ANCILLARY REVENUE1 |
$ |
60 | 53 | 55 | 87 | 54 | ||||||||||||||||
| Total net revenue |
$ | 22,660 | 32,880 | 29,468 | 27,145 | 22,132 | ||||||||||||||||
|
|
|
|
|
|
|
|
|
|
|
|||||||||||||
| 1 | Revenue outside of the primary operations of the Company. These revenues are derived from a management agreement held by the Company with arms-length partners. |
The following table represents the Company disaggregated gross revenues by sale stream for the nine months ended April 30, 2021 and 2020.
| For the nine months ended |
April 30, 2021 | April 30, 2020 | ||||||
| $ | $ | |||||||
| Retail (excluding beverage) |
104,587 | 70,549 | ||||||
| Cannabis beverage retail |
10,280 | 465 | ||||||
| Medical |
1,508 | 2,655 | ||||||
| Wholesale |
559 | 340 | ||||||
| International |
3,125 | — | ||||||
| Total gross revenue from the sale of goods |
120,059 | 74,009 | ||||||
|
|
|
|
|
|||||
HEXO CIB (Cannabis Infused Beverages)
Sales from the Company’s HEXO CIB revenue stream effectively represents the sales activity of the Company’s Truss joint business venture with Molson Canada. These sales began in the third quarter of the 2020 fiscal year. HEXO CIB was established in order to manufacture, produce and sell cannabis beverage products until Truss obtains its own separate licence from Health Canada. HEXO CIB operates under the Company’s cannabis licensing and in compliance with Health Canada and the Cannabis Act’s regulations. The Company has assessed the beverage revenue stream is to be realized by the Company and presented on a gross basis as defined under IFRS 15 (see the Company’s revenue recognition and presentation policy in Note 3 of the Company’s annual financial
20 MD&A
statements for the year ended July 31, 2020). The Company will continue to operate HEXO CIB until Truss has obtained its independent licensing to manufacture and sell cannabis products from Health Canada, at which point these operations will shift to Truss.
ADULT-USE SALES
Non-Beverage Adult-Use Sales
During the three months ended April 30, 2021, the Company’s net adult-use revenue from the of sale cannabis and cannabis products, (exclusive of cannabis infused beverages) declined by 29% quarter over quarter.
The reduction of these sales in the current quarter as compared to the previous quarter is primarily attributable to the following;
| • | The Company noted increased LP presence in Quebec of 28% during the period which contributed to a 35% decrease in Quebec sales during the period. Also noted in the period was a 27% decrease in the Company’s bulk format sales (28g format). The Company experienced hash potency issues in which the produced product did not meet the targeted THC% specification which led to reduced sales of $1,624. |
| • | The Company’s sales in the Alberta decreased $2,669 during the period. In part, due to a 32% decrease in the provincial UP brand sales due to stock limitations as the Company continues to roll out the relaunched brand. Original Stash sales declined 36% in the period, in part, due to stock limitations of the Company’s OS.Reserve high THC product. |
Offsetting the above were the following sales increases during the third quarter of fiscal 2021:
| • | Despite the impact of the COVID-19 third wave in Ontario during the period in which most private retailers were limited to curb side pickup only, the Company’s sales in Ontario increased 14% or $626. The increase was led by the strength of the UP brand and its 20%+ THC small format premium dry cannabis which grew 67% quarter over quarter. |
| • | The introduction of the Company’s latest brand, Bake Sale, which contributed $546 after its initial launch in the latter half of the period. |
The current periods net adult-use sales for non-beverage cannabis decreased 7% compared the same quarter of fiscal 2020 as volumes sold also decreased 7%.
In the nine months ended April 30, 2021, the Company increased its gross adult-use sales from cannabis and cannabis products, (exclusive of cannabis infused beverages) by 40% or $20,213 due to the following:
| • | The relaunched UP brand has generated additional net sales of $5,631 fiscal year to date; and |
| • | The relative success of Original Stash which has grown 180% or $43,537 compared to the nine months ended April 30, 2020, led by the increase of bulk format sales of $20,285. Original Stash hash sales increased $7,772 as well as new product formats such as KLIK and OS.Joints which added $4,196 in new sales streams during the current fiscal year. |
Beverage Based Adult-Use Sales (see section ‘HEXO CIB’)
During the three months ended April 30, 2021, the Company’s cannabis infused beverages division represented approximately 13% of total net sales, an increase of 3% quarter over quarter. The CIB division’s generated net sales declined 10% quarter over quarter. The reduction largely in part due to a decrease in Ontario sales during the period in which the Company saw a decrease of $395 quarter over quarter due to increased competition and 14% increase in beverage SKUs in the market. However, Truss products retained a number one market share at 38% per OCS shared data during the three months ended April 30, 2021.
The first quarter of cannabis infused beverage sales took place in the third quarter of fiscal 2020, where the Company recognized its first cannabis beverage-based sales of $465 through the product launch of VeryVell THC, CBD and 1:1 drops. The current fiscal years beverage sales are derived from a larger and diversified product mix when compared to that of fiscal 2020. Total beverage product offerings increased from 12 products to 24 in the current period.
The Company’s CIB sales saw growth in certain Canadian provincial markets such as Alberta, BC and Nova Scotia which increased by 41%, 35% and 89%, respectively, for total increased sales of $426. This growth was offset by reduced provincial sales in Ontario and Quebec of $591.
21 MD&A
DOMESTIC MEDICAL SALES
Domestic medical net revenue decreased 17% to $351 from $422 quarter over quarter. Volume sold remained relatively consistent at 79kg sold compared to 78kg in the previous quarter, thus the decline is the result of reduced average prices of dry domestic medical grams sold by $0.73 per gram.
During the comparable periods of the three and nine months ended April 30, 2020 net domestic medical sales decreased 49% from $693 and 44% from $2,262, respectively. This decrease is the result of reduced volume sold and decreased average medical product pricing due, in part, to the impact of competitive pricing within the adult-use market.
The Company remains focused on the growth of our adult-use and international medical market share, however, we are committed to our valued medical patients and have continued to add to our medical products portfolio.
WHOLESALE SALES
Wholesale activity consists of transactions held between the Company and other licensed producers. These sales are generally large quantities at reduced prices per gram and gram equivalent which vary from sale to sale. These sales include both cannabis and non-cannabis products and are also free of excise taxes as this burden belongs to the acquirer and ultimately the seller of the cannabis products and therefore possess a higher net revenue margin.
In the months ended April 30, 2021 the Company realized $49 of wholesale net revenue. The wholesale of cannabis products amounted to $29. The sale of non-cannabis inventory was $20. During the nine months ended April 30, 2021, the Company realized wholesales of $559 of which $401 of bulk cannabis trim sales to licensed Canadian producers.
During the comparable period of the three months and nine months ended April 30, 2020, the Company realized wholesales of $340.
The Company’s primary focus remains on the adult-use retail market, however, additional wholesaling opportunities continue to be assessed and evaluated as they arise and may or may not continue to be realized in future periods.
INTERNATIONAL SALES
The Company began selling internationally in the fourth quarter of fiscal 2020 with its medical sales to Israel. During the three months ended April 30, 2021, the Company had no international medical cannabis sales due to revised prerequisite testing and an additional certification by the Israeli government which caused a delay in the Company’s ability to export. As of the date of this MD&A, the Company is in compliance and may resume with these sales when able. These sales occur on an ad hoc basis to which the Company realized $3,125 throughout the first two quarters of fiscal 2021 with a revenue per gram contribution of $2.50.
These sales currently arise from a 24-month purchase agreement established with an Israel based medical cannabis company at the end of fiscal year 2020. These sales are also free of excise taxes as this burden belongs to the acquirer and ultimately the seller of the cannabis products and therefore by nature contribute a higher net revenue per gram sold.
The Company remains vigilant and active in its search for growth opportunities in the international medical cannabis market.
Cost of Sales, Excise Taxes and Fair Value Adjustments
Cost of goods sold includes the direct and indirect costs of materials and labour related to inventory sold, and includes harvesting, processing, packaging, shipping costs, depreciation and applicable stock-based compensation and direct and indirect overhead.
Fair value adjustment on sale of inventory includes the fair value of biological assets included in the value of inventory transferred to cost of sales.
Fair value of biological assets represents the increase or decrease in fair value of plants during the growing process, less expected cost to complete and selling costs and includes certain management estimates.
The following table summarizes and reconciles the Company’s gross profit line items per IFRS to the Company’s selected non-IFRS measures gross profit before adjustments and gross profit before fair value adjustments. Refer to section ‘Non-IFRS Measures’ for definitions.
22 MD&A
| April 30, 2021 |
January 31, 2021 |
April 30, 2020 |
April 30, 2021 |
April 30, 2020 |
||||||||||||||||
| $ | $ | $ | $ | $ | ||||||||||||||||
| Revenue from sale of goods |
33,082 | 45,678 | 30,895 | 120,059 | 74,009 | |||||||||||||||
| Excise taxes |
(10,482 | ) | (12,851 | ) | (8,817 | ) | (35,219 | ) | (20,516 | ) | ||||||||||
|
|
|
|
|
|
|
|
|
|
|
|||||||||||
| Net revenue |
22,600 | 32,827 | 22,078 | 84,840 | 53,493 | |||||||||||||||
| Ancillary revenue |
60 | 53 | 54 | 168 | 145 | |||||||||||||||
| Cost of sales |
(17,654 | ) | (21,192 | ) | (13,349 | ) | (57,933 | ) | (34,765 | ) | ||||||||||
|
|
|
|
|
|
|
|
|
|
|
|||||||||||
| Gross profit before adjustments |
5,006 | 11,688 | 8,783 | 27,075 | 18,873 | |||||||||||||||
| Write off of biological assets and destruction costs |
— | — | — | — | 663 | |||||||||||||||
| Write off of inventory |
(627 | ) | (374 | ) | — | (1,001 | ) | 2,175 | ||||||||||||
| Write (down)/up of inventory to net realizable value |
— | — | 181 | 1,543 | 39,311 | |||||||||||||||
|
|
|
|
|
|
|
|
|
|
|
|||||||||||
| Gross (loss)/profit before fair value adjustments |
4,379 | 11,314 | 8,602 | 27,617 | (23,276 | ) | ||||||||||||||
| Realized fair value amounts on inventory sold |
(6,426 | ) | (6,387 | ) | (9,251 | ) | (17,619 | ) | (21,362 | ) | ||||||||||
| Unrealized gain on changes in fair value of biological assets |
10,863 | 13,657 | 6,379 | 35,616 | 21,378 | |||||||||||||||
|
|
|
|
|
|
|
|
|
|
|
|||||||||||
| Gross (loss)/profit |
8,816 | 18,584 | 5,730 | 45,614 | (23,260 | ) | ||||||||||||||
|
|
|
|
|
|
|
|
|
|
|
|||||||||||
EXCISE TAXES
Excise taxes are applicable to the adult-use and medical sales. Excise taxes are presented against the revenue generated by the sale of cannabis to derive the Company’s net revenues on cannabis sales. Excise taxes for flower-based products are a function of fixed provincial and territorial rates based upon the gram equivalents sold as well as a variable ad valorem component which is dependent upon the selling price of the products. Excised taxes for distillate, oil-based products, such as the adult-use cannabis infused beverages are applied on the basis of a fixed amount per mg of THC, whereas CBD products are free of excise taxes.
Wholesale and International medical based sales are free of the excise tax burden.
In general, the increase to excise taxes are the result of increase in adult-use sales when compared to fiscal 2020. However, as percentage of gross sales in each period, excise taxes have increased to approximately 31% from 29% of gross revenue. This increase is due to a $0.83 decrease to the average flower selling price as well as increased sales to provinces with higher average excise prices. Quarter over quarter this ratio increased from 29%, due to a 2.64% decrease in the average selling price.
COST OF SALES & GROSS MARGIN BEFORE ADJUSTMENTS
The following table illustrates the breakout of gross profit before adjustments (non-IFRS measure) by sales stream for the current the previous fiscal quarters.
| For the three months ended |
Adult-Use (excluding beverages) |
Medical | International | Wholesale | Total non-beverage |
Adult-use beverages |
Company total |
|||||||||||||||||||||
| April 30, 2021 | $ | $ | $ | $ | $ | $ | $ | |||||||||||||||||||||
| Net revenue |
19,151 | 351 | — | 49 | 19,551 | 3,049 | 22,600 | |||||||||||||||||||||
| Cost of sales |
13,860 | 128 | — | 48 | 14,036 | 3,618 | 17,654 | |||||||||||||||||||||
|
|
|
|
|
|
|
|
|
|
|
|
|
|
|
|||||||||||||||
| Gross profit before adjustments ($) |
5,291 | 223 | — | 1 | 5,515 | (569 | ) | 4,946 | ||||||||||||||||||||
| Gross margin before adjustments (%) |
28 | % | 64 | % | Nil | % | 2 | % | 28 | % | (19 | %) | 22 | % | ||||||||||||||
|
|
|
|
|
|
|
|
|
|
|
|
|
|
|
|||||||||||||||
| January 31, 2021 | $ | $ | $ | $ | $ | $ | $ | |||||||||||||||||||||
| Net revenue |
26,904 | 422 | 2,000 | 109 | 29,435 | 3,392 | 32,827 | |||||||||||||||||||||
| Cost of sales |
17,010 | 143 | 577 | 44 | 17,774 | 3,418 | 21,192 | |||||||||||||||||||||
|
|
|
|
|
|
|
|
|
|
|
|
|
|
|
|||||||||||||||
| Gross profit before adjustments ($) |
9,894 | 279 | 1,423 | 65 | 11,661 | (26 | ) | 11,635 | ||||||||||||||||||||
| Gross margin before adjustments (%) |
37 | % | 66 | % | 71 | % | 60 | % | 40 | % | (1 | %) | 35 | % | ||||||||||||||
|
|
|
|
|
|
|
|
|
|
|
|
|
|
|
|||||||||||||||
During the period the Company’s total non-beverage gross margin declined to 28% from 40% in the previous quarter. The Company incurred average price reductions of $0.25 per gram in response to increased competition on dried flower product and $5.73 per unit of hash product which resulted in reduced gross margin of approximately 6% and 3%, respectively. The price reductions were made in relation to inventory that did not meet certain product specifications regarding THC and/or other attributes in order to mitigate inventory risk and to help preserve the Company’s market share which remains pivotal during these early years of legalization. The Company also offered certain discounts in the period, specifically on jar-based inventory to increase sales velocity and make way for new product.
The adult-use beverage gross margin also remained relatively static in the quarter, nominally falling below even. These sales through the Company’s CIB division (see section ‘HEXO CIB’) which began material activity in the fourth quarter of fiscal 2020, remain in the early stages of production and manufacturing, and therefore while scaling to optimal production levels the unabsorbable overhead on current output levels have minimized gross profits.
23 MD&A
The Company realized no international sales during the three months ended April 30, 2021 due to new logistical requirement imposed by the Israel government. As of the date of this MD&A, the Company is in compliance and may resume with these sales when able. As previously disclosed, the Company’s wholesale activity and the associated gross margins may vary from period to period as they are dependent upon the specific wholesale agreements with other licensed producers.
Total cost of sales for the nine months ended April 30, 2021 increased 67% when compared to the nine months ended April 30, 2020 as the result of an incremental gross sales increase of 62%, as well as those factors noted above.
IMPAIRMENTS AND WRITE OFFS
During the three months ended April 30, 2021 the Company destroyed $627 of inventory, primarily packaging materials no longer required. The Company recorded a reversal of impairment in the nine months ended April 30, 2021 of $1,543. The reversal was due to the Company selling previously impaired adult-use dried flower product.
In the comparative period of the three months ended April 30, 2020 the Company incurred write downs on inventory to net realizable value of $181 during the three months ended April 30, 2020. These losses were due to the following;
| • | Write down of concentrated bulk purchase of $1,422 due to an excess supply which reduced the value relative to the contractual obligation price. |
| • | A reversal of impairment was recognized on previously written down cannabis trim of $1,241 due to the Company’s trim utilization plan in which trim previously primarily used for extraction is being utilized for other US value added products. |
During the nine months ended April 30, 2020, in addition to the above, the Company had write downs on inventory to net realizable value of $39,130. The impairment losses were realized on the Company’s inventory and were comprised of the following;
| • | Write down of a surplus of cannabis trim (trim was primarily used for extraction purposes) and milled products the amount of $17,098 due to an excess of stock relative to the Company’s short-term demand for cannabis distillate production; |
| • | Write down of bulk purchased product of $16,166 due, in part, to an oversupply in the market of bulk products with lower potencies as well as a relatively low value when compared to competing bulk goods with a higher potency in the current adult-use market; |
| • | Write down of oil based finished goods of $3,436 due a surplus of finished goods as oil-based products haven’t captured the market share as originally estimated. Also contributing to the impairment is the decision made by certain provinces to return oil products with packaged dates greater than 3 to 4 months old; |
| • | Write down of finished goods of $1,186 which are required to be archived as at October 31, 2019 and possess a net realizable value of $nil; and |
| • | Write down in the amount of $1,241 was recognized due to costs related to packaging reconfiguration |
The continuing evolution of the cannabis industry and market conditions represent ongoing uncertainties that may affect the Company’s future financial results and impairments. See “Risk Factors” for additional economic and inventory risks.
FAIR VALUE ADJUSTMENTS
The unrealized gain on changes in fair value of biological assets for the current period decreased to $10,863 compared to $13,657 in the second quarter of fiscal 2021. The Company incurred decreased average selling prices during quarter which adversely affect the value of its biological assets. The Company’s expected minimum yield per plant increased to 80 grams from 75 in the previous quarter. The average stage of completion (growth of the plant) remained flat at 50% quarter over quarter.
The realized fair value adjustment on inventory sold for the three months ended April 30, 2021 remained flat compared to the previous quarter. This consistency is a function of 20% decrease in volumes sold offset by the high gains on fair value of biological asset stemming from prior quarters which were attributed to increased average harvest yields. Contrarily, the fair value adjustment decreased by 31% from the comparable period of fiscal 2020, volumes sold remained flat and thus the reduction is due to the sales mix of lower gain on fair value trim based product in the current period such as hash and pre-rolls, as opposed to higher gain on fair value oil based products in the comparative period.
The unrealized gain on changes in fair value of biological assets has increased significantly by 70% from $6,379 in the same quarter of fiscal 2020 due to increased total number of plants on hand, increased expected yields as the Company continuously improves harvesting. This holds true also for the 66% increase for the nine months ended April 30, 2021 as compared to the same period of fiscal 2020.
24 MD&A
Operating Expenses
| For the three months ended | For the nine months ended | |||||||||||||||||||
| April 30, 2021 |
January 31, 2021 |
April 30, 2020 |
April 30, 2021 |
April 30, 2020 |
||||||||||||||||
| $ | $ | $ | $ | $ | ||||||||||||||||
| Selling, general and administration1 |
11,178 | 12,299 | 11,238 | 35,147 | 40,833 | |||||||||||||||
| Marketing and promotion |
2,452 | 2,149 | 2,131 | 6,682 | 9,621 | |||||||||||||||
| Share-based compensation |
2,715 | 5,259 | 6,171 | 10,904 | 22,237 | |||||||||||||||
| Research and development |
730 | 1,136 | 1,017 | 2,901 | 3,962 | |||||||||||||||
| Depreciation of property, plant and equipment |
1,612 | 1,679 | 1,566 | 4,369 | 4,890 | |||||||||||||||
| Amortization of intangible assets |
371 | 342 | 341 | 1,043 | 3,690 | |||||||||||||||
| Restructuring costs |
336 | 860 | 865 | 1,721 | 4,846 | |||||||||||||||
| Impairment of property, plant and equipment |
16 | 61 | 220 | 881 | 33,004 | |||||||||||||||
| Impairment of intangible assets |
— | — | — | — | 106,189 | |||||||||||||||
| Impairment of goodwill |
— | — | — | — | 111,877 | |||||||||||||||
| Realization of onerous contract |
— | — | — | — | 3,000 | |||||||||||||||
| Disposal of long-lived assets |
— | 1,294 | 3,237 | 1,294 | 3,734 | |||||||||||||||
| Loss/(gain) on disposal of property, plant and equipment |
(19 | ) | (14 | ) | — | 45 | — | |||||||||||||
| Acquisition and transaction costs |
1,871 | 436 | — | 2,308 | — | |||||||||||||||
| Health Canada Recovery Fee’s1 |
3,644 | — | — | 3,891 | — | |||||||||||||||
|
|
|
|
|
|
|
|
|
|
|
|||||||||||
| Total |
24,906 | 25,501 | 26,786 | 71,186 | 347,883 | |||||||||||||||
| 1 | The Company has adjusted the presentation of the Selling, General and Administrative expenses to breakdown the Health Canada Recovery Fee’s for ease of user review and identification. This presentation differs from that of the Company’s interim financial statement for the three and nine months ended April 30, 2021. |
Operating expenses include general and administrative expenses, marketing and promotion, share-based compensation, research and development, and depreciation/amortization expenses. Marketing and promotion expenses include customer acquisition costs, customer experience costs, salaries for marketing, promotion and sales staff, and general corporate communications expenses. Selling, general and administrative expenses include salaries for administrative staff and executive salaries as well as general corporate expenditures including legal, insurance and professional fees.
SELLING, GENERAL AND ADMINISTRATIVE
During the three months ended April 30, 2021, the Company’s selling, general and administrative expenses increased by 42% from $11,238 compared to the third quarter of fiscal 2020. This increase is due to the following:
| • | The required Health Canada annual recovery fees were $3,644 in period. These fees will be paid annually each April, and are based upon the previous fiscal year’s sales and purchases by class of cannabis and quantity purchased and sold. These fees were expensed in the fourth quarter of fiscal 2020. |
| • | Consulting expenses were reduced by $428 or 42% as the Company has reduced certain ongoing initiatives and its total vendors utilized due to the maturity of its operations. |
| • | Facility related expenses were reduced by $648, in part due to the closure and sale of the Niagara facility which occurred in the third quarter of fiscal 2020; |
| • | Salaries and benefits increased $815 or 31%, primarily due to increased headcount associated with the Company’s CIB division as well as accrued variable compensation related to the Company’s incentive plan, new in fiscal 2021 ; and |
| • | Travel related expenses decreased by $247 due to a general reduction in corporate travelling which, in part, is impacted by the COVID-19 pandemic. |
Selling, general and administrative expenses increased by $2,552 from $12,299 in the previous quarter as a result of the Health Canada Licensing fee noted above which was expensed in the current quarter.
As a percentage of total gross revenues, SG&A expenses, excludes Health Canada fees, have improved by 2% from 36% on comparative period of fiscal 2020.
MARKETING AND PROMOTION
In the three months ended April 30,2021, marketing and promotion expense increased moderately by $303, because of increased marketing of the UP brand relaunch and branding materials required for increased retail locations.
During the nine months ended April 30, 2021 marketing and promotional expenses declined by 31% due to the Company’s restructuring activity, as well as the shift toward positive earnings and reducing operating expenses. This resulted in the Company realizing credits for cancelled marketing and promotional contracts, campaigns and programs, rightsizing of the associated departments and spending efforts during the nine months ended.
RESEARCH AND DEVELOPMENT (“R&D”)
During the three months ended April 30, 2021, R&D expenses decreased by $406 compared to the previous quarter as the result of reduced payroll related expenses. The Company’s Brantford facility was converted to an R&D facility in early fiscal 2021, where future strain development takes place.
25 MD&A
The Company underwent a rightsizing of the R&D and innovation departments during the second quarter of fiscal 2020, resulting in lower payroll related expenses across the department. This has led to a decrease of 28% in R&D expenses when compared to the third quarter of fiscal 2020.
During the nine months ended April 30, 2021, total R&D expenses were reduced by 27% as the result of the restructuring of the Company’s R&D related departments.
SHARE-BASED COMPENSATION
In the three months ended April 30, 2021, share-based compensation expenses decreased 48% from $5,259 in the previous quarter. The decrease is directly attributable to the cash-settlement based share liability which is revalued at each period end. The Company’s increased share price during the previous period resulted in increased expenses of $1,638. Share-based expenses for equity-settled options decreased as there was only one option grant at the end of April 2021 compared to the previous quarter which included two option grants in October 2020 and December 2020.
When compared to the same period of fiscal 2020, share-based compensation decreased 51%, attributable to the vesting structuring of high value stock option grants issued in fiscal 2019 winding down towards less expensive vesting periods. Share-based expenses are weighted more significantly in the first twelve months after issuance due to their vesting structure, thus, critical vesting milestones have been reached. Subsequent grants in fiscal 2020 possess a lower call option burden to the Company due to lower market prices, and therefore lower contribution of expenses over time. During the nine months ended April 30, 2021, share-based compensation was reduced by 51 % primarily due to the above.
DEPRECIATION OF PROPERTY, PLANT AND EQUIPMENT
For the three months ended April 30,2021 and compared to the same period of fiscal 2020, depreciation of property, plant and equipment in operating expenses remained flat.
AMORTIZATION OF INTANGIBLE ASSETS
During the three months ended April 30, 2021 the amortization of intangible assets increased by 8% due to the $1,447 of intangible asset additions being put in use and amortized.
The amortization of intangible assets decreased by $2,647 in the quarter when assessed against the comparative nine-month period of 2020. The decrease in the current period is due to the addition amortization incurred in fiscal 2020 over the fair market value of identified $113,888 cultivation and license intangible asset obtained through business acquisition that was subsequently impaired.
RESTRUCTURING COSTS
During the current fiscal year the Company underwent a restructuring of certain departments and functions within the organization. This began in the first quarter in which $525 of executive severance was realized, then followed up by the reorganization of the Company human resources department in the second quarter amounting to $860. During the current period, $336 was realized mostly due to remaining severance payments. These restructuring efforts continue to rescale the Company’s operations to the appropriate level in order to drive operating expenses lower.
During the comparative periods of the three and nine months ended April 30, 2020 the Company was undergoing its initial restructuring efforts to rightsize the Company as previously disclosed in the Company’s annual MD&A of fiscal 2020 in section ‘Corporate Restructuring.’ These costs were primarily comprised of severance, consulting fees and other payroll related termination costs.
IMPAIRMENT OF PROPERTY, PLANT AND EQUIPMENT
The company incurred no material Impairment losses on property, plant and equipment in the three months ended April 30, 2021.
During the comparative period in fiscal 2020, impairment losses amounted to $220 related to adjusting the Niagara facility and land to its sale price.
IMPAIRMENT OF INTANGIBLE ASSETS
The company incurred no impairment on intangible assets during the three or nine months ended April 30, 2021.
During the comparative periods three and nine months ended April 30, 2020, the Company recognized impairment of intangible assets of $106,189 in connection with the Niagara facility’s cultivation and processing licenses acquired on the purchase of Newstrike.
ONEROUS CONTRACT
The Company incurred no losses on onerous contracts during the three or nine months ended April 30, 2021.
During the comparative periods nine months ended April 30, 2020 the Company recognized onerous contract provisions of $3,000 relating to a fixed price supply agreement for the supply of certain cannabis products to which the Company is currently liable to receive. The onerous portion of the supply agreement is the deemed excess contract price over the current market pricing. The supply agreement is currently the subject of legal proceedings (see section – ‘Litigation’). The costs and purchase obligations under the contract exceed the economic benefits expected to be received.
26 MD&A
DISPOSAL OF LONG-LIVED ASSETS
During the periods of the three ended April 30, 2021, the Company did not dispose of any long-lived assets. In the previous quarter, the Company disposed of its HIP license and prepaid royalties in the amount of $902 on termination of the agreement.
During the comparative periods of fiscal 2020, the Company disposed of certain equipment in the Niagara facility resulting in a loss of $3,237.
ACQUISITION AND TRANSACTION COSTS
The Company recently announced the proposed acquisitions of 48North and Redecan (see subsequent events section). During the period the Company began realizing expenses related to these proposed acquisitions including legal, due diligence, consulting and other applicable costs. In addition to this, the company continued to incur expenses relating to the acquisition of Zenabis which closed June 1, 2021. These uncapitalizable costs amounted to $1,871. There were no such expenses in the comparative period.
Other Income and Losses
| For the three months ended | For the nine months ended | |||||||||||||||||||
| April 30, 2021 |
January 31, 2021 |
April 30, 2020 |
April 30, 2021 |
April 30, 2020 |
||||||||||||||||
| $ | $ | $ | $ | $ | ||||||||||||||||
| Interest and financing expenses |
(3,296 | ) | (2,768 | ) | (3,279 | ) | (8,368 | ) | (7,312 | ) | ||||||||||
| Interest income |
349 | 296 | 353 | 1,057 | 1,239 | |||||||||||||||
|
|
|
|
|
|
|
|
|
|
|
|||||||||||
| Finance income (expense), net |
(2,947 | ) | (2,472 | ) | (2,926 | ) | (7,311 | ) | (6,073 | ) | ||||||||||
|
|
|
|
|
|
|
|
|
|
|
|||||||||||
| Revaluation of financial instruments gain |
(383 | ) | (9,937 | ) | 4,955 | (9,587 | ) | 7,966 | ||||||||||||
| Share of loss from investment in associate and joint ventures |
(2,244 | ) | (2,584 | ) | (1,195 | ) | (5,902 | ) | (4,468 | ) | ||||||||||
| Loss on convertible debenture receivable |
746 | — | (212 | ) | 746 | (3,253 | ) | |||||||||||||
| Unrealized gain/(loss) on investments |
544 | 1,248 | (311 | ) | 1,204 | (8,535 | ) | |||||||||||||
| Realized gain on investments |
— | — | (1,217 | ) | — | (1,444 | ) | |||||||||||||
| Foreign exchange gain/(loss) |
(1,514 | ) | (1,862 | ) | 2,443 | (3,836 | ) | 3,017 | ||||||||||||
| Other income |
1,177 | 1,685 | — | 4,511 | — | |||||||||||||||
|
|
|
|
|
|
|
|
|
|
|
|||||||||||
| Non-operating income (expense), net |
(1,674 | ) | (11,450 | ) | 1,537 | (12,864 | ) | 12,790 | ||||||||||||
|
|
|
|
|
|
|
|
|
|
|
|||||||||||
INTEREST AND FINANCING EXPENSES
During the three months ended April 30, 2021 as compared to the same period of fiscal 2020 interest and financing expenses remained consistent.
Contrarily, these expenses increased by $1,056 in the nine months ended April 30, 2021 due in part, to the interest accrued on the debentures issued in December 2019, thus four months of accrued interest on the debentures took place in the nine months ended April 30, 2020 compared to nine months of accrued interest on the remaining unconverted debentures in the current fiscal year.
REVALUATION OF FINANCIAL INSTRUMENTS
The Company revalued its financial instruments on April 30, 2021, resulting in a loss of $383 in the current period. The loss was due to a moderate increase to the Company market price. In the previous quarter, the market price increased significantly to $8.26 at January 31, 2021 from $3.24 as at October 31, 2020 and $3.64 as at July 31, 2020 resulting in a loss of $9,937. The applicable financial instruments are the Company’s USD denominated warrants, which are classified as a liability and remeasured at each period end date.
Contrarily, the revaluation gain of $7,966 in the nine months ended April 30, 2020 was due to the decrease in the Company’s underlying market price resulting in a reduction of the outstanding warrant liability.
SHARE OF LOSS FROM INVESTMENT IN ASSOCIATES AND JOINT VENTURES
The line item represents the Company’s share of the operational results of our held interests in associates and joint venture and therefore are a function of their respective financial results for the period. In the prior quarter, these losses were reduced moderately by the Company’s share of rent recovery income through the BCI joint venture. Excluding this, the losses from the Truss and Truss CBD USA have increased due to each entity continuing to scale.
LOSS ON CONVERTIBLE DEBENTURES RECEIVABLE
In the three months ended April 30, 2021, the Company recognized a gain of $746 on the $19,500 convertible debenture receivable from Zenabis. In the comparative period of fiscal 2020, a loss was recognized on the $7,000 convertible debentures receivable and when marked-to-market amounted to $212 as a result of volatility in the underlying securities market price.
UNREALIZED GAIN/(LOSSES) ON INVESTMENTS
The Company’s level 1 investments in publicly held companies are marked-to-market at each period end date. During the three months ended April 30, 2021 the Company’s gain on investments was $544 due to the favorable increase in the underlying markets prices. During the nine months ended April 30, 2021, this net gain amounted to $1,204 due to the above.
27 MD&A
The losses in fiscal 2020’s comparative periods for the nine months ended April 30, 2020, were principally due to the $6,574 write off of a level 3 private investment which the Company obtained through a previous acquisition.
FOREIGN EXCHANGE GAIN/(LOSS)
Gains and losses are the outcome of favorable and unfavorable volatility in the CAD/USD FX rate period over period. As at April 30, 2021, the Company’s holds approximately $7,000 less USD compared to April 30, 2020.
Quarter over quarter the CAD/USD FX rate fell to $1.2285 from $1.278 resulting in a loss of $1,514.
OTHER INCOME
During the three and nine months ended April 30, 2021 the Company recognized recoveries on partnership of $1,088 and $3,993, respectively, as Other Income as the result of the Company’s arrangement with Truss in which the Company recovers its net loss incurred due to the operations of HEXO CIB (see section Cannabis Infused Beverage (“CIB”)”). This activity remained consistent period over period and there was no recovery on partnership in the same period of fiscal 2020. In the period, the Company also realized a gain of $90 through exiting two former administrative office leases.
Tax Recovery
In the nine months ended April 30, 2020, the Company realized a tax recovery of $6,023 to offset the remaining differed tax liability generated through the acquisition of Newstrike in fiscal year 2019. There were no tax recoveries in the three and nine months ended April 30, 2021.
Adjusted EBITDA
As defined under section ‘Non-IFRS Measures’ Adjusted EBITDA is a non-GAAP financial measure that does not have any standardized meaning prescribed by IFRS and may not be comparable to similar measures presented by other companies. The Company calculates Adjusted EBITDA as total net loss, plus (minus) income taxes (recovery), plus (minus) finance expense (income), plus depreciation, plus amortization, plus (minus) investment (gains) losses, plus (minus) non-cash fair value adjustments on the sale of in inventory and biological assets, plus (minus) restructuring costs as these are the associated costs for the severance and other payroll related expenses to restructure the Company in such a manner that they are not expected to be a part of the Company’s continuous operations, plus (minus) certain non-cash items, as determined by management as follows:
| Q3’21 | Q2’21 | Q1’21 | Q4’20 | Q3’20 | ||||||||||||||||
| $ | $ | $ | $ | $ | ||||||||||||||||
| Total net loss |
(20,708 | ) | (20,839 | ) | (4,197 | ) | (169,532 | ) | (18,837 | ) | ||||||||||
| Finance expense (income), net |
2,947 | 2,472 | 1,895 | 2,069 | 2,926 | |||||||||||||||
| Depreciation, included in cost of sales |
1,502 | 2,385 | 2,406 | 1,254 | 950 | |||||||||||||||
| Depreciation, included in operating expenses |
1,612 | 1,679 | 1,078 | 1,179 | 1,566 | |||||||||||||||
| Amortization, included in operating expenses |
371 | 342 | 331 | 249 | 341 | |||||||||||||||
| Investment (gains) losses |
||||||||||||||||||||
| Revaluation of financial instruments loss/(gain) |
383 | 9,937 | (733 | ) | 1,433 | (4,955 | ) | |||||||||||||
| Share of loss from investment in joint venture |
2,244 | 2,584 | 1,073 | 1,863 | 1,195 | |||||||||||||||
| Loss/(gain) on convertible debentures |
(746 | ) | — | — | 86 | 212 | ||||||||||||||
| Unrealized loss/(gain) on investments |
(544 | ) | (1,248 | ) | 587 | 4,345 | 311 | |||||||||||||
| Realized loss/(gain) on investments |
— | — | — | — | 1,217 | |||||||||||||||
| Foreign exchange loss/(gain) |
1,514 | 1,862 | 461 | 1,623 | (2,443 | ) | ||||||||||||||
| Loss on inducement of convertible debentures |
— | — | — | 54,283 | — | |||||||||||||||
| Non-cash fair value adjustments |
||||||||||||||||||||
| Realized fair value amounts on inventory sold |
6,426 | 6,387 | 4,806 | 6,656 | 10,764 | |||||||||||||||
| Unrealized gain on changes in fair value of biological assets |
(10,863 | ) | (13,657 | ) | (11,096 | ) | (7,978 | ) | (6,379 | ) | ||||||||||
| Restructuring costs & acquisition costs |
||||||||||||||||||||
| Restructuring costs |
336 | 860 | 525 | (79 | ) | 865 | ||||||||||||||
| Acquisition costs |
1,871 | 436 | — | — | — | |||||||||||||||
| Other non-cash items |
||||||||||||||||||||
| Share-based compensation, included in operating expenses |
2,715 | 5,259 | 2,930 | 4,373 | 5,651 | |||||||||||||||
| Share-based compensation, included in cost of sales |
251 | 402 | 596 | 511 | 396 | |||||||||||||||
| Write-off of inventory |
— | — | — | 2,217 | — | |||||||||||||||
| Write (up)/down of inventory to net realizable value |
— | — | (1,543 | ) | 41,899 | (1,331 | ) | |||||||||||||
| Impairment loss on right-use-assets |
— | — | 761 | 2,000 | — | |||||||||||||||
| Gain on exit of lease |
(88 | ) | — | (419 | ) | — | — | |||||||||||||
| Impairment loss on property, plant and equipment |
16 | 61 | 42 | 46,414 | 220 | |||||||||||||||
| Impairment of intangible assets |
— | — | — | — | — | |||||||||||||||
28 MD&A
| Q3’21 | Q2’21 | Q1’21 | Q4’20 | Q3’20 | ||||||||||||||||
| $ | $ | $ | $ | $ | ||||||||||||||||
| Impairment of goodwill |
— | — | — | — | — | |||||||||||||||
| Recognition of onerous contract |
— | — | — | 1,763 | — | |||||||||||||||
| Disposal of long-lived assets |
(19 | ) | 1,280 | 78 | 122 | 3,237 | ||||||||||||||
|
|
|
|
|
|
|
|
|
|
|
|||||||||||
| Adjusted EBITDA |
(10,780 | ) | 202 | (419 | ) | (3,250 | ) | (4,094 | ) | |||||||||||
|
|
|
|
|
|
|
|
|
|
|
|||||||||||
From total net loss, standard EBITDA items such as interest, taxes, depreciation and amortization were added back. Additional investment gains and losses were adjusted as these items are considered non-operating and/or in the start-up phase of operations. Non-cash fair value adjustments to inventory and biological assets were adjusted as these were non-cash. Restructuring costs were adjusted as they are considered non-recurring charges as they relate to one-time severance and payroll related costs outside of the Company’s ongoing operations. acquisition and transaction costs pertain to uncapitalizable M&A legal and consulting costs which are not a part of the Company’s ongoing operations. Other non-cash items are removed to arrive at Adjusted EBITDA which is a measure used by industry to approximate operating earnings.
The Company’s Adjusted EBITDA in current period fell significantly to ($10,780) due to the decrease in sales and average margin quarter over quarter (see section “Revenue” & section “Cost of Sales Before Adjustments”) which amounted to $6,950.The Company also realized a $3,644 in period expense for Health Canada recovery fees owed for the governmental fiscal year 2022. The Company reached Adjusted EBITDA positive in the second quarter of fiscal 2021 which was due to net revenue increase of 12%. During the three months ended October 31, 2020, the Company’s Adjusted EBITDA loss continued to improve as management works towards profitability of the Company. This improvement was driven by increased gross margin before fair value adjustments, as well as increased non-cash depreciation expensed through costs of sales due to the impact of produced inventory in periods with higher depreciation being sold. (See section Revenue, Excise taxes and Cost of Sales).
Quarterly Results Summary
The following table presents certain unaudited financial information for each of the eight fiscal quarters up to and including the quarter ended April 30, 2021. Past performance is not a guarantee of future performance, and this information is not necessarily indicative of results for any future period.
| Q3 ’21 April 30, 2021 |
Q2 ’21 January 31, 2021 |
Q1 ’21 October 31, 2020 |
Q4 ’20 July 31, 2020 |
|||||||||||||
| $ | $ | $ | $ | |||||||||||||
| Net revenue |
22,660 | 32,880 | 29,468 | 27,145 | ||||||||||||
| Total net loss |
(20,708 | ) | (20,839 | ) | (4,197 | ) | (169,532 | ) | ||||||||
| Loss per share – basic |
(0.17 | ) | (0.17 | ) | (0.04 | ) | (1.60 | ) | ||||||||
| Loss per share – fully diluted |
(0.17 | ) | (0.17 | ) | (0.04 | ) | (1.60 | ) | ||||||||
| Q3 ’20 April 30, 2020 |
Q2 ’20 January 31, 2020 |
Q1 ’20 October 31, 2019 |
Q4 ’19 July 31, 2019 |
|||||||||||||
| $ | $ | $ | $ | |||||||||||||
| Net revenue |
22,132 | 17,007 | 14,499 | 15,424 | ||||||||||||
| Total net loss |
(18,837 | ) | (298,167 | ) | (60,016 | ) | (44,729 | ) | ||||||||
| Loss per share – basic |
(0.28 | ) | (4.52 | ) | (0.92 | ) | (0.84 | ) | ||||||||
| Loss per share – fully diluted |
(0.28 | ) | (4.52 | ) | (0.92 | ) | (0.84 | ) | ||||||||
During the current period the Company’s total net loss remained flat, however, an increase in the operating loss of $9,173 was offset by a reduction to the other losses by $8,991. The increase to the operating loss was due to reduced sales in the period (see section “Revenue”) and the reduction to Other losses led by the stabilization of the Company share price on April 30, 2021 as compared to January 31, 2021. The resulting impact was a nominal loss on revaluation of the Company’s USD warrant liability. The total net loss in the second quarter of fiscal 2021 current period rose by $16,642 from the previous period. This was led by the revaluation loss on financial instruments of $9,937 due to the strength of the Company’s market price since October 31, 2020 which increased in the underlying USD warrants liability. In the first quarter of fiscal 2021, the net loss was reduced significantly due to the previous period incurring $144,813 of total impairments and losses composed of; $54,283 of loss on inducement of convertible debentures (see ‘Other Income and Losses’); $46,414 of property, plant and equipment impairment (see ‘Operating Expenses’) and $44,116 of write offs and write downs of inventory in the period (see ‘Cost of Sales, Excise Taxes and Fair Value Adjustments’). The net of Q3 fiscal 2020 decreased significantly from the previous quarter as a result of $250,850 in impairments to goodwill, property, plant and equipment, intangible assets associated with the Niagara, ON facility realized in that period.
29 MD&A
Financial Position
The following table provides a summary of our condensed interim consolidated financial position as at April 30, 2021 and July 31, 2020:
| April 30, 2021 | July 31, 2020 | |||||||
| $ | $ | |||||||
| Total assets |
653,189 | 692,869 | ||||||
| Total liabilities |
126,064 | 136,193 | ||||||
| Share capital |
1,031,525 | 1,023,788 | ||||||
| Share-based payment reserve |
66,381 | 65,746 | ||||||
| Warrants |
93,429 | 95,617 | ||||||
| Contributed Surplus |
37,386 | 27,377 | ||||||
| Non-controlling interest |
3,379 | 3,379 | ||||||
| Accumulated other comprehensive income and deficit |
(704,978 | ) | (659,231 | ) | ||||
Total Assets
As at April 30, 2021 the Company’s total assets have decreased by 6% from July 31, 2020. The following significant activities and events resulted in the net reduction of assets during the nine months ended April 30, 2021:
| • | The Company’s net decrease to cash, cash equivalents and restricted cash was $78,845. Captive insurance deposits totaling $30,000 were made and are classified as restricted cash; |
| • | Since July 31, 2021, inventory has increased $30,290. As the result of significantly increased average yields of the Company’s biological assets as well as greater bud to trim yields; |
| • | Biological assets increased by $1,651 due to expected yields increased period over period due to entering a higher yielding, increased number of plants and weather favorable season to harvest; |
| • | Property, plant and equipment decreased on a net basis by $5,183 as depreciation expenses of $15,219 and impairments losses of $881 exceeded the periods net additions of $10,051. This is due to the Company’s reduced construction in progress as operations continue to approach scale; |
| • | The Company made a capital contribution of $2,975 to Truss during the period, which was offset by the Company’s share of losses in its joint venture and associates, resulting in a net decrease to the assets of $2,927; |
| • | A convertible debenture receivable with a fair value of $20,246 was issued to Zenabis during the period as a working capital bridge loan to acquisition; |
| • | The HIP license and royalty prepaid assets were written off in the amount of $1,020 during the period as the underlying agreement was effectively ended; and |
| • | Long term prepaid expenses increased by $1,709 due to a deposit made in the same amount to an insurance provider in place of a surety bond as required by the Canadian Tax Agency’s excise tax laws. |
Total Liabilities
Current liabilities on April 30, 2021 decreased 15% from $82,487 as at July 31, 2020 due to the following:
| • | A significant reduction to the current liabilities balance since July 31, 2020 was caused by the Company repayment of the outstanding $29,930 Term loan; |
| • | The Company’s USD denominated warrants were revalued to $13,037 at period end resulting in a revaluation loss of $9,587. This is primarily the result of the Company’s increased share price since year end and therefore a higher future liability of the warrants; |
| • | Decrease in current liabilities includes $2,806 decrease to excise taxes payable. Balance at July 31, 2020 possessed two months of remittable excise taxes which decreased to one month in the current period. |
Long term liabilities increased during the period to $56,322 from $53,706 as at July 31, 2020. The increase is due to the convertible debentures accretion activity of $2,982 and the increase of cash-settlement based securities of $2,024. These increases were offset by a decrease in long term lease liability for $1,778.
Share Capital
During the nine months ended April 30, 2021, share capital increased $7,430 upon the exercise 1,522,139 warrants.
Share-Based Payment Reserve
During the nine months ended April 30, 2021 the Company’s shares-based payment reserve increased on a net basis by $635 from $65,746 on July 31, 2020. The net increase is the result of expired vested and vesting stock options of $9,507 and expired warrants of $195 exceeded by total share-based compensation issued in the period of $10,337. The high value of expired vested stock options in the period is the result of the restructuring activity which occurred in October 2019. The Company’s standard policy is vested stocks options expire after the one-year anniversary date of termination/voluntary exiting.
Warrants Reserve
During the nine months ended April 30, 2021, the warrant reserve was reduced by $2,188 due to the exercise of warrants. There were no warrants issued during the period.
30 MD&A
Contributed Surplus
The Company’s contributed surplus increased by $10,009 during the nine months ended April 30, 2021 due mainly to the $9,507 of expired stock options as stated above.
Liquidity and Capital Resources
Liquidity
Our objectives when managing our liquidity and capital structure are to maintain sufficient cash to fund our working capital needs, capital asset development and contractual obligations.
| For the nine months ended |
April 30, 2021 | April 30, 2020 | ||||||
| $ | $ | |||||||
| Operating activities |
(16,838 | ) | (93,631 | ) | ||||
| Financing activities |
(30,142 | ) | (161,556 | ) | ||||
| Investing activities |
(56,155 | ) | (87,168 | ) | ||||
Operating Activities
Net cash used in operating activities for the nine months ended April 30, 2021 decreased to $16,838 from $93,631 in the comparative period as a result following:
| • | A reduction to the nine months ended net loss of $332,166; |
| • | Net revenue increase of $31,370; |
| • | The changes to items not affecting cash were $24,102 (April 30, 2020 – $343,929) and are composed primarily of; |
| • | Impairment’s losses of property, plant and equipment were $881 (April 30, 2020 – $251,070 of impairments and write offs of property, plant and equipment, goodwill, intangibles and inventory); |
| • | Share-based compensation add back reduced to $1,543 (April 30, 2020 –$22,237); |
| • | Changes to non-cash working capital of $4,804 (April 30, 2020 – ($59,650) composed of; |
| • | Net increase of inventories and biological assets carried of $2,803 (April 30, 2020 – ($65,075); |
| • | Decrease in commodity taxes and other receivable collection of $5,648 (April 30, 2020 – ($1,479); and |
| • | Decrease in cash collection of accounts receivable by $347 (April 30, 2020 – collected cash of $2,873). |
Financing Activities
Net cash used in financing activities for the nine months ended April 30, 2021 was $30,142, contrarily $161,556 of net cash was generated in the comparative period due to the following transactions:
| • | Cash generated from the exercise of options and warrants was $5,677 (April 30, 2020 – $206); |
| • | Term loan payments of principal and interest amounted to $30,625 (April 30, 2020 – $2,625); |
| • | Interest in the current period on the convertible debentures issued midway through the third quarter of fiscal 2021 was $2,409 (April 30, 2020 – $1,804); |
| • | Lease payments and the respective interest payments were $3,476 (April 30, 2020 – $3,196); and |
Investing Activities
Cash used for investing activities in the nine months ended April 30, 2021 was $56,155, a decrease from cash outflows of $87,168 in the comparative period. The reduction in cash outflows was due of the following:
| • | A deposit of $24,290 was made to fund the Company’s captive insurance (April 30, 2020 – $4,967); |
| • | There was no liquidation of short-term investments in the current fiscal year (April 30, 2020 – $24,726); |
| • | Acquired of property, plant and equipment for continuing capital projects was $8,045 (April 30, 2020 – $95,998); and |
| • | Capital calls were made to the Company’s joint ventures and investments in associates of were $2,975 (April 30, 2020 – $29,220). |
| • | Convertible debenture receivable amounted to ($19,500) (April 30,2020- $nil). |
Offsetting the reduction was the $24,290 deposit made to fund the Company’s directors and officer’s captive insurance program (April 30, 2020 – $4,967).
Capital Resources
As at April 30, 2021, working capital totaled $181,929. The exercise of all the in-the-money warrants and vested stock options of the Company issued and outstanding as of April 30, 2021, using the closing market price of the common shares on the TSX of $8.23 (as at April 30, 2021, the final trading day of the period), would result in an increase of cash of approximately $2,480 and $99,377, respectively.
31 MD&A
The Company is continuously assessing its capital and operational expenditures to streamline the business and cut down operational losses each period on the path to generating earnings per share. The Company has begun raising capital subsequent to April 30, 2021 through the launch of an At-the-Market Offering to generate funds up to $150,000 and closed an offering of senior secured convertible notes with a purchase price of USD$327,600 (see section “Other Corporate Highlights—Subsequent Events’). The Company notes that 70% of the proceeds obtained from the convertible notes are to be held in escrow for primary purposes of closing the proposed Redecan acquisition. See Other Highlights section ‘Subsequent to April 30, 2021’ for financing details and estimated use of proceeds.
The following table provides information about the Company’s remaining funds from recent public offering and private placement and the actual use of proceeds from those financings compared to the intended use of proceeds from the offerings. The remaining cash related to financings raised for general corporate and working capital needs are prorated based timing of funds raised and the current periods cash flow.
| Date | Type | Gross Proceeds |
Initially Intended Use of Net Proceeds | Actual Use of Proceeds | ||||
| May 21, 2020 | Underwritten public offering
(see below) |
$57,545 | The net proceeds generated from the financing amounted to $54,493.
The Company expects to use the net proceeds from the Offering for working capital and other general corporate purposes. |
The Company has remained compliant with its stated intended use as at April 30, 2021 and management has not undertaken new direction over the intended use of these funds as at the reporting date.
Due to the timing of the financing the Company utilizing raised funds for general purposes on a first in, first out basis, there is an estimated $26,872 remaining at period end. | ||||
| July 16, 2020 to July 31, 2020 | At-the-market public offering
(see below) |
$34,551 | The net proceeds generated from the financing amounted to $33,236.
The Company expects to use the net proceeds from the ATM Program for general corporate purposes, which may include: (i) working capital; (ii) capital expenditures; and (iii) debt repayments. |
The Company has remained compliant with its stated intended use as at April 30, 2021 and management has not undertaken new direction over the intended use of these funds as at the reporting date.
The Company repaid its outstanding credit facility in full on April 30, 2021. Debt repayments on the Company’s credit facility were $30,625 in the three months ended April 30, 2021 as well as $56 in associated closing fees which were applied against the financing proceeds.
Due to the timing of the financing the Company utilizing raised funds for general purposes on a first in, first out basis, there is an estimated $832 remaining at period end. |
May 2020 Underwritten Public Offering
On May 21, 2020 the Company closed an underwritten public offering for total gross proceeds or $57,545 through the issuance of 63,940,000 units at a price of $0.90 per unit. Each unit contained one common share and one common share purchase warrant (Note 22). Total issuance costs amounted to $3,065.
June 2020 ATM Offering
On June 16, 2020, the Company established the ATM program allowing the Company to issue up to $34,500 (or its U.S. dollar equivalent) of common shares to the public. The common shares sold through the ATM program were to be sold through the TSX, the NYSE and other marketplaces on which the common shares were listed, quoted or otherwise traded, at the prevailing market price at the time of sale. The program closed on July 31, 2020 and a total of approximately $34,551 (after foreign exchange gains were applied) was generated through the issuance of 32,942,479 common shares in the year ended July 31, 2020. On July 31, 2020 a receivable of $883 remained for irrevocable sales which occurred prior to year-end and subsequently settled on August 5, 2020, at which time the remaining 979,500 shares were issued. Total issuance costs and broker fees amounted to $1,267.
Capitalization Table
Our authorized share capital is comprised of an unlimited number of common shares. On December 17, 2020, the Company completed the Share Consolidation, as a result of which the Company’s issued and outstanding common shares were reduced from 488,650,748 to approximately 122,162,687 (disregarding the treatment of any resulting fractional shares) and the exercise or conversion price and the number of common shares issuable under the Company’s outstanding common share purchase warrants, convertible debentures,
32 MD&A
stock options and other securities exercisable for or convertible into common shares were proportionately adjusted to reflect the Share Consolidation in accordance with the respective terms thereof.
The capitalization information in the table below presents the balances of issued and outstanding common shares and other convertible securities as at the Company’s last fiscal year end of July 31, 2020, and the interim period ended April 30, 2021 and the date of this MD&A June 14, 2021, after adjusting for the Share Consolidation.
| June 14, 2021 | April 30, 2021 | July 31, 2020 | ||||||||||
| Common shares |
149,967,105 | 122,465,538 | 120,616,437 | |||||||||
| Warrants |
36,839,273 | 31,760,146 | 33,379,408 | |||||||||
| Options |
9,276,007 | 8,456,820 | 7,503,690 | |||||||||
| Restricted share units |
731,860 | 533,985 | 587,108 | |||||||||
| Convertible debentures |
3,228,051 | 3,175,633 | 3,175,633 | |||||||||
|
|
|
|
|
|
|
|||||||
| Total |
200,042,296 | 166,392,122 | 165,262,276 | |||||||||
|
|
|
|
|
|
|
|||||||
Upon the closing of the Zenabis acquisition the Company acquired and reissued 17,579,336 common shares. The Company replaced and reissued 905,879 of previous Zenabis incentive securities and 5,970,370 of Zenabis warrants.
The following table summarizes the Company’s stock options outstanding as at April 30, 2021.
| Number outstanding | Weighted average remaining life (years) |
Number exercisable | Weighted average remaining life (years) |
|||||||||||||
| $2.32–$10.76 | 4,566,444 | 8.86 | 943,941 | 6.78 | ||||||||||||
| $15.56–$26.16 | 1,664,895 | 8.00 | 1,051,887 | 7.78 | ||||||||||||
| $28.52–$34.00 | 2,220,732 | 7.65 | 1,205,879 | 7.53 | ||||||||||||
| $47.36–$66.96 | 4,749 | 0.41 | 4,749 | 0.41 | ||||||||||||
|
|
|
|
|
|||||||||||||
| 8,456,820 | 3,206,456 | |||||||||||||||
|
|
|
|
|
|||||||||||||
The following table summarizes RSU activity during the nine months ended April 30, 2021 and the year ended July 31, 2020.
| April 30, 2021 | July 31, 2020 | |||||||||||||||
| Value of units on | Value of units on | |||||||||||||||
| Units | grant date | Units | grant date | |||||||||||||
| Opening balance |
587,108 | $ | 8.41 | — | $ | — | ||||||||||
| Granted |
7,161 | 3.16 | 609,636 | 8.52 | ||||||||||||
| Exercised |
(25,483 | ) | 8.60 | — | — | |||||||||||
| Forfeited |
(34,801 | ) | 11.76 | (22,528 | ) | 11.76 | ||||||||||
|
|
|
|
|
|
|
|
|
|||||||||
| Closing balance |
533,985 | $ | 7.96 | 587,108 | $ | 8.41 | ||||||||||
|
|
|
|
|
|
|
|
|
|||||||||
As at April 30, 2021, 71,338 RSU’s are vested and outstanding.
The following table summarizes warrant activity during the nine months ended April 30, 2021 and year ended July 31, 2020.
| April 30, 2021 | July 31, 2020 | |||||||||||||||
| Number of | Weighted average | Number of | Weighted average | |||||||||||||
| warrants | exercise price1 | warrants | exercise price1 | |||||||||||||
| Outstanding, beginning of year |
33,379,408 | $ | 7.60 | 7,396,359 | $ | 39.80 | ||||||||||
| Expired |
(97,123 | ) | 3.92 | (3,889,871 | ) | 49.00 | ||||||||||
| Issued |
— | — | 30,976,389 | 4.96 | ||||||||||||
| Exercised |
(1,522,139 | ) | 3.85 | (1,103,469 | ) | 3.88 | ||||||||||
|
|
|
|
|
|
|
|
|
|||||||||
| Outstanding, end of year |
31,760,146 | $ | 7.66 | 33,379,408 | $ | 7.60 | ||||||||||
|
|
|
|
|
|
|
|
|
|||||||||
| 1 | USD denominated warrant’s exercise price have been converted to the CAD equivalent as at the period end for presentation purposes |
Off-Balance Sheet Arrangements and Contractual Obligations
The Company does not have any off-balance sheet arrangements.
On February 14, 2019, the Company entered into a syndicated credit facility with Canadian Imperial Bank of Commerce (“CIBC”) as Sole Bookrunner, Co-Lead Arranger and Administrative Agent and Bank of Montreal as Co-Lead Arranger and Syndication Agent (together “the Lenders”). The Lenders provided the Company with up to $65,000 in secured debt financing at a rate of interest that is expected to average in the mid-to-high 5% per annum range. The credit facility consisted of an up to $50,000 term loan (“Term Loan”) and up to a $15,000 in a revolving credit facility which is limited to the Company’s working capital assets available to support funded balances. The credit facility had a maturity date of February 14, 2022 and was secured against the Company’s property, plant and equipment. The Company was to repay at minimum 2.5% of the initial amount drawn each quarter per the terms of the credit facility agreement. On February 14, 2019, the Company received $35,000 on the Term Loan and incurred financing costs of $1,347.
33 MD&A
Under the terms of the credit facility the Company was able to repay the loan without penalty, at any time and did so, in full, on April 30, 2021.
On July 31, 2020 the Company was not in compliance with an administrative banking covenant which mandated that the Company does not utilize a Canadian dollar operating bank account with any institution other than the Lenders. The Company was subject to the covenant 90 days after entering the syndicated credit facility on February 14, 2019. The Company received an amendment on October 29, 2020 allowing it to rectify this administrative breach by April 27, 2021. Due to the amendment being received after July 31, 2020 and within the three months ended October 31, 2020 the Company classified its Term Loan as a current liability on July 31, 2020. On April 30, 2021, the Company repaid the credit facility in full and therefore is not longer subject the credit facilities financial or administrative covenants.
Commitments
The Company has certain contractual financial obligations related to service agreements, purchase agreements, rental agreements and construction contracts. These contracts have optional renewal terms that we may exercise at our option. The annual minimum payments payable under these contracts over the next five years are as follows:
| Year ended July 31, |
2021 | 2022 – 2023 | 2024 – 2025 | Thereafter | Total | |||||||||||||||
| $ | $ | $ | $ | $ | ||||||||||||||||
| Accounts payable and accrued liabilities |
42,968 | — | — | — | 42,968 | |||||||||||||||
| Excise taxes payable |
4,315 | — | — | — | 4,315 | |||||||||||||||
| Onerous contract |
4,783 | — | — | — | 4,783 | |||||||||||||||
| Convertible debentures |
— | 31,951 | — | — | 31,951 | |||||||||||||||
| Lease obligations |
1,143 | 9,186 | 8,749 | 31,082 | 50,160 | |||||||||||||||
| Capital projects (1) |
1,383 | 45 | — | — | 1,428 | |||||||||||||||
| Service contracts |
2,198 | 1,789 | 204 | — | 4,191 | |||||||||||||||
| Lease based operating expenses (2) |
891 | 6,894 | 5,756 | 19,274 | 32,815 | |||||||||||||||
|
|
|
|
|
|
|
|
|
|
|
|||||||||||
| 57,681 | 49,865 | 14,709 | 50,356 | 172,611 | ||||||||||||||||
|
|
|
|
|
|
|
|
|
|
|
|||||||||||
| (1) | Note the Company presents in commitments on capital projects on the basis of committed amounts to enacted purchase orders and therefore, inherently there may be differences between committed capital and approved budgets for capital projects. Refer ‘HEXO GROUP OF FACILITIES” for a general summary of these projects and their respective remaining approved capital budgets. |
| (2) | Lease based operating expense represent the variable operating expenses associated with the lease obligation under IFRS 16, Under IFRS all amounts charged that have no minimum fixed charge are considered variable and not capitalized. |
LITIGATION
Class Actions
As of April 30, 2021, the Company is named as a defendant in securities class actions that have been filed in the superior court of the province of Quebec and in the Supreme Court of the State of New York. One or more of the Company’s current and/or former officers and directors, and/or certain underwriters of past public offerings by the Company, are also named as defendants in certain of the actions. The lawsuits assert causes of action under Canadian and U.S. securities legislation in connection with statements made by the defendants that are alleged to have been materially false and/or misleading statements and their alleged failure to disclose material adverse facts. The alleged misrepresentations relate to, among other things, the Company’s forward-looking information, including but not limited to the Company’s forecast revenues for Q4 2019 and fiscal 2020, its inventory, “channel stuffing” and the Company’s supply agreement with the Province of Quebec. As at the date hereof, the amounts claimed for damages in each of these actions have not been quantified. These actions are in a preliminary stage and have not yet been certified as class actions. In November 2020, the Superior Court of Justice of Ontario ordered the discontinuance of two putative securities class actions commenced in Ontario relating to the same matters on a without costs basis. On March 9, 2021, the United States District Court for the Southern District of New York dismissed the U.S. federal securities class action pending against the company relating to the same matters on a without costs basis, with the dismissal not having been appealed from.
As of April 30, 2021, the Company was named as a defendant in a proposed consumer protection class action filed on June 18, 2020 in the Court of Queens’ Bench in Alberta on behalf of residents of Canada who purchased cannabis products over specified periods of time. Several other licensed producers are also named as co-defendants in the action. The lawsuit asserts causes of action, including for breach of contract and breach of consumer protection legislation, arising out of allegations that the Tetrahydrocannabinol (THC) or Cannabidiol (CBD) content of medicinal and recreational cannabis products sold by the Company and the other defendants to consumers was different from what was advertised on the products’ labels. Many of the cannabis products sold by the Company and other defendants were allegedly sold to consumers in containers using plastic bottles or caps that may have rapidly absorbed or degraded the THC or CBD content within them. By allegedly over-representing the true amount of THC or CBD in the products, the plaintiff claims that consumers would be required to consume substantially more product than they otherwise would have in order to obtain the desired effects or, in the alternative, would have consumed the product without obtaining the desired effects. The action has not yet been certified as a class action.
34 MD&A
MediPharm
On January 24, 2020, the Company was served with a statement of claim commenced by a vendor in respect of a supply agreement that was purportedly entered into between UP Cannabis and the vendor prior to the Company’s acquisition of Newstrike on May 24, 2019. The statement of claim filed against the Company is seeking payment of invoices alleged to be owing. In response, the Company filed a statement of defence and counterclaim on February 26, 2020. The supply agreement purports to contemplate that the Company would purchase certain cannabis products until February 2020. The Company intends to vigorously defend itself against such claim and intends to actively advance its counterclaim which alleges, among other things, that the supply agreement is void as it was entered into in bad faith.
Proposed Transactions
The 48North Acquisition and the Redecan Acquisition (the “Acquisitions”) would be subject to the normal commercial risks that an acquisition will not close on the terms negotiated or at all. The closing of the Acquisitions will be subject to the fulfillment or waiver of conditions, including the receipt of approval of the Company’s shareholders, approval under the Competition Act (Canada), the approval of the TSX and the NYSE, and certain other customary closing conditions disclosed herein. The failure to have such closing conditions satisfied or, if applicable, waived, would prevent the Company from completing the Acquisitions. There is no assurance that such closing conditions would be satisfied or waived. If the Redecan Acquisition does not close, the escrowed funds from the sale of the Notes will be released to the purchaser of the Notes and the Company will be obligated to pay to the purchaser of the Notes a corresponding portion of the principal amount of the Notes in an amount equal to the funds released divided by 105%.
The Acquisitions may not be completed or may not be completed on the terms currently anticipated, as a result of a number of factors, including the failure of the parties to satisfy one or more of the conditions to closing. There can be no assurance the conditions to closing will be satisfied or waived, or that other events will not intervene to delay or result in the failure to close the Acquisitions. Delays in closing the Acquisitions or the failure to close the Acquisitions may result in the Company incurring additional costs in connection with such delay, termination of the 48North Arrangement Agreement and the Share Purchase Agreement and/or the failure to achieve the anticipated benefits of the Acquisitions. Any delay in closing or a failure to close the Acquisitions could also have a negative impact on the Company’s business and the trading price of the Common Shares. For instance, the Company could experience negative reactions from the financial markets, which could cause a decrease in the market price of the Common Shares, particularly if the market price reflects market assumptions that the Acquisitions will be completed or completed on certain terms. There could also be negative impact on the Company’s ability to attract future acquisition opportunities.
The business and operations of 48North and Redecan are outside HEXO’s control until completion of the Acquisitions. Although the 48North Arrangement Agreement and the Share Purchase Agreement contain certain covenants on the part of 48North and Redecan regarding the operation of their business prior to closing the Acquisitions, the Company will not control 48North nor Redecan until the completion of the Acquisitions, and 48North’s and Redecan’s business and results of operations may be adversely affected by events that are outside of the Company’s control during the interim period.
The historic and current performance of 48North’s and Redecan’s business and operations may not be indicative of their success in future periods, and the future performance of 48North’s and Redecan’s business may be influenced by, among other factors, general economic conditions, unfavorable regulatory decisions, litigation, the occurrence or discovery of new liabilities and other factors beyond our and 48North’s and Redecan’s control. As a result of any one or more of these factors, among others, the operations and financial performance of 48North and Redecan may be negatively affected, which may adversely affect the future financial results of 48North, Redecan, and the Company as a combined entity.
There can be no assurance that HEXO will be able to successfully integrate 48North and Redecan with its business or otherwise realize the expected benefits of the Acquisitions. Achieving the potential benefits of the acquisition of 48North and Redecan will depend in part on HEXO’s ability to successfully integrate the functions, operations, information technology and accounting systems and personnel of 48North and Redecan in a timely and efficient manner, as well as on HEXO’s ability to realize the anticipated growth opportunities and synergies, efficiencies and cost savings from integrating 48North and Redecan with its business following completion of the Acquisitions.
Although the completion of the Acquisitions is not currently expected to have a material impact on HEXO’s revenue or expenses in 2021, the Company has incurred, and expects to continue to incur, a number of costs associated with the completion of the Acquisitions, the integration of 48North and Redecan into the Company’s operations and achieving the desired synergies. HEXO will incur transaction fees and costs related to formulating and implementing integration plans, including facilities and systems consolidation costs and employment-related costs. Other non-recurrent transaction costs related to the Acquisitions include, but are not limited to, fees paid to legal, financial and accounting advisors, as well as other related costs. HEXO continues to assess the magnitude of these costs, and additional unanticipated costs may be incurred in the acquisition and integration of the three companies’ businesses. In addition, even if successfully integrated, 48North’s and Redecan’s business may prove costly to operate and result in unexpected expenses and inefficiencies. Although HEXO expects that the elimination of duplicative costs, as well as the realization of other efficiencies related to the integration of the businesses, should allow it to offset integration-related costs over time, this net benefit may not be achieved in the near term, or at all.
35 MD&A
Financial Risk Management
We are exposed to risks of varying degrees of significance which could affect our ability to achieve our strategic objectives for growth. The main objectives of our risk management process are to ensure that risks are properly identified and that the capital base is adequate in relation to these risks. The principal financial risks to which we are exposed are described below.
Market Risk
Interest Risk
The Company has minimal exposure to interest rate risk related to any investments of cash and cash equivalents. The Company may invest cash in highly liquid investments with short terms to maturity that would accumulate interest at prevailing rates for such investments. As at April 30, 2021, the Company had no term loans (July 31, 2020 – $29,930) (Note 16).
Price Risk
Price risk is the risk of variability in fair value due to movements in equity or market prices. The Company’s level 1 and 2 investments are susceptible to price risk arising from uncertainties about their future outlook, future values and the impact of market conditions. The fair value of marketable securities and derivatives held in publicly traded entities is based on quoted market prices, which the shares of the investments can be exchanged for. The Company elected an early conversion option in the year ended July 31, 2020 in which $29,860 of the aggregate principal amount of its 8% unsecured convertible debentures (Note 14) were converted, which partially mitigates the Company’s Price Risk.
There would be no material impact (July 31, 2020 – no material impact) if the fair value of these financial assets were to increase or decrease by 10% as of April 30, 2021. The price risk exposure as at January 31, 2021 and July 31, 2020 is presented in the table below.
| April 30, 2021 | July 31, 2020 | |||||||
| $ | $ | |||||||
| Financial assets |
4,402 | 2,692 | ||||||
| Financial liabilities |
(13,037 | ) | (3,450 | ) | ||||
|
|
|
|
|
|||||
| Total exposure |
(8,635 | ) | (758 | ) | ||||
|
|
|
|
|
|||||
Credit Risk
Credit risk is the risk of financial loss to the Company if a customer or counterparty to a financial instrument fails to meet its contractual obligations and arises principally from the Company’s trade receivables and convertible debentures receivable. As at April 30, 2021, the Company was exposed to credit related losses in the event of non-performance by the counterparties.
The Company provides credit to its customers in the normal course of business and has established credit evaluation and monitoring processes to mitigate credit risk. Since the majority of the medical sales are transacted with clients that are covered under various insurance programs, and adult use sales are transacted with crown corporations, the Company has limited credit risk.
Cash and cash equivalents, certain restricted funds and short-term investments are held with four Canadian commercial banks that hold Dun and Bradstreet credit ratings of AA (July 31, 2020 – AA) and $111 is held with a credit union that does not have a publicly available credit rating. Certain restricted funds in the amount of $30,000 are managed by an insurer and are held as a cell captive within a Bermuda based private institution which does not have a publicly available credit rating, however the utilized custodian is Citibank which holds a credit rating of A+. The majority of the trade receivables balance is held with crown corporations of Quebec, Ontario and Alberta. Creditworthiness of a counterparty is evaluated prior to the granting of credit. The Company has estimated the expected credit loss using a lifetime credit loss approach. The current expected credit loss for the nine months ended April 30, 2021 is $36 (July 31, 2020—$35).
In measuring the expected credit losses, the adult-use cannabis trade receivables have been assessed on a per customer basis as they consist of a low number of material contracts. Medical trade receivables have been assessed collectively as they have similar credit risk characteristics. They have been grouped based on the days past due.
Credit risk from the convertible debenture receivable arises from the possibility that principal and/or interest due may become uncollectible. The Company mitigates this risk by managing and monitoring the underlying business relationship.
The carrying amount of cash and cash equivalents, restricted cash and trade receivables represents the maximum exposure to credit risk and as at April 30, 2021; this amounted to $132,638 (July 31, 2020 – $211,860).
The following table summarizes the Company’s aging of trade receivables as at April 30, 2021 and July 31, 2020:
36 MD&A
| April 30, 2021 | July 31, 2020 | |||||||
| $ | $ | |||||||
| 0–30 days |
14,830 | 15,253 | ||||||
| 31–60 days |
2,407 | 2,972 | ||||||
| 61–90 days |
375 | 412 | ||||||
| Over 90 days |
1,437 | 789 | ||||||
|
|
|
|
|
|||||
| Total |
19,049 | 19,426 | ||||||
|
|
|
|
|
|||||
Economic Dependence Risk
Economic dependence risk is the risk of reliance upon a select number of customers, which significantly impacts the financial performance of the Company. For the three months ended April 30, 2021, the Company’s recorded sales to the crown corporations; Société québécoise du cannabis (“SQDC”) the Ontario Cannabis Store (“OCS”) and the Alberta Gaming, Liquor and Cannabis agency (“ALGC”) representing 44%, 26% and 15%, respectively (April 30, 2020 – one crown corporation representing 83%) of total applicable periods gross cannabis sales.
For the nine months ended April 30, 2021, the Company’s recorded sales to the crown corporations; Société québécoise du cannabis (“SQDC”), the Alberta Gaming Liquor and Cannabis agency (“ALGC”) and the Ontario Cannabis Store (“OCS”), representing 50%, 20% and 17%, respectively (April 30, 2020 – one crown corporation representing 75%) of total applicable periods gross cannabis sales.
The Company holds trade receivables from the crown corporations SQDC, OCS and the AGLC representing 30%, 35% and 14%, respectively, of total trade receivable, respectively as at April 30, 2021 (July 31, 2020 – the two crown corps SQDC and OCS representing 47% and 25% of total trade receivables, respectively).
Liquidity Risk
Liquidity risk is the risk that the Company will not be able to meet its financial obligations as they come due. The Company manages its liquidity risk by reviewing on an ongoing basis its capital requirements. As at April 30, 2021, the Company had $81,038 (July 31, 2020 – $184,173) of cash and cash equivalents and $19,049 (July 31, 2020 – $19,426) in trade receivables.
The Company has current liabilities of $69,742 and contractual commitments of $4,273 due before July 31, 2022. The Company’s existing cash and cash equivalents and trade receivables are expected to provide sufficient liquidity to meet cash outflow requirements over the next twelve months.
The Company’s success in executing on its longer-term strategy is dependent upon its ability to fund the repayment of existing borrowings and to generate positive cash flows from operations. If additional liquidity is required, management plans to secure the necessary financing through the issuance of new public or private equity or debt instruments. There is no assurance that additional future funding will be available to the Company, or that it will be available on terms which are acceptable to management.
The carrying values of cash and cash equivalents, trade receivables and accounts payable and accrued liabilities approximate their fair values due to their short-term to maturity.
Foreign Currency Risk
On April 30, 2021, the Company holds certain financial assets and liabilities denominated in United States Dollars (“USD”) which consist of cash and cash equivalents, and warrant liabilities. The Company does not currently use foreign exchange contracts to hedge its exposure of its foreign currency cash flows as management has determined that this risk is not significant. The Company closely monitors relevant economic information to minimize its net exposure to foreign currency risk. The Company is exposed to unrealized foreign exchange risk through its cash and cash equivalents. As at April 30, 2021, approximately $36,228 USD ($29,492) (July 31, 2020 – $42,981 USD ($57,652)) of the Company’s cash and cash equivalents was in USD. A 1% change in the foreign exchange rate would result in a change of $356 to the unrealized gain or loss on foreign exchange or on the gain or loss on financial instrument revaluation of USD denominated warrants.
Critical Accounting Assumptions
Our financial statements are prepared in accordance with IFRS. Management makes estimates and assumptions and uses judgment in applying these accounting policies and reporting the amounts of assets and liabilities, revenue and expenses, and the related disclosure of contingent assets and liabilities. Significant estimates in the accompanying financial statements relate to the valuation of biological assets and inventory, stock-based compensation, warrants, the estimated useful lives of property, plant and equipment, and intangible assets. Actual results could differ from these estimates. Our critical accounting assumptions are presented in Note 3 of the Company’s amended and restated annual audited consolidated financial statements for the fiscal year ended July 31, 2020, which is available under HEXO’s profile on SEDAR and EDGAR.
37 MD&A
New & Upcoming Changes in Accounting Standards
New Accounting Policy
CAPTIVE INSURANCE
Insurance coverage for the Company’s directors and officers has been secured through a Captive Cell program (“the Captive Program”). The Captive Program was effected by entering into a participation agreement with registered insurer for the purposes of holding and managing the Company’s coverage funds through a separate cell account (the “Cell Captive”). The Company applies IFRS 10 Consolidated Financial Statements in its assessment of control as it relates to the Cell Captive. The Company’s accounting policy is to consolidate the Cell Captive. Currently the Captive Program funds are held as cash in the Cell Captive with the possibility of reinvestment into short-term investments and/or marketable securities in the future. As the funds cannot be transferred to other parts of the group without providing 6 month notice, the funds are disclosed as Restricted cash. The Company recognizes gains and losses from, interest, foreign exchange activity and/or fair market value adjustments through the Statement of Loss and Comprehensive Loss.
New Accounting Procurement Not Yet Effective
AMENDMENTS TO IAS 37: ONEROUS CONTRACTS AND THE COST OF FULFILLING A CONTRACT
The amendment specifies that the ‘cost of fulfilling’ a contract comprises the ‘costs that relate directly to the contract’. Costs that relate directly to a contract consist of both the incremental costs of fulfilling that contract or an allocation of other costs that relate directly to fulfilling contracts. The amendment is effective for annual periods beginning on or after January 1, 2022 with early application permitted. The Company is currently evaluating the potential impact of these amendments on the Company’s consolidated financial statements.
Related Party Transactions
Key Management Personnel Compensation
Key management personnel are those persons having the authority and responsibility for planning, directing and controlling the Company’s operations, directly or indirectly. The key management personnel of the Company are the members of the executive management team and Board of Directors.
Compensation provided to key management during the period was as follows:
| For the three months ended | For the nine months ended | |||||||||||||||
| April 30, 2021 | April 30, 2020 | April 30, 2021 | April 30, 2020 | |||||||||||||
| $ | $ | $ | $ | |||||||||||||
| Salary and/or consulting fees |
764 | 715 | 1,846 | 2,365 | ||||||||||||
| Termination benefits |
— | 427 | 1,008 | 427 | ||||||||||||
| Bonus compensation |
210 | — | 620 | 42 | ||||||||||||
| Stock-based compensation |
1,454 | 4,302 | 5,709 | 13,894 | ||||||||||||
|
|
|
|
|
|
|
|
|
|||||||||
| Total |
2,428 | 5,444 | 9,183 | 16,728 | ||||||||||||
|
|
|
|
|
|
|
|
|
|||||||||
Related Parties and Transactions
Belleville Complex Inc.
The Company holds a 25% interest in Belleville Complex Inc. (“BCI”) with the related party Olegna Holdings Inc., a company owned and controlled by a director of the Company, holding the remaining 75% in BCI. BCI purchased a configured 2,004,000 sq. ft. facility through a $20,279 loan issued and repaid during the year ended July 31, 2019. The Company will be the anchor tenant for a 15-year, with an option to renew for 15 years and additional space to rent. The Company has also subleased a portion of the space to Truss Limited Partnership (Note 8). Consideration for the 25% interest on the joint venture is deemed $nil. The carrying value of BCI as at April 30, 2021 is $479 (July 31, 2020 - $nil).
The Company leases a space in Belleville from a related party BCI, that supports its manufacturing activities and is based in Belleville, Ontario. Under this lease arrangement, the Company incurred $1,261 and $3,427 in lease and operating expenses during the three and nine months ended April 30, 2021, respectively (April 30, 2020—$1,236 and $5,510). This lease liability is recognized on the Company’s balance sheet under IFRS 16 (Note 15).
Truss LP
The Company owns a 42.5% interest in Truss LP and accounts for the interest as an investment in an associate (Note 8).
The Company subleases section of its Belleville lease to Truss LP this sublease is recognized as a finance lease receivable on the Company’s balance sheet (Note 5). The Company recognizes a recovery on its partnership with Truss LP in Other receivables and Other income.
Under a Temporary Supply and Services Agreement (“TSSA”) with Truss LP, the Company produces and packages cannabis infused beverages in the CIB Facility (located at the Belleville Facility) and in the Gatineau Facility, an markets and sells beverages for the legal
38 MD&A
adult-use markets in Canada, in each case subject to the terms of its regulatory approvals and applicable laws, all for its own account and as a stand-alone division of HEXO. Truss LP applied to be a licensed producer of Cannabis during the period, but until the time where Truss LP obtains all regulatory approval required under the Cannabis Act (Canada), the TSSA will remain in place. Under the TSSA, Truss LP will be an exclusive supplier to the Company of all property and all services required to carry on the business, other than specific services which are required to be provided by HEXO. As a result of this arrangement, there is a receivable from Truss of $1,908 at April 30, 2021 (July 31, 2020 – $3,405). During the three and nine months ended April 30, 2021, the Company purchased $782 and $5,955 (April 30, 2020 – $nil and $nil) of raw materials from Truss LP under the arrangement and received $1,045 (April 30, 2020 – $nil) of Income.
Internal Controls over Financial Reporting
Internal Controls over Financial Reporting
In accordance with National Instrument 52-109 Certification of Disclosure in Issuers’ Annual and Interim Filings (“NI 52-109”) and Rule 13a-15(e) and 15d-15(e) under the Securities Exchange Act of 1934 within the U.S., the establishment and maintenance of Disclosure Controls and Procedures (“DCP”) and Internal Control Over Financial Reporting (“ICFR”) is the responsibility of management. The DCP and ICFR have been designed by management based on the 2013 Internal Control Integrated Framework issued by the Committee of Sponsoring Organizations of the Treadway Commission (“COSO”) to provide reasonable assurance that the Company’s financial reporting is reliable and that its financial statements have been prepared in accordance with International Financial Reporting Standards (“IFRS”).
Irrespective of how well the DCP and ICFR are designed, internal controls have inherent limitations and can only provide reasonable assurance that the controls are meeting the Company’s objectives in providing reliable financial reporting information in accordance with IFRS. These inherent limitations include, but are not limited to, human error and circumvention of controls and as such, there can be no assurance that the controls will prevent or detect all misstatements due to errors or fraud, if any.
The Company maintains a set of disclosure controls and procedures designed to provide reasonable assurance that information required to be publicly disclosed is recorded, processed, summarized and reported on a timely basis. An evaluation of the design of Disclosure Controls was done under the supervision and with the participation of management, including our Chief Executive Officer and Chief Financial Officer. Based upon this evaluation, the material changes to the control environment and the material weaknesses in our internal control over financial reporting as at April 30, 2021, are set forth below. Despite the existence of the material weaknesses described below, the CEO and CFO, together with management, have concluded that the Condensed Interim Consolidated Statements of Financial Position, Condensed Interim Consolidated Statements of Loss and Comprehensive Loss, Condensed Interim Consolidated Statements of Changes in Shareholders’ Equity and Condensed Interim Consolidated Statements of Cash Flows associated with this Management’s Discussion and Analysis, are presented in accordance with IFRS.
Material Changes to the Control Environment
The Company continued to experience issues with the existing Enterprise Resource Planning (“ERP”) system and is currently in the planning phase of a major ERP system ERP optimization initiative. This initiative will provide an integrated system for inventory tracking and valuation from seed to sale. It will also advance the Company’s strategic goal of standardizing and automating business processes and controls across the organization and reducing reliance on complex spreadsheets. This business transformation will specifically address risks within the cannabis industry and is intended to facilitate improved ICFR.
As of July 31, 2020, management concluded that the Company did not have a comprehensive controls governance or Enterprise Risk program established. Multiple deficiencies in the design and functionality of the ERP system were also identified. These material weaknesses were initially identified in the fiscal year ended July 31, 2020. During the period, as part of ongoing remediation activities, the Company;
| • | Continues to onboard critical finance personnel who possess the appropriate degree of knowledge, expertise and training to perform complex financial transactions; |
| • | Created an internal audit function and engaged external consultants to enhance the assessment and monitoring of controls; |
| • | Continues to provide training to key personnel and subject specific training for individuals responsible for complex accounting transactions for both IFRS and ICFR; |
| • | Implemented enhancements to the ERP’s purchasing functionality, including segregation of duties to initiate, authorize and release purchase orders; |
| • | Communicated policies, training and guidance regarding appropriate usage of the ERP; and |
| • | Implemented standardized, documented policies and controls, including assigning control owners who are accountable for maintaining control effectiveness. |
The above initiatives were identified as remediation points within the ERP System Functionality and Control Environment and Risk Assessment material weakness sections. As additional remediation initiatives and design and operating effectiveness evaluations are still underway within these sections, management determined that these material weaknesses remain unremedied for the period ending April 30, 2021. Remediation initiatives for all remaining material weaknesses are similarly underway, and
39 MD&A
management will determine whether these items have been remediated and are operating effectively throughout the entire fiscal period.
Identified Material Weaknesses and Remediation Plan
A material weakness in internal control over financial reporting is a deficiency, or a combination of deficiencies, in internal control over financial reporting, such that there is a reasonable possibility that a material misstatement of a company’s annual or interim financial statements will not be prevented or detected on a timely basis by the company’s internal controls.
Management has performed a detailed risk assessment to identify key accounts, business processes and related controls, which was predicated on process flow mapping with control owners. Deficiencies in control processes were then assessed and aligned to the five components of the COSO 2013 internal control framework.
As of the nine months ended April 30, 2021, the Company continued remediation activities for the material weaknesses identified during fiscal 2020 that are described below. Based on this evaluation, management concluded that the material weaknesses below continue to exist as of April 30, 2021.
ERP System Functionality
The Company identified multiple deficiencies in the ERP’s design and functionality during the year. Specifically, there is a reasonable possibility that IT dependent control activities relating to inventory management, property, plant and equipment, procurement and journal entry postings would not prevent or detect a material misstatement of the Company’s annual or interim statements on a timely basis.
The Company intends for the ERP to be reimplemented in the next fiscal period and will only place reliance upon the ERP when it has been demonstrated that supporting Information Technology General Controls (ITGCs) have been designed and are operating effectively. To strengthen control functionality of the ERP, management has begun implementing the following initiatives;
| • | Remediation of the design, implementation and effectiveness of ITGCs that support the ERP, particularly those relating to change management; |
| • | Engaging internal and third-party resources to incorporate improved inventory tracking and valuation within the ERP and to minimize reliance on complex spreadsheets; |
| • | Integration of a fixed asset subledger into the ERP, supported by standardized fixed asset impairment and physical verification assessments to confirm the validity of data within the ERP; |
| • | Enhancements to the ERP’s purchasing functionality; including segregation of duties to initiate, authorize and release purchase orders; |
| • | Implementation of an automated journal entry workflow within the ERP; and |
| • | Communication of policies, training and guidance regarding appropriate usage of the ERP. |
Control Environment
The Company did not adequately design or implement a comprehensive governance program for controls and industry-wide pressures precipitated elevated turnover, resulting in an ineffective control environment. As the Company was unable to emphasize adherence to control processes across the organization, this resulted in an increased likelihood of misstatements occurring.
To strengthen the controls surrounding the overall control environment, management has begun implementing the following initiatives;
| • | Consistent cross-functional communication of strategic company objectives, and |
| • | Implementing standardized, documented policies and controls, including assigning control owners who are accountable for maintaining control effectiveness; |
| • | Implementing standardized training, performance management and succession planning |
Risk Assessment
The Company did not design or implement an Enterprise Risk Management Program to identify and analyze risks. As a result, financial reporting processes and internal controls were not, in some instances, appropriately designed to address risks specific to the business.
To strengthen the controls surrounding risk assessment, management has begun implementing the following initiatives;
| • | Design and implementation of an Enterprise Risk Management Program; |
| • | Regular review of control and governance documentation |
The above material weaknesses encompass multiple business processes and increase the possibility that a material misstatement on the consolidated financial statements would not be prevented or detected on a timely basis.
40 MD&A
Information Technology General Controls
While the Company had ITGCs in place, some were assessed as ineffective. Consequently, this resulted in processes such as change management and user access management being deemed ineffective, contributing to issues with ERP functionality as described above.
To strengthen the ITGC environment, management has begun implementing the following initiatives;
| • | Identification, assessment and remediation over the design, implementation and effectiveness of IT related internal controls over financial reporting, and; |
| • | Improving change management and user access management processes |
Complex Spreadsheet Controls
The Company did not implement and maintain effective controls surrounding complex spreadsheets. Controls related to complex spreadsheets did not address all identified material risks associated with manual data entry, review of assumptions and estimates, completeness of data comparative to the ERP, and the accuracy of formulas. Specifically, the complexity of spreadsheets resulted in adjusting entries required to correct significant account balances related to inventory, property, plant and equipment and tax.
To strengthen the controls over the use of complex spreadsheets, management has begun implementing the following initiatives;
| • | Engaging internal and third-party resources to aid in the identification, assessment and remediation over the design and implementation effectiveness of complex spreadsheet internal controls over financial reporting, and; |
| • | Implementation of new financial applications to minimize, where possible, manual reliance and usage of complex spreadsheets in future periods |
Fixed Assets
The Company did not have a fixed assets subledger within its ERP, instead maintains this information within complex spreadsheets. This led to increased risk of error regarding the identification, tracking, classification and disposal of fixed assets.
During the period, the Company formalized the fixed asset policy and process to serve as an enterprise-wide framework to manage and record the authorized purchase, transfer, disposal, and impairment of capital assets in a consistent manner.
To ensure that fixed asset registers are complete, accurate and appropriately valued, management has begun implementing the following initiatives;
| • | Documenting and communicating policies regarding the purchase, transfer and disposal of capital assets; |
| • | Integration of the fixed asset subledger into the ERP, and; |
| • | Implementation of standardized annual fixed asset physical verification procedures |
Financial Reporting
The Company did not maintain effective process level and management review controls over financial reporting processes, reconciliations, the application of IFRS and accounting measurements related to complex transactions. Some journal entries were not subject to consistent review and approval prior to posting. To strengthen the controls surrounding the financial reporting process, management has begun the following initiatives;
| • | Assessment of roles and responsibilities within the finance and accounting function, as well as providing tools, processes and training to functional staff, and; |
| • | Implementation of a cloud-based financial reporting application to automate and control the financial statement close process, in addition to the automation of workflows within the ERP. |
Procurement
The Company did not have effective controls around the authorization of purchases. This material weakness was initially identified in the fiscal year ended July 31, 2019.
During fiscal 2020, the Company introduced a comprehensive Procurement policy, updated the Governance Authority Matrix, provided additional training and guidance regarding adherence to the above. Further, management implemented a Purchase-to-Pay functionality within the ERP system.
Management has determined that this material weakness will be fully remediated once the automated purchasing functionality has been assessed as designed and operating effectively over an adequate financial reporting period.
41 MD&A
Risk Factors
Our overall performance and results of operations are subject to various risks and uncertainties that may materially and adversely affect our business, products, financial condition and operations and may cause actual performance, results and achievements to differ materially from those expressed or implied by forward-looking statements and forward-looking information, including, without limitation, the following factors, some of which, as well as other factors, are discussed in our Annual Information Form dated October 29, 2020 available under our profile on www.sedar.com, which risk factors should be reviewed in detail by all readers:
| • | Our business operations are dependent on our licence under the Cannabis Regulations. These licenses expire on various dates and must be renewed by Health Canada. Failure to comply with the requirements of our licenses or any failure to renew the license would have a material adverse impact on our business, financial condition and operating results. |
| • | Achievement of our business objectives is contingent, in part, upon compliance with regulatory requirements enacted by these governmental authorities and obtaining all regulatory approvals, where necessary, for the production and sale of our products. We cannot predict the time required to secure all appropriate regulatory approvals for our products, or the extent of testing and documentation that may be required by governmental authorities. |
| • | While to the knowledge of our management, the Company is currently in compliance with all laws, regulations and guidelines relating to the marketing, acquisition, manufacture, management, transportation, storage, sale and disposal of cannabis as well as including laws and regulations relating to health and safety, the conduct of operations and the protection of the environment, changes to such laws, regulations and guidelines due to matters beyond our control may cause adverse effects to our operations. |
| • | We operate in a dynamic, rapidly changing environment that involves risks and uncertainties, and as a result, management expectations may not be realized for a number of reasons. |
| • | The volatile Canadian cannabis industry has resulted in several of the Company’s peers to undergo similar rightsizing efforts which could saturate the market with similar assets the Company intends to sell. This could result in further future losses and/or the inability for the Company to liquidate certain of its unneeded assets. |
| • | The continued spread of COVID-19 nationally and globally could also disrupt our cultivation and processing activities, supply chains and sales channels, and result in a reduction in supply of, or demand for, the company’s products as a result of travel restrictions, work refusals by and mandatory accommodations for employees, changing demand by consumers, mass quarantines, confinements, lock-downs or government-imposed closures in Canada or abroad, which could adversely impact materially the company’s business, operations or financial results. |
| • | Since the latter part of February 2020, financial markets have experienced significant volatility in response to the developing COVID-19 pandemic and equity markets in particular have experienced significant declines. The continued spread of COVID-19 nationally and globally may impact the Company’s ability raise sufficient capital. |
| • | We operate within a still young and evolving industry and are exposed to certain risks surrounding the fair value inputs related to the valuation of our biological assets and inventories, which may lead to certain impairments and write-offs. These inputs include but are not limited too market pricings, external and internal demand for cannabis and cannabis products and by-products. |
| • | Reliance on management’s and key persons’ ability to execute on strategy. This exposes us to management’s ability to perform, as well as the risk of management leaving the Company. |
| • | We face intense competition from licensed producers and other companies, some of which may have greater financial resources and more industry, manufacturing and marketing experience than we do. |
| • | The number of licenses granted, and the number of licensed producers ultimately authorized by Health Canada could have an impact on our operations. We expect to face additional competition from new market entrants that are granted licences under the Cannabis Regulations or existing license holders which are not yet active in the industry. |
| • | We may be subject to growth-related risks including capacity constraints and pressure on our internal systems and controls. Our ability to manage growth effectively will require it to continue to implement and improve our operational and financial systems and to expand, train and manage our employee base. |
| • | Conversely, we may be subject to growth decline related risks including reduced capacity needs and inactivity of our internal systems and related assets. Our ability to manage growth volatility effectively will require us to continue to monitor our external industry environment and modify our internal operations accordingly. |
| • | The Company’s credit facility, could expose the Company to risks that its cash flows may become insufficient to satisfy required payments of principal and interest, the risk of increased interest rates as certain of the Company’s borrowings would likely be at variable rates of interest, and enforcement risk in the event of default. |
| • | The credit facility contains covenants that require the Company to maintain certain financial ratios. If the Company does not maintain such ratios, it could have consequences for the availability of credit under the credit facility or result in repayment requirements that the Company may not be able to satisfy. Restrictions and covenants from those facilities may limit the Company’s ability to execute its plans. |
| • | Given the nature of our business, we may from time to time be subject to claims or complaints from investors or others in the normal course of business which could adversely affect the public’s perception of the Company. |
42 MD&A
| • | We are currently a party to certain class action and other lawsuits as discussed elsewhere in this MD&A and we may become party to additional litigation from time to time in the ordinary course of business which could adversely affect our business. |
| • | Failure to adhere to laws and regulations may result in possible sanctions including the revocation or imposition of conditions on licenses to operate our business; the suspension or expulsion from a particular market or jurisdiction or of our key personnel; and the imposition of fines and censures. |
| • | The potential expansion into international operations will result in increased operational, regulatory and other risks. |
| • | There may be a risk of corruption and fraud in any emerging markets in which the Company expands too. |
| • | The Company’s operations in emerging markets to which it expands could pose an increased inflation risk on the business. |
| • | The Company’s ability to successfully identify and make beneficial acquisitions and/or establish joint ventures or investments in associates, as well as successfully integrate these future acquisitions into the Company’s operations. |
| • | The development of our business and operating results may be hindered by applicable restrictions on sales and marketing activities imposed by Health Canada. |
| • | Our activities and resources are currently primarily focused on our facilities on the Gatineau and Belleville campuses, and we will continue to be focused on these campuses for the foreseeable future. Adverse changes or developments affecting these campuses would have a material and adverse effect on our business, financial condition and prospects. |
| • | We expect to derive a significant portion of our future revenues from the legalized adult-use cannabis industry and edible cannabis 2.0 market in Canada, including through our agreements various provincial governing bodies which do not contain purchase commitments or otherwise obligate the purchaser to buy a minimum or fixed volume of products from HEXO. |
| • | We expect to derive a significant portion of our future revenues from the sale of future products of which are still being actively developed and put into production. Failure to adequately meet market demand for edible product in a timely fashion may adversely impact the Company’s profitability. |
| • | The adult-use cannabis industry has encountered and may continue to encounter price compressions, which may adversely impact the Company’s profitability. In addition, such price compressions, as well as, or together with, oversupply of certain types of inventory in the industry, may result in the Company incurring additional impairment losses on inventory in the event the cost of our inventory exceeds its net realizable value. The continuing evolution of these market conditions represent ongoing uncertainties that may affect the Company’s future financial results. |
| • | We have incurred operating losses since commencing operations and may incur losses in the future and may not achieve profitability. |
| • | Our growth strategy contemplates outfitting the Company’s multiple facilities with additional production resources. There is a risk that these additional resources will not be completed on time, on budget, or at all. |
| • | A key aspect of our business is growing cannabis, and as such we are exposed to the risks inherent in any agriculture business, such as disease spread, hazards, pests and similar agricultural risks that may create crop failures and supply interruptions for our customers. |
| • | Our cannabis growing operations consume considerable energy, making us vulnerable to rising energy costs. Volatility of energy costs and the loss of preferred rate status may adversely impact our business and our ability to operate profitably. |
| • | We believe the cannabis industry is highly dependent upon consumer perception regarding the safety, efficacy and quality of the cannabis produced. Consumer perception of our products can be significantly influenced by scientific research or findings, regulatory investigations, litigation, media attention and other publicity regarding the consumption of cannabis products. There can be no assurance that future scientific research, findings, regulatory proceedings, litigation, media attention or other research findings or publicity will be favourable to the cannabis market or any particular product, or consistent with earlier publicity. |
| • | As a manufacturer and distributor of products designed to be ingested or inhaled by humans, we face an inherent risk of exposure to product liability claims, regulatory action and litigation if our products are alleged to have caused significant loss or injury. In addition, the manufacture and sale of our products involve the risk of injury or loss to consumers due to tampering by unauthorized third parties, product contamination, unauthorized use by consumers or other third parties. |
| • | Manufacturers and distributors of products are sometimes subject to the recall or return of their products for a variety of reasons, including product defects, such as contamination, unintended harmful side effects or interactions with other substances, packaging safety and inadequate or inaccurate labelling disclosure. |
| • | Our business is dependent on a number of key inputs and their related costs including raw materials and supplies related to our growing operations, as well as electricity, water and other local utilities. Any significant interruption or negative change in the availability or economics of the supply chain for key inputs could materially impact our business, financial condition and operating results. |
| • | Conflicts of interest may arise between the Company and its directors. |
| • | We may not pay any dividends on our common shares in the foreseeable future. |
43 MD&A
| • | The Company may be at risk as a result of breaches of security at its facilities or in respect of electronic documents, data storage and risks related to breaches of applicable privacy laws, cyber security risks, loss of information and computer systems. |
| • | Our common shares are listed on the TSX and NYSE; however, there can be no assurance that an active and liquid market for the common shares will be maintained, and an investor may find it difficult to resell such shares. |
| • | There is no assurance the Company will continue to meet the listing requirements of the TSX and/or NYSE. |
| • | The Company is subject to restrictions from the TSX and NYSE which may constrain the Company’s ability to expand its business internationally. |
| • | The market price for our common shares may be volatile and subject to wide fluctuations in response to numerous factors, including governmental and regulatory regimes, community support for the cannabis industry, variations in our operating results, changes in our business prospects, as well as many other factors that are beyond our control. The Company must rely largely on its own market research to forecast sales as detailed forecasts are not generally obtainable from other sources at this early stage of the recreational marijuana industry in Canada. |
| • | An investment in our securities is speculative and involves a high degree of risk and uncertainty. |
| • | We may issue additional common shares in the future, which may dilute a shareholder’s holdings in the Company. |
| • | The Company may not be successful in the integration of acquisitions into our business. |
| • | The Company may be unable to successfully achieve the objectives of our strategic alliances. |
| • | The Company’s operations are subject to increased risk as a result of international expansion. |
| • | The Company operates in a highly regulated industry which could discourage any takeover offers. |
| • | We maintain or self-insure various types of insurance such as, but not limited to, errors and omissions insurance; directors’ and officers’ insurance; property coverage; and general commercial insurance, recall insurance, cyber security insurance, warehouseman insurance and cargo insurance. A judgment against any member of the Company in excess of available coverage could have a material adverse effect on us in terms of damages awarded and the impact on our reputation. |
| • | Based upon the nature of the Company’s current business activities, the Company does not believe it is currently an “investment company” (“IC”) under the U.S. Investment Company Act of 1940. However, the tests for determining IC status are based upon the composition of the assets of the Company and its subsidiaries and affiliates from time to time, and it is difficult to make accurate predictions of future assets. Accordingly, there can be no assurance that the Company will not become an IC in the future. A corporation generally will be considered an IC if; more than 40% of the value of its total assets excluding cash and U.S. government securities are comprised of investment securities, which generally include any securities of an entity the corporation does not control. If the Company were to become an IC, it would not be able to conduct public offerings of securities in the U.S. |
| • | Our operations are subject to environmental and safety laws and regulations concerning, among other things, emissions and discharges to water, air and land, the handling and disposal of hazardous and non-hazardous materials and wastes, and employee health and safety. We will incur ongoing costs and obligations related to compliance with environmental and employee health and safety matters. Failure to comply with environmental and safety laws and regulations may result in additional costs for corrective measures, in penalties or in restrictions on our manufacturing operations. |
| • | The Company’s ERP may impact the scoping, requirements definition, business process definition, design and testing of the integrated ERP system could result in problems which could, in turn, result in disruption, delays and errors to the operations and processes within the business and/or inaccurate information for management and financial reporting. |
| • | The Company may not be able to develop and maintain strong internal controls and be SOX compliant by the mandated deadline. |
| • | We are exposed to the risk that our employees, independent contractors and consultants may engage in fraudulent or other illegal activity. Misconduct by these parties could include intentional, reckless and/or negligent conduct or disclosure of unauthorized activities to the Company that violates: (i) government regulations; (ii) manufacturing standards; (iii) federal and provincial healthcare fraud and abuse laws and regulations; or (iv) laws that require the true, complete and accurate reporting of financial information or data. |
| • | The Company is subject to continuous evolving corporate governance, internal controls and disclosure regulations that may increase the risk of non-compliance, which could adversely impact the Company, its market perception and valuation. |
| • | There can be no assurance that the 48North Arrangement Agreement and the Share Purchase Agreement (of Redecan) will be completed, or if completed, that it will be completed on the same or similar terms to those set out in the 48North Arrangement Agreement and the Share Purchase Agreement. The completion of the 48North Arrangement Agreement and the Share Purchase Agreement are subject to the satisfaction of a number of conditions which include, among others, (i) obtaining necessary approvals and (ii) performance by the Company and the 48North and Redecan of their respective obligations and covenants under the 48North Arrangement Agreement and the Share Purchase Agreement in the Arrangement Agreements. In addition, if the Acquisitions are not completed the ongoing business of the Company may be adversely affected as a result of the costs (including opportunity costs) incurred in respect of pursuing the Acquisitions, and the Company could experience negative reactions from the financial markets, which could cause a decrease in the market price of the Company’s securities, particularly if the market price reflects market assumptions that the Arrangements will be completed or completed on certain terms. the Company may also experience negative |
44 MD&A
reactions from its customers and employees and there could be negative impact on the Company’s ability to attract future acquisition opportunities. Failure to complete the Acquisitions or a change in the terms of the 48North Arrangement Agreement and the Share Purchase Agreement could each have a material adverse effect on the Company’s business, financial condition and results of operations.
| • | The pending 48North Arrangement Agreement and the Share Purchase Agreement could cause the attention of the Company’s management to be diverted from the day-to-day operations. These disruptions could be exacerbated by a delay in the completion of the Arrangement Agreements and could have an adverse effect on the business, operating results or prospects of the Company regardless of whether the Arrangement Agreement is ultimately completed. |
| • | The Company expects to incur a number of non-recurring transaction-related costs associated with completing the Acquisitions that will be incurred whether or not the Acquisitions completed. |
45 MD&A
Exhibit 99.3
Form 52-109F2
Certification of Interim Filings
Full Certificate
I, Sébastien St. Louis, Chief Executive Officer of HEXO Corp., certify the following:
| 1. | Review: I have reviewed the interim financial report and interim MD&A (together, the “interim filings”) of HEXO Corp. (the “issuer”) for the interim period ended April 30, 2021. |
| 2. | No misrepresentations: Based on my knowledge, having exercised reasonable diligence, the interim filings do not contain any untrue statement of a material fact or omit to state a material fact required to be stated or that is necessary to make a statement not misleading in light of the circumstances under which it was made, with respect to the period covered by the interim filings. |
| 3. | Fair presentation: Based on my knowledge, having exercised reasonable diligence, the interim financial report together with the other financial information included in the interim filings fairly present in all material respects the financial condition, financial performance and cash flows of the issuer, as of the date of and for the periods presented in the interim filings. |
| 4. | Responsibility: The issuer’s other certifying officer(s) and I are responsible for establishing and maintaining disclosure controls and procedures (DC&P) and internal control over financial reporting (ICFR), as those terms are defined in National Instrument 52-109 Certification of Disclosure in Issuers’ Annual and Interim Filings, for the issuer. |
| 5. | Design: Subject to the limitations, if any, described in paragraphs 5.2 and 5.3, the issuer’s other certifying officer(s) and I have, as at the end of the period covered by the interim filings |
| (a) | designed DC&P, or caused it to be designed under our supervision, to provide reasonable assurance that |
| (i) | material information relating to the issuer is made known to us by others, particularly during the period in which the interim filings are being prepared; and |
| (ii) | information required to be disclosed by the issuer in its annual filings, interim filings or other reports filed or submitted by it under securities legislation is recorded, processed, summarized and reported within the time periods specified in securities legislation; and |
| (b) | designed ICFR, or caused it to be designed under our supervision, to provide reasonable assurance regarding the reliability of financial reporting and the preparation of financial statements for external purposes in accordance with the issuer’s GAAP. |
| 5.1 | Control framework: The control framework the issuer’s other certifying officer(s) and I used to design the issuer’s ICFR is the Internal Control – Integrated Framework (COSO Framework 2013) published by The Committee of Sponsoring Organizations of the Treadway Commission (COSO). |
| 5.2 | ICFR – material weakness relating to design: The issuer has disclosed in its interim MD&A for each material weakness relating to design existing at the end of the interim period |
| (a) | a description of the material weakness; |
1
| (b) | the impact of the material weakness on the issuer’s financial reporting and its ICFR; and |
| (c) | the issuer’s current plans, if any, or any actions already undertaken, for remediating the material weakness. |
| 5.3 | Limitation on scope of design: N/A |
| 6. | Reporting changes in ICFR: The issuer has disclosed in its interim MD&A any change in the issuer’s ICFR that occurred during the period beginning on February 1, 2021 and ended on April 30, 2021 that has materially affected, or is reasonably likely to materially affect, the issuer’s ICFR. |
| Date: June 14, 2021 |
| /s/ Sébastien St-Louis |
| Sébastien St. Louis |
| Chief Executive Officer |
2
Exhibit 99.4
Form 52-109F2
Certification of Interim Filings
Full Certificate
I, Trent MacDonald, Chief Financial Officer of HEXO Corp., certify the following:
| 1. | Review: I have reviewed the interim financial report and interim MD&A (together, the “interim filings”) of HEXO Corp. (the “issuer”) for the interim period ended April 30, 2021. |
| 2. | No misrepresentations: Based on my knowledge, having exercised reasonable diligence, the interim filings do not contain any untrue statement of a material fact or omit to state a material fact required to be stated or that is necessary to make a statement not misleading in light of the circumstances under which it was made, with respect to the period covered by the interim filings. |
| 3. | Fair presentation: Based on my knowledge, having exercised reasonable diligence, the interim financial report together with the other financial information included in the interim filings fairly present in all material respects the financial condition, financial performance and cash flows of the issuer, as of the date of and for the periods presented in the interim filings. |
| 4. | Responsibility: The issuer’s other certifying officer(s) and I are responsible for establishing and maintaining disclosure controls and procedures (DC&P) and internal control over financial reporting (ICFR), as those terms are defined in National Instrument 52-109 Certification of Disclosure in Issuers’ Annual and Interim Filings, for the issuer. |
| 5. | Design: Subject to the limitations, if any, described in paragraphs 5.2 and 5.3, the issuer’s other certifying officer(s) and I have, as at the end of the period covered by the interim filings |
| (a) | designed DC&P, or caused it to be designed under our supervision, to provide reasonable assurance that |
| (i) | material information relating to the issuer is made known to us by others, particularly during the period in which the interim filings are being prepared; and |
| (ii) | information required to be disclosed by the issuer in its annual filings, interim filings or other reports filed or submitted by it under securities legislation is recorded, processed, summarized and reported within the time periods specified in securities legislation; and |
| (b) | designed ICFR, or caused it to be designed under our supervision, to provide reasonable assurance regarding the reliability of financial reporting and the preparation of financial statements for external purposes in accordance with the issuer’s GAAP. |
| 5.1 | Control framework: The control framework the issuer’s other certifying officer(s) and I used to design the issuer’s ICFR is the Internal Control – Integrated Framework (COSO Framework 2013) published by The Committee of Sponsoring Organizations of the Treadway Commission (COSO). |
| 5.2 | ICFR – material weakness relating to design: The issuer has disclosed in its interim MD&A for each material weakness relating to design existing at the end of the interim period |
1
| (a) | a description of the material weakness; |
| (b) | the impact of the material weakness on the issuer’s financial reporting and its ICFR; and |
| (c) | the issuer’s current plans, if any, or any actions already undertaken, for remediating the material weakness. |
| 5.3 | Limitation on scope of design: N/A |
| 6. | Reporting changes in ICFR: The issuer has disclosed in its interim MD&A any change in the issuer’s ICFR that occurred during the period beginning on February 1, 2021 and ended on April 30, 2021 that has materially affected, or is reasonably likely to materially affect, the issuer’s ICFR. |
Date: June 14, 2021
| /s/ Trent MacDonald |
| Trent MacDonald |
| Chief Financial Officer |
2
Serious News for Serious Traders! Try StreetInsider.com Premium Free!
You May Also Be Interested In
- GameChange Solar Secures Over 500 MW of Solar Projects in Southern Africa
- BioInvent International AB: Interim Report January-March 2024
- Invitation to presentation of the interim report January-March 2024 for Truecaller AB (publ)
Create E-mail Alert Related Categories
SEC FilingsSign up for StreetInsider Free!
Receive full access to all new and archived articles, unlimited portfolio tracking, e-mail alerts, custom newswires and RSS feeds - and more!
