

Form 6-K FinVolution Group For: Nov 17
 Tweet
Tweet Share
Share
UNITED STATES
SECURITIES AND EXCHANGE COMMISSION
WASHINGTON, D.C. 20549
FORM 6-K
REPORT OF FOREIGN PRIVATE ISSUER
PURSUANT TO RULE 13a-16 OR 15d-16
UNDER THE SECURITIES EXCHANGE ACT OF 1934
For the month of November 2020
Commission File Number: 001-38269
FinVolution Group
Building G1, No. 999 Dangui Road
Pudong New District, Shanghai 201203
The People’s Republic of China
(Address of principal executive offices)
Indicate by check mark whether the registrant files or will file annual reports under cover of Form 20-F or Form 40-F.
Form 20-F ☒ Form 40-F ☐
Indicate by check mark if the registrant is submitting the Form 6-K in paper as permitted by Regulation S-T Rule 101(b)(1): ☐
Indicate by check mark if the registrant is submitting the Form 6-K in paper as permitted by Regulation S-T Rule 101(b)(7): ☐
SIGNATURES
Pursuant to the requirements of the Securities Exchange Act of 1934, the registrant has duly caused this report to be signed on its behalf by the undersigned, thereunto duly authorized.
| FinVolution Group | ||
| By: | /s/ Simon Tak Leung Ho | |
| Name: | Simon Tak Leung Ho | |
| Title: | Chief Financial Officer | |
Date: November 17, 2020
Exhibit Index
Exhibit 99.1—Press Release
Exhibit 99.1
FinVolution Group Reports Third Quarter 2020 Unaudited Financial Results
SHANGHAI, November 17, 2020 /PRNewswire/ – FinVolution Group (“FinVolution,” or the “Company”) (NYSE: FINV), a leading fintech platform in China, today announced its unaudited financial results for the third quarter ended September 30, 2020.
Third Quarter 2020 Financial and Operational Highlights
| • | Net revenue increased by 12.6% to RMB1,793.3 million (US$264.1 million) for the third quarter of 2020, from RMB1,592.5 million in the same period of 2019. |
| • | Operating profit was RMB689.0 million (US$101.5 million) for the third quarter of 2020, representing an increase of 6.2% from RMB648.9 million in the same period of 2019. |
| • | Non-GAAP adjusted operating profit1, which excludes share-based compensation expenses before tax, was RMB697.6 million (US$102.8 million) for the third quarter of 2020, representing an increase of 6.1% from RMB657.8 million in the same period of 2019. |
| • | Cumulative registered users2 reached approximately 112.8 million as of September 30, 2020. |
| • | Cumulative number of borrowers3 was approximately 18.6 million as of September 30, 2020. |
| • | Number of unique borrowers4 was approximately 1.9 million for the third quarter of 2020. |
| • | Loan origination volume5 was approximately RMB17.0 billion for the third quarter of 2020. |
| • | Repeat borrowing rate6 was 89.7% for the third quarter of 2020, compared to 79.4% in the same period of 2019. |
| • | Average loan size7 was RMB 4,095 for the third quarter of 2020, compared to RMB 3,156 in the same period of 2019. |
| • | Average loan tenure8 was 8.3 months for the third quarter of 2020. |
| 1 | Please refer to “UNAUDITED Reconciliation of GAAP And Non-GAAP Results” for reconciliation between GAAP and Non-GAAP adjusted operating profit. |
| 2 | On a cumulative basis, number of users registered on our platform in Mainland China as of September 30, 2020. |
| 3 | On a cumulative basis, number of borrowers whose loans were funded in Mainland China on or prior to September 30, 2020. |
| 4 | Represents the total number of borrowers in Mainland China whose loans were facilitated on our platform during the period presented. |
| 5 | Represents the loan origination volume facilitated in Mainland China during the period presented. |
| 6 | Represents the percentage of loan volume generated by repeat borrowers in Mainland China who have successfully borrowed on our platform before. |
| 7 | Represents the average loan size on our platform in Mainland China during the period presented. |
| 8 | Represents the average loan tenure period on our platform in Mainland China during the period presented. |
1
Mr. Feng Zhang, the Chief Executive Officer of FinVolution, commented, “We are pleased to report continued progress in our results as we continue our shift to attracting higher quality customers. Our reported operational and financial performance were better-than-expected in the third quarter of 2020, a further testament to the agility and robustness of our core capabilities. As China gradually emerges from the aftermath of COVID-19, our loan business recovery has been gathering momentum. Our loan origination volume in Mainland China for the third quarter reached over RMB17 billion5, representing a 30% increase quarter-over-quarter and exceeding the top end of our previous guidance range.
“Encouragingly, our continual efforts to enhance our technological capabilities and strengthen our risk management have led to significant improvements in delinquency rates across the platform in particular for newly facilitated loans. Due to the shift to better quality customer cohort, our vintage delinquency9 in the most recent quarter is expected to be significantly lower compared to the past several years.
“Our institutional funding partners continue to be supportive with ample funding and ongoing improvement in funding cost. Going forward, we expect further enhancement in funding cost as we continue to deepen our relationships with our partners.
“As part of our ongoing strategy to leverage our technological capabilities to support new initiatives, our international operations gained significant traction. We are excited to report that our loan volume in Indonesia experienced a strong rebound from the depressed levels in the second quarter and is now much higher than pre-COVID-19 levels. We expect this strong momentum to continue moving forward.
“With a long and proven track record in technology innovation, responsive risk management insights and effective measures taken to navigate across credit and economic cycles, we believe our focus on our core strengths and fundamentals, coupled with our strong culture of innovation, sets a solid foundation for our sustainable operation and unlocks the vast potential in the consumer finance markets in China and internationally,” concluded Mr. Zhang.
Mr. Simon Ho, the Chief Financial Officer of FinVolution, commented, “In the third quarter, amid a recovering COVID-19 environment in Mainland China, we delivered non-GAAP operating profit10 of RMB697.6 million representing an increase of 21.1% quarter-over-quarter, and further demonstrating the resilience of our core business model. Our balance sheet and liquidity remain strong with RMB3.4 billion of cash and short-term liquidity. Armed with strong technological capabilities, and a conservative balance sheet, FinVolution is well positioned to capture additional opportunities in the evolving environment.”
| 9 | Represents the historical cumulative 30-day past due delinquency rates by loan origination vintage for all loan products in Mainland China. |
| 10 | Please refer to “UNAUDITED Reconciliation of GAAP and Non-GAAP Results” for reconciliation between GAAP and Non-GAAP adjusted operating profit. |
2
Third Quarter 2020 Financial Results
Net revenue for the third quarter of 2020 increased by 12.6% to RMB1,793.3 million (US$264.1 million) from RMB1,592.5 million in the same period of 2019, primarily due to the adoption of ASC 326. Before the adoption of ASC 326, gains or losses related to quality assurance commitments were recorded in one combined financial statement line item within other income. After the adoption of ASC 326, the guarantee income (i.e. the guarantee liability) was recorded as a separate financial statement line item within revenue and the credit losses for quality assurance were recorded within expenses. The increase in net revenue was partially offset by the decline in loan origination volume and decrease in average rate of transaction fees.
Loan facilitation service fees decreased by 45.6% to RMB486.3 million (US$71.6 million) for the third quarter of 2020 from RMB893.6 million in the same period of 2019, primarily due to the decline in loan origination volume and the decrease in the average rate of transaction fees.
Post-facilitation service fees decreased by 46.3% to RMB161.4 million (US$23.8 million) for the third quarter of 2020 from RMB300.7 million in the same period of 2019, primarily due to the decline in outstanding loans serviced by the Company and the rolling impact of deferred transaction fees.
Guarantee income was RMB747.1 million (US$110.0 million) for the third quarter of 2020 due to the adoption of ASC 326. After the adoption of ASC 326, the guarantee liabilities of quality assurance commitment are released as a revenue systematically over the term of the loans subject to quality assurance commitment.
Net interest income decreased by 24.4% to RMB260.9 million (US$38.4 million) for the third quarter of 2020, from RMB345.0 million in the same period of 2019, primarily due to decreased interest income from the reduction in the outstanding loan balances of consolidated trusts and the decrease in interest rates.
Other revenue increased by 158.6% to RMB137.6 million (US$20.3 million) for the third quarter of 2020 from RMB53.2 million in the same period of 2019, primarily due to increased customer referral fees to other third-party service providers.
Origination and servicing expenses increased by 2.0% to RMB338.9 million (US$49.9 million) for the third quarter of 2020 from RMB332.1 million in the same period of 2019, primarily due to an increase in fees paid to third party service providers.
Sales and marketing expenses decreased by 49.7% to RMB115.3 million (US$17.0 million) for the third quarter of 2020 from RMB229.2 million in the same period of 2019, primarily due to the decrease in online customer acquisition expenses as a result of the decline in newly registered users on the Company’s platform.
General and administrative expenses decreased by 15.5% to RMB105.4 million (US$15.5 million) for the third quarter of 2020 compared to RMB124.8 million in the same period of 2019, due to improved operating efficiency.
Research and development expenses decreased by 14.1% at RMB93.0 million (US$13.7 million) for the third quarter of 2020, compared to RMB108.2 million in the same period of 2019, due to a more streamlined team in technology related departments.
3
Credit losses for quality assurance commitment were RMB326.6 million (US$48.1 million) for the third quarter of 2020 due to the adoption of ASC 326. After the adoption of ASC 326, the expected credit losses of quality assurance commitment will be accounted for in addition to and separately from the guarantee liabilities accounted for under ASC 460.
Provision for loans receivables was RMB90.0 million (US$13.3 million) for the third quarter of 2020, compared with RMB80.1 million in the same period of 2019, primarily due to the adoption of ASC 326, which requires the Company to recognize the life time credit losses upon initial recognition and provisions for new international business.
Provision for accounts receivables and other receivables decreased by 49.3% to RMB35.1 million (US$5.2 million) for the third quarter of 2020, compared with RMB69.2 million in the same period of 2019 as a result of the decline in loan origination volume and improvement in delinquency rates, which was partially offset by provision provided on other receivables.
Operating profit increased by 6.2% to RMB689.0 million (US$101.5 million) for the third quarter of 2020 from RMB648.9 million in the same period of 2019.
Non-GAAP adjusted operating profit, which excludes share-based compensation expenses before tax, was RMB697.6 million (US$102.8 million) for the third quarter of 2020, representing an increase of 6.1% from RMB657.8 million in the same period of 2019.
Other income decreased by 49.5% to RMB26.3 million (US$3.9 million) for the third quarter of 2020, from RMB52.1 million in the same period of 2019. For the third quarter of 2020, other income primarily consisted gains from investments.
Income tax expenses were RMB118.4 million (US$17.4 million) for the third quarter of 2020, compared with RMB130.7 million in the same period of 2019, due to the decline in pre-tax profit and recognition of gain related to quality assurance in a subsidiary with preferential tax status due to tax planning.
Net profit was RMB596.9 million (US$87.9 million) for the third quarter of 2020, compared with RMB598.5 million in the same period of 2019.
Net profit attributable to ordinary shareholders of the Company was RMB602.7 million (US$88.8 million) for the third quarter of 2020, compared with RMB597.9 million in the same period of 2019.
As of September 30, 2020, the Company had cash and cash equivalents of RMB1,107.2 million (US$163.1 million) and short-term investments mainly in wealth management products of RMB2,278.4 million (US$335.6 million).
4
The following table provides the delinquency rates for all outstanding loans on the Company’s platform in Mainland China as of the respective dates indicated.
| As of | 15-29 days | 30-59 days | 60-89 days | 90-119 days | 120-149 days | 150-179 days | ||||||||||||||||||
| September 30, 2017 |
0.89 | % | 1.40 | % | 1.15 | % | 1.02 | % | 0.79 | % | 0.60 | % | ||||||||||||
| December 31, 2017 |
2.27 | % | 2.21 | % | 1.72 | % | 1.63 | % | 1.36 | % | 1.20 | % | ||||||||||||
| March 31, 2018 |
0.87 | % | 2.11 | % | 2.43 | % | 3.83 | % | 2.29 | % | 1.89 | % | ||||||||||||
| June 30, 2018 |
0.83 | % | 1.21 | % | 1.05 | % | 0.98 | % | 1.60 | % | 2.03 | % | ||||||||||||
| September 30, 2018 |
1.03 | % | 1.77 | % | 1.49 | % | 1.29 | % | 1.06 | % | 1.02 | % | ||||||||||||
| December 31, 2018 |
0.92 | % | 1.63 | % | 1.41 | % | 1.45 | % | 1.44 | % | 1.34 | % | ||||||||||||
| March 31, 2019 |
0.80 | % | 1.61 | % | 1.45 | % | 1.29 | % | 1.31 | % | 1.20 | % | ||||||||||||
| June 30, 2019 |
0.86 | % | 1.42 | % | 1.37 | % | 1.19 | % | 1.26 | % | 1.21 | % | ||||||||||||
| September 30, 2019 |
0.90 | % | 1.50 | % | 1.35 | % | 1.31 | % | 1.17 | % | 1.20 | % | ||||||||||||
| December 31, 2019 |
1.34 | % | 2.40 | % | 1.86 | % | 1.76 | % | 1.62 | % | 1.53 | % | ||||||||||||
| March 31, 2020 |
1.34 | % | 3.03 | % | 2.33 | % | 2.44 | % | 2.64 | % | 2.17 | % | ||||||||||||
| June 30, 2020 |
0.71 | % | 1.36 | % | 1.70 | % | 2.00 | % | 2.75 | % | 2.38 | % | ||||||||||||
| September 30,2020 |
0.46 | % | 0.72 | % | 0.74 | % | 0.90 | % | 1.07 | % | 1.43 | % | ||||||||||||
The following chart and table display the historical cumulative 30-day plus past due delinquency rates by loan origination vintage in Mainland China for all loan products facilitated through the Company’s online marketplace as of September 30, 2020:
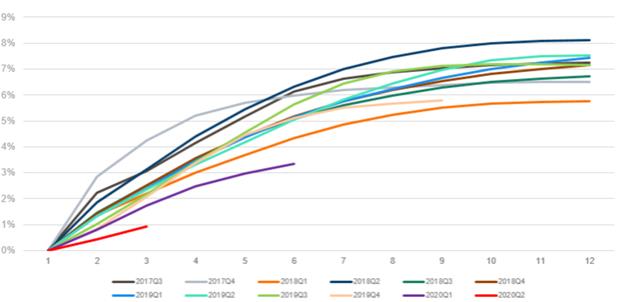
5
| Month on Book | ||||||||||||||||||||||||||||||||||||||||||||
| Vintage |
2nd | 3rd | 4th | 5th | 6th | 7th | 8th | 9th | 10th | 11th | 12th | |||||||||||||||||||||||||||||||||
| 2017Q3 |
2.22 | % | 3.05 | % | 4.13 | % | 5.18 | % | 6.13 | % | 6.64 | % | 6.88 | % | 7.04 | % | 7.16 | % | 7.22 | % | 7.26 | % | ||||||||||||||||||||||
| 2017Q4 |
2.86 | % | 4.24 | % | 5.19 | % | 5.69 | % | 5.98 | % | 6.19 | % | 6.29 | % | 6.39 | % | 6.47 | % | 6.49 | % | 6.50 | % | ||||||||||||||||||||||
| 2018Q1 |
1.37 | % | 2.20 | % | 2.99 | % | 3.67 | % | 4.32 | % | 4.86 | % | 5.23 | % | 5.50 | % | 5.66 | % | 5.74 | % | 5.77 | % | ||||||||||||||||||||||
| 2018Q2 |
1.87 | % | 3.12 | % | 4.39 | % | 5.46 | % | 6.33 | % | 6.99 | % | 7.47 | % | 7.80 | % | 7.99 | % | 8.08 | % | 8.13 | % | ||||||||||||||||||||||
| 2018Q3 |
1.45 | % | 2.51 | % | 3.53 | % | 4.39 | % | 5.09 | % | 5.59 | % | 5.97 | % | 6.28 | % | 6.50 | % | 6.64 | % | 6.72 | % | ||||||||||||||||||||||
| 2018Q4 |
1.43 | % | 2.49 | % | 3.55 | % | 4.42 | % | 5.18 | % | 5.76 | % | 6.20 | % | 6.54 | % | 6.81 | % | 7.01 | % | 7.16 | % | ||||||||||||||||||||||
| 2019Q1 |
1.34 | % | 2.38 | % | 3.45 | % | 4.36 | % | 5.13 | % | 5.75 | % | 6.22 | % | 6.65 | % | 6.99 | % | 7.25 | % | 7.43 | % | ||||||||||||||||||||||
| 2019Q2 |
1.33 | % | 2.34 | % | 3.31 | % | 4.18 | % | 5.05 | % | 5.82 | % | 6.44 | % | 6.98 | % | 7.34 | % | 7.50 | % | 7.52 | % | ||||||||||||||||||||||
| 2019Q3 |
1.02 | % | 2.16 | % | 3.42 | % | 4.55 | % | 5.64 | % | 6.45 | % | 6.92 | % | 7.13 | % | 7.20 | % | 7.20 | % | 7.15 | % | ||||||||||||||||||||||
| 2019Q4 |
0.83 | % | 2.07 | % | 3.37 | % | 4.45 | % | 5.12 | % | 5.50 | % | 5.68 | % | 5.79 | % | ||||||||||||||||||||||||||||
| 2020Q1 |
0.81 | % | 1.73 | % | 2.46 | % | 2.97 | % | 3.35 | % | ||||||||||||||||||||||||||||||||||
| 2020Q2 |
0.44 | % | 0.92 | % | ||||||||||||||||||||||||||||||||||||||||
Changes in Board of Directors and Management
The Board of Directors of the Company (the “Board”) has approved and appointed Mr. Simon Tak Leung Ho as a member of the Board effective on November 16, 2020. At the same time, the Board has approved the appointment of Mr. Jiayuan Xu, as the Company’s new Chief Financial Officer, effective on December 1, 2020. Mr. Xu currently serves as the Company’s Senior Vice President for Finance and will succeed Mr. Ho, who tendered his resignation from the position as the Company’s incumbent Chief Financial Officer due to personal reasons. To ensure a smooth transition, Mr. Ho will remain in his capacity until November 30, 2020.
Mr. Jiayuan Xu has been serving as our Senior Vice President for Finance and Head of Financial Institutions Department since March 2018. Mr. Xu served as the Vice President for finance from June 2016 to March 2018. Mr. Xu joined us as our Financial Controller in June 2015. Prior to joining us, Mr. Xu served as the Head of Financial Management Department of Nanyang Commercial Bank (China) Co., Ltd. from 2008 to 2015. Mr. Xu was an Audit Manager at PricewaterhouseCoopers Zhong Tian LLP from 2003 to 2008. Mr. Xu received his bachelor’s degree in international trade and finance from Shanghai Jiaotong University in and FMBA degree from China Europe International Business School. Mr. Xu is also a member of Chinese Institute of Certified Public Accountants.
Company’s Share Repurchase Update
As of November 12, 2020, the Company has deployed approximately US$10.9 million under its existing repurchase program with an authorization of US$60 million to repurchase its American Depositary Shares (“ADSs”). In combination with the Company’s previous repurchase program with authorization of US$120 million, the Company has deployed a total of approximately US$121.9 million to repurchase its ADSs.
6
FinVolution Group’s Chairman Ownership Update
Mr. Shaofeng Gu, the Chairman and Chief Innovation Officer of the Company, has informed the Company on August 11, 2020 that he had continued to purchase in his personal capacity 0.4 million of the Company’s ADSs in the second quarter of 2020. The purchases were made during an open window period and in compliance the Company’s guidelines. As of September 30, 2020, Mr. Shaofeng Gu beneficially owned an aggregate number of 414,256,580 ordinary shares, representing approximately 28.9% of beneficial ownership in the Company.
Business Outlook
As China gradually recovers from the aftermath of the COVID-19 outbreak, the Company has continued to experience improvements in delinquency trends for newly facilitated loans. The Company will continue to closely monitor the global development of the pandemic and remain agile in its business operations. The Company holds a cautiously optimistic view on its operations and expects progressive growth for its loan origination volume in the fourth quarter of 2020 to be in the range of RMB18 billion to RMB20 billion. With a gradual recovery in the macro economy, the Company expects it’s vintage delinquency9 risks to further improve.
The above outlook is based on current market conditions and reflects the Company’s preliminary expectations as to market conditions, its regulatory and operating environment, as well as customer and institutional investor demand, all of which are subject to change.
Conference Call
The Company’s management will host an earnings conference call at 7:00 AM U.S. Eastern Time on November 17, 2020 (8:00 PM Beijing/Hong Kong time on November 17, 2020).
Dial-in details for the earnings conference call are as follows:
| United States (toll free): | 1-888-346-8982 | |||||
| International: | 1-412-902-4272 | |||||
| Hong Kong, China (toll free): | 800-905-945 | |||||
| Hong Kong, China: | 852-3018-4992 | |||||
| Mainland China: | 400-120-1203 |
Participants should dial-in at least 5 minutes before the scheduled start time and ask to be connected to the call for “FinVolution Group.”
Additionally, a live and archived webcast of the conference call will be available on the Company’s investor relations website at https://ir.finvgroup.com.
A replay of the conference call will be accessible approximately one hour after the conclusion of the live call until November 24, 2020, by dialing the following telephone numbers:
| United States (toll free): | 1-877-344-7529 | |||||
| International: | 1-412-317-0088 | |||||
| Replay Access Code: | 10149966 |
7
About FinVolution Group
FinVolution Group is a leading fintech platform in China connecting underserved individual borrowers with financial institutions. Established in 2007, the Company is a pioneer in China’s online consumer finance industry and has developed innovative technologies and has accumulated in-depth experience in the core areas of credit risk assessment, fraud detection, big data and artificial intelligence. The Company’s platform, empowered by proprietary cutting-edge technologies, features a highly automated loan transaction process, which enables a superior user experience. As of September 30, 2020, the Company had over 112.8 million cumulative registered users.
For more information, please visit https://ir.finvgroup.com
Use of Non-GAAP Financial Measures
We use Non-GAAP operating profit, a Non-GAAP financial measure, in evaluating our operating results and for financial and operational decision-making purposes. We believe that adjusted operating profit help identify underlying trends in our business by excluding the impact of share-based compensation expenses and expected discretionary measures. We believe that adjusted operating profit provide useful information about our operating results, enhance the overall understanding of our past performance and future prospects and allow for greater visibility with respect to key metrics used by our management in its financial and operational decision-making.
Non-GAAP adjusted operating profit is not defined under U.S. GAAP and is not presented in accordance with U.S. GAAP. This Non-GAAP financial measure has limitations as analytical tool, and when assessing our operating performance, cash flows or our liquidity, investors should not consider it in isolation, or as a substitute for net (loss)/income, cash flows provided by operating activities or other consolidated statements of operation and cash flow data prepared in accordance with U.S. GAAP. The Company encourages investors and others to review our financial information in its entirety and not rely on a single financial measure.
For more information on this Non-GAAP financial measure, please see the table captioned “Reconciliations of GAAP and Non-GAAP results” set forth at the end of this press release.
Exchange Rate Information
This announcement contains translations of certain RMB amounts into U.S. dollars at a specified rate solely for the convenience of the reader. Unless otherwise noted, all translations from RMB to U.S. dollars are made at a rate of RMB6.7896 to US$1.00, the rate in effect as of September 30, 2020 as certified for customs purposes by the Federal Reserve Bank of New York.
8
Safe Harbor Statement
This press release contains forward-looking statements. These statements constitute “forward-looking” statements within the meaning of Section 21E of the Securities Exchange Act of 1934, as amended, and as defined in the U.S. Private Securities Litigation Reform Act of 1995. These forward-looking statements can be identified by terminology such as “will,” “expects,” “anticipates,” “future,” “intends,” “plans,” “believes,” “estimates,” “target,” “confident” and similar statements. Such statements are based upon management’s current expectations and current market and operating conditions and relate to events that involve known or unknown risks, uncertainties and other factors, all of which are difficult to predict and many of which are beyond the Company’s control. Forward-looking statements involve risks, uncertainties and other factors that could cause actual results to differ materially from those contained in any such statements. Potential risks and uncertainties include, but are not limited to, uncertainties as to the Company’s ability to attract and retain borrowers and investors on its marketplace, its ability to increase volume of loans facilitated through the Company’s marketplace, its ability to introduce new loan products and platform enhancements, its ability to compete effectively, laws, regulations and governmental policies relating to the online consumer finance industry in China, general economic conditions in China, and the Company’s ability to meet the standards necessary to maintain listing of its ADSs on the NYSE, including its ability to cure any non-compliance with the NYSE’s continued listing criteria. Further information regarding these and other risks, uncertainties or factors is included in the Company’s filings with the U.S. Securities and Exchange Commission. All information provided in this press release is as of the date of this press release, and FinVolution does not undertake any obligation to update any forward-looking statement as a result of new information, future events or otherwise, except as required under applicable law.
For investor and media inquiries, please contact:
In China:
FinVolution Group
Head of Investor Relations
Jimmy Tan
Tel: +86 (21) 8030 3200- Ext 8601
E-mail: [email protected]
The Piacente Group, Inc.
Jenny Cai
Tel: +86 (10) 6508-0677
E-mail: [email protected]
In the United States:
The Piacente Group, Inc.
Brandi Piacente
Tel: +1-212-481-2050
E-mail: [email protected]
9
FinVolution Group
UNAUDITED INTERIM CONDENSED CONSOLIDATED BALANCE SHEETS
(All amounts in thousands, except share data, or otherwise noted)
| As of December 31, | As of September 30, | |||||||||||
| 2019 | 2020 | |||||||||||
| RMB | RMB | USD | ||||||||||
| Assets |
||||||||||||
| Cash and cash equivalents |
2,324,542 | 1,107,192 | 163,072 | |||||||||
| Restricted cash |
3,686,203 | 3,915,293 | 576,660 | |||||||||
| Short-term investments |
114,560 | 2,278,395 | 335,571 | |||||||||
| Investments |
952,833 | 976,333 | 143,798 | |||||||||
| Quality assurance receivable, net of credit loss allowance for quality assurance receivable of RMB809,503 and RMB284,266 as of December 31, 2019 and September 30, 2020, respectively |
3,649,642 | 1,157,485 | 170,479 | |||||||||
| Intangible assets |
64,280 | 96,780 | 14,254 | |||||||||
| Property, equipment and software, net |
134,324 | 108,049 | 15,914 | |||||||||
| Loans receivable, net of credit loss allowance for loans receivable of RMB316,124 and RMB607,423 as of December 31, 2019 and September 30, 2020, respectively |
4,808,252 | 3,232,716 | 476,128 | |||||||||
| Accounts receivable, net of credit loss allowance for accounts receivable of RMB145,699 and RMB255,197 as of December 31, 2019 and September 30, 2020, respectively |
882,305 | 685,903 | 101,023 | |||||||||
| Deferred tax assets |
129,740 | 420,173 | 61,885 | |||||||||
| Contract assets |
20,555 | — | — | |||||||||
| Right of use assets |
95,786 | 63,345 | 9,330 | |||||||||
| Prepaid expenses and other assets |
1,391,023 | 1,133,766 | 166,986 | |||||||||
| Goodwill |
50,411 | 50,411 | 7,425 | |||||||||
|
|
|
|
|
|
|
|||||||
| Total assets |
18,304,456 | 15,225,841 | 2,242,525 | |||||||||
|
|
|
|
|
|
|
|||||||
| Liabilities and Shareholders’ Equity |
|
|||||||||||
| Payable to platform customers |
684,630 | 110,733 | 16,309 | |||||||||
| Quality assurance payable1 |
4,776,153 | — | — | |||||||||
| Deferred guarantee income1 |
— | 1,224,437 | 180,340 | |||||||||
| Expected credit losses for quality assurance commitment1 |
— | 2,249,845 | 331,366 | |||||||||
| Payroll and welfare payable |
176,685 | 144,052 | 21,217 | |||||||||
| Taxes payable |
128,298 | 201,663 | 29,702 | |||||||||
| Short-term borrowings |
235,000 | 150,000 | 22,093 | |||||||||
| Funds payable to investors of consolidated trusts |
3,660,483 | 2,427,922 | 357,594 | |||||||||
| Contract liability |
55,728 | 4,067 | 599 | |||||||||
| Deferred tax liabilities |
198,922 | 202,907 | 29,885 | |||||||||
| Accrued expenses and other liabilities |
291,934 | 392,061 | 57,744 | |||||||||
| Leasing liabilities |
85,143 | 53,706 | 7,910 | |||||||||
|
|
|
|
|
|
|
|||||||
| Total liabilities |
10,292,976 | 7,161,393 | 1,054,759 | |||||||||
|
|
|
|
|
|
|
|||||||
| Commitments and contingencies |
||||||||||||
| FinVolution Group Shareholders’ equity |
||||||||||||
| Ordinary shares |
103 | 103 | 15 | |||||||||
| Additional paid-in capital |
5,640,898 | 5,647,563 | 831,796 | |||||||||
| Treasury stock |
(47,174 | ) | (319,845 | ) | (47,108 | ) | ||||||
| Statutory reserves |
317,198 | 317,198 | 46,718 | |||||||||
| Accumulated other comprehensive income |
70,320 | 35,500 | 5,231 | |||||||||
| Retained Earnings |
1,966,611 | 2,298,839 | 338,582 | |||||||||
|
|
|
|
|
|
|
|||||||
| Total FinVolution Group shareholders’ equity |
7,947,956 | 7,979,358 | 1,175,234 | |||||||||
|
|
|
|
|
|
|
|||||||
| Non-controlling interest |
63,524 | 85,090 | 12,532 | |||||||||
|
|
|
|
|
|
|
|||||||
| Total shareholders’ equity |
8,011,480 | 8,064,448 | 1,187,766 | |||||||||
|
|
|
|
|
|
|
|||||||
| Total liabilities and shareholders’ equity |
18,304,456 | 15,225,841 | 2,242,525 | |||||||||
|
|
|
|
|
|
|
|||||||
| 1 | Upon adoption of ASC 326 on January 1, 2020, quality assurance payable is separated into deferred guarantee income (i.e. the unamortized ASC 460 component of guarantee) and expected credit losses for quality assurance commitment (i.e. CECL liability). |
10
FinVolution Group
UNAUDITED INTERIM CONDENSED CONSOLIDATED STATEMENTS OF COMPREHENSIVE INCOME
(All amounts in thousands, except share data, or otherwise noted)
| For the Three Months Ended September 30, | For the Nine Months Ended September 30, | |||||||||||||||||||||||
| 2019 | 2020 | 2019 | 2020 | |||||||||||||||||||||
| RMB | RMB | USD | RMB | RMB | USD | |||||||||||||||||||
| Operating revenue: |
||||||||||||||||||||||||
| Loan facilitation service fees |
893,614 | 486,291 | 71,623 | 2,771,979 | 1,265,565 | 186,398 | ||||||||||||||||||
| Post-facilitation service fees |
300,671 | 161,376 | 23,768 | 924,542 | 497,236 | 73,235 | ||||||||||||||||||
| Guarantee income1 |
— | 747,143 | 110,042 | — | 2,718,598 | 400,406 | ||||||||||||||||||
| Net interest income |
344,997 | 260,931 | 38,431 | 789,905 | 909,046 | 133,888 | ||||||||||||||||||
| Other Revenue |
53,229 | 137,592 | 20,265 | 243,542 | 319,650 | 47,079 | ||||||||||||||||||
|
|
|
|
|
|
|
|
|
|
|
|
|
|||||||||||||
| Net revenue |
1,592,511 | 1,793,333 | 264,129 | 4,729,968 | 5,710,095 | 841,006 | ||||||||||||||||||
|
|
|
|
|
|
|
|
|
|
|
|
|
|||||||||||||
| Operating expenses: |
||||||||||||||||||||||||
| Origination and servicing expenses |
(332,078 | ) | (338,879 | ) | (49,911 | ) | (903,053 | ) | (860,689 | ) | (126,766 | ) | ||||||||||||
| Sales and marketing expenses |
(229,190 | ) | (115,305 | ) | (16,983 | ) | (588,585 | ) | (273,254 | ) | (40,246 | ) | ||||||||||||
| General and administrative expenses |
(124,806 | ) | (105,392 | ) | (15,523 | ) | (334,630 | ) | (303,772 | ) | (44,741 | ) | ||||||||||||
| Research and development expenses |
(108,221 | ) | (92,988 | ) | (13,696 | ) | (297,504 | ) | (263,941 | ) | (38,874 | ) | ||||||||||||
| Credit losses for quality assurance commitment1 |
— | (326,610 | ) | (48,104 | ) | — | (1,699,231 | ) | (250,270 | ) | ||||||||||||||
| Provision for loans receivable |
(80,082 | ) | (89,986 | ) | (13,253 | ) | (196,936 | ) | (505,698 | ) | (74,482 | ) | ||||||||||||
| Provision for accounts receivable and other receivables |
(69,185 | ) | (35,143 | ) | (5,176 | ) | (197,895 | ) | (91,539 | ) | (13,482 | ) | ||||||||||||
|
|
|
|
|
|
|
|
|
|
|
|
|
|||||||||||||
| Total operating expenses |
(943,562 | ) | (1,104,303 | ) | (162,646 | ) | (2,518,603 | ) | (3,998,124 | ) | (588,861 | ) | ||||||||||||
|
|
|
|
|
|
|
|
|
|
|
|
|
|||||||||||||
| Operating profit |
648,949 | 689,030 | 101,483 | 2,211,365 | 1,711,971 | 252,145 | ||||||||||||||||||
|
|
|
|
|
|
|
|
|
|
|
|
|
|||||||||||||
| Other income (expenses) |
||||||||||||||||||||||||
| Gain from quality assurance fund1 |
34,321 | — | — | 91,331 | — | — | ||||||||||||||||||
| Realized gain (loss) from financial guarantee derivatives |
37,235 | — | — | 29,695 | — | — | ||||||||||||||||||
| Fair value change of financial guarantee derivatives |
(43,474 | ) | — | — | (51,681 | ) | — | — | ||||||||||||||||
| Other income, net |
52,147 | 26,314 | 3,876 | 106,200 | 114,393 | 16,848 | ||||||||||||||||||
|
|
|
|
|
|
|
|
|
|
|
|
|
|||||||||||||
| Profit before income tax expense |
729,178 | 715,344 | 105,359 | 2,386,910 | 1,826,364 | 268,993 | ||||||||||||||||||
| Income tax expenses |
(130,718 | ) | (118,398 | ) | (17,438 | ) | (424,870 | ) | (355,045 | ) | (52,293 | ) | ||||||||||||
|
|
|
|
|
|
|
|
|
|
|
|
|
|||||||||||||
| Net profit |
598,460 | 596,946 | 87,921 | 1,962,040 | 1,471,319 | 216,700 | ||||||||||||||||||
| Net profit (loss) attributable to non-controlling ,interest shareholders |
577 | (5,719 | ) | (842 | ) | 466 | (7,442 | ) | (1,096 | ) | ||||||||||||||
| Net profit attributable to FinVolution Group |
597,883 | 602,665 | 88,763 | 1,961,574 | 1,478,761 | 217,796 | ||||||||||||||||||
|
|
|
|
|
|
|
|
|
|
|
|
|
|||||||||||||
| Foreign currency translation adjustment, net of nil tax |
21,335 | (37,082 | ) | (5,462 | ) | 21,066 | (34,820 | ) | (5,128 | ) | ||||||||||||||
|
|
|
|
|
|
|
|
|
|
|
|
|
|||||||||||||
| Total comprehensive income attributable to FinVolution Group |
619,218 | 565,583 | 83,301 | 1,982,640 | 1,443,941 | 212,668 | ||||||||||||||||||
|
|
|
|
|
|
|
|
|
|
|
|
|
|||||||||||||
| Weighted average number of ordinary shares used in computing net income per share |
||||||||||||||||||||||||
| Basic |
1,553,399,525 | 1,453,795,176 | 1,453,795,176 | 1,521,577,804 | 1,496,832,088 | 1,496,832,088 | ||||||||||||||||||
| Diluted |
1,579,642,133 | 1,467,348,248 | 1,467,348,248 | 1,565,427,361 | 1,509,090,474 | 1,509,090,474 | ||||||||||||||||||
| Income per share -Basic |
0.38 | 0.41 | 0.06 | 1.29 | 0.99 | 0.15 | ||||||||||||||||||
| Income per ADS-Basic |
1.92 | 2.07 | 0.31 | 6.45 | 4.94 | 0.73 | ||||||||||||||||||
| Income per share -Diluted |
0.38 | 0.41 | 0.06 | 1.25 | 0.98 | 0.14 | ||||||||||||||||||
| Income per ADS-Diluted |
1.89 | 2.05 | 0.30 | 6.27 | 4.90 | 0.72 | ||||||||||||||||||
| 1 | Before the adoption of ASC 326 on January 1, 2020, gain or losses related to quality assurance commitments were recorded in one combined financial statement line item within other income. After the adoption of ASC 326, the guarantee income (i.e. the release of ASC 460 component of guarantee liability) was recorded as a separate financial statement line item within revenue and the credit losses for quality assurance commitments (i.e. the recognition of CECL losses) was recorded within expenses. |
11
FinVolution Group
UNAUDITED INTERIM CONDENSED CONSOLIDATED STATEMENTS OF CASH FLOWS
(All amounts in thousands, except share data, or otherwise noted)
| Three Months Ended September 30 | Nine Months Ended September 30, | |||||||||||||||||||||||
| 2019 | 2020 | 2019 | 2020 | |||||||||||||||||||||
| RMB | RMB | USD | RMB | RMB | USD | |||||||||||||||||||
| Net cash provided by operating activities |
1,515,746 | 791,240 | 116,537 | 2,609,065 | 1,458,450 | 214,806 | ||||||||||||||||||
| Net cash provided by/(used in) investing activities |
28,870 | (175,887 | ) | (25,905 | ) | (1,094,495 | ) | (389,740 | ) | (57,402 | ) | |||||||||||||
| Net cash provided by/(used in) financing activities |
285,077 | (602,873 | ) | (88,794 | ) | 937,102 | (2,035,703 | ) | (299,828 | ) | ||||||||||||||
| Effect of exchange rate changes on cash and cash equivalents |
16,505 | (28,131 | ) | (4,143 | ) | 17,657 | (21,267 | ) | (3,131 | ) | ||||||||||||||
| Net increase/(decrease) in cash, cash equivalent and restricted cash |
1,846,198 | (15,651 | ) | (2,305 | ) | 2,469,329 | (988,260 | ) | (145,555 | ) | ||||||||||||||
| Cash, cash equivalent and restricted cash at beginning of period |
5,916,852 | 5,038,136 | 742,037 | 5,293,721 | 6,010,745 | 885,287 | ||||||||||||||||||
| Cash, cash equivalent and restricted cash at end of period |
7,763,050 | 5,022,485 | 739,732 | 7,763,050 | 5,022,485 | 739,732 | ||||||||||||||||||
12
FinVolution Group
UNAUDITED Reconciliation of GAAP and Non-GAAP Results
(All amounts in thousands, except share data, or otherwise noted)
| For the Three Months Ended September 30, | For the Nine Months Ended September 30, | |||||||||||||||||||||||
| 2019 | 2020 | 2019 | 2020 | |||||||||||||||||||||
| RMB | RMB | USD | RMB | RMB | USD | |||||||||||||||||||
| Net Revenues |
1,592,511 | 1,793,333 | 264,129 | 4,729,968 | 5,710,095 | 841,006 | ||||||||||||||||||
| Less: total operating expenses |
(943,562 | ) | (1,104,303 | ) | (162,646 | ) | (2,518,603 | ) | (3,998,124 | ) | (588,861 | ) | ||||||||||||
| Operating Income |
648,949 | 689,030 | 101,483 | 2,211,365 | 1,711,971 | 252,145 | ||||||||||||||||||
| Add: share-based compensation expenses |
8,890 | 8,600 | 1,267 | 32,827 | 25,329 | 3,731 | ||||||||||||||||||
| Non-GAAP adjusted operating income |
657,839 | 697,630 | 102,750 | 2,244,192 | 1,737,300 | 255,876 | ||||||||||||||||||
| Operating Margin |
40.8 | % | 38.4 | % | 38.4 | % | 46.8 | % | 30.0 | % | 30.0 | % | ||||||||||||
| Non-GAAP operating margin |
41.3 | % | 38.9 | % | 38.9 | % | 47.4 | % | 30.4 | % | 30.4 | % | ||||||||||||
13
Serious News for Serious Traders! Try StreetInsider.com Premium Free!
You May Also Be Interested In
- Electrolit Renews Partnership with Patricio "Pato" O'Ward, Extending Sponsorship for Third Consecutive Year
- AeroMech Announces RVSM Certification Program for Piper M700 Fury
- ROSEN, TRUSTED INVESTOR COUNSEL, Encourages The Chemours Company Investors to Secure Counsel Before Important Deadline in Securities Class Action – CC
Create E-mail Alert Related Categories
SEC FilingsSign up for StreetInsider Free!
Receive full access to all new and archived articles, unlimited portfolio tracking, e-mail alerts, custom newswires and RSS feeds - and more!
