

Form 6-K Ferroglobe PLC For: Mar 01
 Tweet
Tweet Share
ShareSECURITIES AND EXCHANGE COMMISSION
Washington, D.C. 20549
FORM 6-K
REPORT OF FOREIGN PRIVATE ISSUER
Pursuant to Rule 13a-16 or 15d-16
under the Securities Exchange Act of 1934
For the Month of March, 2021
Commission File Number: 001-37668
FERROGLOBE PLC
(Name of Registrant)
5 Fleet Place
London, EC4M7RD
(Address of Principal Executive Office)
Indicate by check mark whether the registrant files or will file annual reports under cover of Form 20-F or Form 40-F.
Form 20-F ☒ | Form 40-F ☐ |
Indicate by check mark if the registrant is submitting the Form 6-K in paper as permitted by Regulation S-T Rule 101(b)(1): ☐
Indicate by check mark if the registrant is submitting the Form 6-K in paper as permitted by Regulation S-T Rule 101(b)(7): ☐
Indicate by check mark whether the registrant by furnishing the information contained in this Form is also thereby furnishing the information to the Commission pursuant to Rule 12g3-2(b) under the Securities Exchange Act of 1934.
Yes ☐ | No ☒ |
If "Yes" is marked, indicate below the file number assigned to the registrant in connection with Rule 12g3-2(b): N/A
This Form 6-K consists of the following materials, which appear immediately following this page:
| ● | Press release dated March 1, 2021 announcing results for the quarter and year ended December 31, 2020 |
| ● | Fourth quarter and full year 2020 earnings call presentation |
SIGNATURES
Pursuant to the requirements of the Securities Exchange Act of 1934, the registrant has duly caused this report to be signed on its behalf by the undersigned, thereunto duly authorized.
| Date: March 1, 2021 | |
| FERROGLOBE PLC | |
|
|
|
| by | /s/ Marco Levi |
|
| Name: Marco Levi |
|
| Title: Chief Executive Officer (Principal Executive Officer) |
Ferroglobe Reports Results for the Fourth Quarter and Full Year 2020
Adjusted EBITDA of $5.7 million in Q4 2020 and $32.8 million in Full Year 2020
| ● | Q4 2020 results: |
| ● | Sales of $320.5 million, up 22% compared to $262.7 million in Q3 2020, and $376.6 million in Q4 2019 |
| ● | Net loss of ($84.1) million compared to ($46.8) million in Q3 2020, and ($73.3) million in Q4 2019 |
| ● | Adjusted EBITDA of $5.7 million compared to $22.2 million in Q3 2020, and ($30.4) million in Q4 2019 |
| ● | Full Year 2020 results: |
| ● | Sales of $1.14 billion, down 29%, compared to $1.62 billion in 2019 |
| ● | Net loss of ($194.1) million, including an impairment charge of $36.8 million, compared to a net loss of ($285.6) million in 2019 |
| ● | Adjusted EBITDA of $32.8 million in 2020, compared to ($29.2) million in 2019 |
| ● | Continued working capital reduction of $15 million in Q4 2020, and total reduction of $135 million for the full year 2020 |
| ● | Improved available cash balance by $25 million during the quarter by successful refinancing of the prior accounts receivable securitization program with a new factoring program, at improved terms and lower cost |
| ● | Strategic plan currently in execution stage across all value creation areas; initial financial benefits being realized |
LONDON, March 1, 2021 (GLOBE NEWSWIRE) – Ferroglobe PLC (NASDAQ: GSM) (“Ferroglobe”, the “Company”, or the “Parent”), a leading producer globally of silicon metal, silicon-based and manganese-based specialty alloys, today announced results for the fourth quarter and the full year 2020.
Q4 2020 Earnings Highlights
In Q4 2020, Ferroglobe posted a net loss of ($84.1) million, or ($0.49) per share on a fully diluted basis. On an adjusted basis, the Q4 2020 net loss was ($30.8) million, or ($0.47) per share on a fully diluted basis.
Q4 2020 reported EBITDA was ($0.6) million, up from ($12.2) million in the prior quarter. On an adjusted basis, Q4 2020 EBITDA was $5.7 million, down from Q3 2020 adjusted EBITDA of $22.2 million. The Company reported an adjusted EBITDA margin of 1.8% for Q4 2020, compared to an adjusted EBITDA margin of 8.5% for Q3 2020.
Full Year 2020 Earnings Highlights
For Full Year 2020, Ferroglobe posted a net loss of $(194.1) million, or $(1.13) per share. On an adjusted basis, Full Year 2020 net loss was $(92.6) million, or $(0.98) per share.
For the Full Year 2020, reported EBITDA was $(11.0) million, versus $(235.4) million in the prior year. Full Year 2020 Adjusted EBITDA was $32.8 million, versus $(29.2) million in the prior year. The Company reported an adjusted EBITDA margin of 2.9% for Full Year 2020, compared to an adjusted EBITDA margin of (1.8)% for Full Year 2019.
|
| Quarter Ended |
| Quarter Ended | | Quarter Ended | | Year Ended |
| Year Ended | |||||
$,000 (unaudited) | | December 31, 2020 | | September 30, 2020 | | December 31, 2019 | | December 31, 2020 | | December 31, 2019 | |||||
| | | | | | | | | | | | | | | |
Sales | | $ | 320,535 | | $ | 262,673 | | $ | 376,607 | | $ | 1,144,434 | | $ | 1,615,222 |
Net (loss) profit | | $ | (84,141) | | $ | (46,834) | | $ | (73,291) | | $ | (194,067) | | $ | (285,640) |
Diluted EPS | | $ | (0.49) | | $ | (0.28) | | $ | (0.43) | | $ | (1.13) | | $ | (1.66) |
Adjusted net (loss) income attributable to the parent | | $ | (30,798) | | $ | (13,002) | | $ | (47,845) | | $ | (92,577) | | $ | (108,288) |
Adjusted diluted EPS | | $ | (0.47) | | $ | (0.16) | | $ | (0.28) | | $ | (0.98) | | $ | (0.65) |
Adjusted EBITDA | | $ | 5,737 | | $ | 22,231 | | $ | (30,391) | | $ | 32,765 | | $ | (29,239) |
Adjusted EBITDA margin | | | 1.8% | | | 8.5% | | | (8.1)% | | | 2.9% | | | (1.8)% |
Marco Levi, Ferroglobe’s Chief Executive Officer, commented, “Despite a challenging year, Ferroglobe delivered stronger financial results in 2020, and continued to generate positive EBITDA during the fourth quarter. Throughout the year we progressed on addressing near-term priorities, while also diligently developing a multi-year strategic plan aimed at turning
around the Company.” Dr. Levi added, “The collective efforts and actions of our global employees helped us successfully navigage 2020 and positions the Company well to capitalize on a pivotal 2021. We certainly look forward to executing the turnaround plan and start delivering value to all our stakeholders in the near term.”
Cash Flow and Balance Sheet
Cash generated from operations during Q4 2020 was $3.5 million.
Working capital decreased by $15 million, from $354 million as of September 30, 2020 to $339 million at December 31, 2020. The decrease is mainly driven by a reduction in inventories, partially offset by strengthening of the Euro relative to the US Dollar.
Gross debt was $473 million as of December 31, 2020, up from $442 million as of September 30, 2020, primarily as a result of
coupon payment interest accrued, and the impact of the Tribunal Superior de Galicia decision.
Beatriz García-Cos, Ferroglobe’s Chief Financial Officer, commented, “2020 tested our Company in many ways and despite all the financial pressures, we successfully navigated a turbulent year by making quick adjustments and driving cost savings across the all areas of the organization.” Ms. García-Cos added, “We have been exploring various financing options for some time now, and are excited to work towards closing the proposed financing. This financing would eliminate any risks of near-term debt maturities, and the new capital contribution would provide adequate support to fund our strategic plan.”
COVID-19
Since January 2020, the COVID-19 pandemic has spread to various jurisdictions where the Company does business. The Company has been monitoring the evolving situation, and consequent emerging risk. Among other steps, the Company has implemented a coronavirus crisis management team, which has been meeting regularly to ensure the Company and its subsidiaries take appropriate action to protect all employees and ensure business continuity.
During the fourth quarter demand for our products was adversely impacted by COVID-19 It is difficult to forecast all the impacts of the COVID-19 pandemic, and such impacts might have a material adverse effect on our business, results of operations and financial condition. The Company is continuously evaluating how evolving customer demand and sales price evolution stand to affect the Company’s business and results in the next twelve months.
In connection with the preparation of our consolidated financial statements, we conducted an evaluation as to whether there were conditions and events, considered in the aggregate, which raise substantial doubt as to the Company’s ability to continue as a going concern in the one year period after the date of the issuance of these interim financial statements. For this interim financial statement, the evaluation was updated. Given the speed and frequency of continuously evolving developments with respect to this pandemic and the uncertainties this may bring for the Company and the demand for its products, it is difficult to forecast the level of trading activity and hence cash flow in the next twelve months. Developing a reliable estimate of the potential impact on the results of operations and cash flow at this time is difficult as markets and industries react to the pandemic and the measures implemented in response to it, but our downside scenario analysis supports an expectation that the Company will have cash headroom to continue to operate throughout the next twelve months.
Additionally, the indenture governing the senior unsecured notes includes provisions which, in the event of a change of control, would require the Company to offer to redeem the outstanding senior unsecured notes at a cash purchase price equal to 101% of the principal amount of the senior unsecured notes, plus any accrued and unpaid interest. Based on the provisions cited above, a change of control as defined in the indenture is unlikely to occur, but the matter it is not within the Company’s control. If a change of control were to occur, the Company may not have sufficient financial resources available to satisfy all of its obligations. Management is pursuing additional sources of financing to increase liquidity to fund operations.
Subsequent events
On February 1, 2021, the Company announced that it was in discussions with certain holders of the 9.375% Senior Notes due 2022 and key financial partners.
Discussion of Fourth Quarter 2020 Results
The Company has concluded that there are indications for potential impairment of goodwill, property, plant and equipment and deferred tax assets. During the third quarter, the Company registered an impairment relating to the Niagara Falls facility as there are no plans to restart production. During the fourth quarter the Company registered an impairment the spare parts associated to the Niagara Falls facility. Additionally, during the fourth quarter the Company impaired the deferred tax assets related to tax losses in Spain, France and Argentina.The financial results presented for the fourth quarter and fiscal year ended as of December 31, 2020 are unaudited and may be subsequently materially adjusted, including as a result of the final conclusions on the impairment analysis, and the impact of the Tribunal Superior de Galicia decision.
Sales
Sales for Q4 2020 were $320.5 million, an increase of 22.0% compared to $262.7 million in Q3 2020. For Q4 2020, total shipments were up 29.3% and the average selling price was down 3.5% compared with Q3 2020.
|
| Quarter Ended |
| Quarter Ended | | |
| Quarter Ended | | | | Year Ended |
| Year Ended | | | |||||
| | December 31, 2020 | | September 30, 2020 | | Change | | December 31, 2019 | | Change | | December 31, 2020 | | December 31, 2019 | | Change | |||||
Shipments in metric tons: | | | | | | | | | | | | | | | | | | | | | |
Silicon Metal | | | 54,912 | | | 51,215 | | 7.2% | | | 61,613 | | (10.9)% | | | 207,332 | | | 239,692 | | (13.5)% |
Silicon-based Alloys | | | 57,351 | | | 42,449 | | 35.1% | | | 64,485 | | (11.1)% | | | 200,212 | | | 295,429 | | (32.2)% |
Manganese-based Alloys | | | 78,611 | | | 53,980 | | 45.6% | | | 95,235 | | (17.5)% | | | 261,605 | | | 392,456 | | (33.3)% |
Total shipments* | | | 190,874 | | | 147,644 | | 29.3% | | | 221,333 | | (13.8)% | | | 669,149 | | | 927,577 | | (27.9)% |
| | | | | | | | | | | | | | | | | | | | | |
Average selling price ($/MT): | | | | | | | | | | | | | | | | | | | | | |
Silicon Metal | | $ | 2,260 | | $ | 2,248 | | 0.5% | | $ | 2,175 | | 3.9% | | $ | 2,234 | | $ | 2,252 | | (0.8)% |
Silicon-based Alloys | | $ | 1,528 | | $ | 1,534 | | (0.4)% | | $ | 1,424 | | 7.3% | | $ | 1,515 | | $ | 1,547 | | (2.1)% |
Manganese-based Alloys | | $ | 1,031 | | $ | 1,009 | | 2.2% | | $ | 1,054 | | (2.2)% | | $ | 1,022 | | $ | 1,140 | | (10.4)% |
Total* | | $ | 1,534 | | $ | 1,590 | | (3.5)% | | $ | 1,474 | | 4.1% | | $ | 1,545 | | $ | 1,557 | | (0.8)% |
| | | | | | | | | | | | | | | | | | | | | |
Average selling price ($/lb.): | | | | | | | | | | | | | | | | | | | | | |
Silicon Metal | | $ | 1.03 | | $ | 1.02 | | 0.5% | | $ | 0.99 | | 3.9% | | $ | 1.01 | | $ | 1.02 | | (0.8)% |
Silicon-based Alloys | | $ | 0.69 | | $ | 0.70 | | (0.4)% | | $ | 0.65 | | 7.3% | | $ | 0.69 | | $ | 0.70 | | (2.1)% |
Manganese-based Alloys | | $ | 0.47 | | $ | 0.46 | | 2.2% | | $ | 0.48 | | (2.2)% | | $ | 0.46 | | $ | 0.52 | | (10.4)% |
Total* | | $ | 0.70 | | $ | 0.72 | | (3.5)% | | $ | 0.67 | | 4.1% | | $ | 0.70 | | $ | 0.71 | | (0.8)% |
* Excludes by-products and other
Sales Prices & Volumes By Product
During Q4 2020, total product average selling prices decreased by 3.5% versus Q3 2020. Q4 average selling prices of silicon metal increased 0.5%, silicon-based alloys prices decreased 0.4%, and manganese-based alloys prices increased 2.2%.
Sales volumes in Q4 growth by 29.3% versus the prior quarter. Q4 sales volumes of silicon metal increased 7.2%, silicon-based alloys increased 35.1%, and manganese-based alloys increased 45.6% versus Q3 2020.
Cost of Sales
Cost of sales was $225.9 million in Q4 2020, an increase from $166.2 million in the prior quarter. Cost of sales as a percentage of sales increased to 70.5% in Q4 2020 versus 63.3% for Q3 2020, the increase is mainly due to higher sales volume, lower sales prices, higher energy prices in Europe, lower fixed cost absorption due to decreased production levels and the negative impact of planned production stop in a plant in Spain.
Other Operating Expenses
Other operating expenses amounted to $47.1 million in Q4 2020, an increase from $26.9 million in the prior quarter. This increase is primarily attributable to the accrual for the purchase of CO2 emission rights, the realized benefit from the removal of liability relating to an R&D project in France in Q3, and the increase in commercial expenses resulting from higher sales volume.
Net Loss Attributable to the Parent
In Q4 2020, net loss attributable to the Parent was $83.4 million, or ($0.49) per diluted share, compared to a net loss attributable to the Parent of $47.3 million, or ($0.28) per diluted share in Q3 2020.
Adjusted EBITDA
In Q4 2020, adjusted EBITDA was $5.7 million, or 1.8% of sales, compared to adjusted EBITDA of $22.2 million, or 8.5% of sales in Q3 2020, primarily due to higher costs incurred in Q4 2020.
Conference Call
Ferroglobe management will review the fourth quarter and full year results of 2020 during a conference call at 9:00 a.m. Eastern Time on March 2, 2021.
The dial-in number for participants in the United States is +1 646-741-3167 (conference ID: 6866274). International callers should dial +1 877-870-9135 (conference ID: 6866274). Please dial in at least five minutes prior to the call to register. The call may also be accessed via an audio webcast available at https://edge.media-server.com/mmc/p/td6yky7q
About Ferroglobe
Ferroglobe is one of the world’s leading suppliers of silicon metal, silicon-based and manganese-based specialty alloys and ferroalloys, serving a customer base across the globe in dynamic and fast-growing end markets, such as solar, automotive, consumer products, construction and energy. The Company is based in London. For more information, visit http://investor.ferroglobe.com.
Forward-Looking Statements
This release contains “forward-looking statements” within the meaning of U.S. securities laws. Forward-looking statements are not historical facts but are based on certain assumptions of management and describe the Company’s future plans, strategies and expectations. Forward-looking statements often use forward-looking terminology, including words such as “anticipate”, “believe”, “could”, “estimate”, “expect”, “forecast”, “guidance”, “intends”, “likely”, “may”, “plan”, “potential”, “predicts”, “seek”, “target”, “will” and words of similar meaning or the negative thereof.
Forward-looking statements contained in this press release are based on information currently available to the Company and assumptions that management believe to be reasonable, but are inherently uncertain. As a result, Ferroglobe’s actual results, performance or achievements may differ materially from those expressed or implied by these forward-looking statements, which are not guarantees of future performance and involve known and unknown risks, uncertainties and other factors that are, in some cases, beyond the Company’s control.
Forward-looking financial information and other metrics presented herein represent the Company’s goals and are not intended as guidance or projections for the periods referenced herein or any future periods.
All information in this press release is as of the date of its release. Ferroglobe does not undertake any obligation to update publicly any of the forward-looking statements contained herein to reflect new information, events or circumstances arising after the date of this press release. You should not place undue reliance on any forward-looking statements, which are made only as of the date of this press release.
Non-IFRS Measures
Adjusted EBITDA, adjusted EBITDA margin, adjusted net profit, adjusted profit per share, working capital and net debt, are non-IFRS financial metrics that, we believe, are pertinent measures of Ferroglobe’s success. Ferroglobe has included these financial metrics to provide supplemental measures of its performance. The Company believes these metrics are important because they eliminate items that have less bearing on the Company’s current and future operating performance and highlight trends in its core business that may not otherwise be apparent when relying solely on IFRS financial measures.
INVESTOR CONTACT:
Gaurav Mehta
ExecutiveVice President – Investor Relations
Email: [email protected]
MEDIA CONTACT:
Cristina Feliu Roig
Executive Director – Communications & Public Affairs
Email: [email protected]
Ferroglobe PLC and Subsidiaries
Unaudited Condensed Consolidated Income Statement
(in thousands of U.S. dollars, except per share amounts)
| | Quarter Ended | | Quarter Ended |
| Quarter Ended |
| Year Ended | | Year Ended | |||||
|
| December 31, 2020 |
| September 30, 2020 | | December 31, 2019 | | December 31, 2020 | | December 31, 2019 | |||||
Sales |
| $ | 320,535 |
| $ | 262,673 | | $ | 376,607 | | $ | 1,144,434 | | $ | 1,615,222 |
Cost of sales |
| | (225,956) |
| | (166,231) | | | (314,905) | | | (788,839) | | | (1,214,397) |
Other operating income |
| | 8,100 |
| | 7,598 | | | 12,446 | | | 33,627 | | | 54,213 |
Staff costs |
| | (54,428) |
| | (56,329) | | | (63,379) | | | (214,765) | | | (285,029) |
Other operating expense |
| | (47,112) |
| | (26,896) | | | (58,804) | | | (150,027) | | | (225,705) |
Depreciation and amortization charges, operating allowances and write-downs |
| | (25,538) |
| | (26,524) | | | (30,029) | | | (108,189) | | | (120,194) |
Impairment losses | | | (2,593) | | | (34,269) | | | (546) | | | (36,863) | | | (175,899) |
Other gain (loss) | | | 824 | | | 1,212 | | | 98 | | | 1,449 | | | (3,797) |
Operating (loss) profit | | | (26,168) | | | (38,766) | | | (78,512) | | | (119,173) | | | (355,586) |
Net finance expense |
| | (33,963) |
| | (13,985) | | | (16,484) | | | (81,124) | | | (61,845) |
Financial derivatives (loss) gain | | | — | | | — | | | (1,153) | | | 3,168 | | | 2,729 |
Exchange differences |
| | 7,327 |
| | 13,157 | | | 4,366 | | | 25,553 | | | 2,884 |
(Loss) profit before tax |
| | (52,804) |
| | (39,594) | | | (91,783) | | | (171,576) | | | (411,818) |
Income tax benefit (expense) |
| | (31,337) |
| | (1,841) | | | 14,120 | | | (17,092) | | | 41,541 |
(Loss) profit for the period from continuing operations | | | (84,141) | | | (41,435) | | | (77,663) | | | (188,668) | | | (370,277) |
Profit for the period from discontinued operations | | | — | | | (5,399) | | | 4,372 | | | (5,399) | | | 84,637 |
(Loss) profit for the period | | | (84,141) | | | (46,834) | | | (73,291) | | | (194,067) | | | (285,640) |
Loss (profit) attributable to non-controlling interest |
| | 779 |
| | (450) | | | 866 | | | 3,417 | | | 5,039 |
(Loss) profit attributable to the parent |
| $ | (83,362) |
| $ | (47,284) | | $ | (72,425) | | $ | (190,650) | | $ | (280,601) |
|
| | |
| | | | | | | | | | | |
| | | | | | | | | | | | | | | |
EBITDA | | $ | (630) | | $ | (12,242) | | $ | (48,483) | | $ | (10,984) | | $ | (235,392) |
Adjusted EBITDA | | $ | 5,737 | | $ | 22,231 | | $ | (30,391) | | $ | 32,765 | | $ | (29,239) |
| | | | | | | | | | | | | | | |
Weighted average shares outstanding | | | | | | | | | | | | | | | |
Basic | | | 169,262 | | | 169,261 | | | 169,182 | | | 169,257 | | | 169,153 |
Diluted | | | 169,262 | | | 169,261 | | | 169,182 | | | 169,257 | | | 169,153 |
| | | | | | | | | | | | | | | |
(Loss) profit per ordinary share | | | | | | | | | | | | | | | |
Basic | | $ | (0.49) | | $ | (0.28) | | $ | (0.43) | | $ | (1.13) | | $ | (1.66) |
Diluted | | $ | (0.49) | | $ | (0.28) | | $ | (0.43) | | $ | (1.13) | | $ | (1.66) |
Ferroglobe PLC and Subsidiaries
Unaudited Condensed Consolidated Statement of Financial Position
(in thousands of U.S. dollars)
| | December 31, | | September 30, | | December 31, | ||||
|
| 2020 |
| 2020 |
| 2019 | ||||
ASSETS | ||||||||||
Non-current assets | | | | | | | | | | |
Goodwill | | $ | | 29,702 | | $ | 29,702 | | $ | 29,702 |
Other intangible assets | | | | 20,756 | | | 18,876 | | | 51,267 |
Property, plant and equipment | | | | 656,806 | | | 640,211 | | | 740,906 |
Other non-current financial assets | | | | 5,057 | | | 6,227 | | | 2,618 |
Deferred tax assets | | | | 8,521 | | | 50,939 | | | 59,551 |
Non-current receivables from related parties | | | | 2,454 | | | 2,343 | | | 2,247 |
Other non-current assets | | | | 11,904 | | | 4,960 | | | 1,597 |
Non-current restricted cash and cash equivalents | | | | 22,707 | | | 28,551 | | | 28,323 |
Total non-current assets | | | | 757,907 | | | 781,809 | | | 916,211 |
Current assets | | | | | | | | | | |
Inventories | | | | 245,954 | | | 311,269 | | | 354,121 |
Trade and other receivables | | | | 242,262 | | | 179,432 | | | 309,064 |
Current receivables from related parties | | | | 3,076 | | | 3,055 | | | 2,955 |
Current income tax assets | | | | 12,072 | | | 11,264 | | | 27,930 |
Other current financial assets | | | | 1,008 | | | 2,360 | | | 5,544 |
Other current assets | | | | 20,714 | | | 18,199 | | | 23,676 |
Current restricted cash and cash equivalents | | | | 6,136 | | | — | | | — |
Cash and cash equivalents | | | | 102,714 | | | 118,874 | | | 94,852 |
Total current assets | | | | 633,936 | | | 644,453 | | | 818,142 |
Total assets | | $ | | 1,391,843 | | $ | 1,426,262 | | $ | 1,734,353 |
| | | | | | | | | | |
EQUITY AND LIABILITIES | ||||||||||
Equity | | $ | | 421,060 | | $ | 483,488 | | $ | 602,297 |
Non-current liabilities | | | | | | | | | | |
Deferred income | | | | 620 | | | 7,454 | | | 1,253 |
Provisions | | | | 79,133 | | | 84,779 | | | 84,852 |
Bank borrowings | | | | 32,513 | | | 31,958 | | | 144,388 |
Lease liabilities | | | | 29,399 | | | 12,655 | | | 16,972 |
Debt instruments | | | | 346,620 | | | 345,941 | | | 344,014 |
Other financial liabilities | | | | 39,126 | | | 32,554 | | | 43,157 |
Other non-current liabilities | | | | 16,767 | | | 16,678 | | | 25,906 |
Deferred tax liabilities | | | | 31,717 | | | 47,633 | | | 74,057 |
Total non-current liabilities | | | | 575,895 | | | 579,652 | | | 734,599 |
Current liabilities | | | | | | | | | | |
Provisions | | | | 52,491 | | | 38,121 | | | 46,091 |
Bank borrowings | | | | 75,093 | | | 59,318 | | | 14,611 |
Lease liabilities | | | | 10,032 | | | 7,960 | | | 8,900 |
Debt instruments | | | | 10,888 | | | 2,697 | | | 10,937 |
Other financial liabilities | | | | 25,466 | | | 28,016 | | | 23,382 |
Payables to related parties | | | | 3,196 | | | 4,162 | | | 4,830 |
Trade and other payables | | | | 149,201 | | | 136,371 | | | 189,229 |
Current income tax liabilities | | | | 2,538 | | | 140 | | | 3,048 |
Other current liabilities | | | | 65,983 | | | 86,337 | | | 96,429 |
Total current liabilities | | | | 394,888 | | | 363,122 | | | 397,457 |
Total equity and liabilities | | $ | | 1,391,843 | | $ | 1,426,262 | | $ | 1,734,353 |
Ferroglobe PLC and Subsidiaries
Unaudited Condensed Consolidated Statement of Cash Flows
(in thousands of U.S. dollars)
| | Quarter Ended |
| Quarter Ended |
| Quarter Ended * | | | Year Ended | | | Year Ended * | |||||
|
| December 31, 2020 | | September 30, 2020 | | December 31, 2019 | | | December 31, 2020 | | | December 31, 2019 | |||||
Cash flows from operating activities: | | | | | | | | | | | | | | | | | |
(Loss) profit for the period | | $ | (84,141) | | $ | (46,834) | | $ | (73,291) | | | $ | (194,067) | | | $ | (285,640) |
Adjustments to reconcile net (loss) profit | | | | | | | | | | | | | — | | | | |
Income tax (benefit) expense | | | 31,337 | | | 1,841 | | | (14,120) | | | | 17,092 | | | | (40,528) |
Depreciation and amortization charges, | | | 25,538 | | | 26,524 | | | 30,029 | | | | 108,189 | | | | 123,024 |
Net finance expense | | | 33,963 | | | 13,985 | | | 16,484 | | | | 81,124 | | | | 68,279 |
Financial derivatives loss (gain) | | | — | | | — | | | 1,153 | | | | (3,168) | | | | (2,729) |
Exchange differences | | | (7,327) | | | (13,157) | | | (4,366) | | | | (25,553) | | | | (2,884) |
Impairment losses | | | 2,593 | | | 34,269 | | | 546 | | | | 36,863 | | | | 175,899 |
Net loss (gain) due to changes in the value of asset | | | (242) | | | (246) | | | 1,574 | | | | (158) | | | | 1,574 |
Gain on disposal of discontinued operation | | | — | | | 5,399 | | | (4,372) | | | | 5,399 | | | | (85,101) |
Gain on disposal of non-current assets | | | — | | | — | | | 2,223 | | | | — | | | | 2,223 |
Share-based compensation | | | 244 | | | 323 | | | 1,599 | | | | 1,993 | | | | 4,879 |
Other adjustments | | | (581) | | | (967) | | | (3,896) | | | | (1,292) | | | | — |
Changes in operating assets and liabilities | | | | | | | | | | | | | — | | | | |
(Increase) decrease in inventories | | | 71,754 | | | 3,725 | | | 132,493 | | | | 114,585 | | | | 91,531 |
(Increase) decrease in trade receivables | | | (53,604) | | | (4,731) | | | 29,310 | | | | 71,034 | | | | 30,933 |
Increase (decrease) in trade payables | | | (4,667) | | | (20,359) | | | (51,152) | | | | (55,405) | | | | (63,187) |
Other | | | (10,163) | | | 23,849 | | | (24,448) | | | | (14,199) | | | | (45,878) |
Income taxes paid | | | (1,177) | | | (633) | | | (523) | | | | 11,831 | | | | (3,589) |
Net cash provided (used) by operating activities | | | 3,527 | | | 22,988 | | | 39,243 | | | | 154,268 | | | | (31,194) |
Cash flows from investing activities: | | | | | | | | | | | | | | | | | |
Interest and finance income received | | | 13 | | | 278 | | | 171 | | | | 630 | | | | 1,673 |
Payments due to investments: | | | | | | | | | | | | | - | | | | |
Acquisition of subsidiary | | | — | | | — | | | — | | | | — | | | | 9,088 |
Other intangible assets | | | (2,654) | | | — | | | — | | | | (2,654) | | | | (184) |
Property, plant and equipment | | | (11,861) | | | (8,734) | | | (5,600) | | | | (30,257) | | | | (32,445) |
Other | | | — | | | — | | | (621) | | | | — | | | | (1,248) |
Disposals: | | | | | | | | | | | | | — | | | | |
Disposal of subsidiaries | | | — | | | — | | | 5,532 | | | | — | | | | 176,590 |
Other non-current assets | | | 295 | | | 46 | | | 8,668 | | | | 341 | | | | 8,668 |
Other | | | — | | | — | | | 353 | | | | — | | | | 3,768 |
Net cash (used) provided by investing activities | | | (14,207) | | | (8,410) | | | 8,503 | | | | (31,940) | | | | 165,910 |
Cash flows from financing activities: | | | | | | | | | | | | | | | | | |
Dividends paid | | | — | | | — | | | — | | | | — | | | | — |
Payment for debt issuance costs | | | (2,077) | | | (608) | | | (12,319) | | | | (4,540) | | | | (15,117) |
Repayment of hydro leases | | | — | | | — | | | — | | | | — | | | | (55,352) |
Repayment of other financial liabilities | | | — | | | — | | | — | | | | — | | | | — |
Increase/(decrease) in bank borrowings: | | | | | | | | | | | | | — | | | | |
Borrowings | | | 169,571 | | | 8,022 | | | 174,130 | | | | 177,593 | | | | 245,629 |
Payments | | | (161,936) | | | (7,800) | | | (269,399) | | | | (235,296) | | | | (329,501) |
Proceeds from stock option exercises | | | — | | | — | | | — | | | | — | | | | — |
Amounts paid due to leases | | | (3,414) | | | (2,463) | | | — | | | | (10,756) | | | | (26,631) |
Other amounts received/(paid) due to financing activities | | | (6,030) | | | — | | | (4,363) | | | | (2,422) | | | | — |
Payments to acquire or redeem own shares | | | — | | | — | | | — | | | | — | | | | — |
Interest paid | | | (827) | | | (17,130) | | | (2,471) | | | | (37,912) | | | | (43,033) |
Net cash (used) provided by financing activities | | | (4,713) | | | (19,979) | | | (114,422) | | | | (113,333) | | | | (224,005) |
Total net cash flows for the period | | | (15,393) | | | (5,401) | | | (66,676) | | | | 8,995 | | | | (89,289) |
Beginning balance of cash and cash equivalents | | | 147,425 | | | 153,242 | | | 188,043 | | | | 123,175 | | | | 216,647 |
Exchange differences on cash and | | | (475) | | | (416) | | | 1,808 | | | | (613) | | | | (4,183) |
Ending balance of cash and cash equivalents | | $ | 131,557 | | $ | 147,425 | | $ | 123,175 | | | $ | 131,557 | | | $ | 123,175 |
Cash from continuing operations | | | 102,714 | | | 118,874 | | | 94,852 | | | | 102,714 | | | | 94,852 |
Current/Non-current restricted cash and cash equivalents | | | 28,843 | | | 28,551 | | | 28,323 | | | | 28,843 | | | | 28,323 |
Cash and restricted cash in the statement of financial position | | $ | 131,557 | | $ | 147,425 | | $ | 123,175 | | | $ | 131,557 | | | $ | 123,175 |
* While in previous periods Ferroglobe presented interest paid as cash flows from operating activities, management deems interest paid as among activities that alter the borrowing structure of the Company and therefore most appropriately presented as among financing activities. This change allows for a fairer presentation of cash flow to users of the financial statements. Previous periods have been restated in order to show interest paid as net cash used in financing activities.
Adjusted EBITDA ($,000):
| | Quarter Ended |
| Quarter Ended |
| Quarter Ended | | Year Ended | | Year Ended | |||||
|
| December 31, 2020 | | September 30, 2020 | | December 31, 2019 | | December 31, 2020 | | December 30, 2019 | |||||
(Loss) profit attributable to the parent | | $ | (83,362) | | $ | (47,284) | | $ | (72,425) | | $ | (190,650) | | $ | (280,601) |
(Loss) profit for the period from discontinued operations | | | — | | | 5,399 | | | (4,372) | | | 5,399 | | | (84,637) |
Loss (profit) attributable to non-controlling interest | | | (779) | | | 450 | | | (866) | | | (3,417) | | | (5,039) |
Income tax (benefit) expense | | | 31,337 | | | 1,841 | | | (14,120) | | | 17,092 | | | (41,541) |
Net finance expense | | | 33,963 | | | 13,985 | | | 16,484 | | | 81,124 | | | 61,845 |
Financial derivatives loss (gain) | | | — | | | — | | | 1,153 | | | (3,168) | | | (2,729) |
Exchange differences | | | (7,327) | | | (13,157) | | | (4,366) | | | (25,553) | | | (2,884) |
Depreciation and amortization charges, operating allowances and write-downs | | | 25,538 | | | 26,524 | | | 30,029 | | | 108,189 | | | 120,194 |
EBITDA | | | (630) | | | (12,242) | | | (48,483) | | | (10,984) | | | (235,392) |
Impairment | | | 2,593 | | | 34,269 | | | 456 | | | 36,863 | | | 174,464 |
Revaluation of biological assets | | | — | | | — | | | (550) | | | — | | | 527 |
Contract termination costs | | | — | | | — | | | — | | | — | | | 9,260 |
Restructuring and termination costs | | | 3,774 | | | — | | | 3,000 | | | 3,774 | | | 5,894 |
Energy: France | | | — | | | — | | | 9,682 | | | 70 | | | 9,682 |
Energy: South Africa | | | — | | | — | | | 3,645 | | | — | | | 3,645 |
Staff Costs: South Africa | | | — | | | — | | | 327 | | | 155 | | | 327 |
Other Idling Costs | | | — | | | 204 | | | 1,532 | | | 2,887 | | | 1,532 |
(Loss)profit on disposal of non-core businesses | | | — | | | — | | | — | | | — | | | 822 |
Adjusted EBITDA | | $ | 5,737 | | $ | 22,231 | | $ | (30,391) | | $ | 32,765 | | $ | (29,239) |
Adjusted profit attributable to Ferroglobe ($,000):
| | Quarter Ended |
| Quarter Ended |
| Quarter Ended | | Year Ended |
| Year Ended | |||||
|
| December 31, 2020 | | September 30, 2020 | | December 31, 2019 | | December 31, 2020 | | December 31, 2019 | |||||
(Loss) profit attributable to the parent | | $ | (83,362) | | $ | (47,284) | | $ | (72,425) | | $ | (190,650) | | $ | (280,601) |
Tax rate adjustment | | | 48,234 | | | 14,511 | | | 15,251 | | | 71,995 | | | 90,241 |
Impairment | | | 1,763 | | | 23,303 | | | 310 | | | 25,067 | | | 118,636 |
Revaluation of biological assets | | | — | | | — | | | (374) | | | — | | | 358 |
Contract termination costs | | | — | | | — | | | — | | | — | | | 6,297 |
Restructuring and termination costs | | | 2,566 | | | — | | | 2,040 | | | 2,566 | | | 4,008 |
Energy: France | | | — | | | — | | | 6,584 | | | 48 | | | 6,584 |
Energy: South Africa | | | — | | | — | | | 2,479 | | | — | | | 2,479 |
Staff Costs: South Africa | | | — | | | — | | | 222 | | | 105 | | | 222 |
Other Idling Costs | | | — | | | 139 | | | 1,042 | | | 1,963 | | | 1,042 |
(Loss) profit on disposal of non-core businesses | | | — | | | (3,671) | | | (2,973) | | | (3,671) | | | (57,553) |
Adjusted (loss) profit attributable to the parent | | $ | (30,798) | | $ | (13,002) | | $ | (47,845) | | $ | (92,577) | | $ | (108,288) |
Adjusted diluted profit per share:
| | Quarter Ended |
| Quarter Ended |
| Quarter Ended | | Year Ended |
| Year Ended | |||||
|
| December 31, 2020 | | September 30, 2020 | | December 31, 2019 | | December 31, 2020 | | December 31, 2019 | |||||
Diluted (loss) profit per ordinary share | | $ | (0.49) | | $ | (0.28) | | $ | (0.43) | | $ | (1.13) | | $ | (1.66) |
Tax rate adjustment | | | — | | | (0.00) | | | 0.09 | | | — | | | 0.53 |
Impairment | | | 0.01 | | | 0.14 | | | 0.00 | | | 0.15 | | | 0.70 |
Revaluation of biological assets | | | — | | | — | | | (0.00) | | | — | | | 0.00 |
Contract termination costs | | | — | | | — | | | — | | | — | | | 0.04 |
Restructuring and termination costs | | | 0.02 | | | — | | | 0.01 | | | 0.02 | | | 0.02 |
Energy: France | | | — | | | — | | | 0.04 | | | 0.00 | | | 0.04 |
Energy: South Africa | | | — | | | — | | | 0.01 | | | — | | | 0.01 |
Staff Costs: South Africa | | | — | | | — | | | 0.00 | | | 0.00 | | | 0.00 |
Other Idling Costs | | | — | | | 0.00 | | | 0.01 | | | 0.01 | | | 0.01 |
(Loss) profit on disposal of non-core businesses | | | — | | | (0.02) | | | (0.02) | | | (0.02) | | | (0.34) |
Adjusted diluted (loss) profit per ordinary share | | $ | (0.47) | | $ | (0.16) | | $ | (0.28) | | $ | (0.98) | | $ | (0.65) |
| Advancing Materials Innovation NASDAQ: GSM Fourth Quarter and Full Year 2020 March 2, 2021 1 |

| Forward-Looking Statements and non-IFRS Financial Metrics 2 This presentation contains forward-looking statements within the meaning of Section 27A of the United States Securities Act of 1933, as amended, and Section 21E of the United States Securities Exchange Act of 1934, as amended. Forward-looking statements are not historical facts but are based on certain assumptions of management and describe our future plans, strategies and expectations. Forward-looking statements can generally be identified by the use of forward-looking terminology, including, but not limited to, "may," “could,” “seek,” “guidance,” “predict,” “potential,” “likely,” "believe," "will," "expect," "anticipate," "estimate," "plan," "intend," "forecast," “aim,” “target,” or variations of these terms and similar expressions, or the negative of these terms or similar expressions. Forward-looking statements contained in this presentation are based on information presently available to Ferroglobe PLC (“we,” “us,” “Ferroglobe,” the “Company” or the “Parent”) and assumptions that we believe to be reasonable, but are inherently uncertain. As a result, our actual results, performance or achievements may differ materially from those expressed or implied by these forward-looking statements, which are not guarantees of future performance and involve known and unknown risks, uncertainties and other factors that are, in some cases, beyond our control. You are cautioned that all such statements involve risks and uncertainties, including without limitation, risks that Ferroglobe will not successfully integrate the businesses of Globe Specialty Metals, Inc. and Grupo FerroAtlántica SAU, that we will not realize estimated cost savings, value of certain tax assets, synergies and growth, and/or that such benefits may take longer to realize than expected. Important factors that may cause actual results to differ include, but are not limited to: (i) risks relating to unanticipated costs of integration, including operating costs, customer loss and business disruption being greater than expected; (ii) our organizational and governance structure; (iii) the ability to hire and retain key personnel; (iv) regional, national or global political, economic, business, competitive, market and regulatory conditions including, among others, changes in metals prices; (v) increases in the cost of raw materials or energy; (vi) competition in the metals and foundry industries; (vii) environmental and regulatory risks; (viii) ability to identify liabilities associated with acquired properties prior to their acquisition; (ix) ability to manage price and operational risks including industrial accidents and natural disasters; (x) ability to manage foreign operations; (xi) changes in technology; (xii) ability to acquire or renew permits and approvals; (xiii) changes in legislation or governmental regulations affecting Ferroglobe; (xiv) conditions in the credit markets; (xv) risks associated with assumptions made in connection with critical accounting estimates and legal proceedings; (xvi) Ferroglobe's international operations, which are subject to the risks of currency fluctuations and foreign exchange controls; and (xvii) the potential of international unrest, economic downturn or effects of currencies, tax assessments, tax adjustments, anticipated tax rates, raw material costs or availability or other regulatory compliance costs. The foregoing list is not exhaustive. You should carefully consider the foregoing factors and the other risks and uncertainties that affect our business, including those described in the “Risk Factors” section of our Registration Statement on Form F-1, Annual Reports on Form 20-F, Current Reports on Form 6-K and other documents we file from time to time with the United States Securities and Exchange Commission. We do not give any assurance (1) that we will achieve our expectations or (2) concerning any result or the timing thereof, in each case, with respect to any regulatory action, administrative proceedings, government investigations, litigation, warning letters, consent decree, cost reductions, business strategies, earnings or revenue trends or future financial results. Forward- looking financial information and other metrics presented herein represent our key goals and are not intended as guidance or projections for the periods presented herein or any future periods. We do not undertake or assume any obligation to update publicly any of the forward-looking statements in this presentation to reflect actual results, new information or future events, changes in assumptions or changes in other factors affecting forward-looking statements. If we update one or more forward-looking statements, no inference should be drawn that we will make additional updates with respect to those or other forward-looking statements. We caution you not to place undue reliance on any forward-looking statements, which are made only as of the date of this presentation. Adjusted EBITDA, adjusted EBITDA margin, adjusted net profit, adjusted profit per share, working capital and net debt, are non-IFRS financial metrics that, we believe, are pertinent measures of Ferroglobe’s success. The Company has included these financial metrics to provide supplemental measures of its performance. We believe these metrics are important because they eliminate items that have less bearing on the Company’s current and future operating performance and highlight trends in its core business that may not otherwise be apparent when relying solely on IFRS financial measures. For additional information, including a reconciliation of the differences between such non-IFRS financial measures and the comparable IFRS financial measures, refer to the press release dated March 1, 2021 accompanying this presentation, which is incorporated by reference herein. |
| TABLE OF CONTENTS Q4 and Full Year 2020 Business Review Q4 and Full Year 2020 Financial Review Update on Strategic Plan Appendix — Supplemental Information |

| OPENING REMARKS 4 Q4 marked the ending to a challenging 2020 driven by the pandemic. Positive end market demand and pricing momentum into 2021 Successful cash management supported by various cost cutting initiatives and refinancing. New financing proposal supports full turnaround plan Strategic plan now in execution phase across all value creation areas |
| Q4 and Full Year 2020 Business Review I. |

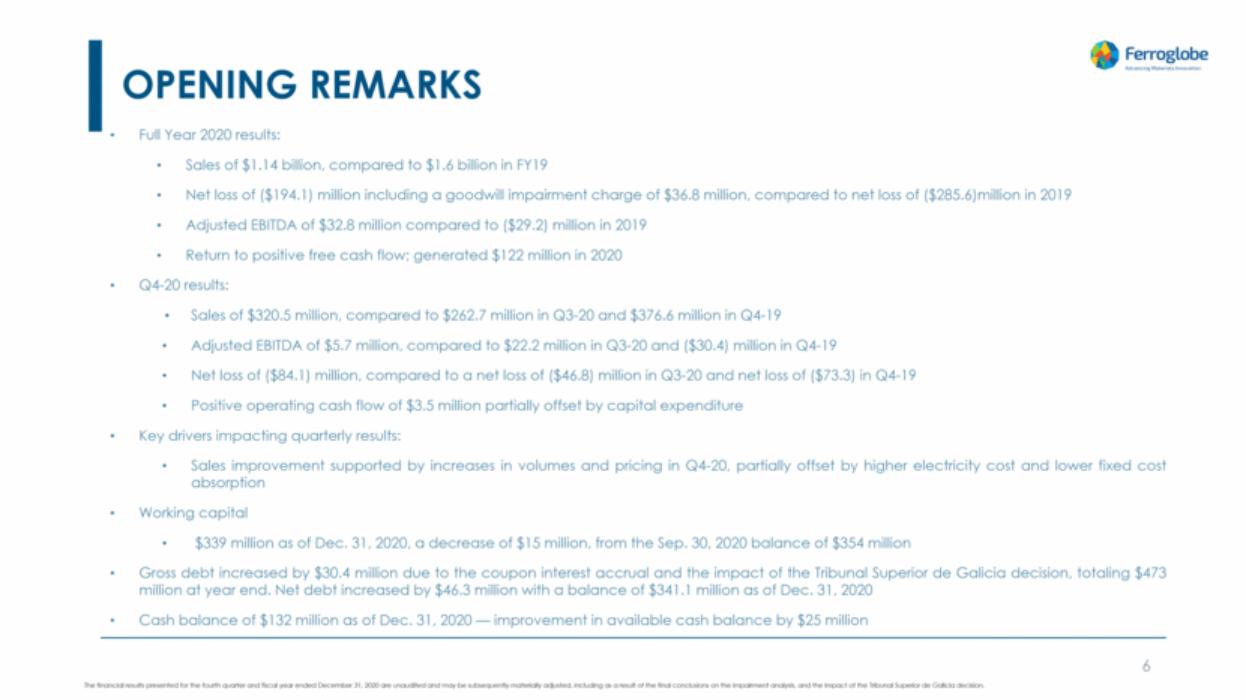
| Full Year 2020 results: Sales of $1.14 billion, compared to $1.6 billion in FY19 Net loss of ($194.1) million including a goodwill impairment charge of $36.8 million, compared to net loss of ($285.6)million in 2019 Adjusted EBITDA of $32.8 million compared to ($29.2) million in 2019 Return to positive free cash flow; generated $122 million in 2020 Q4-20 results: Sales of $320.5 million, compared to $262.7 million in Q3-20 and $376.6 million in Q4-19 Adjusted EBITDA of $5.7 million, compared to $22.2 million in Q3-20 and ($30.4) million in Q4-19 Net loss of ($84.1) million, compared to a net loss of ($46.8) million in Q3-20 and net loss of ($73.3) in Q4-19 Positive operating cash flow of $3.5 million partially offset by capital expenditure Key drivers impacting quarterly results: Sales improvement supported by increases in volumes and pricing in Q4-20, partially offset by higher electricity cost and lower fixed cost absorption Working capital $339 million as of Dec. 31, 2020, a decrease of $15 million, from the Sep. 30, 2020 balance of $354 million Gross debt increased by $30.4 million due to the coupon interest accrual and the impact of the Tribunal Superior de Galicia decision, totaling $473 million at year end. Net debt increased by $46.3 million with a balance of $341.1 million as of Dec. 31, 2020 Cash balance of $132 million as of Dec. 31, 2020 — improvement in available cash balance by $25 million OPENING REMARKS 6 |
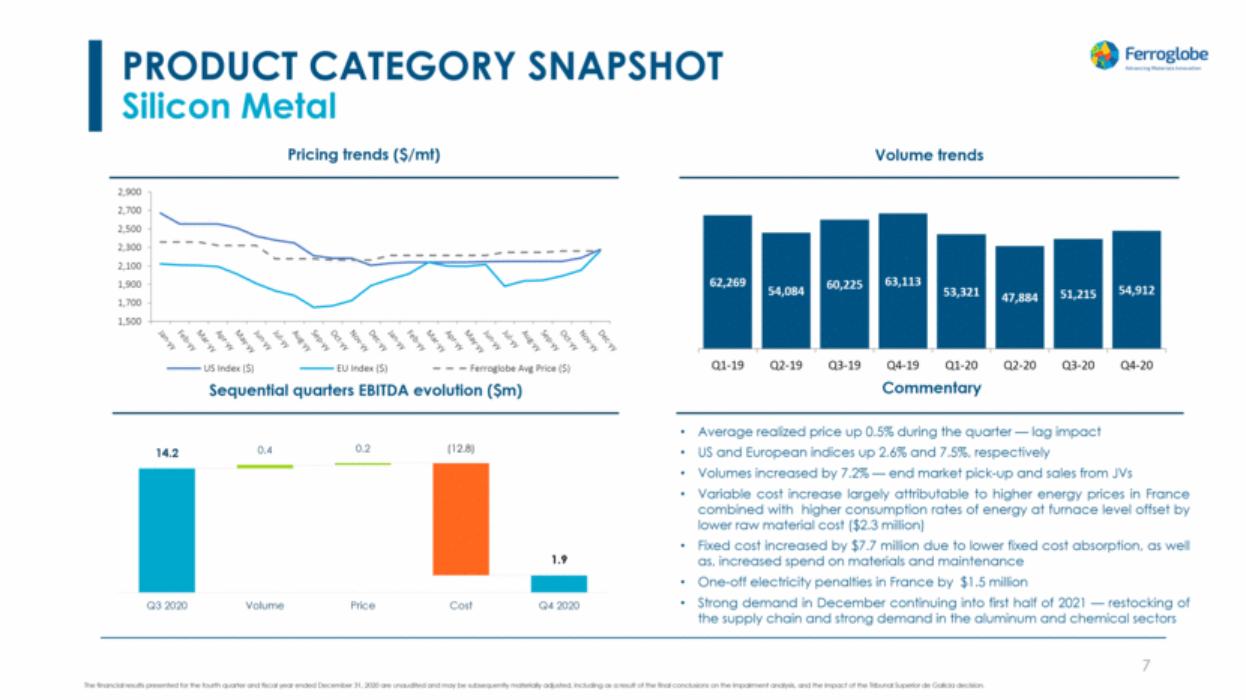
| PRODUCT CATEGORY SNAPSHOT Silicon Metal 7 Sequential quarters EBITDA evolution ($m) Commentary Volume trends Pricing trends ($/mt) Average realized price up 0.5% during the quarter — lag impact US and European indices up 2.6% and 7.5%, respectively Volumes increased by 7.2% — end market pick-up and sales from JVs Variable cost increase largely attributable to higher energy prices in France combined with higher consumption rates of energy at furnace level offset by lower raw material cost ($2.3 million) Fixed cost increased by $7.7 million due to lower fixed cost absorption, as well as, increased spend on materials and maintenance One-off electricity penalties in France by $1.5 million Strong demand in December continuing into first half of 2021 — restocking of the supply chain and strong demand in the aluminum and chemical sectors 1,500 1,700 1,900 2,100 2,300 2,500 2,700 2,900 US Index ($) EU Index ($) Ferroglobe Avg Price ($) 62,269 54,084 60,225 63,113 53,321 47,884 51,215 54,912 Q1-19 Q2-19 Q3-19 Q4-19 Q1-20 Q2-20 Q3-20 Q4-20 14.2 0.4 0.2 (12.8) 1.9 Q3 2020 Volume Price Cost Q4 2020 |
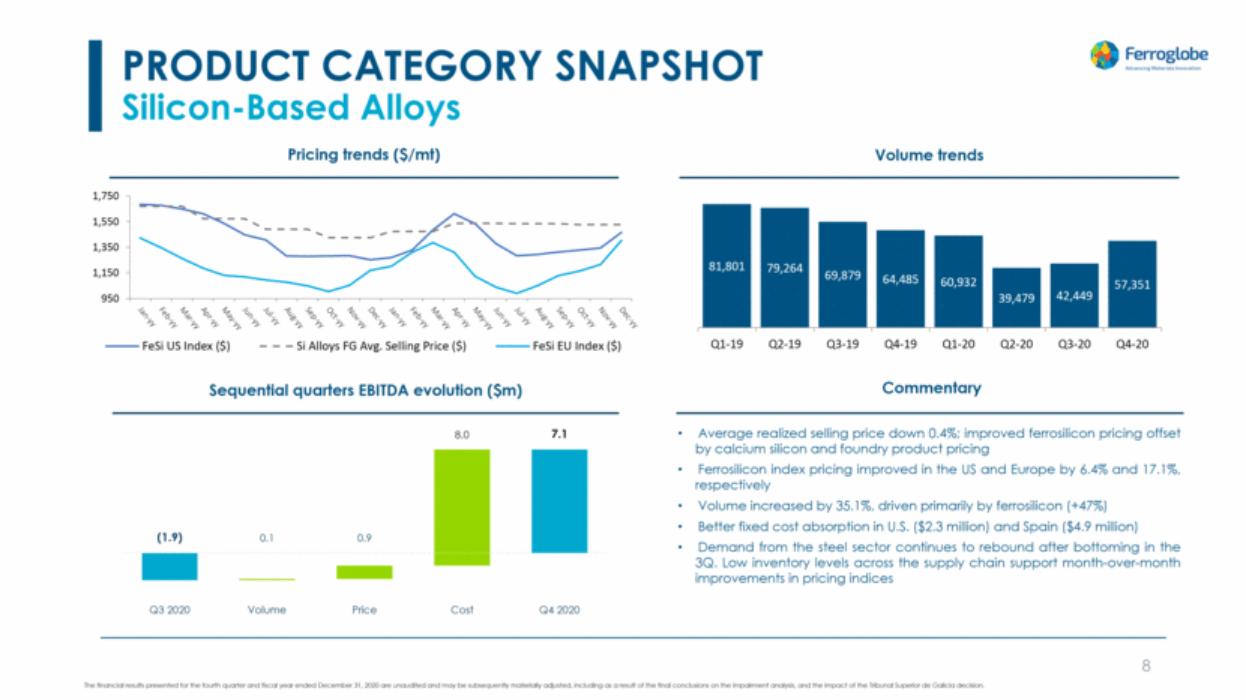
| PRODUCT CATEGORY SNAPSHOT Silicon-Based Alloys 8 Sequential quarters EBITDA evolution ($m) Commentary Volume trends Pricing trends ($/mt) Average realized selling price down 0.4%; improved ferrosilicon pricing offset by calcium silicon and foundry product pricing Ferrosilicon index pricing improved in the US and Europe by 6.4% and 17.1%, respectively Volume increased by 35.1%, driven primarily by ferrosilicon (+47%) Better fixed cost absorption in U.S. ($2.3 million) and Spain ($4.9 million) Demand from the steel sector continues to rebound after bottoming in the 3Q. Low inventory levels across the supply chain support month-over-month improvements in pricing indices 81,801 79,264 69,879 64,485 60,932 39,479 42,449 57,351 Q1-19 Q2-19 Q3-19 Q4-19 Q1-20 Q2-20 Q3-20 Q4-20 950 1,150 1,350 1,550 1,750 FeSi US Index ($) Si Alloys FG Avg. Selling Price ($) FeSi EU Index ($) (1.9) 0.1 0.9 8.0 7.1 Q3 2020 Volume Price Cost Q4 2020 |
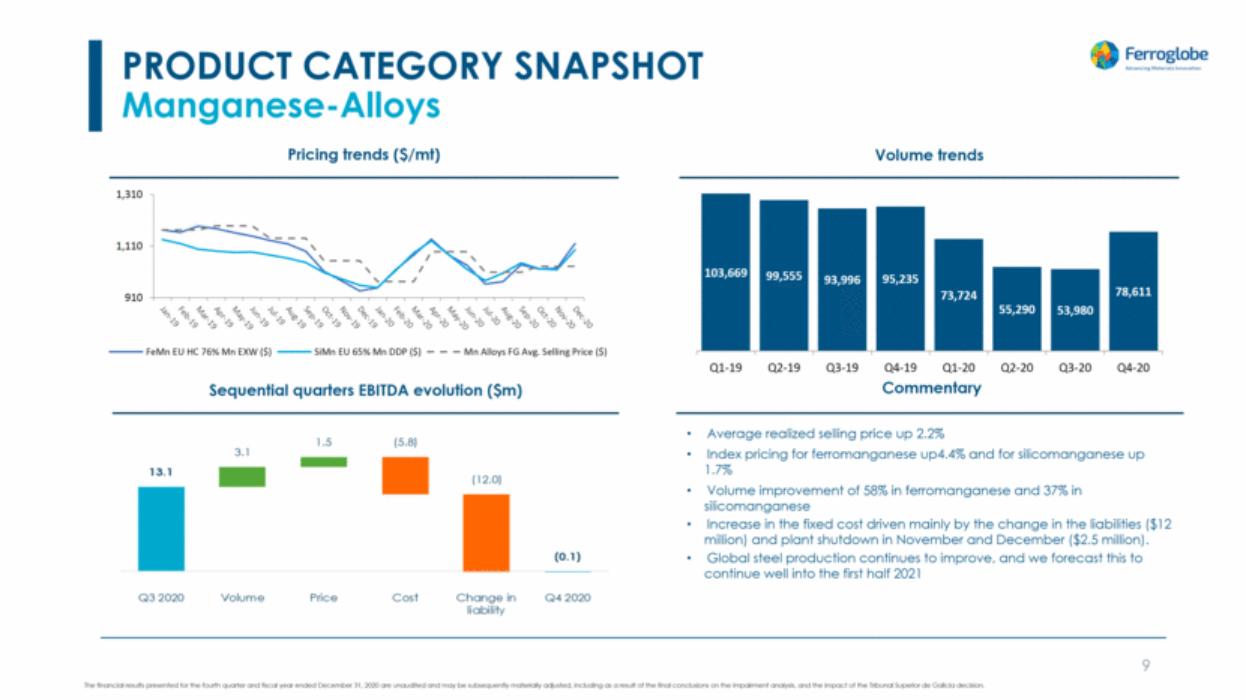
| PRODUCT CATEGORY SNAPSHOT Manganese-Alloys 9 Sequential quarters EBITDA evolution ($m) Commentary Volume trends Pricing trends ($/mt) Average realized selling price up 2.2% Index pricing for ferromanganese up4.4% and for silicomanganese up 1.7% Volume improvement of 58% in ferromanganese and 37% in silicomanganese Increase in the fixed cost driven mainly by the change in the liabilities ($12 million) and plant shutdown in November and December ($2.5 million). Global steel production continues to improve, and we forecast this to continue well into the first half 2021 103,669 99,555 93,996 95,235 73,724 55,290 53,980 78,611 Q1-19 Q2-19 Q3-19 Q4-19 Q1-20 Q2-20 Q3-20 Q4-20 910 1,110 1,310 FeMn EU HC 76% Mn EXW ($) SiMn EU 65% Mn DDP ($) Mn Alloys FG Avg. Selling Price ($) |
| Q4 and Full Year 2020 Financial Review II. |

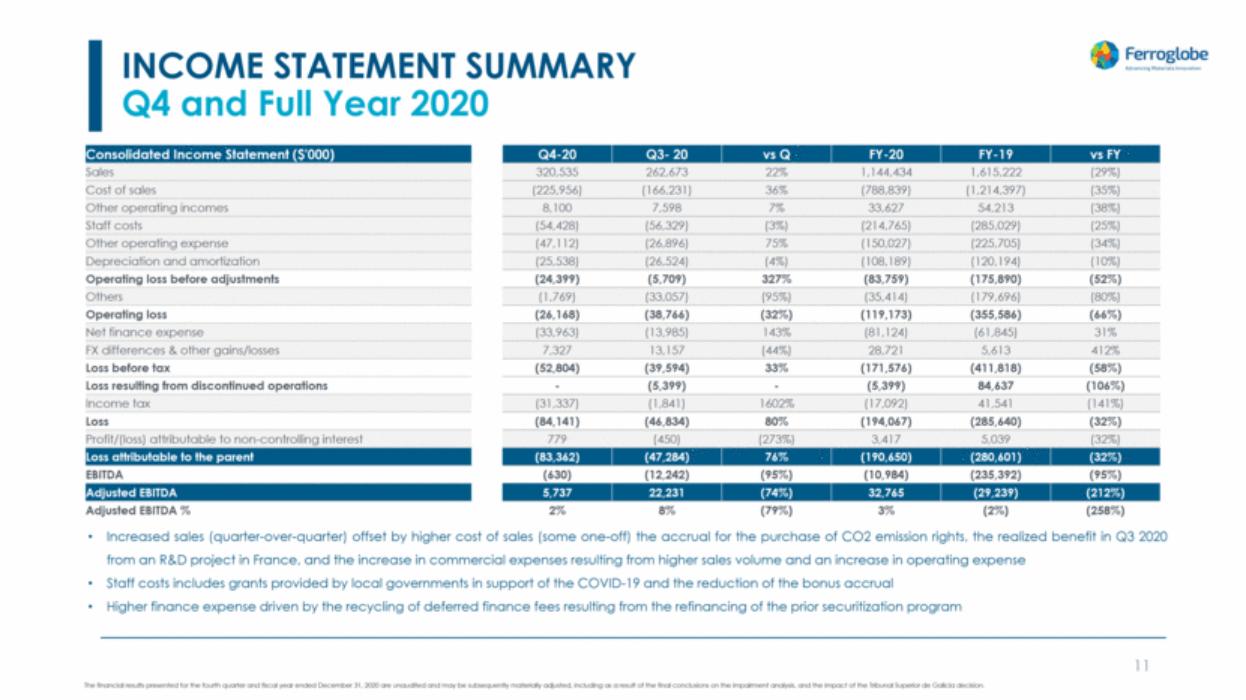
| Increased sales (quarter-over-quarter) offset by higher cost of sales (some one-off) the accrual for the purchase of CO2 emission rights, the realized benefit in Q3 2020 from an R&D project in France, and the increase in commercial expenses resulting from higher sales volume and an increase in operating expense Staff costs includes grants provided by local governments in support of the COVID-19 and the reduction of the bonus accrual Higher finance expense driven by the recycling of deferred finance fees resulting from the refinancing of the prior securitization program INCOME STATEMENT SUMMARY Q4 and Full Year 2020 11 Consolidated Income Statement ($'000) Q4-20 Q3- 20 vs Q FY-20 FY-19 vs FY Sales 320,535 262,673 22% 1,144,434 1,615,222 (29%) Cost of sales (225,956) (166,231) 36% (788,839) (1,214,397) (35%) Other operating incomes 8,100 7,598 7% 33,627 54,213 (38%) Staff costs (54,428) (56,329) (3%) (214,765) (285,029) (25%) Other operating expense (47,112) (26,896) 75% (150,027) (225,705) (34%) Depreciation and amortization (25,538) (26,524) (4%) (108,189) (120,194) (10%) Operating loss before adjustments (24,399) (5,709) 327% (83,759) (175,890) (52%) Others (1,769) (33,057) (95%) (35,414) (179,696) (80%) Operating loss (26,168) (38,766) (32%) (119,173) (355,586) (66%) Net finance expense (33,963) (13,985) 143% (81,124) (61,845) 31% FX differences & other gains/losses 7,327 13,157 (44%) 28,721 5,613 412% Loss before tax (52,804) (39,594) 33% (171,576) (411,818) (58%) Loss resulting from discontinued operations - (5,399) - (5,399) 84,637 (106%) Income tax (31,337) (1,841) 1602% (17,092) 41,541 (141%) Loss (84,141) (46,834) 80% (194,067) (285,640) (32%) Profit/(loss) attributable to non-controlling interest 779 (450) (273%) 3,417 5,039 (32%) Loss attributable to the parent (83,362) (47,284) 76% (190,650) (280,601) (32%) EBITDA (630) (12,242) (95%) (10,984) (235,392) (95%) Adjusted EBITDA 5,737 22,231 (74%) 32,765 (29,239) (212%) Adjusted EBITDA % 2% 8% (79%) 3% (2%) (258%) |
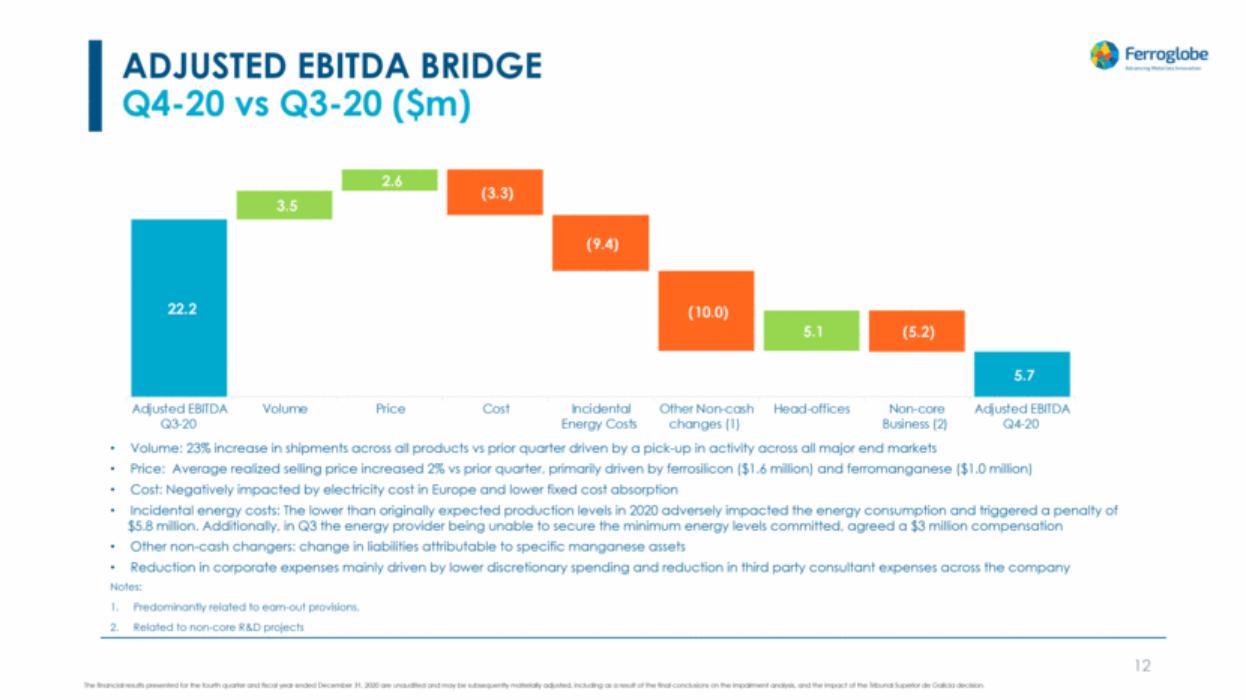
| ADJUSTED EBITDA BRIDGE Q4-20 vs Q3-20 ($m) 12 Volume: 23% increase in shipments across all products vs prior quarter driven by a pick-up in activity across all major end markets Price: Average realized selling price increased 2% vs prior quarter, primarily driven by ferrosilicon ($1.6 million) and ferromanganese ($1.0 million) Cost: Negatively impacted by electricity cost in Europe and lower fixed cost absorption Incidental energy costs: The lower than originally expected production levels in 2020 adversely impacted the energy consumption and triggered a penalty of $5.8 million. Additionally, in Q3 the energy provider being unable to secure the minimum energy levels committed, agreed a $3 million compensation Other non-cash changers: change in liabilities attributable to specific manganese assets Reduction in corporate expenses mainly driven by lower discretionary spending and reduction in third party consultant expenses across the company Notes: Predominantly related to earn-out provisions. Related to non-core R&D projects |
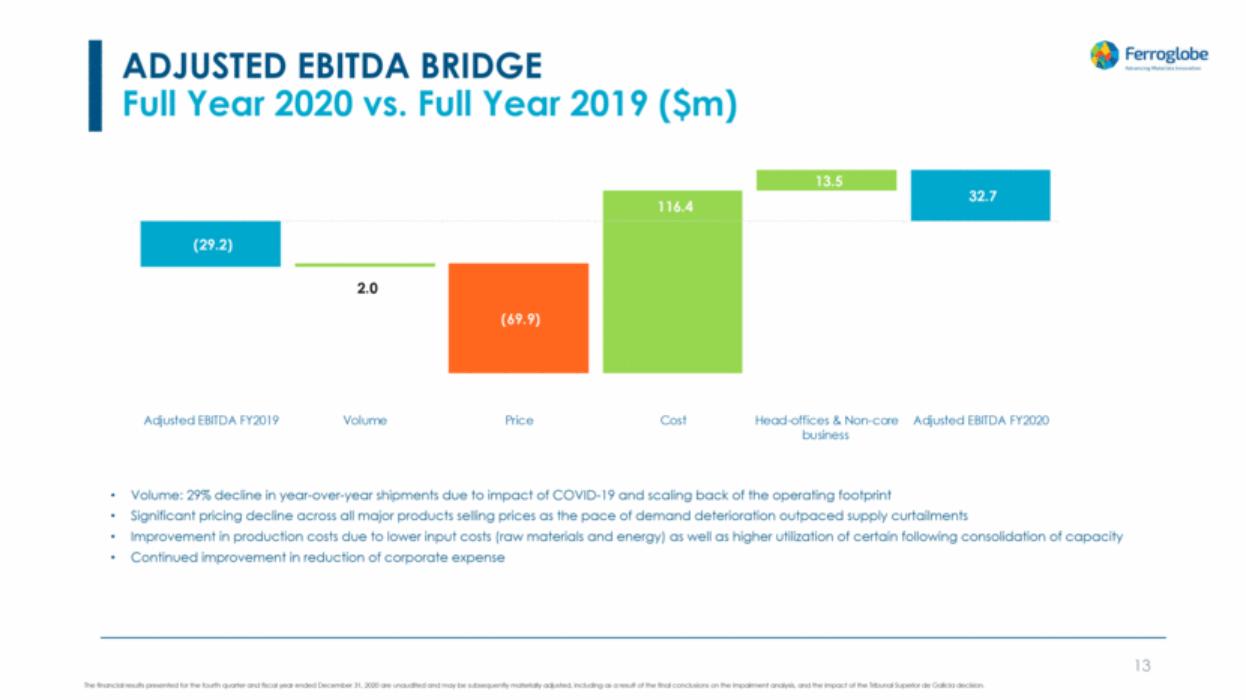
| ADJUSTED EBITDA BRIDGE Full Year 2020 vs. Full Year 2019 ($m) 13 Volume: 29% decline in year-over-year shipments due to impact of COVID-19 and scaling back of the operating footprint Significant pricing decline across all major products selling prices as the pace of demand deterioration outpaced supply curtailments Improvement in production costs due to lower input costs (raw materials and energy) as well as higher utilization of certain following consolidation of capacity Continued improvement in reduction of corporate expense |
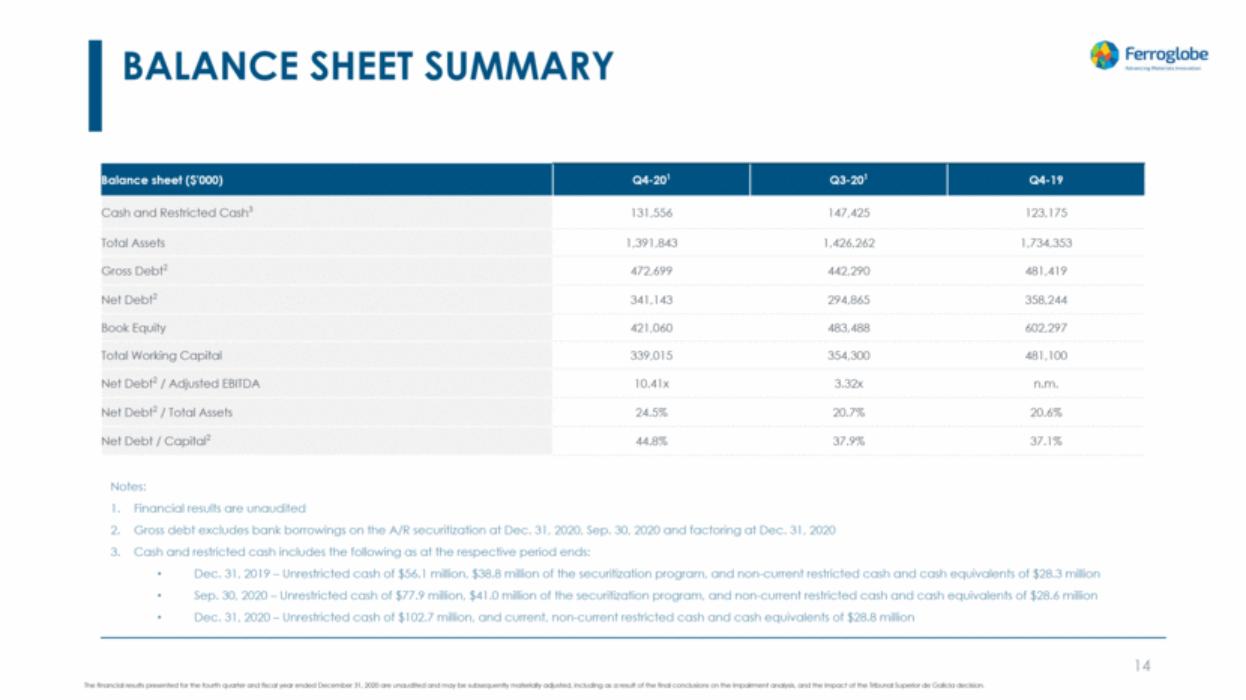
| BALANCE SHEET SUMMARY 14 Notes: Financial results are unaudited Gross debt excludes bank borrowings on the A/R securitization at Dec. 31, 2020, Sep. 30, 2020 and factoring at Dec. 31, 2020 Cash and restricted cash includes the following as at the respective period ends: Dec. 31, 2019 – Unrestricted cash of $56.1 million, $38.8 million of the securitization program, and non-current restricted cash and cash equivalents of $28.3 million Sep. 30, 2020 – Unrestricted cash of $77.9 million, $41.0 million of the securitization program, and non-current restricted cash and cash equivalents of $28.6 million Dec. 31, 2020 – Unrestricted cash of $102.7 million, and current, non-current restricted cash and cash equivalents of $28.8 million Balance sheet ($'000) Q4-201 Q3-201 Q4-19 Cash and Restricted Cash3 131,556 147,425 123,175 Total Assets 1,391,843 1,426,262 1,734,353 Gross Debt2 472,699 442,290 481,419 Net Debt2 341,143 294,865 358,244 Book Equity 421,060 483,488 602,297 Total Working Capital 339,015 354,300 481,100 Net Debt2 / Adjusted EBITDA 10.41x 3.32x n.m. Net Debt2 / Total Assets 24.5% 20.7% 20.6% Net Debt / Capital2 44.8% 37.9% 37.1% |
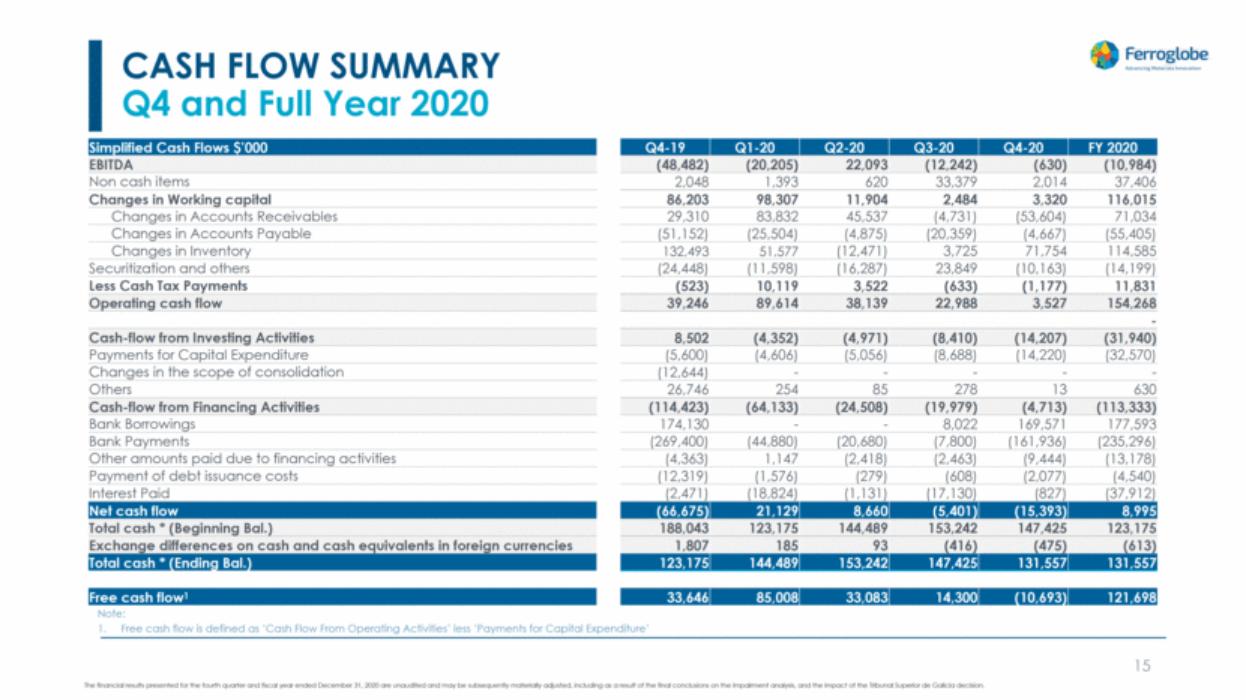
| CASH FLOW SUMMARY Q4 and Full Year 2020 15 Note: Free cash flow is defined as ‘Cash Flow From Operating Activities’ less ‘Payments for Capital Expenditure’ Simplified Cash Flows $’000 Q4-19 Q1-20 Q2-20 Q3-20 Q4-20 FY 2020 EBITDA (48,482) (20,205) 22,093 (12,242) (630) (10,984) Non cash items 2,048 1,393 620 33,379 2,014 37,406 Changes in Working capital 86,203 98,307 11,904 2,484 3,320 116,015 Changes in Accounts Receivables 29,310 83,832 45,537 (4,731) (53,604) 71,034 Changes in Accounts Payable (51,152) (25,504) (4,875) (20,359) (4,667) (55,405) Changes in Inventory 132,493 51,577 (12,471) 3,725 71,754 114,585 Securitization and others (24,448) (11,598) (16,287) 23,849 (10,163) (14,199) Less Cash Tax Payments (523) 10,119 3,522 (633) (1,177) 11,831 Operating cash flow 39,246 89,614 38,139 22,988 3,527 154,268 - Cash-flow from Investing Activities 8,502 (4,352) (4,971) (8,410) (14,207) (31,940) Payments for Capital Expenditure (5,600) (4,606) (5,056) (8,688) (14,220) (32,570) Changes in the scope of consolidation (12,644) - - - - - Others 26,746 254 85 278 13 630 Cash-flow from Financing Activities (114,423) (64,133) (24,508) (19,979) (4,713) (113,333) Bank Borrowings 174,130 - - 8,022 169,571 177,593 Bank Payments (269,400) (44,880) (20,680) (7,800) (161,936) (235,296) Other amounts paid due to financing activities (4,363) 1,147 (2,418) (2,463) (9,444) (13,178) Payment of debt issuance costs (12,319) (1,576) (279) (608) (2,077) (4,540) Interest Paid (2,471) (18,824) (1,131) (17,130) (827) (37,912) Net cash flow (66,675) 21,129 8,660 (5,401) (15,393) 8,995 Total cash * (Beginning Bal.) 188,043 123,175 144,489 153,242 147,425 123,175 Exchange differences on cash and cash equivalents in foreign currencies 1,807 185 93 (416) (475) (613) Total cash * (Ending Bal.) 123,175 144,489 153,242 147,425 131,557 131,557 - Free cash flow1 33,646 85,008 33,083 14,300 (10,693) 121,698 |
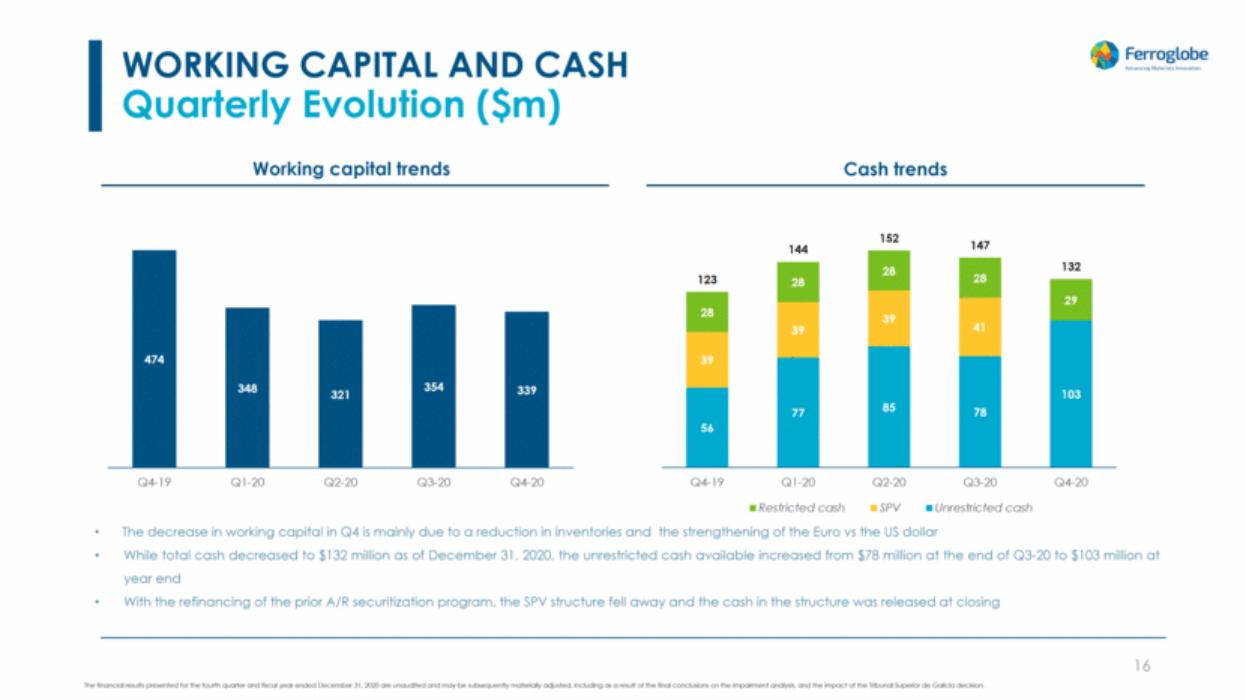
| Cash trends WORKING CAPITAL AND CASH Quarterly Evolution ($m) 16 Working capital trends The decrease in working capital in Q4 is mainly due to a reduction in inventories and the strengthening of the Euro vs the US dollar While total cash decreased to $132 million as of December 31, 2020, the unrestricted cash available increased from $78 million at the end of Q3-20 to $103 million at year end With the refinancing of the prior A/R securitization program, the SPV structure fell away and the cash in the structure was released at closing 474 348 321 354 339 Q4-19 Q1-20 Q2-20 Q3-20 Q4-20 56 77 85 78 103 39 39 39 41 28 28 28 28 29 123 144 152 147 132 Q4-19 Q1-20 Q2-20 Q3-20 Q4-20 Restricted cash SPV Unrestricted cash |
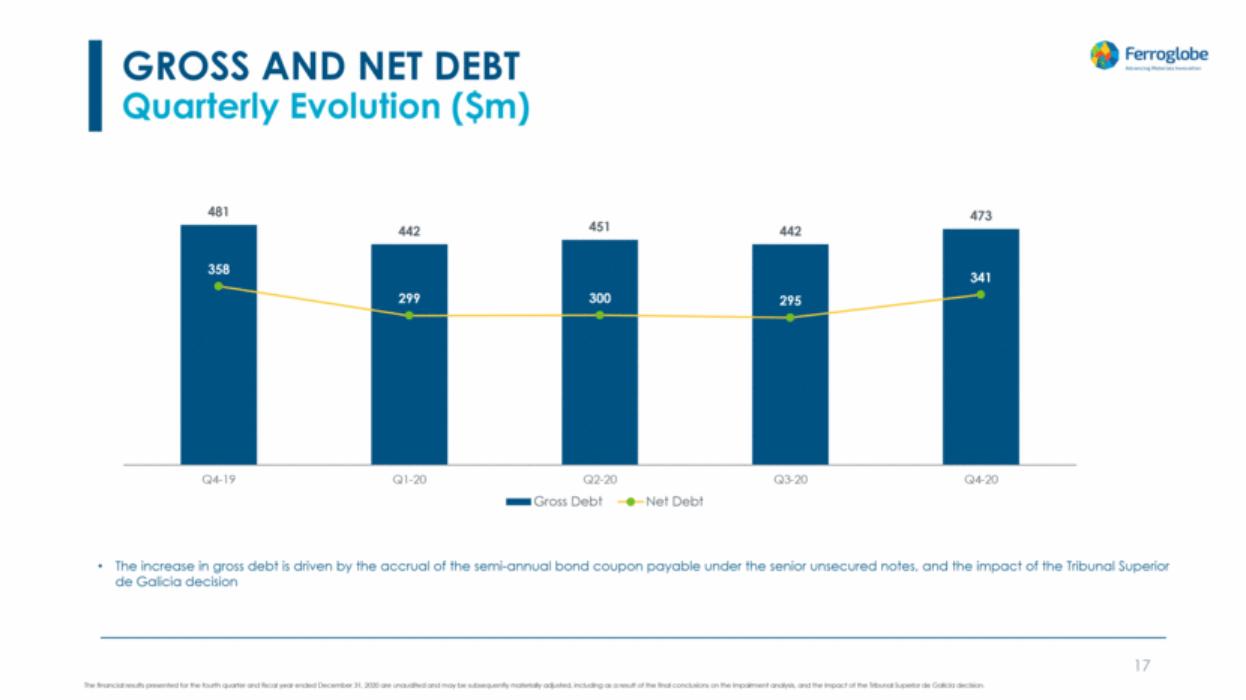
| GROSS AND NET DEBT Quarterly Evolution ($m) 17 The increase in gross debt is driven by the accrual of the semi-annual bond coupon payable under the senior unsecured notes, and the impact of the Tribunal Superior de Galicia decision 481 442 451 442 473 358 299 300 295 341 Q4-19 Q1-20 Q2-20 Q3-20 Q4-20 Gross Debt Net Debt |
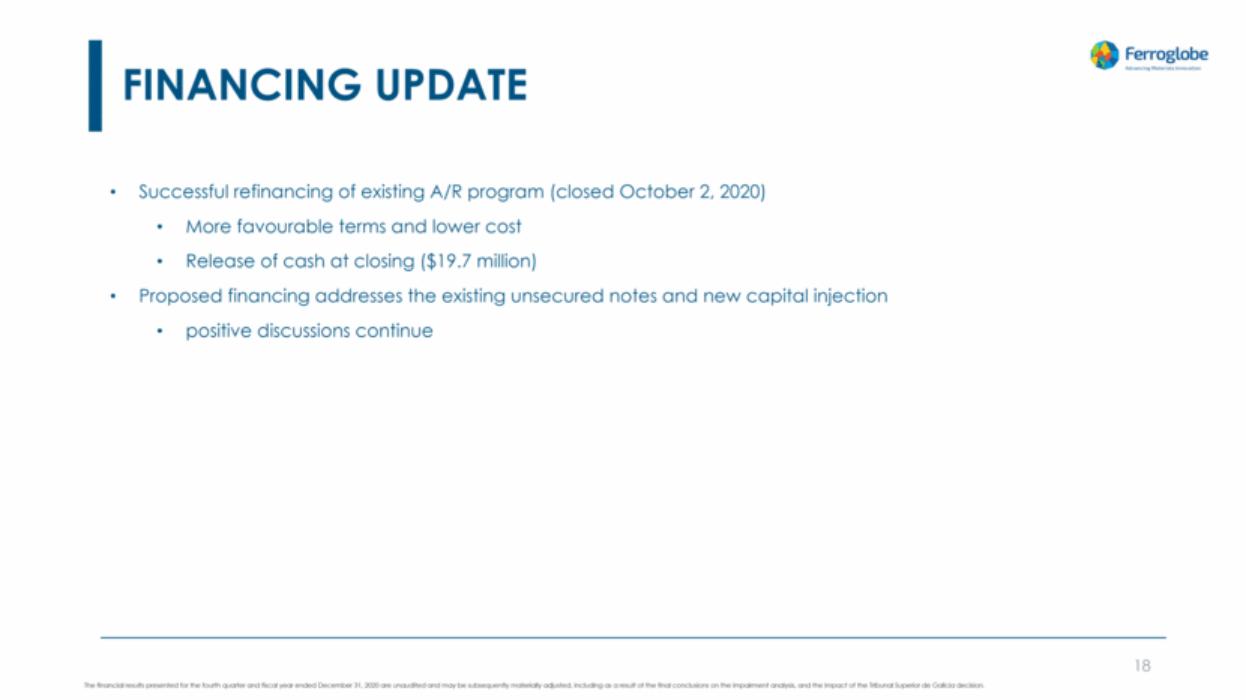
| Successful refinancing of existing A/R program (closed October 2, 2020) More favourable terms and lower cost Release of cash at closing ($19.7 million) Proposed financing addresses the existing unsecured notes and new capital injection positive discussions continue FINANCING UPDATE 18 |
| Update on Strategic Plan III. |

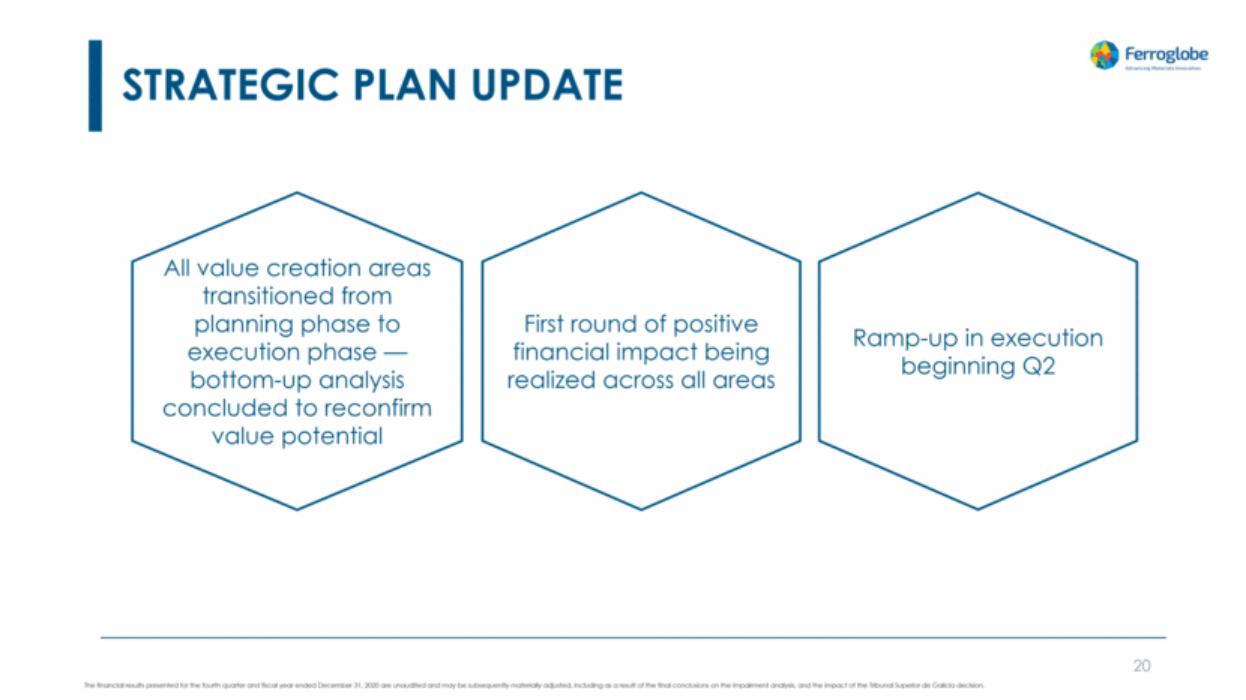
| STRATEGIC PLAN UPDATE 20 All value creation areas transitioned from planning phase to execution phase — bottom-up analysis concluded to reconfirm value potential First round of positive financial impact being realized across all areas Ramp-up in execution beginning Q2 |
| Q&A |

| Appendix — Supplemental Information IV. |

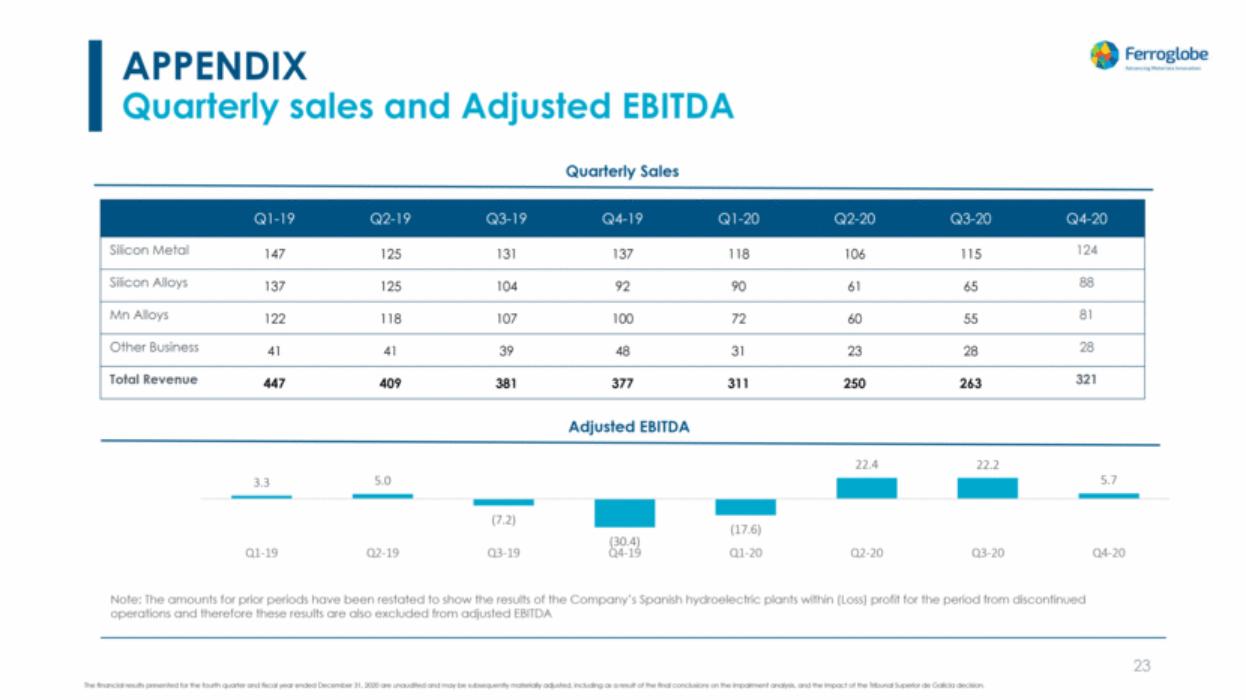
| APPENDIX Quarterly sales and Adjusted EBITDA 23 Note: The amounts for prior periods have been restated to show the results of the Company’s Spanish hydroelectric plants within (Loss) profit for the period from discontinued operations and therefore these results are also excluded from adjusted EBITDA Adjusted EBITDA Quarterly Sales Q1-19 Q2-19 Q3-19 Q4-19 Q1-20 Q2-20 Q3-20 Q4-20 Silicon Metal 147 125 131 137 118 106 115 124 Silicon Alloys 137 125 104 92 90 61 65 88 Mn Alloys 122 118 107 100 72 60 55 81 Other Business 41 41 39 48 31 23 28 28 Total Revenue 447 409 381 377 311 250 263 321 3.3 5.0 (7.2) (30.4) (17.6) 22.4 22.2 5.7 Q1-19 Q2-19 Q3-19 Q4-19 Q1-20 Q2-20 Q3-20 Q4-20 |
| APPENDIX Gross Debt at December 31, 2020 24 ($’000) Gross debt Bank borrowings: Asset-Based Loan (3) 27,237 Trade letters of credit - Other bank loans (4) 5,525 32,762 Finance leases: Hydro leases - Other finance leases 17,837 17,837 Debt instruments: Principal Senior Notes 350,000 Debt issuance costs (3,380) Accrued coupon interest 10,888 357,508 Other financial liabilities: Reindus loan 59,974 Cross currency swap -- Other government loans (5) 4,618 64,592 Total 472,699 Notes: Operating leases have been excluded from the presentation for comparison purposes to align to the balance sheet to the balance sheet prior to IFRS16 adoption Factoring signed on October 2, 2020, net of issuance costs of $1 million Asset-Based loan stated net of unamortised debt issuance costs of $4 million Other bank loans include COVID-19 funding received in France with a supported guarantee from the French Government Other government loans include COVID-19 funding received in Canada from the Government for $3.0 million among others ($’000) Current Non-current Total balance sheet Less operating leases (1) Less Factoring(2) Gross debt Bank borrowings 75,093 32,513 107,606 (74,844) 32,762 Lease liabilities 10,032 29,399 39,431 (21,594) 17,837 Debt instruments 10,888 346,620 357,508 357,508 Other financial liabilities 25,466 39,126 64,592 64,592 Total 121,479 447,658 569,137 (21,594) (74,844) 472,699 |

| THANK YOU Web www.ferroglobe.com 25 |
Serious News for Serious Traders! Try StreetInsider.com Premium Free!
You May Also Be Interested In
- Transaction in Own Shares
- Inverness Graham Strengthens its Value Creation Group with the Addition of Two Seasoned Operating Executives
- Natuzzi Celebrates Its 65th Anniversary by Bringing Its Harmony and Its New Collections on the Stage of the High Point Market in US and of the Design Week in Milan
Create E-mail Alert Related Categories
SEC FilingsSign up for StreetInsider Free!
Receive full access to all new and archived articles, unlimited portfolio tracking, e-mail alerts, custom newswires and RSS feeds - and more!
