

Form 6-K Ferroglobe PLC For: Jul 12
 Tweet
Tweet Share
ShareSECURITIES AND EXCHANGE COMMISSION
Washington, D.C. 20549
FORM 6-K
REPORT OF FOREIGN PRIVATE ISSUER
Pursuant to Rule 13a-16 or 15d-16
under the Securities Exchange Act of 1934
For the Month of July, 2022
Commission File Number: 001-37668
FERROGLOBE PLC
(Name of Registrant)
5 Fleet Place
London, EC4M7RD
(Address of Principal Executive Office)
Indicate by check mark whether the registrant files or will file annual reports under cover of Form 20-F or Form 40-F.
Form 20-F ☒ | Form 40-F ☐ |
Indicate by check mark if the registrant is submitting the Form 6-K in paper as permitted by Regulation S-T Rule 101(b)(1): ☐
Indicate by check mark if the registrant is submitting the Form 6-K in paper as permitted by Regulation S-T Rule 101(b)(7): ☐
Virtual Investor Day
Ferroglobe PLC held a virtual investor day on Tuesday, July 12, 2022. The slides used during the presentation are available on the Company's website and are set forth in the attached exhibit, which is being furnished herewith.
Exhibit
Reference is made to the exhibit attached hereto.
SIGNATURES
Pursuant to the requirements of the Securities Exchange Act of 1934, the registrant has duly caused this report to be signed on its behalf by the undersigned, thereunto duly authorized.
| Date: July 12, 2022 | |
| FERROGLOBE PLC | |
|
|
|
| by | /s/ Marco Levi |
|
| Name: Marco Levi |
|
| Title: Chief Executive Officer (Principal Executive Officer) |
| Investor Day July 12th, 2022 |
| DISCLAIMER Forward Looking Statements This presentation contains forward looking statements These forward looking statements include, but are not limited to, all statements other than statements of historical facts contained in this presentation, including, without limitation, those regarding our future financial position and results of operations, our strategy, plans, objectives, goals and targets, future developments in the markets in which we operate or are seeking to operate or anticipated regulatory or other changes in the markets in which we operate or intend to operate. In some cases, you can identify forward looking statements by terminology such as “anticipate”, “believe”, “could”, “estimate”, “expect”, “forecast”, “guidance”, “intends”, “likely”, “may”, “plan”, “potential”, “predicts”, “seek”, “will” and words of similar meaning or the negative thereof. By their nature, forward looking statements involve risks and uncertainties because they relate to events and depend on circumstances that may or may not occur in the future. Forward looking statements speak only as of the date of this presentation and are not guarantees of future performance and are based on numerous assumptions. Our actual results of operations, financial condition and the development of events may differ materially from (and be more negative than) those made in, or suggested by, the forward-looking statements in this presentation. Except as required by law, we do not undertake any obligation to update any forward-looking statements to reflect events or circumstances after the date hereof or to reflect anticipated or unanticipated events or circumstances. Investors should read the section entitled "Item 3 D - Risk Factors" and the description of business in the section entitled "Item 4 - Information on the Company ", each in our Annual Report on Form 20-F for the fiscal year ended December 31, 2021, filed with the Securities and Exchange Commission, for a more complete discussion of the risks and factors that could affect us. Non-GAAP Financial Information This presentation also includes certain non-GAAP financial measures, including adjusted EBITDA, adjusted EBITDA margin, adjusted net profit, adjusted profit per share, working capital and net debt. Non-GAAP financial measures are not measurements of our performance or liquidity under IFRS as issued by IASB and should not be considered alternatives to operating profit or profit for the period or any other performance measures derived in accordance with IFRS as issued by the IASB or any other generally accepted accounting principles or as alternatives to cash flow from operating, investing or financing activities. The company has included these financial metrics to provide supplemental measures of its performance. The Company believes these metrics are important and useful to investors because they eliminate items that have less bearing on the Company’s current and future operating performance and highlight trends in its core business that may not otherwise be apparent when relying solely on IFRS financial measures. 2 |
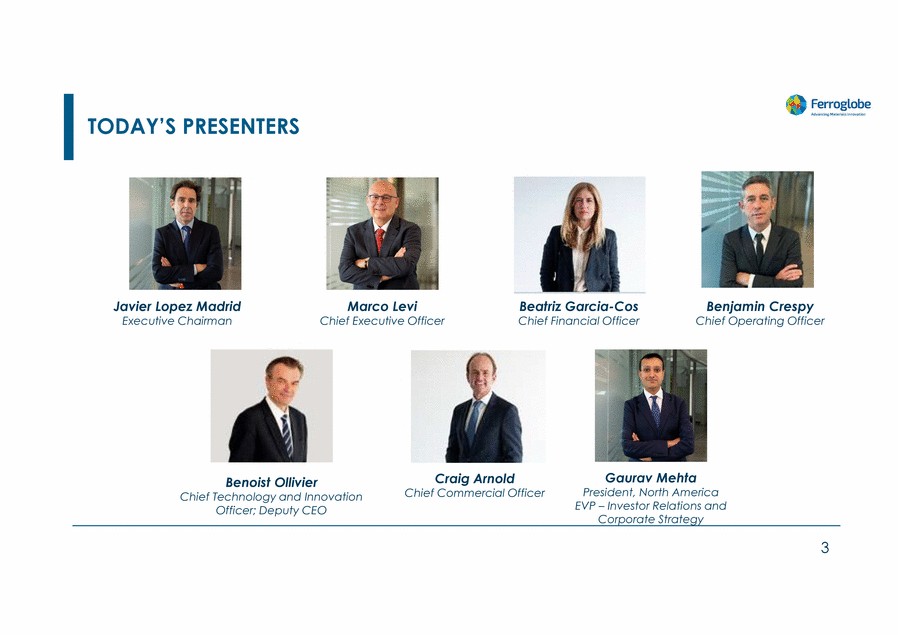
| TODAY’S PRESENTERS Javier Lopez Madrid Executive Chairman Marco Levi Chief Executive Officer Beatriz Garcia-Cos Chief Financial Officer Benjamin Crespy Chief Operating Officer Craig Arnold Chief Commercial Officer Gaurav Mehta President, North America EVP – Investor Relations and Benoist Ollivier Chief Technology and Innovation Officer; Deputy CEO Corporate Strategy 3 |
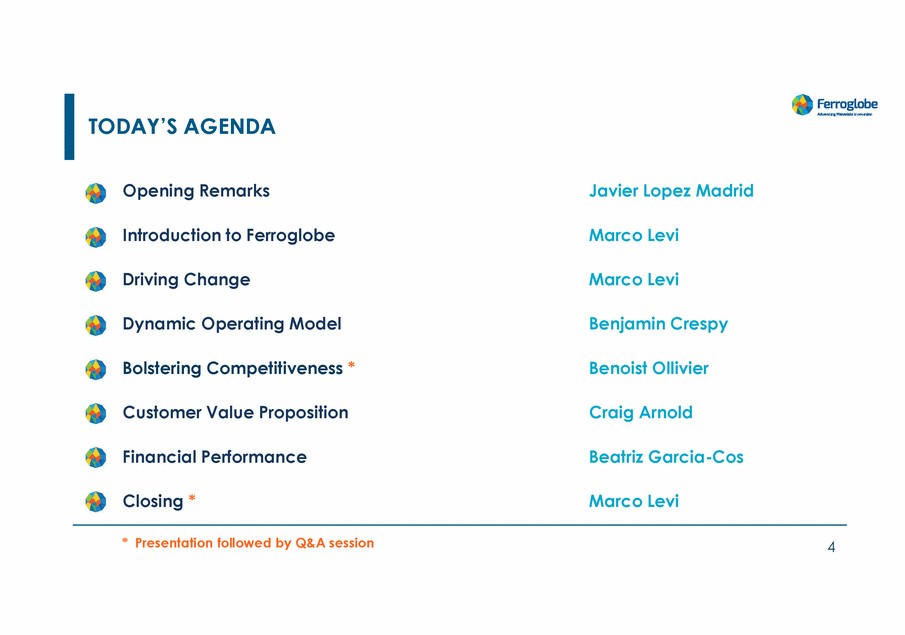
| TODAY’S AGENDA Opening Remarks Javier Lopez Madrid Introduction to Ferroglobe Marco Levi Driving Change Marco Levi Dynamic Operating Model Benjamin Crespy Bolstering Competitiveness * Benoist Ollivier Customer Value Proposition Craig Arnold Financial Performance Beatriz Garcia-Cos Closing * Marco Levi * Presentation followed by Q&A session 4 |
| OPENING REMARKS |
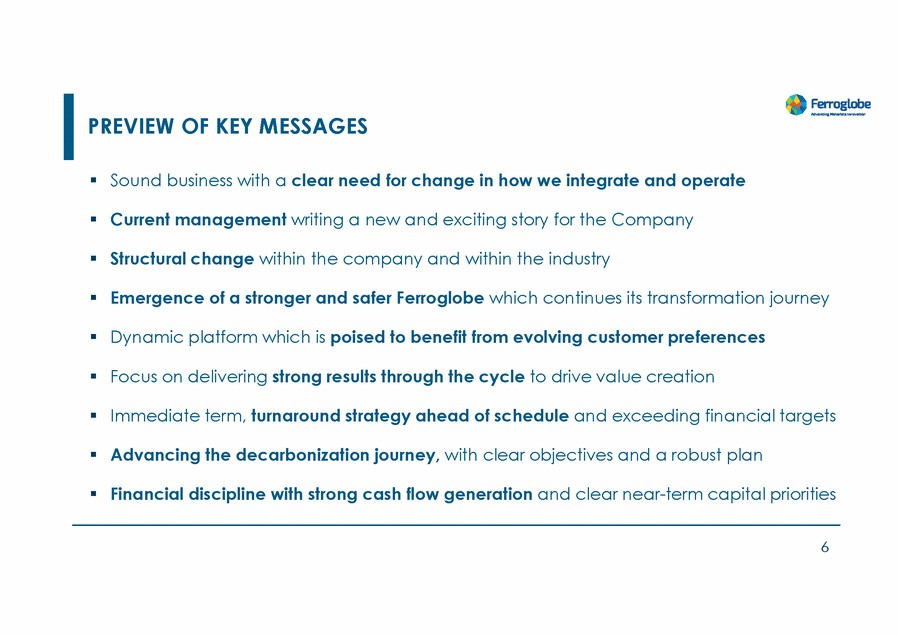
| PREVIEW OF KEY MESSAGES Sound business with a clear need for change in how we integrate and operate Current management writing a new and exciting story for the Company Structural change within the company and within the industry Emergence of a stronger and safer Ferroglobe which continues its transformation journey Dynamic platform which is poised to benefit from evolving customer preferences Focus on delivering strong results through the cycle to drive value creation Immediate term, turnaround strategy ahead of schedule and exceeding financial targets Advancing the decarbonization journey, with clear objectives and a robust plan Financial discipline with strong cash flow generation and clear near-term capital priorities 6 |
| INTRODUCTION TO FERROGLOBE |
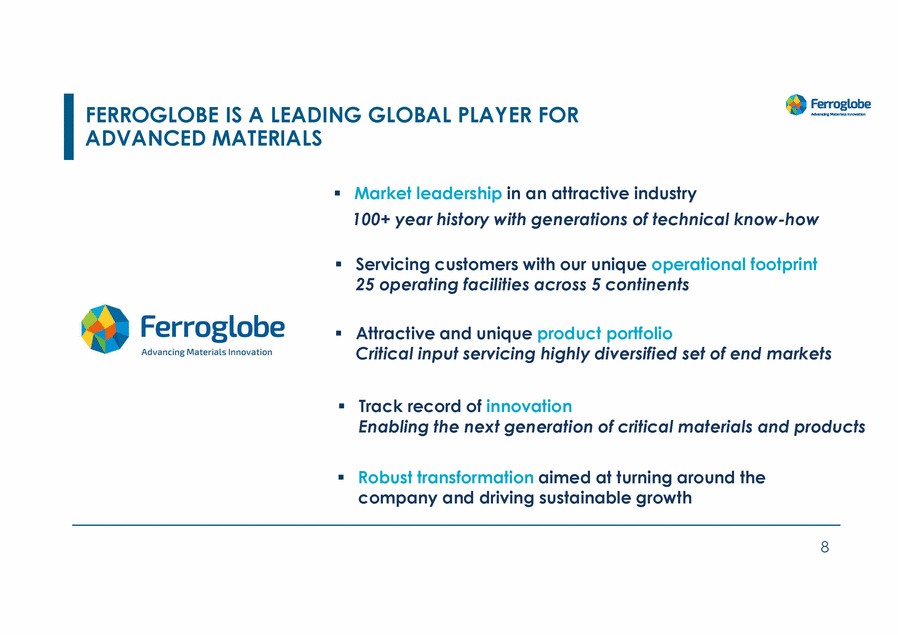
| FERROGLOBE IS A LEADING GLOBAL PLAYER FOR ADVANCED MATERIALS Market leadership in an attractive industry 100+ year history with generations of technical know-how Servicing customers with our unique operational footprint 25 operating facilities across 5 continents Attractive and unique product portfolio Critical input servicing highly diversified set of end markets Track record of innovation Enabling the next generation of critical materials and products Robust transformation aimed at turning around the company and driving sustainable growth 8 |
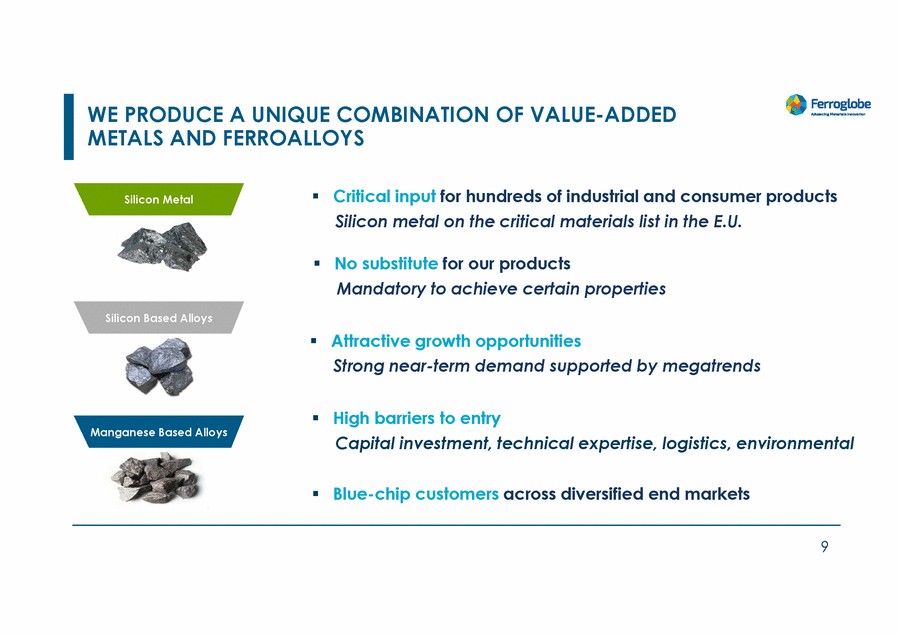
| WE PRODUCE A UNIQUE COMBINATION OF VALUE-ADDED METALS AND FERROALLOYS Critical input for hundreds of industrial and consumer products Silicon metal on the critical materials list in the E.U. Silicon Metal No substitute for our products Mandatory to achieve certain properties Silicon Based Alloys Attractive growth opportunities Strong near-term demand supported by megatrends High barriers to entry Capital investment, technical expertise, logistics, environmental Manganese Based Alloys Blue-chip customers across diversified end markets 9 |
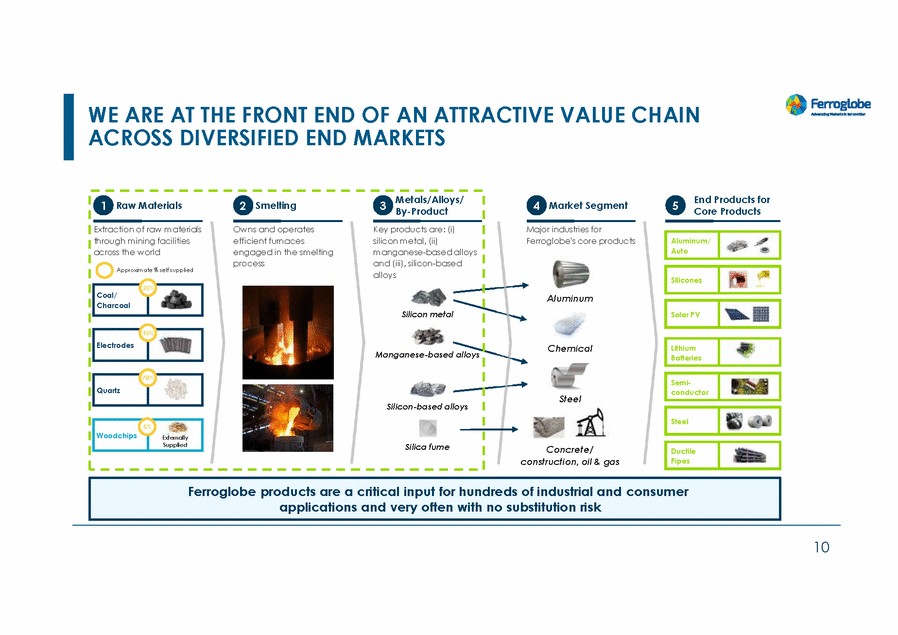
| WE ARE AT THE FRONT END OF AN ATTRACTIVE VALUE CHAIN ACROSS DIVERSIFIED END MARKETS Metals/Alloys/ By-Product End Products for Core Products 1 Raw Materials 2 Smelting 3 4 Market Segment 5 Extraction of raw materials through mining facilities across the world Owns and operates efficient furnaces engaged in the smelting process Key products are: (i) silicon metal, (ii) manganese-based alloys and (iii), silicon-based alloys Major industries for Ferroglobe's core products Approximate % self supplied Aluminum Silicon metal Chemical Manganese-based alloys Steel Silicon-based alloys % Silica fume Concrete/ construction, oil & gas 10 Ferroglobe products are a critical input for hundreds of industrial and consumer applications and very often with no substitution risk Ductile Pipes 5 Woodchips Externally Supplied Steel 70 Quartz % Semi-conductor Lithium Batteries 15 Electrodes % Solar PV 35 Coal/ Charcoal % Silicones Aluminum/ Auto |
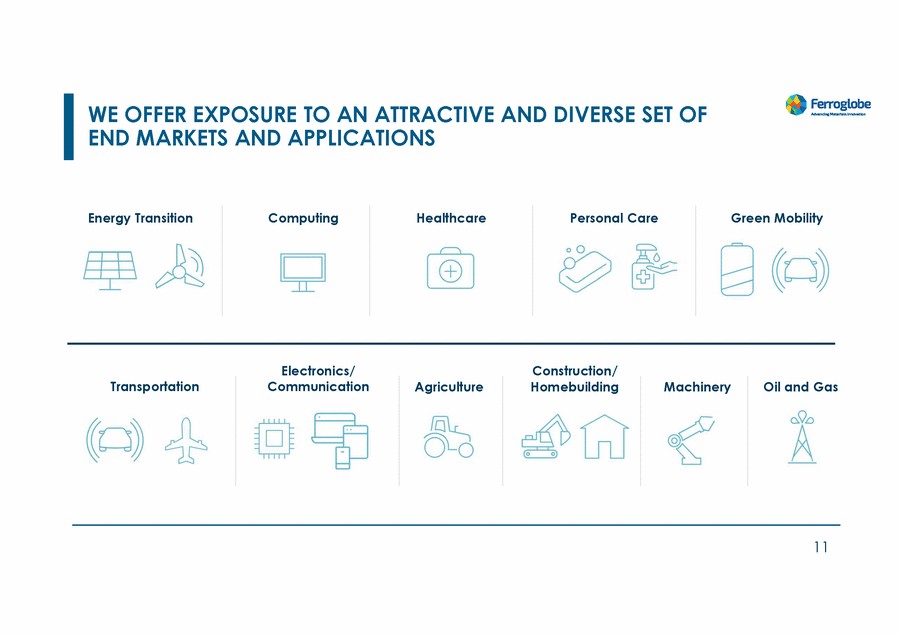
| WE OFFER EXPOSURE TO AN ATTRACTIVE AND DIVERSE SET OF END MARKETS AND APPLICATIONS Energy Transition Computing Healthcare Personal Care Green Mobility s 11 Electronics/ TransportationCommunicationAgric Construction/ ultureHomebuildingMachineryOil and Ga |
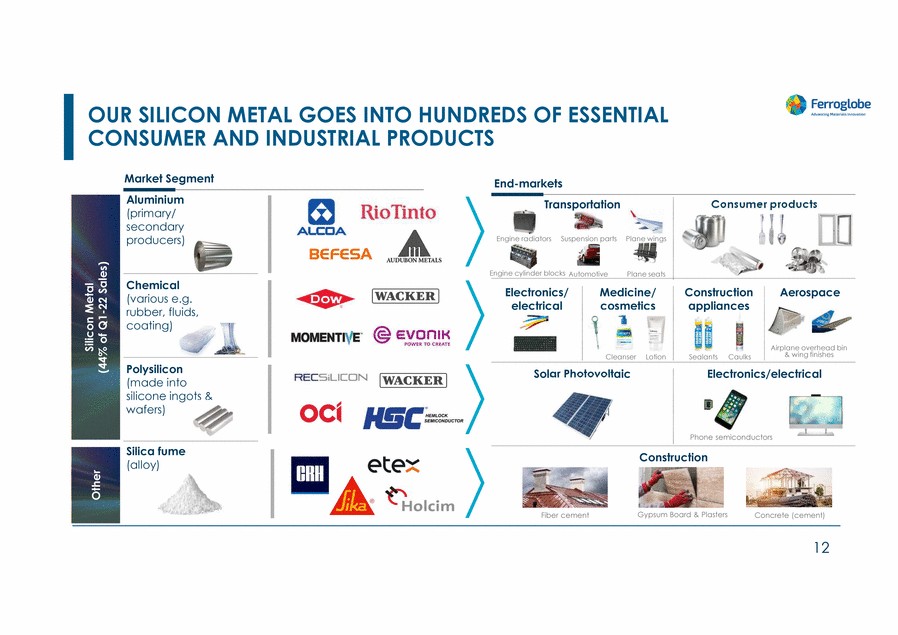
| OUR SILICON METAL GOES INTO HUNDREDS OF ESSENTIAL CONSUMER AND INDUSTRIAL PRODUCTS Market Segment End-markets Aluminium (primary/ secondary producers) Transportation Consumer products Engine radiators Suspension parts Plane wings Engine cylinder blocks Automotive Plane seats Chemical (various e.g. rubber, fluids, coating) Electronics/ electrical Medicine/ cosmetics Construction appliances Aerospace Airplane overhead bin & wing finishes Cleanser Lotion Sealants Caulks Polysilicon (made into silicone ingots & wafers) Solar Photovoltaic Electronics/electrical Phone semiconductors Silica fume (alloy) Construction Gypsum Board & Plasters Fiber cement Concrete (cement) 12 Silicon Metal (44% of Q1-22 Sales) Other |
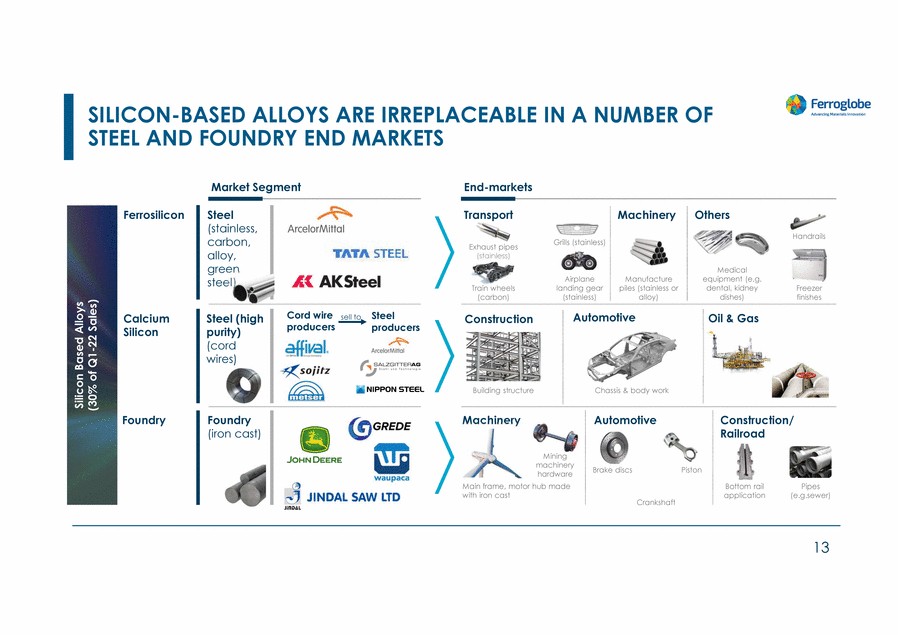
| SILICON-BASED ALLOYS ARE IRREPLACEABLE IN A NUMBER OF STEEL AND FOUNDRY END MARKETS Market Segment End-markets Ferrosilicon Steel (stainless, carbon, alloy, green steel) Transport Machinery Others Handrails Grills (stainless) Exhaust pipes (stainless) Medical equipment (e.g. dental, kidney dishes) Airplane landing gear (stainless) Manufacture piles (stainless or alloy) Train wheels (carbon) Freezer finishes Cord wire producers Steel producers Automotive Calcium Silicon Steel (high purity) (cord wires) sell to Oil & Gas Construction Building structure Chassis & body work Foundry Foundry (iron cast) Machinery Automotive Construction/ Railroad Mining machinery hardware Main frame, motor hub made with iron cast Brake discs Piston Bottom rail application Pipes (e.g.sewer) Crankshaft 13 Silicon Based Alloys (30% of Q1-22 Sales) |
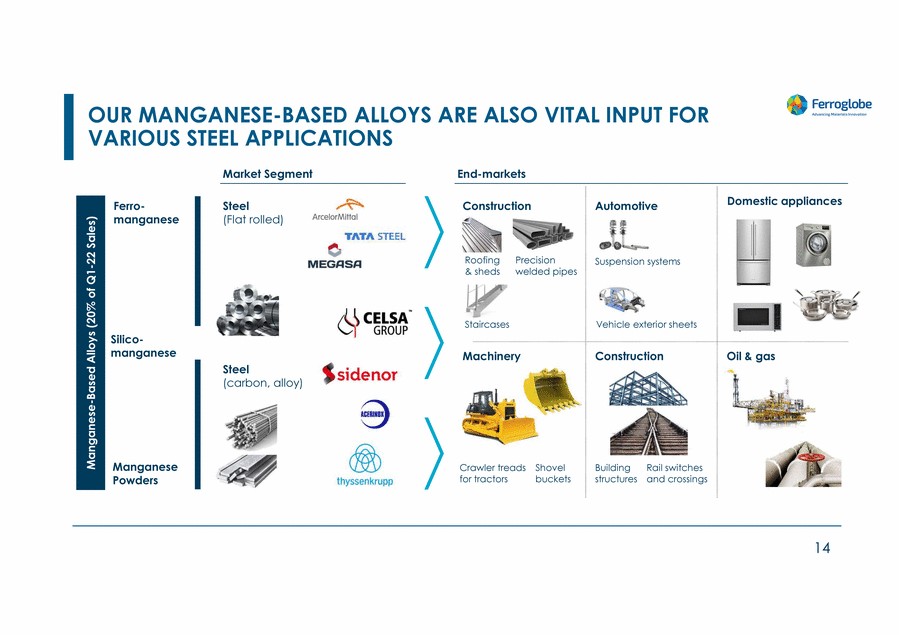
| OUR MANGANESE-BASED ALLOYS ARE ALSO VITAL INPUT FOR VARIOUS STEEL APPLICATIONS Market Segment End-markets Domestic appliances Ferro-manganese Steel (Flat rolled) Construction Automotive Roofing & sheds Precision welded pipes Suspension systems Staircases Vehicle exterior sheets Silico-manganese Machinery Construction Oil & gas Steel (carbon, alloy) Manganese Powders Crawler treads for tractors Shovel buckets BuildingRail switches structures and crossings 14 Manganese-Based Alloys (20% of Q1-22 Sales) |
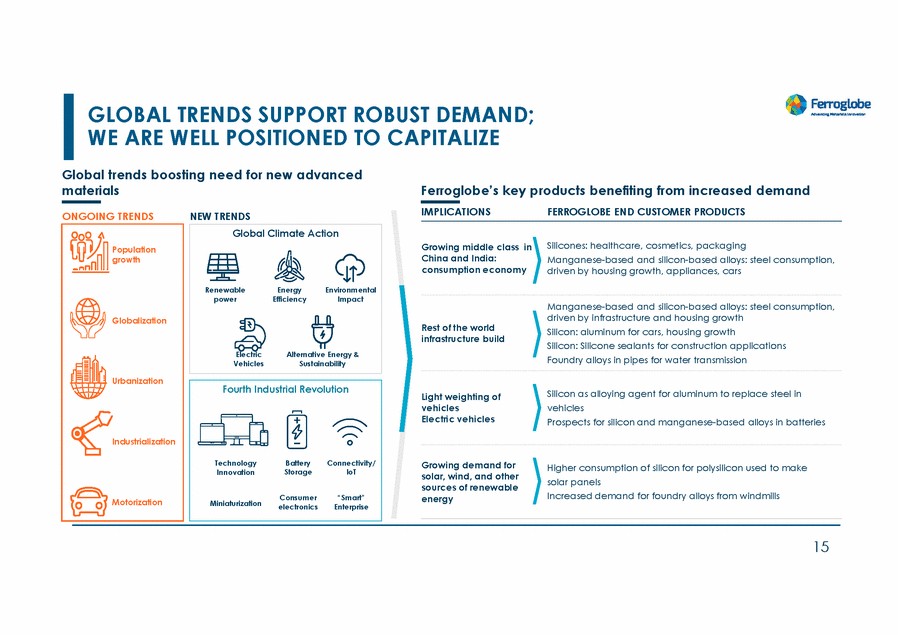
| GLOBAL TRENDS SUPPORT ROBUST DEMAND; WE ARE WELL POSITIONED TO CAPITALIZE Global trends boosting need for new advanced materials Ferroglobe’s key products benefiting from increased demand IMPLICATIONS FERROGLOBE END CUSTOMER PRODUCTS ONGOING TRENDS NEW TRENDS Silicones: healthcare, cosmetics, packaging Manganese-based and silicon-based alloys: steel consumption, driven by housing growth, appliances, cars Growing middle class in China and India: consumption economy Manganese-based and silicon-based alloys: steel consumption, driven by infrastructure and housing growth Silicon: aluminum for cars, housing growth Silicon: Silicone sealants for construction applications Foundry alloys in pipes for water transmission Rest of the world infrastructure build Silicon as alloying agent for aluminum to replace steel in vehicles Prospects for silicon and manganese-based alloys in batteries Light weighting of vehicles Electric vehicles Growing demand for solar, wind, and other sources of renewable energy Higher consumption of silicon for polysilicon used to make solar panels Increased demand for foundry alloys from windmills electronics Enterprise 15 Fourth Industrial Revolution TechnologyBatteryConnectivity/ InnovationStorageloT MiniaturizationConsumer“Smart” Population growth Globalization Urbanization Industrialization Motorization Global Climate Action RenewableEnergyEnvironmental powerEfficiencyImpact ElectricAlternative Energy & VehiclesSustainability |
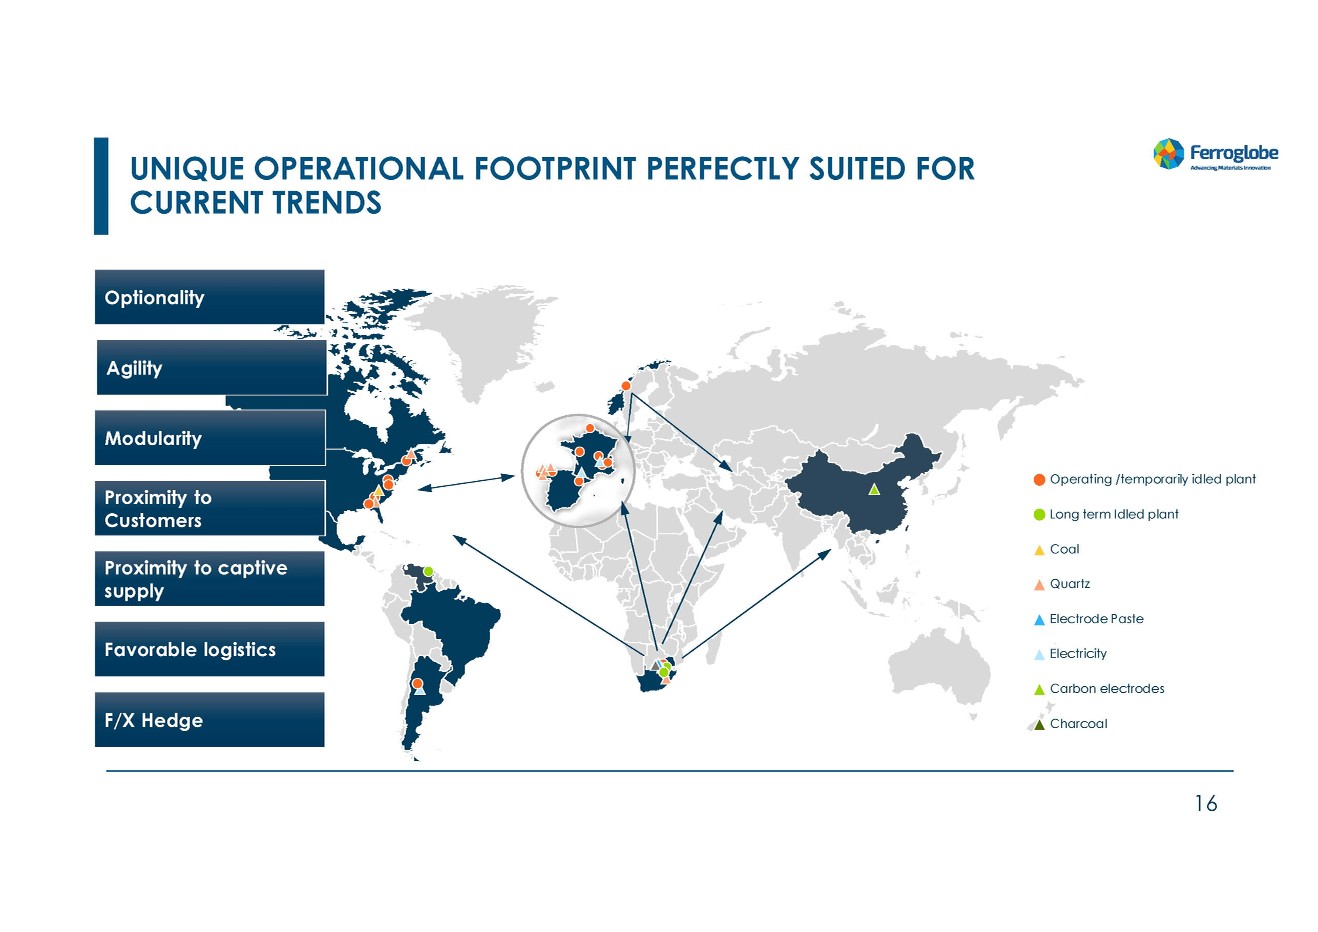
| UNIQUE OPERATIONAL FOOTPRINT PERFECTLY SUITED FOR CURRENT TRENDS Operating /temporarily idled plant Long term Idled plant Coal Quartz Electrode Paste Electricity Carbon electrodes Charcoal 16 F/X Hedge Favorable logistics Proximity to captive supply Proximity to Customers Modularity Agility Optionality |
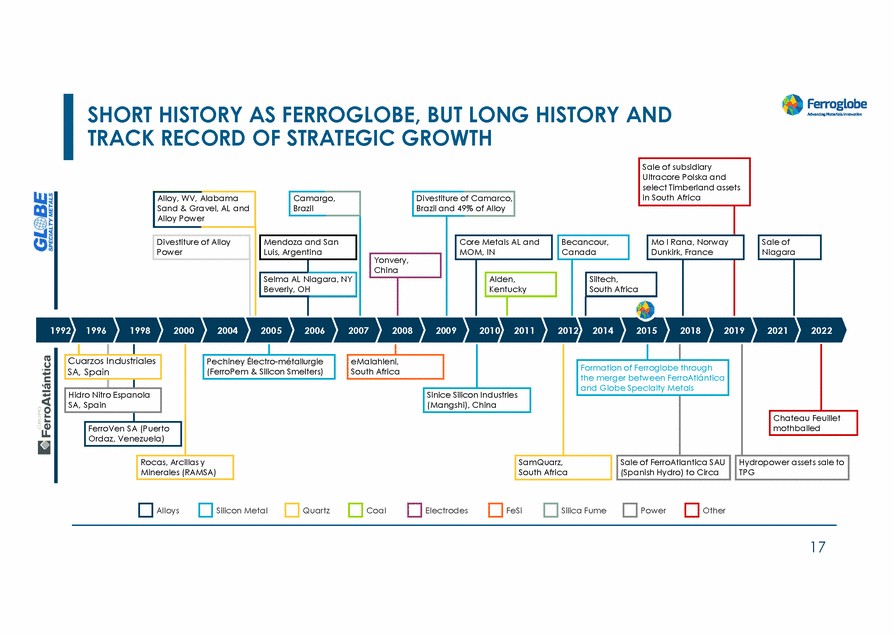
| SHORT HISTORY AS FERROGLOBE, BUT LONG HISTORY AND TRACK RECORD OF STRATEGIC GROWTH 1992 1996 1998 2000 2004 2005 2006 2007 2008 2009 2010 2011 2012 2014 2015 2018 2019 2021 2022 ger between FerroAtlántica Alloys Silicon Metal Quartz Coal Electrodes FeSi Silica Fume Power Other 17 Hydropower assets sale to TPG the mer SamQuarz, South Africa Rocas, Arcillas y Minerales (RAMSA) Chateau Feuillet mothballed Sinice Silicon Industries (Mangshi), China Formation of Ferroglobe through and Globe Specialty Metals Sale of FerroAtlantica SAU (Spanish Hydro) to Circa eMalahleni, South Africa Pechiney Électro-métallurgie (FerroPem & Silicon Smelters) Cuarzos Industriales SA, Spain Hidro Nitro Espanola SA, Spain FerroVen SA (Puerto Ordaz, Venezuela) ca Yonvery, China Sale of Niagara Becancour, Canada Siltech, South Afri AL and cky Mendoza and San Luis, Argentina Selma Beverl Alloy, WV, Alabama Sand & Gravel, AL and Alloy Power Divestiture of Alloy Power Divestiture of Camarco, Brazil and 49% of Alloy Core Metals MOM, IN Alden, Kentu Camargo, Brazil AL Niagara, NY y, OH Sale of subsidiary Ultracore Polska and select Timberland assets in South Africa Mo I Rana, Norway Dunkirk, France |
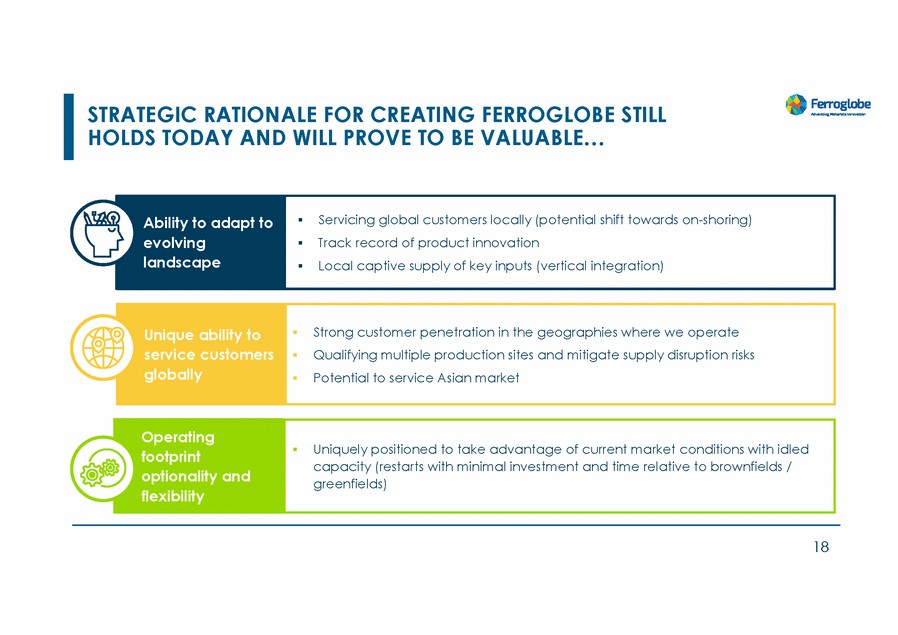
| STRATEGIC RATIONALE FOR CREATING FERROGLOBE STILL HOLDS TODAY AND WILL PROVE TO BE VALUABLE… capacity (restarts with minimal investment and time relative to brownfields / 18 Operating footprint optionality and flexibility Uniquely positioned to take advantage of current market conditions with idled greenfields) Unique ability to service customers globally Strong customer penetration in the geographies where we operate Qualifying multiple production sites and mitigate supply disruption risks Potential to service Asian market Ability to adapt to evolving landscape Servicing global customers locally (potential shift towards on-shoring) Track record of product innovation Local captive supply of key inputs (vertical integration) |
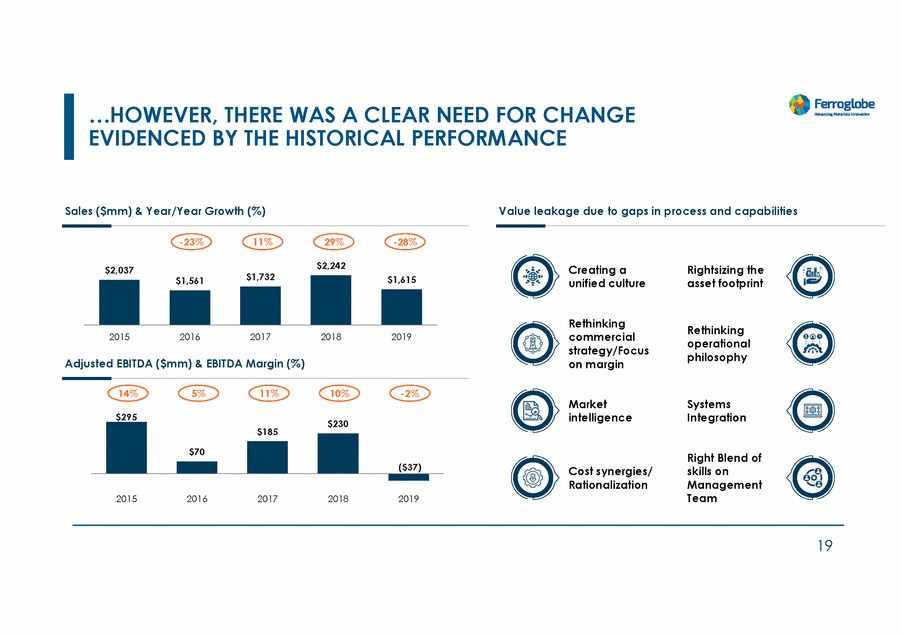
| …HOWEVER, THERE WAS A CLEAR NEED FOR CHANGE EVIDENCED BY THE HISTORICAL PERFORMANCE Sales ($mm) & Year/Year Growth (%) Value leakage due to gaps in process and capabilities -23% 11% 29% -28% $2,242 Creating a unified culture Rightsizing the asset footprint $2,037 $1,732 $1,561 Rethinking commercial strategy/Focus on margin Rethinking operational philosophy 2015 2016 2017 2018 2019 Adjusted EBITDA ($mm) & EBITDA Margin (%) 14% 5% 11% 10% -2% Market intelligence Systems Integration $295 $185 Right Blend of skills on Management Team Cost synergies/ Rationalization 2015 2016 2017 2018 2019 19 $230 ($37) $70 $1,615 |
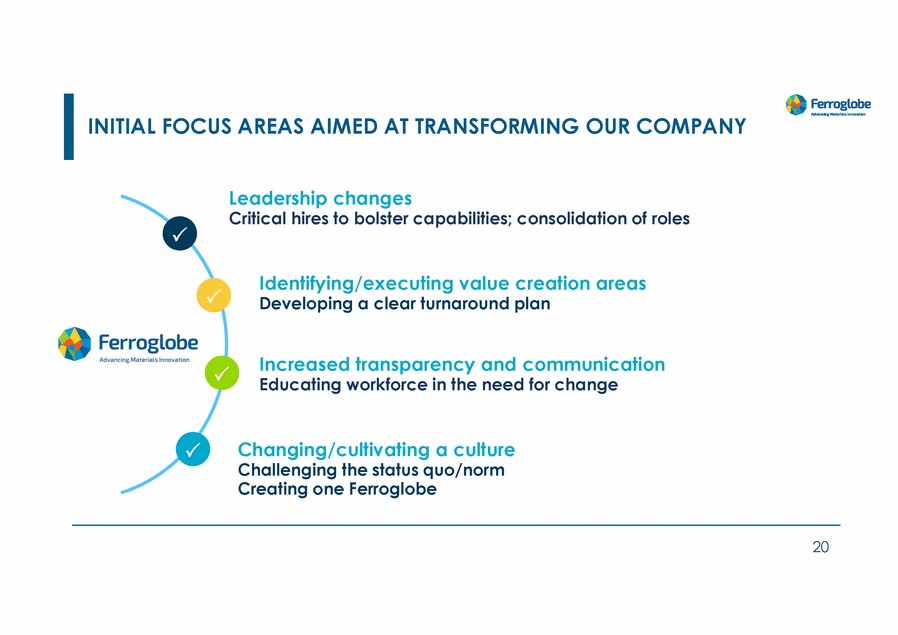
| INITIAL FOCUS AREAS AIMED AT TRANSFORMING OUR COMPANY Leadership changes Critical hires to bolster capabilities; consolidation of roles P Identifying/executing value creation areas Developing a clear turnaround plan P Increased transparency and communication Educating workforce in the need for change P Changing/cultivating a culture Challenging the status quo/norm Creating one Ferroglobe P 20 |
| DRIVING CHANGE |

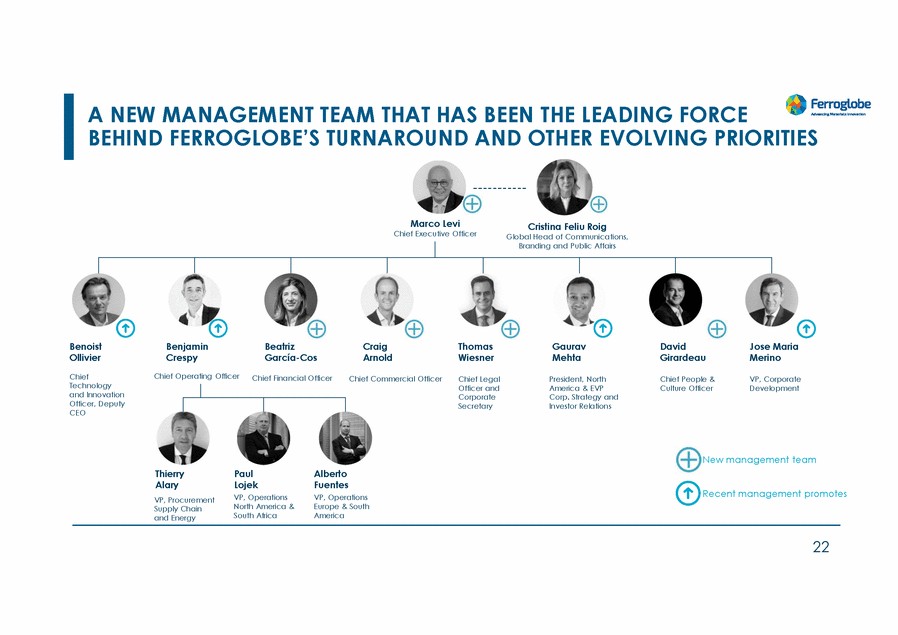
| A NEW MANAGEMENT TEAM THAT HAS BEEN THE LEADING FORCE BEHIND FERROGLOBE’S TURNAROUND AND OTHER EVOLVING PRIORITIES Marco Levi Chief Executive Officer Cristina Feliu Roig Global Head of Communications, Benoist Ollivier Benjamin Crespy Beatriz García-Cos Craig Arnold Thomas Wiesner Gaurav Mehta David Girardeau Jose Maria Merino Chief Operating Officer Chief Technology and Innovation Officer, Deputy CEO Chief Financial Officer Chief Commercial Officer Chief Legal Officer and Corporate Secretary President, North America & EVP Corp. Strategy and Investor Relations Chief People & Culture Officer VP, Corporate Development New management team Thierry Alary VP, Procurement Supply Chain and Energy Paul Lojek VP, Operations North America & South Africa Alberto Fuentes VP, Operations Europe & South America Recent management promotes 22 Branding and Public Affairs |
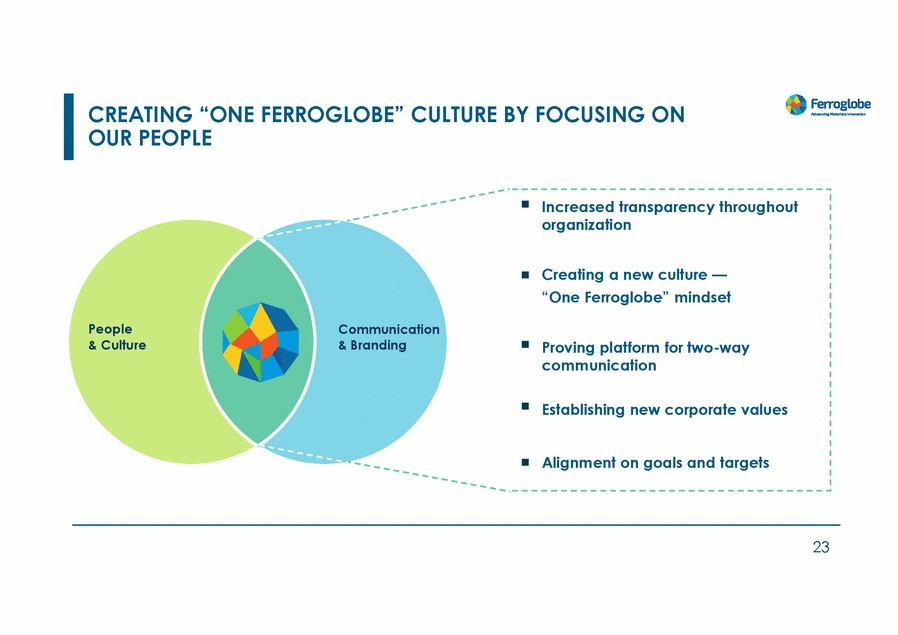
| CREATING “ONE OUR PEOPLE FERROGLOBE” CULTURE BY FOCUSING ON Increased transparency throughout organization Creating a new culture — “One Ferroglobe” mindset People & Culture Communication & Branding Proving platform for two-way communication Establishing new corporate values Alignment on goals and targets 23 |
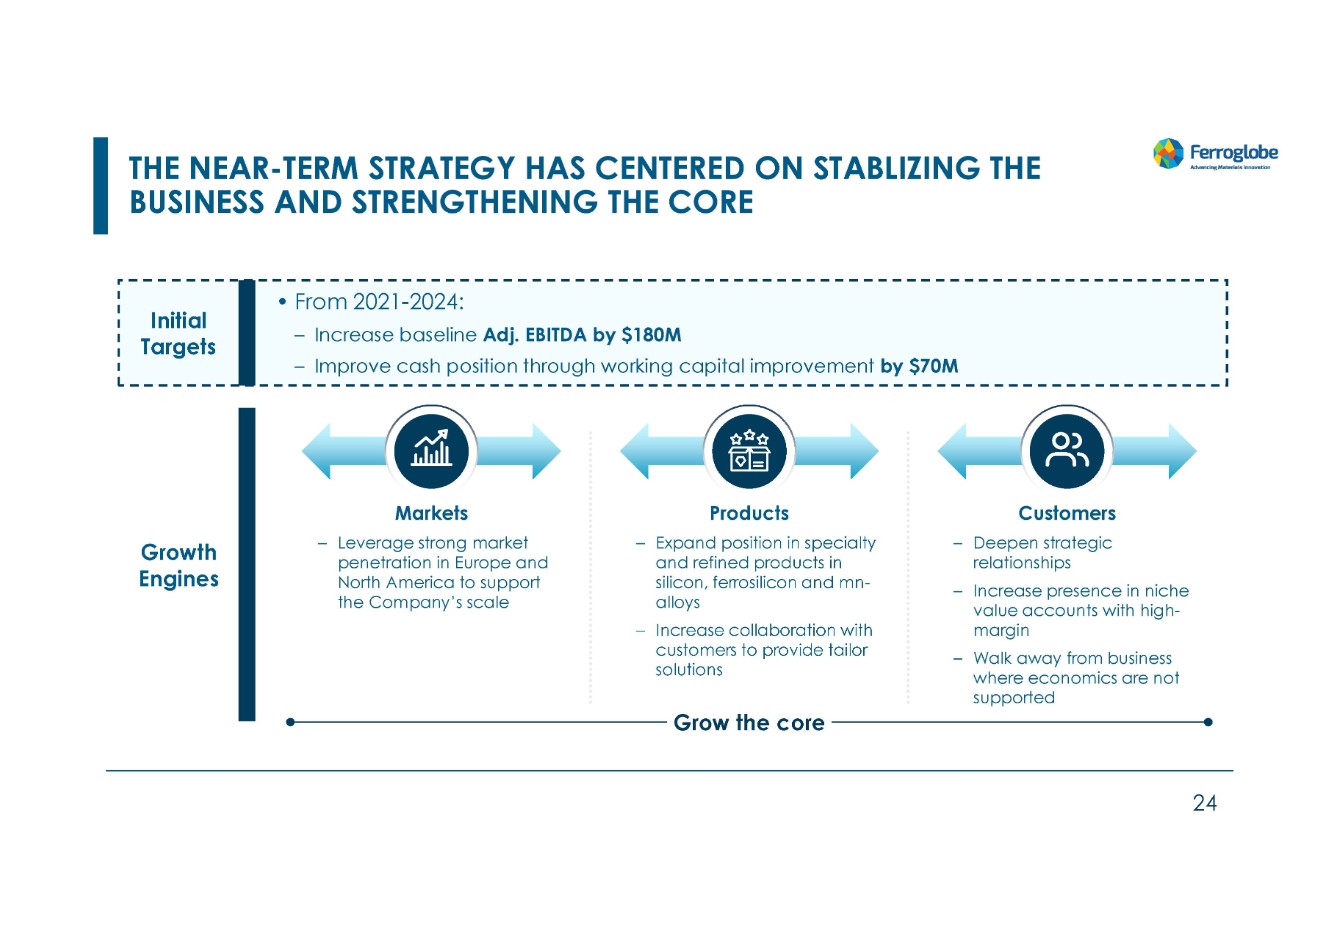
| THE NEAR-TERM STRATEGY HAS CENTERED ON STABLIZING THE BUSINESS AND STRENGTHENING THE CORE • From 2021-2024: Initial Targets – – Increase baseline Adj. EBITDA by $180M Improve cash position through working capital improvement by $70M Markets Leverage strong market penetration in Europe and North America to support the Company’s scale Products Expand position in specialty and refined products in silicon, ferrosilicon and mn-alloys Increase collaboration with customers to provide tailor solutions Customers Deepen strategic relationships Increase presence in niche value accounts with high-margin Walk away from business where economics are not supported – – – Growth Engines – – – Grow the core 24 |
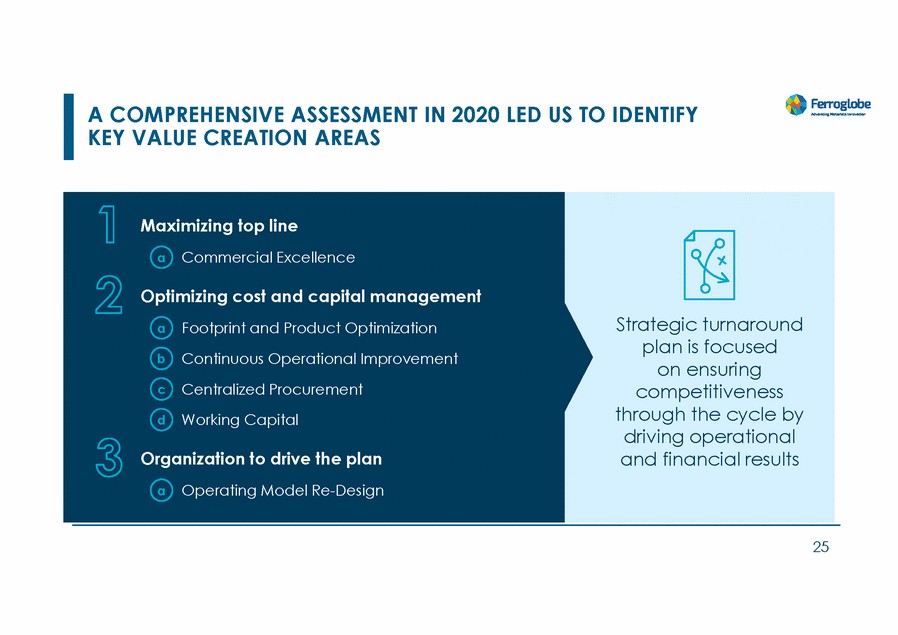
| A COMPREHENSIVE ASSESSMENT IN 2020 LED US TO IDENTIFY KEY VALUE CREATION AREAS 25 Maximizing top line aCommercial Excellence Optimizing cost and capital management aFootprint and Product Optimization bContinuous Operational Improvement cCentralized Procurement dWorking Capital Organization to drive the plan aOperating Model Re-Design Strategic turnaround plan is focused on ensuring competitiveness through the cycle by driving operational and financial results |
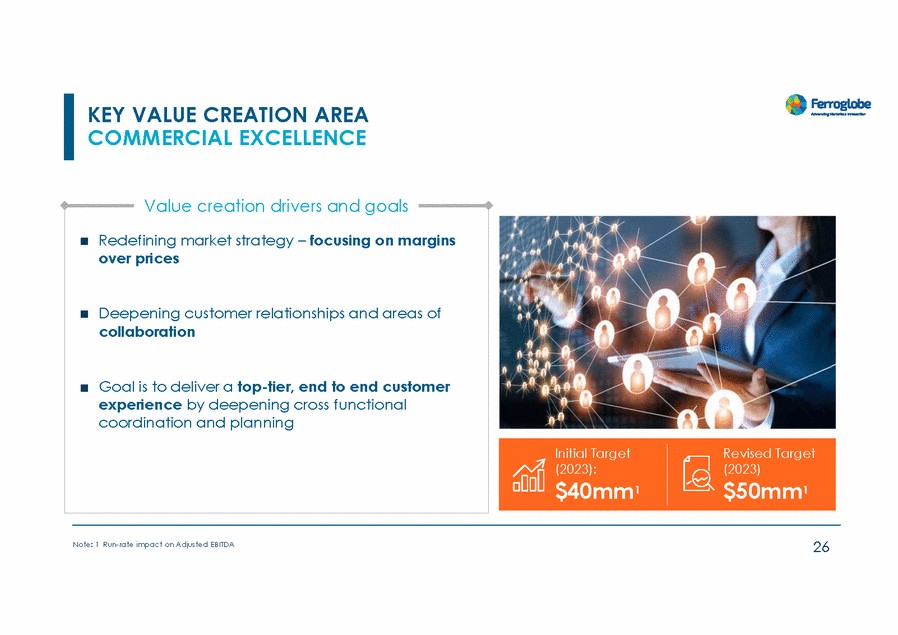
| KEY VALUE CREATION AREA COMMERCIAL EXCELLENCE Value creation drivers and goals 26 Note: 1 Run-rate impact on Adjusted EBITDA Initial TargetRevised Target (2023): (2023) $40mm1 $50mm1 Redefining market strategy – focusing on margins over prices Deepening customer relationships and areas of collaboration Goal is to deliver a top-tier, end to end customer experience by deepening cross functional coordination and planning |
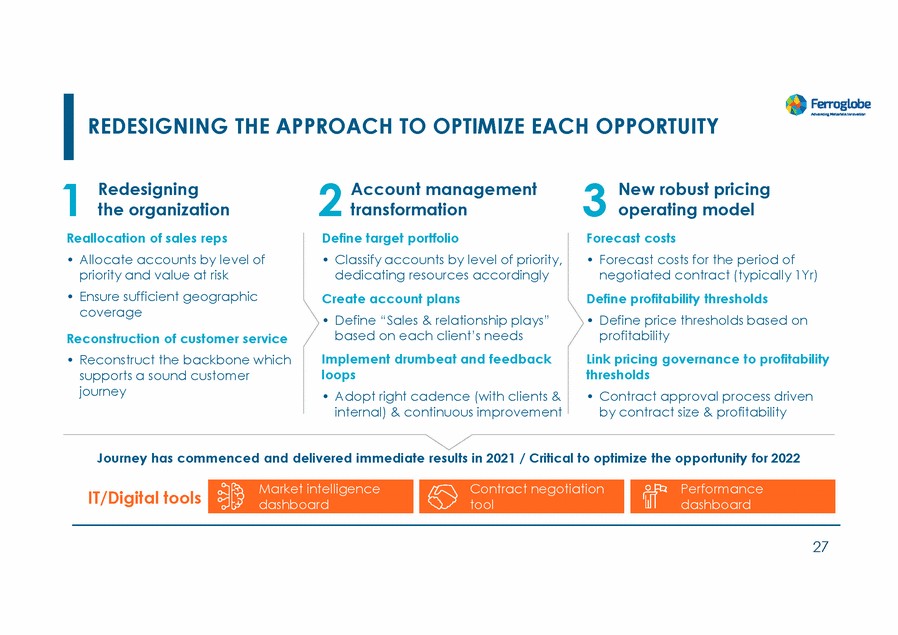
| REDESIGNING THE APPROACH TO OPTIMIZE EACH OPPORTUITY 1 2 3 Redesigning the organization Account management transformation New robust pricing operating model Reallocation of sales reps • Allocate accounts by level of priority and value at risk • Ensure sufficient geographic coverage Reconstruction of customer service • Reconstruct the backbone which supports a sound customer journey Define target portfolio • Classify accounts by level of priority, dedicating resources accordingly Create account plans • Define “Sales & relationship plays” based on each client’s needs Implement drumbeat and feedback loops • Adopt right cadence (with clients & internal) & continuous improvement Forecast costs • Forecast costs for the period of negotiated contract (typically 1Yr) Define profitability thresholds • Define price thresholds based on profitability Link pricing governance to profitability thresholds • Contract approval process driven by contract size & profitability Journey has commenced and delivered immediate results in 2021 / Critical to optimize the opportunity for 2022 IT/Digital tools 27 Performance dashboard Market intelligence dashboard Contract negotiation tool |
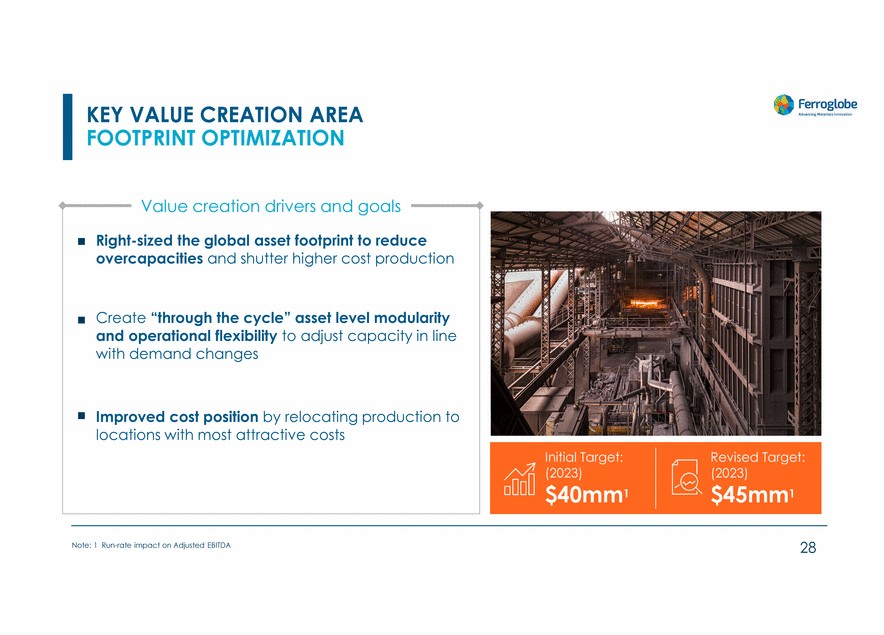
| KEY VALUE CREATION AREA FOOTPRINT OPTIMIZATION Value creation drivers and goals 28 Note: 1 Run-rate impact on Adjusted EBITDA Initial Target:Revised Target: (2023)(2023) $40mm1 $45mm1 Right-sized the global asset footprint to reduce overcapacities and shutter higher cost production Create “through the cycle” asset level modularity and operational flexibility to adjust capacity in line with demand changes Improved cost position by relocating production to locations with most attractive costs |
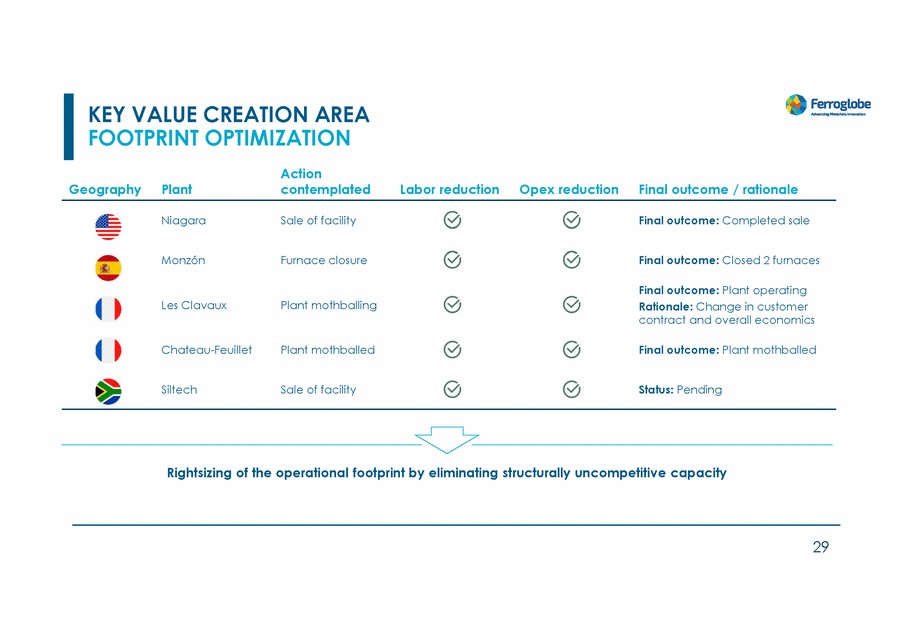
| KEY VALUE CREATION AREA FOOTPRINT OPTIMIZATION Action Geography Plant contemplated Labor reduction Opex reduction Final outcome / rationale Niagara Sale of facility Final outcome: Completed sale Monzón Furnace closure Final outcome: Closed 2 furnaces Final outcome: Plant operating Rationale: Change in customer contract and overall economics Les Clavaux Plant mothballing Chateau-Feuillet Plant mothballed Final outcome: Plant mothballed Siltech Sale of facility Status: Pending Rightsizing of the operational footprint by eliminating structurally uncompetitive capacity 29 |
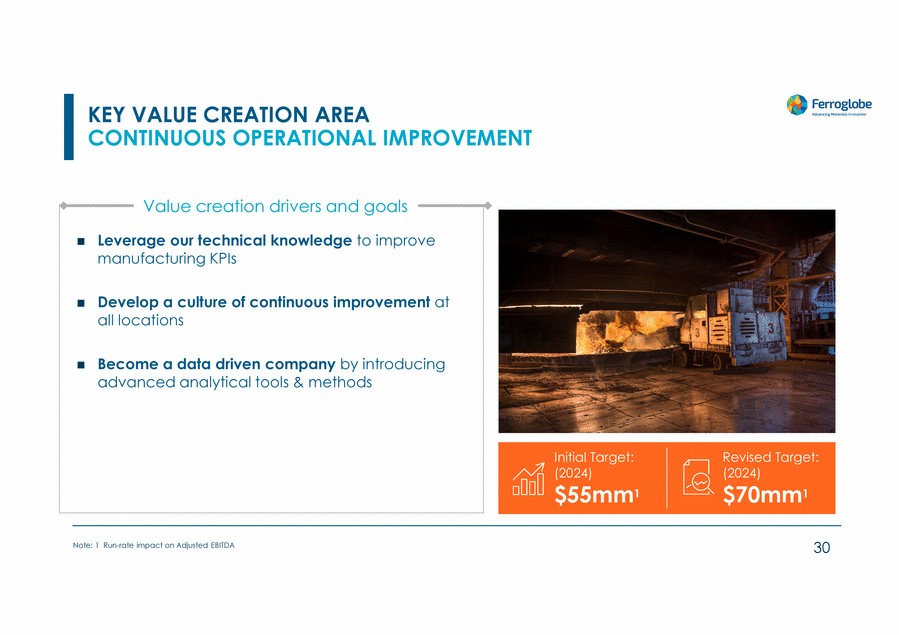
| KEY VALUE CREATION AREA CONTINUOUS OPERATIONAL IMPROVEMENT Value creation drivers and goals 30 Note: 1 Run-rate impact on Adjusted EBITDA Initial Target:Revised Target: (2024)(2024) $55mm1 $70mm1 Leverage our technical knowledge to improve manufacturing KPIs Develop a culture of continuous improvement at all locations Become a data driven company by introducing advanced analytical tools & methods |
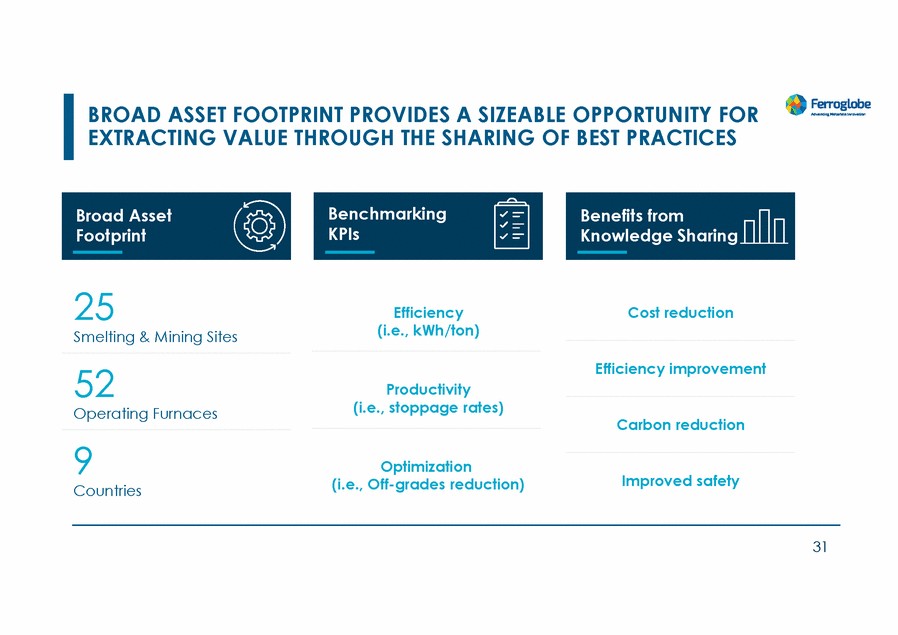
| BROAD ASSET FOOTPRINT PROVIDES A SIZEABLE OPPORTUNITY FOR EXTRACTING VALUE THROUGH THE SHARING OF BEST PRACTICES 25 Smelting & Mining Sites Efficiency (i.e., kWh/ton) Cost reduction Efficiency improvement 52 Operating Furnaces Productivity (i.e., stoppage rates) Carbon reduction 9 Countries Optimization (i.e., Off-grades reduction) Improved safety 31 Benefits from Knowledge Sharing Benchmarking KPIs Broad Asset Footprint |
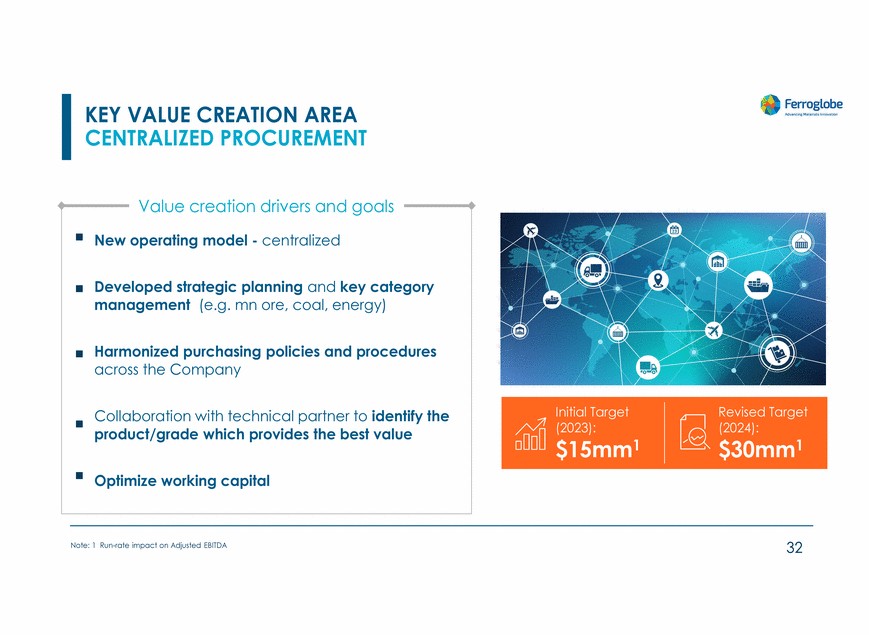
| KEY VALUE CREATION AREA CENTRALIZED PROCUREMENT Value creation drivers and goals (2023): (2024): 32 Note: 1 Run-rate impact on Adjusted EBITDA Initial TargetRevised Target $15mm1 $30mm1 New operating model - centralized Developed strategic planning and key category management (e.g. mn ore, coal, energy) Harmonized purchasing policies and procedures across the Company Collaboration with technical partner to identify the product/grade which provides the best value Optimize working capital |
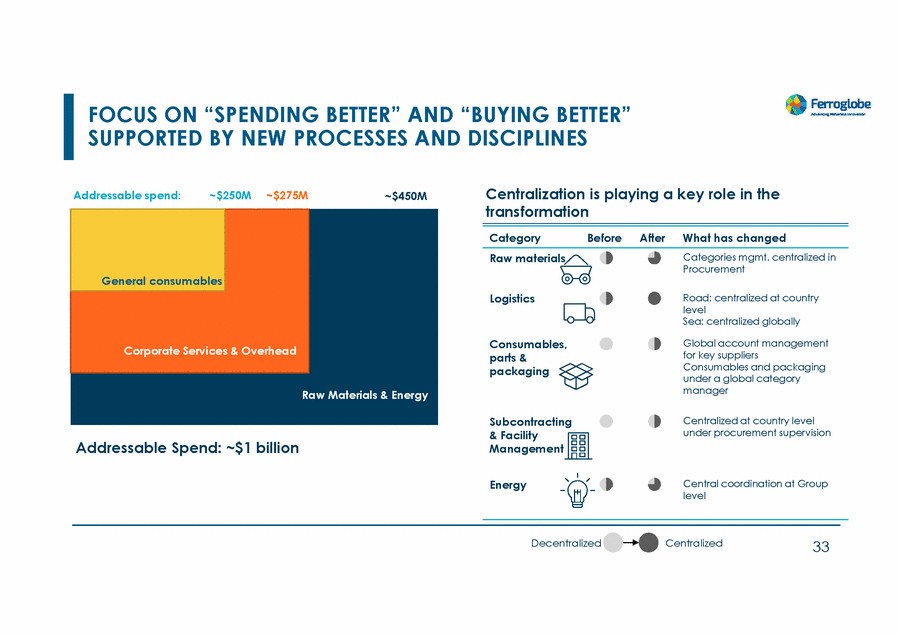
| FOCUS ON “SPENDING BETTER” AND “BUYING BETTER” SUPPORTED BY NEW PROCESSES AND DISCIPLINES Centralization is playing a key role in the transformation Addressable spend: ~$250M ~$275M ~$450M Category Before After What has changed Raw materials Categories mgmt. centralized in Procurement Logistics Road: centralized at country level Sea: centralized globally Global account management for key suppliers Consumables and packaging under a global category manager Consumables, parts & packaging Subcontracting & Facility Management Centralized at country level under procurement supervision Addressable Spend: ~$1 billion Energy Central coordination at Group level Decentralized Centralized 33 General consumables Corporate Services & Overhead Raw Materials & Energy |
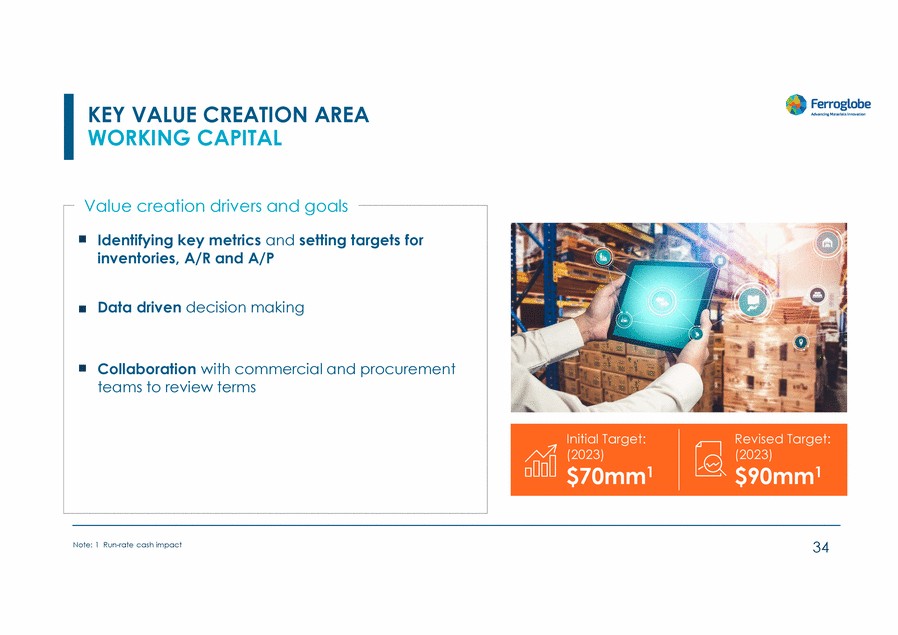
| KEY VALUE CREATION AREA WORKING CAPITAL Value creation drivers and goals 34 Note: 1 Run-rate cash impact Initial Target:Revised Target: (2023)(2023) $70mm1 $90mm1 Identifying key metrics and setting targets for inventories, A/R and A/P Data driven decision making Collaboration with commercial and procurement teams to review terms |
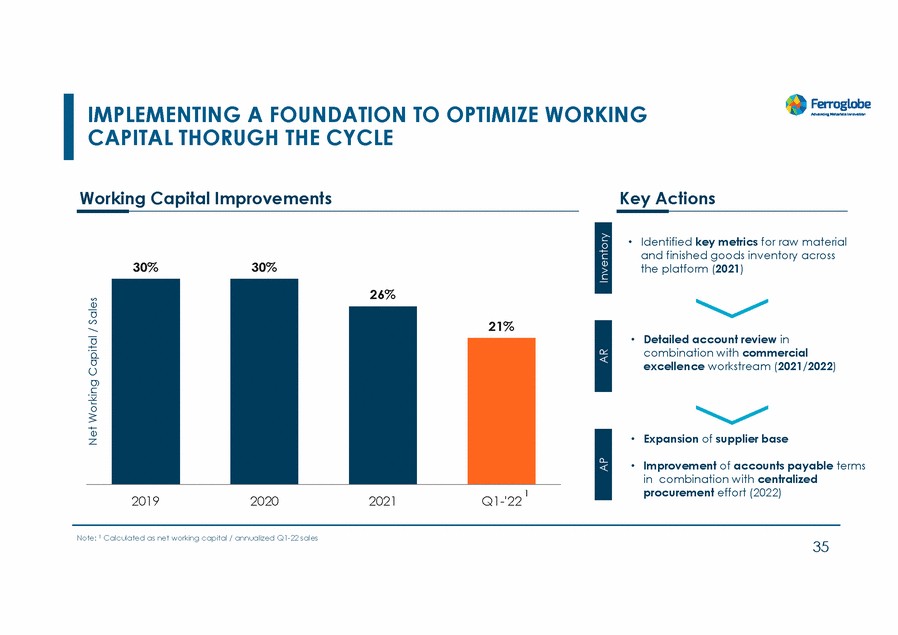
| IMPLEMENTING A FOUNDATION CAPITAL THORUGH THE CYCLE TO OPTIMIZE WORKING Working Capital Improvements Key Actions • Identified key metrics for raw material and finished goods inventory across the platform (2021) 30% 30% • Detailed account review in combination with commercial excellence workstream (2021/2022) • Expansion of supplier base • Improvement of accounts payable terms in combination with centralized procurement effort (2022) 1 2019 2020 2021 Q1-'22 Note: 1 Calculated as net working capital / annualized Q1-22 sales 35 Net Working Capital / Sales AP AR Inventory 26% 21% |
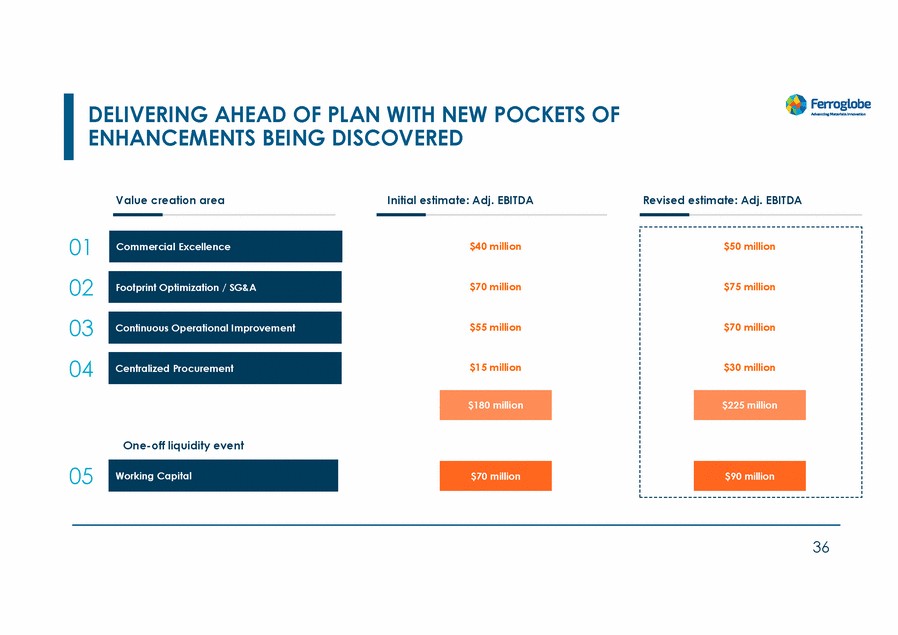
| DELIVERING AHEAD OF PLAN WITH NEW POCKETS OF ENHANCEMENTS BEING DISCOVERED Value creation area Initial estimate: Adj. EBITDA Revised estimate: Adj. EBITDA 01 02 03 04 $40 million $50 million $70 million $75 million $55 million $70 million $15 million $30 million One-off liquidity event 05 36 Working Capital $90 million $70 million $225 million $180 million Centralized Procurement Continuous Operational Improvement Footprint Optimization / SG&A Commercial Excellence |
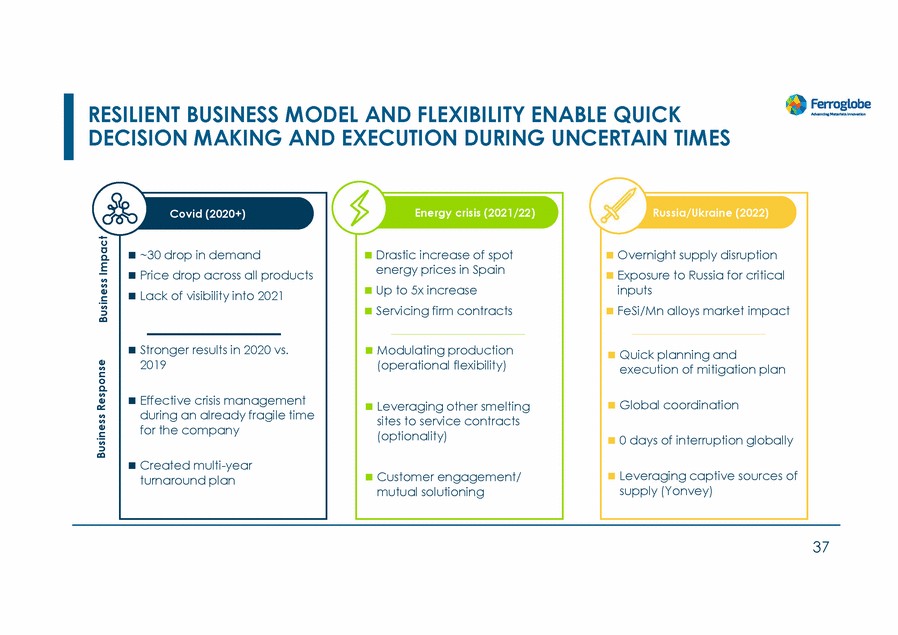
| RESILIENT BUSINESS MODEL AND FLEXIBILITY ENABLE QUICK DECISION MAKING AND EXECUTION DURING UNCERTAIN TIMES 2019 during an already fragile time turnaround plan 37 Business Response Business Impact Covid (2020+) ~30 drop in demand Price drop across all products Lack of visibility into 2021 Stronger results in 2020 vs. Effective crisis management for the company Created multi-year Energy crisis (2021/22) Drastic increase of spot energy prices in Spain Up to 5x increase Servicing firm contracts Modulating production (operational flexibility) Leveraging other smelting sites to service contracts (optionality) Customer engagement/ mutual solutioning Russia/Ukraine (2022) Overnight supply disruption Exposure to Russia for critical inputs FeSi/Mn alloys market impact Quick planning and execution of mitigation plan Global coordination 0 days of interruption globally Leveraging captive sources of supply (Yonvey) |
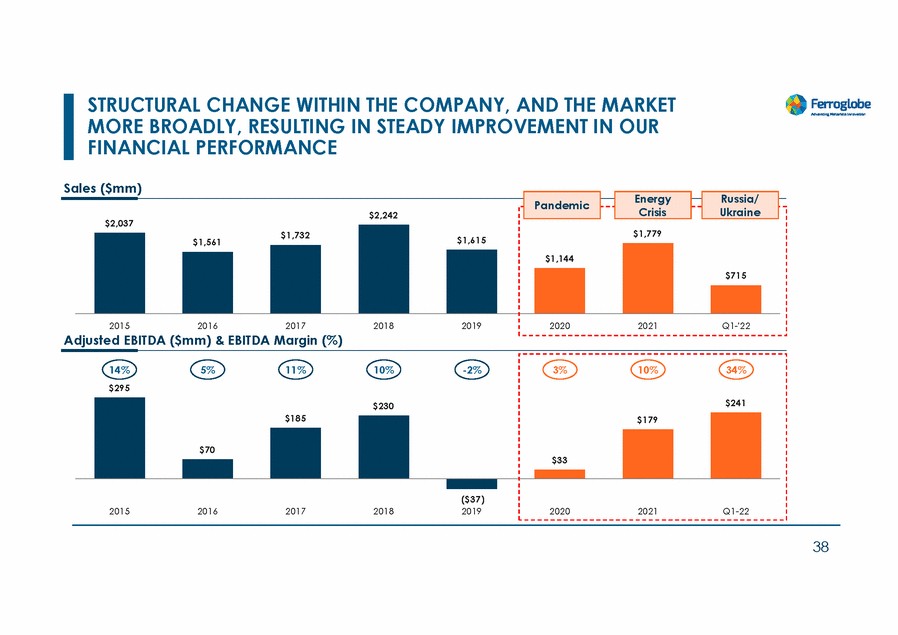
| STRUCTURAL CHANGE WITHIN THE COMPANY, AND THE MARKET MORE BROADLY, RESULTING FINANCIAL PERFORMANCE IN STEADY IMPROVEMENT IN OUR Sales ($mm) $2,037 $1,561 2015 2016 2017 2018 2019 2020 2021 Q1-'22 Adjusted EBITDA ($mm) & EBITDA Margin (%) 14% $295 5% 11% 10% -2% 3% 10% 34% ($37) 2019 2015 2016 2017 2018 2020 2021 Q1-22 38 $230 $241 $185 $179 $33 $70 $1,779 $1,615 $1,732 $715 $1,144 PandemicEnergyRussia/ Crisis Ukraine $2,242 |
| RESHAPING FERROGLOBE BY ENSURING A STRONG FOUNDATION People & Culture Disciplines & Processes Capabilities & Tools 39 |
| DYNAMIC OPERATING MODEL |
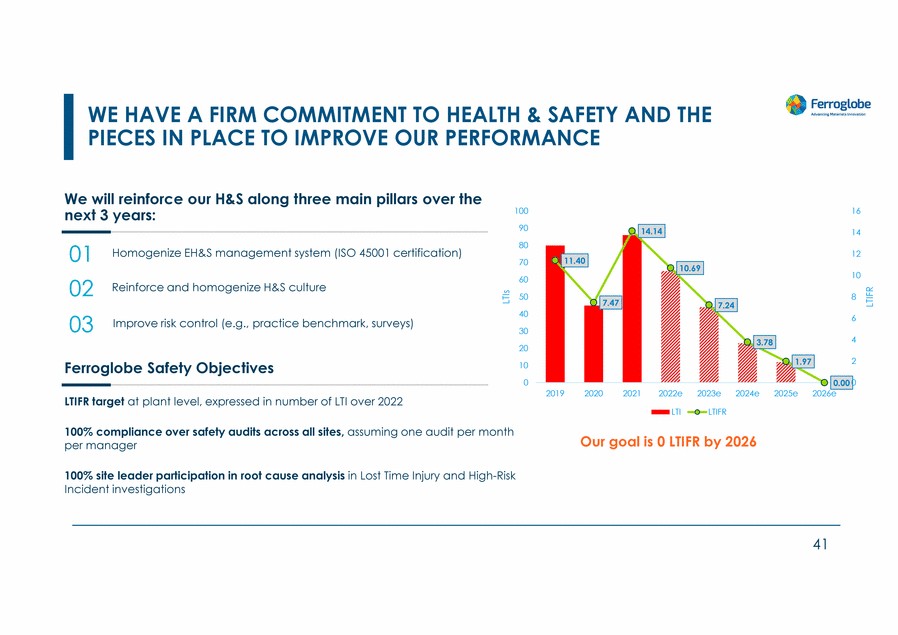
| WE HAVE A FIRM COMMITMENT TO HEALTH & SAFETY PIECES IN PLACE TO IMPROVE OUR PERFORMANCE AND THE We will reinforce our H&S along three main pillars over the next 3 years: 100 90 80 70 60 50 40 30 20 16 14 01 02 03 Homogenize EH&S management system (ISO 45001 certification) 12 10 Reinforce and homogenize H&S culture 8 6 Improve risk control (e.g., practice benchmark, surveys) 4 2 Ferroglobe Safety Objectives 10 0 0 2019 2020 2021 2022e 2023e 2024e 2025e 2026e LTIFR target at plant level, expressed in number of LTI over 2022 LTI LTIFR 100% compliance over safety audits across all sites, assuming one audit per month per manager Our goal is 0 LTIFR by 2026 100% site leader participation in root cause analysis in Lost Time Injury and High-Risk Incident investigations 41 LTIs LTIFR 14.14 11.40 7.47 0.00 1.97 3.78 7.24 10.69 |
| UNIQUE OPERATIONAL FOOTPRINT PERFECTLY SUITED FOR CURRENT TRENDS Operating /temporarily idled plant Long term Idled plant Coal Quartz Electrode Paste Electricity Carbon electrodes Charcoal 42 F/X Hedge Favorable logistics Proximity to captive supply Proximity to Customers Modularity Agility Optionality |

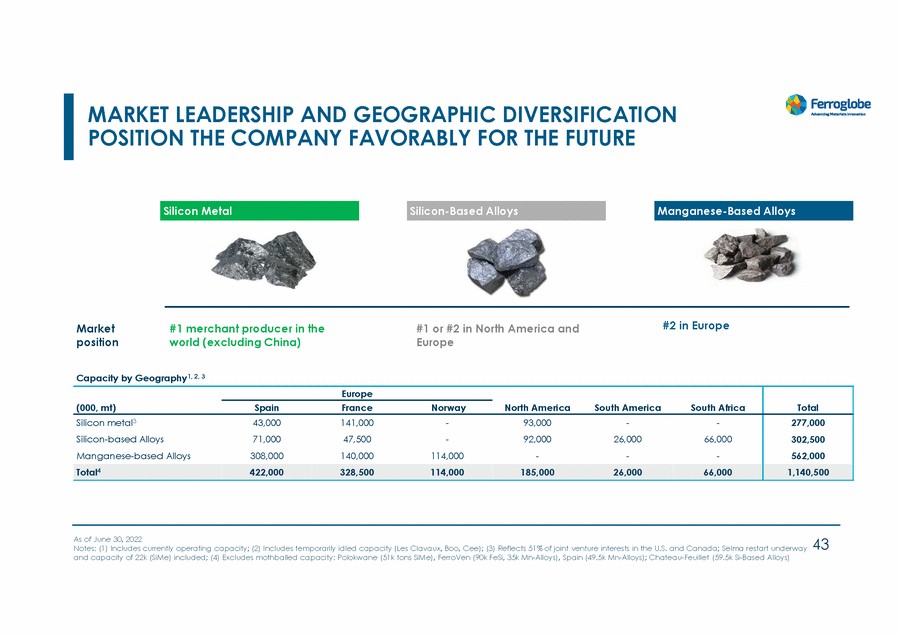
| MARKET LEADERSHIP AND GEOGRAPHIC DIVERSIFICATION POSITION THE COMPANY FAVORABLY FOR THE FUTURE #2 in Europe Market position #1 merchant producer in the world (excluding China) #1 or #2 in North America and Europe Capacity by Geography1, 2, 3 As of June 30, 2022 Notes: (1) Includes currently operating capacity; (2) Includes temporarily idled capacity (Les Clavaux, Boo, Cee); (3) Reflects 51% of joint venture interests in the U.S. and Canada; Selma restart underway 43 and capacity of 22k (SiMe) included; (4) Excludes mothballed capacity: Polokwane (51k tons SiMe), FerroVen (90k FeSi, 35k Mn-Alloys), Spain (49.5k Mn-Alloys); Chateau-Feuillet (59.5k Si-Based Alloys) Europe (000, mt) SpainFranceNorwayNorth AmericaSouth AmericaSouth Africa Total Silicon metal343,000 141,000 - 93,000 - - Silicon-based Alloys71,000 47,500 - 92,000 26,000 66,000 Manganese-based Alloys308,000 140,000 114,000 - - - Total4422,000328,500114,000185,00026,00066,000 277,000 302,500 562,000 1,140,500 Manganese-Based Alloys Silicon-Based Alloys Silicon Metal |
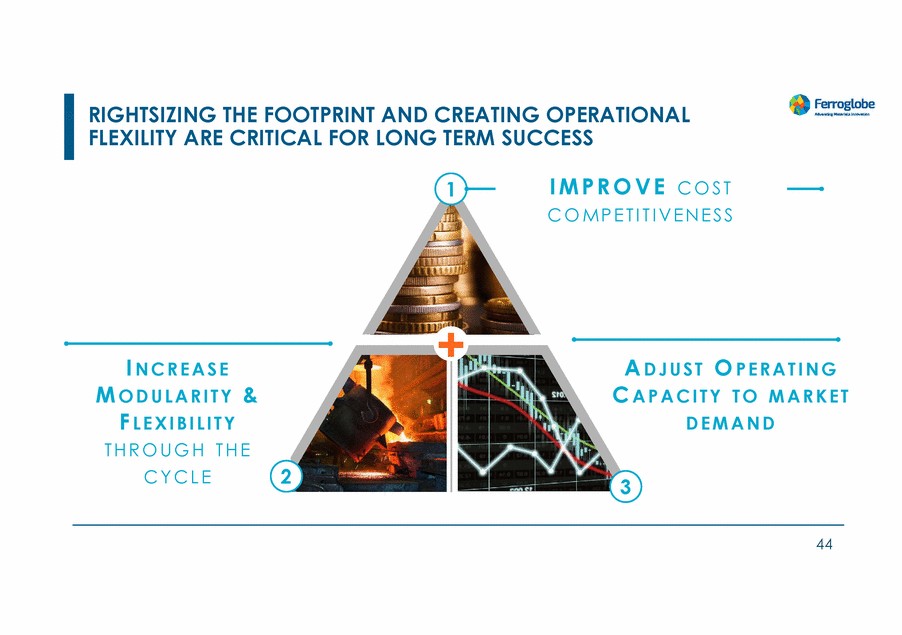
| RIGHTSIZING THE FOOTPRINT AND CREATING OPERATIONAL FLEXILITY ARE CRITICAL FOR LONG TERM SUCCESS I M P R O V EC O S T C O M P E T I T I V E N E S S 1 + I N C R E A S E A D J U S TO P E R A T I N G C A P A C I T YT O M A R K E T D E M A N D M O D U L A R I T Y& F L E X I B I L I T Y T H R O U G HT H E C Y C L E 2 3 44 |
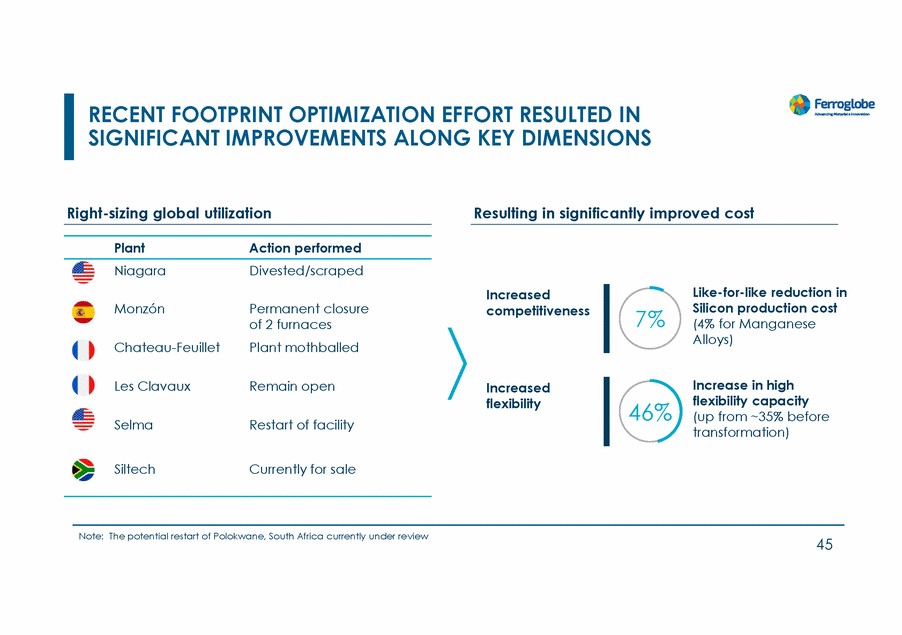
| RECENT FOOTPRINT OPTIMIZATION EFFORT RESULTED IN SIGNIFICANT IMPROVEMENTS ALONG KEY DIMENSIONS Right-sizing global utilization Resulting in significantly improved cost Plant Action performed Niagara Divested/scraped Like-for-like reduction in Silicon production cost (4% for Manganese Alloys) Increased competitiveness Monzón Permanent closure of 2 furnaces Plant mothballed 7% Chateau-Feuillet Increase in high flexibility capacity (up from ~35% before transformation) Les Clavaux Remain open Increased flexibility 46% Selma Restart of facility Siltech Currently for sale Note: The potential restart of Polokwane, South Africa currently under review 45 |
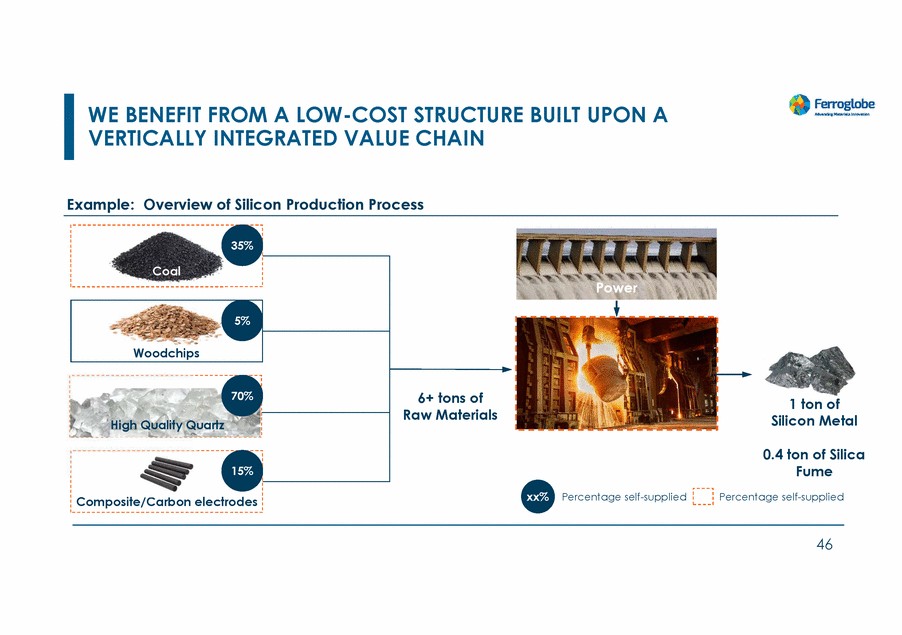
| WE BENEFIT FROM A LOW-COST STRUCTURE VERTICALLY INTEGRATED VALUE CHAIN BUILT UPON A Example: Overview of Silicon Production Process 35% Power 6+ tons of Raw Materials 1 ton of Silicon Metal 0.4 ton of Silica Fume Percentage self-supplied xx% Percentage self-supplied Composite/Carbon electrodes 46 Coal 5% Woodchips 70% High Quality Quartz 15% |
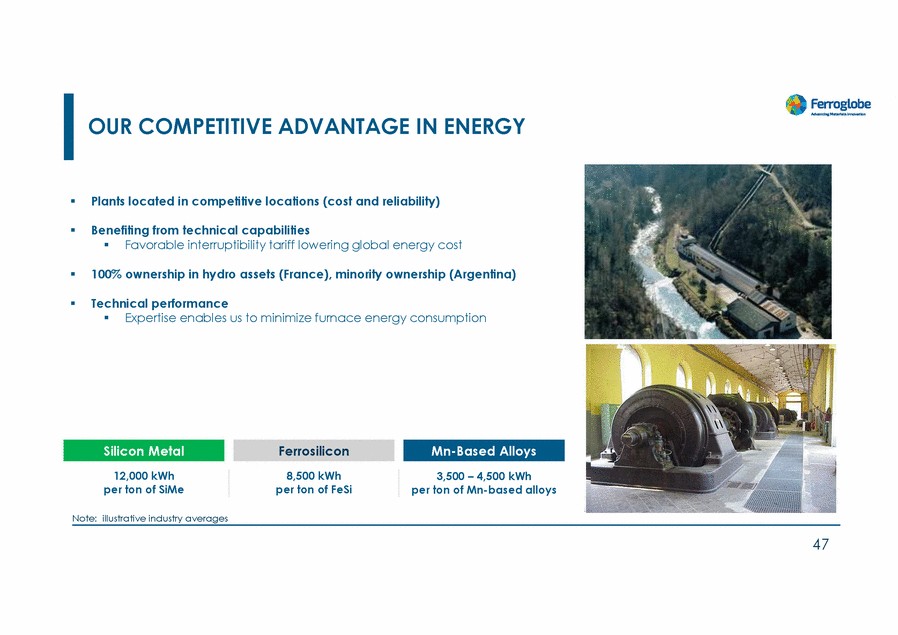
| OUR COMPETITIVE ADVANTAGE IN ENERGY Plants located in competitive locations (cost and reliability) Benefiting from technical capabilities Favorable interruptibility tariff lowering global energy cost 100% ownership in hydro assets (France), minority ownership (Argentina) Technical performance Expertise enables us to minimize furnace energy consumption 12,000 kWh per ton of SiMe 8,500 kWh per ton of FeSi 3,500 – 4,500 kWh per ton of Mn-based alloys Note: illustrative industry averages 47 Mn-Based Alloys Ferrosilicon Silicon Metal |
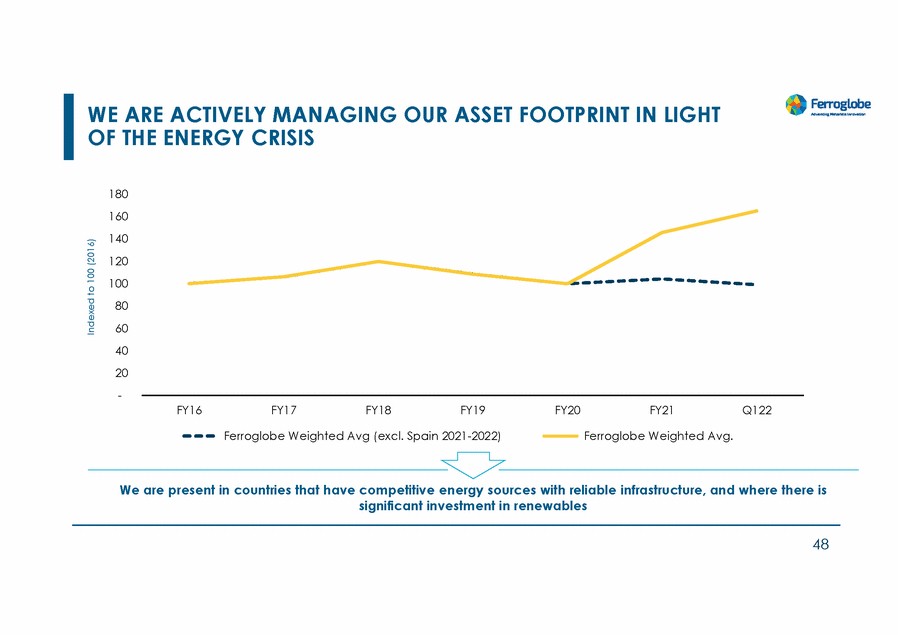
| WE ARE ACTIVELY MANAGING OUR ASSET FOOTPRINT IN LIGHT OF THE ENERGY CRISIS 180 160 140 120 100 80 60 40 20 - FY16 FY17 FY18 FY19 FY20 FY21 Q122 Ferroglobe Weighted Avg (excl. Spain 2021-2022) Ferroglobe Weighted Avg. We are present in countries that have competitive energy sources with reliable infrastructure, and where there is significant investment in renewables 48 Indexed to 100 (2016) |
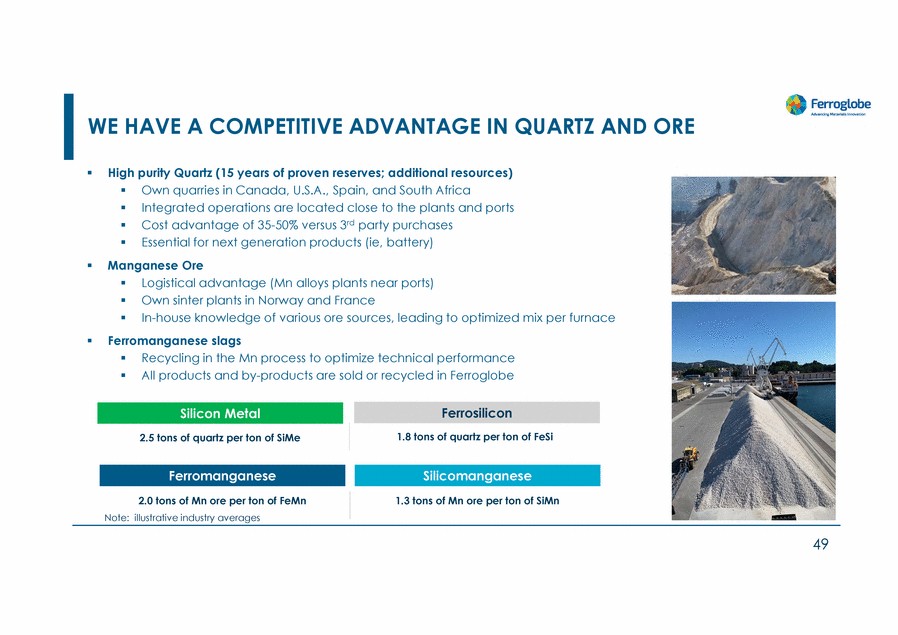
| WE HAVE A COMPETITIVE ADVANTAGE IN QUARTZ AND ORE High purity Quartz (15 years of proven reserves; additional resources) Own quarries in Canada, U.S.A., Spain, and South Africa Integrated operations are located close to the plants and ports Cost advantage of 35-50% versus 3rd party purchases Essential for next generation products (ie, battery) Manganese Ore Logistical advantage (Mn alloys plants near ports) Own sinter plants in Norway and France In-house knowledge of various ore sources, leading to optimized mix per furnace Ferromanganese slags Recycling in the Mn process to optimize technical performance All products and by-products are sold or recycled in Ferroglobe 2.5 tons of quartz per ton of SiMe 1.8 tons of quartz per ton of FeSi 2.0 tons of Mn ore per ton of FeMn Note: illustrative industry averages 1.3 tons of Mn ore per ton of SiMn 49 Silicomanganese Ferromanganese Ferrosilicon Silicon Metal |
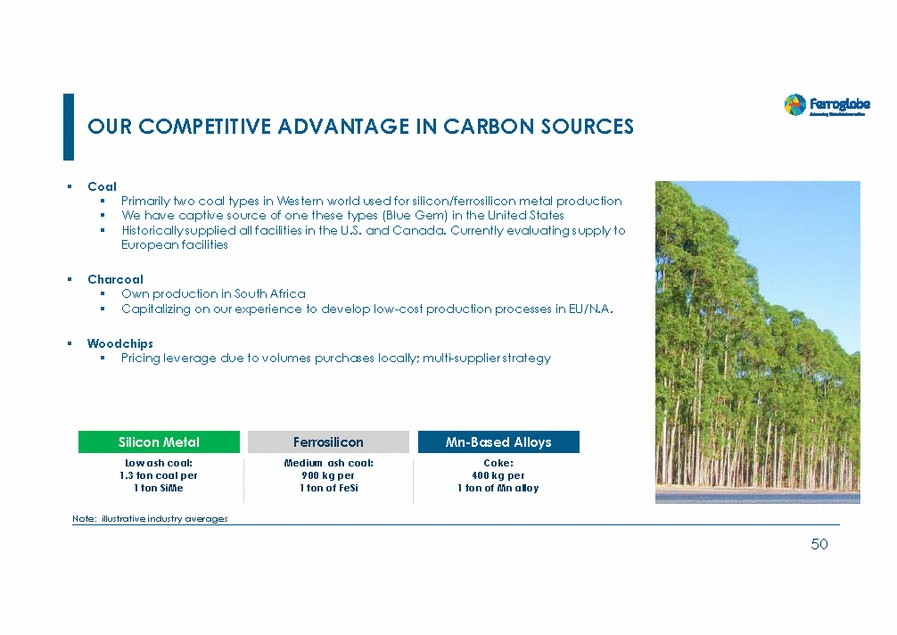
| OUR COMPETITIVE ADVANTAGE IN CARBON SOURCES Coal Primarily two coal types in Western world used for silicon/ferrosilicon metal production We have captive source of one these types (Blue Gem) in the United States Historically supplied all facilities in the U.S. and Canada. Currently evaluating supply to European facilities Charcoal Own production in South Africa Capitalizing on our experience to develop low-cost production processes in EU/N.A. Woodchips Pricing leverage due to volumes purchases locally; multi-supplier strategy Low ash coal: 1.3 ton coal per 1 ton SiMe Medium ash coal: 900 kg per 1 ton of FeSi Coke: 400 kg per 1 ton of Mn alloy Note: illustrative industry averages 50 Mn-Based Alloys Ferrosilicon Silicon Metal |
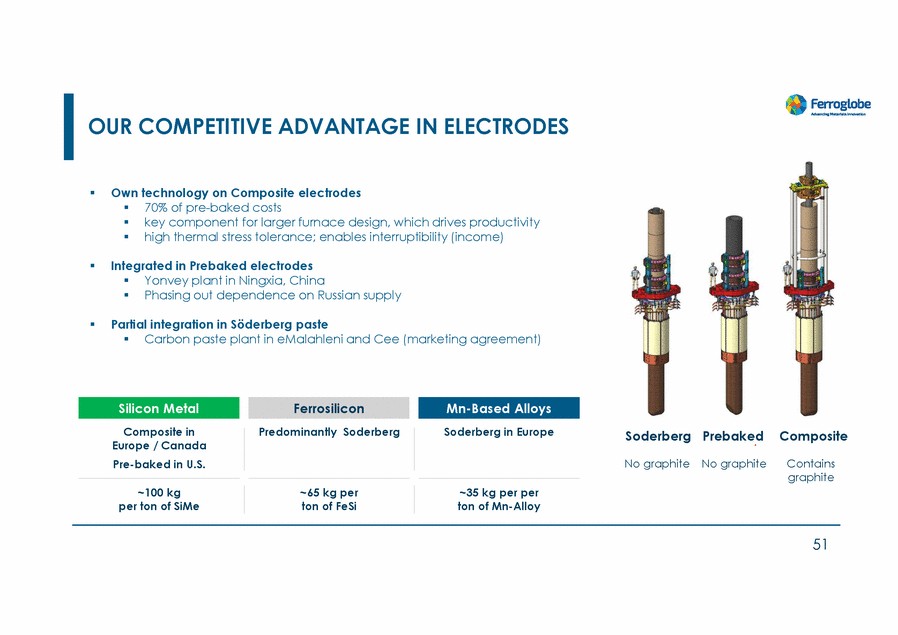
| OUR COMPETITIVE ADVANTAGE IN ELECTRODES Own technology on Composite electrodes 70% of pre-baked costs key component for larger furnace design, which drives productivity high thermal stress tolerance; enables interruptibility (income) Integrated in Prebaked electrodes Yonvey plant in Ningxia, China Phasing out dependence on Russian supply Partial integration in Söderberg paste Carbon paste plant in eMalahleni and Cee (marketing agreement) Composite in Europe / Canada Pre-baked in U.S. Predominantly Soderberg Soderberg in Europe SoderbergPrebakedComposite No graphiteNo graphite Contains graphite ~100 kg per ton of SiMe ~65 kg per ton of FeSi ~35 kg per per ton of Mn-Alloy 51 Mn-Based Alloys Ferrosilicon Silicon Metal |
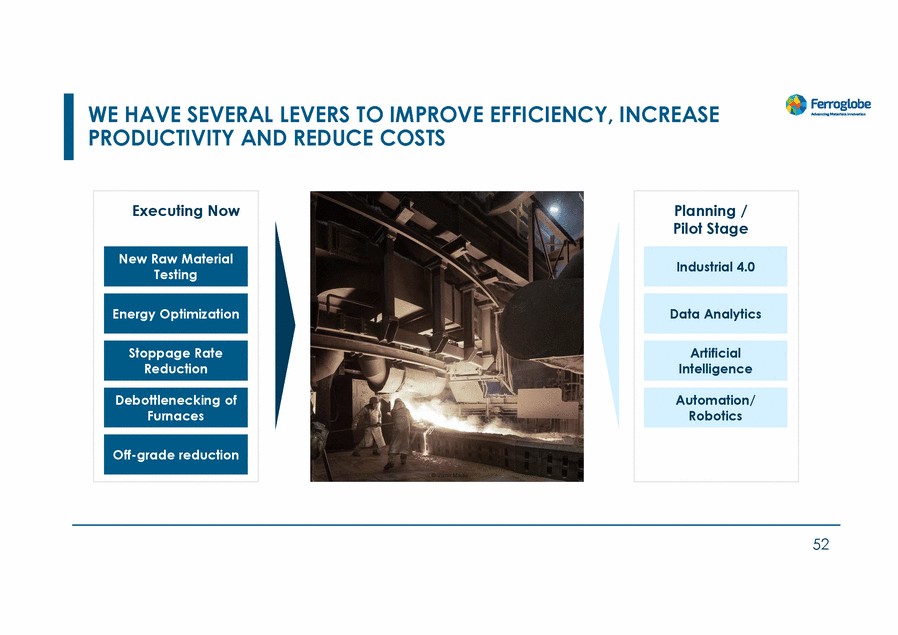
| WE HAVE SEVERAL LEVERS TO IMPROVE EFFICIENCY, INCREASE PRODUCTIVITY AND REDUCE COSTS 52 Planning / Pilot Stage Automation/ Robotics Artificial Intelligence Data Analytics Industrial 4.0 Executing Now Off-grade reduction Debottlenecking of Furnaces Stoppage Rate Reduction Energy Optimization New Raw Material Testing |
| BOLSTERING COMPETITIVENESS |
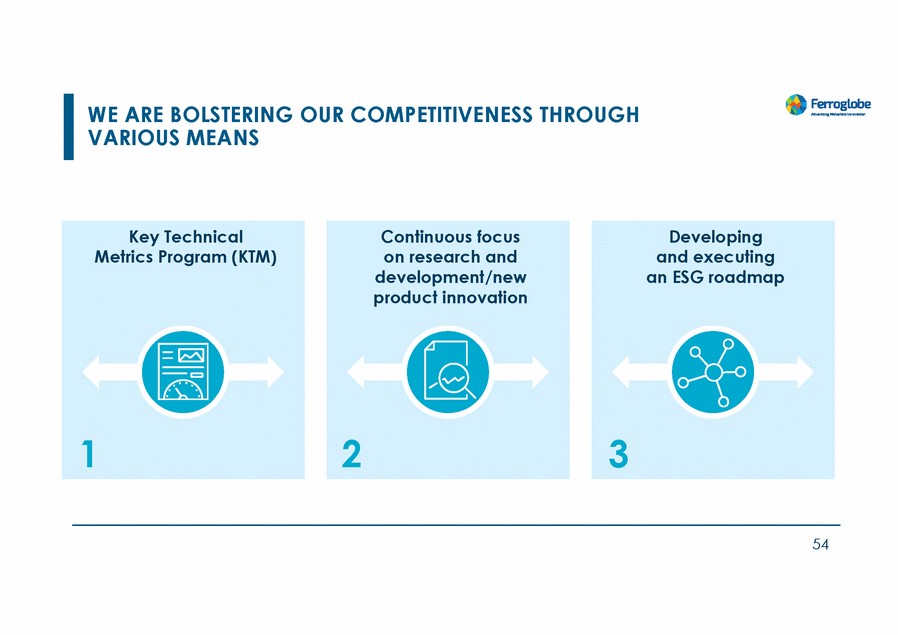
| WE ARE BOLSTERING OUR COMPETITIVENESS THROUGH VARIOUS MEANS 54 Developing and executing an ESG roadmap 3 Continuous focus on research and development/new product innovation 2 Key Technical Metrics Program (KTM) 1 |
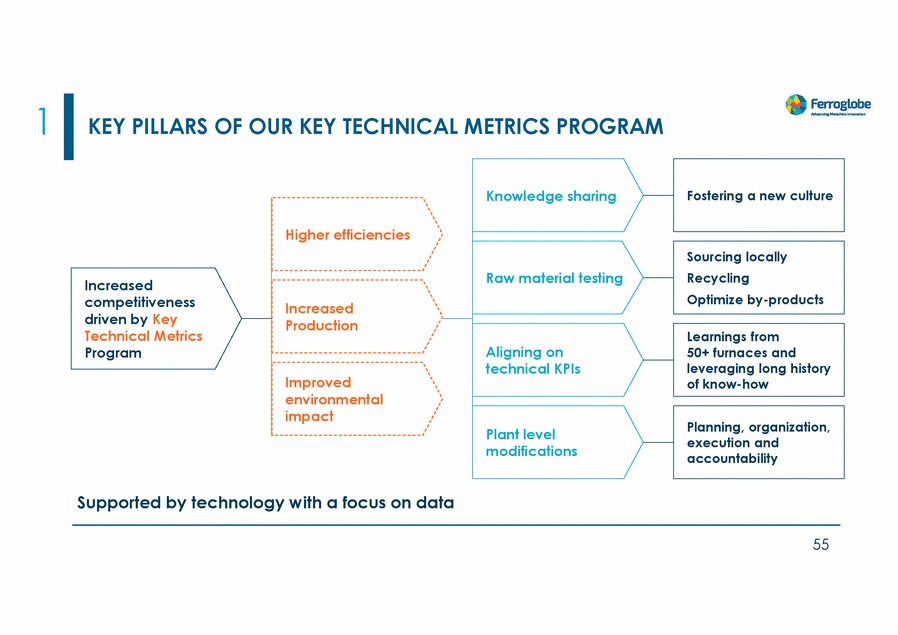
| 1 KEY PILLARS OF OUR KEY TECHNICAL METRICS PROGRAM Knowledge sharing Higher efficiencies Raw material testing Increased competitiveness driven by Key Technical Metrics Program Increased Production Aligning on technical KPIs Improved environmental impact Plant level modifications Supported by technology with a focus on data 55 Planning, organization, execution and accountability Learnings from 50+ furnaces and leveraging long history of know-how Sourcing locally Recycling Optimize by-products Fostering a new culture |
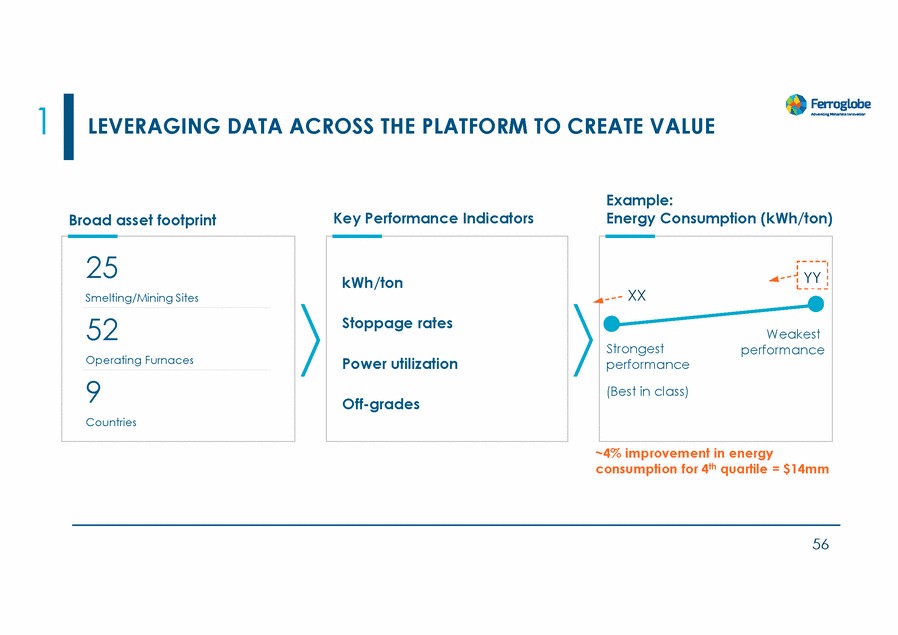
| 1 LEVERAGING DATA ACROSS THE PLATFORM TO CREATE VALUE Example: Energy Consumption (kWh/ton) Key Performance Indicators Broad asset footprint XX Strongest performance ~4% improvement in energy consumption for 4th quartile = $14mm 56 YY Weakest performance (Best in class) kWh/ton Stoppage rates Power utilization Off-grades 25 Smelting/Mining Sites 52 Operating Furnaces 9 Countries |
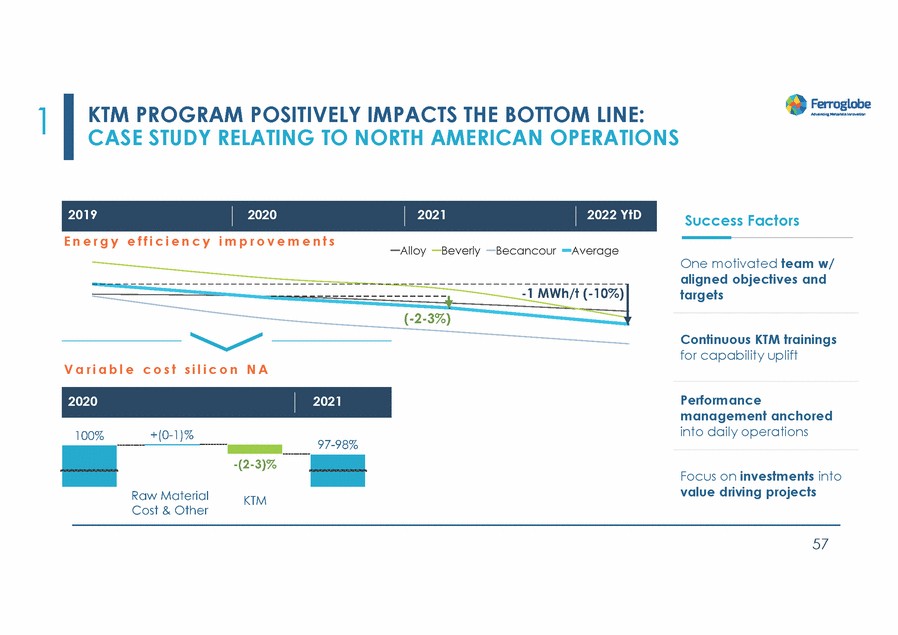
| 1 KTM PROGRAM POSITIVELY IMPACTS THE BOTTOM LINE: CASE STUDY RELATING TO NORTH AMERICAN OPERATIONS Success Factors E n e r g y e f f i c i e n c y i m p r o v e m e n t s One motivated team w/ aligned objectives and targets Continuous KTM trainings for capability uplift V a r i a b l e c o s t s i l i c o n N A Performance management anchored into daily operations Focus on investments into value driving projects 57 2020 2021 2019 2020 2021 2022 YtD |
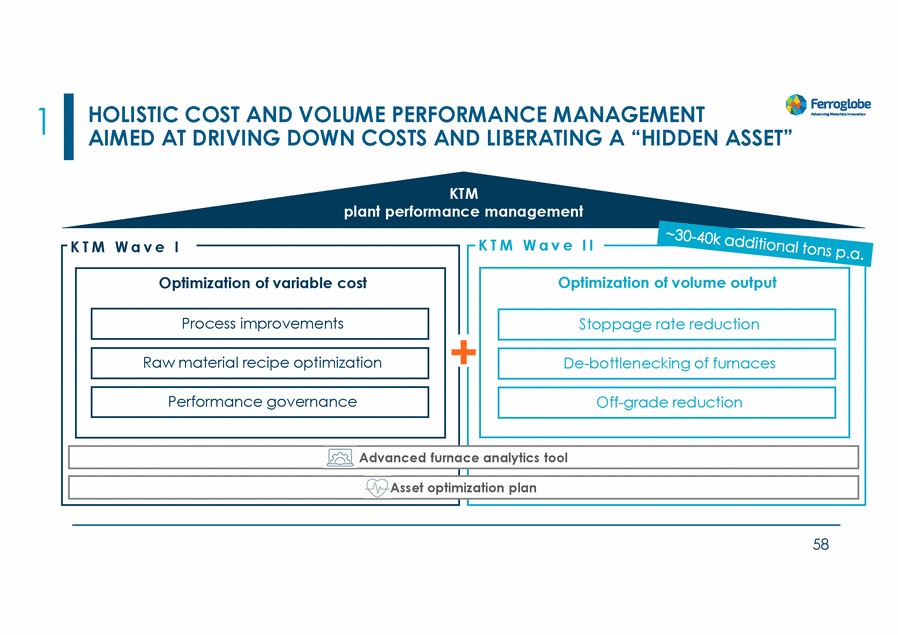
| 1 HOLISTIC COST AND VOLUME PERFORMANCE MANAGEMENT AIMED AT DRIVING DOWN COSTS AND LIBERATING A “HIDDEN ASSET” KTM plant performance management K T M W a v e I I K T M W a v e I + ace analytics tool mi 58 Advanced furn Asset opti zation plan Optimization of volume output Off-grade reduction De-bottlenecking of furnaces Stoppage rate reduction Optimization of variable cost Performance governance Raw material recipe optimization Process improvements |
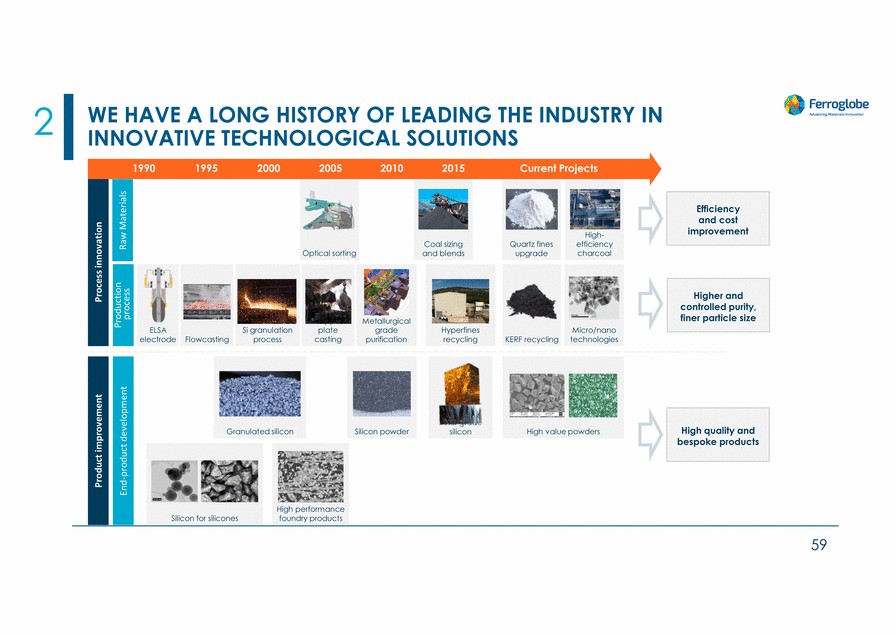
| 2 WE HAVE A LONG HISTORY OF LEADING THE INDUSTRY IN INNOVATIVE TECHNOLOGICAL SOLUTIONS finer particle size 59 Product improvement Process innovation Production process End-product development Raw Materials Silicon for silicones High performance foundry products High quality and bespoke products High value powders Solar grade silicon Silicon powder Granulated silicon Higher and controlled purity, Micro/nano technologies KERF recycling Hyperfines recycling Efficiency and cost improvement Coal sizing and blends Optical sorting ELSA electrode Flowcasting Si granulation process Copper plate casting Upgraded Metallurgical grade purification Current Projects Quartz fines upgrade High-efficiency charcoal 2015 2010 2005 2000 1995 1990 |
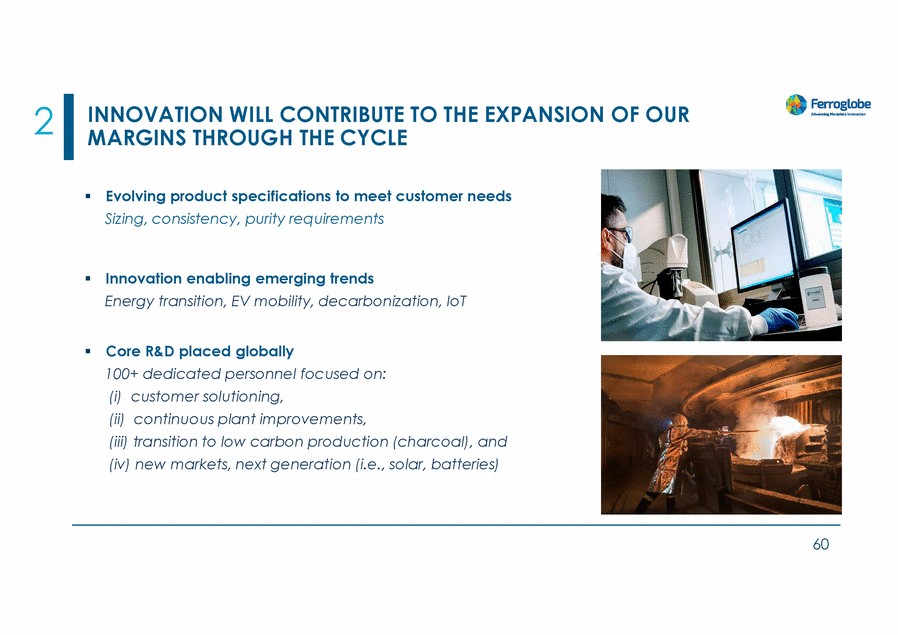
| 2 INNOVATION WILL CONTRIBUTE TO THE EXPANSION MARGINS THROUGH THE CYCLE OF OUR Evolving product specifications to meet customer needs Sizing, consistency, purity requirements Innovation enabling emerging trends Energy transition, EV mobility, decarbonization, IoT Core R&D placed globally 100+ dedicated personnel focused on: (i) customer solutioning, (ii) continuous plant improvements, (iii) transition to low carbon production (charcoal), and (iv) new markets, next generation (i.e., solar, batteries) 60 |
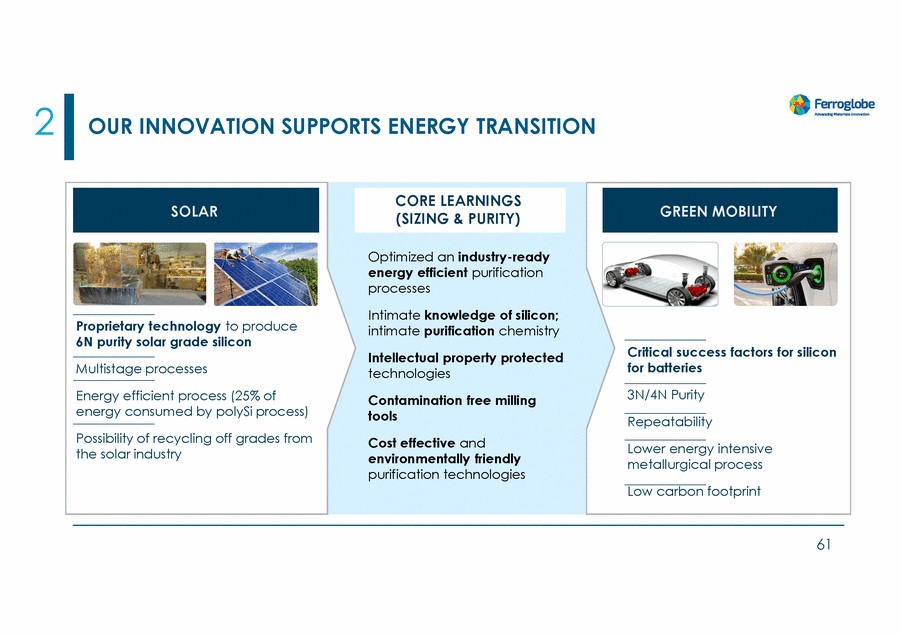
| 2 OUR INNOVATION SUPPORTS ENERGY TRANSITION CORE LEARNINGS (SIZING & PURITY) Optimized an industry-ready energy efficient purification processes Intimate knowledge of silicon; intimate purification chemistry Intellectual property protected technologies Proprietary technology to produce 6N purity solar grade silicon Critical success factors for silicon for batteries Multistage processes 3N/4N Purity Energy efficient process (25% of energy consumed by polySi process) Contamination free milling tools Cost effective and environmentally friendly purification technologies Repeatability Possibility of recycling off grades from the solar industry Lower energy intensive metallurgical process Low carbon footprint 61 GREEN MOBILITY SOLAR |
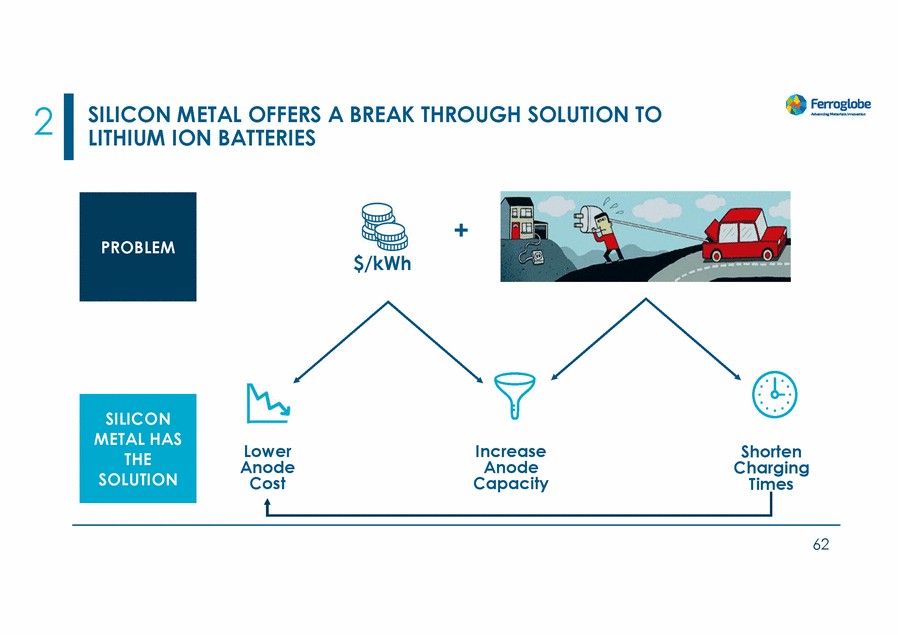
| 2 SILICON METAL OFFERS A BREAK THROUGH SOLUTION TO LITHIUM ION BATTERIES + $/kWh Lower Anode Cost Increase Shorten Charging Times Anode Capacity 62 SILICON METAL HAS THE SOLUTION PROBLEM |
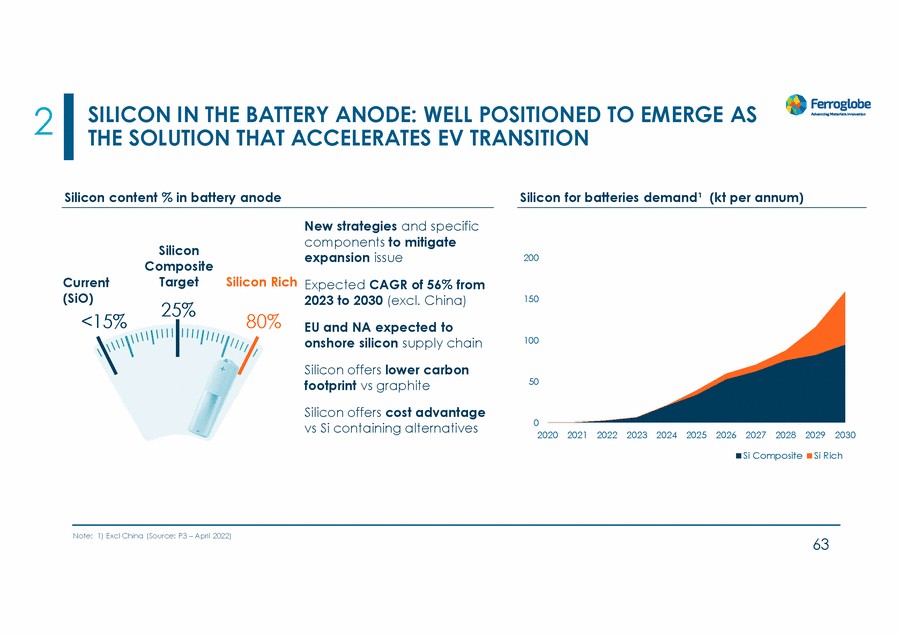
| 2 SILICON IN THE BATTERY ANODE: WELL POSITIONED TO EMERGE AS THE SOLUTION THAT ACCELERATES EV TRANSITION Silicon content % in battery anode Silicon for batteries demand¹ (kt per annum) New strategies and specific components to mitigate expansion issue Silicon Composite Target 25% 200 Silicon Rich Current (SiO) <15% Expected CAGR of 56% from 2023 to 2030 (excl. China) 150 80% EU and NA expected to onshore silicon supply chain 100 Silicon offers lower carbon footprint vs graphite 50 Silicon offers cost advantage vs Si containing alternatives 0 2020 2021 2022 2023 2024 2025 2026 2027 2028 2029 2030 Si CompositeSi Rich Note: 1) Excl China (Source: P3 – April 2022) 63 |
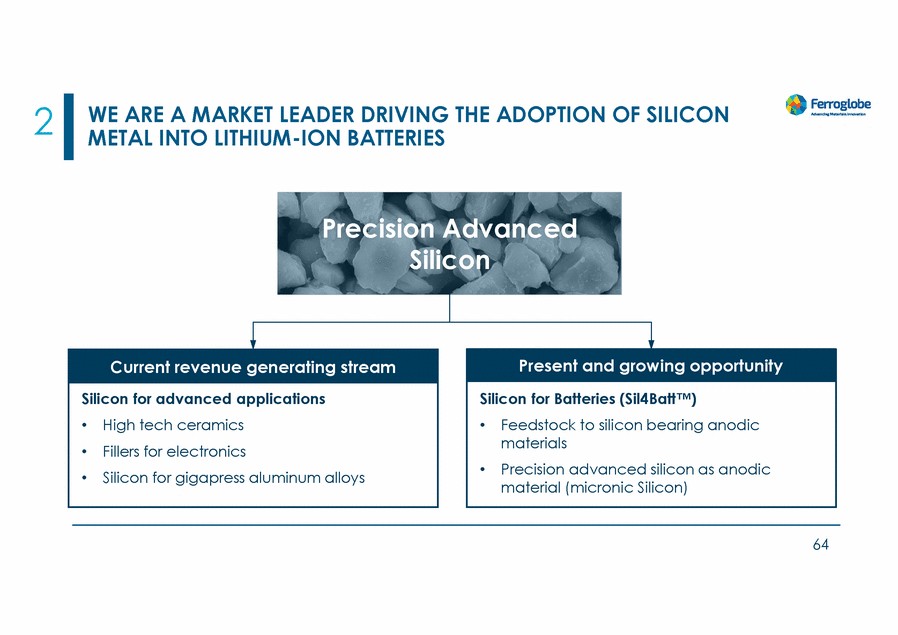
| 2 WE ARE A MARKET LEADER DRIVING THE ADOPTION OF SILICON METAL INTO LITHIUM-ION BATTERIES Precision Advanced Silicon 64 Current revenue generating stream Silicon for advanced applications •High tech ceramics •Fillers for electronics •Silicon for gigapress aluminum alloys Present and growing opportunity Silicon for Batteries (Sil4Batt™) •Feedstock to silicon bearing anodic materials •Precision advanced silicon as anodic material (micronic Silicon) |
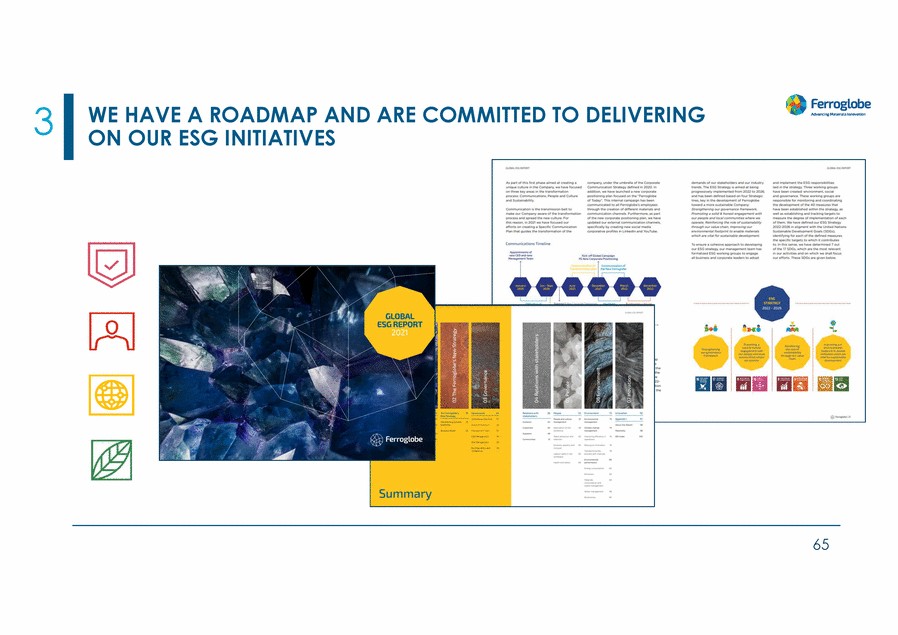
| 3 WE HAVE A ROADMAP AND ARE COMMITTED TO DELIVERING ON OUR ESG INITIATIVES 65 |
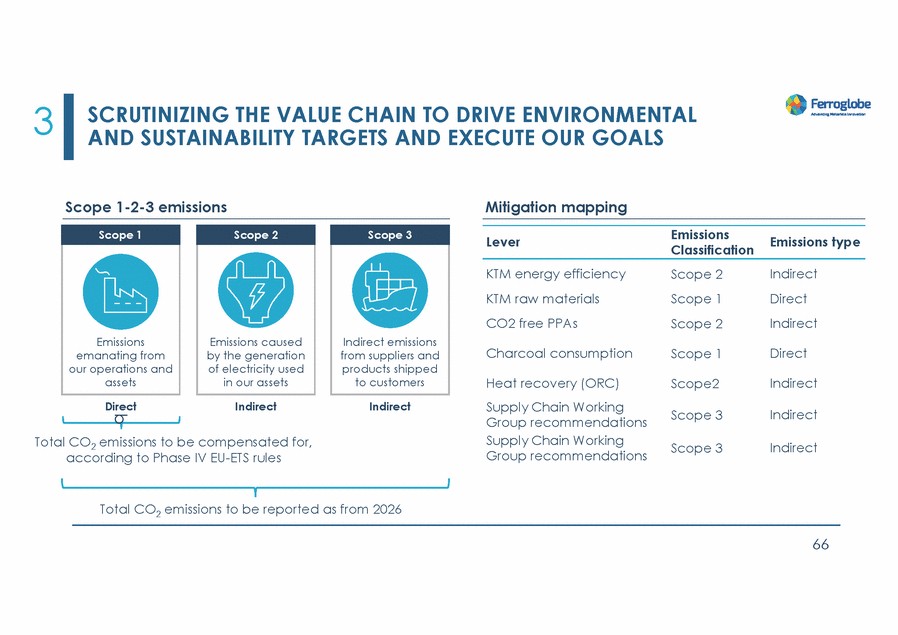
| 3 SCRUTINIZING THE VALUE CHAIN TO DRIVE ENVIRONMENTAL AND SUSTAINABILITY TARGETS AND EXECUTE OUR GOALS Scope 1-2-3 emissions Mitigation mapping Emissions Classification Scope 1 Scope 2 Scope 3 Lever Emissions type KTM energy efficiency KTM raw materials CO2 free PPAs Scope 2 Scope 1 Scope 2 Indirect Direct Indirect Charcoal consumption Direct Scope 1 Heat recovery (ORC) Supply Chain Working Group recommendations Supply Chain Working Group recommendations Indirect Scope2 Direct Indirect Indirect Scope 3 Indirect Total CO2 emissions to be compensated for, according to Phase IV EU-ETS rules Scope 3 Indirect Total CO2 emissions to be reported as from 2026 66 b Indirect emissions from suppliers and products shipped to customers Emissions emanating from our operations and assets Emissions caused by the generation of electricity used in our assets |
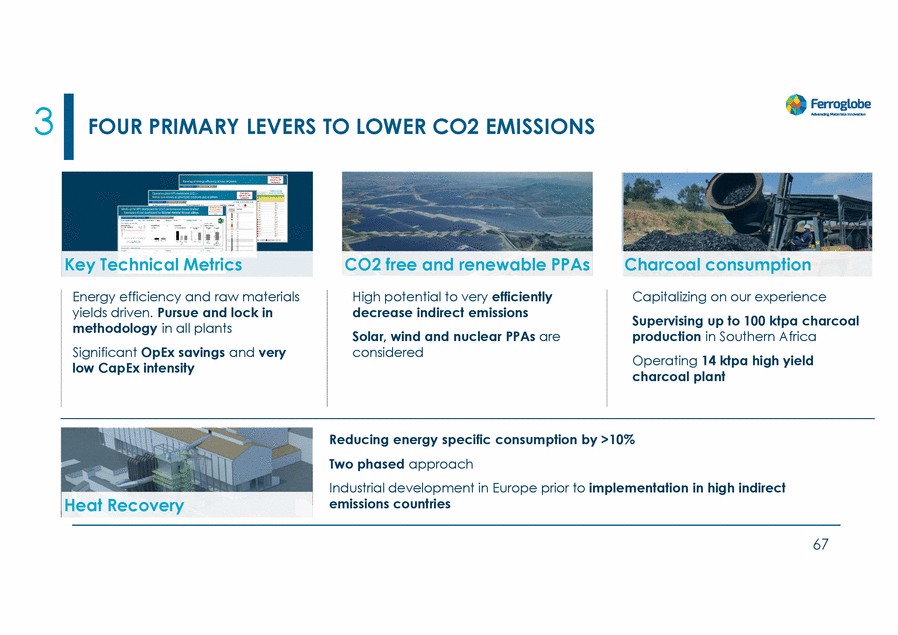
| 3 FOUR PRIMARY LEVERS TO LOWER CO2 EMISSIONS CO2 free and renewable PPAs High potential to very efficiently decrease indirect emissions Solar, wind and nuclear PPAs are considered Charcoal consumption Capitalizing on our experience Supervising up to 100 ktpa charcoal production in Southern Africa Operating 14 ktpa high yield charcoal plant Energy efficiency and raw materials yields driven. Pursue and lock in methodology in all plants Significant OpEx savings and very low CapEx intensity Reducing energy specific consumption by >10% Two phased approach Industrial development in Europe prior to implementation in high indirect emissions countries Heat Recovery 67 Key Tecs chnical Metri |
| Q&A |

| CUSTOMER VALUE PROPOSITION |

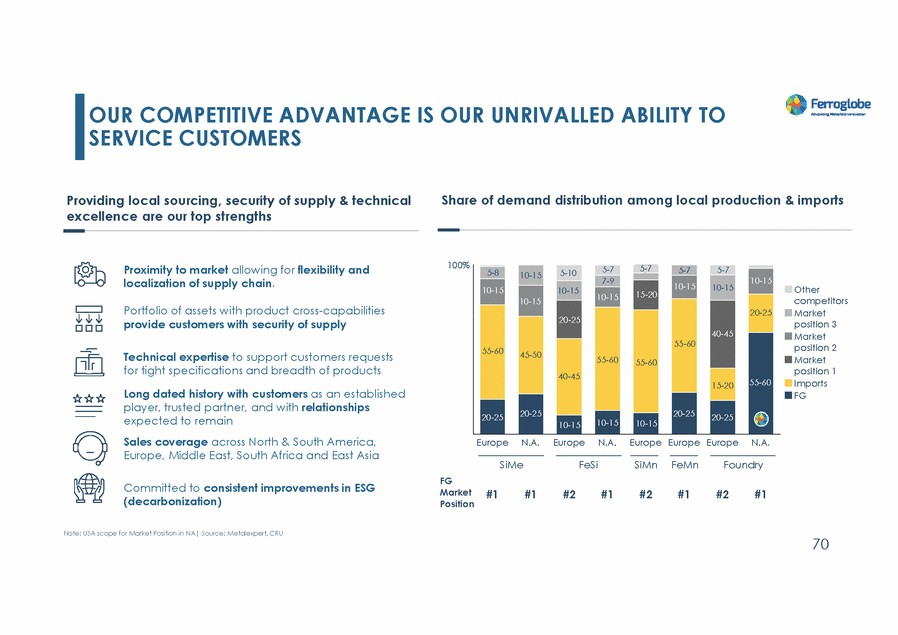
| OUR COMPETITIVE ADVANTAGE SERVICE CUSTOMERS IS OUR UNRIVALLED ABILITY TO Providing local sourcing, security of supply & technical excellence are our top strengths Share of demand distribution among local production & imports 100% Proximity to market allowing for flexibility and localization of supply chain. Other competitors Market position 3 Market position 2 Market position 1 Imports FG Portfolio of assets with product cross-capabilities provide customers with security of supply Technical expertise to support customers requests for tight specifications and breadth of products 55-60 Long dated history with customers as an established player, trusted partner, and with relationships expected to remain Sales coverage across North & South America, Europe, Middle East, South Africa and East Asia 10-15 Europe N.A. Europe N.A. Europe Europe Europe N.A. SiMe FeSi SiMn FeMn Foundry FG Market Position Committed to consistent improvements in ESG (decarbonization) #1 #1 #2 #1 #2 #1 #2 #1 Note: USA scope for Market Position in NA| Source: Metalexpert, CRU 70 75%-8 59-1%0 65%-7 5-%7 65%-7 65%-7 1102-%15 1158-%20 10-15 2203-%25 4400-4%5 61% 5650-6%0 4405-%45 1159-%20 2205-2%5 2204-%25 2200-2%5 2201-%25 14% 1103-%15 1101-%15 5651-%60 45-50 55-60 56% 5555-%60 2202-%25 1101-1%5 1106-%15 1105-%15 1104-%15 7%-9 1105-%15 1102-1%5 |
| SILICON METAL |

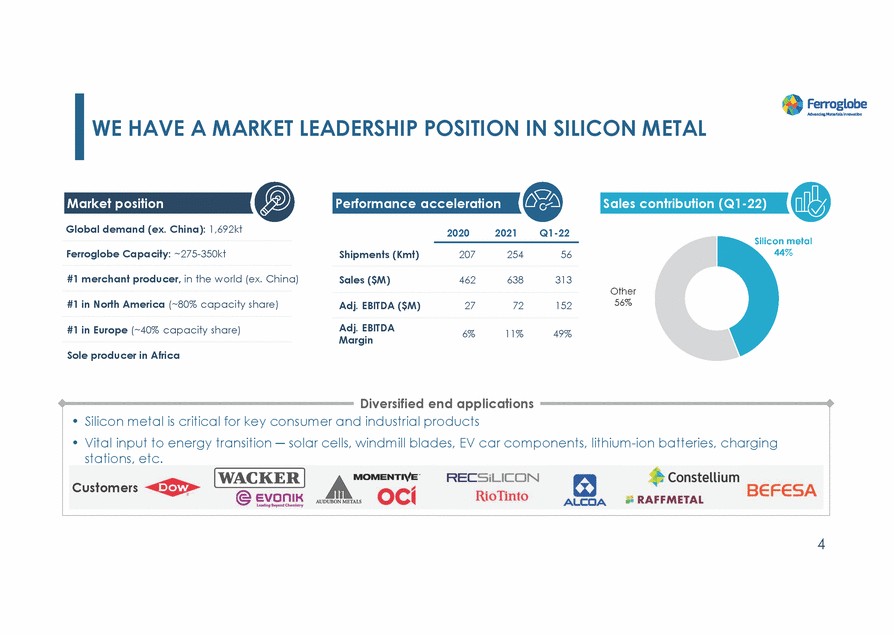
| WE HAVE A MARKET LEADERSHIP POSITION IN SILICON METAL Market position Performance acceleration Sales contribution (Q1-22) Global demand (ex. China): 1,692kt 2020 2021 Q1-22 Ferroglobe Capacity: ~275-350kt Shipments (Kmt) 207 254 56 #1 merchant producer, in the world (ex. China) Sales ($M) 462 638 313 #1 in North America (~80% capacity share) Adj. EBITDA ($M) 27 72 152 Adj. EBITDA Margin #1 in Europe (~40% capacity share) 6% 11% 49% Sole producer in Africa Diversified end applications 4 • Silicon metal is critical for key consumer and industrial products • Vital input to energy transition ─ solar cells, windmill blades, EV car components, lithium-ion batteries, charging stations, etc. Customers |
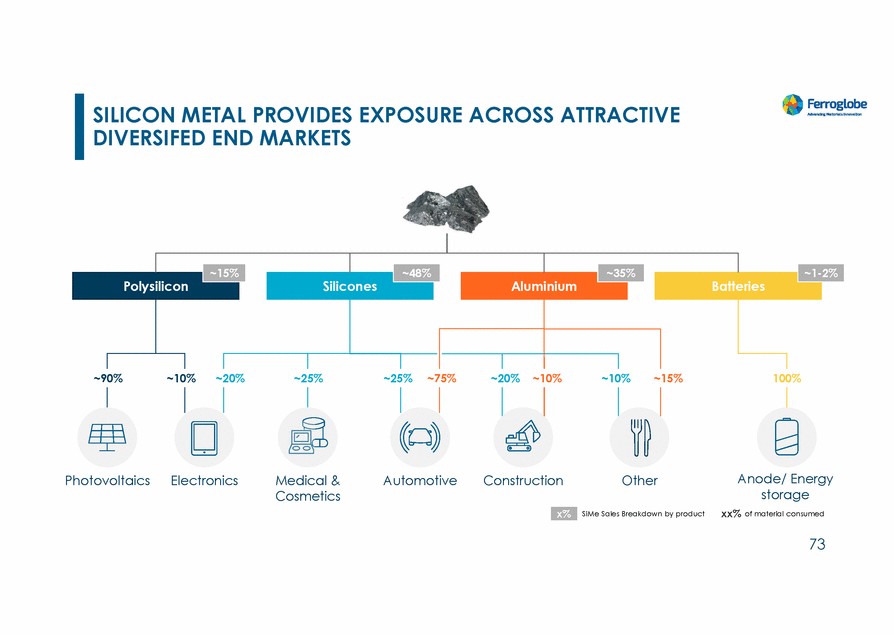
| SILICON METAL PROVIDES EXPOSURE ACROSS ATTRACTIVE DIVERSIFED END MARKETS ~15% ~48% ~35% ~1-2% 5% ~75% ~20% ~10% ~10% ~15% 100% Anode/ Energy storage xx% of material consumed Photovoltaics Electronics Medical & Cosmetics Automotive Construction Other SiMe Sales Breakdown by product 73 x% Polysilicon Silicones Aluminium Batteries ~9 0% ~10 % ~ 20% ~2 5% ~2 |
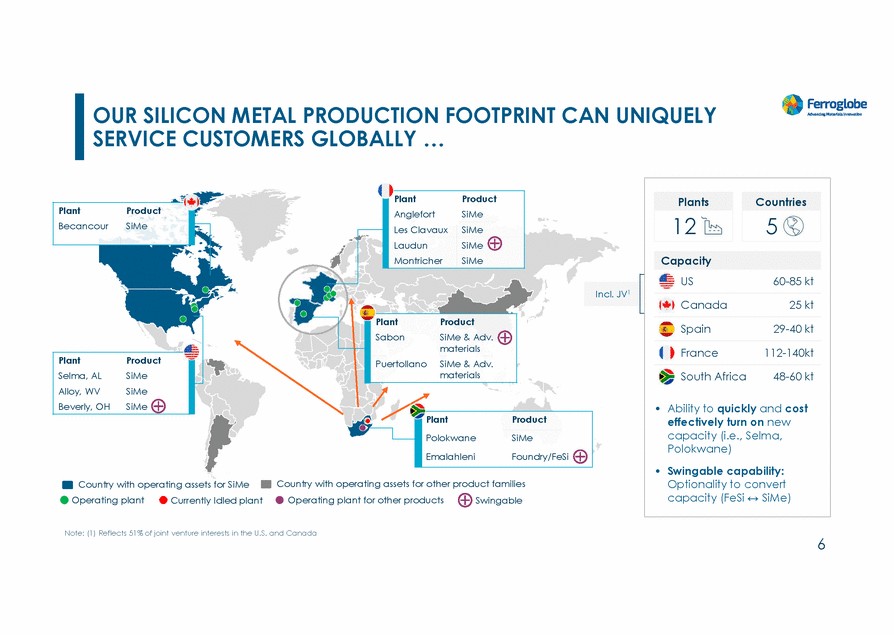
| OUR SILICON METAL PRODUCTION FOOTPRINT CAN UNIQUELY SERVICE CUSTOMERS GLOBALLY … Becancour SiMe Incl. JV1 Country with operating assets for other product families Country with operating assets for SiMe Operating plant Currently Idled plant Operating plant for other products Swingable Note: (1) Reflects 51% of joint venture interests in the U.S. and Canada 6 PlantProduct PolokwaneSiMe EmalahleniFoundry/FeSi PlantProduct Selma, AL Si Alloy, WV SiMe Beverly, OH SiMe Me PlantProduct SabonSiMe & Adv. materials PuertollanoSiMe & Adv. materials PlantProduct Plant Product Anglefort SiMe Les Clavaux SiMe Laudun SiMe Montricher SiMe US 60-85 kt Canada 25 kt Spain 29-40 kt France 112-140kt South Africa 48-60 kt • Ability to quickly and cost effectively turn on new capacity (i.e., Selma, Polokwane) • Swingable capability: Optionality to convert capacity (FeSi ↔ SiMe) Capacity Countries 5 Plants 12 |
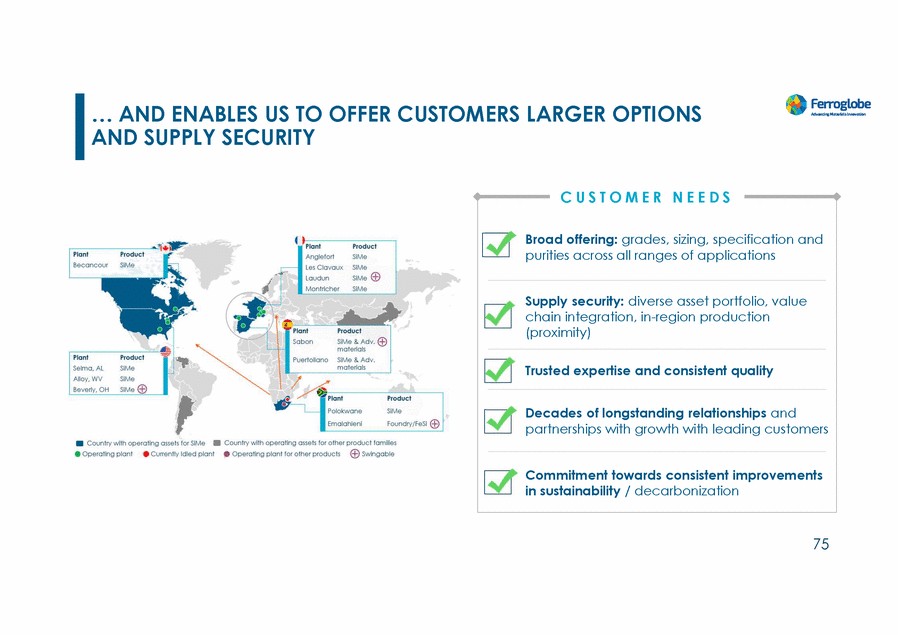
| … AND ENABLES US TO OFFER CUSTOMERS LARGER OPTIONS AND SUPPLY SECURITY C U S T O M E R N E E D S 75 Broad offering: grades, sizing, specification and purities across all ranges of applications Supply security: diverse asset portfolio, value chain integration, in-region production (proximity) Trusted expertise and consistent quality Decades of longstanding relationships and partnerships with growth with leading customers Commitment towards consistent improvements in sustainability / decarbonization |
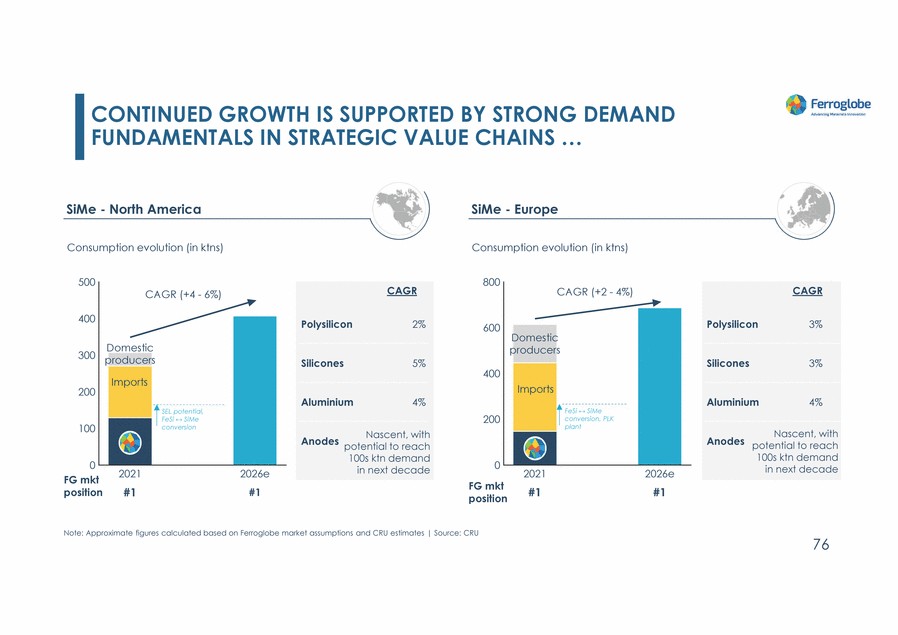
| CONTINUED GROWTH IS SUPPORTED BY STRONG DEMAND FUNDAMENTALS IN STRATEGIC VALUE CHAINS … SiMe - North America SiMe - Europe Anodes potential to reach Note: Approximate figures calculated based on Ferroglobe market assumptions and CRU estimates | Source: CRU 76 SEL potential, FeSi ↔ SiMe conversion FeSi ↔ SiMe conversion, PLK plant CAGR Polysilicon2% Silicones5% Aluminium4% Nascent, with 100s ktn demand in next decade CAGR Polysilicon3% Silicones3% Aluminium4% Nascent, with Anodes potential to reach 100s ktn demand in next decade |
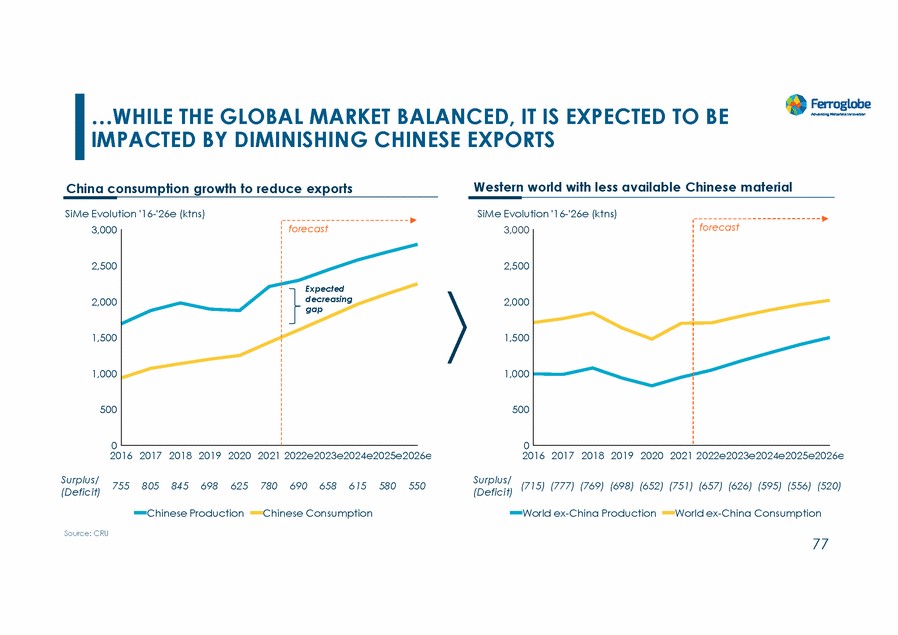
| …WHILE THE GLOBAL MARKET BALANCED, IT IS EXPECTED TO BE IMPACTED BY DIMINISHING CHINESE EXPORTS Western world with less available Chinese material China consumption growth to reduce exports SiMe Evolution '16-'26e (ktns) SiMe Evolution '16-'26e (ktns) forecast forecast 3,000 3,000 2,500 2,500 2,000 2,000 1,500 1,500 1,000 1,000 500 500 0 0 2016 2017 2018 2019 2020 2021 2022e2023e2024e2025e2026e 2016 2017 2018 2019 2020 2021 2022e2023e2024e2025e2026e Surplus/ (Deficit) Surplus/ (Deficit) 755 805 845 698 625 780 690 658 615 580 550 (715) (777) (769) (698) (652) (751) (657) (626) (595) (556) (520) Chinese Production Chinese Consumption World ex-China Production World ex-China Consumption Source: CRU 77 Expected decreasing gap |
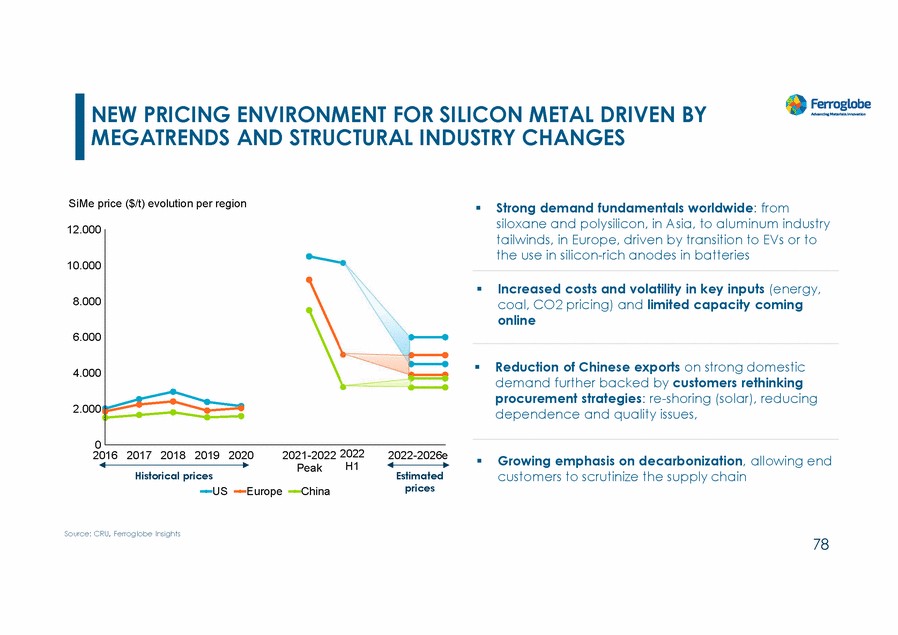
| NEW PRICING ENVIRONMENT FOR SILICON METAL DRIVEN BY MEGATRENDS AND STRUCTURAL INDUSTRY CHANGES SiMe price ($/t) evolution per region Strong demand fundamentals worldwide: from siloxane and polysilicon, in Asia, to aluminum industry tailwinds, in Europe, driven by transition to EVs or to the use in silicon-rich anodes in batteries 12.000 10.000 Increased costs and volatility in key inputs (energy, coal, CO2 pricing) and limited capacity coming online 8.000 6.000 Reduction of Chinese exports on strong domestic demand further backed by customers rethinking procurement strategies: re-shoring (solar), reducing dependence and quality issues, 4.000 2.000 0 2021-2022 2022 2016 2017 2018 2019 2020 Historical prices 2022-2026e Estimated prices Growing emphasis on decarbonization, allowing end customers to scrutinize the supply chain H1 Peak US Europe China Source: CRU, Ferroglobe Insights 78 |
| SILICON BASED ALLOYS |
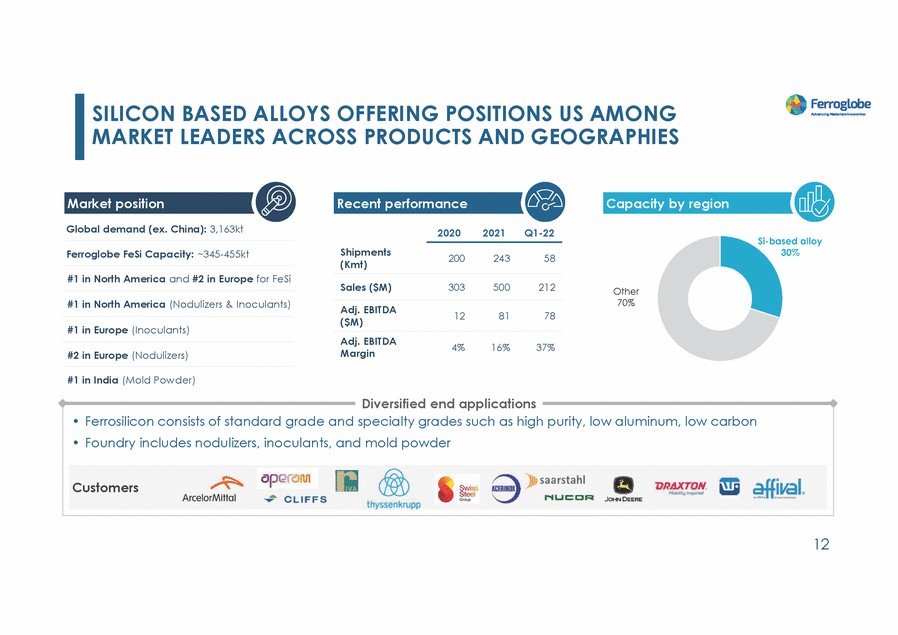
| SILICON BASED ALLOYS OFFERING POSITIONS US AMONG MARKET LEADERS ACROSS PRODUCTS AND GEOGRAPHIES Market position Recent performance Capacity by region Global demand (ex. China): 3,163kt 2020 2021 Q1-22 Shipments (Kmt) Ferroglobe FeSi Capacity: ~345-455kt 200 243 58 #1 in North America and #2 in Europe for FeSi Sales ($M) 303 500 212 #1 in North America (Nodulizers & Inoculants) Adj. EBITDA ($M) 12 81 78 #1 in Europe (Inoculants) Adj. EBITDA Margin 4% 16% 37% #2 in Europe (Nodulizers) #1 in India (Mold Powder) Diversified end applications 12 • Ferrosilicon consists of standard grade and specialty grades such as high purity, low aluminum, low carbon • Foundry includes nodulizers, inoculants, and mold powder Customers |
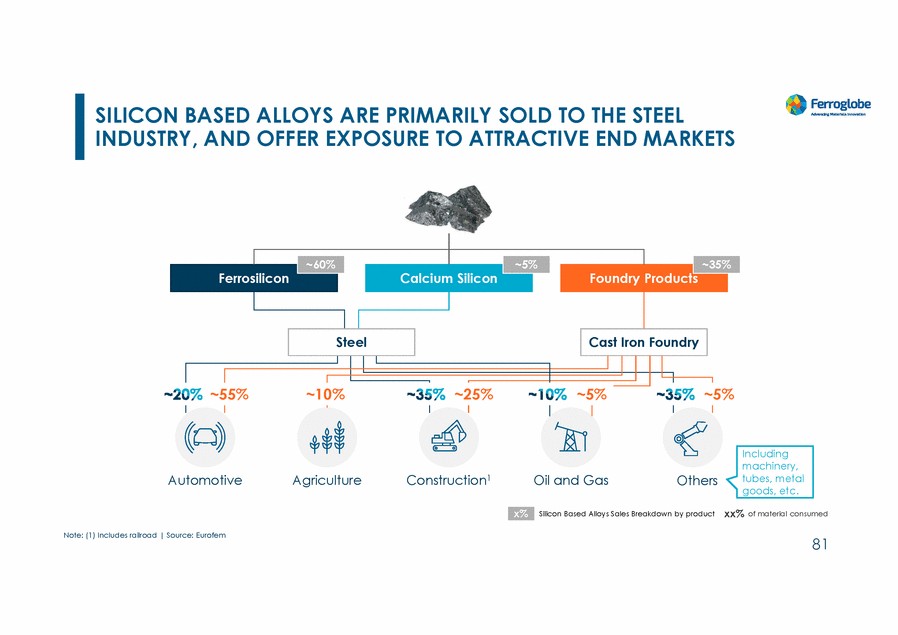
| SILICON BASED ALLOYS ARE PRIMARILY SOLD TO THE STEEL INDUSTRY, AND OFFER EXPOSURE TO ATTRACTIVE END MARKETS ~60% ~5% ~35% Steel Cast Iron Foundry 55% ~10% 25% 5% Including machinery, tubes, metal goods, etc. Automotive Agriculture Construction1 Oil and Gas Others xx% of material consumed Silicon Based Alloys Sales Breakdown by product Note: (1) Includes railroad | Source: Eurofem 81 x% Ferrosilicon Calcium Silicon Foundry Products ~ ~ 5% ~ ~ |
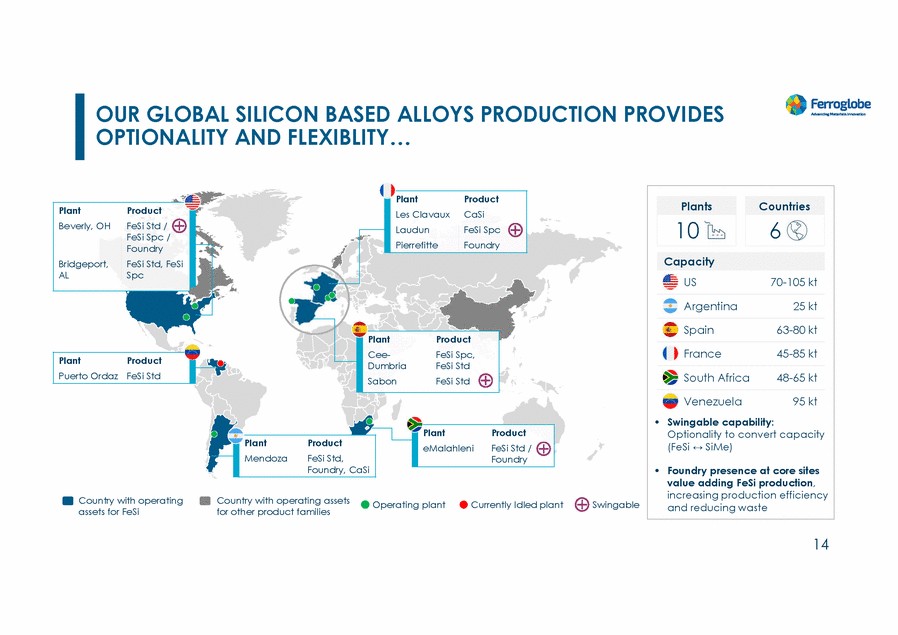
| OUR GLOBAL SILICON BASED ALLOYS PRODUCTION PROVIDES OPTIONALITY AND FLEXIBLITY… FeSi Std / Foundry Country with operating assets for FeSi Country with operating assets for other product families Operating plant Currently Idled plant Swingable 14 PlantProduct MendozaFeSi Std, Foundry, CaSi PlantProduct eMalahleniFeSi Std / Foundry PlantProduct Puerto Ordaz FeSi Std PlantProduct Cee-FeSi Spc, DumbriaFeSi Std SabonFeSi Std Plant Beverly, OH Bridgeport, AL Product FeSi Spc / FeSi Std, FeSi Spc PlantProduct Les ClavauxCaSi LaudunFeSi Spc PierrefitteFoundry US 70-105 kt Argentina 25 kt Spain 63-80 kt France 45-85 kt South Africa 48-65 kt Venezuela 95 kt • Swingable capability: Optionality to convert capacity (FeSi ↔ SiMe) • Foundry presence at core sites value adding FeSi production, increasing production efficiency and reducing waste Capacity Countries 6 Plants 10 |
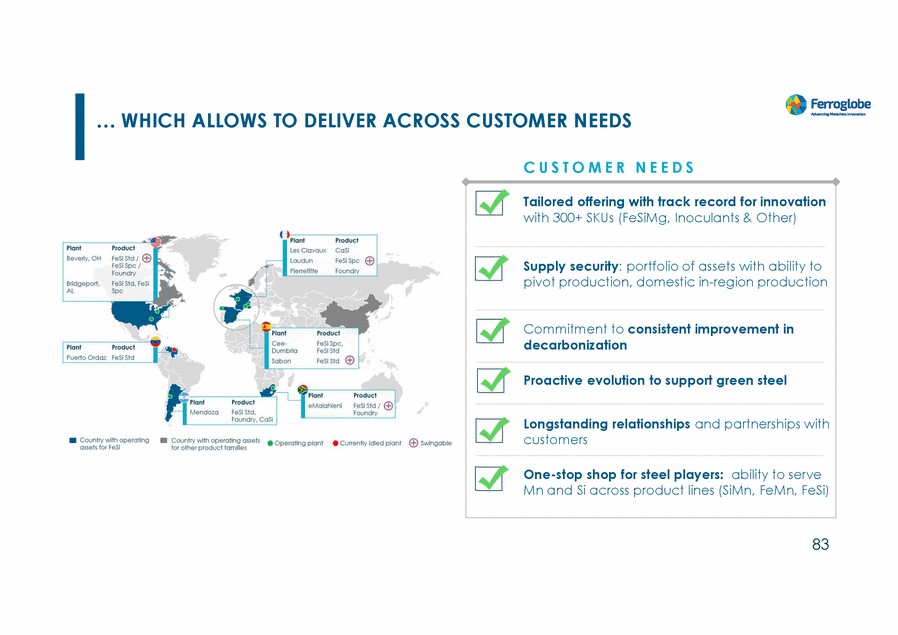
| … WHICH ALLOWS TO DELIVER ACROSS CUSTOMER NEEDS C U S T O M E R N E E D S 83 Tailored offering with track record for innovation with 300+ SKUs (FeSiMg, Inoculants & Other) Supply security: portfolio of assets with ability to pivot production, domestic in-region production Commitment to consistent improvement in decarbonization Proactive evolution to support green steel Longstanding relationships and partnerships with customers One-stop shop for steel players: ability to serve Mn and Si across product lines (SiMn, FeMn, FeSi) |
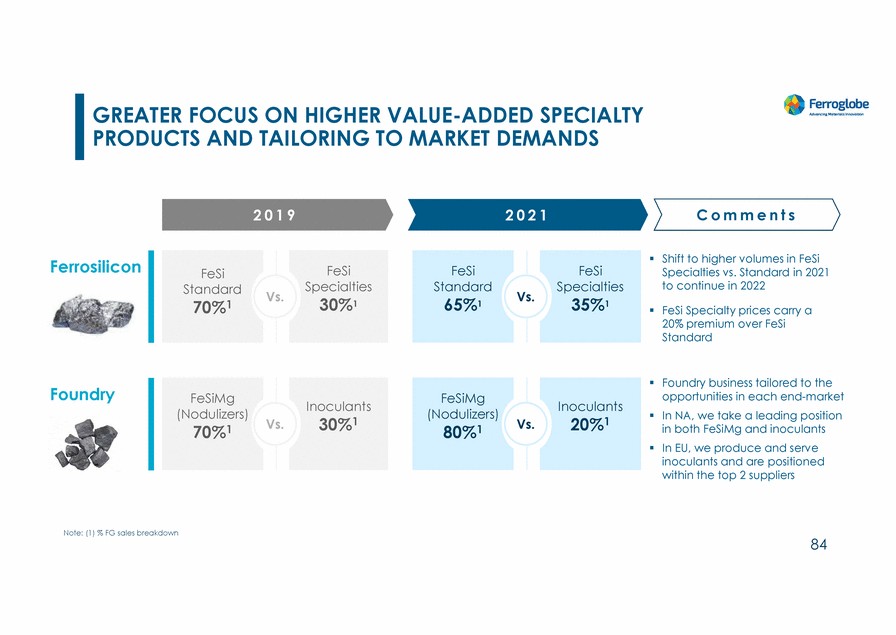
| GREATER FOCUS ON HIGHER VALUE-ADDED SPECIALTY PRODUCTS AND TAILORING TO MARKET DEMANDS 2 0 1 9 2 0 2 1 C o m m e n t s Shift to higher volumes in FeSi Specialties vs. Standard in 2021 to continue in 2022 Ferrosilicon FeSi Specialties 30%1 FeSi Standard 65%1 FeSi Specialties 35%1 FeSi Standard 70%1 Vs. Vs. FeSi Specialty prices carry a 20% premium over FeSi Standard Foundry business tailored to the opportunities in each end-market In NA, we take a leading position in both FeSiMg and inoculants In EU, we produce and serve inoculants and are positioned within the top 2 suppliers Foundry FeSiMg (Nodulizers) 70%1 FeSiMg (Nodulizers) 80%1 Inoculants 30%1 Inoculants 20%1 Vs. Vs. Note: (1) % FG sales breakdown 84 |
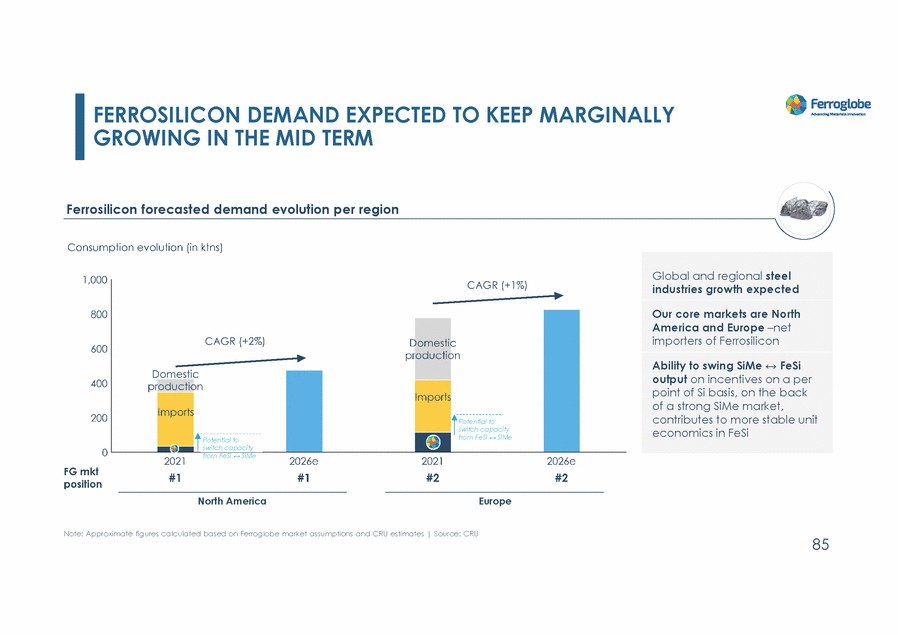
| FERROSILICON DEMAND EXPECTED GROWING IN THE MID TERM TO KEEP MARGINALLY Ferrosilicon forecasted demand evolution per region from FeSi ↔ SiMe North America Europe Note: Approximate figures calculated based on Ferroglobe market assumptions and CRU estimates | Source: CRU 85 Potential to switch capacity Potential to switch capacity from FeSi ↔ SiMe Global and regional steel industries growth expected Our core markets are North America and Europe –net importers of Ferrosilicon Ability to swing SiMe ↔ FeSi output on incentives on a per point of Si basis, on the back of a strong SiMe market, contributes to more stable unit economics in FeSi |
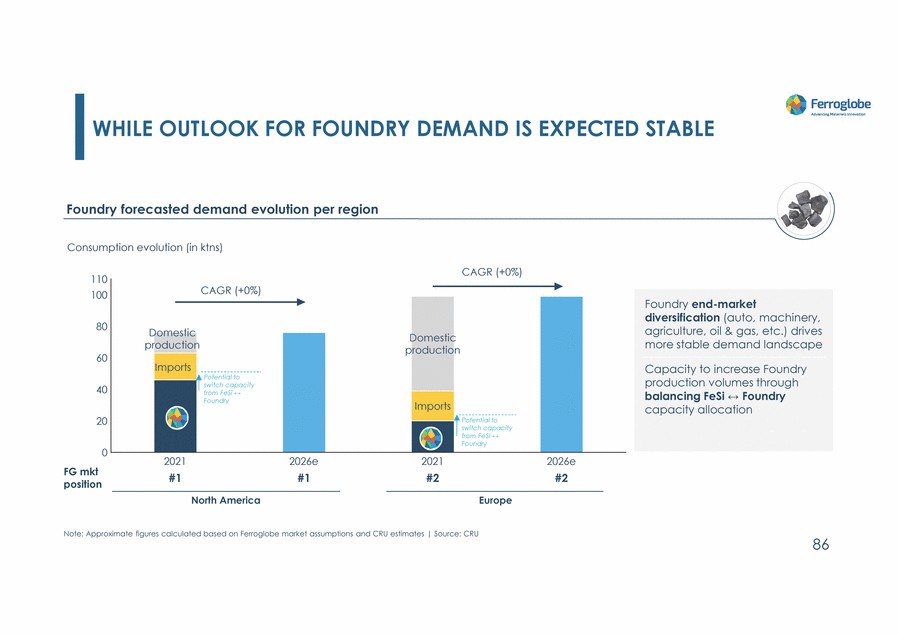
| WHILE OUTLOOK FOR FOUNDRY DEMAND IS EXPECTED STABLE Foundry forecasted demand evolution per region Foundry Potential to North America Europe Note: Approximate figures calculated based on Ferroglobe market assumptions and CRU estimates | Source: CRU 86 Potential to switch capacity from FeSi ↔ switch capacity from FeSi ↔ Foundry Foundry end-market diversification (auto, machinery, agriculture, oil & gas, etc.) drives more stable demand landscape Capacity to increase Foundry production volumes through balancing FeSi ↔ Foundry capacity allocation |
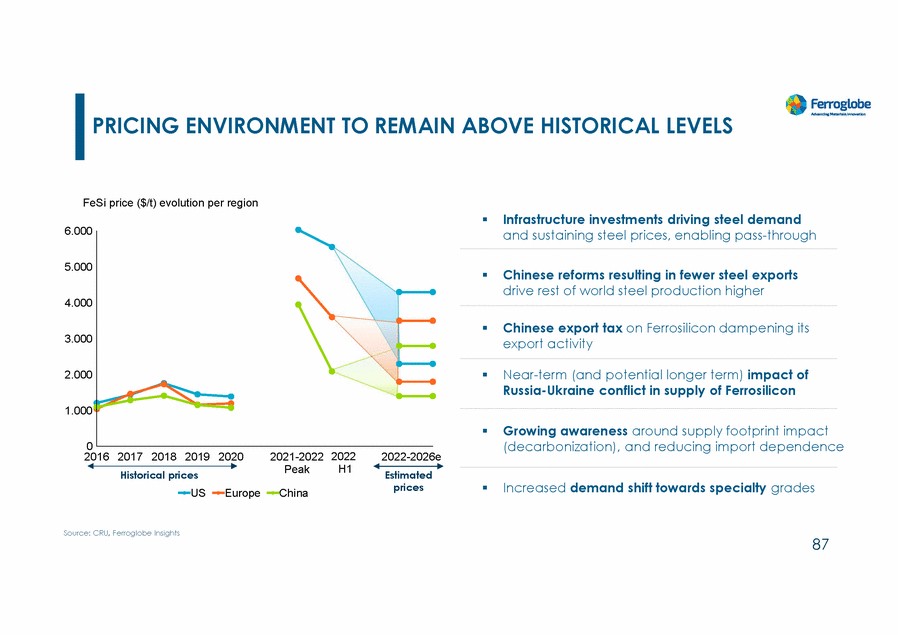
| PRICING ENVIRONMENT TO REMAIN ABOVE HISTORICAL LEVELS FeSi price ($/t) evolution per region Infrastructure investments driving steel demand and sustaining steel prices, enabling pass-through 6.000 5.000 Chinese reforms resulting in fewer steel exports drive rest of world steel production higher 4.000 Chinese export tax on Ferrosilicon dampening its export activity 3.000 Near-term (and potential longer term) impact of Russia-Ukraine conflict in supply of Ferrosilicon 2.000 1.000 Growing awareness around supply footprint impact (decarbonization), and reducing import dependence 0 2016 2017 2018 2019 Historical prices 2020 2021-2022 Peak 2022 H1 2022-2026e Estimated prices Increased demand shift towards specialty grades US Europe China Source: CRU, Ferroglobe Insights 87 |
| MANGANESE BASED ALLOYS |
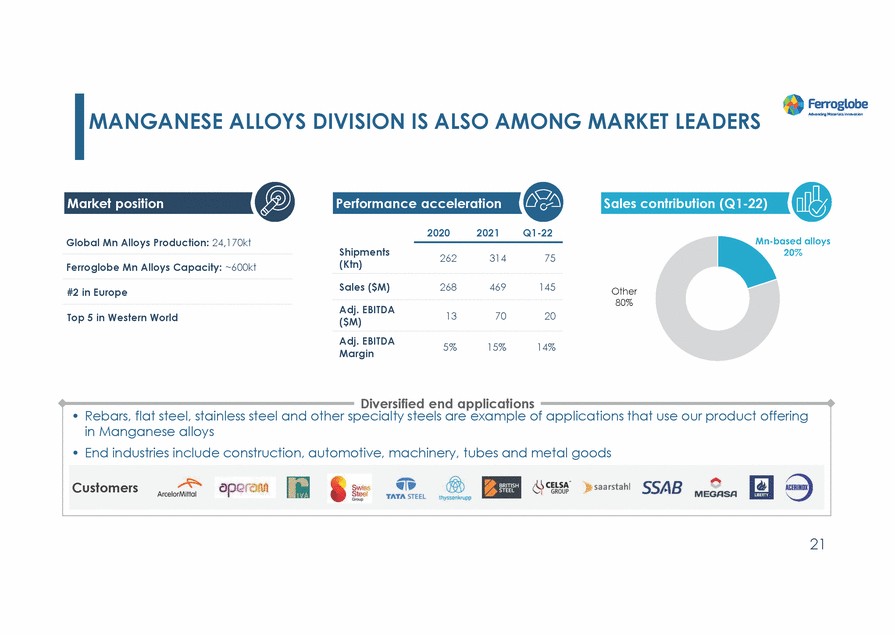
| MANGANESE ALLOYS DIVISION IS ALSO AMONG MARKET LEADERS Market position Performance acceleration Sales contribution (Q1-22) 2020 2021 Q1-22 Global Mn Alloys Production: 24,170kt Shipments (Ktn) 262 314 75 Ferroglobe Mn Alloys Capacity: ~600kt Sales ($M) 268 469 145 #2 in Europe Adj. EBITDA ($M) 13 70 20 Top 5 in Western World Adj. EBITDA Margin 5% 15% 14% Diversified end applications 21 • Rebars, flat steel, stainless steel and other specialty steels are example of applications that use our product offering in Manganese alloys • End industries include construction, automotive, machinery, tubes and metal goods Customers |
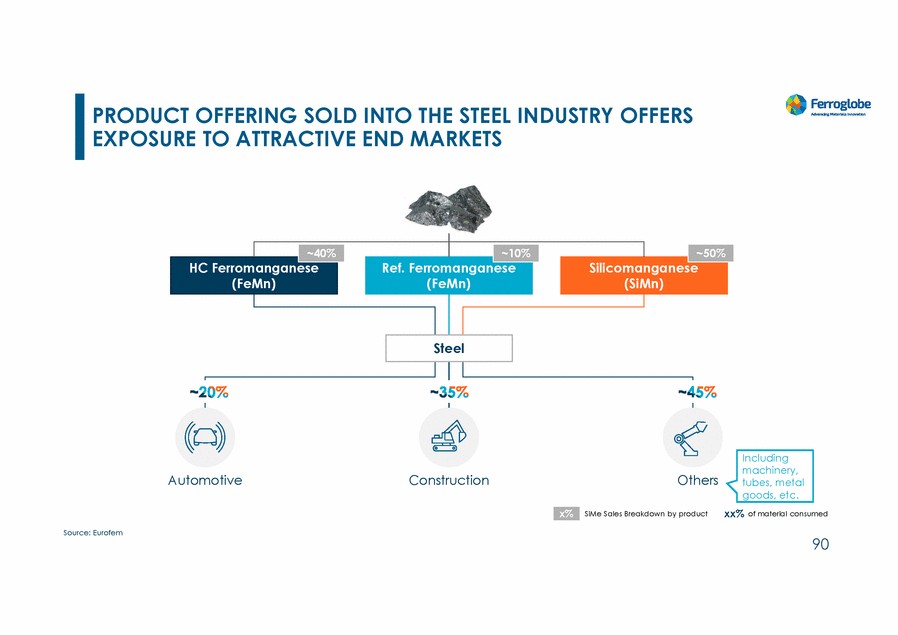
| PRODUCT OFFERING SOLD INTO THE STEEL INDUSTRY OFFERS EXPOSURE TO ATTRACTIVE END MARKETS Steel Including machinery, tubes, metal goods, etc. xx% of material consumed Automotive Construction Others SiMe Sales Breakdown by product Source: Eurofem 90 x% ~40% ~10% ~50% HC Ferromanganese (FeMn) Ref. Ferromanganese (FeMn) Silicomanganese (SiMn) |
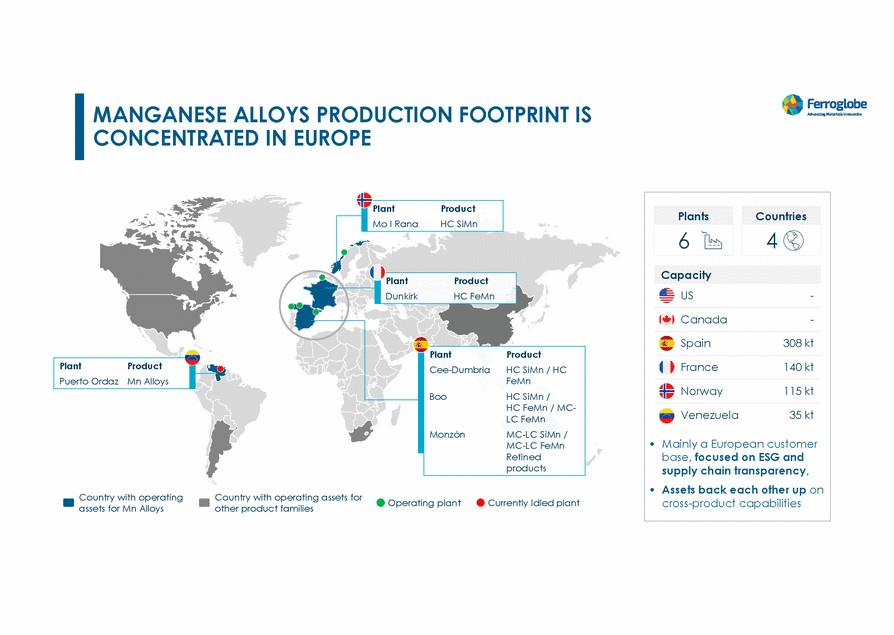
| MANGANESE ALLOYS PRODUCTION FOOTPRINT IS CONCENTRATED IN EUROPE duct SiMn Plant Product nkirk HC FeMn Boo HC SiMn / LC FeMn MC-LC FeMn Country with operating assets for Mn Alloys Country with operating assets for other product families Operating plant Currently Idled plant PlantProduct Puerto Ordaz Mn Alloys PlantProduct Cee-DumbriaHC SiMn / HC FeMn HC FeMn / MC-MonzónMC-LC SiMn / Refined products Du PlantPro Mo I RanaHC US - Canada - Spain 308 kt France 140 kt Norway 115 kt Venezuela 35 kt • Mainly a European customer base, focused on ESG and supply chain transparency, • Assets back each other up on cross-product capabilities Capacity Countries 4 Plants 6 |
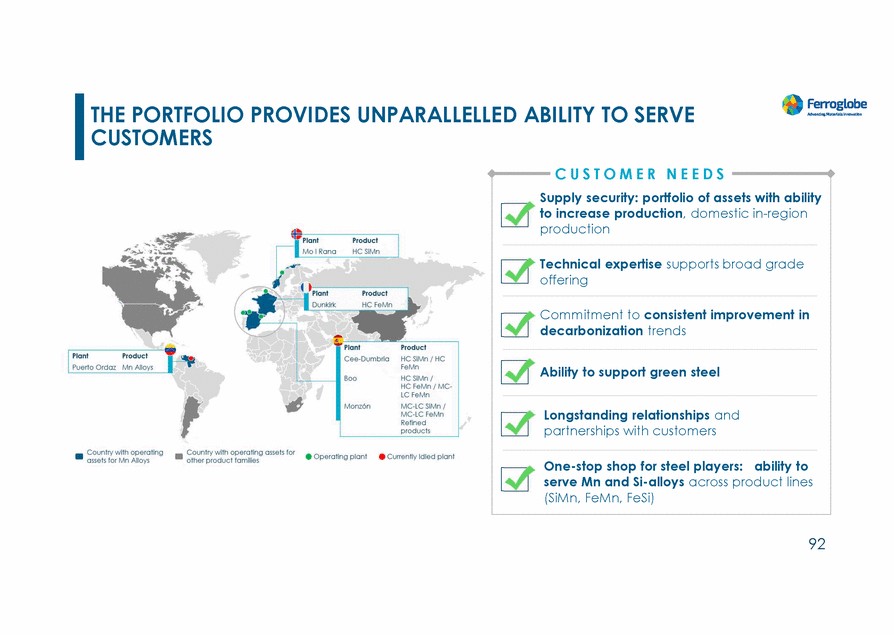
| THE PORTFOLIO CUSTOMERS PROVIDES UNPARALLELLED ABILITY TO SERVE C U S T O M E R N E E D S 92 Supply security: portfolio of assets with ability to increase production, domestic in-region production Technical expertise supports broad grade offering Commitment to consistent improvement in decarbonization trends Ability to support green steel Longstanding relationships and partnerships with customers One-stop shop for steel players:ability to serve Mn and Si-alloys across product lines (SiMn, FeMn, FeSi) |
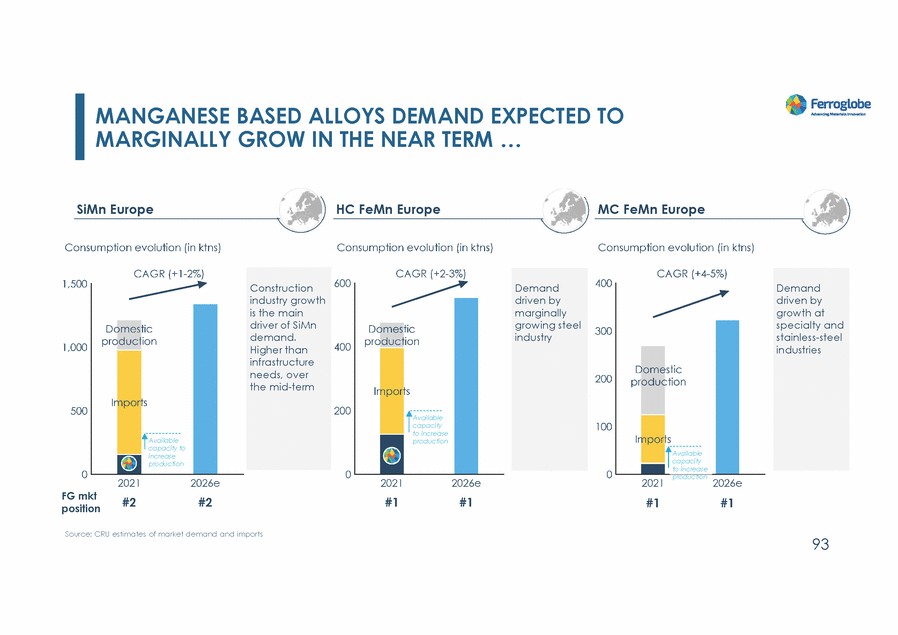
| MANGANESE BASED ALLOYS DEMAND EXPECTED TO MARGINALLY GROW IN THE NEAR TERM … SiMn Europe HC FeMn Europe MC FeMn Europe to increase capacity production Source: CRU estimates of market demand and imports 93 Available to increase Available capacity to increase production Available capacity production Demand driven by growth at specialty and stainless-steel industries Demand driven by marginally growing steel industry Construction industry growth is the main driver of SiMn demand. Higher than infrastructure needs, over the mid-term |
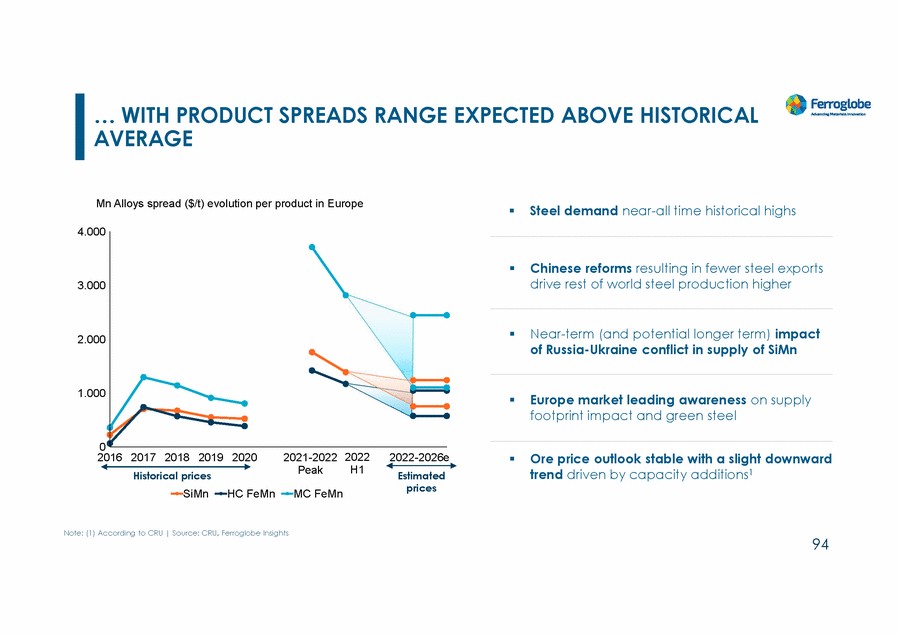
| … WITH PRODUCT SPREADS AVERAGE RANGE EXPECTED ABOVE HISTORICAL Mn Alloys spread ($/t) evolution per product in Europe Steel demand near-all time historical highs 4.000 Chinese reforms resulting in fewer steel exports drive rest of world steel production higher 3.000 Near-term (and potential longer term) impact of Russia-Ukraine conflict in supply of SiMn 2.000 1.000 Europe market leading awareness on supply footprint impact and green steel 0 2017 2018 2019 2020 2021-2022 2022 2022-2026e 2016 Ore price outlook stable with a slight downward trend driven by capacity additions1 Peak H1 Historical prices Estimated prices SiMn HC FeMn MC FeMn Note: (1) According to CRU | Source: CRU, Ferroglobe Insights 94 |
| IN CONCLUSION, THE BUSINESS HAS AN EXCELLENT STRATEGIC POSITION FOR THE FUTURE We are a leading Silicon Metal & Ferroalloy producer with a global portfolio, and leadership, in each major geography Our actions reinforce the company’s ability to grow and succeed going forward, in a market context where supply from traditional sources (Russia, Ukraine, China) are at risk Several megatrends underline the need for our products across strategic supply chains: SiMe to enable the energy transition; supporting solar technologies at a global scale, the opportunity in silicon-rich anodes or the increased use of aluminum in the automotive industry… … to FeSi, Manganese and Foundry products needed for the machinery and construction that sustain the next wave of investments into infrastructure, manufacturing, agriculture or oil & gas, among others Other global dynamics that reinforce our competitive position include: Global dynamics towards reshoring, favoring supply chain flexibility and security of supply for which we are positioned with a portfolio of assets that back each other up and have available capacity to respond to market needs The push towards sustainability, responsible sourcing and supply chain traceability is our advantage We have embarked in a program for commercial excellence focusing our portfolio on value added products, and maintaining discipline in the markets, developments and opportunities we pursue 95 |
| FINANCIAL PERFORMANCE |

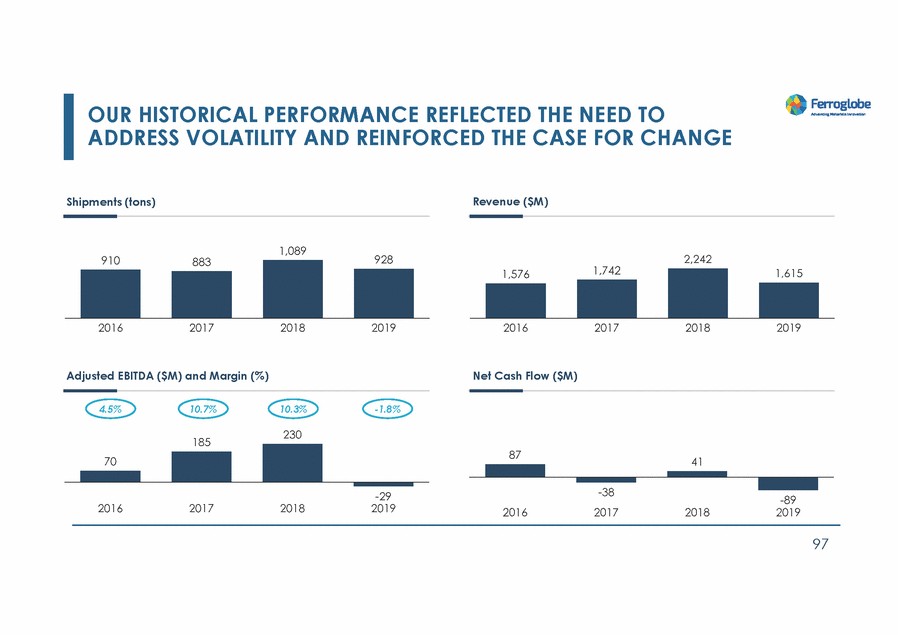
| OUR HISTORICAL PERFORMANCE REFLECTED THE NEED TO ADDRESS VOLATILITY AND REINFORCED THE CASE FOR CHANGE Shipments (tons) Revenue ($M) Adjusted EBITDA ($M) and Margin (%) Net Cash Flow ($M) 4.5% 10.7% 10.3% -1.8% 97 |
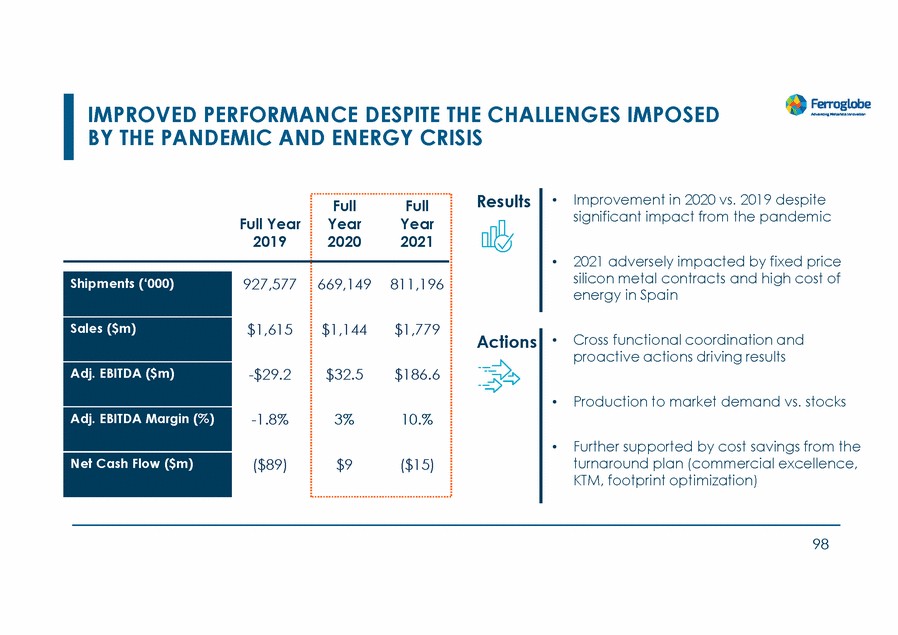
| IMPROVED PERFORMANCE DESPITE THE CHALLENGES IMPOSED BY THE PANDEMIC AND ENERGY CRISIS Results • Improvement in 2020 vs. 2019 despite significant impact from the pandemic Full Year 2020 Full Year 2021 Full Year 2019 • 2021 adversely impacted by fixed price silicon metal contracts and high cost of energy in Spain 927,577 669,149 811,196 $1,615 $1,144 $1,779 • Cross functional coordination and proactive actions driving results Actions -$29.2 $32.5 $186.6 • Production to market demand vs. stocks -1.8% 3% 10.% • Further supported by cost savings from the turnaround plan (commercial excellence, KTM, footprint optimization) ($89) $9 ($15) 98 Shipments (‘000) Sales ($m) Adj. EBITDA ($m) Adj. EBITDA Margin (%) Net Cash Flow ($m) |
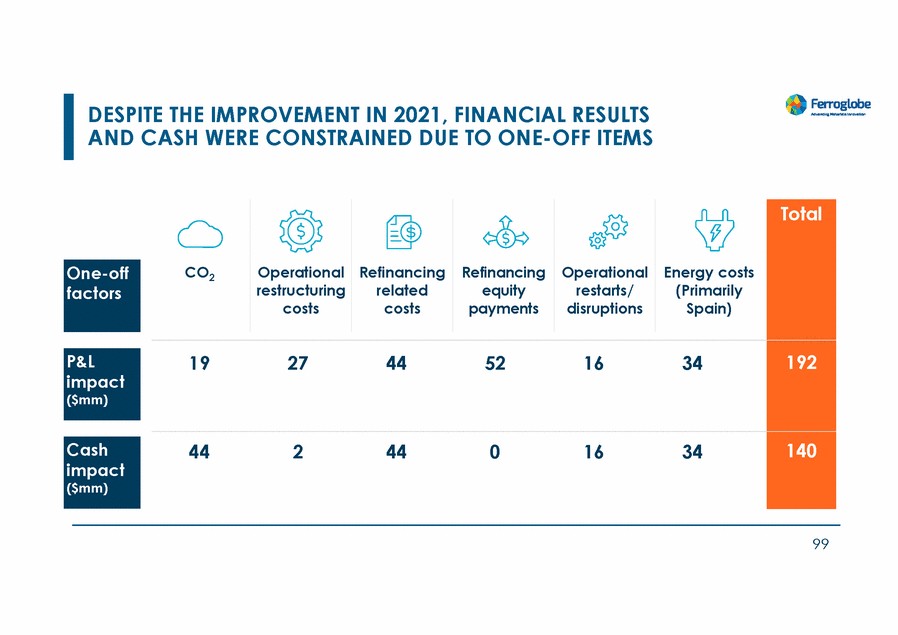
| DESPITE THE IMPROVEMENT IN 2021, FINANCIAL RESULTS AND CASH WERE CONSTRAINED DUE TO ONE-OFF ITEMS 99 Cash impact ($mm) P&L impact ($mm) One-off factors CO2 OperationalRefinancingRefinancingOperationalEnergy costs restructuringrelatedequityrestarts/(Primarily costscostspayments disruptionsSpain) Total 19 27 44 52 16 34 192 44 2 44 0 16 34 140 |
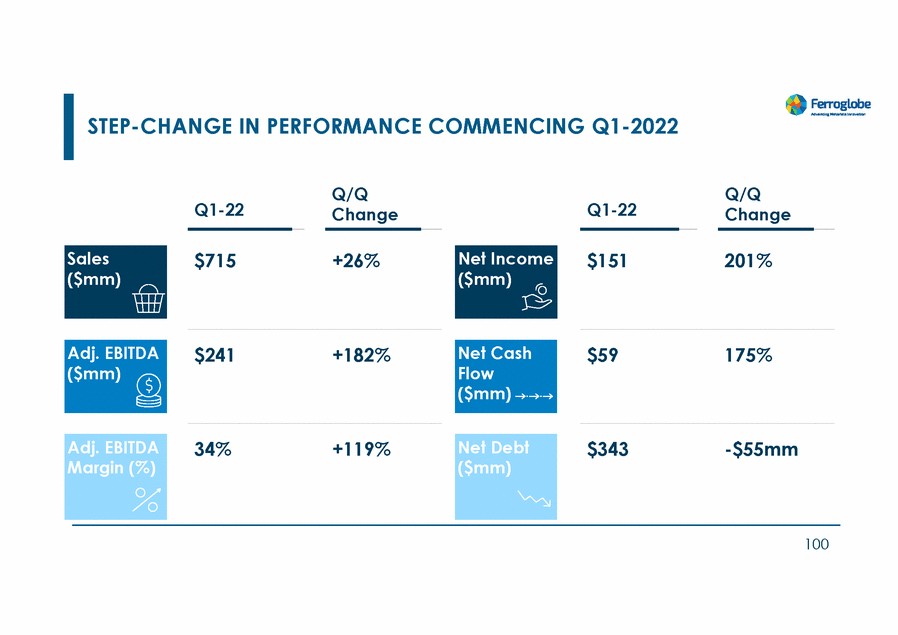
| STEP-CHANGE IN PERFORMANCE COMMENCING Q1-2022 Q/Q Change Q/Q Change Q1-22 Q1-22 $715 +26% $151 201% $241 +182% $59 175% 34% +119% $343 -$55mm 100 Net Debt ($mm) Adj. EBITDA Margin (%) Net Cash Flow ($mm) Adj. EBITDA ($mm) Net Income ($mm) Sales ($mm) |
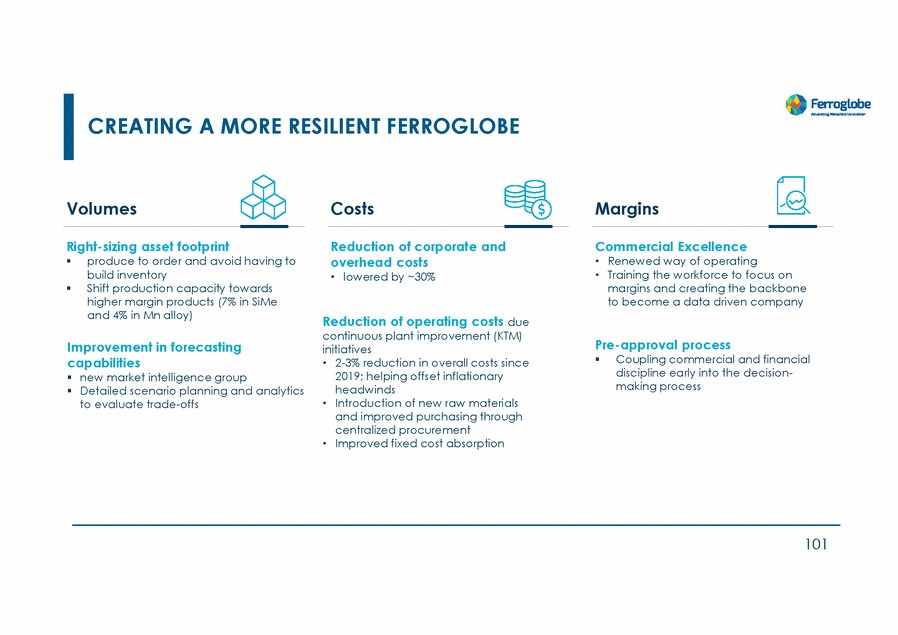
| CREATING A MORE RESILIENT FERROGLOBE Volumes Costs Margins Right-sizing asset footprint Reduction of corporate and overhead costs • lowered by ~30% Commercial Excellence produce to order and avoid having to build inventory Shift production capacity towards higher margin products (7% in SiMe and 4% in Mn alloy) • • Renewed way of operating Training the workforce to focus on margins and creating the backbone to become a data driven company Reduction of operating costs due continuous plant improvement (KTM) initiatives Pre-approval process Improvement in forecasting capabilities new market intelligence group Detailed scenario planning and analytics to evaluate trade-offs Coupling commercial and financial discipline early into the decision-making process • 2-3% reduction in overall costs since 2019; helping offset inflationary headwinds Introduction of new raw materials and improved purchasing through centralized procurement Improved fixed cost absorption • • 101 |
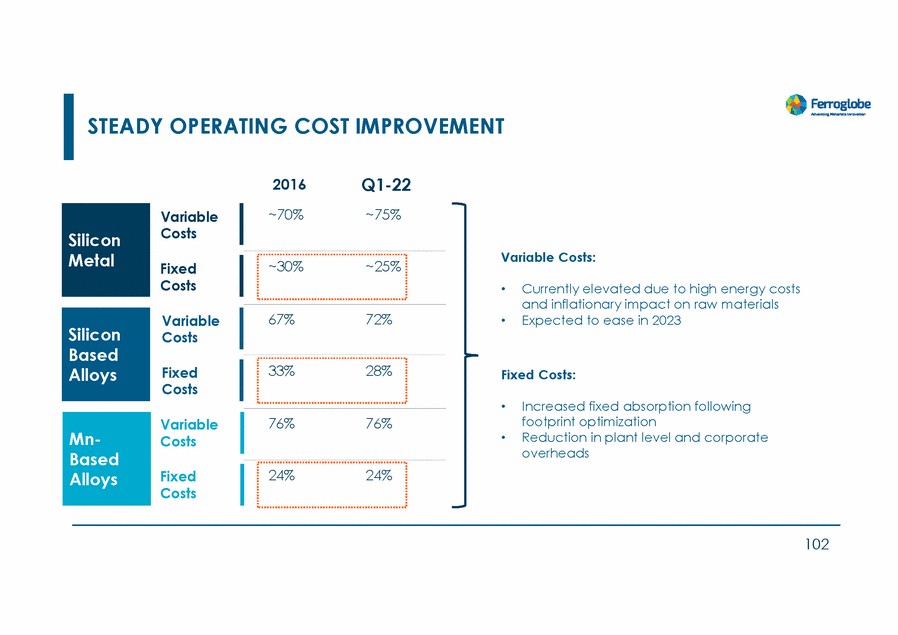
| STEADY OPERATING COST IMPROVEMENT 2016 Q1-22 ~75% ~70% Variable Costs Variable Costs: ~30% ~25% Fixed Costs • Currently elevated due to high energy costs and inflationary impact on raw materials Expected to ease in 2023 67% 72% Variable Costs • 33% 28% Fixed Costs Fixed Costs: • Increased fixed absorption following footprint optimization Reduction in plant level and corporate overheads 76% 76% Variable Costs • 24% 24% Fixed Costs 102 Mn-Based Alloys Silicon Based Alloys Silicon Metal |
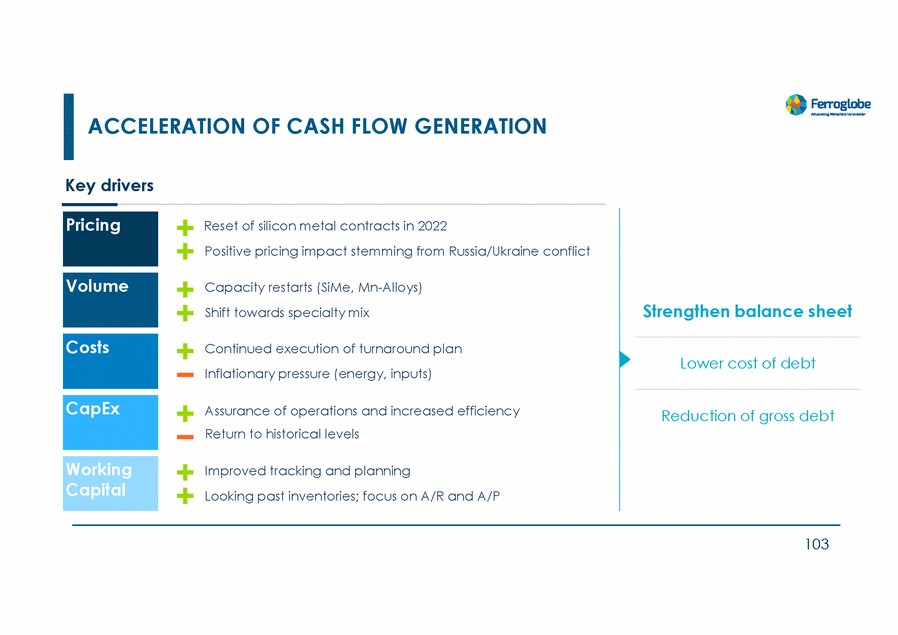
| ACCELERATION OF CASH FLOW GENERATION Key drivers Reset of silicon metal contracts in 2022 Positive pricing impact stemming from Russia/Ukraine conflict Capacity restarts (SiMe, Mn-Alloys) Shift towards specialty mix Strengthen balance sheet Continued execution of turnaround plan Inflationary pressure (energy, inputs) Lower cost of debt Assurance of operations and increased efficiency Return to historical levels Reduction of gross debt Improved tracking and planning Looking past inventories; focus on A/R and A/P 103 Working Capital CapEx Costs Volume Pricing |
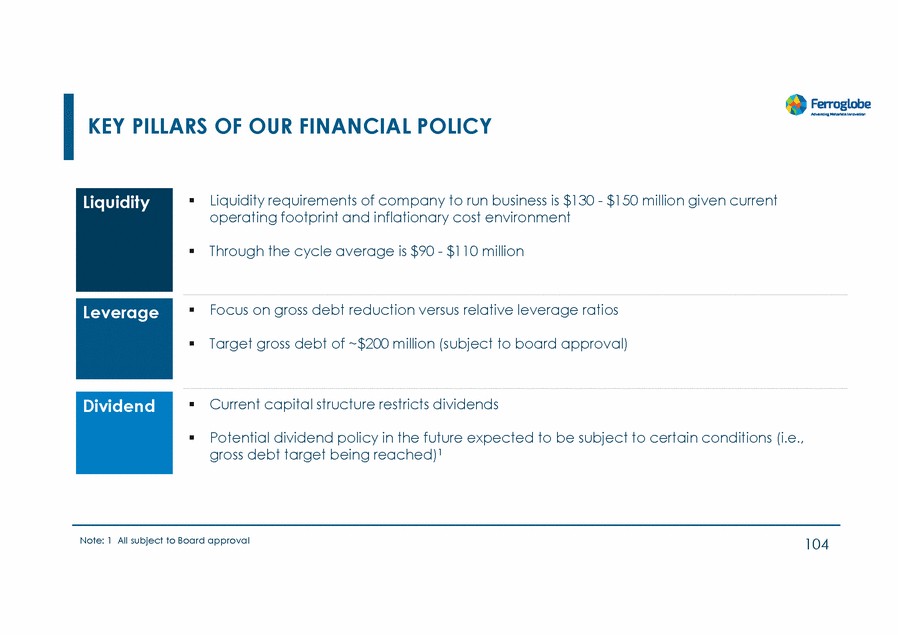
| KEY PILLARS OF OUR FINANCIAL POLICY Liquidity requirements of company to run business is $130 - $150 million given current operating footprint and inflationary cost environment Through the cycle average is $90 - $110 million Focus on gross debt reduction versus relative leverage ratios Target gross debt of ~$200 million (subject to board approval) Current capital structure restricts dividends Potential dividend policy in the future expected to be subject to certain conditions (i.e., gross debt target being reached)1 Note: 1 All subject to Board approval 104 Dividend Leverage Liquidity |
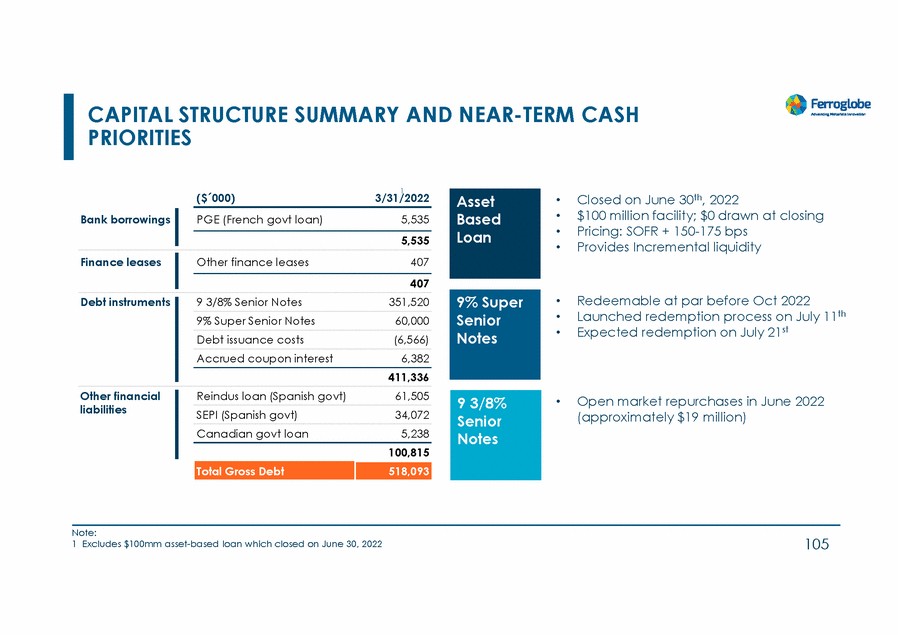
| CAPITAL STRUCTURE PRIORITIES SUMMARY AND NEAR-TERM CASH • • • • Closed on June 30th, 2022 $100 million facility; $0 drawn at closing Pricing: SOFR + 150-175 bps Provides Incremental liquidity • • • Redeemable at par before Oct 2022 Launched redemption process on July 11th Expected redemption on July 21st • Open market repurchases in June 2022 (approximately $19 million) Notes Note: 1 Excludes $100mm asset-based loan which closed on June 30, 2022 105 9 3/8% Senior 9% Super Senior Notes Asset Based Loan Bank borrowings ($´000) 1 3/31/2022 PGE (French govt loan) 5,535 5,535 Finance leases Other finance leases 407 407 Debt instruments 9 3/8% Senior Notes 351,520 9% Super Senior Notes 60,000 Debt issuance costs (6,566) Accrued coupon interest 6,382 411,336 Other financial liabilities Reindus loan (Spanish govt) 61,505 SEPI (Spanish govt) 34,072 Canadian govt loan 5,238 100,815 Total Gross Debt 518,093 |
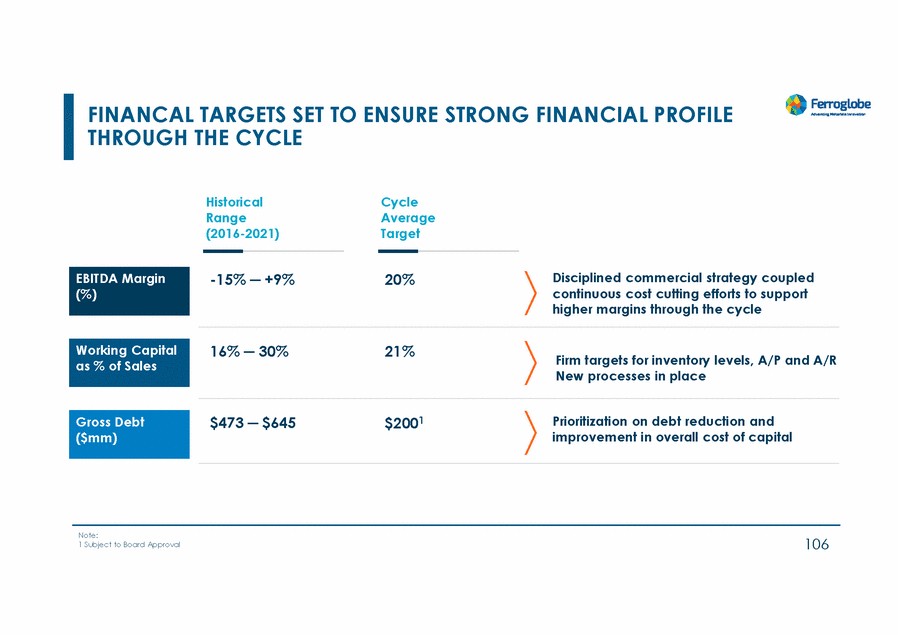
| FINANCAL TARGETS SET TO ENSURE STRONG FINANCIAL PROFILE THROUGH THE CYCLE Historical Range (2016-2021) Cycle Average Target -15% ─ +9% Disciplined commercial strategy coupled continuous cost cutting efforts to support higher margins through the cycle 20% 16% ─ 30% 21% Firm targets for inventory levels, A/P and A/R New processes in place $2001 Prioritization on debt reduction and improvement in overall cost of capital $473 ─ $645 Note: 1 Subject to Board Approval 106 Gross Debt ($mm) Working Capital as % of Sales EBITDA Margin (%) |
| CLOSING REMARKS |

| STRUCTURAL CHANGE IN HOW WE OPERATE Our products are essential and go into hundreds of consumer and industrial end markets Balanced portfolio providing exposure to stable growth end markets (household consumer products) and fast growing end markets (solar, batteries) Our products cannot be replaced – no substitutes Strong focus on people, culture, and communication to deliver our transformation 100+ year history and market leadership across all product categories Longstanding relationships with customers ─ ability to offer consistency, reliability, quality and high level of service Unique asset footprint well positioned to benefit from emerging trends Ownership of high quality inputs and access to competitive energy costs (incl. PPA) Track record of innovation to meet customers evolving needs 108 |
| STRUCTURAL CHANGE IN OUR OPERATING LANDSCAPE Structural change within China present attractive opportunity for Ferroglobe Supply-demand tightness to continue in the near-term supporting a new price floor High barriers to entry (costs, permits, access to cheap power and raw materials, technical know-how) limit risk of new capacity coming on quickly Customer procurement criteria shifting – emphasis on security of supply, quality, ESG We are positioned to capitalize on this opportunity given geographic presence – ability to serve customers locally Our idled capacity that can be restarted quickly and with minimal investment 109 |
| CLEAR PATH TOWARDS VALUE CREATION Structural change within the company unlocking significant value Focus on solidifying the core: stronger market penetration, expand position on specialty products and deepen customer relationships Turnaround plan delivering in all areas – revised Adjusted EBITDA impact of $225mm ($180mm previously) Goal is to create a buffer to ensure cash flow generation through the cycle Higher pricing environment, growing demand and higher margins expected Acceleration of cash flow; prioritization on significant deleveraging and reinvestment in assets Next chapter of the company is being defined – exciting prospects ahead 110 |
| Q&A |

| Ferroglobe MVIIIIGI'II;.......ULI III'I 11 2 THA NK |
Serious News for Serious Traders! Try StreetInsider.com Premium Free!
You May Also Be Interested In
- Increasing unusual call option volume: GSM AMT OPK IAU OUST APH
- AI Agent To Increase Email Deliverability With Woodpecker Integration: Launch
- 4Sight Labs Introduces OverWatch Biometric Monitoring Solution
Create E-mail Alert Related Categories
SEC FilingsSign up for StreetInsider Free!
Receive full access to all new and archived articles, unlimited portfolio tracking, e-mail alerts, custom newswires and RSS feeds - and more!
