

Form 6-K EXFO INC. For: Apr 26
 Tweet
Tweet Share
ShareUNITED STATES
SECURITIES AND EXCHANGE COMMISSION
Washington, D.C. 20549
FORM 6-K
Report of Foreign Private Issuer Pursuant to Rule 13a-16 or 15d-16
Under the Securities Exchange Act of 1934
For the month of April 2018
EXFO Inc.
400 Godin Avenue, Quebec, Quebec, Canada G1M 2K2
(Address of principal executive offices)
Indicate by check mark whether the registrant files or will file annual reports under cover of Form 20-F or Form 40-F.
|
Form 20-F ☑
|
Form 40-F ☐
|
Indicate by check mark whether the registrant by furnishing the information contained in this Form is also thereby furnishing the information to the Commission pursuant to Rule 12g3-2(b) under the Securities Exchange Act of 1934.
|
Yes ☐
|
No ☑
|
If "Yes" is marked, indicate below the file number assigned to the registrant in connection with Rule 12g3-2(b): 82-______.
TABLE OF CONTENTS
Signature
Business Acquisition Report
Unaudited Pro Forma Consolidated Statement of Earnings of EXFO Inc. for the Year Ended August 31, 2017
Unaudited Pro Forma Consolidated Statement of Earnings of EXFO Inc. for the Six Months Ended February 28, 2018
Notes to Unaudited Pro Forma Consolidated Statements of Earnings of EXFO Inc.
Auditor's Report
Consolidated Balance Sheet of Astellia SA for the Year Ended December 31, 2017
Consolidated Statement of Income of Astellia SA for the Year Ended December 31, 2017
Consolidated Statement of Cash Flows of Astellia SA for the Year Ended December 31, 2017
Consolidated Statement of Changes in Equity of Astellia SA for the Year Ended December 31, 2017
Notes to Consolidated Financial Statements of Astellia SA for the Year Ended December 31, 2017
On April 26, 2018, EXFO Inc., a Canadian corporation, filed a Business Acquisition Report following the acquisition of Astellia SA pursuant to Canadian legislation. This report on Form 6-K sets forth the Business Acquisition Report Form relating to EXFO's filing of its Business Acquisition Report in Canada.
The Business Acquisition Report Form contains material information relating to EXFO and are hereby incorporated as documents by reference to Form F-3 (Registration Statement under the Securities Act of 1933) declared effective as of July 30, 2001 and to Form F‑3 (Registration Statement under the Securities Act of 1933) declared effective as of March 11, 2002 and to amend certain material information as set forth in these two Form F-3 documents.
SIGNATURES
Pursuant to the requirements of the Securities Exchange Act of 1934, the registrant has duly caused this report to be signed on its behalf by the undersigned, thereunto duly authorized.
|
EXFO INC.
|
|
|
By: /s/ Philippe Morin
Name: Philippe Morin
Title: Chief Executive Officer
|
|
Date: April 26, 2018
FORM 51-102F4
BUSINESS ACQUISITION REPORT
|
Item 1
|
Identity of Company
|
|
1.1
|
Name and Address of Company
|
EXFO Inc. ("EXFO" or the "company")
400 Godin Avenue
Québec City, Quebec
G1M 2K2
|
1.2
|
Executive Officer
|
The following executive officer of EXFO is knowledgeable about the significant acquisition and this business acquisition report:
Pierre Plamondon, CPA, CA
Chief Financial Officer and Vice-President, Finances
(418) 683-0211
|
Item 2
|
Details of Acquisition
|
|
2.1
|
Nature of Business Acquired
|
In this business acquisition report, all dollar amounts are expressed in US dollars, except as otherwise noted.
On January 26, 2018, the company acquired, by way of a public tender offer, 1,245,209 shares of Astellia S.A. ("Astellia"), at a purchase price of €10 per share for a total cash consideration of €12,452,090 ($15,476,900), which brought the company's investment in Astellia to 88.4%. Prior to this acquisition, the company held 40.3% of Astellia's shares.
Astellia is a publicly traded company on the NYSE Euronext Paris stock exchange. Astellia is a provider of network and subscriber intelligence enabling mobile operators to drive service quality, maximize operational efficiency, reduce churn and increase revenue. Its vendor-independent, real-time monitoring and troubleshooting solution is used to optimize networks end-to-end from radio to core.
|
2.2
|
Date of Acquisition
|
January 26, 2018
|
2.3
|
Consideration
|
The details of the acquisition of Astellia and the consideration paid are disclosed in note 3 to the company's unaudited condensed interim consolidated financial statements for the three months and six months ended February 28, 2018 filed with the Canadian securities commissions on April 11, 2018.
The company financed the cash consideration of this acquisition from existing cash and existing revolving credit facilities of CA$70,000,000 (approximately $54,300,000), which were concluded on December 21, 2017.
|
2.4
|
Effect on Financial Position
|
The acquisition of Astellia was accounted for by applying the acquisition method as required by IFRS 3, "Business Combinations", and the requirements of IFRS 10, "Consolidated Financial Statements". The purchase price was allocated to the net assets acquired based on management's preliminary estimate of their fair value as of the date of acquisition. Other than the resulting impact of the acquisition on the company's consolidated balance sheet and statement of earnings, the company does not foresee, as a result of this acquisition, any material changes in its business affairs or the affairs of the acquired business which may have a significant effect on the results of operations and financial position of the company.
|
2.5
|
Prior Valuations
|
On September 11, 2017, pursuant to article 261-1 1 of the Règlement général de l'AMF, the Board of Directors of Astellia appointed an independent valuation expert, Associés en Finance, to determine the fairness of the public tender offer made by EXFO to acquire Astellia's share at a price of €10 per share.
On November 27, 2017, Associés en Finance, determined that the public tender offer made by EXFO at €10 per share was fair. Associés en Finance used a market approach that relied on valuation multiples and recent transactions for comparable assets or businesses, within the same industry, as well as discounted cash flows to support its assessment.
|
2.6
|
Parties to Transaction
|
The acquisition of Astellia was not a transaction with an informed person, associate or affiliate of the company.
|
2.7
|
Date of Report
|
April 26, 2018
|
Item 3
|
Financial Statements
|
The following financial statements required by Part 8 of National Instrument 51-102, "Continuous Disclosure Obligations", are included in this report:
|
a)
|
Audited consolidated financial statements of Astellia as at December 31, 2017 and 2016 and for the years ended December 31, 2017 and 2016, and an audited supplementary note, which include a reconciliation of the consolidated balance sheets and statements of earnings as at and for the years ended December 31, 2016 and 2017 prepared in accordance with French accounting rules and principles to International Financial Reporting Standards (IFRS) as issued by the International Accounting Standards Board (IASB).
|
|
b)
|
Unaudited pro forma consolidated statement of earnings of EXFO for the year ended August 31, 2017, to give effect to the acquisition of Astellia as if it had occurred at the beginning of that fiscal year.
|
|
c)
|
Unaudited pro forma consolidated statement of earnings of EXFO for the six-month period ended February 28, 2018, to give effect to the acquisition of Astellia as if it had occurred at the beginning of that period.
|
EXFO Inc.
Unaudited Pro Forma Consolidated Statement of Earnings
for the Year Ended August 31, 2017
(in thousands of US dollars, except share and per share data)
|
EXFO Inc.
Year ended
August 31,
2017
|
Astellia
Twelve months
ended June 30,
2017
|
Pro forma
adjustments
|
Note 3
|
Pro forma
Year ended
August 31,
2017
|
|||||||||||||
|
(notes 2 and
3(i))
|
3(i)
|
||||||||||||||||
|
Sales
|
$
|
243,301
|
$
|
47,961
|
$
|
–
|
$
|
291,262
|
|||||||||
|
Cost of sales
|
94,329
|
21,981
|
–
|
116,310
|
|||||||||||||
|
Selling and administrative
|
86,256
|
16,263
|
–
|
102,519
|
|||||||||||||
|
Net research and development
|
47,168
|
11,522
|
–
|
58,690
|
|||||||||||||
|
Depreciation of property, plant and equipment
|
3,902
|
914
|
–
|
4,816
|
|||||||||||||
|
Amortization of intangible assets
|
3,289
|
735
|
11,061
|
(iii) |
15,085
|
||||||||||||
|
Change in fair value of cash contingent consideration
|
(383
|
)
|
–
|
–
|
(383
|
)
|
|||||||||||
|
Interest expense
|
303
|
498
|
–
|
801
|
|||||||||||||
|
Foreign exchange loss
|
978
|
–
|
–
|
978
|
|||||||||||||
|
Earnings (loss) before income taxes
|
7,459
|
(3,952
|
)
|
(11,061
|
)
|
(7,554
|
)
|
||||||||||
|
Income taxes
|
6,608
|
418
|
–
|
7,026
|
|||||||||||||
|
Net earnings (loss) for the period
|
$
|
851
|
$
|
(4,370
|
)
|
$
|
(11,061
|
)
|
$
|
(14,580
|
)
|
||||||
|
Basic and diluted net earnings (loss) per share
|
$
|
0.02
|
$
|
(0.27
|
)
|
||||||||||||
|
Basic weighted average number of shares outstanding (000's)
|
54,423
|
54,423
|
|||||||||||||||
|
Diluted weighted average number of shares outstanding (000's)
|
55,555
|
54,423
|
|||||||||||||||
EXFO Inc.
Unaudited Pro Forma Consolidated Statement of Earnings
for the Six Months Ended February 28, 2018
(in thousands of US dollars, except share and per share data)
|
EXFO Inc.
Six months
ended
February 28,
2018
|
Astellia
|
Pro forma
adjustments
|
Note 3
|
Pro forma
Six months
ended
February 28,
2018
|
|||||||||||||
|
(notes 2 and 3(i))
|
3(i)
|
||||||||||||||||
|
Sales
|
$
|
128,113
|
$
|
24,350
|
$
|
–
|
$
|
152,463
|
|||||||||
|
Cost of sales
|
48,615
|
10,950
|
–
|
59,565
|
|||||||||||||
|
Selling and administrative
|
48,109
|
7,096
|
–
|
55,205
|
|||||||||||||
|
Net research and development
|
24,339
|
4,290
|
–
|
28,629
|
|||||||||||||
|
Depreciation of property, plant and equipment
|
2,417
|
408
|
–
|
2,825
|
|||||||||||||
|
Amortization of intangible assets
|
4,175
|
65
|
268
|
(iii)
|
4,508
|
||||||||||||
|
Change in fair value of cash contingent consideration
|
(716
|
)
|
–
|
–
|
(716
|
)
|
|||||||||||
|
Interest expense
|
672
|
182
|
–
|
854
|
|||||||||||||
|
Foreign exchange (gain) loss
|
(1,226
|
)
|
110
|
(1,116
|
)
|
||||||||||||
|
Share in net loss of an associate
|
2,080
|
–
|
(2,080
|
)
|
(iv)
|
–
|
|||||||||||
|
Gain on the deemed disposal of the investment in an associate
|
(2,080
|
)
|
–
|
2,080
|
(iv)
|
–
|
|||||||||||
|
Earnings (loss) before income taxes
|
1,728
|
1,249
|
(268
|
)
|
2,709
|
||||||||||||
|
Income taxes
|
4,061
|
218
|
–
|
4,279
|
|||||||||||||
|
Net earnings (loss) for the period
|
(2,333
|
)
|
1,031
|
(268
|
)
|
(1,570
|
)
|
||||||||||
|
Net earnings (loss) for the period attributable to non-controlling interest
|
(352
|
)
|
–
|
352
|
(v)
|
–
|
|||||||||||
|
Net earnings (loss) for the period attributable to parent interest
|
$
|
(1,981
|
)
|
$
|
1,031
|
$
|
(620
|
)
|
$
|
(1,570
|
)
|
||||||
|
Basic and diluted net loss attributable to parent interest per share
|
$
|
(0.04
|
)
|
$
|
(0.03
|
)
|
|||||||||||
|
Basic weighted average number of shares outstanding (000's)
|
54,890
|
54,890
|
|||||||||||||||
|
Diluted weighted average number of shares outstanding (000's)
|
54,890
|
54,890
|
|||||||||||||||
EXFO Inc.
Notes to Unaudited Pro Forma Consolidated Statements of Earnings
(in US dollars, except as otherwise noted)
| 1 |
Acquisition of Astellia
|
On January 26, 2018, the company acquired, by way of a public tender offer, 1,245,209 shares of Astellia S.A. ("Astellia"), at a purchase price of €10 per share for a total cash consideration of €12,452,090 (US$15,476,900), which brought the company's total investment in Astellia to 88.4% and provided the company with control over Astellia. Prior to this acquisition, the company held 40.3% of Astellia's shares. Over the month of February 2018, the company gained control over the remaining shares of Astellia
| 2 |
Basis of Presentation
|
The unaudited pro forma consolidated statements of earnings of EXFO Inc. ("the company" or "EXFO") have been prepared to give effect to the acquisition of Astellia. In the opinion of management, the unaudited pro forma consolidated statements of earnings for the year ended August 31, 2017 and for the six months ended February 28, 2018, include all significant adjustments necessary for the presentation of the acquisition on a basis consistent with the company's accounting policies applied in its audited consolidated financial statements for the year ended August 31, 2017 and for the unaudited condensed interim consolidated financial statements for the six months ended February 28, 2018.
The pro forma adjustments are based on available information, estimates and certain assumptions that the company believes are reasonable and are described in the accompanying notes to the unaudited pro forma consolidated statements of earnings.
The unaudited pro forma consolidated statement of earnings for the year ended August 31, 2017 has been prepared by the management of EXFO as if the acquisition had occurred on September 1, 2016. Due to the different fiscal-year periods, the unaudited pro forma consolidated statement of earnings for the year ended August 31, 2017 combines the audited consolidated statement of earnings of EXFO for the year ended August 31, 2017 and the constructed unaudited consolidated statement of earnings of Astellia for the twelve months ended June 30, 2017.
The unaudited pro forma consolidated statement of earnings for the six months ended February 28, 2018 has been prepared by the management of EXFO as if the acquisition had occurred on September 1, 2016. Due to the different fiscal-year periods, the unaudited pro forma consolidated statement of earnings for the six months ended February 28, 2018 combines the unaudited condensed interim consolidated statement of earnings of EXFO for the six months ended February 28, 2018, and a constructed unaudited consolidated statement of earnings of Astellia, that includes the unaudited consolidated statement of earnings of Astellia for the six months ended December 31, 2017 and that eliminates Astellia's results for the one-month contribution (February 2018), already included in EXFO's unaudited condensed interim consolidated statement of earnings for the six months ended February 28, 2018.
Astellia's consolidated financial statements used in the preparation of the unaudited pro forma consolidated statements of earnings for the year ended August 31, 2017 and for the six months ended February 28, 2018, have been prepared in accordance with accounting rules and principles used in France (regulation 99-02 issued by the Comité de Réglementation Comptable / French Accounting Regulations Committee, referred to herein as "French GAAP"). Accordingly, management has also considered adjustments to conform with International Financial Reporting Standards ("IFRS") as issued by the International Accounting Standard Board. The adjustments made mainly related to differences in revenue recognition of multiple-deliverable sales arrangements and in the accounting for development expenses. The nature of these adjustments is further described in a supplemental audited note to the audited consolidated financial statements of Astellia for the year ended December 31, 2017, which is included in this Business Acquisition Report. No additional adjustments were made to comply with the company's accounting policies.
The unaudited pro forma statements of earnings are provided for illustrative purposes only and do not purport to represent what the combined company's actual performance would have been had the transaction occurred on the dates indicated and do not purport to indicate results of operations as of any future period.
3 Significant Assumptions and Adjustments
|
(i)
|
The unaudited consolidated statement of earnings of Astellia for the twelve months ended June 30, 2017 has been translated into US dollars at an average rate of €1.00 = US$1.0851 for that period; the unaudited consolidated statement of earnings of Astellia for the six months ended December 31, 2017 has been translated into US dollars at an average rate of €1.00 = US$1.1749 for that period.
|
|
(ii)
|
The acquisition of Astellia was accounted for by applying the acquisition method as required by IFRS 3, "Business Combinations", and the requirements of IFRS 10, "Consolidated Financial Statements". In the preparation of these unaudited pro forma consolidated statements of earnings, the purchase price has been allocated on a preliminary basis to the fair value of the net assets acquired, based on management best estimates and considering all relevant information available at the time these statements were prepared. Upon the completion of the purchase price allocation, actual amounts for the fair values of the net assets acquired could differ materially from those reflected in the unaudited pro forma consolidated financial statements. Assets and liabilities susceptible to change upon the finalization of the purchase price allocation mainly consist of accounts receivable, intangible assets, goodwill, deferred revenue and deferred income taxes.
|
|
(iii)
|
The fair value of acquired intangible assets is estimated to be $15,000,000 based on management's preliminary estimate of fair value. Acquired intangible assets are amortized on a straight-line basis over their estimated useful lives of one to five years.
|
|
(iv)
|
Prior to the acquisition of Astellia on January 26, 2018, the company's investment in Astellia was accounted for under the equity method as required by IAS 28, "Investments in Associates and Joint Ventures". Therefore, the company's unaudited condensed interim consolidated statement of earnings for the six months ended February 28, 2018 included the company's share of Astellia's net results prior to the acquisition in the amount of $2,079,800. In addition, at the acquisition date, the carrying value of the interest in Astellia held prior to the business combination was re-measured at fair value, that is, €10 per share, and was deemed to have been disposed of on that date. This acquisition-date re-measurement and deemed disposal resulted in a gain of $2,079,800 that was accounted for in the unaudited condensed interim consolidated statement of earnings for the six months ended February 28, 2018. These amounts were eliminated for the purposes of the unaudited pro forma consolidated statement of earnings for the six months ended February 28, 2018.
|
|
(v)
|
On January 26, 2018, the company's total interest in Astellia amounted to 88.4% and the non-controlling interest amounted to 11.6% of Astellia's share capital. However, over the month of February 2018, the company gained control over the remaining shares of Astellia. The company's unaudited pro forma consolidated statements of earnings for the year ended August 31, 2017 and the six months ended February 28, 2018 have been prepared assuming the company had full control over the shares of Astellia. Consequently, an adjustment was included in the preparation of the unaudited pro forma consolidated statement of earnings for the six months ended February 28, 2018 to eliminate the non-controlling interest in Astellia's net results for that period.
|
|
MGA AUDIT
|
|
ERNST & YOUNG et Autres
|
|
This is a translation into English of the statutory auditors' report on the consolidated financial statements of the Company issued in French and it is provided solely for the convenience of English·speaking users.
This statutory auditors' report includes information required by French law, such as information about the appointment of the statutory auditors or verification of the information concerning the Group presented in the management report. This report should be read in conjunction with, and construed in accordance with French law and professional auditing standards applicable in France.
|
Astellia
Year ended December 31, 2017
Statutory auditors' report on the consolidated financial statements
|
MGA AUDIT
8, quai de Tréguier
29600 Morlaix
S.A.R.L. au capital de € 50.000
450 541 974 R.C.S. Morlaix
|
ERNST & YOUNG et Autres
Immeuble Eolios
3, rue Louis Braille
CS 10847
34208 Rennes Cedex 2
S.A.S. à capital variable
438 476 913 R.C.S. Nanterre
|
|
|
Commissaire aux Comptes
Membre de la compagnie
régionale de Rennes
|
Commissaire aux Comptes
Membre de la compagnie
régionale de Versailles
|
Astellia
Year ended December 31, 2017
Statutory auditors' report on the consolidated financial statements
To the Annual General Meeting of Astellia,
|
Opinion
|
In compliance with the engagement entrusted to us by your Annual General Meetings, we have audited the accompanying consolidated financial statements of Astellia for the year ended December 31, 2017.
In our opinion, the consolidated financial statements give a true and fair view of the assets and liabilities and of the financial position of the Group as at December 31, 2017 and of the results of its operations for the year ended in accordance with International Financial Reporting Standards as adopted by the European Union.
|
Basis for Opinion
|
|
§
|
Audit Framework
|
We conducted our audit in accordance with professional standards applicable in France. We believe that the audit evidence we have obtained is sufficient and appropriate to provide a basis for our opinion.
Our responsibilities under those standards are further described in the Statutory Auditors' Responsibilities for the Audit of the Consolidated Financial Statements section of our report.
|
§
|
Independence
|
We conducted our audit engagement in compliance with independence rules applicable to us, for the period from January 1, 2017 to the date of our report and specifically we did not provide any prohibited non-audit services referred to in the French Code of Ethics (Code de déontologie) for statutory auditors.
|
Justification of Assessments
|
In accordance with the requirements of Articles L.823-9 and R.823-7 of the French Commercial Code (Code de commerce) relating to the justification of our assessments, we inform you of the assessments that, in our professional judgment, were of most significance in our audit of the financial statements of the current period.
These matters were addressed in the context of our audit of the financial statements as a whole, and in forming our opinion thereon, and we do not provide a separate opinion on specific items of the financial statements.
Paragraph 4 to the consolidated financial statements presents the accounting policies related to the elements as follows:
|
§
|
research and development costs (4.2.1);
|
|
§
|
Business amortization (4.2.3);
|
|
§
|
Evaluation of provisions for risks and charges (4.11) including provisions for retirement bonuses (4.11.2).
|
Our work consisted in analyzing the data used, to assess the hypothesis adopted, to review the calculations performed and to assess that Paragraph 4 to the consolidated financial statements has provided the required information. As part or our work, we made sure that this evaluation was correct.
|
Verification of the Information Pertaining to the Group Presented in the Management Report
|
As required by law, we have also verified in accordance with professional standards applicable in France the information pertaining to the Group presented in the Board of Directors' management report.
We have no matters to report as to its fair presentation and its consistency with the consolidated financial statements.
|
Responsibilities of Management and Those Charged with Governance for the Consolidated Financial Statements
|
Management is responsible for the preparation and fair presentation of the consolidated financial statements in accordance with International Financial Reporting Standards as adopted by the European Union and for such internal control as management determines is necessary to enable the preparation of consolidated financial statements that are free from material misstatement, whether due to fraud or error.
In preparing the consolidated financial statements, management is responsible for assessing the Company's ability to continue as a going concern, disclosing, as applicable, matters related to going concern and using the going concern basis of accounting unless it is expected to liquidate the Company or to cease operations.
The consolidated financial statements were approved by the Board of Directors.
Astellia
Year ended December 31, 2017
|
Statutory Auditors' Responsibilities for the Audit of the Consolidated Financial Statements
|
Our role is to issue a report on the consolidated financial statements. Our objective is to obtain reasonable assurance about whether the consolidated financial statements as a whole are free from material misstatement. Reasonable assurance is a high level of assurance, but is not a guarantee that an audit conducted in accordance with professional standards will always detect a material misstatement when it exists. Misstatements can arise from fraud or error and are considered material if, individually or in the aggregate, they could reasonably be expected to influence the economic decisions of users taken on the basis of these consolidated financial statements.
As specified in Article L.823-10-1 of the French Commercial Code (Code de commerce), our statutory audit does not include assurance on the viability of the Company or the quality of management of the affairs of the Company.
As part of an audit conducted in accordance with professional standards applicable in France, the statutory auditor exercises professional judgment throughout the audit and furthermore:
|
§
|
Identifies and assesses the risks of material misstatement of the consolidated financial statements, whether due to fraud or error, designs and performs audit procedures responsive to those risks, and obtains audit evidence considered to be sufficient and appropriate to provide a basis for his opinion. The risk of not detecting a material misstatement resulting from fraud is higher than for one resulting from error, as fraud may involve collusion, forgery, intentional omissions, misrepresentations, or the override of internal control.
|
|
§
|
Obtains an understanding of internal control relevant to the audit in order to design audit procedures that are appropriate in the circumstances, but not for the purpose or expressing an opinion on the effectiveness of the internal control.
|
|
§
|
Evaluates the appropriateness of accounting policies used and the reasonableness of accounting estimates and related disclosures made by management in the consolidated financial statements.
|
|
§
|
Assesses the appropriateness of management's use of the going concern basis of accounting and, based on the audit evidence obtained, whether a material uncertainty exists related to events or conditions that may cast significant doubt on the Company's ability to continue as a going concern. This assessment is based on the audit evidence obtained up to the date of his audit report. However, future events or conditions may cause the Company to cease to continue as a going concern. If the statutory auditor concludes that a material uncertainty exists, there is a requirement to draw attention in the audit report to the related disclosures in the consolidated financial statements or, if such disclosures are not provided or inadequate, to modify the opinion expressed therein.
|
|
§
|
Evaluates the overall presentation of the consolidated financial statements and assesses whether these statements represent the underlying transactions and events in a manner that achieves fair presentation.
|
Astellia
Year ended December 31, 2017
|
§
|
Obtains sufficient appropriate audit evidence regarding the financial information of the entities or business activities within the Group to express an opinion on the consolidated financial statements. The statutory auditor is responsible for the direction, supervision and performance of the audit of the consolidated financial statements and for the opinion expressed on these consolidated financial statements.
|
Morlaix and Rennes, April 18, 2018
The Statutory Auditors
French original signed by
|
MGA AUDIT
|
|
ERNST & YOUNG et Autres
|
|
|
/s/ Michel Gouriten
|
|
/s/ Guillaume Ronco
|
|
| Michel Gouriten |
|
Guillaume Ronco
|
Astellia
Year ended December 31, 2017
Consolidated Financial Statements – Year ended 31/12/2017
S.A. Astellia
Consolidated Financial Statements
Year ended
31/12/2017
This document has 41 pages
Consolidated Financial Statements – Year ended 31/12/2017
General summary
|
Consolidated Balance Sheet
|
3
|
|
Consolidated Statement of Income
|
4
|
|
Statement of Cash Flows
|
5
|
|
Consolidated Statement of Changes in Equity
|
6
|
|
Notes to the Consolidated Financial Statements
|
7
|
All amounts are in thousands of euros
2
Consolidated Financial Statements – Year ended 31/12/2017
Consolidated Balance Sheet
|
In thousands of euros
|
||||||||||||
|
Assets
|
Note
|
31/12/2017
|
31/12/2016
|
|||||||||
|
Goodwill
|
4.1
|
0
|
0
|
|||||||||
|
Intangible assets
|
4.2
|
7,689
|
7,617
|
|||||||||
|
Property, plant and equipment
|
4.3
|
1,639
|
1,600
|
|||||||||
|
Long-term investments
|
4.4
|
367
|
447
|
|||||||||
|
Equity-accounted securities
|
0
|
0
|
||||||||||
|
Total non-current assets
|
9,695
|
9,664
|
||||||||||
|
Inventories and work in progress
|
4.5
|
916
|
1 942
|
|||||||||
|
Trade receivables and related accounts
|
4.6
|
21,512
|
40,723
|
|||||||||
|
Other receivables and accruals
|
4.7
|
11,472
|
11,884
|
|||||||||
|
Liquidities and marketable securities
|
4.8
|
4,485
|
6,757
|
|||||||||
|
Total current assets
|
38,384
|
61,306
|
||||||||||
|
Total assets
|
48,080 |
70,970
|
||||||||||
|
Liabilities
|
Note
|
31/12/2017
|
31/12/2016
|
|||||||||
|
Share capital
|
4.9
|
1,295
|
1,295
|
|||||||||
|
Premiums
|
11,229
|
11,229
|
||||||||||
|
Consolidated reserves
|
11,552
|
12,189
|
||||||||||
|
Consolidated net income (loss)
|
-6,393
|
-638
|
||||||||||
|
Other (foreign currency translation reserve)
|
-536
|
-402
|
||||||||||
|
Equity (group’s share)
|
17,147
|
23,674
|
||||||||||
|
Non-controlling interests
|
18
|
2
|
||||||||||
|
Total equity
|
17,164
|
23,676
|
||||||||||
|
Other equity
|
||||||||||||
|
Provisions for risks and expenses
|
4.11
|
1,671
|
1,957
|
|||||||||
|
Loans and financial debts
|
4.12
|
11,592
|
11,228
|
|||||||||
|
Trade payables and related accounts
|
4.13
|
4,404
|
4,875
|
|||||||||
|
Other accounts payables
|
4.13
|
12,021
|
26,746
|
|||||||||
|
Other payables and accruals
|
4.13
|
1,228
|
2,489
|
|||||||||
|
Total debt
|
29,245
|
45,337
|
||||||||||
|
Total liabilities
|
48,080
|
70,970
|
||||||||||
3
Consolidated Financial Statements – Year ended 31/12/2017
Consolidated Statement of Income
|
In thousands of euros
|
||||||||||||
|
Statement of Income
|
Note
|
31/12/2017
|
31/12/2016
|
|||||||||
|
Sales
|
5.1
|
38,574
|
48,879
|
|||||||||
|
Other revenues
|
5.2
|
13,071
|
10,791
|
|||||||||
|
Total revenues
|
51,645
|
59,670
|
||||||||||
|
Purchases consumed, raw materials and goods
|
-5,239
|
-5,890
|
||||||||||
|
Other purchases and external expenses
|
-15,520
|
-15,793
|
||||||||||
|
Salaries and benefits
|
5.3
|
-24,629
|
-26,348
|
|||||||||
|
Taxes
|
-1,334
|
-2,255
|
||||||||||
|
Depreciation and charges to provisions
|
5.4
|
-10,084
|
-9,421
|
|||||||||
|
Other operating expenses
|
-227
|
-255
|
||||||||||
|
Total operating expenses
|
-57,032
|
-59,963
|
||||||||||
|
Operating income (loss)
|
5.5
|
-5,387
|
-293
|
|||||||||
|
Financial expenses
|
-1,354
|
-1,142
|
||||||||||
|
Financial income
|
343
|
1,248
|
||||||||||
|
Net financial income (expenses)
|
5.6
|
-1,011
|
106
|
|||||||||
|
Current income (loss) of consolidated companies
|
-6,399
|
-187
|
||||||||||
|
Unusual expenses and income
|
5.7
|
175
|
-254
|
|||||||||
|
Income taxes
|
6.5
|
-153
|
-279
|
|||||||||
|
Net income (loss) of consolidated companies
|
5.8
|
-6,376
|
-720
|
|||||||||
|
Share of income from equity-accounted investees
|
0
|
0
|
||||||||||
|
Amortization of goodwill
|
4.1
|
0
|
69
|
|||||||||
|
Consolidated net income (loss)
|
4.10
|
-6,376
|
-651
|
|||||||||
|
Non-controlling interests
|
17
|
-13
|
||||||||||
|
Net income (loss) (group’s share)
|
-6,393
|
-638
|
||||||||||
4
Consolidated Financial Statements – Year ended 31/12/2017
Statement of Cash Flows
|
|
|
|||||||||
|
STATEMENT OF CASH FLOWS
|
Notes
|
31/12/2017
|
31/12/2016
|
|||||||
|
OPERATING ACTIVITIES
|
|
|||||||||
|
CONSOLIDATED NET INCOME (LOSS)
|
-6,376
|
-651
|
||||||||
 |
Dividends from equity-accounted investees
|
|
||||||||
|
Other non-cash adjustments
|
|
|||||||||
|
Net income discrepancy + Dilution gains (losses)
|
|
|||||||||
|
Depreciation and charges to provisions
|
|
8,265 | 8,102 | |||||||
|
Reversal of depreciation and provisions
|
|
-388 | -148 | |||||||
|
Gains and losses on disposals
|
|
-4 | 114 | |||||||
|
Deferred income taxes
|
|
0
|
||||||||
|
Grants transferred to the Statement of Income
|
|
|||||||||
|
CASH FLOWS FROM OPERATIONS
|
|
1,497
|
7,417
|
|||||||
|
Change in accrued interest
|
|
24
|
-0
|
|||||||
 |
Change in inventories
|
1,026
|
959
|
|||||||
|
Change in accounts receivable
|
19,155
|
1,741
|
||||||||
|
Change in other receivables
|
487
|
-761
|
||||||||
|
Change in accounts payable
|
-15,037
|
291
|
||||||||
|
Change in other payables
|
-515
|
29
|
||||||||
|
Transfers of prepaid expenses
|
|
|||||||||
|
Reciprocal accounts
|
|
-15
|
||||||||
|
Deferred expenses and revenues
|
-888
|
-325
|
||||||||
|
Foreign exchange gains and losses
|
|
|||||||||
|
CHANGE IN WORKING CAPITAL REQUIREMENTS
|
4228
|
1,918
|
||||||||
|
Net cash flows from operating activities
|
|
5,749
|
9,335
|
|||||||
 |
INVESTING ACTIVITIES
|
|
||||||||
|
Outflows/acquisition of intangible assets (1)
|
-7,464
|
-7,212
|
||||||||
|
Outflows/acquisition of property, plant and equipment (1)
|
-824
|
-904
|
||||||||
|
Inflows/disposal of intangible assets and property, plant and equipment
|
12
|
8
|
||||||||
|
Investment grants received
|
|
-99
|
||||||||
|
Outflows/acquisition of long-term investments
|
-5
|
150
|
||||||||
|
Inflows/disposal of long-term investments
|
79
|
-193
|
||||||||
|
Net cash used in/received from the acquisition/disposal of subsidiaries
|
|
|||||||||
|
Net cash flows used in investing activities
|
-8,202
|
-8,250
|
||||||||
 |
FINANCING ACTIVITIES
|
|
||||||||
|
Capital increases or contributions
|
|
|||||||||
|
Dividends paid to the parent company shareholders
|
|
|||||||||
|
Dividends paid to non-controlling shareholders
|
|
|||||||||
|
Change in other equity
|
|
|||||||||
|
Proceeds from loans (1)
|
1,400
|
1,921
|
||||||||
|
Repayment of loans
|
-1,966
|
-1,560
|
||||||||
|
Net cash flows from (used in) financing activities
|
-566
|
362
|
||||||||
|
CHANGE IN CASH for the year
|
|
-3,019
|
1,446
|
|||||||
|
Impact of changes in exchange rates
|
-160
|
80
|
||||||
|
CASH AT BEGINNING (*)
|
3,675
|
2,066
|
||||||
|
CASH AT END (*)
|
497
|
3,675
|
||||||
|
(1) Excluding acquisition/finance lease transactions
|
||||||||
|
(*) Cash reported here reflects its restrictive definition:
|
||||||||
|
31/12/2017
|
31/12/2016
|
|||||||
|
+ Liquidities
|
4,485
|
6,757
|
||||||
|
- Short-term bank facilities
|
-3,988
|
-3,082
|
||||||
|
Net cash
|
497
|
3,675
|
||||||
5
Consolidated Financial Statements – Year ended 31/12/2017
Consolidated Statement of Changes in Equity
In thousands of euros
|
Ending balance
|
Share
capital
|
Premiums
|
Consoli-
dated
reserves
|
Net income
(loss) for
the year
|
Total equity –
group’s share
|
Non-controlling
interests
|
||||||||||||||||||
|
Balance as at 31/12/2015
|
1,295
|
11,229
|
16,764
|
(5,096
|
)
|
24,192
|
15
|
|||||||||||||||||
|
Net income (loss) appropriation
|
(5,096
|
)
|
5,096
|
|||||||||||||||||||||
|
Net income (loss) for the year
|
(638
|
)
|
(638
|
)
|
(13
|
)
|
||||||||||||||||||
|
Change in foreign currency translation reserve
|
120
|
120
|
||||||||||||||||||||||
|
Other
|
(1
|
)
|
||||||||||||||||||||||
|
Balance as at 31/12/2016
|
1,295
|
11,229
|
11,788
|
(638
|
)
|
23,674
|
2
|
|||||||||||||||||
|
Net income (loss) appropriation
|
(638
|
)
|
638
|
|||||||||||||||||||||
|
Net income (loss) for the year
|
(6,393
|
)
|
(6,393
|
)
|
17
|
|||||||||||||||||||
|
Distributed dividends
|
||||||||||||||||||||||||
|
Change in foreign currency translation reserve
|
(134
|
)
|
(134
|
)
|
(1
|
)
|
||||||||||||||||||
|
Balance as at 31/12/2017
|
1,295
|
11,229
|
11,015
|
(6,393
|
)
|
17,147
|
17
|
|||||||||||||||||
6
Consolidated Financial Statements – Year ended 31/12/2017
Notes to the Consolidated Financial Statements
All amounts are in thousands of euros
7
Consolidated Financial Statements – Year ended 31/12/2017
|
1.
|
Major events
|
10
|
|
1.1.
|
Main events during the period
|
10
|
|
1.1.1.
|
Changes in share ownership structure
|
10
|
|
1.1.2.
|
New loans
|
10
|
|
1.1.3.
|
Spanish subsidiary
|
10
|
|
1.1.4.
|
Indian subsidiary
|
11
|
|
2.
|
Group’s scope of consolidation
|
12
|
|
2.1.
|
Organization chart as at 31/12/2017
|
12
|
|
2.2.
|
Consolidated entities
|
12
|
|
2.3.
|
Year-end dates for consolidated entities
|
13
|
|
2.4.
|
Entities excluded from the scope of consolidation
|
13
|
|
3.
|
Basis of accounting, principles of consolidation, measurement policies and rules
|
14
|
|
3.1.
|
Basis of accounting
|
14
|
|
3.2.
|
Principles of consolidation
|
14
|
|
3.2.1.
|
Consolidation methods
|
14
|
|
3.2.2.
|
Elimination of intercompany transactions
|
15
|
|
3.2.3.
|
Translation of foreign companies financial statements
|
15
|
|
3.3.
|
Measurement policies and rules
|
16
|
|
3.3.1.
|
Application of preferential accounting policies
|
16
|
|
3.3.2.
|
Translation of foreign currency transactions
|
16
|
|
3.3.3.
|
Measurement of assets and liabilities
|
16
|
|
3.3.4.
|
Distinction between unusual income (loss) and current income (loss)
|
16
|
|
3.3.5.
|
Earnings per share
|
16
|
|
3.3.14
|
Tax credits
|
17
|
|
3.3.14.1
|
Research tax credit
|
17
|
|
3.3.14.2
|
Competitiveness and employment tax credit
|
17
|
|
4.
|
Notes on balance sheet items
|
18
|
|
4.1.
|
Goodwill
|
18
|
|
4.2.
|
Intangible assets (excluding goodwill)
|
19
|
|
4.2.1.
|
Research and development expenses
|
20
|
|
4.2.2.
|
Establishment costs
|
20
|
|
4.2.3.
|
Business assets
|
20
|
|
4.3.
|
Property, plant and equipment
|
21
|
|
4.4.
|
Long-term investments
|
22
|
|
4.5.
|
Inventories and work in progress
|
23
|
|
4.6.
|
Trade receivables and related accounts
|
24
|
8
Consolidated Financial Statements – Year ended 31/12/2017
|
4.7.
|
Other receivables and accruals
|
25
|
|
4.8.
|
Cash assets
|
25
|
|
4.9.
|
Equity
|
26
|
|
4.9.1.
|
Composition of share capital
|
26
|
|
4.9.2.
|
Shareholders’ voting rights
|
26
|
|
4.9.3.
|
Share value as at December 31, 2017
|
26
|
|
4.9.4.
|
Analysis of consolidated equity
|
27
|
|
4.10.
|
Analysis of consolidated net income (loss)
|
28
|
|
4.11.
|
Provisions for risks and expenses
|
29
|
|
4.11.1.
|
Summary
|
29
|
|
4.11.2.
|
Retirement and similar benefits
|
29
|
|
4.12.
|
Loans and financial debts
|
30
|
|
4.12.1.
|
Nature and maturities of loans and financial debts
|
30
|
|
4.12.2.
|
Change in loans and financial debts
|
30
|
|
4.13.
|
Trade and other payables
|
31
|
|
5.
|
Statement of income items
|
32 |
|
5.1.
|
Sales by company
|
32
|
|
5.2.
|
Other revenues
|
32
|
|
5.3.
|
Salaries and benefits
|
33
|
|
5.4.
|
Depreciation and charges to provisions
|
33
|
|
5.5.
|
Operating income (loss) by company
|
34
|
|
5.6.
|
Net financial income (expenses)
|
34
|
|
5.7.
|
Unusual income (loss)
|
35
|
|
5.8.
|
Net income (loss) of consolidated companies by company
|
36
|
|
6.
|
Corporate income taxes
|
37 |
|
6.1.
|
Balance sheet presentation
|
37
|
|
6.2.
|
Deferred taxes by nature
|
37
|
|
6.3.
|
Tax losses for which no deferred tax assets are recognized
|
37
|
|
6.4.
|
Other unrecognized tax credits
|
38
|
|
6.5.
|
Corporate income tax expense
|
39
|
|
6.6.
|
Income tax proof
|
39
|
|
7.
|
Other information
|
40 |
|
7.1.
|
Off-balance sheet commitments
|
40
|
|
7.1.1.
|
Commitments given
|
40
|
|
7.1.2.
|
Commitments received
|
40
|
|
7.2.
|
Segmented reporting
|
41
|
|
7.3.
|
Related entities
|
41
|
|
7.4.
|
Management personnel
|
41
|
|
7.4.1.
|
Compensation awarded to members of administrative and management bodies
|
41 |
|
7.4.2.
|
Auditors’ fees
|
41
|
9
Consolidated Financial Statements – Year ended 31/12/2017
|
1.
|
Major events
|
|
1.1.
|
Main events of the period
|
The significant events that occurred during the period are as follows:
|
1.1.1.
|
Changes in share ownership structure
|
On August 31, 2017, EXFO, a Canadian company, announced through a press release that it entered into an agreement with the founders and Isatis capital to acquire 33.1% of the shares of Astellia SA at €10 per share. In this same press release, they announced that they intended to file a voluntary public tender offer at the same price of €10 for all the remaining shares.
This public tender offer was launched on December 15, 2017. On January 26, 2018, the AMF issued the results of this public tender offer. As of that date, EXFO held 88.39% of the shares of Astellia SA.
|
1.1.2.
|
New loans
|
Astellia SA took out two new loans totalling €1,400,000 to finance its invesments and its innovation.
|
1.1.3.
|
Spanish subsidiary
|
| · |
Change in corporate name
|
The corporate name of the company was changed to “Astellia Telecom Spain”.
| · |
Increase in capital and reduction of losses
|
Astellia Telecom Spain increased its capital by €1,500,000 by incorporating the cash advances from its parent company, Astellia SA.
Previous losses were eliminated through a reduction of capital. As a result, the company’s capital was €975,000 as at December 31, 2017.
| · |
Write-down of the amount receivable
|
In view of the recapitalization of the Ingénia subsidiary, Astellia SA had written down its amount receivable by €2,150,000 as at December 31, 2016.
As at December 31, 2017, Astellia SA has written off its amount receivable (amount of €3,000,000).
| · |
Write-off of shares
|
As at December 31, 2017, the shares of Astellia Telecom Spain were written off, for an amount of €5,750,628.
| · |
Implementation of a cost-plus contract
|
10
Consolidated Financial Statements – Year ended 31/12/2017
Since January 1, 2017, the relationships between Astellia Telecom Spain and its parent company have been governed by 3 new contracts:
| - |
A “Distribution and sales services agreement”, which governs the business activities between the two companies.
|
| - |
A “Framework services agreement”, which covers the R&D activities and services to customers.
|
| - |
A “Management services agreement”, which provides for the billing of management fees to this subsidiary.
|
| · |
Transfer of ownership
|
As at December 31, 2016, Astellia Telecom Spain had capitalized development expenses related to the Nova Ran 4.0 project. This asset was sold to Astellia SA for €882,900.
|
1.1.4.
|
Indian subsidiary
|
During 2016, the Company decided to close its Indian subsidiary. As at December 31, 2017, as the net position of Astellia Telecom Pvt was greater than the value of the shares held, these shares were not written down.
As at December 31, 2017, the administrative closure was not yet completed, and the last transactions were recorded in the financial statements of Astellia SA.
11
Consolidated Financial Statements – Year ended 31/12/2017
|
2.
|
Group’s scope of consolidation
|
|
2.1.
|
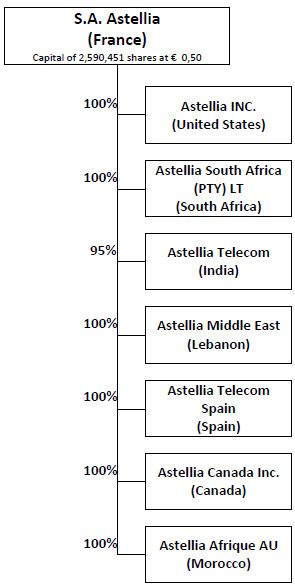
Organization chart as at 31/12/2017
|
|
2.2.
|
Consolidated entities
|
The following table presents the entities included in the scope of consolidation.
|
Company
|
Siren #
|
Head Office
|
Consolidation
method
2017
|
Consolidation
method
2016
|
%
control
2017
|
%
control
2016
|
%
ownership
2017
|
%
ownership
2016
|
|||||||||||||||
|
S.A. Astellia
|
428,780,241
|
2 rue Jacqueline Auriol Saint Jacques de la Lande
|
Parent
|
Parent
|
100
|
%
|
100
|
%
|
100
|
%
|
100
|
%
|
|||||||||||
|
Astellia Inc.
|
United States
|
2711 Centerville Road, Suite 400 Wilmington New Castle, Delaware 19808
|
Full
|
Full
|
100
|
%
|
100
|
%
|
100
|
%
|
100
|
%
|
|||||||||||
|
Astellia South Africa (PTY) LTD
|
South Africa
|
Executive City Corner Cross Street and Charmaine Avenue President Ridge Ranburg
|
Full
|
Full
|
100
|
%
|
100
|
%
|
100
|
%
|
100
|
%
|
|||||||||||
|
Astellia Telecom (PYT) LTD
|
India
|
C66 Okhla Phase 1, New Delhi 110020
|
Full
|
Full
|
95
|
%
|
95
|
%
|
95
|
%
|
95
|
%
|
|||||||||||
|
Astellia Md East S.A.L.
|
Lebanon
|
Centre Starco Beyrouth – Lebanon
|
Full
|
Full
|
100
|
%
|
100
|
%
|
100
|
%
|
100
|
%
|
|||||||||||
|
Astellia Telecom Spain
|
Spain
|
C/Ronda Narciso Monturiol, 6. Oficina 113 – B. 46 980 Paterna (Valencia) Spain
|
Full
|
Full
|
100
|
%
|
100
|
%
|
100
|
%
|
100
|
%
|
|||||||||||
|
Astellia Canada Inc.
|
Canada
|
2135 Sherbrooke Street E Montreal (Quebec) H2K 1C2
|
Full
|
Full
|
100
|
%
|
100
|
%
|
100
|
%
|
100
|
%
|
|||||||||||
|
Astellia Afrique AU
|
Morocco
|
Casablanca
|
Full
|
Full
|
100
|
%
|
100
|
%
|
100
|
%
|
100
|
%
|
|||||||||||
12
Consolidated Financial Statements – Year ended 31/12/2017
|
2.3.
|
Year-end dates for consolidated companies
|
Companies are consolidated based on their balance sheet as at December 31, 2017, for a period of 12 months, except for Astellia Telecom, whose year end is March 31. Interim statements as at December 31 have been prepared for consolidation purposes.
|
2.4.
|
Entities excluded from the scope of consolidation
|
No companies have been excluded from the scope of consolidation.
13
Consolidated Financial Statements – Year ended 31/12/2017
|
3.
|
Basis of accounting, principles of consolidation, policies and measurement rules
|
|
3.1.
|
Basis of accounting
|
The financial statements of Astellia Group have been prepared in accordance with French accounting rules and principles. The provisions of Regulation No. 99.02 of the “Comité de Réglementation Comptable”, approved on June 22, 1999, have been applied since January 1, 2000, as well as those of Regulation CRC 2005-10, dated 26/12/2005, which updated those provisions.
The principles and policies applied by Astellia Group are described in sections 3.2 and following.
|
3.2.
|
Principles of consolidation
|
|
3.2.1.
|
Consolidation methods
|
Consolidation is based on the financial statements as at 31/12/2017. All material interests in entities over which the Astellia Group companies exercise, directly or indirectly, exclusive control are consolidated using the full consolidation method.
Companies over which joint control is exercised are consolidated using the proportionate consolidation method.
Companies over which Astellia Group exercises a significant influence and holds, directly or indirectly, an ownership interest of more than 20% are accounted for under the equity method.
All significant transactions between consolidated companies are eliminated.
The full consolidation method involves:
| — |
including in the financial statements of the consolidating entity the financial statement items of the consolidated entities, after any restatements;
|
| — |
allocating equity and net income between the interests of the consolidating entity and the interests of other shareholders or partners, called “non-controlling interests”;
|
| — |
eliminating the transactions and accounts between the fully consolidated entity and the other consolidated entities.
|
The proportionate consolidation method involves:
| — |
including in the financial statements of the consolidating entity the proportionate share representing its interests in the financial statements of the consolidated entity, after any restatements; no non-controlling interests are therefore recognized;
|
| — |
eliminating the transactions and accounts between the proportionately consolidated entity and the other consolidated entities to the extent of the percentage used to include the proportionately consolidated entity.
|
14
Consolidated Financial Statements – Year ended 31/12/2017
The equity method involves:
| — |
replacing the carrying amount of the securities held with the proportionate share of equity, including net income for the year determined using the consolidation rules;
|
| — |
eliminating the integrated internal profits between the equity-accounted entity and the other consolidated entities to the extent of the ownership percentage in the equity-accounted entity.
|
|
3.2.2.
|
Elimination of intercompany transactions
|
In accordance with regulations, transactions between consolidated companies and internal income (loss) between these companies were eliminated in the consolidated financial statements.
|
3.2.3.
|
Translation of foreign companies financial statements
|
As the subsidiaries of SA Astellia are self-sustaining foreign operations, their financial statements have been translated using the current rate method:
Balance sheet items are translated into euros using the closing rate;
Statement of income items are translated using the average rate for the year;
The translation difference obtained is included in consolidated equity, under “Foreign currency translation reserve”. The following table presents a breakdown of that account.
|
Foreign currency translation
reserve
Company
|
Currency
|
Foreign currency
translation reserve
related to equity,
opening balance
|
Change in foreign
currency translation
reserve related to
equity
|
Foreign
currency
translation
reserve related
to equity,
ending balance
|
Translation
difference
related to net
income (loss)
|
Total foreign
currency
translation
reserve
|
|||||||||||||||
|
Astellia Inc
|
USD
|
(459,880
|
)
|
(43,989
|
)
|
(503,869
|
)
|
(18,635
|
)
|
(522,504
|
)
|
||||||||||
|
Astellia South Africa
|
ZAR
|
(14,578
|
)
|
(991
|
)
|
(15,569
|
)
|
327
|
(15,242
|
)
|
|||||||||||
|
Astellia Telecom
|
INR
|
3,925
|
(2,100
|
)
|
1 ,825
|
(13,024
|
)
|
(11,199
|
)
|
||||||||||||
|
Astellia Middle East
|
USD
|
62,698
|
(34,548
|
)
|
28,150
|
(67
|
)
|
28,083
|
|||||||||||||
|
Astellia Canada Inc
|
CAD
|
4 ,144
|
(12,447
|
)
|
(8,303
|
)
|
(1,737
|
)
|
(10,040
|
)
|
|||||||||||
|
Astellia Afrique
|
MAD
|
1,790
|
(6,376
|
)
|
(4 ,586
|
)
|
(899
|
)
|
(5,485
|
)
|
|||||||||||
|
Total
|
(401,901
|
)
|
(100,451
|
)
|
(502,352
|
)
|
(34,035
|
)
|
(536,387
|
)
|
|||||||||||
15
Consolidated Financial Statements – Year ended 31/12/2017
|
3.3.
|
Measurement policies and rules
|
|
3.3.1.
|
Application of preferential accounting policies
|
The preferential accounting policies stated in Regulation CRC 99-02 have been applied as follows:
|
Application of preferential accounting policies
|
YES
NO-N/A
|
Note
|
|
Recognition of finance leases
|
N/A
|
N/A
|
|
Provisioning of pension and similar benefits
|
YES
|
4.12.2
|
|
Deferral of issuance costs and repayment premiums for bonds and recognition over the life of the bonds
|
N/A
|
N/A
|
|
Recognition in net income of translation gains and losses
|
YES
|
N/A
|
|
Use of the percentage of completion method to recognize partially completed transactions at the reporting date
|
N/A
|
N/A
|
|
Capitalization of development expenses
|
YES
|
4.2.1
|
|
3.3.2.
|
Translation of foreign currency transactions
|
Any transactions denominated in foreign currencies are translated at the exchange rate in effect at the transaction date.
At the reporting date, monetary balances denominated in foreign currencies are translated at the closing rate. Exchange differences resulting from such translation and exchange differences resulting from foreign currency transactions, if any, are recognized in net financial income (loss).
|
3.3.3.
|
Measurement of assets and liabilities
|
Assets and liabilities are measured and recognized at historical cost.
A write-down or impairment loss is recognized when fair value is lower than the net carrying amount of non-current assets.
|
3.3.4.
|
Distinction between unusual income (loss) and current income (loss)
|
Current income (loss) results from the activities in which the Company engages in the normal course of its business and any related activities that it carries out on an ancillary basis or as an extension of its ordinary activities.
Unusual income (loss) results from events or transactions that are unusual and distinct from the ordinary activities and are not expected to recur frequently and regularly.
|
3.3.5.
|
Earnings per share
|
Earnings per share represents consolidated net income (group’s share) divided by the weighted average number of shares of the parent company outstanding during the year (excluding treasury shares deducted from equity).
16
Consolidated Financial Statements – Year ended 31/12/2017
|
3.3.14
|
Tax credits
|
|
3.3.14.1
|
Research tax credit
|
The research tax credit (“RTC”) is classified as operating grant in the statement of income.
|
3.3.14.2
|
Competitiveness and employment tax credit
|
The 2012 Amending Finance Law No. 2012-1510, dated 29/12/2012, introduced a competitiveness and employment tax credit (“CETC”) effective 01/01/2013. This tax credit represents 6% for compensation paid on or after 2014 that does not exceed 2.5 times the guaranteed minimum wage (“SMIC”).
As at December 31, 2017, the CETC recognized in the financial statements of our group amounted to €311,934.
In the statement of income, our group elected to recognize the CETC as a reduction of salaries and benefits.
The CETC was used to partially finance investments.
17
Consolidated Financial Statements – Year ended 31/12/2017
|
4.
|
Notes on balance sheet items
|
|
4.1.
|
Goodwill
|
Goodwill relates to the following entity:
|
Company
|
31/12/2016
|
Increases | Decreases |
31/12/2017
|
|||||||||
|
Gross amount (in K€)
|
|||||||||||||
|
Astellia Telecom Spain
|
1,464
|
1,464
|
|||||||||||
|
Total
|
1,464
|
1,464
|
|||||||||||
|
Accumulated amortization
|
|||||||||||||
|
Astellia Telecom Spain
|
1,464
|
1,464
|
|||||||||||
|
Total
|
1,464
|
1,464
|
|||||||||||
|
Net amount
|
|||||||||||||
|
Astellia Telecom Spain
|
0
|
0
|
|||||||||||
|
Total
|
0
|
0
|
|||||||||||
According to regulations, goodwill represents the difference between:
|
—
|
the acquisition cost of equity securities;
|
|
—
|
the proportionate share of the acquiring company in the total value of identified assets and liabilities at acquisition date.
|
Positive goodwill is recognized in non-current assets and amortized over a period that reflects, as reasonably as possible, the assumptions used and the objectives set for the acquisitions. This maximum period is estimated at 20 years.
The goodwill related to Astellia Telecom Spain is fully amortized.
18
Consolidated Financial Statements – Year ended 31/12/2017
|
4.2.
|
Intangible assets (excluding goodwill)
|
|
Amounts in K€
|
31/12/2016
|
Increases
|
Decreases
|
Translation
differences
|
Other
changes
|
31/12/2017
|
||||||||||||||||||
|
Gross amounts
|
||||||||||||||||||||||||
|
Research and development expenses
|
59,727
|
7,437
|
0
|
67,164
|
||||||||||||||||||||
|
Establishement costs
|
28
|
(3
|
)
|
25
|
||||||||||||||||||||
|
Concessions, patents, brands
|
2,864
|
27
|
5
|
2,886
|
||||||||||||||||||||
|
Business assets
|
15
|
15
|
||||||||||||||||||||||
|
Other intangible assets
|
4,160
|
4,160
|
||||||||||||||||||||||
|
Advances and deposits paid
|
||||||||||||||||||||||||
|
Total
|
66,794
|
7,464
|
5
|
(3
|
)
|
74,250
|
||||||||||||||||||
|
Accumulated amortization
|
||||||||||||||||||||||||
|
Research and development expenses
|
53,000
|
6,759
|
144
|
59,902
|
||||||||||||||||||||
|
Establishement costs
|
28
|
(3
|
)
|
25
|
||||||||||||||||||||
|
Concessions, patents, brands
|
2,009
|
613
|
5
|
(144
|
)
|
2,473
|
||||||||||||||||||
|
Business assets
|
15
|
15
|
||||||||||||||||||||||
|
Other intangible assets
|
4,125
|
20
|
4,145
|
|||||||||||||||||||||
|
Advances and deposits paid
|
||||||||||||||||||||||||
|
Total
|
59,177
|
7,392
|
5
|
(3
|
)
|
66,561
|
||||||||||||||||||
|
Net amounts
|
||||||||||||||||||||||||
|
Research and development expenses
|
6,728
|
678
|
0
|
(144
|
)
|
7,261
|
||||||||||||||||||
|
Establishement costs
|
||||||||||||||||||||||||
|
Concessions, patents, brands
|
854
|
(586
|
)
|
0
|
144
|
413
|
||||||||||||||||||
|
Business assets
|
||||||||||||||||||||||||
|
Other intangible assets
|
35
|
(20
|
)
|
15
|
||||||||||||||||||||
|
Advances and deposits paid
|
||||||||||||||||||||||||
|
7,617
|
72
|
0
|
7,689
|
|||||||||||||||||||||
Intangible assets are measured at acquisition value or production value.
The amortization methods and periods used are as follows:
|
Intangible assets
|
Method
|
Period
|
|
Software
|
Straight line
|
1 to 3 years
|
|
Technical software module
|
Straigh line
|
3 to 10 years
|
19
Consolidated Financial Statements – Year ended 31/12/2017
|
4.2.1.
|
Research and development expenses
|
Projects with high probability of technical feasibility and commercial success are capitalized and amortized over 3 years.
Projects without such characteristics are expensed.
Astellia SA
The “Astellia Solution” is a comprehensive development project: development of algorithms for monitoring and analyzing the quality of mobile (software) and physical (hardware) networks.
|
Base year RTC
|
Amount
|
2014
|
2015
|
2016
|
2017
|
To be amortized
|
||||||||||||||||||
|
2012
|
6,441,613
|
2,147,204
|
||||||||||||||||||||||
|
2013
|
6,798,037
|
2,266,012
|
2,266,012
|
|||||||||||||||||||||
|
2014
|
4,584,692
|
1,528,231
|
1,528,231
|
1,528,231
|
||||||||||||||||||||
|
2015
|
5,370,206
|
1,790,069
|
1,790,069
|
1,790,069
|
||||||||||||||||||||
|
2016
|
6,062,413
|
2,020,804
|
2,020,804
|
2,020,804
|
||||||||||||||||||||
|
2017
|
7,436,638
|
2,478,879
|
4,957,759
|
|||||||||||||||||||||
| Total |
63,369,859
|
5,941,447
|
5,584,312
|
5,339,104
|
6,289,752
|
6,978,563
|
||||||||||||||||||
Astellia Telecom Spain
Astellia Telecom Spain capitalizes development expenses in its separate financial statements. In consolidation, these capitalized expenses are restated to reflect the application of the group amortization method over a 3-year period.
|
Base year RTC
|
Amount
|
2014
|
2015
|
2016
|
Previous conso.
amortization conso
|
2017
|
To be amortized
|
|||||||||||||||||||||
|
2012
|
463278
|
154,426
|
77,213
|
0
|
463,278
|
0
|
0
|
|||||||||||||||||||||
|
2013
|
727459
|
242,486
|
242,486
|
121,243
|
727,459
|
0
|
0
|
|||||||||||||||||||||
|
2014
|
764439
|
254,813
|
254,813
|
254,813
|
764,439
|
0
|
0
|
|||||||||||||||||||||
|
2015
|
990191
|
330,064
|
330,064
|
660,127
|
330,064
|
0
|
||||||||||||||||||||||
|
2016
|
848694
|
282,898
|
282,898
|
282,898
|
282,898
|
|||||||||||||||||||||||
|
2017
|
0
|
0
|
0
|
0
|
||||||||||||||||||||||||
|
Total
|
3,794,061
|
651,725
|
904,576
|
989,018
|
2,898,201
|
612,962
|
282,898
|
|||||||||||||||||||||
For the first two years, an average date was used for the moment when the product was put into service, which resulted in development expenses being amortized for half of the year of capitalization.
|
4.2.2.
|
Establishment costs
|
Establishment costs are essentially comprised of costs related to capital increases and expenses incurred for the acquisition of new subsidiaries.
|
4.2.3.
|
Business assets
|
Business assets recognized in separate financial statements have been amortized in the consolidated financial statements over a period of three years.
20
Consolidated Financial Statements – Year ended 31/12/2017
|
4.3.
|
Property, plant and equipment
|
|
Amounts in K€
|
31/12/2016
|
Increases
|
Decreases |
Translation
differences
|
31/12/2017
|
|||||||||||||||
|
Gross amounts
|
||||||||||||||||||||
|
Land
|
||||||||||||||||||||
|
Leased land
|
||||||||||||||||||||
|
Buildings
|
3
|
3
|
||||||||||||||||||
|
Leased buildings
|
||||||||||||||||||||
|
Technical facilities, mach. & equip.
|
2,948
|
666
|
348
|
(2
|
)
|
3,263
|
||||||||||||||
|
Leased facilities, mach. & equip.
|
||||||||||||||||||||
|
Other property, plant and equipment
|
2,807
|
132
|
222
|
(23
|
)
|
2,694
|
||||||||||||||
|
Other leased PP&E
|
||||||||||||||||||||
|
PP&E in progress
|
26
|
26
|
||||||||||||||||||
|
Advances and deposits
|
||||||||||||||||||||
|
Total
|
5,758
|
824
|
573
|
(25
|
)
|
5,983
|
||||||||||||||
|
Accumulated depreciation
|
||||||||||||||||||||
|
Land
|
||||||||||||||||||||
|
Leased land
|
||||||||||||||||||||
|
Buildings
|
3
|
0
|
3
|
|||||||||||||||||
|
Leased buildings
|
||||||||||||||||||||
|
Technical facilities, mach. & equip.
|
2,270
|
491
|
348
|
2,413
|
||||||||||||||||
|
Leased facilities, mach. & equip.
|
||||||||||||||||||||
|
Other property, plant and equipment
|
1,884
|
281
|
214
|
(20
|
)
|
1,931
|
||||||||||||||
|
Other leased PP&E
|
||||||||||||||||||||
|
PP&E in progress
|
||||||||||||||||||||
|
Advances and deposits
|
||||||||||||||||||||
|
Total
|
4,157
|
772
|
565
|
(20
|
)
|
4,344
|
||||||||||||||
|
Net amounts
|
||||||||||||||||||||
|
Land
|
||||||||||||||||||||
|
Leased land
|
||||||||||||||||||||
|
Buildings
|
0
|
(0
|
)
|
0
|
(0
|
)
|
||||||||||||||
|
Leased buildings
|
||||||||||||||||||||
|
Technical facilities, mach. & equip.
|
678
|
175
|
(2
|
)
|
850
|
|||||||||||||||
|
Leased facilities, mach. & equip.
|
||||||||||||||||||||
|
Other property, plant and equipment
|
923
|
(149
|
)
|
8
|
(3
|
)
|
763
|
|||||||||||||
|
Other leased PP&E
|
||||||||||||||||||||
|
PP&E in progress
|
26
|
26
|
||||||||||||||||||
|
Advances and deposits
|
||||||||||||||||||||
|
Total
|
1,600
|
52
|
8
|
(5
|
)
|
1,639
|
||||||||||||||
Property, plant and equipment are measured at acquisition cost, net of rebates, discounts and cash discounts, or at production cost.
21
Consolidated Financial Statements – Year ended 31/12/2017
An impairment loss is recognized when the present value of an asset is lower that its net carrying amount.
The depreciation pattern for each item of property, plant and equipment depends on its own use and the economic benefits it provides.
The main depreciation methods and periods used are as follows:
|
Property, plant and equipment
|
Method
|
Period
|
|
Computer hardware
|
Straight line
|
3 years
|
|
General facilities
|
Straight line
|
5 to 10 years
|
|
Office and computer equipment
|
Straight line
|
3 to 10 years
|
|
Internal computer network
|
Straight line
|
3 to 5 years
|
|
Furniture
|
Straight line
|
8 to 10 years
|
|
4.4.
|
Long-term investments
|
|
Amounts in K€
|
31/12/2016
|
Increases
|
Decreases
|
Translation
differences
|
31/12/2017
|
|||||||||||||||
|
Gross amounts
|
||||||||||||||||||||
|
Equity securities
|
(0
|
)
|
(0
|
)
|
||||||||||||||||
|
Receivables related to equity interests
|
||||||||||||||||||||
|
Loans
|
||||||||||||||||||||
|
Other long-term investments
|
447
|
5
|
79
|
(6
|
)
|
367
|
||||||||||||||
|
Equity-accounted securities
|
||||||||||||||||||||
|
Total
|
447
|
5
|
79
|
(6
|
)
|
367
|
||||||||||||||
|
Write-downs
|
||||||||||||||||||||
|
Equity securities
|
||||||||||||||||||||
|
Receivables related to equity interests
|
||||||||||||||||||||
|
Loans
|
||||||||||||||||||||
|
Other long-term investments
|
||||||||||||||||||||
|
Equity-accounted securities
|
||||||||||||||||||||
|
Total
|
||||||||||||||||||||
|
Net amounts
|
||||||||||||||||||||
|
Equity securities
|
(0
|
)
|
(0
|
)
|
||||||||||||||||
|
Receivables related to equity interests
|
||||||||||||||||||||
|
Loans
|
||||||||||||||||||||
|
Other long-term investments
|
447
|
5
|
79
|
(6
|
)
|
367
|
||||||||||||||
|
Equity-accounted securities
|
||||||||||||||||||||
|
Total
|
447
|
5
|
79
|
(6
|
)
|
367
|
||||||||||||||
This item is essentially comprised of paid deposits and guarantees, which do not need to be written down.
22
Consolidated Financial Statements – Year ended 31/12/2017
|
4.5.
|
Inventories and work in progress
|
Inventories and work in progress are detailed as follows:
|
Amounts in K€
|
31/12/2016
|
Changes
|
31/12/2017
|
|||||||||
|
Gross amounts
|
||||||||||||
|
Raw materials
|
3,526
|
(1,175
|
)
|
2,350
|
||||||||
|
Work in progress
|
||||||||||||
|
Intermediate and finished goods
|
||||||||||||
|
Goods
|
||||||||||||
|
Total
|
3,526
|
(1,175
|
)
|
2,350
|
||||||||
|
Write-downs
|
||||||||||||
|
Raw materials
|
1,584
|
(149
|
)
|
1,435
|
||||||||
|
Work in progress
|
||||||||||||
|
Intermediate and finished goods
|
||||||||||||
|
Goods
|
||||||||||||
|
Total
|
1,584
|
(149
|
)
|
1,435
|
||||||||
|
Net amounts
|
||||||||||||
|
Raw materials
|
1,942
|
(1,026
|
)
|
916
|
||||||||
|
Work in progress
|
||||||||||||
|
Intermediate and finished goods
|
||||||||||||
|
Goods
|
||||||||||||
|
Total
|
1,942
|
(1,026
|
)
|
916
|
||||||||
Inventories are measured at acquisition cost using the weighted average unit cost method.
The acquisition cost includes the purchase cost, net of trade discounts and rebates received, and duties and non-refundable taxes.
— Write-down method used
Impairment is assessed on an item-per-item basis based on the level of technical obsolescence.
This obsolescence is assessed by the Company’s technical services.
Write-down rates range from 25% to 100%.
23
Consolidated Financial Statements – Year ended 31/12/2017
|
4.6.
|
Trade receivables and related accounts
|
Receivables are broken down by maturities as follows:
|
Amounts in K€
|
Total gross
|
Maturity
1- year 1+ year
|
Write-downs
|
Total net
|
||||||||||||
|
Trade receivables and related accounts
|
22,035
|
22,035
|
523
|
21,512
|
||||||||||||
|
Total
|
22,035
|
22,035
|
523
|
21,512
|
||||||||||||
|
Amounts in K€
|
31/12/2016
|
Charges
|
Reversals
|
31/12/2017
|
||||||||||||
|
Write-downs
|
255
|
487
|
220
|
523
|
||||||||||||
|
Total
|
255
|
487
|
220
|
523
|
||||||||||||
Receivables and payables are measured at face value.
Receivables write-down method: an allowance for receivables impairment is recognized on an individual basis when the realizable value is lower than the carrying amount.
Since the implementation of the new ERP, invoices related to contracts with clients are considered as partial invoices, called milestone invoices.
Milestone billing represents the billing terms and conditions negotiated with customers and does not reflect the percentage of completion of work. Sales are therefore recognized through unbilled receivables.
As at December 31, 2017, unbilled receivables and corresponding deposits are set off in the financial statements.
Amounts reported on the balance sheet are as follows:
|
Advances and deposits received on orders in progress
|
Amount | |||
|
Unbilled receivables related to orders in progress
|
46,708,806
|
|||
|
Amount set off
|
44,193,750
|
|||
|
Reported as assets on the balance sheet (trade receivables)
|
2,515,055
|
|||
|
Milestone billing
|
52,594,612
|
|||
|
Amount set off
|
44,193,750
|
|||
|
Reported as liabilities on the balance sheet (advance and deposits)
|
8,400,861
|
|||
24
Consolidated Financial Statements – Year ended 31/12/2017
|
4.7.
|
Other receivables and accruals
|
|
Nature
|
Total
gross
|
Maturity
|
Write-
downs
|
Total net
31/12/2017
|
Total net
31/12/2016
|
||||||||||||||||
|
1- year
|
1+ year
|
||||||||||||||||||||
|
Recevables related to equity interests
|
|||||||||||||||||||||
|
Other long-term investments
|
367
|
90
|
277
|
367
|
447
|
||||||||||||||||
|
Total long-term receivables
|
367
|
90
|
277
|
367
|
447
|
||||||||||||||||
|
Advances and deposits on orders
|
101
|
101
|
101
|
54
|
|||||||||||||||||
|
Deferred tax assets
|
|||||||||||||||||||||
|
Other receivables (1)
|
9,944
|
5,258
|
4,687
|
9,944
|
10,471
|
||||||||||||||||
|
Deferred expenses
|
1,427
|
1,427
|
1,427
|
1,359
|
|||||||||||||||||
|
Total other operating receivables
|
11,472
|
6,785
|
4,687
|
11,472
|
11,884
|
||||||||||||||||
|
(1)
|
Including intercompany receivables: €4,250K
|
|
—
|
Astellia SA: €3,561K
|
|
—
|
Astellia Telecom Spain: €601K
|
|
—
|
Astellia Telecom (India): €61K
|
|
—
|
Astellia South Africa: €27K
|
|
4.8.
|
Cash assets
|
|
Cash assets
|
Gross
carrying
|
Write-downs
|
Net amounts
31/12/2017
|
Net amounts
31/12/2016
|
|||||||||
|
Marketable securities-cash equivalents
|
16
|
16
|
241
|
||||||||||
|
Treasury shares
|
|||||||||||||
|
Liquidities
|
4,469
|
4,469
|
6,516
|
||||||||||
|
Financial instruments
|
|||||||||||||
|
Total
|
4,485
|
4,485
|
6,757
|
||||||||||
Marketable securities are measured at purchase or subscription price, excluding ancillary costs.
An allowance for impairment is recognized when the quoted price or the probable realizable value are lower than the purchase value.
For reporting purposes in the statement of cash flows, cash includes the following: cash on hand, available bank balances, marketable securities and short-term bank facilities not treated as short-term financing.
25
Consolidated Financial Statements – Year ended 31/12/2017
|
4.9.
|
Equity
|
|
4.9.1.
|
Composition of share capital
|
As at December 31, 2017, share capital was comprised of 2,590,451 shares with a par value of €0.50.
|
4.9.2.
|
Shareholders’ voting rights
|
Each share of the Company gives right to one vote.
The Combined Annual Meeting held December 3, 2007 decided, through its fifth resolution, subject to the condition precedent that the shares of the Company would be admitted to trading on the Alternext market of Euronext Paris, to introduce double voting rights for all shares that are fully paid up and for which proof of registration in the name of the same shareholder for at least two years is provided. Therefore, according to the provisions of the Code of Commerce, all shareholders concerned who would keep their shares after the shares of the Company are admitted to trading on the Alternext market of Euronext Paris would be granted voting rights that would be equal to twice the votings rights attached to the other shares if the above-mention condition precedent is met.
Double voting rights lapse for any shares that are converted into bearer form or are transferred, except for any transfer of shares between holders of registered shares through inheritance or family gift.
Double voting rights may be cancelled following a decision of an Extraordinary General Meeting and after the approval of a Special Meeting of shareholders entitled to double voting rights.
As at December 31, 2017, there were 2,979,530 voting rights in total, of which 389,079 were double voting rights.
|
4.9.3.
|
Share value as at December 31, 2017
|
As at December 31, 2017, the value of shares admitted on the NYSE Alternext market was €9.95.
26
Consolidated Financial Statements – Year ended 31/12/2017
|
4.9.4.
|
Analysis of consolidated equity
|
|
In thousands of euros
|
||||||||||||||||
|
Equity reconciliation
|
Parent
company
|
Subsidiaries
|
31/12/2017
|
31/12/2016
|
||||||||||||
|
Separate equity
|
10,276
|
912
|
11,188
|
25,161
|
||||||||||||
|
Amortization of business assets
|
(833
|
)
|
(833
|
)
|
(1,667
|
)
|
||||||||||
|
Capitalization of development expenses
|
6,979
|
(481
|
)
|
6,498
|
4,951
|
|||||||||||
|
Translation differences
|
29
|
29
|
200
|
|||||||||||||
|
Grants
|
(74
|
)
|
(74
|
)
|
(260
|
)
|
||||||||||
|
Retirement benefits
|
(1,294
|
)
|
(1,294
|
)
|
(1,368
|
)
|
||||||||||
|
Deferred income taxes
|
(580
|
)
|
||||||||||||||
|
Restatements
|
4,881
|
(555
|
)
|
4,326
|
1,276
|
|||||||||||
|
Restated equity
|
15,156
|
357
|
15,514
|
26,437
|
||||||||||||
|
Cancellation of internal provisions
|
11,598
|
11,598
|
4,861
|
|||||||||||||
|
Cancellation of the forgiveness of future debt from India
|
420
|
|||||||||||||||
|
Gains on internal disposals
|
52
|
(451
|
)
|
(399
|
)
|
|||||||||||
|
Other
|
(6
|
)
|
(6
|
)
|
||||||||||||
|
Equity after eliminations
|
26,807
|
(94
|
)
|
26,707
|
31,719
|
|||||||||||
|
Goodwill
|
||||||||||||||||
|
Elimination of shares
|
(9,543
|
)
|
(9,543
|
)
|
(8,043
|
)
|
||||||||||
|
Non-controlling interests on fully consolidated companies
|
(18
|
)
|
(18
|
)
|
(2
|
)
|
||||||||||
|
Consolidated equity
|
26,807
|
(9,654
|
)
|
17,147
|
23,674
|
|||||||||||
27
Consolidated Financial Statements – Year ended 31/12/2017
|
4.10.
|
Analysis of consolidated net income (loss)
|
|
In thousands of euros
|
||||||||||||||||
|
Net income (loss) reconciliation
|
Parent
company
|
Subsidiaries
|
31/12/2017
|
31/12/2016
|
||||||||||||
|
Separate net income (loss)
|
(14,116
|
)
|
(1,059
|
)
|
(15,174
|
)
|
(3,691
|
)
|
||||||||
|
Amortization of business assets
|
833
|
833
|
833
|
|||||||||||||
|
Cancellation of regulated provisions
|
35
|
35
|
41
|
|||||||||||||
|
Capitalisation of development expenses
|
1,147
|
400
|
1,547
|
976
|
||||||||||||
|
Translation differences
|
(171
|
)
|
(171
|
)
|
(375
|
)
|
||||||||||
|
Reclassification of translation differences to net income (loss)
|
(82
|
)
|
||||||||||||||
|
Retirement benefits
|
75
|
75
|
27
|
|||||||||||||
|
Corporate incometax adjustment
|
580
|
580
|
(580
|
)
|
||||||||||||
|
Restatements
|
1,919
|
980
|
2,899
|
840
|
||||||||||||
|
Restated net income (loss)
|
(12,196
|
)
|
(78
|
)
|
(12,275
|
)
|
(2,851
|
)
|
||||||||
|
Cancellation of internal provisions
|
6,737
|
6,737
|
1,534
|
|||||||||||||
|
Cancellation of the forgiveness of future debt from India
|
(420
|
)
|
(420
|
)
|
420
|
|||||||||||
|
Gains on internal disposals
|
52
|
(451
|
)
|
(399
|
)
|
173
|
||||||||||
|
Other
|
(20
|
)
|
(20
|
)
|
4
|
|||||||||||
|
Net income (loss) after eliminations
|
(5,827
|
)
|
(530
|
)
|
(6,376
|
)
|
(720
|
)
|
||||||||
|
Goodwill
|
69
|
|||||||||||||||
|
Non-controlling interests on fully consolidated companies
|
(17
|
)
|
13
|
|||||||||||||
|
Consolidated net income (loss)
|
(5,827
|
)
|
(530
|
)
|
(6,393
|
)
|
(638
|
)
|
||||||||
28
Consolidated Financial Statements – Year ended 31/12/2017
|
4.11.
|
Provisions for risks and expenses
|
|
4.11.1.
|
Summary
|
The following table presents the breakdown of provisions for risks and expenses:
|
Amounts in K€
|
31/12/2016
|
Charges
|
Reversals
|
31/12/2017
|
||||||||||||
|
Provisions for retirement benefits
|
1,368
|
75
|
1,294
|
|||||||||||||
|
Provisons for long-service awards
|
||||||||||||||||
|
Provisions for major refurbishment work
|
||||||||||||||||
|
Provisions for restructuring costs
|
||||||||||||||||
|
Provisions for litigation
|
276
|
101
|
377
|
|||||||||||||
|
Provisions for taxes
|
||||||||||||||||
|
Other provisions for risks and expenses
|
313
|
313
|
||||||||||||||
|
Negative goodwill
|
||||||||||||||||
|
Deferred tax liabilities
|
0
|
0
|
||||||||||||||
|
Total
|
1,957
|
101
|
388
|
1,671
|
||||||||||||
The provisions for current litigation are measured using the information available as at the reporting date.
|
4.11.2.
|
Retirement and similar benefits
|
The amount of employee rights that would be vested for calculating retirement benefits is generally determined based on the employees’ number of years of service and the probability that they will still work for the Company upon retirement.
All these costs are provisioned and recognized in net income (loss) on a systematic basis over the service life of the employees.
The retirement obligation is calculated using the projected unit credit method and the following variables (calculations are performed on a calendar year basis).
The measurement assumptions are as follows:
|
2016
|
2017
|
|||||||
|
Discount rate
|
1.31%
|
1.31%
|
|
|||||
|
Rate of salary increases
|
1.5%
|
|
1.5%
|
|
||||
|
Age at retirement
|
67
|
67
|
||||||
|
Collective agreement
|
Syntec
|
Syntec
|
||||||
|
31/12/2016
|
31/12/2017
|
|||||||
|
Total provision for retirement benefits
|
1,569,039
|
1,332,281
|
||||||
|
Externally covered (capital paid)
|
175,727
|
34,237
|
||||||
|
Externally covered (capitalized interest)
|
25,056
|
4,468
|
||||||
|
Consolidated provision
|
1,368,256
|
1, 293,577
|
||||||
29
Consolidated Financial Statements – Year ended 31/12/2017
Provisions amounting to €74,679 were reversed during the year.
|
4.12.
|
Loans and financial debts
|
|
4.12.1.
|
Nature and maturities of loans and financial debts
|
Financial debts are broken down by maturities as follows:
|
Amounts in K€
|
31/12/2016
|
31/12/2017
|
<1 year
|
1-5 years
|
>5
years
|
|||||||||||||
|
Convertible bonds
|
||||||||||||||||||
|
Other bonds
|
||||||||||||||||||
|
Loans and debts with credit institutions
|
8,128
|
7,566
|
2,313
|
5,253
|
||||||||||||||
|
Employee profit sharing liability
|
||||||||||||||||||
|
Obligations under finance leases
|
||||||||||||||||||
|
Total loans with institutions and finance leases
|
8,128
|
7,566
|
2,313
|
5,253
|
||||||||||||||
|
Miscellaneous financial debts
|
14
|
11
|
11
|
|||||||||||||||
|
Total loans and miscellaneous financial debts
|
14
|
11
|
11
|
|||||||||||||||
|
Short-term bank facilities
|
3,082
|
3,988
|
3,988
|
|||||||||||||||
|
Accrued interest not yet due
|
3
|
27
|
27
|
|||||||||||||||
|
Total short-term bank facilities and accrued interest
|
3,085
|
4,016
|
4,016
|
|||||||||||||||
|
Total loans and financial debts
|
11,228
|
11,592
|
6,339
|
5,253
|
||||||||||||||
|
4.12.2.
|
Change in loans and financial debts
|
|
Amounts in K€
|
31/12/2016
|
Increases
|
Decreases
|
31/12/2017
|
||||||||||||
|
Convertible bonds
|
||||||||||||||||
|
Other bonds
|
||||||||||||||||
|
Loans and debts with credit institutions
|
8,128
|
1,400
|
1,963
|
7,566
|
||||||||||||
|
Employee profit sharing liability
|
||||||||||||||||
|
Obligations under finance leases
|
||||||||||||||||
|
Total loans with institutions and financial leases
|
8,128
|
1,400
|
1,963
|
7,566
|
||||||||||||
|
Miscellaneous financial debts
|
14
|
3
|
11
|
|||||||||||||
|
Total loans and miscellaneous financial debts
|
14
|
3
|
11
|
|||||||||||||
|
Short-term bank facilities
|
3,082
|
907
|
3,988
|
|||||||||||||
|
Accrued interest not yet due
|
3
|
24
|
27
|
|||||||||||||
|
Total short-term bank facilities and accrued interest
|
3,085
|
931
|
4,016
|
|||||||||||||
|
Total loans and financial debts
|
11,228
|
2,331
|
1,966
|
11,592
|
||||||||||||
30
Consolidated Financial Statements – Year ended 31/12/2017
|
4.13.
|
Trade and other payables
|
Other current liabilities include the following items:
|
Amounts in K€
|
31/12/2016
|
31/12/2017
|
< 1 year
|
1-5 years | > 5 years | |||||||||||
|
Trade payables
|
4,875
|
4,404
|
4,404
|
|||||||||||||
|
Trade payables – non-current assets
|
||||||||||||||||
|
Advances and deposits received on orders
|
22,196
|
8,401
|
8,401
|
|||||||||||||
|
Taxes and social security payable
|
4,550
|
3,620
|
3,620
|
|||||||||||||
|
Current accounts in credit
|
||||||||||||||||
|
Miscellaneous liabilities
|
540
|
109
|
109
|
|||||||||||||
|
Deferred revenues
|
1,949
|
1,119
|
1,119
|
|||||||||||||
|
Total other current liabilities
|
34,110
|
17,653
|
17,653
|
|||||||||||||
All liabilities mature within one year.
Deferred revenues relate to 2 activities:
|
—
|
Maintenance and rental revenues for which billing periods are clearly defined.
|
Software implementations and services for which sales are recognized when goods or services are acknowledged by customers.
The milestone billing method will ultimately lead to the elimination of deferred revenues.
31
Consolidated Financial Statements – Year ended 31/12/2017
|
5.
|
Statement of income items
|
|
5.1.
|
Sales by company
|
The contribution to external sales is as follows
|
Sales
|
31/12/2017
|
31/12/2016
|
||||||
|
Astellia S.A.
|
36,175
|
44,775
|
||||||
|
Astellia Inc.
|
166
|
185
|
||||||
|
Astellia Telecom
|
0
|
57
|
||||||
|
Astellia Telecom Spain
|
1,520
|
3,309
|
||||||
|
Astellia Canada Inc
|
713
|
554
|
||||||
|
Total
|
38,574
|
48,880
|
||||||
The Company recognizes sales when the customer has effective control over the goods delivered by the Company, which is when such goods have been put into operation. This recognition method tends to increase “Deferred revenues” on the balance sheet at year-end, as some customers wish to be billed before the end of the year, usually for internal budget reasons, while the Company has not yet recognized the related sales.
The principle applied by the Company is to recognize sales only when performance is entirely achieved with certainty. For training or service activities, applying this principle leads to recognizing sales when it is determined that performance is really achieved, which is when the training session has been completed or the service has been rendered.
For maintenance contracts that are billed at the beginning of the period, the amount is recognized as sales on a time-proportion basis over the year.
Software is sold under the form of a definitive license, and sales are recognized when the software is delivered if it is installed by the customer or when the software is put into operation if it is installed by the Company.
|
5.2.
|
Other revenues
|
|
Amounts in K€
|
31/12/2017
|
31/12/2016
|
||||||
|
Change in inventories
|
8,062
|
7,534
|
||||||
|
Operating grants
|
2,319
|
1,953
|
||||||
|
Reversal of depreciation and operating provisions
|
1,878
|
1,002
|
||||||
|
Other revenues
|
569
|
11
|
||||||
|
Transfers of operating expenses
|
244
|
291
|
||||||
|
Total
|
13,071
|
10,791
|
||||||
32
Consolidated Financial Statements – Year ended 31/12/2017
|
5.3.
|
Salaries and benefits
|
|
Amounts in K€
|
31/12/2017
|
31/12/2016
|
||||||
|
Gross salaries
|
18,281
|
19,266
|
||||||
|
Benefits
|
6,348
|
7,082
|
||||||
|
Employee profit sharing
|
0
|
0
|
||||||
|
Total
|
24,629
|
26,348
|
||||||
The following table presents the average number of employees for each of the fully consolidated companies.
|
Salaried employees
|
31/12/2017
|
31/12/2016
|
||||||
|
Astellia SA
|
239
|
281
|
||||||
|
Astellia Inc
|
3
|
3
|
||||||
|
Astellia Canada Inc
|
6
|
5
|
||||||
|
Astellia South Africa
|
4
|
3
|
||||||
|
Astellia Telecom
|
2
|
18
|
||||||
|
Astellia Middle East
|
19
|
12
|
||||||
|
Astellia Telecom Spain
|
84
|
91
|
||||||
|
Astellia Asia
|
||||||||
|
Astellia Afrique
|
8
|
1
|
||||||
|
Total
|
363
|
414
|
||||||
|
5.4.
|
Depreciation and charges to provisions
|
The following table details depreciation and charges to provisions included in operating income (loss).
|
Amounts in K€
|
31/12/2017
|
31/12/2016
|
||||||
|
Depreciation – Operations
|
8,163
|
7,795
|
||||||
|
Depreciation – Finance leases
|
||||||||
|
Charges to provisions and operating write-downs
|
1,922
|
1,626
|
||||||
|
Total
|
10,084
|
9,421
|
||||||
33
Consolidated Financial Statements – Year ended 31/12/2017
|
5.5.
|
Operating income (loss) by company
|
|
Operating income (loss) by
company (in k€)
|
31/12/2017
|
31/12/2016
|
||||||
|
Astellia S.A.
|
(5,106
|
)
|
305
|
|||||
|
Astellia Inc.
|
160
|
467
|
||||||
|
Astellia South Africa
|
20
|
18
|
||||||
|
Astellia Telecom
|
375
|
(257
|
)
|
|||||
|
Astellia Telecom Spain
|
(984
|
)
|
(973
|
)
|
||||
|
Astellia Canada Inc
|
94
|
106
|
||||||
|
Astellia Afrique
|
54
|
40
|
||||||
|
Total
|
(5,387
|
)
|
(294
|
)
|
||||
|
5.6.
|
Net financial income (expenses)
|
The following table presents the breakdown of net financial income (expenses).
| Amounts in K€ |
31/12/2017
|
31/12/2016
|
||||||
| Financial income | ||||||||
|
Other investment income
|
||||||||
|
Income from receivables and marketable securities
|
0
|
4
|
||||||
|
Foreign exchange gains
|
290
|
1,178
|
||||||
|
Reversals of provisions and transfers of expenses
|
0
|
|||||||
|
Net revenues on disposal of marketable securities
|
||||||||
|
Other financial income
|
53
|
66
|
||||||
|
Total
|
343
|
1,248
|
||||||
|
Financial expenses
|
||||||||
|
Charges to provisions
|
0
|
|||||||
|
Interest and similar expenses
|
258
|
262
|
||||||
|
Foreign exchange losses
|
1,095
|
840
|
||||||
|
Net expenses on disposal of marketable securities
|
||||||||
|
Other financial expenses
|
1
|
40
|
||||||
|
Total
|
1,354
|
1,142
|
||||||
|
Net financial income (loss)
|
(1,011
|
)
|
106
|
|||||
34
Consolidated Financial Statements – Year ended 31/12/2017
|
5.7.
|
Unusual income (loss)
|
The following table presents a breadkdown of unusual income (loss).
|
Amounts in K€
|
31/12/2017
|
31/12/2016
|
||||||
|
Unusual income
|
|
|
||||||
| Unusual income – management transactions | 7 | |||||||
| Unusual income – prior years |
|
|||||||
| Unusual income – capital transactions | ||||||||
|
- On disposal of intangible assets
|
(0
|
)
|
||||||
|
- On disposal of tangible assets
|
12
|
8
|
||||||
|
- On disposal of other financial assets
|
287
|
|||||||
|
Other unusual income
|
3
|
87
|
||||||
|
Unusual reversals of provisions
|
313
|
121
|
||||||
|
Unusual transfers of expenses
|
||||||||
|
Net income discrepancy N-1
|
||||||||
|
Total
|
335
|
502
|
||||||
|
Unusual expenses
|
||||||||
|
Unusual expenses – management transactions
|
29
|
(32
|
)
|
|||||
|
Unusual expenses – prior years
|
||||||||
|
Unusual income – capital transactions
|
||||||||
|
- On disposal of intangible assets
|
||||||||
|
- On disposal of tangible assets
|
7
|
10
|
||||||
|
- On disposal of consolidated securities
|
398
|
|||||||
|
- On disposal of other financial assets
|
20
|
5
|
||||||
|
Unusual depreciation and charges to provisions
|
102
|
376
|
||||||
|
Total
|
159
|
756
|
||||||
|
Unusual income (loss)
|
175
|
(254
|
)
|
|||||
35
Consolidated Financial Statements – Year ended 31/12/2017
|
5.8.
|
Net income (loss) of consolidated companies by company
|
|
Net income (loss) by
company (in k€)
|
31/12/2017
|
31/12/2016
|
||||||
|
Astellia S.A.
|
(5,827
|
)
|
222
|
|||||
|
Astellia Inc.
|
319
|
309
|
||||||
|
Astellia Do Brazil
|
(97
|
)
|
||||||
|
Astellia South Africa
|
21
|
4
|
||||||
|
Astellia Telecom
|
333
|
(260
|
)
|
|||||
|
Astellia Asia
|
17
|
|||||||
|
Astellia Middle East
|
1
|
1
|
||||||
|
Astellia Telecom Spain
|
(1,327
|
)
|
(1,008
|
)
|
||||
|
Astellia Canada Inc
|
66
|
61
|
||||||
|
Astellia Afrique
|
38
|
32
|
||||||
|
Total
|
(6,376
|
)
|
(719
|
)
|
||||
36
Consolidated Financial Statements – Year ended 31/12/2017
|
6.
|
Corporate income taxes
|
|
6.1.
|
Balance sheet presentation
|
|
Amounts in K€
|
31/12/2017
|
31/12/2016 Change
|
||||||
|
Deferred tax assets
|
||||||||
|
Deferred tax liabilities
|
||||||||
|
Total net deferred taxes
|
||||||||
|
Impact on consolidated reserves
|
||||||||
|
Impact on consolidated net income (loss)
|
||||||||
|
Total impact of deferred taxes
|
||||||||
|
6.2.
|
Deferred taxes by nature
|
|
Amounts in K€
|
31/12/2016
|
Impact on reserves
|
Impact on net
income (loss)
|
31/12/2017
|
|||||||||
|
Temporary differences
|
489
|
(151
|
)
|
338
|
|||||||||
|
Tax loss carryforwards
|
1,455
|
(48
|
)
|
1,407
|
|||||||||
|
Capitalization of R&D expenses in France
|
(1,944
|
)
|
199
|
(1,744
|
)
|
||||||||
|
Total
|
(0
|
)
|
|||||||||||
In accordance with Regulation CRC N° 99-02, the group recognizes deferred taxes for:
|
—
|
Temporary differences between the tax basis and the carrying amount of assets and liabilities reported in the consolidated balance sheet.
|
|
—
|
Tax credits and loss carryforwards.
|
Deferred taxes are calculated using the balance sheet liability method, by applying the last enacted tax rate for each company.
In accordance with Regulation CRC N° 99-02, the deferred tax assets and liabilities of a single tax entity are offset.
|
6.3.
|
Tax losses for which no deferred tax assets are recognized
|
Deferred tax assets are recognized only when:
|
—
|
their realization does not depend on future income;
|
|
—
|
or their realization is probable as a result of the existence of expected taxable income in the foreseeable future.
|
No deferred taxes are recognized in foreign subsidiaries.
37
Consolidated Financial Statements – Year ended 31/12/2017
The deferred income tax rate is 25%. For Astellia SA, deferred tax assets are limited to deferred tax liabilities as at 31/12/2017.
The group’s tax losses for which no deferred tax assets are recognized are summarized in the following table.
|
Tax losses
|
Amount
|
Portion for which a
deferred tax asset is
recognized in the
consolidated
financial statements
|
Portion for
which no
deferred tax
assets are
recognized
|
Unrecognized
unrealized benefit
|
||||||||||||
|
Astellia SA
|
25.00
|
%
|
||||||||||||||
|
Balance at end of 2016
|
5,000,208
|
4,364,322
|
635,886
|
158,972
|
||||||||||||
|
2017
|
10,084,832
|
1,262,824
|
8,822,008
|
2,205,502
|
||||||||||||
|
Total Astellia SA
|
15,085,040
|
5,627,146
|
9,457,894
|
2,364,474
|
||||||||||||
|
Astellia Telecom Spain
|
30
|
%
|
||||||||||||||
|
Balance at end of 2016
|
4,228,932
|
4,228,932
|
1,268,680
|
|||||||||||||
|
2017
|
793,091
|
793,091
|
237,927
|
|||||||||||||
|
Total Astellia Telecom Spain
|
5,022,023
|
5,022,023
|
1,506,607
|
|||||||||||||
|
Total
|
20,107,063
|
5,627,146
|
14,479,917
|
3,871,080
|
||||||||||||
|
6.4.
|
Other unrecognized tax credits
|
The Spanish research tax credit has not been included in these financial statements even though it is recognized in the subsidiary’s separate financial statements.
This credit can be applied over the 18-year period following its claim.
| Other unrecognized tax credits | ||||
| Astellia Telecom Spain | ||||
|
Research tax credit 2011
|
22,217
|
|||
|
Research tax credit 2012
|
355,796
|
|||
|
Withholding taxes
|
236,935
|
|||
|
Total
|
614,948
|
The Spanish company also has an additional tax credit related to withholding taxes than can be carried forward indefinitely.
38
Consolidated Financial Statements – Year ended 31/12/2017
|
6.5.
|
Corporate income tax expense
|
|
Amounts in K€
|
31/12/2017 |
31/12/2016
|
||||||
| Corporate income taxes | 153 | 279 | ||||||
| Deferred income taxes | 0 | |||||||
|
Income taxes
|
279 |
279
|
||||||
|
6.6.
|
Income tax proof
|
|
Tax justification
Amounts in K€
|
31/12/2017
|
|||
|
Net income (loss) of the consolidated group
|
(6,376
|
)
|
||
|
Add/deduct: Share of income from equity-acct. investees
|
||||
|
Add/deduct: Amortization of goodwill
|
0
|
|||
|
Net income (loss) of consolidated companies
|
(6,376
|
)
|
||
|
Income taxes (1)
|
153
|
|||
|
Net income (loss) before taxes
|
(6,223
|
)
|
||
|
<Imputed taxes at the enacted rate, 33.33%> (2)
|
(1,556 |
)
|
||
|
Tax difference (1) - (2)
|
1,709
|
|||
|
Explanations Amounts in K€
|
Expenses
|
Benefits | ||||||
|
Permanent differences – separate entities
|
304
|
|||||||
|
Permanent differences – consolidation
|
245
|
|||||||
|
Adjustment conso. gains on disposal of N/C assets
|
100
|
|||||||
|
Loss for the year for which no DIT assets are recognized
|
2,812
|
|||||||
|
Tax credits and CETC
|
654
|
|||||||
|
Total
|
2,912
|
1,204
|
||||||
|
Net difference
|
1,709
|
|||||||
The research tax credit is recognized as an operating grant.
39
Consolidated Financial Statements – Year ended 31/12/2017
|
7.
|
Other information
|
|
7.1.
|
Off-balance sheet commitments
|
|
7.1.1.
|
Commitments given
|
|
·
|
Collateral:
|
|
Type of
commitment
|
Assets pledged
as collateral
|
Debt amount
|
|
Collateral for a loan
|
Business assets
|
1,568,015
|
|
·
|
Bank guarantees provided for commercial bids:
|
|
Purpose
|
Inception
date
|
End date
|
Currency
code
|
Euros
|
Currency
|
|
Performance bond
|
23/02/2012
|
Final acceptance
|
€
|
54,282
|
|
·
|
Guarantees provided:
|
Astellia Telecom Spain
In the first half of 2016, Astellia Telecom Spain received a new financial assistance combined with a preferential-rate loan from a public agency, the Centre for Industrial Technology Development (“CITD”).
Astellia SA has agreed to guarantee, on a joint and several basis, the obligations of Astellia Telecom Spain toward CITD related to the loan for a maximum amount of €438K.
To date, no amount has been paid on this loan (maximum amount of €361K).
Astellia Afrique
Astellia SA guarantees the obligations of Astellia Afrique toward Arval, a supplier, in connection with the provision of a company car.
|
7.1.2.
|
Commitments received
|
|
·
|
OSEO guarantee on the Lebanese subsidiary:
|
The Company is the beneficiary of an OSEO guarantee, with respect to the “Fonds d'Etudes et d'Aides au Secteur privé” national guarantee fund, corresponding to 50% of the capital invested in its subsidiary over a period of 7 years.
The amount of the commission is 0.50% of paid-up capital.
Inception date: 14/03/2013.
40
Consolidated Financial Statements – Year ended 31/12/2017
|
·
|
OSEO guarantee for the Moroccan subsidiary:
|
The Company is the beneficiary of an OSEO guarantee, with respect to the “Fonds d'Etudes et d'Aides au Secteur privé” national guarantee fund, corresponding to 50% of the capital invested in its subsidiary over a period of 7 years.
The amount of the commission is 0.50% of paid-up capital.
Inception date: 01/04/2016.
|
7.2.
|
Segmented reporting
|
The group operates in the telecommunications sector, and more specifically in the mobile telecommunications sector. Therefore, there are no separate operating segments.
|
7.3.
|
Related entities
|
There have been no transactions with non-consolidated related entities.
|
7.4.
|
Management personnel
|
|
7.4.1.
|
Compensation awarded to members of administrative and management bodies
|
Gross compensation awarded to members of administrative and management bodies amounted to €742,026.
|
7.4.2.
|
Auditors’ fees
|
|
Auditors’ fees (K€)
|
Amount
|
|
|
Fees recognized during the period for the statutory financial statement audit
|
58
|
|
|
Total
|
58
|
41
Auditor' report on reconciliation of French GAAP to International Financial Reporting Standards (IFRS)
To the Board of Directors of Astellia S.A.
On April 11, 2017 and on April 18, 2018, we reported on the consolidated balance sheets of Astellia S.A (Astellia or the company) as at December 31, 2016 and 2017 and the consolidated statements of earnings, the consolidated statements of cash flows, and the consolidated statements of changes in equity for the years then ended which are included in the Business Acquisition Report (BAR) of EXFO Inc.
In connection with our audit of the aforementioned consolidated financial statements, we also have audited the related supplemental note entitled "French GAAP to International Financial Reporting Standards Reconciliation" included in the BAR. This supplemental note is the responsibility of the company's management. Our responsibility is to express an opinion on this supplemental note based on our audit.
In our opinion, such supplemental note, when considered in relation to the basic consolidated financial statements taken as a whole, presents fairly in all material respects the information set forth therein.
Morlaix, April 18, 2018
The Statutory Auditor,
MGA AUDIT
/s/ Michel Gouriten
Michel Gouriten
Astellia S.A.
French GAAP to International Financial Reporting Standards (IFRS) Reconciliation
(in thousands of euros)
On January 26, 2018, EXFO Inc. (EXFO), a Canadian publicly traded company, acquired majority interest in Astellia S.A. (Astellia, or the company), by way of public tender offer. As a requirement of the acquisition by EXFO, the company's audited consolidated financial statements must be included in a Business Acquisition Report (BAR) to be filed with the Canadian securities commissions. The BAR requires a reconciliation of French GAAP to IFRS as issued by the International Accounting Standard Board (IASB) reconciliation for the consolidated balance sheets and statements of earnings as at and for the years ended December 31, 2016 and 2017, with a description of each reconciliation adjustments.
Reconciliation of profit and loss
|
12/31/2017
|
12/31/2016
|
|||||||
|
Net loss in accordance with French GAAP
|
-6,393
|
-638
|
||||||
|
Add (deduct)
Revenue (a)
|
1,808
|
-1,095
|
||||||
|
Inventories (a)
|
-1,713
|
385
|
||||||
|
Installation costs (a)
|
-145
|
117
|
||||||
|
R&D expenses – other operating revenue (b)
|
-7,437
|
-6,911
|
||||||
|
Amortization of capitalized R&D expenses (b)
|
6,903
|
6,328
|
||||||
|
Unusual provision recovery (c)
|
-313
|
313
|
||||||
|
Deferred income taxes (d)
|
-168
|
312
|
||||||
|
Other
|
-28
|
65
|
||||||
|
Net loss in accordance with IFRS
|
-7,486
|
-1,124
|
||||||
Reconciliation of balance sheets
|
12/31/2017
|
12/31/2016
|
|||||||||||||||||||||||
|
French GAAP
|
Adjustments
|
IFRS
|
French GAAP
|
Adjustments
|
IFRS
|
|||||||||||||||||||
|
Assets
|
||||||||||||||||||||||||
|
Net R&D capitalized (b)
|
7,262
|
-7,262
|
‒
|
6,727
|
-6,727
|
‒
|
||||||||||||||||||
|
Inventories (a)
|
2,350
|
1,392
|
3,742
|
3,526
|
3,105
|
6,631
|
||||||||||||||||||
|
Prepaid expenses (a)
|
‒
|
949
|
949
|
‒
|
1,094
|
1,094
|
||||||||||||||||||
|
Total assets
|
48,080
|
-4,921
|
43,159
|
70,970
|
-2,528
|
68,442
|
||||||||||||||||||
|
Liabilities
|
||||||||||||||||||||||||
|
Pension and deferred taxes
|
‒
|
-32
|
-32
|
‒
|
-43
|
-43
|
||||||||||||||||||
|
Provisions (c)
|
‒
|
‒
|
‒
|
313
|
-313
|
‒
|
||||||||||||||||||
|
Deferred revenue (a)
|
1,046
|
3,568
|
4,614
|
1,826
|
5,376
|
7,202
|
||||||||||||||||||
|
Fiscal debt (d)
|
402
|
9
|
411
|
836
|
-7
|
829
|
||||||||||||||||||
|
Total liabilities
|
29,245
|
3,545
|
32,790
|
45,377
|
5,013
|
50,390
|
||||||||||||||||||
|
Retained earnings
|
-7,069
|
-8,466
|
-15,535
|
-3,833
|
-7,541
|
-11,374
|
||||||||||||||||||
|
a)
|
Revenue and related costs of good
|
In accordance with French GAAP, sales of third-party hardware and proprietary hardware within an integrated solution are recognized upon transfer of title of ownership. In accordance with IFRS, such sales are recognized upon final customer acceptance.
In accordance with French GAAP, related hardware is expensed upon shipment and related installation costs are expensed as incurred. In accordance with IFRS, related hardware and installation costs are expensed in the period in which the sale is recognised. Otherwise, they are accounted for as inventory or prepaid expenses.
|
b)
|
R&D expenses
|
In accordance with French GAAP, development costs are capitalized and amortized over the estimated benefit period. In accordance with IFRS, development costs are expensed as incurred, net of related tax credits and grants, unless they meet the recognition criteria of IAS 38, "Intangible Assets'', in which case they are capitalized, net of related tax credits and grants and amortized on a straight-line basis over the estimated benefit period. As at December 31, 2016 and 2017, the company had not capitalized any development costs under IFRS.
|
c)
|
Provisions
|
In accordance with French GAAP, costs for employees' future services can be accrued before such services are rendered. In accordance with IFRS, costs for employees' future services that will benefit the company in future periods must be expensed as incurred.
|
d)
|
Income taxes
|
The tax effect of the reconciliation items described above is included in the reconciliation.
Serious News for Serious Traders! Try StreetInsider.com Premium Free!
You May Also Be Interested In
- ACTG Announces Launch of Clinical Trial Evaluating Combination of Three Novel Immune-based Therapies for HIV Cure
- Qualcomm Schedules Second Quarter Fiscal 2024 Earnings Release and Conference Call
- Rodedawg Intl. Ind, Inc. (OTC: RWGI) Provides 2nd Quarter Company Milestone Updates for April 2024
Create E-mail Alert Related Categories
SEC FilingsSign up for StreetInsider Free!
Receive full access to all new and archived articles, unlimited portfolio tracking, e-mail alerts, custom newswires and RSS feeds - and more!
