

Form 6-K Crescent Point Energy For: Mar 31
 Tweet
Tweet Share
ShareSECURITIES AND EXCHANGE COMMISSION
Washington, D.C. 20549
______________________________
F O R M 6-K
REPORT OF FOREIGN PRIVATE ISSUER PURSUANT TO RULE 13a-16 OR 15d-16 UNDER THE
SECURITIES EXCHANGE ACT OF 1934
For the month of
May 2021
Commission File Number 001-36258
Crescent Point Energy Corp.
(Name of Registrant)
Suite 2000, 585 - 8th Avenue S.W.
Calgary, Alberta, T2P 1G1
(Address of Principal Executive Office)
Indicate by check mark whether the registrant files or will file annual reports under cover of Form 20-F or Form 40-F.
Form 20-F ¨ Form 40-F x
Indicate by check mark if the registrant is submitting the Form 6-K in paper as permitted by Regulation S-T Rule 101(b)(1): ¨
Indicate by check mark if the registrant is submitting the Form 6-K in paper as permitted by Regulation S-T Rule 101(b)(7): ¨
Indicate by check mark whether by furnishing the information contained in this Form, the registrant is also thereby furnishing the information to the Commission pursuant to Rule 12g3-2(b) under the Securities Exchange Act of 1934.
Yes ¨ No x
If "Yes" is marked, indicate below the file number assigned to the registrant in connection with Rule 12g3-2(b): 82- ________
The following documents attached as exhibits to this Form 6-K: Exhibit 99.1, the Interim Consolidated Financial Statements (unaudited) for the period ended March 31, 2021; and Exhibit 99.2, the Company's Management's Discussion and Analysis for the period ended March 31, 2021, shall be deemed to be filed with and shall be incorporated by reference into the Company's Registration Statements on Form F-3D (File No. 333-205592) and Form S-8 (File No. 333-226210).
The following documents attached as exhibits hereto are incorporated by reference herein:
| Exhibit No. | Description | ||||
| 99.1 | Interim Consolidated Financial Statements (unaudited) for the period ended March 31, 2021. | ||||
| 99.2 | Management's Discussion and Analysis for the period ended March 31, 2021. | ||||
| 99.3 | Certification of Interim Filings (Form 52-109F2) – Chief Executive Officer. | ||||
| 99.4 | Certification of Interim Filings (Form 52-109F2) – Chief Financial Officer. | ||||
SIGNATURE
Pursuant to the requirements of the Securities Exchange Act of 1934, the registrant has duly caused this report to be signed on its behalf by the undersigned, thereunto duly authorized.
| Crescent Point Energy Corp. | |||||||||||
| (Registrant) | |||||||||||
| By: | /s/ Ken Lamont | ||||||||||
| Name: | Ken Lamont | ||||||||||
| Title: | Chief Financial Officer | ||||||||||
Date: May 12, 2021
EXHIBITS
| Interim Consolidated Financial Statements (unaudited) for the period ended March 31, 2021. | |||||
| Management's Discussion and Analysis for the period ended March 31, 2021. | |||||
| Certification of Interim Filings (Form 52-109F2) – Chief Executive Officer. | |||||
| Certification of Interim Filings (Form 52-109F2) – Chief Financial Officer. | |||||
Exhibit 99.1
CONSOLIDATED BALANCE SHEETS
| As at | |||||||||||||||||
| March 31, | December 31, | ||||||||||||||||
| (UNAUDITED) (Cdn$ millions) | Notes | 2021 | 2020 | ||||||||||||||
| ASSETS | |||||||||||||||||
| Cash | 24.0 | 8.8 | |||||||||||||||
| Accounts receivable | 251.2 | 200.5 | |||||||||||||||
| Deposit on acquisition | 20 | 45.0 | — | ||||||||||||||
| Prepaids and deposits | 21.0 | 22.7 | |||||||||||||||
| Derivative asset | 17 | 37.1 | 46.7 | ||||||||||||||
| Total current assets | 378.3 | 278.7 | |||||||||||||||
| Derivative asset | 17 | 195.1 | 195.7 | ||||||||||||||
| Other long-term assets | 20.4 | 18.2 | |||||||||||||||
| Exploration and evaluation | 3, 4 | 70.2 | 86.4 | ||||||||||||||
| Property, plant and equipment | 4, 5 | 4,268.8 | 4,372.0 | ||||||||||||||
| Right-of-use asset | 7 | 99.4 | 103.7 | ||||||||||||||
| Goodwill | 222.2 | 223.3 | |||||||||||||||
| Deferred income tax | 1,356.3 | 1,367.9 | |||||||||||||||
| Total assets | 6,610.7 | 6,645.9 | |||||||||||||||
| LIABILITIES | |||||||||||||||||
| Accounts payable and accrued liabilities | 369.0 | 311.6 | |||||||||||||||
| Current portion of long-term debt | 6 | 219.1 | 221.6 | ||||||||||||||
| Derivative liability | 17 | 112.6 | 42.2 | ||||||||||||||
| Other current liabilities | 105.2 | 93.8 | |||||||||||||||
| Total current liabilities | 805.9 | 669.2 | |||||||||||||||
| Long-term debt | 6 | 1,930.3 | 2,038.0 | ||||||||||||||
| Derivative liability | 17 | 4.3 | 3.2 | ||||||||||||||
| Other long-term liabilities | 26.1 | 17.3 | |||||||||||||||
| Lease liability | 7 | 125.7 | 130.1 | ||||||||||||||
| Decommissioning liability | 8 | 885.2 | 965.3 | ||||||||||||||
| Total liabilities | 3,777.5 | 3,823.1 | |||||||||||||||
| SHAREHOLDERS’ EQUITY | |||||||||||||||||
| Shareholders’ capital | 9 | 16,454.0 | 16,451.5 | ||||||||||||||
| Contributed surplus | 18.8 | 19.7 | |||||||||||||||
| Deficit | 10 | (14,145.7) | (14,166.1) | ||||||||||||||
| Accumulated other comprehensive income | 506.1 | 517.7 | |||||||||||||||
| Total shareholders' equity | 2,833.2 | 2,822.8 | |||||||||||||||
| Total liabilities and shareholders' equity | 6,610.7 | 6,645.9 | |||||||||||||||
Subsequent Events (Note 20)
See accompanying notes to the consolidated financial statements.
| CRESCENT POINT ENERGY CORP. | 1 | ||||
CONSOLIDATED STATEMENTS OF COMPREHENSIVE INCOME
| Three months ended March 31 | |||||||||||||||||
| (UNAUDITED) (Cdn$ millions, except per share and shares outstanding amounts) | Notes | 2021 | 2020 | ||||||||||||||
| REVENUE AND OTHER INCOME | |||||||||||||||||
Oil and gas sales | 19 | 630.2 | 548.4 | ||||||||||||||
Purchased product sales | 3.0 | 11.3 | |||||||||||||||
Royalties | (85.7) | (73.0) | |||||||||||||||
| Oil and gas revenue | 547.5 | 486.7 | |||||||||||||||
| Commodity derivative gains (losses) | 12, 17 | (142.9) | 314.9 | ||||||||||||||
| Other income (loss) | 13 | (7.7) | 303.5 | ||||||||||||||
| 396.9 | 1,105.1 | ||||||||||||||||
| EXPENSES | |||||||||||||||||
| Operating | 142.6 | 158.3 | |||||||||||||||
| Purchased product | 3.1 | 8.6 | |||||||||||||||
| Transportation | 25.1 | 28.8 | |||||||||||||||
| General and administrative | 15.2 | 24.5 | |||||||||||||||
| Interest | 14 | 23.8 | 9.5 | ||||||||||||||
| Foreign exchange gain | 15 | (1.4) | (8.8) | ||||||||||||||
| Share-based compensation | 4.4 | (8.1) | |||||||||||||||
| Depletion, depreciation, amortization and impairment | 3, 5, 7 | 150.6 | 3,814.7 | ||||||||||||||
| Accretion and financing | 7, 8 | 4.8 | 6.9 | ||||||||||||||
| 368.2 | 4,034.4 | ||||||||||||||||
| Net income (loss) before tax | 28.7 | (2,929.3) | |||||||||||||||
| Tax expense (recovery) | |||||||||||||||||
Current | — | — | |||||||||||||||
Deferred | 7.0 | (605.2) | |||||||||||||||
| Net income (loss) | 21.7 | (2,324.1) | |||||||||||||||
| Other comprehensive income (loss) | |||||||||||||||||
| Items that may be subsequently reclassified to profit or loss | |||||||||||||||||
Foreign currency translation of foreign operations | (11.6) | 112.9 | |||||||||||||||
| Comprehensive income (loss) | 10.1 | (2,211.2) | |||||||||||||||
| Net income (loss) per share | |||||||||||||||||
Basic | 0.04 | (4.40) | |||||||||||||||
Diluted | 0.04 | (4.40) | |||||||||||||||
| Weighted average shares outstanding | |||||||||||||||||
Basic | 530,354,244 | 528,284,435 | |||||||||||||||
Diluted | 536,573,892 | 528,284,435 | |||||||||||||||
See accompanying notes to the consolidated financial statements.
| CRESCENT POINT ENERGY CORP. | 2 | ||||
CONSOLIDATED STATEMENTS OF CHANGES IN SHAREHOLDERS' EQUITY
(UNAUDITED) (Cdn$ millions, except per share amounts) | Notes | Shareholders’ capital | Contributed surplus | Deficit | Accumulated other comprehensive income | Total shareholders’ equity | |||||||||||||||||||||||||||||
| December 31, 2020 | 16,451.5 | 19.7 | (14,166.1) | 517.7 | 2,822.8 | ||||||||||||||||||||||||||||||
| Redemption of restricted shares | 9 | 2.5 | (2.5) | — | |||||||||||||||||||||||||||||||
| Share-based compensation | 16 | 1.6 | 1.6 | ||||||||||||||||||||||||||||||||
| Net income (loss) | 21.7 | 21.7 | |||||||||||||||||||||||||||||||||
Dividends ($0.0025 per share) | (1.3) | (1.3) | |||||||||||||||||||||||||||||||||
| Foreign currency translation adjustment | (11.6) | (11.6) | |||||||||||||||||||||||||||||||||
| March 31, 2021 | 16,454.0 | 18.8 | (14,145.7) | 506.1 | 2,833.2 | ||||||||||||||||||||||||||||||
| December 31, 2019 | 16,449.0 | 35.1 | (11,636.9) | 495.5 | 5,342.7 | ||||||||||||||||||||||||||||||
| Redemption of restricted shares | 6.9 | (7.0) | 0.1 | — | |||||||||||||||||||||||||||||||
| Common shares repurchased | (12.7) | (12.7) | |||||||||||||||||||||||||||||||||
| Forfeit of restricted shares | (1.4) | (1.4) | |||||||||||||||||||||||||||||||||
| Net income (loss) | (2,324.1) | (2,324.1) | |||||||||||||||||||||||||||||||||
Dividends ($0.0100 per share) | (5.3) | (5.3) | |||||||||||||||||||||||||||||||||
| Foreign currency translation adjustment | 112.9 | 112.9 | |||||||||||||||||||||||||||||||||
| March 31, 2020 | 16,443.2 | 26.7 | (13,966.2) | 608.4 | 3,112.1 | ||||||||||||||||||||||||||||||
See accompanying notes to the consolidated financial statements.
| CRESCENT POINT ENERGY CORP. | 3 | ||||
CONSOLIDATED STATEMENTS OF CASH FLOWS
| Three months ended March 31 | ||||||||||||||||||||
(UNAUDITED) (Cdn$ millions) | Notes | 2021 | 2020 | |||||||||||||||||
| CASH PROVIDED BY (USED IN) OPERATING ACTIVITIES | ||||||||||||||||||||
Net income (loss) | 21.7 | (2,324.1) | ||||||||||||||||||
Items not affecting cash | ||||||||||||||||||||
Other (income) loss | 9.0 | (302.0) | ||||||||||||||||||
Deferred tax expense (recovery) | 7.0 | (605.2) | ||||||||||||||||||
Share-based compensation | 1.4 | (1.0) | ||||||||||||||||||
Depletion, depreciation, amortization and impairment | 3, 5, 7 | 150.6 | 3,814.7 | |||||||||||||||||
Accretion | 8 | 3.1 | 5.0 | |||||||||||||||||
Unrealized (gain) loss on derivatives | 17 | 81.7 | (418.5) | |||||||||||||||||
Translation of US dollar long-term debt | 15 | (25.5) | 197.9 | |||||||||||||||||
Realized (gain) loss on cross currency swap maturity | 15 | 13.6 | (62.0) | |||||||||||||||||
Decommissioning expenditures | 8 | (6.1) | (8.6) | |||||||||||||||||
Change in non-cash working capital | 18 | 47.2 | 33.1 | |||||||||||||||||
| 303.7 | 329.3 | |||||||||||||||||||
| INVESTING ACTIVITIES | ||||||||||||||||||||
Development capital and other expenditures | 3, 5 | (134.4) | (331.5) | |||||||||||||||||
Capital acquisitions | — | (1.4) | ||||||||||||||||||
Capital dispositions | 4 | 7.2 | 506.9 | |||||||||||||||||
Deposit on acquisition | 20 | (45.0) | — | |||||||||||||||||
Change in non-cash working capital | 18 | (11.2) | (16.2) | |||||||||||||||||
| (183.4) | 157.8 | |||||||||||||||||||
| FINANCING ACTIVITIES | ||||||||||||||||||||
Issue of shares, net of issue costs | — | (0.1) | ||||||||||||||||||
Common shares repurchased | — | (12.7) | ||||||||||||||||||
Decrease in bank debt, net | 18 | (84.7) | (337.5) | |||||||||||||||||
Repayment of senior guaranteed notes | — | (224.4) | ||||||||||||||||||
Realized gain (loss) on cross currency swap maturity | 15, 18 | (13.6) | 62.0 | |||||||||||||||||
Payments on principal portion of lease liability | 7, 18 | (5.1) | (7.9) | |||||||||||||||||
Cash dividends | 18 | (1.3) | (5.3) | |||||||||||||||||
| (104.7) | (525.9) | |||||||||||||||||||
Impact of foreign currency on cash balances | (0.4) | 1.5 | ||||||||||||||||||
| INCREASE (DECREASE) IN CASH | 15.2 | (37.3) | ||||||||||||||||||
| CASH AT BEGINNING OF PERIOD | 8.8 | 56.9 | ||||||||||||||||||
| CASH AT END OF PERIOD | 24.0 | 19.6 | ||||||||||||||||||
See accompanying notes to the consolidated financial statements.
Supplementary Information:
Cash taxes paid | — | (0.1) | ||||||||||||
Cash interest paid | (5.7) | (12.8) | ||||||||||||
| CRESCENT POINT ENERGY CORP. | 4 | ||||
NOTES TO CONSOLIDATED FINANCIAL STATEMENTS
March 31, 2021 (UNAUDITED)
1.STRUCTURE OF THE BUSINESS
The principal undertaking of Crescent Point Energy Corp. (the “Company” or “Crescent Point”) is to carry on the business of acquiring, developing and holding interests in petroleum and natural gas properties and assets related thereto through a general partnership and wholly owned subsidiaries.
Crescent Point is the ultimate parent and is amalgamated in Alberta, Canada under the Alberta Business Corporations Act. The address of the principal place of business is 2000, 585 - 8th Ave S.W., Calgary, Alberta, Canada, T2P 1G1.
These interim consolidated financial statements were approved and authorized for issue by the Company's Board of Directors on May 11, 2021.
2.BASIS OF PREPARATION
These interim consolidated financial statements are presented under International Financial Reporting Standards (“IFRS”), as issued by the International Accounting Standards Board (“IASB”). These interim consolidated financial statements have been prepared in accordance with IFRS applicable to the preparation of interim consolidated financial statements, including International Accounting Standard (“IAS”) 34 Interim Financial Reporting and have been prepared following the same accounting policies as the annual consolidated financial statements for the year ended December 31, 2020. Certain information and disclosures included in the notes to the annual consolidated financial statements are condensed herein or are disclosed on an annual basis only. Accordingly, these interim consolidated financial statements should be read in conjunction with the annual consolidated financial statements for the year ended December 31, 2020.
The policies applied in these consolidated financial statements are based on IFRS issued and outstanding as of May 11, 2021, the date the Board of Directors approved the statements.
The Company’s presentation currency is Canadian dollars and all amounts reported are Canadian dollars unless noted otherwise. References to “US$” are to United States ("U.S.") dollars.
3.EXPLORATION AND EVALUATION ASSETS
($ millions) | March 31, 2021 | December 31, 2020 | ||||||||||||
Exploration and evaluation assets at cost | 1,721.0 | 1,736.1 | ||||||||||||
Accumulated amortization | (1,650.8) | (1,649.7) | ||||||||||||
Net carrying amount | 70.2 | 86.4 | ||||||||||||
Reconciliation of movements during the period | ||||||||||||||
Cost, beginning of period | 1,736.1 | 1,848.1 | ||||||||||||
Accumulated amortization, beginning of period | (1,649.7) | (1,602.6) | ||||||||||||
Net carrying amount, beginning of period | 86.4 | 245.5 | ||||||||||||
Net carrying amount, beginning of period | 86.4 | 245.5 | ||||||||||||
Acquisitions through business combinations, net | — | 1.3 | ||||||||||||
Additions | 18.5 | 108.2 | ||||||||||||
Dispositions | (5.3) | (0.2) | ||||||||||||
Transfers to property, plant and equipment | (15.4) | (198.0) | ||||||||||||
Amortization | (13.8) | (71.9) | ||||||||||||
Foreign exchange | (0.2) | 1.5 | ||||||||||||
Net carrying amount, end of period | 70.2 | 86.4 | ||||||||||||
Impairment test of exploration and evaluation assets
There were no indicators of impairment at March 31, 2021.
| CRESCENT POINT ENERGY CORP. | 5 | ||||
4.CAPITAL ACQUISITIONS AND DISPOSITIONS
In the three months ended March 31, 2021, the Company incurred $0.1 million (three months ended March 31, 2020 - $4.7 million) of transaction costs related to acquisitions through business combinations and dispositions that were recorded as general and administrative expenses.
Minor property dispositions
In the three months ended March 31, 2021, the Company completed minor property dispositions for net consideration of $7.2 million, resulting in a loss of $17.3 million.
| ($ millions) | Other minor, net | ||||||||||
| Dispositions | |||||||||||
| Consideration | |||||||||||
| Cash | 7.2 | ||||||||||
| 7.2 | |||||||||||
| Carrying Value | |||||||||||
| Exploration and evaluation | (5.3) | ||||||||||
| Property, plant and equipment | (18.9) | ||||||||||
| Goodwill | (1.1) | ||||||||||
| Decommissioning liability | 0.8 | ||||||||||
| (24.5) | |||||||||||
| Loss on capital dispositions | (17.3) | ||||||||||
| CRESCENT POINT ENERGY CORP. | 6 | ||||
5.PROPERTY, PLANT AND EQUIPMENT
($ millions) | March 31, 2021 | December 31, 2020 | ||||||||||||
Development and production assets | 23,546.3 | 23,584.1 | ||||||||||||
Corporate assets | 121.4 | 120.7 | ||||||||||||
Property, plant and equipment at cost | 23,667.7 | 23,704.8 | ||||||||||||
Accumulated depletion, depreciation and impairment | (19,398.9) | (19,332.8) | ||||||||||||
Net carrying amount | 4,268.8 | 4,372.0 | ||||||||||||
Reconciliation of movements during the period | ||||||||||||||
Development and production assets | ||||||||||||||
Cost, beginning of period | 23,584.1 | 23,038.6 | ||||||||||||
Accumulated depletion and impairment, beginning of period | (19,265.2) | (15,251.0) | ||||||||||||
Net carrying amount, beginning of period | 4,318.9 | 7,787.6 | ||||||||||||
Net carrying amount, beginning of period | 4,318.9 | 7,787.6 | ||||||||||||
Acquisitions through business combinations, net | — | 0.2 | ||||||||||||
Additions | 39.1 | 504.2 | ||||||||||||
Dispositions, net | (18.9) | (28.0) | ||||||||||||
Transfers from exploration and evaluation assets | 15.4 | 198.0 | ||||||||||||
Depletion | (131.2) | (611.6) | ||||||||||||
Impairment | — | (3,557.8) | ||||||||||||
Foreign exchange | (7.3) | 26.3 | ||||||||||||
Net carrying amount, end of period | 4,216.0 | 4,318.9 | ||||||||||||
Cost, end of period | 23,546.3 | 23,584.1 | ||||||||||||
Accumulated depletion and impairment, end of period | (19,330.3) | (19,265.2) | ||||||||||||
Net carrying amount, end of period | 4,216.0 | 4,318.9 | ||||||||||||
Corporate assets | ||||||||||||||
Cost, beginning of period | 120.7 | 117.2 | ||||||||||||
Accumulated depreciation, beginning of period | (67.6) | (63.2) | ||||||||||||
Net carrying amount, beginning of period | 53.1 | 54.0 | ||||||||||||
Net carrying amount, beginning of period | 53.1 | 54.0 | ||||||||||||
Additions | 0.7 | 3.5 | ||||||||||||
Depreciation | (1.0) | (4.4) | ||||||||||||
Net carrying amount, end of period | 52.8 | 53.1 | ||||||||||||
Cost, end of period | 121.4 | 120.7 | ||||||||||||
Accumulated depreciation, end of period | (68.6) | (67.6) | ||||||||||||
Net carrying amount, end of period | 52.8 | 53.1 | ||||||||||||
Direct general and administrative costs capitalized by the Company during the three months ended March 31, 2021 were $13.8 million (year ended December 31, 2020 - $37.7 million), including $6.5 million of share-based compensation costs (year ended December 31, 2020 - $5.4 million).
Impairment test of property, plant and equipment ("PP&E")
At March 31, 2021, there were no indicators of impairment or impairment recovery.
| CRESCENT POINT ENERGY CORP. | 7 | ||||
6.LONG-TERM DEBT
| ($ millions) | March 31, 2021 | December 31, 2020 | ||||||||||||
Bank debt (1) | 301.0 | 388.2 | ||||||||||||
Senior guaranteed notes (2) | 1,848.4 | 1,871.4 | ||||||||||||
| Long-term debt | 2,149.4 | 2,259.6 | ||||||||||||
Long-term debt due within one year | 219.1 | 221.6 | ||||||||||||
| Long-term debt due beyond one year | 1,930.3 | 2,038.0 | ||||||||||||
(1)The Company has London Inter-bank Offered Rate ("LIBOR") loans under its bank credit facilities. The US dollar amounts of the LIBOR loans were fixed for purposes of interest and principal repayments. At March 31, 2021, the total notional amount due upon bank debt maturity was $300.8 million (December 31, 2020 - $399.1 million). The Interest Rate Benchmark Reform Phase II amendments, effective January 1, 2021, is not expected to have a financial impact on the Company's results. Upon cessation of LIBOR rates, the Company will transition to alternative benchmark rates.
(2)The Company entered into cross currency swaps ("CCS") and a foreign exchange swap concurrent with the issuance of the US dollar senior guaranteed notes to fix the US dollar amount of the notes for the purpose of principal repayment at Canadian dollar notional amounts. At March 31, 2021, the total notional principal due on the maturity of the senior guaranteed notes was $1.66 billion (December 31, 2020 - $1.66 billion) of which $185.3 million (December 31, 2020 - $185.3 million) was due within one year.
Bank debt
The Company has combined facilities of $3.00 billion, including a $2.90 billion syndicated unsecured credit facility with fourteen banks and a $100.0 million unsecured operating credit facility with one Canadian chartered bank. The current maturity dates of the facilities is October 25, 2023. Both of these facilities constitute revolving credit facilities and are extendible annually.
The credit facilities bear interest at the applicable market rate plus a margin based on a sliding scale ratio of the Company's senior debt to earnings before interest, taxes, depletion, depreciation, amortization and impairment, adjusted for payments on lease liability and certain non-cash items including unrealized derivatives, translation of US dollar long-term debt, equity-settled share-based compensation expense and accretion and financing expense ("adjusted EBITDA").
The credit facilities and senior guaranteed notes have covenants which restrict the Company's ratio of senior debt to adjusted EBITDA to a maximum of 3.5:1.0, the ratio of total debt to adjusted EBITDA to a maximum of 4.0:1.0 and the ratio of senior debt to capital, adjusted for certain non-cash items as noted above, to a maximum of 0.55:1.0. The Company was in compliance with all debt covenants at March 31, 2021.
The Company had letters of credit in the amount of $5.0 million outstanding at March 31, 2021 (December 31, 2020 - $10.4 million).
| CRESCENT POINT ENERGY CORP. | 8 | ||||
Senior guaranteed notes
The Company has closed private offerings of senior guaranteed notes raising total gross proceeds of US$1.26 billion and Cdn$270.0 million. The notes are unsecured and rank pari passu with the Company's bank credit facilities and carry a bullet repayment on maturity. The senior guaranteed notes have financial covenants similar to those of the combined credit facilities described above. The Company's senior guaranteed notes are detailed below:
| Principal ($ millions) | Coupon Rate | Hedged Equivalent (1) (Cdn$ millions) | Interest Payment Dates | Maturity Date | Financial statement carrying value | |||||||||||||||||||||
| March 31, 2021 | December 31, 2020 | |||||||||||||||||||||||||
| Cdn$50.0 | 5.53 | % | 50.0 | October 14 and April 14 | April 14, 2021 | 50.0 | 50.0 | |||||||||||||||||||
| US$82.0 | 5.13 | % | 79.0 | October 14 and April 14 | April 14, 2021 | 103.1 | 104.6 | |||||||||||||||||||
| US$52.5 | 3.29 | % | 56.3 | December 20 and June 20 | June 20, 2021 | 66.0 | 67.0 | |||||||||||||||||||
| Cdn$25.0 | 4.76 | % | 25.0 | November 22 and May 22 | May 22, 2022 | 25.0 | 25.0 | |||||||||||||||||||
| US$200.0 | 4.00 | % | 199.1 | November 22 and May 22 | May 22, 2022 | 251.4 | 255.1 | |||||||||||||||||||
| US$61.5 | 4.12 | % | 80.3 | October 11 and April 11 | April 11, 2023 | 77.3 | 78.4 | |||||||||||||||||||
| Cdn$80.0 | 3.58 | % | 80.0 | October 11 and April 11 | April 11, 2023 | 80.0 | 80.0 | |||||||||||||||||||
| Cdn$10.0 | 4.11 | % | 10.0 | December 12 and June 12 | June 12, 2023 | 10.0 | 10.0 | |||||||||||||||||||
| US$270.0 | 3.78 | % | 274.7 | December 12 and June 12 | June 12, 2023 | 339.4 | 344.4 | |||||||||||||||||||
| Cdn$40.0 | 3.85 | % | 40.0 | December 20 and June 20 | June 20, 2024 | 40.0 | 40.0 | |||||||||||||||||||
| US$257.5 | 3.75 | % | 276.4 | December 20 and June 20 | June 20, 2024 | 323.7 | 328.4 | |||||||||||||||||||
| US$82.0 | 4.30 | % | 107.0 | October 11 and April 11 | April 11, 2025 | 103.1 | 104.6 | |||||||||||||||||||
| Cdn$65.0 | 3.94 | % | 65.0 | October 22 and April 22 | April 22, 2025 | 65.0 | 65.0 | |||||||||||||||||||
| US$230.0 | 4.08 | % | 291.1 | October 22 and April 22 | April 22, 2025 | 289.2 | 293.4 | |||||||||||||||||||
| US$20.0 | 4.18 | % | 25.3 | October 22 and April 22 | April 22, 2027 | 25.2 | 25.5 | |||||||||||||||||||
| Senior guaranteed notes | 1,659.2 | 1,848.4 | 1,871.4 | |||||||||||||||||||||||
| Senior guaranteed notes due within one year | 219.1 | 221.6 | ||||||||||||||||||||||||
| Senior guaranteed notes due beyond one year | 1,629.3 | 1,649.8 | ||||||||||||||||||||||||
(1)Includes underlying derivatives which manage the Company's foreign exchange exposure on its US dollar senior guaranteed notes. The Company considers this to be the economic amount due at maturity instead of the financial statement carrying amount.
Concurrent with the issuance of US$1.23 billion senior guaranteed notes, the Company entered into CCS to manage the Company's foreign exchange risk. The CCS fix the US dollar amount of the notes for purposes of interest and principal repayments at a notional amount of $1.36 billion. Concurrent with the issuance of US$30.0 million senior guaranteed notes, the Company entered a foreign exchange swap which fixed the principal repayment at a notional amount of $32.2 million. See Note 17 - “Financial Instruments and Derivatives” for additional information.
| CRESCENT POINT ENERGY CORP. | 9 | ||||
7.LEASES
Right-of-use asset
| ($ millions) | Office (1) | Fleet Vehicles | Other | Total | ||||||||||||||||||||||
| Right-of-use asset at cost | 121.0 | 20.3 | 12.0 | 153.3 | ||||||||||||||||||||||
| Accumulated depreciation | (35.4) | (13.1) | (5.4) | (53.9) | ||||||||||||||||||||||
| Net carrying amount | 85.6 | 7.2 | 6.6 | 99.4 | ||||||||||||||||||||||
Reconciliation of movements during the period | ||||||||||||||||||||||||||
| Cost, beginning of period | 121.0 | 20.4 | 11.6 | 153.0 | ||||||||||||||||||||||
| Accumulated depreciation, beginning of period | (32.5) | (12.0) | (4.8) | (49.3) | ||||||||||||||||||||||
| Net carrying amount, beginning of period | 88.5 | 8.4 | 6.8 | 103.7 | ||||||||||||||||||||||
| Net carrying amount, beginning of period | 88.5 | 8.4 | 6.8 | 103.7 | ||||||||||||||||||||||
| Additions | — | (0.1) | 0.4 | 0.3 | ||||||||||||||||||||||
| Depreciation | (2.9) | (1.1) | (0.6) | (4.6) | ||||||||||||||||||||||
| Net carrying amount, end of period | 85.6 | 7.2 | 6.6 | 99.4 | ||||||||||||||||||||||
(1)A portion of the Company's office space is subleased. During the three months ended March 31, 2021, the Company recorded sublease income of $1.4 million (three months ended March 31, 2020 - $1.5 million) as a component of other income (loss).
Lease liability
| ($ millions) | March 31, 2021 | December 31, 2020 | ||||||||||||
Lease liability, beginning of period | 156.5 | 181.2 | ||||||||||||
| Additions | 0.3 | 4.8 | ||||||||||||
| Financing | 1.7 | 7.1 | ||||||||||||
Payments on lease liability | (6.8) | (37.1) | ||||||||||||
| Lease modification | — | 0.5 | ||||||||||||
| Lease liability, end of period | 151.7 | 156.5 | ||||||||||||
| Expected to be incurred within one year | 26.0 | 26.4 | ||||||||||||
| Expected to be incurred beyond one year | 125.7 | 130.1 | ||||||||||||
Some leases contain variable payments that are not included within the lease liability as they are based on amounts determined by the lessor annually and not dependent on an index or rate. For the three months ended March 31, 2021, variable lease payments of $0.4 million were included in general and administrative expenses relating to property tax payments on office leases.
During the three months ended March 31, 2021, the Company recorded $0.1 million in general and administrative expenses related to short-term leases and leases for low dollar value underlying assets.
The undiscounted cash flows relating to the lease liability are as follows:
| ($ millions) | March 31, 2021 | |||||||
1 year | 26.6 | |||||||
| 2 to 3 years | 44.8 | |||||||
| 4 to 5 years | 36.3 | |||||||
More than 5 years | 71.7 | |||||||
Total (1) | 179.4 | |||||||
(1)Includes both the principal and amounts representing interest.
| CRESCENT POINT ENERGY CORP. | 10 | ||||
8.DECOMMISSIONING LIABILITY
Upon retirement of its oil and gas assets, the Company anticipates substantial costs associated with decommissioning. The estimated cash flows have been discounted using a risk-free rate of 1.97 percent and a derived inflation rate of 1.69 percent (December 31, 2020 - risk-free rate of 1.21 percent and inflation rate of 1.49 percent).
($ millions) | March 31, 2021 | December 31, 2020 | ||||||||||||
Decommissioning liability, beginning of period | 1,022.7 | 1,144.0 | ||||||||||||
Liabilities incurred | 4.3 | 17.2 | ||||||||||||
Liabilities acquired through capital acquisitions | — | 0.1 | ||||||||||||
Liabilities disposed through capital dispositions | (0.8) | (31.1) | ||||||||||||
Liabilities settled (1) | (12.2) | (19.8) | ||||||||||||
Revaluation of acquired decommissioning liabilities (2) | — | 0.3 | ||||||||||||
Change in estimated future costs | (0.6) | (105.8) | ||||||||||||
Change in discount and inflation rate estimates | (80.1) | 4.6 | ||||||||||||
Accretion expense | 3.1 | 13.6 | ||||||||||||
Foreign exchange | (0.2) | (0.4) | ||||||||||||
Decommissioning liability, end of period | 936.2 | 1,022.7 | ||||||||||||
Expected to be incurred within one year | 51.0 | 57.4 | ||||||||||||
Expected to be incurred beyond one year | 885.2 | 965.3 | ||||||||||||
(1)Includes $6.1 million received from government subsidy programs during the three months ended March 31, 2021 (year ended December 31, 2020 - $5.1 million).
(2)These amounts relate to the revaluation of acquired decommissioning liabilities at the end of the period using a risk-free discount rate. At the date of acquisition, acquired decommissioning liabilities are fair valued.
9.SHAREHOLDERS' CAPITAL
Crescent Point has an unlimited number of common shares authorized for issuance.
| March 31, 2021 | December 31, 2020 | |||||||||||||||||||||||||
Number of shares | Amount ($ millions) | Number of shares | Amount ($ millions) | |||||||||||||||||||||||
Common shares, beginning of period | 530,035,922 | 16,707.6 | 529,399,923 | 16,705.1 | ||||||||||||||||||||||
Issued on redemption of restricted shares | 328,594 | 2.5 | 2,801,599 | 15.2 | ||||||||||||||||||||||
| Issued on exercise of stock options | 4,253 | — | — | — | ||||||||||||||||||||||
Common shares repurchased | — | — | (2,165,600) | (12.7) | ||||||||||||||||||||||
Common shares, end of period | 530,368,769 | 16,710.1 | 530,035,922 | 16,707.6 | ||||||||||||||||||||||
Cumulative share issue costs, net of tax | — | (256.1) | — | (256.1) | ||||||||||||||||||||||
Total shareholders’ capital, end of period | 530,368,769 | 16,454.0 | 530,035,922 | 16,451.5 | ||||||||||||||||||||||
Normal Course Issuer Bid ("NCIB")
On March 5, 2021, the Company announced the approval by the Toronto Stock Exchange of its notice to implement a NCIB. The NCIB allows the Company to purchase, for cancellation, up to 26,462,509 common shares, or five percent of the Company's public float, as at February 26, 2021. The NCIB commenced on March 9, 2021 and is due to expire on March 8, 2022. The Company continues to evaluate returns to shareholders as market conditions permit in the context of its capital allocation framework, leverage targets and adjusted funds flow generation.
10.DEFICIT
| ($ millions) | March 31, 2021 | December 31, 2020 | ||||||||||||
Accumulated earnings (deficit) | (6,526.4) | (6,548.1) | ||||||||||||
Accumulated gain on shares issued pursuant to DRIP (1) and SDP (2) | 8.4 | 8.4 | ||||||||||||
Accumulated tax effect on redemption of restricted shares | 12.1 | 12.1 | ||||||||||||
Accumulated dividends | (7,639.8) | (7,638.5) | ||||||||||||
| Deficit | (14,145.7) | (14,166.1) | ||||||||||||
(1)Premium Dividend TM and Dividend Reinvestment Plan.
(2)Share Dividend Plan.
| CRESCENT POINT ENERGY CORP. | 11 | ||||
11.CAPITAL MANAGEMENT
| ($ millions) | March 31, 2021 | December 31, 2020 | ||||||||||||
Long-term debt (1) | 2,149.4 | 2,259.6 | ||||||||||||
Adjusted working capital deficiency (2) | 55.9 | 93.4 | ||||||||||||
| Unrealized foreign exchange on translation of US dollar long-term debt | (191.9) | (203.8) | ||||||||||||
| Net debt | 2,013.4 | 2,149.2 | ||||||||||||
| Shareholders’ equity | 2,833.2 | 2,822.8 | ||||||||||||
| Total capitalization | 4,846.6 | 4,972.0 | ||||||||||||
(1)Includes current portion of long-term debt.
(2)Adjusted working capital deficiency is calculated as accounts payable and accrued liabilities and long-term compensation liability net of equity derivative contracts, less cash, accounts receivable, prepaids and deposits, including deposit on acquisition and long-term investments.
The following table reconciles cash flow from operating activities to adjusted funds flow from operations for the three months ended March 31, 2021 and March 31, 2020:
| ($ millions) | March 31, 2021 | March 31, 2020 | ||||||||||||
| Cash flow from operating activities | 303.7 | 329.3 | ||||||||||||
Changes in non-cash working capital | (47.2) | (33.1) | ||||||||||||
| Transaction costs | 0.1 | 4.7 | ||||||||||||
| Decommissioning expenditures | 6.1 | 8.6 | ||||||||||||
| Adjusted funds flow from operations | 262.7 | 309.5 | ||||||||||||
Crescent Point's objective for managing its capital structure is to maintain a strong balance sheet and capital base to provide financial flexibility, position the Company to fund future development projects and provide returns to shareholders.
Crescent Point manages and monitors its capital structure and short-term financing requirements using a measure not defined in IFRS, the ratio of net debt to adjusted funds flow from operations. Net debt to adjusted funds flow from operations is used to measure the Company's overall debt position and to measure the strength of the Company's balance sheet. Crescent Point's objective is to manage this metric to be well positioned to execute its business objectives during periods of volatile commodity prices. Crescent Point monitors this ratio and uses this as a key measure in making decisions regarding financing, capital spending and dividend levels. The Company's net debt to adjusted funds flow from operations ratio at March 31, 2021 was 2.4 times (December 31, 2020 - 2.5 times).
Crescent Point is subject to certain financial covenants on its credit facilities and senior guaranteed notes agreements and was in compliance with all financial covenants as at March 31, 2021. See Note 6 - "Long-term Debt" for additional information regarding the Company's financial covenant requirements.
Crescent Point retains financial flexibility with significant liquidity on its credit facilities and no material near-term debt maturities. The Company is continuously monitoring the commodity price environment and actively manages its counterparty exposure to mitigate credit losses and will make adjustments as needed to protect its balance sheet.
12.COMMODITY DERIVATIVE GAINS (LOSSES)
| Three months ended March 31 | ||||||||||||||
($ millions) | 2021 | 2020 | ||||||||||||
Realized gains (losses) | (59.7) | 56.3 | ||||||||||||
Unrealized gains (losses) | (83.2) | 258.6 | ||||||||||||
Commodity derivative gains (losses) | (142.9) | 314.9 | ||||||||||||
13.OTHER INCOME (LOSS)
| Three months ended March 31 | ||||||||||||||
($ millions) | 2021 | 2020 | ||||||||||||
Long-term investments | 2.2 | (5.5) | ||||||||||||
Gain (loss) on capital dispositions | (17.3) | 307.5 | ||||||||||||
| Government subsidy for decommissioning expenditures | 6.1 | — | ||||||||||||
Other | 1.3 | 1.5 | ||||||||||||
Other income (loss) | (7.7) | 303.5 | ||||||||||||
| CRESCENT POINT ENERGY CORP. | 12 | ||||
14.INTEREST EXPENSE
| Three months ended March 31 | ||||||||||||||
($ millions) | 2021 | 2020 | ||||||||||||
Interest expense on long-term debt | 23.9 | 27.3 | ||||||||||||
| Unrealized gain on CCS - interest and interest derivative contracts | (0.1) | (17.8) | ||||||||||||
Interest expense | 23.8 | 9.5 | ||||||||||||
15.FOREIGN EXCHANGE GAIN
| Three months ended March 31 | ||||||||||||||
($ millions) | 2021 | 2020 | ||||||||||||
| Realized gain (loss) on CCS - principal | (13.6) | 62.0 | ||||||||||||
| Translation of US dollar long-term debt | 25.5 | (197.9) | ||||||||||||
| Unrealized gain (loss) on CCS - principal and foreign exchange swaps | (9.1) | 142.1 | ||||||||||||
| Other | (1.4) | 2.6 | ||||||||||||
| Foreign exchange gain | 1.4 | 8.8 | ||||||||||||
16.SHARE-BASED COMPENSATION
The following table reconciles the number of restricted shares, Employee Share Value Plan ("ESVP") awards, Performance Share Units ("PSUs") and Deferred Share Units ("DSUs") for the three months ended March 31, 2021:
Restricted Shares | ESVP | PSUs (1) | DSUs | |||||||||||||||||||||||
Balance, beginning of period | 4,704,129 | 10,449,383 | 3,789,689 | 1,278,263 | ||||||||||||||||||||||
Granted | 2,008 | 8,689 | 2,053,574 | 36,361 | ||||||||||||||||||||||
Redeemed | (335,810) | — | — | — | ||||||||||||||||||||||
Forfeited | (26,137) | (206,016) | — | — | ||||||||||||||||||||||
Balance, end of period | 4,344,190 | 10,252,056 | 5,843,263 | 1,314,624 | ||||||||||||||||||||||
(1)Based on underlying units before any effect of performance multipliers.
The following tables provide summary information regarding stock options outstanding as at March 31, 2021:
| Stock Options (number of units) | Weighted average exercise price ($) | |||||||||||||
Balance, beginning of period | 5,940,871 | 3.92 | ||||||||||||
Granted | 2,314 | 3.87 | ||||||||||||
Exercised | (15,036) | 3.97 | ||||||||||||
Balance, end of period | 5,928,149 | 3.91 | ||||||||||||
| Range of exercise prices ($) | Number of stock options outstanding | Weighted average remaining term for options outstanding (years) | Weighted average exercise price per share for options outstanding ($) | Number of stock options exercisable | Weighted average exercise price per share for options exercisable ($) | ||||||||||||||||||||||||||||||
| 1.09 - 1.35 | 3,326,056 | 6.00 | 1.09 | — | — | ||||||||||||||||||||||||||||||
| 1.36 - 4.52 | 1,035,723 | 4.97 | 3.94 | 396,600 | 3.97 | ||||||||||||||||||||||||||||||
| 4.53 - 9.86 | 123,338 | 4.76 | 8.04 | 39,519 | 8.65 | ||||||||||||||||||||||||||||||
| 9.87 - 10.06 | 1,443,032 | 3.78 | 10.06 | 865,821 | 10.06 | ||||||||||||||||||||||||||||||
| 5,928,149 | 5.25 | 3.91 | 1,301,940 | 8.16 | |||||||||||||||||||||||||||||||
The volume weighted average trading price of the Company's common shares was $4.49 per share during the three months ended March 31, 2021.
| CRESCENT POINT ENERGY CORP. | 13 | ||||
The Company estimates the fair value of stock options on the date of the grant using a Black-Scholes option pricing model. The following weighted average assumptions were used to estimate the fair value of the stock options at their grant date:
| Three months ended March 31 | |||||||||||||||||
| 2021 | 2020 | ||||||||||||||||
Grant date share price ($) | 3.87 | — | |||||||||||||||
| Exercise price ($) | 3.87 | — | |||||||||||||||
| Expected annual dividends ($) | 0.01 | — | |||||||||||||||
| Expected volatility (%) | 58.49 | % | — | % | |||||||||||||
| Risk-free interest rate (%) | 0.41 | % | — | % | |||||||||||||
| Expected life of stock option (years) | 4.9 | — | |||||||||||||||
| Fair value per stock option ($) | 1.85 | — | |||||||||||||||
17.FINANCIAL INSTRUMENTS AND DERIVATIVES
The Company's financial assets and liabilities are comprised of cash, accounts receivable, long-term investments, derivative assets and liabilities, accounts payable and accrued liabilities and long-term debt.
a) Carrying amount and fair value of financial instruments
The fair value of cash, accounts receivable, and accounts payable and accrued liabilities approximate their carrying amount due to the short-term nature of those instruments. The fair value of the amounts drawn on bank credit facilities is equal to its carrying amount as the facilities bear interest at floating rates and credit spreads that are indicative of market rates. These financial instruments are classified as financial assets and liabilities at amortized cost and are reported at amortized cost.
Crescent Point's derivative assets and liabilities and long-term investments are transacted in active markets, classified as financial assets and liabilities at fair value through profit or loss and fair valued at each period with the resulting gain or loss recorded in net income.
At March 31, 2021, the senior guaranteed notes had a carrying value of $1.85 billion and a fair value of $1.84 billion (December 31, 2020 - $1.87 billion and $1.85 billion, respectively).
Derivative assets and liabilities
Derivative assets and liabilities arise from the use of derivative contracts. Crescent Point's derivative assets and liabilities are classified as Level 2 with values based on inputs including quoted forward prices for commodities, time value and volatility factors. Accordingly, the Company's derivative financial instruments are classified as fair value through profit or loss and are reported at fair value with changes in fair value recorded in net income.
The following table summarizes the fair value as at March 31, 2021 and the change in fair value for the three months ended March 31, 2021:
| ($ millions) | Commodity (1) | Interest (2) | Foreign exchange (3) | Equity | Total | |||||||||||||||||||||||||||
| Derivative assets (liabilities), beginning of period | (26.3) | 7.3 | 205.0 | 11.0 | 197.0 | |||||||||||||||||||||||||||
| Unrealized change in fair value | (83.2) | 0.1 | (9.1) | 10.5 | (81.7) | |||||||||||||||||||||||||||
| Derivative assets (liabilities), end of period | (109.5) | 7.4 | 195.9 | 21.5 | 115.3 | |||||||||||||||||||||||||||
| Derivative assets, end of period | 1.6 | 9.6 | 199.5 | 21.5 | 232.2 | |||||||||||||||||||||||||||
| Derivative liabilities, end of period | (111.1) | (2.2) | (3.6) | — | (116.9) | |||||||||||||||||||||||||||
(1)Includes oil and gas contracts.
(2)Includes interest payments on CCS and interest derivative contracts.
(3)Includes principal portion of CCS and foreign exchange contracts.
b) Risks associated with financial assets and liabilities
The Company is exposed to financial risks from its financial assets and liabilities. The financial risks include market risk relating to commodity prices, interest rates, foreign exchange rates and equity price as well as credit and liquidity risk.
Commodity price risk
The Company is exposed to commodity price risk on crude oil, NGLs and natural gas revenues as well as power on electricity consumption. To manage a portion of this risk, the Company has entered into various derivative agreements.
| CRESCENT POINT ENERGY CORP. | 14 | ||||
The following table summarizes the unrealized gains (losses) on the Company's commodity financial derivative contracts and the resulting impact on income before tax due to fluctuations in commodity prices or differentials, with all other variables held constant:
| Impact on Income Before Tax | Impact on Income Before Tax | |||||||||||||||||||||||||
| ($ millions) | Three months ended March 31, 2021 | Three months ended March 31, 2020 | ||||||||||||||||||||||||
| Increase 10% | Decrease 10% | Increase 10% | Decrease 10% | |||||||||||||||||||||||
| Commodity price | ||||||||||||||||||||||||||
| Crude oil | (96.8) | 96.3 | (32.0) | 29.1 | ||||||||||||||||||||||
| Natural gas | (1.3) | 1.3 | — | — | ||||||||||||||||||||||
| Differential | ||||||||||||||||||||||||||
| Crude oil | 0.8 | (0.8) | — | — | ||||||||||||||||||||||
Interest rate risk
The Company is exposed to interest rate risk on bank credit facilities to the extent of changes in market interest rates. Based on the Company's floating rate debt position net of interest rate swaps, as at March 31, 2021, a 1 percent increase or decrease in the interest rate on floating rate debt would have a nominal impact on income before tax (three months ended March 31, 2020 - $0.5 million) on an annualized basis.
The following table summarizes the unrealized gains (losses) on the Company's interest derivative contracts and the resulting impact on income before tax due to the respective changes in the applicable forward interest rates, with all other variables held constant:
| Impact on Income Before Tax | Impact on Income Before Tax | |||||||||||||||||||||||||
($ millions) | Three months ended March 31, 2021 | Three months ended March 31, 2020 | ||||||||||||||||||||||||
Forward interest rates | Increase 50 basis points | Decrease 50 basis points | Increase 50 basis points | Decrease 50 basis points | ||||||||||||||||||||||
Interest rate swaps | 4.0 | (4.0) | 3.1 | (3.1) | ||||||||||||||||||||||
Foreign exchange risk
The Company is exposed to foreign exchange risk in relation to its US dollar denominated long-term debt, investment in U.S. subsidiaries and in relation to its crude oil sales. Crescent Point enters into various CCS and foreign exchange swaps to hedge its foreign exchange exposure on its US dollar denominated long-term debt. To partially mitigate the foreign exchange risk relating to crude oil sales, the Company has fixed crude oil contracts to settle in Cdn$ WTI.
The following table summarizes the resulting unrealized gains (losses) impacting income before tax due to the respective changes in the period end and applicable foreign exchange rates, with all other variables held constant:
Impact on Income Before Tax | Impact on Income Before Tax | ||||||||||||||||||||||||||||
($ millions) | Exchange Rate | Three months ended March 31, 2021 | Three months ended March 31, 2020 | ||||||||||||||||||||||||||
Cdn$ relative to US$ | Increase 10% | Decrease 10% | Increase 10% | Decrease 10% | |||||||||||||||||||||||||
US dollar long-term debt | Period End | 188.0 | (188.0) | 200.6 | (200.6) | ||||||||||||||||||||||||
Cross currency swaps | Forward | (199.3) | 199.3 | (220.0) | 220.0 | ||||||||||||||||||||||||
Foreign exchange swaps | Forward | (3.8) | 3.8 | (2.7) | 2.7 | ||||||||||||||||||||||||
Equity price risk
The Company is exposed to equity price risk on its own share price in relation to certain share-based compensation plans detailed in Note 16 - “Share-based Compensation”. The Company has entered into total return swaps to mitigate its exposure to fluctuations in its share price by fixing the future settlement cost on a portion of the cash settled plan.
The following table summarizes the unrealized gains (losses) on the Company's equity derivative contracts and the resulting impact on income before tax due to the respective changes in the applicable share price, with all other variables held constant:
| Impact on Income Before Tax | Impact on Income Before Tax | |||||||||||||||||||||||||
($ millions) | Three months ended March 31, 2021 | Three months ended March 31, 2020 | ||||||||||||||||||||||||
Share price | Increase 50% | Decrease 50% | Increase 50% | Decrease 50% | ||||||||||||||||||||||
Total return swaps | 21.0 | (21.0) | — | — | ||||||||||||||||||||||
| CRESCENT POINT ENERGY CORP. | 15 | ||||
Credit risk
The Company is exposed to credit risk in relation to its physical oil and gas sales, financial counterparty and joint venture receivables. A substantial portion of the Company's accounts receivable are with customers in the oil and gas industry and are subject to normal industry credit risks. To mitigate credit risk associated with its physical sales portfolio, Crescent Point obtains financial assurances such as parental guarantees, letters of credit and third party credit insurance. Including these assurances, approximately 97 percent of the Company's oil and gas sales are with entities considered investment grade.
At March 31, 2021, approximately 3 percent (December 31, 2020 - 5 percent) of the Company's accounts receivable balance was outstanding for more than 90 days and the Company's average expected credit loss was 1.03 percent (December 31, 2020 - 0.90 percent) on a portion of the Company’s accounts receivable balance relating to joint venture receivables.
Liquidity risk
The Company manages its liquidity risk through managing its capital structure and continuously monitoring forecast cash flows and available credit under existing banking arrangements as well as other potential sources of capital.
At March 31, 2021, the Company had available unused borrowing capacity on bank credit facilities of approximately $2.72 billion, including $5.0 million outstanding letters of credit and cash of $24.0 million.
c) Derivative contracts
The following is a summary of the derivative contracts in place as at March 31, 2021:
Financial WTI Crude Oil Derivative Contracts – Canadian Dollar (1) | ||||||||||||||||||||||||||||||||||||||||||||||||||
| Swap | Collar | Three-way Collar | ||||||||||||||||||||||||||||||||||||||||||||||||
| Term | Volume (bbls/d) (2) | Average Price ($/bbl) | Average Sold Call Price ($/bbl) | Average Bought Put Price ($/bbl) | Volume (bbls/d) | Average Sold Call Price ($/bbl) | Average Bought Put Price ($/bbl) | Average Sold Put Price ($/bbl) | ||||||||||||||||||||||||||||||||||||||||||
| 2021 April - December | 41,284 | 63.68 | — | — | 1,000 | 65.35 | 60.00 | 50.00 | ||||||||||||||||||||||||||||||||||||||||||
| 2022 | 4,462 | 70.40 | 76.49 | 64.00 | 1,000 | 82.63 | 71.00 | 61.00 | ||||||||||||||||||||||||||||||||||||||||||
(1)The volumes and prices reported are the weighted average volumes and prices for the period.
(2)Total weighted average volumes for collar contracts is 1,000 bbl/d in 2022.
Financial WTI Crude Oil Differential Derivative Contracts – Canadian Dollar (1) | |||||||||||||||||||||||
| Term | Volume (bbls/d) | Contract | Basis | Fixed Differential ($/bbl) | |||||||||||||||||||
| 2021 April - September | 2,995 | Basis Swap | WCS (2) | (15.23) | |||||||||||||||||||
| 2021 April - September | 1,497 | Basis Swap | MSW (3) | (5.30) | |||||||||||||||||||
(1)The volumes and prices reported are the weighted average volumes and prices for the period.
(2)WCS refers to Western Canadian Select crude oil differential.
(3)MSW refers to Mixed Sweet Blend crude oil differential.
Financial AECO Natural Gas Derivative Contracts – Canadian Dollar (1) | |||||||||||
| Average Volume (GJ/d) | Average Swap Price ($/GJ) | ||||||||||
| Term | |||||||||||
| 2021 April - October | 25,000 | 2.38 | |||||||||
(1)The volumes and prices reported are the weighted average volumes and prices for the period.
Financial Interest Rate Derivative Contracts – Canadian Dollar | Notional Principal ($ millions) | Fixed Rate (%) | |||||||||||||||
Term | Contract | ||||||||||||||||
April 2021 - March 2023 | Swap | 50.0 | 0.92 | ||||||||||||||
April 2021 - August 2023 | Swap | 50.0 | 0.81 | ||||||||||||||
April 2021 - August 2023 | Swap | 50.0 | 0.95 | ||||||||||||||
April 2021 - September 2023 | Swap | 50.0 | 0.95 | ||||||||||||||
April 2021 - August 2024 | Swap | 100.0 | 0.87 | ||||||||||||||
| CRESCENT POINT ENERGY CORP. | 16 | ||||
| Financial Cross Currency Derivative Contracts | |||||||||||||||||||||||||||||
Term | Contract | Receive Notional Principal (US$ millions) | Fixed Rate (US%) | Pay Notional Principal (Cdn$ millions) | Fixed Rate (Cdn%) | ||||||||||||||||||||||||
| April 2021 | Swap | 240.0 | 2.16 | 301.5 | 2.10 | ||||||||||||||||||||||||
| April 2021 | Swap | 82.0 | 5.13 | 79.0 | 5.83 | ||||||||||||||||||||||||
| April 2021 - June 2021 | Swap | 52.5 | 3.29 | 56.3 | 3.59 | ||||||||||||||||||||||||
| April 2021 - May 2022 | Swap | 170.0 | 4.00 | 166.9 | 5.03 | ||||||||||||||||||||||||
| April 2021 - April 2023 | Swap | 61.5 | 4.12 | 80.3 | 3.71 | ||||||||||||||||||||||||
| April 2021 - June 2023 | Swap | 270.0 | 3.78 | 274.7 | 4.32 | ||||||||||||||||||||||||
| April 2021 - June 2024 | Swap | 257.5 | 3.75 | 276.4 | 4.03 | ||||||||||||||||||||||||
| April 2021 - April 2025 | Swap | 82.0 | 4.30 | 107.0 | 3.98 | ||||||||||||||||||||||||
| April 2021 - April 2025 | Swap | 230.0 | 4.08 | 291.1 | 4.13 | ||||||||||||||||||||||||
| April 2021 - April 2027 | Swap | 20.0 | 4.18 | 25.3 | 4.25 | ||||||||||||||||||||||||
| Financial Foreign Exchange Forward Derivative Contracts | |||||||||||||||||||||||
Settlement Date | Contract | Receive Notional Principal (US$ millions) | Pay Notional Principal (Cdn$ millions) | ||||||||||||||||||||
| May 2022 | Swap | 30.0 | 32.2 | ||||||||||||||||||||
Financial Equity Derivative Contracts | Notional Principal ($ millions) | Number of shares | |||||||||||||||
Term | Contract | ||||||||||||||||
April 2021 - April 2022 | Swap | 8.9 | 3,691,984 | ||||||||||||||
April 2021 - April 2023 | Swap | 8.2 | 3,648,884 | ||||||||||||||
April 2021 - April 2024 | Swap | 3.5 | 691,984 | ||||||||||||||
18.SUPPLEMENTAL DISCLOSURES
Cash flow statement presentation
| Three months ended March 31 | ||||||||||||||
| ($ millions) | 2021 | 2020 | ||||||||||||
Operating activities | ||||||||||||||
Changes in non-cash working capital: | ||||||||||||||
Accounts receivable | (53.1) | 99.2 | ||||||||||||
Prepaids and deposits | 1.7 | (5.6) | ||||||||||||
Accounts payable and accrued liabilities | 71.5 | (49.8) | ||||||||||||
Other current liabilities | 18.3 | (1.7) | ||||||||||||
Other long-term liabilities | 8.8 | (9.0) | ||||||||||||
| 47.2 | 33.1 | |||||||||||||
Investing activities | ||||||||||||||
Changes in non-cash working capital: | ||||||||||||||
Accounts receivable | 2.3 | 2.8 | ||||||||||||
Accounts payable and accrued liabilities | (13.5) | (19.0) | ||||||||||||
| (11.2) | (16.2) | |||||||||||||
| CRESCENT POINT ENERGY CORP. | 17 | ||||
Supplementary financing cash flow information
The Company's reconciliation of cash flow from financing activities is outlined in the table below:
($ millions) | Dividends payable | Long-term debt (1) | Lease liability (2) | ||||||||||||||||||||
| December 31, 2020 | 1.3 | 2,259.6 | 156.5 | ||||||||||||||||||||
Changes from cash flow from financing activities: | |||||||||||||||||||||||
Decrease in bank debt, net | (84.7) | ||||||||||||||||||||||
| Realized loss on cross currency swap maturity | (13.6) | ||||||||||||||||||||||
Cash dividends paid | (1.3) | ||||||||||||||||||||||
Payments on principal portion of lease liability | (5.1) | ||||||||||||||||||||||
Non-cash changes: | |||||||||||||||||||||||
Cash dividends declared | 1.3 | ||||||||||||||||||||||
Additions | 0.3 | ||||||||||||||||||||||
Foreign exchange | (11.9) | ||||||||||||||||||||||
| March 31, 2021 | 1.3 | 2,149.4 | 151.7 | ||||||||||||||||||||
| December 31, 2019 | 5.3 | 2,905.1 | 181.2 | ||||||||||||||||||||
Changes from cash flow from financing activities: | |||||||||||||||||||||||
| Decrease in bank debt, net | (337.5) | ||||||||||||||||||||||
Repayment of senior guaranteed notes | (224.4) | ||||||||||||||||||||||
| Realized gain on cross currency swap maturity | 62.0 | ||||||||||||||||||||||
Cash dividends paid | (5.3) | ||||||||||||||||||||||
Payments on principal portion of lease liability | (7.9) | ||||||||||||||||||||||
Non-cash changes: | |||||||||||||||||||||||
Cash dividends declared | 5.3 | ||||||||||||||||||||||
Additions | 0.3 | ||||||||||||||||||||||
Foreign exchange | 134.0 | 0.3 | |||||||||||||||||||||
| March 31, 2020 | 5.3 | 2,539.2 | 173.9 | ||||||||||||||||||||
(1)Includes current portion of long-term debt.
(2)Includes current portion of lease liability.
19.GEOGRAPHICAL DISCLOSURE
The following table reconciles oil and gas sales by country and product type:
| Three months ended March 31 | ||||||||||||||
($ millions) (1) | 2021 | 2020 | ||||||||||||
Canada | ||||||||||||||
Crude oil sales | 460.3 | 420.8 | ||||||||||||
NGL sales | 33.5 | 22.2 | ||||||||||||
Natural gas sales | 17.8 | 16.9 | ||||||||||||
Total Canada | 511.6 | 459.9 | ||||||||||||
U.S. | ||||||||||||||
Crude oil sales | 98.5 | 80.5 | ||||||||||||
NGL sales | 11.7 | 5.3 | ||||||||||||
Natural gas sales | 8.4 | 2.7 | ||||||||||||
Total U.S. | 118.6 | 88.5 | ||||||||||||
Total oil and gas sales | 630.2 | 548.4 | ||||||||||||
(1)Oil and gas sales are reported before realized derivatives.
| CRESCENT POINT ENERGY CORP. | 18 | ||||
The following table reconciles non-current assets by country:
($ millions) | March 31, 2021 | December 31, 2020 | ||||||||||||
Canada | 5,423.6 | 5,520.6 | ||||||||||||
U.S. | 808.8 | 846.6 | ||||||||||||
Total | 6,232.4 | 6,367.2 | ||||||||||||
20.SUBSEQUENT EVENTS
Acquisition of Kaybob Duvernay Assets
On April 1, 2021, Crescent Point completed the acquisition of Shell Canada Energy's Kaybob Duvernay assets in Alberta. Including closing adjustments, total consideration was approximately $671.4 million in cash and 50.0 million common shares of Crescent Point, which is expected to be allocated substantially to PP&E. Cash consideration was accessed through the Company's credit facility and included the deposit on acquisition of $45.0 million.
| CRESCENT POINT ENERGY CORP. | 19 | ||||
Directors Barbara Munroe, Chair (6) Laura Cillis (1) (2) James Craddock (1) (3) (5) John Dielwart (3) (4) Ted Goldthorpe (1) (5) Mike Jackson (1) (2) (5) Jennifer Koury (2) (4) Francois Langlois (3) (4) (5) Myron Stadnyk (2) (3) (4) Craig Bryksa (4) (1) Member of the Audit Committee of the Board of Directors (2) Member of the Human Resources and Compensation Committee of the Board of Directors (3) Member of the Reserves Committee of the Board of Directors (4) Member of the Environment, Safety and Sustainability Committee of the Board of Directors (5) Member of the Corporate Governance and Nominating Committee (6) Chair of the Board serves in an ex officio capacity on each Committee Officers Craig Bryksa President and Chief Executive Officer Ken Lamont Chief Financial Officer Ryan Gritzfeldt Chief Operating Officer Brad Borggard Senior Vice President, Corporate Planning and Capital Markets Mark Eade Senior Vice President, General Counsel and Corporate Secretary Garret Holt Senior Vice President, Corporate Development Head Office Suite 2000, 585 - 8th Avenue S.W. Calgary, Alberta T2P 1G1 Tel: (403) 693-0020 Fax: (403) 693-0070 Toll Free: (888) 693-0020 Banker The Bank of Nova Scotia Calgary, Alberta | Auditor PricewaterhouseCoopers LLP Calgary, Alberta Legal Counsel Norton Rose Fulbright Canada LLP Calgary, Alberta Evaluation Engineers GLJ Ltd. Calgary, Alberta Sproule Associates Ltd. Calgary, Alberta Registrar and Transfer Agent Investors are encouraged to contact Crescent Point's Registrar and Transfer Agent for information regarding their security holdings: Computershare Trust Company of Canada 600, 530 - 8th Avenue S.W. Calgary, Alberta T2P 3S8 Tel: (403) 267-6800 Stock Exchanges Toronto Stock Exchange - TSX New York Stock Exchange - NYSE Stock Symbol CPG Investor Contacts Brad Borggard Senior Vice President, Corporate Planning and Capital Markets (403) 693-0020 Shant Madian Vice President, Investor Relations and Corporate Communications (403) 693-0020 | |||||||
| CRESCENT POINT ENERGY CORP. | 20 | ||||
Exhibit 99.2
MANAGEMENT’S DISCUSSION AND ANALYSIS
Management's discussion and analysis (“MD&A”) is dated May 11, 2021 and should be read in conjunction with the unaudited consolidated financial statements for the period ended March 31, 2021 and the audited consolidated financial statements for the year ended December 31, 2020 for a full understanding of the financial position and results of operations of Crescent Point Energy Corp. (the “Company” or “Crescent Point”).
The unaudited consolidated financial statements and comparative information for the period ended March 31, 2021 have been prepared in accordance with International Financial Reporting Standards (“IFRS”), specifically International Accounting Standard ("IAS") 34, Interim Financial Reporting, as issued by the International Accounting Standards Board ("IASB").
STRUCTURE OF THE BUSINESS
The principal undertaking of Crescent Point is to carry on the business of acquiring, developing and holding interests in petroleum and natural gas properties and assets related thereto through a general partnership and wholly owned subsidiaries. Amounts in this report are in Canadian dollars unless noted otherwise. References to “US$” are to United States (“U.S.”) dollars.
Overview
The Company’s first quarter results were positively impacted by the continued recovery in benchmark oil prices and narrower differentials. The Company reported first quarter net income of $21.7 million and adjusted net earnings of $95.1 million, compared to a net loss of $2.32 billion and adjusted net earnings of $48.7 million in the first quarter of 2020. Net debt was also reduced by $135.8 million through excess cash flow generated during the quarter, resulting in net debt of $2.01 billion at March 31, 2021.
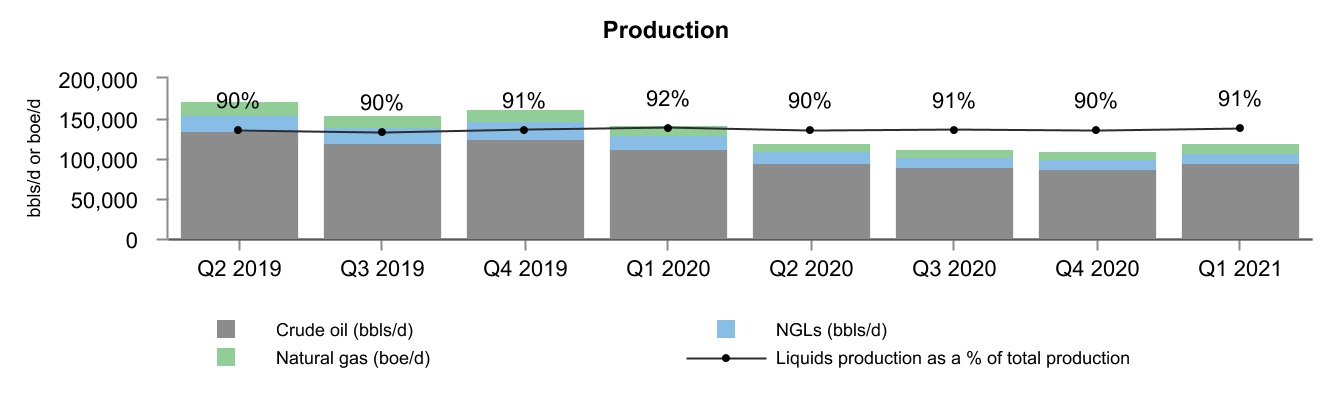
Production volumes totaled 119,384 boe/d during the quarter, down 16 percent from 141,330 boe/d during the first quarter of 2020. With the collapse in commodity prices in 2020, the Company significantly reduced its capital development program which has resulted in lower production volumes. In the first quarter of 2021, development capital spending totaled $119.2 million with the drilling of 65 (64.6 net) wells, targeted towards the Company’s major operating areas.
The Company remained active with its hedging portfolio during the quarter, protecting against commodity price volatility. As of the date of this report, the Company has over 40 percent of its oil and liquids production, net of royalty interest, hedged through the remainder of 2021.
Subsequent to the quarter, the Company successfully closed the acquisition of Kaybob Duvernay assets in Alberta from Shell Canada Energy on April 1, 2021, as previously announced. The acquisition includes production of approximately 30,000 boe/d, weighted 65 percent towards condensate and liquids, and approximately 500 net sections of land in the Kaybob area. The transaction is in line with the Company’s core principles and is also expected to enhance the Company’s free cash flow profile. Crescent Point remains committed to strengthening its balance sheet and sustainability in 2021 and will also continue to evaluate opportunities to further enhance its asset portfolio through strategic acquisitions and dispositions.
Results of Operations
Production
| Three months ended March 31 | ||||||||||||||||||||
| 2021 | 2020 | % Change | ||||||||||||||||||
Crude oil (bbls/d) | 95,276 | 111,928 | (15) | |||||||||||||||||
| NGLs (bbls/d) | 13,319 | 17,493 | (24) | |||||||||||||||||
Natural gas (mcf/d) | 64,732 | 71,451 | (9) | |||||||||||||||||
Total (boe/d) | 119,384 | 141,330 | (16) | |||||||||||||||||
Crude oil and NGLs (%) | 91 | 92 | (1) | |||||||||||||||||
Natural gas (%) | 9 | 8 | 1 | |||||||||||||||||
Total (%) | 100 | 100 | — | |||||||||||||||||
The following is a summary of Crescent Point's production by area:
| Three months ended March 31 | ||||||||||||||||||||
Production By Area (boe/d) | 2021 | 2020 | % Change | |||||||||||||||||
Saskatchewan | 82,384 | 102,210 | (19) | |||||||||||||||||
Alberta | 14,043 | 17,113 | (18) | |||||||||||||||||
United States | 22,957 | 22,007 | 4 | |||||||||||||||||
Total | 119,384 | 141,330 | (16) | |||||||||||||||||
Total production averaged 119,384 boe/d during the first quarter of 2021 compared to 141,330 boe/d in the first quarter of 2020. The 16 percent decrease was primarily due to a significantly reduced development capital program in response to the global pandemic and the collapse in crude oil prices in 2020.
| CRESCENT POINT ENERGY CORP. | 1 | ||||
The Company's weighting to crude oil and natural gas liquids ("NGLs") production has remained relatively consistent with the comparative period.
Exhibit 1
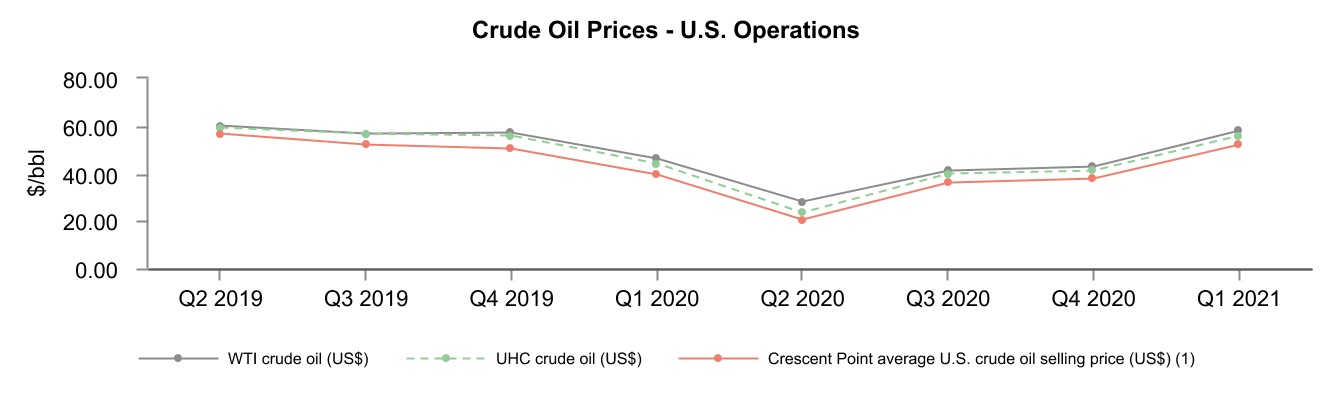
Marketing and Prices
| Three months ended March 31 | ||||||||||||||||||||
Average Selling Prices (1) | 2021 | 2020 | % Change | |||||||||||||||||
Crude oil ($/bbl) | 65.17 | 49.21 | 32 | |||||||||||||||||
NGLs ($/bbl) | 37.70 | 17.28 | 118 | |||||||||||||||||
Natural gas ($/mcf) | 4.50 | 3.03 | 49 | |||||||||||||||||
Total ($/boe) | 58.65 | 42.64 | 38 | |||||||||||||||||
(1) The average selling prices reported are before realized commodity derivatives and transportation.
| Three months ended March 31 | ||||||||||||||||||||
Benchmark Pricing | 2021 | 2020 | % Change | |||||||||||||||||
Crude Oil Prices | ||||||||||||||||||||
WTI crude oil (US$/bbl) (1) | 57.80 | 46.08 | 25 | |||||||||||||||||
WTI crude oil (Cdn$/bbl) | 73.16 | 61.94 | 18 | |||||||||||||||||
Crude Oil Differentials | ||||||||||||||||||||
LSB crude oil (Cdn$/bbl) (2) | (6.33) | (10.42) | (39) | |||||||||||||||||
FOS crude oil (Cdn$/bbl) (3) | (11.87) | (18.37) | (35) | |||||||||||||||||
UHC crude oil (US$/bbl) (4) | (1.93) | (2.25) | (14) | |||||||||||||||||
Natural Gas Prices | ||||||||||||||||||||
AECO daily spot natural gas (Cdn$/mcf) (5) | 3.12 | 2.04 | 53 | |||||||||||||||||
AECO monthly index natural gas (Cdn$/mcf) | 2.93 | 2.14 | 37 | |||||||||||||||||
NYMEX natural gas (US$/mmbtu) (6) | 2.69 | 1.95 | 38 | |||||||||||||||||
Foreign Exchange Rate | ||||||||||||||||||||
Exchange rate (US$/Cdn$) | 0.790 | 0.744 | 6 | |||||||||||||||||
(1)WTI refers to the West Texas Intermediate crude oil price.
(2)LSB refers to the Light Sour Blend crude oil price.
(3)FOS refers to the Fosterton crude oil price, which typically receives a premium to the Western Canadian Select price.
(4)UHC refers to the Sweet at Clearbrook crude oil price.
(5)AECO refers to the Alberta Energy Company natural gas price.
(6)NYMEX refers to the New York Mercantile Exchange natural gas price.
Crude oil prices continued to rebound in the first quarter with improving fundamentals, market optimism generated by COVID-19 vaccinations and the continuation of coordinated supply cuts by OPEC. The US$ WTI benchmark price increased 25 percent on average during the first quarter of 2021, compared to the same period in 2020.
Natural gas prices were stronger due to increased heating demand from colder winter temperatures, higher industrial demand and lower inventory levels from cuts to producer capital budgets in 2020. The growth in oil sands activity, which requires natural gas, also increased demand in Alberta to record highs in the first quarter of 2021. The AECO daily benchmark price was 53 percent higher in the first quarter of 2021 compared to the same period in 2020.
U.S. natural gas prices were also higher on average in the first quarter of 2021 due to increased heating demand and the recovery of LNG demand which was significantly impacted in the prior year by demand losses from the COVID-19 pandemic and high global inventory levels. The NYMEX benchmark gas price was 38 higher in the first quarter of 2021 compared to the same period in 2020.
| CRESCENT POINT ENERGY CORP. | 2 | ||||
Exhibit 2
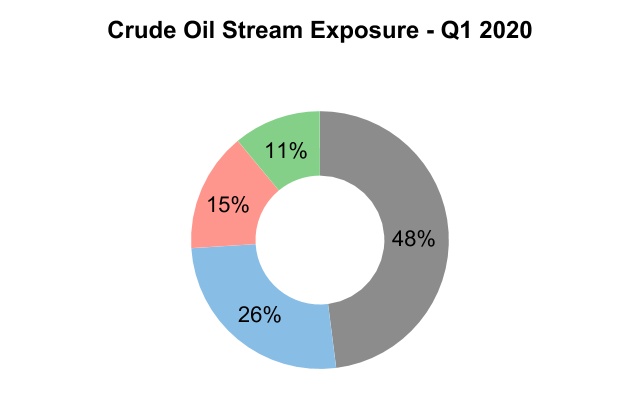
Canadian crude oil differentials narrowed in the first quarter of 2021, primarily due to increased demand from downstream refiners, and lower inventory levels in the U.S. and Canada due to industry wide production shut-ins and reduced capital activity throughout 2020.
For the three months ended March 31, 2021, the Company's average selling price for crude oil increased 32 percent from the same period in 2020, primarily due to the 25 percent increase in the US$ WTI benchmark price and a narrower corporate oil price differential. Crescent Point's corporate oil differential relative to Cdn$ WTI for the three months ended March 31, 2021 was $7.99 per bbl compared to $12.73 per bbl in the first quarter of 2020.
In the first quarter of 2021, the Company's average selling price for NGLs more than doubled, from $17.28 per bbl in the first quarter of 2020 to $37.70 per bbl. The increase in average selling prices for NGLs was primarily due to the increase in US$ WTI, an increase in propane benchmark prices and stronger differentials on condensate.
The Company's average selling price for natural gas for the three months ended March 31, 2021 increased 49 percent from $3.03 per mcf in the first quarter of 2020 to $4.50 per mcf, primarily as a result of the 53 percent increase in the AECO daily benchmark price.
Exhibit 3
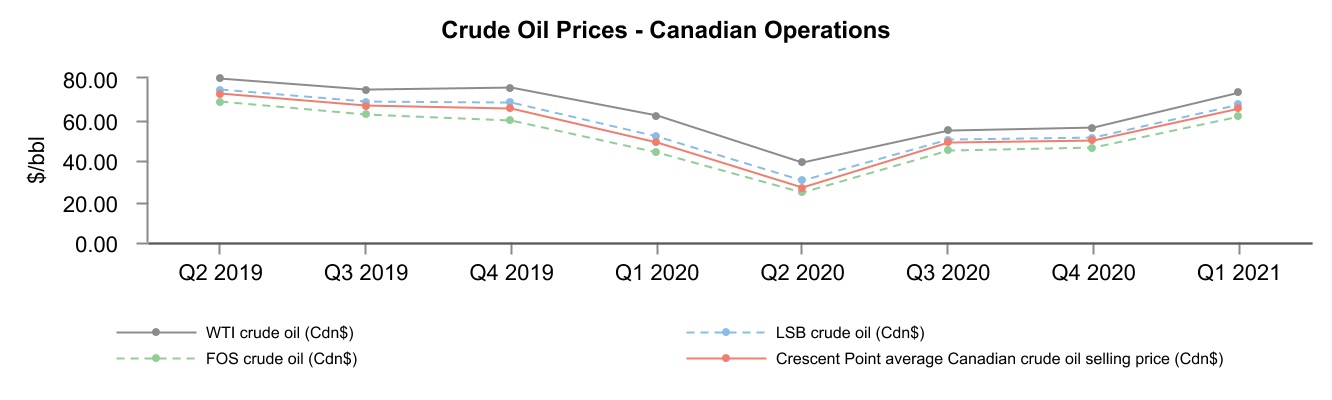
Exhibit 4
(1)Excludes Uinta Basin assets sold in October 2019.
| CRESCENT POINT ENERGY CORP. | 3 | ||||
Commodity Derivatives
Management of cash flow variability is an integral component of Crescent Point's business strategy. Crescent Point regularly monitors changing business and market conditions while executing its strategic risk management program. Crescent Point proactively manages the risk exposure inherent in movements in the price of crude oil, natural gas, interest rates, the Company's share price and the US/Cdn dollar exchange rate through the use of derivatives with investment-grade counterparties.
The Company's crude oil and natural gas derivatives are referenced to WTI and the AECO monthly index, respectively, unless otherwise noted. Crescent Point utilizes a variety of derivatives, including swaps, collars, and put options to protect against downward commodity price movements while also providing the opportunity for some upside participation during periods of rising prices. This reduces the volatility of the selling price of crude oil and natural gas production and provides a measure of stability to the Company's cash flow. See Note 17 - "Financial Instruments and Derivatives" in the unaudited consolidated financial statements for the period ended March 31, 2021 for additional information on the Company's derivatives.
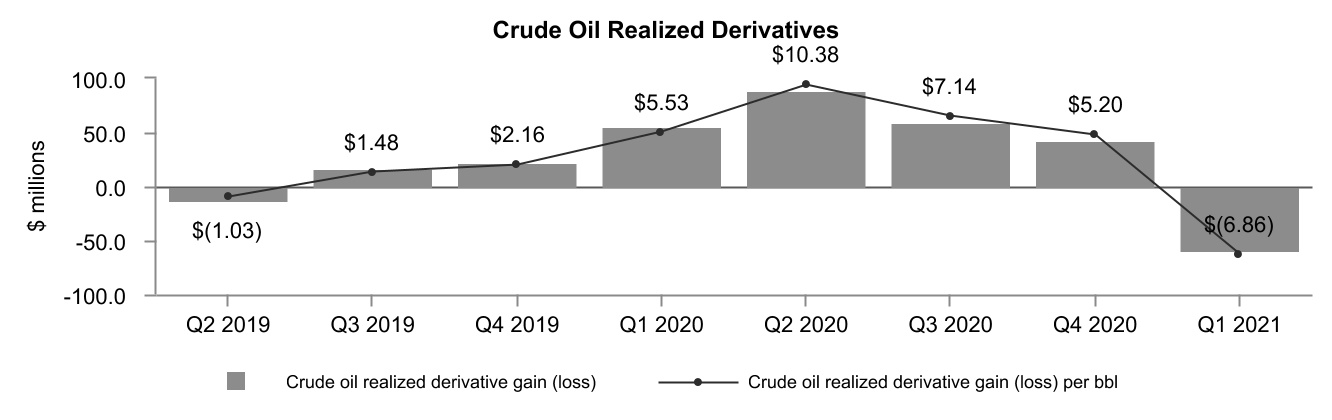
The following is a summary of the realized commodity derivative gains (losses):
| Three months ended March 31 | ||||||||||||||||||||
($ millions, except volume amounts) | 2021 | 2020 | % Change | |||||||||||||||||
Average crude oil volumes hedged (bbls/d) (1) | 57,000 | 60,500 | (6) | |||||||||||||||||
Crude oil realized derivative gain (loss) (1) | (58.8) | 56.3 | (204) | |||||||||||||||||
per bbl | (6.86) | 5.53 | (224) | |||||||||||||||||
Average natural gas volumes hedged (GJ/d) (2) | 25,000 | — | — | |||||||||||||||||
| Natural gas realized derivative loss | (0.9) | — | — | |||||||||||||||||
| per GJ | (0.15) | — | — | |||||||||||||||||
Average barrels of oil equivalent hedged (boe/d) (1) | 60,949 | 60,500 | 1 | |||||||||||||||||
Total realized commodity derivative gains (losses) (1) | (59.7) | 56.3 | (206) | |||||||||||||||||
per boe | (5.55) | 4.38 | (227) | |||||||||||||||||
(1)The crude oil realized derivative gain (loss) for the three months ended March 31, 2021 includes the realized derivative gains and losses on financial price differential contracts. The average crude oil volumes hedged and average barrels of oil equivalent hedged do not include the hedged volumes related to financial price differential contracts.
(2)GJ/d is defined as gigajoules per day.
The Company recorded a $58.8 million realized derivative loss for crude oil for the three months ended March 31, 2021, compared to a realized derivative gain of $56.3 million in the first quarter of 2020. The realized derivative loss in the first quarter of 2021 was largely attributable to the increase in the Cdn$ WTI benchmark price and the decrease in the Company's average derivative crude oil price. During the three months ended March 31, 2021, the Company's average derivative crude oil price decreased by $10.47 per bbl, from $72.17 per bbl in the first quarter of 2020 to $61.70 per bbl in the first quarter of 2021.
Crescent Point's realized derivative loss for gas was $0.9 million for the three months ended March 31, 2021 due to the higher average AECO monthly index price compared to the Company's average derivative gas price of $2.38 per GJ.
Exhibit 5
The following is a summary of the Company's unrealized commodity derivative gains (losses):
| Three months ended March 31 | ||||||||||||||||||||
($ millions) | 2021 | 2020 | % Change | |||||||||||||||||
Crude oil | (82.2) | 258.6 | (132) | |||||||||||||||||
Natural gas | (1.0) | — | — | |||||||||||||||||
| Total unrealized commodity derivative gains (losses) | (83.2) | 258.6 | (132) | |||||||||||||||||
| CRESCENT POINT ENERGY CORP. | 4 | ||||
For the three months ended March 31, 2021, the Company recognized a total unrealized derivative loss of $83.2 million on its commodity contracts compared to an unrealized derivative gain of $258.6 million in the first quarter of 2020. The unrealized derivative loss in the first quarter of 2021 was primarily attributable to crude oil contracts and reflects the increase in the Cdn$ WTI forward benchmark prices at March 31, 2021 compared to December 31, 2020.
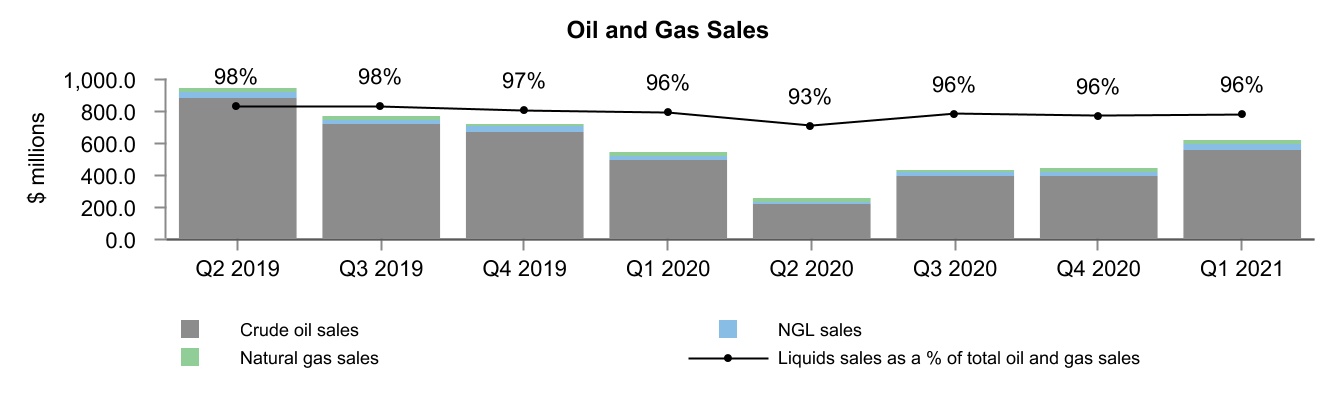
Oil and Gas Sales
| Three months ended March 31 | ||||||||||||||||||||
($ millions) (1) | 2021 | 2020 | % Change | |||||||||||||||||
Crude oil sales | 558.8 | 501.3 | 11 | |||||||||||||||||
NGL sales | 45.2 | 27.5 | 64 | |||||||||||||||||
Natural gas sales | 26.2 | 19.6 | 34 | |||||||||||||||||
Total oil and gas sales | 630.2 | 548.4 | 15 | |||||||||||||||||
(1)Oil and gas sales are reported before realized commodity derivatives.
Total oil and gas sales increased by 15 percent from $548.4 million in the first quarter of 2020 to $630.2 million in the first quarter of 2021, primarily due to the increase in realized crude oil prices, partially offset by lower production.
Exhibit 6
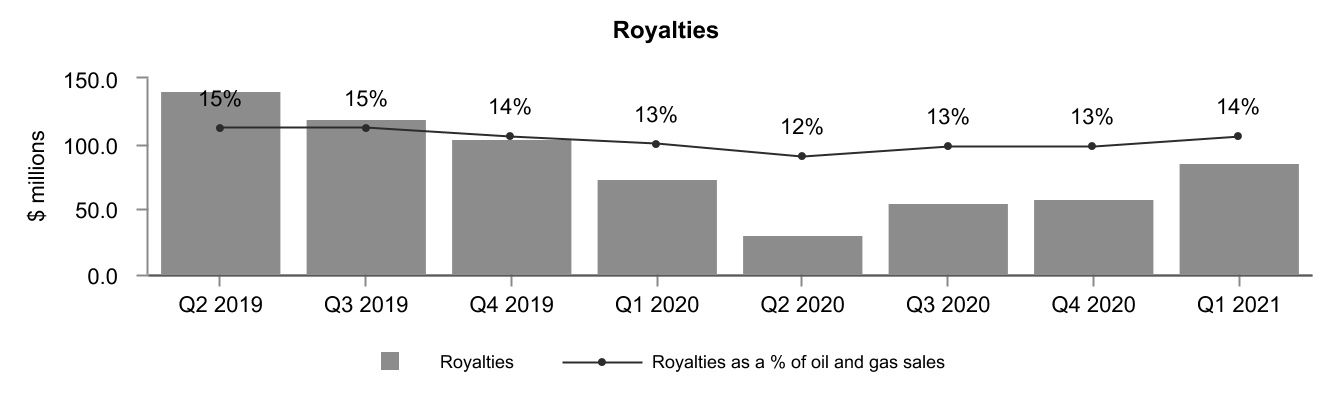
Royalties
| Three months ended March 31 | ||||||||||||||||||||
| ($ millions, except % and per boe amounts) | 2021 | 2020 | % Change | |||||||||||||||||
| Royalties | 85.7 | 73.0 | 17 | |||||||||||||||||
| As a % of oil and gas sales | 14 | 13 | 1 | |||||||||||||||||
| Per boe | 7.98 | 5.68 | 40 | |||||||||||||||||
Royalties increased 17 percent in the first quarter of 2021, largely due to the 15 percent increase in oil and gas sales. Royalties as a percentage of oil and gas sales increased slightly in the first quarter of 2021 compared to the same period in 2020, reflecting higher benchmark oil prices which increased crown royalty rates.
Exhibit 7
| CRESCENT POINT ENERGY CORP. | 5 | ||||
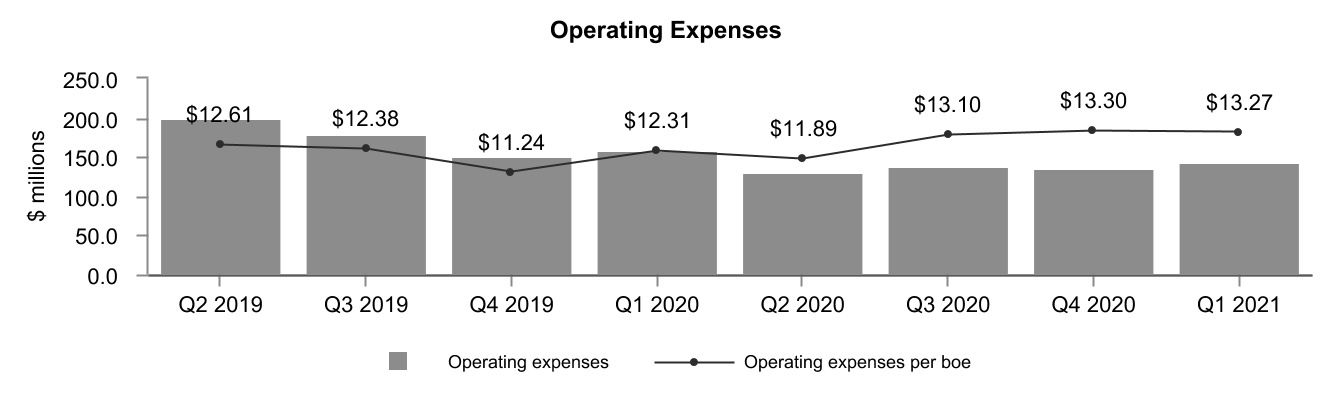
Operating Expenses
| Three months ended March 31 | ||||||||||||||||||||
($ millions, except per boe amounts) | 2021 | 2020 | % Change | |||||||||||||||||
Operating expenses | 142.6 | 158.3 | (10) | |||||||||||||||||
Per boe | 13.27 | 12.31 | 8 | |||||||||||||||||
Operating expenses decreased 10 percent in the first quarter of 2021 due to cost savings recognized from the continued roll-out of the Company's operational technology ("OT") platform, partially offset by higher third party processing fees. On a per boe basis, operating expenses were 8 percent higher primarily due to lower production volumes.
Exhibit 8
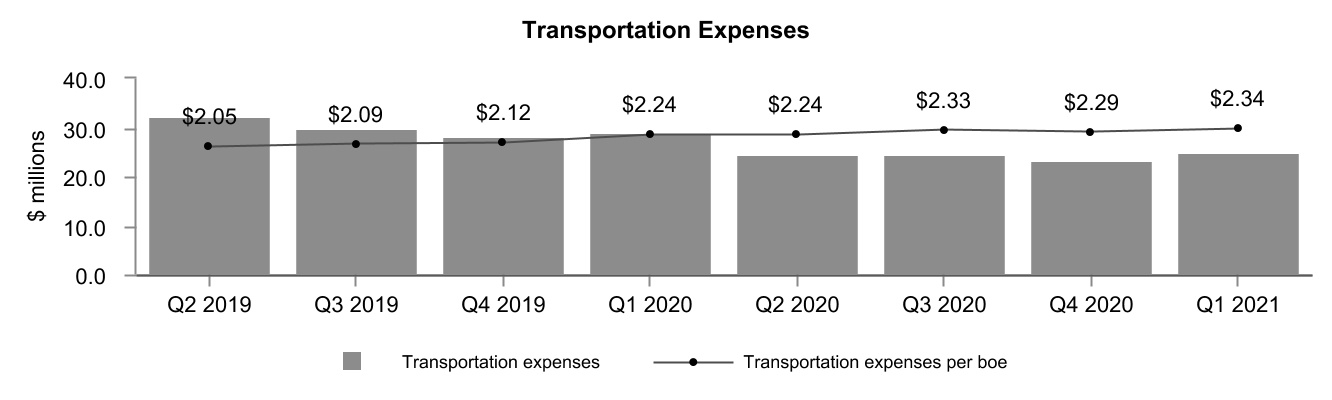
Transportation Expenses
| Three months ended March 31 | ||||||||||||||||||||
| ($ millions, except per boe amounts) | 2021 | 2020 | % Change | |||||||||||||||||
| Transportation expenses | 25.1 | 28.8 | (13) | |||||||||||||||||
| Per boe | 2.34 | 2.24 | 4 | |||||||||||||||||
Transportation expenses decreased 13 percent in the first quarter of 2021 primarily due to lower production volumes. Transportation expenses per boe increased by $0.10 per boe or 4 percent primarily due to higher pipeline tariffs.
Exhibit 9
| CRESCENT POINT ENERGY CORP. | 6 | ||||
Netback
| Three months ended March 31 | ||||||||||||||||||||
| 2021 | 2020 | |||||||||||||||||||
Total (2) ($/boe) | Total (2) ($/boe) | % Change | ||||||||||||||||||
Average selling price | 58.65 | 42.64 | 38 | |||||||||||||||||
Royalties | (7.98) | (5.68) | 40 | |||||||||||||||||
Operating expenses | (13.27) | (12.31) | 8 | |||||||||||||||||
Transportation expenses | (2.34) | (2.24) | 4 | |||||||||||||||||
Operating netback (1) | 35.06 | 22.41 | 56 | |||||||||||||||||
| Realized gain (loss) on commodity derivatives | (5.55) | 4.38 | (227) | |||||||||||||||||
Netback (1) | 29.51 | 26.79 | 10 | |||||||||||||||||
(1)Non-GAAP financial measure that does not have any standardized meaning prescribed by IFRS and, therefore, may not be comparable with the calculation of similar measures presented by other entities. Refer to the Non-GAAP Financial Measures section in this MD&A for further information.
(2)The dominant production category for the Company's properties is crude oil. These properties include associated natural gas and NGL volumes, therefore, the total operating netback and netback have been presented.
The Company's operating netback for the three months ended March 31, 2021 increased 56 percent to $35.06 per boe from $22.41 per boe in the first quarter of 2020. The increase in the Company's operating netback was primarily due to the increase in average selling price, partially offset by higher royalties. The increase in the Company's netback was the result of the increase in the operating netback, partially offset by the realized loss on commodity derivatives.
Exhibit 10
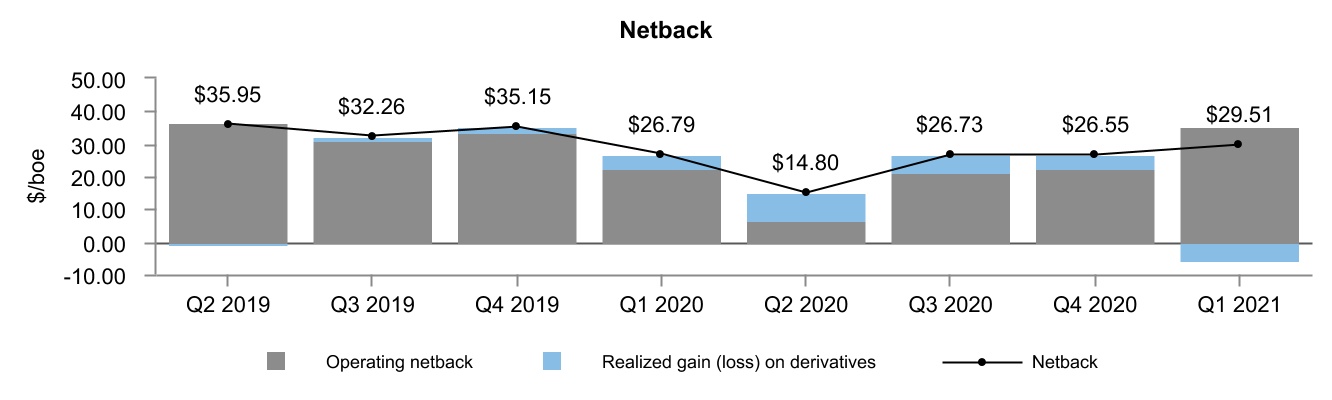
General and Administrative Expenses
| Three months ended March 31 | ||||||||||||||||||||
($ millions, except per boe amounts) | 2021 | 2020 | % Change | |||||||||||||||||
| Gross general and administrative expenses | 28.1 | 41.7 | (33) | |||||||||||||||||
| Overhead recoveries | (5.6) | (7.8) | (28) | |||||||||||||||||
Capitalized | (7.3) | (9.4) | (22) | |||||||||||||||||
Total general and administrative expenses | 15.2 | 24.5 | (38) | |||||||||||||||||
| Transaction costs | (0.1) | (4.7) | (98) | |||||||||||||||||
| General and administrative expenses | 15.1 | 19.8 | (24) | |||||||||||||||||
Per boe | 1.41 | 1.54 | (8) | |||||||||||||||||
General and administrative ("G&A") expenses decreased by 24 percent from $19.8 million in the first quarter of 2020 to $15.1 million in the first quarter of 2021. The decrease was primarily attributable to lower employee costs and lower professional fees from cost reduction initiatives, partially offset by lower overhead recoveries resulting from lower production and capital spending levels.
On a per boe basis, G&A expenses decreased 8 percent in the first quarter of 2021 due to the reduction in total G&A discussed above, partially offset by a decrease in production volumes.
| CRESCENT POINT ENERGY CORP. | 7 | ||||
Exhibit 11
Interest Expense
| Three months ended March 31 | ||||||||||||||||||||
($ millions, except per boe amounts) | 2021 | 2020 | % Change | |||||||||||||||||
Interest expense on long-term debt | 23.9 | 27.3 | (12) | |||||||||||||||||
| Unrealized gain on CCS - interest and interest derivative contracts | (0.1) | (17.8) | (99) | |||||||||||||||||
| Interest expense | 23.8 | 9.5 | 151 | |||||||||||||||||
Per boe | 2.22 | 0.74 | 200 | |||||||||||||||||
Interest expense on long-term debt decreased 12 percent in the first quarter of 2021 primarily due to lower debt balances with the Company's ongoing focus on balance sheet strength.
During the three months ended March 31, 2021, the Company recognized a $0.1 million unrealized gain on interest rate derivatives compared to $17.8 million in the first quarter of 2020. The unrealized gain in the first quarter of 2021 was primarily due to a higher floating interest rate on the Company's interest derivative contracts at March 31, 2021 compared to December 31, 2020, partially offset by the impact of the stronger Canadian dollar at March 31, 2021 as compared to December 31, 2020 on the interest payments related to the Company's cross currency swaps ("CCS").
Crescent Point manages its interest rate exposure through a combination of interest rate swaps and a debt portfolio including short-term floating rate bank debt and long-term fixed rate senior guaranteed notes. At March 31, 2021, approximately 100 percent of the Company's long-term debt, including the impact of related derivatives, had fixed interest rates.
Exhibit 12
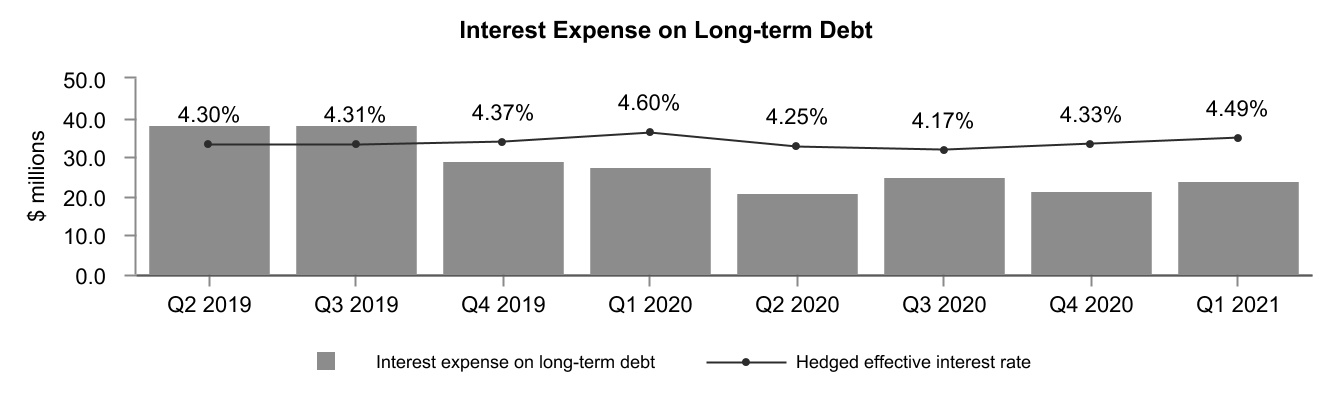
Foreign Exchange Gain
| Three months ended March 31 | ||||||||||||||||||||
($ millions) | 2021 | 2020 | % Change | |||||||||||||||||
| Realized gain (loss) on CCS - principal | (13.6) | 62.0 | (122) | |||||||||||||||||
| Translation of US dollar long-term debt | 25.5 | (197.9) | (113) | |||||||||||||||||
| Unrealized gain (loss) on CCS - principal and foreign exchange swaps | (9.1) | 142.1 | (106) | |||||||||||||||||
Other | (1.4) | 2.6 | (154) | |||||||||||||||||
| Foreign exchange gain | 1.4 | 8.8 | (84) | |||||||||||||||||
| CRESCENT POINT ENERGY CORP. | 8 | ||||
Crescent Point has US dollar denominated debt, including short-term London Inter-bank Offered Rate ("LIBOR") loans under its bank credit facilities and US dollar senior guaranteed notes. The Company hedges its foreign exchange exposure using a combination of CCS and foreign exchange swaps. During the three months ended March 31, 2021, the Company realized a $13.6 million loss on CCS related to LIBOR loan maturities.
The Company records foreign exchange gains or losses on the period end translation of US dollar long-term debt and related accrued interest. Crescent Point recorded a foreign exchange gain of $25.5 million on the translation of US dollar long-term debt and accrued interest in the three months ended March 31, 2021, compared to a foreign exchange loss of $197.9 million in the first quarter of 2020. The foreign exchange gain from the translation of US dollar long-term debt and accrued interest in the first quarter of 2021 was attributable to a stronger Canadian dollar at March 31, 2021 as compared to December 31, 2020.
The Company recognized an unrealized loss on foreign exchange derivatives of $9.1 million for the three months ended March 31, 2021 compared to an unrealized gain of $142.1 million in the same period of 2020. The unrealized loss in the first quarter of 2021 reflects the impact of the stronger forward Canadian dollar at March 31, 2021 as compared to December 31, 2020 on the Company's CCS.
Share-based Compensation Expense (Recovery)
| Three months ended March 31 | ||||||||||||||||||||
| ($ millions, except per boe amounts) | 2021 | 2020 | % Change | |||||||||||||||||
| Share-based compensation costs | 31.1 | (8.4) | (470) | |||||||||||||||||
| Realized gain on equity derivative contracts | (9.7) | — | — | |||||||||||||||||
| Unrealized gain on equity derivative contracts | (10.5) | — | — | |||||||||||||||||
| Capitalized | (6.5) | 0.3 | (2,267) | |||||||||||||||||
| Share-based compensation expense (recovery) | 4.4 | (8.1) | (154) | |||||||||||||||||
| Per boe | 0.41 | (0.63) | (165) | |||||||||||||||||
The Company recorded share-based compensation ("SBC") costs of $31.1 million in the first quarter of 2021 compared to a recovery of $8.4 million in the first quarter of 2020. The higher SBC costs in the first quarter of 2021 primarily relates to an increase in the fair value of cash-settled plans as a result of the increase in the Company's share price.
During the three months ended March 31, 2021, the Company recognized an unrealized gain of $10.5 million on equity derivative contracts, primarily due to the increase in the Company's share price at March 31, 2021 compared to December 31, 2020. The Company also recognized a realized gain of $9.7 million on an equity derivative contract which matured during the quarter.
Exhibit 13
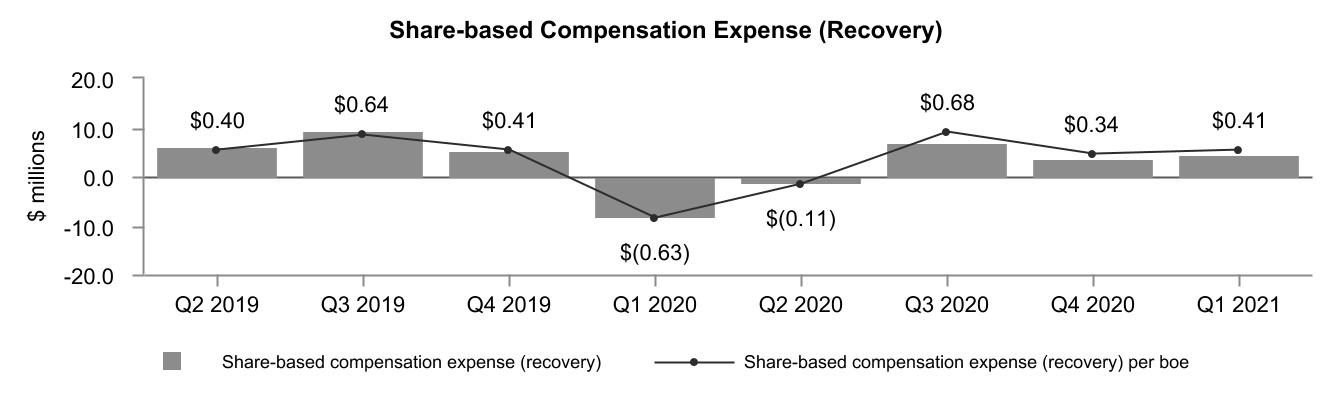
| CRESCENT POINT ENERGY CORP. | 9 | ||||
The following table summarizes the number of Restricted Shares, Employee Share Value Plan ("ESVP") awards, Performance Share Units ("PSUs"), Deferred Share Units ("DSUs") and stock options outstanding:
| March 31, 2021 | March 31, 2020 | |||||||||||||
Restricted Share Bonus Plan (1) | 4,344,190 | 3,080,145 | ||||||||||||
| Employee Share Value Plan | 10,252,056 | — | ||||||||||||
Performance Share Unit Plan (2) | 5,843,263 | 4,602,334 | ||||||||||||
| Deferred Share Unit Plan | 1,314,624 | 335,873 | ||||||||||||
Stock Option Plan (3) | 5,928,149 | 2,748,049 | ||||||||||||
(1)At March 31, 2021, the Company was authorized to issue up to 14,704,927 common shares (March 31, 2020 - 9,209,668 common shares).
(2)Based on underlying units before any effect of performance multipliers.
(3)At March 31, 2021, the weighted average exercise price is $3.91 per share (March 31, 2020 - $7.55 per share).
As of the date of this report, the Company had 4,239,696 restricted shares, 6,770,162 ESVP awards, 5,843,263 PSUs, 1,432,575 DSUs and 6,403,819 stock options outstanding.
Depletion, Depreciation, Amortization and Impairment
| Three months ended March 31 | ||||||||||||||||||||
($ millions, except per boe amounts) | 2021 | 2020 | % Change | |||||||||||||||||
Depletion and depreciation | 136.8 | 235.2 | (42) | |||||||||||||||||
Amortization of exploration and evaluation undeveloped land | 13.8 | 21.7 | (36) | |||||||||||||||||
Depletion, depreciation and amortization | 150.6 | 256.9 | (41) | |||||||||||||||||
| Impairment | — | 3,557.8 | (100) | |||||||||||||||||
Depletion, depreciation, amortization and impairment | 150.6 | 3,814.7 | (96) | |||||||||||||||||
Per boe, before impairment | 14.02 | 19.97 | (30) | |||||||||||||||||
Per boe | 14.02 | 296.61 | (95) | |||||||||||||||||
The Company's depletion, depreciation and amortization (“DD&A”) rate before impairment for the three months ended March 31, 2021 was $14.02 per boe, compared to $19.97 per boe in the first quarter of 2020. The 30 percent decrease in the DD&A rate per boe in the first quarter of 2021 was primarily due to the impairment expense booked in the first quarter of 2020, which reduced the value of the Company's property, plant and equipment ("PP&E").
During the three months ended March 31, 2020, the Company recorded impairment expense of $3.56 billion on its development and production assets primarily due to the significant decrease in forecast benchmark commodity prices.
Exhibit 14
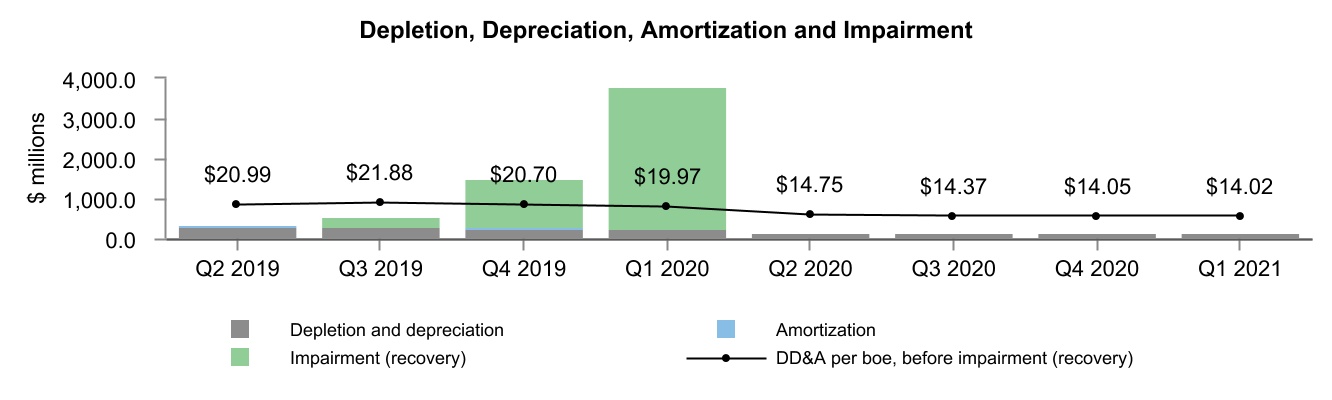
Taxes
| Three months ended March 31 | ||||||||||||||||||||
($ millions) | 2021 | 2020 | % Change | |||||||||||||||||
Current tax expense | — | — | — | |||||||||||||||||
| Deferred tax expense (recovery) | 7.0 | (605.2) | (101) | |||||||||||||||||
Current Tax Expense
In the first quarters of 2021 and 2020, the Company recorded current tax expense of nil. Refer to the Company's Annual Information Form for the year ended December 31, 2020 for information on the Company's expected tax horizon.
| CRESCENT POINT ENERGY CORP. | 10 | ||||
Deferred Tax Expense (Recovery)
In the three months ended March 31, 2021, the Company recorded deferred tax expense of $7.0 million compared to a deferred tax recovery of $605.2 million in the first quarter of 2020. The deferred tax expense in the first quarter of 2021 reflects the pre-tax income recorded in the period. The deferred tax recovery in 2020 primarily relates to the pre-tax loss resulting from the impairment expense recognized, partially offset by the change in estimate for future usable tax pools.
Cash Flow from Operating Activities, Adjusted Funds Flow from Operations, Net Income (Loss) and Adjusted Net Earnings from Operations
| Three months ended March 31 | ||||||||||||||||||||
($ millions, except per share amounts) | 2021 | 2020 | % Change | |||||||||||||||||
Cash flow from operating activities | 303.7 | 329.3 | (8) | |||||||||||||||||
Adjusted funds flow from operations (1) | 262.7 | 309.5 | (15) | |||||||||||||||||
Net income (loss) | 21.7 | (2,324.1) | (101) | |||||||||||||||||
Net income (loss) per share - diluted | 0.04 | (4.40) | (101) | |||||||||||||||||
Adjusted net earnings from operations (1) | 95.1 | 48.7 | 95 | |||||||||||||||||
Adjusted net earnings from operations per share - diluted (1) | 0.18 | 0.09 | 100 | |||||||||||||||||
(1)Non-GAAP financial measure that does not have any standardized meaning prescribed by IFRS and, therefore, may not be comparable with the calculation of similar measures presented by other entities. Refer to the Non-GAAP Financial Measures section in this MD&A for further information.
Cash flow from operating activities decreased from $329.3 million in the first quarter of 2020 to $303.7 million in the first quarter of 2021. Changes in cash flow from operating activities were due to fluctuations in adjusted funds flow from operations ("FFO"), working capital, decommissioning expenditures and transaction costs.
Exhibit 15
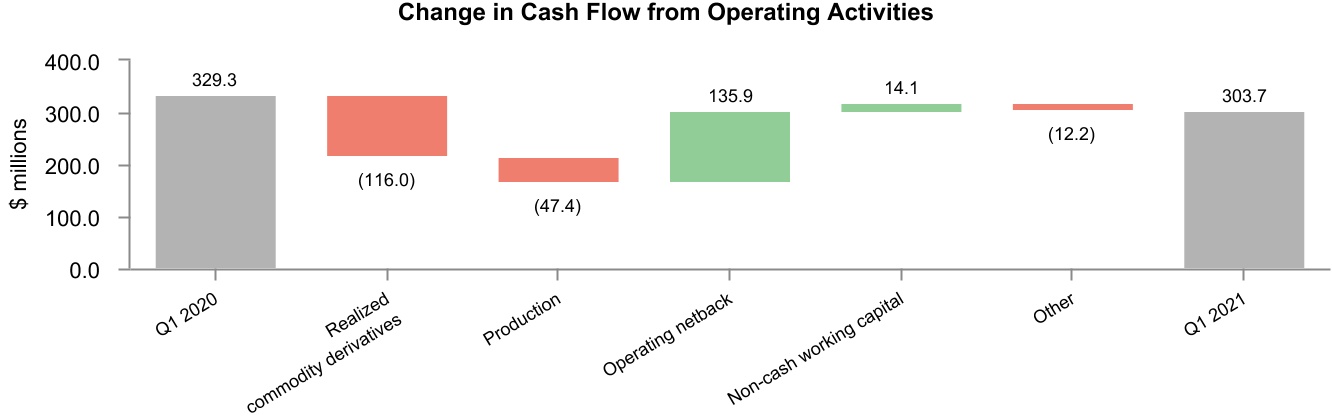
| CRESCENT POINT ENERGY CORP. | 11 | ||||
The Company's adjusted FFO decreased in the three months ended March 31, 2021 to $262.7 million, compared to $309.5 million in the first quarter of 2020. The decrease is primarily a result of the realized commodity derivative loss and the lower production volumes, partially offset by a higher operating netback.
Exhibit 16
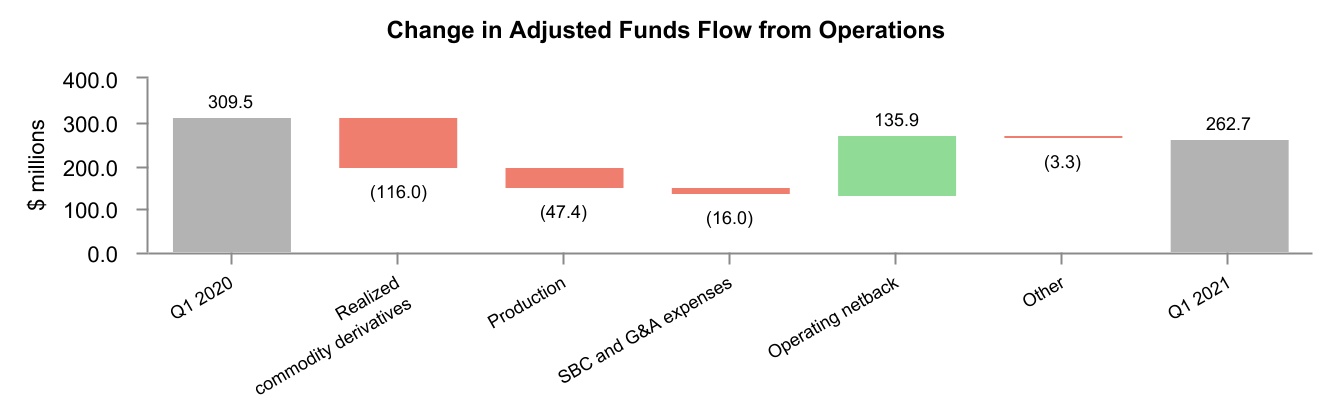
In the three months ended March 31, 2021, the Company reported net income of $21.7 million compared to a net loss of $2.32 billion in the same period in 2020, primarily as a result of the decrease in impairment expense and the unrealized foreign exchange gain on long-term debt, partially offset by fluctuations in deferred taxes, the unrealized derivative loss, other loss and lower adjusted FFO. In the first quarter of 2021, the Company recorded net income per share - diluted of $0.04 compared to a net loss per share - diluted of $4.40 in the first quarter of 2020.
Exhibit 17
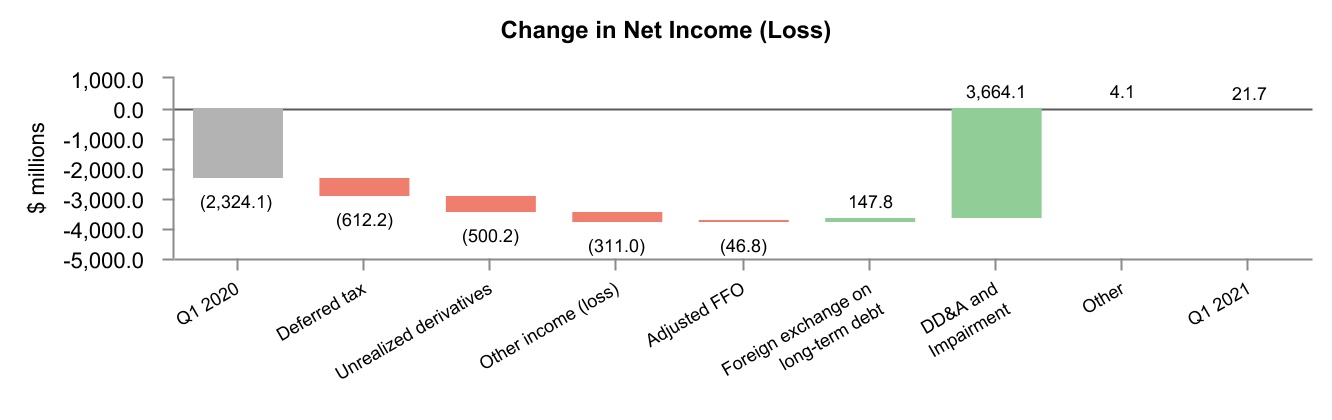
The Company's adjusted net earnings from operations for the three months ended March 31, 2021 was $95.1 million compared to $48.7 million in the first quarter of 2020, primarily due to the decrease in depletion, partially offset by the decrease in adjusted FFO and fluctuations in deferred taxes. Adjusted net earnings from operations per share - diluted for the three months ended March 31, 2021 increased to $0.18 from $0.09 in the first quarter of 2020.
Exhibit 18
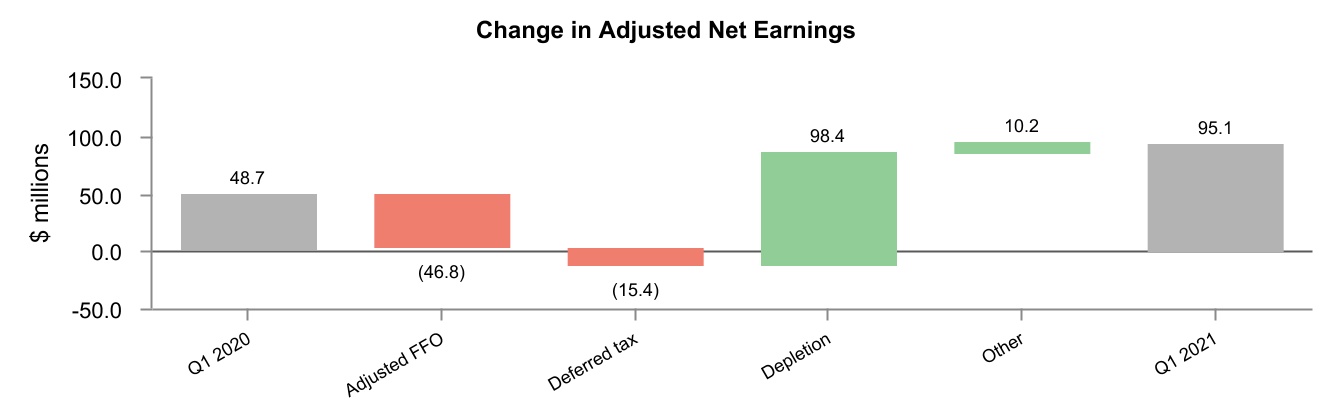
| CRESCENT POINT ENERGY CORP. | 12 | ||||
Dividends
| Three months ended March 31 | ||||||||||||||||||||
| ($ millions, except per share amounts) | 2021 | 2020 | % Change | |||||||||||||||||
| Dividends declared to shareholders | 1.3 | 5.3 | (75) | |||||||||||||||||
| Dividends declared to shareholders per share | 0.0025 | 0.0100 | (75) | |||||||||||||||||
Capital Expenditures
| Three months ended March 31 | ||||||||||||||||||||
($ millions) | 2021 | 2020 | % Change | |||||||||||||||||
Capital acquisitions | — | 1.4 | (100) | |||||||||||||||||
Capital dispositions | (7.2) | (506.9) | (99) | |||||||||||||||||
Development capital expenditures | 119.2 | 320.1 | (63) | |||||||||||||||||
Land expenditures | 0.9 | 0.8 | 13 | |||||||||||||||||
Capitalized administration (1) | 13.6 | 9.4 | 45 | |||||||||||||||||
Corporate assets | 0.7 | 1.2 | (42) | |||||||||||||||||
Total | 127.2 | (174.0) | (173) | |||||||||||||||||
(1)Capitalized administration excludes capitalized equity-settled SBC.
Capital Acquisitions and Dispositions
In the three months ended March 31, 2021, the Company completed minor property dispositions for total net consideration of $7.2 million, resulting in a loss of $17.3 million. These minor property dispositions were completed with full tax pools and no working capital items.
In the three months ended March 31, 2020, the Company's Saskatchewan gas infrastructure disposition closed for consideration of $500.0 million, resulting in a gain of $301.7 million.
Development Capital Expenditures
The Company's development capital expenditures for the three months ended March 31, 2021 were $119.2 million, compared to $320.1 million in the same period in 2020. In the first quarter of 2021, 65 (64.6 net) wells were drilled and $13.6 million was spent on facilities and seismic.
Refer to the Guidance section in this MD&A for Crescent Point's development capital expenditure guidance for 2021.
Exhibit 19
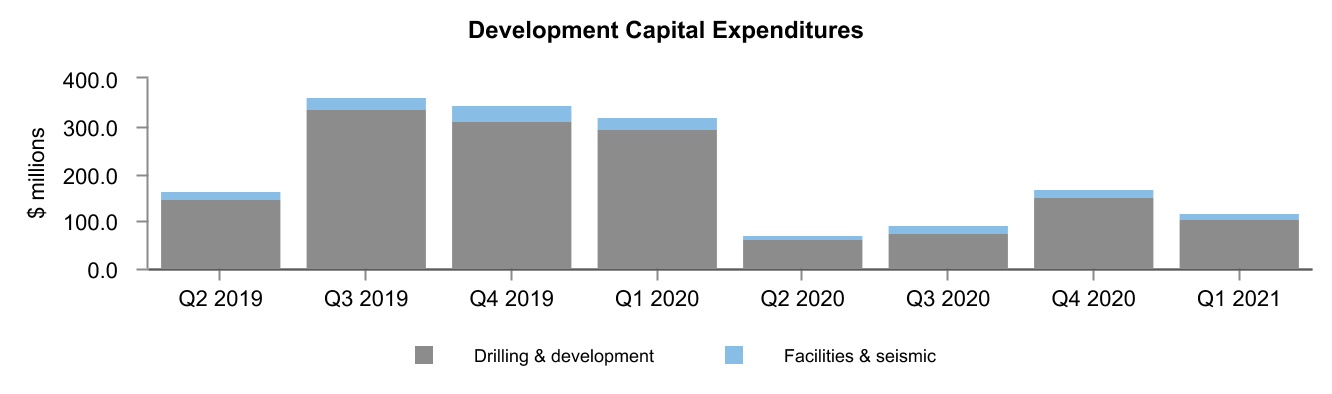
Lease Liability
At March 31, 2021, the Company had $151.7 million of lease liabilities for contracts related to office space, fleet vehicles and equipment.
Decommissioning Liability
The decommissioning liability decreased by $86.5 million in the first quarter of 2021, from $1.02 billion at December 31, 2020 to $936.2 million at March 31, 2021. The decrease primarily relates to changes in inflation and discount rate estimates. The liability was based on estimated undiscounted and uninflated cash flows to settle the obligation of $980.3 million.
| CRESCENT POINT ENERGY CORP. | 13 | ||||
Liquidity and Capital Resources
Capitalization Table ($ millions, except share, per share, ratio and percent amounts) | March 31, 2021 | December 31, 2020 | ||||||||||||
Net debt (1) | 2,013.4 | 2,149.2 | ||||||||||||
Shares outstanding | 530,368,769 | 530,035,922 | ||||||||||||
Market price at end of period (per share) | 5.24 | 2.97 | ||||||||||||
Market capitalization (1) | 2,779.1 | 1,574.2 | ||||||||||||
Enterprise value (1) | 4,792.5 | 3,723.4 | ||||||||||||
Net debt as a percentage of enterprise value | 42 | 58 | ||||||||||||
Adjusted funds flow from operations (1) (2) | 827.6 | 874.4 | ||||||||||||
Net debt to adjusted funds flow from operations (1) | 2.4 | 2.5 | ||||||||||||
(1)Non-GAAP financial measure that does not have any standardized meaning prescribed by IFRS and, therefore, may not be comparable with the calculation of similar measures presented by other entities. Refer to the Non-GAAP Financial Measures section in this MD&A for further information.
(2)The sum of adjusted funds flow from operations for the trailing four quarters.
At March 31, 2021, Crescent Point's enterprise value was $4.79 billion and the Company was capitalized with 58 percent equity compared to $3.72 billion and 42 percent at December 31, 2020, respectively. The Company's net debt to adjusted funds flow from operations ratio at March 31, 2021 decreased to 2.4 times from 2.5 times at December 31, 2020, largely due to the reduction in net debt.
Exhibit 20
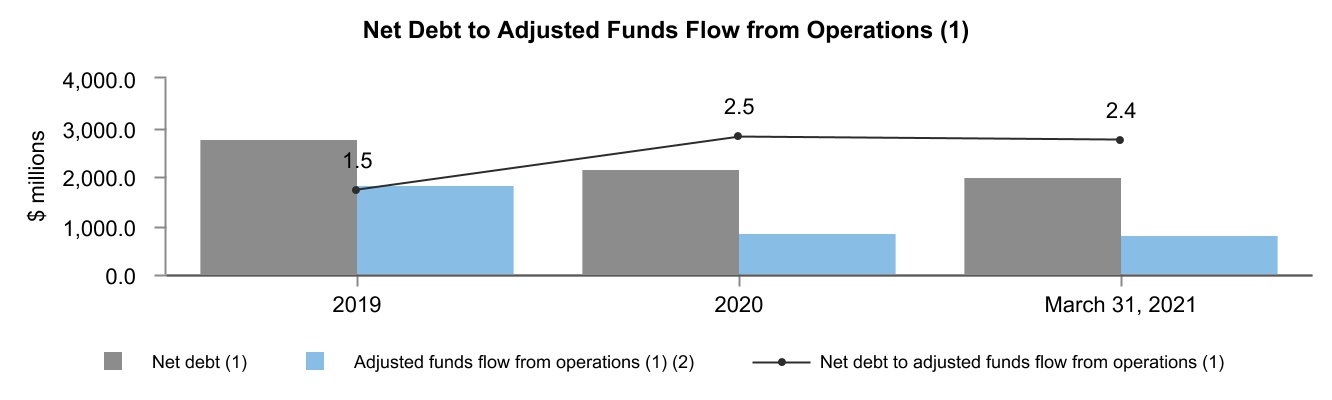
(1)Non-GAAP financial measure that does not have any standardized meaning prescribed by IFRS and, therefore, may not be comparable with the calculation of similar measures presented by other entities. Refer to the Non-GAAP Financial Measures section in this MD&A for further information.
(2)The sum of adjusted funds flow from operations for the trailing four quarters.
The Company has combined revolving credit facilities of $3.00 billion, including a $2.90 billion syndicated unsecured credit facility with fourteen banks and a $100.0 million unsecured operating credit facility with one Canadian chartered bank. The current maturity date of the facilities is October 25, 2023. As at March 31, 2021, the Company had approximately $308.1 million drawn on bank credit facilities, including $5.0 million outstanding pursuant to letters of credit, leaving unutilized borrowing capacity of approximately $2.72 billion including cash of $24.0 million.
The Company has made private offerings of senior guaranteed notes raising total gross proceeds of US$1.26 billion and Cdn$270.0 million. The notes are unsecured and rank pari passu with the Company's bank credit facilities and carry a bullet repayment on maturity. Crescent Point entered into various CCS and foreign exchange swaps to hedge its foreign exchange exposure on its US dollar long-term debt.
| CRESCENT POINT ENERGY CORP. | 14 | ||||
The Company is in compliance with all debt covenants at March 31, 2021 which are listed in the table below:
Covenant Description | Maximum Ratio | March 31, 2021 | ||||||||||||
Senior debt to adjusted EBITDA (1) (2) | 3.5 | 2.5 | ||||||||||||
Total debt to adjusted EBITDA (1) (3) | 4.0 | 2.5 | ||||||||||||
Senior debt to capital (2) (4) | 0.55 | 0.44 | ||||||||||||
(1)Adjusted EBITDA is calculated as earnings before interest, taxes, depletion, depreciation, amortization and impairment, adjusted for certain non-cash items. Adjusted EBITDA is calculated on a trailing twelve month basis adjusted for material acquisitions and dispositions.
(2)Senior debt is calculated as the sum of amounts drawn on the combined facilities, outstanding letters of credit and the principal amount of the senior guaranteed notes.
(3)Total debt is calculated as the sum of senior debt plus subordinated debt. Crescent Point does not have any subordinated debt.
(4)Capital is calculated as the sum of senior debt and shareholder's equity and excludes the effect of unrealized derivative gains or losses and the adoption of IFRS 16.
The Company's working capital deficiency and ongoing working capital requirements are expected to be financed through cash, adjusted funds flow from operations and its bank credit facilities. The Company is continuously monitoring the commodity price environment and actively manages its counterparty exposure to mitigate credit losses and will make adjustments as needed to protect its balance sheet. As at March 31, 2021, Crescent Point has hedged approximately 45 percent of its 2021 oil and liquids production, net of royalty interest, providing further balance sheet protection should commodity prices weaken.
Shareholders' Equity
At March 31, 2021, Crescent Point had 530.4 million common shares issued and outstanding compared to 530.0 million common shares at December 31, 2020. The increase is due to shares issued pursuant to the Restricted Share Bonus Plan and stock option exercises pursuant to the Stock Option Plan.
As of the date of this report, the Company had 581,674,218 common shares outstanding.
Normal Course Issuer Bid ("NCIB")
On March 5, 2021, the Company announced the acceptance by the Toronto Stock Exchange of its notice to implement a NCIB. The NCIB allows the Company to purchase, for cancellation, up to 26,462,509 common shares, or five percent of the Company's public float, as at February 26, 2021. The NCIB commenced on March 9, 2021 and is due to expire on March 8, 2022. The Company continues to evaluate returns to shareholders as market conditions permit in the context of its capital allocation framework, leverage targets and adjusted funds flow generation.
Subsequent Events
Acquisition of Kaybob Duvernay Assets
On April 1, 2021, Crescent Point completed the acquisition of Shell Canada Energy's Kaybob Duvernay assets in Alberta. Including closing adjustments, total consideration was approximately $671.4 million in cash and 50.0 million common shares of Crescent Point, which is expected to be allocated substantially to PP&E. Cash consideration was accessed through the Company's credit facility and included the deposit on acquisition of $45.0 million.
Critical Accounting Estimates
There have been no changes in Crescent Point's critical accounting estimates in the three months ended March 31, 2021. Further information on the Company's critical accounting policies and estimates can be found in the notes to the annual consolidated financial statements and MD&A for the year ended December 31, 2020.
| CRESCENT POINT ENERGY CORP. | 15 | ||||
Summary of Quarterly Results
| 2021 | 2020 | 2019 | ||||||||||||||||||||||||||||||||||||||||||||||||
| ($ millions, except per share amounts) | Q1 | Q4 | Q3 | Q2 | Q1 | Q4 | Q3 | Q2 | ||||||||||||||||||||||||||||||||||||||||||
| Oil and gas sales | 630.2 | 447.8 | 437.0 | 259.0 | 548.4 | 729.3 | 769.1 | 945.2 | ||||||||||||||||||||||||||||||||||||||||||
| Average daily production | ||||||||||||||||||||||||||||||||||||||||||||||||||
| Crude oil (bbls/d) | 95,276 | 87,512 | 89,260 | 94,900 | 111,928 | 111,394 | 119,011 | 134,951 | ||||||||||||||||||||||||||||||||||||||||||
| NGLs (bbls/d) | 13,319 | 13,033 | 13,458 | 14,210 | 17,493 | 21,406 | 20,627 | 20,841 | ||||||||||||||||||||||||||||||||||||||||||
| Natural gas (mcf/d) | 64,732 | 64,033 | 63,988 | 70,391 | 71,451 | 74,347 | 96,422 | 100,101 | ||||||||||||||||||||||||||||||||||||||||||
| Total (boe/d) | 119,384 | 111,217 | 113,383 | 120,842 | 141,330 | 145,191 | 155,708 | 172,476 | ||||||||||||||||||||||||||||||||||||||||||
Net income (loss) | 21.7 | (51.2) | 0.5 | (145.1) | (2,324.1) | (932.1) | (301.7) | 198.6 | ||||||||||||||||||||||||||||||||||||||||||
| Net income (loss) per share | 0.04 | (0.10) | — | (0.27) | (4.40) | (1.73) | (0.55) | 0.36 | ||||||||||||||||||||||||||||||||||||||||||
| Net income (loss) per share – diluted | 0.04 | (0.10) | — | (0.27) | (4.40) | (1.73) | (0.55) | 0.36 | ||||||||||||||||||||||||||||||||||||||||||
Adjusted net earnings (loss) from operations (1) | 95.1 | 85.6 | 71.0 | (27.9) | 48.7 | 49.9 | 32.6 | 146.0 | ||||||||||||||||||||||||||||||||||||||||||
Adjusted net earnings (loss) from operations per share (1) | 0.18 | 0.16 | 0.13 | (0.05) | 0.09 | 0.09 | 0.06 | 0.27 | ||||||||||||||||||||||||||||||||||||||||||
Adjusted net earnings (loss) from operations per share – diluted (1) | 0.18 | 0.16 | 0.13 | (0.05) | 0.09 | 0.09 | 0.06 | 0.27 | ||||||||||||||||||||||||||||||||||||||||||
| Cash flow from operating activities | 303.7 | 245.1 | 219.5 | 66.6 | 329.3 | 396.5 | 402.2 | 527.4 | ||||||||||||||||||||||||||||||||||||||||||
Adjusted funds flow from operations (1) | 262.7 | 220.2 | 235.7 | 109.0 | 309.5 | 418.4 | 389.2 | 503.8 | ||||||||||||||||||||||||||||||||||||||||||
Adjusted working capital (deficiency) (2) | (55.9) | (93.4) | (65.5) | (38.7) | (190.5) | (126.1) | (100.2) | (124.7) | ||||||||||||||||||||||||||||||||||||||||||
| Total assets | 6,610.7 | 6,645.9 | 6,864.2 | 7,022.8 | 7,209.7 | 10,091.8 | 12,073.3 | 12,430.7 | ||||||||||||||||||||||||||||||||||||||||||
| Total liabilities | 3,777.5 | 3,823.1 | 3,952.3 | 4,093.0 | 4,097.6 | 4,749.1 | 5,685.2 | 5,751.7 | ||||||||||||||||||||||||||||||||||||||||||
Net debt (1) | 2,013.4 | 2,149.2 | 2,189.2 | 2,308.6 | 2,327.9 | 2,765.3 | 3,360.0 | 3,553.5 | ||||||||||||||||||||||||||||||||||||||||||
| Weighted average shares – diluted (millions) | 536.6 | 534.4 | 532.9 | 531.2 | 528.3 | 538.7 | 548.0 | 548.2 | ||||||||||||||||||||||||||||||||||||||||||
| Capital acquisitions | — | — | — | — | 1.4 | 13.5 | 0.1 | — | ||||||||||||||||||||||||||||||||||||||||||
| Capital dispositions | (7.2) | 1.1 | (0.9) | (1.5) | (506.9) | (677.3) | (199.3) | (58.3) | ||||||||||||||||||||||||||||||||||||||||||
| Development capital expenditures | 119.2 | 169.4 | 93.3 | 72.0 | 320.1 | 343.4 | 362.3 | 166.2 | ||||||||||||||||||||||||||||||||||||||||||
| Dividends declared | 1.3 | 1.4 | 1.3 | 1.4 | 5.3 | 5.4 | 5.5 | 5.5 | ||||||||||||||||||||||||||||||||||||||||||
| Dividends declared per share | 0.0025 | 0.0025 | 0.0025 | 0.0025 | 0.0100 | 0.0100 | 0.0100 | 0.0100 | ||||||||||||||||||||||||||||||||||||||||||
(1)Non-GAAP financial measure that does not have any standardized meaning prescribed by IFRS and, therefore, may not be comparable with the calculation of similar measures presented by other entities. Refer to the Non-GAAP Financial Measures section in this MD&A for further information.
(2)Adjusted working capital deficiency is calculated as accounts payable and accrued liabilities and long-term compensation liability net of equity derivative contracts, less cash, accounts receivable, prepaids and deposits, including deposit on acquisition and long-term investments.
Over the past eight quarters, the Company's oil and gas sales have fluctuated due to volatility in the Cdn$ WTI benchmark price, changes in production and fluctuations in corporate oil price differentials. The Company's production has fluctuated due to changes in its development capital spending levels, dispositions, voluntary shut-ins and natural declines.
Net income (loss) has fluctuated primarily due to changes in adjusted funds flow from operations, unrealized derivative gains and losses, which fluctuate with the changes in forward market prices and foreign exchange rates, PP&E impairments recorded in the first quarter of 2020 and fourth quarter of 2019, gains and losses on capital dispositions, and fluctuations in deferred tax expense (recovery).
Adjusted net earnings (loss) from operations has fluctuated over the past eight quarters primarily due to changes in adjusted funds flow from operations, depletion and share-based compensation expense along with associated fluctuations in deferred tax expense (recovery).
Capital expenditures have also fluctuated throughout this period due to the timing of acquisitions, dispositions and the Company's development capital program.
| CRESCENT POINT ENERGY CORP. | 16 | ||||
Internal Control Update
Crescent Point is required to comply with Multilateral Instrument 52-109 Certification of Disclosure on Issuers' Annual and Interim Filings. The certificate requires that Crescent Point disclose in the interim MD&A any weaknesses or changes in Crescent Point's internal control over financial reporting that occurred during the period that have materially affected, or are reasonably likely to materially affect Crescent Point's internal controls over financial reporting. Crescent Point confirms that no such weaknesses or changes were identified in the Company's internal controls over financial reporting during the first quarter of 2021.
Guidance
Crescent Point's guidance for 2021 is as follows:
Total Annual Average Production (boe/d) (1) | 132,000 - 136,000 | |||||||||||||
| Capital Expenditures | ||||||||||||||
| Development capital expenditures ($ million) | $575 - $625 | |||||||||||||
| Capitalized G&A ($ million) | $35 | |||||||||||||
Total ($ million) (2) | $610 - $660 | |||||||||||||
| Other Information for 2021 Guidance | ||||||||||||||
Reclamation activities ($ million) (3) | $15 | |||||||||||||
| Capital lease payments ($ million) | $20 | |||||||||||||
| Annual operating expenses | $625 - $645 million ($12.75 - $13.25/boe) | |||||||||||||
| Royalties | 11.5% - 12.5% | |||||||||||||
(1)Total annual average production (boe/d) is comprised of ~87% Oil & NGLs and 13% Natural Gas.
(2)Land expenditures and net property acquisitions and dispositions are not included. Development capital expenditures is allocated as follows: 87% drilling & development and 13% facilities & seismic.
(3)Reflects Crescent Point's portion of its total expected budget.
Crescent Point will continue to evaluate opportunities to further optimize its portfolio, while focusing on returns, capital discipline and cost saving initiatives to enhance value for shareholders.
Additional information including risk factors relating to Crescent Point and the Company's response to COVID-19 is presented in the Company's December 31, 2020 Annual Information Form and MD&A for the year ended December 31, 2020, which along with other relevant documents are available on SEDAR at www.sedar.com and on EDGAR at www.sec.gov/edgar.shtml.
| CRESCENT POINT ENERGY CORP. | 17 | ||||
Non-GAAP Financial Measures
Throughout this MD&A, the Company uses the terms “operating netback”, “netback”, “adjusted funds flow from operations”, "excess cash flow", “adjusted net earnings from operations”, “adjusted net earnings from operations per share”, “adjusted net earnings from operations per share - diluted”, “net debt”, “net debt to adjusted funds flow from operations”, “market capitalization” and “enterprise value”. These terms do not have any standardized meaning as prescribed by IFRS and, therefore, may not be comparable with the calculation of similar measures presented by other issuers.
Operating netback is calculated on a per boe basis as oil and gas sales, less royalties, operating and transportation expenses. Netback is calculated on a per boe basis as operating netback plus realized commodity derivative gains and losses. Operating netback and netback are common metrics used in the oil and gas industry and are used by management to measure operating results on a per boe basis to better analyze performance against prior periods on a comparable basis. The calculations of operating netback and netback are shown in the Results of Operations section in this MD&A.
Adjusted funds flow from operations is calculated based on cash flow from operating activities before changes in non-cash working capital, transaction costs and decommissioning expenditures funded by the Company. Transaction costs are excluded as they vary based on the Company's acquisition and disposition activity and to ensure that this metric is more comparable between periods. Decommissioning expenditures are discretionary and are excluded as they may vary based on the stage of the Company's assets and operating areas. Management utilizes adjusted funds flow from operations as a key measure to assess the ability of the Company to finance dividends, operating activities, capital expenditures and debt repayments. Adjusted funds flow from operations as presented is not intended to represent cash flow from operating activities, net earnings or other measures of financial performance calculated in accordance with IFRS. Excess cash flow is defined as adjusted funds flow from operations less capital expenditures, payments on lease liability, asset retirement obligations, dividends and other cash items (excluding net acquisitions and dispositions). Management utilizes excess cash flow as key measures to assess the ability of the Company to finance dividends, potential share repurchases, debt repayments and returns-based growth.
The following table reconciles cash flow from operating activities to adjusted funds flow from operations:
| Three months ended March 31 | ||||||||||||||||||||
($ millions) | 2021 | 2020 | % Change | |||||||||||||||||
Cash flow from operating activities | 303.7 | 329.3 | (8) | |||||||||||||||||
Changes in non-cash working capital | (47.2) | (33.1) | 43 | |||||||||||||||||
Transaction costs | 0.1 | 4.7 | (98) | |||||||||||||||||
Decommissioning expenditures (1) | 6.1 | 8.6 | (29) | |||||||||||||||||
Adjusted funds flow from operations | 262.7 | 309.5 | (15) | |||||||||||||||||
(1) Excludes amounts received from government subsidy programs.
Adjusted net earnings from operations is calculated based on net income before amortization of exploration and evaluation ("E&E") undeveloped land, impairment or impairment recoveries, unrealized derivative gains or losses, unrealized foreign exchange gain or loss on translation of hedged US dollar long-term debt, unrealized gains or losses on long-term investments, gains or losses on the sale of long-term investments and gains or losses on capital acquisitions and dispositions. Adjusted net earnings from operations per share and adjusted net earnings from operations per share - diluted are calculated as adjusted net earnings from operations divided by the number of weighted average basic and diluted shares outstanding, respectively. Management utilizes adjusted net earnings from operations to present a measure of financial performance that is more comparable between periods. Adjusted net earnings from operations as presented is not intended to represent net earnings or other measures of financial performance calculated in accordance with IFRS.
The following table reconciles net income to adjusted net earnings from operations:
| Three months ended March 31 | ||||||||||||||||||||
($ millions) | 2021 | 2020 | % Change | |||||||||||||||||
| Net income (loss) | 21.7 | (2,324.1) | (101) | |||||||||||||||||
Amortization of E&E undeveloped land | 13.8 | 21.7 | (36) | |||||||||||||||||
Impairment | — | 3,557.8 | (100) | |||||||||||||||||
Unrealized derivative (gains) losses | 81.7 | (418.5) | (120) | |||||||||||||||||
| Unrealized foreign exchange (gain) loss on translation of hedged US dollar long-term debt | (11.9) | 135.9 | (109) | |||||||||||||||||
| Unrealized (gain) loss on long-term investments | (2.2) | 5.5 | (140) | |||||||||||||||||
| Net (gain) loss on capital dispositions | 17.3 | (307.5) | (106) | |||||||||||||||||
| Deferred tax relating to adjustments | (25.3) | (622.1) | (96) | |||||||||||||||||
| Adjusted net earnings from operations | 95.1 | 48.7 | 95 | |||||||||||||||||
Net debt is calculated as long-term debt plus accounts payable and accrued liabilities and long-term compensation liability net of equity derivative contracts, less cash, accounts receivable, prepaids and deposits, including deposit on acquisition, long-term investments, excluding the unrealized foreign exchange on translation of US dollar long-term debt. Management utilizes net debt as a key measure to assess the liquidity of the Company.
| CRESCENT POINT ENERGY CORP. | 18 | ||||
The following table reconciles long-term debt to net debt:
($ millions) | March 31, 2021 | December 31, 2020 | % Change | |||||||||||||||||
Long-term debt (1) | 2,149.4 | 2,259.6 | (5) | |||||||||||||||||
Accounts payable and accrued liabilities | 369.0 | 311.6 | 18 | |||||||||||||||||
Long-term compensation liability (2) | 32.8 | 16.3 | 101 | |||||||||||||||||
Cash | (24.0) | (8.8) | 173 | |||||||||||||||||
Accounts receivable | (251.2) | (200.5) | 25 | |||||||||||||||||
Prepaids and deposits (3) | (66.0) | (22.7) | 191 | |||||||||||||||||
Long-term investments | (4.7) | (2.5) | 88 | |||||||||||||||||
Excludes: | ||||||||||||||||||||
Unrealized foreign exchange on translation of US dollar long-term debt | (191.9) | (203.8) | (6) | |||||||||||||||||
Net debt | 2,013.4 | 2,149.2 | (6) | |||||||||||||||||
(1)Includes current portion of long-term debt.
(2)Includes current portion of long-term compensation liability and is net of equity derivative contracts.
(3)Includes deposit on acquisition.
Net debt to adjusted funds flow from operations is calculated as the period end net debt divided by the sum of adjusted funds flow from operations for the trailing four quarters. The ratio of net debt to adjusted funds flow from operations is used by management to measure the Company's overall debt position and to measure the strength of the Company's balance sheet. Crescent Point monitors this ratio and uses this as a key measure in making decisions regarding financing, capital spending and dividend levels.
Market capitalization is calculated by applying the period end closing share trading price to the number of shares outstanding. Market capitalization is an indication of equity valuation. Refer to the Liquidity and Capital Resources section in this MD&A for further information.
Enterprise value is calculated as market capitalization plus net debt. Management uses enterprise value to assess the valuation of the Company. Refer to the Liquidity and Capital Resources section in this MD&A for further information.
Management believes the presentation of the Non-GAAP measures above provide useful information to investors and shareholders as the measures provide increased transparency and the ability to better analyze performance against prior periods on a comparable basis.
| CRESCENT POINT ENERGY CORP. | 19 | ||||
Forward-Looking Information
Certain statements contained in this management's discussion and analysis constitute forward-looking statements and are based on Crescent Point's beliefs and assumptions based on information available at the time the assumption was made. By its nature, such forward-looking information involves known and unknown risks, uncertainties and other factors that may cause actual results or events to differ materially from those anticipated in such forward-looking statements. The Company believes the expectations reflected in those forward-looking statements are reasonable but no assurance can be given that these expectations will prove to be correct and such forward-looking statements should not be unduly relied upon. These statements are effective only as of the date of this report. Crescent Point undertakes no obligation to update publicly or revise any forward-looking statements, whether as a result of new information, future events or otherwise, unless required to do so pursuant to applicable law.
Any “financial outlook” or “future oriented financial information” in this management’s discussion and analysis, as defined by applicable securities legislation, has been approved by management of Crescent Point. Such financial outlook or future oriented financial information is provided for the purpose of providing information about management’s current expectations and plans relating to the future. Readers are cautioned that reliance on such information may not be appropriate for other purposes.
Certain statements contained in this report, including statements related to Crescent Point's capital expenditures, projected asset growth, view and outlook toward future commodity prices, drilling activity and statements that contain words such as "could", "should", "can", "anticipate", "expect", "believe", "will", "may", “projected”, “sustain”, “continues”, “strategy”, “potential”, “projects”, “grow”, “take advantage”, “estimate” and similar expressions and statements relating to matters that are not historical facts constitute "forward-looking information" within the meaning of applicable Canadian securities legislation. The material assumptions and factors in making these forward-looking statements are disclosed in this MD&A under the headings "Overview", "Commodity Derivatives", “Liquidity and Capital Resources” and “Guidance”.
In particular, forward-looking statements include:
l Crescent Point's approach to proactively manage the risk exposure inherent in movements in the price of crude oil, natural gas, the Company's share price, the US/Cdn dollar exchange rate and interest rate movements through the use of derivatives with investment-grade counterparties; l Crescent Point's use of derivatives to reduce the volatility of the selling price of its crude oil and natural gas production and how this provides a measure of stability to cash flow; l The extent and effectiveness of hedges; l Crescent Point’s 2021 production and development capital expenditures guidance; l Other information for Crescent Point’s 2021 Outlook, including capitalized G&A, reclamation activities, capital lease payments, operating expenses and royalties; l Evaluation of returns to shareholders as market conditions permit in the context of a capital allocation framework, leverage targets and adjusted funds flow generation; | l The Company's liquidity and financial flexibility; l NCIB expectations; l The Company evaluating opportunities to further enhance its asset portfolio through strategic acquisitions and dispositions; l The Company evaluating opportunities to further optimize its portfolio, while focusing on returns, capital discipline and cost saving initiatives to enhance value for shareholders; l How the Company expects to finance its working capital deficiency and ongoing working capital requirements; l Estimated undiscounted cash flows to settle decommissioning liability; l Further adjustments in light of the commodity price environment to protect the Company's balance sheet as necessary; l Expected production, enhanced free cash flow and other attributes of the Kaybob Duvernay assets; and l COVID-19 impacts and response measures. | ||||
This information contains certain forward-looking estimates that involve substantial known and unknown risks and uncertainties, many of which are beyond Crescent Point's control. Such risks and uncertainties include, but are not limited to: financial risk of marketing reserves at an acceptable price given market conditions; volatility in market prices for oil and natural gas, decisions or actions of OPEC and non-OPEC countries in respect of supplies of oil and gas; delays in business operations or delivery of services due to pipeline restrictions, rail blockades, outbreaks, blowouts and business closures and social distancing measures mandated by public health authorities in response to COVID-19; the risk of carrying out operations with minimal environmental impact; industry conditions including changes in laws and regulations including the adoption of new environmental laws and regulations and changes in how they are interpreted and enforced; uncertainties associated with estimating oil and natural gas reserves; risks and uncertainties related to oil and gas interests and operations on Indigenous lands; economic risk of finding and producing reserves at a reasonable cost; uncertainties associated with partner plans and approvals; operational matters related to non-operated properties; increased competition for, among other things, capital, acquisitions of reserves and undeveloped lands; competition for and availability of qualified personnel or management; incorrect assessments of the value and likelihood of acquisitions and dispositions, and exploration and development programs; unexpected geological, technical, drilling, construction, processing and transportation problems; availability of insurance; fluctuations in foreign exchange and interest rates; stock market volatility; general economic, market and business conditions, including uncertainty in the demand for oil and gas and economic activity in general as a result of the COVID-19 pandemic; uncertainties associated with regulatory approvals; uncertainty of government policy changes; the impact of the implementation of the Canada-United States-Mexico Agreement; uncertainty regarding the benefits and costs of dispositions; failure to complete acquisitions and dispositions; uncertainties associated with credit facilities and counterparty credit risk; changes in income tax laws, tax laws, crown royalty rates and incentive programs relating to the oil and gas industry; the wide-ranging impacts of the COVID-19 pandemic, including on demand, health and supply chain; and other factors, many of which are outside the control of the Company.
| CRESCENT POINT ENERGY CORP. | 20 | ||||
Therefore, Crescent Point's actual results, performance or achievement could differ materially from those expressed in, or implied by, these forward-looking estimates and if such actual results, performance or achievements transpire or occur, or if any of them do so, there can be no certainty as to what benefits or detriments Crescent Point will derive therefrom.
Crude oil and natural gas information is provided in accordance with the United States Financial Accounting Standards Board ("FASB") Topic 932 - "Extractive Activities - Oil and Gas" and where applicable, financial information is prepared in accordance with International Financial Reporting Standards ("IFRS").
For the years ended December 31, 2020, 2019, 2018, 2017 and 2016 the Company filed its reserves information under National Instrument 51-101 - "Standards of Disclosure of Oil and Gas Activities" (NI 51-101), which prescribes the standards for the preparation and disclosure of reserves and related information for companies listed in Canada.
There are significant differences to the type of volumes disclosed and the basis from which the volumes are economically determined under the United States Securities and Exchange Commission (“SEC”) requirements and NI 51-101. The SEC requires disclosure of net reserves, after royalties, using trailing 12-month average prices and current costs; whereas NI 51-101 requires Company gross reserves, before royalties, using forecast pricing and costs. Therefore the difference between the reported numbers under the two disclosure standards can be material.
Barrels of oil equivalent (“boe”) may be misleading, particularly if used in isolation. A boe conversion ratio of 6 Mcf : 1 Bbl is based on an energy equivalency conversion method primarily applicable at the burner tip and does not represent a value equivalency at the wellhead. Given that the value ratio based on the current price of crude oil as compared to natural gas is significantly different from the energy equivalency of oil, utilizing a conversion on a 6:1 basis may be misleading as an indication of value. Oil and gas metrics such as operating netback and netback do not have standardized meaning and as such may not be reliable, and should not be used to make comparisons.
The Company retained McDaniel & Associates Consultants Ltd. ("McDaniel") to evaluate the reserves associated with the Kaybob Duvernay assets and prepare the related independent evaluators report (the "McDaniel Report").
The statement of reserves data and other oil and gas information, associated with the Kaybob Duvernay assets, set forth in this MD&A is dated February 11, 2021. The effective date of the reserves information provided for the Kaybob Duvernay assets herein is December 31, 2020, unless otherwise indicated, and the preparation date is February 11, 2021. McDaniel prepared the McDaniel Report in accordance with the standards contained in NI 51-101 and the COGE Handbook that were in effect at the relevant time. Production of approximately 30,000 boe/d associated with the Kaybob Duvernay assets consists of 57% condensate, 8% NGL and 35% shale gas. NI 51-101 includes condensate within the product type of natural gas liquids. The Company has disclosed condensate separately from other natural gas liquids in this MD&A since the price of condensate as compared to other natural gas liquids is currently significantly higher and the Company believes that presenting the two commodities separately provides a more accurate description of its operations and results therefrom.
The Company’s aggregate average production for the past eight quarters and the references to “natural gas” and “crude oil”, reported in this MD&A consist of the following product types, as defined in NI 51-101 and using a conversion ratio of 6 Mcf : 1 Bbl where applicable:
| 2021 | 2020 | 2019 | ||||||||||||||||||||||||
| Q1 | Q4 | Q3 | Q2 | Q1 | Q4 | Q3 | Q2 | |||||||||||||||||||
| Light & Medium Crude Oil (bbl/d) | 20,699 | 21,025 | 18,846 | 18,952 | 24,566 | 25,366 | 29,265 | 32,420 | ||||||||||||||||||
| Heavy Crude Oil (bbl/d) | 4,118 | 4,276 | 4,223 | 4,269 | 4,752 | 4,819 | 4,722 | 4,633 | ||||||||||||||||||
| Tight Oil (bbl/d) | 70,459 | 62,211 | 66,191 | 71,679 | 82,610 | 81,209 | 85,024 | 97,898 | ||||||||||||||||||
| Total Crude Oil (bbl/d) | 95,276 | 87,512 | 89,260 | 94,900 | 111,928 | 111,394 | 119,011 | 134,951 | ||||||||||||||||||
| NGLs (bbl/d) | 13,319 | 13,033 | 13,458 | 14,210 | 17,493 | 21,406 | 20,627 | 20,841 | ||||||||||||||||||
| Shale Gas (Mcf/d) | 53,198 | 52,370 | 50,776 | 57,254 | 54,312 | 56,446 | 76,979 | 79,284 | ||||||||||||||||||
| Conventional Natural Gas (Mcf/d) | 11,534 | 11,663 | 13,212 | 13,137 | 17,139 | 17,901 | 19,443 | 20,817 | ||||||||||||||||||
| Total Natural Gas (Mcf/d) | 64,732 | 64,033 | 63,988 | 70,391 | 71,451 | 74,347 | 96,422 | 100,101 | ||||||||||||||||||
| Total (boe/d) | 119,384 | 111,217 | 113,383 | 120,842 | 141,330 | 145,191 | 155,708 | 172,476 | ||||||||||||||||||
| CRESCENT POINT ENERGY CORP. | 21 | ||||
Directors Barbara Munroe, Chair (6) Laura Cillis (1) (2) James Craddock (1) (3) (5) John Dielwart (3) (4) Ted Goldthorpe (1) (5) Mike Jackson (1) (2) (5) Jennifer Koury (2) (4) Francois Langlois (3) (4) (5) Myron Stadnyk (2) (3) (4) Craig Bryksa (4) (1) Member of the Audit Committee of the Board of Directors (2) Member of the Human Resources and Compensation Committee of the Board of Directors (3) Member of the Reserves Committee of the Board of Directors (4) Member of the Environment, Safety and Sustainability Committee of the Board of Directors (5) Member of the Corporate Governance and Nominating Committee (6) Chair of the Board serves in an ex officio capacity on each Committee Officers Craig Bryksa President and Chief Executive Officer Ken Lamont Chief Financial Officer Ryan Gritzfeldt Chief Operating Officer Brad Borggard Senior Vice President, Corporate Planning and Capital Markets Mark Eade Senior Vice President, General Counsel and Corporate Secretary Garret Holt Senior Vice President, Corporate Development Head Office Suite 2000, 585 - 8th Avenue S.W. Calgary, Alberta T2P 1G1 Tel: (403) 693-0020 Fax: (403) 693-0070 Toll Free: (888) 693-0020 Banker The Bank of Nova Scotia Calgary, Alberta | Auditor PricewaterhouseCoopers LLP Calgary, Alberta Legal Counsel Norton Rose Fulbright Canada LLP Calgary, Alberta Evaluation Engineers GLJ Ltd. Calgary, Alberta Sproule Associates Ltd. Calgary, Alberta Registrar and Transfer Agent Investors are encouraged to contact Crescent Point's Registrar and Transfer Agent for information regarding their security holdings: Computershare Trust Company of Canada 600, 530 - 8th Avenue S.W. Calgary, Alberta T2P 3S8 Tel: (403) 267-6800 Stock Exchanges Toronto Stock Exchange - TSX New York Stock Exchange - NYSE Stock Symbol CPG Investor Contacts Brad Borggard Senior Vice President, Corporate Planning and Capital Markets (403) 693-0020 Shant Madian Vice President, Investor Relations and Corporate Communications (403) 693-0020 | |||||||
| CRESCENT POINT ENERGY CORP. | 22 | ||||
- 1 -
Exhibit 99.3
FORM 52-109F2
CERTIFICATION OF INTERIM FILINGS
FULL CERTIFICATE
I, Craig Bryksa, President and Chief Executive Officer of Crescent Point Energy Corp., certify the following:
1.Review: I have reviewed the interim financial report and interim MD&A (together, the “interim filings”) of Crescent Point Energy Corp. (the “issuer”) for the interim period ended March 31, 2021.
2. No misrepresentations: Based on my knowledge, having exercised reasonable diligence, the interim filings do not contain any untrue statement of a material fact or omit to state a material fact required to be stated or that is necessary to make a statement not misleading in light of the circumstances under which it was made, with respect to the period covered by the interim filings.
3. Fair presentation: Based on my knowledge, having exercised reasonable diligence, the interim financial report together with the other financial information included in the interim filings fairly present in all material respects the financial condition, financial performance and cash flows of the issuer, as of the date of and for the periods presented in the interim filings.
4. Responsibility: The issuer’s other certifying officer and I are responsible for establishing and maintaining disclosure controls and procedures (DC&P) and internal control over financial reporting (ICFR), as those terms are defined in National Instrument 52‑109 Certification of Disclosure in Issuers’ Annual and Interim Filings, for the issuer.
5. Design: Subject to the limitations, if any, described in paragraphs 5.2 and 5.3, the issuer’s other certifying officer and I have, as at the end of the period covered by the interim filings:
(a) designed DC&P, or caused it to be designed under our supervision, to provide reasonable assurance that:
(i) material information relating to the issuer is made known to us by others, particularly during the period in which the interim filings are being prepared; and
(ii) information required to be disclosed by the issuer in its annual filings, interim filings or other reports filed or submitted by it under securities legislation is recorded, processed, summarized and reported within the time periods specified in securities legislation; and
(b) designed ICFR, or caused it to be designed under our supervision, to provide reasonable assurance regarding the reliability of financial reporting and the preparation of financial statements for external purposes in accordance with the issuer’s GAAP.
5.1 Control framework: The control framework the issuer’s other certifying officer and I used to design the issuer’s ICFR is the Internal Control – Integrated Framework (“COSO Framework”) published by The Committee of Sponsoring Organizations of the Treadway Commission (“COSO”).
- 2 -
5.2 ICFR ‑ material weakness relating to design: N/A.
5.3 Limitation on scope of design: N/A.
6. Reporting changes in ICFR: The issuer has disclosed in its interim MD&A any change in the issuer’s ICFR that occurred during the period beginning on January 1, 2021 and ended on March 31, 2021 that has materially affected, or is reasonably likely to materially affect, the issuer’s ICFR.
Date: May 12, 2021
/s/ Craig Bryksa
_______________________________
Craig Bryksa
President and Chief Executive Officer
Exhibit 99.4
FORM 52-109F2
CERTIFICATION OF INTERIM FILINGS
FULL CERTIFICATE
I, Ken Lamont, Chief Financial Officer of Crescent Point Energy Corp., certify the following:
1.Review: I have reviewed the interim financial report and interim MD&A (together, the “interim filings”) of Crescent Point Energy Corp. (the “issuer”) for the interim period ended March 31, 2021.
2. No misrepresentations: Based on my knowledge, having exercised reasonable diligence, the interim filings do not contain any untrue statement of a material fact or omit to state a material fact required to be stated or that is necessary to make a statement not misleading in light of the circumstances under which it was made, with respect to the period covered by the interim filings.
3. Fair presentation: Based on my knowledge, having exercised reasonable diligence, the interim financial report together with the other financial information included in the interim filings fairly present in all material respects the financial condition, financial performance and cash flows of the issuer, as of the date of and for the periods presented in the interim filings.
4. Responsibility: The issuer’s other certifying officer and I are responsible for establishing and maintaining disclosure controls and procedures (DC&P) and internal control over financial reporting (ICFR), as those terms are defined in National Instrument 52‑109 Certification of Disclosure in Issuers’ Annual and Interim Filings, for the issuer.
5. Design: Subject to the limitations, if any, described in paragraphs 5.2 and 5.3, the issuer’s other certifying officer and I have, as at the end of the period covered by the interim filings:
(a) designed DC&P, or caused it to be designed under our supervision, to provide reasonable assurance that:
(i) material information relating to the issuer is made known to us by others, particularly during the period in which the interim filings are being prepared; and
(ii) information required to be disclosed by the issuer in its annual filings, interim filings or other reports filed or submitted by it under securities legislation is recorded, processed, summarized and reported within the time periods specified in securities legislation; and
(b) designed ICFR, or caused it to be designed under our supervision, to provide reasonable assurance regarding the reliability of financial reporting and the preparation of financial statements for external purposes in accordance with the issuer’s GAAP.
5.1 Control framework: The control framework the issuer’s other certifying officer and I used to design the issuer’s ICFR is the Internal Control – Integrated Framework (“COSO Framework”) published by The Committee of Sponsoring Organizations of the Treadway Commission (“COSO”).
5.2 ICFR ‑ material weakness relating to design: N/A.
5.3 Limitation on scope of design: N/A.
6. Reporting changes in ICFR: The issuer has disclosed in its interim MD&A any change in the issuer’s ICFR that occurred during the period beginning on January 1, 2021 and ended on March 31, 2021 that has materially affected, or is reasonably likely to materially affect, the issuer’s ICFR.
Date: May 12, 2021
/s/ Ken Lamont
_______________________________
Ken Lamont
Chief Financial Officer
Serious News for Serious Traders! Try StreetInsider.com Premium Free!
You May Also Be Interested In
- Crescent Point Energy (CPG:CN) (CPG) PT Raised to Cdn$15 at CIBC
- New Collection From Wedding Dress Brand Stella York Celebrates 'That Forever Feeling'
- Luminar Day: A New Era – Luminar Achieves Global Start of Production for Volvo Cars
Create E-mail Alert Related Categories
SEC FilingsSign up for StreetInsider Free!
Receive full access to all new and archived articles, unlimited portfolio tracking, e-mail alerts, custom newswires and RSS feeds - and more!
