

Form 6-K COCA COLA FEMSA SAB DE For: Sep 30
 Tweet
Tweet Share
ShareSECURITIES AND EXCHANGE COMMISSION
WASHINGTON, DC 20549
FORM 6-K
REPORT OF FOREIGN PRIVATE ISSUER
PURSUANT TO RULE 13a-16 OR 15d-16 UNDER
THE SECURITIES EXCHANGE ACT OF 1934
For the month of October 2022
Commission File Number 1-12260
COCA-COLA FEMSA, S.A.B. de C.V.
(Translation of Registrant’s name into English)
United Mexican States
(Jurisdiction of incorporation or organization)
Calle Mario Pani No. 100,
Sante Fe Cuajimalpa,
Cuajimalpa de Morelos,
05348, Ciudad de México,
México
(Address of principal executive offices)
Indicate by check mark whether the registrant files or will file annual reports
under cover of Form 20-F or Form 40-F:
Form 20-F x Form 40-F ¨
Indicate by check mark if the registrant is submitting the Form 6-K in paper as
permitted by Regulation S-T Rule 101(b)(1): _______
Indicate by check mark if the registrant is submitting the Form 6-K in paper as
permitted by Regulation S-T Rule 101(b)(7): _______
Indicate by check mark whether by furnishing the information contained in this
Form, the registrant is also thereby furnishing the information to the
Commission pursuant to Rule 12g3-2(b) under the Securities Exchange Act of 1934.
Yes ¨ No x
If "Yes" is marked, indicate below the file number assigned to the registrant in
connection with Rule 12g3-2(b): 82-_____________

Mexico City, October 24, 2022, Coca-Cola FEMSA, S.A.B. de C.V. (BMV: KOFUBL, NYSE: KOF) (“Coca-Cola FEMSA”, “KOF” or the “Company”), the largest Coca-Cola franchise bottler in the world by sales volume, announces results for the third quarter and the first nine months of 2022.
THIRD QUARTER OPERATIONAL AND FINANCIAL HIGHLIGHTS
| · | Consolidated volumes increased 8.4% as compared to the third quarter of 2021. This increase was driven by volume growth across all of our territories, including single-digit increases in Mexico, Brazil, Colombia, and Uruguay, coupled with double-digit volume increases in Argentina and Central America. On a comparable basis, our volume increased 7.3%. |
| · | Total revenues increased 18.2%, while comparable revenues increased 19.3%, driven mainly by volume growth, pricing initiatives, and favorable price-mix effects. These factors were partially offset by a decline in beer revenues related to the transition of the beer portfolio in Brazil, coupled with unfavorable currency translation effects of some of our operating currencies into Mexican Pesos. |
| · | Operating income increased 13.3%, while comparable operating income increased 13.1%. Our raw material hedging strategies and operating expense efficiencies were partially offset by (i) a tough comparison base that includes the recognition of an extraordinary Ps. 620 million during the third quarter of 2021, related to favorable entitlements to reclaim certain taxes in Brazil following a favorable decision from Brazilian tax authorities; and (ii) higher PET and sweetener costs. |
| · | Majority net income increased 27.9%, driven mainly by an increase in our operating income, coupled with a decrease in our comprehensive financing result, related to a decrease in our interest expense, net. |
| · | Earnings per share1 were Ps. 0.26 (Earnings per unit were Ps. 2.08 and per ADS were Ps. 20.82.). |
RESULTS FINANCIAL SUMMARY
| Change vs. same period of last year | ||||||||||||
| Total Revenues | Gross Profit | Operating Income | Majority Net Income | |||||||||
| 3Q 2022 | YTD 2022 | 3Q 2022 | YTD 2022 | 3Q 2022 | YTD 2022 | 3Q 2022 | YTD 2022 | |||||
| As Reported | Consolidated | 18.2% | 17.7% | 16.4% | 14.0% | 13.3% | 11.5% | 27.9% | 20.6% | |||
| Mexico & Central America | 17.5% | 14.4% | 11.6% | 9.2% | 18.6% | 14.4% | ||||||
| South America | 19.1% | 22.7% | 25.2% | 23.4% | 2.9% | 4.8% | ||||||
| Comparable (2) | Consolidated | 19.3% | 17.4% | 17.6% | 13.9% | 13.1% | 9.3% | |||||
| Mexico & Central America | 17.6% | 14.5% | 11.7% | 9.3% | 18.6% | 14.5% | ||||||
| South America | 21.9% | 21.9% | 29.3% | 22.8% | 2.3% | (2.2%) | ||||||
|
John Santa Maria, Coca-Cola FEMSA’s CEO, commented: |
“Our company´s momentum is evident in our solid results and the continuous progress we are making towards our key strategic objectives. Once again, our volumes grew across all of our territories, enabling us to deliver solid double-digit top- and bottom-line growth. Additionally, we continue making history in sustainable financing, becoming the first company in the consumer sector in the Americas and the first in the Coca-Cola System to successfully price social bonds, underscoring our profound commitment to our communities.
In light of our recent announcements regarding management succession, I am extremely privileged for the opportunity to serve and lead Coca-Cola FEMSA as CEO over the past nine years. Our company is better positioned than ever to capture the many opportunities that are in front of us, and I am very pleased with Ian Craig’s appointment by our Board of Directors as Chief Executive Officer as of January 1, 2023. Ian is a proven leader with an outstanding 28-year track record at FEMSA and Coca-Cola FEMSA. I am confident in the bright future that lies ahead for Coca-Cola FEMSA under his tenure. Finally, I thank and congratulate Constantino Spas, our CFO, who has played a fundamental role in our company’s transformation journey, and has now been invited by FEMSA to become Chief Executive Officer of FEMSA Strategic Businesses as of next year. I wish them both great success.”
| (1) | Quarterly earnings / outstanding shares. Earnings per share (EPS) were calculated using 16,806.7 million shares outstanding. For the convenience of the reader, as a KOFUBL Unit is comprised of 8 shares (3 Series B shares and 5 Series L shares), earnings per unit are equal to EPS multiplied by 8. Each ADS represents 10 KOFUBL Units. |
| (2) | Please refer to page 9 for our definition of “comparable” and a description of the factors
affecting the comparability of our financial and operating performance. |
| 1 |
RECENT DEVELOPMENTS
| · | On September 9, Coca-Cola FEMSA announced the total consideration and acceptance of its tender offers to partially repurchase debt instruments or “Senior Notes" due in 2030, for an amount of US$209 million; and “Senior Notes” due in 2043, for an amount US$111 million. |
| · | On September 28, the Company announced that its Board of Directors appointed Mr. José Henrique Cutrale as a Board member by its Series A shareholders, through which FEMSA indirectly participates in Coca-Cola FEMSA, replacing Mr. José Luis Cutrale, after his unfortunate passing last August. |
| · | On October 6, Coca-Cola FEMSA announced the successful pricing of its social and sustainability bonds in the Mexican market for a total of Ps. 6,000 million, becoming the first non-financial corporate in Mexico and the first corporation from the consumer sector to price financial instruments with a social label in the Americas. The Company priced bonds at a fixed rate of 9.95% (Mbono+0.30%) for an amount of Ps. 5,500 million due in 7 years; and Ps. 500 million at a variable rate of TIIE + 0.05% due in 4 years. The net proceeds of these bonds will be used to finance social and sustainability projects, respectively. |
| · | On October 13, Coca-Cola FEMSA announced that in accordance with its senior leadership succession planning process, John Santa Maria Otazua will retire from his position as Coca-Cola FEMSA’s Chief Executive Officer on January 1, 2023. Accordingly, Coca-Cola FEMSA’s Board of Directors has appointed Ian Craig García, currently CEO of Coca-Cola FEMSA Brazil, to become Coca-Cola FEMSA’s Chief Executive Officer as of the same date. Concurrently, Constantino Spas Montesinos, currently Chief Financial Officer of Coca-Cola FEMSA, has been appointed to become Chief Executive Officer of FEMSA Strategic Businesses as of the same date. Ian and Constantino’s replacements at their current positions will be named in due course. |
| · | As of October, Coca-Cola FEMSA and HEINEKEN began a pilot program in the Mexican City of Irapuato to increase HEINEKEN products´ distribution in the area. We expect this pilot will enable us to gather valuable learnings and insights. As this is the beginning of pilot tests, further details will be provided in due course. |
| · | On November 3, 2022, Coca-Cola FEMSA will pay the second installment of the ordinary dividend approved for Ps. 0.67875 per share (equivalent to Ps. 5.43 per unit). |
CONFERENCE CALL INFORMATION

| 2 |
CONSOLIDATED THIRD QUARTER RESULTS

CONSOLIDATED THIRD QUARTER RESULTS
| As Reported | Comparable (1) | |||||
| Expressed in millions of Mexican pesos | 3Q 2022 | 3Q 2021 | Δ% | Δ% | ||
| Total revenues | 57,093 | 48,316 | 18.2% | 19.3% | ||
| Gross profit | 25,392 | 21,817 | 16.4% | 17.6% | ||
| Operating income | 7,335 | 6,476 | 13.3% | 13.1% | ||
| Operating cash flow (2) | 10,626 | 9,320 | 14.0% | 15.0% | ||
CONSOLIDATED THIRD QUARTER RESULTS
Volume increased 8.4% to 925.8 million unit cases, driven mainly by volume increases in Mexico, Brazil, Colombia, and Uruguay, coupled with double-digit volume increases in Argentina and Central America. On a comparable basis, our volume increased 7.3%.
Total revenues increased 18.2% to Ps. 57,093 million. This increase was driven mainly by volume growth, our pricing initiatives, and favorable price-mix effects. These factors were partially offset by a decline in beer revenues related to the transition of the beer portfolio in Brazil, coupled with unfavorable currency translation effects of some of our operating currencies into Mexican Pesos. On a comparable basis, excluding M&A and currency translation effects, total revenues would have increased 19.3%.
Gross profit increased 16.4% to Ps. 25,392 million, and gross margin decreased 70 basis points to 44.5%. This gross margin decrease was driven by higher raw material costs, mainly in PET and sweeteners. These effects were partially offset by our top-line growth and favorable hedging initiatives. On a comparable basis, gross profit would have increased 17.6%.
Operating income increased 13.3% to Ps. 7,335 million, and operating margin decreased 60 basis points to 12.8%. This increase was driven by solid top-line performance, coupled with operating expense efficiencies. These effects were partially offset by a tough comparison base due to the recognition of a non-recurring tax income of Ps. 620 million during the third quarter of 2021 related to favorable entitlements to reclaim certain taxes in Brazil, following a favorable decision from Brazilian tax authorities. On a comparable basis, operating income would have increased 13.1%.
| (1) | Please refer to page 9 for our definition of “comparable” and a description of the factors affecting the comparability of our financial and operating performance. |
| (2) | Operating cash flow = operating income + depreciation + amortization & other operating non-cash charges. |
| 3 |
Comprehensive financing result recorded an expense of Ps. 682 million, compared to an expense of Ps. 1,030 million in the same period of 2021.
This decrease was driven mainly by a decrease in our interest expense as a result of the tender offer completed during the quarter. In particular, we repurchased Senior Notes due 2030 for an amount of US$209 million and Senior Notes due in 2043 for an amount of US$111 million. In addition, we recognized a gain in interest income of Ps. 649 million as compared to a gain of Ps. 202 million recorded during the same period of 2021, related to an increase in interest rates.
These effects were partially offset by a lower foreign exchange gain of Ps. 40 million as compared to a gain of Ps. 305 million during the same quarter of 2021, as our cash exposure in U.S. dollars was positively impacted by the quarterly depreciation of the Mexican Peso.
We recognized a loss in the market value of financial instruments of Ps. 157 million, related to the increase in interest rates in the U.S., as compared to a loss of Ps. 42 million during the third quarter of 2021.
Finally, we recognized a gain in monetary position in inflationary subsidiaries of Ps. 124 during the third quarter of 2022 as compared to a gain of Ps. 117 during the same period of the previous year.
Income tax as a percentage of income before taxes was 33.4% as compared to 33.5% during the same period of the previous year, mainly driven by deferred taxes and inflationary adjustments.
Net income attributable to equity holders of the company was Ps. 4,374 million as compared to Ps. 3,419 million during the same period of the previous year. This increase was driven mainly by a decrease in our comprehensive financing result, coupled with operating income growth. Earnings per share1 were Ps. 0.26 (Earnings per unit were Ps. 2.08 and per ADS were Ps. 20.82.).
| 4 |
CONSOLIDATED FIRST NINE MONTHS RESULTS

CONSOLIDATED FIRST NINE MONTHS RESULTS
| As Reported | Comparable (1) | |||||
| Expressed in millions of Mexican pesos | YTD 2022 | YTD 2021 | Δ% | Δ% | ||
| Total revenues | 166,042 | 141,091 | 17.7% | 17.4% | ||
| Gross profit | 73,469 | 64,423 | 14.0% | 13.9% | ||
| Operating income | 21,881 | 19,620 | 11.5% | 9.3% | ||
| Operating cash flow (2) | 31,151 | 28,159 | 10.6% | 9.7% | ||
Volume increased 10.1% to 2,759.9 million unit cases, driven mainly by double-digit volume increases in all territories in South America and Central America, coupled with solid volume growth in Mexico. On a comparable basis, our volume would have increased 9.1%.
Total revenues increased 17.7% to Ps. 166,042 million. This increase was driven mainly by volume growth, our pricing initiatives, favorable currency translation effects, and favorable price-mix effects. These factors were partially offset by a decline in beer revenues related to the transition of the beer portfolio in Brazil. On a comparable basis, excluding M&A and currency translation effects, total revenues would have increased 17.4%.
Gross profit increased 14.0% to Ps. 73,469 million, and gross margin decreased 150 basis points to 44.2%. This gross margin decrease was driven mainly by (i) a tough comparison base due to the recognition of an extraordinary Ps. 1,083 million during the second quarter of 2021, related to credits on concentrate purchased from the Manaus Free Trade Zone in Brazil; and (ii) higher raw material costs, mainly in PET and sweeteners. These effects were partially offset by our top-line growth and favorable hedging initiatives. On a comparable basis, gross profit would have increased 13.9%.
Operating income increased 11.5% to Ps. 21,881 million, and operating margin decreased 70 basis points to 13.2%. This operating margin decrease was driven mainly by a decrease in gross margin, coupled with an additional tough comparison base at the operating income level, due to the recognition of non-recurring tax income of Ps. 620 million during the third quarter of 2021 related to favorable entitlements to reclaim certain taxes in Brazil, following a favorable decision from Brazilian tax authorities. These effects were partially offset by a solid top-line performance, coupled with operating expense efficiencies. On a comparable basis, operating income would have increased 9.3%.
| (1) | Please refer to page 9 for our definition of “comparable” and a description of the factors affecting the comparability of our financial and operating performance. |
| (2) | Operating cash flow = operating income + depreciation + amortization & other operating non-cash charges. |
| 5 |
Comprehensive financing result recorded an expense of Ps. 3,438 million, compared to an expense of Ps. 3,477 million in the same period of 2021.
This slight decrease was driven mainly by a decrease in interest expense, net, as compared to the same period of 2021, as a result of the tender offer completed during the third quarter. In particular, we repurchased Senior Notes due 2030 for an amount of US$209 million and Senior Notes due in 2043 for an amount of US$111 million, coupled with an increase in our interest income related to an increase in interest rates.
These effects were partially offset by a loss in financial instruments of Ps. 738 million, as compared to a loss of Ps. 51 million recorded during the same period of 2021, driven mainly by a market value loss of Ps. 935 million recognized during the first quarter of 2022, partially offset by a market value gain of Ps. 355 million recognized during the second quarter of 2022. As explained in the second quarter earnings release, in accordance with IFRS 9, as of the third quarter we are recognizing the hedging gain or loss on the debt instrument that is being hedged using interest rate derivatives. As a result, Coca-Cola FEMSA is recording in the second quarter a one-off gain in “Market value (gain) loss in financial instruments” of Ps. 653 million, corresponding to the first quarter of 2022, offsetting the loss recognized in said quarter.
In addition, we recognized a foreign exchange loss of Ps. 46 million as compared to a gain of Ps. 149 million in the same period of 2021, as our net cash exposure in U.S. dollars was negatively impacted by the slight appreciation of the Mexican Peso during the year.
Income tax as a percentage of income before taxes was 33.5% as compared to 35.5% during the same period of the previous year. This decrease was driven mainly by adjustments to deferred taxes.
Net income attributable to equity holders of the company was Ps. 11,931 million as compared to Ps. 9,893 million during the same period of the previous year. This increase was driven mainly by operating income growth. Earnings per share1 were Ps. 0.71 (Earnings per unit were Ps. 5.68, and per ADS were Ps. 56.79.).
| 6 |
MEXICO & CENTRAL AMERICA DIVISION THIRD QUARTER RESULTS

MEXICO & CENTRAL AMERICA DIVISION RESULTS
| As Reported | Comparable (1) | |||||
| Expressed in millions of Mexican pesos | 3Q 2022 | 3Q 2021 | Δ% | Δ% | ||
| Total revenues | 33,799 | 28,760 | 17.5% | 17.6% | ||
| Gross profit | 15,855 | 14,201 | 11.6% | 11.7% | ||
| Operating income | 5,059 | 4,265 | 18.6% | 18.6% | ||
| Operating cash flow (2) | 7,171 | 6,062 | 18.3% | 18.3% | ||
Volume increased 9.2% to 555.8 million unit cases, driven by a solid performance in Mexico, coupled with double-digit volume increases in Guatemala, Costa Rica, and Nicaragua.
Total revenues increased 17.5% to Ps. 33,799 million, driven mainly by volume growth in all of our territories, our pricing initiatives across the division, and favorable price-mix effects. These factors were partially offset by unfavorable currency translation effects of some of our operating currencies in the division into Mexican Pesos. On a comparable basis, total revenues would have increased 17.6%.
Gross profit increased 11.6% to Ps. 15,855 million, and gross margin contracted 250 basis points to 46.9%. This margin contraction was driven mainly by an increase in raw material costs such as PET and sweeteners, which was partially offset by our raw material hedging strategies and an increase in our top-line. On a comparable basis, gross profit would have increased 11.7%.
Operating income increased 18.6% to Ps. 5,059 million, and operating margin expanded 20 basis points to 15.0% during the period, driven mainly by operating expense efficiencies, partially offset by an increase in fuel, freight, and maintenance expenses. On a comparable basis, operating income would have remained flat.
| (1) | Please refer to page 9 for our definition of “comparable” and a description of the factors affecting the comparability of our financial and operating performance. |
| (2) | Operating cash flow = operating income + depreciation + amortization & other operating non-cash charges. |

| 7 |
SOUTH AMERICA DIVISION THIRD QUARTER RESULTS
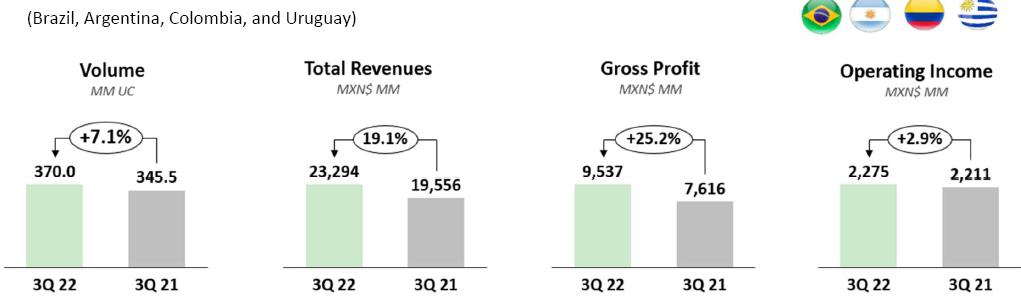
SOUTH AMERICA DIVISION RESULTS
| As Reported | Comparable (1) | |||||
| Expressed in millions of Mexican pesos | 3Q 2022 | 3Q 2021 | Δ% | Δ% | ||
| Total revenues | 23,294 | 19,556 | 19.1% | 21.9% | ||
| Gross profit | 9,537 | 7,616 | 25.2% | 29.3% | ||
| Operating income | 2,275 | 2,211 | 2.9% | 2.3% | ||
| Operating cash flow (2) | 3,455 | 3,258 | 6.1% | 8.5% | ||
Volume increased 7.1% to 370.0 million unit cases, driven mainly by a double-digit volume increase in Argentina, and a solid performance in Brazil, Colombia, and Uruguay. On a comparable basis, our volume for the division would have increased 4.4%.
Total revenues increased 19.1% to Ps. 23,294 million, driven mainly by our pricing initiatives, volume growth, and favorable price-mix effects. This increase was partially offset by a reduction in beer revenues as a result of the transition of our beer portfolio in Brazil, coupled with unfavorable currency translation effects. On a comparable basis, total revenues would have increased 21.9%.
Gross profit increased 25.2% to Ps. 9,537 million, and gross margin expanded 200 basis points to 40.9%. This growth was driven mainly by solid top-line growth, favorable price-mix effects, and raw material hedging strategies. These effects were partially offset by increases in raw material costs such as PET and sweeteners. On a comparable basis, gross profit would have increased 29.3%.
Operating income increased 2.9% to Ps. 2,275 million in the third quarter of 2022, resulting in a margin contraction of 150 basis points to 9.8%. This decline in operating margin was driven mainly by a tough comparison base due to the recognition of non-recurring tax income of Ps. 620 million during the third quarter of 2021 related to favorable entitlements to reclaim certain taxes, following a favorable decision from Brazilian tax authorities, partially offset by favorable operating leverage as a result of solid volume growth across the division. On a comparable basis, operating income would have increased 2.3%.
| (1) | Please refer to page 9 for our definition of “comparable” and a description of the factors affecting the comparability of our financial and operating performance. |
| (2) | Operating cash flow = operating income + depreciation + amortization & other operating non-cash charges. |
| 8 |
DEFINITIONS
Volume is expressed in unit cases. Unit case refers to 192 ounces of finished beverage product (24 eight-ounce servings) and, when applied to soda fountains, refers to the volume of syrup, powders, and concentrate that is required to produce 192 ounces of finished beverage product.
Transactions refers to the number of single units (e.g., a can or a bottle) sold, regardless of their size or volume or whether they are sold individually or in multipacks, except for soda fountains, which represent multiple transactions based on a standard 12 oz. serving.
Operating income is a non-GAAP financial measure computed as “gross profit – operating expenses – other operating expenses, net + operative equity method (gain) loss in associates.”
Operating cash flow is a non-GAAP financial measure computed as “operating income + depreciation + amortization & other operating non-cash charges.”
Earnings per share are equal to “quarterly earnings / outstanding shares.” Earnings per share (EPS) for all periods are adjusted to give effect to the stock split resulting in 16,806,658,096 shares outstanding. For the convenience of the reader, as a KOFUBL Unit is comprised of 8 shares (3 Series B shares and 5 Series L shares), earnings per unit are equal to EPS multiplied by 8. Each ADS represents 10 KOFUBL Units.
COMPARABILITY
In an effort to provide our readers with a more useful representation of our company's underlying financial and operating performance, as of the first quarter 2020, we adjusted our methodology to calculate our comparable figures, no longer excluding hyperinflationary operations. Due to this change, our “comparable” term means, with respect to a year-over-year comparison, the change of a given measure excluding the effects of: (i) mergers, acquisitions, and divestitures; and (ii) translation effects resulting from exchange rate movements. In preparing this measure, management has used its best judgment, estimates, and assumptions in order to maintain comparability.
| 9 |
ABOUT THE COMPANY
Stock listing information: Mexican Stock Exchange, Ticker: KOFUBL | NYSE (ADS), Ticker: KOF | Ratio of KOFUBL to KOF = 10:1
Coca-Cola FEMSA files reports, including annual reports and other information with the U.S. Securities and Exchange Commission, or the “SEC,” and the Mexican Stock Exchange (Bolsa Mexicana de Valores, or the “BMV”) pursuant to the rules and regulations of the SEC (that apply to foreign private issuers) and of the BMV. Filings we make electronically with the SEC and the BMV are available to the public on the Internet at the SEC’s website at www.sec.gov, the BMV’s website at www.bmv.com.mx, and our website at www.coca-colafemsa.com.
Coca-Cola FEMSA, S.A.B. de C.V. is the largest Coca-Cola franchise bottler in the world by sales volume. The Company produces and distributes trademark beverages of The Coca-Cola Company, offering a wide portfolio of 131 brands to a population of more than 266 million. With over 80 thousand employees, the Company markets and sells approximately 3.5 billion unit cases through 2 million points of sale a year. Operating 49 manufacturing plants and 260 distribution centers, Coca-Cola FEMSA is committed to generating economic, social, and environmental value for all of its stakeholders across the value chain. The Company is a member of the Dow Jones Sustainability Emerging Markets Index, Dow Jones Sustainability MILA Pacific Alliance Index, FTSE4Good Emerging Index, and the Mexican Stock Exchange’s IPC and Social Responsibility and Sustainability Indices, among others. Its operations encompass franchise territories in Mexico, Brazil, Guatemala, Colombia, and Argentina, and, nationwide, in Costa Rica, Nicaragua, Panama, Uruguay, and Venezuela through its investment in KOF Venezuela. For further information, please visit www.coca-colafemsa.com.

ADDITIONAL INFORMATION
All of the financial information presented in this report was prepared under International Financial Reporting Standards (IFRS).
This news release may contain forward-looking statements concerning Coca-Cola FEMSA’s future performance, which should be considered as good faith estimates by Coca-Cola FEMSA. These forward-looking statements reflect management’s expectations and are based upon currently available data. Actual results are subject to future events and uncertainties, many of which are outside Coca-Cola FEMSA’s control, which could materially impact the Company’s actual performance. References herein to “US$” are to United States dollars. This news release contains translations of certain Mexican peso amounts into U.S. dollars for the convenience of the reader. These translations should not be construed as representations that Mexican peso amounts actually represent such U.S. dollar amounts or could be converted into U.S. dollars at the rate indicated.
(6 pages of tables to follow)
| 10 |
COCA-COLA FEMSA
Consolidated Income Statement
| Millions of Pesos (1) | ||||||||||||||
| For the Third Quarter of: | For the First Nine Months of: | |||||||||||||
| 2022 | % of Rev. | 2021 | % of Rev. | Δ% Reported | Δ% Comparable (7) | 2022 | % of Rev. | 2021 | % of Rev. | Δ% Reported | Δ% Comparable (7) | |||
| Transactions (million transactions) | 5,507.3 | 4,891.6 | 12.6% | 12.1% | 16,327.4 | 13,926.6 | 17.2% | 16.4% | ||||||
| Volume (million unit cases) | 925.8 | 854.5 | 8.4% | 7.3% | 2,759.9 | 2,506.5 | 10.1% | 9.1% | ||||||
| Average price per unit case | 60.15 | 52.94 | 13.6% | 58.65 | 51.99 | 12.8% | ||||||||
| Net revenues | 57,017 | 47,916 | 19.0% | 165,723 | 140,370 | 18.1% | ||||||||
| Other operating revenues | 77 | 399 | -80.8% | 319 | 721 | -55.8% | ||||||||
| Total revenues (2) | 57,093 | 100.0% | 48,316 | 100.0% | 18.2% | 19.3% | 166,042 | 100.0% | 141,091 | 100.0% | 17.7% | 17.4% | ||
| Cost of goods sold | 31,702 | 55.5% | 26,499 | 54.8% | 19.6% | 92,573 | 55.8% | 76,668 | 54.3% | 20.7% | ||||
| Gross profit | 25,392 | 44.5% | 21,817 | 45.2% | 16.4% | 17.6% | 73,469 | 44.2% | 64,423 | 45.7% | 14.0% | 13.9% | ||
| Operating expenses | 17,933 | 31.4% | 15,530 | 32.1% | 15.5% | 51,290 | 30.9% | 44,636 | 31.6% | 14.9% | ||||
| Other operative expenses, net | 167 | 0.3% | (136) | -0.3% | NA | 451 | 0.3% | 232 | 0.2% | 94.4% | ||||
| Operative equity method (gain) loss in associates(3) | (43) | -0.1% | (53) | -0.1% | NA | (152) | -0.1% | (64) | 0.0% | NA | ||||
| Operating income (5) | 7,335 | 12.8% | 6,476 | 13.4% | 13.3% | 13.1% | 21,881 | 13.2% | 19,620 | 13.9% | 11.5% | 9.3% | ||
| Other non operative expenses, net | 94 | 0.2% | 296 | 0.6% | NA | 343 | 0.2% | 217 | 0.2% | NA | ||||
| Non Operative equity method (gain) loss in associates (4) | (113) | -0.2% | (20) | 0.0% | NA | (141) | -0.1% | 51 | 0.0% | NA | ||||
| Interest expense | 1,339 | 1,613 | -16.9% | 4,694 | 4,570 | 2.7% | ||||||||
| Interest income | 649 | 202 | 220.7% | 1,606 | 562 | 185.5% | ||||||||
| Interest expense, net | 690 | 1,410 | -51.1% | 3,088 | 4,007 | -22.9% | ||||||||
| Foreign exchange loss (gain) | (40) | (305) | NA | 46 | (149) | NA | ||||||||
| Loss (gain) on monetary position in inflationary subsidiries | (124) | (117) | 6.0% | (434) | (433) | 0.3% | ||||||||
| Market value (gain) loss on financial instruments | 157 | 42 | NA | 738 | 51 | NA | ||||||||
| Comprehensive financing result | 682 | 1,030 | -33.7% | 3,438 | 3,477 | -1.1% | ||||||||
| Income before taxes | 6,671 | 5,170 | 29.0% | 18,241 | 15,876 | 14.9% | ||||||||
| Income taxes | 2,166 | 1,697 | 27.7% | 5,972 | 5,626 | 6.1% | ||||||||
| Result of discontinued operations | - | - | NA | - | - | NA | ||||||||
| Consolidated net income | 4,505 | 3,473 | 29.7% | 12,269 | 10,250 | 19.7% | ||||||||
| Net income attributable to equity holders of the company | 4,374 | 7.7% | 3,419 | 7.1% | 27.9% | 11,931 | 7.2% | 9,893 | 7.0% | 20.6% | ||||
| Non-controlling interest | 131 | 0.2% | 54 | 0.1% | 106.0% | 339 | 0.2% | 356 | 0.3% | NA | ||||
| Operating Cash Flow & CAPEX | 2022 | % of Rev. | 2021 | % of Rev. | Δ% Reported | Δ% Comparable (7) | 2022 | % of Rev. | 2021 | % of Rev. | Δ% Reported | Δ% Comparable (7) | ||
| Operating income (5) | 7,335 | 12.8% | 6,476 | 13.4% | 13.3% | 21,881 | 13.2% | 19,620 | 13.9% | 11.5% | ||||
| Depreciation | 2,515 | 2,202 | 14.2% | 7,287 | 6,640 | 9.8% | ||||||||
| Amortization and other operative non-cash charges | 777 | 641 | 21.1% | 1,983 | 1,900 | 4.4% | ||||||||
| Operating cash flow (5)(6) | 10,626 | 18.6% | 9,320 | 19.3% | 14.0% | 15.0% | 31,151 | 18.8% | 28,159 | 20.0% | 10.6% | 9.7% | ||
| CAPEX | 4,026 | 3,907 | 3.1% | 11,191 | 8,224 | 36.1% | ||||||||
(1) Except volume and average price per unit case figures.
(2) Please refer to page 14 for revenue breakdown.
(3) Includes equity method in Jugos del Valle and Leão Alimentos, among others.
(4) Includes equity method in PIASA, IEQSA, Beta San Miguel, IMER, and KSP Participacoes, among others.
(5) The operating income and operating cash flow lines are presented as non-GAAP measures for the convenience of the reader.
(6) Operating cash flow = operating income + depreciation, amortization & other operating non-cash charges.
(7) Please refer to page 9 for our definition of “comparable” and a description of the factors affecting the comparability of our financial and operating performance.
(8) For the third quarter of 2022, total CAPEX effectively paid was Ps. 4,026 million pesos.
| 11 |
MEXICO & CENTRAL AMERICA DIVISION
RESULTS OF OPERATIONS
| Millions of Pesos (1) | ||||||||||||||
| For the Third Quarter of: | For the First Nine Months of: | |||||||||||||
| 2022 | % of Rev. | 2021 | % of Rev. | Δ% Reported |
Δ% Comparable (6) |
2022 | % of Rev. | 2021 | % of Rev. | Δ% Reported |
Δ% Comparable (6) | |||
| Transactions (million transactions) | 2,937.1 | 2,619.0 | 12.1% | 12.1% | 8,712.0 | 7,793.6 | 11.8% | 11.8% | ||||||
| Volume (million unit cases) | 555.8 | 509.0 | 9.2% | 9.2% | 1,640.5 | 1,526.1 | 7.5% | 7.5% | ||||||
| Average price per unit case | 60.80 | 56.47 | 7.7% | 59.24 | 55.67 | 6.4% | ||||||||
| Net revenues | 33,791 | 28,742 | 97,184 | 84,965 | ||||||||||
| Other operating revenues | 8 | 18 | 25 | 37 | ||||||||||
| Total Revenues (2) | 33,799 | 100.0% | 28,760 | 100.0% | 17.5% | 17.6% | 97,209 | 100.0% | 85,002 | 100.0% | 14.4% | 14.5% | ||
| Cost of goods sold | 17,945 | 53.1% | 14,560 | 50.6% | 50,853 | 52.3% | 42,554 | 50.1% | ||||||
| Gross profit | 15,855 | 46.9% | 14,201 | 49.4% | 11.6% | 11.7% | 46,356 | 47.7% | 42,448 | 49.9% | 9.2% | 9.3% | ||
| Operating expenses | 10,710 | 31.7% | 9,811 | 34.1% | 30,378 | 31.2% | 28,383 | 33.4% | ||||||
| Other operative expenses, net | 121 | 0.4% | 161 | 0.6% | 355 | 0.4% | 412 | 0.5% | ||||||
| Operative equity method (gain) loss in associates (3) | (36) | -0.1% | (36) | -0.1% | (112) | -0.1% | (106) | -0.1% | ||||||
| Operating income (4) | 5,059 | 15.0% | 4,265 | 14.8% | 18.6% | 18.6% | 15,736 | 16.2% | 13,759 | 16.2% | 14.4% | 14.5% | ||
| Depreciation, amortization & other operating non-cash charges | 2,111 | 6.2% | 1,797 | 6.2% | 5,690 | 5.9% | 5,287 | 6.2% | ||||||
| Operating cash flow (4)(5) | 7,171 | 21.2% | 6,062 | 21.1% | 18.3% | 18.3% | 21,426 | 22.0% | 19,046 | 22.4% | 12.5% | 12.6% | ||
(1) Except volume and average price per unit case figures.
(2) Please refer to page 14 for revenue breakdown.
(3) Includes equity method in Jugos del Valle, among others.
(4) The operating income and operating cash flow lines are presented as non-GAAP measures for the convenience of the reader.
(5) Operating cash flow = operating income + depreciation, amortization & other operating non-cash charges.
(6) Please refer to page 9 for our definition of “comparable” and a description of the factors affecting the comparability of our financial and operating performance.
SOUTH AMERICA DIVISION
RESULTS OF OPERATIONS
| Millions of Pesos (1) | ||||||||||||||
| For the Third Quarter of: | For the First Nine Months of: | |||||||||||||
| 2022 | % of Rev. | 2021 | % of Rev. | Δ% Reported |
Δ% Comparable (6) |
2022 | % of Rev. | 2021 | % of Rev. | Δ% Reported |
Δ% Comparable (6) | |||
| Transactions (million transactions) | 2,570.2 | 2,272.6 | 13.1% | 12.0% | 7,615.4 | 6,133.0 | 24.2% | 22.2% | ||||||
| Volume (million unit cases) | 370.0 | 345.5 | 7.1% | 4.4% | 1,119.4 | 980.4 | 14.2% | 11.5% | ||||||
| Average price per unit case | 59.18 | 45.23 | 30.8% | 57.78 | 49.00 | 17.9% | ||||||||
| Net revenues | 23,225 | 19,175 | 68,539 | 55,404 | ||||||||||
| Other operating revenues | 69 | 381 | 293 | 684 | ||||||||||
| Total Revenues (2) | 23,294 | 100.0% | 19,556 | 100.0% | 19.1% | 21.9% | 68,833 | 100.0% | 56,088 | 100.0% | 22.7% | 21.9% | ||
| Cost of goods sold | 13,757 | 59.1% | 11,939 | 61.1% | 41,720 | 60.6% | 34,113 | 60.8% | ||||||
| Gross profit | 9,537 | 40.9% | 7,616 | 38.9% | 25.2% | 29.3% | 27,113 | 39.4% | 21,975 | 39.2% | 23.4% | 22.8% | ||
| Operating expenses | 7,223 | 31.0% | 5,719 | 29.2% | 20,912 | 30.4% | 16,253 | 29.0% | ||||||
| Other operative expenses, net | 46 | 0.2% | (297) | -1.5% | 96 | 0.1% | (180) | -0.3% | ||||||
| Operative equity method (gain) loss in associates (3) | (7) | 0.0% | (17) | -0.1% | (40) | -0.1% | 41 | 0.1% | ||||||
| Operating income (4) | 2,275 | 9.8% | 2,211 | 11.3% | 2.9% | 2.3% | 6,145 | 8.9% | 5,861 | 10.4% | 4.8% | -2.2% | ||
| Depreciation, amortization & other operating non-cash charges | 1,180 | 5.1% | 1,046 | 5.3% | 3,580 | 5.2% | 3,252 | 5.8% | ||||||
| Operating cash flow (4)(5) | 3,455 | 14.8% | 3,258 | 16.7% | 6.1% | 8.5% | 9,724 | 14.1% | 9,113 | 16.2% | 6.7% | 3.6% | ||
| (1) | Except volume and average price per unit case figures. |
| (2) | Please refer to page 14 for revenue breakdown. |
| (3) | Includes equity method in Leão Alimentos and Verde Campo, among others. |
| (4) | The operating income and operating cash flow lines are presented as non-GAAP measures for the convenience of the reader. |
| (5) | Operating cash flow = operating income + depreciation, amortization & other operating non-cash charges. |
| (6) | Please refer to page 9 for our definition of “comparable” and a description of the factors affecting the comparability of our financial and operating performance. |
| 12 |
COCA-COLA FEMSA
Consolidated BALANCE SHEET
| Millions of Pesos | ||||||||||
| Assets | Sep-22 | Dec-21 | % Var. | Liabilities & Equity | Sep-22 | Dec-21 | % Var. | |||
| Current Assets | Current Liabilities | |||||||||
| Cash, cash equivalents and marketable securities | Short-term bank loans and notes payable | 8,673 | 2,453 | 254% | ||||||
| 39,205 | 47,248 | -17% | Suppliers | 25,523 | 22,745 | 12% | ||||
| Total accounts receivable | 14,241 | 13,014 | 9% | Short-term leasing Liabilities | 508 | 614 | ||||
| Inventories | 13,146 | 11,960 | 10% | Other current liabilities | 26,625 | 20,409 | 30% | |||
| Other current assets | 9,601 | 8,142 | 18% | Total current liabilities | 61,329 | 46,221 | 33% | |||
| Total current assets | 76,193 | 80,364 | -5% | Non-Current Liabilities | ||||||
| Non-Current Assets | Long-term bank loans and notes payable | 65,934 | 83,329 | -21% | ||||||
| Property, plant and equipment | 120,893 | 113,827 | 6% | Long Term Leasing Liabilities | 941 | 891 | ||||
| Accumulated depreciation | (54,645) | (51,644) | 6% | Other long-term liabilities | 16,590 | 13,554 | 22% | |||
| Total property, plant and equipment, net | 66,248 | 62,183 | 7% | Total liabilities | 144,794 | 143,995 | 1% | |||
| Right of use assets | 1,381 | 1,472 | -6% | Equity | ||||||
| Investment in shares | 8,346 | 7,494 | 11% | Non-controlling interest | 6,306 | 6,022 | 5% | |||
| Intangible assets and other assets | 103,866 | 102,174 | 2% | Total controlling interest | 120,455 | 121,550 | -1% | |||
| Other non-current assets | 15,521 | 17,880 | -13% | Total equity | 126,761 | 127,572 | -1% | |||
| Total Assets | 271,555 | 271,567 | 0% | Total Liabilities and Equity | 271,555 | 271,567 | 0% | |||
| September 30, 2022 | ||||||||||
| Debt Mix | % Total Debt (1) | % Interest Rate Floating (1) (2) | Average Rate | Debt Maturity Profile | ||||||
| Currency |  |
|||||||||
| Mexican Pesos | 58.0% | 8.0% | 7.9% | |||||||
| U.S. Dollars | 20.7% | 28.2% | 3.6% | |||||||
| Colombian Pesos | 1.7% | 0.0% | 7.0% | |||||||
| Brazilian Reals | 18.1% | 62.4% | 12.1% | |||||||
| Uruguayan Pesos | 1.3% | 0.0% | 6.3% | |||||||
| Argentine Pesos | 0.2% | 0.0% | 39.4% | |||||||
| Total Debt | 100% | 22.7% | 7.8% | |||||||
| (1) After giving effect to cross- currency swaps and financial leases. | ||||||||||
| (2) Calculated by weighting each year´s outstanding debt balance mix. | ||||||||||
| Financial Ratios | LTM 22 | FY 2021 | Δ% | |||||||
| Net debt including effect of hedges (1)(3) | 34,275 | 35,243 | -2.7% | |||||||
| Net debt including effect of hedges / Operating cash flow (1)(3) | 0.82 | 0.91 | ||||||||
| Operating cash flow/ Interest expense, net (1) | 10.09 | 7.39 | ||||||||
| Capitalization (2) | 38.7% | 40.7% | ||||||||
| (1) Net debt = total debt - cash | ||||||||||
| (2) Total debt / (long-term debt + shareholders' equity) | ||||||||||
| (3) After giving effect to cross-currency swaps. | ||||||||||
| 13 |
COCA-COLA FEMSA
QUARTERLY VOLUMES, TRANSACTIONS & REVENUES
| Volume | ||||||||||||||
| 3Q 2022 | 3Q 2021 | YoY | ||||||||||||
| Sparkling | Water (1) | Bulk (2) | Stills | Total | Sparkling | Water (1) | Bulk (2) | Stills | Total | Δ % | ||||
| Mexico | 344.8 | 26.8 | 76.4 | 34.0 | 481.9 | 321.5 | 19.7 | 72.0 | 30.4 | 443.6 | 8.7% | |||
| Guatemala | 34.1 | 0.6 | - | 2.3 | 36.9 | 29.5 | 1.0 | - | 2.1 | 32.6 | 13.3% | |||
| CAM South | 29.7 | 1.7 | 0.2 | 5.3 | 36.9 | 27.1 | 1.6 | 0.1 | 4.0 | 32.8 | 12.4% | |||
| Mexico and Central America | 408.6 | 29.1 | 76.6 | 41.5 | 555.8 | 378.2 | 22.3 | 72.1 | 36.4 | 509.0 | 9.2% | |||
| Colombia | 61.8 | 8.8 | 3.2 | 7.1 | 80.8 | 59.8 | 7.6 | 3.9 | 6.0 | 77.2 | 4.7% | |||
| Brazil (3) | 204.1 | 14.6 | 2.0 | 18.2 | 238.9 | 193.4 | 12.0 | 1.9 | 15.6 | 222.9 | 7.2% | |||
| Argentina | 32.3 | 3.6 | 0.8 | 3.2 | 39.9 | 28.7 | 2.7 | 1.2 | 3.0 | 35.6 | 12.1% | |||
| Uruguay | 8.8 | 1.2 | - | 0.4 | 10.3 | 8.6 | 1.0 | - | 0.2 | 9.8 | 5.7% | |||
| South America | 307.0 | 28.2 | 6.0 | 28.8 | 370.0 | 290.4 | 23.3 | 6.9 | 24.8 | 345.5 | 7.1% | |||
| TOTAL | 715.6 | 57.3 | 82.5 | 70.4 | 925.8 | 668.6 | 45.6 | 79.0 | 61.2 | 854.5 | 8.4% | |||
| (1) Excludes water presentations larger than 5.0 Lt ; includes flavored water. | ||||||||||||||
| (2) Bulk Water = Still bottled water in 5.0, 19.0 and 20.0 - liter packaging presentations; includes flavored water | ||||||||||||||
| Transactions | ||||||||||||||
| 3Q 2022 | 3Q 2021 | YoY | ||||||||||||
| Sparkling | Water | Stills | Total | Sparkling | Water | Stills | Total | Δ % | ||||||
| Mexico | 1,920.9 | 188.6 | 239.7 | 2,349.2 | 1,748.7 | 147.6 | 213.8 | 2,110.1 | 11.3% | |||||
| Guatemala | 266.2 | 4.7 | 34.8 | 305.8 | 229.3 | 10.7 | 26.7 | 266.7 | 14.6% | |||||
| CAM South | 222.4 | 11.8 | 47.9 | 282.1 | 195.0 | 10.1 | 37.0 | 242.2 | 16.5% | |||||
| Mexico and Central America | 2,409.5 | 205.1 | 322.5 | 2,937.1 | 2,173.1 | 168.4 | 277.5 | 2,619.0 | 12.1% | |||||
| Colombia | 458.5 | 93.8 | 75.8 | 628.1 | 408.7 | 82.0 | 56.8 | 547.5 | 14.7% | |||||
| Brazil (3) | 1,334.8 | 130.4 | 203.2 | 1,668.4 | 1,218.0 | 104.5 | 171.7 | 1,494.3 | 11.7% | |||||
| Argentina | 171.5 | 24.3 | 27.8 | 223.6 | 144.1 | 16.8 | 22.4 | 183.3 | 22.0% | |||||
| Uruguay | 42.2 | 4.6 | 3.3 | 50.1 | 41.5 | 4.0 | 1.7 | 47.2 | 6.2% | |||||
| South America | 2,007.1 | 253.1 | 310.0 | 2,570.2 | 1,812.3 | 375.7 | 252.6 | 2,272.2 | 13.1% | |||||
| TOTAL | 4,416.6 | 458.2 | 632.5 | 5,507.3 | 3,985.3 | 544.1 | 530.2 | 4,891.2 | 12.6% | |||||
| Revenues | ||||||||||||||
| Expressed in million Mexican Pesos | 3Q 2022 | 3Q 2021 | Δ % | |||||||||||
| Mexico | 27,797 | 23,657 | 17.5% | |||||||||||
| Guatemala | 3,083 | 2,601 | 18.5% | |||||||||||
| CAM South | 2,920 | 2,502 | 16.7% | |||||||||||
| Mexico and Central America | 33,799 | 28,760 | 17.5% | |||||||||||
| Colombia | 4,372 | 3,631 | 20.4% | |||||||||||
| Brazil (4) | 15,281 | 13,322 | 14.7% | |||||||||||
| Argentina | 2,691 | 1,828 | 47.2% | |||||||||||
| Uruguay | 950 | 775 | 22.6% | |||||||||||
| South America | 23,294 | 19,556 | 19.1% | |||||||||||
| TOTAL | 57,093 | 48,316 | 18.2% | |||||||||||
| (3) Volume and transactions in Brazil do not include beer. | ||||||||||||||
| (4) Brazil includes beer revenues of Ps.1,325.2 million for the third quarter of 2022 and Ps.2,429.8 million for the same period of the previous year. | ||||||||||||||

| (1) | Volume is expressed in unit cases. Unit case refers to 192 ounces of finished beverage product (24 eight-ounce servings) and, when applied to soda fountains, refers to the volume of syrup, powders, and concentrate that is required to produce 192 ounces of finished beverage product. |
| (2) | Transactions refers to the number of single units (e.g., a can or a bottle) sold, regardless of their size or volume or whether they are sold individually or in multipacks, except for fountain which represents multiple transactions based on a standard 12 oz. serving. |
| 14 |
COCA-COLA FEMSA
YTD VOLUMES, TRANSACTIONS & REVENUES
| Volume | ||||||||||||||
| YTD 2022 | YTD 2021 | YoY | ||||||||||||
| Sparkling | Water (1) | Bulk (2) | Stills | Total | Sparkling | Water (1) | Bulk (2) | Stills | Total | Δ % | ||||
| Mexico | 1,013.5 | 79.4 | 225.8 | 101.5 | 1,420.2 | 966.4 | 61.0 | 213.8 | 90.7 | 1,331.9 | 6.6% | |||
| Guatemala | 98.5 | 2.8 | - | 6.6 | 108.0 | 87.7 | 3.0 | - | 5.2 | 95.9 | 12.5% | |||
| CAM South | 90.7 | 5.5 | 0.6 | 15.5 | 112.4 | 81.7 | 4.7 | 0.4 | 11.6 | 98.2 | 14.4% | |||
| Mexico and Central America | 1,202.7 | 87.8 | 226.4 | 123.6 | 1,640.5 | 1,135.8 | 68.6 | 214.1 | 107.5 | 1,526.1 | 7.5% | |||
| Colombia | 188.5 | 24.9 | 9.1 | 22.1 | 244.7 | 167.6 | 18.0 | 11.3 | 14.7 | 211.7 | 15.6% | |||
| Brazil (3) | 604.6 | 46.2 | 7.9 | 61.8 | 720.5 | 551.5 | 31.8 | 5.6 | 42.2 | 631.1 | 14.2% | |||
| Argentina | 98.3 | 11.1 | 2.7 | 10.3 | 122.3 | 86.9 | 7.9 | 4.1 | 9.3 | 108.3 | 13.0% | |||
| Uruguay | 26.9 | 4.0 | - | 1.0 | 31.9 | 25.6 | 3.3 | - | 0.5 | 29.4 | 8.6% | |||
| South America | 918.3 | 86.1 | 19.7 | 95.2 | 1,119.4 | 831.7 | 61.0 | 21.1 | 66.7 | 980.4 | 14.2% | |||
| TOTAL | 2,121.1 | 174.0 | 246.1 | 218.8 | 2,759.9 | 1,967.5 | 129.6 | 235.2 | 174.2 | 2,506.5 | 10.1% | |||
| (1) Excludes water presentations larger than 5.0 Lt ; includes flavored water. | ||||||||||||||
| (2) Bulk Water= Still bottled water in 5.0, 19.0 and 20.0 - liter packaging presentations; includes flavored water | ||||||||||||||
| Transactions | ||||||||||||||
| YTD 2022 | YTD 2021 | YoY | ||||||||||||
| Sparkling | Water | Stills | Total | Sparkling | Water | Stills | Total | Δ % | ||||||
| Mexico | 5,681.0 | 559.7 | 727.8 | 6,968.5 | 5,234.5 | 450.1 | 632.6 | 6,317.1 | 10.3% | |||||
| Guatemala | 765.8 | 27.4 | 64.9 | 858.1 | 672.4 | 30.7 | 53.6 | 756.6 | 13.4% | |||||
| CAM South | 673.3 | 36.8 | 175.2 | 885.3 | 572.5 | 30.4 | 117.0 | 719.9 | 23.0% | |||||
| Mexico and Central America | 7,120.1 | 624.0 | 968.0 | 8,712.0 | 6,479.3 | 511.1 | 803.2 | 7,793.6 | 11.8% | |||||
| Colombia | 1,353.0 | 267.3 | 237.5 | 1,857.8 | 1,102.0 | 195.7 | 132.6 | 1,430.3 | 29.9% | |||||
| Brazil (3) | 3,899.2 | 404.0 | 629.8 | 4,933.0 | 3,327.4 | 272.3 | 443.3 | 4,043.0 | 22.0% | |||||
| Argentina | 511.7 | 71.8 | 85.0 | 668.6 | 410.8 | 46.4 | 66.2 | 523.4 | 27.8% | |||||
| Uruguay | 131.3 | 15.3 | 9.4 | 156.0 | 118.6 | 12.3 | 5.0 | 135.9 | 14.8% | |||||
| South America | 5,895.2 | 758.5 | 961.7 | 7,615.4 | 4,958.8 | 526.7 | 647.1 | 6,132.6 | 24.2% | |||||
| TOTAL | 13,015.3 | 1,382.4 | 1,929.7 | 16,327.4 | 11,438.1 | 1,037.9 | 1,450.3 | 13,926.2 | 17.2% | |||||
| Revenues | ||||||||||||||
| Expressed in million Mexican Pesos | YTD 2022 | YTD 2021 | Δ % | |||||||||||
| Mexico | 79,524 | 69,905 | 13.8% | |||||||||||
| Guatemala | 8,929 | 7,607 | 17.4% | |||||||||||
| CAM South | 8,756 | 7,491 | 16.9% | |||||||||||
| Mexico and Central America | 97,209 | 85,002 | 14.4% | |||||||||||
| Colombia | 13,233 | 10,034 | 31.9% | |||||||||||
| Brazil (4) | 44,651 | 38,493 | 16.0% | |||||||||||
| Argentina | 8,154 | 5,327 | 53.1% | |||||||||||
| Uruguay | 2,795 | 2,234 | 25.1% | |||||||||||
| South America | 68,833 | 56,088 | 22.7% | |||||||||||
| TOTAL | 166,042 | 141,091 | 17.7% | |||||||||||
| (3) Volume and transactions in Brazil do not include beer. | ||||||||||||||
| (4) Brazil includes beer revenues of Ps. 3,857.5 million for the first nine months of 2022 and Ps. 9,793.0 million for the same period of the previous year. | ||||||||||||||

| (1) | Volume is expressed in unit cases. Unit case refers to 192 ounces of finished beverage product (24 eight-ounce servings) and, when applied to soda fountains, refers to the volume of syrup, powders, and concentrate that is required to produce 192 ounces of finished beverage product. |
| (2) | Transactions refers to the number of single units (e.g., a can or a bottle) sold, regardless of their size or volume or whether they are sold individually or in multipacks, except for fountain which represents multiple transactions based on a standard 12 oz. serving. |
| 15 |
COCA-COLA FEMSA
MACROECONOMIC INFORMATION
| Inflation (1) | ||||||||
| LTM | 3Q22 | YTD | ||||||
| Mexico | 8.76% | 2.29% | 6.19% | |||||
| Colombia | 11.07% | 2.44% | 9.39% | |||||
| Brazil | 8.98% | 0.13% | 4.99% | |||||
| Argentina | 82.99% | 22.81% | 64.75% | |||||
| Costa Rica | 11.41% | 3.74% | 9.21% | |||||
| Panama | 2.45% | -1.89% | 1.83% | |||||
| Guatemala | 9.59% | 3.69% | 8.06% | |||||
| Nicaragua | 12.20% | 3.51% | 8.46% | |||||
| Uruguay | 9.56% | 2.25% | 8.18% | |||||
| (1) Source: inflation estimated by the company based on historic publications from the Central Bank of each country. | ||||||||
| Average Exchange Rates for each period (2) | ||||||||
Quarterly Exchange Rate (Local Currency per USD) |
Year to Date Exchange Rate (Local Currency per USD) | |||||||
| 3Q22 | 3Q21 | Δ % | YTD 22 | YTD 21 | Δ % | |||
| Mexico | 20.24 | 20.01 | 1.2% | 20.27 | 20.13 | 0.7% | ||
| Colombia | 4,386.03 | 3,846.74 | 14.0% | 4,072.13 | 3,699.00 | 10.1% | ||
| Brazil | 5.25 | 5.23 | 0.4% | 5.13 | 5.33 | -3.7% | ||
| Argentina | 135.80 | 97.24 | 39.6% | 120.11 | 93.30 | 28.7% | ||
| Costa Rica | 664.64 | 624.59 | 6.4% | 662.97 | 619.31 | 7.0% | ||
| Panama | 1.00 | 1.00 | 0.0% | 1.00 | 1.00 | 0.0% | ||
| Guatemala | 7.76 | 7.74 | 0.2% | 7.71 | 7.74 | -0.3% | ||
| Nicaragua | 35.96 | 35.26 | 2.0% | 35.79 | 35.08 | 2.0% | ||
| Uruguay | 40.83 | 43.25 | -5.6% | 41.57 | 43.41 | -4.2% | ||
| End-of-period Exchange Rates | ||||||||
Closing Exchange Rate (Local Currency per USD) |
Closing Exchange Rate (Local Currency per USD) | |||||||
| Sep-22 | Sep-21 | Δ % | Jun-22 | Jun-21 | Δ % | |||
| Mexico | 20.31 | 20.31 | 0.0% | 19.98 | 19.80 | 0.9% | ||
| Colombia | 4,532.07 | 3,834.68 | 18.2% | 4,127.47 | 3,756.67 | 9.9% | ||
| Brazil | 5.41 | 5.44 | -0.6% | 5.24 | 5.00 | 4.7% | ||
| Argentina | 147.32 | 98.74 | 49.2% | 125.23 | 95.72 | 30.8% | ||
| Costa Rica | 632.72 | 629.71 | 0.5% | 692.25 | 621.92 | 11.3% | ||
| Panama | 1.00 | 1.00 | 0.0% | 1.00 | 1.00 | 0.0% | ||
| Guatemala | 7.88 | 7.73 | 1.9% | 7.76 | 7.74 | 0.2% | ||
| Nicaragua | 36.05 | 35.34 | 2.0% | 35.87 | 35.17 | 2.0% | ||
| Uruguay | 41.74 | 42.94 | -2.8% | 39.86 | 43.58 | -8.5% | ||
| (2) Average exchange rate for each period computed with the average exchange rate of each month. | ||||||||
| 16 |
SIGNATURE
Pursuant to the requirements of the Securities Exchange Act of 1934, the registrant has duly caused this report to be signed on its behalf by the undersigned, thereunto duly authorized.
Date: October 24, 2022
COCA-COLA FEMSA, S.A.B. DE C.V.
By: /s/ Constantino Spas Montesinos
Name: Constantino Spas Montesinos
Title: Chief Financial Officer
Serious News for Serious Traders! Try StreetInsider.com Premium Free!
You May Also Be Interested In
- Amerant Reports First Quarter 2024 Results
- Ideanomics Announces Receipt of Notice from Nasdaq Regarding Late Filing of Annual Report on Form 10-K
- Pivotree to Release First Quarter 2024 Financial Results
Create E-mail Alert Related Categories
SEC FilingsSign up for StreetInsider Free!
Receive full access to all new and archived articles, unlimited portfolio tracking, e-mail alerts, custom newswires and RSS feeds - and more!
