

Form 6-K CAMECO CORP For: Feb 10
 Tweet
Tweet Share
Share
UNITED STATES
SECURITIES AND EXCHANGE COMMISSION
Washington, DC 20549
FORM 6-K
Report of Foreign Private Issuer
Pursuant to Rule 13a-16 or 15d-16
Under the Securities Exchange Act of 1934
For the month of February, 2021
Cameco Corporation
(Commission file No. 1-14228)
2121-11th Street West
Saskatoon, Saskatchewan, Canada S7M 1J3
(Address of Principal Executive Offices)
Indicate by check mark whether the registrant files or will file annual reports under cover Form 20-F or Form 40-F.
Form 20-F ☐ Form 40-F ☒
Indicate by check mark whether the registrant by furnishing the information contained in this Form is also thereby furnishing the information to the Commission pursuant to Rule 12g3-2(b) under the Securities Exchange Act of 1934.
Yes ☐ No ☒
If “Yes” is marked, indicate below the file number assigned to the registrant in connection with Rule 12g3-2(b):
Page 2
Exhibit Index
| Exhibit No. |
Description |
Page No. |
||||
| 1. | Press Release dated February 10, 2021 announcing financial results for the period ended December 31, 2020 | |||||
| 2. | 2020 Cameco Corporation Consolidated Financial Statements | |||||
| 3. | Annual Management’s Discussion and Analysis of Cameco Corporation’s 2020 Consolidated Financial Statements | |||||
SIGNATURE
Pursuant to the requirements of the Securities Exchange Act of 1934, the registrant has duly caused this report to be signed on its behalf by the undersigned, thereunto duly authorized.
| Date: February 10, 2021 | Cameco Corporation | |||||
| By: | “Sean A. Quinn” | |||||
| Sean A. Quinn | ||||||
| Senior Vice-President, Chief Legal Officer and Corporate Secretary | ||||||
| TSX: CCO NYSE: CCJ |

|
website: cameco.com currency: Cdn (unless noted) |
2121 – 11th Street West, Saskatoon, Saskatchewan, S7M 1J3 Canada
Tel: 306-956-6200 Fax: 306-956-6201
Resilient in the face of unprecedented challenges; Globally, net-zero carbon targets support nuclear growth story
Saskatoon, Saskatchewan, Canada, February 10, 2021 .. . . . . . . . . . .. . . . . .
Cameco (TSX: CCO; NYSE: CCJ) today reported its consolidated financial and operating results for the fourth quarter and year ended December 31, 2020 in accordance with International Financial Reporting Standards (IFRS).
“As we head into 2021, we remain positive about the long-term fundamentals for the uranium market,” said Tim Gitzel, Cameco’s president and CEO. “Around the globe, we are seeing an increasing focus on electrification for various reasons. There are those that are installing baseload power, those who are looking for a reliable replacement to fossil fuel sources, and finally, there is new demand for things like the electrification of transportation. This is occurring precisely at the same time countries and companies around the world are making net-zero commitments, including in the US where the new administration has expressed support for maintaining the existing domestic nuclear power fleet and the construction of advanced reactors, it has recommitted the US to the global Paris Agreement and has ambitions to re-establish the country’s position as a global leader in the development of commercial nuclear technologies. From a policy point of view, there is recognition that nuclear will be needed in the toolbox to sustainably achieve both electrification and decarbonization.
“So, demand for nuclear power is growing and not just the traditional uses of nuclear power. There is a real focus on, and significant investments being made in the development of non-traditional uses, like small modular reactors. Growing demand for nuclear power means growing demand for uranium. However, on the supply side there are some big question marks about where uranium will come from to fuel the world’s growing demand for nuclear power due to years of persistently low prices that have led to planned production curtailments, lack of investment, the end of reserve life for some mines, shrinking secondary supplies, and trade policy issues, which are currently being amplified by unplanned disruptions due to the COVID-19 pandemic.
“These are the fundamentals that give us growing confidence the uranium market will undergo a transition similar to the conversion and enrichment markets. It is why we remain committed to our vision of energizing a clean air world, which recognizes that we have an important role to play in enabling the vast reductions in greenhouse gas emissions required to achieve a resilient, net-zero carbon economy. As we seek to achieve our vision, we are committed to doing it in a manner that reflects our values. Those values have not changed, they have always guided our actions.
“We believe that our tier-one strategy that includes production discipline, marketing discipline and conservative balance sheet management, is the right strategy to achieve our vision. You can see the resiliency our conservative financial management provides us in our balance sheet. Despite the unprecedentedly challenging year globally, and the significant costs we incurred as a result of the disruptions to our business caused by the COVID-19 pandemic, we finished the year with more than $940 million in cash and a $1 billion undrawn credit facility.
“As a pure-play supplier of the uranium fuel needed to produce clean, carbon-free, baseload electricity, we are excited about the future for our industry and our company as we execute on our strategy and pursue our role in supporting the transition to a net-zero carbon economy through both traditional and non-traditional uses of nuclear power.”
Summary of Q4 and 2020 results and developments:
| • | Fourth quarter net earnings of $80 million; adjusted net earnings of $48 million: Fourth quarter results demonstrated the positive financial impact of the return of low-cost tier-one production from Cigar Lake after the first production suspension and the elimination of care and maintenance costs associated with that suspension. |
| • | Annual net loss of $53 million; adjusted net loss of $66 million: Annual results were driven by the continued execution of our strategy and the proactive measures taken due to the COVID-19 pandemic. Adjusted net earnings is a non-IFRS measure, see page 3. |
- 1 -
| • | Our response to the COVID-19 pandemic: The health and safety of our workers, their families and communities is our top priority. We proactively temporarily suspended production at several of our operations, both uranium and fuel services; withdrew our 2020 outlook; introduced additional safety protocols; and provided well-paying jobs and financial support during a time of significant economic uncertainty for many. See Our response to the COVID-19 pandemic in our 2020 annual MD&A for more details. |
| • | Impact of the COVID-19 pandemic on our business: As a result of the precautionary production suspensions at our operations, in our uranium segment we produced only 5 million pounds in 2020. To manage risk, we purchased 11.5 million pounds more than the top end of the 2020 outlook disclosed in our 2019 annual MD&A at an average annual cost of about $40.41 per pound, totaling about $465 million, compared to the Cigar Lake expected life-of mine cash operating costs of between $15 to $16 per pound. Additionally, we incurred $55 million more in care and maintenance costs than those we had planned for. Even while production was suspended, we kept and continued to pay all our employees. Partially offsetting these costs was the receipt of about $37 million under the Canada Emergency Wage Subsidy program and volatility in foreign exchange rates that resulted in foreign exchange gains. |
| • | Cigar Lake production remains suspended due to COVID-19 pandemic: In December 2020, production at the Cigar Lake mine was temporarily suspended for a second time as a precautionary measure due to the increased uncertainty about access to qualified operational personnel caused by the COVID-19 pandemic. Production at the Cigar Lake mine remains suspended and, as a result, our production plan for 2021 is uncertain. A restart of the operation will be dependent on our ability to maintain safe and stable operating protocols along with a number of other factors, including how the COVID-19 pandemic is impacting the availability of the required workforce, how cases are trending in Saskatchewan, in particular in northern communities, and the views of the public health authorities. While production is suspended, we expect to incur $8 million to $10 million per month in care and maintenance costs. |
| • | Robust fuel services contracting: In our fuel services segment, we replaced the UF6 volumes delivered under contract and added another 17.1 million kilograms to our long-term contract portfolio that reflect the price transition that began in 2017 in the conversion market, and that we expect will allow us to continue to profitably operate and consistently support the long-term fuel services needs of our customers. |
| • | Strategic patience in our uranium marketing activity: Long-term uranium contracting was delayed in 2020 due to ongoing market-access and trade policy issues and the impacts of the COVID-19 pandemic on our customers’ operations. We added 12.5 million pounds to our portolio of long-term uranium contracts. Market signals will take time to impact contracting in our business as we have seen with the transition in our fuel services segment. With our pipeline of uranium business continuing to grow and being larger than we have seen since 2011, we are being patient to capture as much value as possible in our contract portfolio. |
| • | Strengthened balance sheet: Consistent with our conservative financial management, and to take advantage of the low interest rate environment resulting from the COVID-19 pandemic, we issued debentures in the amount of $400 million, bearing interest of 2.95% per annum and maturing in 2027, and used the proceeds to redeem our outstanding $400 million debenture bearing interest of 3.75% maturing in 2022, which resulted in an early redemption fee of $24 million. Our next maturity is in 2024. As of December 31, 2020, we had $943 million in cash and short-term investments and $1.0 billion in long-term debt. In addition, we have a $1 billion undrawn credit facility. |
| • | Received dividends totaling $40.6 million (US) from JV Inkai: In 2020, we received dividend payments from JV Inkai totaling $40.6 million (US). JV Inkai distributes excess cash, net of working capital requirements, to the partners as dividends. Our share of dividends follows our production purchase entitlements. See Uranium – Tier-one operations – Inkai in our 2020 annual MD&A. |
| • | Greater focus on technology and its applications: We are implementing an initiative intended to improve efficiency and reduce costs across the organization, with a particular focus on innovation and accelerating the adoption of advanced digital and automation technologies. In 2020, we began a program to advance the assessment of innovation opportunities at the McArthur River mine and Key Lake mill. We established a team of internal experts who have been tasked with assessing, designing and implementing opportunities to improve operating efficiency. During the year, the team advanced a portfolio of 43 projects focused on improvement of the mine and mill through application of automation, digitization and optimization. The initial assessment of the majority of the projects was completed, which will allow us to complete the pre-feasibility work and to define the business case. We expect projects that meet our investment criteria will be advanced to implementation in 2021. |
- 2 -
| • | Increased ownership in Global Laser Enrichment LLC (GLE): Ownership restructuring has been approved and completed. With the restructuring, our interest in GLE increases from 24% to 49%, with Silex acquiring the remaining 51%. GLE is the exclusive licensee of the proprietary SILEX laser enrichment technology, third-generation uranium enrichment technology that is in the development phase. Having operational control of uranium production, conversion, and enrichment facilities would offer operational synergies that could enhance future profit margins, especially with the world’s increased focus on decarbonization. |
Consolidated financial results
| THREE MONTHS ENDED | YEAR ENDED | |||||||||||||||
| CONSOLIDATED HIGHLIGHTS | DECEMBER 31 | DECEMBER 31 | ||||||||||||||
| ($ MILLIONS EXCEPT WHERE INDICATED) |
2020 | 2019 | 2020 | 2019 | ||||||||||||
| Revenue |
550 | 874 | 1,800 | 1,863 | ||||||||||||
| Gross profit |
109 | 184 | 106 | 242 | ||||||||||||
| Net earnings (loss) attributable to equity holders |
80 | 128 | (53 | ) | 74 | |||||||||||
| $ per common share (basic) |
0.20 | 0.32 | (0.13 | ) | 0.19 | |||||||||||
| $ per common share (diluted) |
0.20 | 0.32 | (0.13 | ) | 0.19 | |||||||||||
| Adjusted net earnings (loss) (non-IFRS, see page 4) |
48 | 94 | (66 | ) | 41 | |||||||||||
| $ per common share (adjusted and diluted) |
0.12 | 0.24 | (0.17 | ) | 0.10 | |||||||||||
| Cash provided by operations (after working capital changes) |
257 | 274 | 57 | 527 | ||||||||||||
The 2020 annual financial statements have been audited; however, the 2019 fourth quarter and 2020 fourth quarter financial information presented is unaudited. You can find a copy of our 2020 annual MD&A and our 2020 audited financial statements on our website at cameco.com.
NET EARNINGS
The following table shows what contributed to the change in net earnings and adjusted net earnings (non-IFRS measure, see page 3) in the three months and year ended December 31, 2020, compared to the same period in 2019.
| THREE MONTHS ENDED | YEAR ENDED | |||||||||||||||||
| CHANGES IN EARNINGS | DECEMBER 31 | DECEMBER 31 | ||||||||||||||||
| ($ MILLIONS) |
IFRS | ADJUSTED | IFRS | ADJUSTED | ||||||||||||||
| Net earnings - 2019 |
128 | 94 | 74 | 41 | ||||||||||||||
|
|
|
|
|
|
|
|
|
|||||||||||
| Change in gross profit by segment |
||||||||||||||||||
| (we calculate gross profit by deducting from revenue the cost of products and services sold, and depreciation and amortization (D&A), net of hedging benefits) |
| |||||||||||||||||
| Uranium |
Lower sales volume |
(52 | ) | (52 | ) | (4 | ) | (4 | ) | |||||||||
| Higher realized prices ($US) |
29 | 29 | 25 | 25 | ||||||||||||||
| Foreign exchange impact on realized prices |
(4 | ) | (4 | ) | 14 | 14 | ||||||||||||
| Higher costs |
(33 | ) | (33 | ) | (175 | ) | (175 | ) | ||||||||||
|
|
|
|
|
|
|
|
|
|||||||||||
| change – uranium |
(60 | ) | (60 | ) | (140 | ) | (140 | ) | ||||||||||
|
|
|
|
|
|
|
|
|
|||||||||||
| Fuel services |
Lower sales volume |
(14 | ) | (14 | ) | (4 | ) | (4 | ) | |||||||||
| Higher realized prices ($Cdn) |
7 | 7 | 21 | 21 | ||||||||||||||
| Higher costs |
(8 | ) | (8 | ) | (11 | ) | (11 | ) | ||||||||||
|
|
|
|
|
|
|
|
|
|||||||||||
| change – fuel services |
(15 | ) | (15 | ) | 6 | 6 | ||||||||||||
|
|
|
|
|
|
|
|
|
|||||||||||
| Other changes |
||||||||||||||||||
| Higher administration expenditures |
(11 | ) | (11 | ) | (20 | ) | (20 | ) | ||||||||||
| Lower (higher) exploration expenditures |
(1 | ) | (1 | ) | 3 | 3 | ||||||||||||
| Change in reclamation provisions |
(26 | ) | — | (21 | ) | — | ||||||||||||
| Change in gains or losses on derivatives |
28 | 3 | 5 | 9 | ||||||||||||||
| Change in foreign exchange gains or losses |
6 | 6 | 33 | 33 | ||||||||||||||
| Change in earnings from equity-accounted investments |
— | — | (9 | ) | (9 | ) | ||||||||||||
| Redemption of Series E debentures in 2020 |
(24 | ) | (24 | ) | (24 | ) | (24 | ) | ||||||||||
| Canadian Emergency Wage Subsidy in 2020 |
37 | 37 | 37 | 37 | ||||||||||||||
| Arbitration award in 2019 related to TEPCO contract |
— | — | (52 | ) | (52 | ) | ||||||||||||
| Change in income tax recovery or expense |
22 | 23 | 47 | 42 | ||||||||||||||
| Other |
(4 | ) | (4 | ) | 8 | 8 | ||||||||||||
|
|
|
|
|
|
|
|
|
|||||||||||
| Net earnings (losses) - 2020 |
80 | 48 | (53 | ) | (66 | ) | ||||||||||||
|
|
|
|
|
|
|
|
|
|||||||||||
- 3 -
Non-IFRS measures
ADJUSTED NET EARNINGS
Adjusted net earnings is a measure that does not have a standardized meaning or a consistent basis of calculation under IFRS (non-IFRS measure). We use this measure as a more meaningful way to compare our financial performance from period to period. We believe that, in addition to conventional measures prepared in accordance with IFRS, certain investors use this information to evaluate our performance. Adjusted net earnings is our net earnings attributable to equity holders, adjusted to better reflect the underlying financial performance for the reporting period. The adjusted earnings measure reflects the matching of the net benefits of our hedging program with the inflows of foreign currencies in the applicable reporting period, and is adjusted for reclamation provisions for our Rabbit Lake and US operations, which have been impaired, and income taxes on adjustments.
Adjusted net earnings is non-standard supplemental information and should not be considered in isolation or as a substitute for financial information prepared according to accounting standards. Other companies may calculate this measure differently, so you may not be able to make a direct comparison to similar measures presented by other companies.
The following table reconciles adjusted net earnings with our net earnings for the three months and years ended December 31, 2020 and 2019.
| THREE MONTHS ENDED | YEAR ENDED | |||||||||||||||
| DECEMBER 31 | DECEMBER 31 | |||||||||||||||
| ($ MILLIONS) |
2020 | 2019 | 2020 | 2019 | ||||||||||||
| Net earnings (loss) attributable to equity holders |
80 | 128 | (53 | ) | 74 | |||||||||||
|
|
|
|
|
|
|
|
|
|||||||||
| Adjustments |
||||||||||||||||
| Adjustments on derivatives |
(43 | ) | (18 | ) | (45 | ) | (49 | ) | ||||||||
| Reclamation provision adjustments |
— | (26 | ) | 24 | 3 | |||||||||||
| Income taxes on adjustments |
11 | 10 | 8 | 13 | ||||||||||||
|
|
|
|
|
|
|
|
|
|||||||||
| Adjusted net earnings (loss) |
48 | 94 | (66 | ) | 41 | |||||||||||
|
|
|
|
|
|
|
|
|
|||||||||
Every quarter we are required to update the reclamation provisions for all operations based on new cash flow estimates, discount and inflation rates. This normally results in an adjustment to an asset retirement obligation asset in addition to the provision balance. When the assets of an operation have been written off due to an impairment, as is the case with our Rabbit Lake and US ISR operations, the adjustment is recorded directly to the statement of earnings as “other operating expense (income)”. See note 15 of our annual financial statements for more information. This amount has been excluded from our adjusted net earnings measure.
Selected segmented highlights
| THREE MONTHS ENDED | YEAR ENDED | |||||||||||||||||||||||||||
| DECEMBER 31 | DECEMBER 31 | |||||||||||||||||||||||||||
| HIGHLIGHTS |
2020 | 2019 | CHANGE | 2020 | 2019 | CHANGE | ||||||||||||||||||||||
| Uranium |
Production volume (million lbs) | 2.8 | 2.7 | 4 | % | 5.0 | 9.0 | (44 | )% | |||||||||||||||||||
| Sales volume (million lbs) | 8.6 | 14.0 | (39 | )% | 30.6 | 31.5 | (3 | )% | ||||||||||||||||||||
| Average realized price | ($US/lb) | 38.43 | 35.92 | 7 | % | 34.39 | 33.77 | 2 | % | |||||||||||||||||||
| ($Cdn/lb) | 50.40 | 47.50 | 6 | % | 46.14 | 44.85 | 3 | % | ||||||||||||||||||||
| Revenue ($ millions) | 436 | 666 | (35 | )% | 1,412 | 1,414 | — | |||||||||||||||||||||
| Gross profit ($ millions) | 76 | 136 | (44 | )% | 13 | 153 | (92 | )% | ||||||||||||||||||||
| Fuel services |
Production volume (million kgU) | 3.3 | 4.0 | (18 | )% | 11.7 | 13.3 | (12 | )% | |||||||||||||||||||
| Sales volume (million kgU) | 4.4 | 6.2 | (29 | )% | 13.5 | 14.1 | (4 | )% | ||||||||||||||||||||
| Average realized price | ($Cdn/kgU) | 26.29 | 24.61 | 7 | % | 27.89 | 26.21 | 6 | % | |||||||||||||||||||
| Revenue ($ millions) | 115 | 152 | (24 | )% | 377 | 370 | 2 | % | ||||||||||||||||||||
| Gross profit ($ millions) | 32 | 47 | (32 | )% | 96 | 90 | 7 | % | ||||||||||||||||||||
- 4 -
Management’s discussion and analysis (MD&A) and financial statements
The 2020 annual MD&A and consolidated financial statements provide a detailed explanation of our operating results for the three and twelve months ended December 31, 2020, as compared to the same periods last year, and our outlook for 2021. This news release should be read in conjunction with these documents, as well as our most recent annual information form, all of which are available on our website at cameco.com, on SEDAR at sedar.com, and on EDGAR at sec.gov/edgar.shtml.
Qualified persons
The technical and scientific information discussed in this news release for our material properties (McArthur River/Key Lake, Cigar Lake) was approved by the following individuals who are qualified persons for the purposes of NI 43-101:
| MCARTHUR RIVER/KEY LAKE | CIGAR LAKE | |
| • Greg Murdock, general manager, McArthur River/Key Lake, Cameco |
• Lloyd Rowson, general manager, Cigar Lake, Cameco | |
Caution about forward-looking information
This news release includes statements and information about our expectations for the future, which we refer to as forward-looking information. Forward-looking information is based on our current views, which can change significantly, and actual results and events may be significantly different from what we currently expect.
Examples of forward-looking information in this news release include: our views of the future growth in demand for nuclear power and the resulting strength of the uranium market, including as a result of net-zero carbon emission targets and the use of nuclear energy in achieving both electrification and decarbonization; our belief that the uranium market will undergo a transition similar to that of the conversion and enrichment markets; our intention to pursue our business objectives in a manner that reflects our values; our belief that our strategy of production discipline, marketing discipline and conservative balance sheet management is the right strategy to achieve our business objectives; the factors that will determine our ability to restart operation and production at Cigar Lake and the monthly care and maintenance costs we expect to incur for Cigar Lake while production is suspended; the delay we expect between changing market signals and their impact on contracting in our business; our expectations regarding the profitable operation of our fuel services segment; our expectations regarding our innovation opportunities program and that projects meeting our investment criteria will be advanced to implementation in 2021; our view that having operational control of uranium production, conversion and enrichment facilities of GLE as a result of ownership restructuring could enhance our future profit margins; and the expected date for announcement of our 2021 first quarter results.
Material risks that could lead to different results include: unexpected changes in uranium supply, demand, long-term contracting, and prices; changes in consumer demand for nuclear power and uranium as a result of changing societal views and objectives regarding nuclear power, electrification and decarbonization; the risk that the uranium market will not undergo a transition similar to that of the conversion and enrichment markets; the risk that we may not be able to implement our business objectives in a manner consistent with our values; the risk that the strategy we are pursuing may prove unsuccessful, or that we may not be able to execute it successfully; the risk of unforeseen delays in restarting operation and production at Cigar Lake, and the risk of incurring higher monthly care and maintenance costs than expected; the risk that we may not be able to fully interpret or respond to changing market signals in a timely manner; the risk that our fuel services segment may not operate as profitably and consistently with the needs of our customers as we expect; the risk that projects under consideration in our innovation opportunities program may not be advanced to implementation in 2021, or at all; the risk that the GLE ownership restructuring will not provide the expected profit margin enhancements for us; and the risk that we may be delayed in announcing our future financial results.
In presenting the forward-looking information, we have made material assumptions which may prove incorrect about: uranium demand, supply, consumption, long-term contracting, growth in the demand for and global public acceptance of nuclear energy, and prices; societal objectives for electrification and decarbonization; our production, purchases, sales, deliveries and costs; the market conditions and other factors upon which we have based our future plans and forecasts; the success of our plans and strategies; the absence of new and adverse government regulations, policies or decisions; and our ability to announce future financial results when expected.
- 5 -
Please also review the discussion in our 2020 annual MD&A and most recent annual information form for other material risks that could cause actual results to differ significantly from our current expectations, and other material assumptions we have made. Forward-looking information is designed to help you understand management’s current views of our near-term and longer-term prospects, and it may not be appropriate for other purposes. We will not necessarily update this information unless we are required to by securities laws.
Conference call
We invite you to join our fourth quarter conference call on Wednesday, February 10, 2021 at 8:00 a.m. Eastern.
The call will be open to all investors and the media. To join the call, please dial (800) 319-4610 (Canada and US) or (604) 638-5340. An operator will put your call through. The slides and a live webcast of the conference call will be available from a link at cameco.com. See the link on our home page on the day of the call.
A recorded version of the proceedings will be available:
| • | on our website, cameco.com, shortly after the call |
| • | on post view until midnight, Eastern, March 10, 2021, by calling (800) 319-6413 (Canada and US) or (604) 638-9010 (Passcode 5895) |
2021 first quarter report release date
We plan to announce our 2021 first quarter results before markets open on May 7, 2021.
Profile
Cameco is one of the largest global providers of the uranium fuel needed to energize a clean-air world. Our competitive position is based on our controlling ownership of the world’s largest high-grade reserves and low-cost operations. Utilities around the world rely on our nuclear fuel products to generate power in safe, reliable, carbon-free nuclear reactors. Our shares trade on the Toronto and New York stock exchanges. Our head office is in Saskatoon, Saskatchewan.
As used in this news release, the terms we, us, our, the Company and Cameco mean Cameco Corporation and its subsidiaries unless otherwise indicated.
- End -
Investor inquiries:
Rachelle Girard
306-956-6403
Media inquiries:
Jeff Hryhoriw
306-385-5221
- 6 -

Cameco Corporation
2020 consolidated financial statements
February 9, 2021
Report of management’s accountability
The accompanying consolidated financial statements have been prepared by management in accordance with International Financial Reporting Standards as issued by the International Accounting Standards Board. Management is responsible for ensuring that these statements, which include amounts based upon estimates and judgments, are consistent with other information and operating data contained in the annual financial review and reflect the corporation’s business transactions and financial position.
Management is also responsible for the information disclosed in the management’s discussion and analysis including responsibility for the existence of appropriate information systems, procedures and controls to ensure that the information used internally by management and disclosed externally is complete and reliable in all material respects.
In addition, management is responsible for establishing and maintaining an adequate system of internal control over financial reporting. The internal control system includes an internal audit function and a code of conduct and ethics, which is communicated to all levels in the organization and requires all employees to maintain high standards in their conduct of the Company’s affairs. Such systems are designed to provide reasonable assurance that the financial information is relevant, reliable and accurate and that the Company’s assets are appropriately accounted for and adequately safeguarded. Management conducted an evaluation of the effectiveness of the system of internal control over financial reporting based on the criteria established in “Internal Control – Integrated Framework (2013)” issued by the Committee of Sponsoring Organizations of the Treadway Commission. Based on this evaluation, management concluded that the Company’s system of internal control over financial reporting was effective as at December 31, 2020.
KPMG LLP has audited the consolidated financial statements in accordance with the standards of the Public Company Accounting Oversight Board (United States).
The board of directors annually appoints an audit and finance committee comprised of directors who are not employees of the corporation. This committee meets regularly with management, the internal auditor and the shareholders’ auditors to review significant accounting, reporting and internal control matters. Both the internal and shareholders’ auditors have unrestricted access to the audit and finance committee. The audit and finance committee reviews the consolidated financial statements, the report of the shareholders’ auditors, and management’s discussion and analysis and submits its report to the board of directors for formal approval.
| Original signed by Tim S. Gitzel | Original signed by Grant E. Isaac | |
| President and Chief Executive Officer | Senior Vice-President and Chief Financial Officer | |
| February 9, 2021 | February 9, 2021 |
2
Report of independent registered public accounting firm
To the Shareholders and Board of Directors of Cameco Corporation:
Opinion on the consolidated financial statements
We have audited the accompanying consolidated statements of financial position of Cameco Corporation (the “Company”) as of December 31, 2020 and 2019, the related consolidated statements of earnings, comprehensive income, changes in equity, and cash flows for each of the years then ended, and the related notes (collectively, the “consolidated financial statements”). In our opinion, the consolidated financial statements present fairly, in all material respects, the financial position of the Company as of December 31, 2020 and 2019, and its financial performance and its cash flows for the years then ended, in conformity with International Financial Reporting Standards as issued by the International Accounting Standards Board.
We also have audited, in accordance with the standards of the Public Company Accounting Oversight Board (United States) (“PCAOB”), the Company’s internal control over financial reporting as of December 31, 2020, based on the criteria established in Internal Control – Integrated Framework (2013) issued by the Committee of Sponsoring Organizations of the Treadway Commission (COSO), and our report dated February 9, 2021 expressed an unqualified opinion on the effectiveness of the Company’s internal control over financial reporting.
Basis for opinion
These consolidated financial statements are the responsibility of the Company’s management. Our responsibility is to express an opinion on these consolidated financial statements based on our audits. We are a public accounting firm registered with the PCAOB and are required to be independent with respect to the Company in accordance with the U.S. federal securities laws and the applicable rules and regulations of the Securities and Exchange Commission and the PCAOB.
We conducted our audits in accordance with the standards of the PCAOB. Those standards require that we plan and perform the audit to obtain reasonable assurance about whether the consolidated financial statements are free of material misstatement, whether due to error or fraud. Our audits included performing procedures to assess the risks of material misstatement of the consolidated financial statements, whether due to error or fraud, and performing procedures that respond to those risks. Such procedures included examining, on a test basis, evidence regarding the amounts and disclosures in the consolidated financial statements. Our audits also included evaluating the accounting principles used and significant estimates made by management, as well as evaluating the overall presentation of the consolidated financial statements. We believe that our audits provide a reasonable basis for our opinion.
Critical Audit Matter
The critical audit matter communicated below is a matter arising from the current period audit of the consolidated financial statements that was communicated or required to be communicated to the audit and finance committee and that: (1) relates to accounts or disclosures that are material to the consolidated financial statements and (2) involved our especially challenging, subjective, or complex judgments. The communication of the critical audit matter does not alter in any way our opinion on the consolidated financial statements, taken as a whole, and we are not, by communicating the critical audit matter below, providing separate opinions on the critical audit matter or on the accounts or disclosures to which they relate.
Assessment of recoverability of deferred tax assets
As discussed in note 21 of the consolidated financial statements, as at December 31, 2020 the Company recorded deferred tax assets of $936,678,000 relating to tax losses incurred in certain jurisdictions and temporary differences. The assessment of the recoverability of these deferred tax assets is dependent on the generation of future taxable income. Significant judgment and estimation is required to assess the sufficiency of future taxable income to utilize the recognized deferred tax assets. The Company uses projections of future taxable income in order to assess the probability that the deferred tax assets will be realized. Predicting future taxable income is dependent on assumptions and judgments regarding future market conditions, production rates, and intercompany sales. The Company determined that the realization of these deferred tax assets is probable.
3
We identified the assessment of the recoverability of deferred tax assets as a critical audit matter due to the high degree of judgment required in assessing the significant assumptions and judgments that are reflected in the projections of future taxable income.
The following are the primary procedures we performed to address this critical audit matter. We evaluated the design and tested the operating effectiveness of certain internal controls related to the Company’s assessment of the recoverability of the deferred tax asset, including controls related to the assumptions and judgments used in the projections of future taxable income. To assess the Company’s ability to estimate future taxable income, we compared the Company’s previous forecasts to actual results. To assess the Company’s estimate of future taxable income, we evaluated key assumptions in the model by comparing (1) forecast uranium sales prices to published views of independent market participants, (2) foreign exchange rates to external analyst estimates, (3) forecast sales to historical trends, board approved budgets and committed sales volumes, including to a sample of committed sales contracts, and (4) forecast production volumes to historical data, board approved budgets and life of mine plans. We performed a sensitivity analysis over the key assumptions to assess their impact on the Company’s determination that the deferred tax assets were recoverable. We involved income tax professionals with specialized skills and knowledge in assessing the Company’s application of the tax regulations in relevant jurisdictions.
Original signed by KPMG LLP
Chartered Professional Accountants
We have served as the Company’s auditor since 1988.
Saskatoon, Canada
February 9, 2021
4
Consolidated statements of earnings
| For the years ended December 31 | ||||||||||||
| ($Cdn thousands, except per share amounts) |
Note | 2020 | 2019 | |||||||||
| Revenue from products and services |
17 | $ | 1,800,073 | $ | 1,862,925 | |||||||
| Cost of products and services sold |
1,484,962 | 1,345,551 | ||||||||||
| Depreciation and amortization |
208,662 | 275,749 | ||||||||||
|
|
|
|
|
|||||||||
| Cost of sales |
1,693,624 | 1,621,300 | ||||||||||
|
|
|
|
|
|||||||||
| Gross profit |
106,449 | 241,625 | ||||||||||
| Administration |
145,344 | 124,869 | ||||||||||
| Exploration |
10,873 | 13,686 | ||||||||||
| Research and development |
3,965 | 6,058 | ||||||||||
| Other operating expense |
15 | 23,921 | 2,732 | |||||||||
| Loss on disposal of assets |
1,072 | 1,869 | ||||||||||
|
|
|
|
|
|||||||||
| Earnings (loss) from operations |
(78,726 | ) | 92,411 | |||||||||
| Finance costs |
19 | (96,133 | ) | (98,622 | ) | |||||||
| Gain on derivatives |
26 | 36,577 | 32,269 | |||||||||
| Finance income |
10,835 | 29,760 | ||||||||||
| Share of earnings from equity-accounted investee |
11 | 36,476 | 45,360 | |||||||||
| Other income |
20 | 51,440 | 33,840 | |||||||||
|
|
|
|
|
|||||||||
| Earnings (loss) before income taxes |
(39,531 | ) | 135,018 | |||||||||
| Income tax expense |
21 | 13,666 | 61,077 | |||||||||
|
|
|
|
|
|||||||||
| Net earnings (loss) |
$ | (53,197 | ) | $ | 73,941 | |||||||
|
|
|
|
|
|||||||||
| Net earnings (loss) attributable to: |
||||||||||||
| Equity holders |
(53,169 | ) | 74,000 | |||||||||
| Non-controlling interest |
(28 | ) | (59 | ) | ||||||||
|
|
|
|
|
|||||||||
| Net earnings (loss) |
$ | (53,197 | ) | $ | 73,941 | |||||||
|
|
|
|
|
|||||||||
| Earnings (loss) per common share attributable to equity holders: |
||||||||||||
| Basic |
22 | $ | (0.13 | ) | $ | 0.19 | ||||||
|
|
|
|
|
|||||||||
| Diluted |
22 | $ | (0.13 | ) | $ | 0.19 | ||||||
|
|
|
|
|
|||||||||
See accompanying notes to consolidated financial statements.
5
Consolidated statements of comprehensive income
| For the years ended December 31 | ||||||||||||
| ($Cdn thousands) |
Note | 2020 | 2019 | |||||||||
| Net earnings (loss) |
$ | (53,197 | ) | $ | 73,941 | |||||||
| Other comprehensive income (loss), net of taxes: |
||||||||||||
| Items that will not be reclassified to net earnings: |
||||||||||||
| Remeasurements of defined benefit liability1 |
25 | (4,959 | ) | (8,112 | ) | |||||||
| Equity investments at FVOCI - net change in fair value2 |
16,986 | (4,044 | ) | |||||||||
| Equity investments at FVOCI - net change in fair value - equity-accounted investee |
(39 | ) | (709 | ) | ||||||||
| Items that are or may be reclassified to net earnings: |
||||||||||||
| Exchange differences on translation of foreign operations |
26,807 | (27,888 | ) | |||||||||
|
|
|
|
|
|||||||||
| Other comprehensive income (loss), net of taxes |
38,795 | (40,753 | ) | |||||||||
|
|
|
|
|
|||||||||
| Total comprehensive income (loss) |
$ | (14,402 | ) | $ | 33,188 | |||||||
|
|
|
|
|
|||||||||
| Other comprehensive income (loss) attributable to: |
||||||||||||
| Equity holders |
$ | 38,799 | $ | (40,740 | ) | |||||||
| Non-controlling interest |
(4 | ) | (13 | ) | ||||||||
|
|
|
|
|
|||||||||
| Other comprehensive income (loss) for the year |
$ | 38,795 | $ | (40,753 | ) | |||||||
|
|
|
|
|
|||||||||
| Total comprehensive income (loss) attributable to: |
||||||||||||
| Equity holders |
$ | (14,370 | ) | $ | 33,260 | |||||||
| Non-controlling interest |
(32 | ) | (72 | ) | ||||||||
|
|
|
|
|
|||||||||
| Total comprehensive income (loss) for the year |
$ | (14,402 | ) | $ | 33,188 | |||||||
|
|
|
|
|
|||||||||
| 1 | Net of tax (2020 - $1,463; 2019 - $2,301) |
| 2 | Net of tax (2020 - $(2,469); 2019 - $453) |
See accompanying notes to consolidated financial statements.
6
Consolidated statements of financial position
| As at December 31 | ||||||||||||
| ($Cdn thousands) |
Note | 2020 | 2019 | |||||||||
| Assets |
||||||||||||
| Current assets |
||||||||||||
| Cash and cash equivalents |
$ | 918,382 | $ | 1,062,431 | ||||||||
| Short-term investments |
24,985 | — | ||||||||||
| Accounts receivable |
6 | 204,980 | 328,044 | |||||||||
| Current tax assets |
8,184 | 3,667 | ||||||||||
| Inventories |
7 | 680,369 | 320,770 | |||||||||
| Supplies and prepaid expenses |
89,428 | 85,502 | ||||||||||
| Current portion of long-term receivables, investments and other |
10 | 18,716 | 6,564 | |||||||||
|
|
|
|
|
|||||||||
| Total current assets |
1,945,044 | 1,806,978 | ||||||||||
|
|
|
|
|
|||||||||
| Property, plant and equipment |
8 | 3,771,557 | 3,720,672 | |||||||||
| Intangible assets |
9 | 55,822 | 60,410 | |||||||||
| Long-term receivables, investments and other |
10 | 652,042 | 630,131 | |||||||||
| Investment in equity-accounted investee |
11 | 219,688 | 252,681 | |||||||||
| Deferred tax assets |
21 | 936,678 | 956,376 | |||||||||
|
|
|
|
|
|||||||||
| Total non-current assets |
5,635,787 | 5,620,270 | ||||||||||
|
|
|
|
|
|||||||||
| Total assets |
$ | 7,580,831 | $ | 7,427,248 | ||||||||
|
|
|
|
|
|||||||||
| Liabilities and shareholders’ equity |
||||||||||||
| Current liabilities |
||||||||||||
| Accounts payable and accrued liabilities |
12 | $ | 233,649 | $ | 181,799 | |||||||
| Current tax liabilities |
1,480 | 6,290 | ||||||||||
| Current portion of other liabilities |
14 | 26,119 | 33,073 | |||||||||
| Current portion of provisions |
15 | 42,535 | 56,248 | |||||||||
|
|
|
|
|
|||||||||
| Total current liabilities |
303,783 | 277,410 | ||||||||||
|
|
|
|
|
|||||||||
| Long-term debt |
13 | 995,541 | 996,718 | |||||||||
| Other liabilities |
14 | 166,559 | 153,927 | |||||||||
| Provisions |
15 | 1,156,387 | 1,004,230 | |||||||||
|
|
|
|
|
|||||||||
| Total non-current liabilities |
2,318,487 | 2,154,875 | ||||||||||
|
|
|
|
|
|||||||||
| Shareholders’ equity |
||||||||||||
| Share capital |
1,869,710 | 1,862,749 | ||||||||||
| Contributed surplus |
237,358 | 234,681 | ||||||||||
| Retained earnings |
2,735,830 | 2,825,596 | ||||||||||
| Other components of equity |
115,457 | 71,699 | ||||||||||
|
|
|
|
|
|||||||||
| Total shareholders’ equity attributable to equity holders |
4,958,355 | 4,994,725 | ||||||||||
| Non-controlling interest |
206 | 238 | ||||||||||
|
|
|
|
|
|||||||||
| Total shareholders’ equity |
4,958,561 | 4,994,963 | ||||||||||
|
|
|
|
|
|||||||||
| Total liabilities and shareholders’ equity |
$ | 7,580,831 | $ | 7,427,248 | ||||||||
|
|
|
|
|
|||||||||
Commitments and contingencies [notes 8, 15, 21]
See accompanying notes to consolidated financial statements.
7
Consolidated statements of changes in equity
| Attributable to equity holders | ||||||||||||||||||||||||||||||||
| Foreign | Equity | Non- | ||||||||||||||||||||||||||||||
| Share | Contributed | Retained | currency | investments | controlling | Total | ||||||||||||||||||||||||||
| ($Cdn thousands) |
capital | surplus | earnings | translation | at FVOCI | Total | interest | equity | ||||||||||||||||||||||||
| Balance at January 1, 2020 |
$ | 1,862,749 | $ | 234,681 | $ | 2,825,596 | $ | 77,114 | $ | (5,415 | ) | $ | 4,994,725 | $ | 238 | $ | 4,994,963 | |||||||||||||||
| Net loss |
— | — | (53,169 | ) | — | — | (53,169 | ) | (28 | ) | (53,197 | ) | ||||||||||||||||||||
| Other comprehensive income (loss) |
— | — | (4,959 | ) | 26,811 | 16,947 | 38,799 | (4 | ) | 38,795 | ||||||||||||||||||||||
|
|
|
|
|
|
|
|
|
|
|
|
|
|
|
|
|
|||||||||||||||||
| Total comprehensive income (loss) |
— | — | (58,128 | ) | 26,811 | 16,947 | (14,370 | ) | (32 | ) | (14,402 | ) | ||||||||||||||||||||
|
|
|
|
|
|
|
|
|
|
|
|
|
|
|
|
|
|||||||||||||||||
| Share-based compensation |
— | 6,564 | — | — | — | 6,564 | — | 6,564 | ||||||||||||||||||||||||
| Stock options exercised |
6,961 | (1,586 | ) | — | — | — | 5,375 | — | 5,375 | |||||||||||||||||||||||
| Restricted and performance share units released |
— | (2,301 | ) | — | — | — | (2,301 | ) | — | (2,301 | ) | |||||||||||||||||||||
| Dividends |
— | — | (31,638 | ) | — | — | (31,638 | ) | — | (31,638 | ) | |||||||||||||||||||||
|
|
|
|
|
|
|
|
|
|
|
|
|
|
|
|
|
|||||||||||||||||
| Balance at December 31, 2020 |
$ | 1,869,710 | $ | 237,358 | $ | 2,735,830 | $ | 103,925 | $ | 11,532 | $ | 4,958,355 | $ | 206 | $ | 4,958,561 | ||||||||||||||||
|
|
|
|
|
|
|
|
|
|
|
|
|
|
|
|
|
|||||||||||||||||
| Balance at January 1, 2019 |
$ | 1,862,652 | $ | 234,982 | $ | 2,791,321 | $ | 104,989 | $ | (662 | ) | $ | 4,993,282 | $ | 310 | $ | 4,993,592 | |||||||||||||||
| Net earnings (loss) |
— | — | 74,000 | — | — | 74,000 | (59 | ) | 73,941 | |||||||||||||||||||||||
| Other comprehensive loss |
— | — | (8,112 | ) | (27,875 | ) | (4,753 | ) | (40,740 | ) | (13 | ) | (40,753 | ) | ||||||||||||||||||
|
|
|
|
|
|
|
|
|
|
|
|
|
|
|
|
|
|||||||||||||||||
| Total comprehensive income (loss) |
— | — | 65,888 | (27,875 | ) | (4,753 | ) | 33,260 | (72 | ) | 33,188 | |||||||||||||||||||||
|
|
|
|
|
|
|
|
|
|
|
|
|
|
|
|
|
|||||||||||||||||
| Share-based compensation |
— | 14,342 | — | — | — | 14,342 | — | 14,342 | ||||||||||||||||||||||||
| Stock options exercised |
97 | (16 | ) | — | — | — | 81 | — | 81 | |||||||||||||||||||||||
| Restricted and performance share units released |
— | (6,258 | ) | — | — | — | (6,258 | ) | — | (6,258 | ) | |||||||||||||||||||||
| Modification of share-based arrangement [note 24] |
— | (8,369 | ) | — | — | — | (8,369 | ) | — | (8,369 | ) | |||||||||||||||||||||
| Dividends |
— | — | (31,613 | ) | — | — | (31,613 | ) | — | (31,613 | ) | |||||||||||||||||||||
|
|
|
|
|
|
|
|
|
|
|
|
|
|
|
|
|
|||||||||||||||||
| Balance at December 31, 2019 |
$ | 1,862,749 | $ | 234,681 | $ | 2,825,596 | $ | 77,114 | $ | (5,415 | ) | $ | 4,994,725 | $ | 238 | $ | 4,994,963 | |||||||||||||||
|
|
|
|
|
|
|
|
|
|
|
|
|
|
|
|
|
|||||||||||||||||
See accompanying notes to consolidated financial statements.
8
Consolidated statements of cash flows
| For the years ended December 31 | ||||||||||||
| ($Cdn thousands) |
Note | 2020 | 2019 | |||||||||
| Operating activities |
||||||||||||
| Net earnings (loss) |
$ | (53,197 | ) | $ | 73,941 | |||||||
| Adjustments for: |
||||||||||||
| Depreciation and amortization |
208,662 | 275,749 | ||||||||||
| Deferred charges |
(2,945 | ) | (13,013 | ) | ||||||||
| Unrealized gain on derivatives |
(42,892 | ) | (55,048 | ) | ||||||||
| Share-based compensation |
24 | 6,564 | 14,342 | |||||||||
| Loss on disposal of assets |
1,072 | 1,869 | ||||||||||
| Finance costs |
19 | 96,133 | 98,622 | |||||||||
| Finance income |
(10,835 | ) | (29,760 | ) | ||||||||
| Share of earnings from equity-accounted investee |
11 | (36,476 | ) | (45,360 | ) | |||||||
| Other expense (income) |
20 | (13,891 | ) | 18,961 | ||||||||
| Other operating expense |
15 | 23,921 | 2,732 | |||||||||
| Income tax expense |
21 | 13,666 | 61,077 | |||||||||
| Interest received |
9,994 | 30,944 | ||||||||||
| Income taxes paid |
(4,374 | ) | (18,589 | ) | ||||||||
| Dividends from equity-accounted investee |
31 | 54,404 | 14,079 | |||||||||
| Other operating items |
23 | (192,917 | ) | 96,478 | ||||||||
|
|
|
|
|
|||||||||
| Net cash provided by operations |
56,889 | 527,024 | ||||||||||
|
|
|
|
|
|||||||||
| Investing activities |
||||||||||||
| Additions to property, plant and equipment |
(77,462 | ) | (75,211 | ) | ||||||||
| Decrease (increase) in short-term investments |
(24,985 | ) | 391,025 | |||||||||
| Decrease in long-term receivables, investments and other |
907 | 120,913 | ||||||||||
| Proceeds from sale of property, plant and equipment |
511 | 679 | ||||||||||
|
|
|
|
|
|||||||||
| Net cash provided by (used in) investing |
(101,029 | ) | 437,406 | |||||||||
|
|
|
|
|
|||||||||
| Financing activities |
||||||||||||
| Increase in long-term debt |
397,539 | — | ||||||||||
| Decrease in long-term debt |
(400,000 | ) | (500,000 | ) | ||||||||
| Interest paid |
(65,547 | ) | (72,484 | ) | ||||||||
| Proceeds from issuance of shares, stock option plan |
5,375 | 81 | ||||||||||
| Lease principal payments |
(3,716 | ) | (2,904 | ) | ||||||||
| Dividends paid |
(31,638 | ) | (31,613 | ) | ||||||||
|
|
|
|
|
|||||||||
| Net cash used in financing |
(97,987 | ) | (606,920 | ) | ||||||||
|
|
|
|
|
|||||||||
| Increase (decrease) in cash and cash equivalents, during the year |
(142,127 | ) | 357,510 | |||||||||
| Exchange rate changes on foreign currency cash balances |
(1,922 | ) | (6,607 | ) | ||||||||
| Cash and cash equivalents, beginning of year |
1,062,431 | 711,528 | ||||||||||
|
|
|
|
|
|||||||||
| Cash and cash equivalents, end of year |
$ | 918,382 | $ | 1,062,431 | ||||||||
|
|
|
|
|
|||||||||
| Cash and cash equivalents is comprised of: |
||||||||||||
| Cash |
$ | 503,496 | $ | 427,986 | ||||||||
| Cash equivalents |
414,886 | 634,445 | ||||||||||
|
|
|
|
|
|||||||||
| Cash and cash equivalents |
$ | 918,382 | $ | 1,062,431 | ||||||||
|
|
|
|
|
|||||||||
See accompanying notes to consolidated financial statements.
9
Notes to consolidated financial statements
For the years ended December 31, 2020 and 2019
| 1. | Cameco Corporation |
Cameco Corporation is incorporated under the Canada Business Corporations Act. The address of its registered office is 2121 11th Street West, Saskatoon, Saskatchewan, S7M 1J3. The consolidated financial statements as at and for the year ended December 31, 2020 comprise Cameco Corporation and its subsidiaries (collectively, the Company or Cameco) and the Company’s interests in associates and joint arrangements.
Cameco is one of the world’s largest providers of the uranium needed to generate clean, reliable baseload electricity around the globe. The Company has mines in northern Saskatchewan and the United States, as well as a 40% interest in Joint Venture Inkai LLP (JV Inkai), a joint arrangement with Joint Stock Company National Atomic Company Kazatomprom (Kazatomprom), located in Kazakhstan. JV Inkai is accounted for on an equity basis (see note 11).
Cameco’s Cigar Lake mine was placed in a temporary state of care and maintenance in March of 2020 due to the global COVID-19 pandemic. While production resumed in September, the mine returned to a temporary state of care and maintenance in January 2021 as a result of the pandemic. Cameco also has two other operations in northern Saskatchewan which are in care and maintenance. Rabbit Lake was placed in care and maintenance in the second quarter of 2016 while operations at McArthur River/Key Lake were suspended indefinitely in the third quarter of 2018. Cameco’s operations in the United States, Crow Butte and Smith Ranch-Highland, are also not currently producing as the decision was made in 2016 to curtail production and defer all wellfield development. See note 28 for the financial statement impact.
The Company is also a leading provider of nuclear fuel processing services, supplying much of the world’s reactor fleet with the fuel to generate one of the cleanest sources of electricity available today. It operates the world’s largest commercial refinery in Blind River, Ontario, controls about 24% of the world UF6 primary conversion capacity in Port Hope, Ontario and is a leading manufacturer of fuel assemblies and reactor components for CANDU reactors at facilities in Port Hope and Cobourg, Ontario. Also a result of the COVID-19 pandemic, production was temporarily suspended at the Port Hope UF6 conversion plant and at the Blind River refinery for approximately four weeks in the second quarter of 2020. See note 28 for the financial statement impact.
| 2. | Significant accounting policies |
| A. | Statement of compliance |
These consolidated financial statements have been prepared in accordance with International Financial Reporting Standards (IFRS) as issued by the International Accounting Standards Board (IASB).
These consolidated financial statements were authorized for issuance by the Company’s board of directors on February 9, 2021.
| B. | Basis of presentation |
These consolidated financial statements are presented in Canadian dollars, which is the Company’s functional currency. All financial information is presented in Canadian dollars, unless otherwise noted. Amounts presented in tabular format have been rounded to the nearest thousand except per share amounts and where otherwise noted.
The consolidated financial statements have been prepared on the historical cost basis except for the following material items which are measured on an alternative basis at each reporting date:
10
| Derivative financial instruments Equity investments |
Fair value through profit or loss (FVTPL) Fair value through other comprehensive income (FVOCI) | |
| Liabilities for cash-settled share-based payment arrangements | FVTPL | |
| Net defined benefit liability | Fair value of plan assets less the present value of the defined benefit obligation | |
The preparation of the consolidated financial statements in conformity with IFRS requires management to make judgments, estimates and assumptions that affect the application of accounting policies and the reported amounts of assets, liabilities, revenue and expenses. Actual results may vary from these estimates.
Estimates and underlying assumptions are reviewed on an ongoing basis. Revisions to accounting estimates are recognized in the period in which the estimates are revised and in any future periods affected. The areas involving a higher degree of judgment or complexity, or areas where assumptions and estimates are significant to the consolidated financial statements are disclosed in note 5.
This summary of significant accounting policies is a description of the accounting methods and practices that have been used in the preparation of these consolidated financial statements and is presented to assist the reader in interpreting the statements contained herein. These accounting policies have been applied consistently to all entities within the consolidated group.
| C. | Consolidation principles |
| i. | Business combinations |
The acquisition method of accounting is used to account for the acquisition of subsidiaries by the Company. The Company measures goodwill at the acquisition date as the fair value of the consideration transferred, including the recognized amount of any non-controlling interests in the acquiree, less the net recognized amount (generally fair value) of the identifiable assets acquired and liabilities assumed, all measured as of the acquisition date. When the excess is negative, a bargain purchase gain is recognized immediately in earnings. In a business combination achieved in stages, the acquisition date fair value of the Company’s previously held equity interest in the acquiree is also considered in computing goodwill.
Consideration transferred includes the fair values of the assets transferred, liabilities incurred and equity interests issued by the Company. Consideration also includes the fair value of any contingent consideration and share-based compensation awards that are replaced mandatorily in a business combination.
The Company elects on a transaction-by-transaction basis whether to measure any non-controlling interest at fair value, or at their proportionate share of the recognized amount of the identifiable net assets of the acquiree, at the acquisition date.
Acquisition-related costs are expensed as incurred, except for those costs related to the issue of debt or equity instruments.
| ii. | Subsidiaries |
The consolidated financial statements include the accounts of Cameco and its subsidiaries. Subsidiaries are entities over which the Company has control. Subsidiaries are fully consolidated from the date on which control is acquired by the Company and are deconsolidated from the date that control ceases.
| iii. | Investments in equity-accounted investees |
Cameco’s investments in equity-accounted investees include investments in associates.
Associates are those entities over which the Company has significant influence, but not control or joint control, over the financial and operating policies. Significant influence is presumed to exist when the Company holds between 20% and 50% of the voting power of another entity, but can also arise where the Company holds less than 20% if it has the power to be actively involved and influential in policy decisions affecting the entity.
11
Investments in associates are accounted for using the equity method. The equity method involves the recording of the initial investment at cost and the subsequent adjusting of the carrying value of the investment for Cameco’s proportionate share of the earnings or loss and any other changes in the associates’ net assets, such as dividends. The cost of the investment includes transaction costs.
Adjustments are made to align the accounting policies of the associate with those of the Company before applying the equity method. When the Company’s share of losses exceeds its interest in an equity-accounted investee, the carrying amount of that interest is reduced to zero, and the recognition of further losses is discontinued except to the extent that the Company has incurred legal or constructive obligations or made payments on behalf of the associate. If the associate subsequently reports profits, Cameco resumes recognizing its share of those profits only after its share of the profits equals the share of losses not recognized.
| iv. | Joint arrangements |
A joint arrangement can take the form of a joint operation or joint venture. All joint arrangements involve a contractual arrangement that establishes joint control.
A joint operation is a joint arrangement whereby the parties that have joint control of the arrangement have rights to the assets, and obligations for the liabilities, relating to the arrangement. A joint operation may or may not be structured through a separate vehicle. These arrangements involve joint control of one or more of the assets acquired or contributed for the purpose of the joint operation. The consolidated financial statements of the Company include its share of the assets in such joint operations, together with its share of the liabilities, revenues and expenses arising jointly or otherwise from those operations. All such amounts are measured in accordance with the terms of each arrangement.
A joint venture is a joint arrangement whereby the parties that have joint control of the arrangement have rights to the net assets of the arrangement. A joint venture is always structured through a separate vehicle. It operates in the same way as other entities, controlling the assets of the joint venture, earning its own revenue and incurring its own liabilities and expenses. Interests in joint ventures are accounted for using the equity method of accounting, whereby the Company’s proportionate interest in the assets, liabilities, revenues and expenses of jointly controlled entities are recognized on a single line in the consolidated statements of financial position and consolidated statements of earnings. The share of joint ventures results is recognized in the Company’s consolidated financial statements from the date that joint control commences until the date at which it ceases.
| v. | Transactions eliminated on consolidation |
Intra-group balances and transactions, and any unrealized income and expenses arising from intra-group transactions, are eliminated in preparing the consolidated financial statements. Unrealized gains arising from transactions with equity-accounted investees are eliminated against the investment to the extent of the Company’s interest in the investee. Unrealized losses are eliminated in the same manner as unrealized gains, but only to the extent that there is no evidence of impairment.
| D. | Foreign currency translation |
Items included in the financial statements of each of Cameco’s subsidiaries, associates and joint arrangements are measured using their functional currency, which is the currency of the primary economic environment in which the entity operates. The consolidated financial statements are presented in Canadian dollars, which is Cameco’s functional and presentation currency.
12
| i. | Foreign currency transactions |
Foreign currency transactions are translated into the respective functional currency of the Company and its entities using the exchange rates prevailing at the dates of the transactions. At the reporting date, monetary assets and liabilities denominated in foreign currencies are translated to the functional currency at the exchange rate at that date. Non-monetary items that are measured in terms of historical cost in a foreign currency are translated using the exchange rate at the date of the transaction. The applicable exchange gains and losses arising on these transactions are reflected in earnings with the exception of foreign exchange gains or losses on provisions for decommissioning and reclamation activities that are in a foreign currency, which are capitalized in property, plant and equipment.
| ii. | Foreign operations |
The assets and liabilities of foreign operations, including goodwill and fair value adjustments arising on acquisition, are translated to Canadian dollars at exchange rates at the reporting dates. The revenues and expenses of foreign operations are translated to Canadian dollars at exchange rates at the dates of the transactions.
Foreign currency differences are recognized in other comprehensive income. When a foreign operation is disposed of, in whole, the relevant amount in the foreign currency translation account is transferred to earnings as part of the gain or loss on disposal.
When the settlement of a monetary item receivable from or payable to a foreign operation is neither planned nor likely in the foreseeable future, foreign exchange gains and losses arising from such a monetary item are considered to form part of the net investment in a foreign operation, and are recognized in other comprehensive income and presented within equity in the foreign currency translation account.
| E. | Cash and cash equivalents |
Cash and cash equivalents consists of balances with financial institutions and investments in money market instruments, which have a term to maturity of three months or less at the time of purchase and are measured at amortized cost.
| F. | Short-term investments |
Short-term investments are comprised of money market instruments with terms to maturity between three and 12 months and are measured at amortized cost.
| G. | Inventories |
Inventories of broken ore, uranium concentrates, and refined and converted products are measured at the lower of cost and net realizable value.
Cost includes direct materials, direct labour, operational overhead expenses and depreciation. Net realizable value is the estimated selling price in the ordinary course of business, less the estimated costs of completion and selling expenses.
Consumable supplies and spares are valued at the lower of cost or replacement value.
| H. | Property, plant and equipment |
| i. | Buildings, plant and equipment and other |
Items of property, plant and equipment are measured at cost less accumulated depreciation and impairment charges. The cost of self-constructed assets includes the cost of materials and direct labour, borrowing costs and any other costs directly attributable to bringing the assets to the location and condition necessary for them to be capable of operating in the manner intended by management, including the initial estimate of the cost of dismantling and removing the items and restoring the site on which they are located.
When components of an item of property, plant and equipment have different useful lives, they are accounted for as separate items of property, plant and equipment and depreciated separately.
13
Gains and losses on disposal of an item of property, plant and equipment are determined by comparing the proceeds from disposal with the carrying amount of property, plant and equipment, and are recognized in earnings.
| ii. | Mineral properties and mine development costs |
The decision to develop a mine property within a project area is based on an assessment of the commercial viability of the property, the availability of financing and the existence of markets for the product. Once the decision to proceed to development is made, development and other expenditures relating to the project area are deferred as part of assets under construction and disclosed as a component of property, plant and equipment with the intention that these will be depreciated by charges against earnings from future mining operations. No depreciation is charged against the property until the production stage commences. After a mine property has been brought into the production stage, costs of any additional work on that property are expensed as incurred, except for large development programs, which will be deferred and depreciated over the remaining life of the related assets.
The production stage is reached when a mine property is in the condition necessary for it to be capable of operating in the manner intended by management. The criteria used to assess the start date of the production stage are determined based on the nature of each mine construction project, including the complexity of a mine site. A range of factors is considered when determining whether the production stage has been reached, which includes, but is not limited to, the demonstration of sustainable production at or near the level intended (such as the demonstration of continuous throughput levels at or above a target percentage of the design capacity).
| iii. | Depreciation |
Depreciation is calculated over the depreciable amount, which is the cost of the asset less its residual value. Assets which are unrelated to production are depreciated according to the straight-line method based on estimated useful lives as follows:
| Land |
Not depreciated | |||
| Buildings |
15 - 25 years | |||
| Plant and equipment |
3 - 15 years | |||
| Furniture and fixtures |
3 - 10 years | |||
| Other |
3 - 5 years |
Mining properties and certain mining and conversion assets for which the economic benefits from the asset are consumed in a pattern which is linked to the production level are depreciated according to the unit-of-production method. For conversion assets, the amount of depreciation is measured by the portion of the facilities’ total estimated lifetime production that is produced in that period. For mining assets and properties, the amount of depreciation or depletion is measured by the portion of the mines’ proven and probable mineral reserves recovered during the period.
Depreciation methods, useful lives and residual values are reviewed at each reporting period and are adjusted if appropriate.
| iv. | Borrowing costs |
Borrowing costs on funds directly attributable to finance the acquisition, production or construction of a qualifying asset are capitalized until such time as substantially all the activities necessary to prepare the qualifying asset for its intended use are complete. A qualifying asset is one that takes a substantial period of time to prepare for its intended use. Capitalization is discontinued when the asset enters the production stage or development ceases. Where the funds used to finance a project form part of general borrowings, interest is capitalized based on the weighted average interest rate applicable to the general borrowings outstanding during the period of construction.
| v. | Repairs and maintenance |
The cost of replacing a component of property, plant and equipment is capitalized if it is probable that future economic benefits embodied within the component will flow to the Company. The carrying amount of the replaced component is derecognized. Costs of routine maintenance and repair are charged to products and services sold.
14
| I. | Goodwill and intangible assets |
Goodwill arising from the acquisition of subsidiaries is initially recognized at cost, measured as the excess of the fair value of the consideration paid over the fair value of the identifiable net assets acquired. At the date of acquisition, goodwill is allocated to the cash generating unit (CGU), or group of CGUs that is expected to receive the economic benefits of the business combination. Goodwill is subsequently measured at cost, less accumulated impairment losses.
Intangible assets acquired individually or as part of a group of assets are initially recognized at cost and measured subsequently at cost less accumulated amortization and impairment losses. Subsequent expenditure is capitalized only when it increases the future economic benefits embodied in the specific asset to which it relates. The cost of a group of intangible assets acquired in a transaction, including those acquired in a business combination that meet the specified criteria for recognition apart from goodwill, is allocated to the individual assets acquired based on their relative fair values.
Intangible assets that have finite useful lives are amortized over their estimated remaining useful lives. Amortization methods and useful lives are reviewed at each reporting period and are adjusted if appropriate.
| J. | Leases |
Cameco recognizes a right-of-use asset and a lease liability at the lease commencement date. The right-of-use asset is initially measured at cost, which is the initial amount of the lease liability adjusted for any lease payments made at or before the commencement date, plus any initial direct costs incurred, less any lease incentives received, and subsequently at cost less any accumulated depreciation and impairment losses. The right-of-use asset is subsequently depreciated using the straight-line method from the commencement date to the end of the lease term, unless the cost of the right-of-use asset reflects that the Company will exercise a purchase option, in which case the right-of-use asset will be depreciated on the same basis as that of property, plant and equipment.
The lease liability is measured at amortized cost using the effective interest method. It is initially measured at the present value of the lease payments that are not paid at the commencement date, discounted using the interest rate implicit in the lease, or, if that rate cannot be readily determined, the Company’s incremental borrowing rate. Generally, Cameco uses its incremental borrowing rate as the discount rate. Current borrowing rates available for classes of leased assets are compared with the rates of Cameco’s existing debt facilities to ensure that use of the Company’s incremental borrowing rate is reasonable.
The lease liability is subsequently increased by the interest cost on the lease liability and decreased by lease payments made. It is remeasured when there is a change in future lease payments arising from a change in an index or rate, a change in the estimate of the amount expected to be payable under a residual value guarantee, or as appropriate, changes in the assessment of whether a purchase or extension option is reasonably certain to be exercised or a termination option is reasonably certain not to be exercised.
Cameco uses judgement in determining the lease term for some lease contracts that include renewal options. The assessment of whether the Company is reasonably certain to exercise such options impacts the lease term, which affects the amount of lease liabilities and right-of-use assets recognized.
The Company has elected not to recognize right-of-use assets and lease liabilities for leases of low-value assets and short-term leases that have a lease term of 12 months or less. The lease payments associated with these leases are recognized as an expense on a straight-line basis over the lease term.
| K. | Finance income and finance costs |
Finance income comprises interest income on funds invested. Interest income and interest expense are recognized in earnings as they accrue, using the effective interest method. Finance costs comprise interest and fees on borrowings, unwinding of the discount on provisions and costs incurred on redemption of debentures.
Borrowing costs that are not directly attributable to the acquisition, construction or production of a qualifying asset are expensed in the period incurred.
15
| L. | Research and development costs |
Expenditures on research are charged against earnings when incurred. Development costs are recognized as assets when the Company can demonstrate technical feasibility and that the asset will generate probable future economic benefits.
| M. | Impairment |
| i. | Non-derivative financial assets |
Cameco recognizes loss allowances for expected credit losses (ECLs) on financial assets measured at amortized cost, debt investments measured at FVOCI, and contract assets. It measures loss allowances at an amount equal to lifetime ECLs, except for debt securities that are determined to have low credit risk at the reporting date and other debt securities, loans advanced and bank balances for which credit risk has not increased significantly since initial recognition. For these, loss allowances are measured equal to 12-month ECLs.
Lifetime ECLs are the ECLs that result from all possible default events over the expected life of a financial instrument while 12-month ECLs are the portion of ECLs that result from default events that are possible within the 12 months after the reporting date (or a shorter period if the expected life of the instrument is less than 12 months). The maximum period considered when estimating ECLs is the maximum contractual period over which the Company is exposed to credit risk.
ECLs are a probability-weighted estimate of credit losses. Credit losses are measured as the present value of the difference between the cash flows due to the entity in accordance with the contract and the cash flows that the Company expects to receive. ECLs are discounted at the effective interest rate of the financial asset.
When determining whether the credit risk of a financial asset has increased significantly since initial recognition and when estimating ECLs, the Company considers reasonable and supportable information that is relevant and available without undue cost or effort. This includes both quantitative and qualitative information and analysis, based on the Company’s historical experience and informed credit assessment and including forward-looking information.
The Company considers a financial asset to be in default when the borrower is unlikely to pay its credit obligations in full, without recourse by Cameco to actions such as realizing security (if any is held).
The Company considers a debt security to have low credit risk when it is at least an A (low) DBRS or A- S&P rating.
Financial assets carried at amortized cost and debt securities at FVOCI are assessed at each reporting date to determine whether they are ‘credit-impaired’. A financial asset is ‘credit-impaired’ when one or more events that have a detrimental effect on the estimated future cash flows of the financial asset have occurred. Evidence can include significant financial difficulty of the borrower or issuer, a breach of contract, restructuring of an amount due to the Company on terms that the Company would not consider otherwise, indications that a debtor or issuer will enter bankruptcy or other financial reorganization, or the disappearance of an active market for a security.
Loss allowances for financial assets measured at amortized cost are deducted from the gross carrying amount of the assets. For debt securities at FVOCI, the loss allowance is charged to earnings and is recognized in OCI. The gross carrying amount of a financial asset is written off when the Company has no reasonable expectations of recovering a financial asset in its entirety or a portion thereof.
| ii. | Non-financial assets |
The carrying amounts of Cameco’s non-financial assets are reviewed at each reporting date to determine whether there is any indication of impairment. If any such indication exists, then the asset’s recoverable amount is estimated. Goodwill is tested annually for impairment.
16
For impairment testing, assets are grouped together into CGUs which are the smallest group of assets that generate cash inflows from continuing use that are largely independent of the cash inflows of other assets or CGUs. Goodwill arising from a business combination is allocated to CGUs or groups of CGUs that are expected to benefit from the synergies of the combination.
The recoverable amount of an asset or CGU is the greater of its value in use and its fair value less costs to sell. Value in use is based on the estimated future cash flows, discounted to their present value using a pre-tax discount rate that reflects current market assessments of the time value of money and the risks specific to the asset or CGU. Fair value is determined as the amount that would be obtained from the sale of the asset or CGU in an arm’s-length transaction between knowledgeable and willing parties. For exploration properties, fair value is based on the implied fair value of the resources in place using comparable market transaction metrics.
An impairment loss is recognized if the carrying amount of an asset or its CGU exceeds its recoverable amount. Impairment losses are recognized in earnings. Impairment losses recognized in respect of CGUs are allocated first to reduce the carrying amount of any goodwill allocated to the CGU, and then to reduce the carrying amounts of the other assets in the CGU on a pro rata basis.
Impairment losses recognized in prior periods are assessed at each reporting date whenever events or changes in circumstances indicate that the impairment may have reversed. If the impairment has reversed, the carrying amount of the asset is increased to its recoverable amount. An impairment loss is reversed only to the extent that the asset’s carrying amount does not exceed the carrying amount that would have been determined, net of depreciation or amortization, if no impairment loss had been recognized. A reversal of an impairment loss is recognized immediately in earnings. An impairment loss in respect of goodwill is not reversed.
| N. | Exploration and evaluation expenditures |
Exploration and evaluation expenditures are those expenditures incurred by the Company in connection with the exploration for and evaluation of mineral resources before the technical feasibility and commercial viability of extracting a mineral resource are demonstrable. These expenditures include researching and analyzing existing exploration data, conducting geological studies, exploratory drilling and sampling, and compiling prefeasibility and feasibility studies. Exploration and evaluation expenditures are charged against earnings as incurred, except when there is a high degree of confidence in the viability of the project and it is probable that these costs will be recovered through future development and exploitation.
The technical feasibility and commercial viability of extracting a resource is considered to be determinable based on several factors, including the existence of proven and probable reserves and the demonstration that future economic benefits are probable. When an area is determined to be technically feasible and commercially viable, the exploration and evaluation assets attributable to that area are first tested for impairment and then transferred to property, plant and equipment.
Exploration and evaluation costs that have been acquired in a business combination or asset acquisition are capitalized under the scope of IFRS 6, Exploration for and Evaluation of Mineral Resources, and are reported as part of property, plant and equipment.
| O. | Provisions |
A provision is recognized if, as a result of a past event, the Company has a present legal or constructive obligation that can be estimated reliably, and it is probable that an outflow of economic benefits will be required to settle the obligation. Provisions are determined by discounting the risk-adjusted expected future cash flows at a pre-tax risk-free rate that reflects current market assessments of the time value of money. The unwinding of the discount is recognized as a finance cost.
17
| i. | Environmental restoration |
The mining, extraction and processing activities of the Company normally give rise to obligations for site closure and environmental restoration. Closure and restoration can include facility decommissioning and dismantling, removal or treatment of waste materials, as well as site and land restoration. The Company provides for the closure, reclamation and decommissioning of its operating sites in the financial period when the related environmental disturbance occurs, based on the estimated future costs using information available at the reporting date. Costs included in the provision comprise all closure and restoration activity expected to occur gradually over the life of the operation and at the time of closure. Routine operating costs that may impact the ultimate closure and restoration activities, such as waste material handling conducted as a normal part of a mining or production process, are not included in the provision.
The timing of the actual closure and restoration expenditure is dependent upon a number of factors such as the life and nature of the asset, the operating licence conditions and the environment in which the mine operates. Closure and restoration provisions are measured at the expected value of future cash flows, discounted to their present value using a current pre-tax risk-free rate. Significant judgments and estimates are involved in deriving the expectations of future activities and the amount and timing of the associated cash flows.
At the time a provision is initially recognized, to the extent that it is probable that future economic benefits associated with the reclamation, decommissioning and restoration expenditure will flow to the Company, the corresponding cost is capitalized as an asset. The capitalized cost of closure and restoration activities is recognized in property, plant and equipment and depreciated on a unit-of-production basis. The value of the provision is gradually increased over time as the effect of discounting unwinds. The unwinding of the discount is an expense recognized in finance costs.
Closure and rehabilitation provisions are also adjusted for changes in estimates. The provision is reviewed at each reporting date for changes to obligations, legislation or discount rates that effect change in cost estimates or life of operations. The cost of the related asset is adjusted for changes in the provision resulting from changes in estimated cash flows or discount rates, and the adjusted cost of the asset is depreciated prospectively.
| ii. | Waste disposal |
The refining, conversion and manufacturing processes generate certain uranium-contaminated waste. The Company has established strict procedures to ensure this waste is disposed of safely. A provision for waste disposal costs in respect of these materials is recognized when they are generated. Costs associated with the disposal, the timing of cash flows and discount rates are estimated both at initial recognition and subsequent measurement.
| P. | Employee future benefits |
| i. | Pension obligations |
The Company accrues its obligations under employee benefit plans. The Company has both defined benefit and defined contribution plans. A defined contribution plan is a pension plan under which the Company pays fixed contributions into a separate entity. The Company has no legal or constructive obligations to pay further contributions if the fund does not hold sufficient assets to pay all employees the benefits relating to employee service in the current and prior periods. A defined benefit plan is a pension plan other than a defined contribution plan. Typically, defined benefit plans define an amount of pension benefit that an employee will receive on retirement, usually dependent on one or more factors such as age, years of service and compensation.
18
The liability recognized in the consolidated statements of financial position in respect of defined benefit pension plans is the present value of the defined benefit obligation at the reporting date less the fair value of plan assets. The defined benefit obligation is calculated annually, by qualified independent actuaries using the projected unit credit method prorated on service and management’s best estimate of expected plan investment performance, salary escalation, retirement ages of employees and expected health care costs. The present value of the defined benefit obligation is determined by discounting the estimated future cash outflows using interest rates of high-quality corporate bonds that are denominated in the currency in which the benefits will be paid, and that have terms to maturity approximating the terms of the related pension liability.
The Company recognizes all actuarial gains and losses arising from defined benefit plans in other comprehensive income, and reports them in retained earnings. When the benefits of a plan are improved, the portion of the increased benefit relating to past service by employees is recognized immediately in earnings.
For defined contribution plans, the contributions are recognized as employee benefit expense in earnings in the periods during which services are rendered by employees. Prepaid contributions are recognized as an asset to the extent that a cash refund or a reduction in future payments is available.
| ii. | Other post-retirement benefit plans |
The Company provides certain post-retirement health care benefits to its retirees. The entitlement to these benefits is usually conditional on the employee remaining in service up to retirement age and the completion of a minimum service period. The expected costs of these benefits are accrued over the period of employment using the same accounting methodology as used for defined benefit pension plans. Actuarial gains and losses are recognized in other comprehensive income in the period in which they arise. These obligations are valued annually by independent qualified actuaries.
| iii. | Short-term employee benefits |
Short-term employee benefit obligations are measured on an undiscounted basis and are expensed as the related service is provided. A liability is recognized for the amount expected to be paid under short-term cash bonus plans if the Company has a present legal or constructive obligation to pay this amount as a result of past service provided by the employee, and the obligation can be measured reliably.
| iv. | Termination benefits |
Termination benefits are payable when employment is terminated by the Company before the normal retirement date, or whenever an employee accepts an entity’s offer of benefits in exchange for termination of employment. Cameco recognizes termination benefits as an expense at the earlier of when the Company can no longer withdraw the offer of those benefits and when the Company recognizes costs for a restructuring. If benefits are payable more than 12 months after the reporting period, they are discounted to their present value.
| v. | Share-based compensation |
For equity-settled plans, the grant date fair value of share-based compensation awards granted to employees is recognized as an employee benefit expense, with a corresponding increase in equity, over the period that the employees unconditionally become entitled to the awards. The amount recognized as an expense is adjusted to reflect the number of awards for which the related service and vesting conditions are expected to be met, such that the amount ultimately recognized as an expense is based on the number of awards that meet the related service and non-market performance conditions at the vesting date.
For cash-settled plans, the fair value of the amount payable to employees is recognized as an expense, with a corresponding increase in liabilities, over the period that the employees unconditionally become entitled to payment. The liability is re-measured at each reporting date and at settlement date. Any changes in the fair value of the liability are recognized as employee benefit expense in earnings.
19
When the terms and conditions of equity-settled plans at the time they were granted are subsequently modified, the fair value of the share-based payment under the original terms and conditions and under the modified terms and conditions are both determined at the date of the modification. Any excess of the modified fair value over the original fair value is recognised over the remaining vesting period in addition to the grant date fair value of the original share-based payment. The share-based payment expense is not adjusted if the modified fair value is less than the original fair value.
Cameco’s contributions under the employee share ownership plan are expensed during the year of contribution. Shares purchased with Company contributions and with dividends paid on such shares become unrestricted on January 1 of the second plan year following the date on which such shares were purchased.
| Q. | Revenue recognition |
Cameco supplies uranium concentrates, uranium conversion services, fabrication services and other services. Revenue is measured based on the consideration specified in a contract with a customer. The Company recognizes revenue when it transfers control, as described below, over a good or service to a customer. Customers do not have the right to return products.
Cameco’s sales arrangements with its customers are pursuant to enforceable contracts that indicate the nature and timing of satisfaction of performance obligations, including significant payment terms, where payment is usually due in 30 days. Each delivery is considered a separate performance obligation under the contract.
Uranium supply
In a uranium supply arrangement, Cameco is contractually obligated to provide uranium concentrates to its customers. Cameco-owned uranium may be physically delivered to either the customer or to conversion facilities (Converters).
For deliveries to customers, terms in the sales contract specify the location of delivery. Revenue is recognized when the uranium has been delivered and accepted by the customer at that location.
When uranium is delivered to Converters, the Converter will credit Cameco’s account for the volume of accepted uranium. Based on delivery terms in the sales contract with its customer, Cameco instructs the Converter to transfer title of a contractually specified quantity of uranium to the customer’s account at the Converter’s facility. At this point, control has been transferred and Cameco recognizes revenue for the uranium supply.
Toll conversion services
In a toll conversion arrangement, Cameco is contractually obligated to convert customer-owned uranium to a chemical state suitable for enrichment. Based on delivery terms in a sales contract with its customer, Cameco either (i) physically delivers converted uranium to enrichment facilities (Enrichers) where it instructs the Enricher to transfer title of a contractually specified quantity of converted uranium to the customer’s account at the Enricher’s facility, or (ii) transfers title of a contractually specified quantity of converted uranium to either an Enricher’s account or the customer’s account at Cameco’s Port Hope conversion facility. At this point, the customer obtains control and Cameco recognizes revenue for the toll conversion services.
Conversion supply
A conversion supply arrangement is a combination of uranium supply and toll conversion services. Cameco is contractually obligated to provide converted uranium to its customers. Based on delivery terms in the sales contract, Cameco either (i) physically delivers converted uranium to the Enricher where it instructs the Enricher to transfer title of a contractually specified quantity of converted uranium to the customer’s account at the Enricher’s facility, or (ii) transfers title of a contractually specified quantity of converted uranium to either an Enricher’s account or a customer’s account at Cameco’s Port Hope conversion facility. At this point, the customer obtains control and Cameco recognizes revenue for both the uranium supplied and the conversion service provided.
20
Fabrication services
In a fabrication services arrangement, Cameco is contractually obligated to provide fuel bundles or reactor components to its customers. In a contract for fuel bundles, the bundles are inspected and accepted by the customer at Cameco’s Port Hope fabrication facility or another location based on delivery terms in the sales contract. At this point, the customer obtains control and Cameco recognizes revenue for the fabrication services.
In some contracts for reactor components, the components are made to a customer’s specification and if a contract is terminated by the customer, Cameco is entitled to reimbursement of the costs incurred to date, including a reasonable margin. Since the customer controls all of the work in progress as the products are being manufactured, revenue and associated costs are recognized over time, before the goods are delivered to the customer’s premises. Revenue is recognized on the basis of units produced as the contracts reflect a per unit basis. Revenue from these contracts represents an insignificant portion of Cameco’s total revenue. In other contracts where the reactor components are not made to a specific customer’s specification, when the components are delivered to the location specified in the contract, the customer obtains control and Cameco recognizes revenue for the services.
Other services
Uranium concentrates and converted uranium are regulated products and can only be stored at regulated facilities. In a storage arrangement, Cameco is contractually obligated to store uranium products at its facilities on behalf of the customer. Cameco invoices the customer in accordance with the contract terms and recognizes revenue on a monthly basis.
Cameco also provides customers with transportation of its uranium products. In the contractual arrangements where Cameco is acting as the principal, revenue is recognized as the product is delivered.
| R. | Financial instruments |
A financial instrument is any contract that gives rise to a financial asset of one entity and a financial liability or equity instrument of another.
Trade receivables and debt securities are initially recognized when they are originated. All other financial assets and liabilities are initially recognized when the company becomes a party to the contractual provisions of the instrument. A financial asset (unless it is a trade receivable without a significant financing component) or financial liability is initially measured at fair value plus, for an item not at fair value through profit or loss, transaction costs that are directly attributable to its acquisition or issue. A trade receivable without a significant financing component is initially measured at the transaction price.
| i. | Financial assets |
On initial recognition, financial assets are classified as measured at: amortized cost, fair value through other comprehensive income, or fair value through profit or loss based on the Company’s business model for managing its financial assets and their cash flow characteristics. Classifications are not changed subsequent to initial recognition unless the Company changes its business model for managing its financial assets, in which case all affected financial assets are reclassified on the first day of the first reporting period following the change in business model.
Amortized cost
A financial asset is measured at amortized cost if it is not designated as at fair value through profit or loss, is held within a business model whose objective is to hold assets to collect contractual cash flows and its contractual terms give rise to cash flows on specified dates that are solely payments of principal and interest on the principal amount outstanding. Assets in this category are subsequently measured at amortized cost using the effective interest method. The amortized cost is reduced by impairment losses. Interest income, foreign exchange gains and losses and impairment are recognized in profit or loss, as is any gain or loss on derecognition.
21
Fair value through other comprehensive income (FVOCI)
A debt investment is measured at FVOCI if it is not designated as at fair value through profit or loss, is held within a business model whose objective is achieved by both collecting contractual cash flows and selling financial assets and its contractual terms give rise to cash flows on specified dates that are solely payments of principal and interest on the principal amount outstanding. These assets are subsequently measured at fair value. Interest income calculated using the effective interest method, foreign exchange gains and losses and impairment are recognized in profit or loss. Other net gains and losses are recognized in other comprehensive income (OCI). On derecognition, gains and losses accumulated in OCI are reclassified to profit or loss.
On initial recognition of an equity investment that is not held for trading, Cameco may irrevocably elect to present subsequent changes in the investments fair value in OCI. This election is made on an investment by investment basis. These assets are subsequently measured at fair value. Dividends are recognized as income in profit or loss unless the dividend clearly represents a recovery of part of the cost of the investment. Other net gains and losses are recognized in OCI and are never reclassified to profit or loss.
Fair value through profit or loss (FVTPL)
All financial assets not classified as measured at amortized cost or FVOCI are measured at FVTPL. This includes all derivative financial assets. On initial recognition, the Company may irrevocably designate a financial asset that otherwise meets the requirements to be measured at amortized cost or at FVOCI as at FVTPL if doing so eliminates or significantly reduces an accounting mismatch that would otherwise arise. These assets are subsequently measured at fair value. Net gains and losses, including any interest or dividend income, are recognized in profit or loss.
Derecognition of financial assets
Cameco derecognizes a financial asset when the contractual rights to the cash flows from the asset expire, or it transfers the rights to receive the contractual cash flows in a transaction in which substantially all of the risks and rewards of ownership of the financial asset are transferred or in which it neither transfers or retains substantially all of the risks and rewards of ownership and it does not retain control of the financial asset.
If the Company enters into a transaction whereby it transfers assets recognized in its statement of financial position, but retains either all or substantially all of the risks and rewards of the transferred assets, the transferred assets would not be derecognized.
| ii. | Financial liabilities |
On initial recognition, financial liabilities are classified as measured at amortized cost or FVTPL. A financial liability is classified as FVTPL if it is classified as held-for-trading, is a derivative or is designated as such on initial recognition. Financial liabilities at FVTPL are measured at fair value and net gains and losses, including any interest expense, are recognized in profit or loss. Other financial liabilities are subsequently measured at amortized cost using the effective interest method. Interest expense and foreign exchange gains and losses are recognized in profit or loss as is any gain or loss on derecognition.
A financial liability is derecognized when its contractual obligations are discharged or cancelled, or expire. The Company also derecognizes a financial liability when its terms are modified and the cash flows of the modified liability are substantially different, in which case a new financial liability based on the modified terms is recognized at fair value. On derecognition of a financial liability, the difference between the carrying amount extinguished and the consideration paid (including any non-cash assets transferred or liabilities assumed) is recognized in profit or loss.
| iii. | Derivative financial instruments |
The Company holds derivative financial instruments to reduce exposure to fluctuations in foreign currency exchange rates and interest rates. Embedded derivatives are separated from the host contract and accounted for separately if the host contract is not a financial asset and certain criteria are met.
22
Derivative financial instruments are initially measured at fair value in the consolidated statements of financial position, with any directly attributable transaction costs recognized in profit or loss as incurred. Subsequent to initial recognition, derivatives are measured at fair value, and changes in fair value are recognized in profit or loss.
The purpose of hedging transactions is to modify the Company’s exposure to one or more risks by creating an offset between changes in the fair value of, or the cash flows attributable to, the hedged item and the hedging item. When hedge accounting is appropriate, the hedging relationship is designated as a fair value hedge, a cash flow hedge, or a foreign currency risk hedge related to a net investment in a foreign operation. The Company does not have any instruments that have been designated as hedge transactions at December 31, 2020 and 2019.
| S. | Income tax |
Income tax expense is comprised of current and deferred taxes. Current tax and deferred tax are recognized in earnings except to the extent that it relates to a business combination, or items recognized directly in equity or in other comprehensive income.
Current tax is the expected tax payable or receivable on the taxable income or loss for the year, using tax rates enacted or substantially enacted at the reporting date, and any adjustments to tax payable in respect of previous years. Current tax assets and liabilities are measured at the amount expected to be paid or recovered from the taxation authorities.
Deferred tax is recognized in respect of temporary differences between the carrying amounts of assets and liabilities for financial reporting purposes and the amounts used for taxation purposes. In addition, deferred tax is not recognized for taxable temporary differences arising on the initial recognition of goodwill. Deferred tax is measured at the tax rates that are expected to be applied to temporary differences when they reverse, based on the laws that have been enacted or substantively enacted by the reporting date. Deferred tax assets and liabilities are offset if there is a legally enforceable right to offset current tax liabilities and assets, and they relate to income taxes levied by the same tax authority on the same taxable entity, or on different tax entities, but they intend to settle current tax liabilities and assets on a net basis or their tax assets and liabilities will be realized simultaneously.
A deferred tax asset is recognized for unused tax losses, tax credits and deductible temporary differences, to the extent that it is probable that future taxable income will be available against which they can be utilized. Deferred tax assets are reviewed at each reporting date and are reduced to the extent that it is no longer probable that the related tax benefit will be realized.
The Company’s exposure to uncertain tax positions is evaluated and a provision is made where it is probable that this exposure will materialize.
| T. | Share capital |
Common shares are classified as equity. Incremental costs directly attributable to the issue of common shares are recognized as a reduction of equity, net of any tax effects.
| U. | Earnings per share |
The Company presents basic and diluted earnings per share data for its common shares. Earnings per share is calculated by dividing the net earnings attributable to equity holders of the Company by the weighted average number of common shares outstanding.
Diluted earnings per share is determined by adjusting the net earnings attributable to equity holders of the Company and the weighted average number of common shares outstanding, for the effects of all dilutive potential common shares. The calculation of diluted earnings per share assumes that outstanding options which are dilutive to earnings per share are exercised and the proceeds are used to repurchase shares of the Company at the average market price of the shares for the period. The effect is to increase the number of shares used to calculate diluted earnings per share.
23
| V. | Segment reporting |
An operating segment is a component of the Company that engages in business activities from which it may earn revenues and incur expenses, including revenues and expenses that relate to transactions with any of the Company’s other segments. To be classified as a segment, discrete financial information must be available and operating results must be regularly reviewed by the Company’s executive team.
Segment capital expenditure is the total cost incurred during the period to acquire property, plant and equipment, and intangible assets other than goodwill.
| W. | Government assistance |
Government grants are recognized when there is reasonable assurance that the Company has complied with the relevant conditions of the grant and that the grant will be received. Grants that compensate the Company for expenses incurred are recognized in profit or loss as other income on a systematic basis in the periods in which the expenses have been recognized.
| 3. | Accounting standards |
| A. | Changes in accounting policy |
A number of amendments to existing standards became effective January 1, 2020 but they did not have an effect on the Company’s financial statements.
| B. | New standards and interpretations not yet adopted |
A number of amendments to existing standards are not yet effective for the year ended December 31, 2020 and have not been applied in preparing these consolidated financial statements. Cameco does not intend to early adopt any of the amendments and does not expect them to have a material impact on its financial statements.
| 4. | Determination of fair values |
A number of the Company’s accounting policies and disclosures require the measurement of fair value, for both financial and non-financial assets and liabilities.
The fair value of an asset or liability is generally estimated as the amount that would be received on sale of an asset, or paid to transfer a liability in an orderly transaction between market participants at the reporting date. Fair values of assets and liabilities traded in an active market are determined by reference to last quoted prices, in the principal market for the asset or liability. In the absence of an active market for an asset or liability, fair values are determined based on market quotes for assets or liabilities with similar characteristics and risk profiles, or through other valuation techniques. Fair values determined using valuation techniques require the use of inputs, which are obtained from external, readily observable market data when available. In some circumstances, inputs that are not based on observable data must be used. In these cases, the estimated fair values may be adjusted in order to account for valuation uncertainty, or to reflect the assumptions that market participants would use in pricing the asset or liability.
All fair value measurements are categorized into one of three hierarchy levels, described below, for disclosure purposes. Each level is based on the transparency of the inputs used to measure the fair values of assets and liabilities:
Level 1 – Values based on unadjusted quoted prices in active markets that are accessible at the reporting date for identical assets or liabilities.
Level 2 – Values based on quoted prices in markets that are not active or model inputs that are observable either directly or indirectly for substantially the full term of the asset or liability.
Level 3 – Values based on prices or valuation techniques that require inputs that are both unobservable and significant to the overall fair value measurement.
24
When the inputs used to measure fair value fall within more than one level of the hierarchy, the level within which the fair value measurement is categorized is based on the lowest level input that is significant to the fair value measurement in its entirety.
Transfers between levels of the fair value hierarchy are recognized at the end of the reporting period during which the transfer occurred. There were no transfers between level 1, level 2, or level 3 during the period. Cameco does not have any recurring fair value measurements that are categorized as level 3 as of the reporting date.
Further information about the techniques and assumptions used to measure fair values is included in the following notes:
Note 24 - Share-based compensation plans
Note 26 - Financial instruments and risk management
| 5. | Use of estimates and judgments |
The preparation of the consolidated financial statements in conformity with IFRS requires management to make judgments, estimates and assumptions that affect the application of accounting policies and the reported amounts of assets, liabilities, revenues and expenses. Actual results may differ from these estimates.
Estimates and underlying assumptions are reviewed on an ongoing basis. Revisions to accounting estimates are recognized in the period in which the estimates are revised and in any future period affected.
Information about critical judgments in applying the accounting policies that have the most significant effect on the amounts recognized in the consolidated financial statements is discussed below. Further details of the nature of these judgments, estimates and assumptions may be found in the relevant notes to the consolidated financial statements.
| A. | Recoverability of long-lived and intangible assets |
Cameco assesses the carrying values of property, plant and equipment, and intangible assets when there is an indication of possible impairment. If it is determined that carrying values of assets or goodwill cannot be recovered, the unrecoverable amounts are charged against current earnings. Recoverability is dependent upon assumptions and judgments regarding market conditions, costs of production, sustaining capital requirements and mineral reserves. Other assumptions used in the calculation of recoverable amounts are discount rates, future cash flows and profit margins. A material change in assumptions may significantly impact the potential impairment of these assets.
| B. | Cash generating units |
In performing impairment assessments of long-lived assets, assets that cannot be assessed individually are grouped together into the smallest group of assets that generates cash inflows that are largely independent of the cash inflows from other assets or groups of assets. Management is required to exercise judgment in identifying these CGUs.
| C. | Provisions for decommissioning and reclamation of assets |
Significant decommissioning and reclamation activities are often not undertaken until near the end of the useful lives of the productive assets. Regulatory requirements and alternatives with respect to these activities are subject to change over time. A significant change to either the estimated costs, timing of the cash flows or mineral reserves may result in a material change in the amount charged to earnings.
25
| D. | Income taxes |
Cameco operates in a number of tax jurisdictions and is, therefore, required to estimate its income taxes in each of these tax jurisdictions in preparing its consolidated financial statements. In calculating income taxes, consideration is given to factors such as tax rates in the different jurisdictions, non-deductible expenses, changes in tax law and management’s expectations of future operating results. Cameco estimates deferred income taxes based on temporary differences between the income and losses reported in its consolidated financial statements and its taxable income and losses as determined under the applicable tax laws. The tax effect of these temporary differences is recorded as deferred tax assets or liabilities in the consolidated financial statements. The calculation of income taxes requires the use of judgment and estimates. The determination of the recoverability of deferred tax assets is dependent on assumptions and judgments regarding future market conditions, production rates and intercompany sales, which can materially impact estimated future taxable income. If these judgments and estimates prove to be inaccurate, future earnings may be materially impacted.
| E. | Mineral reserves |
Depreciation on property, plant and equipment is primarily calculated using the unit-of-production method. This method allocates the cost of an asset to each period based on current period production as a portion of total lifetime production or a portion of estimated mineral reserves. Estimates of life-of-mine and amounts of mineral reserves are updated annually and are subject to judgment and significant change over time. If actual mineral reserves prove to be significantly different than the estimates, there could be a material impact on the amounts of depreciation charged to earnings.
| 6. | Accounts receivable |
| 2020 | 2019 | |||||||
| Trade receivables |
$ | 166,054 | $ | 321,638 | ||||
| GST/VAT receivables |
38,192 | 4,614 | ||||||
| Other receivables |
734 | 1,792 | ||||||
|
|
|
|
|
|||||
| Total |
$ | 204,980 | $ | 328,044 | ||||
|
|
|
|
|
|||||
The Company’s exposure to credit and currency risks as well as credit losses related to trade and other receivables, excluding goods and services tax (GST)/value added tax (VAT) receivables, is disclosed in note 26.
| 7. | Inventories |
| 2020 | 2019 | |||||||
| Uranium |
||||||||
| Concentrate |
$ | 579,653 | $ | 204,123 | ||||
| Broken ore |
45,387 | 51,094 | ||||||
|
|
|
|
|
|||||
| 625,040 | 255,217 | |||||||
| Fuel services |
52,273 | 62,701 | ||||||
| Other |
3,056 | 2,852 | ||||||
|
|
|
|
|
|||||
| Total |
$ | 680,369 | $ | 320,770 | ||||
|
|
|
|
|
|||||
Cameco expensed $1,435,000,000 of inventory as cost of sales during 2020 (2019 - $1,398,000,000).
26
| 8. | Property, plant and equipment |
At December 31, 2020
| Land | Plant | Furniture | Exploration | |||||||||||||||||||||
| and | and | and | Under | and | ||||||||||||||||||||
| buildings | equipment | fixtures | construction | evaluation | Total | |||||||||||||||||||
| Cost |
||||||||||||||||||||||||
| Beginning of year |
$ | 5,050,115 | $ | 2,678,165 | $ | 80,869 | $ | 132,457 | $ | 1,071,840 | $ | 9,013,446 | ||||||||||||
| Additions |
2,030 | 7,097 | 855 | 67,477 | 3 | 77,462 | ||||||||||||||||||
| Transfers |
37,971 | 21,405 | 2,554 | (60,391 | ) | — | 1,539 | |||||||||||||||||
| Change in reclamation provision [note 15] |
151,558 | — | — | — | — | 151,558 | ||||||||||||||||||
| Disposals |
(1,678 | ) | (3,385 | ) | (5,299 | ) | (492 | ) | (99 | ) | (10,953 | ) | ||||||||||||
| Effect of movements in exchange rates |
(15,663 | ) | (3,438 | ) | (68 | ) | — | 53,739 | 34,570 | |||||||||||||||
|
|
|
|
|
|
|
|
|
|
|
|
|
|||||||||||||
| End of year |
5,224,333 | 2,699,844 | 78,911 | 139,051 | 1,125,483 | 9,267,622 | ||||||||||||||||||
|
|
|
|
|
|
|
|
|
|
|
|
|
|||||||||||||
| Accumulated depreciation and impairment |
| |||||||||||||||||||||||
| Beginning of year |
2,936,088 | 1,793,049 | 76,601 | 36,799 | 458,386 | 5,300,923 | ||||||||||||||||||
| Depreciation charge |
84,261 | 89,550 | 3,010 | — | — | 176,821 | ||||||||||||||||||
| Change in reclamation provision [note 15](a) |
23,921 | — | — | — | — | 23,921 | ||||||||||||||||||
| Disposals |
(903 | ) | (2,997 | ) | (5,299 | ) | (1 | ) | (150 | ) | (9,350 | ) | ||||||||||||
| Effect of movements in exchange rates |
(12,075 | ) | (3,266 | ) | (66 | ) | — | 25,427 | 10,020 | |||||||||||||||
|
|
|
|
|
|
|
|
|
|
|
|
|
|||||||||||||
| End of year |
3,031,292 | 1,876,336 | 74,246 | 36,798 | 483,663 | 5,502,335 | ||||||||||||||||||
|
|
|
|
|
|
|
|
|
|
|
|
|
|||||||||||||
|
Right-of-use assets |
| |||||||||||||||||||||||
| Beginning of year |
2,646 | 5,084 | 419 | — | — | 8,149 | ||||||||||||||||||
| Additions |
75 | 22 | 2,124 | — | — | 2,221 | ||||||||||||||||||
| Disposals |
(40 | ) | (747 | ) | — | — | — | (787 | ) | |||||||||||||||
| Depreciation charge |
(875 | ) | (498 | ) | (401 | ) | — | — | (1,774 | ) | ||||||||||||||
| Transfers |
— | (1,539 | ) | — | — | — | (1,539 | ) | ||||||||||||||||
|
|
|
|
|
|
|
|
|
|
|
|
|
|||||||||||||
| End of year |
1,806 | 2,322 | 2,142 | — | — | 6,270 | ||||||||||||||||||
|
|
|
|
|
|
|
|
|
|
|
|
|
|||||||||||||
| Net book value at December 31, 2020 |
$ | 2,194,847 | $ | 825,830 | $ | 6,807 | $ | 102,253 | $ | 641,820 | $ | 3,771,557 | ||||||||||||
|
|
|
|
|
|
|
|
|
|
|
|
|
|||||||||||||
27
At December 31, 2019
| Land | Plant | Furniture | Exploration | |||||||||||||||||||||
| and | and | and | Under | and | ||||||||||||||||||||
| buildings | equipment | fixtures | construction | evaluation | Total | |||||||||||||||||||
| Cost |
||||||||||||||||||||||||
| Beginning of year |
$ | 5,039,313 | $ | 2,654,944 | $ | 80,083 | $ | 114,060 | $ | 1,121,061 | $ | 9,009,461 | ||||||||||||
| Additions |
2,327 | 7,179 | 158 | 65,482 | 65 | 75,211 | ||||||||||||||||||
| Transfers |
17,157 | 28,453 | 951 | (46,561 | ) | — | — | |||||||||||||||||
| Change in reclamation provision |
24,883 | — | — | — | — | 24,883 | ||||||||||||||||||
| Disposals |
(923 | ) | (3,486 | ) | (142 | ) | (507 | ) | (693 | ) | (5,751 | ) | ||||||||||||
| Effect of movements in exchange rates |
(32,642 | ) | (8,925 | ) | (181 | ) | (17 | ) | (48,593 | ) | (90,358 | ) | ||||||||||||
|
|
|
|
|
|
|
|
|
|
|
|
|
|||||||||||||
| End of year |
5,050,115 | 2,678,165 | 80,869 | 132,457 | 1,071,840 | 9,013,446 | ||||||||||||||||||
|
|
|
|
|
|
|
|
|
|
|
|
|
|||||||||||||
| Accumulated depreciation and impairment |
|
|||||||||||||||||||||||
| Beginning of year |
2,835,037 | 1,697,178 | 74,860 | 36,799 | 483,661 | 5,127,535 | ||||||||||||||||||
| Depreciation charge |
128,579 | 105,700 | 2,057 | — | — | 236,336 | ||||||||||||||||||
| Change in reclamation provision(a) |
2,732 | — | — | — | — | 2,732 | ||||||||||||||||||
| Disposals |
(225 | ) | (2,194 | ) | (139 | ) | — | (639 | ) | (3,197 | ) | |||||||||||||
| Effect of movements in exchange rates |
(30,035 | ) | (7,635 | ) | (177 | ) | — | (24,636 | ) | (62,483 | ) | |||||||||||||
|
|
|
|
|
|
|
|
|
|
|
|
|
|||||||||||||
| End of year |
2,936,088 | 1,793,049 | 76,601 | 36,799 | 458,386 | 5,300,923 | ||||||||||||||||||
|
|
|
|
|
|
|
|
|
|
|
|
|
|||||||||||||
|
Right-of-use assets |
|
|||||||||||||||||||||||
| Beginning of year |
— | — | — | — | — | — | ||||||||||||||||||
| Additions |
3,517 | 5,768 | 851 | — | — | 10,136 | ||||||||||||||||||
| Disposals |
— | (9 | ) | — | — | — | (9 | ) | ||||||||||||||||
| Depreciation charge |
(871 | ) | (675 | ) | (432 | ) | — | — | (1,978 | ) | ||||||||||||||
| End of year |
2,646 | 5,084 | 419 | — | — | 8,149 | ||||||||||||||||||
|
|
|
|
|
|
|
|
|
|
|
|
|
|||||||||||||
| Net book value at December 31, 2019 |
$ | 2,116,673 | $ | 890,200 | $ | 4,687 | $ | 95,658 | $ | 613,454 | $ | 3,720,672 | ||||||||||||
|
|
|
|
|
|
|
|
|
|
|
|
|
|||||||||||||
Cameco has contractual capital commitments of approximately $47,000,000 at December 31, 2020. Certain of the contractual commitments may contain cancellation clauses, however the Company discloses the commitments based on management’s intent to fulfill the contract. The majority of this amount is expected to be incurred in 2021.
| (a) | Asset retirement obligation assets are adjusted when the Company updates its reclamation provisions due to new cash flow estimates or changes in discount and inflation rates. When the assets of an operation have been written off due to an impairment, as is the case with our Rabbit Lake operation and some of our operations in the United States, the adjustment is recorded directly to the statement of earnings as other operating expense or income. |
28
| 9. | Intangible assets |
| A. | Reconciliation of carrying amount |
At December 31, 2020
| Intellectual | ||||||||||||
| Contracts | property | Total | ||||||||||
| Cost |
||||||||||||
| Beginning of year |
$ | 113,707 | $ | 118,819 | $ | 232,526 | ||||||
| Effect of movements in exchange rates |
(2,319 | ) | — | (2,319 | ) | |||||||
|
|
|
|
|
|
|
|||||||
| End of year |
111,388 | 118,819 | 230,207 | |||||||||
|
|
|
|
|
|
|
|||||||
| Accumulated amortization and impairment |
||||||||||||
| Beginning of year |
111,094 | 61,022 | 172,116 | |||||||||
| Amortization charge |
1,008 | 3,700 | 4,708 | |||||||||
| Effect of movements in exchange rates |
(2,439 | ) | — | (2,439 | ) | |||||||
|
|
|
|
|
|
|
|||||||
| End of year |
109,663 | 64,722 | 174,385 | |||||||||
|
|
|
|
|
|
|
|||||||
| Net book value at December 31, 2020 |
$ | 1,725 | $ | 54,097 | $ | 55,822 | ||||||
|
|
|
|
|
|
|
|||||||
At December 31, 2019
| Intellectual | ||||||||||||
| Contracts | property | Total | ||||||||||
| Cost |
||||||||||||
| Beginning of year |
$ | 119,371 | $ | 118,819 | $ | 238,190 | ||||||
| Effect of movements in exchange rates |
(5,664 | ) | — | (5,664 | ) | |||||||
|
|
|
|
|
|
|
|||||||
| End of year |
113,707 | 118,819 | 232,526 | |||||||||
|
|
|
|
|
|
|
|||||||
| Accumulated amortization and impairment |
||||||||||||
| Beginning of year |
115,434 | 57,154 | 172,588 | |||||||||
| Amortization charge |
1,181 | 3,868 | 5,049 | |||||||||
| Effect of movements in exchange rates |
(5,521 | ) | — | (5,521 | ) | |||||||
|
|
|
|
|
|
|
|||||||
| End of year |
111,094 | 61,022 | 172,116 | |||||||||
|
|
|
|
|
|
|
|||||||
| Net book value at December 31, 2019 |
$ | 2,613 | $ | 57,797 | $ | 60,410 | ||||||
|
|
|
|
|
|
|
|||||||
29
| B. | Amortization |
The intangible asset values relate to intellectual property acquired with Cameco Fuel Manufacturing Inc. (CFM) and purchase and sales contracts acquired with NUKEM. The CFM intellectual property is being amortized on a unit-of-production basis over its remaining life. Amortization is allocated to the cost of inventory and is recognized in cost of products and services sold as inventory is sold. The purchase and sales contracts will be amortized to earnings over the remaining terms of the underlying contracts, which extend to 2022. Amortization of the purchase contracts is allocated to the cost of inventory and is included in cost of products and services sold as inventory is sold. Sales contracts are amortized to revenue.
| 10. | Long-term receivables, investments and other |
| 2020 | 2019 | |||||||
| Investments in equity securities [note 26](a) |
$ | 43,873 | $ | 24,408 | ||||
| Derivatives [note 26] |
45,605 | 10,504 | ||||||
| Investment tax credits |
95,642 | 95,474 | ||||||
| Amounts receivable related to tax dispute [note 21](b) |
303,222 | 303,222 | ||||||
| Product loan(c) |
176,904 | 176,904 | ||||||
| Other |
5,512 | 26,183 | ||||||
|
|
|
|
|
|||||
| 670,758 | 636,695 | |||||||
| Less current portion |
(18,716 | ) | (6,564 | ) | ||||
|
|
|
|
|
|||||
| Net |
$ | 652,042 | $ | 630,131 | ||||
|
|
|
|
|
|||||
| (a) | At January 1, 2018, Cameco designated the investments shown below as equity securities at FVOCI because these equity securities represent investments that the Company intends to hold for the long term for strategic purposes. There were no dividends recognized on any of these investments during the year. |
| 2020 | 2019 | |||||||
| Investment in Denison Mines Corp. |
$ | 20,677 | $ | 13,292 | ||||
| Investment in UEX Corporation |
13,005 | 7,253 | ||||||
| Investment in ISO Energy Ltd. |
6,923 | 1,481 | ||||||
| Investment in GoviEx |
2,875 | 2,000 | ||||||
| Other |
393 | 382 | ||||||
|
|
|
|
|
|||||
| $ | 43,873 | $ | 24,408 | |||||
|
|
|
|
|
|||||
| (b) | Cameco was required to remit or otherwise secure 50% of the cash taxes and transfer pricing penalties, plus related interest and instalment penalties assessed, in relation to its dispute with Canada Revenue Agency (CRA) (see note 21). In light of our view of the likely outcome of the case, Cameco expects to recover the amounts remitted to CRA, including cash taxes, interest and penalties totalling $303,222,000 already paid as at December 31, 2020 (December 31, 2019 - $303,222,000) (note 21). |
| (c) | During 2018, as a result of the decision to temporarily suspend production at the McArthur River mine, Cameco loaned 5,400,000 pounds of uranium concentrate to its joint venture partner, Orano Canada Inc., (Orano). Orano is obligated to repay us in kind with uranium concentrate no later than December 31, 2023. The loan was recorded at Cameco’s weighted average cost of inventory. |
| 11. | Equity-accounted investee |
JV Inkai is the operator of the Inkai uranium deposit located in Kazakhstan. Cameco holds a 40% interest and Kazatomprom holds a 60% interest in JV Inkai. Cameco does not have joint control over the joint venture and as a result, Cameco accounts for JV Inkai on an equity basis.
30
JV Inkai is a uranium mining and milling operation that utilizes in-situ recovery (ISR) technology to extract uranium. The participants in JV Inkai purchase uranium from Inkai and, in turn, derive revenue directly from the sale of such product to third-party customers.
The following tables summarize the financial information of JV Inkai (100%):
| 2020 | 2019 | |||||||
| Cash and cash equivalents |
$ | 47,539 | $ | 16,699 | ||||
| Other current assets |
115,647 | 139,324 | ||||||
| Non-current assets |
343,767 | 398,721 | ||||||
| Current liabilities |
(26,397 | ) | (71,162 | ) | ||||
| Non-current liabilities |
(39,991 | ) | (41,508 | ) | ||||
|
|
|
|
|
|||||
| Net assets |
$ | 440,565 | $ | 442,074 | ||||
|
|
|
|
|
|||||
| 2020 | 2019 | |||||||
| Revenue from products and services |
$ | 252,764 | $ | 261,860 | ||||
| Cost of products and services sold |
(57,358 | ) | (64,199 | ) | ||||
| Depreciation and amortization |
(24,081 | ) | (27,740 | ) | ||||
| Finance income |
367 | 651 | ||||||
| Finance costs |
(825 | ) | (2,939 | ) | ||||
| Other expense |
(12,305 | ) | (23,767 | ) | ||||
| Income tax expense |
(44,804 | ) | (30,999 | ) | ||||
|
|
|
|
|
|||||
| Net earnings |
113,758 | 112,867 | ||||||
| Other comprehensive loss |
(97 | ) | (1,773 | ) | ||||
|
|
|
|
|
|||||
| Total comprehensive income |
$ | 113,661 | $ | 111,094 | ||||
|
|
|
|
|
|||||
The following table reconciles the summarized financial information to the carrying amount of Cameco’s interest in JV Inkai:
| 2020 | 2019 | |||||||
| Opening net assets |
$ | 442,074 | $ | 416,843 | ||||
| Total comprehensive income |
113,661 | 111,094 | ||||||
| Dividends declared |
(64,456 | ) | (66,369 | ) | ||||
| Impact of foreign exchange |
(50,714 | ) | (19,494 | ) | ||||
|
|
|
|
|
|||||
| Closing net assets |
440,565 | 442,074 | ||||||
| Cameco’s share of net assets |
176,226 | 176,830 | ||||||
| Consolidating adjustments(a) |
(38,975 | ) | (30,633 | ) | ||||
| Fair value increment(b) |
89,184 | 91,697 | ||||||
| Dividends declared but not received |
— | 13,859 | ||||||
| Dividends in excess of ownership percentage(c) |
(9,669 | ) | — | |||||
| Impact of foreign exchange |
2,922 | 928 | ||||||
|
|
|
|
|
|||||
| Carrying amount in the statement of financial position at December 31, 2020 |
$ | 219,688 | $ | 252,681 | ||||
|
|
|
|
|
|||||
| (a) | Cameco records certain consolidating adjustments to eliminate unrealized profit and amortize historical differences in accounting policies. This amount is amortized to earnings over units of production. |
| (b) | Upon restructuring, Cameco assigned fair values to the assets and liabilities of JV Inkai. This increment is amortized to earnings over units of production. |
31
| (c) | Cameco’s share of dividends follows its production purchase entitlements which is currently higher than its ownership interest. |
| 12. | Accounts payable and accrued liabilities |
| 2020 | 2019 | |||||||
| Trade payables |
$ | 137,190 | $ | 100,407 | ||||
| Non-trade payables |
58,105 | 66,815 | ||||||
| Payables due to related parties [note 24] |
38,354 | 14,577 | ||||||
|
|
|
|
|
|||||
| Total |
$ | 233,649 | $ | 181,799 | ||||
|
|
|
|
|
|||||
The Company’s exposure to currency and liquidity risk related to trade and other payables is disclosed in note 26.
| 13. | Long-term debt |
| 2020 | 2019 | |||||||
| Unsecured debentures |
||||||||
| Series E - 3.75% debentures due November 14, 2022 |
— | 399,152 | ||||||
| Series F - 5.09% debentures due November 14, 2042 |
99,319 | 99,302 | ||||||
| Series G - 4.19% debentures due June 24, 2024 |
498,630 | 498,264 | ||||||
| Series H - 2.95% debentures due October 21, 2027 |
397,592 | — | ||||||
|
|
|
|
|
|||||
| Total |
$ | 995,541 | $ | 996,718 | ||||
|
|
|
|
|
|||||
On October 21, 2020, Cameco issued $400,000,000 of Series H debentures which bear interest at a rate of 2.95% per annum. The net proceeds of the issue after deducting expenses were approximately $397,500,000. The debentures mature on October 21, 2027 and are being amortized at an effective interest rate of 3.05%. In conjunction with the issuance of the Series H debentures, on November 20, 2020, the $400,000,000 principal amount of the Series E debentures was redeemed. Cameco recognized $24,439,000 of finance costs in relation to the early redemption of these debentures (note 19).
Cameco has a $1,000,000,000 unsecured revolving credit facility that is available until November 1, 2023. Upon mutual agreement, the facility can be extended for an additional year on the anniversary date. In addition to direct borrowings under the facility, up to $100,000,000 can be used for the issuance of letters of credit and, to the extent necessary, it may be used to provide liquidity support for the Company’s commercial paper program. The agreement also provides the ability to increase the revolving credit facility above $1,000,000,000 by increments no less than $50,000,000, to a total of $1,250,000,000. The facility ranks equally with all of Cameco’s other senior debt. As of December 31, 2020 and 2019, there were no amounts outstanding under this facility.
Cameco has $1,698,340,000 (2019 - $1,719,120,000) in letter of credit facilities. Outstanding and committed letters of credit at December 31, 2020 amounted to $1,596,488,000 (2019 - $1,528,603,000), the majority of which relate to future decommissioning and reclamation liabilities (note 15).
Cameco is bound by a covenant in its revolving credit facility. The covenant requires a funded debt to tangible net worth ratio equal to or less than 1:1. Non-compliance with this covenant could result in accelerated payment and termination of the revolving credit facility. At December 31, 2020, Cameco was in compliance with the covenant and does not expect its operating and investing activities in 2021 to be constrained by it.
32
The table below represents currently scheduled maturities of long-term debt:
| 2021 | 2022 | 2023 | 2024 | 2025 | Thereafter | Total | ||||||||||||||||||
| $ — | — | — | 498,630 | — | 496,911 | $ | 995,541 | |||||||||||||||||
|
|
|
|
|
|
|
|
|
|
|
|
|
|
||||||||||||
| 14. | Other liabilities |
| 2020 | 2019 | |||||||
| Deferred sales [note 17] |
$ | 14,382 | $ | 17,418 | ||||
| Derivatives [note 26] |
4,733 | 12,524 | ||||||
| Accrued pension and post-retirement benefit liability [note 25] |
91,729 | 80,737 | ||||||
| Lease obligation |
7,951 | 12,869 | ||||||
| Product loan(a) |
6,045 | — | ||||||
| Other |
67,838 | 63,452 | ||||||
|
|
|
|
|
|||||
| 192,678 | 187,000 | |||||||
| Less: current portion |
(26,119 | ) | (33,073 | ) | ||||
|
|
|
|
|
|||||
| Net |
$ | 166,559 | $ | 153,927 | ||||
|
|
|
|
|
|||||
Expenses related to short-term leases and leases of low-value assets were insignificant during 2020.
| (a) | The Company has standby product loan facilities with various counterparties. The arrangements allow it to borrow up to 2.0 million kgU of UF6 conversion services and 2.6 million pounds of U3O8 over the period 2020 to 2023 with repayment in kind up to December 31, 2023. Under the facilities, standby fees of up to 1% are payable based on the market value of the facilities and interest is payable on the market value of any amounts drawn at rates ranging from 0.5% to 2.0%. During the year, Cameco borrowed 1,213,800 pounds of U3O8 and 464,600 kgU of UF6 conversion services. The U3O8 loan was repaid during the year while repayment on the UF6 loan is due no later than December 31, 2022. The loan is recorded at Cameco’s weighted average cost of inventory. |
| 15. | Provisions |
| Reclamation | Waste disposal | Total | ||||||||||
| Beginning of year |
$ | 1,050,675 | $ | 9,803 | $ | 1,060,478 | ||||||
| Changes in estimates and discount rates [note 8] |
||||||||||||
| Capitalized in property, plant and equipment |
127,637 | — | 127,637 | |||||||||
| Recognized in earnings [note 8] |
23,921 | (150 | ) | 23,771 | ||||||||
| Provisions used during the period |
(17,272 | ) | (368 | ) | (17,640 | ) | ||||||
| Unwinding of discount [note 19] |
14,366 | 37 | 14,403 | |||||||||
| Effect of movements in exchange rates |
(9,727 | ) | — | (9,727 | ) | |||||||
|
|
|
|
|
|
|
|||||||
| End of period |
$ | 1,189,600 | $ | 9,322 | $ | 1,198,922 | ||||||
|
|
|
|
|
|
|
|||||||
| Current |
$ | 40,760 | $ | 1,775 | $ | 42,535 | ||||||
| Non-current |
1,148,840 | 7,547 | 1,156,387 | |||||||||
|
|
|
|
|
|
|
|||||||
| $ | 1,189,600 | $ | 9,322 | $ | 1,198,922 | |||||||
|
|
|
|
|
|
|
|||||||
| A. | Reclamation provision |
Cameco’s estimates of future decommissioning obligations are based on reclamation standards that satisfy regulatory requirements. Elements of uncertainty in estimating these amounts include potential changes in regulatory requirements, decommissioning and reclamation alternatives and amounts to be recovered from other parties.
33
Cameco estimates total undiscounted future decommissioning and reclamation costs for its existing operating assets to be $1,130,495,000 (2019 - $1,127,487,000). The expected timing of these outflows is based on life-of-mine plans with the majority of expenditures expected to occur after 2026. These estimates are reviewed by Cameco technical personnel as required by regulatory agencies or more frequently as circumstances warrant. In connection with future decommissioning and reclamation costs, Cameco has provided financial assurances of $1,021,142,000 (2019 - $994,129,000) in the form of letters of credit to satisfy current regulatory requirements.
The reclamation provision relates to the following segments:
| 2020 | 2019 | |||||||
| Uranium |
$ | 937,992 | $ | 831,352 | ||||
| Fuel services |
251,608 | 219,323 | ||||||
|
|
|
|
|
|||||
| Total |
$ | 1,189,600 | $ | 1,050,675 | ||||
|
|
|
|
|
|||||
| B. | Waste disposal |
The fuel services segment consists of the Blind River refinery, Port Hope conversion facility and Cameco Fuel Manufacturing Inc.. The refining, conversion and manufacturing processes generate certain uranium contaminated waste. These include contaminated combustible material (paper, rags, gloves, etc.) and contaminated non-combustible material (metal parts, soil from excavations, building and roofing materials, spent uranium concentrate drums, etc.). These materials can in some instances be recycled or reprocessed. A provision for waste disposal costs in respect of these materials is recognized when they are generated.
Cameco estimates total undiscounted future costs related to existing waste disposal to be $8,044,000 (2019 - $8,451,000). The majority of these expenditures are expected to occur within the next five years.
| 16. | Share capital |
Authorized share capital:
| • | Unlimited number of first preferred shares |
| • | Unlimited number of second preferred shares |
| • | Unlimited number of voting common shares, no stated par value, not convertible or redeemable, and |
| • | One Class B share |
| A. | Common Shares |
| Number issued (number of shares) |
2020 | 2019 | ||||||
| Beginning of year |
395,797,732 | 395,792,732 | ||||||
| Issued: |
||||||||
| Stock option plan [note 24] |
465,009 | 5,000 | ||||||
|
|
|
|
|
|||||
| End of year |
396,262,741 | 395,797,732 | ||||||
|
|
|
|
|
|||||
All issued shares are fully paid. Holders of the common shares are entitled to exercise one vote per share at meetings of shareholders, are entitled to receive dividends if, as and when declared by our Board of Directors and are entitled to participate in any distribution of remaining assets following a liquidation.
The shares of Cameco are widely held and no shareholder, resident in Canada, is allowed to own more than 25% of the Company’s outstanding common shares, either individually or together with associates. A non-resident of Canada is not allowed to own more than 15%. In addition, no more than 25% of total shareholder votes cast may be cast by non-resident shareholders.
34
| B. | Class B share |
One Class B share issued during 1988 and assigned $1 of share capital entitles the shareholder to vote separately as a class in respect of any proposal to locate the head office of Cameco to a place not in the province of Saskatchewan.
| C. | Dividends |
Dividends on Cameco Corporation common shares are declared in Canadian dollars. For the year ended December 31, 2020, the dividend declared per share was $0.08 (December 31, 2019 - $0.08).
| 17. | Revenue |
Cameco’s sales contracts with customers contain both fixed and market-related pricing. Fixed-price contracts are typically based on a term-price indicator at the time the contract is accepted and escalated over the term of the contract. Market-related contracts are based on either the spot price or long-term price, and the price is quoted at the time of delivery rather than at the time the contract is accepted. These contracts often include a floor and/or ceiling prices, which are usually escalated over the term of the contract. Escalation is generally based on a consumer price index. The Company’s contracts contain either one of these pricing mechanisms or a combination of the two. There is no variable consideration in the contracts and therefore no revenue is considered constrained at the time of delivery. Cameco expenses the incremental costs of obtaining a contract as incurred as the amortization period is less than a year.
The following table summarizes Cameco’s sales disaggregated by geographical region and contract type and includes a reconciliation to the Company’s reportable segments (note 28):
For the year ended December 31, 2020
| Uranium | Fuel services | Other | Total | |||||||||||||
| Customer geographical region |
||||||||||||||||
| Americas |
$ | 588,827 | $ | 206,011 | $ | 7,676 | $ | 802,514 | ||||||||
| Europe |
323,565 | 123,864 | 3,331 | 450,760 | ||||||||||||
| Asia |
499,378 | 47,421 | — | 546,799 | ||||||||||||
|
|
|
|
|
|
|
|
|
|||||||||
| $ | 1,411,770 | $ | 377,296 | $ | 11,007 | $ | 1,800,073 | |||||||||
|
|
|
|
|
|
|
|
|
|||||||||
| Contract type |
||||||||||||||||
| Fixed-price |
$ | 406,021 | $ | 355,552 | $ | 7,686 | $ | 769,259 | ||||||||
| Market-related |
1,005,749 | 21,744 | 3,321 | 1,030,814 | ||||||||||||
|
|
|
|
|
|
|
|
|
|||||||||
| $ | 1,411,770 | $ | 377,296 | $ | 11,007 | $ | 1,800,073 | |||||||||
|
|
|
|
|
|
|
|
|
|||||||||
For the year ended December 31, 2019
| Uranium | Fuel services | Other | Total | |||||||||||||
| Customer geographical region |
||||||||||||||||
| Americas |
$ | 569,535 | $ | 206,226 | $ | 59,300 | $ | 835,061 | ||||||||
| Europe |
288,134 | 79,629 | 3,587 | 371,350 | ||||||||||||
| Asia |
556,140 | 84,422 | 15,952 | 656,514 | ||||||||||||
|
|
|
|
|
|
|
|
|
|||||||||
| $ | 1,413,809 | $ | 370,277 | $ | 78,839 | $ | 1,862,925 | |||||||||
|
|
|
|
|
|
|
|
|
|||||||||
| Contract type |
||||||||||||||||
| Fixed-price |
$ | 349,021 | $ | 305,383 | $ | 69,703 | $ | 724,107 | ||||||||
| Market-related |
1,064,788 | 64,894 | 9,136 | 1,138,818 | ||||||||||||
|
|
|
|
|
|
|
|
|
|||||||||
| $ | 1,413,809 | $ | 370,277 | $ | 78,839 | $ | 1,862,925 | |||||||||
|
|
|
|
|
|
|
|
|
|||||||||
35
Deferred sales
The following table provides information about contract liabilities (note 14) from contracts with customers:
| 2020 | 2019 | |||||||
| Beginning of year |
$ | 17,418 | $ | 30,727 | ||||
| Additions |
6,994 | 9,783 | ||||||
| Recognized in revenue |
(10,026 | ) | (23,067 | ) | ||||
| Effect of movements in exchange rates |
(4 | ) | (25 | ) | ||||
|
|
|
|
|
|||||
| End of year |
$ | 14,382 | $ | 17,418 | ||||
|
|
|
|
|
|||||
Deferred sales primarily relates to advance consideration received from customers for future conversion deliveries and fuel fabrication services as well as revenue related to the storage of uranium and converted uranium held at Cameco facilities. The revenue related to the fuel fabrication services and storage is recognized over time while the revenue related to future conversion deliveries is expected to be recognized between 2021 and 2027.
Cameco recognized a reduction of revenue of $268,000 (2019 - revenue of $78,000) during 2020 from performance obligations satisfied (or partially satisfied) in previous periods. This is due to the difference between actual pricing indices and the estimates at the time of invoicing.
Future sales commitments
Cameco’s sales portfolio consists of short and long-term sales commitments. The contracts can be executed well in advance of a delivery and include both fixed and market-related pricing. The following table summarizes the expected future revenue, by segment, related to only fixed-price contracts with remaining future deliveries as follows:
| 2021 | 2022 | 2023 | 2024 | 2025 | Thereafter | Total | ||||||||||||||||||||||
| Uranium |
$ | 243,069 | $ | 189,351 | $ | 179,212 | $ | 166,581 | $ | 129,450 | $ | 416,947 | $ | 1,324,610 | ||||||||||||||
| Fuel services |
319,851 | 272,920 | 212,655 | 215,729 | 216,250 | 677,611 | 1,915,016 | |||||||||||||||||||||
| Other |
4,212 | — | — | — | — | — | 4,212 | |||||||||||||||||||||
|
|
|
|
|
|
|
|
|
|
|
|
|
|
|
|||||||||||||||
| Total |
$ | 567,132 | $ | 462,271 | $ | 391,867 | $ | 382,310 | $ | 345,700 | $ | 1,094,558 | $ | 3,243,838 | ||||||||||||||
|
|
|
|
|
|
|
|
|
|
|
|
|
|
|
|||||||||||||||
The sales contracts are denominated largely in US dollars and converted from US to Canadian dollars at a rate of $1.30.
The amounts in the table represent the consideration the Company will be entitled to receive when it satisfies the remaining performance obligations in the contracts. The amounts include assumptions about volumes for contracts that have volume flexibility. Cameco’s total revenue that will be earned will also include revenue from contracts with market-related pricing. The Company has elected to exclude these amounts from the table as the transaction price will not be known until the time of delivery. Contracts with an original duration of one year or less have been included in the table.
36
| 18. | Employee benefit expense |
The following employee benefit expenses are included in cost of products and services sold, administration, exploration, research and development and property, plant and equipment:
| 2020 | 2019 | |||||||
| Wages and salaries |
$ | 226,725 | $ | 238,000 | ||||
| Statutory and company benefits |
41,299 | 41,972 | ||||||
| Expenses related to defined benefit plans [note 25] |
5,256 | 4,790 | ||||||
| Expenses related to defined contribution plans [note 25] |
12,410 | 11,767 | ||||||
| Equity-settled share-based compensation [note 24] |
9,738 | 17,469 | ||||||
| Cash-settled share-based compensation [note 24] |
27,241 | (1,437 | ) | |||||
|
|
|
|
|
|||||
| Total |
$ | 322,669 | $ | 312,561 | ||||
|
|
|
|
|
|||||
| 19. | Finance costs |
| 2020 | 2019 | |||||||
| Interest on long-term debt |
$ | 43,340 | $ | 63,136 | ||||
| Unwinding of discount on provisions [note 15] |
14,403 | 20,789 | ||||||
| Redemption of Series E debentures [note 13] |
24,439 | — | ||||||
| Other charges |
13,951 | 14,697 | ||||||
|
|
|
|
|
|||||
| Total |
$ | 96,133 | $ | 98,622 | ||||
|
|
|
|
|
|||||
No borrowing costs were determined to be eligible for capitalization during the year.
| 20. | Other income (expense) |
| 2020 | 2019 | |||||||
| Arbitration award(a) |
$ | — | $ | 52,801 | ||||
| Foreign exchange gains (losses) |
13,891 | (18,961 | ) | |||||
| Government assistance(b) |
37,347 | — | ||||||
| Other |
202 | — | ||||||
|
|
|
|
|
|||||
| Total |
$ | 51,440 | $ | 33,840 | ||||
|
|
|
|
|
|||||
| (a) | In the third quarter of 2019, Cameco received an award from the tribunal of international arbitrators (Tribunal) with respect to its contract dispute with Tokyo Electric Power Company Holdings, Inc. (TEPCO). The Tribunal rejected TEPCO’s assertion that it had the right to terminate its uranium supply agreement and awarded damages of $40,300,000 (US). Damages were based on the Tribunal’s interpretation of losses under this supply agreement. |
| (b) | In response to the negative economic impact of COVID-19, the Government of Canada announced the Canada Emergency Wage Subsidy program (CEWS). CEWS provides a subsidy on eligible remuneration based on certain criteria. During the year, the Company qualified for the subsidy for the periods April through December. There are no unfulfilled conditions and other contingencies attached to this government assistance. Cameco intends to apply for the CEWS in subsequent application periods, subject to continuing to meet the applicable qualification criteria. |
37
| 21. | Income taxes |
| A. | Significant components of deferred tax assets and liabilities |
| Recognized in earnings | As at December 31 | |||||||||||||||
| 2020 | 2019 | 2020 | 2019 | |||||||||||||
| Assets |
||||||||||||||||
| Property, plant and equipment |
$ | (38,389 | ) | $ | 74,039 | $ | 280,798 | $ | 319,185 | |||||||
| Provision for reclamation |
28,628 | 2,325 | 222,142 | 193,514 | ||||||||||||
| Inventories |
4,071 | (2,163 | ) | 4,071 | — | |||||||||||
| Foreign exploration and development |
2 | (14 | ) | 5,269 | 5,267 | |||||||||||
| Income tax losses (gains) |
(7,629 | ) | (108,839 | ) | 382,712 | 390,341 | ||||||||||
| Defined benefit plan actuarial losses |
— | — | 9,410 | 7,947 | ||||||||||||
| Long-term investments and other |
(5,678 | ) | (17,377 | ) | 32,276 | 40,423 | ||||||||||
|
|
|
|
|
|
|
|
|
|||||||||
| Deferred tax assets |
(18,995 | ) | (52,029 | ) | 936,678 | 956,677 | ||||||||||
|
|
|
|
|
|
|
|
|
|||||||||
| Liabilities |
||||||||||||||||
| Inventories |
(301 | ) | 301 | — | 301 | |||||||||||
|
|
|
|
|
|
|
|
|
|||||||||
| Deferred tax liabilities |
(301 | ) | 301 | — | 301 | |||||||||||
|
|
|
|
|
|
|
|
|
|||||||||
| Net deferred tax asset (liability) |
$ | (18,694 | ) | $ | (52,330 | ) | $ | 936,678 | $ | 956,376 | ||||||
|
|
|
|
|
|
|
|
|
|||||||||
| Deferred tax allocated as |
2020 | 2019 | ||||||
| Deferred tax assets |
$ | 936,678 | $ | 956,376 | ||||
| Deferred tax liabilities |
— | — | ||||||
|
|
|
|
|
|||||
| Net deferred tax asset |
$ | 936,678 | $ | 956,376 | ||||
|
|
|
|
|
|||||
Cameco has recorded a deferred tax asset of $936,678,000 (2019 - $956,376,000). The realization of this deferred tax asset is dependent upon the generation of future taxable income in certain jurisdictions during the periods in which the Company’s deferred tax assets are available. The Company considers whether it is probable that all or a portion of the deferred tax assets will not be realized. In making this assessment, management considers all available evidence, including recent financial operations, projected future taxable income and tax planning strategies. Based on projections of future taxable income over the periods in which the deferred tax assets are available, realization of these deferred tax assets is probable and consequently the deferred tax assets have been recorded.
38
| B. | Movement in net deferred tax assets and liabilities |
| 2020 | 2019 | |||||||
| Deferred tax asset at beginning of year |
$ | 956,376 | $ | 1,006,012 | ||||
| Expense for the year in net earnings |
(18,694 | ) | (52,330 | ) | ||||
| Recovery (expense) for the year in other comprehensive income |
(1,006 | ) | 2,754 | |||||
| Effect of movements in exchange rates |
2 | (60 | ) | |||||
|
|
|
|
|
|||||
| End of year |
$ | 936,678 | $ | 956,376 | ||||
|
|
|
|
|
|||||
| C. | Significant components of unrecognized deferred tax assets |
| 2020 | 2019 | |||||||
| Income tax losses |
$ | 271,163 | $ | 280,330 | ||||
| Property, plant and equipment |
2,204 | 2,321 | ||||||
| Provision for reclamation |
75,219 | 75,082 | ||||||
| Long-term investments and other |
60,223 | 70,380 | ||||||
|
|
|
|
|
|||||
| Total |
$ | 408,809 | $ | 428,113 | ||||
|
|
|
|
|
|||||
| D. | Tax rate reconciliation |
The provision for income taxes differs from the amount computed by applying the combined expected federal and provincial income tax rate to earnings before income taxes. The reasons for these differences are as follows:
| 2020 | 2019 | |||||||
| Earnings (loss) before income taxes and non-controlling interest |
$ | (39,531 | ) | $ | 135,018 | |||
| Combined federal and provincial tax rate |
26.9 | % | 26.9 | % | ||||
|
|
|
|
|
|||||
| Computed income tax expense (recovery) |
(10,634 | ) | 36,320 | |||||
| Increase (decrease) in taxes resulting from: |
||||||||
| Difference between Canadian rates and rates applicable to subsidiaries in other countries |
42,028 | 5,558 | ||||||
| Change in unrecognized deferred tax assets |
(7,766 | ) | 19,646 | |||||
| Share-based compensation plans |
398 | 1,146 | ||||||
| Change in legislation |
(1,978 | ) | — | |||||
| Income in equity-accounted investee |
(12,155 | ) | (12,074 | ) | ||||
| Change in uncertain tax positions |
2,455 | 2,572 | ||||||
| Other permanent differences |
1,318 | 7,909 | ||||||
|
|
|
|
|
|||||
| Income tax expense |
$ | 13,666 | $ | 61,077 | ||||
|
|
|
|
|
|||||
39
| E. | Earnings and income taxes by jurisdiction |
| 2020 | 2019 | |||||||
| Earnings (loss) before income taxes |
||||||||
| Canada |
$ | 72,809 | $ | 229,429 | ||||
| Foreign |
(112,340 | ) | (94,411 | ) | ||||
|
|
|
|
|
|||||
| $ | (39,531 | ) | $ | 135,018 | ||||
|
|
|
|
|
|||||
| Current income taxes (recovery) |
||||||||
| Canada |
$ | (394 | ) | $ | 7,969 | |||
| Foreign |
(4,634 | ) | 778 | |||||
|
|
|
|
|
|||||
| $ | (5,028 | ) | $ | 8,747 | ||||
| Deferred income taxes (recovery) |
||||||||
| Canada |
$ | 9,122 | $ | 60,010 | ||||
| Foreign |
9,572 | (7,680 | ) | |||||
|
|
|
|
|
|||||
| $ | 18,694 | $ | 52,330 | |||||
|
|
|
|
|
|||||
| Income tax expense |
$ | 13,666 | $ | 61,077 | ||||
|
|
|
|
|
|||||
| F. | Reassessments |
Canada
In 2008, as part of the ongoing annual audits of Cameco’s Canadian tax returns, Canada Revenue Agency (CRA) disputed the transfer pricing structure and methodology used by Cameco and its wholly owned Swiss subsidiary, Cameco Europe Ltd., in respect of sale and purchase agreements for uranium products. From December 2008 to date, CRA issued notices of reassessment for the taxation years 2003 through 2014, which in aggregate have increased Cameco’s income for Canadian tax purposes by approximately $6,600,000,000. CRA has also issued notices of reassessment for transfer pricing penalties for the years 2007 through 2011 in the amount of $371,000,000.
On June 26, 2020, the Federal Court of Appeal (Court of Appeal) released its decision in the Company’s dispute with CRA. The Court of Appeal decision upholds the September 26, 2018 decision of the Tax Court of Canada (Tax Court) which ruled in Cameco’s favour for the 2003, 2005 and 2006 tax years.
The Court of Appeal decision upheld the Tax Court ruling that our marketing and trading structure involving foreign subsidiaries and the related transfer pricing methodology used for certain intercompany uranium purchase and sale agreements were in full compliance with Canadian laws for the three tax years in question. Management believes the principles in the decision apply to all subsequent tax years.
On October 30, 2020, Cameco received notice that CRA made an application to the Supreme Court of Canada (Supreme Court) to seek leave to appeal the decision of the Court of Appeal. The Supreme Court will decide whether to hear the appeal or decline CRA’s request for leave. If the appeal proceeds, Cameco estimates that it could take until the second half of 2022 before a decision is rendered by the Supreme Court.
40
Despite the fact that Cameco believes there is no basis to do so, and it is not the Company’s view of the likely outcome, CRA may continue to reassess Cameco using the methodology it reassessed the 2003 through 2014 tax years. In that scenario, and including the $6,600,000,000 already reassessed, the Company could receive notices of reassessment for a total of approximately $8,700,000,000 for the years 2003 through 2020, which would increase Cameco’s related tax expense by approximately $2,600,000,000. In addition to penalties already imposed, CRA may continue to apply penalties to taxation years subsequent to 2011. In that case, Cameco estimates that cash taxes and transfer pricing penalties would be between $1,950,000,000 and $2,150,000,000. In addition, CRA may seek to apply interest and instalment penalties that would be material to Cameco. While in dispute, Cameco would be required to remit or otherwise secure 50% of the cash taxes and transfer pricing penalties (between $970,000,000 and $1,070,000,000), plus related interest and instalment penalties assessed, which would be material to the Company. Cameco expects further actions regarding the tax years 2007 through 2014 will be suspended until the three years covered in the decision are finally resolved.
CRA has recently proposed an alternative reassessing position for the 2014 tax year but has not reassessed on this basis.
Management believes that the ultimate resolution will not be material to Cameco’s financial position, results of operations or liquidity in the year(s) of resolution. However, resolution of this matter as stipulated by CRA would be material to Cameco’s financial position, results of operations or liquidity in the year(s) of resolution and other unfavourable outcomes for the years 2003 to date could be material to Cameco’s financial position, results of operations and cash flows in the year(s) of resolution.
If CRA continues to pursue reassessments for tax years subsequent to 2006, Cameco will continue to utilize its appeal rights under Canadian federal and provincial tax rules.
| G. | Income tax losses |
At December 31, 2020, income tax losses carried forward of $2,399,647,000 (2019 - $2,509,669,000) are available to reduce taxable income. These losses expire as follows:
| Date of expiry |
Canada | US | Other | Total | ||||||||||||
| 2026 |
$ | — | $ | — | $ | 13,819 | $ | 13,819 | ||||||||
| 2027 |
— | — | 2,841 | 2,841 | ||||||||||||
| 2030 |
47 | — | — | 47 | ||||||||||||
| 2031 |
— | 20,436 | — | 20,436 | ||||||||||||
| 2032 |
272 | 22,010 | — | 22,282 | ||||||||||||
| 2033 |
7,037 | 37,520 | — | 44,557 | ||||||||||||
| 2034 |
365,039 | 20,697 | 4,850 | 390,586 | ||||||||||||
| 2035 |
372,376 | 14,401 | 7,752 | 394,529 | ||||||||||||
| 2036 |
211,299 | 43,769 | 6,106 | 261,174 | ||||||||||||
| 2037 |
143 | 32,785 | 298 | 33,226 | ||||||||||||
| 2038 |
5,581 | 35,357 | — | 40,938 | ||||||||||||
| 2039 |
6,424 | 27,348 | — | 33,772 | ||||||||||||
| 2040 |
3,669 | 21,798 | — | 25,467 | ||||||||||||
| No expiry |
— | — | 1,115,973 | 1,115,973 | ||||||||||||
|
|
|
|
|
|
|
|
|
|||||||||
| $ | 971,887 | $ | 276,121 | $ | 1,151,639 | $ | 2,399,647 | |||||||||
|
|
|
|
|
|
|
|
|
|||||||||
Included in the table above is $1,013,730,000 (2019 - $1,048,264,000) of temporary differences related to loss carry forwards where no future benefit has been recognized.
41
| 22. | Per share amounts |
Per share amounts have been calculated based on the weighted average number of common shares outstanding during the period. The weighted average number of paid shares outstanding in 2020 was 395,829,380 (2019 - 395,796,677).
| 2020 | 2019 | |||||||
| Basic earnings (loss) per share computation |
||||||||
| Net earnings (loss) attributable to equity holders |
$ | (53,169 | ) | $ | 74,000 | |||
| Weighted average common shares outstanding |
395,829 | 395,797 | ||||||
|
|
|
|
|
|||||
| Basic earnings (loss) per common share |
$ | (0.13 | ) | $ | 0.19 | |||
|
|
|
|
|
|||||
| Diluted earnings (loss) per share computation |
||||||||
| Net earnings (loss) attributable to equity holders |
$ | (53,169 | ) | $ | 74,000 | |||
| Weighted average common shares outstanding |
395,829 | 395,797 | ||||||
| Dilutive effect of stock options |
214 | 258 | ||||||
|
|
|
|
|
|||||
| Weighted average common shares outstanding, assuming dilution |
396,043 | 396,055 | ||||||
|
|
|
|
|
|||||
| Diluted earnings (loss) per common share |
$ | (0.13 | ) | $ | 0.19 | |||
|
|
|
|
|
|||||
| 23. | Supplemental cash flow information |
Other operating items included in the statements of cash flows are as follows:
| 2020 | 2019 | |||||||
| Changes in non-cash working capital: |
||||||||
| Accounts receivable |
$ | 143,717 | $ | 58,488 | ||||
| Inventories |
(376,908 | ) | 113,388 | |||||
| Supplies and prepaid expenses |
(3,999 | ) | 3,612 | |||||
| Accounts payable and accrued liabilities |
36,514 | (53,477 | ) | |||||
| Reclamation payments |
(17,640 | ) | (32,390 | ) | ||||
| Other |
25,399 | 6,857 | ||||||
|
|
|
|
|
|||||
| Total |
$ | (192,917 | ) | $ | 96,478 | |||
|
|
|
|
|
|||||
42
The changes arising from financing activities were as follows:
| Long-term debt |
Interest payable |
Lease obligation |
Dividends payable |
Share capital |
Total | |||||||||||||||||||
| Balance at January 1, 2020 |
$ | 996,718 | $ | 3,030 | $ | 12,869 | $ | — | $ | 1,862,749 | $ | 2,875,366 | ||||||||||||
| Changes from financing cash flows: |
||||||||||||||||||||||||
| Dividends paid |
— | — | — | (31,638 | ) | — | (31,638 | ) | ||||||||||||||||
| Interest paid |
— | (65,280 | ) | (267 | ) | — | — | (65,547 | ) | |||||||||||||||
| Lease principal payments |
— | — | (3,716 | ) | — | — | (3,716 | ) | ||||||||||||||||
| Shares issued, stock option plan |
— | — | — | — | 5,375 | 5,375 | ||||||||||||||||||
| Repayment of long-term debt |
(400,000 | ) | — | — | — | — | (400,000 | ) | ||||||||||||||||
| Proceeds of long-term debt |
397,539 | — | — | — | — | 397,539 | ||||||||||||||||||
|
|
|
|
|
|
|
|
|
|
|
|
|
|||||||||||||
| Total cash changes |
(2,461 | ) | (65,280 | ) | (3,983 | ) | (31,638 | ) | 5,375 | (97,987 | ) | |||||||||||||
|
|
|
|
|
|
|
|
|
|
|
|
|
|||||||||||||
| Non-cash changes: |
||||||||||||||||||||||||
| Amortization of issue costs |
1,284 | — | — | — | — | 1,284 | ||||||||||||||||||
| Dividends declared |
— | — | — | 31,638 | — | 31,638 | ||||||||||||||||||
| Interest expense |
— | 66,228 | 267 | — | — | 66,495 | ||||||||||||||||||
| Right-of-use asset additions |
— | — | 2,221 | — | — | 2,221 | ||||||||||||||||||
| Right-of-use asset cancellations |
— | — | (2,165 | ) | — | — | (2,165 | ) | ||||||||||||||||
| Joint operation lease obligations |
— | — | (1,361 | ) | — | — | (1,361 | ) | ||||||||||||||||
| Shares issued, stock option plan |
— | — | — | — | 1,586 | 1,586 | ||||||||||||||||||
| Foreign exchange |
— | — | 103 | — | — | 103 | ||||||||||||||||||
|
|
|
|
|
|
|
|
|
|
|
|
|
|||||||||||||
| Total non-cash changes |
1,284 | 66,228 | (935 | ) | 31,638 | 1,586 | 99,801 | |||||||||||||||||
|
|
|
|
|
|
|
|
|
|
|
|
|
|||||||||||||
| Balance at December 31, 2020 |
$ | 995,541 | $ | 3,978 | $ | 7,951 | $ | — | $ | 1,869,710 | $ | 2,877,180 | ||||||||||||
|
|
|
|
|
|
|
|
|
|
|
|
|
|||||||||||||
| 24. | Share-based compensation plans |
The Company has the following plans:
| A. | Stock option plan |
The Company has established a stock option plan under which options to purchase common shares may be granted to employees of Cameco. Options granted under the stock option plan have an exercise price of not less than the closing price quoted on the Toronto Stock Exchange (TSX) for the common shares of Cameco on the trading day prior to the date on which the option is granted. The options carry vesting periods of one to three years, and expire eight years from the date granted.
The aggregate number of common shares that may be issued pursuant to the Cameco stock option plan shall not exceed 43,017,198 of which 28,340,298 shares have been issued.
43
Stock option transactions for the respective years were as follows:
| (Number of options) |
2020 | 2019 | ||||||
| Beginning of year |
8,617,097 | 8,820,805 | ||||||
| Options granted |
— | 886,740 | ||||||
| Options forfeited |
(81,991 | ) | (270,025 | ) | ||||
| Options expired |
(1,911,558 | ) | (815,423 | ) | ||||
| Options exercised [note 16] |
(465,009 | ) | (5,000 | ) | ||||
|
|
|
|
|
|||||
| End of year |
6,158,539 | 8,617,097 | ||||||
|
|
|
|
|
|||||
| Exercisable |
5,076,226 | 6,290,380 | ||||||
|
|
|
|
|
|||||
Weighted average exercise prices were as follows:
| 2020 | 2019 | |||||||
| Beginning of year |
$ | 17.44 | $ | 19.75 | ||||
| Options granted |
— | 15.27 | ||||||
| Options forfeited |
22.22 | 22.59 | ||||||
| Options expired |
20.14 | 38.43 | ||||||
| Options exercised |
11.56 | 16.38 | ||||||
|
|
|
|
|
|||||
| End of year |
$ | 16.98 | $ | 17.44 | ||||
|
|
|
|
|
|||||
| Exercisable |
$ | 17.73 | $ | 18.90 | ||||
|
|
|
|
|
|||||
Total options outstanding and exercisable at December 31, 2020 were as follows:
| Options outstanding | Options exercisable | |||||||||||||||||||||
| Option price per share |
Number | Weighted average remaining life |
Weighted average exercisable price |
Number | Weighted average exercisable price |
|||||||||||||||||
| $ | 11.32 - 15.83 | 3,060,721 | 5.0 | $ | 13.72 | 1,978,408 | $ | 13.85 | ||||||||||||||
| $ | 15.84 - 26.81 | 3,097,818 | 1.8 | $ | 20.21 | 3,097,818 | $ | 20.21 | ||||||||||||||
|
|
|
|
|
|||||||||||||||||||
| 6,158,539 | 5,076,226 | |||||||||||||||||||||
|
|
|
|
|
|||||||||||||||||||
The foregoing options have expiry dates ranging from February 28, 2021 to February 28, 2027.
44
| B. | Executive performance share unit (PSU) |
The Company has established a PSU plan whereby it provides each plan participant an annual grant of PSUs in an amount determined by the board. Each PSU represents one phantom common share that entitles the participant to a payment of one Cameco common share purchased on the open market, or cash with an equivalent market value, at the participant’s discretion provided they have met their ownership requirements, at the end of each three-year period if certain performance and vesting criteria have been met. The final value of the PSUs will be based on the value of Cameco common shares at the end of the three-year period and the number of PSUs that ultimately vest. During the vesting period, dividend equivalents accrue to the participants in the form of additional share units as of each normal cash dividend payment date of Cameco’s common shares. Vesting of PSUs at the end of the three-year period is based on Cameco’s ability to meet its annual operating targets and whether the participating executive remains employed by Cameco at the end of the three-year vesting period. Prior to 2020, total shareholder return over three years was also a vesting condition. If the participant elects a cash payout, the redemption amount will be based on the volume-weighted average trading price of Cameco’s common shares on March 1 or, if March 1 is not a trading day, on the first trading day following March 1. As of December 31, 2020, the total number of PSUs held by the participants, after adjusting for forfeitures on retirement, was 1,720,636 (2019 - 1,465,618).
| C. | Restricted share unit (RSU) |
The Company has established an RSU plan whereby it provides each plan participant an annual grant of RSUs in an amount determined by the board. Each RSU represents one phantom common share that entitles the participant to a payment of one Cameco common share purchased on the open market, or cash with an equivalent market value, at the board’s discretion. The RSUs carry vesting periods of one to three years, and the final value of the units will be based on the value of Cameco common shares at the end of the vesting periods. In addition, certain eligible participants have a single vesting date on the third anniversary of the date of the grant. These same participants, if they have met or are not subject to share ownership requirements, may elect to have their award paid as a lump sum cash amount. During the vesting period, dividend equivalents accrue to the participants in the form of additional share units as of each normal cash dividend payment date of Cameco’s common shares. As of December 31, 2020, the total number of RSUs held by the participants was 927,462, (2019 - 443,274).
| D. | Phantom stock option |
Cameco makes annual grants of bonuses to eligible non-North American employees in the form of phantom stock options. Employees receive the equivalent value of shares in cash when exercised. Options granted under the phantom stock option plan have an award value equal to the closing price quoted on the TSX for the common shares of Cameco on the trading day prior to the date on which the option is granted. The options vest over three years and expire eight years from the date granted. As of December 31, 2020, the number of options held by participating employees was 422,291 (2019 - 406,270) with exercise prices ranging from $11.32 to $26.81 per share (2019 - $11.32 to $26.81) and a weighted average exercise price of $15.66 (2019 - $16.48).
| E. | Employee share ownership plan |
Cameco also has an employee share ownership plan, whereby both employee and Company contributions are used to purchase shares on the open market for employees. The Company’s contributions are expensed during the year of contribution. Under the plan, employees have the opportunity to participate in the program to a maximum of 6% of eligible earnings each year with Cameco matching the first 3% of employee-paid shares by 50%. Cameco contributes $1,000 of shares annually to each employee that is enrolled in the plan. Shares purchased with Company contributions and with dividends paid on such shares become unrestricted 12 months from the date on which such shares were purchased. At December 31, 2020, there were 2,257 participants in the plan (2019 - 2,253). The total number of shares purchased in 2020 with Company contributions was 248,837 (2019 - 235,915). In 2020, the Company’s contributions totaled $3,174,000 (2019 - $3,127,000).
45
| F. | Deferred share unit (DSU) |
Cameco offers a DSU plan to non-employee directors. A DSU is a notional unit that reflects the market value of a single common share of Cameco. 60% of each director’s annual retainer is paid in DSUs. In addition, on an annual basis, directors can elect to receive 25%, 50%, 75% or 100% of the remaining 40% of their annual retainer and any additional fees in the form of DSUs. If a director meets their ownership requirements, the director may elect to take 25%, 50%, 75% or 100% of their annual retainer and any fees in cash, with the balance, if any, to be paid in DSUs. Each DSU fully vests upon award. Dividend equivalents accrue to the participants in the form of additional share units as of each normal cash dividend payment date of Cameco’s common shares. The DSUs will be redeemed for cash upon a director leaving the board. The redemption amount will be based upon the weighted average of the closing prices of the common shares of Cameco on the TSX for the last 20 trading days prior to the redemption date multiplied by the number of DSUs held by the director. As of December 31, 2020, the total number of DSUs held by participating directors was 541,827 (2019 - 474,266).
Equity-settled plans
Cameco records compensation expense under its equity-settled plans with an offsetting credit to contributed surplus, to reflect the estimated fair value of units granted to employees. During the year, the Company recognized the following expenses under these plans:
| 2020 | 2019 | |||||||
| Stock option plan |
$ | 1,011 | $ | 4,418 | ||||
| Performance share unit plan(a) |
2,650 | 7,245 | ||||||
| Restricted share unit plan |
2,903 | 2,679 | ||||||
| Employee share ownership plan |
3,174 | 3,127 | ||||||
|
|
|
|
|
|||||
| Total |
$ | 9,738 | $ | 17,469 | ||||
|
|
|
|
|
|||||
| (a) | In the fourth quarter of 2019, the performance share unit plan was amended to allow eligible participants to elect payout of their grants in cash or shares, provided they have met their share ownership requirements. As a result, this plan is now considered cash-settled for new grants. Expenses related to PSUs granted in previous years will continue to appear as equity-settled if certain assumptions related to the calculation of fair value are met. |
Fair value measurement of equity-settled plans
The fair value of RSUs granted was determined based on their intrinsic value on the date of grant. Expected volatility was estimated by considering historic average share price volatility.
46
The inputs used in the measurement of the fair values at grant date of the equity-settled RSU plan were as follows:
| Grant date Mar 1/20 |
||||
| Number of options granted |
283,426 | |||
| Average strike price |
$ | 11.45 | ||
| Expected forfeitures |
13 | % | ||
| Weighted average grant date fair values |
$ | 11.45 | ||
Cash-settled plans
Cameco has recognized the following expenses (recoveries) under its cash-settled plans:
| 2020 | 2019 | |||||||
| Deferred share unit plan |
$ | 3,765 | $ | (1,001 | ) | |||
| Performance share unit plan |
20,287 | — | ||||||
| Phantom stock option plan |
1,340 | (436 | ) | |||||
| Restricted share unit plan(a) |
1,849 | — | ||||||
| Total |
$ | 27,241 | $ | (1,437 | ) | |||
| (a) | Due to the inclusion of a new group of participants in the RSU plan that are able to elect cash settlement, grants to this group will appear as an expense of a cash-settled plan. Grants to the original group of participants are still disclosed as an expense of an equity-settled plan. |
At December 31, 2020, a liability of $38,354,000 (2019 - $14,577,000) was included in the consolidated statements of financial position to recognize accrued but unpaid expenses for cash-settled plans.
Fair value measurement of cash-settled plans
The fair value of the units granted through the PSU plan was determined based on Monte Carlo simulation and the fair value of RSUs granted was determined based on their intrinsic value on the date of grant. The phantom stock option plan was measured based on the Black-Scholes option-pricing model. Expected volatility is estimated by considering historic average share price volatility.
47
The inputs used in the measurement of the fair values of the cash-settled share-based payment plans at the grant and reporting dates were as follows:
| PSU | RSU | Phantom stock options | ||||||||||||||||||||||
| Grant date |
Reporting date |
Grant date |
Reporting date |
Grant date |
Reporting date |
|||||||||||||||||||
| Mar 1/20 | Dec 31/20 | Mar 1/20 | Dec 31/20 | Mar 1/20 | Dec 31/20 | |||||||||||||||||||
| Number of units |
636,570 | 1,720,636 | 423,180 | 425,176 | 112,140 | 422,291 | ||||||||||||||||||
| Expected vesting |
102 | % | 129 | % | — | — | — | — | ||||||||||||||||
| Average strike price |
— | — | — | — | $ | 11.61 | $ | 15.66 | ||||||||||||||||
| Expected dividend |
— | — | — | — | $ | 0.08 | $ | 0.08 | ||||||||||||||||
| Expected volatility(a) |
— | 22 | % | — | — | 39 | % | 41 | % | |||||||||||||||
| Risk-free interest rate(a) |
— | 0.1 | % | — | — | 0.6 | % | 0.3 | % | |||||||||||||||
| Expected life of option |
3.0 years | 1 year | 3.0 years | 2.2 years | 4 years | 3.4 years | ||||||||||||||||||
| Expected forfeitures |
12 | % | 11 | % | 12 | % | 12 | % | 8 | % | 7 | % | ||||||||||||
| Weighted average measurement date fair values |
$ | 11.45 | $ | 22.01 | $ | 11.45 | $ | 17.05 | $ | 2.85 | $ | 5.43 | ||||||||||||
| (a) | During the first quarter of 2020, the vesting conditions of the PSU plan were amended such that total shareholder return is no longer included for new grants. Due to this change, expected volatility and the risk-free interest rate will no longer be considered in calculating the fair value of new grants. |
In addition to these inputs, other features of the PSU grant were incorporated into the measurement of fair value. The non-market criteria relating to realized selling prices and operating targets have been incorporated into the valuation at both grant and reporting date by reviewing prior history and corporate budgets.
| 25. | Pension and other post-retirement benefits |
Cameco maintains both defined benefit and defined contribution plans providing pension benefits to substantially all of its employees. All regular and temporary employees participate in a registered defined contribution plan. This plan is registered under the Pension Benefits Standard Act, 1985. In addition, all Canadian-based executives participate in a non-registered supplemental executive pension plan which is a defined benefit plan.
Under the supplemental executive pension plan (SEPP), Cameco provides a lump sum benefit equal to the present value of a lifetime pension benefit based on the executive’s length of service and final average earnings. The plan provides for unreduced benefits to be paid at the normal retirement age of 65, however unreduced benefits could be paid if the executive was at least 60 years of age and had 20 years of service at retirement. This program provides for a benefit determined by a formula based on earnings and service, reduced by the benefits payable under the registered base plan. Security is provided for the SEPP benefits through a letter of credit held by the plan’s trustee. The face amount of the letter of credit is determined each year based on the wind-up liabilities of the supplemental plan, less any plan assets currently held with the trustee. A valuation is required annually to determine the letter of credit amount. Benefits will continue to be paid from plan assets until the fund is exhausted, at which time Cameco will begin paying benefits from corporate assets.
Cameco also maintains non-pension post-retirement plans (“other benefit plans”) which are defined benefit plans that cover such benefits as group life insurance and supplemental health and dental coverage to eligible employees and their dependents. The costs related to these plans are charged to earnings in the period during which the employment services are rendered. These plans are funded by Cameco as benefit claims are made.
The board of directors of Cameco has final responsibility and accountability for the Cameco retirement programs. The board is ultimately responsible for managing the programs to comply with applicable legislation, providing oversight over the general functions and setting certain policies.
Cameco expects to pay $1,785,000 in contributions and letter of credit fees to its defined benefit plans in 2021.
48
The post-retirement plans expose Cameco to actuarial risks, such as longevity risk, market risk, interest rate risk, liquidity risk and foreign currency risk. The other benefit plans expose Cameco to risks of higher supplemental health and dental utilization than expected. However, the other benefit plans have limits on Cameco’s annual benefits payable.
The effective date of the most recent valuation for funding purposes on the registered defined benefit pension plans is January 1, 2018. The next planned effective date for valuations is January 1, 2021.
Cameco has more than one defined benefit plan and has generally provided aggregated disclosures in respect of these plans, on the basis that these plans are not exposed to materially different risks. Information relating to Cameco’s defined benefit plans is shown in the following table:
| Pension benefit plans | Other benefit plans | |||||||||||||||
| 2020 | 2019 | 2020 | 2019 | |||||||||||||
| Fair value of plan assets, beginning of year |
$ | 6,806 | $ | 7,177 | $ | — | $ | — | ||||||||
| Interest income on plan assets |
197 | 262 | — | — | ||||||||||||
| Return on assets excluding interest income |
130 | 280 | — | — | ||||||||||||
| Benefits paid |
(915 | ) | (912 | ) | — | — | ||||||||||
| Administrative costs paid |
(1 | ) | (1 | ) | — | — | ||||||||||
|
|
|
|
|
|
|
|
|
|||||||||
| Fair value of plan assets, end of year |
$ | 6,217 | $ | 6,806 | $ | — | $ | — | ||||||||
|
|
|
|
|
|
|
|
|
|||||||||
| Defined benefit obligation, beginning of year |
$ | 62,588 | $ | 54,271 | $ | 24,955 | $ | 21,161 | ||||||||
| Current service cost |
1,977 | 1,586 | 1,010 | 817 | ||||||||||||
| Interest cost |
1,673 | 1,807 | 792 | 841 | ||||||||||||
| Actuarial loss (gain) arising from: |
||||||||||||||||
| - demographic assumptions |
— | — | 102 | — | ||||||||||||
| - financial assumptions |
6,323 | 6,925 | 2,013 | 2,877 | ||||||||||||
| - experience adjustment |
350 | 777 | (2,236 | ) | 114 | |||||||||||
| Benefits paid |
(1,765 | ) | (1,705 | ) | (809 | ) | (855 | ) | ||||||||
| Foreign exchange |
973 | (1,073 | ) | — | — | |||||||||||
|
|
|
|
|
|
|
|
|
|||||||||
| Defined benefit obligation, end of year |
$ | 72,119 | $ | 62,588 | $ | 25,827 | $ | 24,955 | ||||||||
|
|
|
|
|
|
|
|
|
|||||||||
| Defined benefit liability [note 14] |
$ | (65,902 | ) | $ | (55,782 | ) | $ | (25,827 | ) | $ | (24,955 | ) | ||||
|
|
|
|
|
|
|
|
|
|||||||||
The percentages of the total fair value of assets in the pension plans for each asset category at December 31 were as follows:
| Pension benefit plans | ||||||||
| 2020 | 2019 | |||||||
| Asset category(a) |
||||||||
| Canadian equity securities |
8 | % | 9 | % | ||||
| U.S. equity securities |
12 | % | 12 | % | ||||
| Global equity securities |
8 | % | 9 | % | ||||
| Canadian fixed income |
31 | % | 30 | % | ||||
| Other(b) |
41 | % | 40 | % | ||||
|
|
|
|
|
|||||
| Total |
100 | % | 100 | % | ||||
|
|
|
|
|
|||||
| (a) | The defined benefit plan assets contain no material amounts of related party assets at December 31, 2020 and 2019 respectively. |
| (b) | Relates mainly to the value of the refundable tax account held by the Canada Revenue Agency. The refundable total is approximately equal to half of the sum of the realized investment income plus employer contributions less half of the benefits paid by the plan. |
49
The following represents the components of net pension and other benefit expense included primarily as part of administration:
| Pension benefit plans | Other benefit plans | |||||||||||||||
| 2020 | 2019 | 2020 | 2019 | |||||||||||||
| Current service cost |
$ | 1,977 | $ | 1,586 | $ | 1,010 | $ | 817 | ||||||||
| Net interest cost |
1,476 | 1,545 | 792 | 841 | ||||||||||||
| Administration cost |
1 | 1 | — | — | ||||||||||||
|
|
|
|
|
|
|
|
|
|||||||||
| Defined benefit expense [note 18] |
3,454 | 3,132 | 1,802 | 1,658 | ||||||||||||
| Defined contribution pension expense [note 18] |
12,410 | 11,767 | — | — | ||||||||||||
|
|
|
|
|
|
|
|
|
|||||||||
| Net pension and other benefit expense |
$ | 15,864 | $ | 14,899 | $ | 1,802 | $ | 1,658 | ||||||||
|
|
|
|
|
|
|
|
|
|||||||||
The total amount of actuarial losses (gains) recognized in other comprehensive income is:
| Pension benefit plans | Other benefit plans | |||||||||||||||
| 2020 | 2019 | 2020 | 2019 | |||||||||||||
| Actuarial loss (gain) |
$ | 6,673 | $ | 7,702 | $ | (121 | ) | $ | 2,991 | |||||||
| Return on plan assets excluding interest income |
(130 | ) | (280 | ) | — | — | ||||||||||
|
|
|
|
|
|
|
|
|
|||||||||
| $ | 6,543 | $ | 7,422 | $ | (121 | ) | $ | 2,991 | ||||||||
|
|
|
|
|
|
|
|
|
|||||||||
The assumptions used to determine the Company’s defined benefit obligation and net pension and other benefit expense were as follows at December 31 (expressed as weighted averages):
| Pension benefit plans | Other benefit plans | |||||||||||||||
| 2020 | 2019 | 2020 | 2019 | |||||||||||||
| Discount rate - obligation |
2.4 | % | 3.0 | % | 2.5 | % | 3.1 | % | ||||||||
| Discount rate - expense |
3.0 | % | 3.7 | % | 3.1 | % | 3.9 | % | ||||||||
| Rate of compensation increase |
2.9 | % | 3.0 | % | — | — | ||||||||||
| Initial health care cost trend rate |
— | — | 5.0 | % | 6.0 | % | ||||||||||
| Cost trend rate declines to |
— | — | 5.0 | % | 5.0 | % | ||||||||||
| Year the rate reaches its final level |
— | — | 2021 | 2022 | ||||||||||||
| Dental care cost trend rate |
— | — | 4.5 | % | 5.0 | % | ||||||||||
At December 31, 2020, the weighted average duration of the defined benefit obligation for the pension plans was 20.5 years (2019 - 20.0 years) and for the other benefit plans was 14.2 years (2019 - 15.2 years).
50
A 1% change at the reporting date to one of the relevant actuarial assumptions, holding other assumptions constant, would have affected the defined benefit obligation by the following:
| Pension benefit plans | Other benefit plans | |||||||||||||||
| Increase | Decrease | Increase | Decrease | |||||||||||||
| Discount rate |
$ | (9,778 | ) | $ | 12,766 | $ | (3,270 | ) | $ | 4,138 | ||||||
| Rate of compensation increase |
3,009 | (2,772 | ) | n/a | n/a | |||||||||||
A 1% change in any of the other assumptions would not have a significant impact on the defined benefit obligation.
The methods and assumptions used in preparing the sensitivity analyses are the same as the methods and assumptions used in determining the financial position of Cameco’s plans as at December 31, 2020. The sensitivity analyses are determined by varying the sensitivity assumption and leaving all other assumptions unchanged. Therefore, the sensitivity analyses do not recognize any interdependence in the assumptions. The methods and assumptions used in determining the above sensitivity are consistent with the methods and assumptions used in the previous year.
In addition, an increase of one year in the expected lifetime of plan participants in the pension benefit plans would increase the defined benefit obligation by $2,030,000.
To measure the longevity risk for these plans, the mortality rates were reduced such that the average life expectancy for all members increased by one year. The reduced mortality rates were subsequently used to re-measure the defined benefit obligation of the entire plan.
| 26. | Financial instruments and related risk management |
Cameco is exposed in varying degrees to a variety of risks from its use of financial instruments. Management and the board of directors, both separately and together, discuss the principal risks of our businesses. The board sets policies for the implementation of systems to manage, monitor and mitigate identifiable risks. Cameco’s risk management objective in relation to these instruments is to protect and minimize volatility in cash flow. The types of risks Cameco is exposed to, the source of risk exposure and how each is managed is outlined below.
Market risk
Market risk is the risk that changes in market prices, such as commodity prices, foreign currency exchange rates and interest rates, will affect the Company’s earnings or the fair value of its financial instruments. Cameco engages in various business activities which expose the Company to market risk. As part of its overall risk management strategy, Cameco uses derivatives to manage some of its exposures to market risk that result from these activities.
Derivative instruments may include financial and physical forward contracts. Such contracts may be used to establish a fixed price for a commodity, an interest-bearing obligation or a cash flow denominated in a foreign currency. Market risks are monitored regularly against defined risk limits and tolerances.
Cameco’s actual exposure to these market risks is constantly changing as the Company’s portfolios of foreign currency, interest rate and commodity contracts change.
The types of market risk exposure and the way in which such exposure is managed are as follows:
| A. | Commodity price risk |
As a significant producer and supplier of uranium and nuclear fuel processing services, Cameco bears significant exposure to changes in prices for these products. A substantial change in prices will affect the Company’s net earnings and operating cash flows. Prices for Cameco’s products are volatile and are influenced by numerous factors beyond the Company’s control, such as supply and demand fundamentals and geopolitical events.
51
Cameco’s sales contracting strategy focuses on reducing the volatility in future earnings and cash flow, while providing both protection against decreases in market price and retention of exposure to future market price increases. To mitigate the risks associated with the fluctuations in the market price for uranium products, Cameco seeks to maintain a portfolio of uranium product sales contracts with a variety of delivery dates and pricing mechanisms that provide a degree of protection from pricing volatility.
| B. | Foreign exchange risk |
The relationship between the Canadian and US dollar affects financial results of the uranium business as well as the fuel services business. Sales of uranium product, conversion and fuel manufacturing services are routinely denominated in US dollars while production costs are largely denominated in Canadian dollars.
Cameco attempts to provide some protection against exchange rate fluctuations by planned hedging activity designed to smooth volatility. To mitigate risks associated with foreign currency, Cameco enters into forward sales and option contracts to establish a price for future delivery of the foreign currency. These foreign currency contracts are not designated as hedges and are recorded at fair value with changes in fair value recognized in earnings. Cameco also has a natural hedge against US currency fluctuations because a portion of its annual cash outlays, including purchases of uranium and conversion services, is denominated in US dollars.
Cameco holds a number of financial instruments denominated in foreign currencies that expose the Company to foreign exchange risk. Cameco measures its exposure to foreign exchange risk on financial instruments as the change in carrying values that would occur as a result of reasonably possible changes in foreign exchange rates, holding all other variables constant. As of the reporting date, the Company has determined its pre-tax exposure to foreign currency exchange risk on financial instruments to be as follows based on a 5% weakening of the Canadian dollar:
| Carrying value | ||||||||||||
| Currency | (Cdn). | Gain (loss) | ||||||||||
| Cash and cash equivalents |
USD | $ | 86,985 | $ | 4,349 | |||||||
| Accounts receivable |
USD | 136,894 | 6,845 | |||||||||
| Accounts payable and accrued liabilities |
USD | (72,576 | ) | (3,629 | ) | |||||||
| Net foreign currency derivatives |
USD | 40,872 | (38,811 | ) | ||||||||
A 5% strengthening of the Canadian dollar against the currencies above at December 31, 2020 would have had an equal but opposite effect on the amounts shown above, assuming all other variables remained constant.
| C. | Interest rate risk |
The Company has a strategy of minimizing its exposure to interest rate risk by maintaining target levels of fixed and variable rate borrowings. The proportions of outstanding debt carrying fixed and variable interest rates are reviewed by senior management to ensure that these levels are within approved policy limits. At December 31, 2020, the proportion of Cameco’s outstanding debt that carries fixed interest rates is 100% (2019 - 85%).
Cameco was exposed to interest rate risk during the year through its interest rate swap contracts whereby fixed rate payments on a notional amount of $150,000,000 of the Series E senior unsecured debentures were swapped for variable rate payments. The Series E swaps were set to terminate on November 14, 2022 however with the early retirement of these debentures, the swaps terminated on November 16, 2020 (see note 13). Under the terms of the swaps, Cameco made interest payments based on the three-month Canada Dealer Offered Rate plus an average margin of 1.2% and received fixed interest payments of 3.75%. At the time of the termination of the Series E swaps, the fair value of the interest rate swap net asset was $7,330,000. The Series D swaps terminated on September 2, 2019. At December 31, 2020, the fair value of Cameco’s interest rate swap net asset was nil (2019 - $2,313,000).
52
Counterparty credit risk
Counterparty credit risk is associated with the ability of counterparties to satisfy their contractual obligations to Cameco, including both payment and performance. The maximum exposure to credit risk, as represented by the carrying amount of the financial assets, at December 31 was:
| 2020 | 2019 | |||||||
| Cash and cash equivalents |
$ | 918,382 | $ | 1,062,431 | ||||
| Short-term investments |
24,985 | — | ||||||
| Accounts receivable [note 6] |
166,788 | 323,430 | ||||||
| Derivative assets [note 10] |
45,605 | 10,504 | ||||||
Cash and cash equivalents
Cameco held cash and cash equivalents of $918,000,000 at December 31, 2020 (2019 - $1,062,000,000). Cameco mitigates its credit risk by ensuring that balances are held with counterparties with high credit ratings. The Company monitors the credit rating of its counterparties on a monthly basis and has controls in place to ensure prescribed exposure limits with each counterparty are adhered to.
Impairment on cash and cash equivalents has been measured on a 12-month ECL basis and reflects the short maturities of the exposures. The Company considers that its cash and cash equivalents have low credit risk based on the external credit ratings of the counterparties. Cameco has assessed its counterparty credit risk on cash and cash equivalents by applying historic global default rates to outstanding cash balances based on S&P rating. The conclusion of this assessment is that the loss allowance is insignificant.
Accounts receivable
Cameco’s sales of uranium product, conversion and fuel manufacturing services expose the Company to the risk of non-payment. Cameco manages the risk of non-payment by monitoring the credit-worthiness of its customers and seeking pre-payment or other forms of payment security from customers with an unacceptable level of credit risk.
A summary of the Company’s exposure to credit risk for trade receivables is as follows:
| Carrying value |
||||
| Investment grade credit rating |
$ | 160,093 | ||
| Non-investment grade credit rating |
5,961 | |||
|
|
|
|||
| Total gross carrying amount |
$ | 166,054 | ||
| Loss allowance |
— | |||
|
|
|
|||
| Net |
$ | 166,054 | ||
|
|
|
|||
At December 31, 2020, there were no significant concentrations of credit risk and no amounts were held as collateral. Historically, Cameco has experienced minimal customer defaults and, as a result, considers the credit quality of its accounts receivable to be high.
Cameco uses customer credit rating data, historic default rates and aged receivable analysis to measure the ECLs of trade receivables from corporate customers, which comprise a small number of large balances. Since the Company has not experienced customer defaults in the past, applying historic default rates in calculating ECLs, as well as considering forward-looking information, resulted in an insignificant allowance for losses.
53
The following table provides information about Cameco’s aged trade receivables as at December 31, 2020:
| Corporate customers |
Other customers |
Total | ||||||||||
| Current (not past due) |
$ | 159,280 | $ | 3,649 | 162,929 | |||||||
| 1-30 days past due |
133 | 434 | 567 | |||||||||
| More than 30 days past due |
2,043 | 515 | 2,558 | |||||||||
|
|
|
|
|
|
|
|||||||
| Total |
$ | 161,456 | $ | 4,598 | 166,054 | |||||||
|
|
|
|
|
|
|
|||||||
Liquidity risk
Financial liquidity represents Cameco’s ability to fund future operating activities and investments. Cameco ensures that there is sufficient capital in order to meet short-term business requirements, after taking into account cash flows from operations and the Company’s holdings of cash and cash equivalents. The Company believes that these sources will be sufficient to cover the likely short-term and long-term cash requirements.
The table below outlines the Company’s available debt facilities at December 31, 2020:
| Outstanding and | ||||||||||||
| Total amount | committed | Amount available | ||||||||||
| Unsecured revolving credit facility |
$ | 1,000,000 | $ | — | $ | 1,000,000 | ||||||
| Letter of credit facilities [note 13] |
1,698,340 | 1,596,488 | 101,852 | |||||||||
The tables below present a maturity analysis of Cameco’s financial liabilities, including principal and interest, based on the expected cash flows from the reporting date to the contractual maturity date:
| Carrying amount |
Contractual cash flows |
Due in less than 1 year |
Due in 1-3 years |
Due in 3-5 years |
Due after 5 years |
|||||||||||||||||||
| Accounts payable and accrued liabilities |
$ | 233,649 | $ | 233,649 | $ | 233,649 | $ | — | $ | — | $ | — | ||||||||||||
| Long-term debt |
995,541 | 1,000,000 | — | — | 500,000 | 500,000 | ||||||||||||||||||
| Foreign currency contracts |
4,733 | 4,733 | 1,658 | 3,075 | — | — | ||||||||||||||||||
| Lease obligation [note 14] |
7,951 | 8,525 | 3,657 | 3,896 | 972 | — | ||||||||||||||||||
|
|
|
|
|
|
|
|
|
|
|
|
|
|||||||||||||
| Total contractual repayments |
$ | 1,241,874 | $ | 1,246,907 | $ | 238,964 | $ | 6,971 | $ | 500,972 | $ | 500,000 | ||||||||||||
|
|
|
|
|
|
|
|
|
|
|
|
|
|||||||||||||
| Total | Due in less than 1 year |
Due in 1-3 years |
Due in 3-5 years |
Due after 5 years |
||||||||||||||||||||
| Total interest payments on long-term debt |
|
$ | 267,905 | $ | 37,840 | $ | 75,680 | $ | 44,255 | $ | 110,130 | |||||||||||||
54
Measurement of fair values
| A. | Accounting classifications and fair values |
The following tables summarize the carrying amounts and accounting classifications of Cameco’s financial instruments at the reporting date:
At December 31, 2020
| FVTPL | Amortized cost |
FVOCI - designated |
Total | |||||||||||||
| Financial assets |
||||||||||||||||
| Cash and cash equivalents |
$ | — | $ | 918,382 | $ | — | $ | 918,382 | ||||||||
| Short-term investments |
— | 24,985 | — | 24,985 | ||||||||||||
| Accounts receivable [note 6] |
— | 204,980 | — | 204,980 | ||||||||||||
| Derivative assets [note 10] |
||||||||||||||||
| Foreign currency contracts |
45,605 | — | — | 45,605 | ||||||||||||
| Investments in equity securities [note 10] |
— | — | 43,873 | 43,873 | ||||||||||||
|
|
|
|
|
|
|
|
|
|||||||||
| $ | 45,605 | $ | 1,148,347 | $ | 43,873 | $ | 1,237,825 | |||||||||
|
|
|
|
|
|
|
|
|
|||||||||
| Financial liabilities |
||||||||||||||||
| Accounts payable and accrued liabilities [note 12] |
$ | — | $ | 233,649 | $ | — | $ | 233,649 | ||||||||
| Lease obligation [note 14] |
— | 7,951 | — | 7,951 | ||||||||||||
| Derivative liabilities [note 14] |
||||||||||||||||
| Foreign currency contracts |
4,733 | — | — | 4,733 | ||||||||||||
| Long-term debt [note 13] |
— | 995,541 | — | 995,541 | ||||||||||||
|
|
|
|
|
|
|
|
|
|||||||||
| 4,733 | 1,237,141 | — | 1,241,874 | |||||||||||||
|
|
|
|
|
|
|
|
|
|||||||||
| Net |
$ | 40,872 | $ | (88,794 | ) | $ | 43,873 | $ | (4,049 | ) | ||||||
|
|
|
|
|
|
|
|
|
|||||||||
At December 31, 2019
| FVTPL | Amortized cost |
FVOCI - designated |
Total | |||||||||||||
| Financial assets |
||||||||||||||||
| Cash and cash equivalents |
$ | — | $ | 1,062,431 | $ | — | $ | 1,062,431 | ||||||||
| Accounts receivable [note 6] |
— | 328,044 | — | 328,044 | ||||||||||||
| Derivative assets [note 10] |
||||||||||||||||
| Foreign currency contracts |
8,191 | — | — | 8,191 | ||||||||||||
| Interest rate contracts |
2,313 | — | — | 2,313 | ||||||||||||
| Investments in equity securities [note 10] |
— | — | 24,408 | 24,408 | ||||||||||||
|
|
|
|
|
|
|
|
|
|||||||||
| $ | 10,504 | $ | 1,390,475 | $ | 24,408 | $ | 1,425,387 | |||||||||
|
|
|
|
|
|
|
|
|
|||||||||
| Financial liabilities |
||||||||||||||||
| Accounts payable and accrued liabilities [note 12] |
$ | — | $ | 181,799 | $ | — | $ | 181,799 | ||||||||
| Lease obligation |
— | 12,869 | — | 12,869 | ||||||||||||
| Derivative liabilities [note 14] |
||||||||||||||||
| Foreign currency contracts |
12,524 | — | — | 12,524 | ||||||||||||
| Long-term debt [note 13] |
— | 996,718 | — | 996,718 | ||||||||||||
|
|
|
|
|
|
|
|
|
|||||||||
| 12,524 | 1,191,386 | — | 1,203,910 | |||||||||||||
|
|
|
|
|
|
|
|
|
|||||||||
| Net |
$ | (2,020 | ) | $ | 199,089 | $ | 24,408 | $ | 221,477 | |||||||
|
|
|
|
|
|
|
|
|
|||||||||
55
Cameco has pledged $190,140,000 of cash as security against certain of its letter of credit facilities. This cash is being used as collateral for an interest rate reduction on the letter of credit facilities. The collateral account has a term of five years effective July 1, 2018. Cameco retains full access to this cash.
The investments in equity securities represent investments that Cameco intends to hold for the long-term for strategic purposes. As permitted by IFRS 9, these investments have been designated at the date of initial application as measured at FVOCI. The accumulated fair value reserve related to these investments will never be reclassified to profit or loss.
Cameco has not irrevocably designated a financial asset that would otherwise meet the requirements to be measured at amortized cost at FVOCI or FVTPL to eliminate or significantly reduce an accounting mismatch that would otherwise arise.
The following tables summarize the carrying amounts and fair values of Cameco’s financial instruments, including their levels in the fair value hierarchy:
As at December 31, 2020
| Fair value | ||||||||||||||||
| Carrying value | Level 1 | Level 2 | Total | |||||||||||||
| Derivative assets [note 10] |
||||||||||||||||
| Foreign currency contracts |
$ | 45,605 | $ | — | $ | 45,605 | $ | 45,605 | ||||||||
| Investments in equity securities [note 10] |
43,873 | 43,873 | — | 43,873 | ||||||||||||
| Derivative liabilities [note 14] |
||||||||||||||||
| Foreign currency contracts |
(4,733 | ) | — | (4,733 | ) | (4,733 | ) | |||||||||
| Long-term debt [note 13] |
(995,541 | ) | — | (1,173,280 | ) | (1,173,280 | ) | |||||||||
|
|
|
|
|
|
|
|
|
|||||||||
| Net |
$ | (910,796 | ) | $ | 43,873 | $ | (1,132,408 | ) | $ | (1,088,535 | ) | |||||
|
|
|
|
|
|
|
|
|
|||||||||
As at December 31, 2019
| Fair value | ||||||||||||||||
| Carrying value | Level 1 | Level 2 | Total | |||||||||||||
| Derivative assets [note 10] |
||||||||||||||||
| Foreign currency contracts |
$ | 8,191 | $ | — | $ | 8,191 | $ | 8,191 | ||||||||
| Interest rate contracts |
2,313 | — | 2,313 | 2,313 | ||||||||||||
| Investments in equity securities [note 10] |
24,408 | 24,408 | — | 24,408 | ||||||||||||
| Derivative liabilities [note 14] |
||||||||||||||||
| Foreign currency contracts |
(12,524 | ) | — | (12,524 | ) | (12,524 | ) | |||||||||
| Long-term debt [note 13] |
(996,718 | ) | — | (1,111,923 | ) | (1,111,923 | ) | |||||||||
|
|
|
|
|
|
|
|
|
|||||||||
| Net |
$ | (974,330 | ) | $ | 24,408 | $ | (1,113,943 | ) | $ | (1,089,535 | ) | |||||
|
|
|
|
|
|
|
|
|
|||||||||
The preceding tables exclude fair value information for financial instruments whose carrying amounts are a reasonable approximation of fair value. The carrying values of Cameco’s cash and cash equivalents, short-term investments, accounts receivable, and accounts payable and accrued liabilities approximate their fair values as a result of the short-term nature of the instruments.
There were no transfers between level 1 and level 2 during the period. Cameco does not have any financial instruments that are classified as level 3 as of the reporting date.
56
| B. | Financial instruments measured at fair value |
Cameco measures its derivative financial instruments, material investments in equity securities and long-term debt at fair value. Investments in publicly held equity securities are classified as a recurring level 1 fair value measurement while derivative financial instruments and long-term debt are classified as a recurring level 2 fair value measurement.
The fair value of investments in equity securities is determined using quoted share prices observed in the principal market for the securities as of the reporting date. The fair value of Cameco’s long-term debt is determined using quoted market yields as of the reporting date, which ranged from 0.3% to 1.1% (2019 - 1.7% to 1.8%).
Foreign currency derivatives consist of foreign currency forward contracts, options and swaps. The fair value of foreign currency options is measured based on the Black Scholes option-pricing model. The fair value of foreign currency forward contracts and swaps is measured using a market approach, based on the difference between contracted foreign exchange rates and quoted forward exchange rates as of the reporting date.
Interest rate derivatives consist of interest rate swap contracts. The fair value of interest rate swaps is determined by discounting expected future cash flows from the contracts. The future cash flows are determined by measuring the difference between fixed interest payments to be received and floating interest payments to be made to the counterparty based on Canada Dealer Offer Rate forward interest rate curves.
Uranium contract derivatives consist of price swaps. The fair value of uranium price swaps is determined by discounting expected future cash flows from the contracts. The future cash flows are determined by measuring the difference between fixed purchases or sales under contracted prices, and floating purchases or sales based on Numerco forward uranium price curves. The swaps were settled during 2019.
Where applicable, the fair value of the derivatives reflects the credit risk of the instrument and includes adjustments to take into account the credit risk of the Company and counterparty. These adjustments are based on credit ratings and yield curves observed in active markets at the reporting date.
Derivatives
The following table summarizes the fair value of derivatives and classification on the consolidated statements of financial position:
| 2020 | 2019 | |||||||
| Non-hedge derivatives: |
||||||||
| Foreign currency contracts |
$ | 40,872 | $ | (4,333 | ) | |||
| Interest rate contracts |
— | 2,313 | ||||||
|
|
|
|
|
|||||
| Net |
$ | 40,872 | $ | (2,020 | ) | |||
|
|
|
|
|
|||||
| Classification: |
||||||||
| Current portion of long-term receivables, investments and other [note 10] |
$ | 16,466 | $ | 4,144 | ||||
| Long-term receivables, investments and other [note 10] |
29,139 | 6,360 | ||||||
| Current portion of other liabilities [note 14] |
(1,658 | ) | (7,505 | ) | ||||
| Other liabilities [note 14] |
(3,075 | ) | (5,019 | ) | ||||
|
|
|
|
|
|||||
| Net |
$ | 40,872 | $ | (2,020 | ) | |||
|
|
|
|
|
|||||
57
The following table summarizes the different components of the gains (losses) on derivatives included in net earnings:
| 2020 | 2019 | |||||||
| Non-hedge derivatives: |
||||||||
| Foreign currency contracts |
$ | 30,600 | $ | 31,863 | ||||
| Interest rate contracts |
5,977 | 2,068 | ||||||
| Uranium contracts |
— | (1,662 | ) | |||||
|
|
|
|
|
|||||
| Net |
$ | 36,577 | $ | 32,269 | ||||
|
|
|
|
|
|||||
| 27. | Capital management |
Cameco’s management considers its capital structure to consist of bank overdrafts, long-term debt, short-term debt (net of cash and cash equivalents and short-term investments), non-controlling interest and shareholders’ equity.
Despite the impacts of COVID-19 on the global economy, Cameco’s approach to capital management has remained consistent. Cameco’s capital structure reflects its strategy and the environment in which it operates. Delivering returns to long-term shareholders is a top priority. The Company’s objective is to maximize cash flow while maintaining its investment grade rating through close capital management of our balance sheet metrics. Capital resources are managed to allow it to support achievement of its goals while managing financial risks such as the continued weakness in the market, litigation risk and refinancing risk. The overall objectives for managing capital in 2020 reflect the environment that the Company is operating in, similar to the prior comparative period.
The capital structure at December 31 was as follows:
| 2020 | 2019 | |||||||
| Long-term debt [note 13] |
995,541 | 996,718 | ||||||
| Cash and cash equivalents |
(918,382 | ) | (1,062,431 | ) | ||||
| Short-term investments |
(24,985 | ) | — | |||||
|
|
|
|
|
|||||
| Net debt |
52,174 | (65,713 | ) | |||||
|
|
|
|
|
|||||
| Non-controlling interest |
206 | 238 | ||||||
| Shareholders’ equity |
4,958,355 | 4,994,725 | ||||||
|
|
|
|
|
|||||
| Total equity |
4,958,561 | 4,994,963 | ||||||
|
|
|
|
|
|||||
| Total capital |
$ | 5,010,735 | $ | 4,929,250 | ||||
|
|
|
|
|
|||||
Cameco is bound by certain covenants in its general credit facilities. These covenants place restrictions on total debt, including guarantees and set minimum levels for net worth. As of December 31, 2020, Cameco met these requirements.
| 28. | Segmented information |
Cameco has two reportable segments: uranium and fuel services. Cameco’s reportable segments are strategic business units with different products, processes and marketing strategies. The uranium segment involves the exploration for, mining, milling, purchase and sale of uranium concentrate. The fuel services segment involves the refining, conversion and fabrication of uranium concentrate and the purchase and sale of conversion services.
Cost of sales in the uranium segment includes care and maintenance costs for our operations that currently have production suspensions. Cameco expensed $195,972,000 (2019 - $153,924,000) of care and maintenance costs during the year. Included in this amount in 2020 is $45,988,000 relating to care and maintenance costs for operations suspended as a result of COVID-19. Also included in cost of sales, because of the Cigar Lake production suspension, is the impact of increased purchasing activity at a higher cost than produced pounds. This had a negative impact on gross profit in the uranium segment.
58
Cost of sales in the fuel services segment also includes care and maintenance costs for our operations that have had production suspensions as a result of COVID-19. Cameco expensed $8,992,000 in 2020 due to the suspension.
Accounting policies used in each segment are consistent with the policies outlined in the summary of significant accounting policies. Segment revenues, expenses and results include transactions between segments incurred in the ordinary course of business. These transactions are priced on an arm’s length basis, are eliminated on consolidation and are reflected in the “other” column.
| A. | Business segments - 2020 |
For the year ended December 31, 2020
| Uranium | Fuel services |
Other | Total | |||||||||||||
| Revenue |
$ | 1,411,770 | $ | 377,296 | $ | 11,007 | $ | 1,800,073 | ||||||||
| Expenses |
||||||||||||||||
| Cost of products and services sold |
1,244,049 | 237,656 | 3,257 | 1,484,962 | ||||||||||||
| Depreciation and amortization |
154,560 | 43,190 | 10,912 | 208,662 | ||||||||||||
|
|
|
|
|
|
|
|
|
|||||||||
| Cost of sales |
1,398,609 | 280,846 | 14,169 | 1,693,624 | ||||||||||||
|
|
|
|
|
|
|
|
|
|||||||||
| Gross profit (loss) |
13,161 | 96,450 | (3,162 | ) | 106,449 | |||||||||||
| Administration |
— | — | 145,344 | 145,344 | ||||||||||||
| Exploration |
10,873 | — | — | 10,873 | ||||||||||||
| Research and development |
— | — | 3,965 | 3,965 | ||||||||||||
| Other operating expense |
23,921 | — | — | 23,921 | ||||||||||||
| Loss on disposal of assets |
667 | 405 | — | 1,072 | ||||||||||||
| Finance costs |
— | — | 96,133 | 96,133 | ||||||||||||
| Gain on derivatives |
— | — | (36,577 | ) | (36,577 | ) | ||||||||||
| Finance income |
— | — | (10,835 | ) | (10,835 | ) | ||||||||||
| Share of earnings from equity-accounted investee |
(36,476 | ) | — | — | (36,476 | ) | ||||||||||
| Other income |
(202 | ) | — | (51,238 | ) | (51,440 | ) | |||||||||
|
|
|
|
|
|
|
|
|
|||||||||
| Earnings (loss) before income taxes |
14,378 | 96,045 | (149,954 | ) | (39,531 | ) | ||||||||||
| Income tax expense |
13,666 | |||||||||||||||
|
|
|
|||||||||||||||
| Net loss |
(53,197 | ) | ||||||||||||||
|
|
|
|
|
|
|
|
|
|||||||||
| Capital expenditures for the year |
$ | 46,697 | $ | 30,760 | $ | 5 | $ | 77,462 | ||||||||
|
|
|
|
|
|
|
|
|
|||||||||
59
For the year ended December 31, 2019
| Uranium | Fuel services |
Other | Total | |||||||||||||
| Revenue |
$ | 1,413,809 | $ | 370,277 | $ | 78,839 | $ | 1,862,925 | ||||||||
| Expenses |
||||||||||||||||
| Cost of products and services sold |
1,041,922 | 234,423 | 69,206 | 1,345,551 | ||||||||||||
| Depreciation and amortization |
218,832 | 45,856 | 11,061 | 275,749 | ||||||||||||
|
|
|
|
|
|
|
|
|
|||||||||
| Cost of sales |
1,260,754 | 280,279 | 80,267 | 1,621,300 | ||||||||||||
|
|
|
|
|
|
|
|
|
|||||||||
| Gross profit (loss) |
153,055 | 89,998 | (1,428 | ) | 241,625 | |||||||||||
| Administration |
— | — | 124,869 | 124,869 | ||||||||||||
| Exploration |
13,686 | — | — | 13,686 | ||||||||||||
| Research and development |
— | — | 6,058 | 6,058 | ||||||||||||
| Other operating expense |
2,732 | — | — | 2,732 | ||||||||||||
| Loss on disposal of assets |
1,869 | — | — | 1,869 | ||||||||||||
| Finance costs |
— | — | 98,622 | 98,622 | ||||||||||||
| Gain on derivatives |
— | — | (32,269 | ) | (32,269 | ) | ||||||||||
| Finance income |
— | — | (29,760 | ) | (29,760 | ) | ||||||||||
| Share of earnings from equity-accounted investee |
(45,360 | ) | — | — | (45,360 | ) | ||||||||||
| Other expense (income) |
(52,801 | ) | — | 18,961 | (33,840 | ) | ||||||||||
|
|
|
|
|
|
|
|
|
|||||||||
| Earnings (loss) before income taxes |
232,929 | 89,998 | (187,909 | ) | 135,018 | |||||||||||
| Income tax expense |
61,077 | |||||||||||||||
|
|
|
|||||||||||||||
| Net earnings |
73,941 | |||||||||||||||
|
|
|
|
|
|
|
|
|
|||||||||
| Capital expenditures for the year |
$ | 48,092 | $ | 27,117 | $ | 2 | $ | 75,211 | ||||||||
|
|
|
|
|
|
|
|
|
|||||||||
| B. | Geographic segments |
Revenue is attributed to the geographic location based on the location of the entity providing the services. The Company’s revenue from external customers is as follows:
| 2020 | 2019 | |||||||
| United States |
$ | 1,177,756 | $ | 1,295,195 | ||||
| Canada |
622,317 | 567,730 | ||||||
|
|
|
|
|
|||||
| $ | 1,800,073 | $ | 1,862,925 | |||||
|
|
|
|
|
|||||
The Company’s non-current assets, excluding deferred tax assets and financial instruments, by geographic location are as follows:
| 2020 | 2019 | |||||||
| Canada |
$ | 3,260,144 | $ | 3,267,376 | ||||
| Australia |
421,836 | 392,500 | ||||||
| United States |
145,328 | 121,102 | ||||||
| Kazakhstan |
55 | 80 | ||||||
| Germany |
16 | 24 | ||||||
|
|
|
|
|
|||||
| $ | 3,827,379 | $ | 3,781,082 | |||||
|
|
|
|
|
|||||
60
| C. | Major customers |
Cameco relies on a small number of customers to purchase a significant portion of its uranium concentrates and uranium conversion services. During 2020, revenues from two customers of Cameco’s uranium and fuel services segments represented approximately $457,560,000 (2019 - $422,740,000), approximately 25% (2019 - 24%) of Cameco’s total revenues from these segments. As customers are relatively few in number, accounts receivable from any individual customer may periodically exceed 10% of accounts receivable depending on delivery schedule.
| 29. | Group entities |
The following are the principal subsidiaries and associates of the Company:
| Principal place | Ownership interest | |||||||||||
| of business | 2020 | 2019 | ||||||||||
| Subsidiaries: |
||||||||||||
| Cameco Fuel Manufacturing Inc. |
Canada | 100 | % | 100 | % | |||||||
| Cameco Marketing Inc. |
Canada | 100 | % | 100 | % | |||||||
| Cameco Inc. |
US | 100 | % | 100 | % | |||||||
| Power Resources, Inc. |
US | 100 | % | 100 | % | |||||||
| Crow Butte Resources, Inc. |
US | 100 | % | 100 | % | |||||||
| NUKEM, Inc. |
US | 100 | % | 100 | % | |||||||
| Cameco Australia Pty. Ltd. |
Australia | 100 | % | 100 | % | |||||||
| Cameco Europe Ltd. |
Switzerland | 100 | % | 100 | % | |||||||
| Associates: |
||||||||||||
| JV Inkai |
Kazakhstan | 40 | % | 40 | % | |||||||
| 30. | Joint operations |
Cameco conducts a portion of its exploration, development, mining and milling activities through joint operations located around the world. Operations are governed by agreements that provide for joint control of the strategic operating, investing and financing activities among the partners. These agreements were considered in the determination of joint control. Cameco’s significant Canadian uranium joint operation interests are McArthur River, Key Lake and Cigar Lake. The Canadian uranium joint operations allocate uranium production to each joint operation participant and the joint operation participant derives revenue directly from the sale of such product. Mining and milling expenses incurred by joint operations are included in the cost of inventory.
61
Cameco reflects its proportionate interest in these assets and liabilities as follows:
| Principal place | ||||||||||||||||
| of business | Ownership | 2020 | 2019 | |||||||||||||
| Total assets |
||||||||||||||||
| McArthur River |
Canada | 69.81 | % | $ | 1,027,617 | $ | 1,046,556 | |||||||||
| Key Lake |
Canada | 83.33 | % | 560,845 | 524,324 | |||||||||||
| Cigar Lake |
Canada | 50.03 | % | 1,327,956 | 1,354,399 | |||||||||||
|
|
|
|
|
|||||||||||||
| $ | 2,916,418 | $ | 2,925,279 | |||||||||||||
|
|
|
|
|
|||||||||||||
| Total liabilities |
||||||||||||||||
| McArthur River |
69.81 | % | $ | 34,597 | $ | 32,132 | ||||||||||
| Key Lake |
83.33 | % | 278,331 | 227,562 | ||||||||||||
| Cigar Lake |
50.03 | % | 46,604 | 47,396 | ||||||||||||
|
|
|
|
|
|||||||||||||
| $ | 359,532 | $ | 307,090 | |||||||||||||
|
|
|
|
|
|||||||||||||
| 31. | Related parties |
| A. | Transactions with key management personnel |
Key management personnel are those persons that have the authority and responsibility for planning, directing and controlling the activities of the Company, directly or indirectly. Key management personnel of the Company include executive officers, vice-presidents, other senior managers and members of the board of directors.
In addition to their salaries, Cameco also provides non-cash benefits to executive officers and vice-presidents and contributes to pension plans on their behalf (note 25). Senior management and directors also participate in the Company’s share-based compensation plans (note 24).
Executive officers are subject to terms of notice ranging from three to six months. Upon resignation at the Company’s request, they are entitled to termination benefits of up to the lesser of 18 to 24 months or the period remaining until age 65. The termination benefits include gross salary plus the target short-term incentive bonus for the year in which termination occurs.
Compensation for key management personnel was comprised of:
| 2020 | 2019 | |||||||
| Short-term employee benefits |
$ | 21,676 | $ | 21,225 | ||||
| Share-based compensation(a) |
26,230 | 12,034 | ||||||
| Post-employment benefits |
6,041 | 5,542 | ||||||
| Termination benefits |
430 | 272 | ||||||
|
|
|
|
|
|||||
| Total |
$ | 54,377 | $ | 39,073 | ||||
|
|
|
|
|
|||||
| (a) | Excludes deferred share units held by directors (see note 24). |
| B. | Other related party transactions |
Cameco funded JV Inkai’s project development costs through an unsecured shareholder loan. The limit of the loan facility was $175,000,000 (US) and advances under the facility bore interest at a rate of LIBOR plus 2%. At December 31, 2020, there was no balance outstanding as the loan was fully repaid in 2019. For the year ended December 31, 2019, Cameco recorded interest income of $1,878,000 relating to this balance.
Cameco purchases uranium concentrates from JV Inkai. For the year ended December 31, 2020, Cameco had purchases of $148,169,000 ($111,886,000 (US)) (2019 - $112,861,000 ($84,827,000 (US))). Cameco received a cash dividend from JV Inkai of $54,404,000 ($40,621,000 (US)) (2019 - $14,079,000 ($10,635,000 (US))).
62
| 32. | Comparative Figures |
Certain prior year balances have been reclassified to conform to the current financial statement presentation.
63

Management’s discussion and analysis
February 10, 2021
| 8 | 2020 PERFORMANCE HIGHLIGHTS | |
| 13 | MARKET OVERVIEW AND DEVELOPMENTS | |
| 18 | OUR STRATEGY | |
| 25 | OUR APPROACH TO ESG MATTERS | |
| 31 | MEASURING OUR RESULTS | |
| 33 | FINANCIAL RESULTS | |
| 62 | OPERATIONS AND PROJECTS | |
| 86 | MINERAL RESERVES AND RESOURCES | |
| 91 |
ADDITIONAL INFORMATION | |
This management’s discussion and analysis (MD&A) includes information that will help you understand management’s perspective of our audited consolidated financial statements (financial statements) and notes for the year ended December 31, 2020. The information is based on what we knew as of February 9, 2021.
We encourage you to read our audited consolidated financial statements and notes as you review this MD&A. You can find more information about Cameco, including our financial statements and our most recent annual information form, on our website at cameco.com, on SEDAR at sedar.com or on EDGAR at sec.gov. You should also read our annual information form before making an investment decision about our securities.
The financial information in this MD&A and in our financial statements and notes are prepared according to International Financial Reporting Standards (IFRS), unless otherwise indicated.
Unless we have specified otherwise, all dollar amounts are in Canadian dollars.
Throughout this document, the terms we, us, our, the Company and Cameco mean Cameco Corporation and its subsidiaries, unless otherwise indicated.
Caution about forward-looking information
Our MD&A includes statements and information about our expectations for the future. When we discuss our strategy, plans, future financial and operating performance, or other things that have not yet taken place, we are making statements considered to be forward-looking information or forward-looking statements under Canadian and United States (US) securities laws. We refer to them in this MD&A as forward-looking information.
Key things to understand about the forward-looking information in this MD&A:
| • | It typically includes words and phrases about the future, such as: anticipate, believe, estimate, expect, plan, will, intend, goal, target, forecast, project, strategy and outlook (see examples below). |
| • | It represents our current views and can change significantly. |
| • | It is based on a number of material assumptions, including those we have listed on pages 3 and 4, which may prove to be incorrect. |
| • | Actual results and events may be significantly different from what we currently expect, due to the risks associated with our business. We list a number of these material risks on page 3. We recommend you also review our most recent annual information form, which includes a discussion of other material risks that could cause actual results to differ significantly from our current expectations. |
| • | Forward-looking information is designed to help you understand management’s current views of our near- and longer-term prospects, and it may not be appropriate for other purposes. We will not necessarily update this information unless we are required to by securities laws. |
Examples of forward-looking information in this MD&A
| 2 | CAMECO CORPORATION |
Material risks
| MANAGEMENT’S DISCUSSION AND ANALYSIS | 3 |
| 4 | CAMECO CORPORATION |
[This page is intentionally left blank.]
| MANAGEMENT’S DISCUSSION AND ANALYSIS | 5 |
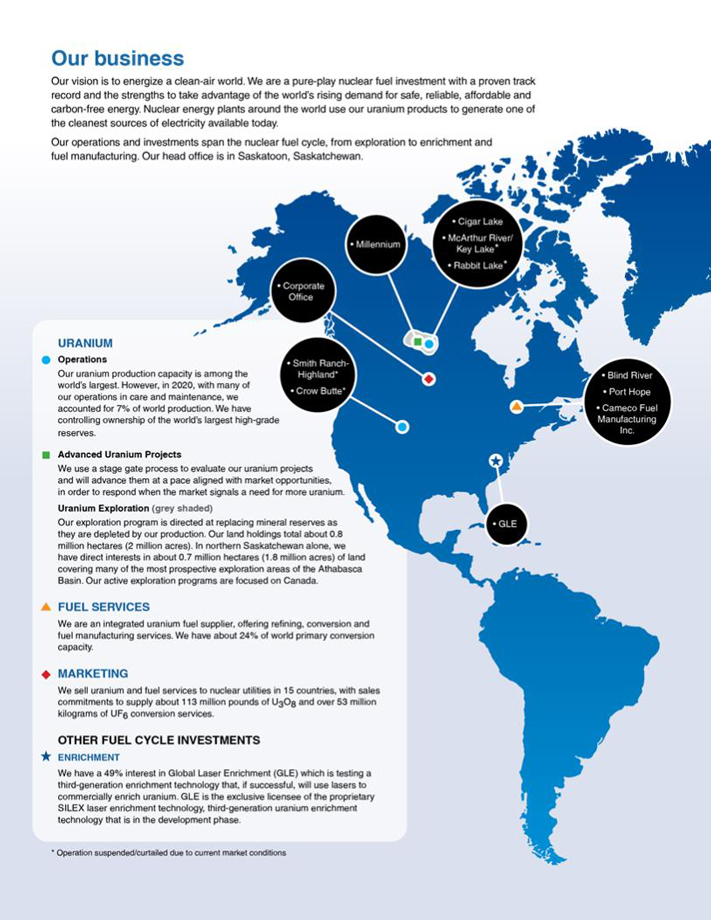
| 6 | CAMECO CORPORATION |
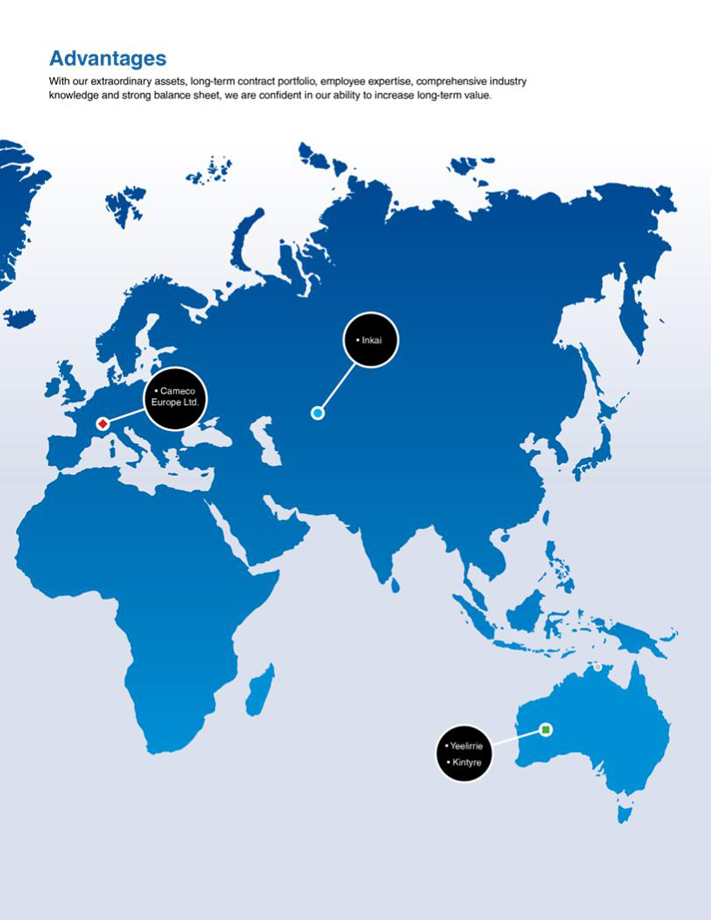
| MANAGEMENT’S DISCUSSION AND ANALYSIS | 7 |
2020 performance highlights
In 2020, the world experienced unprecedented and challenging times due to the impact of the Coronavirus (COVID-19) pandemic. Consistent with our values, the health and safety of our workers, their families and their communities was our priority in 2020. Following the precautions and restrictions enacted by all levels of government where we operate, and considering the unique circumstances at each of our operating sites, we proactively implemented a number of measures and made a number of decisions to ensure a safe working environment for all our workers and to help slow down the spread of the virus. In addition to all of the safety protocols we put in place, we:
| • | suspended production at Cigar Lake, twice. The first suspension ran approximately five months from late March through the end of August. The second suspension was announced in mid-December and continues into 2021. |
| • | suspended production at the Port Hope UF6 conversion plant and at the Blind River refinery in April for approximately four weeks |
| • | withdrew our 2020 outlook |
| • | continued to pay all our employees |
| • | set up and awarded COVID-19 Relief Funds totaling $1.25 million to support our northern Saskatchewan and Ontario communities impacted by the virus |
| • | delivered 1,200 care packages containing essential supplies that residents of remote northern communities were having difficulty obtaining and provided significant numbers of personal protective equipment (masks, gloves and hand sanitizer) to these same communities |
| • | provided personal protective equipment (PPE) to Port Hope and Blind River hospitals and police services in Ontario |
Through all of the disruptions to our business, we continued to do what we said we would do, executing on all strategic fronts; operational, marketing and financial. Demand for our products remained strong and we delivered 30.6 million pounds of uranium to our customers. We generated $57 million in cash from operations, with higher average realized prices in our uranium and fuel services segments than in 2019. However, as a result of the precautionary production suspensions at our operations due to the COVID-19 pandemic, we produced only 5 million pounds in our uranium segment, well below our committed sales. To manage risk we purchased 11.5 million pounds more uranium than the top end of the 2020 outlook disclosed in our 2019 annual MD&A at an average annual cost of $40.41 per pound, totalling about $465 million, compared to the Cigar Lake expected life-of-mine cash operating costs of between $15 to $16 per pound. Additionally, due to the temporary suspensions we incurred $55 million more in care and maintenance costs than those we had planned for. Even while production was suspended, we kept and continued to pay all our employees. Partially off-setting these additional costs was the receipt of about $37 million under the Canada Emergency Wage Subsidy program and volatility in foreign exchange rates that resulted in foreign exchange gains.
On the contracting front, long-term contracting was delayed in 2020 due to ongoing market-access and trade policy issues and the impact of the COVID-19 pandemic on our customers’ operations. However, in our uranium segment, we were successful in adding 12.5 million pounds to our portolio of long-term uranium contracts. Market signals will take time to impact contracting in our business as we have seen with the transition in our fuel services segment. With our pipeline of uranium business continuing to grow and being larger than we have seen since 2011, we are being patient to capture as much value as possible in our contract portfolio. We continue to see off-market interest, which we believe tends to be a leading indicator of broader demand for long-term contracting. In our fuel services segment, we had a very successful year, replacing the volumes we delivered under contract and adding another 17.1 million kilograms of UF6 to our long-term contract portfolio that reflect the price transition that began in 2017 in the conversion market, and that we expect will allow us to continue to profitably operate and consistently support the long-term fuel services needs of our customers.
| 8 | CAMECO CORPORATION |
Thanks to the disciplined execution of our strategy, our balance sheet is strong and we expect it will enable us to see out our strategy as well as self-manage risk. As of December 31, 2020, we had $943 million in cash and short-term investments and $1.0 billion in long-term debt. During the year, the impacts of the COVID-19 pandemic caused disruptions to global financial markets, and incented government stimulus packages and significant interest rate reductions. On October 21, 2020, consistent with our conservative financial management, and to take advantage of the low interest rate environment resulting from the COVID-19 pandemic, we issued debentures in the amount of $400 million, at an interest rate of 2.95% per annum and used the proceeds to redeem our outstanding $400 million debenture bearing interest of 3.75%, resetting the maturity from 2022 to 2027 and extending our maturity profile. The early redemption resulted in a cost of $24 million. Our next maturity is in 2024. In addition, we have a $1.0 billion undrawn credit facility.
We also received a unanimous decision in our favour from the Federal Court of Appeal (Court of Appeal) in our dispute with Canada Revenue Agency (CRA). The decision upholds the September 26, 2018 decision of the Tax Court of Canada (Tax Court), which was unequivocally in our favour for the 2003, 2005 and 2006 tax years and it sustains the corresponding decision on the cost award. We believe the principles in the decision apply to all tax years subsequent to 2006. CRA has made an application to the Supreme Court of Canada (Supreme Court) to seek leave to appeal the decision of the Court of Appeal. The Supreme Court will decide whether to hear the appeal or decline CRA’s request for leave. If the appeal is heard, we estimate that it could take until the second half of 2022 before a decision is rendered by the Supreme Court.
The COVID-19 pandemic has disrupted global uranium production, adding to the supply curtailments that have occurred in the industry for many years. The duration and extent of these disruptions are still not fully known. The uranium spot price increased by more than 35% following announcement of the initial supply disruptions due to the COVID-19 pandemic in March and April, reaching a high of about $34 (US) per pound in 2020. The average uranium spot price ended the year at $30.20 per pound (US) more than 20% higher than the average uranium spot price at the end of 2019.
Around the globe there is an increasing focus on electrification for various reasons. There are countries looking to install baseload power, while others are looking for a reliable replacement to fossil fuel sources, and finally, there is new demand for things such as the electrification of transportation. This is occurring at precisely the same time that countries and companies around the world are committing to net-zero carbon targets. This has led to the recognition, from a policy point of view, that nuclear will be needed in the toolbox to sustainably achieve electrification and decarbonization goals.
In the current environment, we believe the risk to uranium supply is greater than the risk to uranium demand and expect it will create a renewed focus on ensuring availability of long-term supply to fuel nuclear reactors. Over time, we expect this renewed focus on security of supply will provide the market signals producers need. We are taking the steps today and incurring the costs that we believe will allow us to restart our tier-one assets with more flexibility in the production rate, eliminate the care and maintenance costs incurred while our tier-one production is suspended and to benefit from the favourable life-of-mine economics our assets provide. Throughout, we will continue to focus on delivering our products responsibly and addressing the environmental, social and governance (ESG) risks and opportunities that we believe will make our business sustainable and will build long-term value.
Financial performance
| HIGHLIGHTS | ||||||||||||
| DECEMBER 31 ($ MILLIONS EXCEPT WHERE INDICATED) |
2020 | 2019 | CHANGE | |||||||||
| Revenue |
1,800 | 1,863 | (3) | % | ||||||||
| Gross profit |
106 | 242 | (56) | % | ||||||||
| Net earnings (loss) attributable to equity holders |
(53) | 74 | >(100 | %) | ||||||||
| $ per common share (diluted) |
(0.13) | 0.19 | >(100 | %) | ||||||||
| Adjusted net earnings (loss) (non-IFRS, see page 35) |
(66) | 41 | >(100 | %) | ||||||||
| $ per common share (adjusted and diluted) |
(0.17) | 0.10 | >(100 | %) | ||||||||
| Cash provided by operations (after working capital changes) |
57 | 527 | (89) | % | ||||||||
Net earnings attributable to equity holders (net earnings) and adjusted net earnings were lower in 2020 compared to 2019. See 2020 consolidated financial results beginning on page 34 for more information. Of note:
| • | generated $57 million in cash from operations |
| MANAGEMENT’S DISCUSSION AND ANALYSIS | 9 |
| • | incurred $196 million in care and maintenance costs as a result of our strategic decisions, including $55 million due to the precautionary operational decisions made to deal with the risks posed by the COVID-19 pandemic |
| • | received $37 million under the Canada Emergency Wage Subsidy program |
| • | issued debentures in the amount of $400 million, at an interest rate of 2.95% per annum and used the proceeds to redeem our outstanding $400 million debenture bearing interest of 3.75%, resetting the maturity from 2022 to 2027 and resulting in an early redemption fee of $24 million |
| • | received a unanimous decision in our favour from the Federal Court of Appeal in our dispute with CRA. See Transfer pricing dispute on page 39 for more information. |
Our segment updates
In our uranium segment, we continue to execute our strategy. In addition, we have made a number of proactive decisions in response to the risks posed by the COVID-19 pandemic and to ensure a safe working environment for all our workers which has had an impact on our operations. Of note:
| • | continued the production suspension at McArthur River/Key Lake, removing 18 million pounds per year (100% basis) from the market |
| • | suspended production at Cigar Lake, twice. The first suspension ran approximately five months from late March through the end of August. The second suspension was announced in mid-December and continues into 2021. |
| • | annual production of 5.0 million pounds was 44% lower than in 2019, and below the outlook provided in our 2019 annual MD&A due to the impacts of the COVID-19 pandemic on our operations |
| • | purchased 33.5 million pounds of uranium, including our spot purchases, committed purchase volumes, JV Inkai purchases and the purchase of our NUKEM subsidiary’s excess inventory |
| • | delivered on our sales commitments of 30.6 million pounds |
Production in 2020 from our fuel services segment was 12% lower than in 2019, as a result of production disruptions due to the COVID-19 pandemic. We suspended production at the Port Hope UF6 conversion plant and at the Blind River refinery in April for approximately four weeks.
See Operations and projects beginning on page 62 for more information.
| HIGHLIGHTS |
2020 | 2019 | CHANGE | |||||||||||||
| Uranium |
Production volume (million lbs) | 5.0 | 9.0 | (44 | )% | |||||||||||
| Sales volume (million lbs) | 30.6 | 31.5 | (3 | )% | ||||||||||||
| Average realized price | ($US/lb) | 34.39 | 33.77 | 2 | % | |||||||||||
| ($Cdn/lb) | 46.14 | 44.85 | 3 | % | ||||||||||||
| Revenue ($ millions) | 1,412 | 1,414 | — | |||||||||||||
| Gross profit ($ millions) | 13 | 153 | (92 | )% | ||||||||||||
| Fuel services |
Production volume (million kgU) | 11.7 | 13.3 | (12 | )% | |||||||||||
| Sales volume (million kgU) | 13.5 | 14.1 | (4 | )% | ||||||||||||
| Average realized price | ($Cdn/kgU) | 27.89 | 26.21 | 6 | % | |||||||||||
| Revenue ($ millions) | 377 | 370 | 2 | % | ||||||||||||
| Gross profit ($ millions) | 96 | 90 | 7 | % | ||||||||||||
| 10 | CAMECO CORPORATION |
Industry prices
| 2020 | 2019 | CHANGE | ||||||||||
| Uranium ($US/lb U3O8)1 |
||||||||||||
| Average annual spot market price |
29.96 | 25.64 | 17 | % | ||||||||
| Average annual long-term price |
34.63 | 31.75 | 9 | % | ||||||||
| Fuel services ($US/kgU as UF6)1 |
||||||||||||
| Average annual spot market price |
||||||||||||
| North America |
21.94 | 18.27 | 20 | % | ||||||||
| Europe |
21.09 | 18.12 | 16 | % | ||||||||
| Average annual long-term price |
||||||||||||
| North America |
18.27 | 16.73 | 9 | % | ||||||||
| Europe |
18.18 | 16.63 | 9 | % | ||||||||
Note: the industry does not publish UO2 prices.
| 1 | Average of prices reported by TradeTech and UxC, LLC (UxC) |
On the spot market, where purchases call for delivery within one year, the volume reported by UxC for 2020 was approximately 92.2 million pounds U3O8 equivalent, compared to 64.3 million pounds U3O8 equivalent in 2019. The 2020 total surpassed the previous annual record of 88.7 million pounds U3O8 equivalent in 2018. Non-utility purchases made up a significant portion of the 2020 spot market activity. Spot market volumes were significant in the second quarter of the year due to unplanned uranium supply disruptions resulting from the COVID-19 pandemic, then slowed through the balance of 2020. At the end of 2020, the average reported spot price was $30.20 (US) per pound, up $5.27 (US) per pound from the end of 2019. During the year, the uranium spot price ranged from a high of $33.93 (US) per pound to a low of $24.63 (US) per pound, averaging $29.96 (US) for the year.
Long-term contracts usually call for deliveries to begin more than two years after the contract is finalized, and use a number of pricing formulas, including fixed prices escalated over the term of the contract, and market referenced prices (spot and long-term indicators) quoted near the time of delivery. While 2020 saw resolution to a number of geopolitical issues, including recommendations from the Nuclear Fuel Working Group and the extension of the Russian Suspension Agreement, term volumes were the lowest since 2013. The volume of long-term contracting reported by UxC for 2020 was about 53 million pounds U3O8 equivalent, down from about 95.8 million pounds U3O8 equivalent in 2019. Lower volumes can be attributed in part to utilities focusing on operational safety amidst the COVID-19 pandemic. The average reported long-term price at the end of the year was $35.00 (US) per pound, up $2.50 (US) from 2019.
With continued uncertainty related to the COVID-19 pandemic and ongoing trade matters, we expect contracting in 2021 could remain largely discretionary.
While the average reported spot price for North American delivery at the end of 2020 was $21.75 (US) per kilogram uranium as UF6 (US/kgU as UF6), down $0.38 (US) from the end of 2019, spot UF6 conversion prices reached record highs in both the North American and European markets during the year. Long-term UF6 conversion prices finished 2020 at $19.00 (US/kgU as UF6), up $0.87 (US) from the end of 2019.
| MANAGEMENT’S DISCUSSION AND ANALYSIS | 11 |
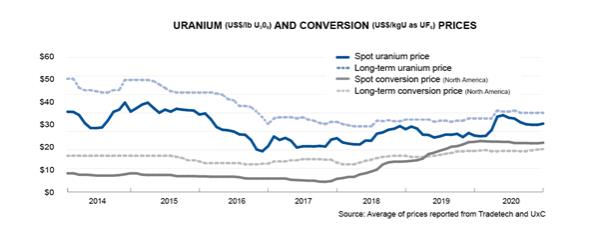
| 12 | CAMECO CORPORATION |
Market overview and developments
Growing confidence
In 2020, the COVID-19 pandemic disrupted global uranium production which added to the planned supply curtailments that have occurred in the industry for several years. The duration and extent of these disruptions are still not fully known. As a result, there was significant demand from producers – including Cameco – in the spot market to cover both the planned and unplanned reductions in primary supply. In contrast, long-term contracting was significantly reduced compared to 2019 as utilities focused on ensuring the safety of their employees and keeping their nuclear plants running to support the critical infrastructure needed throughout the pandemic. In addition, market access and trade policy issues continued to top the list of factors affecting the market in 2020. These issues created uncertainty and consumed a significant amount of time and focus from utilities during the year. The volume of uranium executed under long-term contracts was well below annual consumption levels, accelerating the inventory destocking that was already underway in the industry and adding to the growing wedge of uncovered requirement that we believe will need to be filled at a time when the availability of sufficient supply is not guaranteed. We expect a renewed focus on security of supply will provide the market signals producers need and we have growing confidence that the uranium market will undergo the same transition that is occurring in the conversion and enrichment markets.
Supply is not guaranteed
Low uranium prices, government-driven trade policies, and the COVID-19 pandemic continued to have an impact on the security of supply in our industry. In addition to the decisions many producers, including the lowest-cost producers, have made to preserve long-term value by leaving uranium in the ground, there have been a number of unplanned supply disruptions related to the impact of the COVID-19 pandemic on uranium mining and processing activities. Uranium is a highly trade-dependent commodity, and adding to security of supply concerns is the role of commercial and state-owned entities in the uranium market, and trade policies that highlight the disconnect between where uranium is produced and where it is consumed. About 80% of primary production is in the hands of state-owned enterprises, after taking into account the cuts to primary production that have occurred over the last several years. Furthermore, about 80% of primary production comes from countries that consume little-to-no uranium, and nearly 90% of uranium consumption occurs in countries that have little-to-no primary production. As a result, government-driven trade policies can be particularly disruptive for the uranium market. Some of the more significant supply and trade policy developments in 2020 and to-date are:
| • | Unplanned production disruptions at various production facilities due to the COVID-19 pandemic, including at the Cigar Lake mine and the McClean Lake mill, and across all uranium mines in Kazakhstan resulted in 2020 global uranium production being down about 15% compared to 2019 and led to an increase in spot market purchases by producers. Production in 2020 represented the lowest annual production since 2008, accounting for only 77% of reactor requirements. |
| • | Kazatomprom (KAP) reaffirmed its intention to maintain its aggregate production reduction of 20% compared to planned levels under subsoil use contracts in 2021, with no additional production planned to replace the volumes lost in 2020 resulting from measures taken to combat COVID-19. It also announced its plan to extend the 20% reduction through 2022. KAP said full implementation of its decision would remove up to 14.3 million pounds U3O8 from 2022 expected global primary supply. |
| • | During the year, KAP offered a secondary placement of its shares, increasing publicly-traded share capital from 15% to 18.8%. |
| • | China General Nuclear Power Group is expected to acquire a 49% stake in Ortalyk LLP. This KAP subsidiary holds the Central Mynkuduk in situ recovery (ISR) mine with a capacity of about 5.2 million pounds U3O8 per year and the planned Zhalpak ISR mine with expected capacity of 1.95 million pounds U3O8 per year, subject to obtaining regulatory and government approvals. |
| • | In December, the US Congress approved an omnibus spending bill for fiscal 2021, which will provide nearly $1.5 billion (US) in spending for nuclear programs. Notably it includes initial funding of $75 million (US) for the creation of a national uranium reserve. This funding, which was a primary recommendation in a strategy report released in April by the US Nuclear Fuel Working Group, opens the door for the US government to purchase domestically produced uranium and UF6 to guard against potential commercial and national security risks as a result of the country’s near-total reliance on foreign imports. |
| MANAGEMENT’S DISCUSSION AND ANALYSIS | 13 |
| • | The American Nuclear Infrastructure Act, a bipartisan U.S. Senate bill, was approved in December, though full review is not expected until the next US Congress in 2021. The bill addresses national security, economic, and climate change elements related to the nuclear sector. |
| • | An amendment to the Russian Suspension Agreement (RSA) was signed that extends the agreement from January 1, 2021 through December 31, 2040 and provides a clear set of rules around access to the US nuclear energy sector by Russian nuclear fuel suppliers. Since 1992, the importation of Russian uranium products in the US has been subject to a quota under the US-Russia Agreement Suspending the Antidumping Investigation on Uranium from the Russian Federation (the Russian Suspension Agreement). The amendment reduces the average overall quota and introduces caps, which will reduce the amount of Russian uranium, conversion and enrichment supplied to the US over the long-term. The amendment also includes important new provisions to ensure that all Russian origin uranium must be counted against the quota even if it is imported after further processing in other countries. |
| • | BHP indicated that the economics for its expansion plans at the Olympic Dam mine (ODM) were challenging, and that it has decided not to proceed with the expansion at this time. ODM currently produces approximately 8 million pounds U3O8 per year and the expansion was projected to increase its annual uranium production up to as much as 14 million pounds. |
| • | Energy Resources of Australia Ltd. announced on January 8, 2021 that processing operations have officially been discontinued at the Ranger uranium mine in the Northern Territory of Australia. The mine had averaged about 4 million pounds U3O8 in recent years and this shutdown concludes over 35 years of production. |
| • | The board of directors of Orano’s Cominak mine announced that the mine will shut down in March 2021 due to depletion of reserves. The mine had been producing about 3 million pounds U3O8 in recent years. |
Demand has recovered and is growing
The demand gap left by forced and premature nuclear reactor shutdowns since March of 2011 was filled in 2018. According to the International Atomic Energy Agency there are currently 443 reactors operating globally and 52 reactors under construction. With a number of reactor construction projects recently approved, and many more planned, the demand for uranium is growing. This growth is largely occurring in Asia and the Middle East. Some of this growth is tempered by early reactor retirements, plans for reduced reliance on nuclear, or phase-out policies in other regions. In addition, the COVID-19 pandemic is expected to have a negative impact on global energy demand in the near term. For 2020, the International Energy Agency (IEA) expects global electricity demand to fall by 5% over 2019 with nuclear declining by 2.5% due to lower demand and delays for planned maintenance and construction of several projects. However, there is growing focus on electrification and an increasing recognition of the role nuclear power must play in providing safe, reliable, affordable carbon-free baseload electricity and achieving a low-carbon economy. Momentum is also building for non-traditional commercial uses of nuclear power such as development of small modular reactors and advanced reactors, with numerous companies and countries pursuing projects. With the ongoing challenges posed by the COVID-19 pandemic, many governments will continue to rely on nuclear plants as part of the critical infrastructure needed to guarantee the availability of 24-hour power. Some of the more significant demand developments in 2020 and to-date are:
| • | Many countries, US states, and utilities announced net-zero carbon targets in 2020. While most of these targets are further out in the future, many of the plans include an important role for nuclear. For example, a study suggests that for China to achieve its net-zero target by 2060, will require a 382% increase in nuclear power from 2025 levels. |
| • | In the US, President Biden’s campaign included positive statements about the need to maintain the existing nuclear power fleet and to build advanced reactors as part of an overall shift to non-emitting carbon power sources. |
| • | Exelon announced plans to close its Byron and Dresden nuclear plants in Illinois in 2021, pointing to economics challenged by declining energy prices and market rules. |
| • | Energy Harbor is facing challenges as a state law providing subsidies to its two nuclear plants in Ohio, Davis Besse and Perry, is now in question due to a lobbying and bribery scandal. |
| • | In China, one new reactor began commercial operations in 2020 and two new reactor construction starts were recorded. A fourth power company, China Huaneng Group, was licensed to operate nuclear reactors in China. |
| • | China’s 14th Five-Year Plan and related policy documents covering the 2021-2025 period is ongoing, and publication of the plan is expected in March 2021. |
| 14 | CAMECO CORPORATION |
| • | In Japan, many of the nine restarted reactors were off-line for a period of time for maintenance outages and antiterrorism upgrades. However, Kyushu’s Genkai 3 and Sendai 1 and 2, and Kansai’s Ohi 4 have restarted and are operating after meeting the new standards. Following the completion of upgrades and local approvals, three additional units are expected to restart in 2021, including Kansai’s Takahama 1 and 2, and Mihama 3. |
| • | Japan’s Prime Minister, Yoshihide Suga, announced that the country aims to become carbon neutral by 2050. Regarding nuclear, he indicated Japan will continue to develop its nuclear energy supply with “maximum priority on safety”. Japan’s current energy plan calls for 20% to 22% nuclear by 2030. |
| • | In France, President Macron stated in December that nuclear will remain a pillar of the French energy mix for decades to come and pressed for preparatory studies on new next-generation EPR reactors to be wrapped up in the coming months. |
| • | Two countries had their first nuclear power plants connected to the grid in 2020: United Arab Emirates with Barakah 1, and Belarus with Ostrovets 1. These are the first two countries to begin new nuclear power production since 2013. |
| • | In Eastern Europe, important steps were made to advance nuclear power in several countries including Hungary, Poland, Bulgaria, Romania, Ukraine and Slovenia. |
| • | Belgium confirmed its 2025 nuclear phase-out policy, but left the door open for two to three reactors to stay online longer. |
| • | The Netherlands announced they will begin a process that considers building up to 10 nuclear power plants. |
| • | India’s first domestically designed 700 MWe pressurized heavy water reactor was launched at Kakrapar, an important milestone for the country. Three more units of this design are expected to come online in the next few years. |
| • | In South Korea, according to current government plans, no new nuclear power plants will be built in the country, except those already under construction. Existing nuclear power facilities will continue to operate but will not be granted operating extensions. |
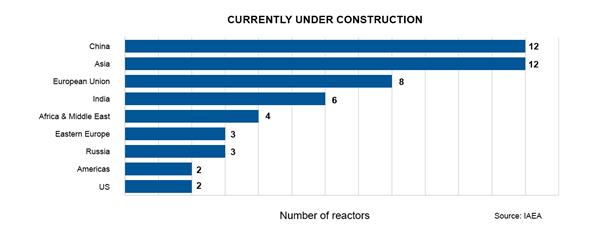
| MANAGEMENT’S DISCUSSION AND ANALYSIS | 15 |
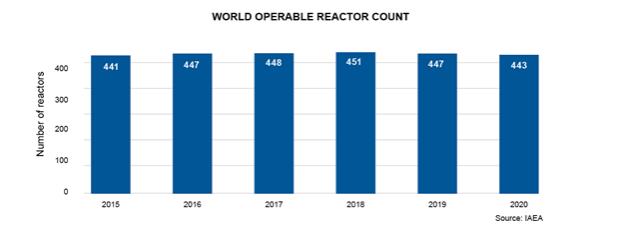
OPPORTUNITIES FOR THOSE WHO CAN WAIT
UxC reports that over the last five years only approximately 390 million pounds U3O8 equivalent have been locked-up in the long-term market, while approximately 815 million pounds U3O8 equivalent have been consumed in reactors. We remain confident that utilities have a growing gap to fill.
Like other commodities, the uranium industry is cyclical. History demonstrates that in general, when prices are rising and high, uranium is perceived as scarce, and a lot of contracting activity takes place. The heavy contracting that takes place during price runs, drives investment in higher-cost sources of production. Once that production is in the market, it tends to stay in the market longer than is economically rational, creating the perception that uranium is abundant and always will be, and prices decline. When prices are declining and low, like we have seen over the past number of years, there is no perceived urgency to contract, and contracting activity and investment in new supply drops off. After years of low investment in supply, as has been the case since 2011, security of supply tends to overtake price concerns at some point, and utilities re-enter the long-term market to ensure they have the reliable supply of uranium they need to run their reactors.
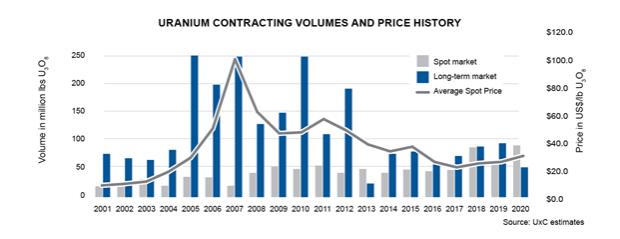
We believe the current backlog of long-term contracting presents a substantial opportunity for commercially motivated suppliers like us that can weather the low-price part of the cycle. As a low-cost producer, we manage our operations with these price cycles in mind.
| 16 | CAMECO CORPORATION |
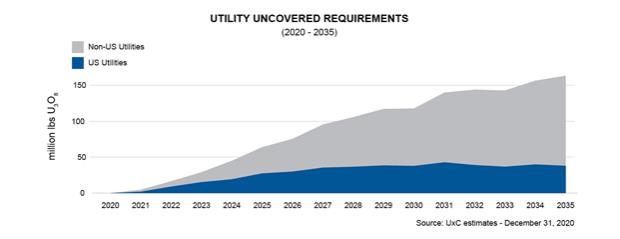
In our industry, customers do not come to the market right before they need to load uranium into their reactors. To operate a reactor that could run for more than 60 years, natural uranium and the downstream services have to be purchased years in advance, allowing time for a number of processing steps before a finished fuel bundle arrives at the power plant. At present, we believe there is a significant amount of uranium that needs to be contracted to keep reactors running into the next decade.
UxC estimates that cumulative uncovered requirements are about 1.4 billion pounds to the end of 2035. The longer the recovery of the long-term market is delayed, the less certainty there will be about the availability of future supply to fill growing demand. In fact, recent data from the US Energy Information Administration shows that utility inventories are starting to decline and are approaching levels that could put security of supply at risk. Ultimately, we expect the current market uncertainty to give way to increasing concerns about the security of future supply.
As utilities’ uncovered requirements grow, annual supply declines, demand for uranium from producers and other intermediaries increases, and with trade policy potentially restricting access to some markets, we believe the pounds available in the spot market will not be adequate to satisfy future demand. As a result, we expect there will be increased competition to secure uranium under long-term contracts on terms that will ensure the availability of reliable primary supply to meet growing demand.
Global population is on the rise, and there is a growing focus on electrification and decarbonization. With the world’s need for safe, clean, reliable baseload energy, nuclear remains an important part of the energy mix. We remain confident in the future of the nuclear industry. With demand increasing due to restarts and new reactors, and supply becoming less certain as a result of low prices, production curtailments, lack of investment, end of reserve life, unplanned production disruptions, shrinking secondary supplies and trade policy issues, we’re continuing to expect a market transition. While the timing of a market transition remains uncertain, we will continue to take the actions we believe are necessary to position the company for long-term success. Therefore, we will undertake contracting activity which aligns with the uncertain timing of a market recovery and is intended to ensure we have adequate protection and will benefit from higher prices under our contract portfolio, while maintaining exposure to the rewards that come from having uncommitted, low-cost supply to place into a strengthening market.
| MANAGEMENT’S DISCUSSION AND ANALYSIS | 17 |
Our strategy
Our strategy is set within the context of a challenging market environment, which we expect to give way to strong long-term fundamentals driven by increasing populations, and a growing focus on electrification and decarbonization. Nuclear energy must be a central part of the solution to the world’s shift to a low-carbon, climate resilient economy. It is an option that can provide the power needed, not only reliably, but also safely and affordably, and in a way that will help avoid some of the worst consequences of climate change.
Tier-one focus
We are a pure-play nuclear fuel investment, focused on providing a clean source of energy, and taking advantage of the long-term growth we see coming in our industry. Our strategy is to focus on our tier-one assets and profitably produce at a pace aligned with market signals in order to preserve the value of those assets and increase long-term value, and to do that with an emphasis on safety, people and the environment.
URANIUM
Uranium production is central to our strategy, as it is the biggest value driver of the nuclear fuel cycle and our business. In accordance with market conditions, and to mitigate risk, we will evaluate the optimal mix of our production, inventory and purchases in order to satisfy our contractual commitments and in order to return the best value possible. We will not produce from our tier-one assets to sell into an oversupplied spot market. During a prolonged period of uncertainty, this could mean leaving our uranium in the ground, which we began doing in 2016. As conditions improve, we expect to meet rising demand with production from our best margin operations.
We are focused on preserving the value of our lowest cost assets, on maintaining a strong balance sheet, on protecting and extending the value of our contract portfolio and on efficiently managing the company in a low-price environment. We have undertaken a number of deliberate and disciplined actions. In 2020, these actions resulted in:
| • | generation of $57 million in cash from operations |
| • | issuing debentures in the amount of $400 million, bearing interest of 2.95% per annum and redeeming our outstanding $400 million debenture bearing interest of 3.75%, resetting the maturity from 2022 to 2027 |
| • | a year-end balance of $943 million in cash on our balance sheet |
Consistent with our actions, our McArthur River/Key Lake operation remains on care and maintenance for an indeterminate duration, removing 18 million pounds of uranium annually from the market. In addition, due to the risks posed by the COVID-19 pandemic, we start 2021 with production at the Cigar Lake mine temporarily suspended. The restart of the Cigar Lake mine is dependent on our ability to maintain safe and stable operating protocols along with a number of other factors, including how the COVID-19 pandemic is impacting the availability of the required workforce, how cases are trending in Saskatchewan, in particular in northern communities, and the views of public health authorities. Our actions have a cost in the short term, and we must weigh these costs against the value we expect they will generate over the long term. Accordingly, we will adjust our actions based on market signals with the intent of being able to self-manage risk, and to ensure our tier-one assets are available to us in a market that values them appropriately.
FUEL SERVICES
Our fuel services division is a source of profit and supports our uranium segment while allowing us to vertically integrate across the fuel cycle.
The UF6 conversion market has gone through a transition that has seen the industry average North American spot price roughly quadrupled and the industry average North American term price increase by nearly 50% since the end of 2017. In this environment, with our Port Hope facility the only UF6 plant currently operating in North America, we are focused on securing new long-term contracts that reflect today’s prices and that will allow us to continue to consistently support the long-term needs of our customers.
In addition, we are pursuing non-traditional markets for our UO2 and fuel fabrication business and have been actively securing new contracts for reactor components to support refurbishment of Canadian reactors.
Our focus will continue to be on maintaining and optimizing the profitability of this segment of our business.
| 18 | CAMECO CORPORATION |
OTHER FUEL CYCLE INVESTMENTS
We continue to explore other opportunities within the nuclear fuel cycle. In particular, we are interested in the second largest value driver of the fuel cycle, enrichment. Having operational control of uranium production, conversion, and enrichment facilities would offer operational synergies that could enhance profit margins.
In January 2021, we increased our interest in Global Laser Enrichment LLC (GLE) from 24% to 49%. We are the commercial lead for the project and have an option to attain a majority interest of up to 75% ownership. GLE is testing a third-generation enrichment technology that, if successful, will use lasers to commercially enrich uranium.
Capital allocation – focus on value
Delivering returns to our long-term shareholders is a top priority. While we navigate by our investment-grade rating, we continually evaluate our investment options to ensure we allocate our capital in a way that we believe will:
| • | create the greatest long-term value |
| • | allow us to execute on our strategy and mitigate risk |
| • | allow us to execute on our dividend while ensuring it is appropriately aligned with the cyclical nature of our earnings |
To deliver value, free cash flow must be productively reinvested in the business or returned to shareholders, which requires good execution and disciplined allocation. Our decisions are based on the run rate of our business, not one-time events. Cash on our balance sheet that exceeds value-adding growth opportunities and/or is not needed to self-manage risk should be returned to shareholders.
We have a multidisciplinary capital allocation team that evaluates all possible uses of investable capital.
We start by determining how much cash we have to invest (investable capital), which is based on our expected cash flow from operations minus expenses we consider to be a higher priority, such as dividends and financing costs, and could include others. This investable capital can be reinvested in the company or returned to shareholders.
With the continued market uncertainty we are facing, our tier-one assets on care and maintenance and our ongoing dispute with CRA, the objective of our capital allocation is to maximize cash flow, while navigating by our investment-grade rating through close management of our balance sheet metrics.
With the metrics that inform an investment-grade rating in mind, we have taken steps to improve margin and cash flow by:
| • | responsibly managing our sources of supply thereby preserving the value of our tier-one assets |
| • | restructuring our activities to reduce our operating, capital, and general and administrative spending |
| • | retiring our $500 million 2019 debenture on maturity to reduce our total debt to $1 billion |
| • | issuing debentures in the amount of $400 million, bearing interest of 2.95% per annum and redeeming our outstanding $400 million debenture bearing interest of 3.75%, resetting the maturity from 2022 to 2027 |
| • | reducing our annual dividend from $0.40 per share to $0.08 per share in 2018 |
| • | implementing an initiative intended to provide a greater focus on technology and its applications to improve efficiency and reduce costs across the organization, with a particular focus on innovation and accelerating the adoption of advanced digital and automation technologies |
As a result, we are well positioned to self-manage risk.
REINVESTMENT
If a decision is made to reinvest capital in sustaining, capacity replacement, or growth, all opportunities are ranked and only those that meet the required risk-adjusted return criteria are considered for investment. We also must identify, at the corporate level, the expected impact on cash flow, earnings, and the balance sheet. All project risks must be identified, including the risks of not investing. Allocation of capital only occurs once an investment has cleared these hurdles.
This may result in some opportunities being held back in favour of higher return investments and should allow us to generate the best return on investment decisions when faced with multiple prospects, while also controlling our costs. If there are not enough good investment prospects internally or externally, this may result in residual investable capital, which we would then consider returning directly to shareholders.
| MANAGEMENT’S DISCUSSION AND ANALYSIS | 19 |
We have not yet seen the market transition needed to restart our idled production capacity. Therefore, until we see that transition, our capital expenditures will be focused primarily on sustaining and capacity replacement capital and demonstrating our continued commitment to a clean environment through ongoing investment in the Vision in Motion project in Port Hope. In addition, we will focus on improving operational effectiveness across our operations, including the use of digital and automation technologies with a particular goal of reducing operating costs and increasing operational flexibility when it comes time to restart the McArthur River/Key Lake operation. Any opportunities will be rigorously assessed before an investment decision is made. If we get clarity on our CRA dispute prior to a market transition, which generates a one-time cash infusion, we may focus on the debt portion of our ratings metrics. This may mean greater emphasis on reducing the debt on our balance sheet. However, if the market does begin to transition and higher uranium prices are beginning to flow through our contract portfolio, and we are able to increase our portfolio of long-term contracts with acceptable pricing mechanisms, the earnings portion of our rating metrics are expected to improve. In that scenario, reducing debt would not be the priority. Our priority would be to invest in restarting our idled tier-one assets, and if warranted, turn to value-adding growth opportunities and to return excess cash to shareholders.
RETURN
We believe in returning cash to shareholders but are also focused on protecting the company and rewarding those shareholders who understand and support our strategy to build long-term value. If we have excess cash and determine the best use is to return it to shareholders, we can do that through a share repurchase or dividend—an annual dividend, one-time supplemental dividend or a progressive dividend. When deciding between these options, we consider a number of factors, including the nature of the excess cash (one time or cash generated by our business operations), growth prospects for the company, and growth prospects for the industry.
Share buyback: If we were generating excess cash while there were few or no growth prospects for the company or the industry, then a share buyback might make sense. However, our current view is that the long-term fundamentals for Cameco and the industry remain strong.
Dividend: The amount and type of dividend paid, annual, progressive or one-time supplemental is evaluated by our board of directors with careful consideration of our cash flow, financial position, strategy, and other relevant factors including appropriate alignment with the cyclical nature of our earnings.
Marketing framework – balanced contract portfolio
As with our corporate strategy and approach to capital allocation, the purpose of our marketing framework is to deliver value. Our approach is to secure a solid base of earnings and cash flow by maintaining a balanced contract portfolio that optimizes our realized price.
We evaluate our strategy in the context of our market environment and continue to adjust our actions in accordance with our marketing framework:
| • | First, we will not produce from our tier-one assets to sell into an oversupplied spot market. We will not produce from these assets unless we can deliver our tier-one pounds under long-term contracts that provide an acceptable rate of return. |
| • | Second, we do not intend to build an inventory of excess uranium. Excess inventory serves to contribute to the sense that uranium is abundant and creates an overhang on the market, and it ties up working capital on our balance sheet. |
| • | Third, in addition to our committed sales, we will capture end-user demand in the market where we think we can obtain value. We will take advantage of opportunities the market provides, where it makes sense from an economic, logistical and strategic point of view. Those opportunities may come in the form of spot, mid-term or long-term demand, and will be additive to our current committed sales. |
| • | Fourth, once we capture demand, we will decide how to best source material to satisfy that demand. Depending on the timing and volume of our production, purchase commitments, and our inventory volumes, this means we will be active buyers in the market in order to meet our demand obligations. |
| • | And finally, in general, if we choose to source material to meet demand by purchasing it, we expect the price of that material will be more than offset by the leverage to market prices in our sales portfolio over the long-term. |
In addition to this framework, our contracting decisions always factor in who the customer is, our desire for regional diversification, the product form, and logistical factors.
| 20 | CAMECO CORPORATION |
Ultimately, our goal is to protect and extend the value of our contract portfolio on terms that recognize the value of our assets and pricing mechanisms that provide adequate protection when prices go down and allow us to benefit when prices rise. We believe using this framework will allow us to create long-term value. Our focus will continue to be on maximizing cash flow, so we can execute on our strategy and self-manage risk.
LONG-TERM CONTRACTING
Uranium is not traded in meaningful quantities on a commodity exchange. Utilities have historically bought the majority of their uranium and fuel services products under long-term contracts with suppliers and have met the rest of their needs on the spot market. We sell uranium and fuel services directly to nuclear utilities around the world as uranium concentrates, UO2 and UF6, conversion services, or fuel fabrication. We have a solid portfolio of long-term sales contracts that reflect the long-term, trusting relationships we have with our customers.
In general, we are always active in the market, buying and selling uranium when it is beneficial for us and in support of our long-term contract portfolio. We undertake activity in the spot and term markets prudently, looking at the prices and other business factors to decide whether it is appropriate to purchase or sell into the spot or term market. Not only is this activity a source of profit, it gives us insight into underlying market fundamentals.
We deliver large volumes of uranium every year, therefore our net earnings and operating cash flows are affected by changes in the uranium price. Market prices are influenced by the fundamentals of supply and demand, market access and trade policy issues, geopolitical events, disruptions in planned supply and demand, and other market factors.
The objectives of our contracting strategy are to:
| • | maximize realized price while providing some certainty for our future earnings and cash flow |
| • | focus on meeting the nuclear industry’s growing annual uncovered requirements with our tier-one production |
| • | establish and grow market share with strategic customers |
We target a portfolio of long-term contracts that have a ratio of 40% fixed-pricing and 60% market-related pricing mechanisms, including provisions to protect us when the market price is declining and allow us to benefit when market prices go up. This is a balanced and flexible approach that allows us to adapt to market conditions and put a floor on our average realized price, and deliver the best value over the long term.
This approach has allowed us to realize prices higher than the market prices during periods of weak uranium demand, and we expect it will enable us to realize increases linked to higher market prices in the future.
Fixed-price contracts for uranium: typically use a pricing mechanism based on a term-price indicator at the time the contract is accepted and escalated over the term of the contract.
Market-related contracts for uranium: are different from fixed-price contracts in that the pricing mechanism may be based on either the spot price or the long-term price, and that price is as quoted at the time of delivery rather than at the time the contract is accepted. These contracts sometimes provide for discounts, and often include floor prices and/or ceiling prices, which are usually escalated over the term of the contract.
Fuel services contracts: the majority of our fuel services contracts use a fixed price mechanism per kgU, escalated over the term of the contract, and reflect the market at the time the contract is accepted.
| MANAGEMENT’S DISCUSSION AND ANALYSIS | 21 |
OPTIMIZING OUR CONTRACT PORTFOLIO
We work with our customers to optimize the value of our contract portfolio. With respect to new contracting activity, as we have seen in our fuel services segment, there is often a lag from when contracting discussions begin and when contracts are executed. With our pipeline of business under negotiation in our uranium segment being larger than we have seen since 2011, and a value driven strategy, we are being strategically patient in considering the commercial terms we are willing to accept. Much of our pending business is off-market and, in the past, off-market activity has been a leading indicator of a contracting cycle. We remain confident that we can add acceptable new sales commitments to our portfolio of long-term contracts to support the restart of our McArthur River/Key Lake operation. Given our view that uranium prices need to rise to ensure the availability of long-term supply to fuel growing demand for safe, clean, reliable, carbon-free nuclear energy, our preference today is to sign long-term contracts with market-related pricing mechanisms. Unsurprisingly, we believe our customers too expect prices to rise and prefer to lock-in today’s low prices, with a fixed-price mechanism. Our goal is to balance all these factors, along with our desire for regional diversification, with product form, and logistical factors to ensure we have adequate protection and will benefit from higher prices under our contract portfolio, while maintaining exposure to the rewards that come from having low-cost supply to deliver into a strengthening market.
With respect to our existing contracts, at times we may also look for opportunities to optimize the value of our portfolio. In cases where a customer is seeking relief under an existing contract due to a challenging policy, operating, or economic environment, or we deem the customer’s long-term demand to be at risk, we may consider options that are beneficial to us and allow us to maintain our customer relationships.
CONTRACT PORTFOLIO STATUS
We have commitments to sell over 113 million pounds of U3O8 with 32 customers worldwide in our uranium segment, and over 53 million kilograms as UF6 conversion with 31 customers worldwide in our fuel services segment. The annual average sales commitments over the next five years in our uranium segment is around 16 million pounds, with commitment levels in 2021 and 2022 higher than in 2023 through 2025.
Customers – U3O8:
Five largest customers account for 60% of commitments
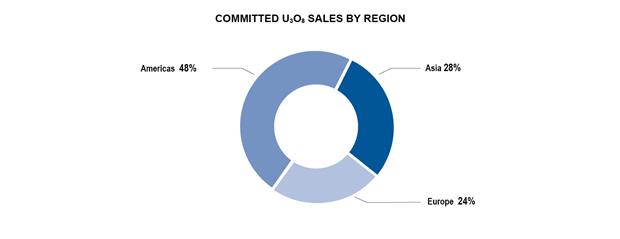
| 22 | CAMECO CORPORATION |
Customers – UF6 conversion:
Five largest customers account for 54% of commitments
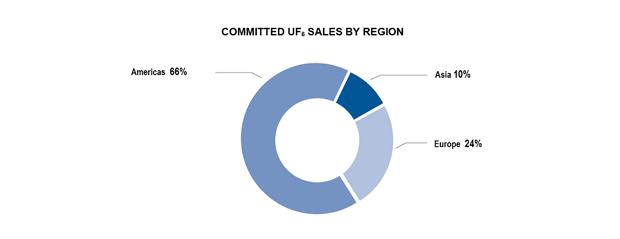
MANAGING OUR CONTRACT COMMITMENTS
To meet our delivery commitments, we use our uranium supply, which includes uranium obtained from:
| • | our existing production |
| • | purchases under our JV Inkai agreement, under long-term agreements and in the spot market |
| • | our existing inventory |
We allow sales volumes to vary year-to-year depending on:
| • | the level of sales commitments in our long-term contract portfolio |
| • | our production volumes |
| • | purchases under existing and/or new arrangements |
| • | discretionary use of inventories |
| • | market opportunities |
Managing our costs
PRODUCTION COSTS
In order to operate efficiently and cost-effectively, we manage operating costs and improve plant reliability by prudently investing in production infrastructure, new technology, and business process improvements. Like all mining companies, our uranium segment is affected by the cost of inputs such as labour and fuel.
| MANAGEMENT’S DISCUSSION AND ANALYSIS | 23 |
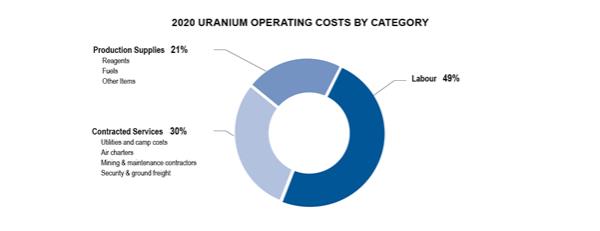
Given the current market dynamics and the risks posed by the COVID-19 pandemic, we start 2021 with all our uranium mining operations on care and maintenance. We expect to restart Cigar Lake, but the timing and the production rate will be dependent on how the COVID-19 pandemic is impacting the availability of the required workforce at Cigar Lake, how cases are trending in Saskatchewan, in particular in northern communities, and the views of public health authorities. In general, while McArthur River and Key Lake are shut down, our annual cost of production is expected to reflect the estimated life-of-mine operating cost, between $15 and $16 per pound, of mining and milling our share of Cigar Lake mineral reserves. However, our cash production costs in 2021 may be impacted by the timing of the restart and the production rate of Cigar Lake.
Operating costs in our fuel services segment are mainly fixed. In 2020, labour accounted for about 51% of the total. The largest variable operating cost is for zirconium, followed by anhydrous hydrogen fluoride, and energy (natural gas and electricity).
CARE AND MAINTENANCE COSTS
In 2021, we expect to incur between $150 million and $170 million in care and maintenance costs related to the suspension of production at our McArthur River/Key Lake mine and mill, Rabbit Lake mine and mill, and US operations. The largest proportion of these costs will be incurred at McArthur River/Key Lake. In addition, we expect to incur care and maintenance costs of between $8 million to $10 million per month while production at Cigar Lake is suspended due to the risks posed by the COVID-19 pandemic.
As noted above, the restart of Cigar Lake is dependent on the risks posed by the COVID-19 pandemic. At McArthur River/Key Lake, the restart of the mine and mill is a commercial decision that will be based on our ability to commit our share of production from this operation under acceptable long-term contracts and to benefit from the favourable life-of-mine economics it provides. Therefore, while on care and maintenance we are focused on improving operational effectiveness, including the use of digital and automation technologies. Our goal is to streamline our processes and leverage digital and automation technologies to reduce our future operating costs and increase the degree of operating flexibility we have when we restart this tier-one asset and eliminate the costs associated with care and maintenance. As a result, care and maintenance costs are expected to be higher for McArthur River/Key Lake compared to Rabbit Lake and in the US. Upon its restart, care and maintenance costs at McArthur River/Key Lake will be eliminated. Our Rabbit Lake and US operations are higher-cost, and with plenty of idle tier-one capacity and tier-one expansion capacity globally that can come back on line relatively quickly, the restart horizon is less certain.
While Rabbit Lake and our US operations are in standby, we will continue to evaluate our options in order to minimize costs.
| 24 | CAMECO CORPORATION |
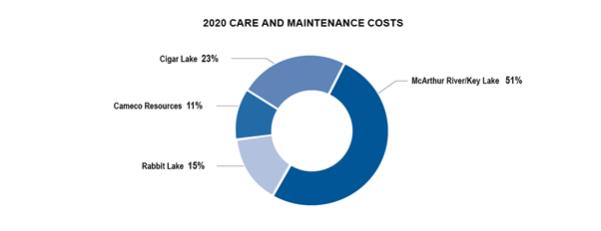
PURCHASES AND INVENTORY COSTS
Our costs are also affected by the purchases of uranium and conversion services we make under long-term contracts and on the spot market.
To meet our delivery commitments, we make use of our mined production, inventories, purchases under long-term contracts, and purchases we make on the spot market. In 2021, the price for the majority of our purchases will be quoted at the time of delivery.
The cost of purchased material may be higher or lower than our other sources of supply, depending on market conditions. The cost of purchased material affects our cost of sales, which is determined by calculating the average of all of our sources of supply, including opening inventory, production, and purchases, and adding royalties, selling costs, and care and maintenance costs. If market prices exceed our cost of inventory, we expect the cost of sales may be impacted.
FINANCIAL IMPACT
As greater certainty returns to the uranium market, our view is that the market needs to transition to one where uranium prices reflect the cost of bringing on new primary production to meet growing demand.
We have taken a number of deliberate and disciplined actions to reduce supply and streamline operations. Some of these actions come with a cost in the near term, like care and maintenance costs and purchase costs higher than our production costs, but we believe the benefit over the long term will far outweigh those costs.
We believe our actions will help shield the company from the nearer term risks we face and will reward shareholders for their continued patience and support of our strategy to build long-term value.
Our approach to ESG matters
OUR VISION
Our vision – “Energizing a clean-air world” – recognizes that we have an important role to play in enabling the vast reductions in global greenhouse gas emissions required to achieve a resilient net-zero carbon economy. The uranium we produce is used around the world in the generation of safe, carbon-free, affordable, base-load nuclear power. As we seek to achieve our vision, we will do so in a manner that reflects our values. We believe we have the right strategy to achieve our vision and are committed to identifying and addressing the environmental, social and governance (ESG) risks and opportunities that we believe may have a significant impact on our ability to add long-term value for our stakeholders.
COMMITTED TO OUR VALUES
Our values are at the core of everything we do and define who we are as a company.
Safety and Environment
The safety of people and protection of the environment are the foundations of our work. All of us share in the responsibility of continually improving the safety of our workplace and the quality of our environment.
| MANAGEMENT’S DISCUSSION AND ANALYSIS | 25 |
We are committed to keeping people safe and conducting our business with respect and care for both the local and global environment.
People
We value the contribution of every employee and we treat people fairly by demonstrating our respect for individual dignity, creativity and cultural diversity. By being open and honest, we achieve the strong relationships we seek.
We are committed to developing and supporting a flexible, skilled, stable and diverse workforce, in an environment that:
| • | attracts and retains talented people and inspires them to be fully productive and engaged |
| • | encourages relationships that build the trust, credibility and support we need to grow our business |
Integrity
Through personal and professional integrity, we lead by example, earn trust, honour our commitments and conduct our business ethically.
We are committed to acting with integrity in every area of our business, wherever we operate.
Excellence
We pursue excellence in all that we do. Through leadership, collaboration and innovation, we strive to achieve our full potential and inspire others to reach theirs.
SUSTAINABILITY: A KEY PART OF OUR STRATEGY, REFLECTING OUR VALUES
We are committed to delivering our products responsibly. This is why we integrate sustainability principles and practices into all stages of our activities, from exploration to decommissioning. We factor them into every aspect of our business, from our objectives and approach to compensation, to our overall corporate strategy and day-to-day operations. We adopt established and recognized management system frameworks to guide our integrated approach, which is embedded within ethical business practices and our robust and transparent governance framework. We seek to be transparent with our stakeholders, keeping them updated on the risks and opportunities that we believe may have a significant impact on our ability to add long-term value.
We have a sustainability policy that describes our commitments in this regard. We encourage you to review our sustainability policy at cameco.com/about/governance/policies-programs.
Environment
We employ an integrated management system that applies to all phases and aspects of our business. The system is governed by our integrated Safety, Health, Environment and Quality (SHEQ) policy, which recognizes that the safety and health of our workers and the public, protection of the environment, and quality of our processes are the highest priority during all stages of our operations. The policy is supported by multiple corporate SHEQ management programs. We maintain ISO 14001 certification of our environmental management program at a corporate level. We encourage you to review our SHEQ policy at cameco.com/about/governance/policies-programs.
Climate change: Nuclear power is part of the solution
We believe the reduction of carbon and greenhouse gas (GHG) emissions is important and necessary in Canada and around the world, and that nuclear power must be a central part of the solution to the world’s shift to a low-carbon, climate-resilient economy. As one of the world’s largest producers of the uranium needed to fuel nuclear reactors, we believe there is a significant opportunity for us to be part of the solution to combat climate change and that we are well positioned to deliver significant long-term business value, while actively working to reduce our emission profile.
| 26 | CAMECO CORPORATION |
There is growing recognition of the role nuclear power must play in ensuring safe, reliable and affordable carbon-free electricity generation. This recognition from key global agencies, such as the United Nations Economic Commission for Europe, the United Nations Intergovernmental Panel on Climate Change, and the Union of Concerned Scientists is important because it acknowledges that nuclear power is needed to credibly achieve commitments under the Paris Agreement or transition to a net-zero carbon future. Indeed, in 2019, for the first time in nearly two decades, the International Energy Agency released a report on nuclear energy in the hopes of bringing it back into the global energy debate. The report highlighted that a steep decline in nuclear power would threaten energy security and climate change goals and result in four billion tonnes of additional carbon emissions by 2040.
The nuclear industry recognizes the scale and immediacy of the challenge outlined in the Paris Agreement, and the important role that all low-carbon and carbon-free energy sources have to play. Led by the World Nuclear Association, the nuclear industry has a program and vision for the future of electricity supply called “Harmony”. The Harmony program sets a target for nuclear power to provide 25% of electricity by 2050 to help avoid the worst consequences of climate change. As members of the World Nuclear Association, and through participation in other industry organizations we fully support and are advocates of this initiative.
Uranium is, in our view, the world’s most significant zero emission fuel. Uranium’s heat value is thousands to tens of thousands of times greater than any other available fuel meaning that a tiny amount of uranium can generate a huge amount of emission-free electricity as nuclear power. The uranium we supply plays a significant role in contributing to GHG mitigation efforts in Canada and abroad. Within Canada, this uranium fuel provides greater than 30% of the province of Ontario’s power every year, avoiding more than 5,000,000 tonnes of carbon dioxide from being emitted into the atmosphere. It enables the province of Ontario to maintain the massive carbon reduction that was fully realized in 2014 when the proportion of electricity produced by nuclear power was increased in that province. Considering only the domestic emissions avoided resulting from the use of nuclear power in Ontario, we could claim to be one of Canada’s first net-zero carbon companies.
We have tracked and reported GHG emissions for more than two decades before it was a regulatory requirement to do so. In the past few years, the emissions of our Canadian operations have become regulated through Canadian output-based performance standard programs. These programs are intended to ensure business competitiveness and prevent carbon leakage. As an organization, we continue to be focused on improving energy management and the visibility of energy consumption within our organization, with the overall goal of improving the energy intensity of our operations to create business value.
Social
Our response to the COVID-19 pandemic
We continue to closely monitor and adapt to the developments related to the outbreak of COVID-19. Throughout the pandemic our priority has been to protect the health and well-being of our workers, including employees and contractors, their families, and their communities. Early in 2020, we activated our Corporate Crisis Management Plan, which includes our Pandemic Plan, and our various Local and Corporate Business Continuity Plans. Our Pandemic Plan and Local and Corporate Business Continuity Plans continue to be in effect across our global operations.
Following the precautions and restrictions enacted by all levels of government where we operate, and, considering the unique circumstances at each of our operating sites, we proactively implemented a number of measures and made a number of decisions to ensure a safe working environment for all our workers. We:
| • | asked employees at corporate office to work remotely from home |
| • | asked that all meetings be conducted by phone or videoconference where possible |
| • | suspended all business travel |
| • | restricted non-essential contractors, visitors and deliveries at all locations |
| • | put in place screening protocols for access to our facilities that align with the guidance of government and public health authorities |
| • | implemented a number of additional protective measures in the workplace, including increased sanitization, physical barriers and physical distancing as well as enhancing use of personal protective equipment |
| • | suspended work on the VIM project in Port Hope |
| MANAGEMENT’S DISCUSSION AND ANALYSIS | 27 |
| • | suspended production at Cigar Lake in late March through August – production was suspended again in December and currently remains suspended |
| • | suspended production, at the Port Hope UF6 conversion facility and at the Blind River refinery in April for about four weeks |
| • | set up and awarded COVID-19 Relief Funds totaling $1.25 million to support our northern Saskatchewan and Ontario communities impacted by the virus |
| • | donated significant volumes of personal protective equipment, including masks, gloves, hand sanitizer, respirators and cartridges, respirator wipes, and safety eyewear |
The proactive decisions we have made, and continue to make, to protect our workers and to help slow down the spread of the COVID-19 virus are necessary decisions that are consistent with our values. We continue to actively monitor the pandemic, and our screening and safety measures will remain in place for the foreseeable future. We will continue to work closely with the relevant health authorities to ensure our protocols align with their guidance.
Safety
The safety and health of our workers and the public is the highest priority during all stages of our activities.
We employ an integrated management system that applies to all phases and aspects of our business. The system is governed by our integrated SHEQ policy and is supported by multiple corporate SHEQ management programs.
Our operations have a strong safety record. We employ systematic programs to identify, evaluate and mitigate risks and engage all workers and managers in development of a strong safety culture. These programs follow the international OHSAS 18001 model and have delivered increasingly noteworthy and recognized safety performance.
Inclusion and Diversity
We have made a formal commitment to inclusion and diversity that is communicated company-wide through our value statements. We understand the value of a diverse workforce and we embrace, encourage and support workplace inclusion and diversity. Members of a diverse workplace bring new ideas, perspective, experiences and expertise to the company. Our diversity vision is to create a work environment where inclusion is the goal, and a diverse and representative workforce is our measure of success. We have a people policy that describes our commitment to developing and supporting a flexible, skilled, stable and diverse workforce, and acting to eliminate racism wherever it exists. The policy is supported by multiple corporate human resource programs, standards and practices. We encourage you to review this policy at cameco.com/about/governance/policies-programs.
We want a culture where each of our workers feel welcome, valued and an integral part of the team and we recognize that in order to successfully progress towards this culture, we must engage members of the workforce throughout the journey. In 2021, this work will be championed through the establishment of an Inclusion and Diversity committee. Members of the committee will be drawn from across the organization and will help us engage the workforce through open and respectful communication, will advocate, lead and support change and provide awareness and understanding of the benefits of inclusion and diversity. The committee will report to the President and CEO, and the Senior Vice-President and Chief Corporate Officer.
Diversity is an important element of executive and board leadership. We have commitments in our diversity and inclusion plan to ensure leadership is at the forefront of our diversity agenda. We strive for a complement of female officers that, at a minimum, reflect the proportion of women in our workforce. We expect that our long-term diversity and inclusion plan will result in more women being identified and prepared for senior level positions within the company. Our board has a diversity policy that was put in place to ensure that the members of the board have the necessary range of perspectives, experience and expertise required to achieve our objectives. The board has also set specific diversity objectives (which they currently meet or exceed) for gender diversity as well as the inclusion of Indigenous directors on the board.
For more information about diversity and inclusion at Cameco, see our most recent management proxy circular.
Stakeholder relations
The long-term sustainability of our business is dependent upon our ability to effectively build relationships with, work with, and add value for our stakeholders.
| 28 | CAMECO CORPORATION |
From community liaison groups and industry associations, to registered charities, regulators, customers, suppliers, contractors, the investment community and our employees, we recognize the value of maintaining many long-term relationships that help us succeed together. All are important but none more so than the relationships we hold with our workers and Indigenous people working and living near our operations.
Informed by best practices, we set standards for the ways we meaningfully engage with and are involved with our stakeholders to ensure we fulfil our obligations to them.
We strive to earn the support of the communities in which we operate, which is one of our key measures of success. We identify opportunities and initiatives that support and respect these communities and their cultures.
We recognize the substantial value in developing and maintaining long-term mutually beneficial relationships with Indigenous communities located within or near our operations and other activities.
Over more than 30 years of operation in Saskatchewan and Ontario and partnerships in northern Saskatchewan and northern Ontario, we have developed a comprehensive strategy that applies to all our operations globally and is aimed at ensuring the support of the communities with whom we work. We achieve success at our sites when we involve, train, and engage local people. This global strategy is flexible and is implemented locally to reflect the needs of the Indigenous and other local communities. The bulk of the strategy has evolved from the commercial benefits we see from building and maintaining strong support among local communities wherever we operate and focuses on five key areas:
| • | Workforce development: designed to deliver programming that aims to build educational and skills capacity in local communities. |
| • | Business development: designed to promote involvement of locally-owned businesses in contracting opportunities at our operations, to provide additional jobs, revenue streams and capacity building at the local community level. |
| • | Community engagement: designed with the objective to ensure that we secure support for our operations from local communities and satisfy the obligations placed on us by regulators and laws. |
| • | Community investment: designed to help local communities with much-needed funding for community programming and infrastructure for initiatives focused on youth, education and literacy, health and wellness, and community development. |
| • | Environmental stewardship: designed to support our overall environmental programming and give communities a voice in both the formal environmental assessment regulatory process, as well as ongoing monitoring activities. |
Wherever we operate, it is our goal to ensure local people are aware of and understand our activities and have opportunities to provide input. Engaging communities and keeping them informed throughout all phases of our operations is a priority for us. We set standards for the measures that we will conform to in maintaining ongoing and meaningful engagement within the communities where we operate.
Ethics and Business Integrity
We have a reputation for maintaining the highest standards of ethical behaviour, which has helped us to grow into the global business we are today. Our Code of Conduct and Ethics guides us in ethical conduct as we fulfil our roles, and our Supplier Code of Conduct and Ethics sets out our expectations for suppliers to ensure a sustainable and ethical supply chain. Our Global Anti-Corruption Program also guides employees to ensure that the integrity of our relationships is maintained. You can access our Code of Conduct and Ethics and Supplier Code of Conduct and Ethics at cameco.com/about/sustainability/our-approach-to-esg-reporting/governance.
Governance: Sound governance is the foundation for strong performance
We believe that sound governance is the foundation for strong corporate performance. Our board of directors is responsible for overseeing management, and our strategy and business affairs, including the integration of ESG principles throughout the company. The board’s goal is to ensure we operate as a sustainable business, optimizing financial returns while effectively managing risk.
The board has formal governance guidelines that set out our approach to governance and the board’s governance role and practices. The guidelines ensure we comply with all of the governance rules and legislation in Canada and the United States that are applicable, conduct ourselves in the best interests of our stakeholders, and meet industry best practices. The guidelines are reviewed and updated regularly.
| MANAGEMENT’S DISCUSSION AND ANALYSIS | 29 |
Risk and Risk Management
We have a mature enterprise risk management (ERM) framework that consists of processes and controls to ensure risks are being appropriately managed and mitigated.
Decisions to accept, mitigate, or transfer identified risks guide management’s plans in our strategic planning and budgeting process. Employees throughout the company take ownership of the risks specific to their area and are responsible for developing and implementing the controls to manage and re-assess risk, including ESG risks.
Our risk policy sets out a broad, systematic approach to identifying, assessing, reporting and managing the significant risks, including ESG risks, we face in our business and operations. The policy is reviewed annually to ensure that it continues to meet our needs.
See Managing the risks, starting on page 63, for a discussion of the risks, including ESG risks, that generally apply to all of our operations and advanced uranium projects, and that could have a material impact on business in the near term. We also recommend you review our most recent annual information form, which includes a discussion of other material risks that could have an impact on our business.
The board is responsible for overseeing management’s implementation of appropriate risk management processes and controls. Time is dedicated at board and committee meetings to risk identification, management, and reporting. In consultation with the board, management works on enhancing its enterprise risk oversight practices, processes and controls. While the board oversees the company’s strategic risks, including ESG/climate-related risks, it also allocates oversight of other top-tier risks to specific board committees. Set out below is an overview of the responsibilities allocated to specific board committees.
Audit and finance – supports the board in fulfilling its oversight responsibilities regarding the integrity of our accounting and financial reporting, the adequacy and effectiveness of our internal controls and disclosure controls, legal, regulatory (excluding safety, health and the environment) and ethical compliance, the independence and performance of our external and internal auditors, oversight of specific material risks, and prevention and detection of fraudulent activities and financial oversight.
Human resources and compensation – supports the board in fulfilling its oversight responsibilities regarding human resource policies, employee and labour relations matters, executive compensation, executive succession and development, pension plan governance, as well as oversight of cyber-security risk.
Nominating, corporate governance and risk – supports the board in fulfilling its oversight responsibilities by developing and recommending a set of corporate governance principles, identifying and recommending qualified individuals as members of the board and its committees, assessing the effectiveness of the board and committees, and overseeing the risk program.
Reserves oversight – supports the board in fulfilling its oversight responsibilities regarding estimating and disclosing mineral reserves and resources.
Safety, health and environment – supports the board in fulfilling its oversight responsibilities regarding safety, health, environmental and climate-related matters, and supportive communities.
More information about our shareholder commitment, our governance principles, how our board operates, its responsibilities, and the profiles of each of our directors can be found in our most recent management proxy circular and on our website at cameco.com/about/board-of-directors.
HOW WE ARE DOING
Given the evolving nature of the ESG landscape, we have established a multi-disciplinary working group to review our current approach to sustainability and ESG governance and reporting. We are planning to issue a ESG report later in 2021 that reflects Sustainability Accounting Standards Board (SASB) and Task Force on Climate-Related Financial Disclosures (TCFD) principles. The working group is chaired by our Senior Vice-President and Chief Corporate Officer and has been reporting to our board and its committees.
| 30 | CAMECO CORPORATION |
Since 2012, we have reported on globally recognized key indicators that measure our environmental, social, governance and financial impacts in the areas that we believe may have a significant impact on our ability to add long-term value for our stakeholders. We have used the Global Reporting Initiative’s Sustainability Framework (GRI), in addition to some corporate indicators that are unique to the company to measure and report our performance. This is our report card to our stakeholders. You can find our most recent performance results at cameco.com/about/sustainability.
TARGETS AND METRICS: THE LINK BETWEEN ESG FACTORS AND EXECUTIVE PAY
We recognize the importance of integrating certain ESG factors, such as safety performance, a clean environment and supportive communities, into our executive compensation strategy as we see success in these areas as critical to the long-term success of the company. For more information on our compensable targets and our reported performance against those targets see the Measuring our results section that follows and our most recent management proxy circular.
Measuring our results
Each year, we set corporate objectives that are aligned with our strategic plan. These objectives fall under our four measures of success: outstanding financial performance, safe, healthy and rewarding workplace, clean environment and supportive communities. Performance against specific targets under these objectives forms the foundation for a portion of annual employee and executive compensation. See our most recent management proxy circular for more information on how executive compensation is determined.
| 2020 OBJECTIVES1 |
TARGET |
RESULTS | ||
| OUTSTANDING FINANCIAL PERFORMANCE | ||||
| Earnings measure | Achieve targeted adjusted net earnings. |
• adjusted net earnings was below target largely due to the costs associated with the proactive measures taken to protect the health and safety of our workforce from the risks posed by the COVID-19 pandemic | ||
| Cash flow measure | Achieve cash flow from operations (after working capital changes). | • cash flow from operations was below target largely due to the costs associated with the proactive measures taken to protect the health and safety of our workforce from the risks posed by the COVID-19 pandemic | ||
| SAFE, HEALTHY AND REWARDING WORKPLACE | ||||
| Workplace safety measure | Strive for no injuries at all Cameco-operated sites. Maintain a long-term downward trend in combined employee and contractor injury frequency and severity, and radiation doses. | • best safety performance in the history of the company, however TRIR did not meet the 2020 improvement target
• completion of corrective actions and job task observations was within the targeted range
• average radiation doses remained low and stable | ||
| CLEAN ENVIRONMENT | ||||
| Environmental performance measures | Achieve divisional environmental aspect improvement targets. | • performance was within the targeted range
• there were no significant environmental incidents in 2020 | ||
| SUPPORTIVE COMMUNITIES | ||||
| Stakeholder support measure | Develop the skill set of residents of Saskatchewan’s north in conjunction with our initiative to accelerate the adoption of advanced digital and automation technologies at our northern Saskatchewan operations. | • Performance was above target | ||
| 1 | Detailed results for our 2020 corporate objectives and the related targets will be provided in our 2021 management proxy circular prior to our Annual Meeting of Shareholders on May 6, 2021. |
| MANAGEMENT’S DISCUSSION AND ANALYSIS | 31 |
2021 objectives
OUTSTANDING FINANCIAL PERFORMANCE
| • | Achieve targeted financial measures focused on controlling costs and generating cash. |
SAFE, HEALTHY AND REWARDING WORKPLACE
| • | Improve workplace safety performance at all sites. |
CLEAN ENVIRONMENT
| • | Improve environmental performance at all sites. |
SUPPORTIVE COMMUNITIES
| • | Build and sustain strong stakeholder support for our activities. |
| 32 | CAMECO CORPORATION |
Financial results
This section of our MD&A discusses our performance, financial condition and outlook for the future.
| 34 | 2020 CONSOLIDATED FINANCIAL RESULTS | |
| 45 | OUTLOOK FOR 2021 | |
| 47 | LIQUIDITY AND CAPITAL RESOURCES | |
| 53 | 2020 FINANCIAL RESULTS BY SEGMENT | |
| 53 | URANIUM | |
| 55 | FUEL SERVICES | |
| 56 | FOURTH QUARTER FINANCIAL RESULTS | |
| 56 | CONSOLIDATED RESULTS | |
| 59 | URANIUM | |
| 61 | FUEL SERVICES | |
| MANAGEMENT’S DISCUSSION AND ANALYSIS | 33 |
2020 consolidated financial results
This section of our MD&A discusses our performance, financial condition and outlook for the future.
As of January 1, 2018, due to restructuring and a change in our ownership interest, we began accounting for JV Inkai on an equity basis, with no restatement of prior periods.
| HIGHLIGHTS | CHANGE FROM | |||||||||||||||
| DECEMBER 31 ($ MILLIONS EXCEPT WHERE INDICATED) |
2020 | 2019 | 2018 | 2019 TO 2020 | ||||||||||||
| Revenue |
1,800 | 1,863 | 2,092 | (3 | )% | |||||||||||
| Gross profit |
106 | 242 | 296 | (56 | )% | |||||||||||
| Net earnings (loss) attributable to equity holders |
(53 | ) | 74 | 166 | >100 | % | ||||||||||
| $ per common share (basic) |
(0.13 | ) | 0.19 | 0.42 | >100 | % | ||||||||||
| $ per common share (diluted) |
(0.13 | ) | 0.19 | 0.42 | >100 | % | ||||||||||
| Adjusted net earnings (loss) (non-IFRS, see page 35) |
(66 | ) | 41 | 211 | >100 | % | ||||||||||
| $ per common share (adjusted and diluted) |
(0.17 | ) | 0.10 | 0.53 | >100 | % | ||||||||||
| Cash provided by operations (after working capital changes) |
57 | 527 | 668 | (89 | )% | |||||||||||
Net earnings
The following table shows what contributed to the change in net earnings in 2020 compared to 2019 and 2018.
| ($ MILLIONS) |
2020 | 2019 | 2018 | |||||||||||
| Net earnings (losses) - previous year |
74 | 166 | (205 | ) | ||||||||||
| Change in gross profit by segment |
||||||||||||||
| (we calculate gross profit by deducting from revenue the cost of products and services sold, and depreciation and amortization (D&A), net of hedging benefits) |
| |||||||||||||
| Uranium |
Higher (lower) sales volume |
(4 | ) | (27 | ) | 18 | ||||||||
| Higher (lower) realized prices ($US) |
25 | (133 | ) | 40 | ||||||||||
| Foreign exchange impact on realized prices |
14 | 35 | 1 | |||||||||||
| Lower (higher) costs |
(175 | ) | 10 | (186 | ) | |||||||||
|
|
|
|
|
|
|
|||||||||
| change – uranium |
(140 | ) | (115 | ) | (127 | ) | ||||||||
|
|
|
|
|
|
|
|||||||||
| Fuel services |
Higher (lower) sales volume |
(4 | ) | 13 | 1 | |||||||||
| Higher (lower) realized prices ($Cdn) |
21 | (11 | ) | (5 | ) | |||||||||
| Lower (higher) costs |
(11 | ) | 29 | (1 | ) | |||||||||
|
|
|
|
|
|
|
|||||||||
| change – fuel services |
6 | 31 | (5 | ) | ||||||||||
|
|
|
|
|
|
|
|||||||||
| Other changes |
||||||||||||||
| Lower (higher) administration expenditures |
(20 | ) | 17 | 21 | ||||||||||
| Lower impairment charges |
— | — | 358 | |||||||||||
| Lower exploration expenditures |
3 | 6 | 10 | |||||||||||
| Change in reclamation provisions |
(21 | ) | 57 | (60 | ) | |||||||||
| Change in gains or losses on derivatives |
5 | 113 | (137 | ) | ||||||||||
| Change in foreign exchange gains or losses |
33 | (45 | ) | 49 | ||||||||||
| Change in earnings from equity-accounted investments |
(9 | ) | 13 | 32 | ||||||||||
| Redemption of Series E debentures in 2020 |
(24 | ) | — | — | ||||||||||
| Canadian Emergency Wage Subsidy in 2020 |
37 | — | — | |||||||||||
| Arbitration award in 2019 related to TEPCO contract |
(52 | ) | 52 | — | ||||||||||
| Gain on sale of interest in Wheeler River Joint Venture in 2018 |
— | (17 | ) | 17 | ||||||||||
| Gain on restructuring of JV Inkai in 2018 |
— | (49 | ) | 49 | ||||||||||
| Gain on customer contract restructuring in 2018 |
— | (6 | ) | 6 | ||||||||||
| Sale of exploration properties in 2018 |
— | (7 | ) | 7 | ||||||||||
| Reversal of tax provision in 2018 related to CRA dispute |
— | (61 | ) | 61 | ||||||||||
| Change in income tax recovery or expense |
47 | (126 | ) | 62 | ||||||||||
| Other |
8 | 45 | 28 | |||||||||||
|
|
|
|
|
|
|
|||||||||
| Net earnings (losses) - current year |
(53 | ) | 74 | 166 | ||||||||||
|
|
|
|
|
|
|
|||||||||
| 34 | CAMECO CORPORATION |
Non-IFRS measures
ADJUSTED NET EARNINGS
Adjusted net earnings is a measure that does not have a standardized meaning or a consistent basis of calculation under IFRS (non-IFRS measure). We use this measure as a more meaningful way to compare our financial performance from period to period. We believe that, in addition to conventional measures prepared in accordance with IFRS, certain investors use this information to evaluate our performance. Adjusted net earnings is our net earnings attributable to equity holders, adjusted to better reflect the underlying financial performance for the reporting period. The adjusted earnings measure reflects the matching of the net benefits of our hedging program with the inflows of foreign currencies in the applicable reporting period and is adjusted for reclamation provisions for our Rabbit Lake and US operations, which have been impaired, the gain on restructuring of JV Inkai, and income taxes on adjustments.
Adjusted net earnings is non-standard supplemental information and should not be considered in isolation or as a substitute for financial information prepared according to accounting standards. Other companies may calculate this measure differently, so you may not be able to make a direct comparison to similar measures presented by other companies.
To facilitate a better understanding of these measures, the table below reconciles adjusted net earnings with our net earnings for the years ended 2020, 2019 and 2018.
| ($ MILLIONS) |
2020 | 2019 | 2018 | |||||||||
| Net earnings (loss) attributable to equity holders |
(53 | ) | 74 | 166 | ||||||||
| Adjustments |
||||||||||||
| Adjustments on derivatives |
(45 | ) | (49 | ) | 65 | |||||||
| Reclamation provision adjustments |
24 | 3 | 60 | |||||||||
| Gain on restructuring of JV Inkai |
— | — | (49 | ) | ||||||||
| Income taxes on adjustments |
8 | 13 | (31 | ) | ||||||||
|
|
|
|
|
|
|
|||||||
| Adjusted net earnings (loss) |
(66 | ) | 41 | 211 | ||||||||
|
|
|
|
|
|
|
|||||||
Every quarter we are required to update the reclamation provisions for all operations based on new cash flow estimates, discount and inflation rates. This normally results in an adjustment to an asset retirement obligation asset in addition to the provision balance. When the assets of an operation have been written off due to an impairment, as is the case with our Rabbit Lake and US ISR operations, the adjustment is recorded directly to the statement of earnings as “other operating expense (income)”. See note 15 of our annual financial statements for more information. This amount has been excluded from our adjusted net earnings measure.
| MANAGEMENT’S DISCUSSION AND ANALYSIS | 35 |
The following table shows what contributed to the change in adjusted net earnings (non-IFRS measure, see above) in 2020 compared to the same period in 2019 and 2018.
| ($ MILLIONS) |
2020 | 2019 | 2018 | |||||||||||
| Adjusted net earnings - previous year |
41 | 211 | 59 | |||||||||||
| Change in gross profit by segment |
||||||||||||||
| (we calculate gross profit by deducting from revenue the cost of products and services sold, and depreciation and amortization (D&A), net of hedging benefits) |
| |||||||||||||
| Uranium | Higher (lower) sales volume |
(4 | ) | (27 | ) | 18 | ||||||||
| Higher (lower) realized prices ($US) |
25 | (133 | ) | 40 | ||||||||||
| Foreign exchange impact on realized prices |
14 | 35 | 1 | |||||||||||
| Lower (higher) costs |
(175 | ) | 10 | (186 | ) | |||||||||
|
|
|
|
|
|
|
|||||||||
| change – uranium |
(140 | ) | (115 | ) | (127 | ) | ||||||||
|
|
|
|
|
|
|
|||||||||
| Fuel services | Higher (lower) sales volume |
(4 | ) | 13 | 1 | |||||||||
| Higher (lower) realized prices ($Cdn) |
21 | (11 | ) | (5 | ) | |||||||||
| Lower (higher) costs |
(11 | ) | 29 | (1 | ) | |||||||||
|
|
|
|
|
|
|
|||||||||
| change – fuel services |
6 | 31 | (5 | ) | ||||||||||
|
|
|
|
|
|
|
|||||||||
| Other changes |
||||||||||||||
| Lower (higher) administration expenditures |
(20 | ) | 17 | 21 | ||||||||||
| Lower (higher) exploration expenditures |
3 | 6 | 10 | |||||||||||
| Change in gains or losses on derivatives |
9 | (1 | ) | 36 | ||||||||||
| Change in foreign exchange gains or losses |
33 | (45 | ) | 49 | ||||||||||
| Change in earnings from equity-accounted investments |
(9 | ) | 13 | 32 | ||||||||||
| Redemption of Series E debentures in 2020 |
(24 | ) | — | — | ||||||||||
| Canadian Emergency Wage Subsidy in 2020 |
37 | — | — | |||||||||||
| Arbitration award in 2019 related to TEPCO contract |
(52 | ) | 52 | — | ||||||||||
| Gain on sale of interest in Wheeler River Joint Venture in 2018 |
— | (17 | ) | 17 | ||||||||||
| Gain on customer contract restructuring in 2018 |
— | (6 | ) | 6 | ||||||||||
| Sale of exploration properties in 2018 |
— | (7 | ) | 7 | ||||||||||
| Reversal of tax provision in 2018 related to CRA dispute |
— | (61 | ) | 61 | ||||||||||
| Change in income tax recovery or expense |
42 | (82 | ) | 17 | ||||||||||
| Other |
8 | 45 | 28 | |||||||||||
|
|
|
|
|
|
|
|||||||||
| Adjusted net earnings (losses) - current year |
(66 | ) | 41 | 211 | ||||||||||
|
|
|
|
|
|
|
|||||||||
Average realized prices
| CHANGE FROM | ||||||||||||||||||
| 2020 | 2019 | 2018 | 2019 TO 2020 | |||||||||||||||
| Uranium1 |
$US/lb | 34.39 | 33.77 | 37.01 | 2 | % | ||||||||||||
| $Cdn/lb | 46.14 | 44.85 | 47.96 | 3 | % | |||||||||||||
|
|
|
|
|
|
|
|
|
|||||||||||
| Fuel services |
$Cdn/kgU | 27.89 | 26.21 | 26.78 | 6 | % | ||||||||||||
|
|
|
|
|
|
|
|
|
|||||||||||
| 1 | Average realized foreign exchange rate ($US/$Cdn): 2020 – 1.34, 2019 – 1.33 and 2018 – 1.30. |
| 36 | CAMECO CORPORATION |
Revenue
The following table shows what contributed to the change in revenue for 2020.
| ($ MILLIONS) |
||||
| Revenue – 2019 |
1,863 | |||
|
|
|
|||
| Uranium |
||||
| Lower sales volume |
(42 | ) | ||
| Higher realized prices ($Cdn) |
40 | |||
|
|
|
|||
| Fuel services |
||||
| Lower sales volume |
(16 | ) | ||
| Higher realized prices ($Cdn) |
23 | |||
|
|
|
|||
| Other |
(68 | ) | ||
|
|
|
|||
| Revenue – 2020 |
1,800 | |||
|
|
|
|||
See 2020 Financial results by segment on page 53 for more detailed discussion.
THREE-YEAR TREND
In 2019, revenue decreased by 11% compared to 2018 due to a decrease in sales volume in the uranium segment and a decrease in the Canadian dollar average realized price despite an increase in the uranium spot price. This decrease in the uranium segment was partially offset by an increase in sales volumes in our fuel services segment.
In 2020, revenue decreased by 3% compared to 2019 due to a decrease in sales volume in the uranium segment that was partially offset by an increase in the Canadian dollar average realized price. In our fuel services segment, revenue increased by 2% as a result of the increase in average realized price partially offset by a decrease in sales volume. In addition, our subsidiary NUKEM had a decrease in sales volume. See notes 17 and 28 in our annual financial statements for more information.
SALES DELIVERY OUTLOOK FOR 2021
For 2021 we have committed sales volumes in our uranium segment of between 23 to 25 million pounds. We will continue to be active buying and selling uranium in the spot market if it makes sense for us.
In our uranium and fuel services segments, our customers choose when in the year to receive deliveries. As a result, our quarterly delivery patterns and, therefore, our sales volumes and revenue can vary significantly. We expect the quarterly distribution of uranium deliveries in 2021 to be fairly evenly distributed as shown below. However, not all delivery notices have been received to date and the expected delivery pattern could change. Typically, we receive notices six months in advance of the requested delivery date.
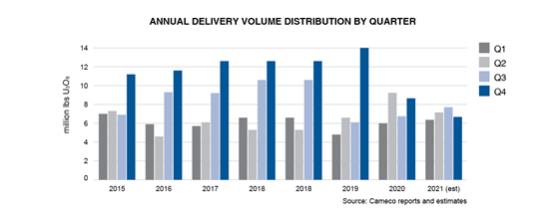
| MANAGEMENT’S DISCUSSION AND ANALYSIS | 37 |
Corporate expenses
ADMINISTRATION
| ($ MILLIONS) |
2020 | 2019 | CHANGE | |||||||||
| Direct administration |
113 | 114 | (1 | )% | ||||||||
|
|
|
|
|
|
|
|||||||
| Stock-based compensation |
32 | 11 | 191 | % | ||||||||
|
|
|
|
|
|
|
|||||||
| Total administration |
145 | 125 | 16 | % | ||||||||
|
|
|
|
|
|
|
|||||||
Direct administration costs in 2020 were $1 million lower than 2019.
We recorded $32 million in stock-based compensation expenses in 2020 under our stock option, restricted share unit, deferred share unit, performance share unit and phantom stock option plans, $21 million higher than in 2019 due to the increase in our share price compared to the same period in 2019. See note 24 to the financial statements.
Administration outlook for 2021
We expect direct administration costs to be between $110 million to $120 million, similar to 2020.
EXPLORATION
Our 2020 exploration activities were focused primarily on Canada. Our spending decreased from $14 million in 2019 to $11 million in 2020 due to a reduction in expenditures as a result of restrictions related to the COVID-19 pandemic.
Exploration outlook for 2021
We expect exploration expenses to be about $9 million in 2021. The focus for 2021 will be on our core projects in Saskatchewan.
FINANCE COSTS
Finance costs were $96 million, a decrease from $99 million in 2019 due to a reduction in our outstanding debt during 2019, as we retired our Series D debentures debenture that matured in September of that year and lower accretion expense as a result of decreases in both reclamation estimates and discount rates. These decreases were partially offset by the cost associated with the early redemption of our Series E debentures. See note 19 to the financial statements.
FINANCE INCOME
Finance income was $11 million compared to $30 million in 2019 mainly due to lower interest rates during 2020. In addition, during 2019 our loan to JV Inkai was fully repaid, decreasing the amount of interest received in the current year.
GAINS AND LOSSES ON DERIVATIVES
In 2020, we recorded $37 million in gains on our derivatives compared to $32 million in gains in 2019. The increase reflects the strength in the Canadian dollar compared to the US dollar at the end of 2020 compared to 2019. See Foreign exchange on page 43 and note 26 to the financial statements.
INCOME TAXES
We recorded an income tax expense of $14 million in 2020 compared to an expense of $61 million in 2019. The decrease in expense was primarily due to a change in the distribution of earnings among jurisdictions compared to 2019.
In 2020, we recorded earnings of $73 million in Canada compared to earnings of $229 million in 2019, while in foreign jurisdictions, we recorded a loss of $112 million compared to a loss of $94 million in 2019. The tax rate in Canada is higher than the average of the rates in the foreign jurisdictions in which our subsidiaries operate.
On an adjusted earnings basis, we recognized a tax expense of $6 million in 2020 compared to an expense of $48 million in 2019. The table below presents our adjusted earnings and adjusted income tax expenses attributable to Canadian and foreign jurisdictions.
| 38 | CAMECO CORPORATION |
| ($ MILLIONS) |
2020 | 2019 | ||||||
| Pre-tax adjusted earnings1 |
||||||||
| Canada |
52 | 183 | ||||||
| Foreign |
(112 | ) | (94 | ) | ||||
|
|
|
|
|
|||||
| Total pre-tax adjusted earnings |
(60 | ) | 89 | |||||
|
|
|
|
|
|||||
| Adjusted income taxes1 |
||||||||
| Canada |
1 | 55 | ||||||
| Foreign |
5 | (7 | ) | |||||
|
|
|
|
|
|||||
| Adjusted income tax expense |
6 | 48 | ||||||
|
|
|
|
|
|||||
| 1 | Pre-tax adjusted earnings and adjusted income taxes are non-IFRS measures. Our IFRS-based measures have been adjusted by the amounts reflected in the table in adjusted net earnings (non-IFRS measures on page 35). |
TRANSFER PRICING DISPUTE
Federal Court of Appeal decision
On June 26, 2020, the Court of Appeal decided unanimously in our favour in our dispute with CRA. The decision upholds the September 26, 2018 decision of the Tax Court of Canada (Tax Court), which was unequivocally in our favour for the 2003, 2005 and 2006 tax years and it sustains the corresponding decision on the cost award. We also believe the principles in the decision apply to all tax years subsequent to 2006.
The Court of Appeal decision is further confirmation that our marketing and trading structure involving foreign subsidiaries and the related transfer pricing methodology used for certain intercompany uranium purchase and sale agreements were in full compliance with Canadian laws for the three years in question.
The total tax reassessed for the three tax years was $11 million, and we remitted 50%. Therefore, we expect to receive refunds totaling about $5.5 million plus interest. The matter has been referred to the Minister of National Revenue in order to issue new reassessments for the 2003, 2005 and 2006 tax years in accordance with the decision.
In addition, on April 30, 2019, the Tax Court awarded us $10.25 million for legal fees incurred, plus an amount for disbursement of up to $17.9 million. The amount of the award for disbursements will be determined by an officer of the Tax Court. We are optimistic we will recover all, or substantially all, of the $17.9 million in disbursements. In addition, we will be receiving a nominal cost award related to the Court of Appeal hearing.
The timing of any payments as a result of the Court of Appeal decision is uncertain.
Appeal process
On October 30, 2020, we received notice that CRA made an application to the Supreme Court to seek leave to appeal the decision of the Court of Appeal. The Supreme Court will decide whether to hear the appeal or decline CRA’s request for leave. If the appeal is heard, we estimate that it could take until the second half of 2022 before a decision is rendered by the Supreme Court.
We remain confident in our position, and that we would succeed on appeal, if leave to appeal is granted. If leave to appeal is not granted, then the dispute over the three tax years in question is fully and finally resolved in our favour.
We expect to incur additional costs if leave to appeal is granted by the Supreme Court, and in connection with potential reassessments of subsequent years. There could also be costs incurred if a negotiated resolution with CRA is sought or achieved.
Potential exposure based on CRA appeal
Since 2008, CRA has disputed our marketing and trading structure and the related transfer pricing methodology we used for certain intercompany uranium sale and purchase agreements. To date, we have received notices of reassessment for our 2003 through 2014 tax years. Both the Court of Appeal and the Tax Court have ruled unequivocally in our favour for the 2003, 2005 and 2006 tax years, and we believe there is nothing in the lower court decisions that would warrant a materially different outcome if the Supreme Court decides to hear the appeal. Although not technically binding, there is nothing in the reasoning of the lower court decisions that should result in a different outcome for those subsequent tax years. However, we expect these disputes with CRA may continue to tie up our financial capacity until the dispute is finally resolved for all years.
| MANAGEMENT’S DISCUSSION AND ANALYSIS | 39 |
For the years 2003 to 2014, CRA has shifted Cameco Europe Limited’s income (as recalculated by CRA) back to Canada and applied statutory tax rates, interest and instalment penalties, and, from 2007 to 2011, transfer pricing penalties. CRA has advised that it has deferred consideration of whether to impose a transfer pricing penalty for 2012 through 2014. Taxes of approximately $326 million for the 2003 to 2020 years have already been paid to date in a jurisdiction outside Canada. If CRA is successful on appeal, we will consider our options under bilateral international tax treaties to limit double taxation of this income. There is a risk that we will not be successful in eliminating all potential double taxation. The income adjustments claimed by CRA in its reassessments are represented by the amounts described below.
The Canadian income tax rules include provisions that generally require larger companies like us to remit or otherwise secure 50% of the cash tax plus related interest and penalties at the time of reassessment. We received the 2014 reassessment late in 2020. CRA has advised that security remitted to date is sufficient to secure the tax debts they consider owing and as such, no further security is required at this time. To date, under these provisions, after applying elective deductions, we have paid or secured the amounts shown in the table below. Of these amounts, we expect to receive refunds totaling approximately $5.5 million plus interest for the years 2003, 2005 and 2006. The timing of the refund may be delayed pending the outcome of the decision of the Supreme Court to hear the appeal.
| INTEREST | TRANSFER | |||||||||||||||||||||||
| AND INSTALMENT | PRICING | CASH | SECURED BY | |||||||||||||||||||||
| YEAR PAID ($ MILLIONS) |
CASH TAXES | PENALTIES | PENALTIES | TOTAL | REMITTANCE | LC | ||||||||||||||||||
| Prior to 2014 |
1 | 22 | 36 | 59 | 59 | — | ||||||||||||||||||
| 2014 |
106 | 47 | — | 153 | 153 | — | ||||||||||||||||||
| 2015 |
202 | 71 | 79 | 352 | 20 | 332 | ||||||||||||||||||
| 2016 |
51 | 38 | 31 | 120 | 32 | 88 | ||||||||||||||||||
| 2017 |
— | 1 | 39 | 40 | 39 | 1 | ||||||||||||||||||
| 2018 |
17 | 40 | — | 57 | — | 57 | ||||||||||||||||||
| 2019 |
— | 2 | — | 2 | — | 2 | ||||||||||||||||||
| 2020 |
— | 2 | — | 2 | — | 2 | ||||||||||||||||||
|
|
|
|
|
|
|
|
|
|
|
|
|
|||||||||||||
| Total |
377 | 223 | 185 | 785 | 303 | 482 | ||||||||||||||||||
|
|
|
|
|
|
|
|
|
|
|
|
|
|||||||||||||
If leave to appeal is granted by the Supreme Court, we expect the prior court decisions to be upheld and believe they should also apply in principle to subsequent years. We expect any further actions regarding the tax years 2007 through 2014 will be suspended until the three years covered under the decision are finally resolved. For 2014, CRA has recently reassessed us on the same basis as previous tax years, but has also proposed an alternative reassessing position that, if applied, would result in a less adverse, albeit still material, adjustment to our income taxable in Canada. This proposed new basis of reassessment is inconsistent with the methodology CRA has pursued for prior years and is being assessed. Our initial view is that this alternative methodology will not result in a materially different outcome for 2014. Until such time as all appeals are exhausted and a resolution is reached for each of the tax years in question, we will not be in a position to determine the definitive outcome of this dispute for that tax year.
Despite the fact that we believe there is no basis to do so, and it is not our view of the likely outcome, CRA may continue to reassess us using the methodology it used to reassess the 2003 through 2014 tax years. In that scenario, and including the $6.6 billion already reassessed, we would expect to receive notices of reassessment for a total of up to approximately $8.7 billion of additional income taxable in Canada for the years 2003 through 2020, which would result in a related tax expense of up to approximately $2.6 billion. As well, CRA may continue to apply transfer pricing penalties to taxation years subsequent to 2011. In that case, we estimate that cash taxes and transfer pricing penalties claimed by CRA for these years would be between $1.95 billion and $2.15 billion. In addition, CRA may seek to apply interest and instalment penalties that would be material to us. While in dispute, we may be required to remit or otherwise provide security for 50% of the cash taxes and transfer pricing penalties (between $970 million and $1.07 billion), plus related interest and instalment penalties assessed, which would be material to us. However, as noted previously, CRA has informed us that no further security is required for the tax debts it considers owing at this time. We have already paid or secured $562 million in cash taxes and transfer pricing penalties and $223 million in interest and instalment penalties. CRA may also advance alternative reassessment methodologies for years other than 2003, 2005 and 2006, such as the alternative reassessing position advanced for 2014.
| 40 | CAMECO CORPORATION |
Under the Canadian federal and provincial tax rules, any amount required to be paid or secured each year will depend on the amount of income reassessed in that year and the availability of elective deductions and tax loss carryovers. CRA has to date disallowed the use of any loss carry-backs for any transfer pricing adjustment, starting with the 2008 tax year. This does not impact the anticipated income tax expense for a particular year but does impact the timing of any required security or payment. As noted above, for amounts reassessed after 2014, as an alternative to remitting cash, we used letters of credit to satisfy our obligations related to the reassessed income tax and related interest amounts. If required, we believe we will be able to continue to provide security in the form of letters of credit to satisfy these requirements. The amounts summarized in the table below reflect actual amounts paid or secured from 2003 through 2020 along with estimated post-2020 amounts if CRA were to continue to reassess based on the scenario outlined above and include the expected timing adjustment for the inability to use any loss carry-backs starting with the 2008 tax year. The amounts have not been adjusted to reflect the refund of approximately $5.5 million plus interest we expect to receive based on the ruling of the Tax Court. The timing of such refund may be delayed pending the outcome of the application for leave to appeal. We plan to update this table annually to include the estimated impact of reassessments expected for completed years subsequent to 2020.
| $ MILLIONS |
2003-2020 | Post-2020 | TOTAL | |||||||||
| 50% of cash taxes and transfer pricing penalties paid, secured or potentially owing in the period |
|
|||||||||||
| Cash payments |
226 | 185 - 235 | 410 - 460 | |||||||||
| Secured by letters of credit |
336 | 225 - 275 | 560 - 610 | |||||||||
|
|
|
|
|
|
|
|||||||
| Total paid or potentially owing1 |
562 | 410 - 510 | 970 - 1070 | |||||||||
|
|
|
|
|
|
|
|||||||
| 1 | These amounts do not include interest and instalment penalties, which totaled approximately $223 million to December 31, 2020. |
Based on the Court of Appeal and Tax Court decisions as described above and our view of the likely outcome if the Supreme Court decides to hear the appeal, and the dispute for subsequent years, we expect to recover all or substantially all of the $785 million already paid or otherwise secured to date.
| MANAGEMENT’S DISCUSSION AND ANALYSIS | 41 |
Caution about forward-looking information relating to our CRA tax dispute
This discussion of our expectations relating to our tax dispute with CRA and future tax reassessments by CRA is forward-looking information that is based upon the assumptions and subject to the material risks discussed under the heading Caution about forward-looking information beginning on page 2 and also on the more specific assumptions and risks listed below. Actual outcomes may vary significantly.
Tax outlook for 2021
Given the ongoing uncertainty about the impact of the COVID-19 pandemic on production at the Cigar Lake mine, and on production at the Inkai operation, we do not have enough certainty to provide tax outlook.
Our consolidated tax rate is a blend of the statutory rates applicable to taxable income earned or tax losses incurred in Canada and in our foreign subsidiaries. We have a global customer base and we have established a marketing and trading structure involving foreign subsidiaries, which entered into various intercompany purchase and sale arrangements, as well as uranium purchase and sale agreements with third parties. Cameco and its subsidiaries made reasonable efforts to put arm’s-length transfer pricing arrangements in place, and these arrangements expose the parties to the risks and rewards accruing to them under these contracts. The intercompany contract prices are generally comparable to those established in comparable contracts between arm’s-length parties entered into at that time. In 2017, we changed our global marketing organization to consolidate our international activities in Canada in order to achieve efficiencies. The existing purchase and sale arrangements will continue to be in place until they expire. As the existing contracts expire, we anticipate that more income will be earned in Canada.
We continue to expect our consolidated tax rate will trend toward the Canadian statutory rate in the longer term. The actual effective tax rate will vary from year-to-year, primarily due to the actual distribution of earnings among jurisdictions and the market conditions at the time transactions occur under both our intercompany and third-party purchase and sale arrangements.
| 42 | CAMECO CORPORATION |
FOREIGN EXCHANGE
The exchange rate between the Canadian dollar and US dollar affects the financial results of our uranium and fuel services segments.
We sell the majority of our uranium and fuel services products under long-term sales contracts, which are routinely denominated in US dollars. Our product purchases are denominated in US dollars while our production costs are largely denominated in Canadian dollars. To provide cash flow predictability we hedge a portion of our net US/Cdn exposure (e.g. total US dollar sales less US dollar expenditures and product purchases) to manage shorter term exchange rate volatility.
Our risk management policy is based on a 60-month period and permits us to hedge 35% to 100% of our expected net exposure in the first 12-month period. Our normal practice is to layer in hedge contracts over a three- to four-year period with the hedge percentage being highest in the first 12 months and decreasing hedge percentages in subsequent years. The portion of our net exposure that remains unhedged is subject to prevailing market exchange rates for the period. Therefore, our results are affected by the movements in the exchange rate on our hedge portfolio (explained below), and on the unhedged portion of our net exposure. A weakening Canadian dollar would have a positive effect on the unhedged exposure, and a strengthening Canadian dollar would have a negative effect
Impact of hedging on IFRS earnings
We do not use hedge accounting under IFRS and, therefore, we are required to report gains and losses on all hedging activity, both for contracts that close in the period and those that remain outstanding at the end of the period. For the contracts that remain outstanding, we must treat them as though they were settled at the end of the reporting period (mark-to-market).
However, we do not believe the gains and losses that we are required to report under IFRS appropriately reflect the intent of our hedging activities, so we make adjustments in calculating our ANE to better reflect the impact of our hedging program in the applicable reporting period.
Impact of hedging on ANE
We designate contracts for use in particular periods, based on our expected net exposure in that period. Hedge contracts are layered in over time based on this expected net exposure. The result is that our current hedge portfolio is made up of a number of contracts which are currently designated to net exposures we expect in 2021 and future years and we will recognize the gains or losses in ANE in those periods.
For the purposes of ANE, gains and losses on derivatives are reported based on the difference between the effective hedge rate of the contracts designated for use in the particular period and the exchange rate at the time of settlement. This results in an adjustment to current period IFRS earnings to effectively remove reported gains or losses on derivatives that arise from contracts put in place for use in future periods. The effective hedge rate will lag the market in periods of rapid currency movement. See Non-IFRS measures on page 35.
The table below provides a summary of our hedge portfolio at December 31, 2020. You can use this information to estimate the expected gains or losses on derivatives for 2021 on an ANE basis. However, if we add contracts to the portfolio that are designated for use in 2021 or if there are changes in the US/Cdn exchange rates in the year, those expected gains or losses could change.
| MANAGEMENT’S DISCUSSION AND ANALYSIS | 43 |
HEDGE PORTFOLIO SUMMARY
| DECEMBER 31, 2020 | AFTER | |||||||||||||||
| ($ MILLIONS) |
2021 | 2021 | TOTAL | |||||||||||||
| US dollar forward contracts |
($ millions) | 190 | 220 | 410 | ||||||||||||
| Average contract rate 1 |
(US/Cdn dollar) | 1.33 | 1.35 | 1.34 | ||||||||||||
| US dollar option contracts |
($ millions) | 125 | 160 | 285 | ||||||||||||
| Average contract rate range1 |
(US/Cdn dollar) | 1.30 to 1.34 | 1.33 to 1.37 | 1.32 to 1.36 | ||||||||||||
| Total US dollar hedge contracts |
($ millions) | 315 | 380 | 695 | ||||||||||||
| Effective hedge rate range2 |
(US/Cdn dollar) | 1.32 to 1.33 | 1.34 to 1.36 | 1.33 to 1.35 | ||||||||||||
| Hedge ratio3 |
41 | % | 9 | % | 14 | % | ||||||||||
| 1 | The average contract rate is the weighted average of the rates stipulated in the outstanding contracts. |
| 2 | The effective hedge rate is the exchange rate on the original hedge contract at the time it was established and designated for use. Therefore, the effective hedge rate range shown reflects an average of contract exchange rates at the time of designation. |
| 3 | Hedge ratio is calculated by dividing the amount (in foreign currency) of outstanding derivative contracts by estimated future net exposures. |
At December 31, 2020:
| • | The value of the US dollar relative to the Canadian dollar was $1.00 (US) for $1.27 (Cdn), down from $1.00 (US) for $1.30 (Cdn) at December 31, 2019. The exchange rate averaged $1.00 (US) for $1.34 (Cdn) over the year. |
| • | The mark-to-market position on all foreign exchange contracts was a $41 million gain compared to a $4 million loss at December 31, 2019. |
We manage counterparty risk associated with hedging by dealing with highly rated counterparties and limiting our exposure. At December 31, 2020, all of our hedging counterparties had a Standard & Poor’s (S&P) credit rating of A or better.
For information on the impact of foreign exchange on our intercompany balances, see note 26 to the financial statements.
| 44 | CAMECO CORPORATION |
Outlook for 2021
Our strategy is to focus on our tier-one assets and profitably produce at a pace aligned with market signals, in order to preserve the value of those assets and increase long-term value, and to do that with a focus on safety, people and the environment.
Our outlook for 2021 reflects the expenditures necessary to help us achieve our strategy. We have made significant progress in reducing our administration, exploration and operating costs, as well as our capital expenditures. We have also made a number of strategic decisions that come with significant costs in the near term, costs we factored into our decisions. As in prior years, care and maintenance costs for the ongoing outage of McArthur River and Key Lake operations and our tier-two assets are expected to be between $150 million and $170 million. Despite the impact on our expected results, we continue to believe these are the right decisions to create long-term value. In addition, we expect to incur care and maintenance costs of between $8 million to $10 million per month while production at Cigar Lake is suspended due to the risks posed by the COVID-19 pandemic.
Given the ongoing uncertainty about the impact of the COVID-19 pandemic on production at the Cigar Lake mine, and on production at the Inkai operation, we do not have enough certainty to provide full outlook information for the uranium segment.
We expect our business to be resilient. We have provided outlook for our sales commitments, which we do not expect to be materially impacted by the disruptions to our business as a result of the COVID-19 pandemic. We expect, given the current production disruptions at Cigar Lake, that we will continue to purchase material on the spot market to meet our delivery commitments and maintain our desired level of inventory. Combined with additional care and maintenance costs associated with the temporary closure of Cigar Lake, we expect these items will again negatively impact our uranium gross margin. The exact magnitude of this impact is uncertain and will be dependent on the length of the temporary closure and our ability to safely return to production.
From a cash perspective, we expect to continue to maintain a significant cash balance. We expect to continue to generate cash from operations however, the amount of cash generated will be dependent on the timing and magnitude of our purchasing activity and therefore, cash balances may fluctuate throughout the year.
See 2020 Financial results by segment on page 53 for details.
2020 outlook compared to actual
In April of 2020 we withdrew our outlook due to the uncertainty created by the COVID-19 pandemic. Based on the restart of the Cigar Lake mine in September after the first production suspension, in the second quarter we set a production target for Cigar Lake of up to 5.3 million pounds (our share). We achieved 5.0 million pounds prior to a second suspension of production at Cigar Lake. The second suspension was a result of the workforce uncertainty caused by the COVID-19 pandemic.
Our results were in-line with the updated production outlook we provided for fuel services in the second quarter MD&A.
| MANAGEMENT’S DISCUSSION AND ANALYSIS | 45 |
2021 FINANCIAL OUTLOOK
| CONSOLIDATED | URANIUM | FUEL SERVICES | ||||||||||
| Production (owned and operated properties) |
— | — | 12.5 to 13.5 million kgU | |||||||||
| Purchases |
— | 8 to 10 million lbs | — | |||||||||
| Sales/delivery volume |
— | 23 to 25 million lbs | 12 to 13 million kgU | |||||||||
| Revenue |
— | — | $ | 360-390 million | ||||||||
| Average unit cost of sales (including D&A) |
— | — | $ | 20.50-21.50/kgU | ||||||||
| Direct administration costs |
$ | 110-120 million | — | — | ||||||||
| Exploration costs |
— | $ | 9 million | — | ||||||||
| Expected gain on derivatives - ANE basis |
$ | 5-15 million | — | — | ||||||||
| Capital expenditures |
$ | 130-155 million | — | — | ||||||||
We do not provide an outlook for the items in the table that are marked with a dash.
The following assumptions were used to prepare the outlook in the table above:
| • | Purchases – are based on the volumes we currently have commitments to acquire under contract in 2021, including our JV Inkai purchases, in order to meet the sales/delivery commitments we have under contract in 2021 and maintain a working inventory. It does not include any purchasing required as a result of the impact of the pandemic on our production rate at Cigar Lake. |
| • | Our 2021 outlook for sales/delivery volume does not include sales between our uranium and fuel services segments. |
| • | Sales/delivery volume is based on the volumes we currently have commitments to deliver under contract in 2021. |
| • | Direct administration costs do not include stock-based compensation expenses. See page 38 for more information. |
Our 2021 financial outlook is presented on the basis of equity accounting for our minority ownership interest in JV Inkai. Under equity accounting, our share of the profits earned by JV Inkai on the sale of its production will be included in “income from equity-accounted investees” on our consolidated statement of earnings. Our share of production will be purchased at a discount to the spot price and included at this value in inventory. In addition, JV Inkai capital is not included in our outlook for capital expenditures. Please see Inkai Planning for the future on pages 77 and 78 for more details.
PRICE SENSITIVITY ANALYSIS: URANIUM SEGMENT
The following table is not a forecast of prices we expect to receive. The prices we actually realize will be different from the prices shown in the table. It is designed to indicate how the portfolio of long-term contracts we had in place on December 31, 2020 would respond to different spot prices. In other words, we would realize these prices only if the contract portfolio remained the same as it was on December 31, 2020, and none of the assumptions we list below change.
We intend to update this table each quarter in our MD&A to reflect deliveries made and changes to our contract portfolio. As a result, we expect the table to change from quarter to quarter.
| 46 | CAMECO CORPORATION |
Expected realized uranium price sensitivity under various spot price assumptions
(rounded to the nearest $1.00)
| SPOT PRICES | ||||||||||||||||||||||||||||
| ($US/lb U3O8) |
$20 | $40 | $60 | $80 | $100 | $120 | $140 | |||||||||||||||||||||
| 2021 |
28 | 38 | 49 | 56 | 62 | 66 | 70 | |||||||||||||||||||||
| 2022 |
27 | 39 | 52 | 60 | 64 | 68 | 71 | |||||||||||||||||||||
| 2023 |
28 | 40 | 53 | 62 | 66 | 70 | 73 | |||||||||||||||||||||
| 2024 |
30 | 41 | 52 | 60 | 63 | 64 | 66 | |||||||||||||||||||||
| 2025 |
30 | 41 | 55 | 64 | 69 | 72 | 75 | |||||||||||||||||||||
The table illustrates the mix of long-term contracts in our December 31, 2020 portfolio, and is consistent with our marketing strategy. It has been updated to reflect contracts entered into up to December 31, 2020.
Our portfolio includes a mix of fixed-price and market-related contracts, which we target at a 40:60 ratio. Those that are fixed at lower prices or have low ceiling prices will yield prices that are lower than current market prices.
Our portfolio is affected by more than just the spot price. We made the following assumptions (which are not forecasts) to create the table:
Liquidity and capital resources
Our financial objective is to ensure we have the cash and debt capacity to fund our operating activities, investments and other financial obligations in order to execute our strategy and to allow us to self-manage risk. We have a number of alternatives to fund future capital requirements, including using our operating cash flow, drawing on our existing credit facilities, entering new credit facilities, and raising additional capital through debt or equity financings. We are always considering our financing options so we can take advantage of favourable market conditions when they arise. In addition, due to the deliberate cost reduction measures implemented over the past five years, we have continued to have positive cash from operations and as a result, we have significant cash balances.
At the end of 2020, we had cash and short-term investments of $943 million, while our total debt amounted to $1.0 billion.
We have large, creditworthy customers that continue to need uranium even during weak economic conditions, and we expect the uranium contract portfolio we have built to continue to provide a solid revenue stream. From 2021 through 2025, we have commitments to deliver an average of 16 million pounds per year, with commitment levels in 2021 and 2022 higher than in 2023 through 2025.
Strategically our focus is on preserving the value of our tier-one assets and reducing our operating, capital and general and administrative spending. In the current environment, the health and safety of our employees, their families and their communities is our priority as the COVID-19 pandemic continues to bring uncertainty. In 2020, we took measures to enhance our health and safety protocols as well we proactively suspended production. As a result of these measures, and a negative trend in the pandemic in Saskatchewan in December, currently production at our Cigar Lake mine is temporarily suspended. See Operations and projects beginning on page 62 for more information. Cash flow from operations will be dependent on how long production at Cigar Lake remains suspended and the timing and magnitude of our purchasing activity, therefore cash balances may fluctuate throughout the year. However, we expect our cash balances and operating cash flows to meet our capital requirements during 2021.
| MANAGEMENT’S DISCUSSION AND ANALYSIS | 47 |
We have now received two favourable rulings in our case with CRA for the 2003, 2005 and 2006 tax years. We continue to believe the rulings should apply in principle to subsequent tax years. However, CRA has submitted a request to seek leave to appeal to the Supreme Court. The Supreme Court will decide whether to hear the appeal or decline CRA’s request for leave. If the appeal is heard, we estimate that it could take until the second half of 2022 before a decision is rendered. Until we know whether an appeal to the Supreme Court will be heard, and a resolution is reached for all tax years in question, in accordance with Canadian income tax rules we may be required to remit or otherwise secure 50% of any cash taxes plus related interest and penalties CRA may continue to reassess, even though we believe there is no basis for them to do so. See page 39 for more information. In the above scenario, the table on page 41 provides the amount and timing of the cash taxes and transfer pricing penalties paid or secured to date. In addition, it provides an estimate of the amounts we may potentially have to pay or secure upfront if CRA continues to reassess us using the same methodology it reassessed the 2003 to 2014 tax years. The timing of these amounts is uncertain.
FINANCIAL CONDITION
| 2020 | 2019 | |||||||
| Cash position ($ millions) |
943 | 1,062 | ||||||
| (cash and cash equivalents and short-term investments) | ||||||||
| Cash provided by operations ($ millions) |
57 | 527 | ||||||
| (net cash flow generated by our operating activities after changes in working capital) | ||||||||
| Cash provided by operations/net debt1 |
109 | % | n/a | |||||
| (net debt is total consolidated debt, less cash position) | ||||||||
| Net debt/total capitalization1 |
1 | % | n/a | |||||
| (total capitalization is net debt and equity) | ||||||||
| 1 | As at December 31, 2019, Cameco’s net debt was negligible due to our strong cash position. |
CREDIT RATINGS
The credit ratings assigned by external ratings agencies are important as they impact our ability to raise capital at competitive pricing to support our business operations and execute our strategy.
Third-party ratings for our commercial paper and senior debt as of February 9, 2021:
| SECURITY |
DBRS | S&P | ||||||
| Commercial paper |
R-2 (middle) | A-3 | ||||||
| Senior unsecured debentures |
BBB | BBB- | ||||||
| Rating trend / rating outlook |
Stable | 1 | Negative | 2 | ||||
| 1 | On May 28, 2020, DBRS changed Cameco’s rating outlook to stable. |
| 2 | On March 11, 2020 S&P changed Cameco’s rating outlook to negative. |
The rating agencies may revise or withdraw these ratings if they believe circumstances warrant. The rating trend/outlook represents the rating agency’s assessment of the likelihood and direction that the rating could change in the future.
A change in our credit ratings could affect our cost of funding and our access to capital through the capital markets.
| 48 | CAMECO CORPORATION |
Liquidity
| ($ MILLIONS) |
2020 | 2019 | ||||||
| Cash and cash equivalents at beginning of year |
1,062 | 1,103 | ||||||
|
|
|
|
|
|||||
| Cash from operations |
57 | 527 | ||||||
|
|
|
|
|
|||||
| Investment activities |
||||||||
| Additions to property, plant and equipment and acquisitions |
(77 | ) | (75 | ) | ||||
| Other investing activities |
1 | 121 | ||||||
|
|
|
|
|
|||||
| Financing activities |
||||||||
| Change in debt |
(2 | ) | (500 | ) | ||||
| Interest paid |
(66 | ) | (72 | ) | ||||
| Other financing activities |
(3 | ) | (3 | ) | ||||
|
|
|
|
|
|||||
| Issue of shares |
5 | — | ||||||
|
|
|
|
|
|||||
| Dividends |
(32 | ) | (32 | ) | ||||
|
|
|
|
|
|||||
| Exchange rate on changes on foreign currency cash balances |
(2 | ) | (7 | ) | ||||
|
|
|
|
|
|||||
| Cash and cash equivalents and short-term investments at end of year |
943 | 1,062 | ||||||
|
|
|
|
|
|||||
CASH FROM OPERATIONS
Cash from operations was 89% lower than in 2019 due largely to the additional purchase activity and care and maintenance costs related to the unplanned suspensions of production due to the COVID-19 pandemic. Working capital provided $289 million less in 2020. Not including working capital requirements, our operating cash flows in the year were down $181 million. See note 23 to the financial statements.
INVESTING ACTIVITIES
Cash used in investing includes acquisitions and capital spending.
Capital spending
We classify capital spending as sustaining, capacity replacement or growth. As a mining company, sustaining capital is the money we spend to keep our facilities running in their present state, which would follow a gradually decreasing production curve, while capacity replacement capital is spent to maintain current production levels at those operations. Growth capital is money we invest to generate incremental production, and for business development.
Outlook for investing activities
| CAMECO’S SHARE ($ MILLIONS) |
2021 PLAN | 2022 PLAN | 2023 PLAN | |||||||||
| Total uranium & fuel services |
130-155 | 100-150 | 100-150 | |||||||||
|
|
|
|
|
|
|
|||||||
| Sustaining capital |
105-120 | 85-110 | 90-115 | |||||||||
| Capacity replacement capital |
25-35 | 15-40 | 10-35 | |||||||||
| Growth capital |
— | — | — | |||||||||
As a result of the uncertain impact of the COVID-19 pandemic on our operations, we are unable to more accurately provide an outlook by operation for capital spending. As a result, the ranges above represent our best estimate of total capital spend for 2021 and may be affected by the timing and length of temporary shutdowns at our operations.
We have assumed that the impact of the COVID-19 pandemic on our operations will be reduced for 2022 and 2023. Our 2021, 2022 and 2023 capital spending estimates also assume that market conditions remain such that McArthur River and Key Lake remain in care and maintenance. We expect total 2021 capital expenditures for uranium and fuel services to be between 70% and 100% higher than in 2020 due to the ongoing investment in the initiative intended to provide a greater focus on technology and its applications to improve efficiency and reduce costs including the use digital and automation technologies and the rescheduling of some expenditures planned in 2020 to 2021.
Our estimate for capital spending in 2022 has been increased to between $100 million and $150 million (previously between $50 million and $100 million) due to our continued investment in digital and automation technologies, along with the timing of expenditures on our Vision in Motion project.
Capital expenditures for JV Inkai are expected to be covered by JV Inkai cash flows in 2021 and are included in our overall equity investment.
| MANAGEMENT’S DISCUSSION AND ANALYSIS | 49 |
Major sustaining and capacity replacement expenditures in 2021 include:
| • | Fuel services – continuation of work on our Vision in Motion project |
| • | Cigar Lake – underground development and necessary ground freezing infrastructure to meet production targets |
| • | Our investment in digital and automation technologies |
This information regarding currently expected capital expenditures for future periods is forward-looking information and is based upon the assumptions and subject to the material risks discussed on pages 3 and 4. Our actual capital expenditures for future periods may be significantly different.
FINANCING ACTIVITIES
Cash from financing includes borrowing and repaying debt, and other financial transactions including paying dividends and providing financial assurance.
Long-term contractual obligations
| 2022 AND | 2024 AND | 2026 AND | ||||||||||||||||||
| DECEMBER 31 ($ MILLIONS) |
2021 | 2023 | 2025 | BEYOND | TOTAL | |||||||||||||||
| Long-term debt |
— | — | 500 | 500 | 1,000 | |||||||||||||||
| Interest on long-term debt |
38 | 76 | 44 | 110 | 268 | |||||||||||||||
| Provision for reclamation |
41 | 64 | 74 | 951 | 1,130 | |||||||||||||||
| Provision for waste disposal |
2 | 3 | 2 | 1 | 8 | |||||||||||||||
| Other liabilities |
7 | 9 | 3 | 86 | 105 | |||||||||||||||
| Capital commitments |
47 | — | — | — | 47 | |||||||||||||||
|
|
|
|
|
|
|
|
|
|
|
|||||||||||
| Total |
135 | 152 | 623 | 1,648 | 2,558 | |||||||||||||||
|
|
|
|
|
|
|
|
|
|
|
|||||||||||
We have contractual capital commitments of approximately $47 million at December 31, 2020. Certain of the contractual commitments may contain cancellation clauses; however, we disclose the commitments based on management’s intent to fulfil the contracts.
We have sufficient borrowing capacity with available unsecured lines of credit totalling about $2.7 billion, which include the following:
| • | A $1.0 billion unsecured revolving credit facility that matures November 1, 2023. Each year on the anniversary date, and upon mutual agreement, the facility can be extended for an additional year. We may increase the revolving credit facility above $1.0 billion, by increments of no less than $50 million, up to a total of $1.25 billion. The facility ranks equally with all of our other senior debt. At December 31, 2020, there were no amounts outstanding under this facility and we do not expect to draw on this facility in 2021. |
| • | At December 31, 2020, we had approximately $1.6 billion outstanding in financial assurances provided by various financial institutions. We use these facilities mainly to provide financial assurance for future decommissioning and reclamation of our operating sites, for our obligations relating to the CRA dispute, and as overdraft protection. |
In total we have $1.0 billion in senior unsecured debentures outstanding:
| • | $500 million bearing interest at 4.19% per year, maturing on June 24, 2024 |
| • | $400 million bearing interest at 2.95% per year, maturing on October 21, 2027 |
| • | $100 million bearing interest at 5.09% per year, maturing on November 14, 2042 |
On October 21, 2020, we issued debentures in the amount of $400 million, at an interest rate of 2.95% per annum and the proceeds were used to redeem our outstanding $400 million debenture bearing interest of 3.75%, resetting the maturity from 2022 to 2027 and resulting in an early redemption fee of $24 million.
Debt covenants
Our revolving credit facility includes the following financial covenants:
| • | our funded debt to tangible net worth ratio must be 1:1 or less |
| • | other customary covenants and events of default |
| 50 | CAMECO CORPORATION |
Funded debt is total consolidated debt less non-recourse debt, $100 million in letters of credit, cash and short-term investments.
Not complying with any of these covenants could result in accelerated payment and termination of our revolving credit facility. At December 31, 2020, we complied with all covenants, and we expect to continue to comply in 2021.
OFF-BALANCE SHEET ARRANGEMENTS
We had three kinds of off-balance sheet arrangements at the end of 2020:
| • | purchase commitments |
| • | financial assurances |
| • | other arrangements |
Purchase commitments
We make purchases under long-term contracts where it is beneficial for us to do so and in order to support our long-term contract portfolio. The following table is based on our purchase commitments in our uranium and fuel services segments, as well as commitments previously contracted by our subsidiary NUKEM, at December 31, 20202 but does not include purchases of our share of Inkai production. These commitments include a mix of fixed-price and market-related contracts. Actual payments will be different as a result of changes to our purchase commitments and, in the case of contracts with market-related pricing, the market prices in effect at the time of delivery. We will update this table as required in our MD&A to reflect material changes to our purchase commitments and changes in the prices used to estimate our commitments under market-related contracts.
| 2022 AND | 2024 AND | 2026 AND | ||||||||||||||||||
| DECEMBER 31, 2020 ($ MILLIONS) |
2021 | 2023 | 2025 | BEYOND | TOTAL | |||||||||||||||
| Purchase commitments1,2 |
217 | 156 | 130 | 411 | 914 | |||||||||||||||
| 1 | Denominated in US dollars and Japanese yen, converted from US dollars to Canadian dollars at the rate of 1.30 and from Japanese yen to Canadian dollars at the rate of $0.01. |
| 2 | These amounts have been adjusted for any additional purchase commitments that we have entered into since December 31, 2020 but does not include deliveries taken under contract since December 31, 2020. |
We have commitments of $914 million (Cdn) for the following:
| • | approximately 20 million pounds of U3O8 equivalent from 2021 to 2028 |
| • | about 0.1 million Separative Work Units (SWU) of enrichment services to meet existing forward sales commitments under agreements with a non-Western supplier |
The suppliers do not have the right to terminate agreements other than pursuant to customary events of default provisions.
Financial assurances
We use standby letters of credit and surety bonds mainly to provide financial assurance for the decommissioning and reclamation of our mining and conversion facilities as well as for our obligations relating to the CRA dispute. We are required to provide financial assurances to various regulatory agencies until decommissioning and reclamation activities are complete. We are also providing letters of credit until the CRA dispute is resolved. Our financial assurances renew automatically on an annual basis, unless otherwise advised by the issuing institution. At December 31, 2020 our financial assurances totaled $1.6 billion, up from $1.5 billion at December 31, 2019. The increase in 2020 was mainly due to some short-term requirements.
Other arrangements
We have arranged for standby product loan facilities with various counterparties. The arrangements allow us to borrow up to 2.0 million kgU of UF6 conversion services and 2.6 million pounds of U3O8 over the period 2020 to 2023 with repayment in kind up to December 31, 2023. Under the loan facilities, standby fees of up to 1% are payable based on the market value of the facilities and interest is payable on the market value of any amounts drawn at rates ranging from 0.5% to 2.0%. During the year, we drew 0.5 million kgU of UF6 conversion services and 1.2 million pounds of U3O8 on the loans. At December 31, 2020, only the conversion services loan was outstanding.
| MANAGEMENT’S DISCUSSION AND ANALYSIS | 51 |
BALANCE SHEET
| DECEMBER 31, 2020 | CHANGE | |||||||||||||||
| ($ MILLIONS EXCEPT PER SHARE AMOUNTS) |
2020 | 2019 | 2018 | 2019 TO 2020 | ||||||||||||
| Inventory |
680 | 321 | 468 | 112 | % | |||||||||||
| Total assets |
7,581 | 7,427 | 8,019 | 2 | % | |||||||||||
| Long-term financial liabilities |
2,253 | 2,099 | 2,102 | 7 | % | |||||||||||
| Dividends per common share |
0.08 | 0.08 | 0.08 | — | ||||||||||||
Total product inventories increased by 112% to $680 million this year due to lower sales volumes than the quantities produced and purchased during the year. There has been an increase in purchased inventory due to production suspensions. At December 31, 2020, our average cost for uranium was $38.09 per pound, up from $33.41 per pound at December 31, 2019. As of December 31, 2020, we held an inventory of 15.3 million pounds of U3O8 equivalent (excluding broken ore).
At the end of 2020, our total assets amounted to $7.6 billion, an increase of $0.2 billion compared to 2019, due mainly to higher inventories. In 2019, the total asset balance decreased by $0.6 billion compared to 2018, due to a decrease in cash and investment balances resulting from the repayment of long-term debt, offset by strong cash flow from operations. In addition, lower inventories, the repayment of our loan to JV Inkai and ongoing depreciation on our property, plant and equipment impacted our total assets.
The major components of long-term financial liabilities are long-term debt, the provision for reclamation, deferred sales and financial derivatives.
| 52 | CAMECO CORPORATION |
2020 financial results by segment
Uranium
| HIGHLIGHTS |
2020 | 2019 | CHANGE | |||||||||||||
| Production volume (million lbs) |
5.0 | 9.0 | (44 | )% | ||||||||||||
| Sales volume (million lbs) |
30.6 | 31.5 | (3 | )% | ||||||||||||
| Average spot price |
($ | US/lb | ) | 29.96 | 25.64 | 17 | % | |||||||||
| Average long-term price |
($ | US/lb | ) | 34.63 | 31.75 | 9 | % | |||||||||
| Average realized price |
($ | US/lb | ) | 34.39 | 33.77 | 2 | % | |||||||||
| ($ | Cdn/lb | ) | 46.14 | 44.85 | 3 | % | ||||||||||
| Average unit cost of sales (including D&A) |
($ | Cdn/lb | ) | 45.71 | 39.99 | 14 | % | |||||||||
| Revenue ($ millions) |
1,412 | 1,414 | — | |||||||||||||
| Gross profit ($ millions) |
13 | 153 | (92 | )% | ||||||||||||
| Gross profit (%) |
1 | 11 | (91 | )% | ||||||||||||
Production volumes in 2020 decreased by 44% compared to 2019. See Uranium – production overview on page 66 for more information.
Uranium revenues this year were unchanged compared to 2019 due to a decrease in sales volumes of 3% offset by an increase of 3% in the Canadian dollar average realized price. Although the spot price for uranium averaged $29.96 (US) per pound in 2020, an increase of 17% compared to the 2019 average price of $25.64 (US) per pound, the average realized price was only 3% higher compared to the same period in 2019 primarily due to lower prices on fixed-price contracts and less sensitivity to price changes due to floor prices in the market-related contracts delivered into in 2019.
Total cost of sales (including D&A) increased by 11% ($1.40 billion compared to $1.26 billion in 2019) due to a 14% increase in unit cost of sales partially offset by a decrease in sales volume of 3%. Unit cost of sales is higher than in the same period in 2019 due to the higher cost of purchased material and additional care and maintenance costs of $46 million resulting from our proactive decision to suspend production at the Cigar Lake mine in response to the threat posed by the COVID-19 pandemic.
The net effect was a $140 million decrease in gross profit for the year.
The following table shows the costs of produced and purchased uranium incurred in the reporting periods (non-IFRS measures, see below). These costs do not include care and maintenance costs, selling costs such as royalties, transportation and commissions, nor do they reflect the impact of opening inventories on our reported cost of sales.
| ($CDN/LB) |
2020 | 2019 | CHANGE | |||||||||
| Produced |
||||||||||||
| Cash cost |
16.24 | 15.70 | 3 | % | ||||||||
| Non-cash cost |
15.10 | 16.09 | (6 | )% | ||||||||
|
|
|
|
|
|
|
|||||||
| Total production cost 1 |
31.34 | 31.79 | (1 | )% | ||||||||
|
|
|
|
|
|
|
|||||||
| Quantity produced (million lbs)1 |
5.0 | 9.0 | (44 | )% | ||||||||
|
|
|
|
|
|
|
|||||||
| Purchased |
||||||||||||
| Cash cost1 |
40.41 | 35.26 | 15 | % | ||||||||
|
|
|
|
|
|
|
|||||||
| Quantity purchased (million lbs)1 |
33.5 | 19.0 | 76 | % | ||||||||
|
|
|
|
|
|
|
|||||||
| Totals |
||||||||||||
| Produced and purchased costs |
39.23 | 34.14 | 15 | % | ||||||||
|
|
|
|
|
|
|
|||||||
| Quantities produced and purchased (million lbs) |
38.5 | 28.0 | 38 | % | ||||||||
|
|
|
|
|
|
|
|||||||
| 1 | Due to equity accounting for JV Inkai, our share of production is shown as a purchase at the time of delivery. JV Inkai purchases will fluctuate during the quarters and timing of purchases will not match production. In 2020 we purchased 4.0 million pounds at a purchase price per pound of $36.63 ($27.66 (US)) (2019 - 3.5 million pounds at a purchase price per pound of $32.43 ($24.37 (US))). |
| MANAGEMENT’S DISCUSSION AND ANALYSIS | 53 |
The average cash cost of production was 3% higher in the year than in 2019 as a result of lower production. Due to the impacts of the COVID-19 pandemic and the suspension of production at Cigar Lake, our cost of production was higher than in 2019. While McArthur River and Key Lake are shut down, our annual cost of production is expected to reflect the estimated life-of-mine operating cost, between $15 and $16 per pound, of mining and milling our share of Cigar Lake mineral reserves. However, our cash production costs in 2021 may be impacted by the timing of the restart and the production rate of Cigar Lake and may fluctuate from quarter to quarter.
The benefit of the estimated life-of-mine operating cost for Inkai’s production of between $8 and $9 per pound, is expected to be reflected in the line item on our statement of earnings called “share of earnings from equity-accounted investee”.
Although purchased pounds are transacted in US dollars, we account for the purchases in Canadian dollars. In the year, the average cash cost of purchased material was $40.41 (Cdn), or $29.69 (US) per pound, compared to $35.26 (Cdn), or $26.49 (US) per pound in the same period in 2019.
Cash cost per pound, non-cash cost per pound and total cost per pound for produced and purchased uranium presented in the above table are non-IFRS measures. These measures do not have a standardized meaning or a consistent basis of calculation under IFRS. We use these measures in our assessment of the performance of our uranium business. We believe that, in addition to conventional measures prepared in accordance with IFRS, certain investors use this information to evaluate our performance and ability to generate cash flow.
These measures are non-standard supplemental information and should not be considered in isolation or as a substitute for measures of performance prepared according to accounting standards. These measures are not necessarily indicative of operating profit or cash flow from operations as determined under IFRS. Other companies may calculate these measures differently, so you may not be able to make a direct comparison to similar measures presented by other companies.
To facilitate a better understanding of these measures, the following table presents a reconciliation of these measures to our unit cost of sales for the years ended 2020 and 2019 as reported in our financial statements.
CASH AND TOTAL COST PER POUND RECONCILIATION
| ($ MILLIONS) |
2020 | 2019 | ||||||
| Cost of product sold |
1,244.0 | 1,041.9 | ||||||
| Add / (subtract) |
||||||||
| Royalties |
(15.5 | ) | (32.5 | ) | ||||
| Other selling costs |
(12.1 | ) | (10.5 | ) | ||||
| Care and maintenance and severance costs |
(138.5 | ) | (109.5 | ) | ||||
| Change in inventories |
357.0 | (78.2 | ) | |||||
|
|
|
|
|
|||||
| Cash operating costs (a) |
1,434.9 | 811.2 | ||||||
| Add / (subtract) |
||||||||
| Depreciation and amortization |
154.6 | 218.8 | ||||||
| Care and maintenance costs |
(57.5 | ) | (44.4 | ) | ||||
| Change in inventories |
(21.6 | ) | (29.6 | ) | ||||
|
|
|
|
|
|||||
| Total operating costs (b) |
1,510.4 | 956.0 | ||||||
|
|
|
|
|
|||||
| Uranium produced & purchased (million lbs) (c) |
38.5 | 28.0 | ||||||
|
|
|
|
|
|||||
| Cash costs per pound (a ÷ c) |
37.27 | 28.97 | ||||||
| Total costs per pound (b ÷ c) |
39.23 | 34.14 | ||||||
|
|
|
|
|
|||||
| 54 | CAMECO CORPORATION |
ROYALTIES
We pay royalties on the sale of all uranium extracted at our mines in the province of Saskatchewan. Two types of royalties are paid:
| • | Basic royalty: calculated as 5% of gross sales of uranium, less the Saskatchewan resource credit of 0.75%. |
| • | Profit royalty: a 10% royalty is charged on profit up to and including $24.22/kg U3O8 ($10.99/lb) and a 15% royalty is charged on profit in excess of $24.22/kg U3O8. Profit is determined as revenue less certain operating, exploration, reclamation and capital costs. Both exploration and capital costs are deductible at the discretion of the producer. |
As a resource corporation in Saskatchewan, we also pay a corporate resource surcharge of 3% of the value of resource sales.
URANIUM SEGMENT OUTLOOK
In mid-December 2020, we announced a second suspension of production at Cigar Lake as a result of the impacts of the COVID-19 pandemic. This suspension continues into 2021 and due to the uncertainty this creates we are unable to provide a full outlook for the uranium segment.
Based on the contracts we have in place, and not including sales between our segments, we expect to deliver between 23 million and 25 million pounds of U3O8 in 2021.
In addition, we expect to purchase between 8 million and 10 million pounds in 2021 to meet our sales commitments and maintain a working inventory. This includes our spot market purchases and other purchase commitments, including from JV Inkai, but It does not include any purchasing required as a result of the impact of the pandemic on our production rate at Cigar Lake.
Fuel services
| (includes results for UF6, UO2, UO3 and fuel fabrication) | ||||||||||||||||
| HIGHLIGHTS |
2020 | 2019 | CHANGE | |||||||||||||
| Production volume (million kgU) |
11.7 | 13.3 | (12 | )% | ||||||||||||
| Sales volume (million kgU) |
13.5 | 14.1 | (4 | )% | ||||||||||||
| Average realized price |
($ | Cdn/kgU | ) | 27.89 | 26.21 | 6 | % | |||||||||
| Average unit cost of sales (including D&A) |
($ | Cdn/kgU | ) | 20.76 | 19.84 | 5 | % | |||||||||
| Revenue ($ millions) |
377 | 370 | 2 | % | ||||||||||||
| Gross profit ($ millions) |
96 | 90 | 7 | % | ||||||||||||
| Gross profit (%) |
25 | 24 | 4 | % | ||||||||||||
Total revenue increased by 2% from 2019 due to a 6% increase in the realized price that was partially offset by a 4% decrease in sales volume. The increase in realized price was mainly the result of increased prices on the sale of UF6 due to market conditions.
Total cost of products and services sold (including D&A) remained relatively unchanged ($281 million compared to $280 million in 2019), due to the 4% decrease in sales volume being offset by a 5% increase in average unit cost of sales compared to 2019. The unit cost of sales was impacted by lower production volumes and the $9 million in care and maintenance costs incurred as a result of our proactive decision to suspend production for four weeks at the Blind River refinery and Port Hope UF6 conversion plant in response to the threat posed by the COVID-19 pandemic.
The net effect was a $6 million increase in gross profit.
FUEL SERVICES SEGMENT OUTLOOK
In 2021, we plan to produce 12.5 million to 13.5 million kgU, and we expect sales volumes, not including intersegment sales, to be 12 million to 13 million kgU. Overall revenue is expected to be between $360 million and $390 million, slightly lower than 2020 due to lower committed sales volumes. We expect the average unit cost of sales (including D&A) to be between $20.50/kgU and $21.50/kgU.
| MANAGEMENT’S DISCUSSION AND ANALYSIS | 55 |
Fourth quarter financial results
Consolidated results
| THREE MONTHS ENDED | ||||||||||||
| HIGHLIGHTS | DECEMBER 31 | |||||||||||
| ($ MILLIONS EXCEPT WHERE INDICATED) |
2020 | 2019 | CHANGE | |||||||||
| Revenue |
550 | 874 | (37 | )% | ||||||||
| Gross profit |
109 | 184 | (41 | )% | ||||||||
| Net earnings attributable to equity holders |
80 | 128 | (38 | )% | ||||||||
| $ per common share (basic) |
0.20 | 0.32 | (38 | )% | ||||||||
| $ per common share (diluted) |
0.20 | 0.32 | (38 | )% | ||||||||
| Adjusted net earnings (non-IFRS, see page 35) |
48 | 94 | (49 | )% | ||||||||
| $ per common share (adjusted and diluted) |
0.12 | 0.24 | (50 | )% | ||||||||
| Cash provided by operations (after working capital changes) |
257 | 274 | (6 | )% | ||||||||
NET EARNINGS
The following table shows what contributed to the change in net earnings and adjusted net earnings (non-IFRS measure, see page 35) in the fourth quarter of 2020 compared to the same period in 2019.
| ($ MILLIONS) |
IFRS | ADJUSTED | ||||||||
| Net earnings - 2019 |
128 | 94 | ||||||||
| Change in gross profit by segment |
||||||||||
| (we calculate gross profit by deducting from revenue the cost of products and services sold, and depreciation and amortization (D&A), net of hedging benefits) |
| |||||||||
| Uranium |
Lower sales volume |
(52 | ) | (52 | ) | |||||
| Higher realized prices ($US) |
29 | 29 | ||||||||
| Foreign exchange impact on realized prices |
(4 | ) | (4 | ) | ||||||
| Higher costs |
(33 | ) | (33 | ) | ||||||
|
|
|
|
|
|||||||
| change – uranium |
(60 | ) | (60 | ) | ||||||
|
|
|
|
|
|||||||
| Fuel services |
Lower sales volume |
(14 | ) | (14 | ) | |||||
| Higher realized prices ($Cdn) |
7 | 7 | ||||||||
| Higher costs |
(8 | ) | (8 | ) | ||||||
|
|
|
|
|
|||||||
| change – fuel services |
(15 | ) | (15 | ) | ||||||
|
|
|
|
|
|||||||
| Other changes |
||||||||||
| Higher administration expenditures |
(11 | ) | (11 | ) | ||||||
| Higher exploration expenditures |
(1 | ) | (1 | ) | ||||||
| Change in reclamation provisions |
(26 | ) | — | |||||||
| Change in gains or losses on derivatives |
28 | 3 | ||||||||
| Change in foreign exchange gains or losses |
6 | 6 | ||||||||
| Redemption of Series E debentures in 2020 |
(24 | ) | (24 | ) | ||||||
| Canadian Emergency Wage Subsidy in 2020 |
37 | 37 | ||||||||
| Change in income tax recovery or expense |
22 | 23 | ||||||||
| Other |
(4 | ) | (4 | ) | ||||||
|
|
|
|
|
|||||||
| Net earnings - 2020 |
80 | 48 | ||||||||
|
|
|
|
|
|||||||
| 56 | CAMECO CORPORATION |
ADJUSTED NET EARNINGS
We use adjusted net earnings, a non-IFRS measure, as a more meaningful way to compare our financial performance from period to period. See page 35 for more information. The following table reconciles adjusted net earnings with our net earnings.
| THREE MONTHS ENDED DECEMBER 31 |
||||||||
| ($ MILLIONS) |
2020 | 2019 | ||||||
| Net earnings attributable to equity holders |
80 | 128 | ||||||
| Adjustments |
||||||||
| Adjustments on derivatives |
(43 | ) | (18 | ) | ||||
| Reclamation provision adjustments |
— | (26 | ) | |||||
| Income taxes on adjustments |
11 | 10 | ||||||
|
|
|
|
|
|||||
| Adjusted net earnings |
48 | 94 | ||||||
|
|
|
|
|
|||||
Every quarter we are required to update the reclamation provisions for all operations based on new cash flow estimates, discount and inflation rates. This normally results in an adjustment to an asset retirement obligation asset in addition to the provision balance. When the assets of an operation have been written off due to an impairment, as is the case with our Rabbit Lake and US ISR operations, the adjustment is recorded directly to the statement of earnings as “other operating expense (income)”. See note 15 of our annual financial statements for more information. This amount has been excluded from our adjusted net earnings measure.
ADMINISTRATION
| THREE MONTHS ENDED DECEMBER 31 |
||||||||||||
| ($ MILLIONS) |
2020 | 2019 | CHANGE | |||||||||
| Direct administration |
31 | 32 | (3 | )% | ||||||||
| Stock-based compensation |
14 | 2 | 600 | % | ||||||||
|
|
|
|
|
|
|
|||||||
| Total administration |
45 | 34 | 32 | % | ||||||||
|
|
|
|
|
|
|
|||||||
Direct administration costs were $31 million in the quarter, $1 million lower than the same period last year. Stock-based compensation expenses were $12 million higher from the fourth quarter of 2019 due to the increase in our share price compared to the same period in 2019. See note 24 to the financial statements.
Quarterly trends
| HIGHLIGHTS | 2020 | 2019 | ||||||||||||||||||||||||||||||
| ($ MILLIONS EXCEPT PER SHARE AMOUNTS) |
Q4 | Q3 | Q2 | Q1 | Q4 | Q3 | Q2 | Q1 | ||||||||||||||||||||||||
| Revenue |
550 | 379 | 525 | 346 | 874 | 303 | 388 | 298 | ||||||||||||||||||||||||
| Net earnings (loss) attributable to equity holders |
80 | (61 | ) | (53 | ) | (19 | ) | 128 | (13 | ) | (23 | ) | (18 | ) | ||||||||||||||||||
| $ per common share (basic) |
0.20 | (0.15 | ) | (0.13 | ) | (0.05 | ) | 0.32 | (0.03 | ) | (0.06 | ) | (0.05 | ) | ||||||||||||||||||
| $ per common share (diluted) |
0.20 | (0.15 | ) | (0.13 | ) | (0.05 | ) | 0.32 | (0.03 | ) | (0.06 | ) | (0.05 | ) | ||||||||||||||||||
| Adjusted net earnings (loss) (non-IFRS, see page 35) |
48 | (78 | ) | (65 | ) | 29 | 94 | (2 | ) | (18 | ) | (33 | ) | |||||||||||||||||||
| $ per common share (adjusted and diluted) |
0.12 | (0.20 | ) | (0.16 | ) | 0.07 | 0.24 | (0.01 | ) | (0.04 | ) | (0.08 | ) | |||||||||||||||||||
| Cash provided by (used in) operations (after working capital changes) |
257 | (66 | ) | (316 | ) | 182 | 274 | 232 | (59 | ) | 80 | |||||||||||||||||||||
Key things to note:
| • | Our financial results are strongly influenced by the performance of our uranium segment, which accounted for 79% of consolidated revenues in the fourth quarter of 2020 and 76% of consolidated revenues in the fourth quarter of 2019. |
| • | The timing of customer requirements, which tends to vary from quarter to quarter, drives revenue in the uranium and fuel services segments. |
| • | Net earnings do not trend directly with revenue due to unusual items and transactions that occur from time to time. We use adjusted net earnings, a non-IFRS measure, as a more meaningful way to compare our results from period to period (see page 35 for more information). |
| MANAGEMENT’S DISCUSSION AND ANALYSIS | 57 |
| • | Cash from operations tends to fluctuate as a result of the timing of deliveries and product purchases in our uranium and fuel services segments. |
| • | Quarterly results are not necessarily a good indication of annual results due to the variability in customer requirements noted above. |
The table that follows presents the differences between net earnings and adjusted net earnings for the previous seven quarters.
| HIGHLIGHTS | 2020 | 2019 | ||||||||||||||||||||||||||||||
| ($ MILLIONS EXCEPT PER SHARE AMOUNTS) |
Q4 | Q3 | Q2 | Q1 | Q4 | Q3 | Q2 | Q1 | ||||||||||||||||||||||||
| Net earnings (loss) attributable to equity holders |
80 | (61 | ) | (53 | ) | (19 | ) | 128 | (13 | ) | (23 | ) | (18 | ) | ||||||||||||||||||
|
|
|
|
|
|
|
|
|
|
|
|
|
|
|
|
|
|||||||||||||||||
| Adjustments |
||||||||||||||||||||||||||||||||
| Adjustments on derivatives |
(43 | ) | (31 | ) | (41 | ) | 70 | (18 | ) | 9 | (17 | ) | (23 | ) | ||||||||||||||||||
| Reclamation provision adjustments |
— | 7 | 23 | (6 | ) | (26 | ) | 3 | 24 | 2 | ||||||||||||||||||||||
| Income taxes on adjustments |
11 | 7 | 6 | (16 | ) | 10 | (1 | ) | (2 | ) | 6 | |||||||||||||||||||||
|
|
|
|
|
|
|
|
|
|
|
|
|
|
|
|
|
|||||||||||||||||
| Adjusted net earnings (losses) (non-IFRS, see page 35) |
48 | (78 | ) | (65 | ) | 29 | 94 | (2 | ) | (18 | ) | (33 | ) | |||||||||||||||||||
|
|
|
|
|
|
|
|
|
|
|
|
|
|
|
|
|
|||||||||||||||||
| 58 | CAMECO CORPORATION |
Fourth quarter financial results by segment
Uranium
| THREE MONTHS ENDED | ||||||||||||||
| DECEMBER 31 | ||||||||||||||
| HIGHLIGHTS |
2020 | 2019 | CHANGE | |||||||||||
| Production volume (million lbs) |
2.8 | 2.7 | 4 | % | ||||||||||
| Sales volume (million lbs) |
8.6 | 14.0 | (39 | )% | ||||||||||
| Average spot price |
($US/lb) | 29.86 | 25.08 | 19 | % | |||||||||
| Average long-term price |
($US/lb) | 35.00 | 32.17 | 9 | % | |||||||||
| Average realized price |
($US/lb) | 38.43 | 35.92 | 7 | % | |||||||||
| ($Cdn/lb) | 50.40 | 47.50 | 6 | % | ||||||||||
| Average unit cost of sales (including D&A) |
($Cdn/lb) | 41.57 | 37.80 | 10 | % | |||||||||
| Revenue ($ millions) |
436 | 666 | (35 | )% | ||||||||||
| Gross profit ($ millions) |
76 | 136 | (44 | )% | ||||||||||
| Gross profit (%) |
17 | 20 | (15 | )% | ||||||||||
Production volumes this quarter were 4% higher compared to the fourth quarter of 2019. See Uranium – production overview on page 66 for more information.
Uranium revenues were down 35% due mainly to a 39% decrease in sales volume slightly offset by a 6% increase in the Canadian dollar average realized price. While the average spot price for uranium increased by 19% compared to the same period in 2019, our average realized price only increased by 6% as a result of lower prices on fixed-price contracts and less sensitivity to price changes due to floor prices in the market-related contracts delivered into. In addition, the Canadian dollar was slightly stronger compared to the same period last year, $1.00 (US) for $1.31 (Cdn) compared to $1.00 (US) for $1.32 (Cdn) in the fourth quarter of 2019.
Total cost of sales (including D&A) decreased by 33% ($348 million compared to $519 million in 2019). This was primarily the result of the 39% decrease in sales volume as the average unit cost of sales increased by 10% due to the higher cost of purchased material.
The net effect was a $60 million decrease in gross profit for the quarter. While the increase in the uranium price compared to 2019 has had a positive effect on our average realized price, the increase has also impacted the cost of our spot market purchases.
The following table shows the costs of produced and purchased uranium incurred in the reporting periods (which are non-IFRS measures, see the paragraphs below the table). These costs do not include care and maintenance costs, selling costs such as royalties, transportation and commissions, nor do they reflect the impact of opening inventories on our reported cost of sales.
| MANAGEMENT’S DISCUSSION AND ANALYSIS | 59 |
| THREE MONTHS ENDED | ||||||||||||
| DECEMBER 31 | ||||||||||||
| ($CDN/LB) |
2020 | 2019 | CHANGE | |||||||||
| Produced |
||||||||||||
| Cash cost |
13.48 | 17.21 | (22 | )% | ||||||||
| Non-cash cost |
14.62 | 15.54 | (6 | )% | ||||||||
| Total production cost 1 |
28.10 | 32.75 | (14 | )% | ||||||||
| Quantity produced (million lbs)1 |
2.8 | 2.7 | 4 | % | ||||||||
| Purchased |
||||||||||||
| Cash cost1 |
37.63 | 34.17 | 10 | % | ||||||||
|
|
|
|
|
|
|
|||||||
| Quantity purchased (million lbs)1 |
7.3 | 4.3 | 70 | % | ||||||||
|
|
|
|
|
|
|
|||||||
| Totals |
||||||||||||
| Produced and purchased costs |
34.99 | 33.62 | 4 | % | ||||||||
|
|
|
|
|
|
|
|||||||
| Quantities produced and purchased (million lbs) |
10.1 | 7.0 | 44 | % | ||||||||
|
|
|
|
|
|
|
|||||||
| 1 | Due to equity accounting for JV Inkai, our share of production will be shown as a purchase at the time of delivery. JV Inkai purchases will fluctuate during the quarters and timing of purchases will not match production. During the quarter, we purchased 2.7 million pounds at a purchase price per pound of $37.14 ($28.17 (US)) (Q4 2019 - 1.4 million pounds at a purchase price per pound of $32.18 ($24.40 (US))). |
The average cash cost of production was 22% lower for the quarter than in the comparable period in 2019 due to the timing of costs in 2019. While McArthur River and Key Lake are shut down, our annual cost of production is expected to reflect the estimated life-of-mine operating cost, between $15 and $16 per pound, of mining and milling our share of Cigar Lake mineral reserves, but it may fluctuate from quarter to quarter.
The benefit of the estimated life-of-mine operating cost for Inkai’s production of between $8 and $9 per pound, is expected to be reflected in the line item on our statement of earnings called “share of earnings from equity-accounted investee”.
Although purchased pounds are transacted in US dollars, we account for the purchases in Canadian dollars. In the fourth quarter, the average cash cost of purchased material was $37.63 (Cdn) per pound, or $28.58 (US) per pound in US dollar terms, compared to $34.17 (Cdn) per pound, or $25.87 (US) per pound in the fourth quarter of 2019.
Cash cost per pound, non-cash cost per pound and total cost per pound for produced and purchased uranium presented in the above table are non-IFRS measures. These measures do not have a standardized meaning or a consistent basis of calculation under IFRS. We use these measures in our assessment of the performance of our uranium business. We believe that, in addition to conventional measures prepared in accordance with IFRS, certain investors use this information to evaluate our performance and ability to generate cash flow.
These measures are non-standard supplemental information and should not be considered in isolation or as a substitute for measures of performance prepared according to accounting standards. These measures are not necessarily indicative of operating profit or cash flow from operations as determined under IFRS. Other companies may calculate these measures differently, so you may not be able to make a direct comparison to similar measures presented by other companies.
To facilitate a better understanding of these measures, the following table presents a reconciliation of these measures to our unit cost of sales for the fourth quarters of 2020 and 2019.
| 60 | CAMECO CORPORATION |
CASH AND TOTAL COST PER POUND RECONCILIATION
| THREE MONTHS ENDED | ||||||||
| DECEMBER 31 | ||||||||
| ($ MILLIONS) |
2020 | 2019 | ||||||
| Cost of product sold |
300.8 | 442.8 | ||||||
| Add / (subtract) |
||||||||
| Royalties |
(7.8 | ) | (14.3 | ) | ||||
| Other selling costs |
(1.3 | ) | (4.4 | ) | ||||
| Care and maintenance and severance costs |
(29.5 | ) | (29.7 | ) | ||||
| Change in inventories |
50.2 | (201.0 | ) | |||||
|
|
|
|
|
|||||
| Cash operating costs (a) |
312.4 | 193.4 | ||||||
| Add / (subtract) |
||||||||
| Depreciation and amortization |
58.6 | 87.4 | ||||||
| Care and maintenance costs |
(11.4 | ) | (11.5 | ) | ||||
| Change in inventories |
(6.2 | ) | (33.9 | ) | ||||
|
|
|
|
|
|||||
| Total operating costs (b) |
353.4 | 235.4 | ||||||
|
|
|
|
|
|||||
| Uranium produced & purchased (million lbs) (c) |
10.1 | 7.0 | ||||||
|
|
|
|
|
|||||
| Cash costs per pound (a ÷ c) |
30.93 | 27.63 | ||||||
| Total costs per pound (b ÷ c) |
34.99 | 33.63 | ||||||
|
|
|
|
|
|||||
Fuel services
(includes results for UF6, UO2, UO3 and fuel fabrication)
| THREE MONTHS ENDED | ||||||||||||||||
| DECEMBER 31 | ||||||||||||||||
| HIGHLIGHTS |
2020 | 2019 | CHANGE | |||||||||||||
| Production volume (million kgU) |
3.3 | 4.0 | (18 | )% | ||||||||||||
| Sales volume (million kgU) |
4.4 | 6.2 | (29 | )% | ||||||||||||
| Average realized price |
($Cdn/kgU) | 26.29 | 24.61 | 7 | % | |||||||||||
| Average unit cost of sales (including D&A) |
($Cdn/kgU) | 19.12 | 17.11 | 12 | % | |||||||||||
| Revenue ($ millions) |
115 | 152 | (24 | )% | ||||||||||||
| Gross profit ($ millions) |
32 | 47 | (32 | )% | ||||||||||||
| Gross profit (%) |
28 | 31 | (10 | )% | ||||||||||||
Total revenue decreased by 24% due to a 29% decrease in sales volumes partially offset by a 7% increase in average realized price. The increase in average realized price was due primarily to increased prices on the sale of UF6 due to market conditions.
Total cost of sales (including D&A) decreased by 22% to $83 million compared to the fourth quarter of 2019 due to the 29% decrease in sales volumes partially offset by an increase of 12% in the average unit cost of sales, due to the mix of product sold.
The net effect was a $15 million decrease in gross profit.
| MANAGEMENT’S DISCUSSION AND ANALYSIS | 61 |
Operations and projects
This section of our MD&A is an overview of the mining properties we operate or have an interest in, our curtailed operations and our projects, what we accomplished this year, our plans for the future and how we manage risk.
| 63 | MANAGING THE RISKS | |||
| 66 | URANIUM – PRODUCTION OVERVIEW | |||
| 66 | PRODUCTION OUTLOOK | |||
| 67 | URANIUM – TIER-ONE OPERATIONS | |||
| 67 | MCARTHUR RIVER MINE / KEY LAKE MILL | |||
| 71 | CIGAR LAKE | |||
| 76 | INKAI | |||
| 79 | URANIUM – TIER-TWO OPERATIONS | |||
| 79 | RABBIT LAKE | |||
| 80 | US ISR | |||
| 81 | URANIUM – ADVANCED PROJECTS | |||
| 81 | MILLENNIUM | |||
| 81 | YEELIRRIE | |||
| 81 | KINTYRE | |||
| 82 | URANIUM – EXPLORATION AND CORPORATE DEVELOPMENT | |||
| 83 | FUEL SERVICES | |||
| 83 | BLIND RIVER REFINERY | |||
| 84 | PORT HOPE CONVERSION SERVICES | |||
| 84 | CAMECO FUEL MANUFACTURING INC. (CFM) | |||
| 62 | CAMECO CORPORATION |
Managing the risks
The nature of our operations means we face many potential risks and hazards that could have a significant impact on our business. Our risk policy and program involves a broad, systematic approach to identifying, assessing, reporting and managing the significant risks we face in our business and operations, including ESG risks. The policy establishes clear accountabilities for enterprise risk management. We use a common risk matrix throughout the company and consider any risk that has the potential to significantly affect our ability to achieve our corporate objectives or strategic plan as an enterprise risk. However, there is no assurance we will be successful in preventing the harm any of these risks and hazards could cause. We recommend you read our most recent management proxy circular for more information about our risk oversight.
Below we list the risks that generally apply to all of our operations and advanced projects. We also talk about how we manage specific risks in each operation or project update. These risks could have a material impact on our business in the near term. These risks, however, are not a complete list of the potential risks our operations and advanced projects face. There may be others we are not aware of or risks we feel are not material today that could become material in the future.
We recommend you also review our annual information form, which includes a discussion of other material risks that could have an impact on our business.
Regulatory risks
A significant part of our economic value depends on our ability to:
| • | obtain and renew the licences and other approvals we need to operate, to increase production at our mines and to develop new mines. If we do not receive the regulatory approvals we need, or do not receive them at the right time, then we may have to delay, modify or cancel a project, which could increase our costs and delay or prevent us from generating revenue from the project. Regulatory review, including the review of environmental matters, is a long and complex process. |
| • | comply with the conditions in these licences and approvals. Our right to continue operating facilities, increase production at our mines and develop new mines depends on our compliance with these conditions. |
| • | comply with the extensive and complex laws and regulations that govern our activities. Environmental legislation imposes strict standards and controls on almost every aspect of our operations and projects, and is not only introducing new requirements, but also becoming more stringent. For example: |
| • | we must complete the environmental assessment process before we can begin developing a new mine or make any significant change to our operations |
| • | we may need regulatory approval to make changes to our operational processes, which can take a significant amount of time because it may require an extensive review of supporting technical information. The complexity of this process can be further compounded when regulatory approvals are required from multiple agencies. |
| • | the federal government has recently introduced a new Impact Assessment Act as well as a Canadian Navigable Waters Act along with significant revisions to the federal Fisheries Act. This new legislation will impact the scope, timeliness and cost of approvals for projects and the revisions could impact existing operations. |
| • | Environment and Climate Change Canada (ECCC) has published an amended national recovery strategy for woodland caribou that has the potential to impact economic and social development in northern Saskatchewan. Research completed in northern Saskatchewan has resulted in a report indicating the range in which our northern Saskatchewan operations are located, hosts a secure and self-sustaining population of woodland caribou, perhaps one of the most secure boreal caribou populations in Canada. The population status was incorporated by ECCC into the amended national recovery strategy; however, potential habitat protection measures could still have an impact on our Saskatchewan operations and advanced projects. |
We use significant management and financial resources to manage our regulatory risks.
Environmental risks
We have the safety, health and environmental risks associated with any mining and chemical processing company. Our uranium and fuel services segments also face unique risks associated with radiation.
| MANAGEMENT’S DISCUSSION AND ANALYSIS | 63 |
Laws to protect the environment are becoming more stringent for members of the nuclear energy industry, including mining, milling and processing facilities, and have inter-jurisdictional aspects (both federal and provincial/state regimes are applicable). Once we have permanently stopped mining and processing activities at an operating site, we are required to decommission the site to the satisfaction of the regulators. We have developed preliminary decommissioning plans for our operating sites and use them to estimate our decommissioning costs. Regulators review and accept our preliminary decommissioning plans on a regular basis. As the site approaches or goes into decommissioning, regulators review the detailed decommissioning plans. This can result in further regulatory process, as well as additional requirements, costs and financial assurances.
We have submitted updates to all Saskatchewan operations’ Preliminary Decommissioning Plan (PDP) and Preliminary Decommissioning Cost Estimate (PDCE) documents in accordance with the five-year timeline specified in the regulations. Upon acceptance of the PDP and PDCE documents by the Saskatchewan Ministry of Environment and Canadian Nuclear Safety Commission (CNSC) staff, a formal Commission proceeding will be required for final approval of the PDP and PDCE by the Commission. We have received the required approvals for the revised PDP and our letters of credit have been updated for McArthur River, Cigar Lake and Key Lake. The revised PDP for Rabbit Lake is still under review by CNSC staff.
At the end of 2020, our estimate of total decommissioning and reclamation costs was $1.14 billion. This is the undiscounted value of the obligation and is based on our current operations. We had accounting provisions of $1.20 billion at the end of 2020 (the present value of the $1.14 billion). Regulatory approval is required prior to beginning decommissioning. Since we expect to incur most of these expenditures at the end of the useful lives of the operations they relate to, and none of our assets have approval for decommissioning, our expected costs for decommissioning and reclamation for the next five years are not material.
We provide financial assurances for decommissioning and reclamation such as letters of credit or surety bonds to regulatory authorities, as required. We had a total of about $1.02 billion in financial assurances supporting our reclamation liabilities at the end of 2020. All of our North American operations have financial assurances in place in connection with our preliminary plans for decommissioning of the sites.
Some of the sites we own or operate have been under ongoing investigation and/or remediation and planning as a result of historic soil and groundwater conditions.
We use significant management and financial resources to manage our environmental risks.
We manage environmental risks through our safety, health, environment and quality (SHEQ) management system. Our chief executive officer is responsible for ensuring that our SHEQ management system is implemented. Our board’s safety, health and environment committee also oversees how we manage our SHEQ risks, including the use of our enterprise risk management program.
A key cornerstone of our SHEQ management system is the continual improvement of process and physical infrastructure supporting the management system. Proposed projects are evaluated and, if beneficial, included in our site’s life of asset plan. Noteworthy projects expected to reduce SHEQ risks that were advanced in 2020 included:
| • | the Vision in Motion project at the Port Hope conversion facility |
| • | the program to advance the assessment of innovation opportunities at the McArthur River mine and Key Lake mill |
| • | energy management improvements at our Saskatchewan operations |
| • | progressive decommissioning activities on historical components of our Rabbit Lake and Key Lake operations as well as at our in-situ recovery operations in the United States |
| • | containment system upgrades and remediation of the groundwater issue discovered in 2018 at our Key Lake operation. |
Most of these projects are multi-year projects that are expected to continue into 2021 and beyond.
| 64 | CAMECO CORPORATION |
Operational risks
Other risks and hazards generally applicable to our operations and advanced projects include:
We have insurance to cover some of these risks and hazards, but not all of them, and not to the full amount of losses or liabilities that could potentially arise.
| MANAGEMENT’S DISCUSSION AND ANALYSIS | 65 |
Uranium – production overview
Production in our uranium segment in the fourth quarter was 2.8 million pounds, 4% higher compared to the same period in 2019, while production for the year was 5.0 million pounds, 44% lower than in 2019. The McArthur River/Key Lake and Rabbit Lake operations are in a safe and sustainable state of care and maintenance, and we are no longer developing new wellfields at Crow Butte and Smith Ranch-Highland. See Uranium – Tier-one operations starting on page 67 and Uranium – Tier-two operations beginning on page 79 for more information.
Uranium production
| THREE MONTHS ENDED | YEAR ENDED | |||||||||||||||||||
| CAMECO SHARE | DECEMBER 31 | DECEMBER 31 | ||||||||||||||||||
| (MILLION LBS) |
2020 | 2019 | 2020 | 2019 | 2020 TARGET1 | |||||||||||||||
| Cigar Lake |
2.8 | 2.7 | 5.0 | 9.0 | up to 5.3 | |||||||||||||||
| Total |
2.8 | 2.7 | 5.0 | 9.0 | up to 5.3 | |||||||||||||||
| 1 | In April 2020 we withdrew our production outlook for the Cigar Lake mine due to the first precautionary suspension of production to manage the risks posed by the COVID-19 pandemic. With the restart of the mine in September after the first production suspension, a production target of up to 5.3 million pounds (our share) was set. |
Production Outlook
We remain focused on taking advantage of the long-term growth we see coming in our industry, while maintaining the ability to respond to market conditions as they evolve. Our strategy is to focus on our tier-one assets and profitably produce at a pace aligned with market signals in order to preserve the value of those assets and increase long-term value, and to do that with an emphasis on safety, people and the environment.
Given the uncertainty due to the COVID-19 pandemic and to mitigate risk, we plan to:
| • | prioritize the health and safety of our workers, their families and communities |
| • | return Cigar Lake to production when it is safe to do so after the second production suspension |
| • | evaluate the optimal mix of production, inventory and purchases in order to retain the flexibility to deliver long-term value |
| • | focus on technology and its applications to improve efficiency, reduce costs and improve operational effectiveness across our operations, including the use of digital and automation technologies |
We expect total production from Inkai to be 8.3 million pounds in 2021 on a 100% basis, assuming no production disruptions due to the COVID-19 pandemic or other causes. Due to equity accounting, our share of production is shown as a purchase. An adjustment to the production purchase entitlement allows us to purchase 4.9 million pounds in 2021.
| 66 | CAMECO CORPORATION |
Uranium – Tier-one operations
McArthur River mine / Key Lake mill
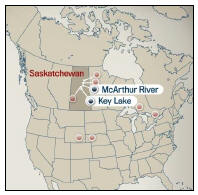
|
2020 Production (our share)
0.0M lbs
2021 Production Outlook (our share)
0.0M lbs
Estimated Reserves (our share)
273.6M lbs
Estimated Mine Life1
23 years |
| 1 | Estimated mine life based on the production schedule presented in the National Instrument 43-101 Technical Report dated March 29, 2019. |
McArthur River is the world’s largest, high-grade uranium mine, and Key Lake is the world’s largest uranium mill.
Ore grades at the McArthur River mine are 100 times the world average, which means it can produce more than 18 million pounds per year by mining only 200 to 400 tonnes of ore per day. We are the operator of both the mine and mill.
In 2018, a decision was made to suspend production and place the mine and mill in care and maintenance, which will continue for an indeterminate duration. The restart of the mine and mill is a commercial decision that will be based on our ability to commit our share of production from this operation under acceptable long-term contracts and to benefit from the favourable life-of-mine economics it provides.
McArthur River is considered a material uranium property for us. There is a technical report dated March 29, 2019 (effective December 31, 2018) that can be downloaded from SEDAR (sedar.com) or from EDGAR (sec.gov).
| Location | Saskatchewan, Canada | |||
| Ownership | McArthur River – 69.805% | |||
| Key Lake – 83.33% | ||||
| Mine type | Underground | |||
| Mining methods | Primary: blasthole stoping | |||
| Secondary: raiseboring | ||||
| End product | Uranium concentrate | |||
| Certification | ISO 14001 certified | |||
| Estimated reserves | 273.6 million pounds (proven and probable), average grade U3O8: 6.89% | |||
| Estimated resources | 7.2 million pounds (measured and indicated), average grade U3O8: 2.45% | |||
| 1.8 million pounds (inferred), average grade U3O8: 2.85% | ||||
| Licensed capacity | Mine and mill: 25.0 million pounds per year | |||
| Licence term | Through October, 2023 | |||
| Total packaged production: | 2000 to 2020 | 325.4 million pounds (McArthur River/Key Lake) (100% basis) | ||
| 1983 to 2002 | 209.8 million pounds (Key Lake) (100% basis) | |||
| 2020 production | 0.0 million pounds (0.0 million pounds on 100% basis) | |||
| 2021 production outlook | 0.0 million pounds (0.0 million pounds on 100% basis) | |||
| Estimated decommissioning cost | $42 million – McArthur River (100% basis) | |||
| $223 million – Key Lake (100% basis) | ||||
| All values shown, including reserves and resources, represent our share only, unless indicated. | ||||
| MANAGEMENT’S DISCUSSION AND ANALYSIS | 67 |
BACKGROUND
Mine description
The mineral reserves at McArthur River are contained within seven zones: Zones 1, 2, 3, 4, 4 South, A and B. Prior to care and maintenance, there were two active mining zones and one where development was significantly advanced.
Zone 2 has been actively mined since production began in 1999. The ore zone was initially divided into three freeze panels. As the freeze wall was expanded, the inner connecting freeze walls were decommissioned in order to recover the inaccessible uranium around the active freeze pipes. Mining of zone 2 is almost complete. About 4.8 million pounds of mineral reserves remain and we expect to recover them using a combination of raisebore and blasthole stope mining.
Zone 4 has been actively mined since 2010. The zone was divided into four freeze panels, and like in zone 2, as the freeze wall was expanded, the inner connecting freeze walls were decommissioned. Zone 4 has 117.5 million pounds of mineral reserves secured behind freeze walls and it will be the main source of production when mine production restarts. Raisebore mining and blasthole stoping will be used to recover the mineral reserves.
Zone 1 is the next planned mine area to be brought into production. Freezehole drilling was 90% complete and brine distribution construction was approximately 10% complete when work was suspended in 2018 as part of the production suspension. Work remaining before production can begin includes completion of the freezehole drilling, brine distribution construction, ground freezing and drill and extraction chamber development. Once complete, an additional 46.6 million pounds of mineral reserves will be secured behind freeze walls. Blasthole stope mining is currently planned as the main extraction method.
We have successfully extracted over 325 million pounds (100% basis) since we began mining in 1999.
Mining methods and techniques
The McArthur River deposit presents unique challenges that are not typical of traditional hard or soft rock mines. These challenges are the result of mining in or near high pressure ground water in challenging ground conditions with significant radiation concerns due to the high-grade uranium ore. Therefore, mine designs and mining methods are selected based on their ability to mitigate hydrological, radiological and geotechnical risks.
There are three approved mining methods at McArthur River: raisebore mining, blasthole stope mining and boxhole mining. However, only raisebore and blasthole stope mining remain in use. In addition, we use ground freezing to mine the McArthur River deposit.
Ground freezing
All the mineralized areas discovered to date at McArthur River are in, or partially in, water-bearing ground with significant pressure at mining depths. This high pressure water source is isolated from active development and production areas in order to reduce the inherent risk of an inflow. To date, McArthur River has relied on pressure grouting and ground freezing to successfully mitigate the risks of the high pressure ground water.
Chilled brine is circulated through freeze holes to form an impermeable freeze barrier around the area being mined. This prevents water from entering the mine, and helps stabilize weak rock formations.
Blasthole stoping
Blasthole stoping began in 2011 and was the main extraction method prior to our production suspension. It is planned in areas where blastholes can be accurately drilled and small stable stopes excavated without jeopardizing the freeze wall integrity. The use of this method has allowed the site to improve operating costs by increasing overall extraction efficiency by reducing underground development, concrete consumption, mineralized waste generation and improving extraction cycle time.
Raisebore mining
Raisebore mining is an innovative non-entry approach that we adapted to meet the unique challenges at McArthur River, and it has been used since mining began in 1999. This method is favourable for mining the weaker rock mass areas of the deposit, and is suitable for massive high-grade zones where there is access both above and below the ore zone.
| 68 | CAMECO CORPORATION |
Initial processing
McArthur River produces two product streams, high grade slurry and low-grade mineralized rock. Both product streams are shipped to Key Lake mill to produce uranium ore concentrate.
The high-grade material is ground and thickened into a slurry paste underground and then pumped to surface. The material is then thickened and blended for grade control and shipped to Key Lake in slurry totes using haul trucks.
The low-grade mineralized material is hoisted to surface and shipped as a dry product to Key Lake using covered haul trucks. Once at Key Lake, the material is ground, thickened and blended with the high-grade slurry to a nominal 5% U3O8 mill feed grade. It is then processed into uranium ore concentrate and packaged in drums for further processing offsite.
Tailings capacity
Based on the current licence conditions, tailings capacity at Key Lake is sufficient to mill all the known McArthur River mineral reserves and resources, should they be converted to reserves, with additional capacity to toll mill ore from other regional deposits.
Licensed annual production capacity
The McArthur River mine and Key Lake mill are both licensed to produce up to 25 million pounds (100% basis) per year.
2020 UPDATE
Production suspension
The facilities remained in a state of safe and sustainable care and maintenance throughout 2020.
Approximately 185 Cameco employees remain employed at the McArthur River and Key Lake sites. Care and maintenance activities include mine dewatering, water treatment, freeze wall maintenance, and environmental monitoring. In addition, preservation maintenance and monitoring of the critical facilities continues. Our objective is that the McArthur River and Key Lake operations are available to return to production in a timely manner once a decision is made to end the production suspension.
Exploration
As a result of the production suspension, there was no exploration activity in 2020.
PLANNING FOR THE FUTURE
Production
Due to continued uranium price weakness, we have suspended production for an indeterminate duration. The restart of the mine and mill is a commercial decision that will be based on our ability to commit our share of production from this operation under acceptable long-term contracts and to benefit from the favourable life-of-mine economics it provides. As a result of the suspension, and the time required to restart the mine and mill, we do not expect the operation to produce any uranium in 2021. Our share of the cash and non-cash costs to maintain both operations during the suspension is expected to range between $8 million and $10 million per month.
Innovation
In 2020, we began a program to advance the assessment of innovation opportunities at the McArthur River mine and Key Lake mill. We established a team of internal experts who have been tasked with assessing, designing and implementing opportunities to improve operating efficiency. During the year, the team advanced a portfolio of 43 projects focused on improvement of the mine and mill through application of automation, digitization and optimization. The initial assessment of the majority of the projects was completed, which will allow us to complete the pre-feasibility work and to define the business case. We expect projects that meet our investment criteria will be advanced to implementation in 2021.
| MANAGEMENT’S DISCUSSION AND ANALYSIS | 69 |
Optimizing production
The technical report dated March of 2019 is based on a production rate of 18 million pounds (100% basis) per year, however, once a restart decision is made, we plan to optimize the production rate to respond to market signals. We expect that this paced approach will allow us to extract maximum value from the operation as the market transitions.
MANAGING OUR RISKS
Production at McArthur River/Key Lake poses many challenges. These challenges include control of groundwater, weak rock formations, radiation protection, water inflow, mine area transitioning, regulatory approvals, surface and underground fires and other mining related challenges. Operational experience gained since the start of production has resulted in a significant reduction in risk.
Mine and mill restart
The operational changes we have made, including the suspension of production in 2018 for an indeterminate duration and the accompanying workforce reduction, carry with them the risks of a delay in restarting operations and subsequent production disruption.
There is increased uncertainty regarding the timing of a successful restart of the operations and the associated costs the longer the mine and mill are on care and maintenance.
Water inflow risk
Water inflows pose a significant risk to mine production. In 2003, a water inflow resulted in a three-month suspension of production. We also had a small water inflow in 2008 that did not impact production but did cause significant development delays.
The consequences of another water inflow at McArthur River would depend on its magnitude, location and timing, but could include a significant interruption or reduction in production, a material increase in costs or a loss of mineral reserves.
We take significant steps and precautions to reduce the risk of inflows, but there is no guarantee that these will be successful. In the event that an inflow does occur, we believe we have sufficient pumping, water treatment and surface storage capacity to handle the estimated maximum sustained inflow.
We also manage the risks listed on pages 63 to 65.
| 70 | CAMECO CORPORATION |
Uranium – Tier-one operations
Cigar Lake
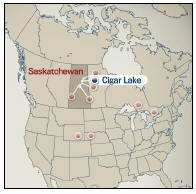
|
2020 Production (our share)
5.0M lbs
2021 Production Outlook (our share)
Production temporarily suspended
Estimated Reserves (our share)
82.8M lbs
Estimated Mine Life
2029 |
Cigar Lake is the world’s highest grade uranium mine, with grades that are 100 times the world average. We are a 50% owner and the mine operator. Cigar Lake uranium is milled at Orano’s (previously AREVA) McClean Lake mill.
Cigar Lake is considered a material uranium property for us. There is a technical report dated March 29, 2016 (effective December 31, 2015) that can be downloaded from SEDAR (sedar.com) or from EDGAR (sec.gov).
| Location | Saskatchewan, Canada | |
| Ownership | 50.025% | |
| Mine type | Underground | |
| Mining method | Jet boring system | |
| End product | Uranium concentrate | |
| Certification | ISO 14001 certified | |
| Estimated reserves | 82.8 million pounds (proven and probable), average grade U3O8: 15.92% | |
| Estimated resources | 52.4 million pounds (measured and indicated), average grade U3O8: 13.88% | |
| 11.4 million pounds (inferred), average grade U3O8: 5.55% | ||
| Licensed capacity | 18.0 million pounds per year (our share 9.0 million pounds per year) | |
| Licence term | Through June, 2021 | |
| Total packaged production: 2014 to 2020 | 93.0 million pounds (100% basis) | |
| 2020 production | 5.0 million pounds (10.1 million pounds on 100% basis) | |
| 2021 production outlook | Production temporarily suspended | |
| Estimated decommissioning cost | $62 million (100% basis) | |
|
All values shown, including reserves and resources, represent our share only, unless otherwise indicated. | ||
BACKGROUND
Development
We began developing the Cigar Lake underground mine in 2005, but development was delayed due to water inflows in 2006 and 2008. The underground workings were successfully remediated and secured in 2011 and, in October 2014 the McClean Lake mill produced the first uranium concentrate from ore mined at the Cigar Lake operation. Commercial production was declared in May 2015.
| MANAGEMENT’S DISCUSSION AND ANALYSIS | 71 |
Mine description
Cigar Lake’s geological setting is similar to McArthur River’s: the permeable sandstone, which overlays the deposit and basement rocks, contains large volumes of water at significant pressure. However, unlike McArthur River, the Cigar Lake deposit has the shape of a flat- to cigar-shaped lens. As a result of these challenging geological conditions, we are unable to utilize traditional mining methods that require access above the ore, necessitating the development of a non-entry mining method specifically adapted for this deposit: the Jet Boring System (JBS).
Mine development is carried out uniquely in the basement rocks below the ore horizon. New mine development is required throughout the mine life to gain access to the ore above.
Mining method
Bulk ground freezing
The sandstone that overlays the deposit and basement rocks is water-bearing, and to prevent water from entering the mine, help stabilize weak rock formations, and meet our production schedule, we freeze the ground from surface. The ore zone and surrounding ground in the area to be mined must meet specific ground freezing requirements before we begin jet boring.
Jet boring system (JBS) mining
After many years of test mining, we selected jet boring, a non-entry mining method, which we have developed and adapted specifically for this deposit. This method involves:
| • | drilling a pilot hole into the frozen orebody, inserting a high pressure water jet and cutting a cavity out of the frozen ore |
| • | collecting the ore and water mixture (slurry) from the cavity and pumping it to storage (sump storage), allowing it to settle |
| • | using a clamshell, transporting the ore from sump storage to an underground grinding and processing circuit |
| • | once mining is complete, filling each cavity in the orebody with concrete |
| • | starting the process again with the next cavity |
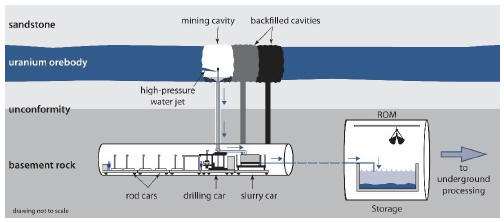
We have divided the orebody into production panels and at least three production panels need to be frozen at one time to achieve the full annual production rate of 18 million pounds. One JBS machine is located below each frozen panel. Three JBS machines are currently in operation. Two machines actively mine at any given time while the third is moving, setting up, or undergoing maintenance.
Initial processing
We carry out initial processing of the extracted ore at Cigar Lake:
| • | the underground circuit grinds the ore and mixes it with water to form a slurry |
| • | the slurry is pumped 500 metres to the surface and stored in one of two ore slurry holding tanks |
| • | it is blended and thickened, removing excess water |
| • | the final slurry, at an average grade of approximately 16% U3O8, is pumped into transport truck containers and shipped to McClean Lake mill on a 69 kilometre all-weather road |
| 72 | CAMECO CORPORATION |
Water from this process, including water from underground operations, is treated on the surface. Any excess treated water is released into the environment.
Milling
All of Cigar Lake’s ore slurry is being processed at the McClean Lake mill, operated by Orano. Given the McClean Lake mill’s capacity, it is able to:
| • | operate at Cigar Lake’s targeted annual production level of 18 million pounds U3O8 |
| • | process and package all of Cigar Lake’s current mineral reserves |
Licensing annual production capacity
The Cigar Lake mine is licensed to produce up to 18 million pounds (100% basis) per year. Orano’s McClean Lake mill is licensed to produce 24 million pounds annually.
The CNSC licence is set to expire in June 2021. The CNSC has set an April date for the licence renewal hearing and it will be held virtually. At this time, we have submitted all of the relevant supporting program documents and we, along with the CNSC, are preparing the Commission Member Documents that the CNSC will review as part of this proceeding. The CNSC has yet to finalize intervener funding for this hearing.
2020 UPDATE
Production
Total packaged production from Cigar Lake was 10.1 million pounds U3O8; our share was 5.0 million pounds. Production was temporarily suspended twice in 2020 due to precautionary measures taken with the increasing risks posed by the COVID-19 pandemic.
An initial suspension was announced in March 2020 with the operations moving to care and maintenance in April. In September we safely restarted the Cigar Lake mine. As planned, it took about two weeks to achieve initial production once the mine was restarted.
As announced in December 2020, production at the Cigar Lake mine was temporarily suspended again as a precautionary measure with a negative trend in the pandemic in Saskatchewan which created increased uncertainty for the continuous operation of the mine due to access to qualified operational personnel.
During the year, we:
| • | substantially completed the extension of the underground electrical distribution system and commenced the extension of the underground piping infrastructure to support mining the west portion of the orebody |
| • | executed planned annual maintenance activities during the first two weeks of September, prior to the safe restart of production following the five-month precautionary suspension of production due to the COVID-19 pandemic |
| • | executed production activities from three production tunnels in the eastern part of the orebody |
| • | expanded our ground freezing program ensuring continued frozen ore inventory growth in alignment with our long-term production plans |
| • | completed a project looking at alternative mining methods that have potential to be utilized as alternatives to the underground jet boring system at Cigar Lake |
| MANAGEMENT’S DISCUSSION AND ANALYSIS | 73 |
Underground development
In alignment with our production plans, underground mine development continued in 2020 between January to March and September to December. Development included focus on two new production panels in the eastern portion of the orebody along with initial access development towards the western portion. Development of the two production panels in the east were completed in 2020. Development in the western portion of the orebody is planned for 2021, along with further development in the eastern portion of the orebody to ensure new production panels are available in alignment with long-term production plans.
PLANNING FOR THE FUTURE
Production
Our production and development plans for 2021 are uncertain as the Cigar Lake mine remains suspended and a restart of the operation and the production rate will be dependent on our ability to maintain safe and stable operating protocols along with a number of other factors, including how the COVID-19 pandemic is impacting the availability of the required workforce, how cases are trending in Saskatchewan, in particular in northern communities, and the views of the public health authorities.
As a result of the suspensions in production, we have also experienced delays and deferrals in project work, including lower capital expenditures, which introduces potential risk to the production rate in 2022.
While Cigar Lake is on care and maintenance, we expect to incur costs of between $8 million and $10 million per month, which will be expensed directly to cost of sales. We may also incur additional costs related to the purchase of uranium, which comes at a higher cost than our production.
In 2021, we plan to:
| • | continue surface freeze drilling and complete construction and commissioning of freeze distribution infrastructure expansion in support of future production |
| • | continue underground mine development on two new production tunnels as well as expand ventilation and access drifts in alignment with the long-term mine plan |
| • | substantially complete the expansion of the underground piping and infrastructure towards new production panels required to sustain production |
MANAGING OUR RISKS
Cigar Lake is a challenging deposit to develop and mine. These challenges include control of groundwater, weak rock formations, radiation protection, chemical ore characteristics, performance of the water treatment system, water inflow, regulatory approvals, surface and underground fires and other mining-related challenges. To reduce this risk, we are applying our operational experience and the lessons we have learned about water inflows at McArthur River and Cigar Lake.
Transition to new mining areas
In order to successfully achieve the planned production schedule, we must continue to successfully transition into new mining areas, which includes mine development and investment in critical support infrastructure.
Ground freezing
To manage our risks and meet our production schedule, the areas being mined must meet specific ground freezing requirements before we begin jet boring. We have identified greater variation of the freeze rates of different geological formations encountered in the mine, based on information obtained through surface freeze drilling. As a mitigation measure, we have increased the site freeze capacity to facilitate the mining of ore cavities as planned.
Environmental performance
The Cigar Lake orebody contains elements of concern with respect to the water quality and the receiving environment. The distribution of elements such as arsenic, molybdenum, selenium and others is non-uniform throughout the orebody, and this can present challenges in attaining and maintaining the required effluent concentrations.
There have been ongoing efforts to optimize the current water treatment process and water handling systems to ensure acceptable environmental performance, which is expected to avoid the need for additional capital upgrades and potential deferral of production.
| 74 | CAMECO CORPORATION |
Water inflow risk
A significant risk to development and production is from water inflows. The 2006 and 2008 water inflows were significant setbacks.
The consequences of another water inflow at Cigar Lake would depend on its magnitude, location and timing, but could include a significant delay or disruption in Cigar Lake production, a material increase in costs or a loss of mineral reserves.
We take the following steps to reduce the risk of inflows, but there is no guarantee that these will be successful:
| • | Bulk freezing: Two of the primary challenges in mining the deposit are control of groundwater and ground support. Bulk freezing reduces but does not completely eliminate the risk of water inflows. |
| • | Mine development: We plan for our mine development to take place away from known groundwater sources whenever possible. In addition, we assess all planned mine development for relative risk and apply extensive additional technical and operating controls for all higher risk development. |
| • | Pumping capacity and treatment limits: We have pumping capacity to meet our standard for this operation of at least one and a half times the estimated maximum inflow. |
We believe we have sufficient pumping, water treatment and surface storage capacity to handle the estimated maximum inflow.
We also manage the risks listed on pages 63 to 65.
| MANAGEMENT’S DISCUSSION AND ANALYSIS | 75 |
Uranium – Tier-one operations
Inkai
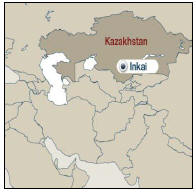
|
2020 Production (100% basis)
7.0M lbs
2021 Production Outlook (100% basis)
8.3M lbs
Estimated Reserves (our share)
97.5M lbs
Estimated Mine Life
2045 (based on licence term) |
Inkai is a very significant uranium deposit, located in Kazakhstan. The operator is JV Inkai limited liability partnership, which we jointly own (40%) with Kazatomprom (60%)1.
Inkai is considered a material uranium property for us. There is a technical report dated January 25, 2018 (effective January 1, 2018) that can be downloaded from SEDAR (sedar.com) or from EDGAR (sec.gov).
| Location | South Kazakhstan | |
| Ownership | 40%1 | |
| Mine type | In situ recovery (ISR) | |
| End product | Uranium concentrate | |
| Certifications | BSI OHSAS 18001 | |
| ISO 14001 certified | ||
| Estimated reserves | 97.5 million pounds (proven and probable), average grade U3O8: 0.03% | |
| Estimated resources | 12.8 million pounds (measured and indicated), average grade U3O8: 0.03% | |
| 30 million pounds (inferred), average grade U3O8: 0.03% | ||
| Licensed capacity (wellfields) | 10.4 million pounds per year (our share 4.2 million pounds per year)1 | |
| Licence term | Through July 2045 | |
| Total packaged production: 2009 to 2020 | 64.5 million pounds (100% basis) | |
| 2020 production | 7.0 million pounds (100% basis)1 | |
| 2021 production outlook | 8.3 million pounds (100% basis)1 | |
| Estimated decommissioning cost (100% basis) | $11 million (US) (100% basis) (this estimate is currently under review) | |
All values shown, including reserves and resources, represent our share only, unless indicated.
| 1 | Our ownership interest in the joint venture is 40% and we equity account for our investment. As such, our share of production is shown as a purchase. |
| 76 | CAMECO CORPORATION |
BACKGROUND
Mine description
The Inkai uranium deposit is a roll-front type orebody within permeable sandstones. The more porous and permeable units host several stacked and relatively continuous, sinuous “roll-fronts” of low-grade uranium forming a regional system. Superimposed over this regional system are several uranium projects and active mines.
Inkai’s mineralization ranges in depths from about 260 metres to 530 metres. The deposit has a surface projection of about 40 kilometres in length, and the width ranges from 40 to 1600 metres. The deposit has hydrogeological and mineralization conditions favourable for use of in-situ recovery (ISR) technology.
Mining and milling method
JV Inkai uses conventional, well-established, and very efficient ISR technology, developed after extensive test work and operational experience. The process involves five major steps:
| • | leach the uranium in-situ by circulating an acid-based solution through the host formation |
| • | recover it from solution with ion exchange resin (takes place at both main and satellite processing plants) |
| • | precipitate the uranium with hydrogen peroxide |
| • | thicken, dewater, and dry it |
| • | package the uranium peroxide product in drums |
Production
Total 2020 production from Inkai was 7.0 million pounds (100% basis), a decrease of 16% from 2019. The decrease in production is due to the impact of the reduction in operational activities introduced to manage the risks posed by the COVID-19 pandemic.
On April 7, 2020, Kazatomprom announced a reduction to operational activities across all uranium mines in Kazakhstan for an expected period of three months due to the risks posed by the COVID-19 pandemic. It indicated that its decision would result in a lower level of wellfield development activity and, as a result, an estimated reduction of up to 17.5% in total planned uranium production in Kazakhstan in 2020. On July 6, 2020, Kazatomprom announced a one-month extension of the period of reduced operational activities with the impact on its revised production plan for 2020 expected to be immaterial. In August 2020, the previously reduced operational activities, including wellfield development resumed at JV Inkai.
Production purchase entitlements
Under the terms of a restructuring agreement signed with our partner Kazatomprom in 2016, our ownership interest in JV Inkai is 40% and Kazatomprom’s share is 60%. However, during production rampup to the licensed limit of 10.4 million pounds, we are entitled to purchase 57.5% of the first 5.2 million pounds of annual production, and as annual production increases over 5.2 million pounds, we are entitled to purchase 22.5% of such incremental production, to the maximum annual share of 4.2 million pounds. Once the rampup to 10.4 million pounds annually is complete, we will be entitled to purchase 40% of such annual production, matching our ownership interest.
Cash distribution
Excess cash, net of working capital requirements, will be distributed to the partners as dividends. In 2020, we received dividend payments from JV Inkai totaling $40.6 million (US). Our share of dividends follows our production purchase entitlements as described above.
PLANNING FOR THE FUTURE
Production
Based on an adjustment to the production purchase entitlement under the 2016 JV Inkai restructuring agreement described above, we are entitled to purchase 4.9 million pounds, or 59.4% of JV Inkai’s planned 2021 production of 8.3 million pounds, assuming no production disruptions due to the COVID-19 pandemic or other causes. Our share of the profits earned by JV Inkai on the sale of its production will be included in “income from equity-accounted investees” on our consolidated statement of earnings.
| MANAGEMENT’S DISCUSSION AND ANALYSIS | 77 |
Our share of production is purchased at a discount to the spot price and included at this value in inventory. In addition, JV Inkai capital is not included in our outlook for capital expenditures.
MANAGING OUR RISKS
2021 production forecast risk
Achievement of JV Inkai’s 2021 production forecast requires it to successfully manage its operating and other risks including the current uncertain environment resulting from the COVID-19 pandemic and its related operational risks, including the risk of significant disruption to JV Inkai’s operations, workforce, required supplies or services, and its ability to produce uranium.
Political risk
Kazakhstan declared itself independent in 1991 after the dissolution of the Soviet Union. Our investment in JV Inkai is subject to the greater risks associated with doing business in developing countries, which have significant potential for social, economic, political, legal and fiscal instability. Kazakh laws and regulations are complex and still developing and their application can be difficult to predict. The other owner of JV Inkai is Kazatomprom, an entity majority owned by the government of Kazakhstan. We have entered into agreements with JV Inkai and Kazatomprom intended to mitigate political risk. This risk includes the imposition of governmental laws or policies that could restrict or hinder JV Inkai paying us dividends, or selling us our share of JV Inkai production, or that impose discriminatory taxes or currency controls on these transactions. The restructuring of JV Inkai, which took effect January 1, 2018, was undertaken with the objective to better align the interests of Cameco and Kazatomprom and includes a governance framework that provides for protection for us as a minority owner of JV Inkai. We believe the political risk related to our investment in JV Inkai is manageable.
For more details on this risk, please our most recent annual information form under the heading political risks.
JV Inkai manages risks listed on pages 63 to 65.
| 78 | CAMECO CORPORATION |
Uranium – Tier-two operations
Rabbit Lake
Located in Saskatchewan, Canada, our 100% owned Rabbit Lake operation opened in 1975, and has the second largest uranium mill in the world. Due to market conditions, we suspended production at Rabbit Lake during the second quarter of 2016.
| Location | Saskatchewan, Canada | |
| Ownership | 100% | |
| End product | Uranium concentrates | |
| ISO certification | ISO 14001 certified | |
| Mine type | Underground | |
| Estimated reserves | - | |
| Estimated resources | 38.6 million pounds (indicated), average grade U3O8: 0.95% | |
| 33.7 million pounds (inferred), average grade U3O8: 0.62% | ||
| Mining methods | Vertical blasthole stoping | |
| Licensed capacity | Mill: maximum 16.9 million pounds per year; currently 11 million | |
| Licence term | Through October, 2023 | |
| Total production: 1975 to 2020 | 202.2 million pounds | |
| 2020 production | 0 million pounds | |
| 2021 production outlook | 0 million pounds | |
| Estimated decommissioning cost1 | $213 million | |
| 1 | This updated estimate is currently under regulatory review. |
PRODUCTION SUSPENSION
The facilities remained in a state of safe and sustainable care and maintenance throughout 2020.
While in standby, we continue to evaluate our options in order to minimize care and maintenance costs. We expect care and maintenance costs to range between $27 million and $32 million annually.
MANAGING OUR RISKS
We also manage the risks listed on pages 63 to 65.
| MANAGEMENT’S DISCUSSION AND ANALYSIS | 79 |
US ISR Operations
Located in Nebraska and Wyoming in the US, the Crow Butte and Smith Ranch-Highland (including the North Butte satellite) operations began production in 1991 and 1975. Each operation has its own processing facility. Due to market conditions, we curtailed production and deferred all wellfield development at these operations during the second quarter of 2016.
| Ownership | 100% | |||
| End product | Uranium concentrates | |||
| ISO certification | ISO 14001 certified | |||
| Estimated reserves | Smith Ranch-Highland: | - | ||
| North Butte-Brown Ranch: | - | |||
| Crow Butte: | - | |||
| Estimated resources | Smith Ranch-Highland: | 24.9 million pounds (measured and indicated), average grade U3O8: 0.06% | ||
| 7.7 million pounds (inferred), average grade U3O8: 0.05% | ||||
| North Butte-Brown Ranch: | 9.5 million pounds (measured and indicated), average grade U3O8: 0.07% | |||
| 0.4 million pounds (inferred), average grade U3O8: 0.07% | ||||
| Crow Butte: | 13.9 million pounds (measured and indicated), average grade U3O8: 0.25% | |||
| 1.8 million pounds (inferred), average grade U3O8: 0.16% | ||||
| Mining methods | In situ recovery (ISR) | |||
| Licensed capacity | Smith Ranch-Highland:1 | Wellfields: 3 million pounds per year; processing plants: 5.5 million pounds per year | ||
| Crow Butte: | Processing plants and wellfields: 2 million pounds per year | |||
| Licence term | Smith Ranch-Highland: | Through September, 2028 | ||
| Crow Butte: | Through October, 2024 | |||
| Total production: 2002 to 2020 | 33.0 million pounds | |||
| 2020 production | 0 million pounds | |||
| 2021 production outlook | 0 million pounds | |||
| Estimated decommissioning cost | Smith Ranch-Highland: $219 million (US), including North Butte | |||
| Crow Butte: $52 million (US) | ||||
| 1 | Including Highland mill |
PRODUCTION CURTAILMENT
As a result of our 2016 decision, production at the US operations ceased in 2018. We expect ongoing cash and non-cash care and maintenance costs to range between $17 million (US) and $19 million (US) for 2021.
FUTURE PRODUCTION
We do not expect any production in 2021.
MANAGING OUR RISKS
We manage the risks listed on pages 63 to 65.
| 80 | CAMECO CORPORATION |
Uranium – advanced projects
Work on our advanced projects has been scaled back and will continue at a pace aligned with market signals.
Millennium
| Location | Saskatchewan, Canada | |
| Ownership | 69.9% | |
| End product | Uranium concentrates | |
| Potential mine type | Underground | |
| Estimated resources (our share) | 53.0 million pounds (indicated), average grade U3O8: 2.39% | |
| 20.2 million pounds (inferred), average grade U3O8: 3.19% | ||
BACKGROUND
The Millennium deposit was discovered in 2000 and was delineated through geophysical survey and surface drilling work between 2000 and 2013.
Yeelirrie
| Location | Western Australia | |
| Ownership | 100% | |
| End product | Uranium concentrates | |
| Potential mine type | Open pit | |
| Estimated resources | 128.1 million pounds (measured and indicated), average grade U3O8: 0.15% | |
BACKGROUND
The deposit was discovered in 1972 and is a near-surface calcrete-style deposit that is amenable to open pit mining techniques. It is one of Australia’s largest undeveloped uranium deposits.
Kintyre
| Location | Western Australia | |
| Ownership | 100% | |
| End product | Uranium concentrates | |
| Potential mine type | Open pit | |
| Estimated resources | 53.5 million pounds (indicated), average grade U3O8: 0.62% | |
| 6.0 million pounds (inferred), average grade U3O8: 0.53% | ||
BACKGROUND
The Kintyre deposit was discovered in 1985 and is amenable to open pit mining techniques.
2020 PROJECT UPDATES
We believe that we have some of the best undeveloped uranium projects in the world. However, in the current market environment our primary focus is on preserving the value of our tier-one uranium assets. We continue to await a signal from the market that additional production is needed prior to making any new development decisions.
PLANNING FOR THE FUTURE
2021 Planned activity
No work is planned at Millennium, Yeelirrie or Kintyre. Further progress towards a development decision is not expected until market conditions improve.
MANAGING THE RISKS
For all of our advanced projects, we manage the risks listed on pages 63 to 65.
| MANAGEMENT’S DISCUSSION AND ANALYSIS | 81 |
Uranium – exploration and corporate development
Our exploration program is directed at replacing mineral reserves as they are depleted by our production and is key to sustaining our business. However, during this period of weak uranium prices, and as we have ample idled production capacity, we have reduced our spending to focus only on exploration near our existing operations where we have established infrastructure and capacity to expand. Globally, we have land with exploration and development prospects that are among the best in the world, mainly in Canada, Australia and the US. Our land holdings total about 0.8 million hectares (2.0 million acres). In northern Saskatchewan alone, we have direct interests in about 0.7 million hectares (1.8 million acres) of land covering many of the most prospective exploration areas of the Athabasca Basin.
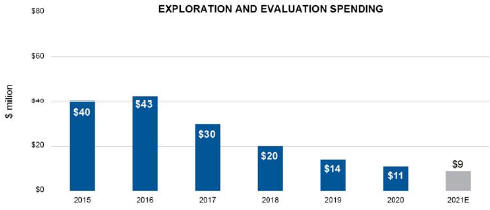
2020 UPDATE
Brownfield exploration
Brownfield exploration is uranium exploration near our existing operations and includes expenses for advanced exploration on the evaluation of projects where uranium mineralization is being defined.
In 2020, we spent about $4 million on brownfields and advanced uranium projects in Saskatchewan and Australia. At the US operations we spent $1 million.
Regional exploration
We spent about $8 million on regional exploration programs (including support costs), primarily in Saskatchewan’s Athabasca Basin.
PLANNING FOR THE FUTURE
We will continue to focus on our core projects in Saskatchewan under our long-term exploration strategy. Long-term, we look for properties that meet our investment criteria. We may partner with other companies through strategic alliances, equity holdings and traditional joint venture arrangements. Our leadership position and industry expertise in both exploration and corporate social responsibility make us a partner of choice.
INVESTMENT PROGRAM
Currently, given the conditions in the uranium market, our extensive portfolio of reserves and resources and our belief that we have ample idle production capacity, our focus is on navigating by our investment-grade rating and preserving the value of our tier-one assets. We expect that these assets will allow us to meet rising uranium demand with increased production from our best margin operations and will help to mitigate risk in the event of prolonged uncertainty.
However, we continually evaluate investment opportunities within the nuclear fuel cycle that could add to our future supply options, support our sales activities, and complement and enhance our business in the nuclear industry. We will make an investment decision when an opportunity is available at the right time and the right price. We strive to pursue corporate development initiatives that will leave us and our shareholders in a fundamentally stronger position. As such, an investment opportunity is never assessed in isolation. Investments must compete for investment capital with our own internal growth opportunities. They are subject to our capital allocation process described in the strategy section, starting on page 18.
| 82 | CAMECO CORPORATION |
Fuel services
Refining, conversion and fuel manufacturing
We have about 24% of world UF6 primary conversion capacity and are a supplier of natural UO2. Our focus is on cost-competitiveness and operational efficiency.
Our fuel services segment is strategically important because it helps support the growth of the uranium segment. Offering a range of products and services to customers helps us broaden our business relationships and expand our uranium market share.
Blind River Refinery
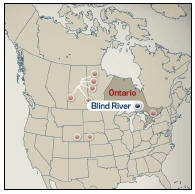
|
Licensed Capacity
24.0M kgU as UO3
Licence renewal in
February, 2022 |
Blind River is the world’s largest commercial uranium refinery, refining uranium concentrates from mines around the world into UO3.
| Location | Ontario, Canada | |
| Ownership | 100% | |
| End product | UO3 | |
| ISO certification | ISO 14001 certified | |
| Licensed capacity | 18.0 million kgU as UO3 per year, approved to 24.0 million subject to the completion of certain equipment upgrades (advancement depends on market conditions) | |
| Licence term | Through February, 2022 | |
| Estimated decommissioning cost | $58 million | |
| MANAGEMENT’S DISCUSSION AND ANALYSIS | 83 |
Port Hope Conversion Services
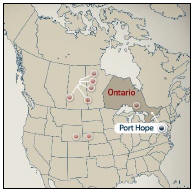
|
Licensed Capacity
12.5M kgU as UF6
2.8M kgU as UO2
Licence renewal in
February, 2027 |
Port Hope is the only uranium conversion facility in Canada and a supplier of UO2 for Canadian-made CANDU reactors.
| Location | Ontario, Canada | |
| Ownership | 100% | |
| End product | UF6, UO2 | |
| ISO certification | ISO 14001 certified | |
| Licensed capacity | 12.5 million kgU as UF6 per year 2.8 million kgU as UO2 per year | |
| Licence term | Through February, 2027 | |
| Estimated decommissioning cost | $129 million | |
Cameco Fuel Manufacturing Inc. (CFM)

|
Licensed Capacity
1.2M kgU as UO2 fuel pellets
Licence renewal in
February, 2022 |
CFM produces fuel bundles and reactor components for CANDU reactors.
| Location | Ontario, Canada | |
| Ownership | 100% | |
| End product | CANDU fuel bundles and components | |
| ISO certification | ISO 9001 certified, ISO 14001 certified | |
| Licensed capacity | 1.2 million kgU as UO2 fuel pellets | |
| Licence term | Through February, 2022 | |
| Estimated decommissioning cost | $21 million | |
| 84 | CAMECO CORPORATION |
2020 UPDATE
Production
Fuel services produced 11.7 million kgU, 12% lower than 2019. This was a result of the temporary suspension of production in April resulting from the precautionary measures taken for the COVID-19 pandemic.
Port Hope conversion facility cleanup and modernization (Vision in Motion)
Vision in Motion is a unique opportunity that demonstrates our continued commitment to a clean environment. It has been made possible by the opening of a long-term waste management facility by the government of Canada’s Port Hope Area Initiative project. There is a limited opportunity during the life of this project to engage in clean-up and renewal activities that address legacy waste at the Port Hope Conversion facility inherited from historic operations. While there was progress earlier in the year, work on the Vision in Motion project in 2020 was suspended due to actions taken by the Ontario government to limit all non-essential construction activity.
PLANNING FOR THE FUTURE
Production
We plan to produce between 12.5 million and 13.5 million kgU in 2021, assuming no production disruptions due to the COVID-19 pandemic or other causes.
In addition, in conjunction with our initiative intended to provide a greater focus on technology and its applications to improve efficiency and reduce costs across the organization, we will continue to look for opportunities to improve operational effectiveness, including the use of digital and automation technologies.
MANAGING OUR RISKS
2021 production forecast risk
Achievement of our 2021 forecast for fuel services production requires us to successfully manage our operating and other risks, including the current uncertain environment resulting from the COVID-19 pandemic and its related operational risks, including the risk of significant disruption to our fuel services operations, workforce, required supplies or services, and our ability to produce product.
Labour relations
The current collective bargaining agreement with the unionized employees at CFM expires on June 1, 2021. There is a risk to our production if we are unable to reach an agreement and there is a labour disruption.
Licensing
The current operating licence from the CNSC for both the Blind River refinery and CFM expire in February 2022. The relicensing process is underway for both sites and will continue throughout 2021. We do not expect any interruption or significant risks from this process.
We also manage the risks listed on pages 63 to 65.
| MANAGEMENT’S DISCUSSION AND ANALYSIS | 85 |
Mineral reserves and resources
Our mineral reserves and resources are the foundation of our company and fundamental to our success.
We have interests in a number of uranium properties. The tables in this section show the estimates of the proven and probable mineral reserves, and measured, indicated, and inferred mineral resources at those properties. However, only three of the properties listed in those tables are material uranium properties for us: McArthur River/Key Lake, Cigar Lake and Inkai. Mineral reserves and resources are all reported as of December 31, 2020.
We estimate and disclose mineral reserves and resources in five categories, using the definition standards adopted by the Canadian Institute of Mining, Metallurgy and Petroleum Council, and in accordance with National Instrument 43-101 – Standards of Disclosure for Mineral Projects (NI 43-101), developed by the Canadian Securities Administrators. You can find out more about these categories at www.cim.org.
About mineral resources
Mineral resources do not have to demonstrate economic viability but have reasonable prospects for eventual economic extraction. They fall into three categories: measured, indicated and inferred. Our reported mineral resources are exclusive of mineral reserves.
| • | Measured and indicated mineral resources can be estimated with sufficient confidence to allow the appropriate application of technical, economic, marketing, legal, environmental, social and governmental factors to support evaluation of the economic viability of the deposit. |
| • | measured resources: we can confirm both geological and grade continuity to support detailed mine planning |
| • | indicated resources: we can reasonably assume geological and grade continuity to support mine planning |
| • | Inferred mineral resources are estimated using limited geological evidence and sampling information. We do not have enough confidence to evaluate their economic viability in a meaningful way. You should not assume that all or any part of an inferred mineral resource will be upgraded to an indicated or measured mineral resource, but it is reasonably expected that the majority of inferred mineral resources could be upgraded to indicated mineral resources with continued exploration. |
Our share of uranium in the following mineral resource tables is based on our respective ownership interests. Reported mineral resources have not demonstrated economic viability.
About mineral reserves
Mineral reserves are the economically mineable part of measured and/or indicated mineral resources demonstrated by at least a preliminary feasibility study. The reference point at which mineral reserves are defined is the point where the ore is delivered to the processing plant, except for ISR operations where the reference point is where the mineralization occurs under the existing or planned wellfield patterns. Mineral reserves fall into two categories:
| • | proven reserves: the economically mineable part of a measured resource for which at least a preliminary feasibility study demonstrates that, at the time of reporting, economic extraction could be reasonably justified with a high degree of confidence |
| • | probable reserves: the economically mineable part of a measured and/or indicated resource for which at least a preliminary feasibility study demonstrates that, at the time of reporting, economic extraction could be reasonably justified with a degree of confidence lower than that applying to proven reserves |
We use current geological models, an average uranium price of $45 (US) per pound U3O8, and current or projected operating costs and mine plans to report our mineral reserves, allowing for dilution and mining losses. We apply our standard data verification process for every estimate.
Our share of uranium in the mineral reserves table below is based on our respective ownership interests.
| 86 | CAMECO CORPORATION |
Changes this year
Our share of proven and probable mineral reserves decreased from 461 million pounds U3O8 at the end of 2019, to 455 million pounds at the end of 2020. The change was primarily the result of:
| • | production at Cigar Lake and Inkai, which removed 8.3 million pounds from our mineral inventory |
| • | application of a revised mining recovery factor at Cigar Lake from 90% to 86% which removed 3.8 million pounds of proven and probable reserves |
partially offset by:
| • | a mineral resource and reserve estimate update at Cigar Lake, which added 7.4 million pounds of proven and probable reserves |
Our share of measured and indicated mineral resources slightly increased from 424 million pounds U3O8 at the end of 2019, to 426 million pounds at the end of 2020. Our share of inferred mineral resources is 174 million pounds U3O8, a slight decrease of 1 million pounds from the end of 2019. The variance in mineral resources was primarily the result of the Cigar Lake mineral resource estimate update and minor mineral resource estimation work at McArthur River.
| MANAGEMENT’S DISCUSSION AND ANALYSIS | 87 |
Qualified persons
The technical and scientific information discussed in this MD&A for our material properties (McArthur River/Key Lake, Cigar Lake and Inkai) was approved by the following individuals who are qualified persons for the purposes of NI 43-101:
Important information about mineral reserve and resource estimates
Although we have carefully prepared and verified the mineral reserve and resource figures in this document, the figures are estimates, based in part on forward-looking information.
Estimates are based on knowledge, mining experience, analysis of drilling results, the quality of available data and management’s best judgment. They are, however, imprecise by nature, may change over time, and include many variables and assumptions, including:
| • | geological interpretation |
| • | extraction plans |
| • | commodity prices and currency exchange rates |
| • | recovery rates |
| • | operating and capital costs |
There is no assurance that the indicated levels of uranium will be produced, and we may have to re-estimate our mineral reserves based on actual production experience. Changes in the price of uranium, production costs or recovery rates could make it unprofitable for us to operate or develop a particular site or sites for a period of time. See page 2 for information about forward-looking information.
Please see our mineral reserves and resources section of our most recent annual information form for the specific assumptions, parameters and methods used for McArthur River, Inkai and Cigar Lake mineral reserve and resource estimates.
Important information for US investors
We present information about mineralization, mineral reserves and resources as required by National Instrument 43-101 – Standards of Disclosure for Mineral Projects of the Canadian Securities Administrators (NI 43-101), in accordance with applicable Canadian securities laws. As a foreign private issuer filing reports with the US Securities and Exchange Commission (SEC) under the Multijurisdictional Disclosure System, we are not required to comply with the SEC’s disclosure requirements relating to mining properties. Investors in the United States should be aware that the disclosure requirements of NI 43-101 are different from those under applicable SEC rules, and the information that we present concerning mineralization, mineral reserves and resources may not be comparable to information made public by companies that comply with the SEC’s reporting and disclosure requirements for mining companies.
| 88 | CAMECO CORPORATION |
Mineral reserves
As of December 31, 2020 (100% – only the shaded column shows our share)
PROVEN AND PROBABLE
(tonnes in thousands; pounds in millions)
| OUR | ||||||||||||||||||||||||||||||||||||||||||||||||
| SHARE | ||||||||||||||||||||||||||||||||||||||||||||||||
| PROVEN | PROBABLE | TOTAL MINERAL RESERVES | RESERVES |
|
||||||||||||||||||||||||||||||||||||||||||||
| MINING | GRADE | CONTENT | GRADE | CONTENT | GRADE | CONTENT | CONTENT | METALLURGICAL | ||||||||||||||||||||||||||||||||||||||||
| PROPERTY |
METHOD | TONNES | % U3O8 | (LBS U3O8) | TONNES | % U3O8 | (LBS U3O8) | TONNES | % U3O8 | (LBS U3O8) | (LBS U3O8) | RECOVERY (%) | ||||||||||||||||||||||||||||||||||||
| Cigar Lake |
UG | 268.7 | 17.53 | 103.8 | 203.2 | 13.78 | 61.7 | 471.9 | 15.92 | 165.6 | 82.8 | 98.5 | ||||||||||||||||||||||||||||||||||||
| Key Lake |
OP | 61.1 | 0.52 | 0.7 | — | — | — | 61.1 | 0.52 | 0.7 | 0.6 | 99 | ||||||||||||||||||||||||||||||||||||
| McArthur River |
UG | 2,041.0 | 7.12 | 320.2 | 540.0 | 6.02 | 71.7 | 2,581.0 | 6.89 | 391.9 | 273.6 | 99 | ||||||||||||||||||||||||||||||||||||
| Inkai |
ISR | 202,780.4 | 0.03 | 156.0 | 149,442.2 | 0.03 | 87.8 | 352,222.7 | 0.03 | 243.8 | 97.5 | 85 | ||||||||||||||||||||||||||||||||||||
|
|
|
|
|
|
|
|
|
|
|
|
|
|
|
|
|
|
|
|
|
|
|
|||||||||||||||||||||||||||
| Total |
205,151.3 | — | 580.7 | 150,185.4 | — | 221.2 | 355,336.7 | — | 802.0 | 454.5 | — | |||||||||||||||||||||||||||||||||||||
|
|
|
|
|
|
|
|
|
|
|
|
|
|
|
|
|
|
|
|
|
|
|
|||||||||||||||||||||||||||
(UG – underground, OP – open pit, ISR – in situ recovery)
Note that the estimates in the above table:
| • | use a constant dollar average uranium price of approximately $45 (US) per pound U3O8 |
| • | are based on exchange rates of $1.00 US=$1.26 Cdn and 460 Kazakhstan Tenge to $1.00 Cdn |
Our estimate of mineral reserves and mineral resources may be positively or negatively affected by the occurrence of one or more of the material risks discussed under the heading Caution about forward-looking information beginning on page 2, as well as certain property-specific risks. See Uranium – Tier-one operations starting on page 67.
Metallurgical recovery
We report mineral reserves as the quantity of contained ore supporting our mining plans and provide an estimate of the metallurgical recovery for each uranium property. The estimate of the amount of valuable product that can be physically recovered by the metallurgical extraction process is obtained by multiplying the quantity of contained metal (content) by the planned metallurgical recovery percentage. The content and our share of uranium in the table above are before accounting for estimated metallurgical recovery.
| MANAGEMENT’S DISCUSSION AND ANALYSIS | 89 |
Mineral resources
As of December 31, 2020 (100% – only the shaded columns show our share)
MEASURED, INDICATED AND INFERRED
(tonnes in thousands; pounds in millions)
| OUR SHARE |
OUR SHARE |
|||||||||||||||||||||||||||||||||||||||||||||||
| MEASURED RESOURCES (M) | INDICATED RESOURCES (I) |
|
INFERRED RESOURCES | |||||||||||||||||||||||||||||||||||||||||||||
| TOTAL M+I | TOTAL M+I | INFERRED | ||||||||||||||||||||||||||||||||||||||||||||||
| GRADE | CONTENT | GRADE | CONTENT | CONTENT | CONTENT | GRADE | CONTENT | CONTENT | ||||||||||||||||||||||||||||||||||||||||
| PROPERTY |
TONNES | % U3O8 | (LBS U3O8) | TONNES | % U3O8 | (LBS U3O8) | (LBS U3O8) | (LBS U3O8) | TONNES | % U3O8 | (LBS U3O8) | (LBS U3O8) | ||||||||||||||||||||||||||||||||||||
| Cigar Lake |
32.9 | 7.61 | 5.5 | 309.4 | 14.55 | 99.3 | 104.8 | 52.4 | 186.3 | 5.55 | 22.8 | 11.4 | ||||||||||||||||||||||||||||||||||||
| Fox Lake |
— | — | — | — | — | — | — | — | 386.7 | 7.99 | 68.1 | 53.3 | ||||||||||||||||||||||||||||||||||||
| Kintyre |
— | — | — | 3,897.7 | 0.62 | 53.5 | 53.5 | 53.5 | 517.1 | 0.53 | 6.0 | 6.0 | ||||||||||||||||||||||||||||||||||||
| McArthur River |
97.8 | 2.57 | 5.5 | 92.4 | 2.32 | 4.7 | 10.3 | 7.2 | 41.0 | 2.85 | 2.6 | 1.8 | ||||||||||||||||||||||||||||||||||||
| Millennium |
— | — | — | 1,442.6 | 2.39 | 75.9 | 75.9 | 53.0 | 412.4 | 3.19 | 29.0 | 20.2 | ||||||||||||||||||||||||||||||||||||
| Rabbit Lake |
— | — | — | 1,836.5 | 0.95 | 38.6 | 38.6 | 38.6 | 2,460.9 | 0.62 | 33.7 | 33.7 | ||||||||||||||||||||||||||||||||||||
| Tamarack |
— | — | — | 183.8 | 4.42 | 17.9 | 17.9 | 10.3 | 45.6 | 1.02 | 1.0 | 0.6 | ||||||||||||||||||||||||||||||||||||
| Yeelirrie |
27,172.9 | 0.16 | 95.9 | 12,178.3 | 0.12 | 32.2 | 128.1 | 128.1 | — | — | — | — | ||||||||||||||||||||||||||||||||||||
| Crow Butte |
1,558.1 | 0.19 | 6.7 | 939.3 | 0.35 | 7.3 | 13.9 | 13.9 | 531.4 | 0.16 | 1.8 | 1.8 | ||||||||||||||||||||||||||||||||||||
| Gas Hills - Peach |
687.2 | 0.11 | 1.7 | 3,626.1 | 0.15 | 11.6 | 13.3 | 13.3 | 3,307.5 | 0.08 | 6.0 | 6.0 | ||||||||||||||||||||||||||||||||||||
| Inkai |
36,680.9 | 0.03 | 21.3 | 21,132.2 | 0.02 | 10.7 | 32.0 | 12.8 | 116,394.6 | 0.03 | 75.0 | 30.0 | ||||||||||||||||||||||||||||||||||||
| North Butte - Brown Ranch |
621.3 | 0.08 | 1.1 | 5,530.3 | 0.07 | 8.4 | 9.5 | 9.5 | 294.5 | 0.07 | 0.4 | 0.4 | ||||||||||||||||||||||||||||||||||||
| Ruby Ranch |
— | — | — | 2,215.3 | 0.08 | 4.1 | 4.1 | 4.1 | 56.2 | 0.14 | 0.2 | 0.2 | ||||||||||||||||||||||||||||||||||||
| Shirley Basin |
89.2 | 0.16 | 0.3 | 1,638.2 | 0.11 | 4.1 | 4.4 | 4.4 | 508.0 | 0.10 | 1.1 | 1.1 | ||||||||||||||||||||||||||||||||||||
| Smith Ranch - Highland |
3,710.6 | 0.10 | 7.9 | 14,372.3 | 0.05 | 17.0 | 24.9 | 24.9 | 6,861.0 | 0.05 | 7.7 | 7.7 | ||||||||||||||||||||||||||||||||||||
|
|
|
|
|
|
|
|
|
|
|
|
|
|
|
|
|
|
|
|
|
|
|
|
|
|||||||||||||||||||||||||
| Total |
70,650.9 | — | 146.0 | 69,394.6 | — | 385.2 | 531.2 | 426.1 | 132,003.2 | — | 255.4 | 174.3 | ||||||||||||||||||||||||||||||||||||
|
|
|
|
|
|
|
|
|
|
|
|
|
|
|
|
|
|
|
|
|
|
|
|
|
|||||||||||||||||||||||||
Note that mineral resources:
| • | do not include amounts that have been identified as mineral reserves |
| • | do not have demonstrated economic viability |
| • | totals may not add due to rounding |
| 90 | CAMECO CORPORATION |
Additional information
Due to the nature of our business, we are required to make estimates that affect the amount of assets and liabilities, revenues and expenses, commitments and contingencies we report. We base our estimates on our experience, our best judgment, guidelines established by the Canadian Institute of Mining, Metallurgy and Petroleum and on assumptions we believe are reasonable.
We believe the following critical accounting estimates reflect the more significant judgments used in the preparation of our financial statements. These estimates affect all of our segments, unless otherwise noted.
Decommissioning and reclamation
In our uranium and fuel services segments, we are required to estimate the cost of decommissioning and reclamation for each operation, but we normally do not incur these costs until an asset is nearing the end of its useful life. Regulatory requirements and decommissioning methods could change during that time, making our actual costs different from our estimates. A significant change in these costs or in our mineral reserves could have a material impact on our net earnings and financial position. See note 15 to the financial statements.
Property, plant and equipment
We depreciate property, plant and equipment primarily using the unit-of-production method, where the carrying value is reduced as resources are depleted. A change in our mineral reserves would change our depreciation expenses, and such a change could have a material impact on amounts charged to earnings.
We assess the carrying values of property, plant and equipment and goodwill every year, or more often if necessary. If we determine that we cannot recover the carrying value of an asset or goodwill, we write off the unrecoverable amount against current earnings. We base our assessment of recoverability on assumptions and judgments we make about future prices, production costs, our requirements for sustaining capital and our ability to economically recover mineral reserves. A material change in any of these assumptions could have a significant impact on the potential impairment of these assets.
In performing impairment assessments of long-lived assets, assets that cannot be assessed individually are grouped together into the smallest group of assets that generates cash inflows that are largely independent of the cash inflows from other assets or groups of assets. Management is required to exercise judgment in identifying these cash generating units.
Taxes
When we are preparing our financial statements, we estimate taxes in each jurisdiction we operate in, taking into consideration different tax rates, non-deductible expenses, valuation of deferred tax assets, changes in tax laws and our expectations for future results.
We base our estimates of deferred income taxes on temporary differences between the assets and liabilities we report in our financial statements, and the assets and liabilities determined by the tax laws in the various countries we operate in. We record deferred income taxes in our financial statements based on our estimated future cash flows, which includes estimates of non-deductible expenses, future market conditions, production levels and intercompany sales. If these estimates are not accurate, there could be a material impact on our net earnings and financial position.
Controls and procedures
We have evaluated the effectiveness of our disclosure controls and procedures and internal control over financial reporting as of December 31, 2020, as required by the rules of the US Securities and Exchange Commission and the Canadian Securities Administrators.
| MANAGEMENT’S DISCUSSION AND ANALYSIS | 91 |
Management, including our Chief Executive Officer (CEO) and our Chief Financial Officer (CFO), supervised and participated in the evaluation, and concluded that our disclosure controls and procedures are effective to provide a reasonable level of assurance that the information we are required to disclose in reports we file or submit under securities laws is recorded, processed, summarized and reported accurately, and within the time periods specified. It should be noted that, while the CEO and CFO believe that our disclosure controls and procedures provide a reasonable level of assurance that they are effective, they do not expect the disclosure controls and procedures or internal control over financial reporting to be capable of preventing all errors and fraud. A control system, no matter how well conceived or operated, can provide only reasonable, not absolute, assurance that the objectives of the control system are met.
Management, including our CEO and our CFO, is responsible for establishing and maintaining internal control over financial reporting and conducted an evaluation of the effectiveness of our internal control over financial reporting based on the Internal Control — Integrated Framework (2013) issued by the Committee of Sponsoring Organizations of the Treadway Commission (COSO). Based on this evaluation, management concluded that our internal control over financial reporting was effective as of December 31, 2020.
There have been no changes in our internal control over financial reporting during the year that have materially affected, or are reasonably likely to materially affect, our internal control over financial reporting.
New standards adopted
A number of amendments to existing standards became effective January 1, 2020 but they did not have an effect on the Company’s financial statements.
| 92 | CAMECO CORPORATION |
Serious News for Serious Traders! Try StreetInsider.com Premium Free!
You May Also Be Interested In
- William O'Neil Reinstates Cameco Corporation (CCJ) at Buy
- TScan Therapeutics Announces Launch of $125 Million Proposed Public Offering
- Phoenix Motor Announces 2024 Investor Day Details for In-Person and Online Attendees
Create E-mail Alert Related Categories
SEC FilingsSign up for StreetInsider Free!
Receive full access to all new and archived articles, unlimited portfolio tracking, e-mail alerts, custom newswires and RSS feeds - and more!
