

Form 6-K BCE INC For: Apr 29
 Tweet
Tweet Share
ShareUNITED STATES
SECURITIES AND EXCHANGE COMMISSION
WASHINGTON, D.C. 20549
FORM 6-K
REPORT OF FOREIGN PRIVATE ISSUER
Pursuant to Rule 13a-16 or 15d-16 under
the Securities Exchange Act of 1934
| For the month of: April 2021 | Commission File Number: 1-8481 |
BCE Inc.
(Translation of Registrant’s name into English)
1, Carrefour Alexander-Graham-Bell, Verdun, Québec, Canada H3E 3B3,
(514) 870-8777
(Address of principal executive offices)
Indicate by check mark whether the registrant files or will file annual reports under cover of Form 20-F or Form 40-F.
| Form 20-F | Form 40-F X | |
Indicate by check mark if the registrant is submitting the Form 6-K in paper as permitted by Regulation S-T Rule 101(b)(1):
Indicate by check mark if the registrant is submitting the Form 6-K in paper as permitted by Regulation S-T Rule 101(b)(7):
Indicate by check mark whether by furnishing the information contained in this Form, the registrant is also thereby furnishing the information to the Commission pursuant to Rule 12g3-2(b) under the Securities Exchange Act of 1934.
| Yes | No X | |
If “Yes” is marked, indicate below the file number assigned to the registrant in connection with Rule 12g3-2(b): 82- .
Only the BCE Inc. Management’s Discussion and Analysis for the quarter ended March 31, 2021 and the BCE Inc. unaudited consolidated interim financial statements for the quarter ended March 31, 2021, included in the BCE Inc. 2021 First Quarter Shareholder Report furnished with this Form 6-K as Exhibit 99.1, the Bell Canada Unaudited Selected Summary Financial Information for the quarter ended March 31, 2021 furnished with this Form 6-K as Exhibit 99.5, and the Exhibit to 2021 First Quarter Financial Statements – Earnings Coverage furnished with this Form 6-K as Exhibit 99.6 are incorporated by reference in the registration statements filed by BCE Inc. with the Securities and Exchange Commission on Form F-3 (Registration Statement No. 333-12130), Form S-8 (Registration Statement No. 333-12780), Form S-8 (Registration Statement No. 333-12802) and Form F-10 (Registration Statement No. 333-249962). Except for the foregoing, no other document or portion of document furnished with this Form 6-K is incorporated by reference in BCE Inc.’s registration statements. Notwithstanding any reference to BCE Inc.’s Web site on the World Wide Web in the documents attached hereto, the information contained in BCE Inc.’s site or any other site on the World Wide Web referred to in BCE Inc.’s site is not a part of this Form 6-K and, therefore, is not furnished to the Securities and Exchange Commission.
Page 1
SIGNATURE
Pursuant to the requirements of the Securities Exchange Act of 1934, the Registrant has duly caused this report to be signed on its behalf by the undersigned, thereunto duly authorized.
| BCE Inc. | ||
| (signed) Glen LeBlanc
| ||
| Glen LeBlanc Executive Vice-President and Chief Financial Officer | ||
| April 29, 2021 | ||
Page 2
EXHIBIT INDEX
| 99.1 | BCE Inc. 2021 First Quarter Shareholder Report | |
| 99.2 | Supplementary Financial Information – First Quarter 2021 | |
| 99.3 | CEO/CFO Certifications | |
| 99.4 | News Release | |
| 99.5 | Bell Canada Unaudited Selected Summary Financial Information | |
| 99.6 | Exhibit to 2021 First Quarter Financial Statements – Earnings Coverage |
Page 3
Table of Contents
Exhibit 99.1

BCE 2021 FIRST QUARTER SHAREHOLDER REPORT APRIL 28, 2021 Q1
Table of Contents
Table of contents
| 1 | ||||||
| 1 | ||||||
| 1 |
3 | |||||
| 4 | ||||||
| 6 | ||||||
| 1.3 Assumptions |
7 | |||||
| 2 |
8 | |||||
| 8 | ||||||
| 9 | ||||||
| 10 | ||||||
| 2.4 Operating costs |
10 | |||||
| 2.5 Net earnings |
11 | |||||
| 2.6 Adjusted EBITDA |
11 | |||||
| 11 | ||||||
| 12 | ||||||
| 2.9 Finance costs |
12 | |||||
| 12 | ||||||
| 2.11 Income taxes |
12 | |||||
| 2.12 Net earnings attributable to common shareholders and EPS |
12 | |||||
| 3 |
13 | |||||
| 3.1 Bell Wireless |
13 | |||||
| 3.2 Bell Wireline |
17 | |||||
| 3.3 Bell Media |
21 | |||||
| 4 |
23 | |||||
| 4.1 Net debt |
23 | |||||
| 23 | ||||||
| 4.3 Cash flows |
24 | |||||
| 25 | ||||||
| 25 | ||||||
| 4.6 Credit ratings |
27 | |||||
| 4.7 Liquidity |
27 | |||||
| 5 |
28 | |||||
| 6 |
29 | |||||
| 7 |
30 | |||||
| 30 | ||||||
| 7.2 Non-GAAP financial measures and key performance indicators (KPIs) |
30 | |||||
| 33 | ||||||
| 34 | ||||||
| 34 | ||||||
| 35 | ||||||
| 36 | ||||||
| 37 | ||||||
| 38 | ||||||
| 39 | ||||||
| Note 1 |
39 | |||||
| Note 2 |
39 | |||||
| Note 3 |
40 | |||||
| Note 4 |
41 | |||||
| Note 5 |
41 | |||||
| Note 6 |
42 | |||||
| Note 7 |
42 | |||||
| Note 8 |
42 | |||||
| Note 9 |
42 | |||||
| Note 10 |
43 | |||||
| Note 11 |
44 | |||||
| Note 12 |
45 | |||||
| Note 13 |
46 | |||||
| Note 14 |
46 | |||||
Table of Contents
MD&A
Management’s discussion and analysis
In this management’s discussion and analysis (MD&A), we, us, our, BCE and the company mean, as the context may require, either BCE Inc. or, collectively, BCE Inc., Bell Canada, their subsidiaries, joint arrangements and associates. Bell means, as the context may require, either Bell Canada or, collectively, Bell Canada, its subsidiaries, joint arrangements and associates.
All amounts in this MD&A are in millions of Canadian dollars, except where noted. Please refer to section 7.2, Non-GAAP financial measures and key performance indicators (KPIs) on pages 30 to 32 for a list of defined non-GAAP financial measures and KPIs.
Please refer to BCE’s unaudited consolidated financial statements for the first quarter of 2021 (Q1 2021 Financial Statements) when reading this MD&A. We also encourage you to read BCE’s MD&A for the year ended December 31, 2020 dated March 4, 2021 (BCE 2020 Annual MD&A). In preparing this MD&A, we have taken into account information available to us up to April 28, 2021, the date of this MD&A, unless otherwise stated.
You will find additional information relating to BCE, including BCE’s annual information form for the year ended December 31, 2020 dated March 4, 2021 (BCE 2020 AIF) and recent financial reports, including the BCE 2020 Annual MD&A, on BCE’s website at BCE.ca, on SEDAR at sedar.com and on EDGAR at sec.gov.
Documents and other information contained in BCE’s website or in any other site referred to in BCE’s website or in this MD&A are not part of this MD&A and are not incorporated by reference herein.
This MD&A comments on our business operations, performance, financial position and other matters for the three months (Q1) ended March 31, 2021 and 2020.
CAUTION REGARDING FORWARD-LOOKING STATEMENTS
This MD&A and, in particular, but without limitation, the introduction to section 1, Overview, section 1.2, Key corporate and business developments, the section and sub-sections entitled Assumptions, section 3.1, Bell Wireless – Key business developments, section 3.2, Bell Wireline – Key business developments, section 4.3, Cash flows and section 4.7, Liquidity, contain forward-looking statements. These forward-looking statements include, without limitation, statements relating to the potential impacts on our business, financial condition, liquidity and financial results of the COVID-19 pandemic, BCE’s 2021 annualized common share dividend, our network deployment and capital investment plans, the sources of liquidity we expect to use to meet our anticipated cash requirements for the remainder of 2021, BCE’s business outlook, objectives, plans and strategic priorities, and other statements that do not refer to historical facts. A statement we make is forward-looking when it uses what we know and expect today to make a statement about the future. Forward-looking statements are typically identified by the words assumption, goal, guidance, objective, outlook, project, strategy, target, and other similar expressions or future or conditional verbs such as aim, anticipate, believe, could, expect, intend, may, plan, seek, should, strive and will. All such forward-looking statements are made pursuant to the safe harbour provisions of applicable Canadian securities laws and of the United States (U.S.) Private Securities Litigation Reform Act of 1995.
Unless otherwise indicated by us, forward-looking statements in this MD&A describe our expectations as at April 28, 2021 and, accordingly, are subject to change after that date. Except as may be required by applicable securities laws, we do not undertake any obligation to update or revise any forward-looking statements, whether as a result of new information, future events or otherwise.
Forward-looking statements, by their very nature, are subject to inherent risks and uncertainties and are based on several assumptions, both general and specific, which give rise to the possibility that actual results or events could differ materially from our expectations expressed in, or implied by, such forward-looking statements and that our business outlook, objectives, plans and strategic priorities may not be achieved. These statements are not guarantees of future performance or events, and we caution you against relying on any of these forward-looking statements. Forward-looking statements are presented in this MD&A for the purpose of assisting investors and others in understanding our objectives, strategic priorities and business outlook as well as our anticipated operating environment. Readers are cautioned, however, that such information may not be appropriate for other purposes.
We have made certain economic, market and operational assumptions in preparing the forward-looking statements contained in this MD&A and, in particular, but without limitation, the forward-looking statements contained in the previously mentioned sections of this MD&A. These assumptions include, without limitation, the assumptions described in the section and sub-sections of this MD&A entitled Assumptions, which section and sub-sections are incorporated by reference in this cautionary statement. Subject to various factors including, without limitation, the future impacts of the COVID-19 pandemic, which are difficult to predict, we believe that our assumptions were reasonable at April 28, 2021. If our assumptions turn out to be inaccurate, our actual results could be materially different from what we expect.
Important risk factors that could cause actual results or events to differ materially from those expressed in, or implied by, the previously-mentioned forward-looking statements and other forward-looking statements contained in this MD&A, include, but are not limited to: the COVID-19 pandemic and the adverse effects from the emergency measures implemented or to be implemented as a result thereof, as well as other pandemics, epidemics and other health risks; adverse economic and financial market conditions, a declining level of retail and commercial activity, and the resulting negative impact on the demand for, and prices of, our products and services; the intensity of competitive activity including from new and emerging competitors; the level of technological substitution and the presence of alternative service providers contributing to the acceleration of disruptions and disintermediation in each of our business segments; changing viewer habits and the expansion of over-the-top (OTT) television (TV) and other alternative service providers, as well as the fragmentation of, and changes in, the advertising market; rising content costs and challenges in our ability to acquire or develop key content; the proliferation of content piracy; higher Canadian smartphone penetration and reduced or slower immigration flow; regulatory initiatives, proceedings and decisions, government consultations and government positions that affect us and influence our business; the inability to protect our physical and non-physical assets from events such as information security attacks, unauthorized access or entry, fire and natural disasters; the failure to transform our operations, enabling a truly customer-centric service experience, while lowering our cost structure; the failure to continue investment in next-generation capabilities in a disciplined and strategic manner; the inability to drive a positive customer experience; the complexity in our operations; the failure to maintain operational networks in the context of significant increases in capacity demands; the risk that we may need to incur significant capital expenditures to provide additional capacity and reduce network congestion; the failure to implement or maintain highly effective information
BCE INC. 2021 FIRST QUARTER SHAREHOLDER REPORT | 1
Table of Contents
MD&A
technology (IT) systems; the failure to generate anticipated benefits from our corporate restructurings, system replacements and upgrades, process redesigns, staff reductions and the integration of business acquisitions; events affecting the functionality of, and our ability to protect, test, maintain, replace and upgrade, our networks, IT systems, equipment and other facilities; in-orbit and other operational risks to which the satellites used to provide our satellite TV services are subject; the failure to attract and retain employees with the appropriate skill sets and to drive their performance in a safe environment; labour disruptions and shortages; our dependence on third-party suppliers, outsourcers and consultants to provide an uninterrupted supply of the products and services we need to operate our business; the failure of our vendor selection, governance and oversight processes; security and data leakage exposure if security control protocols affecting our suppliers are bypassed; the quality of our products and services and the extent to which they may be subject to manufacturing defects or fail to comply with applicable government regulations and standards; the inability to access adequate sources of capital and generate sufficient cash flows from operating activities to meet our cash requirements, fund capital expenditures and provide for planned growth; uncertainty as to whether dividends will be declared by BCE’s board of directors or whether the dividend on common shares will be increased; the inability to manage various credit, liquidity and market risks; pension obligation volatility and increased contributions to post-employment benefit plans; new or higher taxes due to new tax laws or changes thereto or in the interpretation thereof, and the inability to predict the outcome of government audits; the failure to reduce costs, as well as unexpected increases in costs; the failure to evolve practices to effectively monitor and control fraudulent activities; unfavourable resolution of legal proceedings and, in particular, class actions; new or unfavourable changes in applicable laws and the failure to proactively address our legal and regulatory obligations; the failure to recognize and adequately respond to climate change concerns or stakeholder and governmental changing expectations on environmental matters; and health concerns about radiofrequency emissions from wireless communication devices and equipment.
We caution that the foregoing list of risk factors is not exhaustive and other factors could also materially adversely affect us. Please see section 9, Business risks of the BCE 2020 Annual MD&A for a more complete description of the above-mentioned and other risks, which section, and the other sections of the BCE 2020 Annual MD&A referred to therein, are incorporated by reference in this cautionary statement. In addition, please also see section 6, Regulatory environment in this MD&A for updates to the regulatory initiatives and proceedings described in the BCE 2020 Annual MD&A, which section 6 is incorporated by reference in this cautionary statement. Any of those risks could cause actual results or events to differ materially from our expectations expressed in, or implied by, the forward-looking statements set out in this MD&A. Except for the updates set out in section 6, Regulatory environment of this MD&A, the risks described in the BCE 2020 Annual MD&A remain substantially unchanged.
We caution readers that the risk factors described above are not the only ones that could affect us. Additional risks and uncertainties not currently known to us or that we currently deem to be immaterial may also have a material adverse effect on our business, financial condition, liquidity, financial results or reputation. From time to time, we consider potential acquisitions, dispositions, mergers, business combinations, investments, monetizations, joint ventures and other transactions, some of which may be significant. Except as otherwise indicated by us, forward-looking statements do not reflect the potential impact of any such transactions or of special items that may be announced or that may occur after April 28, 2021. The financial impact of these transactions and special items can be complex and depends on facts particular to each of them. We therefore cannot describe the expected impact in a meaningful way, or in the same way we present known risks affecting our business.
2 | BCE INC. 2021 FIRST QUARTER SHAREHOLDER REPORT
Table of Contents
1 MD&A Overview
The COVID-19 pandemic continued to unfavourably impact our financial and operating performance in the first quarter of 2021 as emergency measures were first introduced in the second half of March 2020. It has been over a year since the pandemic began affecting our performance and we have been adapting to operate our business in this environment. Our Bell Wireless and Bell Media segments continued to be adversely affected in the quarter due to reduced commercial activity compared to Q1 2020 as a result of the government restrictions put in place to combat the pandemic. Certain emergency measures were gradually eased during the quarter, which allowed many businesses to resume some level of, or increase, commercial activities. However, by the end of March 2021, an increasing number of cases and the rise of new COVID-19 variants led to the further tightening of government restrictions and reintroduction of emergency measures in certain areas.
The COVID-19 pandemic had the following principal consequences on our business and financial results in the first quarter of 2021 compared to the first quarter of 2020:
| • | Lower advertising revenues from our Bell Media segment mainly in out-of-home (OOH) due to non-essential service restrictions (including restaurants, arenas and bars) and reduced airport and transit traffic, along with lower radio advertising revenues from decreased audience levels attributable to changes in audience listening habits as a result of the work-from-home measures |
| • | Decreased service revenues in our Bell Wireless segment primarily due to lower outbound roaming revenues resulting from reduced customer travel |
Due to uncertainties relating to the severity and duration of the COVID-19 pandemic, including the current resurgence and possible future resurgences in the number of COVID-19 cases, and various potential outcomes, it is difficult at this time to estimate the impacts of the COVID-19 pandemic on our business or future financial results and related assumptions. Our business and financial results could continue to be significantly and negatively impacted in future periods. The extent to which the COVID-19 pandemic will continue to adversely impact us will depend on future developments that are difficult to predict, including the prevalence of COVID-19 variants that are more contagious and may lead to increased health risks, the timely distribution of effective vaccines and treatments, and the potential development and distribution of new vaccines and treatments, as well as new information which may emerge concerning the severity, duration and resurgences of the COVID-19 pandemic and the actions required to contain the coronavirus or remedy its impacts, among others. Any of the risks referred to in this MD&A, including, in particular, in the section Caution regarding forward-looking statements at the beginning of this MD&A, and others arising from the COVID-19 pandemic, could have a material adverse effect on our business, financial condition, liquidity, financial results or reputation.
BCE INC. 2021 FIRST QUARTER SHAREHOLDER REPORT | 3
Table of Contents
1 MD&A Overview
BCE Q1 2021 SELECTED QUARTERLY INFORMATION
| Operating revenues | Net earnings | Adjusted EBITDA (1) | ||
| $5,706 | $687 | $2,429 | ||
| million | million | million | ||
| +1.2% vs. Q1 2020 | (6.3%) vs. Q1 2020 | +0.5% vs. Q1 2020 |
| Net earnings attributable | Adjusted net earnings (1) | Cash flows from | Free cash flow (1) | |||
| to common shareholders | operating activities | |||||
| $642 | $704 | $1,992 | $940 | |||
| million | million | million | million | |||
| (5.6%) vs. Q1 2020 | (1.4%) vs. Q1 2020 | +37.3% vs. Q1 2020 | +53.8% vs. Q1 2020 | |||
|
BCE CUSTOMER CONNECTIONS
| ||||||
| Wireless | Retail high-speed | Retail TV (4) | Retail residential network | |||
| Total mobile phones(2) | Internet (3) | access services (NAS) lines | ||||
| +2.2% | +4.3% | (1.1%) | (7.7%) | |||
| 9.2 million subscribers | 3.7 million subscribers | 2.7 million subscribers | 2.4 million subscribers | |||
| at March 31, 2021 | at March 31, 2021 | at March 31, 2021 | at March 31, 2021 | |||
| (1) | Adjusted EBITDA, adjusted net earnings and free cash flow are non-GAAP financial measures and do not have any standardized meaning under International Financial Reporting Standards (IFRS). Therefore, they are unlikely to be comparable to similar measures presented by other issuers. See section 7.2, Non-GAAP financial measures and key performance indicators (KPIs) – Adjusted EBITDA and adjusted EBITDA margin, Adjusted net earnings and adjusted EPS and Free cash flow and dividend payout ratio, in this MD&A for more details, including reconciliations to the most comparable IFRS financial measure. |
| (2) | Effective January 1, 2021, we changed our wireless operating metrics to reflect our revised approach to reporting wireless subscriber units. Consequently, we are now reporting in two categories, mobile phone subscriber units and mobile connected device subscriber units (e.g. tablets, wearables and mobile Internet devices). Additionally, mobile connected device subscribers now include previously undisclosed Internet of Things (IoT) units (e.g. connected telematics services, monitoring devices, connected cars and fleet management solutions). These changes are consistent with the way we manage our business, reflect our focus on mobile phone subscribers and align to industry peers. As a result, previously reported 2020 subscribers and associated operating metrics (gross and net activations (losses), average billing per user (ABPU) and churn) have been restated for comparability. See section 7.2, Non-GAAP financial measures and key performance indicators (KPIs) – KPIs, in this MD&A for more details. |
| (3) | At the beginning of Q1 2021, our retail high-speed Internet subscriber base was increased by 4,778 subscribers due to the transfer of fixed wireless Internet subscribers from our mobile connected devices subscriber base. |
| (4) | At the beginning of Q1 2021, we adjusted our satellite TV subscriber base to remove 6,125 non-revenue generating units. |
4 | BCE INC. 2021 FIRST QUARTER SHAREHOLDER REPORT
Table of Contents
1 MD&A Overview
BCE INCOME STATEMENTS – SELECTED INFORMATION
| Q1 2021 | Q1 2020 | $ CHANGE | % CHANGE | |||||||||||||
| Operating revenues |
||||||||||||||||
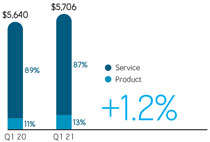
| Service |
4,968 | 5,018 | (50 | ) | (1.0%) | |||||||||||
| Product |
738 | 622 | 116 | 18.6% | ||||||||||||
| Total operating revenues |
5,706 | 5,640 | 66 | 1.2% | ||||||||||||
| Operating costs |
(3,277 | ) | (3,222 | ) | (55 | ) | (1.7%) | |||||||||
| Adjusted EBITDA |
2,429 | 2,418 | 11 | 0.5% | ||||||||||||
| Adjusted EBITDA margin (1) |
42.6 | % | 42.9 | % | (0.3) | pts | ||||||||||
| Net earnings from continuing operations attributable to: |
||||||||||||||||
| Common shareholders |
642 | 675 | (33 | ) | (4.9%) | |||||||||||
| Preferred shareholders |
32 | 38 | (6 | ) | (15.8%) | |||||||||||
| Non-controlling interest |
13 | 15 | (2 | ) | (13.3%) | |||||||||||
| Net earnings from continuing operations |
687 | 728 | (41 | ) | (5.6%) | |||||||||||
| Net earnings from discontinued operations |
– | 5 | (5 | ) | (100.0%) | |||||||||||
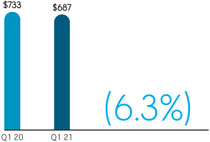
| Net earnings |
687 | 733 | (46 | ) | (6.3%) | |||||||||||
| Net earnings attributable to: |
||||||||||||||||
| Common shareholders |
642 | 680 | (38 | ) | (5.6%) | |||||||||||
| Preferred shareholders |
32 | 38 | (6 | ) | (15.8%) | |||||||||||
| Non-controlling interest |
13 | 15 | (2 | ) | (13.3%) | |||||||||||
| Net earnings |
687 | 733 | (46 | ) | (6.3%) | |||||||||||
| Adjusted net earnings |
704 | 714 | (10 | ) | (1.4%) | |||||||||||
| Net earnings from continuing operations per common share |
0.71 | 0.74 | (0.03 | ) | (4.1%) | |||||||||||
| Net earnings from discontinued operations per common share |
– | 0.01 | (0.01 | ) | (100.0%) | |||||||||||
| Net earnings per common share (EPS) |
0.71 | 0.75 | (0.04 | ) | (5.3%) | |||||||||||
| Adjusted EPS (1) |
0.78 | 0.79 | (0.01 | ) | (1.3%) | |||||||||||
|
(1) Adjusted EBITDA margin and adjusted EPS are non-GAAP financial measures and do not have any standardized meaning under IFRS. Therefore, they are unlikely to be comparable to similar measures presented by other issuers. See section 7.2, Non-GAAP financial measures and key performance indicators (KPIs) – Adjusted EBITDA and adjusted EBITDA margin and Adjusted net earnings and adjusted EPS, in this MD&A for more details, including reconciliations to the most comparable IFRS financial measure. |
| |||||||||||||||
| BCE STATEMENTS OF CASH FLOWS – SELECTED INFORMATION
|
| |||||||||||||||
| Q1 2021 | Q1 2020 | $ CHANGE | % CHANGE | |||||||||||||
| Cash flows from operating activities |
1,992 | 1,451 | 541 | 37.3% | ||||||||||||
| Capital expenditures |
(1,012 | ) | (777 | ) | (235 | ) | (30.2%) | |||||||||
| Free cash flow |
940 | 611 | 329 | 53.8% | ||||||||||||
Q1 2021 FINANCIAL HIGHLIGHTS
BCE revenue growth of 1.2% in Q1 2021, compared to the same period last year, represented an improvement over the 2.8% year-over-year decline experienced in Q4 2020, due to the moderating impacts of the COVID-19 pandemic earlier in the quarter. The growth in Q1 2021 revenues was driven by higher year-over-year product revenues of 18.6%, primarily due to greater sales of wireless premium mobile phones, along with higher equipment sales to large enterprise customers attributable to increased demand, mainly from the government sector. This growth was moderated by lower year-over-year service revenues of 1.0%, due to the ongoing erosion in our voice, satellite TV and legacy data revenues along with reduced media advertising revenues and lower wireless service revenues mainly from lower outbound roaming, driven by the continuing impacts of the COVID-19 pandemic. This was partly offset by the ongoing growth of our mobile phones, retail Internet, and Internet protocol TV (IPTV) subscriber bases, combined with the flow-through of rate increases.
Net earnings decreased by $46 million in the first quarter of 2021, compared to the same period last year, mainly due to higher severance, acquisition and other costs and higher depreciation and amortization, partly offset by higher other income and higher adjusted EBITDA.
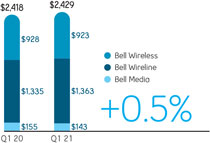
BCE’s adjusted EBITDA increased by 0.5% in Q1 2021, compared to the same period last year. This represented an improvement over the 3.2% year-over-year decline experienced in Q4 2020, due to the moderating impacts of the COVID-19 pandemic earlier in the quarter. The year-over-year increase in Q1 2021 adjusted EBITDA was driven by higher revenues, moderated by increased operating costs. This resulted in an adjusted EBITDA margin of 42.6% in Q1 2021, which declined by 0.3 pts, compared to Q1 2020, primarily from the flow-through impact of lower year-over-year service revenue and greater low-margin product sales in our total revenue base.
BCE’s EPS of $0.71 in Q1 2021 decreased by $0.04 compared to the same period last year.
BCE INC. 2021 FIRST QUARTER SHAREHOLDER REPORT | 5
Table of Contents
1 MD&A Overview
Excluding the impact of severance, acquisition and other costs, net mark-to-market gains (losses) on derivatives used to economically hedge equity settled share-based compensation plans, net gains (losses) on investments, early debt redemption costs, impairment of assets and discontinued operations, net of tax and non-controlling interest (NCI), adjusted net earnings in the first quarter of 2021 was $704 million, or $0.78 per common share, compared to $714 million, or $0.79 per common share, for the same period last year.
Cash flows from operating activities in the first quarter of 2021 increased by $541 million, compared to the same period last year, mainly due to higher cash from working capital, in part from a slowdown experienced in Q1 2020 due to the COVID-19 pandemic and timing of supplier payments, and lower income taxes paid due to timing of installments.
Free cash flow in Q1 2021 increased by $329 million, compared to the same period last year, mainly due to higher cash flows from operating activities, excluding cash from discontinued operations and acquisition and other costs paid, partly offset by higher capital expenditures.
1.2 Key corporate and business developments
This section contains forward-looking statements, including relating to BCE’s 2021 annualized common share dividend and our objectives and plans. Refer to the section Caution regarding forward-looking statements at the beginning of this MD&A.
COMMON SHARE DIVIDEND INCREASE
On February 3, 2021, BCE’s board of directors approved a 5.1%, or 17 cents per share, increase in the annualized common share dividend from $3.33 per share to $3.50 per share, effective with BCE’s 2021 first quarter dividend paid on April 15, 2021 to common shareholders of record on March 15, 2021. This dividend increase represents BCE’s 17th increase to its annual common share dividend since 2009, representing a total increase of 140%.
PUBLIC DEBT OFFERINGS AND REDEMPTION
On March 17, 2021, Bell Canada completed a public offering in Canada of Cdn $1.55 billion of medium term notes (MTN) debentures in two series pursuant to its MTN program. The Cdn $1 billion Series M-54 MTN debentures will mature on March 17, 2031 and carry an annual interest rate of 3.00%. The Cdn $550 million Series M-55 MTN debentures will mature on March 17, 2051 and carry an annual interest rate of 4.05%. The MTN debentures are fully and unconditionally guaranteed by BCE Inc.
On the same date, Bell Canada also completed a public offering in the U.S. of US $1.1 billion of notes in two series (collectively, the Notes). The US $600 million Series US-3 Notes will mature on March 17, 2024 and carry an annual interest rate of 0.75%. The US $500 million Series US-4 Notes will mature on March 17, 2051 and carry an annual interest rate of 3.65%. The Notes are fully and unconditionally guaranteed by BCE Inc.
The net proceeds of the offerings were used to fund the early redemption in April 2021 of Bell Canada’s $1.7 billion principal amount of 3.00% Series M-40 MTN debentures due October 3, 2022 and to repay short-term debt.
BELL PLANNING FOR CARBON NEUTRAL OPERATIONS IN 2025
On March 11 2021, Bell announced its objective to be carbon neutral for its operational emissions starting in 2025. In 2020, Bell surpassed its greenhouse gas (GHG) emissions reduction target for the year, reducing the ratio of its operational emissions to its network usage by 34% from 2019 levels, and plans to further reduce the ratio of its operational GHG emissions to its network usage by 40% of 2019 levels by the end of 2021.
Bell also celebrated its status as the first North American communications company to achieve ISO 50001 certification for its energy management system. The international ISO 50001 standard requires companies to adopt a strict set of energy management objectives, guidelines and practices that enable energy efficiency and reductions in GHG emissions. ISO 50001 status is the latest example of Bell’s world-class sustainability practices; we were also the first Canadian telecommunications company to achieve ISO 14001 environmental certification.
In 2021, Bell was named one of Canada’s Greenest Employers for the fifth consecutive year, recognizing the company’s focus on minimizing environmental impact, energy management system leadership, and success in ongoing initiatives to reduce waste and save energy.
SERVICE IMPROVEMENTS HIGHLIGHTED IN CCTS REPORT
Bell’s investments in championing the customer experience helped drive a 17% reduction in the number of customer complaints accepted by the Commission for Complaints for Telecom-television Services (CCTS) according to the federal agency’s mid-year report. Bell’s improvement was the best performance among national carriers for the sixth year in a row. The CCTS report, which covers the period from August 1, 2020 to January 31, 2021, reflects a timeframe when Canadians everywhere were relying on communications services and networks like never before, especially for remote work and learning connections. Bell responded by accelerating broadband network buildouts in urban and rural locations alike, investing in network capacity and redundancy to manage unprecedented usage levels, and in service enhancements ranging from remote product installation by video to enhanced digital self-serve platforms that enable customers to control their service experience.
BELL NAMED ONE OF CANADA’S BEST DIVERSITY EMPLOYERS
For the fifth year in a row, Bell has been named one of Canada’s Best Diversity Employers in Mediacorp’s 2021 report on workplace diversity and inclusion. The award recognizes Bell’s commitment to an inclusive and accessible workplace that reflects Canada’s diversity and our ongoing action to combat systemic racism.
6 | BCE INC. 2021 FIRST QUARTER SHAREHOLDER REPORT
Table of Contents
1 MD&A Overview
As at the date of this MD&A, our forward-looking statements set out in the BCE 2020 Annual MD&A, as updated or supplemented in this MD&A, are based on certain assumptions including, without limitation, the following economic and market assumptions as well as the various assumptions referred to under the sub-sections entitled Assumptions set out in section 3, Business segment analysis of this MD&A.
ASSUMPTIONS ABOUT THE CANADIAN ECONOMY
We have made certain assumptions concerning the Canadian economy, which in turn depend on important assumptions about how the COVID-19 pandemic will evolve, including the progress of the global vaccination rollout. Notably, it is assumed that broad immunity is achieved by mid-2021 in the U.S.; later in 2021 in Canada, other advanced economies and China; and in 2022 in other emerging-market economies. In particular, we have assumed:
| • | Strong rebound in economic growth as the economy recovers from the significant impacts of the COVID-19 pandemic, given the Bank of Canada’s most recent estimated growth in Canadian gross domestic product of around 6.5% on average in 2021, representing an increase from the earlier estimate of around 4% |
| • | Improving consumer confidence as vaccinations roll out and restrictions are eased |
| • | Strengthening business investment outside the oil and gas sector as uncertainty recedes |
| • | Employment gains expected in 2021, despite ongoing challenges in some sectors |
| • | Accelerating trend toward e-commerce |
| • | Low immigration levels until international travel and/or health-related restrictions are lifted |
| • | Prevailing low interest rates expected to remain at or near current levels for the foreseeable future |
| • | Canadian dollar expected to remain at or near current levels. Further movements may be impacted by the degree of strength of the U.S. dollar, interest rates and changes in commodity prices. |
MARKET ASSUMPTIONS
| • | A consistently high level of wireline and wireless competition in consumer, business and wholesale markets |
| • | Higher, but slowing, wireless industry penetration |
| • | A shrinking data and voice connectivity market as business customers migrate to lower-priced traditional telecommunications solutions or alternative OTT competitors |
| • | While the advertising market continues to be adversely impacted by cancelled or delayed advertising campaigns from many sectors due to the economic downturn during the COVID-19 pandemic, we do expect gradual recovery in 2021 |
| • | Declines in broadcasting distribution undertakings (BDU) subscribers driven by increasing competition from the continued rollout of subscription video on demand streaming services together with further scaling of OTT aggregators |
BCE INC. 2021 FIRST QUARTER SHAREHOLDER REPORT | 7
Table of Contents
2 MD&A Consolidated financial analysis
2 Consolidated financial analysis
This section provides detailed information and analysis about BCE’s performance in Q1 2021 compared with Q1 2020. It focuses on BCE’s consolidated operating results and provides financial information for our Bell Wireless, Bell Wireline and Bell Media business segments. For further discussion and analysis of our business segments, refer to section 3, Business segment analysis.
2.1 BCE consolidated income statements
| Q1 2021 | Q1 2020 | $ CHANGE | % CHANGE | |||||||||||||
| Operating revenues |
||||||||||||||||
| Service |
4,968 | 5,018 | (50 | ) | (1.0%) | |||||||||||
| Product |
738 | 622 | 116 | 18.6% | ||||||||||||
| Total operating revenues |
5,706 | 5,640 | 66 | 1.2% | ||||||||||||
| Operating costs |
(3,277 | ) | (3,222 | ) | (55 | ) | (1.7%) | |||||||||
| Adjusted EBITDA |
2,429 | 2,418 | 11 | 0.5% | ||||||||||||
| Adjusted EBITDA margin |
42.6 | % | 42.9 | % | (0.3) pts | |||||||||||
| Severance, acquisition and other costs |
(89 | ) | (16 | ) | (73 | ) | n.m. | |||||||||
| Depreciation |
(895 | ) | (858 | ) | (37 | ) | (4.3%) | |||||||||
| Amortization |
(238 | ) | (230 | ) | (8 | ) | (3.5%) | |||||||||
| Finance costs |
||||||||||||||||
| Interest expense |
(267 | ) | (277 | ) | 10 | 3.6% | ||||||||||
| Interest on post-employment benefit obligations |
(5 | ) | (12 | ) | 7 | 58.3% | ||||||||||
| Impairment of assets |
(3 | ) | (7 | ) | 4 | 57.1% | ||||||||||
| Other income (expense) |
8 | (47 | ) | 55 | n.m. | |||||||||||
| Income taxes |
(253 | ) | (243 | ) | (10 | ) | (4.1%) | |||||||||
| Net earnings from continuing operations |
687 | 728 | (41 | ) | (5.6%) | |||||||||||
| Net earnings from discontinued operations |
– | 5 | (5 | ) | (100.0%) | |||||||||||
| Net earnings |
687 | 733 | (46 | ) | (6.3%) | |||||||||||
| Net earnings from continuing operations attributable to: |
||||||||||||||||
| Common shareholders |
642 | 675 | (33 | ) | (4.9%) | |||||||||||
| Preferred shareholders |
32 | 38 | (6 | ) | (15.8%) | |||||||||||
| Non-controlling interest |
13 | 15 | (2 | ) | (13.3%) | |||||||||||
| Net earnings from continuing operations |
687 | 728 | (41 | ) | (5.6%) | |||||||||||
| Net earnings attributable to: |
||||||||||||||||
| Common shareholders |
642 | 680 | (38 | ) | (5.6%) | |||||||||||
| Preferred shareholders |
32 | 38 | (6 | ) | (15.8%) | |||||||||||
| Non-controlling interest |
13 | 15 | (2 | ) | (13.3%) | |||||||||||
| Net earnings |
687 | 733 | (46 | ) | (6.3%) | |||||||||||
| Adjusted net earnings |
704 | 714 | (10 | ) | (1.4%) | |||||||||||
| EPS |
||||||||||||||||
| Continuing operations |
0.71 | 0.74 | (0.03 | ) | (4.1%) | |||||||||||
| Discontinued operations |
– | 0.01 | (0.01 | ) | (100.0%) | |||||||||||
| Net earnings per common share |
0.71 | 0.75 | (0.04 | ) | (5.3%) | |||||||||||
| Adjusted EPS |
0.78 | 0.79 | (0.01 | ) | (1.3%) | |||||||||||
|
n.m.: not meaningful |
||||||||||||||||
8 | BCE INC. 2021 FIRST QUARTER SHAREHOLDER REPORT
Table of Contents
2 MD&A Consolidated financial analysis
BCE NET ACTIVATIONS (LOSSES)
| Q1 2021 | Q1 2020 | % CHANGE | ||||||||||||||
| Wireless mobile phone subscribers net activations (losses)(1) |
2,405 | (2,496 | ) | n.m. | ||||||||||||
| Postpaid |
32,925 | 1,559 | n.m. | |||||||||||||
| Prepaid |
(30,520 | ) | (4,055 | ) | n.m. | |||||||||||
| Wireless mobile connected devices net activations (1) |
74,159 | 48,964 | 51.5% | |||||||||||||
| Wireline retail high-speed Internet subscribers net activations |
21,208 | 22,595 | (6.1%) | |||||||||||||
| Wireline retail TV subscribers net (losses) activations |
(9,112 | ) | (18,555 | ) | 50.9% | |||||||||||
| IPTV |
10,696 | 2,852 | n.m. | |||||||||||||
| Satellite |
(19,808 | ) | (21,407 | ) | 7.5% | |||||||||||
| Wireline retail residential NAS lines net losses |
(51,069 | ) | (61,595 | ) | 17.1% | |||||||||||
| Total services net activations (losses) |
37,591 | (11,087 | ) | n.m. | ||||||||||||
|
n.m.: not meaningful
TOTAL BCE CUSTOMER CONNECTIONS
|
||||||||||||||||
| Q1 2021 | Q1 2020 | % CHANGE | ||||||||||||||
| Wireless mobile phone subscribers (1) |
9,166,748 | 8,971,172 | 2.2% | |||||||||||||
| Postpaid |
8,361,264 | 8,177,205 | 2.3% | |||||||||||||
| Prepaid |
805,484 | 793,967 | 1.5% | |||||||||||||
| Wireless mobile connected devices subscribers (1) |
2,130,312 | 1,877,136 | 13.5% | |||||||||||||
| Wireline retail high-speed Internet subscribers (2) |
3,730,576 | 3,578,196 | 4.3% | |||||||||||||
| Wireline retail TV subscribers (3) |
2,723,368 | 2,753,909 | (1.1%) | |||||||||||||
| IPTV |
1,817,069 | 1,770,034 | 2.7% | |||||||||||||
| Satellite (3) |
906,299 | 983,875 | (7.9%) | |||||||||||||
| Wireline retail residential NAS lines |
2,432,863 | 2,635,888 | (7.7%) | |||||||||||||
| Total services subscribers |
20,183,867 | 19,816,301 | 1.9% | |||||||||||||
| (1) | Effective January 1, 2021, we changed our wireless operating metrics to reflect our revised approach to reporting wireless subscriber units. Consequently, we are now reporting in two categories, mobile phone subscriber units and mobile connected device subscriber units (e.g. tablets, wearables and mobile Internet devices). Additionally, mobile connected device subscribers now include previously undisclosed IoT units (e.g. connected telematics services, monitoring devices, connected cars and fleet management solutions). These changes are consistent with the way we manage our business, reflect our focus on mobile phone subscribers and align to industry peers. As a result, previously reported 2020 subscribers and associated operating metrics (gross and net activations (losses), ABPU and churn) have been restated for comparability. See section 7.2, Non-GAAP financial measures and key performance indicators (KPIs) – KPIs, in this MD&A for more details. |
| (2) | At the beginning of Q1 2021, our retail high-speed Internet subscriber base was increased by 4,778 subscribers due to the transfer of fixed wireless Internet subscribers from our mobile connected devices subscriber base. |
| (3) | At the beginning of Q1 2021, we adjusted our satellite TV subscriber base to remove 6,125 non-revenue generating units. |
BCE added 37,591 net retail customer activations in Q1 2021, increasing by 48,678 compared to the same period last year. The net retail customer activations in Q1 2021 consisted of:
| • | 2,405 wireless mobile phone net customer activations, along with 74,159 wireless mobile connected devices net customer activations |
| • | 21,208 retail high-speed Internet net customer activations |
| • | 9,112 retail TV net customer losses comprised of 19,808 retail satellite TV net customer losses, moderated by 10,696 retail IPTV net customer activations |
| • | 51,069 retail residential NAS net losses |
At March 31, 2021, BCE’s retail customer connections totaled 20,183,867, up 1.9% year over year, and consisted of the following:
| • | 9,166,748 wireless mobile phone subscribers, up 2.2% compared to Q1 2020, as well as 2,130,312 wireless mobile connected devices subscribers, up 13.5% year over year |
| • | 3,730,576 retail high-speed Internet subscribers, 4.3% higher than last year |
| • | 2,723,368 total retail TV subscribers, down 1.1% compared to Q1 2020, comprised of 1,817,069 retail IPTV subscribers, up 2.7% year over year, and 906,299 retail satellite TV subscribers, down 7.9% year over year |
| • | 2,432,863 retail residential NAS lines, a decline of 7.7% compared to Q1 2020 |
BCE INC. 2021 FIRST QUARTER SHAREHOLDER REPORT | 9
Table of Contents
2 MD&A Consolidated financial analysis
BCE
Revenues
(in $ millions)
|
|
||||||||||||||||||
| Q1 2021 | Q1 2020 | $ CHANGE | % CHANGE | |||||||||||||||
| Bell Wireless |
2,100 | 2,035 | 65 | 3.2% | ||||||||||||||
| Bell Wireline |
3,081 | 3,036 | 45 | 1.5% | ||||||||||||||
| Bell Media |
713 | 752 | (39 | ) | (5.2%) | |||||||||||||
| Inter-segment eliminations |
(188 | ) | (183 | ) | (5 | ) | (2.7%) | |||||||||||
| Total BCE operating revenues |
5,706 | 5,640 | 66 | 1.2% | ||||||||||||||
BCE
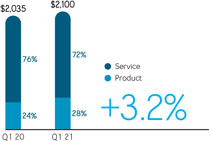
Total operating revenues at BCE increased by 1.2% in Q1 2021, compared to the same period last year, representing an improvement over the 2.8% year-over-year decline experienced in Q4 2020, from the moderating impacts of the COVID-19 pandemic earlier in the quarter. The year-over-year increase was attributable to growth in our Bell Wireless and Bell Wireline segments, offset in part by a decline in our Bell Media segment. BCE service revenues of $4,968 million in Q1 2021 declined by 1.0% year over year, whereas product revenues of $738 million in Q1 2021 increased by 18.6% year over year. Wireless operating revenues grew by 3.2% due to higher product revenues of 20.1%, offset in part by reduced service revenues of 2.1%, which continued to be unfavourably impacted by lower outbound roaming revenues as a result of the COVID-19 pandemic. Wireline operating revenues increased by 1.5% in Q1 2021, over the same period last year, driven by higher services revenues of 0.9%, from greater data and other services revenues, offset in part by reduced voice revenues, coupled with greater product revenues of 14.1%. Bell Media operating revenues declined by 5.2% year over year in Q1 2021, as advertising revenues continued to be adversely impacted by the COVID-19 pandemic.
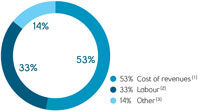
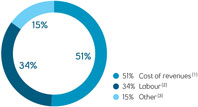
| BCE | BCE | |||
| Operating cost profile | Operating cost profile | |||
| Q1 2020 | Q1 2021 | |||
|
|
|
|||
| Q1 2021 | Q1 2020 | $ CHANGE | % CHANGE | |||||||||||||
| Bell Wireless |
(1,177 | ) | (1,107 | ) | (70 | ) | (6.3%) | |||||||||
| Bell Wireline |
(1,718 | ) | (1,701 | ) | (17 | ) | (1.0%) | |||||||||
| Bell Media |
(570 | ) | (597 | ) | 27 | 4.5% | ||||||||||
| Inter-segment eliminations |
188 | 183 | 5 | 2.7% | ||||||||||||
| Total BCE operating costs |
(3,277 | ) | (3,222 | ) | (55 | ) | (1.7%) | |||||||||
| (1) | Cost of revenues includes costs of wireless devices and other equipment sold, network and content costs, and payments to other carriers. |
| (2) | Labour costs (net of capitalized costs) include wages, salaries and related taxes and benefits, post-employment benefit plans service cost, and other labour costs, including contractor and outsourcing costs. |
| (3) | Other operating costs include marketing, advertising and sales commission costs, bad debt expense, taxes other than income taxes, IT costs, professional service fees and rent. |
BCE
Total BCE operating costs increased by 1.7% in Q1 2021, compared to last year, driven by greater costs in Bell Wireless of 6.3% and Bell Wireline of 1.0%, offset in part by reduced expenses in Bell Media of 4.5%. The increase in operating expenses was primarily driven by higher costs associated with the revenue growth.
10 | BCE INC. 2021 FIRST QUARTER SHAREHOLDER REPORT
Table of Contents
2 MD&A Consolidated financial analysis
| BCE Net earnings (in $ millions)
|
Net earnings decreased by $46 million in the first quarter of 2021, compared to the same period last year, mainly due to higher severance, acquisition and other costs and higher depreciation and amortization, partly offset by higher other income and higher adjusted EBITDA. |
BCE
Adjusted EBITDA
(in $ millions)
|
|
||||||||||||||||||
| Q1 2021 | Q1 2020 | $CHANGE | % CHANGE | |||||||||||||||
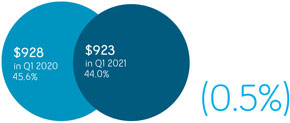
| Bell Wireless |
923 | 928 | (5 | ) | (0.5%) | |||||||||||||
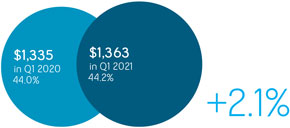
| Bell Wireline |
1,363 | 1,335 | 28 | 2.1% | ||||||||||||||
| Bell Media |
143 | 155 | (12 | ) | (7.7%) | |||||||||||||
| Total BCE adjusted EBITDA |
2,429 | 2,418 | 11 | 0.5% | ||||||||||||||
BCE
BCE’s adjusted EBITDA grew by 0.5% in Q1 2021, compared to the same period last year. This represented an improvement over the 3.2% year-over-year decline experienced in Q4 2020 due to the moderating impacts of the COVID-19 pandemic earlier in the quarter. The increase in adjusted EBITDA in Q1 2021 was driven by higher revenues, moderated by greater operating costs. Adjusted EBITDA margin of 42.6% in Q1 2021 declined by 0.3 pts over the same period last year, mainly resulting from the flow-through impact of lower year-over-year service revenue and higher low-margin product sales in our total revenue base.
2.7 Severance, acquisition and other costs
2021
Severance, acquisition and other costs of $89 million in the first quarter of 2021 included:
| • | Severance costs of $97 million related to involuntary and voluntary employee terminations |
| • | Acquisition and other costs recovery of $8 million |
2020
Severance, acquisition and other costs of $16 million in the first quarter of 2020 included:
| • | Severance costs of $8 million related to involuntary and voluntary employee terminations |
| • | Acquisition and other costs of $8 million |
BCE INC. 2021 FIRST QUARTER SHAREHOLDER REPORT | 11
Table of Contents
2 MD&A Consolidated financial analysis
2.8 Depreciation and amortization
DEPRECIATION
Depreciation in Q1 2021 increased by $37 million, compared to Q1 2020, in part due to a higher asset base as we continued to invest in our broadband and wireless networks as well as our IPTV services.
AMORTIZATION
Amortization in Q1 2021 increased by $8 million, compared to Q1 2020, mainly due to a higher asset base.
INTEREST EXPENSE
Interest expense in the first quarter of 2021 decreased by $10 million, compared to the same period last year, mainly due to lower average debt levels and lower interest rates.
INTEREST ON POST-EMPLOYMENT BENEFIT OBLIGATIONS
Interest on our post-employment benefit obligations is based on market conditions that existed at the beginning of the year. On January 1, 2021, the discount rate was 2.6% compared to 3.1% on January 1, 2020.
In the first quarter of 2021, interest expense on post-employment benefit obligations decreased by $7 million, compared to the same period last year, due to a lower discount rate and a lower net post-employment benefit obligation at the beginning of the year.
The impacts of changes in market conditions during the year are recognized in other comprehensive income (OCI).
2021
Other income of $8 million in the first quarter of 2021 included net mark-to-market gains on derivatives used to economically hedge equity settled share-based compensation plans, partly offset by early debt redemption costs.
2020
Other expense of $47 million in the first quarter of 2020 included net mark-to-market losses on derivatives used to economically hedge equity settled share-based compensation plans and early debt redemption costs.
Income taxes in the first quarter of 2021 increased by $10 million, compared to the same period last year.
2.12 Net earnings attributable to common shareholders and EPS
Net earnings attributable to common shareholders of $642 million in the first quarter of 2021 decreased by $38 million, compared to the same period last year, mainly due to higher severance, acquisition and other costs and higher depreciation and amortization, partly offset by higher other income and higher adjusted EBITDA.
BCE’s EPS of $0.71 in Q1 2021 decreased by $0.04 compared to the same period last year.
Excluding the impact of severance, acquisition and other costs, net mark-to-market gains (losses) on derivatives used to economically hedge equity settled share-based compensation plans, net gains (losses) on investments, early debt redemption costs, impairment of assets and discontinued operations, net of tax and NCI, adjusted net earnings in the first quarter of 2021 was $704 million, or $0.78 per common share, compared to $714 million, or $0.79 per common share, for the same period last year.
12 | BCE INC. 2021 FIRST QUARTER SHAREHOLDER REPORT
Table of Contents
3 MD&A Business segment analysis - Bell Wireless
KEY BUSINESS DEVELOPMENTS
LAUNCH OF TSN 5G VIEW / VISION 5G RDS
TSN and RDS launched TSN 5G View / Vision 5G RDS, an exclusive in-app feature that leverages Bell’s Fifth Generation (5G) network to offer fans interactive new ways to watch sports. Introduced in Montréal on March 19, 2021 and in Toronto on April 15, 2021, this innovative 5G-enabled technology lets Montreal Canadiens and Toronto Maple Leafs fans control how they view every angle of the game on their smartphones, getting up close to every goal, pass, hit and penalty with zoom, pause, rewind and slow motion capabilities made possible with Bell’s superfast, high-capacity 5G mobile network. In addition to the immersive mobile experience, the new 5G technology also allows viewers of TSN and RDS regional home game broadcasts to get closer to the action, featuring views from never-before-seen camera angles during in-game commentary, analysis, replays, and post-game recaps. TSN and RDS subscribers on the Bell 5G network with a 5G device can sign in to their TSN and RDS apps to take advantage of the new technology live in action. TSN 5G View / Vision 5G RDS will continue to expand to more sports events, teams and venues over time.
CONNECTED CAR PARTNERSHIP WITH HONDA CANADA
On March 11, 2021, Bell and Honda Canada announced that new Honda and Acura vehicles are now equipped with built-in Wi-Fi hotspots that enable drivers and their passengers to stay fully connected online, safely and hands-free, while on the open road. Ideal for mobile workers, commuters and families, Bell Connected Car seamlessly supports browsing, streaming and sharing on up to 7 compatible devices with the built-in Wi-Fi hotspot powered by Canada’s largest Fourth Generation (4G) Long-term evolution (LTE) wireless network. The hotspot supports real-time email and text access, enables on-the-go video streaming, gaming and web browsing for passengers, and keeps customers’ devices connected up to 50 feet away from the vehicle.
FINANCIAL PERFORMANCE ANALYSIS
Effective January 1, 2021, we changed our wireless operating metrics to reflect our revised approach to reporting wireless subscriber units. Consequently, we are now reporting in two categories, mobile phone subscriber units and mobile connected device subscriber units (e.g. tablets, wearables and mobile Internet devices). Additionally, mobile connected device subscribers now include previously undisclosed IoT units (e.g. connected telematics services, monitoring devices, connected cars and fleet management solutions). These changes are consistent with the way we manage our business, reflect our focus on mobile phone subscribers and align to industry peers. As a result, previously reported 2020 subscribers and associated operating metrics (gross and net activations (losses), ABPU and churn) have been restated for comparability. See section 7.2, Non-GAAP financial measures and key performance indicators (KPIs) – KPIs, in this MD&A for more details.
Q1 2021 PERFORMANCE HIGHLIGHTS
| Bell Wireless | Bell Wireless | |
| Revenues | Adjusted EBITDA | |
| (in $ millions) | (in $ millions) | |
| (% adjusted EBITDA margin) | ||
|
|
BCE INC. 2021 FIRST QUARTER SHAREHOLDER REPORT | 13
Table of Contents
3 MD&A Business segment analysis - Bell Wireless
| Total mobile phones subscriber growth |
Mobile phones postpaid net activations |
Mobile phones prepaid net losses | ||
| +2.2% | 32,925 | (30,520) | ||
| Q1 2021 vs. Q1 2020 | in Q1 2021 | in Q1 2021 |
| Mobile phones postpaid churn in Q1 2021 |
Mobile phones blended ABPU per month | |
| 0.89% | (3.4%) | |
| Stable vs. Q1 2020 | Q1 2021: $70.34 Q1 2020: $72.78 |
BELL WIRELESS RESULTS
REVENUES
| Q1 2021 | Q1 2020 | $ CHANGE | % CHANGE | |||||||||||||
| External service revenues |
1,503 | 1,535 | (32 | ) | (2.1%) | |||||||||||
| Inter-segment service revenues |
11 | 12 | (1 | ) | (8.3%) | |||||||||||
| Total operating service revenues |
1,514 | 1,547 | (33 | ) | (2.1%) | |||||||||||
| External product revenues |
584 | 487 | 97 | 19.9% | ||||||||||||
| Inter-segment product revenues |
2 | 1 | 1 | 100.0% | ||||||||||||
| Total operating product revenues |
586 | 488 | 98 | 20.1% | ||||||||||||
| Total Bell Wireless revenues |
2,100 | 2,035 | 65 | 3.2% | ||||||||||||
|
Bell Wireless operating revenues grew by 3.2% in Q1 2021, compared to Q1 2020, reflecting quarterly sequential improvements from both service and product revenues. The increase in year-over-year operating revenues was driven by greater product revenues, offset in part by lower service revenues.
Service revenues declined by 2.1% in the current quarter, compared to Q1 2020, due to lower postpaid revenues, offset in part by higher prepaid revenues, reflecting the following:
• Decreased outbound roaming revenues mainly from reduced customer travel as a result of the COVID-19 pandemic
• Lower data overages driven by greater customer adoption of monthly plans with higher data thresholds, including unlimited and shareable plans
These factors were partly offset by:
• Continued growth in our mobile phone subscriber base
• The flow-through of rate increases
Product revenues increased by 20.1% in Q1 2021, compared to the same period last year, due to greater sales mix of premium mobile phones and higher handset prices, along with increased consumer electronic sales at The Source (Bell) Electronics Inc. (The Source), primarily in e-commerce, reflecting the shift in consumer behavior to online shopping driven by the COVID-19 pandemic.
OPERATING COSTS AND ADJUSTED EBITDA
|
| |||||||||||||||
| Q1 2021 | Q1 2020 | $ CHANGE | % CHANGE | |||||||||||||
| Operating costs |
(1,177 | ) | (1,107 | ) | (70 | ) | (6.3 | %) | ||||||||
| Adjusted EBITDA |
923 | 928 | (5 | ) | (0.5 | %) | ||||||||||
| Total adjusted EBITDA margin |
44.0 | % | 45.6 | % | (1.6 | ) pts | ||||||||||
Bell Wireless operating costs increased by 6.3% in Q1 2021, compared to Q1 2020, driven by:
| • | Increased cost of goods sold due to the greater sales mix of premium mobile phones and higher handset costs |
These factors were partly offset by:
| • | Reduced payments to other carriers associated with the decline in roaming revenues as a result of the COVID-19 pandemic |
| • | Lower labour costs due to store closures and reduced store operating hours driven by the government restrictions as a result of the COVID-19 pandemic, partly offset by increased call volumes to our customer service centres |
Bell Wireless adjusted EBITDA decreased by 0.5% in Q1 2021, compared to Q1 2020, mainly attributable to the flow-through of the service revenue decline and higher operating costs. Adjusted EBITDA margin, based on wireless operating revenues, of 44.0% in Q1 2021 declined by 1.6 pts year over year, driven by a greater proportion of low-margin product sales in our total revenue base and the flow-through of the service revenue decline.
14 | BCE INC. 2021 FIRST QUARTER SHAREHOLDER REPORT
Table of Contents
3 MD&A Business segment analysis - Bell Wireless
BELL WIRELESS OPERATING METRICS
| Q1 2021 | Q1 2020 | CHANGE | % CHANGE | |||||||||||||
| Mobile phones |
||||||||||||||||
| Blended ABPU ($/month) |
70.34 | 72.78 | (2.44 | ) | (3.4 | %) | ||||||||||
| Gross activations |
340,127 | 333,557 | 6,570 | 2.0 | % | |||||||||||
| Postpaid |
248,990 | 209,550 | 39,440 | 18.8 | % | |||||||||||
| Prepaid |
91,137 | 124,007 | (32,870 | ) | (26.5 | %) | ||||||||||
| Net activations (losses) |
2,405 | (2,496 | ) | 4,901 | n.m. | |||||||||||
| Postpaid |
32,925 | 1,559 | 31,366 | n.m. | ||||||||||||
| Prepaid |
(30,520 | ) | (4,055 | ) | (26,465 | ) | n.m. | |||||||||
| Blended churn % (average per month) |
1.23 | % | 1.26 | % | 0.03 | pts | ||||||||||
| Postpaid |
0.89 | % | 0.89 | % | – | |||||||||||
| Prepaid |
4.68 | % | 5.03 | % | 0.35 | pts | ||||||||||
| Subscribers |
9,166,748 | 8,971,172 | 195,576 | 2.2 | % | |||||||||||
| Postpaid |
8,361,264 | 8,177,205 | 184,059 | 2.3 | % | |||||||||||
| Prepaid |
805,484 | 793,967 | 11,517 | 1.5 | % | |||||||||||
| Mobile connected devices |
||||||||||||||||
| Net activations |
74,159 | 48,964 | 25,195 | 51.5 | % | |||||||||||
| Subscribers |
2,130,312 | 1,877,136 | 253,176 | 13.5 | % | |||||||||||
n.m.: not meaningful
Mobile phone blended ABPU of $70.34 decreased by 3.4% in Q1 2021, compared to Q1 2020, driven by:
| • | Decreased outbound roaming revenues from reduced customer travel due to the COVID-19 pandemic |
| • | Lower data overages driven by greater customer adoption of monthly plans with higher data thresholds, including unlimited and shareable plans |
These factors were partly offset by:
| • | Higher monthly billings related to increased adoption of mobile phone device financing plans |
| • | The flow-through of rate increases |
Mobile phone gross activations increased by 2.0% in Q1 2021, compared to Q1 2020, due to higher postpaid gross activations, partly offset by lower prepaid gross activations.
| • | Mobile phone postpaid gross activations increased by 18.8% in the quarter, compared to the same period last year, due to our focus on growing higher-valued mobile phone subscribers, greater promotional offers and reflected the benefit from the enhancements to our online capabilities |
| • | Mobile phone prepaid gross activations decreased by 26.5% in the quarter, compared to Q1 2020, driven by lower market activity from fewer visitors to Canada, reduced immigration and the temporary closure of our retail distribution channels as a result of the COVID-19 pandemic |
Mobile phone net activations increased by 4,901 in Q1 2021, compared to Q1 2020, due to higher postpaid net activations, offset in part by lower prepaid net activations.
| • | Mobile phone postpaid net activations increased by 31,366 in Q1 2021, compared to the same period last year, driven by higher gross activations, offset in part by greater customer deactivations |
| • | Mobile phone prepaid net activations decreased by 26,465 in the quarter, compared to the same period last year, due to lower gross activations, offset in part by reduced customer deactivations |
Mobile phone blended churn of 1.23% improved by 0.03 pts in Q1 2021, compared to Q1 2020.
| • | Mobile phone postpaid churn of 0.89% this quarter remained relatively stable, compared to the same period last year |
| • | Mobile phone prepaid churn of 4.68% in Q1 2021 improved by 0.35 pts, compared to the same period last year, due to lower market activity as a result of the COVID-19 pandemic |
Mobile phone subscribers at March 31, 2021 totaled 9,166,748, an increase of 2.2% from 8,971,172 subscribers at the end of Q1 2020. This consisted of 8,361,264 postpaid subscribers and 805,484 prepaid subscribers, an increase of 2.3% and 1.5%, respectively, year over year.
Mobile connected device net activations increased by 51.5% in Q1 2021, compared to Q1 2020, driven by greater IoT net activations, offset in part by lower data devices, primarily less tablet activations.
Mobile connected device subscribers at March 31, 2021 totaled 2,130,312, an increase of 13.5% from 1,877,136 subscribers at the end of Q1 2020.
BCE INC. 2021 FIRST QUARTER SHAREHOLDER REPORT | 15
Table of Contents
3 MD&A Business segment analysis - Bell Wireless
ASSUMPTIONS
As at the date of this MD&A, our forward-looking statements set out in the BCE 2020 Annual MD&A, as updated or supplemented in this MD&A, are based on certain assumptions including, without limitation, the following assumptions and the assumptions referred to in each of the other business segment discussions set out in this section 3, Business segment analysis, as well as the economic and market assumptions referred to in section 1.3, Assumptions, of this MD&A.
| • | Maintain our market share of national operators’ wireless postpaid net additions |
| • | Continued growth of our prepaid subscriber base |
| • | Continued adoption of smartphone devices, tablets and data applications, as well as the introduction of more 5G, 4G LTE and LTE Advanced devices and new data services |
| • | Continued deployment of 5G wireless network offering coverage that is competitive with other national operators in centres across Canada |
| • | Improvement in subscriber acquisition and retention spending, enabled by increasing adoption of device financing plans |
| • | Unfavourable impact on mobile phone blended ABPU, driven by reduced outbound roaming revenue due to travel restrictions as a result of the COVID-19 pandemic, reduced data overage revenue due to continued adoption of unlimited plans and the impact of a higher prepaid mix in our overall subscriber base |
| • | Increased adoption of unlimited data plans and device financing plans |
| • | No material financial, operational or competitive consequences of changes in regulations affecting our wireless business |
16 | BCE INC. 2021 FIRST QUARTER SHAREHOLDER REPORT
Table of Contents
3 MD&A Business segment analysis - Bell Wireline
This section contains forward-looking statements, including relating to our network deployment and capital investment plans. Refer to the section Caution regarding forward-looking statements at the beginning of this MD&A.
KEY BUSINESS DEVELOPMENTS
HIGH-SPEED INTERNET DEPLOYMENT IN QUÉBEC
On March 18, 2021, Bell reaffirmed its plan to respond quickly to requests for access to its communications support structures in anticipation of an increase in the volume of requests over the coming months, underscoring its focus on accelerating the deployment of high-speed Internet as part of the federal and Québec governments’ “Operation High Speed” initiative to connect all Québecers by September 2022. By establishing common priorities and working closely with partners like Hydro-Québec and suppliers including engineering firms specializing in aerial structures, the measures Bell is implementing have already significantly accelerated the issuance of permits for many service providers and sped up deployment of several key projects.
On March 22, 2021, Bell announced that it will roll out high-speed Internet services to several unserved areas of Québec in partnership with the governments of Canada and Québec as part of the “Operation High Speed” initiative. The Bell projects will provide 100% fibre Internet connections to approximately 31,000 homes and businesses in nearly 100 Québec communities.
PARTNERSHIP WITH SCALE AI ON ARTIFICIAL INTELLIGENCE INNOVATION
Bell Business Markets partnered with SCALE AI, a Montréal-based investment and innovation hub, to reduce installation time for new fibre connections using artificial intelligence (AI). By accelerating several steps in the supply chain with AI, the new initiative will increase prediction accuracy for the order completion date, automate email interactions with internal and external participants in the supply chain process, reduce waste and accelerate supply chain fulfillment, enabling us to dynamically forecast workload to ensure consistent and high-level service. The initiative is part of a $16.6 million investment announced by SCALE AI to accelerate the rapid adoption and integration of AI solutions in Canada.
FINANCIAL PERFORMANCE ANALYSIS
Q1 2021 PERFORMANCE HIGHLIGHTS
| Bell Wireline | Bell Wireline | |
| Revenues | Adjusted EBITDA | |
| (in $ millions) | (in $ millions) | |
| (% adjusted EBITDA margin) | ||
|
|
| Retail high-speed Internet (1) | Retail high-speed Internet | Retail TV (2) | ||
| +4.3% | 21,208 | (1.1%) | ||
| Subscriber growth | Total net subscriber activations | Subscriber decline | ||
| Q1 2021 vs. Q1 2020 | in Q1 2021 | Q1 2021 vs. Q1 2020 | ||
| Retail IPTV | Retail residential NAS lines | |
| 10,696 | (7.7%) | |
| Total net subscriber activations in Q1 2021 |
Subscriber decline Q1 2021 vs. Q1 2020 |
| (1) | At the beginning of Q1 2021, our retail high-speed Internet subscriber base was increased by 4,778 subscribers due to the transfer of fixed wireless Internet subscribers from our mobile connected devices subscriber base. |
| (2) | At the beginning of Q1 2021, we adjusted our satellite TV subscriber base to remove 6,125 non-revenue generating units. |
BCE INC. 2021 FIRST QUARTER SHAREHOLDER REPORT | 17
Table of Contents
3 MD&A Business segment analysis - Bell Wireline
BELL WIRELINE RESULTS
REVENUES
| Q1 2021 | Q1 2020 | $ CHANGE | % CHANGE | |||||||||||||
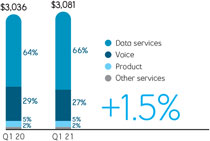
| Data |
1,965 | 1,891 | 74 | 3.9% | ||||||||||||
| Voice |
803 | 872 | (69 | ) | (7.9% | ) | ||||||||||
| Other services |
74 | 62 | 12 | 19.4% | ||||||||||||
| Total external service revenues |
2,842 | 2,825 | 17 | 0.6% | ||||||||||||
| Inter-segment service revenues |
85 | 76 | 9 | 11.8% | ||||||||||||
| Total operating service revenues |
2,927 | 2,901 | 26 | 0.9% | ||||||||||||
| Data |
144 | 123 | 21 | 17.1% | ||||||||||||
| Equipment and other |
10 | 12 | (2 | ) | (16.7% | ) | ||||||||||
| Total external product revenues |
154 | 135 | 19 | 14.1% | ||||||||||||
| Total operating product revenues |
154 | 135 | 19 | 14.1% | ||||||||||||
| Total Bell Wireline revenues |
3,081 | 3,036 | 45 | 1.5% | ||||||||||||
Bell Wireline operating revenues increased by 1.5% in Q1 2021, compared to the same period last year, reflecting an improvement over the decline experienced in Q4 2020. The year-over-year growth was driven by higher data service revenues, increased product sales and greater other services revenues, moderated by the continued erosion in voice revenues.
Bell Wireline operating service revenues grew by 0.9% in Q1 2021, compared to the same period last year.
| • | Data revenues increased by 3.9% in Q1 2021, compared to the same period last year, driven by: |
| • | Higher retail Internet and IPTV subscribers combined with the flow-through of pricing changes |
| • | Lower seasonal suspension of residential services as more customers maintained their services due to the COVID-19 pandemic |
| • | Greater sales of maintenance contracts on data equipment sold to business customers |
These factors were partly offset by:
| • | Continued decline in our satellite TV subscriber base |
| • | Ongoing legacy data erosion |
| • | Voice revenues declined by 7.9% in the first quarter of 2021, compared to Q1 2020, driven by lower local and access and long distance revenues due to: |
| • | NAS line erosion from technological substitution to wireless and Internet based services |
| • | Lower usage of conferencing services as business customers have adopted cheaper solutions since the onset of the COVID-19 pandemic |
| • | Large business customer conversions to Internet protocol (IP) and Internet-based data services |
| • | Other services revenue increased by 19.4% in Q1 2021, compared to Q1 2020, from the acquisition in December 2020 of Environics Analytics Group Ltd., a Canadian data and analytics company |
Bell Wireline operating product revenues increased by 14.1% in Q1 2021, compared to the same period last year, driven by higher demand in our business markets, primarily from greater sales to the government sector, along with the impact in Q1 2020 of vendor delays relating to equipment purchases as a result of the COVID-19 pandemic.
OPERATING COSTS AND ADJUSTED EBITDA
| Q1 2021 | Q1 2020 | $ CHANGE | % CHANGE | |||||||||||||
| Operating costs |
(1,718 | ) | (1,701 | ) | (17 | ) | (1.0%) | |||||||||
| Adjusted EBITDA |
1,363 | 1,335 | 28 | 2.1% | ||||||||||||
| Adjusted EBITDA margin |
44.2 | % | 44.0 | % | 0.2 pts | |||||||||||
Bell Wireline operating costs increased by 1.0% in Q1 2021, compared to the same period last year, due to:
| • | Higher cost of goods sold and maintenance contract expenses attributable to the growth in revenues |
| • | Greater expenses associated with the acquisition of Environics Analytics Group Ltd. |
| • | Higher labour costs from greater project requirements, along with increased call volumes to our customer service centres, moderated by vendor contract savings |
These factors were partly offset by:
| • | Reduced payments to other carriers and TV programming and content costs driven by lower associated revenues |
Bell Wireline adjusted EBITDA increased by 2.1% in Q1 2021, compared to the same period last year, driven by higher revenues, offset in part by greater operating expenses. This reflected an improvement over the Q4 2020 year-over-year decline of 2.7%. Adjusted EBITDA margin of 44.2% in Q1 2021 increased by 0.2 pts compared to the 44.0% achieved in Q1 2020, attributable to higher service revenue flow-through, offset in part by greater low-margin product sales in our total revenue base.
18 | BCE INC. 2021 FIRST QUARTER SHAREHOLDER REPORT
Table of Contents
3 MD&A Business segment analysis - Bell Wireline
BELL WIRELINE OPERATING METRICS
DATA
Retail high-speed Internet
| Q1 2021 | Q1 2020 | CHANGE | % CHANGE | |||||||||||||
| Retail net activations |
21,208 | 22,595 | (1,387 | ) | (6.1%) | |||||||||||
| Retail subscribers (1) |
3,730,576 | 3,578,196 | 152,380 | 4.3% | ||||||||||||
|
(1) At the beginning of Q1 2021, our retail high-speed Internet subscriber base was increased by 4,778 subscribers due to the transfer of fixed wireless Internet subscribers from our mobile connected devices subscriber base.
Retail high-speed Internet subscriber net activations decreased by 6.1% in Q1 2021, compared to Q1 2020, driven by lower retail residential net additions due to fewer promotional offers, lower door-to-door sales and slower growth of new households from lower immigration, as a result of the COVID-19 pandemic, as well as greater competitive intensity. This was offset in part by fewer deactivations due to the COVID-19 pandemic, along with increased activations in our fibre-to-the-premise (FTTP) and wireless-to-the-premise (WTTP) footprints.
Retail high-speed Internet subscribers totaled 3,730,576 at March 31, 2021, up 4.3% from the same period last year. At the beginning of Q1 2021, our retail high-speed Internet subscriber base was increased by 4,778 subscribers due to the transfer of fixed wireless Internet subscribers from our mobile connected devices subscriber base.
Retail TV
|
| |||||||||||||||
| Q1 2021 | Q1 2020 | CHANGE | % CHANGE | |||||||||||||
| Retail net subscriber (losses) activations |
(9,112 | ) | (18,555 | ) | 9,443 | 50.9% | ||||||||||
| IPTV |
10,696 | 2,852 | 7,844 | n.m. | ||||||||||||
| Satellite |
(19,808 | ) | (21,407 | ) | 1,599 | 7.5% | ||||||||||
| Total retail subscribers (1) |
2,723,368 | 2,753,909 | (30,541 | ) | (1.1% | ) | ||||||||||
| IPTV |
1,817,069 | 1,770,034 | 47,035 | 2.7% | ||||||||||||
| Satellite (1) |
906,299 | 983,875 | (77,576 | ) | (7.9% | ) | ||||||||||
n.m.: not meaningful
| (1) | At the beginning of Q1 2021, we adjusted our satellite TV subscriber base to remove 6,125 non-revenue generating units. |
Retail IPTV net subscriber activations increased by 7,844 in Q1 2021, compared to Q1 2020, due to lower deactivations mainly as a result of the COVID-19 pandemic, a reduced number of customers coming off of promotional offers, and the continued ramp-up in activations from Virgin TV, which launched in July 2020. This was offset in part by lower activations driven by fewer door-to-door sales, as a result of the COVID-19 pandemic and greater competitive intensity.
Retail satellite TV net customer losses improved by 7.5% in the Q1 2021, compared to Q1 2020, attributable to improved net activations in our small business market, due to the moderating impact of the COVID-19 pandemic. Retail residential net customer losses also improved year over year due to lower deactivations driven by the COVID-19 pandemic, fewer customers coming off of promotional offers, and reflected a more mature subscriber base geographically better-suited for satellite TV service.
Total retail TV net customer losses (IPTV and satellite TV combined) improved by 50.9% in Q1 2021, compared to the same period last year, driven by higher IPTV net activations, along with fewer satellite TV net customer losses.
Retail IPTV subscribers at March 31, 2021 totaled 1,817,069, up 2.7% from 1,770,034 subscribers reported at the end of Q1 2020.
Retail satellite TV subscribers at March 31, 2021 totaled 906,299, down 7.9% from 983,875 subscribers reported at the end of Q1 2020. At the beginning of Q1 2021, we adjusted our satellite TV subscriber base to remove 6,125 non-revenue generating units.
Total retail TV subscribers (IPTV and satellite TV combined) at March 31, 2021 were 2,723,368, representing a 1.1% decline from 2,753,909 subscribers at the end of Q1 2020. At the beginning of Q1 2021, we adjusted our satellite TV subscriber base to remove 6,125 non-revenue generating units.
VOICE
| Q1 2021 | Q1 2020 | CHANGE | % CHANGE | |||||||||||||
| Retail residential NAS lines net losses |
(51,069 | ) | (61,595 | ) | 10,526 | 17.1% | ||||||||||
| Retail residential NAS lines |
2,432,863 | 2,635,888 | (203,025 | ) | (7.7%) | |||||||||||
Retail residential NAS net losses improved by 17.1% in Q1 2021, compared to Q1 2020, attributable to lower deactivations, due to the COVID-19 pandemic, coupled with a lower number of customers coming off of promotional offers. This was partly offset by ongoing substitution to wireless and Internet-based technologies.
Retail residential NAS subscribers at March 31, 2021 of 2,432,863 declined by 7.7%, compared to the end of Q1 2020. This represented an improvement over the 8.9% rate of erosion experienced in Q1 2020, driven by fewer deactivations primarily due to the COVID-19 pandemic.
BCE INC. 2021 FIRST QUARTER SHAREHOLDER REPORT | 19
Table of Contents
3 MD&A Business segment analysis - Bell Wireline
ASSUMPTIONS
As at the date of this MD&A, our forward-looking statements set out in the BCE 2020 Annual MD&A, as updated or supplemented in this MD&A, are based on certain assumptions including, without limitation, the following assumptions and the assumptions referred to in each of the other business segment discussions set out in this section 3, Business segment analysis, as well as the economic and market assumptions referred to in section 1.3, Assumptions, of this MD&A.
| • | Continued growth in retail Internet and IPTV subscribers |
| • | Increasing wireless and Internet-based technological substitution |
| • | Continued aggressive residential service bundle offers from cable TV competitors in our local wireline areas |
| • | Continued large business customer migration to IP-based systems |
| • | Ongoing competitive repricing pressures in our business and wholesale markets |
| • | Continued competitive intensity in our small and medium-sized business markets as cable operators and other telecommunications competitors continue to intensify their focus on business customers |
| • | Traditional high-margin product categories challenged by large global cloud and OTT providers of business voice and data solutions expanding into Canada with on-demand services |
| • | Accelerating customer adoption of OTT services resulting in downsizing of TV packages |
| • | Further deployment of direct fibre to more homes and businesses within our wireline footprint and fixed WTTP technology in rural communities |
| • | Growing consumption of OTT TV services and on-demand streaming video, as well as the proliferation of devices, such as tablets, that consume large quantities of bandwidth, will require ongoing capital investment |
| • | Realization of cost savings related to management workforce reductions including attrition and retirements, lower contracted rates from our suppliers, operating efficiencies enabled by a growing direct fibre footprint, changes in consumer behaviour and product innovation, new call centre technology that is enabling self-serve capabilities, and other improvements to the customer service experience |
| • | No material financial, operational or competitive consequences of changes in regulations affecting our wireline business |
20 | BCE INC. 2021 FIRST QUARTER SHAREHOLDER REPORT
Table of Contents
3 MD&A Business segment analysis - Bell Media
KEY BUSINESS DEVELOPMENTS
BRAND-NEW ONLINE VIEWING DESTINATION NOOVO.CA AND NOOVO APP
Bell Media expanded its digital offering available on the Noovo.ca website and via the brand-new Noovo app, showcasing its extensive catalogue of French-language programming. Over 5,000 hours of content are now available on Noovo.ca and via the app on iOS and Android mobile devices and smart or connected TVs. This includes content from the conventional channel Noovo as well as from Canal D, Canal Vie, Investigation, VRAK and Z.
Since March 29, 2021, Noovo.ca features the majority of daily programming broadcast live on the Noovo channel, including all episodes of NOOVO LE FIL, which are available in the Noovo Info section dedicated exclusively to news. Led by a team of experienced anchors, journalists and correspondents, NOOVO LE FIL reports on current affairs from multiple angles using dynamic formats. It offers a variety of viewpoints that provide context to daily news stories, while analyzing them from a concrete and grounded perspective.
FINANCIAL PERFORMANCE ANALYSIS
Q1 2021 PERFORMANCE HIGHLIGHTS
| Bell Media | Bell Media | |
| Revenues | Adjusted EBITDA | |
| (in $ millions) | (in $ millions) | |
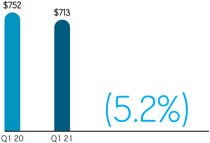
|
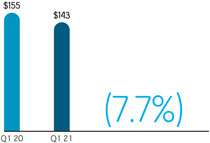
| |
BELL MEDIA RESULTS
REVENUES
| Q1 2021 | Q1 2020 | $ CHANGE | % CHANGE | |||||||||||||
| Total external revenues |
623 | 658 | (35 | ) | (5.3%) | |||||||||||
| Inter-segment revenues |
90 | 94 | (4 | ) | (4.3%) | |||||||||||
| Total Bell Media revenues |
713 | 752 | (39 | ) | (5.2%) | |||||||||||
Bell Media operating revenues declined by 5.2% in Q1 2021, compared to the same period last year, reflecting continued sequential improvement since the start of the COVID-19 pandemic, driven mainly by higher demand by TV advertisers. The Q1 2021 year-over-year decline was primarily due to lower advertising revenues.
| • | Advertising revenues decreased in Q1 2021, compared to Q1 2020, mainly driven by reduced spending by advertisers across some of our platforms due to the continued economic uncertainty resulting from the COVID-19 pandemic. The year-over-year decline reflected the following impacts on our advertising platforms: |
| • | Lower OOH advertising revenues due to the COVID-19 pandemic from the government restrictions imposed throughout most of Q1 2021 on certain non-essential services including restaurants, bars and arenas along with reduced airport and transit traffic |
| • | Decreased radio advertising revenues driven by lower demand from reduced audience levels due to a change in audience listening habits and the temporary shutdown of small local businesses attributable to the COVID-19 pandemic, as well as continued overall market softness |
These factors were partly offset by:
| • | Higher TV advertising revenues from the acquisition in May 2020 of V and Noovo.ca and greater sports advertising revenues year over year as most sporting events were cancelled or delayed in the latter part of March 2020 due to the COVID-19 pandemic and also reflected stronger news specialty performance, offset in part by lower demand by advertisers caused by the COVID-19 pandemic |
| • | Subscriber revenues declined slightly in Q1 2021, compared to the same period last year, primarily due to the timing of certain BDU contract renewals, which was largely offset by continued growth in direct-to-consumer subscribers from Crave and STARZ as well as sports streaming services. |
BCE INC. 2021 FIRST QUARTER SHAREHOLDER REPORT | 21
Table of Contents
3 MD&A Business segment analysis - Bell Media
OPERATING COSTS AND ADJUSTED EBITDA
| Q1 2021 | Q1 2020 | $ CHANGE | % CHANGE | |||||||||||||
| Operating costs |
(570 | ) | (597 | ) | 27 | 4.5 | % | |||||||||
| Adjusted EBITDA |
143 | 155 | (12 | ) | (7.7 | %) | ||||||||||
| Adjusted EBITDA margin |
20.1 | % | 20.6 | % | (0.5 | ) pts | ||||||||||
Bell Media operating costs decreased by 4.5% in Q1 2021, compared to Q1 2020, driven by:
| • | Lower programming costs from production shutdowns and delays due to the COVID-19 pandemic, offset in part by higher sports broadcasting rights |
| • | The temporary waiving of Canadian Radio-television and Telecommunications Commission (CRTC) Part I and II broadcasting license fees driven by the COVID-19 pandemic |
| • | Lower costs related to the OOH and radio revenue declines |
| • | Reduced labour cost primarily due to workforce reductions |
These factors were partly offset by:
| • | Higher costs from the V and Noovo.ca acquisitions |
Bell Media adjusted EBITDA decreased by 7.7% in Q1 2021, compared to the same period last year, driven by lower revenues, moderated by reduced operating costs.
ASSUMPTIONS
As at the date of this MD&A, our forward-looking statements set out in the BCE 2020 Annual MD&A, as updated or supplemented in this MD&A, are based on certain assumptions including, without limitation, the following assumptions and the assumptions referred to in each of the other business segment discussions set out in this section 3, Business segment analysis, as well as the economic and market assumptions referred to in section 1.3, Assumptions, of this MD&A.
| • | Overall revenue is expected to reflect a gradual economic recovery in 2021 combined with subscriber revenue growth and strategic pricing on advertising sales. However, revenue performance is expected to continue to be negatively impacted by the effects of the COVID-19 pandemic on many sectors of the economy. |
| • | Continued escalation of media content costs to secure quality programming, as well as the return of sports and entertainment programming; however, in the short term, savings can still be expected due to production delays, shortened sports seasons, and possible cancellations from the ongoing COVID-19 pandemic |
| • | Continued scaling of Crave through broader content offering and user experience improvements |
| • | Investment in Noovo news and more French-language original content to better serve our French-language customers with a wider array of content, in the language of their choice, on their preferred platforms |
| • | Enhanced market-leading attribution through our Strategic Audience Management (SAM) tool |
| • | Ability to successfully acquire and produce highly rated programming and differentiated content |
| • | Building and maintaining strategic supply arrangements for content across all screens and platforms |
| • | Continued monetization of content rights and Bell Media properties across all platforms |
| • | No material financial, operational or competitive consequences of changes in regulations affecting our media business |
22 | BCE INC. 2021 FIRST QUARTER SHAREHOLDER REPORT
Table of Contents
4 MD&A Financial and capital management
4 Financial and capital management
This section tells you how we manage our cash and capital resources to carry out our strategy and deliver financial results. It provides an analysis of our financial condition, cash flows and liquidity on a consolidated basis.
| MARCH 31, 2021 | DECEMBER 31, 2020 | $ CHANGE | % CHANGE | |||||||||||||
| Debt due within one year |
3,786 | 2,417 | 1,369 | 56.6% | ||||||||||||
| Long-term debt |
24,965 | 23,906 | 1,059 | 4.4% | ||||||||||||
| Preferred shares (2) |
2,002 | 2,002 | – | – | ||||||||||||
| Cash and cash equivalents |
(2,607 | ) | (224 | ) | (2,383 | ) | n.m. | |||||||||
| Net debt |
28,146 | 28,101 | 45 | 0.2% | ||||||||||||
n.m.: not meaningful
| (1) | Net debt is a non-GAAP financial measure and does not have any standardized meaning under IFRS. Therefore, it is unlikely to be comparable to similar measures presented by other issuers. See section 7.2, Non-GAAP financial measures and key performance indicators (KPIs) – Net debt, in this MD&A for more details, including a reconciliation to the most comparable IFRS financial measure. |
| (2) | 50% of outstanding preferred shares of $4,003 million in 2021 and 2020 are classified as debt consistent with the treatment by some credit rating agencies. |
The increase of $2,428 million in total debt, comprised of debt due within one year and long-term debt, was due to:
| • | the issuance by Bell Canada of Series M-54 and Series M-55 MTN debentures, with total principal amounts of $1 billion and $550 million in Canadian dollars, respectively. The MTN debentures are fully and unconditionally guaranteed by BCE Inc. |
| • | the issuance by Bell Canada of Series US-3 and Series US-4 Notes, with total principal amounts of $600 million and $500 million in U.S. dollars, respectively ($747 million and $623 million in Canadian dollars, respectively). The Notes are fully and unconditionally guaranteed by BCE Inc. |
Partly offset by:
| • | a decrease in our notes payable (net of issuances) of $357 million |
| • | a net decrease of $122 million due to lower lease liabilities and other debt |
| • | a decrease in our securitized trade receivables of $13 million |
The increase in cash and cash equivalents of $2,383 million was mainly due to:
| • | $2,319 million of debt issuances (net of repayments) |
| • | $940 million of free cash flow |
Partly offset by:
| • | $753 million of dividends paid on BCE common shares |
| • | $91 million paid for the purchase on the open market of BCE common shares for the settlement of share-based payments |
| COMMON SHARES OUTSTANDING | NUMBER OF SHARES |
|||
| Outstanding, January 1, 2021 |
904,415,010 | |||
| Shares issued under employee stock option plan |
199,928 | |||
| Outstanding, March 31, 2021 |
904,614,938 | |||
| STOCK OPTIONS OUTSTANDING | NUMBER OF OPTIONS |
WEIGHTED AVERAGE EXERCISE PRICE ($) |
||||||
| Outstanding, January 1, 2021 |
15,650,234 | 59 | ||||||
| Exercised (1) |
(199,928 | ) | 48 | |||||
| Forfeited or expired |
(159,042 | ) | 60 | |||||
| Outstanding, March 31, 2021 |
15,291,264 | 59 | ||||||
| Exercisable, March 31, 2021 |
8,708,876 | 57 | ||||||
| (1) | The weighted average market share price for options exercised during the three months ended March 31, 2021 was $56. |
BCE INC. 2021 FIRST QUARTER SHAREHOLDER REPORT | 23
Table of Contents
4 MD&A Financial and capital management
| Q1 2021 | Q1 2020 | $ CHANGE | % CHANGE | |||||||||||||
| Cash flows from operating activities |
1,992 | 1,451 | 541 | 37.3% | ||||||||||||
| Capital expenditures |
(1,012 | ) | (777 | ) | (235 | ) | (30.2% | ) | ||||||||
| Cash dividends paid on preferred shares |
(31 | ) | (36 | ) | 5 | 13.9% | ||||||||||
| Cash dividends paid by subsidiaries to non-controlling interest |
(13 | ) | (14 | ) | 1 | 7.1% | ||||||||||
| Acquisition and other costs paid |
4 | 9 | (5 | ) | (55.6% | ) | ||||||||||
| Cash from discontinued operations (included in cash flows from operating activities) |
– | (22 | ) | 22 | 100.0% | |||||||||||
| Free cash flow |
940 | 611 | 329 | 53.8% | ||||||||||||
| Cash from discontinued operations (included in cash flows from operating activities) |
– | 22 | (22 | ) | (100.0% | ) | ||||||||||
| Acquisition and other costs paid |
(4 | ) | (9 | ) | 5 | 55.6% | ||||||||||
| Other investing activities |
(21 | ) | (6 | ) | (15 | ) | n.m. | |||||||||
| Cash used in discontinued operations (included in cash flows from investing activities) |
– | (7 | ) | 7 | 100.0% | |||||||||||
| Net issuance of debt instruments |
2,319 | 2,742 | (423 | ) | (15.4% | ) | ||||||||||
| Issue of common shares |
10 | 22 | (12 | ) | (54.5% | ) | ||||||||||
| Purchase of shares for settlement of share-based payments |
(91 | ) | (94 | ) | 3 | 3.2% | ||||||||||
| Cash dividends paid on common shares |
(753 | ) | (716 | ) | (37 | ) | (5.2% | ) | ||||||||
| Other financing activities |
(17 | ) | (30 | ) | 13 | 43.3% | ||||||||||
| Cash used in discontinued operations (included in cash flows from financing activities) |
– | (1 | ) | 1 | 100.0% | |||||||||||
| Net increase in cash and cash equivalents |
2,383 | 2,534 | (151 | ) | (6.0% | ) | ||||||||||
|
n.m.: not meaningful
CASH FLOWS FROM OPERATING ACTIVITIES AND FREE CASH FLOW
Cash flows from operating activities in the first quarter of 2021 increased by $541 million, compared to the same period last year, mainly due to higher cash from working capital, in part from a slowdown experienced in Q1 2020 due to the COVID-19 pandemic and timing of supplier payments, and lower income taxes paid due to timing of installments.
Free cash flow in the first quarter of 2021 increased by $329 million, compared to the same period last year, mainly due to higher cash flows from operating activities, excluding cash from discontinued operations and acquisition and other costs paid, partly offset by higher capital expenditures.
CAPITAL EXPENDITURES
|
| Q1 2021 | Q1 2020 | $ CHANGE | % CHANGE | |||||||||||||
| Bell Wireless |
286 | 130 | (156 | ) | n.m. | |||||||||||
| Capital intensity ratio |
13.6% | 6.4% | (7.2) pts | |||||||||||||
| Bell Wireline |
707 | 622 | (85 | ) | (13.7%) | |||||||||||
| Capital intensity ratio |
22.9% | 20.5% | (2.4) pts | |||||||||||||
| Bell Media |
19 | 25 | 6 | 24.0% | ||||||||||||
| Capital intensity ratio |
2.7% | 3.3% | 0.6 pts | |||||||||||||
| BCE |
1,012 | 777 | (235 | ) | (30.2%) | |||||||||||
| Capital intensity ratio |
17.7% | 13.8% | (3.9) pts | |||||||||||||
n.m.: not meaningful
BCE capital expenditures totaled $1,012 million in Q1 2021, increasing by 30.2% or $235 million over the same period last year, due to greater spending at Bell Wireless and Bell Wireline, offset in part by reduced spending at Bell Media. This drove a corresponding capital intensity ratio of 17.7% in Q1 2021, up 3.9 pts over the 13.8% achieved in Q1 2020. The increase in capital spending is consistent with our two-year plan to accelerate spending on broadband and mobile 5G networks. The growth in year-over-year capital expenditures was driven by:
| • | Higher capital spending in our wireless segment of $156 million in Q1 2021, compared to the same period last year, primarily driven by the ongoing deployment of our mobile 5G network |
| • | Greater capital spending in our wireline segment of $85 million in Q1 2021, compared to Q1 2020, mainly due to the continued expansion of our FTTP network to more homes and businesses and the rollout of our fixed WTTP network to more rural locations |
24 | BCE INC. 2021 FIRST QUARTER SHAREHOLDER REPORT
Table of Contents
4 MD&A Financial and capital management
DEBT INSTRUMENTS
2021
In the first quarter of 2021, we issued $2,319 million of debt, net of repayments. This included the issuance of Series M-54 and Series M-55 MTN debentures with total principal amounts of $1 billion and $550 million, respectively, and the issuance of Series US-3 and Series US-4 Notes with total principal amounts of $600 million and $500 million in U.S. dollars, respectively ($747 million and $623 million in Canadian dollars, respectively), partly offset by the repayment (net of issuances) of $357 million of notes payable, net payments of leases and other debt of $231 million and a decrease in securitized trade receivables of $13 million.
2020
In the first quarter of 2020, we issued $2,742 million of debt, net of repayments. This included borrowings by Bell Canada of $1.1 billion in U.S. dollars ($1,544 million in Canadian dollars) under its committed revolving credit facility, the issuance of Series M-47 and Series M-51 MTN debentures with total principal amounts of $1 billion and $750 million in Canadian dollars, respectively, and an increase in securitized trade receivables of $400 million, partly offset by the early redemption of Series M-24 MTN debentures with a total principal amount of $500 million, the repayment (net of issuances) of $230 million of notes payable, and net payments of leases and other debt of $222 million.
CASH DIVIDENDS PAID ON COMMON SHARES
In the first quarter of 2021, cash dividends paid on common shares increased by $37 million compared to Q1 2020, due to a higher dividend paid in Q1 2021 of $0.8325 per common share compared to $0.7925 per common share in Q1 2020.
4.4 Post-employment benefit plans
For the three months ended March 31, 2021, we recorded an increase in our post-employment benefit plans and a gain, before taxes, in OCI from continuing operations of $1,565 million, due to a higher actual discount rate of 3.4% at March 31, 2021, as compared to 2.6% at December 31, 2020, partly offset by a lower-than-expected return on plan assets in 2021.
For the three months ended March 31, 2020, we recorded an increase in our post-employment benefit plans and a gain, before taxes, in OCI from continuing operations of $2,365 million due to a higher actual discount rate of 4.2% at March 31, 2020, as compared to 3.1% at December 31, 2019, partly offset by a lower-than-expected return on plan assets.
FAIR VALUE
The following table provides the fair value details of financial instruments measured at amortized cost in the consolidated statements of financial position.
| MARCH 31, 2021 | DECEMBER 31, 2020 | |||||||||||||||||||
| CLASSIFICATION | FAIR VALUE METHODOLOGY | CARRYING VALUE |
FAIR VALUE |
CARRYING VALUE |
FAIR VALUE |
|||||||||||||||
| CRTC deferral account obligation | Trade payables and other liabilities and other non- current liabilities | Present value of estimated future cash flows discounted using observable market interest rates | 81 | 84 | 82 | 86 | ||||||||||||||
| Debt securities and other debt | Debt due within one year and long-term debt | Quoted market price of debt | 23,401 | 25,776 | 20,525 | 24,366 | ||||||||||||||
BCE INC. 2021 FIRST QUARTER SHAREHOLDER REPORT | 25
Table of Contents
4 MD&A Financial and capital management
The following table provides the fair value details of financial instruments measured at fair value in the consolidated statements of financial position.
| FAIR VALUE | ||||||||||||||||||
| CLASSIFICATION |
|
CARRYING VALUE OF ASSET (LIABILITY) |
|
|
QUOTED PRICES IN ACTIVE MARKETS FOR IDENTICAL ASSETS (LEVEL 1) |
|
|
OBSERVABLE MARKET DATA (LEVEL 2) |
(1) |
|
NON-OBSERVABLE MARKET INPUTS (LEVEL 3) |
(2) | ||||||
| March 31, 2021 | ||||||||||||||||||
| Publicly-traded and privately-held investments (3) | Other non-current assets | 125 | 3 | – | 122 | |||||||||||||
| Derivative financial instruments | Other current assets, trade payables and other liabilities, other non-current assets and liabilities |
64 | – | 64 | – | |||||||||||||
| Maple Leaf Sports & Entertainment Ltd. (MLSE) financial liability (4) |
Trade payables and other liabilities |
(149 | ) | – | – | (149 | ) | |||||||||||
| Other | Other non-current assets and liabilities |
113 | – | 171 | (58 | ) | ||||||||||||
| December 31, 2020 | ||||||||||||||||||
| Publicly-traded and privately-held investments (3) | Other non-current assets |
126 | 3 | – | 123 | |||||||||||||
| Derivative financial instruments | Other current assets, trade payables and other liabilities, other non-current assets and liabilities |
(51 | ) | – | (51 | ) | – | |||||||||||
| MLSE financial liability (4) | Trade payables and other liabilities |
(149 | ) | – | – | (149 | ) | |||||||||||
| Other | Other non-current assets and liabilities |
109 | – | 167 | (58 | ) | ||||||||||||
| (1) | Observable market data such as equity prices, interest rates, swap rate curves and foreign currency exchange rates. |
| (2) | Non-observable market inputs such as discounted cash flows and earnings multiples. A reasonable change in our assumptions would not result in a significant increase (decrease) to our level 3 financial instruments. |
| (3) | Unrealized gains and losses are recorded in OCI from continuing operations in the consolidated statements of comprehensive income and are reclassified from Accumulated OCI to Deficit in the statements of financial position when realized. |
| (4) | Represents BCE’s obligation to repurchase the BCE Master Trust Fund’s (Master Trust Fund) 9% interest in MLSE at a price not less than an agreed minimum price should the Master Trust Fund exercise its put option. The obligation to repurchase is marked to market each reporting period and the gain or loss is recognized in Other income (expense) in the consolidated income statements. |
MARKET RISK
CURRENCY EXPOSURES
We use forward contracts, options and cross currency interest rate swaps to manage foreign currency risk related to anticipated purchases and sales and certain foreign currency debt.
In Q1 2021, we entered into cross currency interest rate swaps with notional amounts of $600 million in U.S. dollars ($749 million in Canadian dollars) and $500 million in U.S. dollars ($637 million in Canadian dollars) to hedge the U.S. currency exposure of our US-3 Notes maturing in 2024 and our US-4 Notes maturing in 2051, respectively. See section 4.1, Net debt, in this MD&A, for additional details.
A 10% depreciation (appreciation) in the value of the Canadian dollar relative to the U.S. dollar would result in a gain (loss) of nil ($15 million) recognized in net earnings from continuing operations at March 31, 2021 and a gain (loss) of $202 million ($188 million) recognized in Other comprehensive income from continuing operations at March 31, 2021, with all other variables held constant.
A 10% depreciation (appreciation) in the value of the Canadian dollar relative to the Philippines Peso would result in a gain (loss) of $5 million recognized in Other comprehensive income from continuing operations at March 31, 2021, with all other variables held constant.
The following table provides further details on our outstanding foreign currency forward contracts and options as at March 31, 2021.
| TYPE OF HEDGE | BUY CURRENCY |
AMOUNT TO RECEIVE |
SELL CURRENCY |
AMOUNT TO PAY |
MATURITY | HEDGED ITEM | ||||||||||||||||
| Cash flow |
USD | 516 | CAD | 678 | 2021 | Anticipated transactions | ||||||||||||||||
| Cash flow |
PHP | 2,756 | CAD | 73 | 2021 | Anticipated transactions | ||||||||||||||||
| Cash flow |
USD | 479 | CAD | 614 | 2022 | Anticipated transactions | ||||||||||||||||
| Cash flow |
USD | 120 | CAD | 150 | 2023 | Anticipated transactions | ||||||||||||||||
| Cash flow – call options |
USD | 231 | CAD | 299 | 2022 | Anticipated transactions | ||||||||||||||||
| Cash flow – put options |
USD | 231 | CAD | 295 | 2022 | Anticipated transactions | ||||||||||||||||
| Economic |
USD | 100 | CAD | 136 | 2021 | Anticipated transactions | ||||||||||||||||
| Economic – call options |
USD | 3 | CAD | 4 | 2021 | Anticipated transactions | ||||||||||||||||
| Economic – call options |
CAD | 4 | USD | 3 | 2021 | Anticipated transactions | ||||||||||||||||
| Economic – put options |
USD | 90 | CAD | 116 | 2021 | Anticipated transactions | ||||||||||||||||
| Economic – put options |
USD | 99 | CAD | 123 | 2022 | Anticipated transactions | ||||||||||||||||
26 | BCE INC. 2021 FIRST QUARTER SHAREHOLDER REPORT
Table of Contents
4 MD&A Financial and capital management
INTEREST RATE EXPOSURES
We use interest rate options to economically hedge the dividend rate resets on $450 million of our preferred shares having varying reset dates in 2021. The fair value of these interest rate options at March 31, 2021 was a net asset of $9 million (December 31, 2020 – net liability of $6 million), recognized in Other current assets, Trade payables and other liabilities, and Other non-current liabilities in the consolidated statements of financial position. A gain of $16 million for the three months ended March 31, 2021 relating to these interest rate options is recognized in Other income (expense) in the consolidated income statements.
A 1% increase (decrease) in interest rates would result in an increase (decrease) of $10 million ($13 million) in net earnings from continuing operations at March 31, 2021.
EQUITY PRICE EXPOSURES
We use equity forward contracts on BCE’s common shares to economically hedge the cash flow exposure related to the settlement of equity settled share-based compensation plans and the equity price risk related to a cash-settled share-based payment plan. The fair value of our equity forward contracts at March 31, 2021 and December 31, 2020 was a net liability of $32 million and $82 million, respectively, recognized in Other current assets, Trade payables and other liabilities, Other non-current assets and Other non-current liabilities in the consolidated statements of financial position. A gain of $60 million for the three months ended March 31, 2021 relating to these equity forward contracts is recognized in Other income (expense) in the consolidated income statements.
A 5% increase (decrease) in the market price of BCE’s common shares at March 31, 2021 would result in a gain (loss) of $40 million recognized in net earnings from continuing operations, with all other variables held constant.
COMMODITY PRICE EXPOSURE
We use fuel swaps to economically hedge the purchase cost of fuel in 2021. The fair value of our fuel swaps at March 31, 2021 and December 31, 2020 was an asset of $6 million and $3 million, respectively, recognized in Other current assets in the consolidated statements of financial position. A gain of $4 million for the three months ended March 31, 2021 relating to these fuel swaps is recognized in Other income (expense) in the consolidated income statements.
A 25% increase (decrease) in the market price of fuel at March 31, 2021 would result in a gain (loss) of $3 million relating to fuel swaps recognized in net earnings from continuing operations, with all other variables held constant.
BCE’s and Bell Canada’s key credit ratings remain unchanged from those described in the BCE 2020 Annual MD&A.
This section contains forward-looking statements, including relating to the sources of liquidity we expect to use to meet our cash requirements for the remainder of 2021. Refer to the section Caution regarding forward-looking statements at the beginning of this MD&A.
Total available liquidity at March 31, 2021 was $6.5 billion, comprised of $2.6 billion in cash and cash equivalents, $400 million available under our securitized trade receivable programs and $3.5 billion available under our committed bank credit facilities.
In April 2021, available liquidity was reduced as a result of the redemption on April 19, 2021 of Bell Canada’s 3.00% Series M-40 MTN debentures, in the principal amount of $1.7 billion, which were due on October 3, 2022, and the repayment of Bell Canada’s 10.75% Series EG debentures in the principal amount of $125 million which matured on April 15, 2021.
We expect our available liquidity to be sufficient to meet our cash requirements for the remainder of 2021, including for capital expenditures, post-employment benefit plans funding, dividend payments, the payment of contractual obligations, maturing debt, on-going operations, and other cash requirements.
We continuously monitor the rapidly changing COVID-19 pandemic for impacts on operations, capital markets and the Canadian economy with the objective of maintaining adequate liquidity.
BCE INC. 2021 FIRST QUARTER SHAREHOLDER REPORT | 27
Table of Contents
5 MD&A Quarterly financial information
5 Quarterly financial information
BCE’s Q1 2021 Financial Statements were prepared in accordance with IFRS, as issued by the International Accounting Standards Board (IASB), under International Accounting Standard (IAS) 34, Interim Financial Reporting and were approved by BCE’s board of directors on April 28, 2021.
The following table, which was also prepared in accordance with IFRS, shows selected consolidated financial data of BCE for the eight most recent completed quarters.
| 2021 | 2020 | 2019 | ||||||||||||||||||||||||||||||
| Q1 | Q4 | Q3 | Q2 | Q1 | Q4 | Q3 | Q2 | |||||||||||||||||||||||||
| Operating revenues |
||||||||||||||||||||||||||||||||
| Service |
4,968 | 5,090 | 4,924 | 4,800 | 5,018 | 5,235 | 5,141 | 5,190 | ||||||||||||||||||||||||
| Product |
738 | 1,012 | 863 | 554 | 622 | 1,040 | 799 | 699 | ||||||||||||||||||||||||
| Total operating revenues |
5,706 | 6,102 | 5,787 | 5,354 | 5,640 | 6,275 | 5,940 | 5,889 | ||||||||||||||||||||||||
| Adjusted EBITDA |
2,429 | 2,404 | 2,454 | 2,331 | 2,418 | 2,484 | 2,568 | 2,572 | ||||||||||||||||||||||||
| Severance, acquisition and other costs |
(89 | ) | (52 | ) | (26 | ) | (22 | ) | (16 | ) | (28 | ) | (23 | ) | (39 | ) | ||||||||||||||||
| Depreciation |
(895 | ) | (872 | ) | (876 | ) | (869 | ) | (858 | ) | (854 | ) | (852 | ) | (879 | ) | ||||||||||||||||
| Amortization |
(238 | ) | (233 | ) | (232 | ) | (234 | ) | (230 | ) | (224 | ) | (225 | ) | (220 | ) | ||||||||||||||||
| Net earnings from continuing operations |
687 | 721 | 734 | 290 | 728 | 718 | 914 | 810 | ||||||||||||||||||||||||
| Net earnings from discontinued operations |
– | 211 | 6 | 4 | 5 | 5 | 8 | 7 | ||||||||||||||||||||||||
| Net earnings |
687 | 932 | 740 | 294 | 733 | 723 | 922 | 817 | ||||||||||||||||||||||||
| Net earnings from continuing operations attributable to common shareholders |
642 | 678 | 686 | 233 | 675 | 667 | 859 | 754 | ||||||||||||||||||||||||
| Net earnings attributable to common shareholders |
642 | 889 | 692 | 237 | 680 | 672 | 867 | 761 | ||||||||||||||||||||||||
| Net earnings per common share – basic and diluted |
||||||||||||||||||||||||||||||||
| Continuing operations |
0.71 | 0.75 | 0.76 | 0.26 | 0.74 | 0.73 | 0.96 | 0.84 | ||||||||||||||||||||||||
| Discontinued operations |
– | 0.23 | 0.01 | – | 0.01 | 0.01 | – | 0.01 | ||||||||||||||||||||||||
| Net earnings per common share – basic and diluted |
0.71 | 0.98 | 0.77 | 0.26 | 0.75 | 0.74 | 0.96 | 0.85 | ||||||||||||||||||||||||
| Weighted average number of common shares outstanding – basic (millions) |
904.5 | 904.4 | 904.3 | 904.3 | 904.1 | 903.8 | 901.4 | 899.5 | ||||||||||||||||||||||||
28 | BCE INC. 2021 FIRST QUARTER SHAREHOLDER REPORT
Table of Contents
6 MD&A Regulatory environment
TELECOMMUNICATIONS ACT
REVIEW OF MOBILE WIRELESS SERVICES
On February 28, 2019, the CRTC launched its planned review of the regulatory framework for mobile wireless services. The main issues in the CRTC’s consultation included (i) competition in the retail market; (ii) the current wholesale mobile wireless service regulatory framework, with a focus on wholesale mobile virtual network operator (MVNO) access; and (iii) the future of mobile wireless services in Canada, with a focus on reducing barriers to infrastructure deployment. On April 15, 2021, the CRTC released its decision. The decision requires Bell Mobility Inc. (Bell Mobility), Rogers Communications Canada Inc. (Rogers), Telus Communications Inc. (Telus) and Saskatchewan Telecommunications (Sasktel) to provide MVNO access to their networks to regional wireless carriers to allow them to operate as MVNOs in Innovation, Science and Economic Development Canada (ISED) Tier 4 spectrum licence areas where they own spectrum. The terms and conditions for MVNO access will be established in tariffs to be approved by the CRTC. The rate for MVNO access will not be subject to the CRTC tariff regime but instead is to be commercially negotiated between the parties with final offer arbitration by the CRTC as a recourse if negotiations fail. The CRTC indicated that the mandated access service is intended to be a temporary measure and will, in the absence of certain implementation delays, be phased out seven years from the date tariffed terms and conditions are finalized. In the decision the CRTC has also required Bell Mobility, Rogers, Telus and Sasktel to provide seamless handoffs as part of the CRTC’s existing mandated domestic roaming service and has confirmed that its mandatory roaming obligations apply to 5G. It is unclear what impact, if any, the measures set out in this decision could have on our business and financial results, and our ability to make investments at the same levels as we have in the past.
BCE INC. 2021 FIRST QUARTER SHAREHOLDER REPORT | 29
Table of Contents
7 MD&A Accounting policies, financial measures and controls
7 Accounting policies, financial measures and controls
BCE’s Q1 2021 Financial Statements were prepared in accordance with IFRS, as issued by the IASB, under IAS 34 – Interim Financial Reporting and were approved by BCE’s board of directors on April 28, 2021. These financial statements were prepared using the same basis of presentation, accounting policies and methods of computation as outlined in Note 2, Significant accounting policies in BCE’s consolidated financial statements for the year ended December 31, 2020. BCE’s Q1 2021 Financial Statements do not include all of the notes required in the annual financial statements.
FUTURE CHANGES TO ACCOUNTING STANDARDS
The following amendments to standards issued by the IASB have not yet been adopted by BCE.
| STANDARD | DESCRIPTION | IMPACT | EFFECTIVE DATE | |||
| Onerous Contracts – Cost of Fulfilling a Contract, Amendments to IAS 37 – Provisions, Contingent Liabilities and Contingent Assets | These amendments clarify which costs should be included in determining the cost of fulfilling a contract when assessing whether a contract is onerous.
|
We are currently assessing the impact of these amendments. | Effective for annual reporting periods beginning on or after January 1, 2022. Early application is permitted. | |||
| Disclosure of Accounting Policies – Amendments to IAS 1 – Presentation of Financial Statements | These amendments require that entities disclose material accounting policies, as defined, instead of significant accounting policies.
|
We are currently assessing the impact of these amendments on the disclosure of our accounting policies. | Effective for annual reporting periods beginning on or after January 1, 2023. Early application is permitted. | |||
7.2 Non-GAAP financial measures and key performance indicators (KPIs)
This section describes the non-GAAP financial measures and KPIs we use to explain our financial results. It also provides reconciliations of the non-GAAP financial measures to the most comparable IFRS financial measures.
ADJUSTED EBITDA AND ADJUSTED EBITDA MARGIN
The terms adjusted EBITDA and adjusted EBITDA margin do not have any standardized meaning under IFRS. Therefore, they are unlikely to be comparable to similar measures presented by other issuers.
We define adjusted EBITDA as operating revenues less operating costs, as shown in BCE’s consolidated income statements. Adjusted EBITDA for BCE’s segments is the same as segment profit as reported in Note 3, Segmented information, in BCE’s Q1 2021 Financial Statements. We define adjusted EBITDA margin as adjusted EBITDA divided by operating revenues.
We use adjusted EBITDA and adjusted EBITDA margin to evaluate the performance of our businesses as they reflect their ongoing profitability. We believe that certain investors and analysts use adjusted EBITDA to measure a company’s ability to service debt and to meet other payment obligations or as a common measurement to value companies in the telecommunications industry. We believe that certain investors and analysts also use adjusted EBITDA and adjusted EBITDA margin to evaluate the performance of our businesses. Adjusted EBITDA is also one component in the determination of short-term incentive compensation for all management employees.
Adjusted EBITDA and adjusted EBITDA margin have no directly comparable IFRS financial measure. Alternatively, the following table provides a reconciliation of net earnings to adjusted EBITDA.
| Q1 2021 | Q1 2020 | |||||||
| Net earnings |
687 | 733 | ||||||
| Severance, acquisition and other costs |
89 | 16 | ||||||
| Depreciation |
895 | 858 | ||||||
| Amortization |
238 | 230 | ||||||
| Finance costs |
||||||||
| Interest expense |
267 | 277 | ||||||
| Interest on post-employment benefit obligations |
5 | 12 | ||||||
| Impairment of assets |
3 | 7 | ||||||
| Other (income) expense |
(8 | ) | 47 | |||||
| Income taxes |
253 | 243 | ||||||
| Net earnings from discontinued operations |
– | (5 | ) | |||||
| Adjusted EBITDA |
2,429 | 2,418 | ||||||
| BCE operating revenues |
5,706 | 5,640 | ||||||
| Adjusted EBITDA margin |
42.6 | % | 42.9 | % | ||||
30 | BCE INC. 2021 FIRST QUARTER SHAREHOLDER REPORT
Table of Contents
7 MD&A Accounting policies, financial measures and controls
ADJUSTED NET EARNINGS AND ADJUSTED EPS
The terms adjusted net earnings and adjusted EPS do not have any standardized meaning under IFRS. Therefore, they are unlikely to be comparable to similar measures presented by other issuers.
We define adjusted net earnings as net earnings attributable to common shareholders before severance, acquisition and other costs, net mark-to-market losses (gains) on derivatives used to economically hedge equity settled share-based compensation plans, net losses (gains) on investments, early debt redemption costs, impairment of assets and discontinued operations, net of tax and NCI. We define adjusted EPS as adjusted net earnings per BCE common share.
We use adjusted net earnings and adjusted EPS, and we believe that certain investors and analysts use these measures, among other ones, to assess the performance of our businesses without the effects of severance, acquisition and other costs, net mark-to-market losses (gains) on derivatives used to economically hedge equity settled share-based compensation plans, net losses (gains) on investments, early debt redemption costs, impairment of assets and discontinued operations, net of tax and NCI. We exclude these items because they affect the comparability of our financial results and could potentially distort the analysis of trends in business performance. Excluding these items does not imply they are non-recurring.
The most comparable IFRS financial measures are net earnings attributable to common shareholders and EPS.
The following table is a reconciliation of net earnings attributable to common shareholders and EPS to adjusted net earnings on a consolidated basis and per BCE common share (adjusted EPS), respectively.
| Q1 2021 | Q1 2020 | |||||||||||||||
| TOTAL | PER SHARE | TOTAL | PER SHARE | |||||||||||||
| Net earnings attributable to common shareholders |
642 | 0.71 | 680 | 0.75 | ||||||||||||
| Severance, acquisition and other costs |
65 | 0.07 | 12 | 0.01 | ||||||||||||
| Net mark-to-market (gains) losses on derivatives used to economically hedge equity settled share-based compensation plans |
(44 | ) | (0.04 | ) | 20 | 0.03 | ||||||||||
| Net gains on investments |
– | – | (10 | ) | (0.01 | ) | ||||||||||
| Early debt redemption costs |
39 | 0.04 | 12 | 0.01 | ||||||||||||
| Impairment of assets |
2 | – | 5 | 0.01 | ||||||||||||
| Net earnings from discontinued operations |
– | – | (5 | ) | (0.01 | ) | ||||||||||
| Adjusted net earnings |
704 | 0.78 | 714 | 0.79 | ||||||||||||
FREE CASH FLOW AND DIVIDEND PAYOUT RATIO
The terms free cash flow and dividend payout ratio do not have any standardized meaning under IFRS. Therefore, they are unlikely to be comparable to similar measures presented by other issuers.
We define free cash flow as cash flows from operating activities, excluding cash from discontinued operations, acquisition and other costs paid (which include significant litigation costs) and voluntary pension funding, less capital expenditures, preferred share dividends and dividends paid by subsidiaries to NCI. We exclude cash from discontinued operations, acquisition and other costs paid and voluntary pension funding because they affect the comparability of our financial results and could potentially distort the analysis of trends in business performance. Excluding these items does not imply they are non-recurring.
We consider free cash flow to be an important indicator of the financial strength and performance of our businesses because it shows how much cash is available to pay dividends on common shares, repay debt and reinvest in our company. We believe that certain investors and analysts use free cash flow to value a business and its underlying assets and to evaluate the financial strength and performance of our businesses. The most comparable IFRS financial measure is cash flows from operating activities.
We define dividend payout ratio as dividends paid on common shares divided by free cash flow. We consider dividend payout ratio to be an important indicator of the financial strength and performance of our businesses because it shows the sustainability of the company’s dividend payments.
The following table is a reconciliation of cash flows from operating activities to free cash flow on a consolidated basis.
| Q1 2021 | Q1 2020 | |||||||
| Cash flows from operating activities |
1,992 | 1,451 | ||||||
| Capital expenditures |
(1,012 | ) | (777 | ) | ||||
| Cash dividends paid on preferred shares |
(31 | ) | (36 | ) | ||||
| Cash dividends paid by subsidiaries to NCI |
(13 | ) | (14 | ) | ||||
| Acquisition and other costs paid |
4 | 9 | ||||||
| Cash from discontinued operations (included in cash flows from operating activities) |
– | (22 | ) | |||||
| Free cash flow |
940 | 611 | ||||||
BCE INC. 2021 FIRST QUARTER SHAREHOLDER REPORT | 31
Table of Contents
7 MD&A Accounting policies, financial measures and controls
NET DEBT
The term net debt does not have any standardized meaning under IFRS. Therefore, it is unlikely to be comparable to similar measures presented by other issuers.
We define net debt as debt due within one year plus long-term debt and 50% of preferred shares, less cash and cash equivalents, as shown in BCE’s consolidated statements of financial position. We include 50% of outstanding preferred shares in our net debt as it is consistent with the treatment by certain credit rating agencies.
We consider net debt to be an important indicator of the company’s financial leverage because it represents the amount of debt that is not covered by available cash and cash equivalents. We believe that certain investors and analysts use net debt to determine a company’s financial leverage.
Net debt has no directly comparable IFRS financial measure, but rather is calculated using several asset and liability categories from the statements of financial position, as shown in the following table.
| MARCH 31, 2021 | DECEMBER 31, 2020 | |||||||
| Debt due within one year |
3,786 | 2,417 | ||||||
| Long-term debt |
24,965 | 23,906 | ||||||
| 50% of outstanding preferred shares |
2,002 | 2,002 | ||||||
| Cash and cash equivalents |
(2,607 | ) | (224 | ) | ||||
| Net debt |
28,146 | 28,101 | ||||||
NET DEBT LEVERAGE RATIO
The net debt leverage ratio does not have any standardized meaning under IFRS. Therefore, it is unlikely to be comparable to similar measures presented by other issuers. We use, and believe that certain investors and analysts use, the net debt leverage ratio as a measure of financial leverage.
The net debt leverage ratio represents net debt divided by adjusted EBITDA. For the purposes of calculating our net debt leverage ratio, adjusted EBITDA is twelve-month trailing adjusted EBITDA.
ADJUSTED EBITDA TO NET INTEREST EXPENSE RATIO
The ratio of adjusted EBITDA to net interest expense does not have any standardized meaning under IFRS. Therefore, it is unlikely to be comparable to similar measures presented by other issuers. We use, and believe that certain investors and analysts use, the adjusted EBITDA to net interest expense ratio as a measure of financial health of the company.
The adjusted EBITDA to net interest expense ratio represents adjusted EBITDA divided by net interest expense. For the purposes of calculating our adjusted EBITDA to net interest expense ratio, adjusted EBITDA is twelve-month trailing adjusted EBITDA. Net interest expense is twelve-month trailing net interest expense as shown in our statements of cash flows, plus 50% of declared preferred share dividends as shown in our income statements.
KPIs
In addition to the non-GAAP financial measures described previously, we use a number of KPIs to measure the success of our strategic imperatives. These KPIs are not accounting measures and may not be comparable to similar measures presented by other issuers.
| KPI | DEFINITION | |
| ABPU |
Mobile phone average billing per user (ABPU) or subscriber approximates the average amount billed to customers on a monthly basis, including monthly billings related to device financing receivables owing from customers on contract, which is used to track our recurring billing streams. Mobile phone blended ABPU is calculated by dividing customer billings by the average mobile phone subscriber base for the specified period and is expressed as a dollar unit per month. | |
|
Capital intensity |
Capital expenditures divided by operating revenues. | |
| Churn |
Mobile phone churn is the rate at which existing mobile phone subscribers cancel their services. It is a measure of our ability to retain our customers. Mobile phone churn is calculated by dividing the number of mobile phone deactivations during a given period by the average number of mobile phone subscribers in the base for the specified period and is expressed as a percentage per month. | |
| Subscriber unit |
Mobile phone subscriber unit is comprised of a recurring revenue generating portable unit (e.g. smartphones and feature phones) on an active service plan, that has access to our wireless networks and includes voice, text and/or data connectivity. We report mobile phone subscriber units in two categories: postpaid and prepaid. Prepaid mobile phone subscriber units are considered active for a period of 90 days following the expiry of the subscriber’s prepaid balance.
Mobile connected device subscriber unit is comprised of a recurring revenue generating portable unit (e.g. tablets, wearables, mobile Internet devices and IoT) on an active service plan, that has access to our wireless networks and is intended for limited or no cellular voice capability.
Wireline subscriber unit consists of an active revenue-generating unit with access to our services, including retail Internet, satellite TV, IPTV, and/or residential NAS. A subscriber is included in our subscriber base when the service has been installed and is operational at the customer premise and a billing relationship has been established. | |
| • Retail Internet, IPTV and satellite TV subscribers have access to stand-alone services, and are primarily represented by a dwelling unit | ||
|
• Retail residential NAS subscribers are based on a line count and are represented by a unique telephone number | ||
32 | BCE INC. 2021 FIRST QUARTER SHAREHOLDER REPORT
Table of Contents
7 MD&A Accounting policies, financial measures and controls
CHANGES IN INTERNAL CONTROL OVER FINANCIAL REPORTING
No changes were made in our internal control over financial reporting during the quarter ended March 31, 2021 that have materially affected, or are reasonably likely to materially affect, our internal control over financial reporting.
BCE INC. 2021 FIRST QUARTER SHAREHOLDER REPORT | 33
Table of Contents
Consolidated financial statements
Consolidated financial statements
CONSOLIDATED INCOME STATEMENTS
| FOR THE PERIOD ENDED MARCH 31 (IN MILLIONS OF CANADIAN DOLLARS, EXCEPT SHARE AMOUNTS) (UNAUDITED) |
NOTE | 2021 | 2020 | |||||||||
| Operating revenues |
3 | 5,706 | 5,640 | |||||||||
| Operating costs |
3, 4 | (3,277 | ) | (3,222 | ) | |||||||
| Severance, acquisition and other costs |
5 | (89 | ) | (16 | ) | |||||||
| Depreciation |
(895 | ) | (858 | ) | ||||||||
| Amortization |
(238 | ) | (230 | ) | ||||||||
| Finance costs |
||||||||||||
| Interest expense |
(267 | ) | (277 | ) | ||||||||
| Interest on post-employment benefit obligations |
10 | (5 | ) | (12 | ) | |||||||
| Impairment of assets |
(3 | ) | (7 | ) | ||||||||
| Other income (expense) |
6 | 8 | (47 | ) | ||||||||
| Income taxes |
(253 | ) | (243 | ) | ||||||||
| Net earnings from continuing operations |
687 | 728 | ||||||||||
| Net earnings from discontinued operations |
– | 5 | ||||||||||
| Net earnings |
687 | 733 | ||||||||||
| Net earnings from continuing operations attributable to: |
||||||||||||
| Common shareholders |
642 | 675 | ||||||||||
| Preferred shareholders |
32 | 38 | ||||||||||
| Non-controlling interest |
13 | 15 | ||||||||||
| Net earnings from continuing operations |
687 | 728 | ||||||||||
| Net earnings attributable to: |
||||||||||||
| Common shareholders |
642 | 680 | ||||||||||
| Preferred shareholders |
32 | 38 | ||||||||||
| Non-controlling interest |
13 | 15 | ||||||||||
| Net earnings |
687 | 733 | ||||||||||
| Net earnings per common share – basic and diluted |
7 | |||||||||||
| Continuing operations |
0.71 | 0.74 | ||||||||||
| Discontinued operations |
– | 0.01 | ||||||||||
| Net earnings per common share – basic and diluted |
0.71 | 0.75 | ||||||||||
| Weighted average number of common shares outstanding - basic (millions) |
904.5 | 904.1 | ||||||||||
34 | BCE INC. 2021 FIRST QUARTER SHAREHOLDER REPORT
Table of Contents
Consolidated financial statements
CONSOLIDATED STATEMENTS OF COMPREHENSIVE INCOME
| FOR THE PERIOD ENDED MARCH 31 (IN MILLIONS OF CANADIAN DOLLARS) (UNAUDITED) |
NOTE | 2021 | 2020 | |||||||||
| Net earnings from continuing operations |
687 | 728 | ||||||||||
| Other comprehensive income from continuing operations, net of income taxes |
||||||||||||
| Items that will be subsequently reclassified to net earnings |
||||||||||||
| Net change in value of publicly-traded and privately-held investments, net of income taxes of nil for the three months ended March 31, 2021 and 2020, respectively |
(3 | ) | (3 | ) | ||||||||
| Net change in value of derivatives designated as cash flow hedges, net of income taxes of ($24) million and ($116) million for the three months ended March 31, 2021 and 2020, respectively |
65 | 318 | ||||||||||
| Items that will not be reclassified to net earnings |
||||||||||||
| Actuarial gains on post-employment benefit plans, net of income taxes of ($420) million and ($634) million for the three months ended March 31, 2021 and 2020, respectively(1) |
10 | 1,145 | 1,731 | |||||||||
| Net change in value of derivatives designated as cash flow hedges, net of income taxes of $2 million and ($21) million for the three months ended March 31, 2021 and 2020, respectively |
(6 | ) | 57 | |||||||||
| Other comprehensive income from continuing operations |
1,201 | 2,103 | ||||||||||
| Net earnings from discontinued operations attributable to common shareholders |
– | 5 | ||||||||||
| Total comprehensive income |
1,888 | 2,836 | ||||||||||
| Total comprehensive income attributable to: |
||||||||||||
| Common shareholders |
1,843 | 2,778 | ||||||||||
| Preferred shareholders |
32 | 38 | ||||||||||
| Non-controlling interest |
13 | 20 | ||||||||||
| Total comprehensive income |
1,888 | 2,836 | ||||||||||
| (1) | The discount rate used to value our post-employment benefit obligations at March 31, 2021 was 3.4% compared to 2.6% at December 31, 2020. The discount rate used to value our post-employment benefit obligations at March 31, 2020 was 4.2% compared to 3.1% at December 31, 2019. |
BCE INC. 2021 FIRST QUARTER SHAREHOLDER REPORT | 35
Table of Contents
Consolidated financial statements
CONSOLIDATED STATEMENTS OF FINANCIAL POSITION
| (IN MILLIONS OF CANADIAN DOLLARS) (UNAUDITED) | NOTE | MARCH 31, 2021 | DECEMBER 31, 2020 | |||||||||
| ASSETS |
||||||||||||
| Current assets |
||||||||||||
| Cash |
1,907 | 224 | ||||||||||
| Cash equivalents |
700 | – | ||||||||||
| Trade and other receivables |
3,247 | 3,528 | ||||||||||
| Inventory |
459 | 439 | ||||||||||
| Contract assets |
563 | 687 | ||||||||||
| Contract costs |
424 | 402 | ||||||||||
| Prepaid expenses |
345 | 209 | ||||||||||
| Other current assets |
8 | 244 | 199 | |||||||||
| Total current assets |
7,889 | 5,688 | ||||||||||
| Non-current assets |
||||||||||||
| Contract assets |
236 | 256 | ||||||||||
| Contract costs |
344 | 362 | ||||||||||
| Property, plant and equipment |
27,370 | 27,513 | ||||||||||
| Intangible assets |
13,227 | 13,102 | ||||||||||
| Deferred tax assets |
107 | 106 | ||||||||||
| Investments in associates and joint ventures |
745 | 756 | ||||||||||
| Post-employment benefit assets |
10 | 2,601 | 1,277 | |||||||||
| Other non-current assets |
8 | 1,124 | 1,001 | |||||||||
| Goodwill |
10,606 | 10,604 | ||||||||||
| Total non-current assets |
56,360 | 54,977 | ||||||||||
| Total assets |
64,249 | 60,665 | ||||||||||
| LIABILITIES |
||||||||||||
| Current liabilities |
||||||||||||
| Trade payables and other liabilities |
3,723 | 3,935 | ||||||||||
| Contract liabilities |
762 | 717 | ||||||||||
| Interest payable |
181 | 222 | ||||||||||
| Dividends payable |
804 | 766 | ||||||||||
| Current tax liabilities |
271 | 214 | ||||||||||
| Debt due within one year |
9 | 3,786 | 2,417 | |||||||||
| Total current liabilities |
9,527 | 8,271 | ||||||||||
| Non-current liabilities |
||||||||||||
| Contract liabilities |
242 | 242 | ||||||||||
| Long-term debt |
9 | 24,965 | 23,906 | |||||||||
| Deferred tax liabilities |
4,285 | 3,810 | ||||||||||
| Post-employment benefit obligations |
10 | 1,723 | 1,962 | |||||||||
| Other non-current liabilities |
1,141 | 1,145 | ||||||||||
| Total non-current liabilities |
32,356 | 31,065 | ||||||||||
| Total liabilities |
41,883 | 39,336 | ||||||||||
| EQUITY |
||||||||||||
| Equity attributable to BCE shareholders |
||||||||||||
| Preferred shares |
4,003 | 4,003 | ||||||||||
| Common shares |
20,400 | 20,390 | ||||||||||
| Contributed surplus |
1,154 | 1,174 | ||||||||||
| Accumulated other comprehensive income |
163 | 103 | ||||||||||
| Deficit |
(3,693 | ) | (4,681 | ) | ||||||||
| Total equity attributable to BCE shareholders |
22,027 | 20,989 | ||||||||||
| Non-controlling interest |
339 | 340 | ||||||||||
| Total equity |
22,366 | 21,329 | ||||||||||
| Total liabilities and equity |
64,249 | 60,665 | ||||||||||
36 | BCE INC. 2021 FIRST QUARTER SHAREHOLDER REPORT
Table of Contents
Consolidated financial statements
CONSOLIDATED STATEMENTS OF CHANGES IN EQUITY
| ATTRIBUTABLE TO BCE SHAREHOLDERS | ||||||||||||||||||||||||||||||||
| FOR THE PERIOD ENDED MARCH 31, 2021 (IN MILLIONS OF CANADIAN DOLLARS) (UNAUDITED) |
PREFERRED SHARES |
COMMON SHARES |
CONTRI- BUTED |
ACCUM- ULATED OTHER COMPRE- HENSIVE INCOME |
DEFICIT | TOTAL | NON- CONTROL- LING INTEREST |
TOTAL EQUITY |
||||||||||||||||||||||||
| Balance at December 31, 2020 |
4,003 | 20,390 | 1,174 | 103 | (4,681 | ) | 20,989 | 340 | 21,329 | |||||||||||||||||||||||
| Net earnings |
– | – | – | – | 674 | 674 | 13 | 687 | ||||||||||||||||||||||||
| Other comprehensive income |
– | – | – | 56 | 1,145 | 1,201 | – | 1,201 | ||||||||||||||||||||||||
| Total comprehensive income |
– | – | – | 56 | 1,819 | 1,875 | 13 | 1,888 | ||||||||||||||||||||||||
| Common shares issued under employee stock option plan |
– | 10 | (1 | ) | – | – | 9 | – | 9 | |||||||||||||||||||||||
| Other share-based compensation |
– | – | (19 | ) | – | (8 | ) | (27 | ) | – | (27 | ) | ||||||||||||||||||||
| Dividends declared on BCE common and preferred shares |
– | – | – | – | (823 | ) | (823 | ) | – | (823 | ) | |||||||||||||||||||||
| Dividends declared by subsidiaries to non-controlling interest |
– | – | – | – | – | – | (13 | ) | (13 | ) | ||||||||||||||||||||||
| Settlement of cash flow hedges transferred to the cost basis of hedged items |
– | – | – | 4 | – | 4 | – | 4 | ||||||||||||||||||||||||
| Other |
– | – | – | – | – | – | (1 | ) | (1 | ) | ||||||||||||||||||||||
| Balance at March 31, 2021 |
4,003 | 20,400 | 1,154 | 163 | (3,693 | ) | 22,027 | 339 | 22,366 | |||||||||||||||||||||||
|
|
||||||||||||||||||||||||||||||||
| ATTRIBUTABLE TO BCE SHAREHOLDERS | ||||||||||||||||||||||||||||||||
| FOR THE PERIOD ENDED MARCH 31, 2020 (IN MILLIONS OF CANADIAN DOLLARS) (UNAUDITED) |
PREFERRED SHARES |
COMMON SHARES |
CONTRI- BUTED SURPLUS |
ACCUM- (LOSS) |
DEFICIT | TOTAL | NON- CONTROL- LING INTEREST |
TOTAL EQUITY |
||||||||||||||||||||||||
| Balance at December 31, 2019 |
4,004 | 20,363 | 1,178 | 161 | (4,632 | ) | 21,074 | 334 | 21,408 | |||||||||||||||||||||||
| Net earnings |
– | – | – | – | 718 | 718 | 15 | 733 | ||||||||||||||||||||||||
| Other comprehensive income |
– | – | – | 368 | 1,730 | 2,098 | 5 | 2,103 | ||||||||||||||||||||||||
| Total comprehensive income |
– | – | – | 368 | 2,448 | 2,816 | 20 | 2,836 | ||||||||||||||||||||||||
| Common shares issued under employee stock option plan |
– | 23 | (1 | ) | – | – | 22 | – | 22 | |||||||||||||||||||||||
| Other share-based compensation |
– | – | (21 | ) | – | (15 | ) | (36 | ) | – | (36 | ) | ||||||||||||||||||||
| Dividends declared on BCE common and preferred shares |
– | – | – | – | (791 | ) | (791 | ) | – | (791 | ) | |||||||||||||||||||||
| Dividends declared by subsidiaries to non-controlling interest |
– | – | – | – | – | – | (14 | ) | (14 | ) | ||||||||||||||||||||||
| Settlement of cash flow hedges transferred to the cost basis of hedged items |
– | – | – | (1 | ) | – | (1 | ) | – | (1 | ) | |||||||||||||||||||||
| Balance at March 31, 2020 |
4,004 | 20,386 | 1,156 | 528 | (2,990 | ) | 23,084 | 340 | 23,424 | |||||||||||||||||||||||
BCE INC. 2021 FIRST QUARTER SHAREHOLDER REPORT | 37
Table of Contents
Consolidated financial statements
CONSOLIDATED STATEMENTS OF CASH FLOWS
| FOR THE PERIOD ENDED MARCH 31 (IN MILLIONS OF CANADIAN DOLLARS) (UNAUDITED) |
NOTE | 2021 | 2020 | |||||||||
| Cash flows from operating activities |
||||||||||||
| Net earnings from continuing operations |
687 | 728 | ||||||||||
| Adjustments to reconcile net earnings from continuing operations to cash flows from operating activities |
||||||||||||
| Severance, acquisition and other costs |
5 | 89 | 16 | |||||||||
| Depreciation and amortization |
1,133 | 1,088 | ||||||||||
| Post-employment benefit plans cost |
10 | 79 | 87 | |||||||||
| Net interest expense |
263 | 270 | ||||||||||
| Impairment of assets |
3 | 7 | ||||||||||
| Income taxes |
253 | 243 | ||||||||||
| Contributions to post-employment benefit plans |
(79 | ) | (79 | ) | ||||||||
| Payments under other post-employment benefit plans |
(15 | ) | (17 | ) | ||||||||
| Severance and other costs paid |
(43 | ) | (35 | ) | ||||||||
| Interest paid |
(306 | ) | (316 | ) | ||||||||
| Income taxes paid (net of refunds) |
(109 | ) | (233 | ) | ||||||||
| Acquisition and other costs paid |
(4 | ) | (9 | ) | ||||||||
| Change in contract assets |
144 | 155 | ||||||||||
| Change in wireless device financing plan receivables |
(91 | ) | (76 | ) | ||||||||
| Net change in operating assets and liabilities |
(12 | ) | (400 | ) | ||||||||
| Cash from discontinued operations |
– | 22 | ||||||||||
| Cash flows from operating activities |
1,992 | 1,451 | ||||||||||
| Cash flows used in investing activities |
||||||||||||
| Capital expenditures |
(1,012 | ) | (777 | ) | ||||||||
| Other investing activities |
(21 | ) | (6 | ) | ||||||||
| Cash used in discontinued operations |
– | (7 | ) | |||||||||
| Cash flows used in investing activities |
(1,033 | ) | (790 | ) | ||||||||
| Cash flows from financing activities |
||||||||||||
| Decrease in notes payable and bank advances |
(357 | ) | (230 | ) | ||||||||
| (Decrease) increase in securitized trade receivables |
(13 | ) | 400 | |||||||||
| Issue of long-term debt |
9 | 2,915 | 3,281 | |||||||||
| Repayment of long-term debt |
(226 | ) | (709 | ) | ||||||||
| Issue of common shares |
10 | 22 | ||||||||||
| Purchase of shares for settlement of share-based payments |
(91 | ) | (94 | ) | ||||||||
| Cash dividends paid on common shares |
(753 | ) | (716 | ) | ||||||||
| Cash dividends paid on preferred shares |
(31 | ) | (36 | ) | ||||||||
| Cash dividends paid by subsidiaries to non-controlling interest |
(13 | ) | (14 | ) | ||||||||
| Other financing activities |
(17 | ) | (30 | ) | ||||||||
| Cash used in discontinued operations |
– | (1 | ) | |||||||||
| Cash flows from financing activities |
1,424 | 1,873 | ||||||||||
| Net increase in cash |
1,683 | 802 | ||||||||||
| Cash at beginning of period |
224 | 141 | ||||||||||
| Cash at end of period |
1,907 | 943 | ||||||||||
| Net increase in cash equivalents |
700 | 1,732 | ||||||||||
| Cash equivalents at beginning of period |
– | 4 | ||||||||||
| Cash equivalents at end of period |
700 | 1,736 | ||||||||||
38 | BCE INC. 2021 FIRST QUARTER SHAREHOLDER REPORT
Table of Contents
Notes to consolidated financial statements
Notes to consolidated financial statements
These consolidated interim financial statements (financial statements) should be read in conjunction with BCE’s 2020 annual consolidated financial statements, approved by BCE’s board of directors on March 4, 2021.
These notes are unaudited.
We, us, our, BCE and the company mean, as the context may require, either BCE Inc. or, collectively, BCE Inc., Bell Canada, their subsidiaries, joint arrangements and associates.
Note 1 | Corporate information
BCE is incorporated and domiciled in Canada. BCE’s head office is located at 1, Carrefour Alexander-Graham-Bell, Verdun, Québec, Canada. BCE is a telecommunications and media company providing wireless, wireline, Internet and television (TV) services to residential, business and wholesale customers in Canada. Our Bell Media segment provides conventional TV, specialty TV, pay TV, streaming services, digital media services, radio broadcasting services and out-of-home advertising services to customers in Canada.
Note 2 | Basis of presentation and significant accounting policies
These financial statements were prepared in accordance with International Financial Reporting Standards (IFRS), as issued by the International Accounting Standards Board (IASB), under International Accounting Standard (IAS) 34 – Interim Financial Reporting and were approved by BCE’s board of directors on April 28, 2021. These financial statements were prepared using the same basis of presentation, accounting policies and methods of computation as outlined in Note 2, Significant accounting policies in our consolidated financial statements for the year ended December 31, 2020.
These financial statements do not include all of the notes required in annual financial statements.
All amounts are in millions of Canadian dollars, except where noted.
FUTURE CHANGES TO ACCOUNTING STANDARDS
The following amendments to standards issued by the IASB have not yet been adopted by BCE.
| STANDARD |
DESCRIPTION |
IMPACT |
EFFECTIVE DATE | |||
| Onerous Contracts – Cost of Fulfilling a Contract, Amendments to IAS 37 – Provisions, Contingent Liabilities and Contingent Assets | These amendments clarify which costs should be included in determining the cost of fulfilling a contract when assessing whether a contract is onerous.
|
We are currently assessing the impact of these amendments. | Effective for annual reporting periods beginning on or after January 1, 2022. Early application is permitted. | |||
| Disclosure of Accounting Policies – Amendments to IAS 1 – Presentation of Financial Statements | These amendments require that entities disclose material accounting policies, as defined, instead of significant accounting policies. | We are currently assessing the impact of these amendments on the disclosure of our accounting policies. | Effective for annual reporting periods beginning on or after January 1, 2023. Early application is permitted.
| |||
BCE INC. 2021 FIRST QUARTER SHAREHOLDER REPORT | 39
Table of Contents
Notes to consolidated financial statements
Note 3 | Segmented information
Our results are reported in three segments: Bell Wireless, Bell Wireline and Bell Media. Our segments reflect how we manage our business and how we classify our operations for planning and measuring performance.
The following tables present financial information by segment for the three month periods ended March 31, 2021 and 2020.
| FOR THE THREE MONTH PERIOD ENDED MARCH 31, 2021 | NOTE |
BELL WIRELESS |
BELL WIRELINE |
BELL MEDIA |
INTERSEGMENT ELIMINATIONS |
BCE | ||||||||||||||||||
| Operating revenues |
||||||||||||||||||||||||
| External customers |
2,087 | 2,996 | 623 | – | 5,706 | |||||||||||||||||||
| Inter-segment |
13 | 85 | 90 | (188 | ) | – | ||||||||||||||||||
| Total operating revenues |
2,100 | 3,081 | 713 | (188 | ) | 5,706 | ||||||||||||||||||
| Operating costs |
4 | (1,177 | ) | (1,718 | ) | (570 | ) | 188 | (3,277 | ) | ||||||||||||||
| Segment profit (1) |
923 | 1,363 | 143 | – | 2,429 | |||||||||||||||||||
| Severance, acquisition and other costs |
5 | (89 | ) | |||||||||||||||||||||
| Depreciation and amortization |
(1,133 | ) | ||||||||||||||||||||||
| Finance costs |
||||||||||||||||||||||||
| Interest expense |
(267 | ) | ||||||||||||||||||||||
| Interest on post-employment benefit obligations |
10 | (5 | ) | |||||||||||||||||||||
| Impairment of assets |
(3 | ) | ||||||||||||||||||||||
| Other income |
6 | 8 | ||||||||||||||||||||||
| Income taxes |
(253 | ) | ||||||||||||||||||||||
| Net earnings |
687 | |||||||||||||||||||||||
| (1) The chief operating decision maker uses primarily one measure of profit to make decisions and assess performance, being operating revenues less operating costs.
|
| |||||||||||||||||||||||
| FOR THE THREE MONTH PERIOD ENDED MARCH 31, 2020 |
NOTE |
BELL WIRELESS |
BELL WIRELINE |
BELL MEDIA |
INTERSEGMENT ELIMINATIONS |
BCE |
||||||||||||||||||
| Operating revenues |
||||||||||||||||||||||||
| External customers |
2,022 | 2,960 | 658 | – | 5,640 | |||||||||||||||||||
| Inter-segment |
13 | 76 | 94 | (183 | ) | – | ||||||||||||||||||
| Total operating revenues |
2,035 | 3,036 | 752 | (183 | ) | 5,640 | ||||||||||||||||||
| Operating costs |
4 | (1,107 | ) | (1,701 | ) | (597 | ) | 183 | (3,222 | ) | ||||||||||||||
| Segment profit (1) |
928 | 1,335 | 155 | – | 2,418 | |||||||||||||||||||
| Severance, acquisition and other costs |
5 | (16 | ) | |||||||||||||||||||||
| Depreciation and amortization |
(1,088 | ) | ||||||||||||||||||||||
| Finance costs |
||||||||||||||||||||||||
| Interest expense |
(277 | ) | ||||||||||||||||||||||
| Interest on post-employment benefit obligations |
10 | (12 | ) | |||||||||||||||||||||
| Impairment of assets |
(7 | ) | ||||||||||||||||||||||
| Other expense |
6 | (47 | ) | |||||||||||||||||||||
| Income taxes |
(243 | ) | ||||||||||||||||||||||
| Net earnings from continuing operations |
728 | |||||||||||||||||||||||
| Net earnings from discontinued operations |
5 | |||||||||||||||||||||||
| Net earnings |
733 | |||||||||||||||||||||||
| (1) | The chief operating decision maker uses primarily one measure of profit to make decisions and assess performance, being operating revenues less operating costs. |
40 | BCE INC. 2021 FIRST QUARTER SHAREHOLDER REPORT
Table of Contents
Notes to consolidated financial statements
REVENUES BY SERVICES AND PRODUCTS
| FOR THE PERIOD ENDED MARCH 31 | 2021 | 2020 | ||||||
| Services (1) |
||||||||
| Wireless |
1,503 | 1,535 | ||||||
| Wireline data |
1,965 | 1,891 | ||||||
| Wireline voice |
803 | 872 | ||||||
| Media |
623 | 658 | ||||||
| Other wireline services |
74 | 62 | ||||||
| Total services |
4,968 | 5,018 | ||||||
| Products (2) |
||||||||
| Wireless |
584 | 487 | ||||||
| Wireline data |
144 | 123 | ||||||
| Wireline equipment and other |
10 | 12 | ||||||
| Total products |
738 | 622 | ||||||
| Total operating revenues |
5,706 | 5,640 | ||||||
| (1) | Our service revenues are generally recognized over time. |
| (2) | Our product revenues are generally recognized at a point in time. |
| FOR THE PERIOD ENDED MARCH 31 | NOTE | 2021 | 2020 | |||||||||
| Labour costs |
||||||||||||
| Wages, salaries and related taxes and benefits |
(1,034 | ) | (1,041 | ) | ||||||||
| Post-employment benefit plans service cost (net of capitalized amounts) |
10 | (74 | ) | (75 | ) | |||||||
| Other labour costs (1) |
(239 | ) | (227 | ) | ||||||||
| Less: |
||||||||||||
| Capitalized labour |
255 | 246 | ||||||||||
| Total labour costs |
(1,092 | ) | (1,097 | ) | ||||||||
| Cost of revenues (2) |
(1,742 | ) | (1,654 | ) | ||||||||
| Other operating costs (3) |
(443 | ) | (471 | ) | ||||||||
| Total operating costs |
(3,277 | ) | (3,222 | ) | ||||||||
| (1) | Other labour costs include contractor and outsourcing costs. |
| (2) | Cost of revenues includes costs of wireless devices and other equipment sold, network and content costs, and payments to other carriers. |
| (3) | Other operating costs include marketing, advertising and sales commission costs, bad debt expense, taxes other than income taxes, information technology costs, professional service fees and rent. |
Note 5 | Severance, acquisition and other costs
| FOR THE PERIOD ENDED MARCH 31 | 2021 | 2020 | ||||||
| Severance |
(97 | ) | (8 | ) | ||||
| Acquisition and other |
8 | (8 | ) | |||||
| Total severance, acquisition and other costs |
(89 | ) | (16 | ) | ||||
SEVERANCE COSTS
Severance costs consist of charges related to involuntary and voluntary employee terminations.
ACQUISITION AND OTHER COSTS
Acquisition and other costs consist of transaction costs, such as legal and financial advisory fees, related to completed or potential acquisitions, employee severance costs related to the purchase of a business, the costs to integrate acquired companies into our operations, costs relating to litigation and regulatory decisions, when they are significant, and other costs.
BCE INC. 2021 FIRST QUARTER SHAREHOLDER REPORT | 41
Table of Contents
Notes to consolidated financial statements
Note 6 | Other income (expense)
| FOR THE PERIOD ENDED MARCH 31 | NOTE | 2021 | 2020 | |||||||||
| Net mark-to-market gains (losses) on derivatives used to economically hedge equity settled share-based compensation plans |
60 | (28 | ) | |||||||||
| Early debt redemption costs |
9 | (53 | ) | (17 | ) | |||||||
| Equity (losses) gains from investments in associates and joint ventures |
||||||||||||
| Gain on investment (1) |
– | 10 | ||||||||||
| Operations |
(13 | ) | 9 | |||||||||
| Losses on retirements and disposals of property, plant and equipment and intangible assets |
(5 | ) | (16 | ) | ||||||||
| Other |
19 | (5 | ) | |||||||||
| Total other income (expense) |
8 | (47 | ) | |||||||||
| (1) | The $10 million gain in 2020 represents BCE’s share of an obligation to repurchase at fair value the minority interest in one of BCE’s joint ventures. The obligation is marked to market each reporting period and the gain or loss on investment is recorded as equity gains or losses from investments in associates and joint ventures. |
The following table shows the components used in the calculation of basic and diluted net earnings per common share for earnings attributable to common shareholders.
| FOR THE PERIOD ENDED MARCH 31 | 2021 | 2020 | ||||||
| Net earnings from continuing operations attributable to common shareholders – basic |
642 | 675 | ||||||
| Net earnings from discontinued operations attributable to common shareholders – basic |
– | 5 | ||||||
| Net earnings attributable to common shareholders – basic |
642 | 680 | ||||||
| Dividends declared per common share (in dollars) |
0.8750 | 0.8325 | ||||||
| Weighted average number of common shares outstanding (in millions) |
||||||||
| Weighted average number of common shares outstanding – basic |
904.5 | 904.1 | ||||||
| Assumed exercise of stock options (1) |
– | 0.4 | ||||||
| Weighted average number of common shares outstanding – diluted (in millions) |
904.5 | 904.5 | ||||||
| (1) | The calculation of the assumed exercise of stock options includes the effect of the average unrecognized future compensation cost of dilutive options. It excludes options for which the exercise price is higher than the average market value of a BCE common share. The number of excluded options was 15,031,826 for the first quarter of 2021, compared to 3,458,250 for the first quarter of 2020. |
In Q1 2021, we entered into a $107 million subsidy agreement with the Government of Québec to facilitate the deployment of high-speed Internet in certain areas of the province of Québec by September 2022. At the end of Q1 2021, we had received $97 million of the total committed funding, with the remainder expected upon completion of the project.
As a result, we recorded $48 million in Other current assets and $49 million in Other non-current assets as restricted cash with a corresponding liability in Trade payables and other liabilities and Other non-current liabilities, respectively, on the statement of financial position at March 31, 2021.
On March 17, 2021, Bell Canada issued, under its 1997 trust indenture, 3.00% Series M-54 medium term note (MTN) debentures, with a principal amount of $1 billion, which mature on March 17, 2031, and 4.05% Series M-55 MTN debentures, with a principal amount of $550 million, which mature on March 17, 2051.
Additionally, on March 17, 2021, Bell Canada issued, under its 2016 trust indenture, 0.75% Series US-3 Notes, with a principal amount of $600 million in U.S. dollars ($747 million in Canadian dollars), which mature on March 17, 2024, and 3.65% Series US-4 Notes, with a principal amount of $500 million in U.S. dollars ($623 million in Canadian dollars), which mature on March 17, 2051. The Series US-3 and Series US-4 Notes (collectively, the Notes) have been hedged for foreign currency fluctuations through cross currency interest rate swaps. See Note 11, Financial assets and liabilities, for additional details.
The MTN debentures and Notes are fully and unconditionally guaranteed by BCE.
As announced on March 18, 2021, Bell Canada redeemed, on April 19, 2021, prior to maturity, its 3.00% Series M-40 MTN debentures, having an outstanding principal amount of $1,700 million, which were due on October 3, 2022. As a result, in Q1 2021, we reclassified the Series M-40 MTN debentures from Long-term debt to Debt due within one year and recognized early debt redemption costs of $53 million, which were recorded in Other income (expense) in the income statement.
42 | BCE INC. 2021 FIRST QUARTER SHAREHOLDER REPORT
Table of Contents
Notes to consolidated financial statements
Note 10 | Post-employment benefit plans
POST-EMPLOYMENT BENEFIT PLANS COST
We provide pension and other benefits for most of our employees. These include defined benefit (DB) pension plans, defined contribution (DC) pension plans and other post-employment benefits (OPEBs).
COMPONENTS OF POST-EMPLOYMENT BENEFIT PLANS SERVICE COST
| FOR THE PERIOD ENDED MARCH 31 | 2021 | 2020 | ||||||
| DB pension |
(55 | ) | (54 | ) | ||||
| DC pension |
(36 | ) | (36 | ) | ||||
| OPEBs |
(1 | ) | (1 | ) | ||||
| Less: |
||||||||
| Capitalized benefit plans cost |
18 | 16 | ||||||
| Total post-employment benefit plans service cost |
(74 | ) | (75 | ) | ||||
| COMPONENTS OF POST-EMPLOYMENT BENEFIT PLANS FINANCING COST
|
| |||||||
| FOR THE PERIOD ENDED MARCH 31 | 2021 | 2020 | ||||||
| DB pension |
3 | (3 | ) | |||||
| OPEBs |
(8 | ) | (9 | ) | ||||
| Total interest on post-employment benefit obligations |
(5 | ) | (12 | ) | ||||
FUNDED STATUS OF POST-EMPLOYMENT BENEFIT PLANS COST
The following table shows the funded status of our post-employment benefit obligations.
| FUNDED | PARTIALLY FUNDED (1) | UNFUNDED (2) | TOTAL | |||||||||||||||||||||||||||||
| FOR THE PERIOD ENDED |
MARCH 31, 2021 |
DECEMBER 31, 2020 |
MARCH 31, 2021 |
DECEMBER 31, 2020 |
MARCH 31, 2021 |
DECEMBER 31, 2020 |
MARCH 31, 2021 |
DECEMBER 31, 2020 |
||||||||||||||||||||||||
| Present value of post-employment benefit obligations |
(23,572 | ) | (26,421 | ) | (1,816 | ) | (2,011 | ) | (287 | ) | (317 | ) | (25,675 | ) | (28,749 | ) | ||||||||||||||||
| Fair value of plan assets |
26,219 | 27,727 | 399 | 402 | – | – | 26,618 | 28,129 | ||||||||||||||||||||||||
| Plan surplus (deficit) |
2,647 | 1,306 | (1,417 | ) | (1,609 | ) | (287 | ) | (317 | ) | 943 | (620 | ) | |||||||||||||||||||
| (1) | The partially funded plans consist of supplementary executive retirement plans (SERPs) for eligible employees and certain OPEBs. The company partially funds the SERPs through letters of credit and a retirement compensation arrangement account with the Canada Revenue Agency. Certain paid-up life insurance benefits are funded through life insurance contracts. |
| (2) | Our unfunded plans consist of certain OPEBs, which are paid as claims are incurred. |
In Q1 2021, we recorded an increase in our post-employment benefit plans and a gain, before taxes, in Other comprehensive income from continuing operations of $1,565 million due to a decrease in the present value of our post-employment benefit obligations of $2,957 million as a result of an increase in the discount rate to 3.4% at March 31, 2021, compared to 2.6% at December 31, 2020, partly offset by a decrease in the fair value of plan assets of $1,392 million as a result of an actual loss on plan assets of 4.3%.
BCE INC. 2021 FIRST QUARTER SHAREHOLDER REPORT | 43
Table of Contents
Notes to consolidated financial statements
Note 11 | Financial assets and liabilities
FAIR VALUE
The following table provides the fair value details of financial instruments measured at amortized cost in the consolidated statements of financial position.
| MARCH 31, 2021 | DECEMBER 31, 2020 | |||||||||||||||||||||
| CLASSIFICATION | FAIR VALUE METHODOLOGY | CARRYING VALUE |
FAIR VALUE |
CARRYING VALUE |
FAIR VALUE |
|||||||||||||||||
| CRTC deferral account obligation | Trade payables and other liabilities and other non- current liabilities | Present value of estimated future cash flows discounted using observable market interest rates |
81 | 84 | 82 | 86 | ||||||||||||||||
| Debt securities and other debt | Debt due within one year and long-term debt | Quoted market price of debt | 23,401 | 25,776 | 20,525 | 24,366 | ||||||||||||||||
The following table provides the fair value details of financial instruments measured at fair value in the consolidated statements of financial position.
| FAIR VALUE | ||||||||||||||
| CLASSIFICATION | |
CARRYING VALUE OF ASSET (LIABILITY) |
|
QUOTED PRICES IN ACTIVE MARKETS FOR IDENTICAL ASSETS (LEVEL 1) |
OBSERVABLE MARKET DATA (LEVEL 2)(1) |
|
NON-OBSERVABLE
MARKET INPUTS (LEVEL 3)(2) |
| ||||||
| March 31, 2021 |
||||||||||||||
| Publicly-traded and privately-held investments (3) |
Other non-current assets | 125 | 3 | – | 122 | |||||||||
| Derivative financial instruments |
Other current assets, trade payables and other liabilities, other non-current assets and liabilities | 64 | – | 64 | – | |||||||||
| Maple Leaf Sports & Entertainment Ltd. (MLSE) financial liability (4) | Trade payables and other liabilities | (149 | ) | – | – | (149) | ||||||||
| Other |
Other non-current assets and liabilities | 113 | – | 171 | (58) | |||||||||
| December 31, 2020 |
||||||||||||||
| Publicly-traded and privately-held investments (3) |
Other non-current assets | 126 | 3 | – | 123 | |||||||||
| Derivative financial instruments |
Other current assets, trade payables and other liabilities, other non-current assets and liabilities | (51 | ) | – | (51) | – | ||||||||
| MLSE financial liability (4) |
Trade payables and other liabilities | (149 | ) | – | – | (149) | ||||||||
| Other |
Other non-current assets and liabilities | 109 | – | 167 | (58) | |||||||||
| (1) | Observable market data such as equity prices, interest rates, swap rate curves and foreign currency exchange rates. |
| (2) | Non-observable market inputs such as discounted cash flows and earnings multiples. A reasonable change in our assumptions would not result in a significant increase (decrease) to our level 3 financial instruments. |
| (3) | Unrealized gains and losses are recorded in Other comprehensive income from continuing operations in the consolidated statements of comprehensive income and are reclassified from Accumulated other comprehensive income to Deficit in the statements of financial position when realized. |
| (4) | Represents BCE’s obligation to repurchase the BCE Master Trust Fund’s (Master Trust Fund) 9% interest in MLSE at a price not less than an agreed minimum price should the Master Trust Fund exercise its put option. The obligation to repurchase is marked to market each reporting period and the gain or loss is recognized in Other income (expense) in the consolidated income statements. |
MARKET RISK
CURRENCY EXPOSURES
We use forward contracts, options and cross currency interest rate swaps to manage foreign currency risk related to anticipated purchases and sales and certain foreign currency debt.
In Q1 2021, we entered into cross currency interest rate swaps with notional amounts of $600 million in U.S. dollars ($749 million in Canadian dollars) and $500 million in U.S. dollars ($637 million in Canadian dollars) to hedge the U.S. currency exposure of our US-3 Notes maturing in 2024 and our US-4 Notes maturing in 2051, respectively. See Note 9, Debt, for additional details.
A 10% depreciation (appreciation) in the value of the Canadian dollar relative to the U.S. dollar would result in a gain (loss) of nil ($15 million) recognized in net earnings from continuing operations at March 31, 2021 and a gain (loss) of $202 million ($188 million) recognized in Other comprehensive income from continuing operations at March 31, 2021, with all other variables held constant.
A 10% depreciation (appreciation) in the value of the Canadian dollar relative to the Philippines Peso would result in a gain (loss) of $5 million recognized in Other comprehensive income from continuing operations at March 31, 2021, with all other variables held constant.
44 | BCE INC. 2021 FIRST QUARTER SHAREHOLDER REPORT
Table of Contents
Notes to consolidated financial statements
The following table provides further details on our outstanding foreign currency forward contracts and options as at March 31, 2021.
| TYPE OF HEDGE | BUY CURRENCY |
AMOUNT TO RECEIVE |
SELL CURRENCY |
AMOUNT TO PAY |
MATURITY | HEDGED ITEM | ||||||||||||||||||
| Cash flow |
USD | 516 | CAD | 678 | 2021 | Anticipated transactions | ||||||||||||||||||
| Cash flow |
PHP | 2,756 | CAD | 73 | 2021 | Anticipated transactions | ||||||||||||||||||
| Cash flow |
USD | 479 | CAD | 614 | 2022 | Anticipated transactions | ||||||||||||||||||
| Cash flow |
USD | 120 | CAD | 150 | 2023 | Anticipated transactions | ||||||||||||||||||
| Cash flow – call options |
USD | 231 | CAD | 299 | 2022 | Anticipated transactions | ||||||||||||||||||
| Cash flow – put options |
USD | 231 | CAD | 295 | 2022 | Anticipated transactions | ||||||||||||||||||
| Economic |
USD | 100 | CAD | 136 | 2021 | Anticipated transactions | ||||||||||||||||||
| Economic – call options |
USD | 3 | CAD | 4 | 2021 | Anticipated transactions | ||||||||||||||||||
| Economic – call options |
CAD | 4 | USD | 3 | 2021 | Anticipated transactions | ||||||||||||||||||
| Economic – put options |
USD | 90 | CAD | 116 | 2021 | Anticipated transactions | ||||||||||||||||||
| Economic – put options |
USD | 99 | CAD | 123 | 2022 | Anticipated transactions | ||||||||||||||||||
INTEREST RATE EXPOSURES
We use interest rate options to economically hedge the dividend rate resets on $450 million of our preferred shares having varying reset dates in 2021. The fair value of these interest rate options at March 31, 2021 was a net asset of $9 million (December 31, 2020 – net liability of $6 million), recognized in Other current assets, Trade payables and other liabilities, and Other non-current liabilities in the consolidated statements of financial position. A gain of $16 million for the three months ended March 31, 2021 relating to these interest rate options is recognized in Other income (expense) in the consolidated income statements.
A 1% increase (decrease) in interest rates would result in an increase (decrease) of $10 million ($13 million) in net earnings from continuing operations at March 31, 2021.
EQUITY PRICE EXPOSURES
We use equity forward contracts on BCE’s common shares to economically hedge the cash flow exposure related to the settlement of equity settled share-based compensation plans and the equity price risk related to a cash-settled share-based payment plan. The fair value of our equity forward contracts at March 31, 2021 and December 31, 2020 was a net liability of $32 million and $82 million, respectively, recognized in Other current assets, Trade payables and other liabilities, Other non-current assets and Other non-current liabilities in the consolidated statements of financial position. A gain of $60 million for the three months ended March 31, 2021 relating to these equity forward contracts is recognized in Other income (expense) in the consolidated income statements.
A 5% increase (decrease) in the market price of BCE’s common shares at March 31, 2021 would result in a gain (loss) of $40 million recognized in net earnings from continuing operations, with all other variables held constant.
COMMODITY PRICE EXPOSURE
We use fuel swaps to economically hedge the purchase cost of fuel in 2021. The fair value of our fuel swaps at March 31, 2021 and December 31, 2020 was an asset of $6 million and $3 million, respectively, recognized in Other current assets in the consolidated statements of financial position. A gain of $4 million for the three months ended March 31, 2021 relating to these fuel swaps is recognized in Other income (expense) in the consolidated income statements.
A 25% increase (decrease) in the market price of fuel at March 31, 2021 would result in a gain (loss) of $3 million relating to fuel swaps recognized in net earnings from continuing operations, with all other variables held constant.
CONVERSION AND DIVIDEND RATE RESET OF FIRST PREFERRED SHARES
On March 31, 2021, 42,423 of BCE’s 9,542,615 fixed-rate Cumulative Redeemable First Preferred Shares, Series AM (Series AM Preferred Shares) were converted, on a one-for-one basis, into floating-rate Cumulative Redeemable First Preferred Shares, Series AN (Series AN Preferred Shares). In addition, on the same date, 939,786 of BCE’s 1,952,085 Series AN Preferred Shares were converted, on a one-for-one basis, into Series AM Preferred Shares.
The annual fixed dividend rate on BCE’s Series AM Preferred Shares was reset for the next five years, effective March 31, 2021, at 2.939%. The Series AN Preferred Shares continue to pay a quarterly floating cash dividend.
On April 22, 2021, BCE announced that 105,430 of its 4,984,851 fixed-rate Cumulative Redeemable First Preferred Shares, Series AG (Series AG Preferred Shares) have been tendered for conversion on May 1, 2021, on a one-for-one basis, into floating-rate Cumulative Redeemable First Preferred Shares, Series AH (Series AH Preferred Shares). In addition, 4,100,109 of BCE’s 9,012,249 Series AH Preferred Shares have been tendered for conversion on May 1, 2021, on a one-for-one basis, into Series AG Preferred Shares.
The annual fixed dividend rate on BCE’s Series AG Preferred Shares was reset for the next five years, effective May 1, 2021, at 3.37%. The Series AH Preferred Shares will continue to pay a monthly floating cash dividend.
Dividends will be paid as and when declared by the board of directors of BCE.
BCE INC. 2021 FIRST QUARTER SHAREHOLDER REPORT | 45
Table of Contents
Notes to consolidated financial statements
Note 13 | Share-based payments
The following share-based payment amounts are included in the income statements as operating costs.
| FOR THE PERIOD ENDED MARCH 31 | 2021 | 2020 | ||||||
| Employee savings plan |
(8 | ) | (8 | ) | ||||
| Restricted share units (RSUs) and performance share units (PSUs) |
(20 | ) | (16 | ) | ||||
| Other (1) |
(2 | ) | (3 | ) | ||||
| Total share-based payments |
(30 | ) | (27 | ) | ||||
| (1) | Includes deferred share plan, deferred share units and stock options. |
The following tables summarize the change in outstanding RSUs/PSUs and stock options for the period ended March 31, 2021.
RSUs/PSUs
|
NUMBER OF RSUs/PSUs |
||||
| Outstanding, January 1, 2021 |
2,973,393 | |||
| Granted |
1,161,035 | |||
| Dividends credited |
44,329 | |||
| Settled |
(1,085,424 | ) | ||
| Forfeited |
(27,829 | ) | ||
| Outstanding, March 31, 2021 |
3,065,504 | |||
STOCK OPTIONS
| NUMBER OF OPTIONS |
WEIGHTED AVERAGE EXERCISE PRICE ($) |
|||||||
| Outstanding, January 1, 2021 |
15,650,234 | 59 | ||||||
| Exercised (1) |
(199,928 | ) | 48 | |||||
| Forfeited or expired |
(159,042 | ) | 60 | |||||
| Outstanding, March 31, 2021 |
15,291,264 | 59 | ||||||
| Exercisable, March 31, 2021 |
8,708,876 | 57 | ||||||
| (1) | The weighted average market share price for options exercised during the three months ended March 31, 2021 was $56. |
The COVID-19 pandemic continued to unfavourably impact our financial and operating performance in the first quarter of 2021 as emergency measures were first introduced in the second half of March 2020. Our Bell Wireless and Bell Media segments continued to be adversely affected in the quarter with a more pronounced impact on media advertising revenues and wireless outbound roaming revenues. Depending on the severity and duration of the COVID-19 pandemic, including the number and intensity of resurgences in COVID-19 cases, the prevalence of variants, the timely distribution of effective vaccines and the scope and duration of measures adopted to combat the pandemic, our operations and financial results could continue to be significantly and negatively impacted in future periods. It is difficult at this time to estimate the magnitude of such future impacts.
46 | BCE INC. 2021 FIRST QUARTER SHAREHOLDER REPORT
Table of Contents
| This document has been filed by BCE Inc. with the Canadian provincial securities regulatory authorities and the U.S. Securities and Exchange Commission. It can be found on BCE Inc.’s website at BCE.ca, on SEDAR at www.sedar.com and on EDGAR at www.sec.gov or is available upon request from: |
For further information concerning BCE Inc.’s Dividend Reinvestment and Stock Purchase Plan (DRP), direct deposit of dividend payments, the elimination of multiple mailings or the receipt of quarterly reports, please contact: |
| ||
| AST TRUST COMPANY (CANADA) | ||||
| INVESTOR RELATIONS |
1 Toronto Street, Suite 1200 | |||
| Building A, 8th floor |
Toronto, Ontario M5C 2V6 | |||
| 1 Carrefour Alexander-Graham-Bell Verdun, Québec H3E 3B3 |
e-mail: [email protected] tel: 416 682-3861 or 1 800 561-0934 | |||
|
e-mail: [email protected] |
fax: 514 985-8843 or 1 888 249-6189 | |||
| tel: 1-800-339-6353 |
||||
| fax: 514-786-3970
|
||||
| BCE.ca
|
||||
| For additional copies of this document, please contact investor relations. |
||||
|
Pour obtenir un exemplaire de la version française de ce document, contactez les Relations avec les investisseurs. |

Table of Contents

Exhibit 99.2

| ||
| Q1 | Supplementary Financial Information First Quarter 2021 | |
| BCE Investor Relations Thane Fotopoulos 514-870-4619 |

| |
BCE (1)
Consolidated Operational Data
| (In millions of Canadian dollars, except share amounts) (unaudited) | Q1 2021 |
Q1 2020 |
$ change | % change | ||||||||||||||
| Operating revenues |
||||||||||||||||||
| Service |
4,968 | 5,018 | (50 | ) | (1.0%) | |||||||||||||
| Product |
738 | 622 | 116 | 18.6% | ||||||||||||||
| Total operating revenues |
5,706 | 5,640 | 66 | 1.2% | ||||||||||||||
| Operating costs (A) |
(3,203 | ) | (3,147 | ) | (56 | ) | (1.8%) | |||||||||||
| Post-employment benefit plans service cost |
(74 | ) | (75 | ) | 1 | 1.3% | ||||||||||||
| Adjusted EBITDA (2) |
2,429 | 2,418 | 11 | 0.5% | ||||||||||||||
| Adjusted EBITDA margin (2) |
42.6% | 42.9% | (0.3) pts | |||||||||||||||
| Severance, acquisition and other costs |
(89 | ) | (16 | ) | (73 | ) | n.m. | |||||||||||
| Depreciation |
(895 | ) | (858 | ) | (37 | ) | (4.3%) | |||||||||||
| Amortization |
(238 | ) | (230 | ) | (8 | ) | (3.5%) | |||||||||||
| Finance costs |
||||||||||||||||||
| Interest expense |
(267 | ) | (277 | ) | 10 | 3.6% | ||||||||||||
| Interest on post-employment benefit obligations |
(5 | ) | (12 | ) | 7 | 58.3% | ||||||||||||
| Impairment of assets |
(3 | ) | (7 | ) | 4 | 57.1% | ||||||||||||
| Other income (expense) |
8 | (47 | ) | 55 | n.m. | |||||||||||||
| Income taxes |
(253 | ) | (243 | ) | (10 | ) | (4.1%) | |||||||||||
| Net earnings from continuing operations |
687 | 728 | (41 | ) | (5.6%) | |||||||||||||
| Net earnings from discontinued operations |
– | 5 | (5 | ) | (100.0%) | |||||||||||||
| Net earnings |
687 | 733 | (46 | ) | (6.3%) | |||||||||||||
| Net earnings from continuing operations attributable to: |
||||||||||||||||||
| Common shareholders |
642 | 675 | (33 | ) | (4.9%) | |||||||||||||
| Preferred shareholders |
32 | 38 | (6 | ) | (15.8%) | |||||||||||||
| Non-controlling interest |
13 | 15 | (2 | ) | (13.3%) | |||||||||||||
| Net earnings from continuing operations |
687 | 728 | (41 | ) | (5.6%) | |||||||||||||
| Net earnings attributable to: |
||||||||||||||||||
| Common shareholders |
642 | 680 | (38 | ) | (5.6%) | |||||||||||||
| Preferred shareholders |
32 | 38 | (6 | ) | (15.8%) | |||||||||||||
| Non-controlling interest |
13 | 15 | (2 | ) | (13.3%) | |||||||||||||
| Net earnings |
687 | 733 | (46 | ) | (6.3%) | |||||||||||||
| Net earnings per common share - basic and diluted |
||||||||||||||||||
| Continuing operations |
$ | 0.71 | $ | 0.74 | $ | (0.03 | ) | (4.1%) | ||||||||||
| Discontinued operations |
$ | - | $ | 0.01 | $ | (0.01 | ) | (100.0%) | ||||||||||
| Net earnings per common share - basic and diluted |
$ | 0.71 | $ | 0.75 | $ | (0.04 | ) | (5.3%) | ||||||||||
| Dividends per common share |
$ | 0.8750 | $ | 0.8325 | $ | 0.0425 | 5.1% | |||||||||||
| Weighted average number of common shares outstanding - basic (millions) |
904.5 | 904.1 | ||||||||||||||||
| Weighted average number of common shares outstanding - diluted (millions) |
904.5 | 904.5 | ||||||||||||||||
| Number of common shares outstanding (millions) |
904.6 | 904.3 | ||||||||||||||||
| Adjusted net earnings and EPS |
||||||||||||||||||
| Net earnings attributable to common shareholders |
642 | 680 | (38 | ) | (5.6%) | |||||||||||||
| Severance, acquisition and other costs |
65 | 12 | 53 | n.m. | ||||||||||||||
| Net mark-to-market (gains) losses on derivatives used to economically hedge equity settled share-based compensation plans |
(44 | ) | 20 | (64 | ) | n.m. | ||||||||||||
| Net gains on investments |
- | (10 | ) | 10 | 100.0% | |||||||||||||
| Early debt redemption costs |
39 | 12 | 27 | n.m. | ||||||||||||||
| Impairment of assets |
2 | 5 | (3 | ) | (60.0%) | |||||||||||||
| Net earnings from discontinued operations |
- | (5 | ) | 5 | 100.0% | |||||||||||||
| Adjusted net earnings (2) |
704 | 714 | (10 | ) | (1.4%) | |||||||||||||
| Adjusted EPS (2) |
$ | 0.78 | $ | 0.79 | $ | (0.01 | ) | (1.3%) | ||||||||||
n.m. : not meaningful
(A) Excludes post-employment benefit plans service cost
BCE Supplementary Financial Information - First Quarter 2021 Page 2
BCE
Consolidated Operational Data - Historical Trend
| (In millions of Canadian dollars, except share amounts) (unaudited) | Q1 21 | TOTAL 2020 |
Q4 20 | Q3 20 | Q2 20 | Q1 20 | ||||||||||||||||||||||
| Operating revenues |
||||||||||||||||||||||||||||
| Service |
4,968 | 19,832 | 5,090 | 4,924 | 4,800 | 5,018 | ||||||||||||||||||||||
| Product |
738 | 3,051 | 1,012 | 863 | 554 | 622 | ||||||||||||||||||||||
| Total operating revenues |
5,706 | 22,883 | 6,102 | 5,787 | 5,354 | 5,640 | ||||||||||||||||||||||
| Operating costs (A) |
(3,203 | ) | (13,007 | ) | (3,633 | ) | (3,268 | ) | (2,959 | ) | (3,147 | ) | ||||||||||||||||
| Post-employment benefit plans service cost |
(74 | ) | (269 | ) | (65 | ) | (65 | ) | (64 | ) | (75 | ) | ||||||||||||||||
| Adjusted EBITDA |
2,429 | 9,607 | 2,404 | 2,454 | 2,331 | 2,418 | ||||||||||||||||||||||
| Adjusted EBITDA margin |
42.6% | 42.0% | 39.4% | 42.4% | 43.5% | 42.9% | ||||||||||||||||||||||
| Severance, acquisition and other costs |
(89 | ) | (116 | ) | (52 | ) | (26 | ) | (22 | ) | (16 | ) | ||||||||||||||||
| Depreciation |
(895 | ) | (3,475 | ) | (872 | ) | (876 | ) | (869 | ) | (858 | ) | ||||||||||||||||
| Amortization |
(238 | ) | (929 | ) | (233 | ) | (232 | ) | (234 | ) | (230 | ) | ||||||||||||||||
| Finance costs |
||||||||||||||||||||||||||||
| Interest expense |
(267 | ) | (1,110 | ) | (274 | ) | (279 | ) | (280 | ) | (277 | ) | ||||||||||||||||
| Interest on post-employment benefit obligations |
(5 | ) | (46 | ) | (11 | ) | (12 | ) | (11 | ) | (12 | ) | ||||||||||||||||
| Impairment of assets |
(3 | ) | (472 | ) | (12 | ) | (4 | ) | (449 | ) | (7 | ) | ||||||||||||||||
| Other income (expense) |
8 | (194 | ) | (38 | ) | (29 | ) | (80 | ) | (47 | ) | |||||||||||||||||
| Income taxes |
(253 | ) | (792 | ) | (191 | ) | (262 | ) | (96 | ) | (243 | ) | ||||||||||||||||
| Net earnings from continuing operations |
687 | 2,473 | 721 | 734 | 290 | 728 | ||||||||||||||||||||||
| Net earnings from discontinued operations |
- | 226 | 211 | 6 | 4 | 5 | ||||||||||||||||||||||
| Net earnings |
687 | 2,699 | 932 | 740 | 294 | 733 | ||||||||||||||||||||||
| Net earnings from continuing operations attributable to: |
||||||||||||||||||||||||||||
| Common shareholders |
642 | 2,272 | 678 | 686 | 233 | 675 | ||||||||||||||||||||||
| Preferred shareholders |
32 | 136 | 32 | 32 | 34 | 38 | ||||||||||||||||||||||
| Non-controlling interest |
13 | 65 | 11 | 16 | 23 | 15 | ||||||||||||||||||||||
| Net earnings from continuing operations |
687 | 2,473 | 721 | 734 | 290 | 728 | ||||||||||||||||||||||
| Net earnings attributable to: |
||||||||||||||||||||||||||||
| Common shareholders |
642 | 2,498 | 889 | 692 | 237 | 680 | ||||||||||||||||||||||
| Preferred shareholders |
32 | 136 | 32 | 32 | 34 | 38 | ||||||||||||||||||||||
| Non-controlling interest |
13 | 65 | 11 | 16 | 23 | 15 | ||||||||||||||||||||||
| Net earnings |
687 | 2,699 | 932 | 740 | 294 | 733 | ||||||||||||||||||||||
| Net earnings per common share - basic and diluted |
||||||||||||||||||||||||||||
| Continuing operations |
$ | 0.71 | $ | 2.51 | $ | 0.75 | $ | 0.76 | $ | 0.26 | $ | 0.74 | ||||||||||||||||
| Discontinued operations |
$ | - | $ | 0.25 | $ | 0.23 | $ | 0.01 | $ | - | $ | 0.01 | ||||||||||||||||
| Net earnings per common share - basic and diluted |
$ | 0.71 | $ | 2.76 | $ | 0.98 | $ | 0.77 | $ | 0.26 | $ | 0.75 | ||||||||||||||||
| Dividends per common share |
$ | 0.8750 | $ | 3.3300 | $ | 0.8325 | $ | 0.8325 | $ | 0.8325 | $ | 0.8325 | ||||||||||||||||
| Weighted average number of common shares outstanding - basic (millions) |
904.5 | 904.3 | 904.4 | 904.3 | 904.3 | 904.1 | ||||||||||||||||||||||
| Weighted average number of common shares outstanding - diluted (millions) |
904.5 | 904.4 | 904.4 | 904.4 | 904.4 | 904.5 | ||||||||||||||||||||||
| Number of common shares outstanding (millions) |
904.6 | 904.4 | 904.4 | 904.3 | 904.3 | 904.3 | ||||||||||||||||||||||
| Adjusted net earnings and EPS |
||||||||||||||||||||||||||||
| Net earnings attributable to common shareholders |
642 | 2,498 | 889 | 692 | 237 | 680 | ||||||||||||||||||||||
| Severance, acquisition and other costs |
65 | 85 | 38 | 19 | 16 | 12 | ||||||||||||||||||||||
| Net mark-to-market (gains) losses on derivatives used to economically hedge equity settled share-based compensation plans |
(44 | ) | 37 | - | 10 | 7 | 20 | |||||||||||||||||||||
| Net gains on investments |
- | (46 | ) | (3 | ) | (22 | ) | (11 | ) | (10 | ) | |||||||||||||||||
| Early debt redemption costs |
39 | 37 | 9 | 16 | - | 12 | ||||||||||||||||||||||
| Impairment of assets |
2 | 345 | 9 | 3 | 328 | 5 | ||||||||||||||||||||||
| Net earnings from discontinued operations |
- | (226 | ) | (211 | ) | (6 | ) | (4 | ) | (5 | ) | |||||||||||||||||
| Adjusted net earnings |
704 | 2,730 | 731 | 712 | 573 | 714 | ||||||||||||||||||||||
| Adjusted EPS |
$ | 0.78 | $ | 3.02 | $ | 0.81 | $ | 0.79 | $ | 0.63 | $ | 0.79 | ||||||||||||||||
(A) Excludes post-employment benefit plans service cost
BCE Supplementary Financial Information - First Quarter 2021 Page 3
BCE (1)
Segmented Data
| (In millions of Canadian dollars, except where otherwise indicated) (unaudited) | Q1 2021 |
Q1 2020 |
$ change | % change | ||||||||||||||
| Operating revenues |
||||||||||||||||||
| Bell Wireless |
2,100 | 2,035 | 65 | 3.2% | ||||||||||||||
| Bell Wireline |
3,081 | 3,036 | 45 | 1.5% | ||||||||||||||
| Bell Media |
713 | 752 | (39 | ) | (5.2%) | |||||||||||||
| Inter-segment eliminations |
(188 | ) | (183 | ) | (5 | ) | (2.7%) | |||||||||||
| Total |
5,706 | 5,640 | 66 | 1.2% | ||||||||||||||
| Operating costs |
||||||||||||||||||
| Bell Wireless |
(1,177 | ) | (1,107 | ) | (70 | ) | (6.3%) | |||||||||||
| Bell Wireline |
(1,718 | ) | (1,701 | ) | (17 | ) | (1.0%) | |||||||||||
| Bell Media |
(570 | ) | (597 | ) | 27 | 4.5% | ||||||||||||
| Inter-segment eliminations |
188 | 183 | 5 | 2.7% | ||||||||||||||
| Total |
(3,277 | ) | (3,222 | ) | (55 | ) | (1.7%) | |||||||||||
| Adjusted EBITDA |
||||||||||||||||||
| Bell Wireless |
923 | 928 | (5 | ) | (0.5%) | |||||||||||||
| Margin |
44.0% | 45.6% | (1.6) pts | |||||||||||||||
| Bell Wireline |
1,363 | 1,335 | 28 | 2.1% | ||||||||||||||
| Margin |
44.2% | 44.0% | 0.2 pts | |||||||||||||||
| Bell Media |
143 | 155 | (12 | ) | (7.7%) | |||||||||||||
| Margin |
20.1% | 20.6% | (0.5) pts | |||||||||||||||
| Total |
2,429 | 2,418 | 11 | 0.5% | ||||||||||||||
| Margin |
42.6% | 42.9% | (0.3) pts | |||||||||||||||
| Capital expenditures |
||||||||||||||||||
| Bell Wireless |
286 | 130 | (156 | ) | n.m. | |||||||||||||
| Capital intensity (3) |
13.6% | 6.4% | (7.2) pts | |||||||||||||||
| Bell Wireline |
707 | 622 | (85 | ) | (13.7%) | |||||||||||||
| Capital intensity |
22.9% | 20.5% | (2.4) pts | |||||||||||||||
| Bell Media |
19 | 25 | 6 | 24.0% | ||||||||||||||
| Capital intensity |
2.7% | 3.3% | 0.6 pts | |||||||||||||||
| Total |
1,012 | 777 | (235 | ) | (30.2%) | |||||||||||||
| Capital intensity |
17.7% | 13.8% | (3.9) pts | |||||||||||||||
n.m. : not meaningful
BCE Supplementary Financial Information - First Quarter 2021 Page 4
BCE
Segmented Data - Historical Trend
| (In millions of Canadian dollars, except where otherwise indicated) (unaudited) | Q1 21 | TOTAL 2020 |
Q4 20 | Q3 20 | Q2 20 | Q1 20 | ||||||||||||||||||
|
|
|
|
|
|
|
| ||||||||||||||||||
|
|
||||||||||||||||||||||||
| Operating revenues |
||||||||||||||||||||||||
| Bell Wireless |
2,100 | 8,683 | 2,408 | 2,318 | 1,922 | 2,035 | ||||||||||||||||||
| Bell Wireline |
3,081 | 12,206 | 3,095 | 3,032 | 3,043 | 3,036 | ||||||||||||||||||
| Bell Media |
713 | 2,750 | 791 | 628 | 579 | 752 | ||||||||||||||||||
| Inter-segment eliminations |
(188 | ) | (756 | ) | (192 | ) | (191 | ) | (190 | ) | (183 | ) | ||||||||||||
|
|
|
|
|
|
|
|
|
| ||||||||||||||||
| Total |
5,706 | 22,883 | 6,102 | 5,787 | 5,354 | 5,640 | ||||||||||||||||||
|
|
|
|
|
|
|
|
|
| ||||||||||||||||
|
|
||||||||||||||||||||||||
| Operating costs |
||||||||||||||||||||||||
| Bell Wireless |
(1,177 | ) | (5,017 | ) | (1,505 | ) | (1,362 | ) | (1,043 | ) | (1,107 | ) | ||||||||||||
| Bell Wireline |
(1,718 | ) | (6,960 | ) | (1,783 | ) | (1,712 | ) | (1,764 | ) | (1,701 | ) | ||||||||||||
| Bell Media |
(570 | ) | (2,055 | ) | (602 | ) | (450 | ) | (406 | ) | (597 | ) | ||||||||||||
| Inter-segment eliminations |
188 | 756 | 192 | 191 | 190 | 183 | ||||||||||||||||||
|
|
|
|
|
|
|
|
|
| ||||||||||||||||
| Total |
(3,277 | ) | (13,276 | ) | (3,698 | ) | (3,333 | ) | (3,023 | ) | (3,222 | ) | ||||||||||||
|
|
|
|
|
|
|
|
|
| ||||||||||||||||
|
|
||||||||||||||||||||||||
| Adjusted EBITDA |
||||||||||||||||||||||||
| Bell Wireless |
923 | 3,666 | 903 | 956 | 879 | 928 | ||||||||||||||||||
| Margin |
44.0% | 42.2% | 37.5% | 41.2% | 45.7% | 45.6% | ||||||||||||||||||
| Bell Wireline |
1,363 | 5,246 | 1,312 | 1,320 | 1,279 | 1,335 | ||||||||||||||||||
| Margin |
44.2% | 43.0% | 42.4% | 43.5% | 42.0% | 44.0% | ||||||||||||||||||
| Bell Media |
143 | 695 | 189 | 178 | 173 | 155 | ||||||||||||||||||
| Margin |
20.1% | 25.3% | 23.9% | 28.3% | 29.9% | 20.6% | ||||||||||||||||||
|
|
|
|
|
|
|
|
|
| ||||||||||||||||
| Total |
2,429 | 9,607 | 2,404 | 2,454 | 2,331 | 2,418 | ||||||||||||||||||
|
|
|
|
|
|
|
|
|
| ||||||||||||||||
| Margin |
42.6% | 42.0% | 39.4% | 42.4% | 43.5% | 42.9% | ||||||||||||||||||
|
|
||||||||||||||||||||||||
| Capital expenditures |
||||||||||||||||||||||||
| Bell Wireless |
286 | 916 | 392 | 212 | 182 | 130 | ||||||||||||||||||
| Capital intensity |
13.6% | 10.5% | 16.3% | 9.1% | 9.5% | 6.4% | ||||||||||||||||||
| Bell Wireline |
707 | 3,161 | 1,053 | 792 | 694 | 622 | ||||||||||||||||||
| Capital intensity |
22.9% | 25.9% | 34.0% | 26.1% | 22.8% | 20.5% | ||||||||||||||||||
| Bell Media |
19 | 125 | 49 | 27 | 24 | 25 | ||||||||||||||||||
| Capital intensity |
2.7% | 4.5% | 6.2% | 4.3% | 4.1% | 3.3% | ||||||||||||||||||
|
|
|
|
|
|
|
|
|
| ||||||||||||||||
| Total |
1,012 | 4,202 | 1,494 | 1,031 | 900 | 777 | ||||||||||||||||||
|
|
|
|
|
|
|
|
|
| ||||||||||||||||
| Capital intensity |
17.7% | 18.4% | 24.5% | 17.8% | 16.8% | 13.8% | ||||||||||||||||||
BCE Supplementary Financial Information - First Quarter 2021 Page 5
Bell Wireless (1)
| Q1 | Q1 | |||||||||||||
| (In millions of Canadian dollars, except where otherwise indicated) (unaudited) | 2021 | 2020 | % change | |||||||||||
| Bell Wireless |
||||||||||||||
| Operating revenues |
||||||||||||||
| External service revenues |
1,503 | 1,535 | (2.1%) | |||||||||||
| Inter-segment service revenues |
11 | 12 | (8.3%) | |||||||||||
| Total operating service revenues |
1,514 | 1,547 | (2.1%) | |||||||||||
| External product revenues |
584 | 487 | 19.9% | |||||||||||
| Inter-segment product revenues |
2 | 1 | 100.0% | |||||||||||
| Total operating product revenues |
586 | 488 | 20.1% | |||||||||||
| Total external revenues |
2,087 | 2,022 | 3.2% | |||||||||||
| Total operating revenues |
2,100 | 2,035 | 3.2% | |||||||||||
| Operating costs |
(1,177 | ) | (1,107 | ) | (6.3%) | |||||||||
| Adjusted EBITDA |
923 | 928 | (0.5%) | |||||||||||
| Adjusted EBITDA margin (Total operating revenues) |
44.0% | 45.6% | (1.6) pts | |||||||||||
| Capital expenditures |
286 | 130 | n.m. | |||||||||||
| Capital intensity |
13.6% | 6.4% | (7.2) pts | |||||||||||
| Mobile phone subscribers(3)(A) |
||||||||||||||
| Gross activations |
340,127 | 333,557 | 2.0% | |||||||||||
| Postpaid |
248,990 | 209,550 | 18.8% | |||||||||||
| Prepaid |
91,137 | 124,007 | (26.5%) | |||||||||||
| Net activations (losses) |
2,405 | (2,496 | ) | n.m. | ||||||||||
| Postpaid |
32,925 | 1,559 | n.m. | |||||||||||
| Prepaid |
(30,520 | ) | (4,055 | ) | n.m. | |||||||||
| Subscribers end of period (EOP) |
9,166,748 | 8,971,172 | 2.2% | |||||||||||
| Postpaid |
8,361,264 | 8,177,205 | 2.3% | |||||||||||
| Prepaid |
805,484 | 793,967 | 1.5% | |||||||||||
| Blended average billing per user (ABPU) ($/month)(3) |
70.34 | 72.78 | (3.4%) | |||||||||||
| Blended churn (%) (average per month)(3) |
1.23% | 1.26% | 0.03 pts | |||||||||||
| Postpaid |
0.89% | 0.89% | - | |||||||||||
| Prepaid |
4.68% | 5.03% | 0.35 pts | |||||||||||
| Mobile connected device subscribers (3)(A) |
||||||||||||||
| Net activations |
74,159 | 48,964 | 51.5% | |||||||||||
| Subscribers EOP |
2,130,312 | 1,877,136 | 13.5% | |||||||||||
n.m. : not meaningful
| (A) | Effective January 1, 2021, we changed our wireless operating metrics to reflect our revised approach to reporting wireless subscriber units. Consequently, we are now reporting in two categories, mobile phone subscriber units and mobile connected device subscriber units (e.g. tablets, wearables and mobile Internet devices). Additionally, mobile connected device subscribers now include previously undisclosed Internet of Things (IoT) units (e.g. connected telematics services, monitoring devices, connected cars and fleet management solutions). These changes are consistent with the way we manage our business, reflect our focus on mobile phone subscribers and align to industry peers. As a result, previously reported 2020 subscribers and associated operating metrics (gross and net activations (losses), ABPU and churn) have been restated for comparability. |
BCE Supplementary Financial Information - First Quarter 2021 Page 6
Bell Wireless - Historical Trend
| (In millions of Canadian dollars, except where otherwise indicated) (unaudited) | Q1 21 | TOTAL 2020 |
Q4 20 | Q3 20 | Q2 20 | Q1 20 | ||||||||||||||||||||||
| Bell Wireless |
||||||||||||||||||||||||||||
| Operating revenues |
||||||||||||||||||||||||||||
| External service revenues |
1,503 | 6,122 | 1,543 | 1,563 | 1,481 | 1,535 | ||||||||||||||||||||||
| Inter-segment service revenues |
11 | 47 | 11 | 12 | 12 | 12 | ||||||||||||||||||||||
| Total operating service revenues |
1,514 | 6,169 | 1,554 | 1,575 | 1,493 | 1,547 | ||||||||||||||||||||||
| External product revenues |
584 | 2,508 | 851 | 742 | 428 | 487 | ||||||||||||||||||||||
| Inter-segment product revenues |
2 | 6 | 3 | 1 | 1 | 1 | ||||||||||||||||||||||
| Total operating product revenues |
586 | 2,514 | 854 | 743 | 429 | 488 | ||||||||||||||||||||||
| Total external revenues |
2,087 | 8,630 | 2,394 | 2,305 | 1,909 | 2,022 | ||||||||||||||||||||||
| Total operating revenues |
2,100 | 8,683 | 2,408 | 2,318 | 1,922 | 2,035 | ||||||||||||||||||||||
| Operating costs |
(1,177 | ) | (5,017 | ) | (1,505 | ) | (1,362 | ) | (1,043 | ) | (1,107 | ) | ||||||||||||||||
| Adjusted EBITDA |
923 | 3,666 | 903 | 956 | 879 | 928 | ||||||||||||||||||||||
| Adjusted EBITDA margin (Total operating revenues) |
44.0% | 42.2% | 37.5% | 41.2% | 45.7% | 45.6% | ||||||||||||||||||||||
| Capital expenditures |
286 | 916 | 392 | 212 | 182 | 130 | ||||||||||||||||||||||
| Capital intensity |
13.6% | 10.5% | 16.3% | 9.1% | 9.5% | 6.4% | ||||||||||||||||||||||
| Mobile phone subscribers(A) |
||||||||||||||||||||||||||||
| Gross activations |
340,127 | 1,545,173 | 445,322 | 457,161 | 309,133 | 333,557 | ||||||||||||||||||||||
| Postpaid |
248,990 | 1,025,748 | 328,051 | 308,558 | 179,589 | 209,550 | ||||||||||||||||||||||
| Prepaid |
91,137 | 519,425 | 117,271 | 148,603 | 129,544 | 124,007 | ||||||||||||||||||||||
| Net activations (losses) |
2,405 | 190,675 | 61,716 | 119,345 | 12,110 | (2,496 | ) | |||||||||||||||||||||
| Postpaid |
32,925 | 152,693 | 73,388 | 78,706 | (960 | ) | 1,559 | |||||||||||||||||||||
| Prepaid |
(30,520 | ) | 37,982 | (11,672 | ) | 40,639 | 13,070 | (4,055 | ) | |||||||||||||||||||
| Subscribers EOP |
9,166,748 | 9,164,343 | 9,164,343 | 9,102,627 | 8,983,282 | 8,971,172 | ||||||||||||||||||||||
| Postpaid |
8,361,264 | 8,328,339 | 8,328,339 | 8,254,951 | 8,176,245 | 8,177,205 | ||||||||||||||||||||||
| Prepaid |
805,484 | 836,004 | 836,004 | 847,676 | 807,037 | 793,967 | ||||||||||||||||||||||
| Blended ABPU ($/month) |
70.34 | 72.01 | 72.13 | 73.25 | 69.88 | 72.78 | ||||||||||||||||||||||
| Blended churn (%) (average per month) |
1.23% | 1.26% | 1.40% | 1.25% | 1.11% | 1.26% | ||||||||||||||||||||||
| Postpaid |
0.89% | 0.92% | 1.06% | 0.98% | 0.76% | 0.89% | ||||||||||||||||||||||
| Prepaid |
4.68% | 4.60% | 4.79% | 3.98% | 4.63% | 5.03% | ||||||||||||||||||||||
| Mobile connected device subscribers(A) |
||||||||||||||||||||||||||||
| Net activations |
74,159 | 227,981 | 98,949 | 41,225 | 38,843 | 48,964 | ||||||||||||||||||||||
| Subscribers EOP |
2,130,312 | 2,056,153 | 2,056,153 | 1,957,204 | 1,915,979 | 1,877,136 | ||||||||||||||||||||||
| (A) | Effective January 1, 2021, we changed our wireless operating metrics to reflect our revised approach to reporting wireless subscriber units. Consequently, we are now reporting in two categories, mobile phone subscriber units and mobile connected device subscriber units (e.g. tablets, wearables and mobile Internet devices). Additionally, mobile connected device subscribers now include previously undisclosed IoT units (e.g. connected telematics services, monitoring devices, connected cars and fleet management solutions). These changes are consistent with the way we manage our business, reflect our focus on mobile phone subscribers and align to industry peers. As a result, previously reported 2020 subscribers and associated operating metrics (gross and net activations (losses), ABPU and churn) have been restated for comparability. |
BCE Supplementary Financial Information - First Quarter 2021 Page 7
Bell Wireline (1)
| Q1 | Q1 | |||||||||||||
| (In millions of Canadian dollars, except where otherwise indicated) (unaudited) | 2021 | 2020 | % change | |||||||||||
| Bell Wireline |
||||||||||||||
| Operating revenues |
||||||||||||||
| Data |
1,965 | 1,891 | 3.9% | |||||||||||
| Voice |
803 | 872 | (7.9%) | |||||||||||
| Other services |
74 | 62 | 19.4% | |||||||||||
| Total external service revenues |
2,842 | 2,825 | 0.6% | |||||||||||
| Inter-segment service revenues |
85 | 76 | 11.8% | |||||||||||
| Total operating service revenues |
2,927 | 2,901 | 0.9% | |||||||||||
| Data |
144 | 123 | 17.1% | |||||||||||
| Equipment and other |
10 | 12 | (16.7%) | |||||||||||
| Total external product revenues |
154 | 135 | 14.1% | |||||||||||
| Inter-segment product revenues |
- | - | - | |||||||||||
| Total operating product revenues |
154 | 135 | 14.1% | |||||||||||
| Total external revenues |
2,996 | 2,960 | 1.2% | |||||||||||
| Total operating revenues |
3,081 | 3,036 | 1.5% | |||||||||||
| Operating costs |
(1,718 | ) | (1,701 | ) | (1.0%) | |||||||||
| Adjusted EBITDA |
1,363 | 1,335 | 2.1% | |||||||||||
| Adjusted EBITDA margin |
44.2% | 44.0% | 0.2 pts | |||||||||||
| Capital expenditures |
707 | 622 | (13.7%) | |||||||||||
| Capital intensity |
22.9% | 20.5% | (2.4) pts | |||||||||||
| Retail high-speed Internet subscribers (3) |
||||||||||||||
| Retail net activations |
21,208 | 22,595 | (6.1%) | |||||||||||
| Retail subscribers EOP(A) |
3,730,576 | 3,578,196 | 4.3% | |||||||||||
| Retail TV subscribers (3) |
||||||||||||||
| Retail net subscriber (losses) activations |
(9,112 | ) | (18,555 | ) | 50.9% | |||||||||
| Internet protocol television (IPTV) |
10,696 | 2,852 | n.m. | |||||||||||
| Satellite |
(19,808 | ) | (21,407 | ) | 7.5% | |||||||||
| Total retail subscribers EOP(B) |
2,723,368 | 2,753,909 | (1.1%) | |||||||||||
| IPTV |
1,817,069 | 1,770,034 | 2.7% | |||||||||||
| Satellite(B) |
906,299 | 983,875 | (7.9%) | |||||||||||
| Retail residential network access services (NAS)(3) |
||||||||||||||
| Retail residential NAS lines net losses |
(51,069 | ) | (61,595 | ) | 17.1% | |||||||||
| Retail residential NAS lines |
2,432,863 | 2,635,888 | (7.7%) | |||||||||||
n.m. : not meaningful
(A) At the beginning of Q1 2021, our retail high-speed Internet subscriber base was increased by 4,778 subscribers due to the transfer of fixed wireless Internet subscribers from our mobiled connected devices subscriber base.
(B) At the beginning of Q1 2021, we adjusted our satellite TV subscriber base to remove 6,125 non-revenue generating units.
BCE Supplementary Financial Information - First Quarter 2021 Page 8
Bell Wireline - Historical Trend
| TOTAL | ||||||||||||||||||||||||||||||||
| (In millions of Canadian dollars, except where otherwise indicated) (unaudited) | Q1 21 | 2020 | Q4 20 | Q3 20 | Q2 20 | Q1 20 | ||||||||||||||||||||||||||
| Bell Wireline |
||||||||||||||||||||||||||||||||
| Operating revenues |
||||||||||||||||||||||||||||||||
| Data |
1,965 | 7,691 | 1,953 | 1,931 | 1,916 | 1,891 | ||||||||||||||||||||||||||
| Voice |
803 | 3,402 | 828 | 839 | 863 | 872 | ||||||||||||||||||||||||||
| Other services |
74 | 248 | 67 | 61 | 58 | 62 | ||||||||||||||||||||||||||
| Total external service revenues |
2,842 | 11,341 | 2,848 | 2,831 | 2,837 | 2,825 | ||||||||||||||||||||||||||
| Inter-segment service revenues |
85 | 321 | 85 | 80 | 80 | 76 | ||||||||||||||||||||||||||
| Total operating service revenues |
2,927 | 11,662 | 2,933 | 2,911 | 2,917 | 2,901 | ||||||||||||||||||||||||||
| Data |
144 | 494 | 148 | 110 | 113 | 123 | ||||||||||||||||||||||||||
| Equipment and other |
10 | 49 | 13 | 11 | 13 | 12 | ||||||||||||||||||||||||||
| Total external product revenues |
154 | 543 | 161 | 121 | 126 | 135 | ||||||||||||||||||||||||||
| Inter-segment product revenues |
- | 1 | 1 | - | - | - | ||||||||||||||||||||||||||
| Total operating product revenues |
154 | 544 | 162 | 121 | 126 | 135 | ||||||||||||||||||||||||||
| Total external revenues |
2,996 | 11,884 | 3,009 | 2,952 | 2,963 | 2,960 | ||||||||||||||||||||||||||
| Total operating revenues |
3,081 | 12,206 | 3,095 | 3,032 | 3,043 | 3,036 | ||||||||||||||||||||||||||
| Operating costs |
(1,718 | ) | (6,960 | ) | (1,783 | ) | (1,712 | ) | (1,764 | ) | (1,701 | ) | ||||||||||||||||||||
| Adjusted EBITDA |
1,363 | 5,246 | 1,312 | 1,320 | 1,279 | 1,335 | ||||||||||||||||||||||||||
| Adjusted EBITDA margin |
44.2% | 43.0% | 42.4% | 43.5% | 42.0% | 44.0% | ||||||||||||||||||||||||||
| Capital expenditures |
707 | 3,161 | 1,053 | 792 | 694 | 622 | ||||||||||||||||||||||||||
| Capital intensity |
22.9% | 25.9% | 34.0% | 26.1% | 22.8% | 20.5% | ||||||||||||||||||||||||||
| Retail high-speed Internet subscribers |
||||||||||||||||||||||||||||||||
| Retail net activations |
21,208 | 148,989 | 44,512 | 62,859 | 19,023 | 22,595 | ||||||||||||||||||||||||||
| Retail subscribers EOP(A) |
3,730,576 | 3,704,590 | 3,704,590 | 3,660,078 | 3,597,219 | 3,578,196 | ||||||||||||||||||||||||||
| Retail TV subscribers |
||||||||||||||||||||||||||||||||
| Retail net subscriber (losses) activations |
(9,112 | ) | (33,859 | ) | 536 | (296 | ) | (15,544 | ) | (18,555 | ) | |||||||||||||||||||||
| IPTV |
10,696 | 39,191 | 21,106 | 18,837 | (3,604 | ) | 2,852 | |||||||||||||||||||||||||
| Satellite |
(19,808 | ) | (73,050 | ) | (20,570 | ) | (19,133 | ) | (11,940 | ) | (21,407 | ) | ||||||||||||||||||||
| Total retail subscribers EOP(B) |
2,723,368 | 2,738,605 | 2,738,605 | 2,738,069 | 2,738,365 | 2,753,909 | ||||||||||||||||||||||||||
| IPTV |
1,817,069 | 1,806,373 | 1,806,373 | 1,785,267 | 1,766,430 | 1,770,034 | ||||||||||||||||||||||||||
| Satellite(B) |
906,299 | 932,232 | 932,232 | 952,802 | 971,935 | 983,875 | ||||||||||||||||||||||||||
| Retail residential NAS |
||||||||||||||||||||||||||||||||
| Retail residential NAS lines net losses |
(51,069 | ) | (213,551 | ) | (53,759 | ) | (49,792 | ) | (48,405 | ) | (61,595 | ) | ||||||||||||||||||||
| Retail residential NAS lines |
2,432,863 | 2,483,932 | 2,483,932 | 2,537,691 | 2,587,483 | 2,635,888 | ||||||||||||||||||||||||||
(A) At the beginning of Q1 2021, our retail high-speed Internet subscriber base was increased by 4,778 subscribers due to the transfer of fixed wireless Internet subscribers from our mobiled connected devices subscriber base.
(B) At the beginning of Q1 2021, we adjusted our satellite TV subscriber base to remove 6,125 non-revenue generating units.
BCE Supplementary Financial Information - First Quarter 2021 Page 9
BCE
Net debt and other information
| BCE - Net debt and preferred shares |
||||||||||||||||||||||||
| (In millions of Canadian dollars, except where otherwise indicated) (unaudited) |
||||||||||||||||||||||||
| March 31 | December 31 | |||||||||||||||||||||||
| 2021 | 2020 | |||||||||||||||||||||||
| Debt due within one year |
3,786 | 2,417 | ||||||||||||||||||||||
| Long-term debt |
24,965 | 23,906 | ||||||||||||||||||||||
| 50% of preferred shares |
2,002 | 2,002 | ||||||||||||||||||||||
| Cash and cash equivalents |
(2,607 | ) | (224) | |||||||||||||||||||||
| Net debt (2) |
28,146 | 28,101 | ||||||||||||||||||||||
| Net debt leverage ratio (2) |
2.93 | 2.93 | ||||||||||||||||||||||
| Adjusted EBITDA /net interest expense ratio (2) |
8.40 | 8.32 | ||||||||||||||||||||||
| Cash flow information |
||||||||||||||||||||||||
| (In millions of Canadian dollars, except where otherwise indicated) (unaudited) |
Q1 | Q1 | ||||||||||||||||||||||
| 2021 | 2020 | $ change | % change | |||||||||||||||||||||
| Free cash flow (FCF) (2) |
||||||||||||||||||||||||
| Cash flows from operating activities |
1,992 | 1,451 | 541 | 37.3% | ||||||||||||||||||||
| Capital expenditures |
(1,012 | ) | (777 | ) | (235 | ) | (30.2%) | |||||||||||||||||
| Cash dividends paid on preferred shares |
(31 | ) | (36 | ) | 5 | 13.9% | ||||||||||||||||||
| Cash dividends paid by subsidiaries to non-controlling interest |
(13 | ) | (14 | ) | 1 | 7.1% | ||||||||||||||||||
| Acquisition and other costs paid |
4 | 9 | (5 | ) | (55.6%) | |||||||||||||||||||
| Cash from discontinued operations (included in cash flows from operating activities) |
- | (22 | ) | 22 | 100.0% | |||||||||||||||||||
| FCF |
940 | 611 | 329 | 53.8% | ||||||||||||||||||||
| Cash flow information - Historical trend |
||||||||||||||||||||||||
| (In millions of Canadian dollars, except where otherwise indicated) (unaudited) |
Q1 | TOTAL | Q4 | Q3 | Q2 | Q1 | ||||||||||||||||||
| 2021 | 2020 | 2020 | 2020 | 2020 | 2020 | |||||||||||||||||||
| FCF |
||||||||||||||||||||||||
| Cash flows from operating activities |
1,992 | 7,754 | 1,631 | 2,110 | 2,562 | 1,451 | ||||||||||||||||||
| Capital expenditures |
(1,012 | ) | (4,202 | ) | (1,494 | ) | (1,031 | ) | (900 | ) | (777) | |||||||||||||
| Cash dividends paid on preferred shares |
(31 | ) | (132 | ) | (31 | ) | (32 | ) | (33 | ) | (36) | |||||||||||||
| Cash dividends paid by subsidiaries to non-controlling interest |
(13 | ) | (53 | ) | (16 | ) | (11 | ) | (12 | ) | (14) | |||||||||||||
| Acquisition and other costs paid |
4 | 35 | 2 | 13 | 11 | 9 | ||||||||||||||||||
| Cash from discontinued operations (included in cash flows from operating activities) |
- | (54 | ) | - | (15 | ) | (17 | ) | (22) | |||||||||||||||
| FCF |
940 | 3,348 | 92 | 1,034 | 1,611 | 611 | ||||||||||||||||||
BCE Supplementary Financial Information - First Quarter 2021 Page 10
BCE
Consolidated Statements of Financial Position
| (In millions of Canadian dollars, except where otherwise indicated) (unaudited) | March 31 2021 |
December 31 2020 |
||||||||
| ASSETS |
||||||||||
| Current assets |
||||||||||
| Cash |
1,907 | 224 | ||||||||
| Cash equivalents |
700 | - | ||||||||
| Trade and other receivables |
3,247 | 3,528 | ||||||||
| Inventory |
459 | 439 | ||||||||
| Contract assets |
563 | 687 | ||||||||
| Contract costs |
424 | 402 | ||||||||
| Prepaid expenses |
345 | 209 | ||||||||
| Other current assets |
244 | 199 | ||||||||
| Total current assets |
7,889 | 5,688 | ||||||||
| Non-current assets |
||||||||||
| Contract assets |
236 | 256 | ||||||||
| Contract costs |
344 | 362 | ||||||||
| Property, plant and equipment |
27,370 | 27,513 | ||||||||
| Intangible assets |
13,227 | 13,102 | ||||||||
| Deferred tax assets |
107 | 106 | ||||||||
| Investments in associates and joint ventures |
745 | 756 | ||||||||
| Post-employment benefit assets |
2,601 | 1,277 | ||||||||
| Other non-current assets |
1,124 | 1,001 | ||||||||
| Goodwill |
10,606 | 10,604 | ||||||||
| Total non-current assets |
56,360 | 54,977 | ||||||||
| Total assets |
64,249 | 60,665 | ||||||||
| LIABILITIES |
||||||||||
| Current liabilities |
||||||||||
| Trade payables and other liabilities |
3,723 | 3,935 | ||||||||
| Contract liabilities |
762 | 717 | ||||||||
| Interest payable |
181 | 222 | ||||||||
| Dividends payable |
804 | 766 | ||||||||
| Current tax liabilities |
271 | 214 | ||||||||
| Debt due within one year |
3,786 | 2,417 | ||||||||
| Total current liabilities |
9,527 | 8,271 | ||||||||
| Non-current liabilities |
||||||||||
| Contract liabilities |
242 | 242 | ||||||||
| Long-term debt |
24,965 | 23,906 | ||||||||
| Deferred tax liabilities |
4,285 | 3,810 | ||||||||
| Post-employment benefit obligations |
1,723 | 1,962 | ||||||||
| Other non-current liabilities |
1,141 | 1,145 | ||||||||
| Total non-current liabilities |
32,356 | 31,065 | ||||||||
| Total liabilities |
41,883 | 39,336 | ||||||||
| EQUITY |
||||||||||
| Equity attributable to BCE shareholders |
||||||||||
| Preferred shares |
4,003 | 4,003 | ||||||||
| Common shares |
20,400 | 20,390 | ||||||||
| Contributed surplus |
1,154 | 1,174 | ||||||||
| Accumulated other comprehensive income |
163 | 103 | ||||||||
| Deficit |
(3,693 | ) | (4,681 | ) | ||||||
| Total equity attributable to BCE shareholders |
22,027 | 20,989 | ||||||||
| Non-controlling interest |
339 | 340 | ||||||||
| Total equity |
22,366 | 21,329 | ||||||||
| Total liabilities and equity |
64,249 | 60,665 | ||||||||
| Number of common shares outstanding (millions) |
904.6 | 904.4 | ||||||||
BCE Supplementary Financial Information - First Quarter 2021 Page 11
BCE
Consolidated Cash Flow Data
| (In millions of Canadian dollars, except where otherwise indicated) (unaudited) | Q1 2021 |
Q1 2020 |
$ change | |||||||||||
| Net earnings from continuing operations |
687 | 728 | (41 | ) | ||||||||||
| Adjustments to reconcile net earnings from continuing operations to cash flows from operating activities |
||||||||||||||
| Severance, acquisition and other costs |
89 | 16 | 73 | |||||||||||
| Depreciation and amortization |
1,133 | 1,088 | 45 | |||||||||||
| Post-employment benefit plans cost |
79 | 87 | (8 | ) | ||||||||||
| Net interest expense |
263 | 270 | (7 | ) | ||||||||||
| Impairment of assets |
3 | 7 | (4 | ) | ||||||||||
| Income taxes |
253 | 243 | 10 | |||||||||||
| Contributions to post-employment benefit plans |
(79 | ) | (79 | ) | - | |||||||||
| Payments under other post-employment benefit plans |
(15 | ) | (17 | ) | 2 | |||||||||
| Severance and other costs paid |
(43 | ) | (35 | ) | (8 | ) | ||||||||
| Interest paid |
(306 | ) | (316 | ) | 10 | |||||||||
| Income taxes paid (net of refunds) |
(109 | ) | (233 | ) | 124 | |||||||||
| Acquisition and other costs paid |
(4 | ) | (9 | ) | 5 | |||||||||
| Change in contract assets |
144 | 155 | (11 | ) | ||||||||||
| Change in wireless device financing plan receivables |
(91 | ) | (76 | ) | (15 | ) | ||||||||
| Net change in operating assets and liabilities |
(12 | ) | (400 | ) | 388 | |||||||||
| Cash from discontinued operations |
- | 22 | (22 | ) | ||||||||||
| Cash flows from operating activities |
1,992 | 1,451 | 541 | |||||||||||
| Capital expenditures |
(1,012 | ) | (777 | ) | (235 | ) | ||||||||
| Cash dividends paid on preferred shares |
(31 | ) | (36 | ) | 5 | |||||||||
| Cash dividends paid by subsidiaries to non-controlling interest |
(13 | ) | (14 | ) | 1 | |||||||||
| Acquisition and other costs paid |
4 | 9 | (5 | ) | ||||||||||
| Cash from discontinued operations (included in cash flows from operating activities) |
- | (22 | ) | 22 | ||||||||||
| Free cash flow |
940 | 611 | 329 | |||||||||||
| Cash from discontinued operations (included in cash flows from operating activities) |
- | 22 | (22 | ) | ||||||||||
| Acquisition and other costs paid |
(4 | ) | (9 | ) | 5 | |||||||||
| Acquisition of spectrum licences |
- | (1 | ) | 1 | ||||||||||
| Other investing activities |
(21 | ) | (5 | ) | (16 | ) | ||||||||
| Cash used in discontinued operations (included in cash flows from investing activities) |
- | (7 | ) | 7 | ||||||||||
| Decrease in notes payable |
(357 | ) | (230 | ) | (127 | ) | ||||||||
| (Decrease) increase in securitized trade receivables |
(13 | ) | 400 | (413 | ) | |||||||||
| Issue of long-term debt |
2,915 | 3,281 | (366 | ) | ||||||||||
| Repayment of long-term debt |
(226 | ) | (709 | ) | 483 | |||||||||
| Issue of common shares |
10 | 22 | (12 | ) | ||||||||||
| Purchase of shares for settlement of share-based payments |
(91 | ) | (94 | ) | 3 | |||||||||
| Cash dividends paid on common shares |
(753 | ) | (716 | ) | (37 | ) | ||||||||
| Other financing activities |
(17 | ) | (30 | ) | 13 | |||||||||
| Cash used in discontinued operations (included in cash flows from financing activities) |
- | (1 | ) | 1 | ||||||||||
| 1,443 | 1,923 | (480 | ) | |||||||||||
| Net increase in cash and cash equivalents |
2,383 | 2,534 | (151 | ) | ||||||||||
| Cash and cash equivalents at beginning of period |
224 | 145 | 79 | |||||||||||
| Cash and cash equivalents at end of period |
2,607 | 2,679 | (72 | ) | ||||||||||
BCE Supplementary Financial Information - First Quarter 2021 Page 12
BCE
Consolidated Cash Flow Data - Historical Trend
| (In millions of Canadian dollars, except where otherwise indicated) (unaudited) | Q1 21 | TOTAL 2020 |
Q4 20 | Q3 20 | Q2 20 | Q1 20 | ||||||||||||||||||||||
| Net earnings from continuing operations |
687 | 2,473 | 721 | 734 | 290 | 728 | ||||||||||||||||||||||
| Adjustments to reconcile net earnings from continuing operations to cash flows from operating activities |
||||||||||||||||||||||||||||
| Severance, acquisition and other costs |
89 | 116 | 52 | 26 | 22 | 16 | ||||||||||||||||||||||
| Depreciation and amortization |
1,133 | 4,404 | 1,105 | 1,108 | 1,103 | 1,088 | ||||||||||||||||||||||
| Post-employment benefit plans cost |
79 | 315 | 76 | 77 | 75 | 87 | ||||||||||||||||||||||
| Net interest expense |
263 | 1,087 | 269 | 273 | 275 | 270 | ||||||||||||||||||||||
| Impairment of assets |
3 | 472 | 12 | 4 | 449 | 7 | ||||||||||||||||||||||
| Losses on investments |
- | (3 | ) | (3 | ) | - | - | - | ||||||||||||||||||||
| Income taxes |
253 | 792 | 191 | 262 | 96 | 243 | ||||||||||||||||||||||
| Contributions to post-employment benefit plans |
(79 | ) | (297 | ) | (78 | ) | (69 | ) | (71 | ) | (79 | ) | ||||||||||||||||
| Payments under other post-employment benefit plans |
(15 | ) | (61 | ) | (17 | ) | (15 | ) | (12 | ) | (17 | ) | ||||||||||||||||
| Severance and other costs paid |
(43 | ) | (78 | ) | (19 | ) | (11 | ) | (13 | ) | (35 | ) | ||||||||||||||||
| Interest paid |
(306 | ) | (1,112 | ) | (235 | ) | (321 | ) | (240 | ) | (316 | ) | ||||||||||||||||
| Income taxes paid (net of refunds) |
(109 | ) | (846 | ) | (383 | ) | (236 | ) | 6 | (233 | ) | |||||||||||||||||
| Acquisition and other costs paid |
(4 | ) | (35 | ) | (2 | ) | (13 | ) | (11 | ) | (9 | ) | ||||||||||||||||
| Change in contract assets |
144 | 704 | 132 | 178 | 239 | 155 | ||||||||||||||||||||||
| Change in wireless device financing plan receivables |
(91 | ) | (867 | ) | (319 | ) | (322 | ) | (150 | ) | (76 | ) | ||||||||||||||||
| Net change in operating assets and liabilities |
(12 | ) | 636 | 129 | 420 | 487 | (400 | ) | ||||||||||||||||||||
| Cash from discontinued operations |
- | 54 | - | 15 | 17 | 22 | ||||||||||||||||||||||
| Cash flows from operating activities |
1,992 | 7,754 | 1,631 | 2,110 | 2,562 | 1,451 | ||||||||||||||||||||||
| Capital expenditures |
(1,012 | ) | (4,202 | ) | (1,494 | ) | (1,031 | ) | (900 | ) | (777 | ) | ||||||||||||||||
| Cash dividends paid on preferred shares |
(31 | ) | (132 | ) | (31 | ) | (32 | ) | (33 | ) | (36 | ) | ||||||||||||||||
| Cash dividends paid by subsidiaries to non-controlling interest |
(13 | ) | (53 | ) | (16 | ) | (11 | ) | (12 | ) | (14 | ) | ||||||||||||||||
| Acquisition and other costs paid |
4 | 35 | 2 | 13 | 11 | 9 | ||||||||||||||||||||||
| Cash from discontinued operations (included in cash flows from operating activities) |
- | (54 | ) | - | (15 | ) | (17 | ) | (22 | ) | ||||||||||||||||||
| Free cash flow |
940 | 3,348 | 92 | 1,034 | 1,611 | 611 | ||||||||||||||||||||||
| Cash from discontinued operations (included in cash flows from operating activities) |
- | 54 | - | 15 | 17 | 22 | ||||||||||||||||||||||
| Business acquisitions |
- | (65 | ) | (42 | ) | - | (23 | ) | - | |||||||||||||||||||
| Acquisition and other costs paid |
(4 | ) | (35 | ) | (2 | ) | (13 | ) | (11 | ) | (9 | ) | ||||||||||||||||
| Acquisition of spectrum licences |
- | (86 | ) | - | (85 | ) | - | (1 | ) | |||||||||||||||||||
| Other investing activities |
(21 | ) | (79 | ) | (12 | ) | (49 | ) | (13 | ) | (5 | ) | ||||||||||||||||
| Cash from (used in) discontinued operations (included in cash flows from investing activities) |
- | 892 | 913 | (6 | ) | (8 | ) | (7 | ) | |||||||||||||||||||
| (Decrease) increase in notes payable |
(357 | ) | (1,641 | ) | (524 | ) | 317 | (1,204 | ) | (230 | ) | |||||||||||||||||
| (Decrease) increase in securitized trade receivables |
(13 | ) | - | 23 | (23 | ) | (400 | ) | 400 | |||||||||||||||||||
| Issue of long-term debt |
2,915 | 6,006 | - | 750 | 1,975 | 3,281 | ||||||||||||||||||||||
| Repayment of long-term debt |
(226 | ) | (5,003 | ) | (1,094 | ) | (979 | ) | (2,221 | ) | (709 | ) | ||||||||||||||||
| Issue of common shares |
10 | 26 | 4 | - | - | 22 | ||||||||||||||||||||||
| Purchase of shares for settlement of share-based payments |
(91 | ) | (263 | ) | (54 | ) | (40 | ) | (75 | ) | (94 | ) | ||||||||||||||||
| Cash dividends paid on common shares |
(753 | ) | (2,975 | ) | (753 | ) | (753 | ) | (753 | ) | (716 | ) | ||||||||||||||||
| Other financing activities |
(17 | ) | (93 | ) | (6 | ) | (32 | ) | (25 | ) | (30 | ) | ||||||||||||||||
| Cash used in discontinued operations (included in cash flows from financing activities) |
- | (7 | ) | - | (4 | ) | (2 | ) | (1 | ) | ||||||||||||||||||
| 1,443 | (3,269 | ) | (1,547 | ) | (902 | ) | (2,743 | ) | 1,923 | |||||||||||||||||||
| Net increase (decrease) in cash and cash equivalents |
2,383 | 79 | (1,455 | ) | 132 | (1,132 | ) | 2,534 | ||||||||||||||||||||
| Cash and cash equivalents at beginning of period |
224 | 145 | 1,679 | 1,547 | 2,679 | 145 | ||||||||||||||||||||||
| Cash and cash equivalents at end of period |
2,607 | 224 | 224 | 1,679 | 1,547 | 2,679 | ||||||||||||||||||||||
BCE Supplementary Financial Information - First Quarter 2021 Page 13
Accompanying Notes
| (1) | Our results are reported in three segments: Bell Wireless, Bell Wireline and Bell Media. Our segments reflect how we manage our business and how we classify our operations for planning and measuring performance. |
Throughout this report, we, us, our, BCE and the company mean, as the context may require, either BCE Inc. or, collectively, BCE Inc., Bell Canada, their subsidiaries, joint arrangements and associates. Bell means, as the context may require, either Bell Canada or, collectively, Bell Canada, its subsidiaries, joint arrangements and associates.
| (2) | Non-GAAP Financial Measures |
Adjusted EBITDA and adjusted EBITDA margin
The terms adjusted EBITDA and adjusted EBITDA margin do not have any standardized meaning under IFRS. Therefore, they are unlikely to be comparable to similar measures presented by other issuers.
We define adjusted EBITDA as operating revenues less operating costs (including post-employment benefit plans service cost) as shown in BCE’s consolidated income statements. Adjusted EBITDA for BCE’s segments is the same as segment profit as reported in BCE’s consolidated financial statements. We define adjusted EBITDA margin as adjusted EBITDA divided by operating revenues.
We use adjusted EBITDA and adjusted EBITDA margin to evaluate the performance of our businesses as they reflect their ongoing profitability. We believe that certain investors and analysts use adjusted EBITDA to measure a company’s ability to service debt and to meet other payment obligations or as a common measurement to value companies in the telecommunications industry. We believe that certain investors and analysts also use adjusted EBITDA and adjusted EBITDA margin to evaluate the performance of our businesses. Adjusted EBITDA also is one component in the determination of short-term incentive compensation for all management employees.
Adjusted EBITDA and adjusted EBITDA margin have no directly comparable IFRS financial measure. Alternatively, adjusted EBITDA may be reconciled to net earnings as shown in this document.
Adjusted net earnings and adjusted EPS
The terms adjusted net earnings and adjusted EPS do not have any standardized meaning under IFRS. Therefore, they are unlikely to be comparable to similar measures presented by other issuers.
We define adjusted net earnings as net earnings attributable to common shareholders before severance, acquisition and other costs, net mark-to-market losses (gains) on derivatives used to economically hedge equity settled share-based compensation plans, net losses (gains) on investments, early debt redemption costs, impairment of assets and discontinued operations, net of tax and non-controlling interest (NCI). We define adjusted EPS as adjusted net earnings per BCE common share.
We use adjusted net earnings and adjusted EPS, and we believe that certain investors and analysts use these measures, among other ones, to assess the performance of our businesses without the effects of severance, acquisition and other costs, net mark-to-market losses (gains) on derivatives used to economically hedge equity settled share-based compensation plans, net losses (gains) on investments, early debt redemption costs, impairment of assets and discontinued operations, net of tax and NCI. We exclude these items because they affect the comparability of our financial results and could potentially distort the analysis of trends in business performance. Excluding these items does not imply they are non-recurring.
The most comparable IFRS financial measures are net earnings attributable to common shareholders and EPS, as reconciled in this document.
BCE Supplementary Financial Information - First Quarter 2021 Page 14
Free cash flow
The term free cash flow does not have any standardized meaning under IFRS. Therefore, it is unlikely to be comparable to similar measures presented by other issuers.
We define free cash flow as cash flows from operating activities, excluding cash from discontinued operations, acquisition and other costs paid (which include significant litigation costs) and voluntary pension funding, less capital expenditures, preferred share dividends and dividends paid by subsidiaries to NCI. We exclude cash from discontinued operations, acquisition and other costs paid and voluntary pension funding because they affect the comparability of our financial results and could potentially distort the analysis of trends in business performance. Excluding these items does not imply they are non-recurring.
We consider free cash flow to be an important indicator of the financial strength and performance of our businesses because it shows how much cash is available to pay dividends on common shares, repay debt and reinvest in our company.
We believe that certain investors and analysts use free cash flow to value a business and its underlying assets and to evaluate the financial strength and performance of our businesses.
The most comparable IFRS financial measure is cash flows from operating activities, as reconciled in this document.
Net debt
The term net debt does not have any standardized meaning under IFRS. Therefore, it is unlikely to be comparable to similar measures presented by other issuers.
We define net debt as debt due within one year plus long-term debt and 50% of preferred shares, less cash and cash equivalents, as shown in BCE’s consolidated statements of financial position. We include 50% of outstanding preferred shares in our net debt as it is consistent with the treatment by certain credit rating agencies.
We consider net debt to be an important indicator of the company’s financial leverage because it represents the amount of debt that is not covered by available cash and cash equivalents. We believe that certain investors and analysts use net debt to determine a company’s financial leverage.
Net debt has no directly comparable IFRS financial measure, but rather is calculated using several asset and liability categories from the statements of financial position, as shown in this document.
Net debt leverage ratio
The net debt leverage ratio does not have any standardized meaning under IFRS. Therefore, it is unlikely to be comparable to similar measures presented by other issuers. We use, and believe that certain investors and analysts use, the net debt leverage ratio as a measure of financial leverage.
The net debt leverage ratio represents net debt divided by adjusted EBITDA. For the purposes of calculating our net debt leverage ratio, adjusted EBITDA is twelve-month trailing adjusted EBITDA.
Adjusted EBITDA to net interest expense ratio
The ratio of adjusted EBITDA to net interest expense does not have any standardized meaning under IFRS. Therefore, it is unlikely to be comparable to similar measures presented by other issuers. We use, and believe that certain investors and analysts use, the adjusted EBITDA to net interest expense ratio as a measure of financial health of the company.
BCE Supplementary Financial Information - First Quarter 2021 Page 15
The adjusted EBITDA to net interest expense ratio represents adjusted EBITDA divided by net interest expense. For the purposes of calculating our adjusted EBITDA to net interest expense ratio, adjusted EBITDA is twelve-month trailing adjusted EBITDA. Net interest expense is twelve-month trailing net interest expense as shown in our statements of cash flows, plus 50% of declared preferred share dividends as shown in our income statements.
| (3) | Key performance indicators (KPIs) |
In addition to the non-GAAP financial measures described previously, we use a number of KPIs to measure the success of our strategic imperatives. These KPIs are not accounting measures and may not be comparable to similar measures presented by other issuers.
Capital intensity is capital expenditures divided by operating revenues.
Mobile phone average billing per user (ABPU) or subscriber approximates the average amount billed to customers on a monthly basis, including monthly billings related to device financing receivables owing from customers on contract, which is used to track our recurring billing streams. Mobile phone blended ABPU is calculated by dividing customer billings by the average mobile phone subscriber base for the specified period and is expressed as a dollar unit per month.
Mobile phone churn is the rate at which existing mobile phone subscribers cancel their services. It is a measure of our ability to retain our customers. Mobile phone churn is calculated by dividing the number of mobile phone deactivations during a given period by the average number of mobile phone subscribers in the base for the specified period and is expressed as a percentage per month.
Mobile phone subscriber unit is comprised of a recurring revenue generating portable unit (e.g. smartphones and feature phones) on an active service plan, that has access to our wireless networks and includes voice, text and/or data connectivity. We report mobile phone subscriber units in two categories: postpaid and prepaid. Prepaid mobile phone subscriber units are considered active for a period of 90 days following the expiry of the subscriber’s prepaid balance.
Mobile connected device subscriber unit is comprised of a recurring revenue generating portable unit (e.g. tablets, wearables, mobile Internet devices and Internet of Things) on an active service plan, that has access to our wireless networks and is intended for limited or no cellular voice capability.
Wireline subscriber unit consists of an active revenue-generating unit with access to our services, including retail Internet, satellite TV, IPTV, and/or residential NAS. A subscriber is included in our subscriber base when the service has been installed and is operational at the customer premise and a billing relationship has been established.
| • | Retail Internet, IPTV and satellite TV subscribers have access to stand-alone services, and are primarily represented by a dwelling unit |
| • | Retail residential NAS subscribers are based on a line count and are represented by a unique telephone number |
BCE Supplementary Financial Information - First Quarter 2021 Page 16
Exhibit 99.3

Form 52-109F2 – Certification of Interim Filings - Full Certificate
I, Mirko Bibic, President and Chief Executive Officer of BCE Inc., certify the following:
1. Review: I have reviewed the interim financial report and interim MD&A (together, the “interim filings”) of BCE Inc. (the “issuer”) for the interim period ended March 31, 2021.
2. No misrepresentations: Based on my knowledge, having exercised reasonable diligence, the interim filings do not contain any untrue statement of a material fact or omit to state a material fact required to be stated or that is necessary to make a statement not misleading in light of the circumstances under which it was made, with respect to the period covered by the interim filings.
3. Fair presentation: Based on my knowledge, having exercised reasonable diligence, the interim financial report together with the other financial information included in the interim filings fairly present in all material respects the financial condition, financial performance and cash flows of the issuer, as of the date of and for the periods presented in the interim filings.
4. Responsibility: The issuer’s other certifying officer(s) and I are responsible for establishing and maintaining disclosure controls and procedures (DC&P) and internal control over financial reporting (ICFR), as those terms are defined in National Instrument 52-109 Certification of Disclosure in Issuers’ Annual and Interim Filings, for the issuer.
5. Design: Subject to the limitations, if any, described in paragraphs 5.2 and 5.3, the issuer’s other certifying officer(s) and I have, as at the end of the period covered by the interim filings
| A. | designed DC&P, or caused it to be designed under our supervision, to provide reasonable assurance that |
| I. | material information relating to the issuer is made known to us by others, particularly during the period in which the interim filings are being prepared; and |
| II. | information required to be disclosed by the issuer in its annual filings, interim filings or other reports filed or submitted by it under securities legislation is recorded, processed, summarized and reported within the time periods specified in securities legislation; and |
| B. | designed ICFR, or caused it to be designed under our supervision, to provide reasonable assurance regarding the reliability of financial reporting and the preparation of financial statements for external purposes in accordance with the issuer’s GAAP. |
5.1 Control framework: The control framework the issuer’s other certifying officer(s) and I used to design the issuer’s ICFR is the Internal Control-Integrated Framework (2013) issued by the Committee of Sponsoring Organizations of the Treadway Commission (COSO).
5.2 N/A
5.3 N/A
6. Reporting changes in ICFR: The issuer has disclosed in its interim MD&A any change in the issuer’s ICFR that occurred during the period beginning on January 1, 2021 and ended on March 31, 2021 that has materially affected, or is reasonably likely to materially affect, the issuer’s ICFR.
Date: April 29, 2021
| (signed) Mirko Bibic | ||
| Mirko Bibic | ||
| President and Chief Executive Officer |

Form 52-109F2 – Certification of Interim Filings - Full Certificate
I, Glen LeBlanc, Executive Vice-President and Chief Financial Officer of BCE Inc., certify the following:
1. Review: I have reviewed the interim financial report and interim MD&A (together, the “interim filings”) of BCE Inc. (the “issuer”) for the interim period ended March 31, 2021.
2. No misrepresentations: Based on my knowledge, having exercised reasonable diligence, the interim filings do not contain any untrue statement of a material fact or omit to state a material fact required to be stated or that is necessary to make a statement not misleading in light of the circumstances under which it was made, with respect to the period covered by the interim filings.
3. Fair presentation: Based on my knowledge, having exercised reasonable diligence, the interim financial report together with the other financial information included in the interim filings fairly present in all material respects the financial condition, financial performance and cash flows of the issuer, as of the date of and for the periods presented in the interim filings.
4. Responsibility: The issuer’s other certifying officer(s) and I are responsible for establishing and maintaining disclosure controls and procedures (DC&P) and internal control over financial reporting (ICFR), as those terms are defined in National Instrument 52-109 Certification of Disclosure in Issuers’ Annual and Interim Filings, for the issuer.
5. Design: Subject to the limitations, if any, described in paragraphs 5.2 and 5.3, the issuer’s other certifying officer(s) and I have, as at the end of the period covered by the interim filings
| A. | designed DC&P, or caused it to be designed under our supervision, to provide reasonable assurance that |
| I. | material information relating to the issuer is made known to us by others, particularly during the period in which the interim filings are being prepared; and |
| II. | information required to be disclosed by the issuer in its annual filings, interim filings or other reports filed or submitted by it under securities legislation is recorded, processed, summarized and reported within the time periods specified in securities legislation; and |
| B. | designed ICFR, or caused it to be designed under our supervision, to provide reasonable assurance regarding the reliability of financial reporting and the preparation of financial statements for external purposes in accordance with the issuer’s GAAP. |
5.1 Control framework: The control framework the issuer’s other certifying officer(s) and I used to design the issuer’s ICFR is the Internal Control-Integrated Framework (2013) issued by the Committee of Sponsoring Organizations of the Treadway Commission (COSO).
5.2 N/A
5.3 N/A
6. Reporting changes in ICFR: The issuer has disclosed in its interim MD&A any change in the issuer’s ICFR that occurred during the period beginning on January 1, 2021 and ended on March 31, 2021 that has materially affected, or is reasonably likely to materially affect, the issuer’s ICFR.
Date: April 29, 2021
| (signed) Glen LeBlanc | ||
| Glen LeBlanc | ||
| Executive Vice-President and Chief Financial Officer |
Exhibit 99.4

|

|
For immediate release
This news release contains forward-looking statements. For a description of the related risk factors and assumptions, please see the section entitled “Caution Regarding Forward-Looking Statements” later in this news release.
BCE reports first quarter 2021 results
| ● | BCE revenue grows 1.2%, adjusted EBITDA up 0.5%, representing the first quarter of growth since the beginning of the COVID-19 crisis |
| ● | Broadband additions up 51% year over year – 108,468 total combined wireless mobile phone and mobile connected device, retail Internet and IPTV net additions |
| ● | 32,925 postpaid mobile phone net additions, up 31,366; net mobile connected device additions grew 51% to 74,159 |
| ● | 21,208 retail Internet net additions with 12% Internet revenue growth; 10,696 IPTV net additions represent first quarter of year-over-year growth since Q1 2019 |
| ● | Broadband network acceleration program under way with over $1 billion in capital invested in Q1; on track to reach up to 6.9 million total fibre and WHI connections by year end |
| ● | Strong financial position with $6.5 billion of available liquidity at the end of Q1; cash flows from operating activities up 37.3% to $1,992 million, driving 54% higher year-over-year free cash flow of $940 million |
| ● | Net earnings of $687 million with net earnings attributable to common shareholders of $642 million, or $0.71 per common share; adjusted net earnings of $704 million generated adjusted EPS of $0.78, down 1.3% |
MONTRÉAL, April 29, 2021 – BCE Inc. (TSX, NYSE: BCE) today reported results for the first quarter (Q1), including the first quarter of positive revenue and adjusted EBITDA growth since the beginning of the COVID-19 crisis, and significant progress in Bell’s broadband network acceleration program.
“As we celebrate the 141st anniversary of Bell’s founding in Montréal today, our Q1 results highlight how the Bell team continues to step up to support our customers and communities in 2021. Keeping the country connected and informed while building momentum in a recovering economy, Bell delivered continued sequential quarterly improvement in our results, including positive revenue and adjusted EBITDA growth for the first time since the beginning of the COVID crisis,” said Mirko Bibic, President and CEO of BCE Inc. and Bell Canada. “As we all deal with the ongoing social and economic challenges of COVID-19, Bell is focused on advancing how Canadians connect with each other and the world. Building the best networks, launching innovative services and delivering the most compelling content is supporting an improved growth trajectory for Canada’s largest communications company and delivering positive benefits for all our stakeholders.”
“The speed and quality of our networks, the exclusive services that leverage them and our team’s commitment to champion customer experience helped grow Bell’s broadband market share in Q1 with 108,468 net new mobile, retail Internet and IPTV customers – a 51% increase over Q1 last year – alongside continued leadership in traditional and digital media platforms,” said Mr. Bibic. “We’re building on this success with our accelerated fibre, rural and 5G network rollout program now under way to support Canada’s ongoing recovery and long-term broadband
1/14
leadership, reflected in our significantly increased capital investment and network connection numbers in Q1, as we also continue to invest in our communities. Consistently ranked as one of Canada’s greenest companies and a key enabler of a sustainable economy, Bell is leading the way in international environmental certification and our commitment to carbon neutral operations in 2025. With the continuing crisis impacting the mental health of students across the country, Bell Let’s Talk was proud to invest in colleges and universities across the country to support their rollout of new mental health national standards for post-secondary students.”
KEY BUSINESS DEVELOPMENTS
Bell’s continued ESG leadership
Bell was again named one of Canada’s Greenest Employers, the only national communications provider to be ranked for a fifth straight year; became the first North American communications company to receive ISO 50001 certification for energy management; and announced our plan to achieve carbon neutral operations in 2025. Bell launched commercial availability of highly energy efficient 400G wavelength service for cloud providers, data centre operators and others moving massive amounts of data; an innovative solar powered cell site project in Abitibi-Témiscamingue; and trials of aluminium tower structures sourced from local materials in Saguenay. With COVID-19 heightening mental health impacts on students on campus and studying remotely across Canada, the Bell Let’s Talk Post-Secondary Fund announced more than $3 million in grants to 123 colleges and universities nationwide to support implementation of the National Standard of Canada for Mental Health and Well-Being for Post-Secondary Students and the Québec Action Plan on Student Mental Health for Higher Education.
Build the best networks: Top speeds, coverage acceleration
Executing our accelerated network investment plan, Bell increased capital expenditures by 30% compared to Q1 2020, delivering even more broadband connections to help enable Canada’s social and economic recovery from COVID-19. Canada’s fastest-ranked network, Bell 5G coverage grew to more than 30% of the national population in Q1, and we brought fibre and rural Wireless Home Internet access to 148,000 more homes and businesses. Bell announced new partnerships with the federal and provincial governments to bring broadband access to hard-to-serve areas, including Québec’s Operation High Speed project, the federal Universal Broadband Fund and multiple initiatives in Atlantic Canada.
Driving growth with innovative services
Leading the way in 5G service innovation, we launched TSN 5G View / Vision 5G RDS, an immersive in-game sports viewing experience powered by the Bell 5G network. The feature lets fans control how they watch the action directly from their Bell smartphones, including Montreal Canadiens and Toronto Maple Leafs home games, while enhancing TSN and RDS broadcasts with announcer and analyst up-close access through the service’s 80 in-arena cameras. Bell and Honda Canada announced a new connected car partnership equipping Honda and Acura vehicles with Built-in Wi-Fi hotspots powered by the Bell LTE network.
Champion customer experience
Our focus on making it easier to do business with Bell continues to drive industry-leading improvement according to the mid-year report from the Commission for Complaints for Telecom-television Services (CCTS). For 6 years in a row, Bell has led all major Canadian carriers in reducing customer complaints to the CCTS – which again dropped 17% from August 2020 to January 2021. Our high-profile support for customers and communities throughout the COVID crisis is reflected in Bell remaining the most valuable communications brand in Canada in the latest Brand Finance report.
2/14
Deliver the most compelling content
Leveraging our content and digital leadership, Bell Media and AT&T’s Xandr are working together to deliver Canada’s first digital self-serve platform for advertisers. Accelerating media innovation in Québec, Noovo launched the Noovo Info news service, lifestyle destination NoovoMoi.ca and the enhanced Noovo.ca and new Noovo App, offering over 5,000 hours of French-language content from Bell Media channels. High-demand programming like Zack Snyder’s Justice League, the #1 title ever on Crave boosted total Crave subscribers 12% year over year to 2.9 million, while Super Bowl LV attracted the big game’s third-largest Canadian audience ever on CTV, TSN and RDS. Bell and our production partners received 181 nominations for the 2021 Canadian Screen Awards.
BCE Q1 RESULTS
Financial Highlights
| ($ millions except per share amounts) (unaudited) | Q1 2021 | Q1 2020 | % change | |||||||||
| BCE |
||||||||||||
| Operating revenues |
5,706 | 5,640 | 1.2% | |||||||||
| Net earnings |
687 | 733 | (6.3%) | |||||||||
| Net earnings attributable to common shareholders |
642 | 680 | (5.6%) | |||||||||
| Adjusted net earnings(1) |
704 | 714 | (1.4%) | |||||||||
| Adjusted EBITDA(2) |
2,429 | 2,418 | 0.5% | |||||||||
| Net earnings per common share (EPS) |
0.71 | 0.75 | (5.3%) | |||||||||
| Adjusted EPS(1) |
0.78 | 0.79 | (1.3%) | |||||||||
| Cash flows from operating activities |
1,992 | 1,451 | 37.3% | |||||||||
| Capital expenditures |
(1,012) | (777) | (30.2%) | |||||||||
| Free cash flow(3) |
940 | 611 | 53.8% | |||||||||
“Bell’s Q1 results represent a promising start to the year, reflecting significantly better performance trajectories and steady sequential quarterly improvement across all our business segments,” said Glen LeBlanc, Chief Financial Officer for BCE and Bell Canada. ”Bell’s strengthening performance, including ongoing strong free cash flow generation, further solidified our very healthy financial position, with $6.5 billion of available liquidity at the end of Q1 and a historic pension plan solvency surplus position that bodes well for the possibility of a pension contribution holiday on our larger defined benefits plans in the near future. As we re-confirm our guidance targets for 2021. Bell is well positioned to execute our network acceleration plans, including participation in the upcoming federal 5G spectrum auction, while delivering sustainable dividend growth to our shareholders.”
| ● | BCE delivered positive operating revenue growth in Q1 despite the ongoing impacts of COVID-19 on consumer and commercial activity. Total operating revenue was up 1.2% over Q1 2020 to $5,706 million, driven by 18.6% growth in product revenue to $738 million from increased sales of premium mobile phones and business telecom data equipment. Service revenue declined 1.0% to $4,968 million, due mainly to year-over-year declines in wireless roaming, media advertising and business customer spending on wireline services. |
| ● | Net earnings declined 6.3% to $687 million and net earnings attributable to common shareholders totalled $642 million, or $0.71 per share, down 5.6% and 5.3% respectively. |
3/14
| The decreases were due to higher severance, acquisition and other costs as well as higher depreciation and amortization expense, partly offset by higher adjusted EBITDA and higher other income. |
| ● | Adjusted net earnings were $704 million, or $0.78 per common share, down 1.4% and 1.3% respectively from $714 million, or $0.79 per common share, in Q1 2020. |
| ● | Adjusted EBITDA grew 0.5% to $2,429 million, driven by a 2.1% increase at Bell Wireline and partly offset by declines of 0.5% at Bell Wireless and 7.7% at Bell Media. BCE’s consolidated adjusted EBITDA margin decreased 0.3 percentage points to 42.6%, due to the flow-through impact of lower year-over-year service revenue and higher low-margin product sales. |
| ● | BCE capital expenditures increased 30.2% to $1,012 million for a capital intensity(4) ratio of 17.7%, compared to 13.8% in Q1 2020. The year-over-year increase in capital spending is consistent with our 2-year program to accelerate the rollout of Bell’s broadband fibre and Wireless Home Internet networks and the expansion of mobile 5G. |
| ● | BCE cash flows from operating activities totalled $1,992 million, up 37.3% from Q1 2020. The increase was driven by higher cash from working capital and lower income taxes. |
| ● | Free cash flow increased 53.8% to $940 million, compared to $611 million in Q1 2020, due to higher cash flows from operating activities, excluding cash from discontinued operations and acquisition and other costs paid, partly offset by higher capital expenditures. |
BCE OPERATING RESULTS BY SEGMENT
Bell Wireless
Effective January 1, 2021, we changed our reporting of wireless subscriber results and associated operating metrics, such as ABPU and churn, to disclose mobile phones and mobile connected devices, which includes IoT devices, separately. For comparability, we have restated our 2020 quarterly wireless subscriber results and related operating metrics where applicable to reflect these changes. Our revised reporting reflects our strategic focus on higher-value mobile phone subscribers, enhances the transparency of our wireless subscriber metrics disclosure and aligns with industry peers.
| ● | Total wireless operating revenue increased 3.2% to $2,100 million. |
| ● | Service revenue was down 2.1% to $1,514 million, the result of lower roaming revenue due to decreased travel during COVID-19, and reduced data overage as customers continued to adopt plans with higher data thresholds, including unlimited and shareable options. |
| ● | Product revenue increased 20.1% to $586 million, reflecting a greater sales mix of premium mobile phones and stronger year-over-year consumer electronic sales at The Source, including significantly increased online shopping. |
| ● | Reflecting the decreases in high-margin roaming and data overage revenue, wireless adjusted EBITDA decreased 0.5% to $923 million, resulting in a 1.6 percentage-point drop in margin to 44.0%. |
| ● | Bell added 2,405 total net new postpaid and prepaid mobile phone customers(4), compared to a net loss of 2,496 in Q1 last year. |
| ● | Postpaid mobile phone net additions totalled 32,925, up from 1,559 in Q1 2020. The significant year-over-year improvement reflects an 18.8% increase in gross additions, due to our emphasis on higher-value accretive smartphone transactions and higher sales through direct channels. Postpaid mobile phone customer churn remained stable at 0.89%. |
| ● | Bell’s prepaid mobile phone base decreased by 30,520 net subscribers, compared to a net loss of 4,055 in Q1 2020. Lower overall market activity reflected a slowdown in immigration and international travel to Canada during COVID-19, as well as reduced retail store traffic, |
4/14
| resulting in 26.5% fewer gross additions compared to last year. Mobile phone prepaid customer churn improved 0.35 percentage points to 4.68%. |
| ● | Bell’s mobile phone customer base totalled 9,166,748 at the end of Q1, a 2.2% increase over last year, comprising 8,361,264 postpaid subscribers, up 2.3%, and 805,484 prepaid customers, up 1.5%. |
| ● | Mobile phone blended average billing per user (ABPU) decreased 3.4% to $70.34, reflecting reduced roaming and reductions in data overage revenue. |
| ● | Mobile connected device net activations increased 51.5% to 74,159 with increased demand for Bell IoT solutions, including connected car subscriptions. Mobile connected device subscribers totalled 2,130,312 at the end of Q1, an increase of 13.5% over last year. |
Bell Wireline
| ● | Total wireline operating revenue increased 1.5% in Q1 to $3,081 million. |
| ● | Despite lower spending by large business customers and volume declines in small business due to COVID-19, wireline service revenue was up 0.9% to $2,927 million as Internet revenue increased 12% over last year. |
| ● | Product revenue increased 14.1% to $154 million compared to Q1 2020, due mainly to higher sales of data equipment to the government sector. |
| ● | Wireline adjusted EBITDA grew 2.1% to $1,363 million, reflecting the flow-through of higher year-over-year revenue. This drove a 0.2 percentage-point improvement in margin to 44.2%. Consistent with the year-over-year growth in revenue, operating costs increased 1.0%. |
| ● | Bell added 21,208 new retail Internet customers, compared to 22,595 in Q1 2020. Within Bell’s direct fibre footprint, retail Internet net additions were 36,806, up 43.2%. Retail Internet customers totalled 3,730,576 at the end of Q1, a 4.3% increase over Q1 last year. |
| ● | Bell TV added 10,696 net new retail IPTV subscribers, up from 2,852 in Q1 2020, representing our first quarter of year-over-year growth in 2 years. The positive result reflects improved Bell Fibe TV performance, strong demand for the new Virgin TV service and lower customer churn, particularly in our IPTV fibre footprint. |
| ● | Retail satellite TV net customer losses improved 7.5% to 19,808, due to fewer customer deactivations during COVID-19 and improved small business net activations. |
| ● | At the end of Q1, Bell had a combined total of 2,723,368 retail IPTV and satellite TV subscribers, down 1.1% from Q1 2020. |
| ● | Retail residential NAS net losses improved 17.1% to 51,069, reflecting fewer customer deactivations during COVID-19. Bell’s retail residential NAS customer base totalled 2,432,863 at the end of Q1, a 7.7% decline from last year. |
Bell Media
| ● | Media operating revenue decreased 5.2% to $713 million, due to continued weak advertiser spending in out of home and radio, partly offset by higher year-over-year TV advertising driven by stronger sports and news specialty performance, and the incremental contribution from our French-language network Noovo. |
| ● | Subscriber revenue was slightly lower compared to Q1 2020, due to the timing of contract renewals with some Canadian TV distributors that was largely offset by higher revenue from Crave streaming subscriber growth. Crave subscribers increased 12% over last year to surpass 2.9 million total customers in Q1. |
| ● | TSN remained Canada’s #1 sports network and top specialty channel overall in Q1, and made history with the first all-female broadcast team of an NBA game in March; RDS remained the top French-language sports network with strong growth in key audiences. |
5/14
| ● | Noovo also grew its market share with key demographics by 3.7 points and increased primetime viewership by 34%. |
| ● | Adjusted EBITDA decreased 7.7% to $143 million due to the flow-through impact of lower revenue, resulting in a 0.5 percentage point reduction in margin to 20.1%. This was partly offset by a 4.5% improvement in operating costs, reflecting TV production shutdowns and delays, labour savings and the temporary waiving of CRTC Part I and Part II broadcasting licence fees due to COVID-19. |
COMMON SHARE DIVIDEND
BCE’s Board of Directors has declared a quarterly dividend of $0.875 per common share, payable on July 15, 2021 to shareholders of record at the close of business on June 15, 2021.
OUTLOOK FOR 2021
BCE confirmed its financial guidance targets for 2021, as provided on February 4, 2021, as follows:
|
February 4 |
April 29 Guidance | |||||
| Revenue growth |
2% – 5% | On track | ||||
| Adjusted EBITDA growth |
2% – 5% | On track | ||||
| Capital intensity |
18% – 20% | On track | ||||
| Adjusted EPS growth |
1% – 6% | On track | ||||
| Free cash flow ($M) |
$2,850 – $3,200 | On track | ||||
| Annualized common dividend per share |
$3.50 | $3.50 | ||||
Due to uncertainties relating to the severity and duration of the COVID-19 pandemic, including the current resurgence and possible future resurgences in the number of COVID-19 cases, and various potential outcomes, it is difficult at this time to estimate the impacts of the COVID-19 pandemic on our business or future financial results and related assumptions. Our business and financial results could continue to be significantly and negatively impacted in future periods. The extent to which the COVID-19 pandemic will continue to adversely impact us will depend on future developments that are difficult to predict, including the prevalence of COVID-19 variants that are more contagious and may lead to increased health risks, the timely distribution of effective vaccines and treatments, and the potential development and distribution of new vaccines and treatments, as well as new information which may emerge concerning the severity, duration and resurgences of the COVID-19 pandemic and the actions required to contain the coronavirus or remedy its impacts, among others. Please see the section entitled “Caution Regarding Forward-Looking Statements” later in this news release for a description of the principal assumptions on which BCE’s 2021 financial guidance targets are based, as well as the principal related risk factors.
CALL WITH FINANCIAL ANALYSTS
BCE will hold a conference call for financial analysts to discuss Q1 2021 results on Thursday, April 29 at 8:00 am eastern. Media are welcome to participate on a listen-only basis. To participate, please dial toll-free 1-800-806-5484 or 416-340-2217 and enter passcode 9028147#. A replay will be available until midnight on May 29, 2021 by dialing 1-800-408-3053 or 905-694-9451 and entering passcode 1119668#.
6/14
A live audio webcast of the conference call will be available on BCE’s website at BCE Q1-2021 conference call.
NOTES
The information contained in this news release is unaudited.
(1) The terms adjusted net earnings and adjusted EPS do not have any standardized meaning under IFRS. Therefore, they are unlikely to be comparable to similar measures presented by other issuers. We define adjusted net earnings as net earnings attributable to common shareholders before severance, acquisition and other costs, net mark-to-market losses (gains) on derivatives used to economically hedge equity settled share-based compensation plans, net losses (gains) on investments, early debt redemption costs, impairment of assets and discontinued operations, net of tax and non-controlling interest (NCI). We define adjusted EPS as adjusted net earnings per BCE common share. We use adjusted net earnings and adjusted EPS, and we believe certain investors and analysts use these measures, among other ones, to assess the performance of our businesses without the effects of severance, acquisition and other costs, net mark-to-market losses (gains) on derivatives used to economically hedge equity settled share-based compensation plans, net losses (gains) on investments, early debt redemption costs, impairment of assets and discontinued operations, net of tax and NCI. We exclude these items because they affect the comparability of our financial results and could potentially distort the analysis of trends in business performance. Excluding these items does not imply they are non-recurring. The most comparable IFRS financial measures are net earnings attributable to common shareholders and EPS. The following table is a reconciliation of net earnings attributable to common shareholders and EPS to adjusted net earnings on a consolidated basis and per BCE common share (adjusted EPS), respectively.
| ($ millions except per share amounts) | ||||||||||||||||
| Q1 2021 | Q1 2020 | |||||||||||||||
| TOTAL | PER SHARE | TOTAL | PER SHARE | |||||||||||||
| Net earnings attributable to common shareholders |
642 | 0.71 | 680 | 0.75 | ||||||||||||
| Severance, acquisition and other costs | 65 | 0.07 | 12 | 0.01 | ||||||||||||
| Net mark-to-market (gains) losses on derivatives used to economically hedge equity settled share-based compensation plans | (44) | (0.04) | 20 | 0.03 | ||||||||||||
| Net gains on investments | - | - | (10) | (0.01) | ||||||||||||
| Early debt redemption costs | 39 | 0.04 | 12 | 0.01 | ||||||||||||
| Impairment of assets | 2 | - | 5 | 0.01 | ||||||||||||
| Net earnings from discontinued operations | - | - | (5) | (0.01) | ||||||||||||
|
Adjusted net earnings |
704 | 0.78 | 714 | 0.79 | ||||||||||||
(2) The terms adjusted EBITDA and adjusted EBITDA margin do not have any standardized meaning under IFRS. Therefore, they are unlikely to be comparable to similar measures presented by other issuers. We define adjusted EBITDA as operating revenues less operating costs, as shown in BCE’s consolidated income statements. Adjusted EBITDA for BCE’s segments is the same as segment profit as reported in Note 3, Segmented information, in BCE’s Q1 2021 consolidated Financial Statements. We define adjusted EBITDA margin as
7/14
adjusted EBITDA divided by operating revenues. We use adjusted EBITDA and adjusted EBITDA margin to evaluate the performance of our businesses as they reflect their ongoing profitability. We believe certain investors and analysts use adjusted EBITDA to measure a company’s ability to service debt and to meet other payment obligations or as a common measurement to value companies in the telecommunications industry. We believe that certain investors and analysts also use adjusted EBITDA and adjusted EBITDA margin to evaluate the performance of our businesses. Adjusted EBITDA is also one component in the determination of short-term incentive compensation for all management employees. Adjusted EBITDA and adjusted EBITDA margin have no directly comparable IFRS financial measure. Alternatively, the following table provides a reconciliation of net earnings to adjusted EBITDA.
| ($ millions) | ||||||||
| Q1 2021 | Q1 2020 | |||||||
| Net earnings |
687 | 733 | ||||||
| Severance, acquisition and other costs |
89 | 16 | ||||||
| Depreciation |
895 | 858 | ||||||
| Amortization |
238 | 230 | ||||||
| Finance costs |
||||||||
| Interest expense |
267 | 277 | ||||||
| Interest on post-employment benefit obligations |
5 | 12 | ||||||
| Impairment of assets |
3 | 7 | ||||||
| Other (income) expense |
(8) | 47 | ||||||
| Income taxes |
253 | 243 | ||||||
| Net earnings from discontinued operations |
- | (5) | ||||||
|
Adjusted EBITDA |
2,429 | 2,418 | ||||||
|
BCE operating revenues |
5,706 | 5,640 | ||||||
|
Adjusted EBITDA margin |
42.6% | 42.9% | ||||||
|
|
||||||||
(3) The term free cash flow does not have any standardized meaning under IFRS. Therefore, it is unlikely to be comparable to similar measures presented by other issuers. We define free cash flow as cash flows from operating activities, excluding cash from discontinued operations, acquisition and other costs paid (which include significant litigation costs) and voluntary pension funding, less capital expenditures, preferred share dividends and dividends paid by subsidiaries to NCI. We exclude cash from discontinued operations, acquisition and other costs paid and voluntary pension funding because they affect the comparability of our financial results and could potentially distort the analysis of trends in business performance. Excluding these items does not imply they are non-recurring. We consider free cash flow to be an important indicator of the financial strength and performance of our businesses because it shows how much cash is available to pay dividends on common shares, repay debt and reinvest in our company. We believe certain investors and analysts use free cash flow to value a business and its underlying assets and to evaluate the financial strength and performance of our businesses. The most comparable IFRS financial measure is cash flows from operating activities. The following table is a reconciliation of cash flows from operating activities to free cash flow on a consolidated basis.
8/14
| ($ millions) | ||||||||||||
| Q1 2021 | Q1 2020 | |||||||||||
| Cash flows from operating activities |
1,992 | 1,451 | ||||||||||
| Capital expenditures |
(1,012) | (777) | ||||||||||
| Cash dividends paid on preferred shares |
(31) | (36) | ||||||||||
| Cash dividends paid by subsidiaries to NCI |
(13) | (14) | ||||||||||
| Acquisition and other costs paid |
4 | 9 | ||||||||||
| Cash from discontinued operations (included in cash flows from operating activities) |
- | (22) | ||||||||||
| Free cash flow |
940 | 611 | ||||||||||
(4) We use ABPU, churn, capital intensity and subscriber units to measure the success of our strategic imperatives. These key performance indicators are not accounting measures and may not be comparable to similar measures presented by other issuers.
CAUTION REGARDING FORWARD-LOOKING STATEMENTS
Certain statements made in this news release are forward-looking statements. These statements include, without limitation, statements relating to BCE’s financial guidance (including revenues, adjusted EBITDA, capital intensity, adjusted EPS and free cash flow), BCE’s 2021 annualized common share dividend, BCE’s network deployment and capital investment plans, including its two-year increased capital investment program to accelerate broadband network and 5G footprint expansion, the potential impacts on our business, financial condition, liquidity and financial results of the COVID-19 pandemic, our post-employment benefit plans funding, BCE’s business outlook, objectives, plans and strategic priorities, and other statements that are not historical facts. Forward-looking statements are typically identified by the words assumption, goal, guidance, objective, outlook, project, strategy, target and other similar expressions or future or conditional verbs such as aim, anticipate, believe, could, expect, intend, may, plan, seek, should, strive and will. All such forward-looking statements are made pursuant to the ‘safe harbour’ provisions of applicable Canadian securities laws and of the United States Private Securities Litigation Reform Act of 1995.
Forward-looking statements, by their very nature, are subject to inherent risks and uncertainties and are based on several assumptions, both general and specific, which give rise to the possibility that actual results or events could differ materially from our expectations expressed in or implied by such forward-looking statements and that our business outlook, objectives, plans and strategic priorities may not be achieved. These statements are not guarantees of future performance or events, and we caution you against relying on any of these forward-looking statements. The forward-looking statements contained in this news release describe our expectations as of April 29, 2021 and, accordingly, are subject to change after such date. Except as may be required by applicable securities laws, we do not undertake any obligation to update or revise any forward-looking statements contained in this news release, whether as a result of new information, future events or otherwise. From time to time, we consider potential acquisitions, dispositions, mergers, business combinations, investments, monetizations, joint ventures and other transactions, some of which may be significant. Except as otherwise indicated by us, forward-looking statements do not reflect the potential impact of any such transactions or of special items that may be announced or that may occur after April 29, 2021. The financial impact of these transactions and special items can be complex and depends on the facts particular to each of them. We therefore cannot describe the expected impact in a meaningful way or in the same way we present known risks affecting our business. Forward-
9/14
looking statements are presented in this news release for the purpose of assisting investors and others in understanding certain key elements of our expected financial results, as well as our objectives, strategic priorities and business outlook, and in obtaining a better understanding of our anticipated operating environment. Readers are cautioned that such information may not be appropriate for other purposes.
Material Assumptions
A number of economic, market, operational and financial assumptions were made by BCE in preparing its forward-looking statements contained in this news release, including, but not limited to the following:
Canadian Economic Assumptions
Our forward-looking statements are based on certain assumptions concerning the Canadian economy, which in turn depend on important assumptions about how the COVID-19 pandemic will evolve, including the progress of the global vaccination rollout. Notably, it is assumed that broad immunity is achieved by mid-2021 in the U.S.; later in 2021 in Canada, other advanced economies and China; and in 2022 in other emerging-market economies. In particular, we have assumed:
| ● | Strong rebound in economic growth as the economy recovers from the significant impacts of the COVID-19 pandemic, given the Bank of Canada’s most recent estimated growth in Canadian gross domestic product of around 6.5% on average in 2021, representing an increase from the earlier estimate of around 4% |
| ● | Improving consumer confidence as vaccinations roll out and restrictions are eased |
| ● | Strengthening business investment outside the oil and gas sector as uncertainty recedes |
| ● | Employment gains expected in 2021, despite ongoing challenges in some sectors |
| ● | Accelerating trend toward e-commerce |
| ● | Low immigration levels until international travel and/or health-related restrictions are lifted |
| ● | Prevailing low interest rates expected to remain at or near current levels for the foreseeable future |
| ● | Canadian dollar expected to remain at or near current levels. Further movements may be impacted by the degree of strength of the U.S. dollar, interest rates and changes in commodity prices. |
Canadian Market Assumptions
Our forward-looking statements also reflect various Canadian market assumptions. In particular, we have made the following market assumptions:
| ● | A consistently high level of wireline and wireless competition in consumer, business and wholesale markets |
| ● | Higher, but slowing, wireless industry penetration |
| ● | A shrinking data and voice connectivity market as business customers migrate to lower-priced traditional telecommunications solutions or alternative OTT competitors |
| ● | While the advertising market continues to be adversely impacted by cancelled or delayed advertising campaigns from many sectors due to the economic downturn during the COVID-19 pandemic, we do expect gradual recovery in 2021 |
| ● | Declines in broadcasting distribution undertakings (BDU) subscribers driven by increasing competition from the continued rollout of subscription video on demand (SVOD) streaming services together with further scaling of OTT aggregators |
Assumptions Concerning our Bell Wireless Segment
10/14
Our forward-looking statements are also based on the following internal operational assumptions with respect to our Bell Wireless segment:
| ● | Maintain our market share of national operators’ wireless postpaid net additions |
| ● | Continued growth of our prepaid subscriber base |
| ● | Continued adoption of smartphone devices, tablets and data applications, as well as the introduction of more 5G, 4G LTE and LTE Advanced devices and new data services |
| ● | Continued deployment of 5G wireless network offering coverage that is competitive with other national operators in centres across Canada |
| ● | Improvement in subscriber acquisition and retention spending, enabled by increasing adoption of device financing plans |
| ● | Unfavourable impact on mobile phone blended ABPU, driven by reduced outbound roaming revenue due to travel restrictions as a result of the COVID-19 pandemic, reduced data overage revenue due to continued adoption of unlimited plans and the impact of a higher prepaid mix in our overall subscriber base |
| ● | Increased adoption of unlimited data plans and device financing plans |
| ● | No material financial, operational or competitive consequences of changes in regulations affecting our wireless business |
Assumptions Concerning our Bell Wireline Segment
Our forward-looking statements are also based on the following internal operational assumptions with respect to our Bell Wireline segment:
| ● | Continued growth in retail Internet and IPTV subscribers |
| ● | Increasing wireless and Internet-based technological substitution |
| ● | Continued aggressive residential service bundle offers from cable TV competitors in our local wireline areas |
| ● | Continued large business customer migration to IP-based systems |
| ● | Ongoing competitive repricing pressures in our business and wholesale markets |
| ● | Continued competitive intensity in our small and medium-sized business markets as cable operators and other telecommunications competitors continue to intensify their focus on business customers |
| ● | Traditional high-margin product categories challenged by large global cloud and OTT providers of business voice and data solutions expanding into Canada with on-demand services |
| ● | Accelerating customer adoption of OTT services resulting in downsizing of TV packages |
| ● | Further deployment of direct fibre to more homes and businesses within our wireline footprint and fixed WTTP technology in rural communities |
| ● | Growing consumption of OTT TV services and on-demand streaming video, as well as the proliferation of devices, such as tablets, that consume large quantities of bandwidth, will require ongoing capital investment |
| ● | Realization of cost savings related to management workforce reductions including attrition and retirements, lower contracted rates from our suppliers, operating efficiencies enabled by a growing direct fibre footprint, changes in consumer behaviour and product innovation, new call centre technology that is enabling self-serve capabilities, and other improvements to the customer service experience |
| ● | No material financial, operational or competitive consequences of changes in regulations affecting our wireline business |
Assumptions Concerning our Bell Media Segment
Our forward-looking statements are also based on the following internal operational assumptions with respect to our Bell Media segment:
11/14
| ● | Overall revenue is expected to reflect a gradual economic recovery in 2021 combined with subscriber revenue growth and strategic pricing on advertising sales. However, revenue performance is expected to continue to be negatively impacted by the effects of the COVID-19 pandemic on many sectors of the economy. |
| ● | Continued escalation of media content costs to secure quality programming, as well as the return of sports and entertainment programming; however, in the short term, savings can still be expected due to production delays, shortened sports seasons, and possible cancellations from the ongoing COVID-19 pandemic |
| ● | Continued scaling of Crave through broader content offering and user experience improvements |
| ● | Investment in Noovo news and more French-language original content to better serve our French-language customers with a wider array of content, in the language of their choice, on their preferred platforms |
| ● | Enhanced market-leading attribution through our Strategic Audience Management (SAM) tool |
| ● | Ability to successfully acquire and produce highly rated programming and differentiated content |
| ● | Building and maintaining strategic supply arrangements for content across all screens and platforms |
| ● | Continued monetization of content rights and Bell Media properties across all platforms |
| ● | No material financial, operational or competitive consequences of changes in regulations affecting our media business |
Financial Assumptions Concerning BCE
Our forward-looking statements are also based on the following internal financial assumptions with respect to BCE for 2021:
| ● | Total post-employment benefit plans cost to be approximately $300 million, based on an estimated accounting discount rate of 2.6%, comprised of an estimated above adjusted EBITDA post-employment benefit plans service cost of approximately $275 million and an estimated below adjusted EBITDA net post-employment benefit plans financing cost of approximately $25 million |
| ● | Increase in depreciation and amortization expense of approximately $200 million to $250 million compared to 2020 |
| ● | Interest expense and payments of approximately $1,050 million to $1,100 million |
| ● | An effective tax rate of approximately 27% |
| ● | NCI of approximately $60 million |
| ● | Total cash pension and other post-employment benefit plan funding of approximately $350 million to $375 million |
| ● | Cash income taxes of approximately $800 million to $900 million |
| ● | Average number of BCE common shares outstanding of approximately 905 million |
| ● | An annual common share dividend of $3.50 per share |
The foregoing assumptions, although considered reasonable by BCE on April 29, 2021, may prove to be inaccurate. Accordingly, our actual results could differ materially from our expectations as set forth in this news release.
Material Risks
Important risk factors that could cause our assumptions and estimates to be inaccurate and actual results or events to differ materially from those expressed in, or implied by, our forward-looking statements, including our 2021 financial guidance, are listed below. The realization of
12/14
our forward-looking statements, including our ability to meet our 2021 financial guidance targets, essentially depends on our business performance, which, in turn, is subject to many risks. Accordingly, readers are cautioned that any of the following risks could have a material adverse effect on our forward-looking statements. These risks include, but are not limited to: the COVID-19 pandemic and the adverse effects from the emergency measures implemented or to be implemented as a result thereof, as well as other pandemics, epidemics and other health risks; adverse economic and financial market conditions, a declining level of retail and commercial activity, and the resulting negative impact on the demand for, and prices of, our products and services; the intensity of competitive activity including from new and emerging competitors; the level of technological substitution and the presence of alternative service providers contributing to the acceleration of disruptions and disintermediation in each of our business segments; changing viewer habits and the expansion of OTT TV and other alternative service providers, as well as the fragmentation of, and changes in, the advertising market; rising content costs and challenges in our ability to acquire or develop key content; the proliferation of content piracy; higher Canadian smartphone penetration and reduced or slower immigration flow; regulatory initiatives, proceedings and decisions, government consultations and government positions that affect us and influence our business; the inability to protect our physical and non-physical assets from events such as information security attacks, unauthorized access or entry, fire and natural disasters; the failure to transform our operations, enabling a truly customer-centric service experience, while lowering our cost structure; the failure to continue investment in next-generation capabilities in a disciplined and strategic manner; the inability to drive a positive customer experience; the complexity in our operations; the failure to maintain operational networks in the context of significant increases in capacity demands; the risk that we may need to incur significant capital expenditures to provide additional capacity and reduce network congestion; the failure to implement or maintain highly effective information technology (IT) systems; the failure to generate anticipated benefits from our corporate restructurings, system replacements and upgrades, process redesigns, staff reductions and the integration of business acquisitions; events affecting the functionality of, and our ability to protect, test, maintain, replace and upgrade, our networks, IT systems, equipment and other facilities; in-orbit and other operational risks to which the satellites used to provide our satellite TV services are subject; the failure to attract and retain employees with the appropriate skill sets and to drive their performance in a safe environment; labour disruptions and shortages; our dependence on third-party suppliers, outsourcers and consultants to provide an uninterrupted supply of the products and services we need to operate our business; the failure of our vendor selection, governance and oversight processes; security and data leakage exposure if security control protocols affecting our suppliers are bypassed; the quality of our products and services and the extent to which they may be subject to manufacturing defects or fail to comply with applicable government regulations and standards; the inability to access adequate sources of capital and generate sufficient cash flows from operating activities to meet our cash requirements, fund capital expenditures and provide for planned growth; uncertainty as to whether dividends will be declared by BCE’s board of directors or whether the dividend on common shares will be increased; the inability to manage various credit, liquidity and market risks; pension obligation volatility and increased contributions to post-employment benefit plans; new or higher taxes due to new tax laws or changes thereto or in the interpretation thereof, and the inability to predict the outcome of government audits; the failure to reduce costs, as well as unexpected increases in costs; the failure to evolve practices to effectively monitor and control fraudulent activities; unfavourable resolution of legal proceedings and, in particular, class actions; new or unfavourable changes in applicable laws and the failure to proactively address our legal and regulatory obligations; the failure to recognize and adequately respond to climate change concerns or stakeholder and governmental changing expectations on environmental matters;
13/14
and health concerns about radiofrequency emissions from wireless communication devices and equipment.
We caution that the foregoing list of risk factors is not exhaustive and other factors could also adversely affect our results. We encourage investors to also read BCE’s 2020 Annual MD&A dated March 4, 2021 (included in BCE’s 2020 Annual Report) and BCE’s 2021 First Quarter MD&A dated April 28, 2021 for additional information with respect to certain of these and other assumptions and risks, filed by BCE with the Canadian provincial securities regulatory authorities (available at Sedar.com) and with the U.S. Securities and Exchange Commission (available at SEC.gov). These documents are also available at BCE.ca.
About BCE
BCE is Canada’s largest communications company, providing advanced Bell broadband wireless, TV, Internet and business communications services alongside the country’s premier content creation and media assets from Bell Media. To learn more, please visit Bell.ca or BCE.ca.
Bell supports the social and economic prosperity of our communities with a commitment to the highest environmental, social and governance (ESG) standards. We measure our progress in increasing environmental sustainability, achieving a diverse and inclusive workplace, leading data governance and protection, and building stronger and healthier communities. This includes confronting the challenge of mental illness with the Bell Let’s Talk initiative, which drives mental health awareness and action with programs like the annual Bell Let’s Talk Day and Bell funding for community care, research and workplace programs nationwide all year round.
Media inquiries:
Marie-Eve Francoeur
514-391-5263
Investor inquiries:
Thane Fotopoulos
514-870-4619
14/14
Exhibit 99.5
NOTICE OF RELIANCE
SECTION 13.4 OF NATIONAL INSTRUMENT 51-102
CONTINUOUS DISCLOSURE OBLIGATIONS
| To: | Alberta Securities Commission |
British Columbia Securities Commission
Manitoba Securities Commission
Financial and Consumer Services Commission, New Brunswick
Office of the Superintendent of Securities, Newfoundland and Labrador
Nova Scotia Securities Commission
Ontario Securities Commission
Office of the Superintendent of Securities, Prince Edward Island
Autorité des marchés financiers
Financial and Consumer Affairs Authority of Saskatchewan
Toronto Stock Exchange
Notice is hereby given that Bell Canada relies on the continuous disclosure documents filed by BCE Inc. pursuant to the exemption from the requirements of National Instrument 51-102 – Continuous Disclosure Obligations (“NI 51-102”) provided in Section 13.4 of NI 51-102.
The continuous disclosure documents of BCE Inc. can be found for viewing in electronic format at www.sedar.com.
Attached to this notice and forming part thereof is the consolidating summary financial information for BCE Inc. as required by Section 13.4 of NI 51-102.
| Dated: April 29, 2021 |
||||
| BELL CANADA | ||||
| By: |
(signed) Thierry Chaumont | |||
| Name: |
Thierry Chaumont | |||
| Title: |
Senior Vice-President, Controller and Tax | |||

|
BELL CANADA
|
UNAUDITED SELECTED SUMMARY FINANCIAL INFORMATION (1)
For the periods ended March 31, 2021 and 2020
(in millions of Canadian dollars)
BCE Inc. fully and unconditionally guarantees the payment obligations of its 100% owned subsidiary Bell Canada under the public debt issued by Bell Canada. Accordingly, the following summary financial information is provided by Bell Canada in compliance with the requirements of section 13.4 of National Instrument 51-102 (Continuous Disclosure Obligations) providing for an exemption for certain credit support issuers. The tables below contain selected summary financial information for (i) BCE Inc. (as credit supporter), (ii) Bell Canada (as credit support issuer) on a consolidated basis, (iii) BCE Inc.’s subsidiaries, other than Bell Canada, on a combined basis, (iv) consolidating adjustments, and (v) BCE Inc. and all of its subsidiaries on a consolidated basis, in each case for the periods indicated. Such summary financial information for BCE Inc. and Bell Canada and all other subsidiaries is intended to provide investors with meaningful and comparable financial information about BCE Inc. and its subsidiaries. This summary financial information should be read in conjunction with BCE Inc.’s audited consolidated financial statements for the year ended December 31, 2020 and the unaudited consolidated interim financial report for the three months ended March 31, 2021.
For the periods ended March 31:
| BCE INC. (“CREDIT SUPPORTER”)(2) |
BELL CANADA CONSOLIDATED (“CREDIT SUPPORT ISSUER”) |
SUBSIDIARIES OF BCE INC. OTHER THAN BELL CANADA(3) |
CONSOLIDATING ADJUSTMENTS(4) |
BCE INC. CONSOLIDATED | ||||||||||||||||||||||||||||||||||||||||||||||||||||||||||||||||||||||||||||||||||||||||||||||||||||||
| 2021 | 2020 | 2021 | 2020 | 2021 | 2020 | 2021 | 2020 | 2021 | 2020 | |||||||||||||||||||||||||||||||||||||||||||||||||||||||||||||||||||||||||||||||||||||||||||||||||
| Operating revenues |
– | – | 5,706 | 5,640 | — | — | — | — | 5,706 | 5,640 | ||||||||||||||||||||||||||||||||||||||||||||||||||||||||||||||||||||||||||||||||||||||||||||||||
| Net earnings from continuing operations |
674 | 713 | 696 | 696 | 32 | 34 | (728) | (730) | 674 | 713 | ||||||||||||||||||||||||||||||||||||||||||||||||||||||||||||||||||||||||||||||||||||||||||||||||
| Net earnings attributable to owners |
674 | 718 | 696 | 701 | 32 | 34 | (728) | (735) | 674 | 718 | ||||||||||||||||||||||||||||||||||||||||||||||||||||||||||||||||||||||||||||||||||||||||||||||||
|
As at March 31, 2021 and December 31, 2020, respectively: |
|
|||||||||||||||||||||||||||||||||||||||||||||||||||||||||||||||||||||||||||||||||||||||||||||||||||||||||
| BCE INC. (“CREDIT SUPPORTER”)(2) |
BELL CANADA CONSOLIDATED (“CREDIT SUPPORT ISSUER”) |
SUBSIDIARIES OF BCE INC. OTHER THAN BELL CANADA(3) |
CONSOLIDATING ADJUSTMENTS(4) |
BCE INC. CONSOLIDATED | ||||||||||||||||||||||||||||||||||||||||||||||||||||||||||||||||||||||||||||||||||||||||||||||||||||||
| |
Mar. 31, 2021 |
|
|
Dec. 31, 2020 |
|
|
Mar. 31, 2021 |
|
|
Dec. 31, 2020 |
|
|
Mar. 31, 2021 |
|
|
Dec. 31, 2020 |
|
|
Mar. 31, 2021 |
|
|
Dec. 31, 2020 |
|
|
Mar. 31, 2021 |
|
|
Dec. 31, 2020 |
|
|||||||||||||||||||||||||||||||||||||||||||||||||||||||||||||||||||||||||||||
| Total Current Assets |
569 | 711 | 11,639 | 9,291 | 368 | 337 | (4,687) | (4,651) | 7,889 | 5,688 | ||||||||||||||||||||||||||||||||||||||||||||||||||||||||||||||||||||||||||||||||||||||||||||||||
| Total Non-current Assets |
26,279 | 24,971 | 49,862 | 48,444 | 38 | 38 | (19,819) | (18,476) | 56,360 | 54,977 | ||||||||||||||||||||||||||||||||||||||||||||||||||||||||||||||||||||||||||||||||||||||||||||||||
| Total Current Liabilities |
4,757 | 4,589 | 9,363 | 8,238 | 94 | 95 | (4,687) | (4,651) | 9,527 | 8,271 | ||||||||||||||||||||||||||||||||||||||||||||||||||||||||||||||||||||||||||||||||||||||||||||||||
| Total Non-current Liabilities |
64 | 104 | 31,700 | 30,367 | – | – | 592 | 594 | 32,356 | 31,065 | ||||||||||||||||||||||||||||||||||||||||||||||||||||||||||||||||||||||||||||||||||||||||||||||||
| (1) | The summary financial information is prepared in accordance with International Financial Reporting Standards (IFRS) and is in accordance with generally accepted accounting principles issued by the Canadian Accounting Standards Board for publicly-accountable enterprises. |
| (2) | This column accounts for investments in all subsidiaries of BCE Inc. under the equity method. |
| (3) | This column accounts for investments in all subsidiaries of BCE Inc. (other than Bell Canada) on a consolidated basis. |
| (4) | This column includes the necessary amounts to eliminate the intercompany balances between BCE Inc., Bell Canada and other subsidiaries and other adjustments to arrive at the information for BCE Inc. on a consolidated basis. |
Exhibit 99.6
BCE Inc.
EXHIBIT TO 2021 FIRST QUARTER FINANCIAL STATEMENTS
EARNINGS COVERAGE
The following consolidated financial ratios are calculated for the twelve months ended March 31, 2021, give effect to the issuance and redemption of all long-term debt since April 1, 2020 as if these transactions occurred on April 1, 2020, and are based on unaudited financial information of BCE Inc.
| March 31, 2021 | ||
| Earnings coverage of interest on debt requirements based on net earnings attributable to owners of BCE Inc. before interest expense and income tax: | 3.9 times | |
| Earnings coverage of interest on debt requirements based on net earnings attributable to owners of BCE Inc. before interest expense, income tax and non-controlling interest: | 3.9 times | |
Serious News for Serious Traders! Try StreetInsider.com Premium Free!
You May Also Be Interested In
- BCE Inc. (BCE:CN) (BCE) PT Lowered to Cdn$53.25 at Scotiabank
- High Wire Reports 2023 Revenue of $27.0 Million, with Annualized Recurring Revenue at $12.0 Million
- Cresset Welcomes Two New Advisory Teams, Expands National Presence and San Francisco Footprint
Create E-mail Alert Related Categories
SEC FilingsSign up for StreetInsider Free!
Receive full access to all new and archived articles, unlimited portfolio tracking, e-mail alerts, custom newswires and RSS feeds - and more!
