

Form 6-K BARRICK GOLD CORP For: May 05
 Tweet
Tweet Share
Share
UNITED STATES
SECURITIES AND EXCHANGE COMMISSION
WASHINGTON, D.C. 20549
Form 6-K
REPORT OF FOREIGN PRIVATE ISSUER
PURSUANT TO RULE 13a-16 OR 15d-16
UNDER THE SECURITIES EXCHANGE ACT OF 1934
For the month of May 2021
Commission File Number: 1-9059
Barrick Gold Corporation
(Registrant’s name)
Brookfield Place, TD Canada Trust Tower, Suite 3700
161 Bay Street, P.O. Box 212
Toronto, Ontario M5J 2S1 Canada
(Address of principal executive offices)
Indicate by check mark whether the registrant files or will file annual reports under cover of Form 20-F or Form 40-F.
Form 20-F ☐ Form 40-F ☒
Indicate by check mark if the registrant is submitting the Form 6-K in paper as permitted by Regulation S-T Rule 101(b)(1): ☐
Indicate by check mark if the registrant is submitting the Form 6-K in paper as permitted by Regulation S-T Rule 101(b)(7): ☐
INCORPORATION BY REFERENCE
Exhibit 99.1 to this report on Form 6-K is furnished, not filed, and will not be incorporated by reference into any registration statement.
Exhibit 99.2 to this report on Form 6-K is hereby incorporated by reference into the Registration Statements on Form F-3 (File No. 333-206417), Form S-8 (File No. 333-224560) and Form F-10 (File No. 333-230235).
SIGNATURES
Pursuant to the requirements of the Securities Exchange Act of 1934, the registrant has duly caused this report to be signed on its behalf by the undersigned, thereunto duly authorized.
| BARRICK GOLD CORPORATION | ||||||
| Date: May 5, 2021 | By: /s/ Richie Haddock | |||||
| Name: Richie Haddock | ||||||
| Title: General Counsel | ||||||
EXHIBIT INDEX
| Exhibits | Description | |
| 99.1 | 2021 Q1 Report Press Release dated May 5, 2021 | |
| 99.2 | Barrick Gold Corporation’s Comparative Unaudited Financial Statements prepared in accordance with International Financial Reporting Standards and the notes thereto for the three months ended March 31, 2021 and Management’s Discussion and Analysis for the same period. | |
Exhibit 99.1
ROBUST Q1 PERFORMANCE BY CORE MINES
SETS BARRICK ON COURSE
FOR ANNUAL TARGET
| All amounts expressed in US dollars
Toronto, May 5, 2021 — Barrick Gold Corporation (NYSE: GOLD)(TSX: ABX) today reported its results for the first quarter of 2021, noting that with gold and copper production on plan, it was well positioned to achieve its annual guidance.
Production in the latter half of the year is expected to be higher than the first, mainly due to mine sequencing at Nevada Gold Mines, the commissioning of the new leach pad facility at Veladero in Argentina, the ramp-up of underground mining at Bulyanhulu and higher anticipated grades at Lumwana in Zambia.
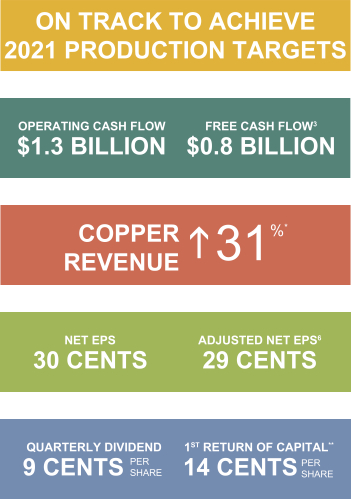
Barrick’s Tier One1 gold mines all delivered strong financial performances in Q1 while revenue from its copper mines rose by 31% due to higher copper prices. Net cash2 increased by $0.5 billion despite an advanced tax payment to the state of Nevada on the back of operating cash flow of $1.3 billion and free cash flow3 of $0.8 billion.
The company announced a 9 cents per share quarterly dividend, which will be topped up by a three-tranche return of capital distribution totaling $750 million through the course of the year. This would take the per share yield based on yesterday’s closing share price to 3.5% for 2021.4,5 |
| |
|
CONTINUED ON PAGE 3 |
* Quarter on quarter ** Distribution per share amount is based on issued and outstanding shares as of March 31, 2021, and is subject to change |
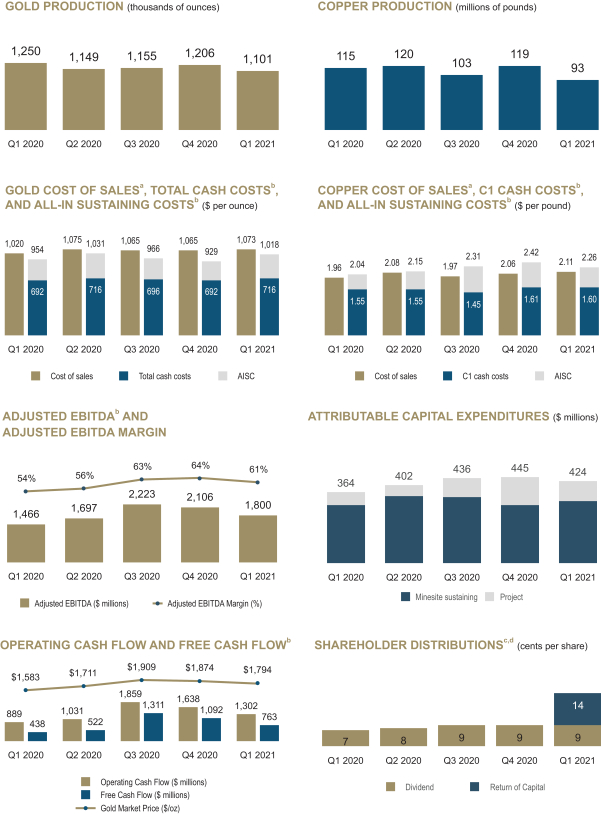
Key Performance Indicators
Financial and Operating Highlights
| BARRICK FIRST QUARTER 2021 | 2 | PRESS RELEASE |
CONTINUED FROM PAGE 1
BARRICK ANNOUNCES FIRST $250 MILLION RETURN OF CAPITAL TRANCHE AND QUARTERLY DIVIDEND
Barrick today announced that the first $250 million ($0.14 per share)15 tranche of a return of capital distribution totaling $750 million will be paid on June 15, 2021 to shareholders of record at the close of business on May 28, 2021.
| BARRICK FIRST QUARTER 2021 | 3 | PRESS RELEASE |
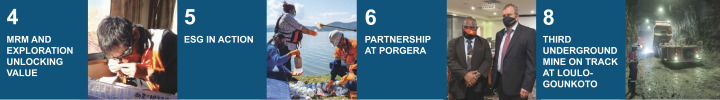
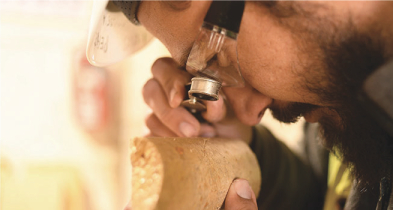
INTEGRATION OF EXPLORATION, MINERAL RESOURCE MANAGEMENT AND PLANNING UNLOCKS VALUE
Built on its core strategy of continuing exploration success, Barrick’s 10-year plan has been bolstered further by significant advances in resource replacement and prospect development during the first quarter of the year.
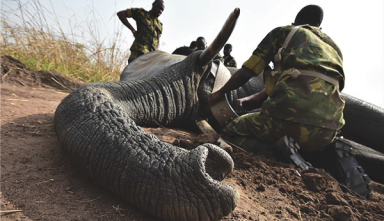
BIODIVERSITY ACTION PLANS PROTECT ECOSYSTEMS,
PROMOTE CONSERVATION AROUND BARRICK MINES
Barrick has implemented biodiversity action plans at all its operational sites to manage their impact on sensitive ecosystems as well as to support conservation efforts in the wilderness areas around some of its mines.
| BARRICK FIRST QUARTER 2021 | 4 | PRESS RELEASE |
|
The recent collaring of an elephant in Garamba National Park in the DRC. Since 2014, the Kibali mine has partnered with the park to promote conservation and combat poaching. |
ESG IN ACTION: TANZANIA SHOWS THE WAY
When Barrick took over operational control of its Tanzanian assets under two years ago, it faced daunting challenges: a government that was actively hostile to the mining industry in general and the former operator in particular; serious environmental issues which had halted production at North Mara; long-standing land disputes; allegations of human rights abuses; and a non-existent social licence to operate.
| BARRICK FIRST QUARTER 2021 | 5 | PRESS RELEASE |
NEVADA GOLD MINES:
WORLD CLASS ASSETS AND A GREAT FUTURE
Nevada Gold Mines, the joint venture formed in July 2019 by industry leaders Barrick and Newmont, is maturing rapidly, with a high-confidence 10-year plan in place and the focus shifting to a 15-year plan. The world’s largest gold mining complex, NGM is majority-owned and operated by Barrick.
PARTNERSHIP AND PERSEVERANCE PAY OFF
AT PORGERA
The Porgera gold mine is set to resume operations later this year after the Papua New Guinea (PNG) government and Barrick Niugini Limited (BNL) agreed on a partnership for its future ownership and operation.

| BARRICK FIRST QUARTER 2021 | 6 | PRESS RELEASE |
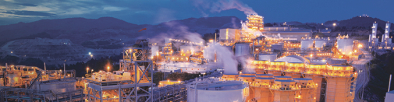
PUEBLO VIEJO MAINTAINS MAJOR CONTRIBUTION
TO DOMINICAN ECONOMY
Pueblo Viejo paid $228 million in direct cash taxes and royalties in the first four months of this year, bringing its total tax and royalty payments to the government to more than $2.6 billion since production started in 2013.
|
Pueblo Viejo |
Kibali |
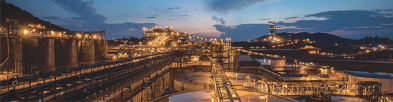
KIBALI MAKES STRONG START TO 2021,
CONTINUES TO REDUCE CARBON FOOTPRINT
The Barrick operated Kibali mine in the DRC produced 191,612 ounces of gold17 in the first quarter of 2021, keeping it on plan and on track to achieve its full year target, president and chief executive Mark Bristow told local media and stakeholders at a recent briefing in Kinshasa.
| BARRICK FIRST QUARTER 2021 | 7 | PRESS RELEASE |
LOULO-GOUNKOTO’S THIRD UNDERGROUND MINE
ON TRACK TO START PRODUCTION
Barrick’s giant Loulo-Gounkoto gold complex’s third underground mine has reached its first mining level and is scheduled to start delivering ore tonnes to the plant during the second quarter, president and chief executive Mark Bristow told a media briefing in Bamako recently.
| BARRICK FIRST QUARTER 2021 | 8 | PRESS RELEASE |
Appendix 1
2021 Operating and Capital Expenditure Guidance
| GOLD PRODUCTION AND COSTS | ||||||||
| 2021 forecast attributable production (000s oz) |
2021 forecast cost of sales11 ($/oz) |
2021 forecast total cash costs12 ($/oz) |
2021 forecast all-in oz) | |||||
| Carlin (61.5%)18 |
940 - 1,000 | 920 - 970 | 740 - 790 | 1,050 - 1,100 | ||||
| Cortez (61.5%)19 |
500 - 550 | 1,000 - 1,050 | 700 - 750 | 940 - 990 | ||||
| Turquoise Ridge (61.5%) |
390 - 440 | 950 - 1,000 | 620 - 670 | 810 - 860 | ||||
| Phoenix (61.5%) |
100 - 120 | 1,800 - 1,850 | 725 - 775 | 970 - 1,020 | ||||
| Long Canyon (61.5%) |
140 - 160 | 800 - 850 | 180 - 230 | 240 - 290 | ||||
| Nevada Gold Mines (61.5%) |
2,100 - 2,250 | 980 - 1,030 | 660 - 710 | 910 - 960 | ||||
| Hemlo |
200 - 220 | 1,200 - 1,250 | 950 - 1,000 | 1,280 - 1,330 | ||||
| North America |
2,300 - 2,450 | 990 - 1,040 | 690 - 740 | 940 - 990 | ||||
| Pueblo Viejo (60%) |
470 - 510 | 880 - 930 | 520 - 570 | 760 - 810 | ||||
| Veladero (50%) |
130 - 150 | 1,510 - 1,560 | 820 - 870 | 1,720 - 1,770 | ||||
| Porgera (47.5%)20 |
— | — | — | — | ||||
| Latin America & Asia Pacific |
600 - 660 | 1,050 - 1,100 | 600 - 650 | 1,000 - 1,050 | ||||
| Loulo-Gounkoto (80%) |
510 - 560 | 980 - 1,030 | 630 - 680 | 930 - 980 | ||||
| Kibali (45%) |
350 - 380 | 990 - 1,040 | 590 - 640 | 800 - 850 | ||||
| North Mara (84%) |
240 - 270 | 970 - 1,020 | 740 - 790 | 960 - 1,010 | ||||
| Tongon (89.7%) |
180 - 200 | 1,470 - 1,520 | 1,000 - 1,050 | 1,140 - 1,190 | ||||
| Bulyanhulu (84%) |
170 - 200 | 980 - 1,030 | 580 - 630 | 810 - 860 | ||||
| Buzwagi (84%) |
30 - 40 | 1,360 - 1,410 | 1,250 - 1,300 | 1,230 - 1,280 | ||||
| Africa & Middle East |
1,500 - 1,600 | 1,050 - 1,100 | 690 - 740 | 920 - 970 | ||||
| Total Attributable to Barrick21,22,23 |
4,400 - 4,700 | 1,020 - 1,070 | 680 - 730 | 970 - 1,020 | ||||
| COPPER PRODUCTION AND COSTS | ||||||||
| 2021 forecast attributable production (Mlbs) |
2021 forecast cost of sales13 ($/lb) |
2021 forecast C1 cash costs14 ($/lb) |
2021 forecast all-in sustaining costs14 ($/lb) | |||||
| Lumwana |
250 - 280 | 1.85 - 2.05 | 1.45 - 1.65 | 2.25 - 2.45 | ||||
| Zaldívar (50%) |
90 - 110 | 2.30 - 2.50 | 1.65 - 1.85 | 1.90 - 2.10 | ||||
| Jabal Sayid (50%) |
70 - 80 | 1.40 - 1.60 | 1.10 - 1.30 | 1.30 - 1.50 | ||||
| Total Attributable to Barrick22 |
410 - 460 | 1.90 - 2.10 | 1.40 - 1.60 | 2.00 - 2.20 | ||||
| ATTRIBUTABLE CAPITAL EXPENDITURES |
| |||
| ($ millions) | ||||
| Attributable minesite sustaining |
1,250 - 1,450 | |||
| Attributable project |
550 - 650 | |||
| Total attributable capital expenditures |
1,800 - 2,100 | |||
2021 OUTLOOK ASSUMPTIONS AND ECONOMIC SENSITIVITY ANALYSIS24
| 2021 Guidance Assumption |
Hypothetical Change | Impact on EBITDA25 (millions) |
Impact on TCC/C1 Cash Costs and AISC12,14 | |||||
| Gold price sensitivity |
$1,700/oz | +/- $100/oz | +/- $620 | +/-$4/oz | ||||
| Copper price sensitivity |
$2.75/lb | +/- $0.25/lb | +/- $60 | +/- $0.01/lb | ||||
| BARRICK FIRST QUARTER 2021 | 9 | PRESS RELEASE |
Appendix 2
Production and Cost Summary - Gold
| For the three months ended | ||||||||||||||||
| 3/31/21 | 12/31/20 | % Change | 3/31/20 | % Change | ||||||||||||
| Nevada Gold Mines LLC (61.5%)a |
||||||||||||||||
| Gold produced (000s oz attributable basis) |
485 | 546 | (11)% | 526 | (8)% | |||||||||||
| Gold produced (000s oz 100% basis) |
789 | 885 | (11)% | 855 | (8)% | |||||||||||
| Cost of sales ($/oz) |
1,047 | 1,008 | 4 % | 995 | 5 % | |||||||||||
| Total cash costs ($/oz)b |
686 | 667 | 3 % | 690 | (1)% | |||||||||||
| All-in sustaining costs ($/oz)b |
932 | 873 | 7 % | 952 | (2)% | |||||||||||
| Carlin (61.5%)c |
||||||||||||||||
| Gold produced (000s oz attributable basis) |
229 | 260 | (12)% | 253 | (9)% | |||||||||||
| Gold produced (000s oz 100% basis) |
373 | 422 | (12)% | 411 | (9)% | |||||||||||
| Cost of sales ($/oz) |
950 | 917 | 4 % | 970 | (2)% | |||||||||||
| Total cash costs ($/oz)b |
766 | 740 | 4 % | 776 | (1)% | |||||||||||
| All-in sustaining costs ($/oz)b |
1,045 | 1,005 | 4 % | 1,007 | 4 % | |||||||||||
| Cortez (61.5%)d |
||||||||||||||||
| Gold produced (000s oz attributable basis) |
100 | 118 | (15)% | 128 | (22)% | |||||||||||
| Gold produced (000s oz 100% basis) |
163 | 191 | (15)% | 208 | (22)% | |||||||||||
| Cost of sales ($/oz) |
1,251 | 1,043 | 20 % | 878 | 42 % | |||||||||||
| Total cash costs ($/oz)b |
860 | 738 | 17 % | 614 | 40 % | |||||||||||
| All-in sustaining costs ($/oz)b |
1,203 | 906 | 33 % | 1,009 | 19 % | |||||||||||
| Turquoise Ridge (61.5%) |
||||||||||||||||
| Gold produced (000s oz attributable basis) |
92 | 91 | 1 % | 84 | 9 % | |||||||||||
| Gold produced (000s oz 100% basis) |
149 | 147 | 1 % | 137 | 9 % | |||||||||||
| Cost of sales ($/oz) |
1,007 | 1,064 | (5)% | 1,032 | (2)% | |||||||||||
| Total cash costs ($/oz)b |
647 | 687 | (6)% | 668 | (3)% | |||||||||||
| All-in sustaining costs ($/oz)b |
741 | 757 | (2)% | 806 | (8)% | |||||||||||
| Phoenix (61.5%) |
||||||||||||||||
| Gold produced (000s oz attributable basis) |
25 | 26 | (3)% | 35 | (28)% | |||||||||||
| Gold produced (000s oz 100% basis) |
41 | 42 | (3)% | 57 | (28)% | |||||||||||
| Cost of sales ($/oz) |
2,051 | 2,054 | — % | 1,583 | 30 % | |||||||||||
| Total cash costs ($/oz)b |
346 | 590 | (41)% | 737 | (53)% | |||||||||||
| All-in sustaining costs ($/oz)b |
530 | 670 | (21)% | 914 | (42)% | |||||||||||
| Long Canyon (61.5%) |
||||||||||||||||
| Gold produced (000s oz attributable basis) |
39 | 51 | (24)% | 26 | 50 % | |||||||||||
| Gold produced (000s oz 100% basis) |
63 | 83 | (24)% | 42 | 50 % | |||||||||||
| Cost of sales ($/oz) |
511 | 674 | (24)% | 1,025 | (50)% | |||||||||||
| Total cash costs ($/oz)b |
79 | 145 | (46)% | 345 | (77)% | |||||||||||
| All-in sustaining costs ($/oz)b |
156 | 324 | (52)% | 561 | (72)% | |||||||||||
| Pueblo Viejo (60%) |
||||||||||||||||
| Gold produced (000s oz attributable basis) |
137 | 159 | (14)% | 143 | (4)% | |||||||||||
| Gold produced (000s oz 100% basis) |
229 | 265 | (14)% | 238 | (4)% | |||||||||||
| Cost of sales ($/oz) |
816 | 803 | 2 % | 767 | 6 % | |||||||||||
| Total cash costs ($/oz)b |
507 | 493 | 3 % | 502 | 1 % | |||||||||||
| All-in sustaining costs ($/oz)b |
689 | 689 | — % | 626 | 10 % | |||||||||||
| BARRICK FIRST QUARTER 2021 | 10 | PRESS RELEASE |
Production and Cost Summary - Gold (continued)
| For the three months ended | ||||||||||||||||||||
| 3/31/21 | 12/31/20 | % Change | 3/31/20 | % Change | ||||||||||||||||
| Loulo-Gounkoto (80%) |
||||||||||||||||||||
| Gold produced (000s oz attributable basis) |
154 | 123 | 26 % | 141 | 9 % | |||||||||||||||
| Gold produced (000s oz 100% basis) |
193 | 153 | 26 % | 177 | 9 % | |||||||||||||||
| Cost of sales ($/oz) |
974 | 1,149 | (15)% | 1,002 | (3)% | |||||||||||||||
| Total cash costs ($/oz)b |
608 | 734 | (17)% | 614 | (1)% | |||||||||||||||
| All-in sustaining costs ($/oz)b |
920 | 923 | — % | 891 | 3 % | |||||||||||||||
| Kibali (45%) |
||||||||||||||||||||
| Gold produced (000s oz attributable basis) |
86 | 92 | (6)% | 91 | (5)% | |||||||||||||||
| Gold produced (000s oz 100% basis) |
192 | 205 | (6)% | 201 | (5)% | |||||||||||||||
| Cost of sales ($/oz) |
1,065 | 1,163 | (8)% | 1,045 | 2 % | |||||||||||||||
| Total cash costs ($/oz)b |
691 | 616 | 12 % | 582 | 19 % | |||||||||||||||
| All-in sustaining costs ($/oz)b |
856 | 783 | 9 % | 773 | 11 % | |||||||||||||||
| Veladero (50%) |
||||||||||||||||||||
| Gold produced (000s oz attributable basis) |
32 | 58 | (45)% | 75 | (57)% | |||||||||||||||
| Gold produced (000s oz 100% basis) |
64 | 116 | (45)% | 150 | (57)% | |||||||||||||||
| Cost of sales ($/oz) |
1,151 | 1,074 | 7 % | 1,182 | (3)% | |||||||||||||||
| Total cash costs ($/oz)b |
736 | 698 | 5 % | 788 | (7)% | |||||||||||||||
| All-in sustaining costs ($/oz)b |
2,104 | 1,428 | 47 % | 1,266 | 66 % | |||||||||||||||
| Porgera (47.5%)e |
||||||||||||||||||||
| Gold produced (000s oz attributable basis) |
— | — | 62 | (100)% | ||||||||||||||||
| Gold produced (000s oz 100% basis) |
— | — | 131 | (100)% | ||||||||||||||||
| Cost of sales ($/oz) |
— | — | 1,097 | (100)% | ||||||||||||||||
| Total cash costs ($/oz)b |
— | — | 941 | (100)% | ||||||||||||||||
| All-in sustaining costs ($/oz)b |
— | — | 1,089 | (100)% | ||||||||||||||||
| Tongon (89.7%) |
||||||||||||||||||||
| Gold produced (000s oz attributable basis) |
48 | 66 | (26)% | 61 | (21)% | |||||||||||||||
| Gold produced (000s oz 100% basis) |
54 | 73 | (26)% | 68 | (21)% | |||||||||||||||
| Cost of sales ($/oz) |
1,510 | 1,371 | 10 % | 1,368 | 10 % | |||||||||||||||
| Total cash costs ($/oz)b |
995 | 810 | 23 % | 762 | 31 % | |||||||||||||||
| All-in sustaining costs ($/oz)b |
1,062 | 853 | 25 % | 788 | 35 % | |||||||||||||||
| Hemlo |
||||||||||||||||||||
| Gold produced (000s oz) |
47 | 57 | (18)% | 57 | (18)% | |||||||||||||||
| Cost of sales ($/oz) |
1,610 | 1,379 | 17 % | 1,119 | 44 % | |||||||||||||||
| Total cash costs ($/oz)b |
1,324 | 1,104 | 20 % | 945 | 40 % | |||||||||||||||
| All-in sustaining costs ($/oz)b |
1,840 | 1,464 | 26 % | 1,281 | 44 % | |||||||||||||||
| North Mara (84%) |
||||||||||||||||||||
| Gold produced (000s oz attributable basis) |
62 | 61 | 1 % | 65 | (4)% | |||||||||||||||
| Gold produced (000s oz 100% basis) |
74 | 73 | 1 % | 77 | (4)% | |||||||||||||||
| Cost of sales ($/oz) |
1,061 | 1,073 | (1)% | 959 | 11 % | |||||||||||||||
| Total cash costs ($/oz)b |
832 | 799 | 4 % | 646 | 29 % | |||||||||||||||
| All-in sustaining costs ($/oz)b |
1,038 | 989 | 5 % | 816 | 27 % | |||||||||||||||
| BARRICK FIRST QUARTER 2021 | 11 | PRESS RELEASE |
Production and Cost Summary - Gold (continued)
| For the three months ended | ||||||||||||||||||||
| 3/31/21 | 12/31/20 | % Change | 3/31/20 | % Change | ||||||||||||||||
| Buzwagi (84%) |
||||||||||||||||||||
| Gold produced (000s oz attributable basis) |
17 | 21 | (20)% | 22 | (25)% | |||||||||||||||
| Gold produced (000s oz 100% basis) |
20 | 25 | (20)% | 27 | (25)% | |||||||||||||||
| Cost of sales ($/oz) |
1,486 | 1,314 | 13 % | 1,373 | 8 % | |||||||||||||||
| Total cash costs ($/oz)b |
1,450 | 1,267 | 14 % | 1,275 | 14 % | |||||||||||||||
| All-in sustaining costs ($/oz)b |
1,467 | 1,283 | 14 % | 1,288 | 14 % | |||||||||||||||
| Bulyanhulu (84%) |
||||||||||||||||||||
| Gold produced (000s oz attributable basis) |
33 | 23 | 44 % | 7 | 352 % | |||||||||||||||
| Gold produced (000s oz 100% basis) |
39 | 27 | 44 % | 9 | 352 % | |||||||||||||||
| Cost of sales ($/oz) |
1,211 | 1,181 | 3 % | 1,685 | (28)% | |||||||||||||||
| Total cash costs ($/oz)b |
865 | 610 | 42 % | 686 | 26 % | |||||||||||||||
| All-in sustaining costs ($/oz)b |
957 | 664 | 44 % | 906 | 6 % | |||||||||||||||
| Total Attributable to Barrickf |
||||||||||||||||||||
| Gold produced (000s oz) |
1,101 | 1,206 | (9)% | 1,250 | (12)% | |||||||||||||||
| Cost of sales ($/oz)g |
1,073 | 1,065 | 1 % | 1,020 | 5 % | |||||||||||||||
| Total cash costs ($/oz)b |
716 | 692 | 3 % | 692 | 3 % | |||||||||||||||
| All-in sustaining costs ($/oz)b |
1,018 | 929 | 10 % | 954 | 7 % | |||||||||||||||
| a. | These results represent our 61.5% interest in Carlin (including NGM’s 60% interest in South Arturo), Cortez, Turquoise Ridge, Phoenix and Long Canyon. |
| b. | These are non-GAAP financial performance measures with no standardized meaning under IFRS and therefore may not be comparable to similar measures presented by other issuers. For further information and a detailed reconciliation of each non-GAAP measure used in this section of the press release to the most directly comparable IFRS measure, please see the endnotes to this press release. |
| c. | Included within our 61.5% interest in Carlin is NGM’s 60% interest in South Arturo. |
| d. | Starting in the first quarter of 2021, Goldrush is reported as part of Cortez as it is operated by Cortez management. Comparative periods have been restated to include Goldrush. |
| e. | As Porgera was placed on care and maintenance on April 25, 2020, no operating data or per ounce data is provided. |
| f. | Excludes Pierina, Lagunas Norte, Golden Sunlight, and Morila (40%) up until its divestiture in November 2020, as these assets are producing incidental ounces while in closure or care and maintenance. |
| g. | Gold cost of sales per ounce is calculated as cost of sales across our gold operations (excluding sites in care and maintenance) divided by ounces sold (both on an attributable basis using Barrick’s ownership share). |
| BARRICK FIRST QUARTER 2021 | 12 | PRESS RELEASE |
Production and Cost Summary - Copper
| For the three months ended | ||||||||||||||||
| 3/31/21 | 12/31/20 | % Change | 3/31/20 | % Change | ||||||||||||
| Lumwana |
||||||||||||||||
| Copper production (Mlbs) |
51 | 78 | (35)% | 64 | (20)% | |||||||||||
| Cost of sales ($/lb) |
1.97 | 1.96 | 1 % | 1.94 | 2 % | |||||||||||
| C1 cash costs ($/lb)a |
1.48 | 1.58 | (6)% | 1.63 | (9)% | |||||||||||
| All-in sustaining costs ($/lb)a |
2.37 | 2.60 | (9)% | 2.26 | 5 % | |||||||||||
| Zaldívar (50%) |
||||||||||||||||
| Copper production (Mlbs attributable basis) |
24 | 23 | 4 % | 31 | (23)% | |||||||||||
| Copper production (Mlbs 100% basis) |
48 | 46 | 4 % | 62 | (23)% | |||||||||||
| Cost of sales ($/lb) |
3.03 | 2.68 | 13 % | 2.39 | 27 % | |||||||||||
| C1 cash costs ($/lb)a |
2.25 | 2.01 | 12 % | 1.71 | 32 % | |||||||||||
| All-in sustaining costs ($/lb)a |
2.47 | 2.70 | (9)% | 1.99 | 24 % | |||||||||||
| Jabal Sayid (50%) |
||||||||||||||||
| Copper production (Mlbs attributable basis) |
18 | 18 | 0 % | 20 | (10)% | |||||||||||
| Copper production (Mlbs 100% basis) |
36 | 36 | 0 % | 40 | (10)% | |||||||||||
| Cost of sales ($/lb) |
1.21 | 1.53 | (21)% | 1.28 | (5)% | |||||||||||
| C1 cash costs ($/lb)a |
1.06 | 1.15 | (8)% | 0.97 | 9 % | |||||||||||
| All-in sustaining costs ($/lb)a |
1.22 | 1.27 | (4)% | 1.11 | 10 % | |||||||||||
| Total Attributable to Barrick |
||||||||||||||||
| Copper production (Mlbs attributable basis) |
93 | 119 | (22)% | 115 | (19)% | |||||||||||
| Cost of sales ($/lb)b |
2.11 | 2.06 | 2 % | 1.96 | 8 % | |||||||||||
| C1 cash costs ($/lb)a |
1.60 | 1.61 | (1)% | 1.55 | 3 % | |||||||||||
| All-in sustaining costs ($/lb)a |
2.26 | 2.42 | (7)% | 2.04 | 11 % | |||||||||||
| a. | These are non-GAAP financial performance measures with no standardized meaning under IFRS and therefore may not be comparable to similar measures presented by other issuers. For further information and a detailed reconciliation of each non-GAAP measure used in this section of the press release to the most directly comparable IFRS measure, please see the endnotes to this press release. |
| b. | Copper cost of sales per pound is calculated as cost of sales across our copper operations divided by pounds sold (both on an attributable basis using Barrick’s ownership share). |
| BARRICK FIRST QUARTER 2021 | 13 | PRESS RELEASE |
Technical Information
The scientific and technical information contained in this press release has been reviewed and approved by Steven Yopps, MMSA, Manager of Growth Projects, Nevada Gold Mines; Craig Fiddes, SME-RM, Manager – Resource Modeling, Nevada Gold Mines; Chad Yuhasz, P.Geo, Mineral Resource Manager, Latin America & Asia Pacific; Simon Bottoms, CGeol, MGeol, FGS, FAusIMM, Mineral Resources Manager: Africa & Middle East; Rodney Quick, MSc, Pr. Sci.Nat, Mineral Resource Management and Evaluation Executive; John Steele, CIM, Metallurgy, Engineering and Capital Projects Executive; and Rob Krcmarov, FAusIMM, Executive Vice President, Exploration and Growth – each a “Qualified Person” as defined in National Instrument 43-101 – Standards of Disclosure for Mineral Projects.
Endnotes
Endnote 1
A Tier One Gold Asset is an asset with a reserve potential to deliver a minimum 10-year life, annual production of at least 500,000 ounces of gold and total cash costs per ounce over the mine life that are in the lower half of the industry cost curve.
Endnote 2
Calculated as cash ($5,672 million) less debt ($5,153 million).
Endnote 3
“Free cash flow” is a non-GAAP financial performance measure that deducts capital expenditures from net cash provided by operating activities. Barrick believes this to be a useful indicator of our ability to operate without reliance on additional borrowing or usage of existing cash. Free cash flow is intended to provide additional information only and does not have any standardized meaning under IFRS and may not be comparable to similar measures of performance presented by other companies. Free cash flow should not be considered in isolation or as a substitute for measures of performance prepared in accordance with IFRS. Further details on this non-GAAP measure are provided in the MD&A accompanying Barrick’s financial statements filed from time to time on SEDAR at www.sedar.com and on EDGAR at www.sec.gov.
Reconciliation of Net Cash Provided by Operating Activities to Free Cash Flow
| ($ millions) | For the three months ended | |||||||||||
| 3/31/21 | 12/31/20 | 3/31/20 | ||||||||||
| Net cash provided by operating activities |
1,302 | 1,638 | 889 | |||||||||
| Capital expenditures |
(539 | ) | (546 | ) | (451 | ) | ||||||
| Free cash flow |
763 | 1,092 | 438 | |||||||||
Endnote 4
The declaration and payment of dividends is at the discretion of the Board of Directors, and will depend on the company’s financial results, cash requirements, future prospects and other factors deemed relevant by the Board.
Endnote 5
Forecast yield for 2021 is based on the current quarterly dividend rate ($0.09 per share) and a return of capital distribution per share ($0.42) calculated based on our issued and outstanding shares as of March 31, 2021, which is subject to change.
Endnote 6
“Adjusted net earnings” and “adjusted net earnings per share” are non-GAAP financial performance measures. Adjusted net earnings excludes the following from net earnings: certain impairment charges (reversals) related to intangibles, goodwill, property, plant and equipment, and investments; gains (losses) and other one-time costs relating to acquisitions or dispositions; foreign currency translation gains (losses); significant tax adjustments not related to current period earnings; and the tax effect and non-controlling interest of these items. The Company uses this measure internally to evaluate our underlying operating performance for the reporting periods presented and to assist with the planning and forecasting of future operating results. Barrick believes that adjusted net earnings is a useful measure of our performance because these adjusting items do not reflect the underlying operating performance of our core mining business and are not necessarily indicative of future operating results. Adjusted net earnings and adjusted net earnings per share are intended to provide additional information only and do not have any standardized meaning under IFRS and may not be comparable to similar measures of performance presented by other companies. They should not be considered in isolation or as a substitute for measures of performance prepared in accordance with IFRS. Further details on these non-GAAP measures are provided in the MD&A accompanying Barrick’s financial statements filed from time to time on SEDAR at www.sedar.com and on EDGAR at www.sec.gov.
| BARRICK FIRST QUARTER 2021 | 14 | PRESS RELEASE |
Reconciliation of Net Earnings to Net Earnings per Share, Adjusted Net Earnings and Adjusted Net Earnings per Share
| ($ millions, except per share amounts in dollars) | For the three months ended | |||||||||||
| 3/31/21 | 12/31/20 | 3/31/20 | ||||||||||
| Net earnings attributable to equity holders of the Company |
538 | 685 | 400 | |||||||||
| Impairment charges (reversals) related to intangibles, goodwill, property, plant and equipment, and investmentsa |
(89 | ) | 40 | (336 | ) | |||||||
| Acquisition/disposition (gains) lossesb |
(3 | ) | (126 | ) | (60 | ) | ||||||
| Loss (gain) on currency translation |
4 | 16 | 16 | |||||||||
| Significant tax adjustmentsc |
47 | (2 | ) | (44 | ) | |||||||
| Other expense adjustmentsd |
11 | 15 | 98 | |||||||||
| Tax effect and non-controlling intereste |
(1 | ) | (12 | ) | 211 | |||||||
| Adjusted net earnings |
507 | 616 | 285 | |||||||||
| Net earnings per sharef |
0.30 | 0.39 | 0.22 | |||||||||
| Adjusted net earnings per sharef |
0.29 | 0.35 | 0.16 | |||||||||
| a. | For the three month period ended March 31, 2021, net impairment reversals primarily relate to non-current asset reversals at Lagunas Norte. Net impairment charges (reversals) for the three month periods ended December 31, 2020 and March 31, 2020 mainly relate to non-current assets at our Tanzanian assets. |
| b. | Acquisition/disposition gains for the three month period ended December 31, 2020 primarily relate to the gain on the sale of Eskay Creek, Morila and Bullfrog. For the three months ended March 31, 2020, acquisition/disposition gains mainly relate to the gain on the sale of Massawa. |
| c. | Significant tax adjustments for the three month period ended March 31, 2021 mainly relates to the remeasurement of deferred tax balances for changes in foreign currency rates and the recognition/derecognition of our deferred taxes in various jurisdictions. For the three months ended March 31, 2020, significant tax adjustments primarily relate to deferred tax recoveries as a result of tax reform measures in Argentina and adjustments made in recognition of the net settlement of all outstanding disputes with the Government of Tanzania. |
| d. | Other expense adjustments for the three month periods ended March 31, 2021 and December 31, 2020 mainly relate to care and maintenance expenses at Porgera. For the three months ended March 31, 2020, other expense adjustments primarily relate to the impact of changes in the discount rate assumptions on our closed mine rehabilitation provision and losses on debt extinguishment. |
| e. | Tax effect and non-controlling interest for the three month period ended March 31, 2020 primarily relates to the net impairment reversals related to long-lived assets and acquisition gains. |
| f. | Calculated using weighted average number of shares outstanding under the basic method of earnings per share. |
Endnote 7
“Realized price” is a non-GAAP financial measure which excludes from sales: unrealized gains and losses on non-hedge derivative contracts; unrealized mark-to-market gains and losses on provisional pricing from copper and gold sales contracts; sales attributable to ore purchase arrangements; treatment and refining charges; export duties; and cumulative catch-up adjustments to revenue relating to our streaming arrangements. This measure is intended to enable Management to better understand the price realized in each reporting period for gold and copper sales because unrealized mark-to-market values of non-hedge gold and copper derivatives are subject to change each period due to changes in market factors such as market and forward gold and copper prices, so that prices ultimately realized may differ from those recorded. The exclusion of such unrealized mark-to-market gains and losses from the presentation of this performance measure enables investors to understand performance based on the realized proceeds of selling gold and copper production. The realized price measure is intended to provide additional information and does not have any standardized definition under IFRS and should not be considered in isolation or as a substitute for measures of performance prepared in accordance with IFRS. Further details on these non-GAAP measures are provided in the MD&A accompanying Barrick’s financial statements filed from time to time on SEDAR at www.sedar.com and on EDGAR at www.sec.gov.
Reconciliation of Sales to Realized Price per ounce/pound
| ($ millions, except per ounce/pound information in dollars) | Gold | Copper | ||||||||||||||||||||||
| For the three months ended | ||||||||||||||||||||||||
| 3/31/21 | 12/31/20 | 3/31/20 | 3/31/21 | 12/31/20 | 3/31/20 | |||||||||||||||||||
| Sales |
2,641 | 3,028 | 2,593 | 256 | 195 | 99 | ||||||||||||||||||
| Sales applicable to non-controlling interests |
(814 | ) | (934 | ) | (770 | ) | 0 | 0 | 0 | |||||||||||||||
| Sales applicable to equity method investmentsa,b |
154 | 168 | 147 | 170 | 135 | 107 | ||||||||||||||||||
| Realized non-hedge gold/copper derivative (losses) gains |
0 | 0 | 0 | 0 | 0 | 0 | ||||||||||||||||||
| Sales applicable to sites in care and maintenancec |
(41 | ) | (41 | ) | (46 | ) | 0 | 0 | 0 | |||||||||||||||
| Treatment and refinement charges |
0 | 1 | 0 | 41 | 39 | 39 | ||||||||||||||||||
| Otherd |
0 | (1 | ) | 15 | 0 | 0 | 0 | |||||||||||||||||
| Revenues – as adjusted |
1,940 | 2,221 | 1,939 | 467 | 369 | 245 | ||||||||||||||||||
| Ounces/pounds sold (000s ounces/millions pounds)c |
1,093 | 1,186 | 1,220 | 113 | 108 | 110 | ||||||||||||||||||
| Realized gold/copper price per ounce/pounde |
1,777 | 1,871 | 1,589 | 4.12 | 3.39 | 2.23 | ||||||||||||||||||
| a. | Represents sales of $154 million for the three month period ended March 31, 2021 (December 31, 2020: $168 million and March 31, 2020: $140 million) applicable to our 45% equity method investment in Kibali for gold. Represents sales of $109 million for the three months ended March 31, 2021 (December 31, 2020: $82 million and March 31, 2020: $72 million) applicable to our 50% equity method investment in Zaldívar and $65 million (December 31, 2020: $59 million and March 31, 2020: $40 million) applicable to our 50% equity method investment in Jabal Sayid for copper. |
| b. | Sales applicable to equity method investments are net of treatment and refinement charges. |
| c. | Figures exclude: Pierina, Lagunas Norte, Golden Sunlight, and Morila up until its divestiture in November 2020 from the calculation of realized price per ounce. These assets are producing incidental ounces. |
| BARRICK FIRST QUARTER 2021 | 15 | PRESS RELEASE |
| d. | Represents a cumulative catch-up adjustment to revenue relating to our streaming arrangements. Refer to note 2f of the 2020 Annual Financial Statements for more information. |
| e. | Realized price per ounce/pound may not calculate based on amounts presented in this table due to rounding. |
Endnote 8
On an attributable basis.
Endnote 9
Net earnings represents net earnings attributable to the equity holders of the Company.
Endnote 10
These amounts are presented on the same basis as our guidance.
Endnote 11
Gold cost of sales per ounce is calculated as cost of sales across our gold operations (excluding sites in care and maintenance) divided by ounces sold (both on an attributable basis using Barrick’s ownership share). Copper cost of sales per pound is calculated as cost of sales across our copper operations divided by pounds sold (both on an attributable basis using Barrick’s ownership share).
Endnote 12
“Total cash costs” per ounce, “All-in sustaining costs” per ounce and “All-in costs” per ounce are non-GAAP financial performance measures. “Total cash costs” per ounce starts with cost of sales related to gold production and removes depreciation, the non-controlling interest of cost of sales, and includes by product credits. “All-in sustaining costs” per ounce start with “Total cash costs” per ounce and add further costs which reflect the expenditures made to maintain current production levels, primarily sustaining capital expenditures, sustaining leases, general & administrative costs, minesite exploration and evaluation costs, and reclamation cost accretion and amortization. “All-in costs” per ounce starts with “All-in sustaining costs” per ounce and adds additional costs that reflect the varying costs of producing gold over the life-cycle of a mine, including: project capital expenditures and other non-sustaining costs. Barrick believes that the use of “Total cash costs” per ounce, “All-in sustaining costs” per ounce and “All-in costs” per ounce will assist investors, analysts and other stakeholders in understanding the costs associated with producing gold, understanding the economics of gold mining, assessing our operating performance and also our ability to generate free cash flow from current operations and to generate free cash flow on an overall Company basis. “Total cash costs” per ounce, “All-in sustaining costs” per ounce and “All-in costs” per ounce are intended to provide additional information only and do not have any standardized meaning under IFRS. Although a standardized definition of all-in sustaining costs was published in 2013 by the World Gold Council (a market development organization for the gold industry comprised of and funded by gold mining companies from around the world, including Barrick), it is not a regulatory organization, and other companies may calculate this measure differently. These measures should not be considered in isolation or as a substitute for measures prepared in accordance with IFRS. Further details on these non-GAAP measures are provided in the MD&A accompanying Barrick’s financial statements filed from time to time on SEDAR at www.sedar.com and on EDGAR at www.sec.gov.
| BARRICK FIRST QUARTER 2021 | 16 | PRESS RELEASE |
Reconciliation of Gold Cost of Sales to Total cash costs, All-in sustaining costs and All-in costs, including on a per ounce basis
| ($ millions, except per ounce information in dollars) | For the three months ended | |||||||||||||||
| Footnote | 3/31/21 | 12/31/20 | 3/31/20 | |||||||||||||
| Cost of sales applicable to gold production |
1,571 | 1,681 | 1,643 | |||||||||||||
| Depreciation |
(454 | ) | (495 | ) | (474 | ) | ||||||||||
| Cash cost of sales applicable to equity method investments |
59 | 69 | 52 | |||||||||||||
| By-product credits |
(59 | ) | (56 | ) | (29 | ) | ||||||||||
| Realized (gains) losses on hedge and non-hedge derivatives |
a | 0 | (1 | ) | 0 | |||||||||||
| Non-recurring items |
b | 0 | 1 | 0 | ||||||||||||
| Other |
c | (33 | ) | (55 | ) | (27 | ) | |||||||||
| Non-controlling interests |
d | (302 | ) | (323 | ) | (316 | ) | |||||||||
| Total cash costs |
782 | 821 | 849 | |||||||||||||
| General & administrative costs |
38 | 24 | 40 | |||||||||||||
| Minesite exploration and evaluation costs |
e | 16 | 22 | 15 | ||||||||||||
| Minesite sustaining capital expenditures |
f | 405 | 354 | 370 | ||||||||||||
| Sustaining leases |
13 | 12 | 0 | |||||||||||||
| Rehabilitation - accretion and amortization (operating sites) |
g | 11 | 11 | 14 | ||||||||||||
| Non-controlling interest, copper operations and other |
h | (154 | ) | (142 | ) | (125 | ) | |||||||||
| All-in sustaining costs |
1,111 | 1,102 | 1,163 | |||||||||||||
| Project exploration and evaluation and project costs |
e | 45 | 52 | 56 | ||||||||||||
| Community relations costs not related to current operations |
0 | 0 | 1 | |||||||||||||
| Project capital expenditures |
f | 131 | 184 | 76 | ||||||||||||
| Non-sustaining leases |
0 | 4 | 0 | |||||||||||||
| Rehabilitation - accretion and amortization (non-operating sites) |
g | 3 | 4 | 2 | ||||||||||||
| Non-controlling interest and copper operations and other |
h | (42 | ) | (61 | ) | (33 | ) | |||||||||
| All-in costs |
1,248 | 1,285 | 1,265 | |||||||||||||
| Ounces sold - equity basis (000s ounces) |
i | 1,093 | 1,186 | 1,220 | ||||||||||||
| Cost of sales per ounce |
j,k | 1,073 | 1,065 | 1,020 | ||||||||||||
| Total cash costs per ounce |
k | 716 | 692 | 692 | ||||||||||||
| Total cash costs per ounce (on a co-product basis) |
k,l | 746 | 718 | 705 | ||||||||||||
| All-in sustaining costs per ounce |
k | 1,018 | 929 | 954 | ||||||||||||
| All-in sustaining costs per ounce (on a co-product basis) |
k,l | 1,048 | 955 | 967 | ||||||||||||
| All-in costs per ounce |
k | 1,144 | 1,083 | 1,035 | ||||||||||||
| All-in costs per ounce (on a co-product basis) |
k,l | 1,174 | 1,109 | 1,048 | ||||||||||||
| a. | Realized (gains) losses on hedge and non-hedge derivatives |
Includes realized hedge losses of $nil for the three month period ended March 31, 2021 (December 31, 2020: $nil and March 31, 2020: $nil), and realized non-hedge losses of $nil for the three month period ended March 31, 2021 (December 31, 2020: gains of $1 million and March 31, 2020: $nil). Refer to Note 5 to the Financial Statements for further information.
| b. | Non-recurring items |
These costs are not indicative of our cost of production and have been excluded from the calculation of total cash costs.
| c. | Other |
Other adjustments for the three month period ended March 31, 2021 include the removal of total cash costs and by-product credits associated with Pierina, Lagunas Norte, Golden Sunlight and Morila up until its divestiture in November 2020, which all are producing incidental ounces, of $24 million (December 31, 2020: $26 million; March 31, 2020: $25 million).
| d. | Non-controlling interests |
Non-controlling interests include non-controlling interests related to gold production of $462 million for the three month period ended March 31, 2021 (December 31, 2020: $490 million and March 31, 2020: $466 million). Non-controlling interests include Nevada Gold Mines, Pueblo Viejo, Loulo-Gounkoto, Tongon, North Mara, Bulyanhulu, Buzwagi. Refer to Note 5 to the Financial Statements for further information.
| e. | Exploration and evaluation costs |
Exploration, evaluation and project expenses are presented as minesite sustaining if it supports current mine operations and project if it relates to future projects. Refer to page 68 of the Q1 2021 MD&A.
| f. | Capital expenditures |
Capital expenditures are related to our gold sites only and are split between minesite sustaining and project capital expenditures. Project capital expenditures are distinct projects designed to increase the net present value of the mine and are not related to current production. Significant projects in the current year are the expansion project at Pueblo Viejo and construction of the Third Shaft at Turquoise Ridge. Refer to page 67 of the Q1 2021 MD&A.
| g. | Rehabilitation—accretion and amortization |
Includes depreciation on the assets related to rehabilitation provisions of our gold operations and accretion on the rehabilitation provision of our gold operations, split between operating and non-operating sites.
| h. | Non-controlling interest and copper operations |
| BARRICK FIRST QUARTER 2021 | 17 | PRESS RELEASE |
Removes general & administrative costs related to non-controlling interests and copper based on a percentage allocation of revenue. Also removes exploration, evaluation and project expenses, rehabilitation costs and capital expenditures incurred by our copper sites and the non-controlling interest of Nevada Gold Mines (including South Arturo), Pueblo Viejo, Loulo-Gounkoto, Tongon, North Mara, Bulyanhulu, and Buzwagi operating segments. It also includes capital expenditures applicable to our equity method investment in Kibali. Figures remove the impact of Pierina, Lagunas Norte and Golden Sunlight. The impact is summarized as the following:
| ($ millions) | For the three months ended | |||||||||||
| Non-controlling interest, copper operations and other | 3/31/21 | 12/31/20 | 3/31/20 | |||||||||
| General & administrative costs |
(6 | ) | (5 | ) | (6 | ) | ||||||
| Minesite exploration and evaluation expenses |
(7 | ) | (9 | ) | (3 | ) | ||||||
| Rehabilitation - accretion and amortization (operating sites) |
(3 | ) | (3 | ) | (4 | ) | ||||||
| Minesite sustaining capital expenditures |
(138 | ) | (125 | ) | (112 | ) | ||||||
| All-in sustaining costs total |
(154 | ) | (142 | ) | (125 | ) | ||||||
| Project exploration and evaluation and project costs |
(1 | ) | (6 | ) | (19 | ) | ||||||
| Project capital expenditures |
(41 | ) | (55 | ) | (14 | ) | ||||||
| All-in costs total |
(42 | ) | (61 | ) | (33 | ) | ||||||
| i. | Ounces sold - equity basis |
Figures remove the impact of: Pierina, Lagunas Norte, Golden Sunlight, and Morila up until its divestiture in November 2020, which are producing incidental ounces.
| j. | Cost of sales per ounce |
Figures remove the cost of sales impact of: Pierina of $5 million for the three month period ended March 31, 2021 (December 31, 2020: $4 million and March 31, 2020: $6 million); Golden Sunlight of $nil for the three month period ended March 31, 2021 (December 31, 2020: $nil and March 31, 2020: $nil); up until its divestiture in November of 2020, Morila, of $nil for the three month period ended March 31, 2021 (December 31, 2020: $2 million and March 31, 2020: $6 million); and Lagunas Norte of $23 million for the three month period ended March 31, 2021 (December 31, 2020: $26 million and March 31, 2020: $21 million), which are producing incidental ounces. Gold cost of sales per ounce is calculated as cost of sales across our gold operations (excluding sites in care and maintenance) divided by ounces sold (both on an attributable basis using Barrick’s ownership share).
| k. | Per ounce figures |
Cost of sales per ounce, total cash costs per ounce, all-in sustaining costs per ounce and all-in costs per ounce may not calculate based on amounts presented in this table due to rounding.
| l. | Co-product costs per ounce |
Total cash costs per ounce, all-in sustaining costs per ounce and all-in costs per ounce presented on a co-product basis removes the impact of by-product credits of our gold production (net of non-controlling interest) calculated as:
| ($ millions) | For the three months ended | |||||||||||
| 3/31/21 | 12/31/20 | 3/31/20 | ||||||||||
| By-product credits |
59 | 56 | 29 | |||||||||
| Non-controlling interest |
(26 | ) | (27 | ) | (15 | ) | ||||||
| By-product credits (net of non-controlling interest) |
33 | 29 | 14 | |||||||||
Endnote 13
Copper cost of sales per pound is calculated as cost of sales across our copper operations divided by pounds sold (both on an attributable basis using Barrick’s ownership share).
Endnote 14
“C1 cash costs” per pound and “All-in sustaining costs” per pound are non-GAAP financial performance measures. “C1 cash costs” per pound is based on cost of sales but excludes the impact of depreciation and royalties and production taxes and includes treatment and refinement charges. “All-in sustaining costs” per pound begins with “C1 cash costs” per pound and adds further costs which reflect the additional costs of operating a mine, primarily sustaining capital expenditures, general & administrative costs and royalties and production taxes. Barrick believes that the use of “C1 cash costs” per pound and “all-in sustaining costs” per pound will assist investors, analysts, and other stakeholders in understanding the costs associated with producing copper, understanding the economics of copper mining, assessing our operating performance, and also our ability to generate free cash flow from current operations and to generate free cash flow on an overall Company basis. “C1 cash costs” per pound and “All-in sustaining costs” per pound are intended to provide additional information only, do not have any standardized meaning under IFRS, and may not be comparable to similar measures of performance presented by other companies. These measures should not be considered in isolation or as a substitute for measures of performance prepared in accordance with IFRS. Further details on these non-GAAP measures are provided in the MD&A accompanying Barrick’s financial statements filed from time to time on SEDAR at www.sedar.com and on EDGAR at www.sec.gov.
| BARRICK FIRST QUARTER 2021 | 18 | PRESS RELEASE |
Reconciliation of Copper Cost of Sales to C1 cash costs and All-in sustaining costs, including on a per pound basis
| ($ millions, except per pound information in dollars) | For the three months ended | |||||||||||
|
|
3/31/21
|
|
|
12/31/20
|
|
|
3/31/20
|
| ||||
| Cost of sales |
136 | 125 | 124 | |||||||||
| Depreciation/amortization |
(48 | ) | (41 | ) | (43 | ) | ||||||
| Treatment and refinement charges |
41 | 39 | 39 | |||||||||
| Cash cost of sales applicable to equity method investments |
79 | 72 | 66 | |||||||||
| Less: royalties and production taxesa |
(23 | ) | (16 | ) | (11 | ) | ||||||
| By-product credits |
(4 | ) | (5 | ) | (3 | ) | ||||||
| Other |
0 | 0 | 0 | |||||||||
| C1 cash costs |
181 | 174 | 172 | |||||||||
| General & administrative costs |
4 | 5 | 3 | |||||||||
| Rehabilitation - accretion and amortization |
1 | 1 | 3 | |||||||||
| Royalties and production taxesa |
23 | 16 | 11 | |||||||||
| Minesite exploration and evaluation costs |
2 | 1 | 1 | |||||||||
| Minesite sustaining capital expenditures |
42 | 65 | 32 | |||||||||
| Sustaining leases |
2 | 2 | 3 | |||||||||
| All-in sustaining costs |
255 | 264 | 225 | |||||||||
| Pounds sold - consolidated basis (millions pounds) |
113 | 108 | 110 | |||||||||
| Cost of sales per poundb,c |
2.11 | 2.06 | 1.96 | |||||||||
| C1 cash cost per poundb |
1.60 | 1.61 | 1.55 | |||||||||
| All-in sustaining costs per poundb |
2.26 | 2.42 | 2.04 | |||||||||
| a. | For the three month period ended March 31, 2021, royalties and production taxes include royalties of $23 million (December 31, 2020: $16 million and March 31, 2020: $11 million). |
| b. | Cost of sales per pound, C1 cash costs per pound and all-in sustaining costs per pound may not calculate based on amounts presented in this table due to rounding. |
| c. | Copper cost of sales per pound is calculated as cost of sales across our copper operations divided by pounds sold (both on an attributable basis using Barrick’s ownership share). |
Endnote 15
Return of capital distribution per share amounts are based on issued and outstanding Barrick shares as of March 31, 2021 and are subject to change.
Endnote 16
Source: Mining Intelligence and Company Reports. Based on 2020 production.
Endnote 17
On a 100% basis.
Endnote 18
Included within our 61.5% interest in Carlin is NGM’s 60% interest in South Arturo.
Endnote 19
Includes Goldrush.
Endnote 20
Porgera was placed on temporary care and maintenance in April 2020 and remains excluded from our 2021 guidance. On April 9, 2021, the Government of Papua New Guinea and BNL, the operator of the Porgera joint venture, signed a binding Framework Agreement in which they agreed on a partnership for Porgera’s future ownership and operation. We expect to update our guidance to include Porgera following both the execution of definitive agreements to implement the Framework Agreement and the finalization of a timeline for the resumption of full mine operations.
Endnote 21
Total cash costs and all-in sustaining costs per ounce include the impact of hedges and/or costs allocated to non-operating sites.
Endnote 22
Operating division guidance ranges reflect expectations at each individual operating division, and may not add up to the company-wide guidance range total. Guidance ranges exclude Pierina, Lagunas Norte, and Golden Sunlight, which are producing incidental ounces while in closure or care and maintenance.
| BARRICK FIRST QUARTER 2021 | 19 | PRESS RELEASE |
Endnote 23
Includes corporate administration costs.
Endnote 24
Reflects the impact of the full year.
Endnote 25
EBITDA is a non-GAAP financial measure, which excludes the following from net earnings: income tax expense; finance costs; finance income; and depreciation. Management believes that EBITDA is a valuable indicator of our ability to generate liquidity by producing operating cash flow to fund working capital needs, service debt obligations, and fund capital expenditures. Management uses EBITDA for this purpose. Adjusted EBITDA removes the effect of impairment charges; acquisition/disposition gains/losses; foreign currency translation gains/losses; other expense adjustments; and the impact of the income tax expense, finance costs, finance income and depreciation incurred in our equity method accounted investments. We believe these items provide a greater level of consistency with the adjusting items included in our Adjusted Net Earnings reconciliation, with the exception that these amounts are adjusted to remove any impact on finance costs/income, income tax expense and/or depreciation as they do not affect EBITDA. We believe this additional information will assist analysts, investors and other stakeholders of Barrick in better understanding our ability to generate liquidity from our full business, including equity method investments, by excluding these amounts from the calculation as they are not indicative of the performance of our core mining business and not necessarily reflective of the underlying operating results for the periods presented. EBITDA and adjusted EBITDA are intended to provide additional information only and do not have any standardized meaning under IFRS and may not be comparable to similar measures of performance presented by other companies. They should not be considered in isolation or as a substitute for measures of performance prepared in accordance with IFRS. Further details on these non-GAAP measures are provided in the MD&A accompanying Barrick’s financial statements filed from time to time on SEDAR at www.sedar.com and on EDGAR at www.sec.gov.
Reconciliation of Net Earnings to EBITDA and Adjusted EBITDA
| ($ millions) | For the three months ended | |||||||||||
|
|
3/31/21
|
|
|
12/31/20
|
|
|
3/31/20
|
| ||||
| Net earnings |
830 | 1,058 | 663 | |||||||||
| Income tax expense |
374 | 404 | 386 | |||||||||
| Finance costs, neta |
77 | 72 | 88 | |||||||||
| Depreciation |
507 | 544 | 524 | |||||||||
| EBITDA |
1,788 | 2,078 | 1,661 | |||||||||
| Impairment charges (reversals) of long-lived assetsb |
(89 | ) | 40 | (336 | ) | |||||||
| Acquisition/disposition (gains) lossesc |
(3 | ) | (126 | ) | (60 | ) | ||||||
| Loss on currency translation |
4 | 16 | 16 | |||||||||
| Other expense (income) adjustmentsd |
11 | 15 | 98 | |||||||||
| Income tax expense, net finance costs, and depreciation from equity investees |
89 | 83 | 87 | |||||||||
| Adjusted EBITDA |
1,800 | 2,106 | 1,466 | |||||||||
| a. | Finance costs exclude accretion. |
| b. | For the three month period ended March 31, 2021, net impairment reversals primarily relate to non-current asset reversals at Lagunas Norte. Net impairment charges (reversals) for the three month periods ended December 31, 2020 and March 31, 2020 mainly relate to non-current assets at our Tanzanian assets. |
| c. | Acquisition/disposition gains for the three month period ended December 31, 2020 primarily relate to the gain on the sale of Eskay Creek, Morila and Bullfrog. For the three months ended March 31, 2020, acquisition/disposition gains mainly relate to the gain on the sale of Massawa. |
| d. | Other expense adjustments for the three month periods ended March 31, 2021 and December 31, 2020 mainly relate to care and maintenance expenses at Porgera. For the three months ended March 31, 2020, other expense adjustments primarily relate to the impact of changes in the discount rate assumptions on our closed mine rehabilitation provision and losses on debt extinguishment. |
| BARRICK FIRST QUARTER 2021 | 20 | PRESS RELEASE |
Cautionary Statement on Forward-Looking Information
Exhibit 99.2
Management’s Discussion and Analysis (“MD&A”)
Quarterly Report on the First Quarter of 2021
Cautionary Statement on Forward-Looking Information
| BARRICK FIRST QUARTER 2021 | 21 | MANAGEMENT’S DISCUSSION AND ANALYSIS |
| BARRICK FIRST QUARTER 2021 | 22 | MANAGEMENT’S DISCUSSION AND ANALYSIS |
| BARRICK FIRST QUARTER 2021 | 23 | MANAGEMENT’S DISCUSSION AND ANALYSIS |
Overview
Financial and Operating Highlights
| For the three months ended | ||||||||||||
| 3/31/21 | 12/31/20 | % Change | 3/31/20 | % Change | ||||||||
| Financial Results ($ millions) |
||||||||||||
| Revenues |
2,956 | 3,279 | (10)% | 2,721 | 9 % | |||||||
| Cost of sales |
1,712 | 1,814 | (6)% | 1,776 | (4)% | |||||||
| Net earningsa |
538 | 685 | (21)% | 400 | 35 % | |||||||
| Adjusted net earningsb |
507 | 616 | (18)% | 285 | 78 % | |||||||
| Adjusted EBITDAb |
1,800 | 2,106 | (15)% | 1,466 | 23 % | |||||||
| Adjusted EBITDA marginc |
61% | 64% | (5)% | 54% | 13 % | |||||||
| Minesite sustaining capital expendituresd |
405 | 354 | 14 % | 370 | 9 % | |||||||
| Project capital expendituresd |
131 | 184 | (29)% | 76 | 72 % | |||||||
| Total consolidated capital expendituresd,e |
539 | 546 | (1)% | 451 | 20 % | |||||||
| Net cash provided by operating activities |
1,302 | 1,638 | (21)% | 889 | 46 % | |||||||
| Net cash provided by operating activities marginf |
44% | 50% | (12)% | 33% | 33 % | |||||||
| Free cash flowb |
763 | 1,092 | (30)% | 438 | 74 % | |||||||
| Net earnings per share (basic and diluted) |
0.30 | 0.39 | (23)% | 0.22 | 36 % | |||||||
| Adjusted net earnings (basic)b per share |
0.29 | 0.35 | (17)% | 0.16 | 81 % | |||||||
| Weighted average diluted common shares (millions of shares) |
1,778 | 1,778 | 0 % | 1,778 | 0 % | |||||||
| Operating Results |
||||||||||||
| Gold production (thousands of ounces)g |
1,101 | 1,206 | (9)% | 1,250 | (12)% | |||||||
| Gold sold (thousands of ounces)g |
1,093 | 1,186 | (8)% | 1,220 | (10)% | |||||||
| Market gold price ($/oz) |
1,794 | 1,874 | (4)% | 1,583 | 13 % | |||||||
| Realized gold priceb,g ($/oz) |
1,777 | 1,871 | (5)% | 1,589 | 12 % | |||||||
| Gold cost of sales (Barrick’s share)g,h ($/oz) |
1,073 | 1,065 | 1 % | 1,020 | 5 % | |||||||
| Gold total cash costsb,g ($/oz) |
716 | 692 | 3 % | 692 | 3 % | |||||||
| Gold all-in sustaining costsb,g ($/oz) |
1,018 | 929 | 10 % | 954 | 7 % | |||||||
| Copper production (millions of pounds)g |
93 | 119 | (22)% | 115 | (19)% | |||||||
| Copper sold (millions of pounds)g |
113 | 108 | 5 % | 110 | 3 % | |||||||
| Market copper price ($/lb) |
3.86 | 3.25 | 19 % | 2.56 | 51 % | |||||||
| Realized copper priceb,g ($/lb) |
4.12 | 3.39 | 22 % | 2.23 | 85 % | |||||||
| Copper cost of sales (Barrick’s share)g,i ($/lb) |
2.11 | 2.06 | 2 % | 1.96 | 8 % | |||||||
| Copper C1 cash costsb,g ($/lb) |
1.60 | 1.61 | (1)% | 1.55 | 3 % | |||||||
| Copper all-in sustaining costsb,g ($/lb) |
2.26 | 2.42 | (7)% | 2.04 | 11 % | |||||||
| |
As at 3/31/21 |
|
As at 12/31/20 |
% Change | As at 3/31/20 |
% Change | ||||||
| Financial Position ($ millions) |
||||||||||||
| Debt (current and long-term) |
5,153 | 5,155 | 0 % | 5,179 | (1)% | |||||||
| Cash and equivalents |
5,672 | 5,188 | 9 % | 3,327 | 70 % | |||||||
| Debt, net of cash |
(519) | (33) | 1,473 % | 1,852 | (128)% | |||||||
| a. | Net earnings represents net earnings attributable to the equity holders of the Company. |
| b. | Adjusted net earnings, adjusted EBITDA, free cash flow, adjusted net earnings per share, realized gold price, all-in sustaining costs, total cash costs, C1 cash costs and realized copper price are non-GAAP financial performance measures with no standardized meaning under IFRS and therefore may not be comparable to similar measures presented by other issuers. For further information and a detailed reconciliation of each non-GAAP measure to the most directly comparable IFRS measure, please see pages 74 to 92 of this MD&A. |
| c. | Represents adjusted EBITDA divided by revenue. |
| d. | Amounts presented on a consolidated cash basis. Project capital expenditures are included in our calculation of all-in costs, but not included in our calculation of all-in sustaining costs. |
| e. | Total consolidated capital expenditures also includes capitalized interest of $3 million for the three month periods ended March 31, 2021 (December 31, 2020: $8 million and March 31, 2020: $5 million). |
| f. | Represents net cash provided by operating activities divided by revenue. |
| g. | On an attributable basis. |
| h. | Gold cost of sales per ounce is calculated as cost of sales across our gold operations (excluding sites in care and maintenance) divided by ounces sold (both on an attributable basis using Barrick’s ownership share). |
| i. | Copper cost of sales per pound is calculated as cost of sales across our copper operations divided by pounds sold (both on an attributable basis using Barrick’s ownership share). |
| BARRICK FIRST QUARTER 2021 | 24 | MANAGEMENT’S DISCUSSION AND ANALYSIS |
| a. | Gold cost of sales per ounce is calculated as cost of sales across our gold operations (excluding sites in care and maintenance) divided by ounces sold (both on an attributable basis using Barrick’s ownership share). Copper cost of sales per pound is calculated as cost of sales across our copper operations divided by pounds sold (both on an attributable basis using Barrick’s ownership share). |
| b. | These are non-GAAP financial performance measures with no standardized meaning under IFRS and therefore may not be comparable to similar measures presented by other issuers. For further information and a detailed reconciliation of each non-GAAP measure to the most directly comparable IFRS measure, please see pages 74 to 92 of this MD&A. |
| c. | Dividend per share declared in respect of the stated period. Return of capital distribution to be paid contemporaneously with respective dividend. |
| d. | Return of capital distribution per share is an estimate based on issued and outstanding shares as of March 31, 2021, and is subject to change. |
| BARRICK FIRST QUARTER 2021 | 25 | MANAGEMENT’S DISCUSSION AND ANALYSIS |
Numerical annotations throughout the text of this document refer to the endnotes found on page 93.
| BARRICK FIRST QUARTER 2021 | 26 | MANAGEMENT’S DISCUSSION AND ANALYSIS |
| BARRICK FIRST QUARTER 2021 | 27 | MANAGEMENT’S DISCUSSION AND ANALYSIS |
| BARRICK FIRST QUARTER 2021 | 28 | MANAGEMENT’S DISCUSSION AND ANALYSIS |
| BARRICK FIRST QUARTER 2021 | 29 | MANAGEMENT’S DISCUSSION AND ANALYSIS |
| BARRICK FIRST QUARTER 2021 | 30 | MANAGEMENT’S DISCUSSION AND ANALYSIS |
| BARRICK FIRST QUARTER 2021 | 31 | MANAGEMENT’S DISCUSSION AND ANALYSIS |
Operating Division Guidance
Our 2021 forecast gold and copper production, cost of salesa, total cash costsb, all-in sustaining costsb, and C1 cash costsb ranges by operating division are as follows:
| Operating Division |
|
2021 forecast attributable production (000s ozs) |
|
|
2021 forecast cost of salesa ($/oz) |
|
|
2021 forecast total cash costsb ($/oz) |
|
|
2021 forecast all-in sustaining costsb ($/oz) |
| ||||
| Gold |
||||||||||||||||
| Carlin (61.5%)c |
940 - 1,000 | 920 - 970 | 740 - 790 | 1,050 - 1,100 | ||||||||||||
| Cortez (61.5%)d |
500 - 550 | 1,000 - 1,050 | 700 - 750 | 940 - 990 | ||||||||||||
| Turquoise Ridge (61.5%) |
390 - 440 | 950 - 1,000 | 620 - 670 | 810 - 860 | ||||||||||||
| Phoenix (61.5%) |
100 - 120 | 1,800 - 1,850 | 725 - 775 | 970 - 1,020 | ||||||||||||
| Long Canyon (61.5%) |
140 - 160 | 800 - 850 | 180 - 230 | 240 - 290 | ||||||||||||
| Nevada Gold Mines (61.5%) |
2,100 - 2,250 | 980 - 1,030 | 660 - 710 | 910 - 960 | ||||||||||||
| Hemlo |
200 - 220 | 1,200 - 1,250 | 950 - 1,000 | 1,280 - 1,330 | ||||||||||||
| North America |
2,300 - 2,450 | 990 - 1,040 | 690 - 740 | 940 - 990 | ||||||||||||
| Pueblo Viejo (60%) |
470 - 510 | 880 - 930 | 520 - 570 | 760 - 810 | ||||||||||||
| Veladero (50%) |
130 - 150 | 1,510 - 1,560 | 820 - 870 | 1,720 - 1,770 | ||||||||||||
| Porgera (47.5%)e |
— | — | — | — | ||||||||||||
| Latin America & Asia Pacific |
600 - 660 | 1,050 - 1,100 | 600 - 650 | 1,000 - 1,050 | ||||||||||||
| Loulo-Gounkoto (80%) |
510 - 560 | 980 - 1,030 | 630 - 680 | 930 - 980 | ||||||||||||
| Kibali (45%) |
350 - 380 | 990 - 1,040 | 590 - 640 | 800 - 850 | ||||||||||||
| North Mara (84%) |
240 - 270 | 970 - 1,020 | 740 - 790 | 960 - 1,010 | ||||||||||||
| Tongon (89.7%) |
180 - 200 | 1,470 - 1,520 | 1,000 - 1,050 | 1,140 - 1,190 | ||||||||||||
| Bulyanhulu (84%) |
170 - 200 | 980 - 1,030 | 580 - 630 | 810 - 860 | ||||||||||||
| Buzwagi (84%) |
30 - 40 | 1,360 - 1,410 | 1,250 - 1,300 | 1,230 - 1,280 | ||||||||||||
| Africa & Middle East |
1,500 - 1,600 | 1,050 - 1,100 | 690 - 740 | 920 - 970 | ||||||||||||
| Total Attributable to Barrickf,g,h |
4,400 - 4,700 | 1,020 - 1,070 | 680 - 730 | 970 - 1,020 | ||||||||||||
| |
2021 forecast attributable production (M lbs) |
|
|
2021 forecast cost of salesa ($/lb) |
|
|
2021 forecast C1 cash costsb ($/lb) |
|
|
2021 forecast all-in sustaining costsb ($/lb) |
| |||||
| Copper |
||||||||||||||||
| Lumwana |
250 - 280 | 1.85 - 2.05 | 1.45 - 1.65 | 2.25 - 2.45 | ||||||||||||
| Zaldívar (50%) |
90 - 110 | 2.30 - 2.50 | 1.65 - 1.85 | 1.90 - 2.10 | ||||||||||||
| Jabal Sayid (50%) |
70 - 80 | 1.40 - 1.60 | 1.10 - 1.30 | 1.30 - 1.50 | ||||||||||||
| Total Copperg |
410 - 460 | 1.90 - 2.10 | 1.40 - 1.60 | 2.00 - 2.20 | ||||||||||||
| a. | Gold cost of sales per ounce is calculated as cost of sales across our gold operations (excluding sites in care and maintenance) divided by ounces sold (both on an attributable basis using Barrick’s ownership share). Copper cost of sales per pound is calculated as cost of sales across our copper operations divided by pounds sold (both on an attributable basis using Barrick’s ownership share). |
| b. | Total cash costs, all-in sustaining costs and C1 cash costs are non-GAAP financial performance measures with no standardized meaning under IFRS and therefore may not be comparable to similar measures of performance presented by other issuers. For further information and a detailed reconciliation of the non-GAAP measures used in this section of the MD&A to the most directly comparable IFRS measures, please see pages 74 to 92 of this MD&A. |
| c. | Included within our 61.5% interest in Carlin is NGM’s 60% interest in South Arturo. |
| d. | Includes Goldrush. |
| e. | Porgera was placed on temporary care and maintenance in April 2020 and remains excluded from our 2021 guidance. On April 9, 2021, the Government of Papua New Guinea and BNL, the operator of the Porgera joint venture, signed a binding Framework Agreement in which they agreed on a partnership for Porgera’s future ownership and operation. We expect to update our guidance to include Porgera following both the execution of definitive agreements to implement the Framework Agreement and the finalization of a timeline for the resumption of full mine operations. |
| f. | Total cash costs and all-in sustaining costs per ounce include the impact of hedges and/or costs allocated to non-operating sites. |
| g. | Operating division guidance ranges reflect expectations at each individual operating division, and may not add up to the company-wide guidance range total. Guidance ranges exclude Pierina, Lagunas Norte, and Golden Sunlight, which are producing incidental ounces while in closure or care and maintenance. |
| h. | Includes corporate administration costs. |
| BARRICK FIRST QUARTER 2021 | 32 | MANAGEMENT’S DISCUSSION AND ANALYSIS |
Production and Cost Summary - Gold
| For the three months ended | ||||||||||||
| 3/31/21 | 12/31/20 | % Change | 3/31/20 | % Change | ||||||||
| Nevada Gold Mines LLC (61.5%)a |
||||||||||||
| Gold produced (000s oz) |
485 | 546 | (11)% | 526 | (8)% | |||||||
| Cost of sales ($/oz) |
1,047 | 1,008 | 4 % | 995 | 5 % | |||||||
| Total cash costs ($/oz)b |
686 | 667 | 3 % | 690 | (1)% | |||||||
| All-in sustaining costs ($/oz)b |
932 | 873 | 7 % | 952 | (2)% | |||||||
| Carlin (61.5%)c |
||||||||||||
| Gold produced (000s oz) |
229 | 260 | (12)% | 253 | (9)% | |||||||
| Cost of sales ($/oz) |
950 | 917 | 4 % | 970 | (2)% | |||||||
| Total cash costs ($/oz)b |
766 | 740 | 4 % | 776 | (1)% | |||||||
| All-in sustaining costs ($/oz)b |
1,045 | 1,005 | 4 % | 1,007 | 4 % | |||||||
| Cortez (61.5%)d |
||||||||||||
| Gold produced (000s oz) |
100 | 118 | (15)% | 128 | (22)% | |||||||
| Cost of sales ($/oz) |
1,251 | 1,043 | 20 % | 878 | 42 % | |||||||
| Total cash costs ($/oz)b |
860 | 738 | 17 % | 614 | 40 % | |||||||
| All-in sustaining costs ($/oz)b |
1,203 | 906 | 33 % | 1,009 | 19 % | |||||||
| Turquoise Ridge (61.5%) |
||||||||||||
| Gold produced (000s oz) |
92 | 91 | 1 % | 84 | 10 % | |||||||
| Cost of sales ($/oz) |
1,007 | 1,064 | (5)% | 1,032 | (2)% | |||||||
| Total cash costs ($/oz)b |
647 | 687 | (6)% | 668 | (3)% | |||||||
| All-in sustaining costs ($/oz)b |
741 | 757 | (2)% | 806 | (8)% | |||||||
| Phoenix (61.5%) |
||||||||||||
| Gold produced (000s oz) |
25 | 26 | (4)% | 35 | (29)% | |||||||
| Cost of sales ($/oz) |
2,051 | 2,054 | 0 % | 1,583 | 30 % | |||||||
| Total cash costs ($/oz)b |
346 | 590 | (41)% | 737 | (53)% | |||||||
| All-in sustaining costs ($/oz)b |
530 | 670 | (21)% | 914 | (42)% | |||||||
| Long Canyon (61.5%) |
||||||||||||
| Gold produced (000s oz) |
39 | 51 | (24)% | 26 | 50% | |||||||
| Cost of sales ($/oz) |
511 | 674 | (24)% | 1,025 | (50)% | |||||||
| Total cash costs ($/oz)b |
79 | 145 | (46)% | 345 | (77)% | |||||||
| All-in sustaining costs ($/oz)b |
156 | 324 | (52)% | 561 | (72)% | |||||||
| Pueblo Viejo (60%) |
||||||||||||
| Gold produced (000s oz) |
137 | 159 | (14)% | 143 | (4)% | |||||||
| Cost of sales ($/oz) |
816 | 803 | 2 % | 767 | 6 % | |||||||
| Total cash costs ($/oz)b |
507 | 493 | 3 % | 502 | 1 % | |||||||
| All-in sustaining costs ($/oz)b |
689 | 689 | 0 % | 626 | 10 % | |||||||
| Loulo-Gounkoto (80%) |
||||||||||||
| Gold produced (000s oz) |
154 | 123 | 25 % | 141 | 9 % | |||||||
| Cost of sales ($/oz) |
974 | 1,149 | (15)% | 1,002 | (3)% | |||||||
| Total cash costs ($/oz)b |
608 | 734 | (17)% | 614 | (1)% | |||||||
| All-in sustaining costs ($/oz)b |
920 | 923 | 0 % | 891 | 3 % | |||||||
| Kibali (45%) |
||||||||||||
| Gold produced (000s oz) |
86 | 92 | (7)% | 91 | (5)% | |||||||
| Cost of sales ($/oz) |
1,065 | 1,163 | (8)% | 1,045 | 2 % | |||||||
| Total cash costs ($/oz)b |
691 | 616 | 12 % | 582 | 19 % | |||||||
| All-in sustaining costs ($/oz)b |
856 | 783 | 9 % | 773 | 11 % | |||||||
| Veladero (50%) |
||||||||||||
| Gold produced (000s oz) |
32 | 58 | (45)% | 75 | (57)% | |||||||
| Cost of sales ($/oz) |
1,151 | 1,074 | 7 % | 1,182 | (3)% | |||||||
| Total cash costs ($/oz)b |
736 | 698 | 5 % | 788 | (7)% | |||||||
| All-in sustaining costs ($/oz)b |
2,104 | 1,428 | 47 % | 1,266 | 66 % | |||||||
| Porgera (47.5%)e |
||||||||||||
| Gold produced (000s oz) |
— | — | — % | 62 | — % | |||||||
| Cost of sales ($/oz) |
— | — | — % | 1,097 | — % | |||||||
| Total cash costs ($/oz)b |
— | — | — % | 941 | — % | |||||||
| All-in sustaining costs ($/oz)b |
— | — | — % | 1,089 | — % | |||||||
| BARRICK FIRST QUARTER 2021 | 33 | MANAGEMENT’S DISCUSSION AND ANALYSIS |
Production and Cost Summary - Gold (continued)
| For the three months ended | ||||||||||||
| 3/31/21 | 12/31/20 | % Change | 3/31/20 | % Change | ||||||||
| Tongon (89.7%) |
||||||||||||
| Gold produced (000s oz) |
48 | 66 | (27)% | 61 | (21)% | |||||||
| Cost of sales ($/oz) |
1,510 | 1,371 | 10 % | 1,368 | 10 % | |||||||
| Total cash costs ($/oz)b |
995 | 810 | 23 % | 762 | 31 % | |||||||
| All-in sustaining costs ($/oz)b |
1,062 | 853 | 25 % | 788 | 35 % | |||||||
| Hemlo |
||||||||||||
| Gold produced (000s oz) |
47 | 57 | (18)% | 57 | (18)% | |||||||
| Cost of sales ($/oz) |
1,610 | 1,379 | 17 % | 1,119 | 44 % | |||||||
| Total cash costs ($/oz)b |
1,324 | 1,104 | 20 % | 945 | 40 % | |||||||
| All-in sustaining costs ($/oz)b |
1,840 | 1,464 | 26 % | 1,281 | 44 % | |||||||
| North Mara (84%) |
||||||||||||
| Gold produced (000s oz) |
62 | 61 | 2 % | 65 | (5)% | |||||||
| Cost of sales ($/oz) |
1,061 | 1,073 | (1)% | 959 | 11 % | |||||||
| Total cash costs ($/oz)b |
832 | 799 | 4 % | 646 | 29 % | |||||||
| All-in sustaining costs ($/oz)b |
1,038 | 989 | 5 % | 816 | 27 % | |||||||
| Buzwagi (84%) |
||||||||||||
| Gold produced (000s oz) |
17 | 21 | (19)% | 22 | (23)% | |||||||
| Cost of sales ($/oz) |
1,486 | 1,314 | 13 % | 1,373 | 8 % | |||||||
| Total cash costs ($/oz)b |
1,450 | 1,267 | 14 % | 1,275 | 14 % | |||||||
| All-in sustaining costs ($/oz)b |
1,467 | 1,283 | 14 % | 1,288 | 14 % | |||||||
| Bulyanhulu (84%) |
||||||||||||
| Gold produced (000s oz) |
33 | 23 | 43 % | 7 | 371 % | |||||||
| Cost of sales ($/oz) |
1,211 | 1,181 | 3 % | 1,685 | (28)% | |||||||
| Total cash costs ($/oz)b |
865 | 610 | 42 % | 686 | 26 % | |||||||
| All-in sustaining costs ($/oz)b |
957 | 664 | 44 % | 906 | 6 % | |||||||
| Total Attributable to Barrickf |
||||||||||||
| Gold produced (000s oz) |
1,101 | 1,206 | (9)% | 1,250 | (12)% | |||||||
| Cost of sales ($/oz)g |
1,073 | 1,065 | 1 % | 1,020 | 5 % | |||||||
| Total cash costs ($/oz)b |
716 | 692 | 3 % | 692 | 3 % | |||||||
| All-in sustaining costs ($/oz)b |
1,018 | 929 | 10 % | 954 | 7 % | |||||||
| a. | These results represent our 61.5% interest in Carlin (including NGM’s 60% interest in South Arturo), Cortez, Turquoise Ridge, Phoenix and Long Canyon. |
| b. | These are non-GAAP financial performance measures with no standardized meaning under IFRS and therefore may not be comparable to similar measures presented by other issuers. For further information and a detailed reconciliation of each non-GAAP measure used in this section of the MD&A to the most directly comparable IFRS measure, please see pages 74 to 92 of this MD&A. |
| c. | Included within our 61.5% interest in Carlin is NGM’s 60% interest in South Arturo. |
| d. | Starting in the first quarter of 2021, Goldrush is reported as part of Cortez as it is operated by Cortez management. Comparative periods have been restated to include Goldrush. |
| e. | As Porgera was placed on care and maintenance on April 25, 2020, no operating data or per ounce data is provided. |
| f. | Excludes Pierina, Lagunas Norte, Golden Sunlight, and Morila (40%) up until its divestiture in November 2020, as these assets are producing incidental ounces while in closure or care and maintenance. |
| g. | Gold cost of sales per ounce is calculated as cost of sales across our gold operations (excluding sites in care and maintenance) divided by ounces sold (both on an attributable basis using Barrick’s ownership share). |
| BARRICK FIRST QUARTER 2021 | 34 | MANAGEMENT’S DISCUSSION AND ANALYSIS |
Production and Cost Summary - Copper
| For the three months ended | ||||||||||||
| 3/31/21 | 12/31/20 | % Change | 3/31/20 | % Change | ||||||||
| Lumwana |
||||||||||||
| Copper production (millions lbs) |
51 | 78 | (35)% | 64 | (20)% | |||||||
| Cost of sales ($/lb) |
1.97 | 1.96 | 1 % | 1.94 | 2 % | |||||||
| C1 cash costs ($/lb)a |
1.48 | 1.58 | (6)% | 1.63 | (9)% | |||||||
| All-in sustaining costs ($/lb)a |
2.37 | 2.60 | (9)% | 2.26 | 5 % | |||||||
| Zaldívar (50%) |
||||||||||||
| Copper production (millions lbs) |
24 | 23 | 4 % | 31 | (23)% | |||||||
| Cost of sales ($/lb) |
3.03 | 2.68 | 13 % | 2.39 | 27 % | |||||||
| C1 cash costs ($/lb)a |
2.25 | 2.01 | 12 % | 1.71 | 32 % | |||||||
| All-in sustaining costs ($/lb)a |
2.47 | 2.70 | (9)% | 1.99 | 24 % | |||||||
| Jabal Sayid (50%) |
||||||||||||
| Copper production (millions lbs) |
18 | 18 | 0 % | 20 | (10)% | |||||||
| Cost of sales ($/lb) |
1.21 | 1.53 | (21)% | 1.28 | (5)% | |||||||
| C1 cash costs ($/lb)a |
1.06 | 1.15 | (8)% | 0.97 | 9 % | |||||||
| All-in sustaining costs ($/lb)a |
1.22 | 1.27 | (4)% | 1.11 | 10 % | |||||||
| Total Copper |
||||||||||||
| Copper production (millions lbs) |
93 | 119 | (22)% | 115 | (19)% | |||||||
| Cost of sales ($/lb)b |
2.11 | 2.06 | 2 % | 1.96 | 8 % | |||||||
| C1 cash costs ($/lb)a |
1.60 | 1.61 | (1)% | 1.55 | 3 % | |||||||
| All-in sustaining costs ($/lb)a |
2.26 | 2.42 | (7)% | 2.04 | 11 % | |||||||
| a. | These are non-GAAP financial performance measures with no standardized meaning under IFRS and therefore may not be comparable to similar measures presented by other issuers. For further information and a detailed reconciliation of each non-GAAP measure used in this section of the MD&A to the most directly comparable IFRS measure, please see pages 74 to 92 of this MD&A. |
| b. | Copper cost of sales per pound is calculated as cost of sales across our copper operations divided by pounds sold (both on an attributable basis using Barrick’s ownership share). |
Operating Divisions Performance
| BARRICK FIRST QUARTER 2021 | 35 | MANAGEMENT’S DISCUSSION AND ANALYSIS |
Nevada Gold Mines (61.5% basis)a, Nevada USA
Summary of Operating and Financial Data
| For the three months ended | ||||||||||||
| 3/31/21 | 12/31/20 | % Change | 3/31/20 | % Change | ||||||||
| Total tonnes mined (000s) |
54,157 | 57,614 | (6)% | 56,516 | (4)% | |||||||
| Open pit ore |
8,170 | 8,843 | (8)% | 10,433 | (22)% | |||||||
| Open pit waste |
44,685 | 47,472 | (6)% | 44,808 | 0 % | |||||||
| Underground |
1,302 | 1,299 | 0 % | 1,275 | 2 % | |||||||
| Average grade (grams/tonne) |
||||||||||||
| Open pit mined |
1.09 | 1.02 | 7 % | 0.78 | 40 % | |||||||
| Underground mined |
9.22 | 9.39 | (2)% | 10.03 | (8)% | |||||||
| Processed |
2.18 | 2.05 | 6 % | 1.71 | 27 % | |||||||
| Ore tonnes processed (000s) |
10,025 | 10,717 | (6)% | 12,539 | (20)% | |||||||
| Oxide mill |
3,171 | 3,220 | (2)% | 3,189 | (1)% | |||||||
| Roaster |
1,397 | 1,468 | (5)% | 1,304 | 7 % | |||||||
| Autoclave |
1,193 | 1,207 | (1)% | 1,402 | (15)% | |||||||
| Heap leach |
4,264 | 4,822 | (12)% | 6,464 | (34)% | |||||||
| Recovery rateb |
79 % | 79 % | 0 % | 81 % | (2)% | |||||||
| Oxide Millb |
74 % | 73 % | 1 % | 72 % | 3 % | |||||||
| Roaster |
86 % | 86 % | 0 % | 86 % | 0 % | |||||||
| Autoclave |
68 % | 69 % | (1)% | 75 % | (9)% | |||||||
| Gold produced (000s oz) |
485 | 546 | (11)% | 526 | (8)% | |||||||
| Oxide mill |
71 | 83 | (14)% | 71 | 0 % | |||||||
| Roaster |
241 | 270 | (11)% | 260 | (7)% | |||||||
| Autoclave |
109 | 111 | (2)% | 129 | (16)% | |||||||
| Heap leach |
64 | 82 | (22)% | 66 | (3)% | |||||||
| Gold sold (000s oz) |
488 | 542 | (10)% | 528 | (8)% | |||||||
| Revenue ($ millions) |
889 | 1,032 | (14)% | 853 | 4 % | |||||||
| Cost of sales ($ millions) |
508 | 542 | (6)% | 527 | (4)% | |||||||
| Income ($ millions) |
375 | 482 | (22)% | 316 | 19 % | |||||||
| EBITDA ($ millions)c |
517 | 634 | (18)% | 462 | 12 % | |||||||
| EBITDA marginc,d |
58% | 61% | (5)% | 54 % | 8 % | |||||||
| Capital expenditures ($ millions)e |
134 | 126 | 6 % | 143 | (6)% | |||||||
| Minesite sustaining |
113 | 95 | 19 % | 122 | (7)% | |||||||
| Project |
21 | 31 | (32)% | 21 | 0 % | |||||||
| Cost of sales ($/oz) |
1,047 | 1,008 | 4 % | 995 | 5 % | |||||||
| Total cash costs ($/oz)c |
686 | 667 | 3 % | 690 | (1)% | |||||||
| All-in sustaining costs ($/oz)c |
932 | 873 | 7 % | 952 | (2)% | |||||||
| All-in costs ($/oz)c |
974 | 925 | 5 % | 993 | (2%) | |||||||
| a. | Barrick is the operator of the joint venture and owns 61.5%, with Newmont Corporation owning the remaining 38.5%. Nevada Gold Mines is accounted for as a subsidiary with a 38.5% non-controlling interest. These results represent our 61.5% interest in Carlin (including NGM’s 60% interest in South Arturo), Cortez, Turquoise Ridge, Phoenix and Long Canyon. |
| b. | Excludes the Gold Quarry (Mill 5) concentrator. |
| c. | These are non-GAAP financial performance measures with no standardized meaning under IFRS and therefore may not be comparable to similar measures presented by other issuers. For further information and a detailed reconciliation of each non-GAAP measure used in this section of the MD&A to the most directly comparable IFRS measure, please see pages 74 to 92 of this MD&A. |
| d. | Represents EBITDA divided by revenue. |
| e. | Amounts presented exclude capitalized interest. |
| BARRICK FIRST QUARTER 2021 | 36 | MANAGEMENT’S DISCUSSION AND ANALYSIS |
| BARRICK FIRST QUARTER 2021 | 37 | MANAGEMENT’S DISCUSSION AND ANALYSIS |
Carlin (61.5% basis)a, Nevada USA
Summary of Operating and Financial Data
| For the three months ended |
| |||||||||||||
| 3/31/21 | 12/31/20 | % Change | 3/31/20 | % Change | ||||||||||
| Total tonnes mined (000s) |
18,898 | 19,761 | (4%) | 17,120 | 10% | |||||||||
| Open pit ore |
882 | 919 | (4%) | 1,467 | (40% | ) | ||||||||
| Open pit waste |
17,215 | 18,038 | (5%) | 14,901 | 16% | |||||||||
| Underground |
801 | 804 | 0% | 752 | 7% | |||||||||
| Average grade (grams/tonne) |
||||||||||||||
| Open pit mined |
0.95 | 1.42 | (33%) | 1.36 | (30% | ) | ||||||||
| Underground mined |
8.75 | 8.78 | 0% | 9.45 | (7% | ) | ||||||||
| Processed |
3.49 | 3.82 | (9%) | 3.41 | 2% | |||||||||
| Ore tonnes processed (000s) |
3,026 | 3,053 | (1%) | 3,229 | (6% | ) | ||||||||
| Oxide mill |
749 | 785 | (5%) | 669 | 12% | |||||||||
| Roasters |
1,058 | 1,143 | (7%) | 928 | 14% | |||||||||
| Autoclave |
525 | 595 | (12%) | 853 | (38% | ) | ||||||||
| Heap leach |
694 | 530 | 31% | 779 | (11% | ) | ||||||||
| Recovery rateb |
78% | 79% | (1%) | 80 % | (3% | ) | ||||||||
| Roasters |
86% | 87% | (1%) | 85 % | 1% | |||||||||
| Autoclave |
45% | 48% | (6%) | 64 % | (30% | ) | ||||||||
| Gold produced (000s oz) |
229 | 260 | (12%) | 253 | (9% | ) | ||||||||
| Oxide mill |
7 | 9 | (22%) | 9 | (22% | ) | ||||||||
| Roasters |
188 | 214 | (12%) | 183 | 3% | |||||||||
| Autoclave |
25 | 27 | (7%) | 50 | (50% | ) | ||||||||
| Heap leach |
9 | 10 | (10%) | 11 | (18% | ) | ||||||||
| Gold sold (000s oz) |
231 | 259 | (11%) | 256 | (10% | ) | ||||||||
| Revenue ($ millions) |
408 | 479 | (15%) | 407 | 0% | |||||||||
| Cost of sales ($ millions) |
219 | 237 | (8%) | 248 | (12% | ) | ||||||||
| Income ($ millions) |
188 | 244 | (23%) | 153 | 23% | |||||||||
| EBITDA ($ millions)c |
230 | 289 | (20%) | 202 | 14% | |||||||||
| EBITDA marginc,d |
56% | 60% | (7%) | 50 % | 12% | |||||||||
| Capital expenditures ($ millions) |
61 | 57 | 7% | 55 | 11% | |||||||||
| Minesite sustaining |
61 | 57 | 7% | 55 | 11% | |||||||||
| Project |
0 | 0 | 0% | 0 | 0% | |||||||||
| Cost of sales ($/oz) |
950 | 917 | 4% | 970 | (2% | ) | ||||||||
| Total cash costs ($/oz)c |
766 | 740 | 4% | 776 | (1% | ) | ||||||||
| All-in sustaining costs ($/oz)c |
1,045 | 1,005 | 4% | 1,007 | 4% | |||||||||
| All-in costs ($/oz)c |
1,045 | 1,005 | 4% | 1,007 | 4% | |||||||||
| a. | Included within our 61.5% interest in Carlin is NGM’s 60% interest in South Arturo. |
| b. | Excludes the Gold Quarry (Mill 5) concentrator. |
| c. | These are non-GAAP financial performance measures with no standardized meaning under IFRS and therefore may not be comparable to similar measures presented by other issuers. For further information and a detailed reconciliation of each non-GAAP measure used in this section of the MD&A to the most directly comparable IFRS measure, please see pages 74 to 92 of this MD&A. |
| d. | Represents EBITDA divided by revenue. |
| BARRICK FIRST QUARTER 2021 | 38 | MANAGEMENT’S DISCUSSION AND ANALYSIS |
| BARRICK FIRST QUARTER 2021 | 39 | MANAGEMENT’S DISCUSSION AND ANALYSIS |
Cortez (61.5% basis)a, Nevada USA
Summary of Operating and Financial Data
| For the three months ended | ||||||||||||
| 3/31/21 | 12/31/20 | % Change | 3/31/20 | % Change | ||||||||
| Total tonnes mined (000s) |
20,923 | 21,842 | (4)% | 22,696 | (8)% | |||||||
| Open pit ore |
1,818 | 2,279 | (20)% | 4,566 | (60)% | |||||||
| Open pit waste |
18,800 | 19,280 | (2)% | 17,841 | 5 % | |||||||
| Underground |
305 | 283 | 8 % | 289 | 6 % | |||||||
| Average grade (grams/tonne) |
||||||||||||
| Open pit mined |
0.84 | 0.95 | (12)% | 0.44 | 91 % | |||||||
| Underground mined |
8.51 | 8.92 | (5)% | 10.63 | (20)% | |||||||
| Processed |
1.81 | 1.75 | 3 % | 1.06 | 71 % | |||||||
| Ore tonnes processed (000s) |
2,335 | 2,553 | (9)% | 4,783 | (51)% | |||||||
| Oxide mill |
556 | 558 | 0 % | 670 | (17)% | |||||||
| Roasters |
339 | 325 | 4 % | 376 | (10)% | |||||||
| Heap leach |
1,440 | 1,670 | (14)% | 3,737 | (61)% | |||||||
| Recovery rate |
81% | 81 % | 0 % | 84% | (4)% | |||||||
| Oxide Mill |
77% | 77 % | 0 % | 72 % | 7 % | |||||||
| Roasters |
84% | 85 % | (1)% | 88 % | (4)% | |||||||
| Gold produced (000s oz) |
100 | 118 | (15)% | 128 | (22)% | |||||||
| Oxide mill |
36 | 45 | (20)% | 26 | 38 % | |||||||
| Roasters |
53 | 56 | (5)% | 77 | (31)% | |||||||
| Heap leach |
11 | 17 | (35)% | 25 | (56)% | |||||||
| Gold sold (000s oz) |
102 | 116 | (12)% | 128 | (20)% | |||||||
| Revenue ($ millions) |
179 | 216 | (17)% | 203 | (12%) | |||||||
| Cost of sales ($ millions) |
127 | 121 | 5 % | 112 | 13 % | |||||||
| Income ($ millions) |
49 | 93 | (47)% | 89 | (45)% | |||||||
| EBITDA ($ millions)b |
88 | 128 | (31)% | 122 | (28)% | |||||||
| EBITDA marginb,c |
49% | 59% | (17)% | 60 % | (18)% | |||||||
| Capital expenditures ($ millions)d |
43 | 37 | 16 % | 59 | (27)% | |||||||
| Minesite sustaining |
33 | 18 | 83 % | 46 | (28)% | |||||||
| Project |
10 | 19 | (47)% | 13 | (23)% | |||||||
| Cost of sales ($/oz) |
1,251 | 1,043 | 20 % | 878 | 42 % | |||||||
| Total cash costs ($/oz)b |
860 | 738 | 17 % | 614 | 40 % | |||||||
| All-in sustaining costs ($/oz)b |
1,203 | 906 | 33 % | 1,009 | 19 % | |||||||
| All-in costs ($/oz)b |
1,303 | 1,065 | 22 % | 1,112 | 17 % | |||||||
| a. | Starting in the first quarter of 2021, Goldrush is reported as part of Cortez as it is operated by Cortez management. Comparative periods have been restated to include Goldrush. |
| b. | These are non-GAAP financial performance measures with no standardized meaning under IFRS and therefore may not be comparable to similar measures presented by other issuers. For further information and a detailed reconciliation of each non-GAAP measure used in this section of the MD&A to the most directly comparable IFRS measure, please see pages 74 to 92 of this MD&A. |
| c. | Represents EBITDA divided by revenue. |
| d. | Amounts presented exclude capitalized interest. |
| BARRICK FIRST QUARTER 2021 | 40 | MANAGEMENT’S DISCUSSION AND ANALYSIS |
| BARRICK FIRST QUARTER 2021 | 41 | MANAGEMENT’S DISCUSSION AND ANALYSIS |
Turquoise Ridge (61.5%), Nevada USA
Summary of Operating and Financial Data
| For the three months ended | ||||||||||||||||||||
| 3/31/21 | 12/31/20 | % Change | 3/31/20 | % Change | ||||||||||||||||
| Total tonnes mined (000s) |
3,569 | 3,880 | (8)% | 3,744 | (5)% | |||||||||||||||
| Open pit ore |
1,158 | 1,447 | (20)% | 1,008 | 15 % | |||||||||||||||
| Open pit waste |
2,215 | 2,221 | 0 % | 2,502 | (11)% | |||||||||||||||
| Underground |
196 | 212 | (8)% | 234 | (16)% | |||||||||||||||
| Average grade (grams/tonne) |
||||||||||||||||||||
| Open pit mined |
1.87 | 2.21 | (15)% | 1.91 | (2)% | |||||||||||||||
| Underground mined |
11.64 | 11.94 | (3)% | 10.98 | 6 % | |||||||||||||||
| Processed |
3.42 | 3.47 | (1)% | 3.35 | 2 % | |||||||||||||||
| Ore tonnes processed (000s) |
967 | 964 | 0 % | 862 | 12 % | |||||||||||||||
| Oxide Mill |
105 | 120 | (13)% | 120 | (13)% | |||||||||||||||
| Autoclave |
668 | 612 | 9 % | 549 | 22 % | |||||||||||||||
| Heap leach |
194 | 232 | (16)% | 193 | 1 % | |||||||||||||||
| Recovery rate |
82% | 82 % | 0 % | 84 % | (2)% | |||||||||||||||
| Oxide Mill |
87% | 86 % | 1 % | 84 % | 4 % | |||||||||||||||
| Autoclave |
81% | 82 % | (1)% | 85 % | (5)% | |||||||||||||||
| Gold produced (000s oz) |
92 | 91 | 1 % | 84 | 10 % | |||||||||||||||
| Oxide Mill |
5 | 5 | 0 % | 4 | 25 % | |||||||||||||||
| Autoclave |
84 | 84 | 0 % | 78 | 8 % | |||||||||||||||
| Heap leach |
3 | 2 | 50 % | 2 | 50 % | |||||||||||||||
| Gold sold (000s oz) |
92 | 90 | 2 % | 87 | 6 % | |||||||||||||||
| Revenue ($ millions) |
165 | 168 | (2)% | 139 | 19 % | |||||||||||||||
| Cost of sales ($ millions) |
93 | 95 | (2)% | 90 | 3 % | |||||||||||||||
| Income ($ millions) |
72 | 72 | 0 % | 47 | 53 % | |||||||||||||||
| EBITDA ($ millions)a |
104 | 104 | 0 % | 78 | 33 % | |||||||||||||||
| EBITDA margina,b |
63% | 62 % | 2 % | 56 % | 12 % | |||||||||||||||
| Capital expenditures ($ millions) |
20 | 10 | 100 % | 19 | 5 % | |||||||||||||||
| Minesite sustaining |
9 | 6 | 50 % | 11 | (18)% | |||||||||||||||
| Project |
11 | 4 | 175 % | 8 | 38% | |||||||||||||||
| Cost of sales ($/oz) |
1,007 | 1,064 | (5)% | 1,032 | (2)% | |||||||||||||||
| Total cash costs ($/oz)a |
647 | 687 | (6)% | 668 | (3)% | |||||||||||||||
| All-in sustaining costs ($/oz)a |
741 | 757 | (2)% | 806 | (8)% | |||||||||||||||
| All-in costs ($/oz)a |
866 | 799 | 8 % | 903 | (4)% | |||||||||||||||
| a. | These are non-GAAP financial performance measures with no standardized meaning under IFRS and therefore may not be comparable to similar measures presented by other issuers. For further information and a detailed reconciliation of each non-GAAP measure used in this section of the MD&A to the most directly comparable IFRS measure, please see pages 74 to 92 of this MD&A. |
| b. | Represents EBITDA divided by revenue. |
| BARRICK FIRST QUARTER 2021 | 42 | MANAGEMENT’S DISCUSSION AND ANALYSIS |
| BARRICK FIRST QUARTER 2021 | 43 | MANAGEMENT’S DISCUSSION AND ANALYSIS |
Other Mines - Nevada Gold Mines
Summary of Operating and Financial Data
| For the three months ended | ||||||||||||||||||||||||||||||||||||||||
| 3/31/21 | 12/31/20 | |||||||||||||||||||||||||||||||||||||||
|
|
Gold produced (000s oz) |
|
|
Cost of sales ($/oz) |
|
|
Total cash costs ($/oz)a |
|
|
All-in sustaining costs ($/oz)a |
|
|
Capital Expend- ituresb |
|
|
Gold produced (000s oz) |
|
|
Cost of sales ($/oz) |
|
|
Total cash costs ($/oz)a |
|
|
All-in sustaining costs ($/oz)a |
|
|
Capital Expend- ituresb |
| |||||||||||
| Phoenix (61.5%) |
25 | 2,051 | 346 | 530 | 4 | 26 | 2,054 | 590 | 670 | 2 | ||||||||||||||||||||||||||||||
| Long Canyon (61.5%) |
39 | 511 | 79 | 156 | 2 | 51 | 674 | 145 | 324 | 7 | ||||||||||||||||||||||||||||||
| a. | These are non-GAAP financial performance measures with no standardized meaning under IFRS and therefore may not be comparable to similar measures presented by other issuers. For further information and a detailed reconciliation of each non-GAAP measure used in this section of the MD&A to the most directly comparable IFRS measure, please see pages 74 to 92 of this MD&A. |
| b. | Includes both minesite sustaining and project capital expenditures. |
| BARRICK FIRST QUARTER 2021 | 44 | MANAGEMENT’S DISCUSSION AND ANALYSIS |
Pueblo Viejo (60% basis)a, Dominican Republic
Summary of Operating and Financial Data
| For the three months ended | ||||||||||||||||||||
| 3/31/21 | 12/31/20 | % Change | 3/31/20 | % Change | ||||||||||||||||
| Open pit tonnes mined (000s) |
6,636 | 6,248 | 6 % | 4,039 | 64 % | |||||||||||||||
| Open pit ore |
2,137 | 2,274 | (6)% | 627 | 241 % | |||||||||||||||
| Open pit waste |
4,499 | 3,974 | 13 % | 3,412 | 32 % | |||||||||||||||
| Average grade (grams/tonne) |
||||||||||||||||||||
| Open pit mined |
2.46 | 2.68 | (8)% | 2.21 | 11 % | |||||||||||||||
| Processed |
3.55 | 3.91 | (9)% | 3.44 | 3 % | |||||||||||||||
| Autoclave ore tonnes processed (000s) |
1,349 | 1,456 | (7)% | 1,471 | (8)% | |||||||||||||||
| Recovery rate |
88 % | 87 % | 1 % | 89 % | (1)% | |||||||||||||||
| Gold produced (000s oz) |
137 | 159 | (14)% | 143 | (4)% | |||||||||||||||
| Gold sold (000s oz) |
141 | 153 | (8)% | 144 | (2)% | |||||||||||||||
| Revenue ($ millions) |
246 | 291 | (15)% | 216 | 14 % | |||||||||||||||
| Cost of sales ($ millions) |
115 | 122 | (6)% | 111 | 4 % | |||||||||||||||
| Income ($ millions) |
131 | 167 | (22)% | 102 | 28 % | |||||||||||||||
| EBITDA ($ millions)b |
168 | 204 | (18)% | 134 | 25 % | |||||||||||||||
| EBITDA marginb,c |
68 % | 70 % | (3)% | 62 % | 10 % | |||||||||||||||
| Capital expenditures ($ millions) |
59 | 66 | (11)% | 17 | 247 % | |||||||||||||||
| Minesite sustaining |
24 | 27 | (11)% | 17 | 41 % | |||||||||||||||
| Project |
35 | 39 | (10)% | 0 | 0 % | |||||||||||||||
| Cost of sales ($/oz) |
816 | 803 | 2 % | 767 | 6 % | |||||||||||||||
| Total cash costs ($/oz)b |
507 | 493 | 3 % | 502 | 1 % | |||||||||||||||
| All-in sustaining costs ($/oz)b |
689 | 689 | 0 % | 626 | 10 % | |||||||||||||||
| All-in costs ($/oz)b |
936 | 941 | (1)% | 635 | 47 % | |||||||||||||||
| a. | Pueblo Viejo is accounted for as a subsidiary with a 40% non-controlling interest. The results in the table and the discussion that follows are based on our 60% share only. |
| b. | These are non-GAAP financial performance measures with no standardized meaning under IFRS and therefore may not be comparable to similar measures presented by other issuers. For further information and a detailed reconciliation of each non-GAAP measure used in this section of the MD&A to the most directly comparable IFRS measure, please see pages 74 to 92 of this MD&A. |
| c. | Represents EBITDA divided by revenue. |
| BARRICK FIRST QUARTER 2021 | 45 | MANAGEMENT’S DISCUSSION AND ANALYSIS |
| BARRICK FIRST QUARTER 2021 | 46 | MANAGEMENT’S DISCUSSION AND ANALYSIS |
Loulo-Gounkoto (80% basis)a, Mali
Summary of Operating and Financial Data
| For the three months ended | ||||||||||||||||
| 3/31/21 | 12/31/20 | % Change | 3/31/20 | % Change | ||||||||||||
| Total tonnes mined (000s) |
9,009 | 8,582 | 5 % | 7,572 | 19 % | |||||||||||
| Open pit ore |
149 | 888 | (83)% | 599 | (75)% | |||||||||||
| Open pit waste |
8,313 | 7,111 | 17 % | 6,405 | 30 % | |||||||||||
| Underground |
547 | 583 | (6)% | 568 | (4)% | |||||||||||
| Average grade (grams/tonne) |
||||||||||||||||
| Open pit mined |
2.82 | 5.01 | (44)% | 7.47 | (62)% | |||||||||||
| Underground mined |
4.61 | 4.55 | 1 % | 4.16 | 11 % | |||||||||||
| Processed |
5.38 | 4.41 | 22 % | 4.96 | 8 % | |||||||||||
| Ore tonnes processed (000s) |
984 | 959 | 3 % | 980 | 0 % | |||||||||||
| Recovery rate |
91 % | 91 % | 0 % | 90 % | 1 % | |||||||||||
| Gold produced (000s oz) |
154 | 123 | 25 % | 141 | 9 % | |||||||||||
| Gold sold (000s oz) |
151 | 126 | 20 % | 123 | 23 % | |||||||||||
| Revenue ($ millions) |
269 | 236 | 14 % | 194 | 39 % | |||||||||||
| Cost of sales ($ millions) |
147 | 146 | 1 % | 122 | 20 % | |||||||||||
| Income ($ millions) |
113 | 91 | 24 % | 68 | 66 % | |||||||||||
| EBITDA ($ millions)b |
168 | 143 | 17 % | 115 | 46 % | |||||||||||
| EBITDA marginb,c |
62 % | 61 % | 2 % | 59 % | 5 % | |||||||||||
| Capital expenditures ($ millions) |
55 | 27 | 104 % | 32 | 72 % | |||||||||||
| Minesite sustaining |
43 | 21 | 105 % | 32 | 34 % | |||||||||||
| Project |
12 | 6 | 100 % | 0 | 100 % | |||||||||||
| Cost of sales ($/oz) |
974 | 1,149 | (15)% | 1,002 | (3)% | |||||||||||
| Total cash costs ($/oz)b |
608 | 734 | (17)% | 614 | (1)% | |||||||||||
| All-in sustaining costs ($/oz)b |
920 | 923 | 0 % | 891 | 3 % | |||||||||||
| All-in costs ($/oz)b |
1,000 | 970 | 3 % | 891 | 12 % | |||||||||||
| a. | Barrick owns 80% of Société des Mines de Loulo SA and Société des Mines de Gounkoto with the Republic of Mali owning 20%. Loulo-Gounkoto is accounted for as a subsidiary with a 20% non-controlling interest on the basis that Barrick controls the asset. The results in the table and the discussion that follows are based on our 80% share, inclusive of the impact of the purchase price allocation resulting from the Merger. |
| b. | These are non-GAAP financial performance measures with no standardized meaning under IFRS and therefore may not be comparable to similar measures presented by other issuers. For further information and a detailed reconciliation of each non-GAAP measure used in this section of the MD&A to the most directly comparable IFRS measure, please see pages 74 to 92 of this MD&A. |
| c. | Represents EBITDA divided by revenue. |
| BARRICK FIRST QUARTER 2021 | 47 | MANAGEMENT’S DISCUSSION AND ANALYSIS |
| BARRICK FIRST QUARTER 2021 | 48 | MANAGEMENT’S DISCUSSION AND ANALYSIS |
Kibali (45% basis)a, Democratic Republic of Congo
Summary of Operating and Financial Data
| For the three months ended | ||||||||||||||||
| 3/31/21 | 12/31/20 | % Change | 3/31/20 | % Change | ||||||||||||
| Total tonnes mined (000s) |
3,409 | 3,474 | (2) % | 3,175 | 7 % | |||||||||||
| Open pit ore |
261 | 308 | (15)% | 375 | (30)% | |||||||||||
| Open pit waste |
2,694 | 2,682 | 0 % | 2,333 | 15 % | |||||||||||
| Underground |
454 | 484 | (6)% | 467 | (3)% | |||||||||||
| Average grade (grams/tonne) |
||||||||||||||||
| Open pit mined |
2.55 | 2.39 | 7 % | 2.12 | 20 % | |||||||||||
| Underground mined |
5.18 | 5.37 | (4)% | 5.16 | 0 % | |||||||||||
| Processed |
3.33 | 3.60 | (8)% | 3.77 | (12)% | |||||||||||
| Ore tonnes processed (000s) |
894 | 877 | 2 % | 838 | 7 % | |||||||||||
| Recovery rate |
90 % | 90 % | 0 % | 89 % | 1 % | |||||||||||
| Gold produced (000s oz) |
86 | 92 | (7)% | 91 | (5)% | |||||||||||
| Gold sold (000s oz) |
86 | 89 | (3)% | 88 | (2)% | |||||||||||
| Revenue ($ millions) |
154 | 168 | (8)% | 140 | 10 % | |||||||||||
| Cost of sales ($ millions) |
92 | 104 | (12)% | 93 | (1)% | |||||||||||
| Income ($ millions) |
63 | 58 | 9 % | 48 | 31 % | |||||||||||
| EBITDA ($ millions)b |
95 | 106 | (10)% | 89 | 7 % | |||||||||||
| EBITDA marginb,c |
62 % | 63 % | (2)% | 64 % | (3)% | |||||||||||
| Capital expenditures ($ millions) |
11 | 12 | (8)% | 15 | (27)% | |||||||||||
| Minesite sustaining |
11 | 11 | 0 % | 15 | (27)% | |||||||||||
| Project |
0 | 1 | (100)% | 0 | 0 % | |||||||||||
| Cost of sales ($/oz) |
1,065 | 1,163 | (8)% | 1,045 | 2 % | |||||||||||
| Total cash costs ($/oz)b |
691 | 616 | 12 % | 582 | 19 % | |||||||||||
| All-in sustaining costs ($/oz)b |
856 | 783 | 9 % | 773 | 11 % | |||||||||||
| All-in costs ($/oz)b |
862 | 787 | 10 % | 773 | 12 % | |||||||||||
| a. | Barrick owns 45% of Kibali Goldmines SA (Kibali) with the Democratic Republic of Congo (“DRC”) and our joint venture partner, AngloGold Ashanti, owning 10% and 45%, respectively. Kibali is accounted for as an equity method investment on the basis that the joint venture partners that have joint control have rights to the net assets of the joint venture. The figures presented in this table and the discussion that follows are based on our 45% effective interest in Kibali inclusive of the impact of the purchase price allocation resulting from the Merger. |
| b. | These are non-GAAP financial performance measures with no standardized meaning under IFRS and therefore may not be comparable to similar measures presented by other issuers. For further information and a detailed reconciliation of each non-GAAP measure used in this section of the MD&A to the most directly comparable IFRS measure, please see pages 74 to 92 of this MD&A. |
| c. | Represents EBITDA divided by revenue. |
| BARRICK FIRST QUARTER 2021 | 49 | MANAGEMENT’S DISCUSSION AND ANALYSIS |
| BARRICK FIRST QUARTER 2021 | 50 | MANAGEMENT’S DISCUSSION AND ANALYSIS |
Veladero (50% basis)a, Argentina
Summary of Operating and Financial Data
| For the three months ended | ||||||||||||||||
| 3/31/21 | 12/31/20 | % Change | 3/31/20 | % Change | ||||||||||||
| Open pit tonnes mined (000s) |
9,550 | 8,883 | 8 % | 8,280 | 15 % | |||||||||||
| Open pit ore |
1,311 | 3,792 | (65)% | 3,871 | (66)% | |||||||||||
| Open pit waste |
8,239 | 5,091 | 62 % | 4,409 | 87 % | |||||||||||
| Average grade (grams/tonne) |
||||||||||||||||
| Open pit mined |
0.78 | 0.76 | 3 % | 0.74 | 5 % | |||||||||||
| Processed |
0.85 | 0.87 | (2)% | 0.80 | 6 % | |||||||||||
| Heap leach ore tonnes processed (000s) |
1,305 | 2,976 | (56)% | 3,243 | (60)% | |||||||||||
| Gold produced (000s oz) |
32 | 58 | (45)% | 75 | (57)% | |||||||||||
| Gold sold (000s oz) |
31 | 51 | (39)% | 57 | (46)% | |||||||||||
| Revenue ($ millions) |
57 | 99 | (42)% | 90 | (37)% | |||||||||||
| Cost of sales ($ millions) |
35 | 54 | (35)% | 67 | (48)% | |||||||||||
| Income ($ millions) |
22 | 44 | (50)% | 24 | (8)% | |||||||||||
| EBITDA ($ millions)b |
33 | 61 | (46)% | 46 | (28)% | |||||||||||
| EBITDA marginb,c |
58 % | 62 % | (6)% | 51 % | 14 % | |||||||||||
| Capital expenditures ($ millions) |
41 | 35 | 17 % | 40 | 3 % | |||||||||||
| Minesite sustaining |
41 | 35 | 17 % | 25 | 64 % | |||||||||||
| Project |
0 | 0 | 0 % | 15 | (100)% | |||||||||||
| Cost of sales ($/oz) |
1,151 | 1,074 | 7 % | 1,182 | (3)% | |||||||||||
| Total cash costs ($/oz)b |
736 | 698 | 5 % | 788 | (7)% | |||||||||||
| All-in sustaining costs ($/oz)b |
2,104 | 1,428 | 47 % | 1,266 | 66 % | |||||||||||
| All-in costs ($/oz)b |
2,104 | 1,428 | 47 % | 1,537 | 37 % | |||||||||||
| a. | Barrick owns 50% of Veladero with our joint venture partner, Shandong Gold, owning the remaining 50%. Veladero is proportionately consolidated on the basis that the joint venture partners that have joint control have rights to the assets and obligations for the liabilities relating to the arrangement. The figures presented in this table and the discussion that follows are based on our 50% interest in Veladero inclusive of the impact of remeasurement of our interest in Veladero following the disposal of a 50% interest on June 30, 2017. |
| b. | These are non-GAAP financial performance measures with no standardized meaning under IFRS and therefore may not be comparable to similar measures presented by other issuers. For further information and a detailed reconciliation of each non-GAAP measure used in this section of the MD&A to the most directly comparable IFRS measure, please see pages 74 to 92 of this MD&A. |
| c. | Represents EBITDA divided by revenue. |
| BARRICK FIRST QUARTER 2021 | 51 | MANAGEMENT’S DISCUSSION AND ANALYSIS |
| BARRICK FIRST QUARTER 2021 | 52 | MANAGEMENT’S DISCUSSION AND ANALYSIS |
North Mara (84% basis)a, Tanzania
Summary of Operating and Financial Data
| For the three months ended | ||||||||||||||||
| 3/31/21 | 12/31/20 | % Change | 3/31/20 | % Change | ||||||||||||
| Total tonnes mined (000s) |
248 | 296 | (16)% | 2,448 | (90)% | |||||||||||
| Open pit ore |
n/a | n/a | n/a | 1,158 | n/a | |||||||||||
| Open pit waste |
n/a | n/a | n/a | 993 | n/a | |||||||||||
| Underground |
248 | 296 | (16)% | 297 | (16)% | |||||||||||
| Average grade (grams/tonne) |
||||||||||||||||
| Open pit mined |
n/a | n/a | n/a | 2.04 | n/a | |||||||||||
| Underground mined |
3.94 | 5.97 | (34)% | 4.13 | (5)% | |||||||||||
| Processed |
3.31 | 3.08 | 7 % | 3.42 | (3)% | |||||||||||
| Ore tonnes processed (000s) |
642 | 677 | (5)% | 636 | 1 % | |||||||||||
| Recovery rate |
90 % | 91 % | (1)% | 93 % | (3)% | |||||||||||
| Gold produced (000s oz) |
62 | 61 | 2 % | 65 | (5)% | |||||||||||
| Gold sold (000s oz) |
56 | 63 | (11)% | 70 | (20)% | |||||||||||
| Revenue ($ millions) |
100 | 120 | (17)% | 111 | (10)% | |||||||||||
| Cost of sales ($ millions) |
59 | 69 | (14)% | 66 | (11)% | |||||||||||
| Income ($ millions) |
40 | 49 | (18)% | 49 | (18)% | |||||||||||
| EBITDA ($ millions)b |
52 | 66 | (21)% | 70 | (26)% | |||||||||||
| EBITDA marginb,c |
52 % | 55 % | (5)% | 63 % | (17)% | |||||||||||
| Capital expenditures ($ millions) |
16 | 27 | (41)% | 13 | 23 % | |||||||||||
| Minesite sustaining |
11 | 11 | 0 % | 11 | 0 % | |||||||||||
| Project |
5 | 16 | (69)% | 2 | 150 % | |||||||||||
| Cost of sales ($/oz) |
1,061 | 1,073 | (1)% | 959 | 11 % | |||||||||||
| Total cash costs ($/oz)b |
832 | 799 | 4 % | 646 | 29 % | |||||||||||
| All-in sustaining costs ($/oz)b |
1,038 | 989 | 5 % | 816 | 27 % | |||||||||||
| All-in costs ($/oz)b |
1,134 | 1,232 | (8)% | 838 | 35 % | |||||||||||
| a. | Barrick owns 84% of North Mara, with the Government of Tanzania owning 16%. North Mara is accounted for as a subsidiary with a 16% non-controlling interest on the basis that Barrick controls the asset. The results in the table and the discussion that follows are based on our 84% share. |
| b. | These are non-GAAP financial performance measures with no standardized meaning under IFRS and therefore may not be comparable to similar measures presented by other issuers. For further information and a detailed reconciliation of each non-GAAP measure used in this section of the MD&A to the most directly comparable IFRS measure, please see pages 74 to 92 of this MD&A. |
| c. | Represents EBITDA divided by revenue. |
| BARRICK FIRST QUARTER 2021 | 53 | MANAGEMENT’S DISCUSSION AND ANALYSIS |
| BARRICK FIRST QUARTER 2021 | 54 | MANAGEMENT’S DISCUSSION AND ANALYSIS |
Bulyanhulu (84% basis)a, Tanzania
Summary of Operating and Financial Data
| For the three months ended | ||||||||||||||||
| 3/31/21 | 12/31/20 | % Change | 3/31/20 | % Change | ||||||||||||
| Underground tonnes mined (000s) |
125 | 73 | 71 % | n/a | 0 % | |||||||||||
| Average grade (grams/tonne) |
||||||||||||||||
| Underground mined |
9.78 | 9.00 | 9 % | n/a | 0 % | |||||||||||
| Processed |
9.90 | 3.14 | 215 % | 0.99 | 900 % | |||||||||||
| Ore tonnes processed (000s) |
110 | 274 | (60)% | 445 | (75)% | |||||||||||
| Recovery rate |
94 % | 81 % | 17 % | 52 % | 81 % | |||||||||||
| Gold produced (000s oz) |
33 | 23 | 43 % | 7 | 371 % | |||||||||||
| Gold sold (000s oz) |
28 | 20 | 40 % | 7 | 300 % | |||||||||||
| Revenue ($ millions) |
42 | 36 | 17 % | 12 | 250 % | |||||||||||
| Cost of sales ($ millions) |
34 | 23 | 48 % | 12 | 183 % | |||||||||||
| Income ($ millions) |
7 | 13 | (46)% | (11) | 164 % | |||||||||||
| EBITDA ($ millions)b |
17 | 23 | (26)% | (4) | 525 % | |||||||||||
| EBITDA marginb,c |
40 % | 64 % | (38)% | (33)% | 220 % | |||||||||||
| Capital expenditures ($ millions) |
11 | 37 | (70)% | 2 | 450 % | |||||||||||
| Minesite sustaining |
2 | 1 | 100% | 1 | 100 % | |||||||||||
| Project |
9 | 36 | (75)% | 1 | 800 % | |||||||||||
| Cost of sales ($/oz) |
1,211 | 1,181 | 3 % | 1,685 | (28)% | |||||||||||
| Total cash costs ($/oz)b |
865 | 610 | 42 % | 686 | 26 % | |||||||||||
| All-in sustaining costs ($/oz)b |
957 | 664 | 44 % | 906 | 6 % | |||||||||||
| All-in costs ($/oz)b |
1,275 | 2,493 | (49)% | 1,038 | 23 % | |||||||||||
| a. | Barrick owns 84% of Bulyanhulu, with the Government of Tanzania owning 16%. Bulyanhulu is accounted for as a subsidiary with a 16% non-controlling interest on the basis that Barrick controls the asset. The results in the table and the discussion that follows are based on our 84% share. |
| b. | These are non-GAAP financial performance measures with no standardized meaning under IFRS and therefore may not be comparable to similar measures presented by other issuers. For further information and a detailed reconciliation of each non-GAAP measure used in this section of the MD&A to the most directly comparable IFRS measure, please see pages 74 to 92 of this MD&A. |
| c. | Represents EBITDA divided by revenue. |
| BARRICK FIRST QUARTER 2021 | 55 | MANAGEMENT’S DISCUSSION AND ANALYSIS |
| BARRICK FIRST QUARTER 2021 | 56 | MANAGEMENT’S DISCUSSION AND ANALYSIS |
Other Mines - Gold
Summary of Operating and Financial Data
| For the three months ended | ||||||||||||||||||||||||||||||||||||||||
| 3/31/21 | 12/31/20 | |||||||||||||||||||||||||||||||||||||||
| Gold produced (000s oz) |
Cost of sales ($/oz) |
Total cash |
All-in sustaining costs ($/oz)a |
Capital Expend- ituresb |
Gold produced (000s oz) |
Cost of sales ($/oz) |
Total cash costs ($/oz)a |
All-in ($/oz)a |
Capital ituresb |
|||||||||||||||||||||||||||||||
| Tongon (89.7%) |
48 | 1,510 | 995 | 1,062 | 2 | 66 | 1,371 | 810 | 853 | 2 | ||||||||||||||||||||||||||||||
| Hemlo |
47 | 1,610 | 1,324 | 1,840 | 22 | 57 | 1,379 | 1,104 | 1,464 | 20 | ||||||||||||||||||||||||||||||
| Buzwagi (84%) |
17 | 1,486 | 1,450 | 1,467 | 0 | 21 | 1,314 | 1,267 | 1,283 | 0 | ||||||||||||||||||||||||||||||
| Porgera (47.5%) |
— | — | — | — | — | — | — | — | — | — | ||||||||||||||||||||||||||||||
| a. | These are non-GAAP financial performance measures with no standardized meaning under IFRS and therefore may not be comparable to similar measures presented by other issuers. For further information and a detailed reconciliation of each non-GAAP measure used in this section of the MD&A to the most directly comparable IFRS measure, please see pages 74 to 92 of this MD&A. |
| b. | Includes both minesite sustaining and project capital expenditures. |
| BARRICK FIRST QUARTER 2021 | 57 | MANAGEMENT’S DISCUSSION AND ANALYSIS |
Other Mines - Copper
Summary of Operating and Financial Data
| For the three months ended | ||||||||||||||||||||||||||||||||||||||||
| 3/31/21 | 12/31/20 | |||||||||||||||||||||||||||||||||||||||
|
Copper production (millions of pounds) |
Cost of sales ($/lb) |
C1 cash costs ($/lb)a |
All-in sustaining costs |
Capital Expend- ituresb |
Copper production (millions of pounds) |
Cost of sales ($/lb) |
C1 cash costs |
All-in sustaining costs |
Capital Expend- ituresb |
|||||||||||||||||||||||||||||||
| Lumwana |
51 | 1.97 | 1.48 | 2.37 | 37 | 78 | 1.96 | 1.58 | 2.60 | 48 | ||||||||||||||||||||||||||||||
| Zaldívar (50%) |
24 | 3.03 | 2.25 | 2.47 | 14 | 23 | 2.68 | 2.01 | 2.70 | 29 | ||||||||||||||||||||||||||||||
| Jabal Sayid (50%) |
18 | 1.21 | 1.06 | 1.22 | 2 | 18 | 1.53 | 1.15 | 1.27 | 2 | ||||||||||||||||||||||||||||||
| a. | These are non-GAAP financial performance measures with no standardized meaning under IFRS and therefore may not be comparable to similar measures presented by other issuers. For further information and a detailed reconciliation of each non-GAAP measure used in this section of the MD&A to the most directly comparable IFRS measure, please see pages 74 to 92 of this MD&A. |
| b. | Includes both minesite sustaining and project capital expenditures. |
| BARRICK FIRST QUARTER 2021 | 58 | MANAGEMENT’S DISCUSSION AND ANALYSIS |
Growth Project Updates
| BARRICK FIRST QUARTER 2021 | 59 | MANAGEMENT’S DISCUSSION AND ANALYSIS |
Exploration and Mineral Resource Management
| BARRICK FIRST QUARTER 2021 | 60 | MANAGEMENT’S DISCUSSION AND ANALYSIS |
| BARRICK FIRST QUARTER 2021 | 61 | MANAGEMENT’S DISCUSSION AND ANALYSIS |
| BARRICK FIRST QUARTER 2021 | 62 | MANAGEMENT’S DISCUSSION AND ANALYSIS |
| BARRICK FIRST QUARTER 2021 | 63 | MANAGEMENT’S DISCUSSION AND ANALYSIS |
| BARRICK FIRST QUARTER 2021 | 64 | MANAGEMENT’S DISCUSSION AND ANALYSIS |
Review of Financial Results
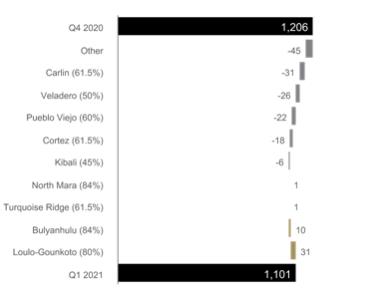
| BARRICK FIRST QUARTER 2021 | 65 | MANAGEMENT’S DISCUSSION AND ANALYSIS |
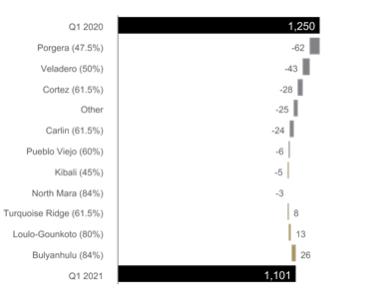
| BARRICK FIRST QUARTER 2021 | 66 | MANAGEMENT’S DISCUSSION AND ANALYSIS |
| BARRICK FIRST QUARTER 2021 | 67 | MANAGEMENT’S DISCUSSION AND ANALYSIS |
| BARRICK FIRST QUARTER 2021 | 68 | MANAGEMENT’S DISCUSSION AND ANALYSIS |
| BARRICK FIRST QUARTER 2021 | 69 | MANAGEMENT’S DISCUSSION AND ANALYSIS |
Financial Condition Review
Summary Balance Sheet and Key Financial Ratios
| ($ millions, except ratios and share amounts) |
As at 3/31/21 | As at 12/31/20 | ||||||
| Total cash and equivalents |
5,672 | 5,188 | ||||||
| Current assets |
3,112 | 2,955 | ||||||
| Non-current assets |
38,064 | 38,363 | ||||||
| Total Assets |
46,848 | 46,506 | ||||||
| Current liabilities excluding short-term debt |
2,318 | 2,200 | ||||||
| Non-current liabilities excluding long-term debta |
7,298 | 7,441 | ||||||
| Debt (current and long-term) |
5,153 | 5,155 | ||||||
| Total Liabilities |
14,769 | 14,796 | ||||||
| Total shareholders’ equity |
23,674 | 23,341 | ||||||
| Non-controlling interests |
8,405 | 8,369 | ||||||
| Total Equity |
32,079 | 31,710 | ||||||
| Total common shares outstanding (millions of shares) |
1,778 | 1,778 | ||||||
| Debt, net of cash |
(519) | (33) | ||||||
| Key Financial Ratios: |
||||||||
| Current ratiob |
4.08:1 | 3.67:1 | ||||||
|
Debt-to-equityc |
0.16:1 | 0.16:1 | ||||||
a. Non-current financial liabilities as at March 31, 2021 were $5,512 million (December 31, 2020: $5,486 million).
b. Represents current assets divided by current liabilities (including short-term debt) as at March 31, 2021 and December 31, 2020.
c. Represents debt divided by total shareholders’ equity (including minority interest) as at March 31, 2021 and December 31, 2020.
| BARRICK FIRST QUARTER 2021 | 70 | MANAGEMENT’S DISCUSSION AND ANALYSIS |
| BARRICK FIRST QUARTER 2021 | 71 | MANAGEMENT’S DISCUSSION AND ANALYSIS |
Commitments and Contingencies
Litigation and Claims
We are currently subject to various litigation proceedings as disclosed in note 18 to the Financial Statements, and we may be involved in disputes with other parties in the future that may result in litigation. If we are unable to resolve these disputes favorably, it may have a material adverse impact on our financial condition, cash flow and results of operations.
Contractual Obligations and Commitments
In the normal course of business, we enter into contracts that give rise to commitments for future minimum payments. The following table summarizes the remaining contractual maturities of our financial liabilities and operating and capital commitments shown on an undiscounted basis:
| ($ millions) |
Payments due as at 3/31/21 | |||||||||||||||||||||||||||
| 2021 | 2022 | 2023 | 2024 | 2025 | |
2026 and thereafter |
|
Total | ||||||||||||||||||||
| Debta |
||||||||||||||||||||||||||||
| Repayment of principal |
0 | 0 | 0 | 0 | 12 | 5,097 | 5,109 | |||||||||||||||||||||
| Capital leases |
10 | 13 | 10 | 5 | 4 | 28 | 70 | |||||||||||||||||||||
| Interest |
289 | 308 | 307 | 306 | 306 | 4,141 | 5,657 | |||||||||||||||||||||
| Provisions for environmental rehabilitationb |
236 | 159 | 164 | 145 | 150 | 2,075 | 2,929 | |||||||||||||||||||||
| Restricted share units |
6 | 14 | 2 | 0 | 0 | 0 | 22 | |||||||||||||||||||||
| Pension benefits and other post-retirement benefits |
4 | 4 | 4 | 4 | 4 | 37 | 57 | |||||||||||||||||||||
| Minimum royalty paymentsc |
1 | 1 | 1 | 1 | 1 | 1 | 6 | |||||||||||||||||||||
| Purchase obligations for supplies and consumablesd |
550 | 201 | 153 | 122 | 95 | 533 | 1,654 | |||||||||||||||||||||
| Capital commitmentse |
205 | 17 | 0 | 0 | 0 | 0 | 222 | |||||||||||||||||||||
| Social development costsf |
12 | 10 | 6 | 5 | 5 | 54 | 92 | |||||||||||||||||||||
| Other Obligationsg |
0 | 3 | 6 | 6 | 6 | 294 | 315 | |||||||||||||||||||||
| Total |
1,313 | 730 | 653 | 594 | 583 | 12,260 | 16,133 | |||||||||||||||||||||
| a. | Debt and Interest - Our debt obligations do not include any subjective acceleration clauses or other clauses that enable the holder of the debt to call for early repayment, except in the event that we breach any of the terms and conditions of the debt or for other customary events of default. We are not required to post any collateral under any debt obligations. Projected interest payments on variable rate debt were based on interest rates in effect at March 31, 2021. Interest is calculated on our long-term debt obligations using both fixed and variable rates. |
| b. | Provisions for environmental rehabilitation - Amounts presented in the table represent the undiscounted uninflated future payments for the expected cost of provisions for environmental rehabilitation. |
| c. | Minimum royalty payments are related to continuing operations and are presented net of recoverable amounts. |
| d. | Purchase obligations for supplies and consumables - Includes commitments related to new purchase obligations to secure a supply of acid, tires and cyanide for our production process. |
| e. | Capital commitments - Purchase obligations for capital expenditures include only those items where binding commitments have been entered into. |
| f. | Social development costs - Includes a commitment of $14 million in 2026 and thereafter related to the funding of a power transmission line in Argentina. |
| g. | Other obligations - Relates to the Pueblo Viejo JV partner shareholder loan and the deposit on the Pascua-Lama silver sale agreement with Wheaton Precious Metals Corp. |
| BARRICK FIRST QUARTER 2021 | 72 | MANAGEMENT’S DISCUSSION AND ANALYSIS |
Review of Quarterly Results
Quarterly Informationa
| ($ millions, except where indicated) |
2021 | 2020 | 2020 | 2020 | 2020 | 2019 | 2019 | 2019 | ||||||||||||||||||||||||
| Q1 | Q4 | Q3 | Q2 | Q1 | Q4 | Q3 | Q2 | |||||||||||||||||||||||||
| Revenues |
2,956 | 3,279 | 3,540 | 3,055 | 2,721 | 2,883 | 2,678 | 2,063 | ||||||||||||||||||||||||
| Realized price per ounce – goldb |
1,777 | 1,871 | 1,926 | 1,725 | 1,589 | 1,483 | 1,476 | 1,317 | ||||||||||||||||||||||||
| Realized price per pound – copperb |
4.12 | 3.39 | 3.28 | 2.79 | 2.23 | 2.76 | 2.55 | 2.62 | ||||||||||||||||||||||||
| Cost of sales |
1,712 | 1,814 | 1,927 | 1,900 | 1,776 | 1,987 | 1,889 | 1,545 | ||||||||||||||||||||||||
| Net earnings (loss) |
538 | 685 | 882 | 357 | 400 | 1,387 | 2,277 | 194 | ||||||||||||||||||||||||
| Per share (dollars)c |
0.30 | 0.39 | 0.50 | 0.20 | 0.22 | 0.78 | 1.30 | 0.11 | ||||||||||||||||||||||||
| Adjusted net earningsb |
507 | 616 | 726 | 415 | 285 | 300 | 264 | 154 | ||||||||||||||||||||||||
| Per share (dollars)b,c |
0.29 | 0.35 | 0.41 | 0.23 | 0.16 | 0.17 | 0.15 | 0.09 | ||||||||||||||||||||||||
| Operating cash flow |
1,302 | 1,638 | 1,859 | 1,031 | 889 | 875 | 1,004 | 434 | ||||||||||||||||||||||||
| Consolidated capital expendituresd |
539 | 546 | 548 | 509 | 451 | 446 | 502 | 379 | ||||||||||||||||||||||||
| Free cash flowb |
763 | 1,092 | 1,311 | 522 | 438 | 429 | 502 | 55 | ||||||||||||||||||||||||
| a. | Sum of all the quarters may not add up to the annual total due to rounding. |
| b. | Realized price, adjusted net earnings, adjusted net earnings per share and free cash flow are non-GAAP financial performance measures with no standardized meaning under IFRS and therefore may not be comparable to similar measures of performance presented by other issuers. For further information and a detailed reconciliation of each non-GAAP measure used in this section of the MD&A to the most directly comparable IFRS measure, please see pages 74 to 92 of this MD&A. |
| c. | Calculated using weighted average number of shares outstanding under the basic method of earnings per share. |
| d. | Amounts presented on a consolidated cash basis. |
Internal Control Over Financial Reporting and Disclosure Controls and Procedures
| BARRICK FIRST QUARTER 2021 | 73 | MANAGEMENT’S DISCUSSION AND ANALYSIS |
IFRS Critical Accounting Policies and Accounting Estimates
Non-GAAP Financial Performance Measures
| BARRICK FIRST QUARTER 2021 | 74 | MANAGEMENT’S DISCUSSION AND ANALYSIS |
Reconciliation of Net Earnings to Net Earnings per Share, Adjusted Net Earnings and Adjusted Net Earnings per Share
| ($ millions, except per share amounts in dollars) |
For the three months ended | |||||||||||
| 3/31/21 | 12/31/20 | 3/31/20 | ||||||||||
| Net earnings attributable to equity holders of the Company |
538 | 685 | 400 | |||||||||
| Impairment charges (reversals) related to intangibles, goodwill, property, plant and equipment, and investmentsa |
(89 | ) | 40 | (336 | ) | |||||||
| Acquisition/disposition (gains) lossesb |
(3 | ) | (126 | ) | (60 | ) | ||||||
| Loss (gain) on currency translation |
4 | 16 | 16 | |||||||||
| Significant tax adjustmentsc |
47 | (2 | ) | (44 | ) | |||||||
| Other expense adjustmentsd |
11 | 15 | 98 | |||||||||
| Tax effect and non-controlling intereste |
(1 | ) | (12 | ) | 211 | |||||||
| Adjusted net earnings |
507 | 616 | 285 | |||||||||
| Net earnings per sharef |
0.30 | 0.39 | 0.22 | |||||||||
| Adjusted net earnings per sharef |
0.29 | 0.35 | 0.16 | |||||||||
| a. | For the three month period ended March 31, 2021, net impairment reversals primarily relate to non-current asset reversals at Lagunas Norte. Net impairment charges (reversals) for the three month periods ended December 31, 2020 and March 31, 2020 mainly relate to non-current assets at our Tanzanian assets. |
| b. | Acquisition/disposition gains for the three month period ended December 31, 2020 primarily relate to the gain on the sale of Eskay Creek, Morila and Bullfrog. For the three months ended March 31, 2020, acquisition/disposition gains mainly relate to the gain on the sale of Massawa. |
| c. | Significant tax adjustments for the three month period ended March 31, 2021 mainly relates to the remeasurement of deferred tax balances for changes in foreign currency rates and the recognition/derecognition of our deferred taxes in various jurisdictions. For the three months ended March 31, 2020, significant tax adjustments primarily relate to deferred tax recoveries as a result of tax reform measures in Argentina and adjustments made in recognition of the net settlement of all outstanding disputes with the Government of Tanzania. |
| d. | Other expense adjustments for the three month periods ended March 31, 2021 and December 31, 2020 mainly relate to care and maintenance expenses at Porgera. For the three months ended March 31, 2020, other expense adjustments primarily relate to the impact of changes in the discount rate assumptions on our closed mine rehabilitation provision and losses on debt extinguishment. |
| e. | Tax effect and non-controlling interest for the three month period ended March 31, 2020 primarily relates to the net impairment reversals related to long-lived assets and acquisition gains. |
| f. | Calculated using weighted average number of shares outstanding under the basic method of earnings per share. |
Reconciliation of Net Cash Provided by Operating Activities to Free Cash Flow
| ($ millions) |
For the three months ended | |||||||||||
| 3/31/21 | 12/31/20 | 3/31/20 | ||||||||||
| Net cash provided by operating activities |
1,302 | 1,638 | 889 | |||||||||
| Capital expenditures |
(539 | ) | (546 | ) | (451 | ) | ||||||
| Free cash flow |
763 | 1,092 | 438 | |||||||||
| BARRICK FIRST QUARTER 2021 | 75 | MANAGEMENT’S DISCUSSION AND ANALYSIS |
Total cash costs per ounce, All-in sustaining costs per ounce, All-in costs per ounce, C1 cash costs per pound and All-in sustaining costs per pound
| BARRICK FIRST QUARTER 2021 | 76 | MANAGEMENT’S DISCUSSION AND ANALYSIS |
Reconciliation of Gold Cost of Sales to Total cash costs, All-in sustaining costs and All-in costs, including on a per ounce basis
| ($ millions, except per ounce information in dollars) |
For the three months ended | |||||||||||||||
| Footnote | 3/31/21 | 12/31/20 | 3/31/20 | |||||||||||||
| Cost of sales applicable to gold production |
1,571 | 1,681 | 1,643 | |||||||||||||
| Depreciation |
(454 | ) | (495 | ) | (474 | ) | ||||||||||
| Cash cost of sales applicable to equity method investments |
59 | 69 | 52 | |||||||||||||
| By-product credits |
(59 | ) | (56 | ) | (29 | ) | ||||||||||
| Realized (gains) losses on hedge and non-hedge derivatives |
a | 0 | (1 | ) | 0 | |||||||||||
| Non-recurring items |
b | 0 | 1 | 0 | ||||||||||||
| Other |
c | (33 | ) | (55 | ) | (27 | ) | |||||||||
| Non-controlling interests |
d | (302 | ) | (323 | ) | (316 | ) | |||||||||
| Total cash costs |
782 | 821 | 849 | |||||||||||||
| General & administrative costs |
38 | 24 | 40 | |||||||||||||
| Minesite exploration and evaluation costs |
e | 16 | 22 | 15 | ||||||||||||
| Minesite sustaining capital expenditures |
f | 405 | 354 | 370 | ||||||||||||
| Sustaining leases |
13 | 12 | 0 | |||||||||||||
| Rehabilitation - accretion and amortization (operating sites) |
g | 11 | 11 | 14 | ||||||||||||
| Non-controlling interest, copper operations and other |
h | (154 | ) | (142 | ) | (125 | ) | |||||||||
| All-in sustaining costs |
1,111 | 1,102 | 1,163 | |||||||||||||
| Project exploration and evaluation and project costs |
e | 45 | 52 | 56 | ||||||||||||
| Community relations costs not related to current operations |
0 | 0 | 1 | |||||||||||||
| Project capital expenditures |
f | 131 | 184 | 76 | ||||||||||||
| Non-sustaining leases |
0 | 4 | 0 | |||||||||||||
| Rehabilitation - accretion and amortization (non-operating sites) |
g | 3 | 4 | 2 | ||||||||||||
| Non-controlling interest and copper operations and other |
h | (42 | ) | (61 | ) | (33 | ) | |||||||||
| All-in costs |
1,248 | 1,285 | 1,265 | |||||||||||||
| Ounces sold - equity basis (000s ounces) |
i | 1,093 | 1,186 | 1,220 | ||||||||||||
| Cost of sales per ounce |
j,k | 1,073 | 1,065 | 1,020 | ||||||||||||
| Total cash costs per ounce |
k | 716 | 692 | 692 | ||||||||||||
| Total cash costs per ounce (on a co-product basis) |
k,l | 746 | 718 | 705 | ||||||||||||
| All-in sustaining costs per ounce |
k | 1,018 | 929 | 954 | ||||||||||||
| All-in sustaining costs per ounce (on a co-product basis) |
k,l | 1,048 | 955 | 967 | ||||||||||||
| All-in costs per ounce |
k | 1,144 | 1,083 | 1,035 | ||||||||||||
| All-in costs per ounce (on a co-product basis) |
k,l | 1,174 | 1,109 | 1,048 | ||||||||||||
| a. | Realized (gains) losses on hedge and non-hedge derivatives |
Includes realized hedge losses of $nil for the three month period ended March 31, 2021 (December 31, 2020: $nil and March 31, 2020: $nil), and realized non-hedge losses of $nil for the three month period ended March 31, 2021 (December 31, 2020: gains of $1 million and March 31, 2020: $nil). Refer to Note 5 to the Financial Statements for further information.
| b. | Non-recurring items |
These costs are not indicative of our cost of production and have been excluded from the calculation of total cash costs.
| c. | Other |
Other adjustments for the three month period ended March 31, 2021 include the removal of total cash costs and by-product credits associated with Pierina, Lagunas Norte, Golden Sunlight and Morila up until its divestiture in November 2020, which all are producing incidental ounces, of $24 million (December 31, 2020: $26 million; March 31, 2020: $25 million).
| d. | Non-controlling interests |
Non-controlling interests include non-controlling interests related to gold production of $462 million for the three month period ended March 31, 2021 (December 31, 2020: $490 million and March 31, 2020: $466 million). Non-controlling interests include Nevada Gold Mines, Pueblo Viejo, Loulo-Gounkoto, Tongon, North Mara, Bulyanhulu, Buzwagi. Refer to Note 5 to the Financial Statements for further information.
| e. | Exploration and evaluation costs |
Exploration, evaluation and project expenses are presented as minesite sustaining if it supports current mine operations and project if it relates to future projects. Refer to page 68 of this MD&A.
| f. | Capital expenditures |
Capital expenditures are related to our gold sites only and are split between minesite sustaining and project capital expenditures. Project capital expenditures are distinct projects designed to increase the net present value of the mine and are not related to current production. Significant projects in the current year are the expansion project at Pueblo Viejo and construction of the Third Shaft at Turquoise Ridge. Refer to page 67 of this MD&A.
| BARRICK FIRST QUARTER 2021 | 77 | MANAGEMENT’S DISCUSSION AND ANALYSIS |
| g. | Rehabilitation—accretion and amortization |
Includes depreciation on the assets related to rehabilitation provisions of our gold operations and accretion on the rehabilitation provision of our gold operations, split between operating and non-operating sites.
| h. | Non-controlling interest and copper operations |
Removes general & administrative costs related to non-controlling interests and copper based on a percentage allocation of revenue. Also removes exploration, evaluation and project expenses, rehabilitation costs and capital expenditures incurred by our copper sites and the non-controlling interest of Nevada Gold Mines (including South Arturo), Pueblo Viejo, Loulo-Gounkoto, Tongon, North Mara, Bulyanhulu, and Buzwagi operating segments. It also includes capital expenditures applicable to our equity method investment in Kibali. Figures remove the impact of Pierina, Lagunas Norte and Golden Sunlight. The impact is summarized as the following:
| ($ millions) |
For the three months ended | |||||||||||
| Non-controlling interest, copper operations and other |
3/31/21 | 12/31/20 | 3/31/20 | |||||||||
| General & administrative costs |
(6 | ) | (5 | ) | (6 | ) | ||||||
| Minesite exploration and evaluation expenses |
(7 | ) | (9 | ) | (3 | ) | ||||||
| Rehabilitation - accretion and amortization (operating sites) |
(3 | ) | (3 | ) | (4 | ) | ||||||
| Minesite sustaining capital expenditures |
(138 | ) | (125 | ) | (112 | ) | ||||||
| All-in sustaining costs total |
(154 | ) | (142 | ) | (125 | ) | ||||||
| Project exploration and evaluation and project costs |
(1 | ) | (6 | ) | (19 | ) | ||||||
| Project capital expenditures |
(41 | ) | (55 | ) | (14 | ) | ||||||
| All-in costs total |
(42 | ) | (61 | ) | (33 | ) | ||||||
| i. | Ounces sold - equity basis |
Figures remove the impact of: Pierina, Lagunas Norte, Golden Sunlight, and Morila up until its divestiture in November 2020, which are producing incidental ounces.
| j. | Cost of sales per ounce |
Figures remove the cost of sales impact of: Pierina of $5 million for the three month period ended March 31, 2021 (December 31, 2020: $4 million and March 31, 2020: $6 million); Golden Sunlight of $nil for the three month period ended March 31, 2021 (December 31, 2020: $nil and March 31, 2020: $nil); up until its divestiture in November of 2020, Morila, of $nil for the three month period ended March 31, 2021 (December 31, 2020: $2 million and March 31, 2020: $6 million); and Lagunas Norte of $23 million for the three month period ended March 31, 2021 (December 31, 2020: $26 million and March 31, 2020: $21 million), which are producing incidental ounces. Gold cost of sales per ounce is calculated as cost of sales across our gold operations (excluding sites in care and maintenance) divided by ounces sold (both on an attributable basis using Barrick’s ownership share).
| k. | Per ounce figures |
Cost of sales per ounce, total cash costs per ounce, all-in sustaining costs per ounce and all-in costs per ounce may not calculate based on amounts presented in this table due to rounding.
| l. | Co-product costs per ounce |
Total cash costs per ounce, all-in sustaining costs per ounce and all-in costs per ounce presented on a co-product basis removes the impact of by-product credits of our gold production (net of non-controlling interest) calculated as:
| ($ millions) |
For the three months ended | |||||||||||
| 3/31/21 | 12/31/20 | 3/31/20 | ||||||||||
| By-product credits |
59 | 56 | 29 | |||||||||
| Non-controlling interest |
(26 | ) | (27 | ) | (15 | ) | ||||||
| By-product credits (net of non-controlling interest) |
33 | 29 | 14 | |||||||||
| BARRICK FIRST QUARTER 2021 | 78 | MANAGEMENT’S DISCUSSION AND ANALYSIS |
Reconciliation of Gold Cost of Sales to Total cash costs, All-in sustaining costs and All-in costs, including on a per ounce basis, by operating site
| ($ millions, except per ounce information in dollars) |
|
For the three months ended 3/31/21 | ||||||||||||||||||||||||||||||||||
| Footnote | Carlin | a | Cortez | b | |
Turquoise Ridge |
|
|
Long Canyon |
|
Phoenix | |
Nevada Gold Mines |
c |
Hemlo | |
North America |
| ||||||||||||||||||
| Cost of sales applicable to gold production |
356 | 207 | 151 | 32 | 80 | 826 | 76 | 902 | ||||||||||||||||||||||||||||
| Depreciation |
(68 | ) | (64 | ) | (51 | ) | (27 | ) | (20 | ) | (230 | ) | (13 | ) | (243 | ) | ||||||||||||||||||||
| By-product credits |
(1 | ) | (1 | ) | (3 | ) | 0 | (46 | ) | (51 | ) | 0 | (51 | ) | ||||||||||||||||||||||
| Non-recurring items |
d | 0 | 0 | 0 | 0 | 0 | 0 | 0 | 0 | |||||||||||||||||||||||||||
| Other |
0 | 0 | 0 | 0 | 0 | 0 | 0 | 0 | ||||||||||||||||||||||||||||
| Non-controlling interests |
(110 | ) | (55 | ) | (37 | ) | (2 | ) | (6 | ) | (210 | ) | 0 | (210 | ) | |||||||||||||||||||||
| Total cash costs |
177 | 87 | 60 | 3 | 8 | 335 | 63 | 398 | ||||||||||||||||||||||||||||
| General & administrative costs |
0 | 0 | 0 | 0 | 0 | 0 | 0 | 0 | ||||||||||||||||||||||||||||
| Minesite exploration and evaluation costs |
e | 3 | 1 | 0 | 1 | 0 | 5 | 1 | 6 | |||||||||||||||||||||||||||
| Minesite sustaining capital expenditures |
f | 100 | 54 | 14 | 3 | 6 | 185 | 22 | 207 | |||||||||||||||||||||||||||
| Sustaining capital leases |
0 | 0 | 0 | 0 | 0 | 1 | 0 | 1 | ||||||||||||||||||||||||||||
| Rehabilitation - accretion and amortization (operating sites) |
g | 2 | 2 | 0 | 0 | 0 | 4 | 1 | 5 | |||||||||||||||||||||||||||
| Non-controlling interests |
(41 | ) | (22 | ) | (5 | ) | (1 | ) | (2 | ) | (74 | ) | 0 | (74 | ) | |||||||||||||||||||||
| All-in sustaining costs |
241 | 122 | 69 | 6 | 12 | 456 | 87 | 543 | ||||||||||||||||||||||||||||
| Project exploration and evaluation and project costs |
e | 0 | 0 | 0 | 0 | 0 | 0 | 0 | 0 | |||||||||||||||||||||||||||
| Project capital expenditures |
f | 0 | 17 | 19 | 0 | 0 | 36 | 0 | 36 | |||||||||||||||||||||||||||
| Non-controlling interests |
0 | (7 | ) | (8 | ) | 0 | 0 | (15 | ) | 0 | (15 | ) | ||||||||||||||||||||||||
| All-in costs |
241 | 132 | 80 | 6 | 12 | 477 | 87 | 564 | ||||||||||||||||||||||||||||
| Ounces sold - equity basis (000s ounces) |
231 | 102 | 92 | 39 | 24 | 488 | 47 | 535 | ||||||||||||||||||||||||||||
| Cost of sales per ounce |
h,i | 950 | 1,251 | 1,007 | 511 | 2,051 | 1,047 | 1,610 | 1,097 | |||||||||||||||||||||||||||
| Total cash costs per ounce |
i | 766 | 860 | 647 | 79 | 346 | 686 | 1,324 | 742 | |||||||||||||||||||||||||||
| Total cash costs per ounce (on a co-product basis) |
i,j | 768 | 863 | 665 | 79 | 1,534 | 749 | 1,329 | 800 | |||||||||||||||||||||||||||
| All-in sustaining costs per ounce |
i | 1,045 | 1,203 | 741 | 156 | 530 | 932 | 1,840 | 1,013 | |||||||||||||||||||||||||||
| All-in sustaining costs per ounce (on a co-product basis) |
i,j | 1,047 | 1,206 | 759 | 156 | 1,718 | 995 | 1,845 | 1,071 | |||||||||||||||||||||||||||
| All-in costs per ounce |
i | 1,045 | 1,303 | 866 | 156 | 530 | 974 | 1,838 | 1,051 | |||||||||||||||||||||||||||
| All-in costs per ounce (on a co-product basis) |
i,j | 1,047 | 1,306 | 884 | 156 | 1,718 | 1,037 | 1,843 | 1,109 | |||||||||||||||||||||||||||
| BARRICK FIRST QUARTER 2021 | 79 | MANAGEMENT’S DISCUSSION AND ANALYSIS |
| ($ millions, except per ounce information in dollars) |
|
For the three months ended 3/31/21 | ||||||||||||||
| Footnote | Pueblo Viejo | Veladero | |
Latin America & Asia Pacific |
| |||||||||||
| Cost of sales applicable to gold production |
191 | 35 | 226 | |||||||||||||
| Depreciation |
(61 | ) | (11 | ) | (72 | ) | ||||||||||
| By-product credits |
(12 | ) | (1 | ) | (13 | ) | ||||||||||
| Non-recurring items |
d | 0 | 0 | 0 | ||||||||||||
| Other |
0 | 0 | 0 | |||||||||||||
| Non-controlling interests |
(47 | ) | 0 | (47 | ) | |||||||||||
| Total cash costs |
71 | 23 | 94 | |||||||||||||
| General & administrative costs |
0 | 0 | 0 | |||||||||||||
| Minesite exploration and evaluation costs |
e | 0 | 0 | 0 | ||||||||||||
| Minesite sustaining capital expenditures |
f | 40 | 41 | 81 | ||||||||||||
| Sustaining capital leases |
0 | 0 | 0 | |||||||||||||
| Rehabilitation - accretion and amortization (operating sites) |
g | 2 | 0 | 2 | ||||||||||||
| Non-controlling interests |
(16 | ) | 0 | (16 | ) | |||||||||||
| All-in sustaining costs |
97 | 64 | 161 | |||||||||||||
| Project exploration and evaluation and project costs |
e | 0 | 0 | 0 | ||||||||||||
| Project capital expenditures |
f | 58 | 0 | 58 | ||||||||||||
| Non-controlling interests |
(23 | ) | 0 | (23 | ) | |||||||||||
| All-in costs |
132 | 64 | 196 | |||||||||||||
| Ounces sold - equity basis (000s ounces) |
141 | 31 | 172 | |||||||||||||
| Cost of sales per ounce |
h,i | 816 | 1,151 | 903 | ||||||||||||
| Total cash costs per ounce |
i | 507 | 736 | 548 | ||||||||||||
| Total cash costs per ounce (on a co-product basis) |
i,j | 553 | 782 | 594 | ||||||||||||
| All-in sustaining costs per ounce |
i | 689 | 2,104 | 954 | ||||||||||||
| All-in sustaining costs per ounce (on a co-product basis) |
i,j | 735 | 2,150 | 1,000 | ||||||||||||
| All-in costs per ounce |
i | 936 | 2,104 | 1,157 | ||||||||||||
| All-in costs per ounce (on a co-product basis) |
i,j | 982 | 2,150 | 1,203 | ||||||||||||
| BARRICK FIRST QUARTER 2021 | 80 | MANAGEMENT’S DISCUSSION AND ANALYSIS |
| ($ millions, except per ounce information in dollars) |
|
For the three months ended 3/31/21 | ||||||||||||||||||||||||||||||
| Footnote | |
Loulo- Gounkoto |
|
Kibali | |
North Mara |
|
Tongon | Bulyanhulu | Buzwagi | |
Africa & Middle East |
| |||||||||||||||||||
| Cost of sales applicable to gold production |
184 | 92 | 71 | 81 | 40 | 31 | 499 | |||||||||||||||||||||||||
| Depreciation |
(69 | ) | (32 | ) | (15 | ) | (28 | ) | (12 | ) | (1 | ) | (157 | ) | ||||||||||||||||||
| By-product credits |
0 | 0 | 0 | 0 | 0 | 1 | 1 | |||||||||||||||||||||||||
| Non-recurring items |
d | 0 | 0 | 0 | 0 | 0 | 0 | 0 | ||||||||||||||||||||||||
| Other |
0 | 0 | 0 | 0 | 0 | 0 | 0 | |||||||||||||||||||||||||
| Non-controlling interests |
(23 | ) | 0 | (10 | ) | (5 | ) | (4 | ) | (6 | ) | (48 | ) | |||||||||||||||||||
| Total cash costs |
92 | 60 | 46 | 48 | 24 | 25 | 295 | |||||||||||||||||||||||||
| General & administrative costs |
0 | 0 | 0 | 0 | 0 | 0 | 0 | |||||||||||||||||||||||||
| Minesite exploration and evaluation costs |
e | 4 | 0 | 0 | 1 | 0 | 0 | 5 | ||||||||||||||||||||||||
| Minesite sustaining capital expenditures |
f | 53 | 11 | 12 | 2 | 3 | 0 | 81 | ||||||||||||||||||||||||
| Sustaining capital leases |
1 | 3 | 0 | 0 | 0 | 0 | 4 | |||||||||||||||||||||||||
| Rehabilitation - accretion and amortization (operating sites) |
g | 1 | 0 | 2 | 0 | 0 | 0 | 3 | ||||||||||||||||||||||||
| Non-controlling interests |
(12 | ) | 0 | (2 | ) | 0 | (1 | ) | 0 | (15 | ) | |||||||||||||||||||||
| All-in sustaining costs |
139 | 74 | 58 | 51 | 26 | 25 | 373 | |||||||||||||||||||||||||
| Project exploration and evaluation and project costs |
e | 0 | 0 | 0 | 0 | 0 | 0 | 0 | ||||||||||||||||||||||||
| Project capital expenditures |
f | 15 | 0 | 6 | 0 | 10 | 0 | 31 | ||||||||||||||||||||||||
| Non-controlling interests |
(3 | ) | 0 | (1 | ) | 0 | (1 | ) | 0 | (5 | ) | |||||||||||||||||||||
| All-in costs |
151 | 74 | 63 | 51 | 35 | 25 | 399 | |||||||||||||||||||||||||
| Ounces sold - equity basis (000s ounces) |
151 | 86 | 56 | 48 | 28 | 17 | 386 | |||||||||||||||||||||||||
| Cost of sales per ounce |
h,i | 974 | 1,065 | 1,061 | 1,510 | 1,211 | 1,486 | 1,114 | ||||||||||||||||||||||||
| Total cash costs per ounce |
i | 608 | 691 | 832 | 995 | 865 | 1,450 | 763 | ||||||||||||||||||||||||
| Total cash costs per ounce (on a co-product basis) |
i,j | 608 | 695 | 839 | 996 | 861 | 1,420 | 763 | ||||||||||||||||||||||||
| All-in sustaining costs per ounce |
i | 920 | 856 | 1,038 | 1,062 | 957 | 1,467 | 968 | ||||||||||||||||||||||||
| All-in sustaining costs per ounce (on a co-product basis) |
i,j | 920 | 860 | 1,045 | 1,063 | 953 | 1,437 | 969 | ||||||||||||||||||||||||
| All-in costs per ounce |
i | 1,000 | 862 | 1,134 | 1,062 | 1,275 | 1,467 | 1,037 | ||||||||||||||||||||||||
| All-in costs per ounce (on a co-product basis) |
i,j | 1,000 | 866 | 1,141 | 1,063 | 1,271 | 1,437 | 1,038 | ||||||||||||||||||||||||
| BARRICK FIRST QUARTER 2021 | 81 | MANAGEMENT’S DISCUSSION AND ANALYSIS |
| ($ millions, except per ounce information in dollars) |
|
For the three months ended 12/31/20 | ||||||||||||||||||||||||||||||||||
| Footnote | Carlin | a | Cortez | b | |
Turquoise Ridge |
|
|
Long Canyon |
|
Phoenix | |
Nevada Gold Mines |
c |
Hemlo | |
North America |
| ||||||||||||||||||
| Cost of sales applicable to gold production |
385 | 197 | 156 | 56 | 89 | 883 | 79 | 962 | ||||||||||||||||||||||||||||
| Depreciation |
(74 | ) | (57 | ) | (52 | ) | (44 | ) | (21 | ) | (248 | ) | (16 | ) | (264 | ) | ||||||||||||||||||||
| By-product credits |
(1 | ) | (1 | ) | (3 | ) | 0 | (42 | ) | (47 | ) | 0 | (47 | ) | ||||||||||||||||||||||
| Non-recurring items |
d | 0 | 0 | 0 | 0 | 0 | 0 | 0 | 0 | |||||||||||||||||||||||||||
| Other |
0 | 0 | 0 | 0 | 0 | 0 | 0 | 0 | ||||||||||||||||||||||||||||
| Non-controlling interests |
(120 | ) | (54 | ) | (38 | ) | (5 | ) | (10 | ) | (227 | ) | 0 | (227 | ) | |||||||||||||||||||||
| Total cash costs |
190 | 85 | 63 | 7 | 16 | 361 | 63 | 424 | ||||||||||||||||||||||||||||
| General & administrative costs |
0 | 0 | 0 | 0 | 0 | 0 | 0 | 0 | ||||||||||||||||||||||||||||
| Minesite exploration and evaluation costs |
e | 13 | 0 | 0 | 3 | 0 | 16 | 1 | 17 | |||||||||||||||||||||||||||
| Minesite sustaining capital expenditures |
f | 97 | 28 | 10 | 12 | 3 | 160 | 20 | 180 | |||||||||||||||||||||||||||
| Sustaining capital leases |
0 | 0 | 0 | 0 | 0 | 1 | 0 | 1 | ||||||||||||||||||||||||||||
| Rehabilitation - accretion and amortization (operating sites) |
g | 2 | 3 | 0 | 0 | 1 | 6 | 0 | 6 | |||||||||||||||||||||||||||
| Non-controlling interests |
(43 | ) | (12 | ) | (4 | ) | (6 | ) | (1 | ) | (70 | ) | 0 | (70 | ) | |||||||||||||||||||||
| All-in sustaining costs |
259 | 104 | 69 | 16 | 19 | 474 | 84 | 558 | ||||||||||||||||||||||||||||
| Project exploration and evaluation and project costs |
e | 0 | 0 | 0 | 0 | 0 | 0 | 0 | 0 | |||||||||||||||||||||||||||
| Project capital expenditures |
f | 0 | 30 | 6 | 0 | 0 | 48 | 0 | 48 | |||||||||||||||||||||||||||
| Non-controlling interests |
0 | (11 | ) | (2 | ) | 0 | 0 | (17 | ) | 0 | (17 | ) | ||||||||||||||||||||||||
| All-in costs |
259 | 123 | 73 | 16 | 19 | 505 | 84 | 589 | ||||||||||||||||||||||||||||
| Ounces sold - equity basis (000s ounces) |
259 | 116 | 90 | 51 | 26 | 542 | 57 | 599 | ||||||||||||||||||||||||||||
| Cost of sales per ounce |
h,i | 917 | 1,043 | 1,064 | 674 | 2,054 | 1,008 | 1,379 | 1,043 | |||||||||||||||||||||||||||
| Total cash costs per ounce |
i | 740 | 738 | 687 | 145 | 590 | 667 | 1,104 | 709 | |||||||||||||||||||||||||||
| Total cash costs per ounce (on a co-product basis) |
i,j | 742 | 741 | 710 | 146 | 1,557 | 720 | 1,109 | 757 | |||||||||||||||||||||||||||
| All-in sustaining costs per ounce |
i | 1,005 | 906 | 757 | 324 | 670 | 873 | 1,464 | 930 | |||||||||||||||||||||||||||
| All-in sustaining costs per ounce (on a co-product basis) |
i,j | 1,007 | 909 | 780 | 325 | 1,637 | 926 | 1,469 | 978 | |||||||||||||||||||||||||||
| All-in costs per ounce |
i | 1,005 | 1,065 | 799 | 324 | 670 | 925 | 1,464 | 977 | |||||||||||||||||||||||||||
| All-in costs per ounce (on a co-product basis) |
i,j | 1,007 | 1,068 | 822 | 325 | 1,637 | 978 | 1,469 | 1,025 | |||||||||||||||||||||||||||
| BARRICK FIRST QUARTER 2021 | 82 | MANAGEMENT’S DISCUSSION AND ANALYSIS |
| ($ millions, except per ounce information in dollars) |
|
For the three months ended 12/31/20 | ||||||||||||||
| Footnote | Pueblo Viejo | Veladero | |
Latin America & Asia Pacific |
| |||||||||||
| Cost of sales applicable to gold production |
203 | 54 | 257 | |||||||||||||
| Depreciation |
(61 | ) | (17 | ) | (78 | ) | ||||||||||
| By-product credits |
(16 | ) | (2 | ) | (18 | ) | ||||||||||
| Non-recurring items |
f | 0 | 0 | 0 | ||||||||||||
| Other |
0 | 0 | 0 | |||||||||||||
| Non-controlling interests |
(52 | ) | 0 | (52 | ) | |||||||||||
| Total cash costs |
74 | 35 | 109 | |||||||||||||
| General & administrative costs |
0 | 0 | 0 | |||||||||||||
| Minesite exploration and evaluation costs |
e | 3 | 0 | 3 | ||||||||||||
| Minesite sustaining capital expenditures |
f | 45 | 35 | 80 | ||||||||||||
| Sustaining capital leases |
0 | 1 | 1 | |||||||||||||
| Rehabilitation - accretion and amortization (operating sites) |
g | 2 | 1 | 3 | ||||||||||||
| Non-controlling interests |
(20 | ) | 0 | (20 | ) | |||||||||||
| All-in sustaining costs |
104 | 72 | 176 | |||||||||||||
| Project exploration and evaluation and project costs |
e | 0 | 0 | 0 | ||||||||||||
| Project capital expenditures |
f | 64 | 0 | 64 | ||||||||||||
| Non-controlling interests |
(25 | ) | 0 | (25 | ) | |||||||||||
| All-in costs |
143 | 72 | 215 | |||||||||||||
| Ounces sold - equity basis (000s ounces) |
153 | 51 | 204 | |||||||||||||
| Cost of sales per ounce |
h,i | 803 | 1,074 | 894 | ||||||||||||
| Total cash costs per ounce |
i | 493 | 698 | 545 | ||||||||||||
| Total cash costs per ounce (on a co-product basis) |
i,j | 560 | 734 | 604 | ||||||||||||
| All-in sustaining costs per ounce |
i | 689 | 1,428 | 878 | ||||||||||||
| All-in sustaining costs per ounce (on a co-product basis) |
i,j | 756 | 1,464 | 937 | ||||||||||||
| All-in costs per ounce |
i | 941 | 1,428 | 1,066 | ||||||||||||
| All-in costs per ounce (on a co-product basis) |
i,j | 1,008 | 1,464 | 1,125 | ||||||||||||
| BARRICK FIRST QUARTER 2021 | 83 | MANAGEMENT’S DISCUSSION AND ANALYSIS |
| ($ millions, except per ounce information in dollars) |
|
For the three months ended 12/31/20 | ||||||||||||||||||||||||||||||
| Footnote | |
Loulo- Gounkoto |
|
Kibali | North Mara | Tongon | Bulyanhulu | Buzwagi | |
Africa & Middle East |
| |||||||||||||||||||||
| Cost of sales applicable to gold production |
181 | 104 | 82 | 99 | 28 | 33 | 527 | |||||||||||||||||||||||||
| Depreciation |
(65 | ) | (48 | ) | (21 | ) | (41 | ) | (13 | ) | (2 | ) | (190 | ) | ||||||||||||||||||
| By-product credits |
0 | 0 | (1 | ) | 0 | 0 | 0 | (1 | ) | |||||||||||||||||||||||
| Non-recurring items |
d | 0 | 0 | 0 | 0 | 0 | 0 | 0 | ||||||||||||||||||||||||
| Other |
0 | 0 | 0 | 0 | 0 | 0 | 0 | |||||||||||||||||||||||||
| Non-controlling interests |
(23 | ) | 0 | (10 | ) | (6 | ) | (2 | ) | (5 | ) | (46 | ) | |||||||||||||||||||
| Total cash costs |
93 | 56 | 50 | 52 | 13 | 26 | 290 | |||||||||||||||||||||||||
| General & administrative costs |
0 | 0 | 0 | 0 | 0 | 0 | 0 | |||||||||||||||||||||||||
| Minesite exploration and evaluation costs |
e | 2 | 0 | 0 | 1 | 0 | 0 | 3 | ||||||||||||||||||||||||
| Minesite sustaining capital expenditures |
f | 27 | 11 | 13 | 2 | 1 | 0 | 54 | ||||||||||||||||||||||||
| Sustaining capital leases |
1 | 2 | 0 | 0 | 0 | 0 | 3 | |||||||||||||||||||||||||
| Rehabilitation - accretion and amortization (operating sites) |
g | 0 | 0 | 1 | 0 | 0 | 0 | 1 | ||||||||||||||||||||||||
| Non-controlling interests |
(6 | ) | 0 | (2 | ) | 0 | 0 | 0 | (8 | ) | ||||||||||||||||||||||
| All-in sustaining costs |
117 | 69 | 62 | 55 | 14 | 26 | 343 | |||||||||||||||||||||||||
| Project exploration and evaluation and project costs |
e | 0 | 0 | 0 | 0 | 0 | 0 | 0 | ||||||||||||||||||||||||
| Project capital expenditures |
f | 7 | 1 | 18 | 0 | 43 | 0 | 69 | ||||||||||||||||||||||||
| Non-controlling interests |
(1 | ) | 0 | (3 | ) | 0 | (7 | ) | 0 | (11 | ) | |||||||||||||||||||||
| All-in costs |
123 | 70 | 77 | 55 | 50 | 26 | 401 | |||||||||||||||||||||||||
| Ounces sold - equity basis (000s ounces) |
126 | 89 | 63 | 64 | 20 | 21 | 383 | |||||||||||||||||||||||||
| Cost of sales per ounce |
h,i | 1,149 | 1,163 | 1,073 | 1,371 | 1,181 | 1,314 | 1,188 | ||||||||||||||||||||||||
| Total cash costs per ounce |
i | 734 | 616 | 799 | 810 | 610 | 1,267 | 753 | ||||||||||||||||||||||||
| Total cash costs per ounce (on a co-product basis) |
i,j | 734 | 621 | 806 | 811 | 621 | 1,242 | 753 | ||||||||||||||||||||||||
| All-in sustaining costs per ounce |
i | 923 | 783 | 989 | 853 | 664 | 1,283 | 896 | ||||||||||||||||||||||||
| All-in sustaining costs per ounce (on a co-product basis) |
i,j | 923 | 788 | 996 | 854 | 675 | 1,258 | 898 | ||||||||||||||||||||||||
| All-in costs per ounce |
i | 970 | 787 | 1,232 | 853 | 2,493 | 1,283 | 1,046 | ||||||||||||||||||||||||
| All-in costs per ounce (on a co-product basis) |
i,j | 970 | 792 | 1,239 | 854 | 2,504 | 1,258 | 1,048 | ||||||||||||||||||||||||
| BARRICK FIRST QUARTER 2021 | 84 | MANAGEMENT’S DISCUSSION AND ANALYSIS |
| ($ millions, except per ounce information in dollars) |
|
For the three months ended 3/31/20 | ||||||||||||||||||||||||||||||||||
| Footnote | Carlin | a | Cortez | b | |
Turquoise Ridge |
|
|
Long Canyon |
|
Phoenix | |
Nevada Gold Mines |
c |
Hemlo | |
North America |
| ||||||||||||||||||
| Cost of sales applicable to gold production |
404 | 182 | 147 | 45 | 78 | 856 | 65 | 921 | ||||||||||||||||||||||||||||
| Depreciation |
(80 | ) | (54 | ) | (51 | ) | (30 | ) | (22 | ) | (237 | ) | (10 | ) | (247 | ) | ||||||||||||||||||||
| By-product credits |
0 | 0 | (1 | ) | 0 | (20 | ) | (21 | ) | 0 | (21 | ) | ||||||||||||||||||||||||
| Non-recurring items |
d | 0 | 0 | 0 | 0 | 0 | 0 | 0 | 0 | |||||||||||||||||||||||||||
| Other |
0 | 0 | 0 | 0 | 0 | 0 | 0 | 0 | ||||||||||||||||||||||||||||
| Non-controlling interests |
(125 | ) | (49 | ) | (37 | ) | (6 | ) | (14 | ) | (231 | ) | 0 | (231 | ) | |||||||||||||||||||||
| Total cash costs |
199 | 79 | 58 | 9 | 22 | 367 | 55 | 422 | ||||||||||||||||||||||||||||
| General & administrative costs |
0 | 0 | 0 | 0 | 0 | 0 | 0 | 0 | ||||||||||||||||||||||||||||
| Minesite exploration and evaluation costs |
e | 3 | 2 | 1 | 1 | 0 | 7 | 0 | 7 | |||||||||||||||||||||||||||
| Minesite sustaining capital expenditures |
f | 91 | 76 | 18 | 8 | 7 | 209 | 19 | 228 | |||||||||||||||||||||||||||
| Sustaining capital leases |
0 | 0 | 0 | 0 | 0 | 0 | 0 | 0 | ||||||||||||||||||||||||||||
| Rehabilitation - accretion and amortization (operating sites) |
g | 2 | 4 | 0 | 0 | 1 | 7 | 0 | 7 | |||||||||||||||||||||||||||
| Non-controlling interests |
(37 | ) | (32 | ) | (7 | ) | (4 | ) | (3 | ) | (83 | ) | 0 | (83 | ) | |||||||||||||||||||||
| All-in sustaining costs |
258 | 129 | 70 | 14 | 27 | 507 | 74 | 581 | ||||||||||||||||||||||||||||
| Project exploration and evaluation and project costs |
e | 0 | 0 | 0 | 0 | 0 | 0 | 0 | 0 | |||||||||||||||||||||||||||
| Project capital expenditures |
f | 0 | 21 | 14 | 0 | 0 | 35 | 0 | 35 | |||||||||||||||||||||||||||
| Non-controlling interests |
0 | (8 | ) | (6 | ) | 0 | 0 | (13 | ) | 0 | (13 | ) | ||||||||||||||||||||||||
| All-in costs |
258 | 142 | 78 | 14 | 27 | 529 | 74 | 603 | ||||||||||||||||||||||||||||
| Ounces sold - equity basis (000s ounces) |
256 | 128 | 87 | 27 | 30 | 528 | 58 | 586 | ||||||||||||||||||||||||||||
| Cost of sales per ounce |
h,i | 970 | 878 | 1,032 | 1,025 | 1,583 | 995 | 1,119 | 1,007 | |||||||||||||||||||||||||||
| Total cash costs per ounce |
i | 776 | 614 | 668 | 345 | 737 | 690 | 945 | 720 | |||||||||||||||||||||||||||
| Total cash costs per ounce (on a co-product basis) |
i,j | 777 | 614 | 672 | 347 | 1,140 | 730 | 945 | 757 | |||||||||||||||||||||||||||
| All-in sustaining costs per ounce |
i | 1,007 | 1,009 | 806 | 561 | 914 | 952 | 1,281 | 979 | |||||||||||||||||||||||||||
| All-in sustaining costs per ounce (on a co-product basis) |
i,j | 1,008 | 1,009 | 810 | 563 | 1,317 | 992 | 1,281 | 1,016 | |||||||||||||||||||||||||||
| All-in costs per ounce |
i | 1,007 | 1,112 | 903 | 561 | 914 | 993 | 1,288 | 1,017 | |||||||||||||||||||||||||||
| All-in costs per ounce (on a co-product basis) |
i,j | 1,008 | 1,112 | 907 | 563 | 1,317 | 1,033 | 1,288 | 1,054 | |||||||||||||||||||||||||||
| BARRICK FIRST QUARTER 2021 | 85 | MANAGEMENT’S DISCUSSION AND ANALYSIS |
| ($ millions, except per ounce information in dollars) |
|
For the three months ended 3/31/20 | ||||||||||||||||||
| Footnote | Pueblo Viejo | Veladero | Porgerak | |
Latin America & Asia Pacific |
| ||||||||||||||
| Cost of sales applicable to gold production |
185 | 67 | 70 | 322 | ||||||||||||||||
| Depreciation |
(53 | ) | (22 | ) | (10 | ) | (85 | ) | ||||||||||||
| By-product credits |
(12 | ) | (1 | ) | 0 | (13 | ) | |||||||||||||
| Non-recurring items |
d | 0 | 0 | 0 | 0 | |||||||||||||||
| Other |
0 | 0 | 0 | 0 | ||||||||||||||||
| Non-controlling interests |
(48 | ) | 0 | 0 | (48 | ) | ||||||||||||||
| Total cash costs |
72 | 44 | 60 | 176 | ||||||||||||||||
| General & administrative costs |
0 | 0 | 0 | 0 | ||||||||||||||||
| Minesite exploration and evaluation costs |
e | 0 | 0 | 1 | 1 | |||||||||||||||
| Minesite sustaining capital expenditures |
f | 28 | 25 | 8 | 61 | |||||||||||||||
| Sustaining capital leases |
0 | 0 | 1 | 1 | ||||||||||||||||
| Rehabilitation - accretion and amortization (operating sites) |
g | 1 | 1 | 0 | 2 | |||||||||||||||
| Non-controlling interests |
(12 | ) | 0 | 0 | (12 | ) | ||||||||||||||
| All-in sustaining costs |
89 | 70 | 70 | 229 | ||||||||||||||||
| Project exploration and evaluation and project costs |
e | 2 | 0 | 0 | 2 | |||||||||||||||
| Project capital expenditures |
h | 0 | 15 | 0 | 15 | |||||||||||||||
| Non-controlling interests |
(1 | ) | 0 | 0 | (1 | ) | ||||||||||||||
| All-in costs |
90 | 85 | 70 | 245 | ||||||||||||||||
| Ounces sold - equity basis (000s ounces) |
144 | 57 | 63 | 264 | ||||||||||||||||
| Cost of sales per ounce |
h,i | 767 | 1,182 | 1,097 | 935 | |||||||||||||||
| Total cash costs per ounce |
i | 502 | 788 | 941 | 668 | |||||||||||||||
| Total cash costs per ounce (on a co-product basis) |
i,j | 548 | 806 | 946 | 718 | |||||||||||||||
| All-in sustaining costs per ounce |
i | 626 | 1,266 | 1,089 | 874 | |||||||||||||||
| All-in sustaining costs per ounce (on a co-product basis) |
i,j | 672 | 1,284 | 1,094 | 924 | |||||||||||||||
| All-in costs per ounce |
i | 635 | 1,537 | 1,089 | 934 | |||||||||||||||
| All-in costs per ounce (on a co-product basis) |
i,j | 681 | 1,555 | 1,094 | 984 | |||||||||||||||
| BARRICK FIRST QUARTER 2021 | 86 | MANAGEMENT’S DISCUSSION AND ANALYSIS |
| ($ millions, except per ounce information in dollars) |
|
For the three months ended 3/31/20 | ||||||||||||||||||||||||||||||
| Footnote | |
Loulo- Gounkoto |
|
Kibali | North Mara | Tongon | Bulyanhulu | Buzwagi | |
Africa & Middle East |
| |||||||||||||||||||||
| Cost of sales applicable to gold production |
153 | 93 | 79 | 89 | 14 | 39 | 467 | |||||||||||||||||||||||||
| Depreciation |
(59 | ) | (41 | ) | (25 | ) | (39 | ) | (8 | ) | (3 | ) | (175 | ) | ||||||||||||||||||
| By-product credits |
0 | 0 | (1 | ) | 0 | 0 | 0 | (1 | ) | |||||||||||||||||||||||
| Non-recurring items |
d | 0 | 0 | 0 | 0 | 0 | 0 | 0 | ||||||||||||||||||||||||
| Other |
0 | 0 | 0 | 0 | 0 | 0 | 0 | |||||||||||||||||||||||||
| Non-controlling interests |
(19 | ) | 0 | (9 | ) | (5 | ) | (1 | ) | (6 | ) | (40 | ) | |||||||||||||||||||
| Total cash costs |
75 | 52 | 44 | 45 | 5 | 30 | 251 | |||||||||||||||||||||||||
| General & administrative costs |
0 | 0 | 0 | 0 | 0 | 0 | 0 | |||||||||||||||||||||||||
| Minesite exploration and evaluation costs |
e | 2 | 1 | 0 | 1 | 0 | 0 | 4 | ||||||||||||||||||||||||
| Minesite sustaining capital expenditures |
f | 39 | 15 | 14 | 1 | 1 | 0 | 70 | ||||||||||||||||||||||||
| Sustaining capital leases |
0 | 0 | 0 | 0 | 0 | 0 | 0 | |||||||||||||||||||||||||
| Rehabilitation - accretion and amortization (operating sites) |
g | 1 | 0 | 1 | 0 | 0 | 0 | 2 | ||||||||||||||||||||||||
| Non-controlling interests |
(8 | ) | 0 | (2 | ) | 0 | 0 | 0 | (10 | ) | ||||||||||||||||||||||
| All-in sustaining costs |
109 | 68 | 57 | 47 | 6 | 30 | 317 | |||||||||||||||||||||||||
| Project exploration and evaluation and project costs |
e | 0 | 0 | 0 | 0 | 0 | 0 | 0 | ||||||||||||||||||||||||
| Project capital expenditures |
f | 0 | 0 | 2 | 0 | 1 | 0 | 3 | ||||||||||||||||||||||||
| Non-controlling interests |
0 | 0 | 0 | 0 | 0 | 0 | 0 | |||||||||||||||||||||||||
| All-in costs |
109 | 68 | 59 | 47 | 7 | 30 | 320 | |||||||||||||||||||||||||
| Ounces sold - equity basis (000s ounces) |
123 | 88 | 70 | 58 | 7 | 24 | 370 | |||||||||||||||||||||||||
| Cost of sales per ounce |
h,i | 1,002 | 1,045 | 959 | 1,368 | 1,685 | 1,373 | 1,099 | ||||||||||||||||||||||||
| Total cash costs per ounce |
i | 614 | 582 | 646 | 762 | 686 | 1,275 | 680 | ||||||||||||||||||||||||
| Total cash costs per ounce (on a co-product basis) |
i,j | 614 | 585 | 653 | 763 | 709 | 1,282 | 684 | ||||||||||||||||||||||||
| All-in sustaining costs per ounce |
i | 891 | 773 | 816 | 788 | 906 | 1,288 | 859 | ||||||||||||||||||||||||
| All-in sustaining costs per ounce (on a co-product basis) |
i,j | 891 | 776 | 823 | 789 | 929 | 1,295 | 863 | ||||||||||||||||||||||||
| All-in costs per ounce |
i | 891 | 773 | 838 | 788 | 1,038 | 1,288 | 865 | ||||||||||||||||||||||||
| All-in costs per ounce (on a co-product basis) |
i,j | 891 | 776 | 845 | 789 | 1,061 | 1,295 | 869 | ||||||||||||||||||||||||
| a. | Included within our 61.5% interest in Carlin is NGM’s 60% interest in South Arturo. |
| b. | Starting in the first quarter of 2021, Goldrush is reported as part of Cortez as it is operated by Cortez management. Comparative periods have been restated to include Goldrush. |
| c. | These results represent our 61.5% interest in Carlin (including NGM’s 60% interest in South Arturo), Cortez, Turquoise Ridge, Phoenix and Long Canyon. |
| d. | Non-recurring items |
These costs are not indicative of our cost of production and have been excluded from the calculation of total cash costs.
| e. | Exploration and evaluation costs |
Exploration, evaluation and project expenses are presented as minesite sustaining if it supports current mine operations and project if it relates to future projects. Refer to page 68 of this MD&A.
| f. | Capital expenditures |
Capital expenditures are related to our gold sites only and are split between minesite sustaining and project capital expenditures. Project capital expenditures are distinct projects designed to increase the net present value of the mine and are not related to current production. Significant projects in the current year are the expansion project at Pueblo Viejo and construction of the Third Shaft at Turquoise Ridge. Refer to page 67 of this MD&A.
| g. | Rehabilitation - accretion and amortization |
Includes depreciation on the assets related to rehabilitation provisions of our gold operations and accretion on the rehabilitation provision of our gold operations, split between operating and non-operating sites.
| h. | Cost of sales per ounce |
Gold cost of sales per ounce is calculated as cost of sales across our gold operations (excluding sites in care and maintenance) divided by ounces sold (both on an attributable basis using Barrick’s ownership share).
| i. | Per ounce figures |
Cost of sales per ounce, total cash costs per ounce, all-in sustaining costs per ounce and all-in costs per ounce may not calculate based on amounts presented in this table due to rounding.
| BARRICK FIRST QUARTER 2021 | 87 | MANAGEMENT’S DISCUSSION AND ANALYSIS |
| j. | Co-product costs per ounce |
Total cash costs per ounce, all-in sustaining costs per ounce and all-in costs per ounce presented on a co-product basis removes the impact of by-product credits of our gold production (net of non-controlling interest) calculated as:
| ($ millions) |
For the three months ended 3/31/21 | |||||||||||||||||||||||||||||||||||
| Carlina | Cortezb | Turquoise Ridge |
Long Canyon |
Phoenix | Nevada Gold Minesc |
Hemlo | Pueblo Viejo |
Veladero | ||||||||||||||||||||||||||||
| By-product credits |
1 | 1 | 3 | 0 | 46 | 51 | 0 | 12 | 1 | |||||||||||||||||||||||||||
| Non-controlling interest |
0 | 0 | (1 | ) | 0 | (18 | ) | (19 | ) | 0 | (5 | ) | 0 | |||||||||||||||||||||||
| By-product credits (net of non-controlling interest) |
1 | 1 | 2 | 0 | 28 | 32 | 0 | 7 | 1 | |||||||||||||||||||||||||||
| ($ millions) |
For the three months ended 3/31/21 | |||||||||||||||||||||||||||||||||||
| Loulo- Gounkoto |
Kibali | North Mara |
Tongon | Bulyanhulu | Buzwagi | |||||||||||||||||||||||||||||||
| By-product credits |
0 | 0 | 0 | 0 | 0 | (1 | ) | |||||||||||||||||||||||||||||
| Non-controlling interest |
0 | 0 | 0 | 0 | 0 | 0 | ||||||||||||||||||||||||||||||
| By-product credits (net of non-controlling interest) |
0 | 0 | 0 | 0 | 0 | (1 | ) | |||||||||||||||||||||||||||||
| ($ millions) |
For the three months ended 12/31/20 | |||||||||||||||||||||||||||||||||||
| Carlina | Cortezb | Turquoise Ridge |
Long Canyon |
Phoenix | Nevada Gold Minesc |
Hemlo | Pueblo Viejo |
Veladero | ||||||||||||||||||||||||||||
| By-product credits |
1 | 1 | 3 | 0 | 42 | 47 | 0 | 16 | 2 | |||||||||||||||||||||||||||
| Non-controlling interest |
0 | 0 | (1 | ) | 0 | (16 | ) | (18 | ) | 0 | (6 | ) | 0 | |||||||||||||||||||||||
| By-product credits (net of non-controlling interest) |
1 | 1 | 2 | 0 | 26 | 29 | 0 | 10 | 2 | |||||||||||||||||||||||||||
| ($ millions) |
For the three months ended 12/31/20 | |||||||||||||||||||||||||||||||||||
| Loulo- Gounkoto |
Kibali | North Mara |
Tongon | Bulyanhulu | Buzwagi | |||||||||||||||||||||||||||||||
| By-product credits |
0 | 0 | 1 | 0 | 0 | 0 | ||||||||||||||||||||||||||||||
| Non-controlling interest |
0 | 0 | 0 | 0 | 0 | 0 | ||||||||||||||||||||||||||||||
| By-product credits (net of non-controlling interest) |
0 | 0 | 1 | 0 | 0 | 0 | ||||||||||||||||||||||||||||||
| ($ millions) |
For the three months ended 3/31/2020 | |||||||||||||||||||||||||||||||||||
| Carlina | Cortezb | Turquoise Ridge |
Long Canyon |
Phoenix | Nevada Gold Minesc |
Hemlo | Pueblo Viejo |
Veladero | ||||||||||||||||||||||||||||
| By-product credits |
0 | 0 | 1 | 0 | 20 | 21 | 0 | 12 | 1 | |||||||||||||||||||||||||||
| Non-controlling interest |
0 | 0 | 0 | 0 | (8 | ) | (8 | ) | 0 | (5 | ) | 0 | ||||||||||||||||||||||||
| By-product credits (net of non-controlling interest) |
0 | 0 | 1 | 0 | 12 | 13 | 0 | 7 | 1 | |||||||||||||||||||||||||||
| ($ millions) |
For the three months ended 3/31/2020 | |||||||||||||||||||||||||||||||||||
| Porgerak | Loulo- Gounkoto |
Kibali | North Mara |
Tongon | Bulyanhulu | Buzwagi | ||||||||||||||||||||||||||||||
| By-product credits |
0 | 0 | 0 | 1 | 0 | 0 | 0 | |||||||||||||||||||||||||||||
| Non-controlling interest |
0 | 0 | 0 | 0 | 0 | 0 | 0 | |||||||||||||||||||||||||||||
| By-product credits (net of non-controlling interest) |
0 | 0 | 0 | 1 | 0 | 0 | 0 | |||||||||||||||||||||||||||||
| k. | As Porgera was placed on care and maintenance on April 25, 2020, no operating data or per ounce data was provided for the three month periods ended March 31, 2021 and December 31, 2020. |
| BARRICK FIRST QUARTER 2021 | 88 | MANAGEMENT’S DISCUSSION AND ANALYSIS |
Reconciliation of Copper Cost of Sales to C1 cash costs and All-in sustaining costs, including on a per pound basis
| ($ millions, except per pound information in dollars) |
For the three months ended | |||||||||||
| 3/31/21 | 12/31/20 | 3/31/20 | ||||||||||
| Cost of sales |
136 | 125 | 124 | |||||||||
| Depreciation/amortization |
(48 | ) | (41 | ) | (43 | ) | ||||||
| Treatment and refinement charges |
41 | 39 | 39 | |||||||||
| Cash cost of sales applicable to equity method investments |
79 | 72 | 66 | |||||||||
| Less: royalties and production taxesa |
(23 | ) | (16 | ) | (11 | ) | ||||||
| By-product credits |
(4 | ) | (5 | ) | (3 | ) | ||||||
| Other |
0 | 0 | 0 | |||||||||
| C1 cash costs |
181 | 174 | 172 | |||||||||
| General & administrative costs |
4 | 5 | 3 | |||||||||
| Rehabilitation - accretion and amortization |
1 | 1 | 3 | |||||||||
| Royalties and production taxesa |
23 | 16 | 11 | |||||||||
| Minesite exploration and evaluation costs |
2 | 1 | 1 | |||||||||
| Minesite sustaining capital expenditures |
42 | 65 | 32 | |||||||||
| Sustaining leases |
2 | 2 | 3 | |||||||||
| All-in sustaining costs |
255 | 264 | 225 | |||||||||
| Pounds sold - consolidated basis (millions pounds) |
113 | 108 | 110 | |||||||||
| Cost of sales per poundb,c |
2.11 | 2.06 | 1.96 | |||||||||
| C1 cash cost per poundb |
1.60 | 1.61 | 1.55 | |||||||||
| All-in sustaining costs per poundb |
2.26 | 2.42 | 2.04 | |||||||||
| a. | For the three month period ended March 31, 2021, royalties and production taxes include royalties of $23 million (December 31, 2020: $16 million and March 31, 2020: $11 million). |
| b. | Cost of sales per pound, C1 cash costs per pound and all-in sustaining costs per pound may not calculate based on amounts presented in this table due to rounding. |
| c. | Copper cost of sales per pound is calculated as cost of sales across our copper operations divided by pounds sold (both on an attributable basis using Barrick’s ownership share). |
| BARRICK FIRST QUARTER 2021 | 89 | MANAGEMENT’S DISCUSSION AND ANALYSIS |
Reconciliation of Copper Cost of Sales to C1 cash costs and All-in sustaining costs, including on a per pound basis, by operating site
| ($ millions, except per pound information in dollars) |
|
For the three months ended | ||||||||||||||||||||||||||||||||||
| 3/31/21 | 12/31/20 | 3/31/20 | ||||||||||||||||||||||||||||||||||
| Zaldívar | Lumwana | |
Jabal Sayid |
|
Zaldívar | Lumwana | |
Jabal Sayid |
|
Zaldívar | Lumwana | |
Jabal Sayid |
| ||||||||||||||||||||||
| Cost of sales |
83 | 136 | 21 | 68 | 125 | 28 | 70 | 124 | 22 | |||||||||||||||||||||||||||
| Depreciation/amortization |
(21 | ) | (48 | ) | (3 | ) | (17 | ) | (41 | ) | (7 | ) | (20 | ) | (43 | ) | (6 | ) | ||||||||||||||||||
| Treatment and refinement charges |
0 | 37 | 4 | 1 | 33 | 5 | 0 | 34 | 5 | |||||||||||||||||||||||||||
| Less: royalties and production taxesa |
0 | (23 | ) | 0 | 0 | (16 | ) | 0 | 0 | (11 | ) | 0 | ||||||||||||||||||||||||
| By-product credits |
0 | 0 | (4 | ) | 0 | 0 | (5 | ) | 0 | 0 | (3 | ) | ||||||||||||||||||||||||
| Other |
0 | 0 | 0 | 0 | 0 | 0 | 0 | 0 | 0 | |||||||||||||||||||||||||||
| C1 cash costs |
62 | 102 | 18 | 52 | 101 | 21 | 50 | 104 | 18 | |||||||||||||||||||||||||||
| Rehabilitation - accretion and amortization |
0 | 1 | 0 | 0 | 1 | 0 | 0 | 3 | 0 | |||||||||||||||||||||||||||
| Royalties and production taxesa |
0 | 23 | 0 | 0 | 16 | 0 | 0 | 11 | 0 | |||||||||||||||||||||||||||
| Minesite exploration and evaluation costs |
2 | 0 | 0 | 1 | 0 | 0 | 1 | 0 | 0 | |||||||||||||||||||||||||||
| Minesite sustaining capital expenditures |
2 | 37 | 3 | 15 | 48 | 2 | 6 | 25 | 1 | |||||||||||||||||||||||||||
| Sustaining leases |
1 | 1 | 0 | 1 | 1 | 0 | 1 | 2 | 0 | |||||||||||||||||||||||||||
| All-in sustaining costs |
67 | 164 | 21 | 69 | 167 | 23 | 58 | 145 | 19 | |||||||||||||||||||||||||||
| Pounds sold - consolidated basis (millions pounds) |
27 | 69 | 17 | 25 | 65 | 18 | 30 | 63 | 17 | |||||||||||||||||||||||||||
| Cost of sales per poundb,c |
3.03 | 1.97 | 1.21 | 2.68 | 1.96 | 1.53 | 2.39 | 1.94 | 1.28 | |||||||||||||||||||||||||||
| C1 cash cost per poundb |
2.25 | 1.48 | 1.06 | 2.01 | 1.58 | 1.15 | 1.71 | 1.63 | 0.97 | |||||||||||||||||||||||||||
| All-in sustaining costs per poundb |
2.47 | 2.37 | 1.22 | 2.70 | 2.60 | 1.27 | 1.99 | 2.26 | 1.11 | |||||||||||||||||||||||||||
| a. | For the three month period ended March 31, 2021, royalties and production taxes include royalties of $23 million (December 31, 2020: $16 million and March 31, 2020: $11 million). |
| b. | Cost of sales per pound, C1 cash costs per pound and all-in sustaining costs per pound may not calculate based on amounts presented in this table due to rounding. |
| c. | Copper cost of sales per pound is calculated as cost of sales across our copper operations divided by pounds sold (both on an attributable basis using Barrick’s ownership share). |
EBITDA and Adjusted EBITDA
| BARRICK FIRST QUARTER 2021 | 90 | MANAGEMENT’S DISCUSSION AND ANALYSIS |
Reconciliation of Net Earnings to EBITDA and Adjusted EBITDA
| ($ millions) |
For the three months ended | |||||||||||
| 3/31/21 | 12/31/20 | 3/31/20 | ||||||||||
| Net earnings |
830 | 1,058 | 663 | |||||||||
| Income tax expense |
374 | 404 | 386 | |||||||||
| Finance costs, neta |
77 | 72 | 88 | |||||||||
| Depreciation |
507 | 544 | 524 | |||||||||
| EBITDA |
1,788 | 2,078 | 1,661 | |||||||||
| Impairment charges (reversals) of long-lived assetsb |
(89 | ) | 40 | (336 | ) | |||||||
| Acquisition/disposition (gains) lossesc |
(3 | ) | (126 | ) | (60 | ) | ||||||
| Loss on currency translation |
4 | 16 | 16 | |||||||||
| Other expense (income) adjustmentsd |
11 | 15 | 98 | |||||||||
| Income tax expense, net finance costs, and depreciation from equity investees |
89 | 83 | 87 | |||||||||
| Adjusted EBITDA |
1,800 | 2,106 | 1,466 | |||||||||
| a. | Finance costs exclude accretion. |
| b. | For the three month period ended March 31, 2021, net impairment reversals primarily relate to non-current asset reversals at Lagunas Norte. Net impairment charges (reversals) for the three month periods ended December 31, 2020 and March 31, 2020 mainly relate to non-current assets at our Tanzanian assets. |
| c. | Acquisition/disposition gains for the three month period ended December 31, 2020 primarily relate to the gain on the sale of Eskay Creek, Morila and Bullfrog. For the three months ended March 31, 2020, acquisition/disposition gains mainly relate to the gain on the sale of Massawa. |
| d. | Other expense adjustments for the three month periods ended March 31, 2021 and December 31, 2020 mainly relate to care and maintenance expenses at Porgera. For the three months ended March 31, 2020, other expense adjustments primarily relate to the impact of changes in the discount rate assumptions on our closed mine rehabilitation provision and losses on debt extinguishment. |
Reconciliation of Income to EBITDA by operating site
| ($ millions) |
For the three months ended 3/31/21 | |||||||||||||||||||||||||||||||||||||||
| |
Carlina (61.5%) |
|
|
Cortezb (61.5%) |
|
|
Turquoise Ridge (61.5%) |
|
|
Nevada Gold Minesc (61.5%) |
|
|
Pueblo Viejo (60%) |
|
|
Loulo- Gounkoto (80%) |
|
Kibali (45%) |
|
|
Veladero (50%) |
|
|
North Mara (84%) |
|
|
Bulyanhulu (84%) |
| ||||||||||||
| Income |
188 | 49 | 72 | 375 | 131 | 113 | 63 | 22 | 40 | 7 | ||||||||||||||||||||||||||||||
| Depreciation |
42 | 39 | 32 | 142 | 37 | 55 | 32 | 11 | 12 | 10 | ||||||||||||||||||||||||||||||
| EBITDA |
230 | 88 | 104 | 517 | 168 | 168 | 95 | 33 | 52 | 17 | ||||||||||||||||||||||||||||||
| For the three months ended 12/31/20 | ||||||||||||||||||||||||||||||||||||||||
| |
Carlina (61.5%) |
|
|
Cortezb (61.5%) |
|
|
Turquoise Ridge (61.5%) |
|
|
Nevada Gold Minesc (61.5%) |
|
|
Pueblo Viejo (60%) |
|
|
Loulo- Gounkoto (80%) |
|
Kibali (45%) |
|
|
Veladero (50%) |
|
|
North Mara (84%) |
|
|
Bulyanhulu (84%) |
| ||||||||||||
| Income |
244 | 93 | 72 | 482 | 167 | 91 | 58 | 44 | 49 | 13 | ||||||||||||||||||||||||||||||
| Depreciation |
45 | 35 | 32 | 152 | 37 | 52 | 48 | 17 | 17 | 10 | ||||||||||||||||||||||||||||||
| EBITDA |
289 | 128 | 104 | 634 | 204 | 143 | 106 | 61 | 66 | 23 | ||||||||||||||||||||||||||||||
| For the three months ended 3/31/20 | ||||||||||||||||||||||||||||||||||||||||
| |
Carlina (61.5%) |
|
|
Cortezb (61.5%) |
|
|
Turquoise Ridge (61.5%) |
|
|
Nevada Gold Minesc (61.5%) |
|
|
Pueblo Viejo (60%) |
|
|
Loulo- Gounkoto (80%) |
|
|
Kibali (45%) |
|
|
Veladero (50%) |
|
|
North Mara (84%) |
|
|
Bulyanhulu (84%) |
| |||||||||||
| Income |
153 | 89 | 47 | 316 | 102 | 68 | 48 | 24 | 49 | (11 | ) | |||||||||||||||||||||||||||||
| Depreciation |
49 | 33 | 31 | 146 | 32 | 47 | 41 | 22 | 21 | 7 | ||||||||||||||||||||||||||||||
| EBITDA |
202 | 122 | 78 | 462 | 134 | 115 | 89 | 46 | 70 | (4 | ) | |||||||||||||||||||||||||||||
| a. | Included within our 61.5% interest in Carlin is NGM’s 60% interest in South Arturo. |
| b. | Starting in the first quarter of 2021, Goldrush is reported as part of Cortez as it is operated by Cortez management. Comparative periods have been restated to include Goldrush. |
| c. | These results represent our 61.5% interest in Carlin (including NGM’s 60% interest in South Arturo), Cortez, Turquoise Ridge, Phoenix and Long Canyon. |
| BARRICK FIRST QUARTER 2021 | 91 | MANAGEMENT’S DISCUSSION AND ANALYSIS |
Reconciliation of Sales to Realized Price per ounce/pound
| ($ millions, except per ounce/pound information in dollars) |
Gold | Copper | ||||||||||||||||||||||
| For the three months ended | ||||||||||||||||||||||||
| 3/31/21 | 12/31/20 | 3/31/20 | 3/31/21 | 12/31/20 | 3/31/20 | |||||||||||||||||||
| Sales |
2,641 | 3,028 | 2,593 | 256 | 195 | 99 | ||||||||||||||||||
| Sales applicable to non-controlling interests |
(814 | ) | (934 | ) | (770 | ) | 0 | 0 | 0 | |||||||||||||||
| Sales applicable to equity method investmentsa,b |
154 | 168 | 147 | 170 | 135 | 107 | ||||||||||||||||||
| Realized non-hedge gold/copper derivative (losses) gains |
0 | 0 | 0 | 0 | 0 | 0 | ||||||||||||||||||
| Sales applicable to sites in care and maintenancec |
(41 | ) | (41 | ) | (46 | ) | 0 | 0 | 0 | |||||||||||||||
| Treatment and refinement charges |
0 | 1 | 0 | 41 | 39 | 39 | ||||||||||||||||||
| Otherd |
0 | (1 | ) | 15 | 0 | 0 | 0 | |||||||||||||||||
| Revenues – as adjusted |
1,940 | 2,221 | 1,939 | 467 | 369 | 245 | ||||||||||||||||||
| Ounces/pounds sold (000s ounces/millions pounds)c |
1,093 | 1,186 | 1,220 | 113 | 108 | 110 | ||||||||||||||||||
| Realized gold/copper price per ounce/pounde |
1,777 | 1,871 | 1,589 | 4.12 | 3.39 | 2.23 | ||||||||||||||||||
| a. | Represents sales of $154 million for the three month period ended March 31, 2021 (December 31, 2020: $168 million and March 31, 2020: $140 million) applicable to our 45% equity method investment in Kibali for gold. Represents sales of $109 million for the three months ended March 31, 2021 (December 31, 2020: $82 million and March 31, 2020: $72 million) applicable to our 50% equity method investment in Zaldívar and $65 million (December 31, 2020: $59 million and March 31, 2020: $40 million) applicable to our 50% equity method investment in Jabal Sayid for copper. |
| b. | Sales applicable to equity method investments are net of treatment and refinement charges. |
| c. | Figures exclude: Pierina, Lagunas Norte, Golden Sunlight, and Morila up until its divestiture in November 2020 from the calculation of realized price per ounce. These assets are producing incidental ounces. |
| d. | Represents a cumulative catch-up adjustment to revenue relating to our streaming arrangements. Refer to note 2f of the 2020 Annual Financial Statements for more information. |
| e. | Realized price per ounce/pound may not calculate based on amounts presented in this table due to rounding. |
| BARRICK FIRST QUARTER 2021 | 92 | MANAGEMENT’S DISCUSSION AND ANALYSIS |
Technical Information
The scientific and technical information contained in this MD&A has been reviewed and approved by Steven Yopps, MMSA, Manager of Growth Projects, Nevada Gold Mines; Craig Fiddes, SME-RM, Manager – Resource Modeling, Nevada Gold Mines; Chad Yuhasz, P.Geo, Mineral Resource Manager, Latin America & Asia Pacific; Simon Bottoms, CGeol, MGeol, FGS, FAusIMM, Mineral Resources Manager: Africa & Middle East; Rodney Quick, MSc, Pr. Sci.Nat, Mineral Resource Management and Evaluation Executive; John Steele, CIM, Metallurgy, Engineering and Capital Projects Executive; and Rob Krcmarov, FAusIMM, Executive Vice President, Exploration and Growth – each a “Qualified Person” as defined in National Instrument 43-101 – Standards of Disclosure for Mineral Projects.
All mineral reserve and mineral resource estimates are estimated in accordance with National Instrument 43-101 – Standards of Disclosure for Mineral Projects. Unless otherwise noted, such mineral reserve and mineral resource estimates are as of December 31, 2020.
Endnotes
| 1 | These are non-GAAP financial performance measures with no standardized meaning under IFRS and therefore may not be comparable to similar measures presented by other issuers. For further information and a detailed reconciliation of each non-GAAP measure to the most directly comparable IFRS measure, please see pages 74 to 92 of this MD&A. |
| 2 | Gold cost of sales per ounce is calculated as cost of sales across our gold operations (excluding sites in care and maintenance) divided by ounces sold (both on an attributable basis using Barrick’s ownership share). Copper cost of sales per pound is calculated as cost of sales across our copper operations divided by pounds sold (both on an attributable basis using Barrick’s ownership share). References to attributable basis means our 100% share of Hemlo and Lumwana, our 61.5% share of Nevada Gold Mines, our 60% share of Pueblo Viejo, our 80% share of Loulo-Gounkoto, our 89.7% share of Tongon, our 84% share of North Mara, Bulyanhulu and Buzwagi, our 50% share of Veladero, Zaldívar and Jabal Sayid, our 47.5% share of Porgera and our 45% share of Kibali. |
| 3 | Total reportable incident frequency rate (“TRIFR”) is a ratio calculated as follows: number of reportable injuries x 1,000,000 hours divided by the total number of hours worked. Reportable injuries include fatalities, lost time injuries, restricted duty injuries, and medically treated injuries. Lost time injury frequency rate (“LTIFR”) is a ratio calculated as follows: number of lost time injuries x 1,000,000 hours divided by the total number of hours worked. |
| 4 | Class 1 - High Significance is defined as an incident that causes significant negative impacts on human health or the environment or an incident that extends onto publicly accessible land and has the potential to cause significant adverse impact to surrounding communities, livestock or wildlife. |
| 5 | A Tier One Gold Asset is an asset with a reserve potential to deliver a minimum 10-year life, annual production of at least 500,000 ounces of gold and total cash costs per ounce over the mine life that are in the lower half of the industry cost curve. |
| 6 | A Tier Two Gold Asset is an asset with a reserve potential to deliver a minimum 10-year life, annual production of at least 250,000 ounces of gold and total cash costs per ounce over the mine life that are in the lower half of the industry cost curve. A Strategic Asset is an asset which in the opinion of Barrick, has the potential to deliver significant unrealized value in the future. |
| 7 | See the Technical Report on the Turquoise Ridge complex, dated March 25, 2020, and filed on SEDAR at www.sedar.com and EDGAR at www.sec.gov on March 25, 2020. |
| 8 | See the Technical Report on the Pueblo Viejo mine, Sanchez Ramirez Province, Dominican Republic, dated March 19, 2018, and filed on SEDAR at www.sedar.com and EDGAR at www.sec.gov on March 23, 2018. |
| 9 | Carlin Trend Significant Interceptsa |
| Drill Results from Q1 2021 | ||||||||||
| Drill Holeb | Azimuth | Dip | Interval (m) | Width (m)c | Au (g/t) | |||||
| 613.3 - 616.0 | 2.7 | 7.2 | ||||||||
| 617.5 - 619.0 | 1.5 | 8.21 | ||||||||
| 620.1 - 622.7 | 2.6 | 5.62 | ||||||||
| 709.7 - 734.7 | 25.0 | 11.77 | ||||||||
| 769.9 - 772.6 | 2.7 | 16.56 | ||||||||
| PGX-20002A |
9 | (67) | 781.5 - 783.2 | 1.7 | 6.04 | |||||
| a. | All intercepts calculated using a 5 g/t Au cutoff and are uncapped; minimum intercept width is 0.8 m; internal dilution is less than 20% total width. |
| b. | Carlin Trend drill hole nomenclature: Project area (PGX - Post-Gen) followed by the year (20 for 2020) then hole number |
| c. | True width of intercepts are uncertain at this stage. |
| BARRICK FIRST QUARTER 2021 | 93 | MANAGEMENT’S DISCUSSION AND ANALYSIS |
The drilling results for the Carlin Trend contained in this MD&A have been prepared in accordance with National Instrument 43-101 – Standards of Disclosure for Mineral Projects. All drill hole assay information has been manually reviewed and approved by staff geologists and re-checked by the project manager. Sample preparation and analyses are conducted by ALS Minerals. Procedures are employed to ensure security of samples during their delivery from the drill rig to the laboratory. The quality assurance procedures, data verification and assay protocols used in connection with drilling and sampling on the Carlin Trend conform to industry accepted quality control methods.
| 10 | Carlin Trend Significant Interceptsa |
| Drill Results from 2020/Legacy Results | ||||||||||
| Drill Holeb | Azimuth | Dip | Interval (m) | Width (m)c | Au (g/t) | |||||
| 334.7 - 365.2 | 30.5 | 15.9 | ||||||||
| DPC-0241 |
72 | (56) | 369.7 - 396.2 | 26.5 | 11.24 | |||||
| DSU-00190 |
106 | (60) | 379.5 - 388.5 | 9 | 12.81 | |||||
| 482.9 - 486.6 | 3.7 | 14.65 | ||||||||
| 489.8 - 492.7 | 2.9 | 17.07 | ||||||||
| PGX-20005 |
256 | (52) | 503.2 - 504.6 | 1.4 | 6.58 | |||||
| a. | All intercepts calculated using a 5 g/t Au cutoff and are uncapped; minimum intercept width is 0.8 m; internal dilution is less than 20% total width. |
| b. | Carlin Trend drill hole nomenclature: Project area (PGX - Post-Gen) followed by the year (20 for 2020) then hole number. Legacy nomenclature: Project area (DPC - Deep Post, DSU - Deep Star) followed by hole number. |
| c. | True width of intercepts are uncertain at this stage. |
The drilling results for the Carlin Trend contained in this MD&A have been prepared in accordance with National Instrument 43-101 – Standards of Disclosure for Mineral Projects. All drill hole assay information has been manually reviewed and approved by staff geologists and re-checked by the project manager. Sample preparation and analyses are conducted by ALS Minerals. Procedures are employed to ensure security of samples during their delivery from the drill rig to the laboratory. The quality assurance procedures, data verification and assay protocols used in connection with drilling and sampling on the Carlin Trend conform to industry accepted quality control methods.
| 11 | North Leeville Significant Interceptsa |
| Drill Results from Q1 2021 | ||||||||||
| Drill Holeb | Azimuth | Dip | Interval (m) | Width (m)c | Au (g/t) | |||||
| 733.6 - 736.7 | 3.1 | 16.72 | ||||||||
| CGX-20078 |
106 | (67) | 756.5 - 789.4d | 32.9 | 16.94 | |||||
| 813.5 - 825.8d | 12.3 | 18.27 | ||||||||
| CGX-20079 |
280 | (80) | 951.1 - 954.9 | 3.8 | 8.87 | |||||
| 776.2 - 781.2 | 5.0 | 4.49 | ||||||||
| CGX-20080 |
0 | (90) | 784.4 - 787.5 | 3.1 | 3.94 | |||||
| CGX-20081 |
255 | (75) | No significant intercepts | |||||||
| CGX-20083 |
105 | (80) | No significant intercepts | |||||||
| a. | All intercepts calculated using a 3.4 g/t Au cutoff and are uncapped; minimum intercept width is 3.0 m; internal dilution is less than 20% total width. |
| b. | Carlin Trend drill hole nomenclature: Project area (CGX - Leeville) followed by the year (20 for 2020) then hole number. |
| c. | True width of intercepts are uncertain at this stage. |
| d. | Interval reported with 2020 results. |
The drilling results for North Leeville contained in this MD&A have been prepared in accordance with National Instrument 43-101 – Standards of Disclosure for Mineral Projects. All drill hole assay information has been manually reviewed and approved by staff geologists and re-checked by the project manager. Sample preparation and analyses are conducted by ALS Minerals. Procedures are employed to ensure security of samples during their delivery from the drill rig to the laboratory. The quality assurance procedures, data verification and assay protocols used in connection with drilling and sampling on North Leeville conform to industry accepted quality control methods.
| BARRICK FIRST QUARTER 2021 | 94 | MANAGEMENT’S DISCUSSION AND ANALYSIS |
| 12 | North Leeville Significant Interceptsa |
| Drill Results from 2020 | ||||||||||
| Drill Holeb | Azimuth | Dip | Interval (m) | Width (m)c | Au (g/t) | |||||
| CGX-20075 |
68 | (84) | 909.5 - 912.6 | 3.1 | 3.78 | |||||
| 781.2 - 786.1 | 4.9 | 5.12 | ||||||||
| 805.6 - 810.5 | 4.8 | 4.76 | ||||||||
| 823.7 - 847.0 | 23.3 | 32.58 | ||||||||
| CGX-00076A |
115 | (75) | 898.2 - 901.9 | 3.7 | 9.00 | |||||
| CGX-20077 |
105 | (67) | 813.5 - 816.6 | 3.1 | 7.05 | |||||
| a. | All intercepts calculated using a 3.4 g/t Au cutoff and are uncapped; minimum intercept width is 3.0 m; internal dilution is less than 20% total width. |
| b. | Carlin Trend drill hole nomenclature: Project area (CGX - Leeville) followed by the year (20 for 2020) then hole number. |
| c. | True width of intercepts are uncertain at this stage. |
The drilling results for North Leeville contained in this MD&A have been prepared in accordance with National Instrument 43-101 – Standards of Disclosure for Mineral Projects. All drill hole assay information has been manually reviewed and approved by staff geologists and re-checked by the project manager. Sample preparation and analyses are conducted by ALS Minerals. Procedures are employed to ensure security of samples during their delivery from the drill rig to the laboratory. The quality assurance procedures, data verification and assay protocols used in connection with drilling and sampling on North Leeville conform to industry accepted quality control methods.
| 13 | Hemlo Significant Interceptsa |
| Drill Results from 2020 | ||||||||||
| Drill Holeb | Azimuth | Dip | Interval (m) | Width (m)c | Au (g/t) | |||||
| 590.84 - 612.35 | 6.69 | 2.64 | ||||||||
| including | 3.60 | 3.86 | ||||||||
| 817.00 - 897.73 | 12.42 | 0.79 | ||||||||
| 1352003 |
10 | (53) | including | 3.2 | 1.34 | |||||
| 635.90 - 654.17 | 5.48 | 2.09 | ||||||||
| 1352004 |
348 | (53) | including | 1.54 | 4.21 | |||||
| 512.32 - 515.00 | 1.72 | 1.84 | ||||||||
| 16020128 |
135 | (74) | 538.20 - 540.10 | 1.22 | 3.02 | |||||
| a. | All intercepts calculated using a 0.2 g/t Au cutoff and are uncapped; minimum intercept width is 0.5 m; internal dilution is less than 20% total width. |
| a. | Hemlo drill hole nomenclature: Mine level (e.g. 135 for 9135 level) followed by the year (20 for 2020 when the program commenced) then hole number |
| b. | True width of intercepts are calculated based on intersection angle of dominant fabric of rock and core axis. |
The drilling results for Hemlo contained in this MD&A have been prepared in accordance with National Instrument 43-101 – Standards of Disclosure for Mineral Projects. All drill hole assay information has been manually reviewed and approved by staff geologists and re-checked by the project manager. Sample preparation and analyses are conducted by ALS Minerals. Procedures are employed to ensure security of samples during their delivery from the field sites to the laboratory. The quality assurance procedures, data verification and assay protocols used in connection with drilling and sampling at Hemlo conform to industry accepted quality control methods.
| 14 | Alturas - Del Carmen Significant Interceptsa |
| Drill Results from Q1 2021 | ||||||||||
| Drill Holeb | Azimuth | Dip | Interval (m) | Width (m)c | Au (g/t) | |||||
| 22.0 - 67.5 | 45.5 | 1.05 | ||||||||
|
DDH-RGR-038 |
75 | (55) | 205 - 224.7 | 19.7 | 0.86 | |||||
| a. | All significant intercepts reported at 0.25 g/t Au cut-off; include reported at 1 g/t Au cut-off, sub-include at 3 g/t Au cutoff. Internal dilution of no more than 10 consecutive meters below cut-off included in the calculation. Minimum intercept length 10 meters. |
| a. | Alturas - Del Carmen drill hole nomenclature: DDH (diamond drillhole) followed by the prospect (RGR, Rojo Grande) and a correlative number. |
| b. | True widths are uncertain at this stage. |
The drilling results for the Alturas - Del Carmen property contained in this MD&A have been prepared in accordance with National Instrument 43-101 – Standards of Disclosure for Mineral Projects. All drill hole assay information has been manually
| BARRICK FIRST QUARTER 2021 | 95 | MANAGEMENT’S DISCUSSION AND ANALYSIS |
reviewed and approved by staff geologists and re-checked by the project manager. Sample preparation and analyses are conducted by ALS, an independent laboratory. Procedures are employed to ensure security of samples during their delivery from the drill rig to the laboratory. The quality assurance procedures, data verification and assay protocols used in connection with drilling and sampling at Alturas - Del Carmen conform to industry accepted quality control methods.
| 15 | Veladero Significant Interceptsa |
| Drill Results from Q1 2021 | ||||||||||
| Drill Holeb | Azimuth | Dip | Interval (m) | Width (m)c | Au (g/t) | |||||
| 234 - 251 | 17 | 0.68 | ||||||||
| 256 - 265 | 9 | 0.60 | ||||||||
|
DDH-CPE-007 |
90 | (60) | 403 - 415.8 | 12.8 | 0.41 | |||||
|
DDH-CPE-008 |
90 | (60) | 164 - 175 | 11.0 | 0.63 | |||||
| DDH-0953B |
270 | (82) | 205 - 297 | 92 | 1.14 | |||||
| a. | All intercepts calculated using a 0.25 g/t Au cut-off and are uncapped; minimum intercept width is 10 meters; internal dilution is less than 20% total width. |
| a. | Veladero drill hole nomenclature: DDH (Diamond drillhole) followed by the prospect, if corresponds (CPE, Cerro Pelado) and a correlative number. If no prospect if specified, then the hole corresponds to Veladero. |
| b. | Due to the nature of mineralization at Veladero, all widths reported are approximate. |
The drilling results for the Veladero property contained in this MD&A have been prepared in accordance with National Instrument 43-101 – Standards of Disclosure for Mineral Projects. All drill hole assay information has been manually reviewed and approved by staff geologists and re-checked by the Mineral Resources Manager. Sample preparation and analyses are conducted by ALS, an independent laboratory. Procedures are employed to ensure security of samples. The quality assurance procedures, data verification and assay protocols used in connection with drilling and sampling on the Veladero property conform to industry accepted quality control methods.
| 16 | Bambadji Significant Interceptsa |
| Drill Results from Q1 2021 | ||||||||||||||||||
| Includingd | ||||||||||||||||||
| Drill Holeb | Azimuth | Dip | From | To | Width (m)c | Au (g/t) | Interval (m) | Width (m)c | Au (g/t) | |||||||||
| KBWDH006 |
135 | (55) | 88.80 | 141.80 | 53.00 | 2.12 | 97.4-107.1 | 9.70 | 3.85 | |||||||||
| KBWDT017 |
135 | (55) | 247.50 | 268.10 | 20.6 | 2.59 | 257.3-268.1 | 10.80 | 4.05 | |||||||||
| KBWRC038 |
135 | (55) | 136.00 | 152.00 | 16.0 | 2.01 | 145-148 | 3.00 | 6.04 | |||||||||
| 28.00 | 59.00 | 31.0 | 1.03 | |||||||||||||||
| 75.00 | 91.00 | 16.0 | 0.59 | |||||||||||||||
| KBWRC039 |
135 | (55) | 148.00 | 160.00 | 12.0 | 1.11 | ||||||||||||
| SYDH001 |
330 | (50) | 62.00 | 96.00 | 34.0 | 3.11 | 79.1-87 | 7.90 | 7.00 | |||||||||
| GFDH002 |
90 | (50) | 85.15 | 88.30 | 3.1 | 0.76 | ||||||||||||
| 89.00 | 98.00 | 9.0 | 0.77 | |||||||||||||||
| 121.40 | 140.70 | 19.30 | 0.46 | |||||||||||||||
| GFDH003 |
90 | (50) | 160.80 | 189.60 | 28.80 | 0.46 | ||||||||||||
| 5.00 | 13.70 | 8.70 | 1.04 | 9.6-12.9 | 3.30 | 2.19 | ||||||||||||
| 86.80 | 93.30 | 6.50 | 2.3 | |||||||||||||||
| GFDH007 |
90 | (50) | 101.00 | 115.00 | 14.00 | 0.51 | ||||||||||||
| a. | All intercepts calculated using a 0.5 g/t Au cutoff and are uncapped; minimum intercept width is 2m; internal dilution is equal to or less than 2m total width. |
| b. | Drill hole nomenclature: KBW (Kabewest), GF (Gefa), SY (Soya) followed by type of drilling RC (Reverse Circulation) and DH (Diamond Drilling). |
| c. | True widths uncertain at this stage. |
| d. | Includings calculated using a 10.0 g/t Au cutoff and are uncapped; minimum intercept width is 2m; internal dilution is equal to or less than 2m total width. |
The drilling results for the Bambadji property contained in this MD&A have been prepared in accordance with National Instrument 43-101 – Standards of Disclosure for Mineral Projects. All drill hole assay information has been manually reviewed and approved by staff geologists and re-checked by the project manager. Sample preparation and analyses are conducted by SGS Laboratories, an independent laboratory. Procedures are employed to ensure security of samples during their delivery from the drill rig to the laboratory. The quality assurance procedures, data verification and assay protocols used in connection with drilling and sampling on the Bambadji property conform to industry accepted quality control methods.
| BARRICK FIRST QUARTER 2021 | 96 | MANAGEMENT’S DISCUSSION AND ANALYSIS |
| 17 | Loulo-Gounkoto Significant Interceptsa |
| Drill Results from Q1 2021 | ||||||||||
| Drill Holeb | Azimuth | Dip | Interval (m) | Width (m)c | Au (g/t) | |||||
| 2.82 | 47.53-50.35 | 2.21 | ||||||||
| 8.30 | 62-70.3 | 3.38 | ||||||||
| 5.00 | 71.3-76.3 | 0.82 | ||||||||
| 12.05 | 77.35-89.4 | 2.01 | ||||||||
| 6.00 | 91-97 | 7.69 | ||||||||
| 13.95 | 102.6-116.55 | 7.44 | ||||||||
| 2.65 | 118.5-121.15 | 1.32 | ||||||||
| 10.98 | 130.5-141.48 | 2.63 | ||||||||
| 13.80 | 149.5-163.3 | 2.24 | ||||||||
| 6.30 | 173.6-179.9 | 1.27 | ||||||||
| 5.25 | 181.8-187.05 | 2.34 | ||||||||
| YRDH009 |
170.00 | (51.00) | 4.20 | 188.9-193.1 | 1.06 | |||||
| 2.60 | 16.4-19 | 1.40 | ||||||||
| 6.80 | 146.6-153.4 | 1.62 | ||||||||
| 2.33 | 155.27-157.6 | 52.95 | ||||||||
| 2.65 | 161-163.65 | 1.36 | ||||||||
| 3.28 | 167.7-170.98 | 0.83 | ||||||||
| 8.70 | 173.5-182.2 | 13.94 | ||||||||
| 3.90 | 185.4-189.3 | 18.79 | ||||||||
| 5.85 | 193.05-198.9 | 6.34 | ||||||||
| 2.00 | 201.5-203.5 | 1.51 | ||||||||
| 2.90 | 205.7-208.6 | 0.88 | ||||||||
| 2.07 | 210.63-212.7 | 0.90 | ||||||||
| 2.20 | 219.1-221.3 | 1.73 | ||||||||
| 4.90 | 224.35-229.25 | 3.08 | ||||||||
| 2.45 | 242.55-245 | 1.46 | ||||||||
| YRDH010 |
172.00 | (55.00) | 4.05 | 261.55-265.6 | 1.50 | |||||
| 4.30 | 107.2-111.5 | 2.49 | ||||||||
| 4.45 | 155-159.45 | 0.61 | ||||||||
| MNDH002 |
87.00 | (54.14) | 2.25 | 165.4-167.65 | 3.54 | |||||
| a. | All intercepts calculated using a 0.5 g/t Au cutoff and are uncapped; minimum intercept width is 2m; internal dilution is equal to or less than 2m total width. |
| b. | Loulo – Gounkoto drill hole nomenclature: prospect initial YR (Yalea Ridge), MN (Mina) followed by type of drilling RC (Reverse Circulation), DH (Diamond Drilling) RCDH (RC/Diamond Tail) |
| c. | True widths uncertain at this stage. |
The drilling results for the Loulo-Gounkoto property contained in this MD&A have been prepared in accordance with National Instrument 43-101 – Standards of Disclosure for Mineral Projects. All drill hole assay information has been manually reviewed and approved by staff geologists and re-checked by the project manager. Sample preparation and analyses are conducted by SGS Laboratories, an independent laboratory. Industry accepted best practices for preparation and fire assaying procedures are utilized to determine gold content. Procedures are employed to ensure security of samples during their delivery from the drill rig to the laboratory. The quality assurance procedures, data verification and assay protocols used in connection with drilling and sampling on the Loulo property conform to industry accepted quality control methods.
| BARRICK FIRST QUARTER 2021 | 97 | MANAGEMENT’S DISCUSSION AND ANALYSIS |
| 18 | Nielle East Significant Interceptsa |
| Drill Results from Q1 2021 | ||||||||||||||||
| Drill Holeb | Azimuth | Dip | Interval (m) | Width (m)c | Au (g/t) | Includingd
Interval (m) |
Width (m)c | Au (g/t) | ||||||||
| JBRC004 |
120 | (50) | 37.00 - 43.00 | 6.00 | 3.45 | |||||||||||
| JBRC005 |
120 | (50) | 49.00 - 66.00 | 17.00 | 2.69 | |||||||||||
| JBRC006 |
120 | (50) | 64.00 - 72.00 | 8.00 | 6.97 | |||||||||||
| JBAC008 |
120 | (50) | 91.00 - 94.00 | 3.00 | 1.90 | |||||||||||
| SNRC018 |
120 | (50) | 128.00 - 136.00 | 8.00 | 3.14 | |||||||||||
| SNRC019 |
120 | (50) | 120.00 - 143.00 | 23.00 | 4.92 | 130-143 | 13.00 | 8.00 | ||||||||
| 147.00 - 160.00 | 13.00 | 3.21 | ||||||||||||||
| SNRC024 |
120 | (50) | 164.00 - 182.00 | 18.00 | 3.19 | 171-178 | 7.00 | 5.50 | ||||||||
| SNRC025 |
120 | (50) | 4.00 - 18.00 | 14.00 | 3.93 | |||||||||||
| SNRC026 |
120 | (50) | 162.00 - 174.00 | 12.00 | 3.85 | 168-173 | 5.00 | 8.03 | ||||||||
| SNRC027 |
120 | (50) | 60.00 - 102.00 | 42.00 | 5.43 | 79-99 | 20.00 | 7.92 | ||||||||
| a. | All intercepts calculated using a 0.5 g/t Au cutoff and are uncapped; minimum intercept width is 2m; 2m for maximal internal dilution. |
| b. | Nielle drill hole nomenclature: JB (Jubula), SN (Seydou North) followed by type of drilling RC (Reverse Circulation), AC (Air core) |
| c. | True widths uncertain at this stage. |
| d. | Includings calculated using a 3.0 g/t Au cutoff and are uncapped; minimum intercept width is 2m; internal dilution is equal to or less than 25% total width. |
The drilling results for the Nielle property contained in this MD&A have been prepared in accordance with National Instrument 43-101 – Standards of Disclosure for Mineral Projects. All drill hole assay information has been manually reviewed and approved by staff geologists and re-checked by the project manager. Sample preparation and analyses are conducted by SGS Laboratories, an independent laboratory. Procedures are employed to ensure security of samples during their delivery from the drill rig to the laboratory. The quality assurance procedures, data verification and assay protocols used in connection with drilling and sampling on the Nielle property conform to industry accepted quality control methods.
| BARRICK FIRST QUARTER 2021 | 98 | MANAGEMENT’S DISCUSSION AND ANALYSIS |
| 19 | Kibali Significant Interceptsa |
|
Drill Results from Q1 2021
| ||||||||||||||||
| Includingd | ||||||||||||||||
| Drill Holeb | Azimuth | Dip | Interval (m) | Width (m)c | Au (g/t) | Interval (m) | Width (m)c | Au (g/t) | ||||||||
| 304 | (74) | 228.4 - 233.98 | 5.60 | 3.24 | 228.4 - 230.5 | 2.10 | 7.32 | |||||||||
| 304 | (74) | 237.2 - 246.6 | 9.40 | 1.50 | 238.3 - 239.4 | 1.10 | 6.75 | |||||||||
| KVDD0028 |
304 | (74) | 268.32 - 273.3 | 5.00 | 0.67 | |||||||||||
| 304 | (74) | 275.49 - 289.32 | 13.80 | 6.72 | 277.87 - 286.1 | 8.23 | 9.86 | |||||||||
| KVDD0029 |
304 | (74) | 301.5 - 314.15 | 11.70 | 1.62 | 303.5 - 306.5 | 3.00 | 2.83 | ||||||||
| KVDD0030 |
300 | (60) | 71.91 - 76.14 | 4.20 | 2.61 | 74.94 - 76.14 | 1.20 | 6.06 | ||||||||
| 300 | (60) | 194.14 - 197.74 | 3.60 | 1.26 | ||||||||||||
| KVDD0031 |
300 | (60) | 206.14 - 227.54 | 21.40 | 2.15 | 210.94 - 213.94 | 3.00 | 6.20 | ||||||||
| 300 | (60) | 160.94 - 164.84 | 3.90 | 1.91 | ||||||||||||
| KVDD0032 |
300 | (60) | 182.85 - 188 | 5.20 | 8.39 | |||||||||||
| KVDD0033 |
300 | (60) | 286 - 297 | 11.00 | 0.51 | |||||||||||
| KVDD0034 |
304 | (74) | 328 - 342.5 | 14.70 | 3.73 | 331.2 - 340.24 | 9.04 | 5.31 | ||||||||
| 260 | (65) | 70.9 - 72.9 | 2.00 | 1.57 | ||||||||||||
| 260 | (65) | 78.5 - 83.9 | 5.40 | 1.18 | ||||||||||||
| 260 | (65) | 109.5 - 114 | 4.50 | 1.16 | ||||||||||||
| 260 | (65) | 128.9 - 132.4 | 3.50 | 1.05 | ||||||||||||
| PDD174 |
260 | (65) | 156.9 - 167.6 | 10.70 | 1.47 | 162.9 - 166 | 3.10 | 3.60 | ||||||||
| 280 | (50) | 294 - 296 | 2.00 | 1.73 | ||||||||||||
| PDD175 |
280 | (50) | 337 - 345.1 | 8.10 | 0.98 | |||||||||||
| 175 | (60) | 75 - 86.47 | 11.5 | 1.42 | 75 - 77.52 | 2.52 | 3.26 | |||||||||
| 175 | (60) | 117 - 119 | 2 | 0.76 | ||||||||||||
| 175 | (60) | 198.5 - 201.5 | 3 | 0.94 | ||||||||||||
| TDD004 |
175 | (60) | 206.87 - 211 | 4.1 | 0.62 | |||||||||||
| TDD006 |
177 | (60) | 73.9 - 78 | 4.1 | 0.85 | |||||||||||
| 200 | (63) | 2.2 - 6.65 | 4.5 | 0.77 | ||||||||||||
| 200 | (63) | 127.9 - 137.55 | 9.7 | 1.73 | 131.7 - 134.5 | 2.8 | 3.85 | |||||||||
| 200 | (63) | 155.3 - 161 | 5.7 | 1.06 | ||||||||||||
| TDD007 |
200 | (63) | 200 - 209.66 | 9.7 | 0.65 | |||||||||||
| 180 | (65) | 234.83 - 241.94 | 7.1 | 1.66 | 239.33 - 241.94 | 2.61 | 3.19 | |||||||||
| 180 | (65) | 247.49 - 251.46 | 4 | 6.49 | ||||||||||||
| TDD009 |
180 | (65) | 258.8 - 264.3 | 5.5 | 1.65 | 260.62 - 262.5 | 1.88 | 2.35 | ||||||||
| 186 | (65) | 0 - 14 | 14 | 0.81 | ||||||||||||
| 186 | (65) | 20 - 24 | 4 | 3.29 | ||||||||||||
| 186 | (65) | 31 - 44 | 13 | 1.02 | ||||||||||||
| TRC085 |
186 | (65) | 50 - 56 | 6 | 2.74 | 50 - 55 | 5 | 3.01 | ||||||||
| TRC090 |
177 | (60) | 63 - 66 | 3 | 5.22 | 64 - 66 | 2 | 6.4 | ||||||||
| a. | All intercepts calculated using a 0.5 g/t Au cutoff and are uncapped; minimum intercept width is 2m; internal dilution is equal to or less than 25% total width. |
| b. | Kibali drill hole nomenclature: prospect initial (T = Tete Bakangwe) followed by type of drilling RC (Reverse Circulation), DD (Diamond), GC (Grade control) with no designation of the year. KCDU = KCD Underground. |
| c. | True widths uncertain at this stage. |
| d. | All including intercepts are calculated using a 0.5 g/t Au cut-off and are uncapped, minimum intercept width is 1m, no internal dilution, with grade significantly above (>40%) the overall intercept grade. |
The drilling results for the Kibali property contained in this MD&A have been prepared in accordance with National Instrument 43-101 – Standards of Disclosure for Mineral Projects. All drill hole assay information has been manually reviewed and approved by staff geologists and re-checked by the project manager. Sample preparation and analyses are conducted by SGS Laboratories, an independent laboratory. Procedures are employed to ensure security of samples during their delivery from the drill rig to the laboratory. The quality assurance procedures, data verification and assay protocols used in connection with drilling and sampling on the Kibali property conform to industry accepted quality control methods.
| BARRICK FIRST QUARTER 2021 | 99 | MANAGEMENT’S DISCUSSION AND ANALYSIS |
Consolidated Statements of Income
| Barrick Gold Corporation (in millions of United States dollars, except per share data) (Unaudited) |
|
Three months ended March 31, |
||||||||
| 2021 | 2020 | |||||||||
| Revenue (notes 5 and 6) |
$2,956 | $2,721 | ||||||||
| Costs and expenses (income) |
||||||||||
| Cost of sales (notes 5 and 7) |
1,712 | 1,776 | ||||||||
| General and administrative expenses |
38 | 40 | ||||||||
| Exploration, evaluation and project expenses |
61 | 71 | ||||||||
| Impairment reversals (notes 9b and 13) |
(89 | ) | (336 | ) | ||||||
| Loss on currency translation |
4 | 16 | ||||||||
| Closed mine rehabilitation |
23 | 90 | ||||||||
| Income from equity investees (note 12) |
(103 | ) | (54 | ) | ||||||
| Other expense (income) (note 9a) |
19 | (35 | ) | |||||||
| Income before finance costs and income taxes |
$1,291 | $1,153 | ||||||||
| Finance costs, net |
(87 | ) | (104 | ) | ||||||
| Income before income taxes |
$1,204 | $1,049 | ||||||||
| Income tax expense (note 10) |
(374 | ) | (386 | ) | ||||||
| Net income |
$830 | $663 | ||||||||
| Attributable to: |
||||||||||
| Equity holders of Barrick Gold Corporation |
$538 | $400 | ||||||||
| Non-controlling interests (note 17) |
$292 | $263 | ||||||||
| Earnings per share data attributable to the equity holders of Barrick Gold Corporation (note 8) |
||||||||||
| Net income |
||||||||||
| Basic |
$0.30 | $0.22 | ||||||||
| Diluted |
$0.30 | $0.22 | ||||||||
The accompanying notes are an integral part of these condensed interim consolidated financial statements.
| BARRICK FIRST QUARTER 2021 | 100 | FINANCIAL STATEMENTS (UNAUDITED) |
Consolidated Statements
of Comprehensive Income
| Barrick Gold Corporation (in millions of United States dollars) (Unaudited) |
Three months ended March 31, |
| ||||
|
2021 |
|
2020 |
| |||
| Net income |
$830 | $663 | ||||
| Other comprehensive income (loss), net of taxes |
||||||
| Items that may be reclassified subsequently to profit or loss: |
||||||
| Unrealized gains on derivatives designated as cash flow hedges, net of tax $nil and $nil |
— | 1 | ||||
| Currency translation adjustments, net of tax $nil and $nil |
— | (4 | ) | |||
| Items that will not be reclassified to profit or loss: |
||||||
| Actuarial gain on post employment benefit obligations, net of tax $nil and $3 |
— | 3 | ||||
| Net change on equity investments, net of tax $8 and $nil |
(47) | (25 | ) | |||
| Total other comprehensive loss |
(47) | (25 | ) | |||
| Total comprehensive income |
$783 | $638 | ||||
| Attributable to: |
||||||
| Equity holders of Barrick Gold Corporation |
$491 | $375 | ||||
| Non-controlling interests |
$292 | $263 | ||||
The accompanying notes are an integral part of these condensed interim consolidated financial statements.
| BARRICK FIRST QUARTER 2021 | 101 | FINANCIAL STATEMENTS (UNAUDITED) |
Consolidated Statements of Cash Flow
| Barrick Gold Corporation (in millions of United States dollars) (Unaudited) |
|
Three months ended March 31, |
| |||||
| 2021 | 2020 | |||||||
| OPERATING ACTIVITIES |
||||||||
| Net income |
$830 | $663 | ||||||
| Adjustments for the following items: |
||||||||
| Depreciation |
507 | 524 | ||||||
| Finance costs, net |
94 | 111 | ||||||
| Impairment reversals (notes 9b and 13) |
(89 | ) | (336 | ) | ||||
| Income tax expense (note 10) |
374 | 386 | ||||||
| Gain on sale of non-current assets |
(3 | ) | (60 | ) | ||||
| Loss on currency translation |
4 | 16 | ||||||
| Change in working capital (note 11) |
(102 | ) | (332 | ) | ||||
| Other operating activities (note 11) |
(93 | ) | 53 | |||||
| Operating cash flows before interest and income taxes |
1,522 | 1,025 | ||||||
| Interest paid |
(22 | ) | (24 | ) | ||||
| Income taxes paid1 |
(198 | ) | (112 | ) | ||||
| Net cash provided by operating activities |
1,302 | 889 | ||||||
| INVESTING ACTIVITIES |
||||||||
| Property, plant and equipment |
||||||||
| Capital expenditures (note 5) |
(539 | ) | (451 | ) | ||||
| Sales proceeds |
4 | 7 | ||||||
| Divestitures (note 4) |
— | 256 | ||||||
| Other investing activities (note 11) |
127 | 25 | ||||||
| Net cash used in investing activities |
(408 | ) | (163 | ) | ||||
| FINANCING ACTIVITIES |
||||||||
| Lease repayments |
(6 | ) | (5 | ) | ||||
| Debt repayments |
(7 | ) | (351 | ) | ||||
| Dividends |
(158) | (122) | ||||||
| Funding from non-controlling interests (note 17) |
6 | 1 | ||||||
| Disbursements to non-controlling interests (note 17) |
(265 | ) | (217 | ) | ||||
| Other financing activities (note 11) |
21 | (15 | ) | |||||
| Net cash used in financing activities |
(409 | ) | (709 | ) | ||||
| Effect of exchange rate changes on cash and equivalents |
(1 | ) | (4 | ) | ||||
| Net increase in cash and equivalents |
484 | 13 | ||||||
| Cash and equivalents at the beginning of period |
5,188 | 3,314 | ||||||
| Cash and equivalents at the end of period |
$5,672 | $3,327 | ||||||
| 1 | Income taxes paid excludes $36 million (March 31, 2020: $24 million) of income taxes payable that were settled against offsetting VAT receivables. |
The accompanying notes are an integral part of these condensed interim consolidated financial statements.
| BARRICK FIRST QUARTER 2021 | 102 | FINANCIAL STATEMENTS (UNAUDITED) |
Consolidated Balance Sheets
| Barrick Gold Corporation (in millions of United States dollars) (Unaudited) |
As at March 31, 2021 |
|
As at December 31, 2020 |
| ||
| ASSETS |
||||||
| Current assets |
||||||
| Cash and equivalents (note 14a) |
$5,672 | $5,188 | ||||
| Accounts receivable |
530 | 558 | ||||
| Inventories |
1,776 | 1,878 | ||||
| Other current assets |
470 | 519 | ||||
| Total current assets (excluding assets classified as held for sale) |
$8,448 | $8,143 | ||||
| Assets classified as held for sale (note 4a) |
336 | — | ||||
| Total current assets |
$8,784 | $8,143 | ||||
| Non-current assets |
||||||
| Equity in investees (note 12) |
4,646 | 4,670 | ||||
| Property, plant and equipment |
24,628 | 24,628 | ||||
| Goodwill |
4,769 | 4,769 | ||||
| Intangible assets |
168 | 169 | ||||
| Deferred income tax assets |
58 | 98 | ||||
| Non-current portion of inventory |
2,482 | 2,566 | ||||
| Other assets |
1,313 | 1,463 | ||||
| Total assets |
$46,848 | $46,506 | ||||
| LIABILITIES AND EQUITY |
||||||
| Current liabilities |
||||||
| Accounts payable |
$1,168 | $1,458 | ||||
| Debt |
13 | 20 | ||||
| Current income tax liabilities |
606 | 436 | ||||
| Other current liabilities |
271 | 306 | ||||
| Total current liabilities (excluding liabilities classified as held for sale) |
$2,058 | $2,220 | ||||
| Liabilities classified as held for sale (note 4a) |
273 | — | ||||
| Total current liabilities |
$2,331 | $2,220 | ||||
| Non-current liabilities |
||||||
| Debt |
5,140 | 5,135 | ||||
| Provisions |
2,926 | 3,139 | ||||
| Deferred income tax liabilities |
3,085 | 3,034 | ||||
| Other liabilities |
1,287 | 1,268 | ||||
| Total liabilities |
$14,769 | $14,796 | ||||
| Equity |
||||||
| Capital stock (note 16) |
$29,238 | $29,236 | ||||
| Deficit |
(7,571) | (7,949 | ) | |||
| Accumulated other comprehensive loss |
(33) | 14 | ||||
| Other |
2,040 | 2,040 | ||||
| Total equity attributable to Barrick Gold Corporation shareholders |
$23,674 | $23,341 | ||||
|
Non-controlling interests (note 17) |
8,405 | 8,369 | ||||
| Total equity |
$32,079 | $31,710 | ||||
| Contingencies and commitments (notes 5 and 18) |
||||||
| Total liabilities and equity |
$46,848 | $46,506 | ||||
The accompanying notes are an integral part of these condensed interim consolidated financial statements.
| BARRICK FIRST QUARTER 2021 | 103 | FINANCIAL STATEMENTS (UNAUDITED) |
Consolidated Statements of Changes in Equity
|
Barrick Gold Corporation |
|
Attributable to equity holders of the company |
|
|||||||||||||||||||||||||||||
| (in millions of United States dollars) (Unaudited) |
|
Common Shares (in thousands) |
|
|
Capital stock |
|
|
Retained earnings (deficit) |
|
|
Accumulated other comprehensive income (loss)1 |
|
Other | 2 | |
Total equity attributable to shareholders |
|
|
Non- controlling interests |
|
|
Total equity |
| |||||||||
| At January 1, 2021 |
1,778,190 | $29,236 | ($7,949 | ) | $14 | $2,040 | $23,341 | $8,369 | $31,710 | |||||||||||||||||||||||
| Net income |
— | — | 538 | — | — | 538 | 292 | 830 | ||||||||||||||||||||||||
| Total other comprehensive income (loss) |
— | — | — | (47 | ) | — | (47 | ) | — | (47 | ) | |||||||||||||||||||||
| Total comprehensive income (loss) |
— | — | 538 | (47 | ) | — | 491 | 292 | 783 | |||||||||||||||||||||||
| Transactions with owners |
||||||||||||||||||||||||||||||||
| Dividends |
— | — | (158 | ) | — | — | (158 | ) | — | (158 | ) | |||||||||||||||||||||
| Issued on exercise of stock options |
50 | — | — | — | — | — | — | — | ||||||||||||||||||||||||
| Funding from non-controlling interests (note 17) |
— | — | — | — | — | — | 6 | 6 | ||||||||||||||||||||||||
| Disbursements to non-controlling interests (note 17) |
— | — | — | — | — | — | (262 | ) | (262 | ) | ||||||||||||||||||||||
| Dividend reinvestment plan (note 16) |
72 | 2 | (2 | ) | — | — | — | — | — | |||||||||||||||||||||||
| Share-based payments |
59 | — | — | — | — | — | — | — | ||||||||||||||||||||||||
| Total transactions with owners |
181 | 2 | (160 | ) | — | — | (158 | ) | (256 | ) | (414 | ) | ||||||||||||||||||||
| At March 31, 2021 |
1,778,371 | $29,238 | ($7,571 | ) | ($33 | ) | $2,040 | $23,674 | $8,405 | $32,079 | ||||||||||||||||||||||
| At January 1, 2020 |
1,777,927 | $29,231 | ($9,722 | ) | ($122 | ) | $2,045 | $21,432 | $8,395 | $29,827 | ||||||||||||||||||||||
| Net income |
— | — | 400 | — | — | 400 | 263 | 663 | ||||||||||||||||||||||||
| Total other comprehensive income (loss) |
— | — | — | (25 | ) | — | (25 | ) | — | (25 | ) | |||||||||||||||||||||
| Total comprehensive income (loss) |
— | — | 400 | (25 | ) | — | 375 | 263 | 638 | |||||||||||||||||||||||
| Transactions with owners |
||||||||||||||||||||||||||||||||
| Dividends |
— | — | (122 | ) | — | — | (122 | ) | — | (122 | ) | |||||||||||||||||||||
| Issuance of 16% interest in Tanzania mines |
— | — | — | — | — | — | 234 | 234 | ||||||||||||||||||||||||
| Issued on exercise of stock options |
30 | — | — | — | — | — | — | — | ||||||||||||||||||||||||
| Funding from non-controlling interests |
— | — | — | — | — | — | 1 | 1 | ||||||||||||||||||||||||
| Disbursements to non-controlling interests |
— | — | — | — | — | — | (225 | ) | (225 | ) | ||||||||||||||||||||||
| Dividend reinvestment plan |
78 | 2 | (2 | ) | — | — | — | — | — | |||||||||||||||||||||||
| Share-based payments |
— | — | — | — | 2 | 2 | — | 2 | ||||||||||||||||||||||||
| Total transactions with owners |
108 | 2 | (124 | ) | — | 2 | (120 | ) | 10 | (110 | ) | |||||||||||||||||||||
| At March 31, 2020 |
1,778,035 | $29,233 | ($9,446 | ) | ($147 | ) | $2,047 | $21,687 | $8,668 | $30,355 | ||||||||||||||||||||||
| 1 | Includes cumulative translation losses at March 31, 2021: $95 million (December 31, 2020: $95 million; March 31, 2020: $92 million). |
| 2 | Includes additional paid-in capital as at March 31, 2021: $2,002 million (December 31, 2020: $2,002 million; March 31, 2020: $2,009 million). |
The accompanying notes are an integral part of these condensed interim consolidated financial statements.
| BARRICK FIRST QUARTER 2021 | 104 | FINANCIAL STATEMENTS (UNAUDITED) |
Notes to Consolidated Financial Statements
Barrick Gold Corporation. Tabular dollar amounts in millions of United States dollars, unless otherwise shown.
| BARRICK FIRST QUARTER 2021 | 105 | NOTES TO FINANCIAL STATEMENTS (UNAUDITED) |
| BARRICK FIRST QUARTER 2021 | 106 | NOTES TO FINANCIAL STATEMENTS (UNAUDITED) |
5 ∎ Segment Information
Barrick’s business is organized into eighteen minesites and one project. Barrick’s Chief Operating Decision Maker (“CODM”) (Mark Bristow, President and Chief Executive Officer) reviews the operating results, assesses performance and makes capital allocation decisions at the minesite, Company and/or project level. Each individual minesite and the Pascua-Lama project are operating segments for financial reporting purposes. Our presentation of our reportable operating segments consists of nine gold mines (Carlin, Cortez, Turquoise Ridge, Pueblo Viejo, Loulo-Gounkoto, Kibali, Veladero, North Mara and Bulyanhulu). Starting in the first quarter of 2021, Goldrush was included as part of Cortez as the CODM began reviewing the operating results and assessing performance on a combined level. The remaining operating segments, including our remaining gold mines, copper mines and project, have been grouped into an “other” category and will not be reported on individually. Segment performance is evaluated based on a number of measures including operating income before tax, production levels and unit production costs. Certain costs are managed on a consolidated basis and are therefore not reflected in segment income. Prior period figures have been restated to reflect the changes made to our reportable operating segments in the current year.
Consolidated Statement of Income Information
| Cost of Sales | ||||||||||||||||||||||||
| For the three months ended March 31, 2021 |
Revenue | |
Site operating costs, royalties and community relations |
|
Depreciation | |
Exploration, evaluation and project expenses |
|
|
Other expenses (income)1 |
|
|
Segment income (loss) |
| ||||||||||
| Carlin2 |
$663 | $288 | $68 | $3 | ($1 | ) | $305 | |||||||||||||||||
| Cortez2 |
292 | 143 | 64 | 3 | 1 | 81 | ||||||||||||||||||
| Turquoise Ridge2 |
269 | 100 | 51 | — | — | 118 | ||||||||||||||||||
| Pueblo Viejo2 |
420 | 130 | 61 | 1 | 1 | 227 | ||||||||||||||||||
| Loulo-Gounkoto2 |
337 | 115 | 69 | 4 | 8 | 141 | ||||||||||||||||||
| Kibali |
154 | 60 | 32 | — | (1 | ) | 63 | |||||||||||||||||
| Veladero |
57 | 24 | 11 | — | — | 22 | ||||||||||||||||||
| North Mara2 |
119 | 56 | 15 | — | 1 | 47 | ||||||||||||||||||
| Bulyanhulu2 |
50 | 28 | 12 | — | 1 | 9 | ||||||||||||||||||
| Other Mines2 |
687 | 299 | 142 | 3 | 15 | 228 | ||||||||||||||||||
| Reportable segment total |
$3,048 | $1,243 | $525 | $14 | $25 | $1,241 | ||||||||||||||||||
| Share of equity investees |
(154 | ) | (60 | ) | (32 | ) | — | 1 | (63 | ) | ||||||||||||||
| Segment total |
$2,894 | $1,183 | $493 | $14 | $26 | $1,178 | ||||||||||||||||||
| Consolidated Statement of Income Information
|
|
|||||||||||||||||||||||
| Cost of Sales | ||||||||||||||||||||||||
| For the three months ended March 31, 2020 |
Revenue | |
Site operating costs, royalties and community relations |
|
Depreciation | |
Exploration, evaluation and project expenses |
|
|
Other expenses (income)1 |
|
|
Segment income (loss) |
| ||||||||||
| Carlin2 |
$662 | $324 | $80 | $3 | $6 | $249 | ||||||||||||||||||
| Cortez2 |
330 | 128 | 54 | 2 | 2 | 144 | ||||||||||||||||||
| Turquoise Ridge2 |
226 | 96 | 51 | 1 | 2 | 76 | ||||||||||||||||||
| Pueblo Viejo2 |
374 | 132 | 53 | 3 | 2 | 184 | ||||||||||||||||||
| Loulo-Gounkoto2 |
243 | 94 | 59 | 2 | 3 | 85 | ||||||||||||||||||
| Kibali |
140 | 52 | 41 | 1 | (2 | ) | 48 | |||||||||||||||||
| Veladero |
90 | 45 | 22 | — | (1 | ) | 24 | |||||||||||||||||
| North Mara2 |
132 | 54 | 25 | — | (5 | ) | 58 | |||||||||||||||||
| Bulyanhulu2 |
14 | 6 | 8 | — | 12 | (12 | ) | |||||||||||||||||
| Other Mines2 |
610 | 352 | 157 | 4 | (1 | ) | 98 | |||||||||||||||||
| Reportable segment total |
$2,821 | $1,283 | $550 | $16 | $18 | $954 | ||||||||||||||||||
| Share of equity investees |
(140 | ) | (52 | ) | (41 | ) | (1 | ) | 2 | (48 | ) | |||||||||||||
| Segment total |
$2,681 | $1,231 | $509 | $15 | $20 | $906 | ||||||||||||||||||
| 1 | Includes accretion expense, which is included within finance costs, net in the consolidated statement of income. For the three months ended March 31, 2021, accretion expense was $5 million (2020: $8 million). |
| 2 | Includes the non-controlling interest portion of revenues, cost of sales and segment income for the three months ended March 31, 2021 for Nevada Gold Mines $557 million, $318 million, $236 million (2020: $536 million, $330 million, $200 million), Pueblo Viejo $174 million, $76 million, $98 million (2020: $158 million, $74 million, $82 million), Loulo-Gounkoto $67 million, $37 million, $28 million (2020: $49 million, $31 million, $17 million), North Mara, Bulyanhulu and Buzwagi $32 million, $23 million, $8 million (2020: $31 million, $22 million, $8 million) and Tongon $10 million, $8 million, $1 million (2020: $11 million, $9 million, $1 million). |
| BARRICK FIRST QUARTER 2021 | 107 | NOTES TO FINANCIAL STATEMENTS (UNAUDITED) |
Reconciliation of Segment Income to Income Before Income Taxes
| For the three months ended March 31 |
| |||||
| 2021 | 2020 | |||||
| Segment income |
$1,178 | $906 | ||||
| Other revenue |
62 | 40 | ||||
| Other cost of sales/amortization |
(36) | (36 | ) | |||
| Exploration, evaluation and project expenses not attributable to segments |
(47) | (56 | ) | |||
| General and administrative expenses |
(38) | (40 | ) | |||
| Other income not attributable to segments |
1 | 54 | ||||
| Impairment reversals |
89 | 336 | ||||
| Loss on currency translation |
(4) | (16 | ) | |||
| Closed mine rehabilitation |
(23) | (90 | ) | |||
| Income from equity investees |
103 | 54 | ||||
| Finance costs, net (includes non-segment accretion) |
(82) | (96 | ) | |||
| Gain (loss) on non-hedge derivatives |
1 | (7 | ) | |||
| Income before income taxes |
$1,204 | $1,049 | ||||
| Capital Expenditures Information
|
||||||
| Segment capital expenditures1 | ||||||
| For the three months ended March 31 |
| |||||
| 2021 | 2020 | |||||
| Carlin |
$92 | $93 | ||||
| Cortez |
62 | 102 | ||||
| Turquoise Ridge |
33 | 30 | ||||
| Pueblo Viejo |
101 | 28 | ||||
| Loulo-Gounkoto |
70 | 39 | ||||
| Kibali |
11 | 15 | ||||
| Veladero |
40 | 26 | ||||
| North Mara |
18 | 15 | ||||
| Bulyanhulu |
15 | 4 | ||||
| Other Mines |
74 | 65 | ||||
| Reportable segment total |
$516 | $417 | ||||
| Other items not allocated to segments |
24 | 19 | ||||
| Total |
$540 | $436 | ||||
| Share of equity investees |
(11) | (15 | ) | |||
| Total |
$529 | $421 | ||||
| 1 | Segment capital expenditures are presented for internal management reporting purposes on an accrual basis. Capital expenditures in the Consolidated Statements of Cash Flow are presented on a cash basis. For the three months ended March 31, 2021, cash expenditures were $539 million (2020: $451 million) and the decrease in accrued expenditures was $10 million (2020: $30 million decrease). |
Purchase Commitments
At March 31, 2021, we had purchase obligations for supplies and consumables of $1,654 million (December 31, 2020: $1,882 million).
Capital Commitments
In addition to entering into various operational commitments in the normal course of business, we had capital commitments of $222 million at March 31, 2021 (December 31, 2020: $223 million).
| BARRICK FIRST QUARTER 2021 | 108 | NOTES TO FINANCIAL STATEMENTS (UNAUDITED) |
6 ∎ Revenue
|
For the three months ended March 31 |
| |||||
|
2021 |
|
2020 |
| |||
| Gold sales |
||||||
| Spot market sales |
$2,615 | $2,555 | ||||
| Concentrate sales |
29 | 38 | ||||
| Provisional pricing adjustments |
(3) | — | ||||
| $2,641 | $2,593 | |||||
| Copper sales |
||||||
| Concentrate sales |
$211 | $123 | ||||
| Provisional pricing adjustments |
45 | (24 | ) | |||
| $256 | $99 | |||||
| Other sales1 |
59 | 29 | ||||
| Total |
$2,956 | $2,721 | ||||
| 1 | Revenues include the sale of by-products for our gold and copper mines. |
7 ∎ Cost of Sales
| Gold | Copper | Other3 | Total | |||||||||||||||||||||||||||||
| For the three months ended March 31 |
2021 | 2020 | 2021 | 2020 | 2021 | 2020 | 2021 | 2020 | ||||||||||||||||||||||||
| Site operating costs1,2 |
$1,020 | $1,080 | $65 | $69 | $— | $2 | $1,085 | $1,151 | ||||||||||||||||||||||||
| Depreciation |
454 | 474 | 48 | 43 | 5 | 7 | 507 | 524 | ||||||||||||||||||||||||
| Royalty expense |
93 | 84 | 23 | 11 | — | — | 116 | 95 | ||||||||||||||||||||||||
| Community relations |
4 | 5 | — | 1 | — | — | 4 | 6 | ||||||||||||||||||||||||
| $1,571 | $1,643 | $136 | $124 | $5 | $9 | $1,712 | $1,776 | |||||||||||||||||||||||||
| 1 | Site operating costs includes charges to reduce the cost of inventory to net realizable value as follows: $14 million for the three months ended March 31, 2021 (2020: $17 million). |
| 2 | Site operating costs includes the costs of extracting by-products. |
| 3 | Other includes realized hedge gains and losses and corporate amortization. |
8 ∎ Earnings Per Share
| For the three months ended March 31 | ||||||||||||||||
| 2021 | 2020 | |||||||||||||||
| Basic | Diluted | Basic | Diluted | |||||||||||||
| Net income |
$830 | $830 | $663 | $663 | ||||||||||||
| Net income attributable to non-controlling interests |
(292 | ) | (292 | ) | (263 | ) | (263 | ) | ||||||||
| Net income attributable to equity holders of Barrick Gold Corporation |
$538 | $538 | $400 | $400 | ||||||||||||
| Weighted average shares outstanding |
1,778 | 1,778 | 1,778 | 1,778 | ||||||||||||
| Basic and diluted earnings per share data attributable to the equity holders of Barrick Gold Corporation |
$0.30 | $0.30 | $0.22 | $0.22 | ||||||||||||
| BARRICK FIRST QUARTER 2021 | 109 | NOTES TO FINANCIAL STATEMENTS (UNAUDITED) |
| BARRICK FIRST QUARTER 2021 | 110 | NOTES TO FINANCIAL STATEMENTS (UNAUDITED) |
11 ∎ Cash Flow - Other Items
| Operating Cash Flows – Other Items |
For the three months ended March 31 |
| ||||
| 2021 | 2020 | |||||
| Adjustments for non-cash income statement items: |
||||||
| Loss (gain) on non-hedge derivatives |
($1) | $7 | ||||
| Loss on warrant investments at FVPL |
5 | — | ||||
| Share-based compensation expense |
13 | 17 | ||||
| Income from investment in equity investees |
(103) | (54 | ) | |||
| Change in estimate of rehabilitation costs at closed mines |
23 | 90 | ||||
| Net inventory impairment charges |
14 | 17 | ||||
| Change in other assets and liabilities |
(22) | (4 | ) | |||
| Settlement of rehabilitation obligations |
(22) | (20 | ) | |||
| Other operating activities |
($93) | $53 | ||||
| Cash flow arising from changes in: |
||||||
| Accounts receivable |
$35 | ($8 | ) | |||
| Inventory |
(20) | (84 | ) | |||
| Other current assets |
(7) | (106 | ) | |||
| Accounts payable |
(101) | (79 | ) | |||
| Other current liabilities |
(9) | (55 | ) | |||
| Change in working capital |
($102) | ($332 | ) | |||
| Investing Cash Flows – Other Items |
For the three months ended March 31 |
| ||||
| 2021 | 2020 | |||||
| Dividends received from equity method investments |
$126 | $25 | ||||
| Shareholder loan repayments from equity method investments |
1 | — | ||||
| Other investing activities |
$127 | $25 | ||||
| Financing Cash Flows – Other Items |
For the three months ended March 31 |
| ||||
| 2021 | 2020 | |||||
| Pueblo Viejo JV partner shareholder loan |
$21 | $— | ||||
| Debt extinguishment costs |
— | (15 | ) | |||
| Other financing activities |
$21 | ($15 | ) | |||
12 ∎ Equity Accounting Method Investment Continuity
| Kibali | Jabal Sayid | Zaldívar | Other | Total | ||||||||||||||||
| At January 1, 2020 |
$3,218 | $296 | $955 | $58 | $4,527 | |||||||||||||||
| Equity pick-up from equity investees |
201 | 74 | 12 | 1 | 288 | |||||||||||||||
| Dividends received |
(140 | ) | — | — | (1 | ) | (141 | ) | ||||||||||||
| Shareholder loan repayment |
— | (1 | ) | — | (3 | ) | (4 | ) | ||||||||||||
| At December 31, 2020 |
$3,279 | $369 | $967 | $55 | $4,670 | |||||||||||||||
| Equity pick-up from equity investees |
51 | 35 | 17 | — | 103 | |||||||||||||||
| Dividends received |
(36 | ) | (25 | ) | (65 | ) | — | (126 | ) | |||||||||||
| Shareholder loan repayment |
— | — | — | (1 | ) | (1 | ) | |||||||||||||
| At March 31, 2021 |
$3,294 | $379 | $919 | $54 | $4,646 | |||||||||||||||
| BARRICK FIRST QUARTER 2021 | 111 | NOTES TO FINANCIAL STATEMENTS (UNAUDITED) |
| BARRICK FIRST QUARTER 2021 | 112 | NOTES TO FINANCIAL STATEMENTS (UNAUDITED) |
15 ∎ Fair Value Measurements
| BARRICK FIRST QUARTER 2021 | 113 | NOTES TO FINANCIAL STATEMENTS (UNAUDITED) |
17 ∎ Non-controlling Interests Continuity
| Nevada Gold Mines |
Pueblo Viejo |
Tanzania Mines1 |
Loulo- Gounkoto |
Tongon | Other | Total | ||||||||||||||||||||||
| NCI in subsidiary at December 31, 2020 |
38.5 | % | 40 | % | 16 | % | 20 | % | 10.3 | % | Various | |||||||||||||||||
| At January 1, 2020 |
$6,039 | $1,424 | $— | $901 | $47 | ($16 | ) | $8,395 | ||||||||||||||||||||
| Share of income (loss) |
965 | 196 | 57 | 68 | 9 | (5 | ) | 1,290 | ||||||||||||||||||||
| Cash contributed |
— | — | — | — | — | 11 | 11 | |||||||||||||||||||||
| Increase in non-controlling interest |
— | — | 251 | — | — | — | 251 | |||||||||||||||||||||
| Disbursements |
(1,026 | ) | (427 | ) | (45 | ) | (36 | ) | (17 | ) | (27 | ) | (1,578 | ) | ||||||||||||||
| At December 31, 2020 |
$5,978 | $1,193 | $263 | $933 | $39 | ($37 | ) | $8,369 | ||||||||||||||||||||
| Share of income (loss) |
208 | 59 | 6 | 18 | 1 | — | 292 | |||||||||||||||||||||
| Cash contributed |
— | — | — | — | — | 6 | 6 | |||||||||||||||||||||
| Disbursements |
(202 | ) | (37 | ) | — | (16 | ) | — | (7 | ) | (262 | ) | ||||||||||||||||
| At March 31, 2021 |
$5,984 | $1,215 | $269 | $935 | $40 | ($38 | ) | $8,405 | ||||||||||||||||||||
| 1 | Tanzania mines consist of North Mara, Bulyanhulu and Buzwagi. |
| BARRICK FIRST QUARTER 2021 | 114 | NOTES TO FINANCIAL STATEMENTS (UNAUDITED) |
| BARRICK FIRST QUARTER 2021 | 115 | NOTES TO FINANCIAL STATEMENTS (UNAUDITED) |
Cautionary Statement on Forward-Looking Information
Serious News for Serious Traders! Try StreetInsider.com Premium Free!
You May Also Be Interested In
- European stocks rise; Tesla earnings boost global sentiment
- BrightFocus Foundation Announces $10M in New Funding Across Brain and Vision Research, Celebrates Historic Diversity of Grant Award Recipients
- Barrick Gold (ABX:CN) (ABX) PT Lowered to Cdn$28 at National Bank Financial
Create E-mail Alert Related Categories
SEC FilingsSign up for StreetInsider Free!
Receive full access to all new and archived articles, unlimited portfolio tracking, e-mail alerts, custom newswires and RSS feeds - and more!
