

Form 6-K BARRICK GOLD CORP For: Jun 30
 Tweet
Tweet Share
ShareExhibit 99.1

SOLID OPERATING PERFORMANCE MAINTAINS PRODUCTION WITHIN GUIDANCE
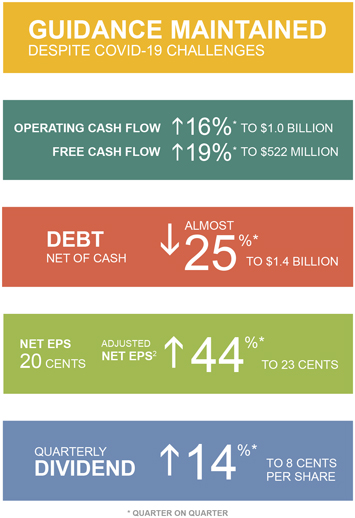

Key Performance Indicators
| BARRICK SECOND QUARTER 2020 |
2 | PRESS RELEASE |
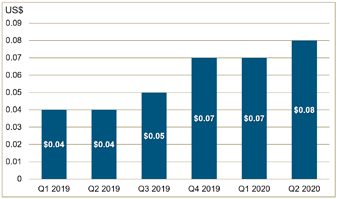
QUARTERLY DIVIDEND INCREASED BY 14%
| BARRICK SECOND QUARTER 2020 |
3 | PRESS RELEASE |
STRONG STRUCTURE, PARTNERSHIP CULTURE
DRIVE PROMPT AND EFFECTIVE
PANDEMIC RESPONSE
A fit-for-purpose management structure coupled with its deeply embedded health and welfare commitment enabled Barrick to buffer the impact of the Covid-19 pandemic on its business, people and communities as well as to provide vital support to its host governments.
| BARRICK SECOND QUARTER 2020 |
4 | PRESS RELEASE |
TANZANIA MINES FOCUS ON SOCIAL LICENSE
AND REBUILDING MINING OPERATIONS
When Barrick took over the Acacia assets in Tanzania in September last year, it was faced with a clean-up of Herculean proportions:

CORTEZ LEADS THE WAY IN NEVADA
Cortez continues to produce higher than planned ounces at a lower cost, confirming its status as Nevada Gold Mines’ flagship as well as the leader in the general move from lower grade open pit operations to higher grade underground mining.
| BARRICK SECOND QUARTER 2020 |
5 | PRESS RELEASE |
EXPLORATION MAINTAINS BARRICK’S
FOCUS ON THE FUTURE
There were significant drill results from all regions during the past quarter.
Despite the challenges presented by the Covid-19 pandemic, Barrick’s exploration teams have continued to add to the mineral inventory that is needed to sustain a profitable mining enterprise.
| BARRICK SECOND QUARTER 2020 |
6 | PRESS RELEASE |
RECRUITING AND DEVELOPING A NEW
GENERATION OF LEADERS

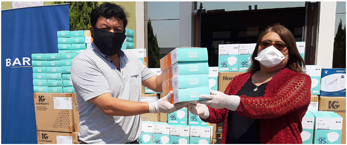
Janet Camilo (left), the Dominican Republic’s Minister of Women, and Inka Mattila (right), UNDP resident representative, present the Gold Seal of Igualando RD to Juana Barceló (centre), Pueblo Viejo President, at a ceremony lauding the mine’s commitment to and progress in advancing gender equality in the workplace.
Barrick employs more than 20,000 people along with another 21,000 contractors in 12 countries across the world, and its recruitment and development policies are designed to ensure that they can be the best of the best.
| BARRICK SECOND QUARTER 2020 |
7 | PRESS RELEASE |
Appendix 1
2020 Operating and Capital Expenditure Guidance
| GOLD PRODUCTION AND COSTS |
||||||||||||||||
| 2020 forecast attributable production (000s oz) |
2020 forecast cost of sales15 ($/oz) |
2020 forecast total cash costs8 ($/oz) |
2020 forecast all-in sustaining costs8 ($/oz) |
|||||||||||||
| Carlin (61.5%)16 |
1,000 - 1,050 | 920 - 970 | 760 - 810 | 1,000 - 1,050 | ||||||||||||
| Cortez (61.5%) |
450 - 480 | 980 - 1,030 | 640 - 690 | 910 - 960 | ||||||||||||
| Turquoise Ridge (61.5%) |
430 - 460 | 900 - 950 | 540 - 590 | 690 - 740 | ||||||||||||
| Phoenix (61.5%) |
100 - 120 | 1,850 - 1,900 | 700 - 750 | 920 - 970 | ||||||||||||
| Long Canyon (61.5%) |
130 - 150 | 910 - 960 | 240 - 290 | 450 - 500 | ||||||||||||
| Nevada Gold Mines (61.5%) |
2,100 - 2,250 | 970 - 1,020 | 660 - 710 | 880 - 930 | ||||||||||||
| Hemlo |
200 - 220 | 960 - 1,010 | 800 - 850 | 1,200 - 1,250 | ||||||||||||
| North America |
2,300 - 2,450 | 970 - 1,020 | 660 - 710 | 900 - 950 | ||||||||||||
| Pueblo Viejo (60%) |
530 - 580 | 840 - 890 | 520 - 570 | 720 - 770 | ||||||||||||
| Veladero (50%) |
240 - 270 | 1,220 - 1,270 | 670 - 720 | 1,250 - 1,300 | ||||||||||||
| Porgera (47.5%)17 |
||||||||||||||||
| Latin America & Asia Pacific |
800 - 900 | 930 - 980 | 610 - 660 | 890 - 940 | ||||||||||||
| Loulo-Gounkoto (80%) |
500 - 540 | 1,050 - 1,100 | 620 - 670 | 970 - 1,020 | ||||||||||||
| Kibali (45%) |
340 - 370 | 1,030 - 1,080 | 600 - 650 | 790 - 840 | ||||||||||||
| North Mara (84%)18 |
240 - 270 | 750 - 800 | 570 - 620 | 830 - 880 | ||||||||||||
| Tongon (89.7%) |
240 - 260 | 1,390 - 1,440 | 680 - 730 | 740 - 790 | ||||||||||||
| Bulyanhulu (84%)18 |
30 - 50 | 1,210 - 1,260 | 790 - 840 | 1,110 - 1,160 | ||||||||||||
| Buzwagi (84%)18 |
80 - 100 | 850 - 900 | 820 - 870 | 850 - 900 | ||||||||||||
|
Africa & Middle East
|
|
1,450 - 1,600
|
|
|
1,040 - 1,090
|
|
|
640 - 690
|
|
|
870 - 920
|
| ||||
| Total Attributable to Barrick18,19,20 |
4,600 - 5,000 | 980 - 1,030 | 650 - 700 | 920 - 970 | ||||||||||||
| COPPER PRODUCTION AND COSTS |
||||||||||||||||
| 2020 forecast attributable production (Mlbs) |
2020 forecast cost of sales15 ($/lb) |
2020 forecast C1 cash costs11 ($/lb) |
2020 forecast
all-in sustaining costs11 ($/lb) |
|||||||||||||
| Lumwana |
250 - 280 | 2.20 - 2.40 | 1.50 - 1.70 | 2.30 - 2.60 | ||||||||||||
| Zaldívar (50%) |
120 - 135 | 2.40 - 2.70 | 1.65 - 1.85 | 2.30 - 2.60 | ||||||||||||
| Jabal Sayid (50%) |
60 - 70 | 1.75 - 2.00 | 1.40 - 1.60 | 1.50 - 1.70 | ||||||||||||
| Total Copper21 |
440 - 500 | 2.10 - 2.40 | 1.50 - 1.80 | 2.20 - 2.50 | ||||||||||||
| ATTRIBUTABLE CAPITAL EXPENDITURES |
||||
| ($ millions) | ||||
| Attributable minesite sustaining |
1,300 - 1,500 | |||
| Attributable project |
300 - 400 | |||
| Total attributable capital expenditures22 |
1,600 - 1,900 | |||
2020 Outlook Assumptions and Economic Sensitivity Analysis23
| 2020 Guidance | Impact on EBITDA | |||||||
| Assumption | Hypothetical Change | (millions)24 | Impact on AISC8,11 | |||||
| Gold revenue, net of royalties25 |
$1,350/oz | +$100/oz | +$655 | +$4/oz | ||||
| $1,350/oz | -$100/oz | -$652 | -$4/oz | |||||
| Copper revenue, net of royalties |
$2.75/lb | +/- $0.50/lb | +/-$125 | +/- $0.02/lb | ||||
| BARRICK SECOND QUARTER 2020 |
8 | PRESS RELEASE |
Appendix 2
Production and Cost Summary - Gold
| For the three months ended | ||||||||||||||||||||
| 6/30/20 | 3/31/20 | % Change | 6/30/19 | % Change | ||||||||||||||||
| Nevada Gold Mines LLC (61.5%)a |
||||||||||||||||||||
| Gold produced (000s oz attributable basis) |
521 | 526 | (1)% | 526 | (1)% | |||||||||||||||
| Gold produced (000s oz 100% basis) |
847 | 855 | (1)% | 548 | 55 % | |||||||||||||||
| Cost of sales ($/oz) |
1,055 | 995 | 6 % | 842 | 25 % | |||||||||||||||
| Total cash costs ($/oz)b |
728 | 690 | 6 % | 594 | 23 % | |||||||||||||||
| All-in sustaining costs ($/oz)b |
985 | 952 | 3 % | 752 | 31 % | |||||||||||||||
| Carlin (61.5%)c |
||||||||||||||||||||
| Gold produced (000s oz attributable basis) |
235 | 253 | (7)% | 181 | 30 % | |||||||||||||||
| Gold produced (000s oz 100% basis) |
382 | 411 | (7)% | 181 | 111 % | |||||||||||||||
| Cost of sales ($/oz) |
1,037 | 970 | 7 % | 1,116 | (7)% | |||||||||||||||
| Total cash costs ($/oz)b |
850 | 776 | 10 % | 769 | 11 % | |||||||||||||||
| All-in sustaining costs ($/oz)b |
1,130 | 1,007 | 12 % | 1,088 | 4 % | |||||||||||||||
| Cortez (61.5%)d |
||||||||||||||||||||
| Gold produced (000s oz attributable basis) |
132 | 128 | 3 % | 280 | (53)% | |||||||||||||||
| Gold produced (000s oz 100% basis) |
215 | 208 | 3 % | 280 | (23)% | |||||||||||||||
| Cost of sales ($/oz) |
870 | 876 | (1)% | 719 | 21 % | |||||||||||||||
| Total cash costs ($/oz)b |
613 | 614 | 0% | 489 | 25 % | |||||||||||||||
| All-in sustaining costs ($/oz)b |
950 | 1,009 | (6)% | 561 | 69 % | |||||||||||||||
| Turquoise Ridge (61.5%)e |
||||||||||||||||||||
| Gold produced (000s oz attributable basis) |
79 | 84 | (6)% | 65 | 22 % | |||||||||||||||
| Gold produced (000s oz 100% basis) |
128 | 137 | (6)% | 87 | 47 % | |||||||||||||||
| Cost of sales ($/oz) |
1,073 | 1,032 | 4 % | 665 | 61 % | |||||||||||||||
| Total cash costs ($/oz)b |
753 | 668 | 13 % | 569 | 32 % | |||||||||||||||
| All-in sustaining costs ($/oz)b |
829 | 806 | 3 % | 667 | 24 % | |||||||||||||||
| Phoenix (61.5%)f |
||||||||||||||||||||
| Gold produced (000s oz attributable basis) |
35 | 35 | 0 % | |||||||||||||||||
| Gold produced (000s oz 100% basis) |
57 | 57 | 0 % | |||||||||||||||||
| Cost of sales ($/oz) |
1,726 | 1,583 | 9 % | |||||||||||||||||
| Total cash costs ($/oz)b |
725 | 737 | (2)% | |||||||||||||||||
| All-in sustaining costs ($/oz)b |
957 | 914 | 5 % | |||||||||||||||||
| Long Canyon (61.5%)f |
||||||||||||||||||||
| Gold produced (000s oz attributable basis) |
40 | 26 | 54 % | |||||||||||||||||
| Gold produced (000s oz 100% basis) |
65 | 42 | 54 % | |||||||||||||||||
| Cost of sales ($/oz) |
1,009 | 1,025 | (2)% | |||||||||||||||||
| Total cash costs ($/oz)b |
308 | 345 | (11)% | |||||||||||||||||
| All-in sustaining costs ($/oz)b |
430 | 561 | (23)% | |||||||||||||||||
| Pueblo Viejo (60%) |
||||||||||||||||||||
| Gold produced (000s oz attributable basis) |
111 | 143 | (22)% | 124 | (10)% | |||||||||||||||
| Gold produced (000s oz 100% basis) |
185 | 238 | (22)% | 207 | (10)% | |||||||||||||||
| Cost of sales ($/oz) |
935 | 767 | 22 % | 852 | 10 % | |||||||||||||||
| Total cash costs ($/oz)b |
579 | 502 | 15 % | 557 | 4 % | |||||||||||||||
| All-in sustaining costs ($/oz)b |
720 | 626 | 15 % | 702 | 3 % | |||||||||||||||
| BARRICK SECOND QUARTER 2020 |
9 | PRESS RELEASE |
Production and Cost Summary - Gold (continued)
| For the three months ended | ||||||||||||||||||||
| 6/30/20 | 3/31/20 | % Change | 6/30/19 | % Change | ||||||||||||||||
| Loulo-Gounkoto (80%) |
||||||||||||||||||||
| Gold produced (000s oz attributable basis) |
141 | 141 | 0 % | 147 | (4)% | |||||||||||||||
| Gold produced (000s oz 100% basis) |
176 | 177 | 0 % | 184 | (4)% | |||||||||||||||
| Cost of sales ($/oz) |
1,012 | 1,002 | 1 % | 1,072 | (6)% | |||||||||||||||
| Total cash costs ($/oz)b |
639 | 614 | 4 % | 598 | 7 % | |||||||||||||||
| All-in sustaining costs ($/oz)b |
1,030 | 891 | 16 % | 811 | 27 % | |||||||||||||||
| Kibali (45%) |
||||||||||||||||||||
| Gold produced (000s oz attributable basis) |
90 | 91 | (1)% | 95 | (5)% | |||||||||||||||
| Gold produced (000s oz 100% basis) |
201 | 201 | (1)% | 211 | (5)% | |||||||||||||||
| Cost of sales ($/oz) |
1,067 | 1,045 | 2 % | 868 | 23 % | |||||||||||||||
| Total cash costs ($/oz)b |
617 | 582 | 6 % | 540 | 14 % | |||||||||||||||
| All-in sustaining costs ($/oz)b |
739 | 773 | (4)% | 651 | 14 % | |||||||||||||||
| Veladero (50%) |
||||||||||||||||||||
| Gold produced (000s oz attributable basis) |
49 | 75 | (35)% | 75 | (35)% | |||||||||||||||
| Gold produced (000s oz 100% basis) |
98 | 150 | (35)% | 150 | (35)% | |||||||||||||||
| Cost of sales ($/oz) |
1,228 | 1,182 | 4 % | 1,186 | 4 % | |||||||||||||||
| Total cash costs ($/oz)b |
801 | 788 | 2 % | 746 | 7 % | |||||||||||||||
| All-in sustaining costs ($/oz)b |
1,383 | 1,266 | 9 % | 1,046 | 32 % | |||||||||||||||
| Porgera (47.5%) |
||||||||||||||||||||
| Gold produced (000s oz attributable basis) |
24 | 62 | (61)% | 61 | (61)% | |||||||||||||||
| Gold produced (000s oz 100% basis) |
51 | 131 | (61)% | 128 | (61)% | |||||||||||||||
| Cost of sales ($/oz) |
1,141 | 1,097 | 4 % | 1,032 | 11 % | |||||||||||||||
| Total cash costs ($/oz)b |
875 | 941 | (7)% | 893 | (2)% | |||||||||||||||
| All-in sustaining costs ($/oz)b |
1,046 | 1,089 | (4)% | 1,112 | (6)% | |||||||||||||||
| Tongon (89.7%) |
||||||||||||||||||||
| Gold produced (000s oz attributable basis) |
64 | 61 | 5 % | 61 | 5 % | |||||||||||||||
| Gold produced (000s oz 100% basis) |
71 | 68 | 5 % | 68 | 5 % | |||||||||||||||
| Cost of sales ($/oz) |
1,275 | 1,368 | (7)% | 1,562 | (18)% | |||||||||||||||
| Total cash costs ($/oz)b |
688 | 762 | (10)% | 750 | (8)% | |||||||||||||||
| All-in sustaining costs ($/oz)b |
745 | 788 | (5)% | 802 | (7)% | |||||||||||||||
| Hemlo |
||||||||||||||||||||
| Gold produced (000s oz) |
54 | 57 | (5)% | 55 | (2)% | |||||||||||||||
| Cost of sales ($/oz) |
1,268 | 1,119 | 13 % | 953 | 33 % | |||||||||||||||
| Total cash costs ($/oz)b |
1,080 | 945 | 14 % | 822 | 31 % | |||||||||||||||
| All-in sustaining costs ($/oz)b |
1,456 | 1,281 | 14 % | 1,015 | 43 % | |||||||||||||||
| North Mara (84%)g |
||||||||||||||||||||
| Gold produced (000s oz attributable basis) |
68 | 65 | 5 % | 76 | (11)% | |||||||||||||||
| Gold produced (000s oz 100% basis) |
81 | 77 | 5 % | 119 | (32)% | |||||||||||||||
| Cost of sales ($/oz) |
1,040 | 959 | 8 % | 800 | 30 % | |||||||||||||||
| Total cash costs ($/oz)b |
724 | 646 | 12 % | 539 | 34 % | |||||||||||||||
| All-in sustaining costs ($/oz)b |
1,166 | 816 | 43 % | 675 | 73 % | |||||||||||||||
| Buzwagi (84%)g |
||||||||||||||||||||
| Gold produced (000s oz attributable basis) |
20 | 22 | (9)% | 19 | 5 % | |||||||||||||||
| Gold produced (000s oz 100% basis) |
24 | 27 | (9)% | 30 | (20)% | |||||||||||||||
| Cost of sales ($/oz) |
909 | 1,373 | (34)% | 1,198 | (24)% | |||||||||||||||
| Total cash costs ($/oz)b |
751 | 1,275 | (41)% | 1,099 | (32)% | |||||||||||||||
| All-in sustaining costs ($/oz)b |
770 | 1,288 | (40)% | 1,150 | (33)% | |||||||||||||||
| BARRICK SECOND QUARTER 2020 |
10 | PRESS RELEASE |
Production and Cost Summary - Gold (continued)
| For the three months ended | ||||||||||||||||||||
| 6/30/20 | 3/31/20 | % Change | 6/30/19 | % Change | ||||||||||||||||
| Bulyanhulu (84%)g |
||||||||||||||||||||
| Gold produced (000s oz attributable basis) |
7 | 7 | 0 % | 6 | 17 % | |||||||||||||||
| Gold produced (000s oz 100% basis) |
8 | 9 | 0 % | 9 | (11)% | |||||||||||||||
| Cost of sales ($/oz) |
1,658 | 1,685 | (2)% | 1,217 | 36 % | |||||||||||||||
| Total cash costs ($/oz)b |
950 | 686 | 38 % | 525 | 81 % | |||||||||||||||
| All-in sustaining costs ($/oz)b |
1,014 | 906 | 12 % | 666 | 52 % | |||||||||||||||
| Kalgoorlie (50%)h |
||||||||||||||||||||
| Gold produced (000s oz attributable basis) |
57 | (100)% | ||||||||||||||||||
| Gold produced (000s oz 100% basis) |
114 | (100)% | ||||||||||||||||||
| Cost of sales ($/oz) |
1,038 | (100)% | ||||||||||||||||||
| Total cash costs ($/oz)b |
846 | (100)% | ||||||||||||||||||
| All-in sustaining costs ($/oz)b |
1,204 | (100)% | ||||||||||||||||||
| Total Attributable to Barricki |
||||||||||||||||||||
| Gold produced (000s oz) |
1,149 | 1,250 | (8)% | 1,353 | (15)% | |||||||||||||||
| Cost of sales ($/oz)j |
1,075 | 1,020 | 5 % | 964 | 12 % | |||||||||||||||
| Total cash costs ($/oz)b |
716 | 692 | 3 % | 651 | 10 % | |||||||||||||||
| All-in sustaining costs ($/oz)b |
1,031 | 954 | 8 % | 869 | 19 % | |||||||||||||||
| a. | Represents the combined results of Cortez, Goldstrike (including our 60% share of South Arturo) and our 75% interest in Turquoise Ridge until June 30, 2019. Commencing July 1, 2019, the date Nevada Gold Mines was established, the results represent our 61.5% interest in Cortez, Carlin (including Goldstrike and 60% of South Arturo), Turquoise Ridge (including Twin Creeks), Phoenix and Long Canyon. |
| b. | These are non-GAAP financial performance measures with no standardized meaning under IFRS and therefore may not be comparable to similar measures presented by other issuers. For further information and a detailed reconciliation of each non-GAAP measure used to the most directly comparable IFRS measure, please see pages 79 to 103 of our second quarter MD&A. |
| c. | On July 1, 2019, Barrick’s Goldstrike and Newmont’s Carlin were contributed to Nevada Gold Mines and are now referred to as Carlin. As a result, the amounts presented represent Goldstrike on a 100% basis (including our 60% share of South Arturo) up until June 30, 2019, and the combined results of Carlin and Goldstrike (including NGM’s 60% share of South Arturo) on a 61.5% basis thereafter. |
| d. | On July 1, 2019, Cortez was contributed to Nevada Gold Mines, a joint venture with Newmont. As a result, the amounts presented are on an 100% basis up until June 30, 2019, and on a 61.5% basis thereafter. |
| e. | Barrick owned 75% of Turquoise Ridge through to the end of the second quarter of 2019, with our joint venture partner, Newmont, owning the remaining 25%. Turquoise Ridge was proportionately consolidated on the basis that the joint venture partners that have joint control have rights to the assets and obligations for the liabilities relating to the arrangement. The figures presented in this table are based on our 75% interest in Turquoise Ridge until June 30, 2019. On July 1, 2019, Barrick’s 75% interest in Turquoise Ridge as well as Newmont’s Twin Creeks and 25% interest in Turquoise Ridge were contributed to Nevada Gold Mines. Starting July 1, 2019, the results represent our 61.5% share of Turquoise Ridge and Twin Creeks, now referred to as Turquoise Ridge. |
| f. | A 61.5% interest in these sites was acquired as a result of the formation of Nevada Gold Mines on July 1, 2019. |
| g. | Formerly known as Acacia Mining plc. On September 17, 2019, Barrick acquired all of the shares of Acacia it did not own. Operating results are included at 100% from October 1, 2019 to December 31, 2019 (notwithstanding the completion of the Acacia transaction on September 17, 2019, we consolidated our interest in Acacia and recorded a non-controlling interest of 36.1% in the income statement for the entirety of the third quarter of 2019 as a matter of convenience), and on an 84% basis thereafter as the GoT’s 16% free-carried interest was made effective from January 1, 2020. |
| h. | On November 28, 2019, we completed the sale of our 50% interest in Kalgoorlie in Western Australia to Saracen Mineral Holdings Limited for total cash consideration of $750 million. Accordingly, these represent our 50% interest until November 28, 2019. |
| i. | Excludes Pierina; Lagunas Norte starting in the fourth quarter of 2019; and Golden Sunlight and Morila (40%) starting in the third quarter of 2019 which are producing incidental ounces as they reach the end of their mine lives. |
| j. | Cost of sales per ounce (Barrick’s share) is calculated as cost of sales - gold on an attributable basis (excluding sites in care and maintenance) divided by gold equity ounces sold. |
| BARRICK SECOND QUARTER 2020 |
11 | PRESS RELEASE |
Production and Cost Summary - Copper
| For the three months ended | ||||||||||||||||||||
| 6/30/20 | 3/31/20 | % Change | 6/30/19 | % Change | ||||||||||||||||
| Lumwana |
||||||||||||||||||||
| Copper production (Mlbs) |
72 | 64 | 13 % | 49 | 47 % | |||||||||||||||
| Cost of sales ($/lb) |
2.06 | 1.94 | 6 % | 2.07 | 0 % | |||||||||||||||
| C1 cash costs ($/lb)a |
1.55 | 1.63 | (5)% | 1.70 | (9)% | |||||||||||||||
| All-in sustaining costs ($/lb)a |
2.27 | 2.26 | 0 % | 2.78 | (18)% | |||||||||||||||
| Zaldívar (50%) |
||||||||||||||||||||
| Copper production (Mlbs attributable basis) |
28 | 31 | (10)% | 32 | (13)% | |||||||||||||||
| Copper production (Mlbs 100% basis) |
56 | 62 | (10)% | 64 | (13)% | |||||||||||||||
| Cost of sales ($/lb) |
2.52 | 2.39 | 5 % | 2.32 | 9 % | |||||||||||||||
| C1 cash costs ($/lb)a |
1.79 | 1.71 | 5 % | 1.61 | 11 % | |||||||||||||||
| All-in sustaining costs ($/lb)a |
2.09 | 1.99 | 5 % | 1.85 | 13 % | |||||||||||||||
| Jabal Sayid (50%) |
||||||||||||||||||||
| Copper production (Mlbs attributable basis) |
20 | 20 | 0 % | 16 | 25 % | |||||||||||||||
| Copper production (Mlbs 100% basis) |
40 | 40 | 0 % | 32 | 25 % | |||||||||||||||
| Cost of sales ($/lb) |
1.41 | 1.28 | 10 % | 1.45 | (3)% | |||||||||||||||
| C1 cash costs ($/lb)a |
1.14 | 0.97 | 18 % | 1.22 | (7)% | |||||||||||||||
| All-in sustaining costs ($/lb)a |
1.41 | 1.11 | 27 % | 1.31 | 8 % | |||||||||||||||
| Total Copper |
||||||||||||||||||||
| Copper production (Mlbs attributable basis) |
120 | 115 | 4 % | 97 | 24 % | |||||||||||||||
| Cost of sales ($/lb)b |
2.08 | 1.96 | 6 % | 2.04 | 2 % | |||||||||||||||
| C1 cash costs ($/lb)a |
1.55 | 1.55 | 0 % | 1.59 | (3)% | |||||||||||||||
| All-in sustaining costs ($/lb)a |
2.15 | 2.04 | 5 % | 2.28 | (6)% | |||||||||||||||
| a. | These are non-GAAP financial performance measures with no standardized meaning under IFRS and therefore may not be comparable to similar measures presented by other issuers. For further information and a detailed reconciliation of each non-GAAP measure used to the most directly comparable IFRS measure, please see pages 79 to 103 of our second quarter MD&A. |
| b. | Cost of sales per pound (Barrick’s share) is calculated as cost of sales - copper plus our equity share of cost of sales attributable to Zaldívar and Jabal Sayid divided by copper pounds sold. |
| BARRICK SECOND QUARTER 2020 |
12 | PRESS RELEASE |
Technical Information
The scientific and technical information contained in this press release has been reviewed and approved by Steven Yopps, MMSA, Director - Metallurgy, North America; Craig Fiddes, SME-RM, Manager – Resource Modeling, Nevada Gold Mines; Chad Yuhasz, P.Geo, Mineral Resource Manager, Latin America and Asia Pacific; Simon Bottoms, CGeol, MGeol, FGS, FAusIMM, Mineral Resources Manager: Africa and Middle East; Rodney Quick, MSc, Pr. Sci.Nat, Mineral Resource Management and Evaluation Executive; John Steele, CIM, Metallurgy, Engineering and Capital Projects Executive; and Rob Krcmarov, FAusIMM, Executive Vice President, Exploration and Growth – each a “Qualified Person” as defined in National Instrument 43-101 – Standards of Disclosure for Mineral Projects.
All mineral reserve and mineral resource estimates are estimated in accordance with National Instrument 43-101 – Standards of Disclosure for Mineral Projects. Unless otherwise noted, such mineral reserve and mineral resource estimates are as of December 31, 2019.
Endnotes
Endnote 1
“Free cash flow” is a non-GAAP financial performance measure which deducts capital expenditures from net cash provided by operating activities. Barrick believes this to be a useful indicator of our ability to operate without reliance on additional borrowing or usage of existing cash. Free cash flow is intended to provide additional information only and does not have any standardized meaning under IFRS and may not be comparable to similar measures of performance presented by other companies. Free cash flow should not be considered in isolation or as a substitute for measures of performance prepared in accordance with IFRS. Further details on this non-GAAP measure are provided in the MD&A accompanying Barrick’s financial statements filed from time to time on SEDAR at www.sedar.com and on EDGAR at www.sec.gov.
Reconciliation of Net Cash Provided by Operating Activities to Free Cash Flow
| ($ millions) | For the three months ended | For the six months ended | ||||||||||||||||||
| 6/30/20 | 3/31/20 | 6/30/19 | 6/30/20 | 6/30/19 | ||||||||||||||||
| Net cash provided by operating activities |
1,031 | 889 | 434 | 1,920 | 954 | |||||||||||||||
| Capital expenditures |
(509) | (451) | (379) | (960) | (753) | |||||||||||||||
| Free cash flow |
522 | 438 | 55 | 960 | 201 | |||||||||||||||
Endnote 2
“Adjusted net earnings” and “adjusted net earnings per share” are non-GAAP financial performance measures. Adjusted net earnings excludes the following from net earnings: certain impairment charges (reversals) related to intangibles, goodwill, property, plant and equipment, and investments; gains (losses) and other one-time costs relating to acquisitions or dispositions; foreign currency translation gains (losses); significant tax adjustments not related to current period earnings; unrealized gains (losses) on non-hedge derivative instruments; and the tax effect and non-controlling interest of these items. The Company uses this measure internally to evaluate our underlying operating performance for the reporting periods presented and to assist with the planning and forecasting of future operating results. Barrick believes that adjusted net earnings is a useful measure of our performance because these adjusting items do not reflect the underlying operating performance of our core mining business and are not necessarily indicative of future operating results. Adjusted net earnings and adjusted net earnings per share are intended to provide additional information only and do not have any standardized meaning under IFRS and may not be comparable to similar measures of performance presented by other companies. They should not be considered in isolation or as a substitute for measures of performance prepared in accordance with IFRS. Further details on these non-GAAP measures are provided in the MD&A accompanying Barrick’s financial statements filed from time to time on SEDAR at www.sedar.com and on EDGAR at www.sec.gov.
| BARRICK SECOND QUARTER 2020 |
13 | PRESS RELEASE |
Reconciliation of Net Earnings to Net Earnings per Share, Adjusted Net Earnings and Adjusted Net Earnings per Share
| ($ millions, except per share amounts in dollars) | For the three months ended | For the six months ended | ||||||||||||||||||
| 6/30/20 | 3/31/20 | 6/30/19 | 6/30/20 | 6/30/19 | ||||||||||||||||
| Net earnings attributable to equity holders of the Company | 357 | 400 | 194 | 757 | 305 | |||||||||||||||
| Impairment charges (reversals) related to intangibles, goodwill, property, plant and equipment, and investmentsa | 23 | (336 | ) | 12 | (313 | ) | 15 | |||||||||||||
| Acquisition/disposition (gains) lossesb | 8 | (60 | ) | (12 | ) | (52 | ) | (12 | ) | |||||||||||
| Loss (gain) on currency translation | 2 | 16 | (6 | ) | 18 | 16 | ||||||||||||||
| Significant tax adjustmentsc | (7 | ) | (44 | ) | (83 | ) | (51 | ) | (75 | ) | ||||||||||
| Other expense adjustmentsd | 48 | 98 | 58 | 146 | 104 | |||||||||||||||
| Tax effect and non-controlling intereste | (16 | ) | 211 | (9 | ) | 195 | (15 | ) | ||||||||||||
| Adjusted net earnings | 415 | 285 | 154 | 700 | 338 | |||||||||||||||
| Net earnings per sharef | 0.20 | 0.22 | 0.11 | 0.43 | 0.17 | |||||||||||||||
| Adjusted net earnings per sharef | 0.23 | 0.16 | 0.09 | 0.39 | 0.19 | |||||||||||||||
| a. | Net impairment charges for the three month period ended June 30, 2020 relate to miscellaneous assets. For the three month period ended March 31, 2020 and the six month period ended June 30, 2020, net impairment reversals primarily relate to non-current asset reversals at our Tanzanian assets. |
| b. | Acquisition/disposition gains for the three month period ended March 31, 2020 and the six month period ended June 30, 2020 primarily relate to the gain on the sale of Massawa. |
| c. | Significant tax adjustments for the three month period ended March 31, 2020 and the six month period ended June 30, 2020 primarily relate to deferred tax recoveries as a result of tax reform measures in Argentina and adjustments made in recognition of the net settlement of all outstanding disputes with the GoT. For the three and six month periods ended June 30, 2019, significant tax adjustments primarily relate to an adjustment to deferred taxes at Veladero. Refer to Note 10 to the Financial Statements for more information. |
| d. | Other expense adjustments for the three and six month period ended June 30, 2020 primarily relate to care and maintenance expenses at Porgera and Covid-19 donations. The six month period ended June 30, 2020 was further impacted by changes in the discount rate assumptions on our closed mine rehabilitation provision. For the three month period ended March 31, 2020, other expense adjustments primarily relate to the impact of changes in the discount rate assumptions on our closed mine rehabilitation provision and losses on debt extinguishment. Other expense adjustments for the three and six month periods ended June 30, 2019 primarily relate to severance costs as a result of the implementation of a number of organizational reductions, the impact of changes in the discount rate assumptions on our closed mine rehabilitation provision and transaction costs related to Nevada Gold Mines. |
| e. | Tax effect and non-controlling interest for the three month periods ended March 31, 2020 and December 31, 2019 primarily relates to the net impairment reversals related to long-lived assets. |
| f. | Calculated using weighted average number of shares outstanding under the basic method of earnings per share. |
Endnote 3
“Realized price” is a non-GAAP financial measure which excludes from sales: unrealized gains and losses on non-hedge derivative contracts; unrealized mark-to-market gains and losses on provisional pricing from copper and gold sales contracts; sales attributable to ore purchase arrangements; treatment and refining charges; export duties; and cumulative catch-up adjustments to revenue relating to our streaming arrangements. This measure is intended to enable Management to better understand the price realized in each reporting period for gold and copper sales because unrealized mark-to-market values of non-hedge gold and copper derivatives are subject to change each period due to changes in market factors such as market and forward gold and copper prices, so that prices ultimately realized may differ from those recorded. The exclusion of such unrealized mark-to-market gains and losses from the presentation of this performance measure enables investors to understand performance based on the realized proceeds of selling gold and copper production. The realized price measure is intended to provide additional information and does not have any standardized definition under IFRS and should not be considered in isolation or as a substitute for measures of performance prepared in accordance with IFRS. Further details on these non-GAAP measures are provided in the MD&A accompanying Barrick’s financial statements filed from time to time on SEDAR at www.sedar.com and on EDGAR at www.sec.gov.
| BARRICK SECOND QUARTER 2020 |
14 | PRESS RELEASE |
Reconciliation of Sales to Realized Price per ounce/pound
| ($ millions, except per ounce/pound information in dollars) |
Gold | Copper | Gold | Copper | ||||||||||||||||||||||||||||||||||||
| For the three months ended | For the six months ended | |||||||||||||||||||||||||||||||||||||||
| 6/30/20 | 3/31/20 | 6/30/19 | 6/30/20 | 3/31/20 | 6/30/19 | 6/30/20 | 6/30/19 | 6/30/20 | 6/30/19 | |||||||||||||||||||||||||||||||
| Sales |
2,812 | 2,593 | 1,937 | 184 | 99 | 103 | 5,405 | 3,843 | 283 | 266 | ||||||||||||||||||||||||||||||
| Sales applicable to non-controlling interests | (822 | ) | (770 | ) | (240 | ) | 0 | 0 | 0 | (1,592 | ) | (464 | ) | 0 | 0 | |||||||||||||||||||||||||
| Sales applicable to equity method investmentsa,b | 172 | 147 | 135 | 120 | 107 | 124 | 319 | 264 | 227 | 245 | ||||||||||||||||||||||||||||||
| Realized non-hedge gold/copper derivative | ||||||||||||||||||||||||||||||||||||||||
| (losses) gains | 0 | 0 | 1 | 0 | 0 | 0 | 0 | 1 | 0 | 0 | ||||||||||||||||||||||||||||||
| Sales applicable to sites in care and maintenancec | (53 | ) | (46 | ) | (26 | ) | 0 | 0 | 0 | (99 | ) | (52 | ) | 0 | 0 | |||||||||||||||||||||||||
| Treatment and refinement charges | 2 | 0 | 0 | 40 | 39 | 25 | 2 | 0 | 79 | 56 | ||||||||||||||||||||||||||||||
| Otherd | 0 | 15 | 0 | 0 | 0 | 0 | 15 | 0 | 0 | 0 | ||||||||||||||||||||||||||||||
| Revenues – as adjusted | 2,111 | 1,939 | 1,807 | 344 | 245 | 252 | 4,050 | 3,592 | 589 | 567 | ||||||||||||||||||||||||||||||
| Ounces/pounds sold (000s ounces/millions pounds)c | 1,224 | 1,220 | 1,372 | 123 | 110 | 96 | 2,444 | 2,737 | 233 | 199 | ||||||||||||||||||||||||||||||
| Realized gold/copper price per ounce/pounde | 1,725 | 1,589 | 1,317 | 2.79 | 2.23 | 2.62 | 1,657 | 1,312 | 2.53 | 2.85 | ||||||||||||||||||||||||||||||
| a. | Represents sales of $164 million and $304 million, respectively, for the three and six month periods ended June 30, 2020 (March 31, 2020: $140 million and June 30, 2019: $125 million and $242 million, respectively) applicable to our 45% equity method investment in Kibali and $nil and nil, respectively, (March 31, 2020: $nil and June 30, 2019: $10 million and $22 million, respectively) applicable to our 40% equity method investment in Morila for gold. Represents sales of $78 million and $150 million, respectively, for the three and six months ended June 30, 2020 (March 31, 2020: $72 million and June 30, 2019: $86 million and $167 million, respectively) applicable to our 50% equity method investment in Zaldívar and $46 million and $86 million, respectively (March 31, 2020: $40 million and June 30, 2019: $44 million and $88 million, respectively) applicable to our 50% equity method investment in Jabal Sayid for copper. |
| b. | Sales applicable to equity method investments are net of treatment and refinement charges. |
| c. | Figures exclude: Pierina; Golden Sunlight and Morila starting in the third quarter of 2019; and Lagunas Norte starting in the fourth quarter of 2019, from the calculation of realized price per ounce as they reach the end of their mine lives. |
| d. | Represents cumulative catch-up adjustment to revenue relating to our streaming arrangements. Refer to note 2f of the 2019 Annual Financial Statements for more information. |
| e. | Realized price per ounce/pound may not calculate based on amounts presented in this table due to rounding. |
Endnote 4
Includes North Mara, Bulyanhulu and Buzwagi on a 84% basis starting January 1, 2020 (and on a 63.9% basis from January 1, 2019 to September 30, 2019; notwithstanding the completion of the Acacia transaction on September 17, 2019, we consolidated our interest in Acacia and recorded a non-controlling interest of 36.1% in the income statement for the entirety of the third quarter of 2019 as a matter of convenience, and on a 100% basis from October 1, 2019 to December 31, 2019), Pueblo Viejo on a 60% basis, South Arturo on a 36.9% basis from July 1, 2019 onwards as a result of its contribution to Nevada Gold Mines (and on a 60% basis from January 1, 2019 to June 30, 2019), Veladero on a 50% basis, Loulo-Gounkoto on an 80% basis, Kibali on a 45% basis, Tongon on an 89.7% basis, and Morila on a 40% basis until the second quarter of 2019, which reflects our equity share of production and sales. Also removes the non-controlling interest of 38.5% Nevada Gold Mines from July 1, 2019 onwards.
Endnote 5
Net earnings (loss) represents net earnings (loss) attributable to the equity holders of the Company.
Endnote 6
These amounts are presented on the same basis as our guidance and include our 60% share of Pueblo Viejo, 80% share of Loulo-Gounkoto, 89.7% share of Tongon, 45% share of Kibali, 40% share of Morila and 60% share of South Arturo (36.9% of South Arturo from July 1, 2019 onwards as a result of its contribution to Nevada Gold Mines), our 84% share of Tanzania starting January 1, 2020 (63.9% share from January 1, 2019 to September 30, 2019; notwithstanding the completion of the Acacia transaction on September 17, 2019, we consolidated our interest in Acacia and recorded a non-controlling interest of 36.1% in the income statement for the entirety of the third quarter of 2019 as a matter of convenience, and 100% share from October 1, 2019 to December 31, 2019) and our 50% share of Zaldívar and Jabal Sayid. Starting July 1, 2019, it also includes our 61.5% share of Nevada Gold Mines.
Endnote 7
Gold cost of sales (Barrick’s share) is calculated as cost of sales - gold on an attributable basis (excluding sites in care and maintenance) divided by ounces sold.
Endnote 8
“Total cash costs” per ounce, “All-in sustaining costs” per ounce and “All-in costs” per ounce are non-GAAP financial performance measures. “Total cash costs” per ounce starts with cost of sales related to gold production but removes depreciation, the noncontrolling interest of cost of sales, and includes by product credits. “All-in sustaining costs” per ounce begin with “Total cash costs” per ounce and add further costs which reflect the expenditures made to maintain current production levels, primarily sustaining capital expenditures, sustaining leases, general & administrative costs, minesite exploration and
| BARRICK SECOND QUARTER 2020 |
15 | PRESS RELEASE |
evaluation costs, and reclamation cost accretion and amortization. “All-in costs” per ounce starts with “All-in sustaining costs” per ounce and adds additional costs that reflect the varying costs of producing gold over the life-cycle of a mine, including: project capital expenditures and other nonsustaining costs. Barrick believes that the use of “total cash costs” per ounce, “all-in sustaining costs” per ounce and “All-in costs” per ounce will assist investors, analysts and other stakeholders in understanding the costs associated with producing gold, understanding the economics of gold mining, assessing our operating performance and also our ability to generate free cash flow from current operations and to generate free cash flow on an overall Company basis. “Total cash costs” per ounce, “All-in sustaining costs” per ounce and “All-in costs” per ounce are intended to provide additional information only and do not have any standardized meaning under IFRS. Although a standardized definition of all-in sustaining costs was published in 2013 by the World Gold Council (a market development organization for the gold industry comprised of and funded by 25 gold mining companies from around the world, including Barrick), it is not a regulatory organization, and other companies may calculate this measure differently. Starting from the first quarter of 2019, we have renamed “cash costs” to “total cash costs” when referring to our gold operations. The calculation of total cash costs is identical to our previous calculation of cash costs with only a change in the naming convention of this non-GAAP measure. These measures should not be considered in isolation or as a substitute for measures prepared in accordance with IFRS. Further details on these non-GAAP measures are provided in the MD&A accompanying Barrick’s financial statements filed from time to time on SEDAR at www.sedar.com and on EDGAR at www.sec.gov.
Reconciliation of Gold Cost of Sales to Total cash costs, All-in sustaining costs and All-in costs, including on a per ounce basis
| ($ millions, except per ounce information in dollars) | For the three months ended | For the six months ended | ||||||||||||||||||||
| Footnote | 6/30/20 | 3/31/20 | 6/30/19 | 6/30/20 | 6/30/19 | |||||||||||||||||
| Cost of sales applicable to gold production | 1,740 | 1,643 | 1,437 | 3,383 | 2,787 | |||||||||||||||||
| Depreciation |
(498 | ) | (474 | ) | (431 | ) | (972 | ) | (815 | ) | ||||||||||||
| Cash cost of sales applicable to equity method investments |
62 | 52 | 62 | 114 | 124 | |||||||||||||||||
| By-product credits |
(59 | ) | (29 | ) | (23 | ) | (88 | ) | (47 | ) | ||||||||||||
| Realized (gains) losses on hedge and non-hedge derivatives |
a | 1 | 0 | (1 | ) | 1 | (1 | ) | ||||||||||||||
| Non-recurring items |
b | 0 | 0 | (9 | ) | 0 | (29 | ) | ||||||||||||||
| Other |
c | (26 | ) | (27 | ) | (26 | ) | (53 | ) | (46 | ) | |||||||||||
| Non-controlling interests |
d | (336 | ) | (316 | ) | (112 | ) | (652 | ) | (213 | ) | |||||||||||
| Total cash costs | 884 | 849 | 897 | 1,733 | 1,760 | |||||||||||||||||
| General & administrative costs |
71 | 40 | 59 | 111 | 113 | |||||||||||||||||
| Minesite exploration and evaluation costs |
e | 23 | 15 | 12 | 38 | 23 | ||||||||||||||||
| Minesite sustaining capital expenditures |
f | 420 | 370 | 267 | 790 | 520 | ||||||||||||||||
| Sustaining leases |
10 | 0 | 8 | 10 | 18 | |||||||||||||||||
| Rehabilitation - accretion and amortization (operating sites) |
g | 12 | 14 | 16 | 26 | 30 | ||||||||||||||||
| Non-controlling interest, copper operations and other |
h | (158 | ) | (125 | ) | (76 | ) | (283 | ) | (151 | ) | |||||||||||
| All-in sustaining costs | 1,262 | 1,163 | 1,183 | 2,425 | 2,313 | |||||||||||||||||
| Project exploration and evaluation and project costs |
e | 55 | 56 | 86 | 111 | 149 | ||||||||||||||||
| Community relations costs not related to current operations |
0 | 1 | 0 | 1 | 1 | |||||||||||||||||
| Project capital expenditures |
f | 85 | 76 | 108 | 161 | 228 | ||||||||||||||||
| Rehabilitation - accretion and amortization (non-operating sites) |
g | 4 | 2 | 7 | 6 | 14 | ||||||||||||||||
| Non-controlling interest and copper operations and other |
h | (36 | ) | (17 | ) | (28 | ) | (53 | ) | (31 | ) | |||||||||||
| All-in costs | 1,370 | 1,281 | 1,356 | 2,651 | 2,674 | |||||||||||||||||
| Ounces sold - equity basis (000s ounces) | i | 1,224 | 1,220 | 1,372 | 2,444 | 2,737 | ||||||||||||||||
| Cost of sales per ounce | j,k | 1,075 | 1,020 | 964 | 1,048 | 956 | ||||||||||||||||
| Total cash costs per ounce | k | 716 | 692 | 651 | 704 | 641 | ||||||||||||||||
| Total cash costs per ounce (on a co-product basis) | k,l | 747 | 705 | 663 | 726 | 654 | ||||||||||||||||
| All-in sustaining costs per ounce | k | 1,031 | 954 | 869 | 993 | 842 | ||||||||||||||||
| All-in sustaining costs per ounce (on a co-product basis) | k,l | 1,062 | 967 | 881 | 1,015 | 855 | ||||||||||||||||
| All-in costs per ounce | k | 1,118 | 1,052 | 999 | 1,085 | 976 | ||||||||||||||||
| All-in costs per ounce (on a co-product basis) | k,l | 1,149 | 1,065 | 1,011 | 1,107 | 989 | ||||||||||||||||
| a. | Realized (gains) losses on hedge and non-hedge derivatives |
Includes realized hedge losses of $nil and $nil, respectively, for the three and six month periods ended June 30, 2020 (March 31, 2020: $nil and June 30, 2019: $nil and $nil, respectively), and realized non-hedge losses of $1 million and $1 million, respectively, for the three and six month periods ended June 30, 2020 (March 31, 2020: $nil and June 30, 2019: gains of $1 million and $1 million, respectively). Refer to note 5 to the Financial Statements for further information.
| BARRICK SECOND QUARTER 2020 |
16 | PRESS RELEASE |
| b. | Non-recurring items |
Non-recurring items in 2019 relate to organizational restructuring. These costs are not indicative of our cost of production and have been excluded from the calculation of total cash costs.
| c. | Other |
Other adjustments for the three and six month period ended June 30, 2020 include the removal of total cash costs and by-product credits associated with: our Pierina mine; Golden Sunlight and Morila starting in the third quarter of 2019; and Lagunas Norte starting in the fourth quarter of 2019, which all are producing incidental ounces as they reach the end of their mine lives of $26 million and $51 million, respectively, (March 31, 2020: $25 million; June 30, 2019: $19 million and $37 million, respectively, relating to Pierina only).
| d. | Non-controlling interests |
Non-controlling interests include non-controlling interests related to gold production of $495 million and $961 million, respectively, for the three and six month periods ended June 30, 2020 (March 31, 2020: $466 million and June 30, 2019: $171 million and $323 million, respectively). Non-controlling interests include Pueblo Viejo, Loulo-Gounkoto, Tongon, North Mara, Bulyanhulu, Buzwagi (notwithstanding the completion of the Acacia transaction on September 17, 2019, we consolidated our interest in Acacia and recorded a non-controlling interest of 36.1% in the income statement for the entirety of the third quarter of 2019 as a matter of convenience) and Nevada Gold Mines starting July 1, 2019. Refer to note 5 to the Financial Statements for further information.
| e. | Exploration and evaluation costs |
Exploration, evaluation and project expenses are presented as minesite sustaining if it supports current mine operations and project if it relates to future projects. Refer to page 72 of this MD&A.
| f. | Capital expenditures |
Capital expenditures are related to our gold sites only and are split between minesite sustaining and project capital expenditures. Project capital expenditures are distinct projects designed to increase the net present value of the mine and are not related to current production. Significant projects in the current year are the expansion project at Pueblo Viejo, the Goldrush exploration declines, the restart of mining activities at Bulyanhulu, and construction of the third shaft at Turquoise Ridge. Refer to page 71 of this MD&A.
| g. | Rehabilitation—accretion and amortization |
Includes depreciation on the assets related to rehabilitation provisions of our gold operations and accretion on the rehabilitation provision of our gold operations, split between operating and non-operating sites.
| h. | Non-controlling interest and copper operations |
Removes general & administrative costs related to non-controlling interests and copper based on a percentage allocation of revenue. Also removes exploration, evaluation and project expenses, rehabilitation costs and capital expenditures incurred by our copper sites and the non-controlling interest of North Mara, Bulyanhulu and Buzwagi (notwithstanding the completion of the Acacia transaction on September 17, 2019, we consolidated our interest in Acacia and recorded a non-controlling interest of 36.1% in the income statement for the entirety of the third quarter of 2019 as a matter of convenience), Pueblo Viejo, Loulo-Gounkoto and Tongon operating segments and South Arturo (63.1% of South Arturo from July 1, 2019 onwards as a result of its contribution to Nevada Gold Mines). Also removes the non-controlling interest of Nevada Gold Mines starting July 1, 2019. It also includes capital expenditures applicable to equity method investments. Figures remove the impact of Pierina; Golden Sunlight and Morila starting in the third quarter of 2019; and Lagunas Norte starting in the fourth quarter of 2019. The impact is summarized as the following:
| ($ millions) | For the three months ended | For the six months ended | ||||||||||||||||||
| Non-controlling interest, copper operations and other | 6/30/20 | 3/31/20 | 6/30/19 | 6/30/20 | 6/30/19 | |||||||||||||||
| General & administrative costs |
(8 | ) | (6 | ) | (23 | ) | (14 | ) | (33 | ) | ||||||||||
| Minesite exploration and evaluation expenses |
(8 | ) | (3 | ) | 0 | (11 | ) | (1 | ) | |||||||||||
| Rehabilitation - accretion and amortization (operating sites) |
(4 | ) | (4 | ) | (1 | ) | (8 | ) | (2 | ) | ||||||||||
| Minesite sustaining capital expenditures |
(138 | ) | (112 | ) | (52 | ) | (250 | ) | (115 | ) | ||||||||||
| All-in sustaining costs total |
(158 | ) | (125 | ) | (76 | ) | (283 | ) | (151 | ) | ||||||||||
| Project exploration and evaluation and project costs |
(9 | ) | (3 | ) | (26 | ) | (12 | ) | (28 | ) | ||||||||||
| Project capital expenditures |
(27 | ) | (14 | ) | (2 | ) | (41 | ) | (3 | ) | ||||||||||
| All-in costs total |
(36 | ) | (17 | ) | (28 | ) | (53 | ) | (31 | ) | ||||||||||
| i. | Ounces sold - equity basis |
Figures remove the impact of: Pierina; Golden Sunlight and Morila starting in the third quarter of 2019; and Lagunas Norte starting in the fourth quarter of 2019, which are producing incidental ounces as they reach the end of their mine lives.
| j. | Cost of sales per ounce |
Figures remove the cost of sales impact of: Pierina of $4 million and $10 million, respectively, for the three and six month periods ended June 30, 2020 (March 31, 2020: $6 million and June 30, 2019: $44 million and $71 million, respectively); starting in the third quarter of 2019, Golden Sunlight of $nil and $nil, respectively, for the three and six month periods ended June 30, 2020 (March 31, 2020: $nil and June 30, 2019: $nil and $nil, respectively) and Morila of $8 million and $14 million, respectively, for the three and six month periods ended June 30, 2020 (March 31, 2020: $6 million and June 30, 2019: $nil and $nil, respectively); and starting in the fourth quarter of 2019, Lagunas Norte of $23 million and $43 million, respectively, for the three and six month periods ended June 30, 2020 (March 31, 2020: $21 million and June 30, 2019: $nil and $nil, respectively), which are producing incidental ounces as as they reach the end of their mine lives. Cost of sales per ounce excludes non-controlling interest related to gold production. Cost of sales applicable to gold per ounce is calculated using cost of sales on an attributable basis (removing the non-controlling interest of 40% Pueblo Viejo, 20% of Loulo- Gounkoto, 10.3% of Tongon, 16% North Mara, Bulyanhulu and Buzwagi starting January 1, 2020, the effective date of the GoT’s free carried interest (36.1% up until September 30, 2019; notwithstanding the completion of the Acacia transaction on September 17, 2019, we consolidated our interest in Acacia and recorded a non-controlling interest of 36.1% in the income statement for the entirety of the third quarter of 2019 as a matter of convenience) and 40% South Arturo from cost of sales (63.1% of South Arturo from July 1, 2019 onwards as a result of its contribution to Nevada Gold Mines)), divided by attributable gold ounces. The non-controlling interest of 38.5% Nevada Gold Mines is also removed from cost of sales from July 1, 2019 onwards.
| k. | Per ounce figures |
Cost of sales per ounce, total cash costs per ounce, all-in sustaining costs per ounce and all-in costs per ounce may not calculate based on amounts presented in this table due to rounding.
| BARRICK SECOND QUARTER 2020 |
17 | PRESS RELEASE |
| l. | Co-product costs per ounce |
Total cash costs per ounce, all-in sustaining costs per ounce and all-in costs per ounce presented on a co-product basis removes the impact of by-product credits of our gold production (net of non-controlling interest) calculated as:
| ($ millions) | For the three months ended | For the six months ended | ||||||||||||||||||
| 6/30/20 | 3/31/20 | 6/30/19 | 6/30/20 | 6/30/19 | ||||||||||||||||
| By-product credits |
59 | 29 | 23 | 88 | 47 | |||||||||||||||
| Non-controlling interest |
(22 | ) | (15 | ) | (7 | ) | (37 | ) | (15 | ) | ||||||||||
| By-product credits (net of non-controlling interest) |
37 | 14 | 16 | 51 | 32 | |||||||||||||||
Endnote 9
Amounts reflect production and sales from Jabal Sayid and Zaldívar on a 50% basis, which reflects our equity share of production, and Lumwana.
Endnote 10
Copper cost of sales (Barrick’s share) is calculated as cost of sales - copper plus our equity share of cost of sales attributable to Zaldívar and Jabal Sayid divided by pounds sold.
Endnote 11
“C1 cash costs” per pound and “All-in sustaining costs” per pound are non-GAAP financial performance measures. “C1 cash costs” per pound is based on cost of sales but excludes the impact of depreciation and royalties and production taxes and includes treatment and refinement charges. “All-in sustaining costs” per pound begins with “C1 cash costs” per pound and adds further costs which reflect the additional costs of operating a mine, primarily sustaining capital expenditures, general & administrative costs and royalties and production taxes. Barrick believes that the use of “C1 cash costs” per pound and “all-in sustaining costs” per pound will assist investors, analysts, and other stakeholders in understanding the costs associated with producing copper, understanding the economics of copper mining, assessing our operating performance, and also our ability to generate free cash flow from current operations and to generate free cash flow on an overall Company basis. “C1 cash costs” per pound and “All-in sustaining costs” per pound are intended to provide additional information only, do not have any standardized meaning under IFRS, and may not be comparable to similar measures of performance presented by other companies. These measures should not be considered in isolation or as a substitute for measures of performance prepared in accordance with IFRS. Further details on these non-GAAP measures are provided in the MD&A accompanying Barrick’s financial statements filed from time to time on SEDAR at www.sedar.com and on EDGAR at www.sec.gov.
Reconciliation of Copper Cost of Sales to C1 cash costs and All-in sustaining costs, including on a per pound basis
| ($ millions, except per pound information in dollars) | For the three months ended | For the six months ended | ||||||||||||||||||
| 6/30/20 | 3/31/20 | 6/30/19 | 6/30/20 | 6/30/19 | ||||||||||||||||
| Cost of sales |
153 | 124 | 101 | 277 | 232 | |||||||||||||||
| Depreciation/amortization |
(63 | ) | (43 | ) | (28 | ) | (106 | ) | (70 | ) | ||||||||||
| Treatment and refinement charges |
40 | 39 | 25 | 79 | 56 | |||||||||||||||
| Cash cost of sales applicable to equity method investments |
72 | 66 | 69 | 138 | 135 | |||||||||||||||
| Less: royalties and production taxesa |
(11 | ) | (11 | ) | (9 | ) | (22 | ) | (21 | ) | ||||||||||
| By-product credits |
(3 | ) | (3 | ) | (2 | ) | (6 | ) | (5 | ) | ||||||||||
| Other |
0 | 0 | (5 | ) | 0 | (5 | ) | |||||||||||||
| C1 cash costs |
188 | 172 | 151 | 360 | 322 | |||||||||||||||
| General & administrative costs |
6 | 3 | 6 | 9 | 11 | |||||||||||||||
| Rehabilitation - accretion and amortization |
2 | 3 | 3 | 5 | 6 | |||||||||||||||
| Royalties and production taxesa |
11 | 11 | 9 | 22 | 21 | |||||||||||||||
| Minesite exploration and evaluation costs |
1 | 1 | 1 | 2 | 3 | |||||||||||||||
| Minesite sustaining capital expenditures |
52 | 32 | 48 | 84 | 107 | |||||||||||||||
| Sustaining leases |
2 | 3 | 1 | 5 | 2 | |||||||||||||||
| All-in sustaining costs |
262 | 225 | 219 | 487 | 472 | |||||||||||||||
| Pounds sold - consolidated basis (millions pounds) |
123 | 110 | 96 | 233 | 199 | |||||||||||||||
| Cost of sales per poundb,c |
2.08 | 1.96 | 2.04 | 2.03 | 2.13 | |||||||||||||||
| C1 cash cost per poundb |
1.55 | 1.55 | 1.59 | 1.55 | 1.62 | |||||||||||||||
| All-in sustaining costs per poundb |
2.15 | 2.04 | 2.28 | 2.10 | 2.37 | |||||||||||||||
| a. | For the three and six month period ended June 30, 2020, royalties and production taxes include royalties of $11 million and $22 million respectively (March 31, 2020: $11 million and June 30, 2019: $9 million and $21 million respectively). |
| b. | Cost of sales per pound, C1 cash costs per pound and all-in sustaining costs per pound may not calculate based on amounts presented in this table due to rounding. |
| c. | Cost of sales applicable to copper per pound is calculated using cost of sales including our proportionate share of cost of sales attributable to equity method investments (Zaldívar and Jabal Sayid), divided by consolidated copper pounds (including our proportionate share of copper pounds from our equity method investments). |
| BARRICK SECOND QUARTER 2020 |
18 | PRESS RELEASE |
Endnote 12
Barrick defines a Tier One mine as one that produces in excess of 500,000 ounces of gold per annum and has a life of at least 10 years.
Endnote 13
On a 100% basis and pending completion of updated feasibility studies at Bulyanhulu.
Endnote 14
The declaration and payment of dividends is at the discretion of the Board of Directors, and will depend on the company’s financial results, cash requirements, future prospects and other factors deemed relevant by the Board.
Endnote 15
Cost of sales applicable to gold per ounce is calculated using cost of sales applicable to gold on an attributable basis (removing the non-controlling interest of 40% Pueblo Viejo; 20% Loulo-Gounkoto; 10.3% Tongon; 16% North Mara, Bulyanhulu and Buzwagi starting January 1, 2020, the date the GoT’s 16% free carried interest was made effective (36.1% from January 1, 2019 to September 30, 2019; notwithstanding the completion of the Acacia transaction on September 17, 2019, we consolidated our interest in Acacia and recorded a non-controlling interest of 36.1% in the income statement for the entirety of the third quarter of 2019 as a matter of convenience); 63.1% South Arturo from cost of sales from July 1, 2019 onwards as a result of its contribution to Nevada Gold Mines (and on a 40% basis from January 1, 2019 to June 30, 2019); and our proportionate share of cost of sales attributable to equity method investments (Kibali, and Morila until the second quarter of 2019), divided by attributable gold ounces. Also removes the non-controlling interest of 38.5% Nevada Gold Mines from cost of sales from July 1, 2019 onwards. Cost of sales applicable to copper per pound is calculated using cost of sales applicable to copper including our proportionate share of cost of sales attributable to equity method investments (Zaldívar and Jabal Sayid), divided by consolidated copper pounds (including our proportionate share of copper pounds from our equity method investments).
Endnote 16
Includes our 36.9% share of South Arturo.
Endnote 17
Based on the communication we received from the Government of Papua New Guinea that the SML will not be extended, Porgera was placed on temporary care and maintenance on April 25, 2020 to ensure the safety and security of our employees and communities. Due to the uncertainty related to the timing and scope of future developments on the mine’s operating outlook, our full year 2020 guidance for Porgera has been withdrawn.
Endnote 18
Amounts are on an 84% basis as the GoT’s 16% free-carried interest was made effective from January 1, 2020.
Endnote 19
Total cash costs and all-in sustaining costs per ounce include the impact of hedges and/or costs allocated to non-operating sites.
Endnote 20
Operating unit guidance ranges reflect expectations at each individual operating unit, and may not add up to the company-wide guidance range total. Guidance ranges exclude Pierina, Lagunas Norte, Golden Sunlight and Morila (40%).
Endnote 21
Includes corporate administration costs.
Endnote 22
2020 Guidance includes our 61.5% share of Nevada Gold Mines, our 60% share of Pueblo Viejo, our 80% share of Loulo-Gounkoto, our 89.7% share of Tongon, our 84% share of North Mara, Bulyanhulu and Buzwagi, our 50% share of Zaldívar and Jabal Sayid, and our 45% of Kibali, and our share of joint operations.
Endnote 23
Reflects the impact of the full year.
Endnote 24
EBITDA is a non-GAAP financial measure, which excludes the following from net earnings: income tax expense; finance costs; finance income; and depreciation. Management believes that EBITDA is a valuable indicator of our ability to generate liquidity by producing operating cash flow to fund working capital needs, service debt obligations, and fund capital expenditures. Management uses EBITDA for this purpose. Adjusted EBITDA removes the effect of impairment charges; acquisition/disposition gains/losses; foreign currency translation gains/losses; other expense adjustments; unrealized gains on non-hedge derivative instruments; and the impact of the income tax expense, finance costs, finance income and depreciation incurred in our equity method accounted investments. We believe these items provide a greater level of consistency with the adjusting items included in our Adjusted Net Earnings reconciliation, with the exception that these amounts are adjusted to remove any impact on finance costs/income, income tax expense and/or depreciation as they do not affect EBITDA. We believe this additional information will assist analysts, investors and other stakeholders of Barrick in better understanding our ability to generate liquidity from our full
| BARRICK SECOND QUARTER 2020 |
19 | PRESS RELEASE |
business, including equity method investments, by excluding these amounts from the calculation as they are not indicative of the performance of our core mining business and not necessarily reflective of the underlying operating results for the periods presented. EBITDA and adjusted EBITDA are intended to provide additional information only and do not have any standardized meaning under IFRS and may not be comparable to similar measures of performance presented by other companies. They should not be considered in isolation or as a substitute for measures of performance prepared in accordance with IFRS. Further details on these non-GAAP measures are provided in the MD&A accompanying Barrick’s financial statements filed from time to time on SEDAR at www.sedar.com and on EDGAR at www.sec.gov.
Reconciliation of Net Earnings to EBITDA and Adjusted EBITDA
| ($ millions) |
For the three months ended | For the six months ended | ||||||||||||||||||
| 6/30/20 | 3/31/20 | 6/30/19 | 6/30/20 | 6/30/19 | ||||||||||||||||
| Net earnings (loss) |
622 | 663 | 223 | 1,285 | 363 | |||||||||||||||
| Income tax expense |
258 | 386 | 41 | 644 | 208 | |||||||||||||||
| Finance costs, neta |
74 | 88 | 98 | 162 | 198 | |||||||||||||||
| Depreciation |
566 | 524 | 466 | 1,090 | 901 | |||||||||||||||
| EBITDA |
1,520 | 1,661 | 828 | 3,181 | 1,670 | |||||||||||||||
| Impairment charges (reversals) of long-lived assetsb |
23 | (336 | ) | 12 | (313 | ) | 15 | |||||||||||||
| Acquisition/disposition (gains) lossesc |
8 | (60 | ) | (12 | ) | (52 | ) | (12 | ) | |||||||||||
| Loss (gain) on currency translation |
2 | 16 | (6 | ) | 18 | 16 | ||||||||||||||
| Other expense (income) adjustmentsd |
48 | 98 | 58 | 146 | 104 | |||||||||||||||
| Income tax expense, net finance costs, and depreciation from equity investees |
96 | 87 | 92 | 183 | 181 | |||||||||||||||
| Adjusted EBITDA |
1,697 | 1,466 | 972 | 3,163 | 1,974 | |||||||||||||||
| a. | Finance costs exclude accretion. |
| b. | Net impairment charges for the three month period ended June 30, 2020 relate to miscellaneous assets. For the three month period ended March 31, 2020 and the six month period ended June 30, 2020, net impairment reversals primarily relate to non-current asset reversals at our Tanzanian assets. |
| c. | Acquisition/disposition gains for the three month period ended March 31, 2020 and the six month period ended June 30, 2020 primarily relate to the gain on the sale of Massawa. |
| d. | Other expense adjustments for the three and six month period ended June 30, 2020 primarily relate to care and maintenance expenses at Porgera and Covid-19 donations. The six month period ended June 30, 2020 was further impacted by changes in the discount rate assumptions on our closed mine rehabilitation provision. For the three month period ended March 31, 2020, other expense adjustments primarily relate to the impact of changes in the discount rate assumptions on our closed mine rehabilitation provision and losses on debt extinguishment. Other expense adjustments for the three and six month periods ended June 30, 2019 primarily relate to severance costs as a result of the implementation of a number of organizational reductions, the impact of changes in the discount rate assumptions on our closed mine rehabilitation provision and transaction costs related to Nevada Gold Mines. |
Endnote 25
Due to our hedging activities, which are reflected in these sensitivities, we are partially protected against changes in these
factors.
| BARRICK SECOND QUARTER 2020 |
20 | PRESS RELEASE |
Cautionary Statement on Forward-Looking Information
Serious News for Serious Traders! Try StreetInsider.com Premium Free!
You May Also Be Interested In
- Gold prices rally past $2,400 on reports of Israel strikes on Iran
- Proposed Increase in Size of Offer for Subscription and Re-Opening of Offer for Subscription to Further Applications
- Brüush Receives Additional Delisting Notification to Address at Hearing
Create E-mail Alert Related Categories
SEC FilingsSign up for StreetInsider Free!
Receive full access to all new and archived articles, unlimited portfolio tracking, e-mail alerts, custom newswires and RSS feeds - and more!
