

Form 6-K ASE Technology Holding For: Apr 28
 Tweet
Tweet Share
ShareUNITED
STATES
SECURITIES AND EXCHANGE COMMISSION
Washington, D.C. 20549
FORM 6-K
REPORT OF FOREIGN PRIVATE ISSUER PURSUANT TO RULE 13a-16 OR 15d-16
UNDER THE SECURITIES EXCHANGE ACT OF 1934
April 28, 2021
| Commission File Number 001-16125 | |
| ASE Technology Holding Co., Ltd. | |
| (Translation of registrant’s name into English) | |
26 Chin Third Road Nantze Export Processing Zone Kaoshiung, Taiwan Republic of China | |
| (Address of principal executive offices) | |
Indicate by check mark whether the registrant files or will file annual reports under cover of Form 20-F or Form 40-F.
| Form 20-F ☒ Form 40-F ☐ |
Indicate by check mark if the registrant is submitting the Form 6-K in paper as permitted by Regulation S-T Rule 101(b)(1): ☐
Note: Regulation S-T Rule 101(b)(1) only permits the submission in paper of a Form 6-K if submitted solely to provide an attached annual report to security holders.
Indicate by check mark if the registrant is submitting the Form 6-K in paper as permitted by Regulation S-T Rule 101(b)(7): ☐
Note: Regulation S-T Rule 101(b)(7) only permits the submission in paper of a Form 6-K if submitted to furnish a report or other document that the registrant foreign private issuer must furnish and make public under the laws of the jurisdiction in which the registrant is incorporated, domiciled or legally organized (the registrant’s “home country”), or under the rules of the home country exchange on which the registrant’s securities are traded, as long as the report or other document is not a press release, is not required to be and has not been distributed to the registrant’s security holders, and, if discussing a material event, has already been the subject of a Form 6-K submission or other Commission filing on EDGAR.
SIGNATURES
Pursuant to the requirements of the Securities Exchange Act of 1934, the registrant has duly caused this report to be signed on its behalf by the undersigned, thereunto duly authorized.
| ASE TECHNOLOGY HOLDING CO., LTD. | ||
| Date: April 28, 2021 | By: | /s/ Joseph Tung |
| Name: Joseph Tung | ||
| Title: Chief Financial Officer | ||

1 ASE Technology Holding Co., Ltd. April 28, 2021 ASE Technology Holding First Quarter 2021 Earnings Release
2 Safe Harbor Notice This presentation contains "forward - looking statements" within the meaning of Section 27A of the United States Securities Act of 1933, as amended, and Section 21E of the United States Securities Exchange Act of 1934, as amended. Although these forward - looking statements, which may include statements regarding our future results of operations, financial condition or business prospects, are based on our own information and information from other sources we believe to be reliable, you should not place undue reliance on these forward - looking statements, which apply only as of the date of this presentation. The words “anticipate,” “believe,” “estimate,” “expect,” “intend,” “plan” and similar expressions, as they relate to us, are intended to identify these forward - looking statements in this presentation. These forward - looking statements are necessarily estimates reflecting the best judgment of our senior management and our actual results of operations, financial condition or business prospects may differ materially from those expressed or implied by the forward - looking statements for reasons including, among others, risks associated with cyclicality and market conditions in the semiconductor or electronic industry; changes in our regulatory environment, including our ability to comply with new or stricter environmental regulations and to resolve environmental liabilities; demand for the outsourced semiconductor packaging, testing and electronic manufacturing services we offer and for such outsourced services generally; the highly competitive semiconductor or manufacturing industry we are involved in; our ability to introduce new technologies in order to remain competitive; international business activities; our business strategy; our future expansion plans and capital expenditures; the strained relationship between the Republic of China and the People’s Republic of China; general economic and political conditions; the recent shift in United States trade policies; possible disruptions in commercial activities caused by natural or human - induced disasters; fluctuations in foreign currency exchange rates; and other factors. For a discussion of these risks and other factors, please see the documents we file from time to time with the Securities and Exchange Commission, including the 2020 Annual Report on Form 20 - F filed on April 6, 2021.

3 Consolidated Statements of Comprehensive Income Quarterly Comparison (unaudited) (NT$ Million) Q1 / 2021 % Q4 / 2020 % Q1 / 2020 % QoQ YoY Net Revenues: ATM 71,184 59.6% 69,135 46.4% 64,150 65.9% 3% 11% EMS 47,684 39.9% 79,141 53.2% 32,721 33.6% -40% 46% Others 602 0.5% 601 0.4% 486 0.5% 0% 24% Total Net Revenues 119,470 100.0% 148,877 100.0% 97,357 100.0% -20% 23% Gross Profit 22,028 18.4% 23,299 15.7% 16,156 16.6% -5% 36% Operating Income (Loss) 11,066 9.3% 11,246 7.6% 6,063 6.2% -2% 83% Pretax Income (Loss) 11,338 9.5% 12,604 8.5% 5,237 5.4% -10% 116% Income Tax Benefit (Expense) (2,490) -2.1% (1,839) -1.2% (1,175) -1.2% Non-controlling Interest (283) -0.2% (721) -0.5% (163) -0.2% Net Income Attributable to Shareholders of the Parent 8,565 7.2% 10,044 6.7% 3,899 4.0% -15% 120% Basic EPS 1.99 2.35 0.92 -15% 116% Diluted EPS 1.94 2.30 0.89 -16% 118% Additional Commentary From Management: Gross Profit excl. PPA expenses 1 22,911 19.2% 24,184 16.2% 17,205 17.7% -5% 33% Operating Profit excl. PPA expenses 1 12,202 10.2% 12,383 8.3% 7,365 7.6% -1% 66% Net Profit excl. PPA expenses 1 9,745 8.2% 11,239 7.5% 5,231 5.4% -13% 86% Basic EPS excl. PPA expenses 1 2.26 2.63 1.23 -14% 84% 1 : PPA expenses are the P&L impacts from the accounting treatment of purchase price allocation in relation to the ASE/SPIL transaction, which resulted in increased asset values from purchase price premiums in PP&E, intangibles and right - of - use assets. The PPA expenses excluded are related to depreciation, amortization and other expenses $1.18bn in 1Q21, $1.20bn in 4Q20 and $1.33bn in 1Q20.

4 ATM Statements of Comprehensive Income Quarterly Comparison (unaudited) (NT$ Million) Q1 / 2021 % Q4 / 2020 % Q1 / 2020 % QoQ YoY Net Revenues: Packaging 61,545 83.4% 60,825 83.6% 53,600 81.0% 1% 15% Testing 11,131 15.1% 10,667 14.7% 11,566 17.5% 4% -4% Direct Material 1,044 1.4% 1,229 1.7% 1,014 1.5% -15% 3% Others 47 0.1% 31 0.0% 29 0.0% 52% 62% Total Net Revenues 73,767 100.0% 72,752 100.0% 66,209 100.0% 1% 11% Gross Profit 18,007 24.4% 16,478 22.6% 13,334 20.1% 9% 35% Operating Income (Loss) 9,918 13.4% 8,002 11.0% 5,572 8.4% 24% 78% Additional Commentary From Management: Gross Profit excl. PPA expenses 1 18,890 25.6% 17,363 23.9% 14,383 21.7% 9% 31% Operating Profit excl. PPA expenses 1 11,054 15.0% 9,139 12.6% 6,874 10.4% 21% 61% 1 : PPA expenses are the P&L impacts from the accounting treatment of purchase price allocation in relation to the ASE/SPIL transaction, which resulted in increased asset values from purchase price premiums in PP&E, intangibles and right - of - use assets. The PPA expenses excluded are related to depreciation, amortization and other expenses $1.18bn in 1Q21, $ 1.20bn in 4Q20 and $ 1.33bn in 1Q20.

5 ATM Operations (unaudited) 13,334 15,082 14,540 16,478 18,007 66,209 69,516 71,820 72,752 73,767 20.1% 21.7% 20.2% 22.6% 24.4% 0% 10% 20% 30% 40% 0 20,000 40,000 60,000 80,000 Q1/20 Q2/20 Q3/20 Q4/20 Q1/21 NT$ Million Gross Profit Gross Margin Revenue

6 ATM Revenue by Application (unaudited) 54% 54% 53% 52% 50% 15% 14% 14% 14% 14% 31% 32% 33% 34% 36% 0% 20% 40% 60% 80% 100% Q1/20 Q2/20 Q3/20 Q4/20 Q1/21 Communication Computing Automotive, Consumer & Others

7 38% 38% 37% 35% 34% 36% 35% 37% 39% 40% 7% 7% 8% 9% 9% 17% 18% 17% 15% 15% 2% 2% 1% 2% 2% 0% 20% 40% 60% 80% 100% Q1/20 Q2/20 Q3/20 Q4/20 Q1/21 Material Testing Discrete and Other Wirebonding Bump/FC/WLP /SiP ATM Revenue by Type (unaudited)

8 EMS Operations Quarterly Comparison & Revenue By Application (unaudited ) (NT$ Million) Q1 / 2021 % Q4 / 2020 % Q1 / 2020 % QoQ YoY EMS Net Revenues 47,693 100.0% 79,149 100.0% 32,727 100.0% -40% 46% Gross Profit 4,153 8.7% 6,996 8.8% 3,048 9.3% -41% 36% Operating Income (Loss) 1,333 2.8% 3,463 4.4% 771 2.4% -62% 73% 36% 46% 40% 45% 39% 14% 12% 6% 4% 7% 33% 28% 40% 39% 33% 11% 10% 9% 8% 14% 6% 3% 4% 3% 5% 1% 1% 1% 2% 0% 20% 40% 60% 80% 100% Q1/20 Q2/20 Q3/20 Q4/20 Q1/21 Communication Computing & Storage Consumer Industrial Automotive Others

9 Key Balance Sheet Items & Indices (unaudited) (NT$ Million) Mar. 31, 2021 Dec. 31, 2020 Cash and cash equivalent 73,783 51,538 Financial assets - current 5,114 4,894 Financial assets - non current & investments - equity method 18,797 17,041 Property, plant & equipment 236,865 233,207 Total assets 606,229 583,091 Short-term loans 41,186 34,598 Current portion of bonds payable 3,699 7,000 Current portion of long-term loans 4,434 4,220 Bonds payable 48,457 49,254 Long-term loans & long-term bills payable 124,247 108,170 Total interest bearing debts 228,237 209,118 Total liabilities 360,124 348,834 Total equity (Including non-controlling interest) 246,105 234,257 Quarterly EBITDA 24,940 26,130 Current ratio 1.44 1.30 Net debt to equity ratio 0.61 0.65

10 Equipment Capital Expenditure vs. EBITDA (unaudited) 410 495 415 379 471 635 751 788 908 881 0 200 400 600 800 1,000 Q1/20 Q2/20 Q3/20 Q4/20 Q1/21 US$ Million Capex EBITDA
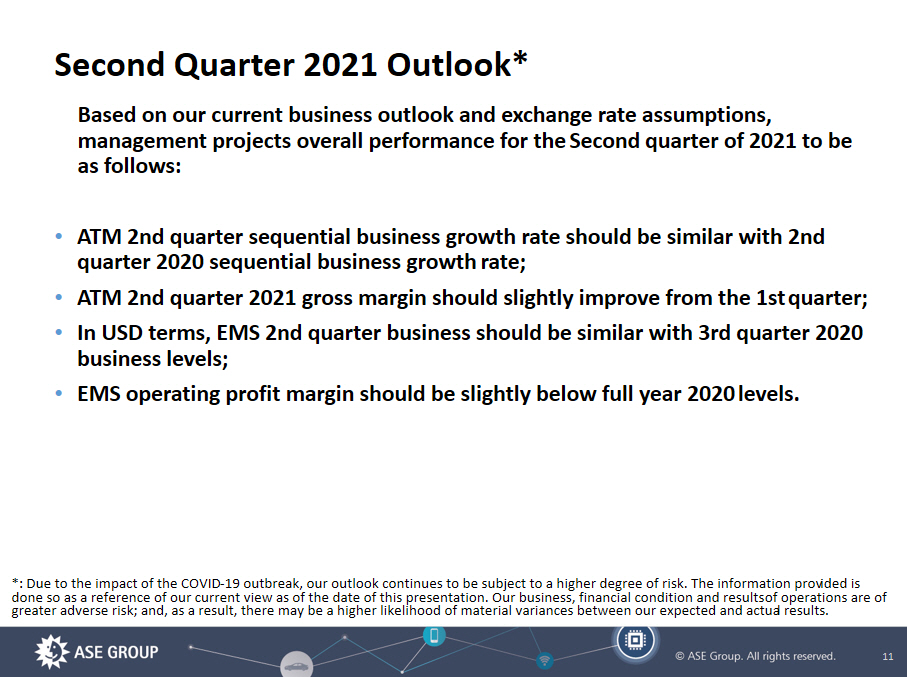
11 Second Quarter 2021 Outlook* Based on our current business outlook and exchange rate assumptions, management projects overall performance for the Second quarter of 2021 to be as follows: • ATM 2nd quarter sequential business growth rate should be similar with 2nd quarter 2020 sequential business growth rate; • ATM 2nd quarter 2021 gross margin should slightly improve from the 1st quarter; • In USD terms, EMS 2nd quarter business should be similar with 3rd quarter 2020 business levels; • EMS operating profit margin should be slightly below full year 2020 levels. *: Due to the impact of the COVID - 19 outbreak, our outlook continues to be subject to a higher degree of risk. The information prov ided is done so as a reference of our current view as of the date of this presentation. Our business, financial condition and results of operations are of greater adverse risk; and, as a result, there may be a higher likelihood of material variances between our expected and actua l r esults .

12 www.aseglobal.com Thank You
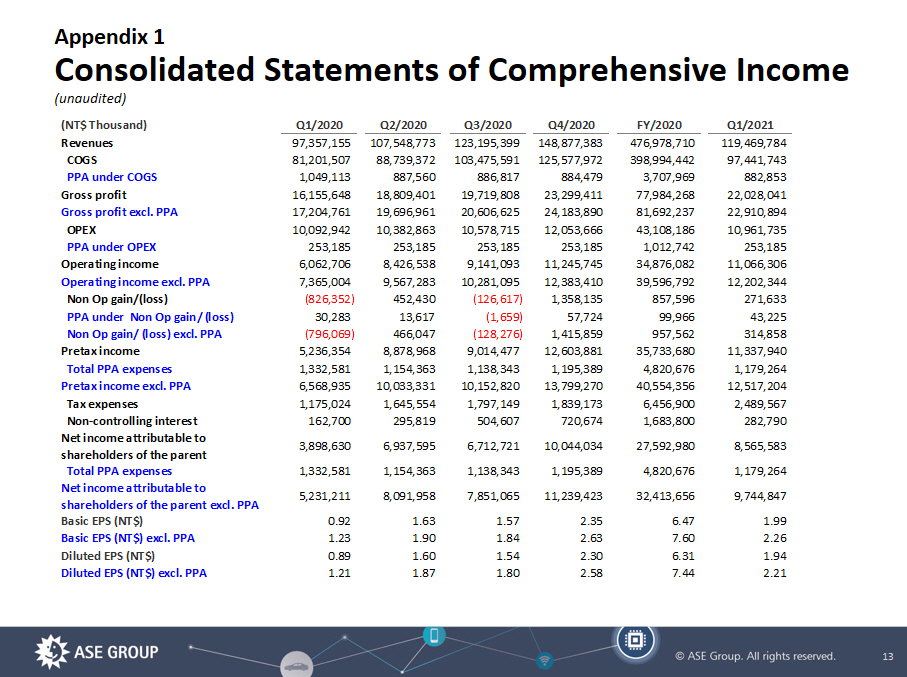
13 Appendix 1 Consolidated Statements of Comprehensive Income ( unaudited) (NT$ Thousand) Q1/2020 Q2/2020 Q3/2020 Q4/2020 FY/2020 Q1/2021 Revenues 97,357,155 107,548,773 123,195,399 148,877,383 476,978,710 119,469,784 COGS 81,201,507 88,739,372 103,475,591 125,577,972 398,994,442 97,441,743 PPA under COGS 1,049,113 887,560 886,817 884,479 3,707,969 882,853 Gross profit 16,155,648 18,809,401 19,719,808 23,299,411 77,984,268 22,028,041 Gross profit excl. PPA 17,204,761 19,696,961 20,606,625 24,183,890 81,692,237 22,910,894 OPEX 10,092,942 10,382,863 10,578,715 12,053,666 43,108,186 10,961,735 PPA under OPEX 253,185 253,185 253,185 253,185 1,012,742 253,185 Operating income 6,062,706 8,426,538 9,141,093 11,245,745 34,876,082 11,066,306 Operating income excl. PPA 7,365,004 9,567,283 10,281,095 12,383,410 39,596,792 12,202,344 Non Op gain/(loss) (826,352) 452,430 (126,617) 1,358,135 857,596 271,633 PPA under Non Op gain/ (loss) 30,283 13,617 (1,659) 57,724 99,966 43,225 Non Op gain/ (loss) excl. PPA (796,069) 466,047 (128,276) 1,415,859 957,562 314,858 Pretax income 5,236,354 8,878,968 9,014,477 12,603,881 35,733,680 11,337,940 Total PPA expenses 1,332,581 1,154,363 1,138,343 1,195,389 4,820,676 1,179,264 Pretax income excl. PPA 6,568,935 10,033,331 10,152,820 13,799,270 40,554,356 12,517,204 Tax expenses 1,175,024 1,645,554 1,797,149 1,839,173 6,456,900 2,489,567 Non-controlling interest 162,700 295,819 504,607 720,674 1,683,800 282,790 Net income attributable to shareholders of the parent 3,898,630 6,937,595 6,712,721 10,044,034 27,592,980 8,565,583 Total PPA expenses 1,332,581 1,154,363 1,138,343 1,195,389 4,820,676 1,179,264 Net income attributable to shareholders of the parent excl. PPA 5,231,211 8,091,958 7,851,065 11,239,423 32,413,656 9,744,847 Basic EPS (NT$) 0.92 1.63 1.57 2.35 6.47 1.99 Basic EPS (NT$) excl. PPA 1.23 1.90 1.84 2.63 7.60 2.26 Diluted EPS (NT$) 0.89 1.60 1.54 2.30 6.31 1.94 Diluted EPS (NT$) excl. PPA 1.21 1.87 1.80 2.58 7.44 2.21
Serious News for Serious Traders! Try StreetInsider.com Premium Free!
You May Also Be Interested In
- Landstar System Reports First Quarter Revenue of $1.171B and Earnings Per Share of $1.32
- Entourage Health to Report Fiscal Year 2023 Financial Results
- AMH Releases 2023 Sustainability Report
Create E-mail Alert Related Categories
SEC FilingsSign up for StreetInsider Free!
Receive full access to all new and archived articles, unlimited portfolio tracking, e-mail alerts, custom newswires and RSS feeds - and more!
