

Form 424B3 RREEF Property Trust,
 Tweet
Tweet Share
ShareFiled Pursuant to Rule 424(b)(3)
Registration No. 333-232425
RREEF PROPERTY TRUST, INC.
SUPPLEMENT NO. 2 DATED MAY 17, 2022
TO THE PROSPECTUS DATED APRIL 18, 2022
This document supplements, and should be read in conjunction with, our prospectus dated April 18, 2022, as supplemented by Supplement No. 1 dated May 6, 2022. Unless otherwise defined herein, capitalized terms shall have the same meanings as set forth in the prospectus.
The purpose of this supplement is to disclose:
•an update to the valuation of our properties;
•an update to the “Experts” section of our prospectus; and
•our Quarterly Report on Form 10-Q for the period ended March 31, 2022.
Valuation of Properties
The estimated value of our investments in real estate as of March 31, 2022 was $592,000,000. Altus Group U.S. Inc. serves as our independent valuation advisor. Altus Group is responsible for providing an opinion of fair value in individual appraisal reports or expressing an opinion as to the reasonableness of the value expressed in individual third-party appraisal reports based on its review of the underlying reports. Altus Group does not calculate and is not responsible for our daily NAV per share for any class of our shares.
Experts
The following disclosure is added to the “Experts” section of our prospectus.
The estimated value of our investments in real estate as of March 31, 2022 presented on page 1 of this Supplement No. 2 under the section “Valuation of Properties” has been reviewed by Altus Group U.S. Inc., an independent valuation firm, and represents the sum of the estimated values of our investments in real estate as of March 31, 2022 as derived from property valuations, appraisals and acquisitions contained in a schedule submitted by Altus Group in accordance with the process described in our prospectus under the captions “Net Asset Value Calculation and Valuation Guidelines—Our Independent Valuation Advisor” and “Net Asset Value Calculation and Valuation Guidelines—Valuation of Properties,” and is included in this Supplement No. 2 given the authority of such firm as experts in property valuations and appraisals. Altus Group is responsible for providing an opinion of fair value in individual appraisal reports or expressing an opinion as to the reasonableness of the value expressed in individual third-party appraisal reports based on its review of the underlying reports. Altus Group does not calculate and is not responsible for our daily NAV per share for any class of our shares.
Quarterly Report on Form 10-Q
The prospectus is hereby supplemented with our Quarterly Report on Form 10-Q, excluding exhibits, for the period ended March 31, 2022 that was filed with the SEC on May 12, 2022, a copy of which is attached to this Supplement No. 2 as Appendix A.
Appendix A
UNITED STATES
SECURITIES AND EXCHANGE COMMISSION
Washington, D.C. 20549
__________________________________________
Form 10-Q
_________________________________________
| ☒ | QUARTERLY REPORT PURSUANT TO SECTION 13 OR 15(d) OF THE SECURITIES EXCHANGE ACT OF 1934 | ||||
For the quarterly period ended March 31, 2022
OR
| ☐ | TRANSITION REPORT PURSUANT TO SECTION 13 OR 15(d) OF THE SECURITIES EXCHANGE ACT OF 1934 | ||||
For the transition period from ____ to ____
Commission file number 000-55598
__________________________________________
RREEF Property Trust, Inc.
(Exact name of registrant as specified in its charter)
__________________________________________
| Maryland | 45-4478978 | ||||
| (State or other jurisdiction of incorporation or organization) | (I.R.S. Employer Identification Number) | ||||
875 Third Avenue, 26th Floor, New York, NY 10022 | (212) 454-4500 | ||||
| (Address of principal executive offices; zip code) | (Registrant’s telephone number, including area code) | ||||
Not Applicable
(Former name, former address and former fiscal year, if changed since last report)
________________________________________________________________________
Securities registered pursuant to Section 12(b) of the Act: None.
Indicate by check mark whether the registrant (1) has filed all reports required to be filed by Section 13 or 15(d) of the Securities Exchange Act of 1934 during the preceding 12 months (or for such shorter period that the registrant was required to file such reports), and (2) has been subject to such filing requirements for the past 90 days. Yes x No o
Indicate by check mark whether the registrant has submitted electronically every Interactive Data File required to be submitted pursuant to Rule 405 of Regulation S-T (§ 232.405 of this chapter) during the preceding 12 months (or for such shorter period that the registrant was required to submit such files). Yes x No o
Indicate by check mark whether the registrant is a large accelerated filer, an accelerated filer, a non-accelerated filer, smaller reporting company or an emerging growth company. See the definitions of “large accelerated filer,” “accelerated filer,” “smaller reporting company,” and “emerging growth company” in Rule 12b-2 of the Exchange Act.
| Large accelerated filer | o | Accelerated filer | o | ||||||||
| Non-accelerated filer | x | Smaller reporting company | ☒ | ||||||||
| Emerging growth company | ☐ | ||||||||||
If an emerging growth company, indicate by check mark if the registrant has elected not to use the extended transition period for complying with any new or revised financial accounting standards provided pursuant to Section 13(a) of the Exchange Act. o
Indicate by check mark whether the registrant is a shell company (as defined in Rule 12b-2 of the Exchange Act). Yes ☐ No x
As of May 10, 2022, the registrant had 4,212,161 shares of Class A common stock, $.01 par value, outstanding, 13,023,052 shares of Class I common stock, $.01 par value, outstanding, 606,823 shares of Class T common stock, $.01 par value, outstanding, 2,805,038 shares of Class D common stock, $.01 par value, outstanding, 426,051 shares of Class N common stock, $.01 par value, outstanding, 185,776 shares of Class M-I common stock, $.01 par value, outstanding, 171,254 shares of Class T2 common stock, $.01 par value, outstanding, 75,000 shares of Class Z common stock, $.01 par value and no shares of Class S common stock, $.01 par value, outstanding.
RREEF PROPERTY TRUST, INC.
QUARTERLY REPORT ON FORM 10-Q
For the Quarter Ended March 31, 2022
TABLE OF CONTENTS
3
PART I
FINANCIAL INFORMATION
ITEM 1. FINANCIAL STATEMENTS
RREEF PROPERTY TRUST, INC.
CONSOLIDATED BALANCE SHEETS
(in thousands, except share and per share data)
| March 31, 2022 (unaudited) | December 31, 2021 | ||||||||||
| ASSETS | |||||||||||
| Investment in real estate assets: | |||||||||||
| Land | $ | 135,169 | $ | 135,169 | |||||||
Buildings and improvements, less accumulated depreciation of $37,833 and $35,225, respectively | 265,311 | 267,826 | |||||||||
Furniture, fixtures and equipment, less accumulated depreciation of $907 and $658, respectively | 3,021 | 3,226 | |||||||||
Acquired intangible lease assets, less accumulated amortization of $38,795 and $35,976, respectively | 28,192 | 31,011 | |||||||||
| Total investment in real estate assets, net | 431,693 | 437,232 | |||||||||
| Investment in marketable securities | 34,680 | 36,825 | |||||||||
| Total investment in real estate assets and marketable securities, net | 466,373 | 474,057 | |||||||||
| Cash and cash equivalents | 5,765 | 7,131 | |||||||||
Receivables, net of allowance for doubtful accounts of $7 and $22, respectively | 6,763 | 6,113 | |||||||||
Deferred leasing costs, net of amortization of $1,677 and $1,559, respectively | 2,560 | 2,673 | |||||||||
| Prepaid and other assets | 2,327 | 1,641 | |||||||||
| Total assets | $ | 483,788 | $ | 491,615 | |||||||
| LIABILITIES AND STOCKHOLDERS' EQUITY | |||||||||||
| Line of credit, net | $ | 71,183 | $ | 82,152 | |||||||
| Mortgage loans payable, net | 190,862 | 191,001 | |||||||||
| Accounts payable and accrued expenses | 3,199 | 3,503 | |||||||||
| Due to affiliates | 19,090 | 22,921 | |||||||||
Note to affiliate, net of unamortized discount of $598 and $642, respectively | 4,785 | 4,741 | |||||||||
Acquired below market lease intangibles, less accumulated amortization of $6,305 and $6,090, respectively | 12,260 | 12,475 | |||||||||
| Distributions payable | 702 | 627 | |||||||||
| Other liabilities | 2,349 | 2,444 | |||||||||
| Total liabilities | 304,430 | 319,864 | |||||||||
| Stockholders' Equity: | |||||||||||
Preferred stock, none issued | — | — | |||||||||
Class A common stock, 4,220,026 and 4,105,093 issued and outstanding, respectively | 42 | 41 | |||||||||
Class D common stock, 2,506,986 and 2,162,181 issued and outstanding, respectively | 25 | 22 | |||||||||
Class I common stock, 12,747,093 and 12,195,381 issued and outstanding, respectively | 127 | 122 | |||||||||
Class M-I common stock, 172,677 and 152,584 issued and outstanding, respectively | 2 | 1 | |||||||||
Class N common stock, 405,610 and 270,652 issued and outstanding, respectively | 4 | 3 | |||||||||
Class S common stock, none issued | — | — | |||||||||
Class T common stock, 660,173 and 770,097 issued and outstanding, respectively | 7 | 8 | |||||||||
Class T2 common stock, 171,778 and 105,435 issued and outstanding, respectively | 2 | 1 | |||||||||
Class Z common stock, 75,000 issued and outstanding | 1 | 1 | |||||||||
| Additional paid-in capital | 255,811 | 238,275 | |||||||||
| Deficit | (76,663) | (66,723) | |||||||||
| Total stockholders' equity | 179,358 | 171,751 | |||||||||
| Total liabilities and stockholders' equity | $ | 483,788 | $ | 491,615 | |||||||
The accompanying notes are an integral part of these consolidated financial statements.
4
RREEF PROPERTY TRUST, INC.
CONSOLIDATED STATEMENTS OF OPERATIONS
(Unaudited)
(in thousands, except share and per share data)
| Three Months Ended March 31, | |||||||||||
| 2022 | 2021 | ||||||||||
| Revenues | |||||||||||
| Property related income | $ | 10,143 | $ | 8,207 | |||||||
| Investment income on marketable securities | 233 | 144 | |||||||||
| Total revenues | 10,376 | 8,351 | |||||||||
| Expenses | |||||||||||
| General and administrative expenses | 537 | 554 | |||||||||
| Property operating expenses | 2,986 | 2,368 | |||||||||
| Advisory fees | 2,349 | 747 | |||||||||
| Depreciation | 2,857 | 1,635 | |||||||||
| Amortization | 2,900 | 1,422 | |||||||||
| Total operating expenses | 11,629 | 6,726 | |||||||||
| Net realized gain upon sale of marketable securities | 1,025 | 671 | |||||||||
| Net unrealized change in fair value of investment in marketable securities | (3,338) | 1,082 | |||||||||
| Operating (loss) income | (3,566) | 3,378 | |||||||||
| Interest expense | (2,144) | (1,685) | |||||||||
| Net (loss) income | $ | (5,710) | $ | 1,693 | |||||||
| Basic and diluted net (loss) income per share of Class A common stock | $ | (0.28) | $ | 0.11 | |||||||
| Basic and diluted net (loss) income per share of Class I common stock | $ | (0.28) | $ | 0.11 | |||||||
| Basic and diluted net (loss) income per share of Class T common stock | $ | (0.28) | $ | 0.11 | |||||||
| Basic and diluted net (loss) per share of Class D common stock | $ | (0.28) | $ | (0.11) | |||||||
| Basic and diluted net (loss) income per share of Class N common stock | $ | (0.28) | $ | 0.11 | |||||||
| Basic and diluted net (loss) per share of Class M-I common stock | $ | (0.30) | $ | — | |||||||
| Basic and diluted net (loss) per share of Class T2 common stock | $ | (0.30) | $ | — | |||||||
| Basic and diluted net (loss) per share of Class Z common stock | $ | (0.28) | $ | — | |||||||
The accompanying notes are an integral part of these consolidated financial statements.
4
RREEF PROPERTY TRUST, INC.
CONSOLIDATED STATEMENTS OF STOCKHOLDERS' EQUITY
(Unaudited)
(in thousands, except share and per share data)
| Preferred Stock | Common Stock | Additional Paid-in Capital | Deficit | Total Stockholders' Equity | |||||||||||||||||||||||||||||||
| Number of Shares | Par Value | Number of Shares | Par Value | ||||||||||||||||||||||||||||||||
| Balance, December 31, 2021 | — | $ | — | 19,836,423 | $ | 199 | $ | 238,275 | $ | (66,723) | $ | 171,751 | |||||||||||||||||||||||
| Issuance of common stock | — | — | 1,079,418 | 11 | 18,334 | — | 18,345 | ||||||||||||||||||||||||||||
| Issuance of common stock through the distribution reinvestment plan | — | — | 129,394 | 1 | 2,209 | — | 2,210 | ||||||||||||||||||||||||||||
| Redemption of common stock | — | — | (87,582) | (1) | (1,474) | — | (1,475) | ||||||||||||||||||||||||||||
| Distributions to investors | — | — | — | — | — | (4,230) | (4,230) | ||||||||||||||||||||||||||||
| Offering costs | — | — | — | — | (1,557) | — | (1,557) | ||||||||||||||||||||||||||||
| Equity based compensation | — | — | 1,690 | — | 24 | — | 24 | ||||||||||||||||||||||||||||
| Net loss | — | — | — | — | — | (5,710) | (5,710) | ||||||||||||||||||||||||||||
| Balance, March 31, 2022 | — | $ | — | 20,959,343 | $ | 210 | $ | 255,811 | $ | (76,663) | $ | 179,358 | |||||||||||||||||||||||
5
RREEF PROPERTY TRUST, INC.
CONSOLIDATED STATEMENTS OF STOCKHOLDERS' EQUITY
(Unaudited)
(in thousands, except share and per share data)
| Preferred Stock | Common Stock | Additional Paid-in Capital | Deficit | Total Stockholders' Equity | |||||||||||||||||||||||||||||||
| Number of Shares | Par Value | Number of Shares | Par Value | ||||||||||||||||||||||||||||||||
| Balance, December 31, 2020 | — | $ | — | 15,182,231 | $ | 152 | $ | 171,161 | $ | (58,350) | $ | 112,963 | |||||||||||||||||||||||
| Issuance of common stock | — | — | 378,116 | 3 | 5,520 | — | 5,523 | ||||||||||||||||||||||||||||
| Issuance of common stock through the distribution reinvestment plan | — | — | 94,352 | — | 1,374 | — | 1,374 | ||||||||||||||||||||||||||||
| Redemption of common stock | — | — | (265,403) | (2) | (3,847) | — | (3,849) | ||||||||||||||||||||||||||||
| Distributions to investors | — | — | — | — | — | (2,711) | (2,711) | ||||||||||||||||||||||||||||
| Offering costs | — | — | — | — | (748) | — | (748) | ||||||||||||||||||||||||||||
| Equity based compensation | — | — | 1,784 | — | 25 | — | 25 | ||||||||||||||||||||||||||||
| Net income | — | — | — | — | — | 1,693 | 1,693 | ||||||||||||||||||||||||||||
| Balance, March 31, 2021 | — | $ | — | 15,391,080 | $ | 153 | $ | 173,485 | $ | (59,368) | $ | 114,270 | |||||||||||||||||||||||
The accompanying notes are an integral part of these consolidated financial statements.
6
RREEF PROPERTY TRUST, INC.
CONSOLIDATED STATEMENTS OF CASH FLOWS
(Unaudited)
(in thousands)
| Three Months Ended March 31, | |||||||||||
| 2022 | 2021 | ||||||||||
| Cash flows from operating activities: | |||||||||||
| Net (loss) income | $ | (5,710) | $ | 1,693 | |||||||
| Adjustments to reconcile net (loss) income to net cash (used in) provided by operating activities: | |||||||||||
| Depreciation | 2,857 | 1,635 | |||||||||
| Net realized gain upon sale of marketable securities | (1,025) | (671) | |||||||||
| Net unrealized change in fair value of marketable securities | 3,338 | (1,082) | |||||||||
| Share based compensation | 24 | 25 | |||||||||
| Amortization of intangible lease assets and liabilities | 2,722 | 1,259 | |||||||||
| Amortization of deferred financing costs | 69 | 84 | |||||||||
| Straight line rent | (191) | (332) | |||||||||
| Amortization of discount on note to affiliate | 44 | 43 | |||||||||
| Changes in assets and liabilities: | |||||||||||
| Receivables, net | (389) | (58) | |||||||||
| Deferred leasing costs | (59) | (16) | |||||||||
| Prepaid and other assets | (689) | (470) | |||||||||
| Accounts payable and accrued expenses | (184) | 694 | |||||||||
| Other liabilities | (126) | 303 | |||||||||
| Due to affiliates | (4,525) | 205 | |||||||||
| Net cash (used in) provided by operating activities | (3,844) | 3,312 | |||||||||
| Cash flows from investing activities: | |||||||||||
| Improvements to real estate assets | (317) | (216) | |||||||||
| Investment in marketable securities | (10,833) | (4,996) | |||||||||
| Proceeds from sale of marketable securities | 10,585 | 4,944 | |||||||||
| Net cash used in investing activities | (565) | (268) | |||||||||
| Cash flows from financing activities: | |||||||||||
| Proceeds from line of credit | 6,000 | 1,000 | |||||||||
| Repayment of line of credit | (17,000) | (2,500) | |||||||||
| Repayment of mortgage loans payable | (177) | (86) | |||||||||
| Proceeds from issuance of common stock | 18,469 | 5,458 | |||||||||
| Payment of financing costs | — | (255) | |||||||||
| Payment of offering costs | (829) | (557) | |||||||||
| Distributions to investors | (1,945) | (1,318) | |||||||||
| Redemption of common stock | (1,475) | (3,914) | |||||||||
| Net cash provided by (used in) financing activities | 3,043 | (2,172) | |||||||||
| Net (decrease) increase in cash and cash equivalents | (1,366) | 872 | |||||||||
| Cash and cash equivalents, beginning of period | 7,131 | 4,133 | |||||||||
| Cash and cash equivalents, end of period | $ | 5,765 | $ | 5,005 | |||||||
The accompanying notes are an integral part of these consolidated financial statements.
7
RREEF PROPERTY TRUST, INC.
CONSOLIDATED STATEMENTS OF CASH FLOWS
(continued)
(Unaudited)
| Three Months Ended March 31, | |||||||||||
| Supplemental Disclosures of Non-Cash Investing and Financing Activities: | 2022 | 2021 | |||||||||
| Distributions declared and unpaid | $ | 702 | $ | 462 | |||||||
| Common stock issued through the distribution reinvestment plan | 2,210 | 1,374 | |||||||||
| Purchases of marketable securities not yet paid | 211 | 80 | |||||||||
| Proceeds from sale of marketable securities not yet received | 236 | 69 | |||||||||
| Proceeds from issuance of common stock not yet received | 25 | 151 | |||||||||
| Accrued offering costs not yet paid | 1,290 | 462 | |||||||||
| Capital expenditures not yet paid | 32 | 8 | |||||||||
| Supplemental Cash Flow Disclosures: | |||||||||||
| Interest paid | $ | 2,031 | $ | 1,554 | |||||||
The accompanying notes are an integral part of these consolidated financial statements.
8
RREEF PROPERTY TRUST, INC.
NOTES TO CONSOLIDATED FINANCIAL STATEMENTS
March 31, 2022
(Unaudited)
(in thousands except share and per share data)
NOTE 1 — ORGANIZATION
RREEF Property Trust, Inc. (the “Company”) was formed on February 7, 2012 as a Maryland corporation and has elected to qualify as a real estate investment trust (“REIT”) for federal income tax purposes. Substantially all of the Company's business is conducted through RREEF Property Operating Partnership, LP, the Company's operating partnership (the “Operating Partnership”). The Company is the sole general partner of the Operating Partnership. RREEF Property OP Holder, LLC (the “OP Holder”), a wholly-owned subsidiary of the Company, is the limited partner of the Operating Partnership. The Company's sponsor and advisor is RREEF America L.L.C. (“RREEF America”).
The Company invests primarily in a diversified portfolio consisting primarily of high quality, income-producing commercial real estate located in the United States, including, without limitation, office, industrial, retail and apartment properties (“Real Estate Properties”). Although the Company invests primarily in Real Estate Properties, it also acquires common and preferred stock of REITs and other real estate companies (“Real Estate Equity Securities”) and intends to invest in debt investments backed principally by real estate (“Real Estate Loans” and, together with Real Estate Equity Securities, “Real Estate-Related Assets”).
The Company raises capital through a combination of public and private offerings of its shares of common stock. On January 3, 2013, the Company commenced its initial public offering, which continued until June 30, 2016 (the “Initial Public Offering”). On July 12, 2016, the Company commenced its first follow-on public offering, which continued until January 8, 2020 (the “Follow-On Public Offering”).
On January 8, 2020, the Company commenced its second follow-on public offering which is currently ongoing (the “Second Follow-On Public Offering”). In the Second Follow-On Public Offering, the Company is offering to the public up to $2,300,000 in various classes of common stock: Class A shares, Class I shares, Class M-I shares, Class N shares, Class S shares, Class T shares and Class T2 shares (also see Note 9). Class N shares can only be acquired via (a) conversion from Class T shares in accordance with the provisions of Class T shares, and (b) thereafter via the Company’s distribution reinvestment program. The Company and its Operating Partnership entered into a dealer manager agreement (the “Dealer Manager Agreement”) with DWS Distributors, Inc. (the “Dealer Manager”), a registered broker-dealer and an affiliate of RREEF America, to conduct the Company's public offerings. Also see Note 8.
On January 20, 2016, the Company commenced a private offering of up to a maximum of $350,000 in Class D shares under Regulation D of the Securities Act of 1933 (the "Reg D Private Offering"). On November 17, 2020, the Company commenced a separate private offering of up to a maximum of $300,000 in Class D shares under Regulation S of the Securities Act of 1933 (the "Reg S Private Offering" and, together with the Reg D Private Offering, the "Private Offerings"). In addition, the Company has Class Z shares, which are expected to be offered only in a private offering to RREEF America.
Together, the Initial Public Offering, the Follow-On Public Offering, the Second Follow-On Public Offering and the Private Offerings are collectively referred to as the "Offerings."
Shares of the Company’s common stock are sold at the Company’s net asset value (“NAV”) per share, plus, for Class A, Class S, Class T, Class T2 and Class D shares only, applicable selling commissions. Each class of shares have a different NAV per share because of certain class-specific fees. NAV per share is calculated by dividing the NAV at the end of each business day for each class by the number of shares outstanding for that class on such day.
The Company's NAV per share for its Class A, Class I, Class T, Class D, Class M-I, Class T2, and Class N shares is posted to the Company's website at www.rreefpropertytrust.com after the stock market close each business day. Additionally, the Company's NAV per share for its Class A, Class I, Class T, Class D, Class M-I, Class T2, and Class N shares is published daily via NASDAQ's Mutual Fund Quotation System under the symbols ZRPTAX,
9
RREEF PROPERTY TRUST, INC.
NOTES TO CONSOLIDATED FINANCIAL STATEMENTS - continued
March 31, 2022
(Unaudited)
(in thousands, except share and per share data)
ZRPTIX, ZRPTTX, ZRPTDX, ZRPTMX, ZRPTUX, and ZRPTNX, respectively. The Company's NAV per share for its Class S shares will be available on the Company's website and via NASDAQ's Mutual Fund Quotation System once the first sale of shares for the share class has occurred.
NOTE 2 — SUMMARY OF SIGNIFICANT ACCOUNTING POLICIES
Basis of Presentation and Principles of Consolidation
The accompanying consolidated financial statements have been prepared in accordance with the Financial Accounting Standards Board (“FASB”) Accounting Standards Codification (“ASC”), the authoritative reference for U.S. generally accepted accounting principles (“GAAP”). There have been no significant changes to the Company's significant accounting policies during the three months ended March 31, 2022. The interim financial data as of March 31, 2022 and for the three months ended March 31, 2022 and 2021 is unaudited. In the Company’s opinion, the interim data includes all adjustments, consisting only of normal recurring adjustments, necessary for a fair presentation of the results for the interim periods.
Use of Estimates
The preparation of the consolidated financial statements in conformity with GAAP requires management to make estimates and assumptions that affect the amounts reported in the consolidated financial statements and accompanying notes. Actual results could differ from those estimates.
Real Estate Investments and Lease Intangibles
Entities are required to evaluate whether transactions should be accounted for as acquisitions (and dispositions) of assets or businesses. When substantially all of the fair value of the gross assets acquired (or disposed of) is concentrated in a single identifiable asset or a group of similar identifiable assets, the set is not a business. Generally, a real estate asset and its related leases will be considered a single identifiable asset and therefore will not meet the definition of a business. If the real estate and related leases in an acquisition are determined to be an asset and not a business, then the acquisition related costs would be capitalized onto the consolidated balance sheets. Otherwise, such costs will be expensed upon completion of the transaction.
The Company assesses the carrying values of real estate investments whenever events or changes in circumstances indicate that the carrying amount of these assets may not be fully recoverable, such as a reduction in the expected holding period of a property. A real estate investment is potentially impaired if the undiscounted cash flows to be realized over the expected hold period are less than the real estate investment’s carrying amount. In this case, an impairment loss will be recorded to the extent that the estimated fair value is lower than the real estate investment’s carrying amount. The estimated fair value is determined primarily using information contained within independent appraisals obtained quarterly by the Company from its independent valuation agent. Real estate investments that are expected to be disposed of are valued at the lower of carrying amount or estimated fair value less costs to sell. As of March 31, 2022 and December 31, 2021, none of the Company's real estate investments were impaired.
Organization and Offering Costs
Organizational expenses and other expenses which do not qualify as offering costs are expensed as incurred. Offering costs are those costs incurred by the Company, RREEF America and its affiliates on behalf of the Company which relate directly to the Company’s activities of raising capital in the Offerings, preparing for the Offerings, the qualification and registration of the Offerings and the marketing and distribution of the Company’s shares. This includes, but is not limited to, accounting and legal fees, including the legal fees of the dealer manager for the public offerings, costs for registration statement amendments and prospectus supplements, printing, mailing and distribution costs, filing fees, amounts to reimburse RREEF America as the Company’s advisor or its affiliates for the salaries of employees and other costs in connection with preparing supplemental sales literature, amounts to
10
RREEF PROPERTY TRUST, INC.
NOTES TO CONSOLIDATED FINANCIAL STATEMENTS - continued
March 31, 2022
(Unaudited)
(in thousands, except share and per share data)
reimburse the dealer manager for amounts that it may pay to reimburse the bona fide due diligence expenses of any participating broker-dealers supported by detailed and itemized invoices, telecommunication costs, fees of the transfer agent, registrars, trustees, depositories and experts, the cost of educational conferences held by the Company (including the travel, meal and lodging costs of registered representatives of any participating broker-dealers) and attendance fees and cost reimbursement for employees of affiliates to attend retail seminars conducted by broker-dealers. Offering costs will be paid from the proceeds of the Offerings. These costs will be treated as a reduction of the total proceeds. Total organization and offering costs incurred by the Company with respect to a particular public offering will not exceed 15% of the gross proceeds from such particular public offering. In addition, the Company will not reimburse RREEF America or the dealer manager for any underwriting compensation (a subset of organization and offering costs) which would cause the Company’s total underwriting compensation to exceed 10% of the gross proceeds from the primary portion of the each public offering.
Included in offering costs are (1) distribution fees paid on a trailing basis at the rate of (a) 0.50% per annum on the NAV of the outstanding Class A Shares, (b) 1.00% per annum on the NAV of the outstanding Class T Shares, and (c) 0.85% per annum on the NAV of the outstanding Class S and Class T2 Shares, and (2) dealer manager fees paid on a trailing basis at the rate of 0.55% per annum on the NAV of the outstanding Class A and Class I Shares (collectively, the "Trailing Fees"). The Trailing Fees are computed daily based on the respective NAV of each share class as of the beginning of each day and paid monthly. However, at each reporting date, the Company accrues an estimate for the amount of Trailing Fees that ultimately may be paid on the outstanding shares. Such estimate reflects the maximum amount of underwriting compensation that could be paid based on the amount of capital raised as of the reporting date for the primary portion of each separate public offering. Changes in this estimate will be recorded prospectively as an adjustment to additional paid-in capital. As of March 31, 2022 and December 31, 2021, the Company has accrued $17,035 and $16,343, respectively, in Trailing Fees to be payable in the future, which was included in due to affiliates on the consolidated balance sheets.
Revenue Recognition
In accordance with FASB Topic 842, Leases (ASC 842), and related ASU's that amended or clarified certain provisions of ASC 842, the Company elected a practical expedient to not separate lease and non-lease components of a lease and instead accounts for them as a single component if two criteria are met: (i) the timing and pattern of transfer of the non-lease component(s) and associated lease component are the same, and (ii) the lease component, if accounted for separately, would be classified as an operating lease. The Company has evaluated the lease and non-lease components within its leases under the practical expedient and reports rental and other property income and common area expense reimbursement income as a single component on the Company’s consolidated statements of operations.
Contractual base rental revenue from real estate leases is recognized on a straight-line basis over the terms of the related leases. The differences between contractual base rental revenue earned from real estate leases on a straight-line basis and amounts due under the respective lease agreements are amortized or accreted, as applicable, to deferred rent receivable. Property related income will also include amortization of above- and below-market leases as well as amortization of lease incentives. Revenues relating to lease termination fees for the termination of an entire lease will be recognized at the time that a tenant’s right to occupy the leased space is terminated and collectibility is reasonably assured.
Under ASC 842, the future revenue stream from leases must be evaluated for collectibility. Pursuant to these provisions, if an entity has determined that the collectibility of substantially all future lease payments from a particular lease is not at least probable, then the entity must write off its existing receivable balances (except receivable amounts which are under dispute by the tenant), including any deferred rent amounts recognized on a straight-line basis, and instead begin recognizing revenue from such lease on cash basis. The factors used to evaluate the collectibility of future lease payments for each lease may include, but not be limited to, the tenant's payment history, current payment status, publicly available information about the financial condition of the tenant and other
11
RREEF PROPERTY TRUST, INC.
NOTES TO CONSOLIDATED FINANCIAL STATEMENTS - continued
March 31, 2022
(Unaudited)
(in thousands, except share and per share data)
information about the tenant of which the entity may be aware. The Company is closely monitoring its tenants in light of the ongoing coronavirus pandemic. As of March 31, 2022, the Company has assessed that substantially all of its future lease payments are at least probable of collection.
To the extent the Company's revenues do not qualify for treatment under ASC 842 or under other specific guidance, the Company is required to recognize revenue in its financial statements in a manner that depicts the transfer of the promised goods or services to its customers in an amount that reflects the consideration to which the Company is entitled at the time of transfer of those goods or services. Such treatment may apply to other types of real estate related contracts, such as for dispositions or development of real estate.
Investment income from marketable securities is accrued at each distribution record date.
Net Earnings or Loss Per Share
Net earnings or loss per share is calculated using the two-class method. The two-class method is utilized when an entity (1) has different classes of common stock that participate differently in net earnings or loss, or (2) has issued participating securities, which are securities that participate in distributions separately from the entity’s common stock. Pursuant to the advisory agreement between the Company, the Operating Partnership and RREEF America (see Note 8), RREEF America may earn a performance component of the advisory fee which is calculated separately for each class of common stock which therefore may result in a different allocation of net earnings or loss to each class of common stock. In addition, the Company originally granted Class I Shares to its independent directors (see Note 9), which qualified as participating securities. During the three months ended March 31, 2021, the Company converted the granted shares from Class I Shares to Class D Shares for its independent directors (see Note 9), which qualify as participating securities. Thereafter, Annual Share Grant Awards (defined in Note 9 below) will be in Class D Shares.
Risks and Uncertainties
As of March 31, 2022 and December 31, 2021, the Company had cash on deposit at multiple financial institutions which were in excess of federally insured levels. The Company limits significant cash holdings to accounts held by financial institutions with a high credit standing. Therefore, the Company believes it is not exposed to any significant credit risk on its cash deposits.
Through March 31, 2022, the Company did not incur significant disruptions from the COVID-19 pandemic. Nonetheless, the extent to which the COVID-19 pandemic impacts the Company's investments and operations will depend on future developments, which are highly uncertain and cannot be predicted with confidence and may affect the Company’s ability to make distributions to its stockholders, service debt, or meet other financial obligations. Among the cash on hand, ongoing net capital raise and availability under the Company's line of credit, the Company believes it has, and intends to maintain, sufficient liquidity at all times to satisfy its operational needs and the maximum quarterly limits on redemptions under its share redemption plan.
Recent Accounting Pronouncements
In March 2020, the FASB issued ASU 2020-04, Reference Rate Reform (Topic 848), which provides temporary optional expedients and exceptions to the application of GAAP to modifications of certain contracts (generally, receivables, debt obligations and leases) and hedging relationships to ease the financial burdens of the expected market transitions from LIBOR and other interbank offered rates to alternative reference rates. The guidance was effective upon issuance and can be applied through December 31, 2022 to certain contract modifications as well as qualifying existing and new hedge relationships. Generally, ASU 2020-04 allows an entity to not re-assess certain aspects of the contract or hedge modification thereby allowing the contract or hedge accounting to be similar to how such contract or hedge was accounted for prior to the reference rate reform. While the adoption of any of the
12
RREEF PROPERTY TRUST, INC.
NOTES TO CONSOLIDATED FINANCIAL STATEMENTS - continued
March 31, 2022
(Unaudited)
(in thousands, except share and per share data)
expedients is optional at any time through December 31, 2022, if an entity were to adopt any of the optional expedients, then such expedient must be applied consistently to all similar contracts. The Company's line of credit has an interest rate that is based on LIBOR and the Company does not have any hedging relationships. The Company's line of credit matures on February 27, 2023. Based on recent authoritative announcements, LIBOR, for the durations which apply to the Company's line of credit, will continue to be published until June 30, 2023. As the Company's line of credit matures prior to such date, the Company currently does not expect ASU 2020-04 to have a material impact on its consolidated financial statements.
NOTE 3 — FAIR VALUE MEASUREMENTS
Fair value measurements are determined based on the assumptions that market participants would use in pricing an asset or liability. As a basis for considering market participant assumptions in fair value measurements, FASB ASC 820, Fair Value Measurement and Disclosures, establishes a fair value hierarchy that distinguishes between market participant assumptions based on market data obtained from sources independent of the reporting entity (observable inputs that are classified within Levels 1 and 2 of the hierarchy) and the reporting entity's own assumptions about market participant assumptions (unobservable inputs classified within Level 3 of the hierarchy).
Level 1 inputs utilize quoted prices (unadjusted) in active markets for identical assets or liabilities that the Company has the ability to access. Level 2 inputs are inputs other than quoted prices included in Level 1 that are observable for the asset or liability, either directly or indirectly. Level 2 inputs may include quoted prices for similar assets and liabilities in active markets, as well as inputs that are observable for the asset or liability (other than quoted prices), such as interest rates and yield curves that are observable at commonly quoted intervals. Level 3 inputs are the unobservable inputs for the asset or liability, which are typically based on an entity's own assumption, as there is little, if any, related market activity. In instances where the determination of the fair value measurement is based on input from different levels of the fair value hierarchy, the level in the fair value hierarchy within which the entire fair value measurement falls is based on the lowest level input that is significant to the fair value measurement in its entirety. The Company's assessment of the significance of a particular input to the fair value measurement in its entirety requires judgment and considers factors specific to the asset or liability.
The Company's investments in marketable securities are valued using Level 1 inputs as the securities are publicly traded on major stock exchanges.
The fair value of the Company's line of credit and mortgage loans payable are determined using Level 2 and Level 3 inputs and a discounted cash flow approach with an interest rate, property valuation and other assumptions that estimate current market conditions. The carrying amount of the Company's line of credit, exclusive of deferred financing costs, at March 31, 2022 and December 31, 2021 approximated its fair value of $71,300 and $82,300, respectively. The Company estimated the fair value of the Company's mortgage loans payable at $187,650 and $193,636 as of March 31, 2022 and December 31, 2021, respectively. If the valuation of the Company's properties as of March 31, 2022 were significantly lower, the market interest rate assumption would be higher (due to higher loan-to-value ratios), potentially resulting in a significantly lower estimated fair value for these liabilities.
The fair value of the Company's note to affiliate is determined using Level 2 and Level 3 inputs and a discounted cash flow approach with an interest rate and other assumptions that estimate current market conditions. The Company has estimated the fair value of its note to affiliate at approximately $4,400 and $4,350 as of March 31, 2022 and December 31, 2021, respectively. The estimated market interest rate is impacted by a number of factors. Material changes in those factors may cause a material change to the estimated market interest rate, thereby materially affecting the estimated fair value of the note to affiliate. The Company has estimated the fair value of the note to affiliate in the middle of the range of reasonably estimable values.
The following shows certain information about the estimated fair value and the unobservable inputs for the Company's debt obligations as of March 31, 2022 and December 31, 2021.
13
RREEF PROPERTY TRUST, INC.
NOTES TO CONSOLIDATED FINANCIAL STATEMENTS - continued
March 31, 2022
(Unaudited)
(in thousands, except share and per share data)
| Range | |||||||||||||||||||||||||||||||||||
| Fair Value at March 31, 2022 | Primary Valuation Techniques | Significant Unobservable Inputs | Minimum | Maximum | Weighted Average | ||||||||||||||||||||||||||||||
| Line of Credit | $ | 71,300 | Discounted cash flow | Loan to value | 43.5 | % | 43.5 | % | 43.5 | % | |||||||||||||||||||||||||
| Market interest rate | 2.06 | % | 2.06 | % | 2.06 | % | |||||||||||||||||||||||||||||
| Mortgage Loans Payable | 187,650 | Discounted cash flow | Loan to value | 26.7 | % | 57.4 | % | 44.8 | % | ||||||||||||||||||||||||||
| Market interest rate | 3.65 | % | 4.45 | % | 4.26 | % | |||||||||||||||||||||||||||||
| Note to Affiliate | 4,400 | Discounted cash flow | Loan to value | NA | NA | NA | |||||||||||||||||||||||||||||
| Market interest rate | 5.00 | % | 5.00 | % | 5.00 | % | |||||||||||||||||||||||||||||
| Range | |||||||||||||||||||||||||||||||||||
| Fair Value at December 31, 2021 | Primary Valuation Techniques | Significant Unobservable Inputs | Minimum | Maximum | Weighted Average | ||||||||||||||||||||||||||||||
| Line of Credit | $ | 82,300 | Discounted cash flow | Loan to value | 51.5 | % | 51.6 | % | 51.5 | % | |||||||||||||||||||||||||
| Market interest rate | 1.71 | % | 1.71 | % | 1.71 | % | |||||||||||||||||||||||||||||
| Mortgage Loans Payable | 193,636 | Discounted cash flow | Loan to value | 30.1 | % | 57.8 | % | 46.3 | % | ||||||||||||||||||||||||||
| Market interest rate | 2.50 | % | 4.05 | % | 3.20 | % | |||||||||||||||||||||||||||||
| Note to Affiliate | 4,350 | Discounted cash flow | Loan to value | NA | NA | NA | |||||||||||||||||||||||||||||
| Market interest rate | 4.50 | % | 4.50 | % | 4.50 | % | |||||||||||||||||||||||||||||
The Company's financial instruments, other than those referred to above, are generally short-term in nature and contain minimal credit risk. These instruments consist of cash and cash equivalents, accounts and other receivables and accounts payable. The carrying amounts of these assets and liabilities in the consolidated balance sheets approximate their fair value.
NOTE 4 — REAL ESTATE INVESTMENTS
The Company acquired no real estate property during the three months ended March 31, 2022 and 2021.
NOTE 5 — RENTALS UNDER OPERATING LEASES
As of March 31, 2022, the Company owned 15 properties with a total of 60 commercial leases comprised of four office properties (including one medical office property), four retail properties, five industrial properties and two apartment properties (including one student housing property). As of March 31, 2021, the Company owned 14 properties with a total of 59 commercial leases comprised of four office properties (including one medical office property), four retail properties, five industrial properties and one student housing property. All leases at the
14
RREEF PROPERTY TRUST, INC.
NOTES TO CONSOLIDATED FINANCIAL STATEMENTS - continued
March 31, 2022
(Unaudited)
(in thousands, except share and per share data)
Company's properties have been classified as operating leases. The Company's property related income from its real estate investments is comprised of the following:
| Three Months Ended March 31, | |||||||||||
| 2022 | 2021 | ||||||||||
Lease revenue 1 | $ | 9,774 | $ | 7,711 | |||||||
| Straight-line revenue | 191 | 332 | |||||||||
| Above- and below-market lease amortization, net | 204 | 190 | |||||||||
| Lease incentive amortization | (26) | (26) | |||||||||
| Property related income | $ | 10,143 | $ | 8,207 | |||||||
(1) Lease revenue includes $1,366 and $1,342 of variable income from tenant reimbursements for the three months ended March 31, 2022 and 2021, respectively. | |||||||||||
The future minimum rentals to be received, excluding tenant reimbursements, under the non-cancelable portions of all of the Company's in-place commercial leases in effect as of March 31, 2022 are as follows:
| Year | Amount | |||||||
| 2022 - remainder of year | $ | 17,583 | ||||||
| 2023 | 19,612 | |||||||
| 2024 | 16,044 | |||||||
| 2025 | 15,184 | |||||||
| 2026 | 13,808 | |||||||
| Thereafter | 34,594 | |||||||
| $ | 116,825 | |||||||
The above future minimum rentals exclude the Company’s residential leases, which typically have terms of approximately one year. Such leases accounted for $2,675 of lease revenue for the three months ended March 31, 2022.
Percentages of property related income by property and tenant representing more than 10% of the Company's total property related income are shown below.
15
RREEF PROPERTY TRUST, INC.
NOTES TO CONSOLIDATED FINANCIAL STATEMENTS - continued
March 31, 2022
(Unaudited)
(in thousands, except share and per share data)
| Percent of property related income | ||||||||||||||
| Property | Three Months Ended March 31, 2022 | Three Months Ended March 31, 2021 | ||||||||||||
| The Glenn, Centennial, CO | 16.9 | % | — | % | ||||||||||
| Providence Square, Marietta, GA | 11.4 | 14.4 | ||||||||||||
| Seattle East Industrial, Redmond, WA | 10.7 | 13.2 | ||||||||||||
| Flats at Carrs Hill, Athens, GA | 9.1 | 10.7 | ||||||||||||
| Loudoun Gateway, Sterling, VA | 8.3 | 10.0 | ||||||||||||
| Total | 56.4 | % | 48.3 | % | ||||||||||
| Percent of property related income | ||||||||||||||
| Tenant | Three Months Ended March 31, 2022 | Three Months Ended March 31, 2021 | ||||||||||||
| FedEx Ground - Seattle East Industrial | 10.7 | % | 13.2 | % | ||||||||||
Orbital ATK Inc. - Loudoun Gateway | 8.3 | 10.0 | ||||||||||||
| Total | 19.0 | % | 23.2 | % | ||||||||||
The Company's tenants representing more than 10% of in-place annualized base rental revenues were as follows:
| Percent of in-place annualized base rental revenues as of | ||||||||||||||
| Property | March 31, 2022 | March 31, 2021 | ||||||||||||
| FedEx Ground - Seattle East Industrial | 11.8 | % | 14.5 | % | ||||||||||
| Orbital ATK Inc. - Loudoun Gateway | 9.5 | 11.5 | ||||||||||||
| Total | 21.3 | % | 26.0 | % | ||||||||||
NOTE 6 — MARKETABLE SECURITIES
The following is a summary of the Company's marketable securities held as of the dates indicated, which consisted entirely of publicly-traded shares of common stock in REITs as of each date.
| March 31, 2022 | December 31, 2021 | ||||||||||
| Marketable securities—cost | $ | 26,757 | $ | 25,564 | |||||||
| Unrealized gains | 8,232 | 11,280 | |||||||||
| Unrealized losses | (309) | (19) | |||||||||
| Net unrealized gain | 7,923 | 11,261 | |||||||||
| Marketable securities—fair value | $ | 34,680 | $ | 36,825 | |||||||
Upon the sale of a particular security, the realized net gain or loss is computed assuming the shares with the highest cost are sold first. During the three months ended March 31, 2022 and 2021, marketable securities sold generated proceeds of $10,779 and $4,924, respectively, resulting in gross realized gains of $1,505 and $703, respectively, and gross realized losses of $480 and $32, respectively.
NOTE 7 — NOTES PAYABLE
16
RREEF PROPERTY TRUST, INC.
NOTES TO CONSOLIDATED FINANCIAL STATEMENTS - continued
March 31, 2022
(Unaudited)
(in thousands, except share and per share data)
Wells Fargo Line of Credit
On February 27, 2018, the Company, as guarantor, and certain of the wholly owned subsidiaries of the Operating Partnership, as co-borrowers, entered into an amended and restated secured revolving credit facility (the “Wells Fargo Line of Credit”) with Wells Fargo Bank, National Association, as administrative agent, and other lending institutions that may become parties to the credit agreement. The Wells Fargo Line of Credit matures on February 27, 2023. Prior to this maturity date, the Company expects to refinance the Wells Fargo Line of Credit with another line of credit. There can be no assurance as to the terms any new line of credit may contain or that the Company will be able to obtain a new line of credit.
The interest rate under the Wells Fargo Line of Credit is based on the 1-month LIBOR with a spread of 160 to 180 basis points depending on the debt yield as defined in the agreement. The Wells Fargo Line of Credit has a maximum capacity of $100,000 and is expandable by the Company up to a maximum capacity of $200,000 upon satisfaction of specified conditions. Each requested expansion must be for at least $25,000 and may result in the Wells Fargo Line of Credit being syndicated. As of March 31, 2022, the outstanding balance under the Wells Fargo Line of Credit was $71,300 and the weighted average interest rate was 2.06%. As of December 31, 2021, the outstanding balance was $82,300 and the weighted average interest rate was 1.71%.
At any time, the borrowing capacity under the Wells Fargo Line of Credit is based on the lesser of (1) an amount equal to 65% of the aggregate value of the properties in the collateral pool as determined by lender appraisals, (2) an amount that results in a minimum debt yield of 9% based on the in-place net operating income of the collateral pool as defined, or (3) the maximum capacity of the Wells Fargo Line of Credit. Proceeds from the Wells Fargo Line of Credit can be used to fund acquisitions, redeem shares pursuant to the Company's redemption plan and for any other corporate purpose. As of March 31, 2022, the Company's maximum borrowing capacity was $92,983.
The Wells Fargo Line of Credit agreement contains customary representations, warranties, borrowing conditions and affirmative, negative and financial covenants, including that there must be at least five properties in the collateral pool at all times and that the collateral pool must also meet specified concentration provisions, unless waived by the lender. In addition, the Company, as guarantor, must meet tangible net worth hurdles. The Company was in compliance with all financial covenants as of March 31, 2022.
The following is a reconciliation of the carrying amount of the Wells Fargo Line of Credit at March 31, 2022 and December 31, 2021.
| Balance at | ||||||||||||||
| Lender | March 31, 2022 | December 31, 2021 | ||||||||||||
| Wells Fargo | $ | 71,300 | $ | 82,300 | ||||||||||
| Deduct: Deferred financing costs, less accumulated amortization | (117) | (148) | ||||||||||||
| Line of credit, net | $ | 71,183 | $ | 82,152 | ||||||||||
Mortgage Loans
Certain wholly owned subsidiaries of the Company are obligors on various mortgage loans. Such mortgage loans contain fixed interest rates, allow for one-time transfer to another borrower subject to lender discretion and payment of applicable fees, and allow for full prepayment at certain times with payment of applicable penalties, if
17
RREEF PROPERTY TRUST, INC.
NOTES TO CONSOLIDATED FINANCIAL STATEMENTS - continued
March 31, 2022
(Unaudited)
(in thousands, except share and per share data)
any. The following is a reconciliation of the carrying amount of the mortgage loans payable at March 31, 2022 and December 31, 2021.
| Balance at | ||||||||||||||||||||||||||||||||
| Lender | Encumbered Property | March 31, 2022 | December 31, 2021 | Interest Rate | Maturity Date | |||||||||||||||||||||||||||
| Talcott Resolution Life Insurance Company | Commerce Corner | $ | 12,144 | $ | 12,213 | 3.41 | % | December 1, 2023 | ||||||||||||||||||||||||
| Nationwide Life Insurance Company | Flats at Carrs Hill | 14,500 | 14,500 | 3.63 | March 1, 2026 | |||||||||||||||||||||||||||
| State Farm Life Insurance Company | Elston Plaza | 17,391 | 17,470 | 3.89 | July 1, 2026 | |||||||||||||||||||||||||||
| Massachusetts Mutual Life Insurance Company | The Glenn | 66,000 | 66,000 | 3.02 | December 1, 2028 | |||||||||||||||||||||||||||
| Transamerica Life Insurance Company | Wallingford Plaza | 6,820 | 6,849 | 4.56 | January 1, 2029 | |||||||||||||||||||||||||||
| Nationwide Life Insurance Company | Providence Square | 29,700 | 29,700 | 3.67 | October 5, 2029 | |||||||||||||||||||||||||||
| JPMorgan Chase Bank | Seattle East Industrial | 45,140 | 45,140 | 3.87 | January 1, 2030 | |||||||||||||||||||||||||||
| $ | 191,695 | $ | 191,872 | |||||||||||||||||||||||||||||
| Deduct: Deferred financing costs, less accumulated amortization | (833) | (871) | ||||||||||||||||||||||||||||||
| Mortgage loans payable, net | $ | 190,862 | $ | 191,001 | ||||||||||||||||||||||||||||
Aggregate future principal payments due on the Wells Fargo Line of Credit and mortgage loans payable as of March 31, 2022 are as follows:
| Year | Amount | |||||||
| Remainder of 2022 | $ | 540 | ||||||
| 2023 | 83,688 | |||||||
| 2024 | 474 | |||||||
| 2025 | 493 | |||||||
| 2026 | 30,746 | |||||||
| Thereafter | 147,054 | |||||||
| Total | $ | 262,995 | ||||||
NOTE 8 — RELATED PARTY ARRANGEMENTS
Advisory Agreement
RREEF America is entitled to compensation and reimbursements in connection with the management of the Company's investments in accordance with an advisory agreement between RREEF America, the Operating Partnership and the Company (the "Advisory Agreement"). The Advisory Agreement has a one-year term and is renewable annually upon the review and approval of the Company's board of directors, including the approval of a majority of the Company's independent directors. The Advisory Agreement has a current expiration date of April 21, 2023. There is no limit to the number of terms for which the Advisory Agreement can be renewed.
18
RREEF PROPERTY TRUST, INC.
NOTES TO CONSOLIDATED FINANCIAL STATEMENTS - continued
March 31, 2022
(Unaudited)
(in thousands, except share and per share data)
Fees
Under the Advisory Agreement, RREEF America can earn an advisory fee comprised of two components as described below.
1.The fixed component accrues daily in an amount equal to 1/365th of 1.0% of the NAV of the outstanding shares of each class of common stock for such day. The fixed component of the advisory fee is payable monthly in arrears.
2.The performance component is calculated for each class of common stock on the basis of the total return to stockholders and is measured by the total distributions per share declared to such class plus the change in the NAV per share for such class.
a.For Class A, Class I, Class T, Class D, Class N and Class Z Shares, for any calendar year in which the total return per share allocable to a class exceeds 6% per annum (the “Hurdle Amount”), RREEF America will receive up to 10% of the aggregate total return allocable to such class with a Catch-Up (defined below) calculated as follows: first, if the total return for the applicable period exceeds the Hurdle Amount, 25% of such total return in excess of the Hurdle Amount (the “Excess Profits”) until the total return reaches 10% (commonly referred to as a “Catch-Up”); and second, to the extent there are remaining Excess Profits, 10% of such remaining Excess Profits.
b.For Class M-I, Class S, and Class T2 Shares, for any calendar year in which the total return per share allocable to a class exceeds 5% per annum (the “Alternative Hurdle Amount”), RREEF America will receive up to 12.5% of the aggregate total return allocable to such class with an Alternative Catch-Up (defined below) calculated as follows: first, if the total return for the applicable period exceeds the Alternative Hurdle Amount, 100% of such total return in excess of the Alternative Hurdle Amount (the “Alternative Excess Profits”) until the total return reaches 5.715% (commonly referred to as a “Alternative Catch-Up”); and second, to the extent there are remaining Alternative Excess Profits, 12.5% of such remaining Alternative Excess Profits.
For all share classes, the performance component earned by RREEF America for each class is subject to certain other adjustments which do not apply unless the NAV per share is below $12.00 per share. The performance component is payable annually in arrears.
The performance component is calculated daily on a year-to-date basis by reference to a proration of the per annum hurdle as of the date of calculation. Any resulting performance component as of a given date is deducted from the Company's published NAV per share for such date. At each interim balance sheet date, the Company considers the estimated performance component that is probable to be due as of the end of the current calendar year in assessing whether the calculated performance component as of the interim balance sheet date meets the threshold for recognition in accordance with GAAP in the Company's consolidated financial statements. The ultimate amount of the performance component as of the end of the current calendar year, if any, may be more or less than the amount recognized by the Company as of any interim date and will depend on a variety of factors, including but not limited to, the performance of the Company's investments, interest rates, capital raise and redemptions. The Company considers an estimated performance component as of March 31, 2022 to be probable and recognized a performance component during the three months ended March 31, 2022 in the Company's consolidated financial statements. The fixed component earned by RREEF America and the performance component recognized by the Company are shown below.
19
RREEF PROPERTY TRUST, INC.
NOTES TO CONSOLIDATED FINANCIAL STATEMENTS - continued
March 31, 2022
(Unaudited)
(in thousands, except share and per share data)
| Three Months Ended March 31, | |||||||||||
| 2022 | 2021 | ||||||||||
| Fixed component | $ | 849 | $ | 547 | |||||||
| Performance component | 1,500 | 200 | |||||||||
| $ | 2,349 | $ | 747 | ||||||||
Expense Reimbursements
Under the Advisory Agreement, RREEF America is entitled to reimbursement of certain costs incurred by RREEF America or its affiliates that were not incurred under the Expense Support Agreement, as described below. Costs eligible for reimbursement, if they were not incurred under the Expense Support Agreement, include most third-party operating expenses, salaries and related costs of RREEF America's employees who perform services for the Company (but not those employees for which RREEF America earns a separate fee or those employees who are executive officers of the Company) and travel related costs for RREEF America's employees who incur such costs on behalf of the Company. Reimbursement payments to RREEF America are subject to the limitations described below under "Reimbursement Limitations."
For the three months ended March 31, 2022 and 2021, RREEF America incurred $71 and $51 of reimbursable operating expenses and offering costs, respectively, that were subject to reimbursement under the Advisory Agreement. As of March 31, 2022 and December 31, 2021, the Company had a payable to RREEF America of $71 and $71, respectively, of operating expenses and offering costs reimbursable under the Advisory Agreement.
Expense Support Agreement
Pursuant to the terms of the expense support agreement, as most recently amended on January 20, 2016 (the "Expense Support Agreement"), and as further modified on March 24, 2020 by a letter agreement (the "Letter Agreement"), the Company's obligations to reimburse RREEF America for amounts paid by RREEF America (the "Expense Payments") under the Expense Support Agreement are suspended until the first calendar month following the month in which the Company has reached $500,000 in offering proceeds from the Offerings (the "ESA Commencement Date"). As of March 31, 2022, the Company owed $5,383 to RREEF America under the Expense Support Agreement which is reflected as a note to affiliate on the Company's consolidated balance sheet (the "Note to Affiliate"). Pursuant to the Letter Agreement, beginning the month following the ESA Commencement Date, reimbursements to RREEF America will be made in the amount of $250 per month for 12 months, followed by reimbursements of $198 per month for 12 months, which will fully satisfy the principal balance owed.
In connection with the Letter Agreement, the Company recorded a discount on the Note to Affiliate in the amount of $946 based on an estimated market interest rate of 3.75%. The discount is being amortized using the effective interest method over the expected term of the Note to Affiliate. For the three months ended March 31, 2022 and 2021, the Company amortized $44 and $43, respectively, of the discount on the Note to Affiliate into interest expense.
In addition, pursuant to the Letter Agreement, if RREEF America is serving as the Company's advisor at the time that the Company or the Operating Partnership undertakes a liquidation, the Company's remaining obligations to reimburse RREEF America for the unreimbursed Expense Payments under the Expense Support Agreement shall be waived.
Dealer Manager Agreement
20
RREEF PROPERTY TRUST, INC.
NOTES TO CONSOLIDATED FINANCIAL STATEMENTS - continued
March 31, 2022
(Unaudited)
(in thousands, except share and per share data)
The Company and its Operating Partnership entered into the Dealer Manager Agreement with the Dealer Manager, which was most recently amended and restated on April 21, 2020. The Dealer Manager Agreement governs the distribution by the Dealer Manager of the Company’s shares of common stock in the Second Follow-On Public Offering and any subsequent registered public offering. In connection with the ongoing Trailing Fees to be paid in the future, the Company and the Dealer Manager entered into an agreement whereby the Company will pay to the Dealer Manager the Trailing Fees that are attributable to the Company's shares issued in the Company's initial public offering that remain outstanding. In addition, the Company is obligated to pay to the Dealer Manager Trailing Fees that are attributable to the Company's shares issued in the Follow-On Public Offering and the Second Follow-On Public Offering. As of March 31, 2022 and December 31, 2021, the Company has accrued $169 and $160, respectively, in Trailing Fees currently payable to the Dealer Manager, and $17,035 and $16,343, respectively, in Trailing Fees estimated to become payable in the future to the Dealer Manager, both of which are included in Due to affiliates on the consolidated balance sheets. The Company also pays the Dealer Manager upfront selling commissions and upfront dealer manager fees in connection with its Offerings, as applicable. For the three months ended March 31, 2022 and 2021, the Dealer Manager earned upfront selling commissions and upfront dealer manager fees totaling $99 and $38, respectively.
Under the Dealer Manager Agreement, the Company is obligated to reimburse the Dealer Manager for certain offering costs incurred by the Dealer Manager on the Company's behalf, including but not limited to broker-dealer sponsorships, attendance fees for retail seminars conducted by broker-dealers or the Dealer Manager, and travel costs for certain personnel of the Dealer Manager who are dedicated to the distribution of the Company's shares of common stock. For the three months ended March 31, 2022 and 2021, the Dealer Manager incurred $15 and $3, respectively, in such costs on behalf of the Company. As of March 31, 2022 and December 31, 2021, the Company had payable to the Dealer Manager $15 and $15, respectively, of such costs which was included in Due to Affiliates on the consolidated balance sheets.
Reimbursement Limitations
Organization and Offering Costs
The Company will not reimburse RREEF America under the Advisory Agreement or the Expense Support Agreement and will not reimburse the Dealer Manager under the Dealer Manager Agreement for any organization and offering costs which would cause the Company's total organization and offering costs with respect to a public offering to exceed 15% of the gross proceeds from such public offering. Further, the Company will not reimburse RREEF America or the Dealer Manager for any underwriting compensation (a subset of organization and offering costs) which would cause the Company's total underwriting compensation with respect to a public offering to exceed 10% of the gross proceeds from the primary portion of such public offering.
For the Initial Public Offering that ended on June 30, 2016, the Company raised $102,831 in gross proceeds and incurred $15,424 in organization and offering costs, including, as of March 31, 2022, estimated accrued Trailing Fees payable in the future of $2,737.
For the Follow-On Public Offering that ended on January 8, 2020, the Company raised $132,994 in gross proceeds and incurred $16,861 in organization and offering costs, including, as of March 31, 2022, estimated accrued Trailing Fees payable in the future of $7,332.
For the Second Follow-On Public Offering, as of March 31, 2022, the Company raised $95,786 in gross proceeds and incurred $10,480 in organization and offering costs, including estimated accrued Trailing Fees payable in the future of $6,966.
Operating Expenses
Pursuant to the Company’s charter, the Company may reimburse RREEF America, at the end of each fiscal quarter, for total operating expenses incurred by RREEF America, whether under the Expense Support Agreement
21
RREEF PROPERTY TRUST, INC.
NOTES TO CONSOLIDATED FINANCIAL STATEMENTS - continued
March 31, 2022
(Unaudited)
(in thousands, except share and per share data)
or otherwise. However, the Company may not reimburse RREEF America at the end of any fiscal quarter for total operating expenses (as defined in the Company’s charter) that, in the four consecutive fiscal quarters then ended, exceed the greater of 2% of average invested assets or 25% of net income determined without reduction for any additions to reserves for depreciation, bad debts or other similar non-cash reserves and excluding any gain from the sale of the Company's assets for that period (the “2%/25% Guidelines”). Notwithstanding the foregoing, the Company may reimburse RREEF America for expenses in excess of the 2%/25% Guidelines if a majority of the Company’s independent directors determines that such excess expenses are justified based on unusual and non-recurring factors. For the four fiscal quarters ended March 31, 2022, total operating expenses of the Company were $12,230, which exceeded the 2%/25% Guidelines. Based upon a review of unusual and non-recurring factors, including but not limited to outsized performance during this period resulting in an increased performance component of the advisory fee, the Company's independent directors determined that the excess expenses were justified.
Due to Affiliates and Note to Affiliate
In accordance with all the above, the Company owed its affiliates the following amounts:
| March 31, 2022 | December 31, 2021 | ||||||||||
| Reimbursable under the Advisory Agreement | $ | 71 | $ | 71 | |||||||
| Reimbursable under the Dealer Manager Agreement | 15 | 15 | |||||||||
| Advisory fees | 1,800 | 6,332 | |||||||||
| Accrued Trailing Fees | 17,204 | 16,503 | |||||||||
| Due to affiliates | $ | 19,090 | $ | 22,921 | |||||||
| Note to Affiliate | $ | 5,383 | $ | 5,383 | |||||||
| Unamortized discount | (598) | (642) | |||||||||
| Note to Affiliate, net of unamortized discount | $ | 4,785 | $ | 4,741 | |||||||
NOTE 9 — CAPITALIZATION
Under the Company's charter, the Company has the authority to issue 1,000,000,000 shares of common stock and 50,000,000 shares of preferred stock. All shares of such stock have a par value of $0.01 per share. The Company's authorized shares of common stock are allocated between classes as follows:
| Common Stock | No. of Authorized Shares | |||||||
| Class A Shares | 45,000,000 | |||||||
| Class D Shares | 45,000,000 | |||||||
| Class I Shares | 200,000,000 | |||||||
| Class M-I Shares | 200,000,000 | |||||||
| Class N Shares | 150,000,000 | |||||||
| Class S Shares | 200,000,000 | |||||||
| Class T Shares | 5,000,000 | |||||||
| Class T2 Shares | 150,000,000 | |||||||
| Class Z Shares | 5,000,000 | |||||||
| 1,000,000,000 | ||||||||
22
RREEF PROPERTY TRUST, INC.
NOTES TO CONSOLIDATED FINANCIAL STATEMENTS - continued
March 31, 2022
(Unaudited)
(in thousands, except share and per share data)
Class A shares are subject to selling commissions of up to 3% of the purchase price, and annual dealer manager fees of 0.55% and distribution fees of 0.50% of NAV, both paid on a trailing basis. Class I shares are subject to annual dealer manager fees of 0.55% of NAV paid in a trailing basis, but are not subject to any selling commissions or distribution fees. Class M-I shares will not incur any up-front commissions or trailing fees. Class S shares are subject to selling commissions of up to 3% of the purchase price, and annual distribution fees of 0.85% of the NAV paid on a trailing basis for approximately seven years. Class T shares are subject to selling commissions of up to 3% of the purchase price, an up-front dealer manager fee of up to 2.50% of the purchase price, and annual distribution fees of 1.0% of NAV paid on a trailing basis for approximately three years. Class T2 shares are subject to selling commissions of up to 3% of the purchase price, an up-front dealer manager fee of up to 0.50% of the purchase price, and annual distribution fees of 0.85% of the NAV paid on a trailing basis for approximately six years. Class D shares sold in the Private Offerings are subject to selling commissions of up to 1.0% of the purchase price, but do not incur any dealer manager or distribution fees.
Class N shares are not sold in the primary portion of the Second Follow-On Public Offering. Class N shares will be issued upon conversion of an investor's Class T shares once (i) the investor's Class T share account for a given public offering has incurred a maximum of 8.5% of commissions, dealer manager fees and distribution fees; (ii) the total underwriting compensation from whatever source with respect to a public offering exceeds 10% of the gross proceeds from the primary portion of such offering; (iii) a listing of the Class N shares; or (iv) the Company's merger or consolidation with or into another entity or the sale or other disposition of all or substantially all of the Company's assets. For the three months ended March 31, 2022, 135,279 Class T shares were converted to 135,085 Class N shares, respectively.
Class Z shares are expected to be sold only in a private offering to RREEF America. During the year ended December 31, 2021, 75,000 Class I shares owned by RREEF America were exchanged for 75,000 Class Z shares. Class Z shares do not incur any sales commissions, dealer manager fees or distribution fees.
The Company's board of directors is authorized to amend its charter from time to time, without the approval of the stockholders, to increase or decrease the aggregate number of authorized shares of common stock or the number of shares of any class or series that the Company has authority to issue.
Stock Issuance
During the three months ended March 31, 2022 and 2021, the Company issued common stock, excluding shares issued in the distribution reinvestment plan, as follows:
| Three months Ended March 31, 2022 | Three months Ended March 31, 2021 | |||||||||||||||||||||||||
No. of shares | Amount | No. of shares | Amount | |||||||||||||||||||||||
| Class A Shares | 115,089 | $ | 1,968 | 23,241 | $ | 342 | ||||||||||||||||||||
| Class D Shares | 322,693 | 5,455 | — | — | ||||||||||||||||||||||
| Class I Shares | 530,599 | 8,988 | 318,880 | 4,632 | ||||||||||||||||||||||
| Class M-I Shares | 18,869 | 319 | — | — | ||||||||||||||||||||||
| Class N Shares converted from Class T Shares, net | (194) | — | — | — | ||||||||||||||||||||||
| Class T Shares | 26,904 | 478 | 35,995 | 549 | ||||||||||||||||||||||
| Class T2 Shares | 65,458 | 1,137 | — | — | ||||||||||||||||||||||
Total | 1,079,418 | $ | 18,345 | 378,116 | $ | 5,523 | ||||||||||||||||||||
There were no Class S Shares issued as of March 31, 2022.
23
RREEF PROPERTY TRUST, INC.
NOTES TO CONSOLIDATED FINANCIAL STATEMENTS - continued
March 31, 2022
(Unaudited)
(in thousands, except share and per share data)
Distribution Reinvestment Plan
The Company has adopted a distribution reinvestment plan that allows stockholders to have the cash distributions attributable to the class of shares that the stockholder owns automatically invested in additional shares of the same class. Shares are offered pursuant to the Company's distribution reinvestment plan at the NAV per share applicable to that class, calculated as of the distribution date and after giving effect to all distributions. Stockholders who elect to participate in the distribution reinvestment plan, and who are subject to U.S. federal income taxation laws, will incur a tax liability on an amount equal to the fair value on the relevant distribution date of the shares of the Company's common stock purchased with reinvested distributions, even though such stockholders have elected not to receive the distributions used to purchase those shares of the Company's common stock in cash.
Redemption Plan
In an effort to provide the Company's stockholders with liquidity in respect of their investment in shares of the Company's common stock, the Company has adopted a redemption plan whereby on a daily basis stockholders may request the redemption of all or any portion of their shares. The redemption price per share is equal to the Company's NAV per share of the class of shares being redeemed on the date of redemption, subject to a short-term trading discount, if applicable. The total amount of redemptions in any calendar quarter will be limited to shares whose aggregate value (based on the redemption price per share on the date of the redemption) is equal to 5% of the Company's combined NAV for all classes of shares as of the last day of the previous calendar quarter. In addition, if redemptions do not reach the 5% limit in a calendar quarter, the unused portion generally will be carried over to the next quarter and not any subsequent quarter, except that the maximum amount of redemptions during any quarter may never exceed 10% of the combined NAV for all classes of shares as of the last day of the previous calendar quarter. If the quarterly volume limitation is reached on or before the third business day of a calendar quarter, redemption requests during the next quarter will be satisfied on a stockholder by stockholder basis, which the Company refers to as a per stockholder allocation, instead of a first-come, first-served basis. Pursuant to the per stockholder allocation, each stockholder would be allowed to request redemption at any time during such quarter of a total number of shares not to exceed 5% of the shares of common stock the stockholder held as of the end of the prior quarter. The per stockholder allocation requirement will remain in effect for each succeeding quarter for which the total redemptions for the immediately preceding quarter exceeded 4% of the Company's NAV on the last business day of such preceding quarter. If total redemptions during a quarter for which the per stockholder allocation applies are equal to or less than 4% of the Company's NAV on the last business day of such preceding quarter, then redemptions will again be satisfied on a first-come, first-served basis for the next succeeding quarter and each quarter thereafter.
Each redemption request will be evaluated by the Company in consideration of rules and regulations promulgated by the Internal Revenue Service with respect to dividend equivalent redemptions. Redemptions that may be considered dividend equivalent redemptions may adversely affect the Company or its stockholders. Accordingly, the Company may reject any redemption request that it reasonably believes may be treated as a dividend equivalent redemption.
While there is no minimum holding period, purchased shares (excluding shares acquired via the Company's distribution reinvestment plan) redeemed within 365 days of the date of the investor's initial purchase of the Company's shares will be redeemed at the Company's NAV per share of the class of shares being redeemed on the date of redemption less a short-term trading discount equal to 2% of the gross proceeds otherwise payable with respect to such purchased shares which are being redeemed.
In the event that any stockholder fails to maintain a minimum balance of $500 (not in thousands) worth of shares of common stock, the Company may redeem all of the shares held by that stockholder at the redemption price per share in effect on the date it is determined that the stockholder has failed to meet the minimum balance, less the
24
RREEF PROPERTY TRUST, INC.
NOTES TO CONSOLIDATED FINANCIAL STATEMENTS - continued
March 31, 2022
(Unaudited)
(in thousands, except share and per share data)
short-term trading discount of 2%, if applicable. Minimum account redemptions will apply even in the event that the failure to meet the minimum balance is caused solely by a decline in the Company's NAV.
During the three months ended March 31, 2022 and 2021, redemptions were as shown below. The Company funded these redemptions with cash flow from operations, proceeds from its Offerings or borrowings. The weighted average redemption prices are shown before allowing for any applicable 2% short-term trading discounts. The Company fulfilled all of the redemption requests received during the periods shown.
| Three Months Ended March 31, 2022 | Shares | Weighted Average Share Price | Amount | |||||||||||||||||
| Class A | 27,192 | $ | 16.79 | $ | 456 | |||||||||||||||
| Class I | 54,696 | 16.86 | 922 | |||||||||||||||||
| Class T | 3,996 | 16.92 | 68 | |||||||||||||||||
| Class D | 6 | 17.09 | — | |||||||||||||||||
| Class N | 1,692 | 16.99 | 29 | |||||||||||||||||
| Class M-I | — | — | — | |||||||||||||||||
| Class T2 | — | — | — | |||||||||||||||||
| Three Months Ended March 31, 2021 | Shares | Weighted Average Share Price | Amount | |||||||||||||||||
| Class A | 32,081 | $ | 14.52 | $ | 466 | |||||||||||||||
| Class I | 214,104 | 14.49 | 3,103 | |||||||||||||||||
| Class T | 4,672 | 14.49 | 67 | |||||||||||||||||
| Class D | — | — | — | |||||||||||||||||
| Class N | 14,546 | 14.65 | 213 | |||||||||||||||||
The Company's board of directors has the discretion to suspend or modify the redemption plan at any time, including in circumstances in which it (1) determines that such action is in the best interest of the Company's stockholders, (2) determines that it is necessary due to regulatory changes or changes in law or (3) becomes aware of undisclosed material information that it believes should be publicly disclosed before shares are redeemed. In addition, the Company's board of directors may suspend the Offerings and the redemption plan, if it determines that the calculation of NAV is materially incorrect or there is a condition that restricts the valuation of a material portion of the Company's assets. If the board of directors materially amends (including any reduction of the quarterly limit) or suspends the redemption plan during any quarter, other than any temporary suspension to address certain external events unrelated to the Company's business, any unused portion of that quarter’s 5% limit will not be carried forward to the next quarter or any subsequent quarter.
Equity-Based Compensation
The Company has in place an incentive compensation plan and an independent directors compensation plan (the “Compensation Plans”). The Compensation Plans were created to attract, retain and compensate highly-qualified individuals, who are not employees of RREEF Property Trust, Inc. or any of its subsidiaries or affiliates, for service as members of the board by providing them with competitive compensation. The Compensation Plans provided for 5,000 shares of restricted stock to be issued to each of the Company's independent directors once the Company had issued 12,500,000 shares of its common stock in the aggregate from its Offerings.
25
RREEF PROPERTY TRUST, INC.
NOTES TO CONSOLIDATED FINANCIAL STATEMENTS - continued
March 31, 2022
(Unaudited)
(in thousands, except share and per share data)
On March 29, 2019, pursuant to the Company having met the issued share requirement, the Company granted 5,000 shares of restricted Class I common stock to each of the Company's independent directors for a total of 20,000 shares (the "Initial Stock Awards"). As of March 31, 2022, all Initial Stock Awards had fully vested. The fair value of the Initial Stock Awards was determined using the Company’s Class I share price on the date of grant, which was $14.34. The Company has elected to account for any forfeitures of restricted stock awards as they occur.
Pursuant to the independent director compensation plan, upon completion of each annual stockholder meeting, the Company grants $10 of shares of restricted common stock to each of the Company's independent directors (the "Annual Share Grant Awards"). The fair value of the Annual Share Grant Awards will be determined using the Company’s share price for the class of shares granted on the date of grant. The Annual Share Grant Awards shall vest and become non-forfeitable at the next annual stockholder meeting (approximately one year from issue date). The Annual Share Grant Awards granted in May 2019 and May 2020 were restricted Class I shares. The Company has elected to account for any forfeitures of restricted stock awards as they occur.
On February 25, 2021, the Company's board of directors amended and restated the Compensation Plans to provide that all future awards of the Company's common stock pursuant to the Compensation Plans, including the Annual Share Grant Awards, will be made in restricted Class D Shares rather than restricted Class I shares. In addition, the Company's board of directors approved the conversion of all then-outstanding awards of Class I shares previously granted to the Company’s independent directors, whether or not vested, to Class D shares. Conversion of all such unvested Class I shares occurred in March 2021 and conversion of all vested Class I shares occurred in March and April 2021. Subsequent Annual Share Grant Awards were granted in restricted Class D shares.
Below is a summary of the activity, per share value and recognized expense for the stock awards.
| Three Months Ended March 31, 2022 | Three Months Ended March 31, 2021 | ||||||||||||||||||||||||||||
| Stock Awards | Class D Shares* | Weighted Average Grant Date Fair Value | Class D Shares* | Weighted Average Grant Date Fair Value | |||||||||||||||||||||||||
| Outstanding, beginning of period | 7,018 | $ | 14.48 | 12,106 | $ | 14.32 | |||||||||||||||||||||||
| Changes during the period: | |||||||||||||||||||||||||||||
| Granted | — | — | — | — | |||||||||||||||||||||||||
| Vested | (4,993) | 14.34 | (5,007) | 14.34 | |||||||||||||||||||||||||
| Forfeited | — | — | — | — | |||||||||||||||||||||||||
| Outstanding, end of period | 2,025 | 14.82 | 7,099 | 14.31 | |||||||||||||||||||||||||
| Amount included in general and administrative expenses | $ | 24 | $ | 25 | |||||||||||||||||||||||||
*After conversion from Class I Shares. | |||||||||||||||||||||||||||||
NOTE 10 - NET INCOME (LOSS) PER SHARE
The Company computes net income (loss) per share for each class of common stock with shares outstanding using the two-class method. RREEF America may earn a performance component of the advisory fee (see Note 8) which may impact the net income (loss) of each class of common stock differently. The performance component and the impact on each class of common stock, if any, are shown below.
Basic and diluted net income (loss) per share for each class of common stock is computed using the weighted-average number of common shares outstanding during the period for each class of common stock. The Initial Stock
26
RREEF PROPERTY TRUST, INC.
NOTES TO CONSOLIDATED FINANCIAL STATEMENTS - continued
March 31, 2022
(Unaudited)
(in thousands, except share and per share data)
Awards and the Annual Share Grant Awards granted to the Company's independent directors (see Note 9) qualify as participating securities and therefore also require use of the two-class method for computing net income (loss) per share. The unvested Initial Stock Awards and the unvested Annual Share Grant Awards were anti-dilutive or immaterially dilutive for the three months ended March 31, 2022 and 2021.
The following table sets forth the computation of basic and diluted net income (loss) per share for each class of the Company’s common stock which had shares outstanding during the relevant period.
| Three Months Ended March 31, 2022 | |||||||||||||||||||||||||||||||||||||||||||||||||||||
| Class A | Class I | Class T | Class D | Class N | Class M-I* | Class T2* | Class Z** | ||||||||||||||||||||||||||||||||||||||||||||||
| Basic and diluted net loss per share: | |||||||||||||||||||||||||||||||||||||||||||||||||||||
| Allocation of net loss before performance fee | $ | (860) | $ | (2,572) | $ | (151) | $ | (482) | $ | (66) | $ | (33) | $ | (30) | $ | (16) | |||||||||||||||||||||||||||||||||||||
| Allocation of performance fees | (298) | (914) | (52) | (178) | (24) | (15) | (13) | (6) | |||||||||||||||||||||||||||||||||||||||||||||
| Total numerator | $ | (1,158) | $ | (3,486) | $ | (203) | $ | (660) | $ | (90) | $ | (48) | $ | (43) | $ | (22) | |||||||||||||||||||||||||||||||||||||
| Denominator - weighted average number of common shares outstanding | 4,159,718 | 12,441,496 | 732,409 | 2,330,260 | 319,463 | 157,483 | 144,207 | 75,000 | |||||||||||||||||||||||||||||||||||||||||||||
| Basic and diluted net loss per share: | $ | (0.28) | $ | (0.28) | $ | (0.28) | $ | (0.28) | $ | (0.28) | $ | (0.30) | $ | (0.30) | $ | (0.28) | |||||||||||||||||||||||||||||||||||||
| *Class M-I and Class T2 shares were initially issued in May 2021. | |||||||||||||||||||||||||||||||||||||||||||||||||||||
| ** Class Z shares were first converted from Class I shares in December 2021. | |||||||||||||||||||||||||||||||||||||||||||||||||||||
27
RREEF PROPERTY TRUST, INC.
NOTES TO CONSOLIDATED FINANCIAL STATEMENTS - continued
March 31, 2022
(Unaudited)
(in thousands, except share and per share data)
| Three Months Ended March 31, 2021 | |||||||||||||||||||||||||||||||||||||||||||||||||||||
| Class A | Class I | Class T | Class D | Class N | |||||||||||||||||||||||||||||||||||||||||||||||||
| Basic and diluted net income per share: | |||||||||||||||||||||||||||||||||||||||||||||||||||||
| Allocation of net income (loss) before performance fee | $ | 452 | $ | 1,316 | $ | 119 | $ ** | $ | 6 | ||||||||||||||||||||||||||||||||||||||||||||
| Allocation of performance fees | (46) | (141) | (12) | ** | (1) | ||||||||||||||||||||||||||||||||||||||||||||||||
| Total numerator | $ | 406 | $ | 1,175 | $ | 107 | $ ** | $ | 5 | ||||||||||||||||||||||||||||||||||||||||||||
| Denominator - weighted average number of common shares outstanding | 3,648,711 | 10,623,391 | 962,593 | 1,682 | 46,511 | ||||||||||||||||||||||||||||||||||||||||||||||||
| Basic and diluted net income (loss) per share: | $ | 0.11 | $ | 0.11 | $ | 0.11 | $ | (0.11) | $ | 0.11 | |||||||||||||||||||||||||||||||||||||||||||
** For the three months ended March 31, 2021, a net loss was allocated to Class D shares in the amount of $179 (not in thousands). Under the two-class method, undistributed losses are not allocated to unvested shares in determining net income (loss) per share, resulting in undistributed losses being fully allocated to the actual outstanding shares of each share class. The impact is more significant when the number of unvested shares for a share class is significant compared to the number of actual outstanding shares for such share class. | |||||||||||||||||||||||||||||||||||||||||||||||||||||
NOTE 11 — DISTRIBUTIONS
In order to qualify as a REIT, the Company is required, among other things, to make distributions each taxable year of at least 90% of its taxable income determined without regard to the dividends-paid deduction and excluding net capital gains, and to meet certain tests regarding the nature of the Company's income and assets. The Company expects that its board of directors will continue to declare distributions with a daily record date, payable monthly in arrears. Any distributions the Company makes will be at the discretion of its board of directors, considering factors such as its earnings, cash flow, capital needs and general financial condition and the requirements of Maryland law. The Company commenced operations on May 30, 2013 and elected taxation as a REIT for the year ended December 31, 2013. Distributions for each month are payable on or before the first business day of the following month. However, any distributions reinvested by the stockholders in accordance with the Company's dividend reinvestment plan are reinvested at the per share NAV of the same class determined at the close of business on the last business day of the month in which the distributions were accrued.
Shown below are details of the Company's distributions.
28
RREEF PROPERTY TRUST, INC.
NOTES TO CONSOLIDATED FINANCIAL STATEMENTS - continued
March 31, 2022
(Unaudited)
(in thousands, except share and per share data)
| Three Months Ended March 31, | |||||||||||
| 2022 | 2021 | ||||||||||
| Declared daily distribution rate, before adjustment for class-specific fees | $ | 0.00230945 | $ | 0.00197050 | |||||||
| Distributions paid or payable in cash | $ | 2,020 | $ | 1,337 | |||||||
| Distributions reinvested | 2,210 | 1,374 | |||||||||
| Distributions declared | $ | 4,230 | $ | 2,711 | |||||||
| Class A Shares issued upon reinvestment | 27,036 | 23,374 | |||||||||
| Class I Shares issued upon reinvestment | 75,809 | 66,027 | |||||||||
| Class T Shares issued upon reinvestment | 2,447 | 3,832 | |||||||||
| Class D Shares issued upon reinvestment | 20,428 | 643 | |||||||||
| Class N Shares issued upon reinvestment | 1,565 | 476 | |||||||||
| Class M-I Shares issued upon reinvestment* | 1,224 | — | |||||||||
| Class T2 Shares issued upon reinvestment* | 885 | — | |||||||||
| *Class M-I and Class T2 Shares were initially issued in May 2021. | |||||||||||
| Three Months Ended March 31, | |||||||||||
| 2022 | 2021 | ||||||||||
| Class A | $ | 786 | $ | 601 | |||||||
| Class I | 2,610 | 1,933 | |||||||||
| Class T | 139 | 159 | |||||||||
| Class D | 540 | 9 | |||||||||
| Class N | 74 | 9 | |||||||||
| Class M-I* | 36 | — | |||||||||
| Class T2* | 28 | — | |||||||||
| Class Z** | 17 | — | |||||||||
| Distributions declared | $ | 4,230 | $ | 2,711 | |||||||
| *Class M-I and Class T2 Shares were initially issued in May 2021. | |||||||||||
| **Class Z Shares were first converted from Class I Shares in December 2021. | |||||||||||
NOTE 12 — INCOME TAXES
The Company believes that it has operated in such a manner to qualify to be taxed as a REIT for federal income tax purposes beginning with the taxable year ended December 31, 2013, when it first elected REIT status. In each calendar year that the Company qualifies for taxation as a REIT, the Company generally will not be subject to federal income tax to the extent it meets certain criteria and distributes its REIT taxable income to its stockholders. Distributions declared and paid by the Company may consist of ordinary income, qualifying dividends, return of capital, capital gains or a combination thereof. The characterization of the distributions into these various components will impact how the distributions are taxable to the stockholder who received them. Distributions that constitute a return of capital generally are non-taxable and will reduce the stockholder's basis in the shares. The characterization of the distributions is generally determined during the month of January following the close of the tax year.
29
RREEF PROPERTY TRUST, INC.
NOTES TO CONSOLIDATED FINANCIAL STATEMENTS - continued
March 31, 2022
(Unaudited)
(in thousands, except share and per share data)
Net worth and similar taxes paid to certain states where the Company owns real estate properties were $3 and $25 for the three months ended March 31, 2022 and 2021, respectively.
NOTE 13 — SEGMENT INFORMATION
For three months ended March 31, 2022 and 2021, the Company had two segments with reportable information: Real Estate Properties and Real Estate Equity Securities. The Company organizes and analyzes the operations and results of each of these segments independently, due to inherently different considerations for each segment. Such considerations include, but are not limited to, the nature and characteristics of the investment and investment strategies and objectives. The following tables set forth the carrying value, revenue and the components of operating income of the Company's segments reconciled to total assets as of March 31, 2022 and December 31, 2021 and net income (loss) for the three months ended March 31, 2022 and 2021.
| Real Estate Properties | Real Estate Equity Securities | Total | ||||||||||||||||||
| Carrying value as of March 31, 2022 | $ | 431,693 | $ | 34,680 | $ | 466,373 | ||||||||||||||
| Receivables | 6,396 | 313 | 6,709 | |||||||||||||||||
| Deferred leasing costs | 2,560 | — | 2,560 | |||||||||||||||||
| Prepaid and other assets | 919 | — | 919 | |||||||||||||||||
| Subtotal | $ | 441,568 | $ | 34,993 | $ | 476,561 | ||||||||||||||
| Reconciliation to total assets of March 31, 2022 | ||||||||||||||||||||
| Carrying value per reportable segments | $ | 476,561 | ||||||||||||||||||
| Other assets | 7,227 | |||||||||||||||||||
| Total assets | $ | 483,788 | ||||||||||||||||||
| Carrying value as of December 31, 2021 | $ | 437,232 | $ | 36,825 | $ | 474,057 | ||||||||||||||
| Receivables | 5,830 | 112 | 5,942 | |||||||||||||||||
| Deferred leasing costs | 2,673 | — | 2,673 | |||||||||||||||||
| Prepaid and other assets | 534 | — | 534 | |||||||||||||||||
| Subtotal | $ | 446,269 | $ | 36,937 | $ | 483,206 | ||||||||||||||
| Reconciliation to total assets of December 31, 2021 | ||||||||||||||||||||
| Carrying value per reportable segments | $ | 483,206 | ||||||||||||||||||
| Other assets | 8,409 | |||||||||||||||||||
| Total assets | $ | 491,615 | ||||||||||||||||||
30
RREEF PROPERTY TRUST, INC.
NOTES TO CONSOLIDATED FINANCIAL STATEMENTS - continued
March 31, 2022
(Unaudited)
(in thousands, except share and per share data)
| Three Months Ended March 31, 2022 | Real Estate Properties | Real Estate Equity Securities | Total | ||||||||||||||
| Property related income | $ | 10,143 | $ | — | $ | 10,143 | |||||||||||
| Investment income on marketable securities | — | 233 | 233 | ||||||||||||||
| Total revenues | 10,143 | 233 | 10,376 | ||||||||||||||
| Segment operating expenses | 2,986 | 10 | 2,996 | ||||||||||||||
| Net realized gain upon sale of marketable securities | — | 1,025 | 1,025 | ||||||||||||||
| Net unrealized change in fair value of investment in marketable securities | — | (3,338) | (3,338) | ||||||||||||||
| Operating income (loss) - segments | $ | 7,157 | $ | (2,090) | $ | 5,067 | |||||||||||
| Three Months Ended March 31, 2021 | |||||||||||||||||
| Property related income | $ | 8,207 | $ | — | $ | 8,207 | |||||||||||
| Investment income on marketable securities | — | 144 | 144 | ||||||||||||||
| Total revenues | 8,207 | 144 | 8,351 | ||||||||||||||
| Segment operating expenses | 2,368 | 7 | 2,375 | ||||||||||||||
| Net realized gain upon sale of marketable securities | — | 671 | 671 | ||||||||||||||
| Net unrealized change in fair value of investment in marketable securities | — | 1,082 | 1,082 | ||||||||||||||
| Operating income - segments | $ | 5,839 | $ | 1,890 | $ | 7,729 | |||||||||||
| Three Months Ended March 31, | |||||||||||||||||
| Reconciliation to net (loss) income | 2022 | 2021 | |||||||||||||||
| Operating income - segments | $ | 5,067 | $ | 7,729 | |||||||||||||
| General and administrative expenses | (527) | (547) | |||||||||||||||
| Advisory expenses | (2,349) | (747) | |||||||||||||||
| Depreciation | (2,857) | (1,635) | |||||||||||||||
| Amortization | (2,900) | (1,422) | |||||||||||||||
| Operating (loss) income | (3,566) | 3,378 | |||||||||||||||
| Interest expense | (2,144) | (1,685) | |||||||||||||||
| Net (loss) income | $ | (5,710) | $ | 1,693 | |||||||||||||
NOTE 14 — ECONOMIC DEPENDENCY
The Company depends on RREEF America and the Dealer Manager for certain services that are essential to the Company, including the sale of the Company's shares of common stock, asset acquisition and disposition decisions and other general and administrative responsibilities. In the event that RREEF America or the Dealer Manager is unable to provide such services, the Company would be required to find alternative service providers.
NOTE 15 — COMMITMENTS AND CONTINGENCIES
31
RREEF PROPERTY TRUST, INC.
NOTES TO CONSOLIDATED FINANCIAL STATEMENTS - continued
March 31, 2022
(Unaudited)
(in thousands, except share and per share data)
In the normal course of business, from time to time, the Company may be involved in legal actions relating to the ownership and operations of real estate investments. In the Company's opinion, the liabilities, if any, that may ultimately result from such legal actions are not expected to have a material adverse effect on the Company's consolidated financial position, results of operations or liquidity.
The Company, as an owner of real estate, is subject to various environmental laws of federal and local governments. All of the Company's properties were subject to assessments, involving visual inspections of the properties and their neighborhoods. The Company carries environmental liability insurance on its properties that provides coverage for remediation liability and pollution liability for third-party bodily injury and property damage claims. The Company does not believe such environmental assessments will have a material adverse impact on the Company's consolidated financial position or results of operations in the future.
NOTE 16 — SUBSEQUENT EVENTS
The Company has evaluated subsequent events through the date of filing of this Form 10-Q and concluded that no material subsequent events have occurred since March 31, 2022.
32
ITEM 2. MANAGEMENT'S DISCUSSION AND ANALYSIS OF FINANCIAL CONDITION AND RESULTS OF OPERATIONS
The following discussion and analysis of our financial condition and results of operations should be read in conjunction with our unaudited consolidated financial statements, the notes thereto and the other unaudited financial data included in this Quarterly Report on Form 10-Q, or this Quarterly Report. The following discussion should also be read in conjunction with our audited consolidated financial statements and the notes thereto, included in our Annual Report on Form 10-K for the year ended December 31, 2021. We further invite you to visit our website, www.rreefpropertytrust.com, where we routinely post additional information about our Company, such as, without limitation, our daily net asset value, or NAV, per share. The contents of our website are not incorporated by reference. The terms “we,” “us,” “our” and the “Company” refer to RREEF Property Trust, Inc. and its subsidiaries.
The NAV per share is published daily via NASDAQ's Mutual Fund Quotation System under the symbols ZRPTAX, ZRPTIX, ZRPTMX, ZRPTNX, ZRPTTX, ZRPTUX and ZRPTDX for our Class A shares, Class I shares, Class M-I shares, Class N shares, Class T shares, Class T2 shares and Class D shares, respectively. The NAV per share for our Class S shares will be available on the Company's website and via NASDAQ's Mutual Fund Quotation System once the first sale of shares for this share class has occurred.
All dollar amounts included in this Quarterly Report on Form 10-Q are presented in thousands, except for per share data.
Forward-Looking Statements
Certain statements contained in this Quarterly Report on Form 10-Q, other than historical facts, may be considered forward-looking statements within the meaning of Section 27A of the Securities Act of 1933, as amended, or the Securities Act, or Section 21E of the Securities Exchange Act of 1934, as amended, or the Exchange Act. We intend for all such forward-looking statements to be covered by the safe harbor provisions for forward-looking statements contained in Section 27A of the Securities Act and Section 21E of the Exchange Act, as applicable by law. Such statements include, in particular, statements about our plans, strategies and prospects and are subject to certain risks and uncertainties, as well as known and unknown risks, which could cause actual results to differ materially from those projected or anticipated. Therefore, such statements are not intended to be a guaranty of our performance in future periods. Such forward-looking statements can generally be identified by our use of forward-looking terminology such as “may,” “will,” “would,” “could,” “should,” “expect,” “intend,” “anticipate,” “estimate,” “believe,” “continue,” “plan,” “potential,” “predict” or other similar words.
The forward-looking statements included herein are based upon our current expectations, plans, estimates, assumptions and beliefs that involve numerous risks and uncertainties. Assumptions relating to the foregoing involve judgments with respect to, among other things, future economic, competitive and market conditions and future business decisions, all of which are difficult or impossible to predict accurately and many of which are beyond our control. Although we believe that the expectations reflected in such forward-looking statements are based on reasonable assumptions, our actual results and performance could differ materially from those set forth in the forward-looking statements.
Forward-looking statements that were true at the time made may ultimately prove to be incorrect or false. We caution readers not to place undue reliance on forward-looking statements, which reflect our management’s view only as of the date this Quarterly Report on Form 10-Q is filed with the Securities and Exchange Commission, or the SEC. We make no representation or warranty (express or implied) about the accuracy of any such forward-looking statements contained in this Quarterly Report on Form 10-Q. Additionally, we undertake no obligation to update or revise forward-looking statements to reflect changed assumptions, the occurrence of unanticipated events or changes to future operating results. The forward-looking statements should be read in light of the risk factors identified in “Risk Factors” of this Quarterly Report on Form 10-Q and our Annual Report on Form 10-K for the year ended December 31, 2021.
33
Overview
We are a Maryland corporation formed on February 7, 2012, our inception date, to invest in a diversified portfolio of high quality, income-producing commercial real estate properties and other real estate-related assets. We are an externally advised, perpetual-life corporation that initially elected to be taxed as a REIT for federal income tax purposes for the calendar year ended December 31, 2013. We invest primarily in the office, industrial, retail and apartment sectors of the commercial real estate industry in the United States. We may also invest in real estate-related assets, which include common and preferred stock of publicly-traded REITs and other real estate companies, which we refer to as “real estate equity securities,” and debt investments backed by real estate, which we refer to as “real estate loans.” We hold our properties, real estate-related assets and other investments through RREEF Property Operating Partnership, LP, or our operating partnership, of which we are the sole general partner.
Our board of directors has ultimate oversight and policy-making authority over us, including responsibility for governance, financial controls, compliance and disclosure. Pursuant to our advisory agreement, our board of directors has delegated to RREEF America L.L.C., or our advisor, authority to manage our day-to-day business in accordance with our investment objectives, strategy, guidelines, policies and limitations. Our advisory agreement is renewable annually upon approval by our board of directors, including a majority of our independent directors. The current term expires on April 21, 2022.
We raise capital through a combination of public and private offerings of our shares of common stock. Our initial public offering commenced on January 3, 2013, through which we raised a total of $102,831. Our follow-on public offering commenced in July 12, 2016, through which we raised a total of $132,994. On January 8, 2020, our second follow-on offering commenced, through which we have raised $95,786 as of March 31, 2022. We have registered for sale in our second follow-on offering up to $2,300,000 of shares of our common stock to be sold on a "best efforts" basis in any combination of Class A, Class I, Class M-I, Class N, Class S, Class T or Class T2 common stock (the "Second Follow-On Public Offering").
On January 20, 2016, we launched a private offering of up to a maximum of $350,000 of our Class D shares (the “Reg D Private Placement”). The Reg D Private Placement is being conducted pursuant to Rule 506(c) of Regulation D promulgated under the Securities Act.
On November 17, 2020, we commenced a separate private offering of up to a maximum of $300,000 in Class D shares under Regulation S promulgated under the Securities Act (the "Reg S Private Placement" and, together with the Reg D Private Placement, the "Private Placements"). We refer to the Second Follow-On Public Offering and the Private Placements collectively as our “offerings.”
The per share purchase price of our common stock varies from day-to-day, and on any given business day, for a given share class, is equal to our NAV of such share class divided by the number of shares of our common stock outstanding for such share class as of the end of business on such day, plus, for Class A, Class D, Class S, Class T and Class T2 shares only, applicable selling commissions and dealer manager fees.
We are structured as a perpetual-life, non-exchange traded REIT. This means that, subject to regulatory approval of our filing for additional offerings, we intend to sell shares of our common stock on a continuous basis and for an indefinite period of time. We will endeavor to take all reasonable actions to avoid interruptions in the continuous public offering of our shares of common stock. There can be no assurance, however, that we will not need to suspend our continuous public offering. The public offering must be registered in every state in which we offer or sell shares. Generally, such registrations are for a period of one year. Thus, we may have to stop selling shares in any state in which our registration is not renewed or otherwise extended annually. We reserve the right to terminate the Second Follow-On Public Offering at any time and to extend the Second Follow-On Public Offering's term to the extent permissible under applicable law.
COVID-19 Pandemic
34
The ongoing COVID-19 pandemic has had, and may continue to have, a significant impact on local, national and global economies. We continue to closely monitor the impact of the COVID-19 pandemic on all aspects of our investments and operations, including its impact on our tenants and business partners. While we did not incur significant disruptions in our operations from the COVID-19 pandemic during the three months ended March 31, 2022 and the years ended December 31, 2021 and 2020, the extent to which the COVID-19 pandemic ultimately impacts our investments and operations will depend on future developments, which are highly uncertain and cannot be predicted with confidence and may affect our ability to make distributions to our stockholders, service our debt, or meet other financial obligations. Among the cash on hand, ongoing net capital raise and availability under our line of credit, we believe we have and can maintain sufficient liquidity at all times to satisfy our operational needs and the maximum quarterly limits on redemptions under our share redemption plan.
Portfolio Information
Real Estate Property Portfolio
As of March 31, 2022, we owned 15 properties diversified across geography and sector, including one medical office property and one student housing property (a subset of apartment). Excluding our apartment properties with leases that roll over approximately every year, as of March 31, 2022, our weighted average remaining lease term for active leases was 4.1 years. The following table sets forth certain additional information about the properties we owned as of March 31, 2022:
| Property | Location | Rentable Square Feet | Number of Leases/Units | Leased(1) | ||||||||||||||||||||||
| Office Properties | ||||||||||||||||||||||||||
| Heritage Parkway | Woodridge, IL | 94,233 | 1 | 100.0 | % | |||||||||||||||||||||
| Anaheim Hills Office Plaza | Anaheim, CA | 73,892 | 7 | 86.1 | ||||||||||||||||||||||
| Loudoun Gateway | Sterling, VA | 102,015 | 1 | 100.0 | ||||||||||||||||||||||
| Allied Drive | Dedham, MA | 64,127 | 2 | 100.0 | ||||||||||||||||||||||
| Office Total | 334,267 | 11 | 97.2 | |||||||||||||||||||||||
| Retail Properties | ||||||||||||||||||||||||||
Wallingford Plaza(2) | Seattle, WA | 30,761 | 4 | 87.6 | ||||||||||||||||||||||
| Terra Nova Plaza | Chula Vista, CA | 96,114 | 2 | 100.0 | ||||||||||||||||||||||
Elston Plaza(3) | Chicago, IL | 92,806 | 11 | 95.7 | ||||||||||||||||||||||
Providence Square(4) | Marietta, GA | 222,805 | 26 | 99.3 | ||||||||||||||||||||||
| Retail Total | 442,486 | 43 | 97.2 | |||||||||||||||||||||||
| Industrial Properties | ||||||||||||||||||||||||||
Commerce Corner | Logan Township, NJ | 259,910 | 2 | 100.0 | ||||||||||||||||||||||
Miami Industrial | ||||||||||||||||||||||||||
Palmetto Lakes | Miami Lakes, FL | 182,919 | 1 | 100.0 | ||||||||||||||||||||||
Hialeah I | Miami, FL | 57,000 | 1 | 100.0 | ||||||||||||||||||||||
Hialeah II | Miami, FL | 50,000 | 1 | 100.0 | ||||||||||||||||||||||
Seattle East Industrial | Redmond, WA | 210,321 | 1 | 100.0 | ||||||||||||||||||||||
| Industrial Total | 760,150 | 6 | 100.0 | |||||||||||||||||||||||
| Apartment Properties | ||||||||||||||||||||||||||
| The Flats at Carrs Hill | Athens, GA | 135,864 | 138 | 100.0 | ||||||||||||||||||||||
| The Glenn | Centennial, CO | 274,688 | 306 | 98.0 | ||||||||||||||||||||||
| Apartment Total | 410,552 | 444 | 98.5 | |||||||||||||||||||||||
| Grand Total | 1,947,455 | 60/444 | 98.4 | % | ||||||||||||||||||||||
35
(1) Leased percentage is based on executed leases as of March 31, 2022, is calculated based on square footage for a single property and is weighted by relative property value when calculated for more than one property together.
(2) Wallingford Plaza is ground floor retail plus two floors of office space.
(3) The total square footage for Elston Plaza includes a freestanding bank branch of 4,860 square feet that is subject to a ground lease to a single tenant.
(4) The total square footage for Providence Square includes a freestanding restaurant of 5,779 square feet that is subject to a ground lease to a single tenant.
Real Estate Equity Securities Portfolio
As of March 31, 2022, our real estate equity securities portfolio consisted of publicly-traded common stock of 32 REITs with a value of $34,680. We believe that investing a portion of our proceeds from our offerings into a diversified portfolio of common and preferred shares of REITs and other real estate operating companies will provide the overall portfolio some flexibility with near-term liquidity as well as potentially enhance our NAV over a longer period. Our real estate equity securities portfolio is regularly reviewed and evaluated to determine whether the securities held continue to serve their original intended purposes.
The following chart summarizes the diversification of our real estate equity securities portfolio by property type as of March 31, 2022:
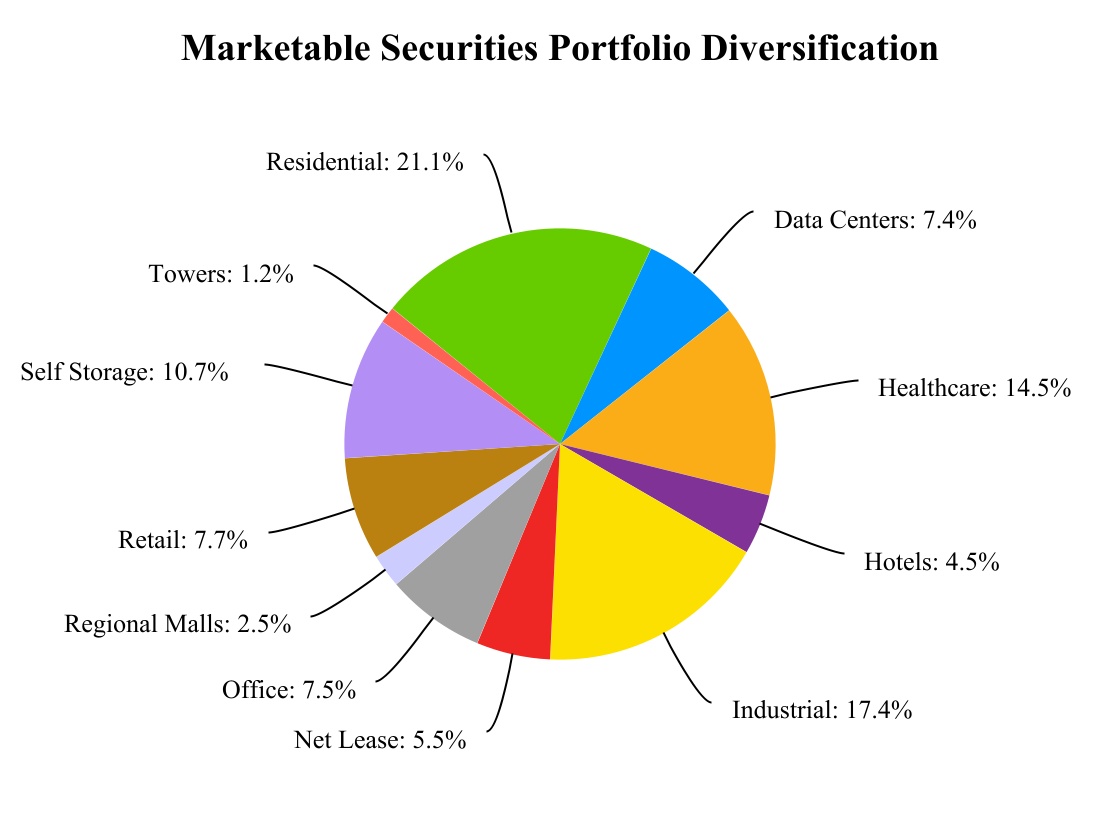
36
As of March 31, 2022, our top ten holdings in our real estate equity securities portfolio were as follows:
| Security | Sector | Percent of Securities Portfolio | ||||||||||||
| Prologis, Inc. | Industrial | 10.6 | % | |||||||||||
| AvalonBay Communities, Inc. | Residential | 7.0 | ||||||||||||
| Public Storage | Self Storage | 6.2 | ||||||||||||
| Welltower, Inc. | Healthcare | 5.6 | ||||||||||||
| Boston Properties, Inc. | Office | 4.6 | ||||||||||||
| Digital Realty Trust, Inc. | Data Center | 4.5 | ||||||||||||
| Life Storage, Inc. | Self Storage | 4.4 | ||||||||||||
| Ventas, Inc. | Healthcare | 3.8 | ||||||||||||
| Kimco Realty Corp. | Retail | 3.7 | ||||||||||||
| Mid-America Apartment Communities, Inc. | Residential | 3.7 | ||||||||||||
| Total | 54.1 | % | ||||||||||||
Market Outlook
United States real estate performed well in 2021. Although the year began tepidly amid a surge of COVID infections, the steady rollout of vaccines unleashed a resurgence of economic, leasing, and transactions activity in the spring and summer. By year-end, overall vacancy rates had dropped to about their lowest levels in more than 30 years, according to CBRE Econometric Advisors (CBRE-EA), December 2021. Net Operating Income (NOI) increased 12.4%, a rate eclipsed only once (during the dot-com boom) since 1983, according to the National Council of Real Estate Investment Fiduciaries (NCREIF), December 2021. Transaction volume of $809 billion was the highest in at least 20 years, according to Real Capital Analytics, December 2021. Finally, NCREIF reported in January 2022 that its fund-level Open-end Diversified Core Equity real estate index delivered its strongest total returns in history (since 1978).
In our view, a flood of capital, reflected in compressing capitalization rates, played a role in pushing values higher. Yet, we believe that the rebound was largely driven by fundamentals. CBRE-EA reports as of December 2021 the apartment sector absorbed 614,000 units in 2021, shattering annual totals back to 1996. Further, CBRE-EA reports as of December 2021 that industrial absorption of 432 million square feet was the highest since at least 1989. Even the retail sector, which suffered well-documented pressure from e-commerce as well as mandated store closures, registered its fifth consecutive quarter of positive net demand, according to CBRE-EA as of December 2021. Finally, CBRE-EA reports as of December 2021 that in all three sectors, vacancy rates dropped to their lowest levels on record, underpinning solid rent growth of about 10% in the case of apartments and industrial buildings, and 2% for retail centers.
In our view, the macroeconomic climate has darkened somewhat in 2022. We believe tight labor markets and supply-chain stress – exacerbated by war in Europe and further COVID lockdowns in China – have fueled inflation, prompting the Federal Reserve to lift interest rates. In our view, higher inflation and interest rates could add headwinds to an economy that was already poised to decelerate following last year’s extraordinary, stimulus-fueled re-opening surge.
Nevertheless, we remain sanguine about the real estate outlook. The economy might slow, but pent-up household savings will, in our view, continue to support above-average growth and leasing activity while higher interest rates might increase the cost of leveraging property. However, we believe that investors will increasingly look to real estate to hedge inflation risks. Importantly, unlike most debt instruments, real estate’s cash flows and residual values are not fixed. We believe rising wages and sales can augment renters’ spending power (per capita income increased 11% in 2021 according to the Bureau of Economic Analysis as of December 2021). We further believe higher construction costs can also constrain competitive supply (materials prices soared 35% in 2021, the most in at least 70 years, according to the Census Bureau for construction materials costs, as of December 2021).
37
We believe the combination of increased spending power and restricted supply can support stronger rent growth. And over time, we believe real estate values have tracked replacement costs. Indeed, property prices rose briskly in the 1970s, despite several recessions, as inflation and interest rates increased well into the double digits, according the Federal Reserve as of December 2021. Accordingly, we believe that real estate is well positioned in the face of a potentially volatile, inflationary period ahead.
Results of Operations
Since our inception, we have acquired 15 properties and invested in real estate equity securities as described above under "Portfolio Information." We expect to continue to raise additional capital, increase our borrowings and make future investments in our targeted segments of real estate properties, real estate equity securities and real estate loans, which we believe will have a significant impact on our future results of operations.
We review our stabilized operating results, measured by contractual rental revenue, including tenant reimbursement income, less property operating expenses, which we refer to as net operating income, for properties that we owned for the entirety of both the current and prior year reporting periods, which we refer to as “same-store” properties. We believe that net operating income, a non-GAAP financial measure, in combination with net income (loss) and cash flows from operating activities, as defined by GAAP, is a useful supplemental performance measure that helps us evaluate our operating performance. We believe this metric is useful to our stockholders and other users of our reports because it provides additional information regarding our property acquisitions and their impact on our portfolio. Net operating income should not be considered as an alternative to net income (loss) or to cash flows from operating activities (both as defined by GAAP) as an indication of our performance and is not intended to be used as a liquidity measure indicative of cash flow available to fund our cash needs, including our ability to make distributions to our stockholders. No single measure can provide users of financial information with sufficient information, and only our disclosures read as a whole can be relied upon to adequately portray our financial position, liquidity and results of operations.
Three Months Ended March 31, 2022 and 2021
The following table illustrates the changes in lease revenue, property operating expenses, and net operating income for the three months ended March 31, 2022 and 2021. For the three months ended March 31, 2022 and 2021, all of our properties except The Glenn are considered same-store properties. For purposes of comparative analysis, the table below reconciles the net operating income to net income (loss) determined in accordance with GAAP for the three months ended March 31, 2022 and 2021.
38
| Three Months Ended March 31, | |||||||||||||||||
| 2022 | 2021 | Change | |||||||||||||||
| Lease revenue | |||||||||||||||||
| Lease revenue - same-store portfolio | $ | 8,061 | $ | 7,711 | $ | 350 | |||||||||||
| Lease revenue - non-same-store portfolio | 1,713 | — | 1,713 | ||||||||||||||
| Total lease revenue | 9,774 | 7,711 | 2,063 | ||||||||||||||
| Property operating expenses | |||||||||||||||||
| Same-store portfolio | 2,392 | 2,368 | 24 | ||||||||||||||
| Non-same-store portfolio | 594 | — | 594 | ||||||||||||||
| Total property operating expenses | 2,986 | 2,368 | 618 | ||||||||||||||
| Net operating income | |||||||||||||||||
| Same-store portfolio | 5,669 | 5,343 | 326 | ||||||||||||||
| Non-same-store portfolio | 1,119 | — | 1,119 | ||||||||||||||
| Total net operating income | 6,788 | 5,343 | 1,445 | ||||||||||||||
| Adjustments to lease revenue | |||||||||||||||||
| Straight-line revenue | 191 | 332 | (141) | ||||||||||||||
| Above- and below-market lease amortization, net | 204 | 190 | 14 | ||||||||||||||
| Lease incentive amortization | (26) | (26) | — | ||||||||||||||
| Depreciation | (2,857) | (1,635) | (1,222) | ||||||||||||||
| Amortization | (2,900) | (1,422) | (1,478) | ||||||||||||||
| General and administrative expenses | (537) | (554) | 17 | ||||||||||||||
| Advisory fees | (2,349) | (747) | (1,602) | ||||||||||||||
| Interest expense | (2,144) | (1,685) | (459) | ||||||||||||||
| Marketable securities | |||||||||||||||||
| Investment income on marketable securities | 233 | 144 | 89 | ||||||||||||||
| Net realized gain on marketable securities | 1,025 | 671 | 354 | ||||||||||||||
| Net unrealized change in fair value of marketable securities | (3,338) | 1,082 | (4,420) | ||||||||||||||
| Net (loss) income | $ | (5,710) | $ | 1,693 | $ | (7,403) | |||||||||||
Property Operations
Each of our total lease revenue and total property operating expenses for the three months ended March 31, 2022 increased compared to those from the same period in 2021, resulting in an net increase to net operating income. Our total same-store net operating income for the three months ended March 31, 2022 and 2021 reflects all properties in the portfolio except The Glenn which we acquired in November 2021. Same-store lease revenue for the three months ended March 31, 2022 increased from the same period in 2021 due in part to an increase in lease
39
revenue of $230 at Heritage Parkway due to a 5-year lease renewal which provided free rent for two months during the 2021 period compared to no free rent during the 2022 period. Partially offsetting this increase was lower same-store lease revenue at Anaheim Hills Office Plaza due to free rent provided pursuant to a lease renewal. Lastly, same-store lease revenue increased from contractually stepped-up rents at several leases across the portfolio and higher rents at The Flats at Carrs Hill for the 2021-2022 school year.
Same-store property operating expenses for the three months ended March 31, 2022 immaterially increased from the same period in 2021.
Straight-Line Revenue
The decrease in straight-line revenue for the three months ended March 31, 2022 compared to the same period in 2021 was primarily due to the aforementioned free rent impacts at Heritage Parkway and Anaheim Hills Office Plaza, combined with increased contractual rents at several properties across the portfolio.
Lease Intangible Amortization
During the three months ended March 31, 2022, the net amount of above- and below-market lease amortization immaterially increased from the same period in 2021. Lease incentive amortization primarily represents amortization of the lease incentive paid to Dick's Sporting Goods, Inc. at Terra Nova Plaza, which is being amortized over the approximate 10-year term of that lease.
Depreciation and Amortization
The depreciation and amortization on properties increased in the 2022 period compared to the 2021 period due to our acquisition of The Glenn in November 2021.
General and Administrative
Our general and administrative expenses include a variety of corporate expenses, the largest of which were directors and officers insurance, audit fees, legal fees and independent director compensation. The amount for the three months ended March 31, 2022 decreased from the same period in 2021 primarily due to lower legal fees and state income tax accruals, partially offset by higher directors and officers insurance and fund administrator fees.
Advisory Fees
The fixed component of the advisory fee pursuant to the advisory agreement is equal to 1% per annum of the NAV for each share class and is calculated and accrued daily and reflected in our NAV per share. The fixed component of the advisory fee was higher in the 2022 period compared to the 2021 period which is commensurate with the overall increase in our average NAV, as we continue to raise and invest capital.
In accordance with our advisory agreement, our advisor can earn the performance component of the advisory fee when the total return to stockholders of a particular share class exceeds a required per annum hurdle for such share class (the “Hurdle Amount”). The performance component is calculated separately for each share class and is comprised of the distributions paid to stockholders in each share class combined with the change in price of each share class. For any calendar year in which the total return per share allocable to a class exceeds the Hurdle Amount for such class, RREEF America will receive a percentage of the aggregate total return allocable to such class. The performance component of the advisory fee is payable annually based on the results for the entire calendar year. The actual performance component that our advisor could earn in the current calendar year depends on several factors, including but not limited to the performance of our investments, our expenses and interest rates. For the three months ended March 31, 2022 and 2021, the total return of each share class exceeded the required Hurdle Amount for each share class, applied on a pro rata basis as applicable, resulting in our recognition under GAAP of a performance component of the advisory fee of $1,500 and $200 for the three months ended March 31, 2022 and 2021, respectively.
40
Interest Expense
The higher interest expense for the three months ended March 31, 2022 compared to the same period in 2021 was due to the new $66,000 fixed rate loan which we originated in connection with our acquisition of The Glenn in November 2021. The increased increase expense was offset somewhat by a lower weighted average outstanding aggregate balance on our Wells Fargo line of credit. During the three months ended March 31, 2022, we made net principal payments toward our Wells Fargo line of credit. As a result, the weighted average outstanding aggregate balance on our line of credit was $75,167 and $77,351 for the three months ended March 31, 2022 and 2021, respectively. Our total outstanding loan balance as of March 31, 2022 consisted of 73% fixed rate loans and 27% floating rate loans.
We expect our interest expense to increase in future periods because we anticipate acquiring additional properties with borrowings, including by utilizing additional property-specific debt as a form of permanent financing along with continuing to use our line of credit.
Marketable Securities
The increase in investment income for the three months ended March 31, 2022 compared to the corresponding 2021 period is primarily due to a higher investment base. From first quarter 2021 through first quarter 2022, we invested an additional $5,500 into our securities portfolio. In addition, the ongoing adjustments to the portfolio mix allowed realized gains to be reinvested into additional real estate equity securities, further increasing our investment base. Our portfolio of investments in publicly-traded REIT securities is actively managed and thus is regularly adjusted by increasing and decreasing specific holdings primarily based upon changes in sector allocations and to a lesser degree based upon performance of specific securities. These continual portfolio refinements generate realized gains and losses by using the highest cost method whereby a sale of any particular security is first attributed to the shares of that security with the highest cost basis. For the three months ended March 31, 2022, our real estate securities portfolio posted net realized gains and net unrealized losses of $1,025 and $3,338, respectively.
Inflation
In our view, the real estate property sector has not been affected significantly by inflation in the past several years due to the relatively low inflation rate. However, the recent increase in inflation since mid-2021 as evidenced by the consumer price index, and the extent to which it continues, may have an impact on our property operating expenses. The eventual reduction of inflation to historical averages of the previous five years remains subject to countless economic, regulatory and population driven variables.
With the exception of leases with tenants in apartment properties, we seek to include provisions in our tenant leases designed to protect us from the impact of inflation. These provisions include annual contractual base rent increases, reimbursement billings for operating expense pass-through charges, real estate tax and insurance reimbursements, or in some cases, annual reimbursement of operating expenses above a certain allowance. Due to the generally long-term nature of these leases, and should the inflation readings since the second quarter of 2021 persist for an extended period, annual rent increases may not be sufficient to cover inflation and may result in rental rates that are below market. Leases in apartment properties generally turn over on an annual basis and do not typically present the same concerns regarding inflation protection due to their short-term nature.
In addition, prices for certain construction materials have risen significantly over the past year. While we have incurred typical ongoing capital expenditures for property improvements and maintenance, such costs have thus far been relatively immaterial. We currently do not have any development or significant capital projects planned at any property. Future significant capital projects may be impacted by increased material and/or labor costs.
NAV per Share
Our NAV per share is calculated in accordance with the valuation guidelines approved by our board of directors
41
for the purposes of establishing a purchase price for our shares sold in our offerings as well as establishing a redemption price for our share repurchase plan. The following table provides a breakdown of the major components of our total NAV and NAV per share as of March 31, 2022:
| Components of NAV | Total NAV | Per Class A Share | Per Class I Share | Per Class T Share | Per Class D Share | Per Class N Share | Per Class M-I Share | Per Class T2 Share | Per Class Z Share | |||||||||||||||||||||||||||||||||||||||||||||||
Investments in real estate (1) | $ | 592,000 | $ | 28.12 | $ | 28.28 | $ | 28.21 | $ | 28.32 | $ | 28.21 | $ | 28.18 | $ | 28.08 | $ | 28.29 | ||||||||||||||||||||||||||||||||||||||
Investments in real estate equity securities (2) | 34,680 | 1.65 | 1.66 | 1.65 | 1.66 | 1.65 | 1.65 | 1.65 | 1.66 | |||||||||||||||||||||||||||||||||||||||||||||||
| Other assets, net | 10,607 | 0.50 | 0.51 | 0.50 | 0.51 | 0.50 | 0.50 | 0.50 | 0.51 | |||||||||||||||||||||||||||||||||||||||||||||||
| Line of credit | (71,300) | (3.39) | (3.41) | (3.39) | (3.41) | (3.40) | (3.39) | (3.38) | (3.40) | |||||||||||||||||||||||||||||||||||||||||||||||
| Mortgage loans payable | (191,695) | (9.10) | (9.16) | (9.12) | (9.18) | (9.14) | (9.12) | (9.09) | (9.15) | |||||||||||||||||||||||||||||||||||||||||||||||
| Other liabilities, net | (8,602) | (0.41) | (0.41) | (0.45) | (0.40) | (0.39) | (0.42) | (0.41) | (0.45) | |||||||||||||||||||||||||||||||||||||||||||||||
| Net asset value | $ | 365,690 | $ | 17.37 | $ | 17.47 | $ | 17.40 | $ | 17.50 | $ | 17.43 | $ | 17.40 | $ | 17.35 | $ | 17.46 | ||||||||||||||||||||||||||||||||||||||
Note: No Class S shares were outstanding as of March 31, 2022. | ||||||||||||||||||||||||||||||||||||||||||||||||||||||||
(1) The value of our investments in real estate was approximately 19.6% more than their historical cost.
(2) The value of our investments in real estate securities was approximately 29.6% more than their historical cost.
As of March 31, 2022, all properties were appraised by a third-party appraisal firm in addition to our independent valuation advisor. Set forth below are the weighted averages of the key assumptions used in the appraisals of the properties by type as of March 31, 2022.
| Discount Rate | Exit Capitalization Rate | |||||||||||||
| Office properties | 7.27 | % | 6.41 | % | ||||||||||
| Retail properties | 6.81 | % | 6.04 | % | ||||||||||
| Industrial properties | 4.96 | % | 4.16 | % | ||||||||||
| Apartment properties | 5.50 | % | 4.25 | % | ||||||||||
These assumptions are determined by our independent valuation advisor or by separate third-party appraisers. A change in these assumptions would impact the calculation of the value of our property investments. The table below shows the approximate decrease in the value of our property investments assuming an increase of 0.25% in the weighted-average discount rate or the weighted-average exit capitalization rate as of March 31, 2022.
| Discount Rate | Exit Capitalization Rate | |||||||||||||
| Office properties | (1.8) | % | (2.4) | % | ||||||||||
| Retail properties | (1.8) | % | (2.3) | % | ||||||||||
| Industrial properties | (2.0) | % | (4.1) | % | ||||||||||
| Apartment properties | (2.0) | % | (3.9) | % | ||||||||||
The table below sets forth a reconciliation of our stockholders' equity to our NAV, which we calculate for the purpose of establishing the purchase and redemption price for our shares, as of March 31, 2022.
42
| Total NAV | Per Class A Share | Per Class I Share | Per Class T Share | Per Class D Share | Per Class N Share | Per Class M-I Share | Per Class T2 Share | Per Class Z Share | |||||||||||||||||||||||||||||||||||||||||||||
| Total stockholders' equity | $ | 179,358 | $ | 8.52 | $ | 8.57 | $ | 8.53 | $ | 8.57 | $ | 8.54 | $ | 8.53 | $ | 8.50 | $ | 8.56 | |||||||||||||||||||||||||||||||||||
| Plus: | |||||||||||||||||||||||||||||||||||||||||||||||||||||
| Unrealized gain on real estate investments | 97,100 | 4.61 | 4.64 | 4.62 | 4.65 | 4.63 | 4.62 | 4.61 | 4.64 | ||||||||||||||||||||||||||||||||||||||||||||
| Accumulated depreciation | 38,740 | 1.84 | 1.85 | 1.84 | 1.85 | 1.85 | 1.84 | 1.84 | 1.85 | ||||||||||||||||||||||||||||||||||||||||||||
| Accumulated amortization | 34,168 | 1.62 | 1.63 | 1.63 | 1.64 | 1.63 | 1.63 | 1.62 | 1.63 | ||||||||||||||||||||||||||||||||||||||||||||
| Deferred costs and expenses, net | 20,944 | 1.00 | 1.00 | 1.00 | 1.01 | 1.00 | 1.00 | 1.00 | 1.00 | ||||||||||||||||||||||||||||||||||||||||||||
| Less: | |||||||||||||||||||||||||||||||||||||||||||||||||||||
| Deferred rent receivable | (4,620) | (0.22) | (0.22) | (0.22) | (0.22) | (0.22) | (0.22) | (0.22) | (0.22) | ||||||||||||||||||||||||||||||||||||||||||||
| Net asset value | $ | 365,690 | $ | 17.37 | $ | 17.47 | $ | 17.40 | $ | 17.50 | $ | 17.43 | $ | 17.40 | $ | 17.35 | $ | 17.46 | |||||||||||||||||||||||||||||||||||
Note: No Class S shares were outstanding as of March 31, 2022. | |||||||||||||||||||||||||||||||||||||||||||||||||||||
The deferred costs and expenses of $20,944 includes amounts that have been accrued as a liability under GAAP but are initially excluded from the NAV calculation. The deferred costs and expenses includes $17,035 in estimated future trailing fees that will be deducted from the NAV on a daily basis as and when they become payable to DWS Distributors, Inc., or the dealer manager. Additionally, the deferred costs and expenses includes $4,590 payable to our advisor which is reflected in due to affiliates and note to affiliate on our consolidated balance sheet but is not yet payable and will be deducted from the NAV as and when they are reimbursed to our advisor in accordance with the advisory agreement, the expense support agreement and the ESA letter agreement dated March 24, 2020 amending the advisory agreement and expense support agreement (defined below). Lastly, the deferred cost and expenses above is net of (1) the portion of the performance component of the advisory fee that is reflected in the NAV calculation, if any, but does not yet meet the threshold for accrual under GAAP, and (2) the difference in recognition between GAAP and our NAV calculation for (i) certain offering costs and (ii) compensation costs related to the shares granted to our independent directors.
Limitations and Risks
As with any valuation methodology, our methodology is based upon a number of estimates and assumptions that may not be accurate or complete. Different parties with different assumptions and estimates could derive a different NAV per share. Accordingly, with respect to our NAV per share, we can provide no assurance that:
•a stockholder would be able to realize this NAV per share upon attempting to resell his or her shares;
•we would be able to achieve, for our stockholders, the NAV per share, upon a listing of our shares of common stock on a national securities exchange, selling our real estate portfolio, or merging with another company; or
•the NAV per share, or the methodologies relied upon to estimate the NAV per share, will be found by any regulatory authority to comply with any regulatory requirements.
Furthermore, the NAV per share was calculated as of a particular point in time. The NAV per share will fluctuate over time in response to, among other things, global, national or regional economic events, such as those caused by the COVID-19 pandemic, changes in real estate market fundamentals, capital markets activities, and attributes specific to the properties and leases within our portfolio. The extent to which the COVID-19 pandemic impacts our investments and operations will depend on future developments, which are highly uncertain and cannot be predicted with confidence. These developments include the duration of the outbreak, the impact of the global vaccination effort, the impact of government stimulus, new information that may emerge concerning the severity of
43
the coronavirus, and actions taken to contain the coronavirus or treat its impact, among others.
The COVID-19 pandemic has had, and may continue to have a significant impact on local, national and global economies. Certain independent third-party appraisal firms engaged by our advisor have included additional cautionary language in their respective first quarter 2022 reports related to the uncertain impact of the COVID-19 pandemic on the property values.
Funds from Operations and Adjusted Funds from Operations
We believe that funds from operations, or FFO, and adjusted funds from operations, or AFFO, in combination with net income or loss and cash flows from operating activities, as defined by GAAP, are useful supplemental performance measures that we use to evaluate our operating performance. However, these supplemental, non-GAAP measures should not be considered as an alternative to net income or loss or to cash flows from operating activities, both as determined by GAAP, as an indication of our performance and are not intended to be used as a liquidity measure indicative of cash flow available to fund our cash needs, including our ability to make distributions to our stockholders. No single measure can provide users of financial information with sufficient information, and only our disclosures read as a whole can be relied upon to adequately portray our financial position, liquidity and results of operations. In addition, other REITs may define FFO and AFFO measures differently and thus choose to treat certain accounting line items in a manner different from us due to differences in investment and operating strategy or for other reasons.
FFO
As defined by the National Association of Real Estate Investment Trusts, or NAREIT, FFO is a non-GAAP supplemental financial performance measure that excludes certain items such as real estate-related depreciation and amortization and the impact of certain non-recurring items such as realized gains and losses on sales of real estate. We believe FFO is a meaningful supplemental financial performance measure of our operating performance that is useful to investors because depreciation and amortization in accordance with GAAP implicitly assume that the value of real estate assets diminishes predictably over time. Additionally, realized gains and losses on sales of real estate generally occur infrequently. As a result, excluding these items from FFO aids our analysis of our ongoing operations. We use FFO as an indication of our operating performance and as a guide to making decisions about future investments.
AFFO
We believe that AFFO is a non-GAAP supplemental financial performance measure that is helpful as a measure of ongoing operating performance because it excludes costs that management considers more reflective of investing activities and other non-operating items included in FFO. Compared to FFO, AFFO additionally excludes items such as acquisition-related costs (if expensed in accordance with GAAP), non-cash amounts related to straight-line rent, amortization of above- and below-market lease intangibles and lease incentives, the performance component of the advisory fee, amortization of restricted stock awards, amortization of deferred financing costs and the net unrealized change in the fair value of our investments in marketable securities. In addition, beginning with the three months ended March 31, 2022,we have additionally excluded the amortization of the discount on the note to affiliate. We have made similar adjustments to prior periods for conformity of presentation.
We use FFO and AFFO, among other things: (i) to evaluate and compare the potential performance of the portfolio after the acquisition phase is complete, and (ii) as metrics in evaluating our ongoing distribution policy. We believe investors are best served if the information that is made available to them allows them to align their analyses and evaluation with these same performance metrics used by us in planning and executing our business strategy. We believe that these performance metrics will assist investors in evaluating the potential performance of the portfolio after the completion of the acquisition phase. However, these supplemental, non-GAAP measures are not necessarily indicative of future performance and should not be considered as an alternative to net income or loss or to cash flows from operating activities, both as determined by GAAP, and are not intended to be used as a liquidity measure indicative of cash flow available to fund our cash needs, including our ability to make distributions to our
44
stockholders. Neither the SEC, NAREIT, nor any regulatory body has passed judgment on the acceptability of the adjustments used to calculate AFFO. In the future, the SEC, NAREIT, or a regulatory body may decide to standardize the allowable adjustments across the non-listed REIT industry at which point we may adjust our calculation and characterization of AFFO.
The following unaudited table presents a reconciliation of net income (loss) to FFO and AFFO.
| Three Months Ended March 31, | |||||||||||
| 2022 | 2021 | ||||||||||
| Net (loss) income | $ | (5,710) | $ | 1,693 | |||||||
| Real estate related depreciation | 2,857 | 1,635 | |||||||||
| Real estate related amortization | 2,900 | 1,422 | |||||||||
| NAREIT defined FFO | $ | 47 | $ | 4,750 | |||||||
| Straight line rents, net | (191) | (332) | |||||||||
| Amortization of above- and below-market lease intangibles, net | (204) | (190) | |||||||||
| Amortization of lease incentive | 26 | 26 | |||||||||
| Net unrealized change in fair value of investment in marketable securities | 3,338 | (1,082) | |||||||||
| Performance component of the advisory fee | 1,500 | 200 | |||||||||
| Amortization of restricted stock awards | 24 | 25 | |||||||||
| Amortization of deferred financing costs | 69 | 84 | |||||||||
| Amortization of discount on note to affiliate | 45 | 43 | |||||||||
| AFFO | $ | 4,654 | $ | 3,524 | |||||||
Liquidity and Capital Resources
Our primary needs for liquidity and capital resources are to fund our investments in accordance with our investment strategy and policies, make distributions to our stockholders, redeem shares of our common stock pursuant to our redemption plan, pay our offering and operating fees and expenses and pay interest on any outstanding indebtedness.
Over time, we generally intend to fund our cash needs for items, other than asset acquisitions and material capital improvements, from operations. Our cash needs for acquisitions and material capital improvements will be funded primarily from the sale of shares of our common stock in our offerings. The amount we may raise in such offerings is uncertain and dependent on a number of factors, including the impacts of the coronavirus pandemic. We commenced our Second Follow-On Public Offering on January 8, 2020. We intend to contribute any additional net proceeds from our offerings that are not used or retained to pay the fees and expenses attributable to our operations to our operating partnership.
The coronavirus pandemic has had, and may continue to have, a significant impact on local, national and global economies. We continue to closely monitor the impact of the COVID-19 pandemic on all aspects of our investments
45
and operations, including how it will impact our tenants and business partners. While thus far, we did not incur significant disruptions in our operations from the COVID-19 pandemic, the extent to which the COVID-19 pandemic ultimately impacts our investments and operations will depend on future developments, which are highly uncertain and cannot be predicted with confidence and may affect our ability to make distributions to our stockholders, service our debt, or meet other financial obligations.
We generally intend to maintain sufficient liquidity at all times to satisfy our operational needs and the maximum potential quarterly redemptions under our share redemption plan. As of March 31, 2022, among our cash balances, our real estate securities portfolio, and the available borrowing capacity on our Wells Fargo line of credit, we had liquidity of $62,128.
We may also satisfy our cash needs for acquisitions and material capital improvements through the assumption or incurrence of debt. On February 27, 2018, we entered into an amended and restated secured revolving line of credit with Wells Fargo Bank, National Association. The Wells Fargo line of credit had a three-year term. In February 2021, we exercised both extension options via an amendment to the Wells Fargo line of credit, thereby extending the maturity date to February 27, 2023. Prior to this maturity date, we expect to refinance the Wells Fargo line of credit via another line of credit. There can be no assurance at this time as to the terms any new line of credit may contain or that we will be able to obtain a new line of credit.
The interest rate under the Wells Fargo line of credit is based on the 1-month LIBOR with a spread of 160 to 180 basis points depending on the debt yield as defined in the agreement. Financial markets are in process of phasing out LIBOR and other interbank offered rates in favor of alternative reference rates. While certain LIBOR rates have already been discontinued, the LIBOR rate applicable to our Wells Fargo line of credit will continue to be published through June 30, 2023, after the maturity of the Wells Fargo line of credit. Consequently, we expect that any new line of credit that we may obtain will be based on an alternative reference rate.
The Wells Fargo line of credit has a current maximum capacity of $100,000, and we have the option to expand the Wells Fargo line of credit up to a maximum capacity of $200,000 upon satisfaction of specified conditions. Each requested expansion must be for at least $25,000 and may result in the Wells Fargo line of credit being syndicated.
The Wells Fargo line of credit has as co-borrowers certain of the wholly-owned subsidiaries of our operating partnership, with the Company serving as the guarantor. At any time, the borrowing capacity under the Wells Fargo line of credit is based on the lesser of (1) an amount equal to 65% of the aggregate value of the properties in the collateral pool as determined by lender appraisals, (2) an amount that results in a minimum debt yield of 9% based on the in-place net operating income of the collateral pool as defined or (3) the maximum capacity of the Wells Fargo line of credit. Proceeds from the Wells Fargo line of credit can be used to fund acquisitions, redeem shares pursuant to our redemption plan and for any other corporate purpose. As of March 31, 2022, our maximum borrowing capacity was $92,983, our outstanding balance was $71,300 and our weighted average interest rate was 2.06%.
The Wells Fargo line of credit agreement contains customary representations, warranties, borrowing conditions and affirmative, negative and financial covenants, including that there must be at least five properties in the collateral pool at all times, and the collateral pool must also meet specified concentration provisions, unless waived by the lender. In addition, the guarantor must meet tangible net worth hurdles. As of March 31, 2022, we were in compliance with all covenants.
Since our inception, we have entered into property specific mortgage loans to finance the acquisition of certain properties, or refinance certain properties off of our Wells Fargo line of credit to create room under our Wells Fargo line of credit to fund future property acquisitions. The following table presents a summary of the property specific mortgage loans in place as of March 31, 2022. Each of the below mortgage loans has a fixed interest rate for the entire term of the mortgage loan. In addition, each mortgage loan contains provisions allowing for (a) a one-time transfer of the loan to an unaffiliated borrower at the sole discretion of the lender and upon payment of applicable fees, and (b) full prepayment of the mortgage loan within allowable windows subject to payment of applicable penalties, if any.
46
| Lender | Encumbered Property | Outstanding Balance | Interest Rate | Maturity Date | ||||||||||||||||||||||
| Talcott Resolution Life Insurance Company | Commerce Corner | $ | 12,144 | 3.41 | % | December 1, 2023 | ||||||||||||||||||||
| Nationwide Life Insurance Company | Flats at Carrs Hill | 14,500 | 3.63 | March 1, 2026 | ||||||||||||||||||||||
| State Farm Life Insurance Company | Elston Plaza | 17,391 | 3.89 | July 1, 2026 | ||||||||||||||||||||||
| Massachusetts Mutual Life Insurance Company | The Glenn | 66,000 | 3.02 | December 1, 2028 | ||||||||||||||||||||||
| Transamerica Life Insurance Company | Wallingford Plaza | 6,820 | 4.56 | January 1, 2029 | ||||||||||||||||||||||
| Nationwide Life Insurance Company | Providence Square | 29,700 | 3.67 | October 5, 2029 | ||||||||||||||||||||||
| JPMorgan Chase Bank | Seattle East Industrial | 45,140 | 3.87 | January 1, 2030 | ||||||||||||||||||||||
| $ | 191,695 | |||||||||||||||||||||||||
Aggregate future principal payments due on the Wells Fargo line of credit and mortgage loans payable as of March 31, 2022 are as follows:
| Year | Amount | |||||||
| Remainder of 2022 | $ | 540 | ||||||
| 2023 | 83,688 | |||||||
| 2024 | 474 | |||||||
| 2025 | 493 | |||||||
| 2026 | 30,746 | |||||||
| Thereafter | 147,054 | |||||||
| Total | $ | 262,995 | ||||||
In the future, as our assets increase, it may not be commercially feasible or we may not be able to secure an adequate line of credit to fund acquisitions, redemptions or other needs. Moreover, actual availability may be reduced at any given time if the values of our real estate or our marketable securities portfolio decline, such as that which may occur as a result of the coronavirus pandemic. Furthermore, the credit markets have been significantly impacted by the coronavirus pandemic which has caused certain lenders in the commercial real estate space to limit available financing options.
Expense Payments by Our Advisor
Pursuant to the advisory agreement, RREEF America is entitled to reimbursement of certain costs incurred by RREEF America or its affiliates. Costs eligible for reimbursement include most third-party operating expenses, salaries and related costs of its employees who perform services for us (but not those employees for which RREEF America earns a separate fee or those employees who are our executive officers) and travel related costs for its employees who incur such costs on our behalf. We will reimburse our advisor for all expenses paid or incurred by our advisor in connection with the services provided to us, subject to the limitations described below regarding the 2%/25% guidelines as defined in our advisory agreement. As of March 31, 2022, we owed $71 to our advisor for such costs.
On May 29, 2013, we entered into an expense support agreement with our advisor, which was amended and restated most recently on January 20, 2016, which we refer to as the expense support agreement. Pursuant to the terms of the expense support agreement, our advisor incurred expenses related to our operations which we refer to as expense payments. These expense payments included, without limitation, expenses that are organization and
47
offering costs and operating expenses under the advisory agreement. As of December 31, 2015, our advisor had incurred $9,200 in expense payments, which was the maximum amount of expense payments allowed under the expense support agreement. We have not received any expense support from our advisor under the expense support agreement since January 1, 2016.
On March 24, 2020, we and our advisor entered into a second letter agreement which superseded the previous letter agreement, which we refer to as the ESA letter agreement. The ESA letter agreement provides, in part, that our obligations to reimburse our advisor for expense payments under the expense support agreement are suspended until the first calendar month following the month in which we have reached $500,000 in offering proceeds from our offerings, which we refer to as the ESA commencement date. Since our inception through March 31, 2022, we raised $373,067 from the sale of shares of our common stock, including proceeds from our dividend reinvestment plan. Pursuant to the ESA letter agreement, our advisor agreed to permanently waive reimbursement of $3,567 of expense payments related to organization and offering costs from our Initial Public Offering. As a result, we currently owe $5,383 to our advisor under the expense support agreement. Beginning the month following the ESA commencement date, we will make monthly reimbursement payments to our advisor in the amount of $250 for the first 12 months and $198 for the second 12 months. In addition, pursuant to the ESA letter agreement, if RREEF America is serving as our advisor at the time that we or our operating partnership undertakes a liquidation, our remaining obligations to reimburse our advisor for the unpaid monthly reimbursements under the expense support agreement shall be waived.
Limits on Expense Reimbursement
In all cases, reimbursement payments to our advisor will be subject to reduction as necessary in order to ensure that such reimbursement payment will not cause the aggregate organization and offering costs paid by us for any particular offering to exceed 15% of the gross proceeds from the sale of shares in such offering as of the date of the reimbursement payment, and such reimbursement payment will not adversely affect our ability to maintain our qualification as a REIT for federal tax purposes.
In addition to the reimbursement limitations for organization and offering costs, we are also limited in the amount of operating expenses that we may reimburse our advisor. Pursuant to our charter, we may reimburse our advisor, at the end of each fiscal quarter, for total operating expenses incurred by our advisor; provided, however, that we may not reimburse our advisor at the end of any fiscal quarter for total operating expenses (as defined in our charter) that, in the four consecutive fiscal quarters then ended, exceed the greater of 2% of our average invested assets or 25% of our net income determined without reduction for any additions to reserves for depreciation, bad debts or other similar non-cash reserves and excluding any gain from the sale of our assets for that period (which we refer to as the 2%/25% guidelines) for such four-quarter period. Notwithstanding the foregoing, we may reimburse our advisor for expenses in excess of the 2%/25% guidelines if a majority of our independent directors determine that such excess expenses, which we refer to as an excess amount, are justified based on unusual and non-recurring factors. For the four fiscal quarters ended March 31, 2022, our total operating expenses (as defined in our charter) were $12,230, which exceeded the 2%/25% guidelines. Based upon a review of unusual and non-recurring factors, including, but not limited to, our particularly strong performance during this period that resulted in an increased performance component of the advisory fee, our independent directors determined that the excess expenses were justified.
Pursuant to the expense support agreement, the amount of the reimbursement payment paid in any calendar quarter will not be aggregated with our cumulative operating expenses for any four consecutive calendar quarters that includes the calendar quarter in which such reimbursement payment is paid, and instead the amount of the unreimbursed expense payments comprising such reimbursement payment will have previously been aggregated with our total operating expenses for the four calendar quarter periods ending with the calendar quarter in which such expense payment was originally incurred, which we refer to as prior 2%/25% periods. If an unreimbursed expense payment incurred during a prior 2%/25% period exceeded the 2%/25% guidelines for such prior 2%/25% period, the amount of such excess will only be reimbursed pursuant to the expense support agreement to the extent that our independent directors previously approved such excess with respect to the applicable prior 2%/25% period.
48
We anticipate our offering and operating fees and expenses will include, among other things, the advisory fee that we pay to our advisor, the selling commissions, dealer manager and distribution fees we pay to the dealer manager, legal and audit expenses, federal and state filing fees, printing expenses, transfer agent fees, marketing and distribution expenses and fees related to appraising and managing our properties. We will not have any office or personnel expenses as we do not have any employees. Our advisor will incur certain of these expenses and fees, for which we may reimburse our advisor, subject to certain limitations. Additionally, our advisor may allocate to us out-of-pocket expenses in connection with providing services to us, including our allocable share of our advisor’s overhead, such as rent, utilities and personnel costs for personnel who are directly involved in the performance of services to us and are not our executive officers. Furthermore, our dealer manager incurs certain bona fide offering expenses in connection with the distribution of our shares for which we are required to reimburse the dealer manager. Ultimately, total organization and offering costs incurred in a given offering will not exceed 15% of the gross proceeds from such offering. The total organization and offering costs paid by our advisor did not cause us to exceed the 15% limitation as of March 31, 2022 with respect to any of our public offerings. If, in future periods, the total organization and offering costs paid by our advisor and the dealer manager cause us to exceed the 15% limitation with respect to any of our current or prior public offerings, or any subsequent public offering, the excess would not be reflected on our consolidated balance sheet as of the end of such period. In such event, we may become obligated to reimburse all or a portion of this excess as we raise additional proceeds from such public offering. As of March 31, 2022, our total organization and offering costs incurred with respect to our current public offering and any of our prior public offerings did not exceed the 15% limitation for each such offering.
Other potential future sources of capital include secured or unsecured financings from banks or other lenders and proceeds from the sale of assets. If necessary, we may use financings or other sources of capital in the event of unforeseen significant capital expenditures.
Cash Flow Analysis
Cash flow (used in) provided by operating activities during the three months ended March 31, 2022 and 2021 was $(3,844) and $3,312, respectively. The primary reason for the decrease relates to the payment of the 2021 performance component of the advisory fee in the amount of $6,057, whereas there was no performance component for 2020 that was payable in 2021.
Cash flow used in investing activities during the three months ended March 31, 2022 and 2021 was $565 and $268, respectively, primarily for building improvements and tenant improvements at various properties.
Cash flow provided by financing activities was $3,043 for the three months ended March 31, 2022. We received proceeds of $18,469 in our offerings and paid $829 in offering costs. Cash distributions to stockholders paid during the three months ended March 31, 2022 were $1,945. Additionally, we processed redemptions during the three months ended March 31, 2022 that resulted in payments by us of $1,475, after deductions for any applicable 2% short-term trading discounts. We used the proceeds from our offerings to repay $17,000 against our outstanding balance on the Wells Fargo line of credit. We borrowed $6,000 from our Wells Fargo line of credit during the three months ended March 31, 2022. Additionally, we made principal payments on three of our property specific mortgage loans totaling $177 during the three months ended March 31, 2022.
Cash flow used in financing activities was $2,172 for the three months ended March 31, 2021. We received proceeds of $5,458 in our offerings and paid $557 in offering costs. Cash distributions to stockholders paid during the three months ended March 31, 2021 were $1,318. Additionally, we processed redemptions during the three months ended March 31, 2021 that resulted in payments by us of $3,914, after deductions for any applicable 2% short-term trading discounts. We used the proceeds from our offerings to repay $2,500 against our outstanding balance on the Wells Fargo line of credit. We borrowed $1,000 from our Wells Fargo line of credit during the three months ended March 31, 2021. Additionally, we made principal payments of $86 on one of our property specific mortgage loans during the three months ended March 31, 2021. Lastly, we paid $255 in financing costs to extend our Wells Fargo line of credit.
49
Distributions
Our board of directors authorized and we declared daily cash distributions for each quarter which were payable monthly for each share of our common stock outstanding. Shown below are details of the distributions:
| Three Months Ended | |||||||||||
| March 31, 2022 | March 31, 2021 | ||||||||||
| Distributions: | |||||||||||
| Declared daily distribution rate, before adjustment for class-specific fees | $ | 0.00230945 | $ | 0.00197050 | |||||||
| Distributions paid or payable in cash | $ | 2,020 | $ | 1,337 | |||||||
| Distributions reinvested | 2,210 | 1,374 | |||||||||
| Distributions declared | $ | 4,230 | $ | 2,711 | |||||||
| Net cash (used in) provided by Operating Activities: | $ | (3,844) | $ | 3,312 | |||||||
| Funds From Operations: | $ | 47 | $ | 4,750 | |||||||
For the three months ended March 31, 2022, our distributions were covered 100% by borrowings as the cash flow from operations was negatively impacted by the annual payment of directors and officers insurance and payment of the 2021 performance component of the advisory fee. We expect that we will continue to pay distributions monthly in arrears. Any distributions not reinvested will be payable in cash, and there can be no assurances regarding the portion of the distributions that will be reinvested. We intend to fund distributions from cash generated by operations. However, we may fund distributions from borrowings under our line of credit, from the proceeds of our offering or any other source.
The COVID-19 pandemic has caused, and may continue to cause, a world-wide economic slowdown, and resulted in numerous temporary retail store closings as well as temporary closings of many other businesses due to government imposed or elected shelter-in-place orders. While conditions have recently improved, and certain related pandemic restrictions have eased, the duration and ultimate impact of the coronavirus cannot be predicted and may cause reduced operating cash flows from our investments. The payment of distributions from sources other than cash flow from operations or FFO may be dilutive to our NAV per share because it may reduce the amount of proceeds available for investment and operations or cause us to incur additional interest expense as a result of borrowed funds.
Redemptions
For details on our redemptions, please see Note 9 (“Capitalization”) to our consolidated financial statements included in this quarterly report on Form 10-Q. As of March 31, 2022, we had no unfulfilled redemption requests.
Critical Accounting Policies
Our accounting policies have been established to conform with GAAP. The preparation of financial statements in conformity with GAAP requires management to use judgment in the application of accounting policies, including making estimates and assumptions. These judgments affect the reported amounts of assets and liabilities and disclosure of contingent assets and liabilities at the dates of the financial statements and the reported amounts of revenue and expenses during the reporting periods. If management’s judgment or interpretation of the facts and circumstances relating to various transactions had been different, it is possible that different accounting policies would have been applied, thus resulting in a different presentation of the financial statements. Additionally, other
50
companies may utilize different estimates that may impact the comparability of our results of operations to those of companies in similar businesses. We consider our critical accounting policies to be the policies that relate to the following concepts:
•Real Estate Investments and Lease Intangibles
•Revenue Recognition
A complete description of such policies and our considerations is contained in Note 2 ("Summary of Significant Accounting Policies") to our consolidated financial statements included in our Annual Report on Form 10-K for the year ended December 31, 2021, as supplemented by the most recent quarterly report on Form 10-Q.
Certain Accounting Pronouncements Effective in the Future
We refer you to Note 2 (“Summary of Significant Accounting Policies”) to our consolidated financial statements included in this quarterly report on Form 10-Q for a discussion of the potential impact on us from certain accounting pronouncements that become effective in the future.
REIT Compliance and Income Taxes
We elected to be taxed as a REIT under Sections 856 through 860 of the Internal Revenue Code beginning with the year ended December 31, 2013, and we believe that we have operated in such a manner to continue to be taxed as a REIT for federal income tax purposes. In order to maintain our qualification as a REIT, we are required to, among other things, distribute as dividends at least 90% of our REIT taxable income, determined without regard to the dividends-paid deduction and excluding net capital gains, to our stockholders and meet certain tests regarding the nature of our income and assets. If we qualify for taxation as a REIT, we generally will not be subject to federal income tax to the extent our income meets certain criteria and we distribute our REIT taxable income to our stockholders. Even if we qualify for taxation as a REIT, we may be subject to (1) certain state and local taxes on our income, property or net worth and (2) federal income and excise taxes on undistributed income, if any income remains undistributed. Many of these requirements are highly technical and complex. We will monitor the business and transactions that may potentially impact our REIT status. If we were to fail to meet these requirements, we could be subject to federal income tax on our taxable income at regular corporate rates. We would not be able to deduct distributions paid to stockholders in any year in which we fail to qualify as a REIT. We will also be disqualified for the four taxable years following the year during which qualification was lost unless we are entitled to relief under specific statutory provisions.
ITEM 3. QUANTITATIVE AND QUALITATIVE DISCLOSURES ABOUT MARKET RISK
In connection with our line of credit, which has a variable interest rate, we are subject to market risk associated with changes in LIBOR. As of March 31, 2022, we had $71,300 outstanding under our Wells Fargo line of credit bearing interest at approximately 2.1%, representing approximately a 51.5% loan-to-cost ratio. At this balance, a change in the interest rate of 0.50% would result in a change in our interest expense of $357 per annum. In the future, we may be exposed to additional market risk associated with interest rate changes as a result of additional short-term debt, such as additional borrowings under our line of credit, and long-term debt, which, in either case, may be used to maintain liquidity, fund capital expenditures and expand our investment portfolio. Market fluctuations in real estate financing may affect the availability and cost of funds needed to expand our investment portfolio. In addition, restrictions upon the availability of real estate financing or high interest rates for real estate loans could adversely affect our ability to dispose of real estate in the future. We will seek to limit the impact of interest rate changes on earnings and cash flows and to lower our overall borrowing costs. We intend to manage market risk associated with our variable-rate financing by assessing our interest rate cash flow risk through continually identifying and monitoring changes in interest rate exposures that may adversely impact expected future cash flows and by evaluating hedging opportunities. We may use derivative financial instruments to hedge exposures to changes in interest rates on loans secured by our assets.
51
We may be exposed to credit risk, which is the risk that the counterparty will fail to perform under the terms of the derivative contract. If the fair value of a derivative contract is positive, the counterparty will owe us, which creates credit risk for us. If the fair value of a derivative contract is negative, we will owe the counterparty and, therefore, do not have credit risk. We will seek to minimize the credit risk in derivative instruments by entering into transactions with high-quality counterparties. We are not currently a party to any such derivative contracts.
We will be exposed to financial market risk with respect to our marketable securities portfolio. Financial market risk is the risk that we will incur economic losses due to adverse changes in equity security prices. Our exposure to changes in equity security prices is a result of our investment in these types of securities. Market prices are subject to fluctuation and, therefore, the amount realized in the subsequent sale of an investment may significantly differ from the reported market value. Fluctuation in the market prices of a security may result from any number of factors, including perceived changes in the underlying fundamental characteristics of the issuer, the relative price of alternative investments, interest rates, default rates and general market conditions. Since the COVID-19 pandemic began, it has caused, and may cause in the future, significant disruption in the financial markets due to uncertainties around the actual and perceived impacts on global, national and local economies. Furthermore, amounts realized on the sale of a particular security may be affected by the relative quantity of the security being sold. We do not currently engage in derivative or other hedging transactions to manage our security price risk. As of March 31, 2022, we owned marketable securities with a value of $34,680. While it is difficult to project what factors may affect the prices of equity securities and how much the effect might be, a 10% change in the value of the marketable securities we owned as of March 31, 2022 would result in a change of $3,468 to the unrealized gain on marketable securities.
ITEM 4. CONTROLS AND PROCEDURES
Evaluation of Disclosure Controls and Procedures
As required by Rules 13a-15(b) and 15d-15(b) of the Exchange Act, we, under the supervision and with the participation of our chief executive officer and chief financial officer, carried out an evaluation of the effectiveness of our disclosure controls and procedures (as defined in Rules 13a-15(e) and 15d-15(e) of the Exchange Act) as of the end of the period covered by this Quarterly Report on Form 10-Q. Based on that evaluation, our chief executive officer and chief financial officer concluded that our disclosure controls and procedures, as of March 31, 2022, were effective to ensure that information required to be disclosed by us in this Quarterly Report is recorded, processed, summarized and reported within the time periods specified by the rules and forms promulgated under the Exchange Act and is accumulated and communicated to management, including our chief executive officer and chief financial officer, as appropriate to allow timely decisions regarding required disclosures.
Internal Control over Financial Reporting
No change occurred in our internal control over financial reporting (as defined in Rules 13a-15(f) and 15d -15(f) of the Exchange Act) during the three months ended March 31, 2022 that has materially affected, or is reasonably likely to materially affect, our internal control over financial reporting. .
52
PART II
OTHER INFORMATION
ITEM 1. LEGAL PROCEEDINGS
As of March 31, 2022, there were no material pending legal proceedings.
ITEM 1A. RISK FACTORS
We refer you to the risk factors contained in Part I, Item 1A of our Annual Report on Form 10-K for the year ended December 31, 2021, filed with the SEC on March 4, 2022. Since that filing, there have been no material changes to our risk factors.
ITEM 2. UNREGISTERED SALES OF EQUITY SECURITIES AND USE OF PROCEEDS
Unregistered Sales of Equity Securities
Between March 3, 2022 and May 10, 2022, we completed the sale of 343,852 shares of our Class D Shares for an aggregate purchase price of approximately $6,003. The sale of such Class D Shares was made in connection with our private offerings of Class D shares (i) to accredited investors, which is exempt from the registration provisions of the Securities Act of 1933, as amended (the “Securities Act”) by virtue of Section 4(a)(2) and Rule 506 of Regulation D thereunder, and/or (ii) to non-U.S. persons, which is exempt from the registration provisions of the Securities Act by virtue of Section 4(a)(2) and Regulation S thereunder (together, the “Class D Private Offerings”). DWS Distributors, Inc., the dealer manager for our continuous public offering, also serves as the placement agent for our Class D Private Offerings, and received commissions of approximately $4 in connection with the transactions described herein.
Share Redemption Plan
On November 27, 2012 we adopted a share redemption plan whereby on a daily basis stockholders may request that we repurchase all or a portion of their shares of common stock. The redemption price per share is equal to our NAV per share of the class of shares being redeemed on the date of redemption. The total amount of redemptions in any calendar quarter will be limited to shares whose aggregate value (based on the redemption price per share on the date of the redemption) is equal to 5% of our combined NAV for all classes of shares as of the last day of the previous calendar quarter. In addition, if redemptions do not reach the 5% limit in a calendar quarter, the unused portion generally will be carried over to the next quarter and not any subsequent quarter, except that the maximum amount of redemptions during any quarter may never exceed 10% of the combined NAV for all classes of shares as of the last day of the previous calendar quarter. While there is no minimum holding period, purchased shares (excluding shares acquired via our distribution reinvestment plan) redeemed within 365 days of an investor's initial date of purchase will be redeemed at our NAV per share of the class of shares being redeemed on the date of redemption less a short-term trading discount equal to 2% of the gross proceeds otherwise payable with respect to such purchased shares being redeemed. Our board of directors has the discretion to suspend or modify the share redemption plan at any time.
The following tables set forth information regarding our redemption of shares of our common stock by share class. The weighted average redemption prices are shown before allowing for any applicable 2% short-term trading discounts.
53
| Three Months Ended March 31, 2022 | Shares | Weighted Average Share Price | ||||||||||||
| Class A | 27,192 | $ | 16.79 | |||||||||||
| Class I | 54,696 | 16.86 | ||||||||||||
| Class T | 3,996 | 16.92 | ||||||||||||
| Class D | 6 | 17.09 | ||||||||||||
| Class N | 1,692 | 16.99 | ||||||||||||
| Class M-I | — | — | ||||||||||||
| Class T2 | — | — | ||||||||||||
We funded these redemptions with cash flow from operations, proceeds from our offerings or borrowings on our line of credit.
The following table sets forth information regarding redemptions of shares of our common stock by month. As of March 31, 2022, we had no unfulfilled redemption requests.
| Period | Total Number of Shares Redeemed | Average Price Paid per Share | Total Number of Shares Purchased as Part of Publicly Announced Plans or Programs | Maximum Number of Shares that May Yet Be Purchased Pursuant to the Program (1) | ||||||||||||||||||||||
| January 1 - January 31, 2022 | 37,694 | $ | 16.82 | 37,694 | (1) | |||||||||||||||||||||
| February 1 - February 28, 2022 | 27,274 | 16.79 | 27,274 | (1) | ||||||||||||||||||||||
| March 1 - March 31, 2022 | 22,614 | 16.96 | 22,614 | (1) | ||||||||||||||||||||||
| (1) Redemptions are limited as described above. | ||||||||||||||||||||||||||
ITEM 3. DEFAULTS UPON SENIOR SECURITIES
Not applicable.
ITEM 4. MINE SAFETY DISCLOSURES
Not applicable.
ITEM 5. OTHER INFORMATION
None.
54
ITEM 6. EXHIBITS
| Exhibit No. | Description | |||||||
| 3.1 | ||||||||
| 3.2 | ||||||||
| 3.3 | ||||||||
| 4.1 | ||||||||
| 31.1* | ||||||||
| 31.2* | ||||||||
| 32.1* | ||||||||
| 101.INS | XBRL Instance Document | |||||||
| 101.SCH | XBRL Taxonomy Extension Schema Document | |||||||
| 101.CAL | XBRL Taxonomy Extension Calculation Linkbase Document | |||||||
| 101.DEF | XBRL Taxonomy Extension Definition Linkbase Document | |||||||
| 101.LAB | XBRL Taxonomy Extension Label Linkbase Document | |||||||
| 101.PRE | XBRL Taxonomy Extension Presentation Linkbase Document | |||||||
| 104 | Cover Page Interactive Data File (embedded within the Inline XBRL document) | |||||||
| * | Filed herewith | ||||
55
SIGNATURES
Pursuant to the requirements of the Securities Exchange Act of 1934, as amended, the registrant has duly caused this report to be signed on its behalf by the undersigned thereunto duly authorized.
RREEF Property Trust, Inc. | |||||
| By: | /s/ Anne-Marie Vandenberg | ||||
| Name: | Anne-Marie Vandenberg | ||||
| Title: | Chief Executive Officer and President (Principal Executive Officer) | ||||
| By: | /s/ Eric M. Russell | ||||
| Name: | Eric M. Russell | ||||
| Title: | Chief Financial Officer (Principal Financial and Accounting Officer) | ||||
Date: May 12, 2022
56
Serious News for Serious Traders! Try StreetInsider.com Premium Free!
You May Also Be Interested In
- Unlock Yosemite National Park: Reservations are Available, and Booking is Easy
- LSI Industries Acquires EMI Industries, Expanding Store Fixtures and Food Service Equipment Business
- PowerThru by CASETiFY™ Collection: New Wireless Car Charger, Fast Charger & 240W Cable
Create E-mail Alert Related Categories
SEC FilingsSign up for StreetInsider Free!
Receive full access to all new and archived articles, unlimited portfolio tracking, e-mail alerts, custom newswires and RSS feeds - and more!
