

Form 10-Q RELIV INTERNATIONAL INC For: Mar 31
 Tweet
Tweet Share
ShareUNITED STATES
SECURITIES AND EXCHANGE COMMISSION
WASHINGTON, D.C. 20549
____________
FORM 10-Q
(Mark One)
|
☒ |
QUARTERLY REPORT PURSUANT TO SECTION 13 OR 15 (d) OF THE SECURITIES EXCHANGE ACT OF 1934 For the quarterly period ended March 31, 2018 |
|
OR |
|
☐ |
TRANSITION REPORT PURSUANT TO SECTION 13 OR 15 (d) OF THE SECURITIES EXCHANGE ACT OF 1934 |
For the transition period from _________to_________
Commission File Number
000-19932
RELIV’ INTERNATIONAL, INC.
(Exact name of Registrant as specified in its charter)
| Delaware | 371172197 |
| (State or other jurisdiction of | (I.R.S. Employer Identification Number) |
| incorporation or organization) | |
| 136 Chesterfield Industrial Boulevard | |
| Chesterfield, Missouri | 63005 |
| (Address of principal executive offices) | (Zip Code) |
(636) 537-9715
(Registrant’s telephone number, including area code)
Indicate by check mark whether the Registrant: (1) has filed all reports required to be filed by Section 13 or 15(d) of the Securities Exchange Act of 1934 during the preceding 12 months (or for such shorter period that the Registrant was required to file such reports), and (2) has been subject to such filing requirements for the past 90 days. Yes ☑ No ☐
Indicate by check mark whether the registrant has submitted electronically and posted on its corporate Web site, if any, every Interactive Data File required to be submitted and posted pursuant to Rule 405 of Regulation S-T (§232.405 of this chapter) during the preceding 12 months (or for such shorter period that the registrant was required to submit and post such files). Yes ☑ No ☐
Indicate by check mark whether the registrant is a large accelerated filer, an accelerated filer, a non-accelerated filer, or a smaller reporting company. See the definitions of “large accelerated filer,” “accelerated filer,” “smaller reporting company” and “emerging growth company” in Rule 12b-2 of the Exchange Act. (Check one):
Large accelerated filer ☐ Accelerated filer ☐ Non-accelerated filer ☐ (Do not check if a smaller reporting company)
Smaller reporting company ☑ Emerging growth company ☐
If an emerging growth company, indicate by check mark if the registrant has elected not to use the extended transition period for complying with any new or revised financial accounting standards provided pursuant to Section 13(a) of the Exchange Act. ☐
Indicate by check mark whether the Registrant is a shell company (as defined in Rule 12b-2 of the Exchange Act). Yes ☐ No ☑
The number of shares outstanding of the Registrant’s common stock as of May 7, 2018 was 1,845,160 (excluding treasury shares).
INDEX
|
Part I – Financial Information |
|
|
|
|
|
|
|
Item No. 1 |
Financial Statements (Unaudited) |
1 |
|
Item No. 2 |
Management’s Discussion and Analysis of Financial Condition and Results of Operations |
13 |
|
Item No. 4 |
Controls and Procedures |
20 |
|
|
|
|
|
Part II – Other Information |
|
|
|
|
|
|
|
Item No. 6 |
Exhibits |
20 |
|
PART I -- FINANCIAL INFORMATION |
|
Item No. 1 - Financial Statements |
|
Reliv International, Inc. and Subsidiaries |
|
Condensed Consolidated Balance Sheets |
|
March 31 |
December 31 |
|||||||
|
2018 |
2017 |
|||||||
|
(unaudited) |
||||||||
|
Assets |
||||||||
|
Current assets: |
||||||||
|
Cash and cash equivalents |
$ | 3,676,840 | $ | 3,272,788 | ||||
|
Accounts receivable, less allowances of $25,400 in 2018 and $26,300 in 2017 |
137,843 | 29,760 | ||||||
|
Accounts and note due from employees and distributors |
136,726 | 138,497 | ||||||
|
Inventories |
||||||||
|
Finished goods |
2,533,727 | 2,762,249 | ||||||
|
Raw materials |
1,500,968 | 1,653,466 | ||||||
|
Sales aids and promotional materials |
142,558 | 139,770 | ||||||
|
Total inventories |
4,177,253 | 4,555,485 | ||||||
|
Refundable income taxes |
23,002 | 26,552 | ||||||
|
Prepaid expenses and other current assets |
692,955 | 372,602 | ||||||
|
Total current assets |
8,844,619 | 8,395,684 | ||||||
|
Other assets |
343,243 | 337,190 | ||||||
|
Cash surrender value of life insurance |
3,093,138 | 3,086,522 | ||||||
|
Note receivable due from distributor |
1,375,039 | 1,405,113 | ||||||
|
Intangible assets, net |
2,117,752 | 2,174,248 | ||||||
|
Property, plant and equipment: |
||||||||
|
Land and land improvements |
905,190 | 905,190 | ||||||
|
Building |
9,954,757 | 9,950,190 | ||||||
|
Machinery & equipment |
4,760,057 | 4,755,727 | ||||||
|
Office equipment |
1,162,552 | 1,183,115 | ||||||
|
Computer equipment & software |
2,264,561 | 2,261,038 | ||||||
| 19,047,117 | 19,055,260 | |||||||
|
Less: Accumulated depreciation |
13,499,266 | 13,378,021 | ||||||
|
Net property, plant and equipment |
5,547,851 | 5,677,239 | ||||||
|
Total assets |
$ | 21,321,642 | $ | 21,075,996 | ||||
See notes to financial statements.
|
Reliv International, Inc. and Subsidiaries |
|
Condensed Consolidated Balance Sheets |
|
March 31 |
December 31 |
|||||||
|
2018 |
2017 |
|||||||
|
(unaudited) |
||||||||
|
Liabilities and stockholders' equity |
||||||||
|
Current liabilities: |
||||||||
|
Accounts payable and accrued expenses: |
||||||||
|
Trade accounts payable and other accrued expenses |
$ | 2,114,304 | $ | 1,667,495 | ||||
|
Distributors' commissions payable |
1,055,736 | 1,115,649 | ||||||
|
Sales taxes payable |
182,893 | 154,958 | ||||||
|
Deferred revenue |
356,210 | - | ||||||
|
Payroll and payroll taxes payable |
401,758 | 261,916 | ||||||
|
Total accounts payable and accrued expenses |
4,110,901 | 3,200,018 | ||||||
|
Income taxes payable |
23,490 | 12,616 | ||||||
|
Revolving line of credit |
500,000 | 500,000 | ||||||
|
Current portion of long-term debt |
2,437,101 | 2,545,421 | ||||||
|
Total current liabilities |
7,071,492 | 6,258,055 | ||||||
|
Noncurrent liabilities: |
||||||||
|
Other noncurrent liabilities |
458,674 | 453,354 | ||||||
|
Total noncurrent liabilities |
458,674 | 453,354 | ||||||
|
Stockholders' equity: |
||||||||
|
Preferred stock, par value $.001 per share; 500,000 shares authorized; -0- shares issued and outstanding in 2018 and 2017 |
- | - | ||||||
|
Common stock, par value $.001 per share; 5,000,000 authorized; 2,110,013 shares issued and 1,845,160 shares outstanding as of 3/31/2018; 2,110,013 shares issued and 1,845,160 shares outstanding as of 12/31/2017 |
2,110 | 2,110 | ||||||
|
Additional paid-in capital |
30,606,454 | 30,598,920 | ||||||
|
Accumulated deficit |
(10,646,102 | ) | (10,040,229 | ) | ||||
|
Accumulated other comprehensive loss: |
||||||||
|
Foreign currency translation adjustment |
(832,426 | ) | (857,654 | ) | ||||
|
Treasury stock |
(5,338,560 | ) | (5,338,560 | ) | ||||
|
Total stockholders' equity |
13,791,476 | 14,364,587 | ||||||
|
Total liabilities and stockholders' equity |
$ | 21,321,642 | $ | 21,075,996 | ||||
See notes to financial statements.
|
Reliv International, Inc. and Subsidiaries |
|
Condensed Consolidated Statements of Net |
|
Income (Loss) and Comprehensive Income (Loss) |
|
(unaudited) |
Three months ended March 31 |
|||||||
|
2018 |
2017 |
|||||||
|
Product sales |
$ | 9,391,381 | $ | 11,835,116 | ||||
|
Handling & freight income |
611,858 | 942,666 | ||||||
|
Net sales |
10,003,239 | 12,777,782 | ||||||
|
Costs and expenses: |
||||||||
|
Cost of products sold |
2,349,742 | 2,835,525 | ||||||
|
Distributor royalties and commissions |
3,391,745 | 4,498,553 | ||||||
|
Selling, general and administrative |
4,485,895 | 4,926,279 | ||||||
|
Total costs and expenses |
10,227,382 | 12,260,357 | ||||||
|
Income (loss) from operations |
(224,143 | ) | 517,425 | |||||
|
Other income (expense): |
||||||||
|
Interest income |
23,952 | 25,526 | ||||||
|
Interest expense |
(31,565 | ) | (24,841 | ) | ||||
|
Other income |
10,451 | 32,683 | ||||||
|
Income (loss) before income taxes |
(221,305 | ) | 550,793 | |||||
|
Provision for income taxes |
17,000 | 27,000 | ||||||
|
Net income (loss) |
$ | (238,305 | ) | $ | 523,793 | |||
|
Other comprehensive income (loss): |
||||||||
|
Foreign currency translation adjustment |
25,228 | 25,472 | ||||||
|
Comprehensive income (loss) |
$ | (213,077 | ) | $ | 549,265 | |||
|
Earnings (loss) per common share - Basic |
$ | (0.13 | ) | $ | 0.28 | |||
|
Weighted average shares |
1,845,000 | 1,845,000 | ||||||
|
Earnings (loss) per common share - Diluted |
$ | (0.13 | ) | $ | 0.28 | |||
|
Weighted average shares |
1,845,000 | 1,846,000 | ||||||
See notes to financial statements.
|
Reliv International, Inc. and Subsidiaries |
|
Condensed Consolidated Statements of Cash Flows |
|
(unaudited) |
|
Three months ended March 31 |
||||||||
|
2018 |
2017 |
|||||||
|
Operating activities: |
||||||||
|
Net income (loss) |
$ | (238,305 | ) | $ | 523,793 | |||
|
Adjustments to reconcile net income (loss) to net cash provided by operating activities: |
||||||||
|
Depreciation and amortization |
201,634 | 217,631 | ||||||
|
Stock-based compensation |
7,535 | 8,444 | ||||||
|
Non-cash life insurance policy accretion |
(6,617 | ) | (30,135 | ) | ||||
|
(Gain) loss on sale of property, plant and equipment |
(3,800 | ) | - | |||||
|
Deferred income taxes |
- | 5,000 | ||||||
|
Foreign currency transaction (gain) loss |
341 | (36,133 | ) | |||||
|
(Increase) decrease in accounts receivable and accounts due from employees and distributors |
(104,767 | ) | (138,452 | ) | ||||
|
(Increase) decrease in inventories |
393,576 | 268,776 | ||||||
|
(Increase) decrease in refundable income taxes |
(3,550 | ) | 29,454 | |||||
|
(Increase) decrease in prepaid expenses and other current assets |
(320,175 | ) | (353,515 | ) | ||||
|
(Increase) decrease in other assets |
(6,052 | ) | (1,906 | ) | ||||
|
Increase (decrease) in income taxes payable |
18,664 | - | ||||||
|
Increase (decrease) in accounts payable & accrued expenses and other noncurrent liabilities |
561,297 | 37,429 | ||||||
|
Net cash provided by operating activities |
499,781 | 530,386 | ||||||
|
Investing activities: |
||||||||
|
Purchase of property, plant and equipment |
(15,383 | ) | (261,550 | ) | ||||
|
Proceeds from the sale of property, plant and equipment |
3,888 | - | ||||||
|
Payments received on distributor note receivable |
28,326 | 26,680 | ||||||
|
Net cash provided by (used in) investing activities |
16,831 | (234,870 | ) | |||||
|
Financing activities: |
||||||||
|
Principal payments on long-term borrowings |
(108,320 | ) | (113,743 | ) | ||||
|
Net cash used in financing activities |
(108,320 | ) | (113,743 | ) | ||||
|
Effect of exchange rate changes on cash and cash equivalents |
(4,240 | ) | 40,703 | |||||
|
Increase (decrease) in cash and cash equivalents |
404,052 | 222,476 | ||||||
|
Cash and cash equivalents at beginning of period |
3,272,788 | 3,606,817 | ||||||
|
Cash and cash equivalents at end of period |
$ | 3,676,840 | $ | 3,829,293 | ||||
See notes to financial statements.
Reliv’ International, Inc. and Subsidiaries
Notes to Consolidated Financial Statements
(Unaudited)
March 31, 2018
1. Accounting Policies
Basis of Presentation
The accompanying unaudited condensed consolidated financial statements and notes thereto have been prepared in accordance with the instructions to Form 10-Q and reflect all adjustments (which primarily include normal recurring accruals) which management believes are necessary to present fairly the financial position, results of operations and cash flows. These statements, however, do not include all information and footnotes necessary for a complete presentation of financial position, results of operations, and cash flows in conformity with accounting principles generally accepted in the United States. Interim results may not necessarily be indicative of results that may be expected for any other interim period or for the year as a whole. These financial statements should be read in conjunction with the audited consolidated financial statements and footnotes included in the annual report on Form 10-K for the year ended December 31, 2017, filed March 29, 2018 with the Securities and Exchange Commission.
Use of Estimates
The preparation of financial statements in conformity with accounting principles generally accepted in the United States requires management to make estimates and assumptions that affect the amounts reported in the financial statements and accompanying notes. Actual results could differ from those estimates.
New Accounting Pronouncements – Not Yet Adopted
In February 2016, the Financial Accounting Standards Board (“FASB”) issued Accounting Standards Updated (“ASU”) No. 2016-2, Leases (Topic 842) which supersedes the existing lease guidance. This update requires lessees to recognize a lease liability and a lease asset for all leases, including operating leases, with a lease term greater than twelve months on its balance sheet. The update also expands the required quantitative and qualitative disclosures surrounding leases. This update is effective for fiscal years beginning after December 15, 2018 and interim periods within those fiscal years, with earlier application permitted. The Company expects the adoption of this standard to result in the recognition of right-of-use assets and lease liabilities not currently recorded in the Company’s consolidated financial statements. The Company is evaluating its transition method and other effects that the new standard will have on its consolidated financial statements and related disclosures.
Reliv’ International, Inc. and Subsidiaries
Notes to Consolidated Financial Statements
(Unaudited)
1. Accounting Policies (continued)
New Accounting Pronouncements – Adopted January 1, 2018
On January 1, 2018, the Company adopted ASU No. 2014-09, Revenue from Contracts with Customers (including amendments), and applied the new revenue standard to all contracts using the modified retrospective method. Under this method, prior quarters are not restated. Upon adoption, the Company recognized the cumulative effect of applying the new revenue standard as a reduction of $367,568 to the opening retained earnings (accumulated deficit) balance.
In accordance with the new revenue standard requirements, the disclosure of the impact of adoption to the Company’s financial position and results from operations are as follows:
|
March 31, 2018 |
||||||||||||
|
Balance at |
Adjustments |
Balance at |
||||||||||
|
December 31 |
Due to |
January 1 |
||||||||||
|
2017 |
ASU 2014-09 |
2018 |
||||||||||
|
Liabilities and stockholders' equity |
||||||||||||
|
Accumulated deficit |
$ | (10,040,229 | ) | $ | (367,568 | ) | $ | (10,407,797 | ) | |||
|
Deferred revenue |
- | 367,568 | 367,568 | |||||||||
|
Three Months Ended March 31, 2018 |
||||||||||||
|
Without |
Effect of |
|||||||||||
|
Adoption of |
Change |
|||||||||||
|
As Reported |
ASU 2014-09 |
Higher/(Lower) |
||||||||||
|
Operating results |
||||||||||||
|
Net sales |
$ | 10,003,239 | $ | 9,991,047 | $ | 12,192 | ||||||
|
Net income (loss) |
(238,305 | ) | (250,497 | ) | 12,192 | |||||||
The new revenue standard defines a five step process to recognize revenues. Under this new standard, the Company determined that the timeframe for recognizing the revenue performance obligation for membership-fee type revenue would be lengthened to more closely correlate with the distributor and customer membership terms of generally twelve months. Based upon all contracts still in existence as of December 31, 2017, the adoption of the new revenue standard resulted in the recognition of a deferred revenue liability balance of $367,568.
Prior to adoption of the new revenue standard, the Company’s primary source of revenue has been from the sale of nutritional products to the Company’s independent distributors whereby revenue is recognized when product is shipped and risk of loss has passed to the customer; and the Company’s nutritional product revenue recognition policy does not change under the new revenue standard.
The Company does not anticipate that the adoption of the new standard will be material to net sales and net income on an ongoing basis.
Reliv’ International, Inc. and Subsidiaries
Notes to Consolidated Financial Statements
(Unaudited)
1. Accounting Policies (continued)
New Accounting Pronouncements – Adopted January 1, 2018 (continued)
Description of Products and Services by Region and Category
The Company operates in one reportable segment, a network marketing segment consisting of six operating units that sell nutritional and dietary products to a sales force of independent distributors that sell the products directly to customers. These operating units are based on geographic regions, as follows:
|
Three months ended March 31 |
||||||||
|
2018 |
2017 |
|||||||
|
Net sales to external customers |
||||||||
|
United States |
$ | 7,670,061 | $ | 10,258,939 | ||||
|
Australia/New Zealand |
231,928 | 259,427 | ||||||
|
Canada |
242,120 | 264,303 | ||||||
|
Mexico |
107,371 | 157,317 | ||||||
|
Europe (1) |
1,164,884 | 1,200,774 | ||||||
|
Asia (2) |
586,875 | 637,022 | ||||||
|
Total net sales |
$ | 10,003,239 | $ | 12,777,782 | ||||
|
(1) |
Europe consists of United Kingdom, Ireland, France, Germany, Austria, and the Netherlands. |
|
(2) |
Asia consists of Philippines, Malaysia, Singapore, and Indonesia. |
The Company classifies its sales into two categories of sales products plus handling & freight income. Net sales by product category, as follows:
|
Three months ended March 31 |
||||||||
|
2018 |
2017 |
|||||||
|
Net sales by product category |
||||||||
|
Nutritional and dietary supplements |
$ | 9,069,356 | $ | 11,419,619 | ||||
|
Sales aids and other |
322,025 | 415,497 | ||||||
|
Handling & freight income |
611,858 | 942,666 | ||||||
|
Total net sales |
$ | 10,003,239 | $ | 12,777,782 | ||||
2. Basic and Diluted Earnings (Loss) per Share
Basic earnings (loss) per common share is computed using the weighted average number of common shares outstanding during the period. Diluted earnings (loss) per common share is computed using the weighted average number of common shares and potential dilutive common shares that were outstanding during the period. Potential dilutive common shares consist of outstanding stock options, outstanding stock warrants, and convertible preferred stock.
Reliv’ International, Inc. and Subsidiaries
Notes to Consolidated Financial Statements
(Unaudited)
2. Basic and Diluted Earnings (Loss) per Share (continued)
The following table sets forth the computation of basic and diluted earnings (loss) per share:
|
Three months ended March 31 |
||||||||
|
2018 |
2017 |
|||||||
|
Numerator: |
||||||||
|
Net income (loss) |
$ | (238,305 | ) | $ | 523,793 | |||
|
Denominator: |
||||||||
|
Denominator for basic earnings (loss) per share – weighted average shares |
1,845,000 | 1,845,000 | ||||||
|
Dilutive effect of employee stock options and other warrants |
- | 1,000 | ||||||
|
Denominator for diluted earnings (loss) per share – adjusted weighted average shares |
1,845,000 | 1,846,000 | ||||||
|
Basic earnings (loss) per share |
$ | (0.13 | ) | $ | 0.28 | |||
|
Diluted earnings (loss) per share |
$ | (0.13 | ) | $ | 0.28 | |||
Options and warrants to purchase 120,242 shares and 142,013 shares of common stock for the three months ended March 31, 2018 and 2017, respectively, were not included in the denominator for diluted earnings (loss) per share because their effect would be antidilutive or because the shares were deemed contingently issuable.
3. Fair Value of Financial Instruments
Fair value can be measured using valuation techniques such as the market approach (comparable market prices), the income approach (present value of future income or cash flow), and the cost approach (cost to replace the service capacity of an asset or replacement cost). Accounting standards utilize a fair value hierarchy that prioritizes the inputs to valuation techniques used to measure fair value into three broad levels. The following is a brief description of those levels:
Level 1: Observable inputs such as quoted prices (unadjusted) in active markets for identical assets or liabilities.
Level 2: Inputs other than quoted prices that are observable for the asset or liability, either directly or indirectly. These include quoted prices for similar assets or liabilities in active markets or similar assets or liabilities in markets that are not active.
Level 3: Unobservable inputs that reflect the reporting entity’s own assumptions.
Reliv’ International, Inc. and Subsidiaries
Notes to Consolidated Financial Statements
(Unaudited)
3. Fair Value of Financial Instruments (continued)
The carrying amount and fair value of financial instruments were approximately as follows:
|
Carrying |
Fair |
|||||||||||||||||||
|
Description |
Amount |
Value |
Level 1 |
Level 2 |
Level 3 |
|||||||||||||||
|
March 31, 2018 |
||||||||||||||||||||
|
Long-term debt |
$ | 2,937,101 | $ | 2,937,101 | - | $ | 2,937,101 | - | ||||||||||||
|
Note receivable |
1,492,679 | 1,620,000 | - | 1,620,000 | - | |||||||||||||||
|
Marketable securities |
336,000 | 336,000 | $ | 336,000 | - | - | ||||||||||||||
|
December 31, 2017 |
||||||||||||||||||||
|
Long-term debt |
$ | 3,045,421 | $ | 3,045,421 | - | $ | 3,045,421 | - | ||||||||||||
|
Note receivable |
1,521,005 | 1,684,000 | - | 1,684,000 | - | |||||||||||||||
|
Marketable securities |
330,000 | 330,000 | $ | 330,000 | - | - | ||||||||||||||
Long-term debt: The fair value of the Company’s term and revolver loans approximate carrying value as these loans were incurred within the past year and have variable market-based interest rates that reset every thirty days.
Note receivable: The Company’s note receivable is a variable rate residential mortgage-based financial instrument. An average of published interest rate quotes for a fifteen-year residential jumbo mortgage, a comparable financial instrument, was used to estimate fair value of this note receivable under a discounted cash flow model.
Marketable securities: The assets (trading securities) of the Company’s Supplemental Executive Retirement Plan are recorded at fair value on a recurring basis, and are presented within Other Assets in the consolidated balance sheets.
The carrying value of other financial instruments, including cash, accounts receivable and accounts payable, and accrued liabilities approximate fair value due to their short maturities or variable-rate nature of the respective balances.
4. Debt
|
March 31 |
December 31 |
|||||||
|
2018 |
2017 |
|||||||
|
Term loan |
$ | 2,437,101 | $ | 2,545,421 | ||||
|
Revolving line of credit |
500,000 | 500,000 | ||||||
| 2,937,101 | 3,045,421 | |||||||
|
Less current portion |
2,937,101 | 3,045,421 | ||||||
|
Total long-term debt |
$ | - | $ | - | ||||
Reliv’ International, Inc. and Subsidiaries
Notes to Consolidated Financial Statements
(Unaudited)
4. Debt (continued)
Effective September 30, 2015, the Company entered into a series of lending agreements with its primary lender which included agreements for a $3.25 million term loan and a $3.5 million revolving credit facility. These lending agreements replaced similar borrowings under agreements with the Company’s former primary lender.
The $3.25 million term loan was for an initial period of three years and required monthly term loan payments, under a ten-year amortization, consisting of principal of $27,080 plus interest with a balloon payment for the outstanding balance due and payable on September 30, 2018. Effective with an April 11, 2018 loan agreement amendment, under similar monthly payment and interest rate terms, the term loan’s balloon payment due date has been extended from September 30, 2018 to April 29, 2019. The term loan's interest rate is based on the 30-day LIBOR plus 2.25% and was 3.94% at March 31, 2018.
The $3.5 million revolving line of credit agreement, originally dated September 30, 2015, accrues interest at a floating interest rate based on the 30-day LIBOR plus 2.25% and had an original term of one year. Effective September 30, 2016, the revolving line of credit agreement was extended under similar terms to April 30, 2018. Effective with an April 11, 2018 loan amendment, the revolving line of credit’s term has been extended from April 30, 2018 to April 29, 2019 and the revolver’s maximum borrowing amount has been reduced from $3.5 million to $2.0 million. At March 31, 2018, outstanding borrowings under the revolving line of credit are $500,000. The interest rate on revolver borrowings is identical to the term loan.
Borrowings under the lending agreements continue to be secured by all tangible and intangible assets of the Company, a whole life insurance policy on the life of the Company's Chief Executive Officer, which was assigned to the lender, and by a mortgage on the real estate of the Company's headquarters.
The loan agreements, including the April 2018 loan amendment, include quarterly financial covenants requiring the Company to maintain net tangible worth of not less than $9.5 million, and i) a cumulative minimum EBITDA requirement of $200,000; $400,000; $600,000; and $800,000 for the fiscal periods ending March 31, 2018; June 30, 2018; September 30, 2018; and December 31, 2018; respectively; and ii) a minimum EBITDA of $200,000 for the quarter ended March 31, 2019.
As defined, EBITDA equals the Company's consolidated net income for such period, before interest expense, income tax expense, depreciation and amortization, and management fees, and further adjusted to exclude any gain or loss on the sale of assets, other extraordinary gains or losses, and any one-time adjustment approved by the lender.
At March 31, 2018, the Company was not in compliance with its quarterly financial loan covenant requirements. On May 4, 2018, the Company’s lender agreed to waive the Company’s non-compliance with the tangible net worth and minimum EBITDA covenants for the March 31, 2018 reporting period; however, the Company cannot provide any assurance that the lender will waive any financial loan covenant non-compliance in any future quarterly reporting periods. Furthermore, the Company is unable to provide reasonable assurance that future operating results will achieve compliance with its quarterly financial loan covenant requirements. Accordingly, the Company has presented its outstanding loan balances as current liabilities in the March 31, 2018 condensed consolidated balance sheets.
Reliv’ International, Inc. and Subsidiaries
Notes to Consolidated Financial Statements
(Unaudited)
4. Debt (continued)
At March 31, 2018, the Company is current on all principal and interest payments due to its lender. Company management believes that the Company’s cash on hand and its ability, if necessary, to borrow a significant portion of or liquidate the cash surrender value of the Company’s key-man life insurance policy, will be sufficient to meet the Company’s working capital requirements and debt service requirements for the next twelve months.
5. Income Taxes
During 2016 and 2017, the Company determined that it was more likely than not that U.S. federal and various state net operating losses primarily generated in 2016 and 2017 will not be realized based on projections of future U.S. taxable income, estimated reversals of existing taxable timing differences, and other considerations.
In prior years, the Company recorded a valuation allowance on all of its domestic and foreign deferred tax assets. The effective income tax rate was (7.7)% and 4.9% for the quarter ended March 31, 2018 and 2017, respectively. The income tax provision amount for the quarter ended March 31, 2018 primarily represents estimated income taxes in certain U.S. states and one of the Company’s foreign subsidiaries.
The United States Tax Cuts and Jobs Act (TCJA) was enacted in December 2017, which significantly changed U.S. tax law, principally by permanently reducing the U.S. federal statutory rate to 21% effective January 1, 2018, implementing a territorial tax system, and imposing a repatriation tax on deemed repatriated earnings of foreign subsidiaries. Under the TJCA’s repatriation tax, the Company estimates its cumulative amount of unremitted foreign earnings and related tax is immaterial. The effect of the federal tax rate reduction to 21% is reflected as a reduction in the U.S. deferred tax assets with a corresponding reduction in the valuation allowance.
Securities and Exchange Commission (“SEC”) issued Staff Accounting Bulletin (“SAB”) 118 to provide guidance to companies on the reporting of the impacts of TCJA in their financial statements. Under SAB 118, the Company is recording affected items as provisional to allow additional time for clarifying technical guidance from Treasury and analysis of the effect to the Company’s current tax positions.
One of the Company’s foreign subsidiaries is presently under local country audit for alleged deficiencies (totaling approximately $800,000 plus interest at 20% per annum) in value-added tax (VAT) and withholding tax for the years 2004 through 2006. The Company, in consultation with its legal counsel, believes that there are strong legal grounds that it should not be liable to pay the majority of the alleged tax deficiencies. In 2011, the Company made good faith deposits of approximately $173,000 to the local tax authority under the tax agency’s administrative judicial resolution process. As of December 31, 2017, management’s estimated reserve (net of deposits) for this matter was approximately $181,000 and remains unchanged in the first quarter of 2018. In May 2018, the Company received a formal notice of denial of one of its appeals under the tax agency’s administrative judicial resolution process; however, management intends to pursue other available legal processes as the Company maintains its position that it is not liable for the majority of the alleged tax deficiencies.
Reliv’ International, Inc. and Subsidiaries
Notes to Consolidated Financial Statements
(Unaudited)
6. Restructuring Activities – Subsequent Event
In April 2018, the Company announced the closing of the operations of its Reliv Indonesia subsidiary. Under this plan, the Company anticipates ceasing all Indonesia operations by the end of the 2018 third quarter. The total cost of this program primarily representing employee severance costs and lease exit costs, is estimated to range from $50,000 to $100,000, and will be included in the Company’s operating results for the quarter ended June 30, 2018.
FORWARD-LOOKING STATEMENTS
This quarterly report includes both historical and “forward-looking statements” within the meaning of Section 21E of the Securities Exchange Act of 1934, as amended. We have based these forward-looking statements on our current expectations and projections about future results. Words such as “may,” “should,” “could,” “would,” “expect,” “plan,” “anticipate,” “believe,” “estimate,” “predict,” “potential,” “continue,” or similar words are intended to identify forward-looking statements, although not all forward-looking statements contain these words. Although we believe that our opinions and expectations reflected in the forward-looking statements are reasonable, we cannot guarantee future results, levels of activity, performance or achievements, and our actual results may differ substantially from the views and expectations set forth in this quarterly report on Form 10-Q. We disclaim any intent or obligation to update any forward-looking statements after the date of this annual report to conform such statements to actual results or to changes in our opinions or expectations.
Item No. 2 - Management’s Discussion and Analysis of Financial Condition and Results of Operations
The following discussion and analysis of our financial condition and results of operations should be read in conjunction with our financial statements and related notes included elsewhere in this Quarterly Report on Form 10-Q. The following discussion and analysis discusses the financial condition and results of our operations on a consolidated basis, unless otherwise indicated.
Overview
We are a developer, manufacturer and marketer of a proprietary line of nutritional supplements addressing basic nutrition, specific wellness needs, weight management and sports nutrition. We sell our products through an international network marketing system utilizing independent distributors. Sales in the United States represented approximately 76.7% of worldwide net sales for the three months ended March 31, 2018 and 80.3% of worldwide net sales for the three months ended March 31, 2017. Our international operations currently generate sales through distributor networks with facilities in Australia, Canada, Indonesia, Malaysia, Mexico, the Philippines, and the United Kingdom. We also operate in Ireland, France, Germany, Austria and the Netherlands from our United Kingdom distribution center, in New Zealand from our Australia office, and in Singapore from our Malaysia office.
We derive our revenues principally through product sales made by our global independent distributor base, which, as of March 31, 2018, consisted of approximately 32,100 distributors and preferred customers. Our sales can be affected by several factors, including our ability to attract new distributors and retain our existing distributor base, our ability to properly train and motivate our distributor base and our ability to develop new products and successfully maintain our current product line.
All of our sales to distributors outside the United States are made in the respective local currency; therefore, our earnings and cash flows are subject to fluctuations due to changes in foreign currency rates as compared to the U.S. dollar. As a result, exchange rate fluctuations may have an effect on sales and gross margins. U.S. generally accepted accounting practices require that our results from operations be converted to U.S. dollars for reporting purposes. Consequently, our reported earnings may be significantly affected by fluctuations in currency exchange rates, generally increasing with a weaker U.S. dollar and decreasing with a strengthening U.S. dollar. Products manufactured by us for sale to our foreign subsidiaries are transacted in U.S. dollars. From time to time, we enter into foreign exchange forward contracts to mitigate our foreign currency exchange risk.
Components of Net Sales and Expense
Product sales represent the actual product purchase price typically paid by our distributors, after giving effect to distributor allowances, which can range from 10% to 40% of suggested retail price, depending on the rank of a particular distributor. Handling and freight income represents the amounts billed to distributors for shipping costs. We record net sales and the related commission expense when the merchandise is shipped.
Our primary expenses include cost of products sold, distributor royalties and commissions and selling, general and administrative expenses.
Cost of products sold primarily consists of expenses related to raw materials, labor, quality control and overhead directly associated with production of our products and sales materials, as well as shipping costs relating to the shipment of products to distributors, and duties and taxes associated with product exports. Cost of products sold is impacted by the cost of the ingredients used in our products, the cost of shipping distributors’ orders, along with our efficiency in managing the production of our products.
Distributor royalties and commissions are monthly payments made to distributors based on products sold in their downline organization. Based on our distributor agreements, these expenses have typically approximated 23% of sales at suggested retail. Wholesale pricing discounts on distributor orders are based on the retail value of the product. Distributor royalties and commissions are paid on an amount referred to as the business value (“BV”), which typically ranges between 80% and 90% of the retail price of each product. Also, we include other sales leadership bonuses, such as Ambassador bonuses, within this caption. Overall, distributor royalties and commissions remain directly related to the level of our sales and should continue at comparable levels as a percentage of net sales going forward.
Selling, general and administrative expenses include the compensation and benefits paid to our employees, except for those in manufacturing, all other selling expenses, marketing, promotional expenses, travel and other corporate administrative expenses. These other corporate administrative expenses include professional fees, non-manufacturing depreciation and amortization, occupancy costs, communication costs and other similar operating expenses. Selling, general and administrative expenses can be affected by a number of factors, including staffing levels and the cost of providing competitive salaries and benefits; the amount we decide to invest in distributor training and motivational initiatives; and the cost of regulatory compliance.
Results of Operations
Net Sales. Overall net sales decreased by 21.7% in the three months ended March 31, 2018 compared to the same period in 2017. During the first quarter of 2018 (“Q1 2018”), sales in the United States decreased by 25.2% and international sales decreased by 7.4% over the prior-year period. International sales, when reported in U.S. dollars, were positively impacted by a weaker U.S. dollar versus most of the currencies we conduct business in, other than the Philippine peso. Excluding the impact of currency exchange fluctuation, international sales decreased by 13.0%.
The following table summarizes net sales by geographic market for the three months ended March 31, 2018 and 2017.
|
Three months ended March 31, |
||||||||||||||||||||||||
|
2018 |
2017 |
Change from prior year |
||||||||||||||||||||||
|
Amount |
% of Net Sales |
Amount |
% of Net Sales |
Amount |
% |
|||||||||||||||||||
|
(dollars in thousands) |
||||||||||||||||||||||||
|
United States |
$ | 7,670 | 76.7 |
% |
$ | 10,259 | 80.3 |
% |
$ | (2,589 |
) |
(25.2 |
)% |
|||||||||||
|
Australia/New Zealand |
232 | 2.3 | 260 | 2.0 | (28 |
) |
(10.8 |
) |
||||||||||||||||
|
Canada |
242 | 2.4 | 264 | 2.1 | (22 |
) |
(8.3 |
) |
||||||||||||||||
|
Mexico |
107 | 1.1 | 157 | 1.2 | (50 |
) |
(31.8 |
) |
||||||||||||||||
|
Europe |
1,165 | 11.6 | 1,201 | 9.4 | (36 |
) |
(3.0 |
) |
||||||||||||||||
|
Asia |
587 | 5.9 | 637 | 5.0 | (50 |
) |
(7.8 |
) |
||||||||||||||||
|
Consolidated total |
$ | 10,003 | 100.0 |
% |
$ | 12,778 | 100.0 |
% |
$ | (2,775 |
) |
(21.7 |
)% |
|||||||||||
The following table sets forth, as of March 31, 2018 and 2017, the number of our active distributors and Master Affiliates and above. The total number of active distributors includes Master Affiliates and above. We define an active distributor as one that enrolls as a distributor or renews his or her distributorship during the prior twelve months. Master Affiliates and above are distributors that have attained the highest level of discount and are eligible for royalties generated by Master Affiliate groups in their downline organization. We include Preferred Customers as part of our Active Distributor count, and Preferred Customers represent approximately 4,780 and 5,200 of the Active Distributor count as of March 31, 2018 and 2017, respectively.
|
March 31, 2018 |
March 31, 2017 |
% Change |
||||||||||||||||||||||
|
Active Distributors and Preferred Customers |
Master Affiliates and Above |
Active Distributors and Preferred Customers |
Master Affiliates and Above |
Active Distributors and Preferred Customers |
Master Affiliates and Above |
|||||||||||||||||||
|
United States |
21,800 | 2,240 | 26,110 | 2,610 | (16.5) | % |
|
(14.2) | % |
|
||||||||||||||
|
Australia/New Zealand |
1,070 | 80 | 1,440 | 110 | (25.7) |
|
(27.3) |
|
||||||||||||||||
|
Canada |
630 | 80 | 780 | 90 | (19.2) |
|
(11.1) |
|
||||||||||||||||
|
Mexico |
660 | 60 | 880 | 60 | (25.0) |
|
--- | |||||||||||||||||
|
Europe |
3,630 | 350 | 4,620 | 410 | (21.4) |
|
(14.6) |
|
||||||||||||||||
|
Asia |
4,310 | 330 | 3,450 | 310 | 24.9 | 6.5 | ||||||||||||||||||
|
Consolidated total |
32,100 | 3,140 | 37,280 | 3,590 | (13.9) | % |
|
(12.5) | % |
|
||||||||||||||
The following table provides key statistics related to distributor activity by market and should be read in conjunction with the following discussion.
|
Distributor Activity by Market |
International |
|||||||||||||||||||||||||||
|
United States |
AUS/NZ |
Canada |
Mexico |
Europe |
Asia |
-- Total |
||||||||||||||||||||||
|
Sales in USD (in 000's): |
||||||||||||||||||||||||||||
|
Quarter ended 3/31/2018 |
$ | 7,670 | $ | 232 | $ | 242 | $ | 107 | $ | 1,165 | $ | 587 | $ | 2,333 | ||||||||||||||
|
Quarter ended 3/31/2017 |
$ | 10,259 | $ | 260 | $ | 264 | $ | 157 | $ | 1,201 | $ | 637 | $ | 2,519 | ||||||||||||||
|
% change in sales-Q1 2018 vs. Q1 2017: |
||||||||||||||||||||||||||||
|
in USD |
-25.2 | % | -10.8 | % | -8.3 | % | -31.8 | % | -3.0 | % | -7.8 | % | -7.4 | % | ||||||||||||||
|
due to currency fluctuation |
- | 2.8 | % | 4.2 | % | 5.1 | % | 10.6 | % | -2.0 | % | 5.6 | % | |||||||||||||||
|
Sales in local currency (non-GAAP) |
-25.2 | % | -13.6 | % | -12.5 | % | -36.9 | % | -13.6 | % | -5.8 | % | -13.0 | % | ||||||||||||||
|
# of new distributors-Q1 2018 (1) |
978 | 41 | 38 | 83 | 342 | 539 | 1,043 | |||||||||||||||||||||
|
# of new distributors-Q1 2017 (1) |
1,615 | 66 | 44 | 83 | 466 | 701 | 1,360 | |||||||||||||||||||||
|
% change |
-39.4 | % | -37.9 | % | -13.6 | % | 0.0 | % | -26.6 | % | -23.1 | % | -23.3 | % | ||||||||||||||
|
# of new Master Affiliates-Q1 2018 |
100 | 6 | 7 | 10 | 30 | 54 | 107 | |||||||||||||||||||||
|
# of new Master Affiliates-Q1 2017 |
154 | 3 | 3 | 7 | 34 | 88 | 135 | |||||||||||||||||||||
|
% change |
-35.1 | % | 100.0 | % | 133.3 | % | 42.9 | % | -11.8 | % | -38.6 | % | -20.7 | % | ||||||||||||||
|
# of Product orders-Q1 2018 |
26,637 | 1,204 | 631 | 751 | 3,607 | 6,553 | 12,746 | |||||||||||||||||||||
|
# of Product orders-Q1 2017 |
35,008 | 1,452 | 814 | 1,093 | 4,704 | 5,675 | 13,738 | |||||||||||||||||||||
|
% change |
-23.9 | % | -17.1 | % | -22.5 | % | -31.3 | % | -23.3 | % | 15.5 | % | -7.2 | % | ||||||||||||||
|
(1) The new distributor totals for Q1 2018 and Q1 2017 include 782 and 1,019, respectively, new worldwide preferred customers. |
Use of Non-GAAP Financial Information
Net sales expressed in local currency or net sales adjusted for the impact of foreign currency fluctuation are non-GAAP financial measures. We use these measurements to assess the level of business activity in a foreign market, absent the impact of foreign currency fluctuation relative to the U.S. dollar, which our local management has no ability to influence. This is a meaningful measurement to management, and we believe this is a useful measurement to provide to shareholders.
United States
|
● |
Net sales in the United States declined by 25.2% in Q1 2018 compared to the prior-year period as all measurements of distributor activity declined. |
|
● |
In Q1 2017, we launched Fit3TM, a new fitness and weight loss program. Net sales of the Fit3 product line represented 10.1% of net U.S. sales in 2017; however, net sales have declined since its introductory period and only represented 4.3% of net sales in the U.S. in Q1 2018. |
|
● |
Effective November 1, 2017, we increased suggested retail prices in the United States by an average of 4.5%, but we offered incentives on the shipping and handling charge on large orders, such as orders to qualify as a Master Affiliate. One of the effects of this price increase was to accelerate a portion of sales into October 2017 for Master Affiliate requalification that would have normally taken place in January 2018. |
|
● |
Products in the LunaRich line, including Reliv Now® and LunaRich X™, continued to perform well, constituting 17.1% and 12.4% of net sales in the United States, respectively, in Q1 2018. Reliv NOW and LunaRich X represented 15.9% and 13.1%, respectively, of net sales in the United States in the prior-year quarter. |
|
● |
Distributor enrollments and new Master Affiliate qualifications decreased by 39.4% and 35.1%, respectively, in Q1 2018 compared to the prior year quarter. |
|
● |
Distributor retention was 72.3% for the twelve month period ended March 31, 2018 compared to 71.5% for all of 2017. Distributor retention is determined by the percentage of active distributors from 2017 that renewed their distributorships in 2018. |
|
● |
Our average order size in Q1 2018 decreased by 2.8% to $388 at suggested retail value compared to the prior-year quarter. Also, the number of product orders decreased by 23.9% in Q1 2018 compared to the prior year quarter. |
International Operations
|
● |
The average foreign exchange rate for the U.S. dollar for Q1 2018 was weaker against most of the currencies in which we conduct business, except for the Philippine peso. |
|
● |
We continue to review prices and margins in all of our international markets and plan to make adjustments as needed, as we increased prices in most of our markets in 2017. We are also reviewing sales by product to phase out products with lower sales levels and gross margins as strategically appropriate. |
|
● |
Australia/New Zealand and Canadian net sales in Q1 2018 decreased by 13.6% and 12.5%, respectively, in local currency compared to the prior-year quarter as the result of decreased distributor activity in the market. |
|
● |
Net sales in Mexico decreased by 36.9% in local currency in Q1 2018 compared to the prior-year quarter. Sales in Mexico have been negatively impacted since a price increase in November 2017. |
|
● |
Net sales in Europe decreased by 13.6% in local currency in Q1 2018 compared to the prior-year quarter. Distributor activity declined both in the form of new distributor and preferred customer enrollments and number of product orders placed in the region. |
|
● |
Sales in Asia decreased by 5.8% in local currency in Q1 2018 compared to the prior-year quarter. Local currency sales in the Philippines, our largest market in the region, declined 3.8% as the Easter holiday period fell on the last week of March in 2018. |
Costs and Expenses
The following table sets forth selected results of our operations expressed as a percentage of net sales for the three-month periods ended March 31, 2018 and 2017. Our results of operations for the periods described below are not necessarily indicative of results of operations for future periods.
|
Income statement data |
||||||||||||||||
|
(amounts in thousands) |
Q1 2018 |
Q1 2017 |
||||||||||||||
|
Amount |
% of net sales |
Amount |
% of net sales |
|||||||||||||
|
Net sales |
$ | 10,003 | 100.0 |
% |
$ | 12,778 | 100.0 |
% |
||||||||
|
Costs and expenses: |
||||||||||||||||
|
Cost of products sold |
2,349 | 23.5 | 2,836 | 22.2 | ||||||||||||
|
Distributor royalties and commissions |
3,392 | 33.9 | 4,499 | 35.2 | ||||||||||||
|
Selling, general and adminstrative |
4,486 | 44.8 | 4,926 | 38.6 | ||||||||||||
|
Income (loss) from operations |
(224 | ) | (2.2 | ) | 517 | 4.0 | ||||||||||
|
Interest income |
24 | 0.2 | 26 | 0.2 | ||||||||||||
|
Interest expense |
(31 | ) | (0.3 | ) | (25 | ) | (0.2 | ) | ||||||||
|
Other income |
10 | 0.1 | 33 | 0.3 | ||||||||||||
|
Income (loss) before income taxes |
(221 | ) | (2.2 | ) | 551 | 4.3 | ||||||||||
|
Provision for income taxes |
17 | 0.2 | 27 | 0.2 | ||||||||||||
|
Net income (loss) |
$ | (238 | ) | (2.4 |
)% |
$ | 524 | 4.1 |
% |
|||||||
|
Earnings (loss) per common share-Basic |
$ | (0.13 | ) | $ | 0.28 | |||||||||||
|
Earnings (loss) per common share-Diluted |
$ | (0.13 | ) | $ | 0.28 | |||||||||||
Cost of Products Sold:
|
● |
The cost of products sold as a percentage of net sales in Q1 2018 increased by 1.3% compared to the prior-year period. The cost of products sold as a percentage of net sales in Q1 2018 was negatively impacted by lower plant utilization and promotions in the United States that reduced our handling and freight income. |
Distributor Royalties and Commissions:
|
● |
Distributor royalties and commissions as a percentage of net sales for Q1 2018 decreased by 1.3% of net sales when compared to the prior-year period. Over the course of 2017, we increased the prices of our products in most of our markets, with prices increased in the U.S. and Canada effective November 1, 2017. As part of the price increase, we did not increase the BV of the products. The BV represents the amount per commissionable product that is paid in distributor royalties and commissions. This accounts for the slight decrease in royalties and commissions expense as a percentage of net sales. |
Selling, General and Administrative Expenses:
|
● |
Selling, general and administrative expenses declined by $440,000 in Q1 2018 compared to the prior-year period. |
|
● |
Salaries, other staffing expenses, benefits, and incentive compensation decreased in the aggregate by $203,000 in Q1 2018, compared to the prior-year period. |
|
● |
Sales and marketing expenses decreased by $241,000 in Q1 2018 compared to the prior-year period. Components of the decrease include: |
|
o |
$166,000 decrease in Star Director and other distributor bonuses, credit card fees, and other expenses related to the level of sales. |
|
o |
$74,000 decrease in video production and other sales development expense in Q1 2018 compared to the prior-year period. Much of these expenses in Q1 2017 were related to the Fit3 new product launch. |
|
|
Offsetting increases include: |
|
o |
$71,000 increase in distributor conferences and meeting expenses. |
|
● |
Other general and administrative expenses decreased by $28,000 in Q1 2018 versus the prior-year period. |
Other Income/Expense:
|
● |
The other income in Q1 2018 and Q1 2017 is primarily the result of foreign currency exchange gains on intercompany debt denominated in U.S. dollars in certain of our subsidiaries. |
Income Taxes:
|
● |
We reported an income tax expense of $17,000 for Q1 2018 related to income taxes on our earnings in our Philippine entity and minimum U.S. state income tax expense. |
|
● |
See Note 5 of the Condensed Consolidated Financial Statements for additional detail regarding income taxes. |
Net Income:
|
● |
We reported a net loss of $238,000 in Q1 2018 compared to a net income of $524,000 in the prior-year quarter primarily the result of the decrease in net sales in the United States. |
Financial Condition, Liquidity and Capital Resources
During the first three months of 2018, we generated $500,000 of net cash from operating activities, $17,000 was provided by investing activities, and we used $108,000 in financing activities. This compares to $530,000 of net cash provided by operating activities, $235,000 used in investing activities, and $114,000 used in financing activities in the same period of 2017. Cash and cash equivalents increased by $404,000 to $3.68 million as of March 31, 2018 compared to December 31, 2017.
Significant changes in working capital items consisted of a decrease in inventory of $394,000, an increase in prepaid expenses/other current assets of $320,000, and an increase of $561,000 in accounts payable and accrued expenses in the first three months of 2018. The decrease in inventory is the result of a decrease in production to correspond to the decrease in sales, and the increase in prepaid expenses/other current assets primarily represents the annual premium payments made in the first quarter of 2018 on most of the corporate business insurance policies. The increase in accounts payable and accrued expenses is result of a financing arrangement for our annual corporate insurance policy renewals, coupled with an increase in payroll and payroll taxes payable as the result of our change from a semi-monthly to a bi-weekly payroll cycle in the United States.
Investing activities during the first three months of 2018 consisted of a net investment of $11,000 for capital expenditures, offset by payments received on a distributor note receivable of $28,000. Financing activities during the first three months of 2018 consisted of principal payments of $108,000 on long-term borrowings.
Stockholders’ equity decreased to $13.79 million at March 31, 2018 compared to $14.36 million at December 31, 2017. The decrease is primarily due to our net loss during the first three months of 2018 of $238,000 and a reduction of $368,000 due to the recognition of deferred revenue under ASU No. 2014-09. Our working capital balance was $1.77 million at March 31, 2018 compared to $2.14 million at December 31, 2017. The current ratio at March 31, 2018 was 1.25 compared to 1.34 at December 31, 2017.
Effective September 30, 2015, the Company entered into a series of lending agreements with our primary lender which included agreements for a $3.25 million term loan and a $3.5 million revolving credit facility. These lending agreements replaced similar borrowings under agreements with the Company’s former primary lender.
The $3.25 million term loan was for a period of three years and required monthly term loan payments, under a ten-year amortization, consisting of principal of $27,080 plus interest with a balloon payment for the outstanding balance due and payable on September 30, 2018. Effective with an April 11, 2018 loan agreement amendment, under similar monthly payment and interest rate terms, the term loan’s balloon payment due date has been extended from September 30, 2018 to April 29, 2019. The term loan's interest rate is based on the 30-day LIBOR plus 2.25% and was 3.94% at March 31, 2018.
The $3.5 million revolving line of credit agreement, originally dated September 30, 2015, accrues interest at a floating interest rate based on the 30-day LIBOR plus 2.25% and had an original term of one year. Effective September 30, 2016, the revolving line of credit agreement was extended under similar terms to April 30, 2018. Effective with an April 11, 2018 loan amendment, the revolving line of credit’s term has been extended from April 30, 2018 to April 29, 2019 and the revolver’s maximum borrowing amount has been reduced from $3.5 million to $2.0 million. At March 31, 2018, outstanding borrowings under the revolving line of credit are $500,000. The interest rate on revolver borrowings is identical to the term loan.
Borrowings under the lending agreements continue to be secured by all tangible and intangible assets of the Company, a whole life insurance policy on the life of the Company's Chief Executive Officer, which was assigned to the lender, and by a mortgage on the real estate of the Company's headquarters.
The loan agreements, including the April 2018 loan amendment, include quarterly financial covenants requiring the Company to maintain net tangible worth of not less than $9.5 million, and i) a cumulative minimum EBITDA requirement of $200,000; $400,000; $600,000; and $800,000 for the fiscal periods ending March 30, 2018; June 30, 2018; September 30, 2018; and December 31, 2018; respectively; and ii) a minimum EBITDA of $200,000 for the quarter ended March 31, 2019.
As defined, EBITDA equals the Company's consolidated net income for such period, before interest expense, income tax expense, depreciation and amortization, and management fees, and further adjusted to exclude any gain or loss on the sale of assets, other extraordinary gains or losses, and any one-time adjustment approved by the lender.
At March 31, 2018, we were not in compliance with our quarterly financial loan covenant requirements. On May 4, 2018, our lender agreed to waive our non-compliance with the tangible net worth and minimum EBITDA covenants for the March 31, 2018 reporting period; however, we cannot provide any assurance that the lender will waive any financial loan covenant non-compliance in any future quarterly reporting periods. Furthermore, we are unable to provide reasonable assurance that future operating results will achieve compliance with our quarterly financial loan covenant requirements. Accordingly, we have presented our outstanding loan balances as current liabilities in the March 31, 2018 condensed consolidated balance sheets.
We believe that our cash on hand and our ability, if necessary, to borrow a significant portion of or liquidate the cash surrender value of our key-man life insurance policy, will be sufficient to meet our working capital requirements and debt service requirements for the next twelve months.
Critical Accounting Policies
A summary of our critical accounting policies and estimates is presented in our 2017 Annual Report on Form 10-K filed with the Securities and Exchange Commission on March 29, 2018. Except for the required adoption of ASU No. 2014-09, our critical accounting policies remain unchanged as of March 31, 2018.
Item No. 4 - Controls and Procedures
Our management, under the supervision and with the participation of our Chief Executive Officer and Chief Financial Officer, has reviewed and evaluated the effectiveness of the design and operation of our disclosure controls and procedures as of March 31, 2018. Based on such review and evaluation, our Chief Executive Officer and Chief Financial Officer have concluded that the disclosure controls and procedures were effective as of March 31, 2018, to ensure that the information required to be disclosed by us in the reports that we file or submit under the Securities Exchange Act of 1934, as amended, (a) is recorded, processed, summarized and reported within the time period specified in the SEC’s rules and forms and (b) is accumulated and communicated to our management, including the officers, as appropriate to allow timely decisions regarding required disclosure. There were no material changes in our internal control over financial reporting during the first quarter of 2018 that have materially affected or are reasonably likely to materially affect our internal controls over financial reporting.
PART II – OTHER INFORMATION
Item No. 6 – Exhibits
|
Exhibit Number |
|
|
10.1 |
|
10.2 |
|
10.3 |
|
31.1 |
|
31.2 |
|
32 |
|
101 |
Interactive Data Files, including the following materials from the Company’s Quarterly Report on Form 10-Q for the quarter ended March 31, 2018, formatted in XBRL: (i) the Condensed Consolidated Balance Sheets, (ii) the Condensed Consolidated Statements of Net Income (Loss) and Comprehensive Income (Loss), (iii) the Condensed Consolidated Statements of Cash Flows, and (iv) the Notes to Condensed Consolidated Financial Statements. |
SIGNATURES
Pursuant to the requirements of the Securities Exchange Act of 1934, the registrant has duly caused this report to be signed on its behalf by the undersigned, thereunto duly authorized.
RELIV’ INTERNATIONAL, INC.
| By: | /s/ Robert L. Montgomery | |
| Robert L. Montgomery, Chairman of the Board of Directors and Chief Executive Officer | ||
| Date: May 15, 2018 | ||
| By: | /s/ Steven D. Albright | |
| Steven D. Albright, Chief Financial Officer (and accounting officer) | ||
| Date: May 15, 2018 | ||
21
Exhibit 10.1
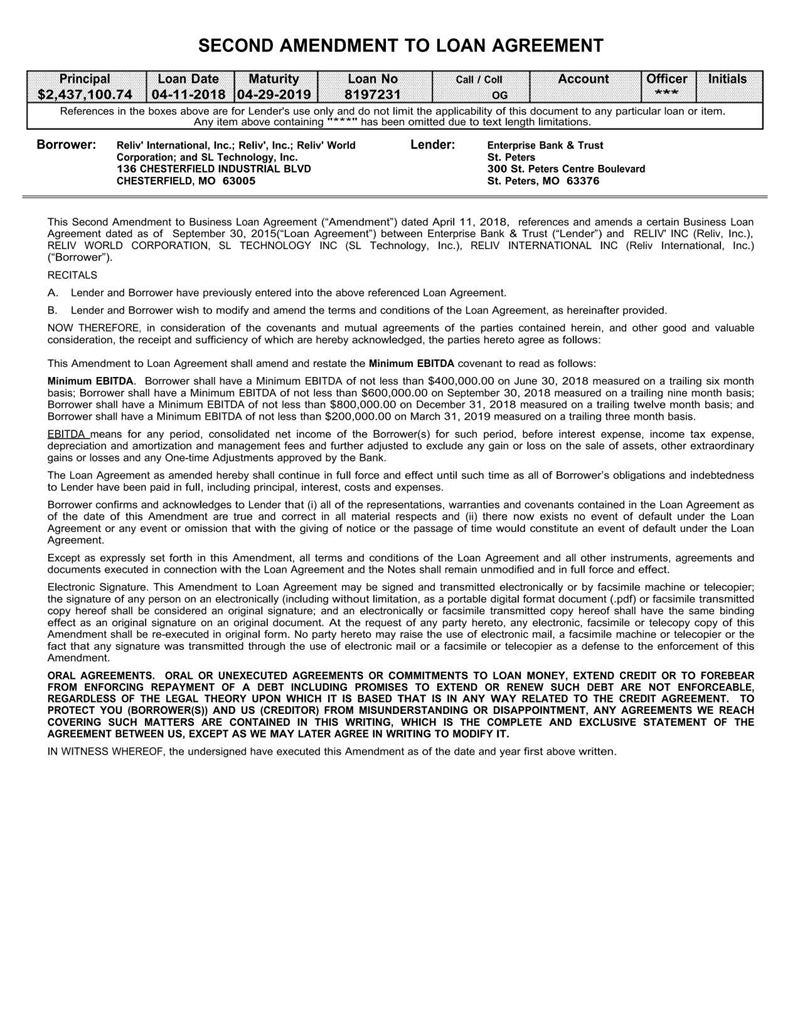
Exhibit 10.2


Exhibit 10.3

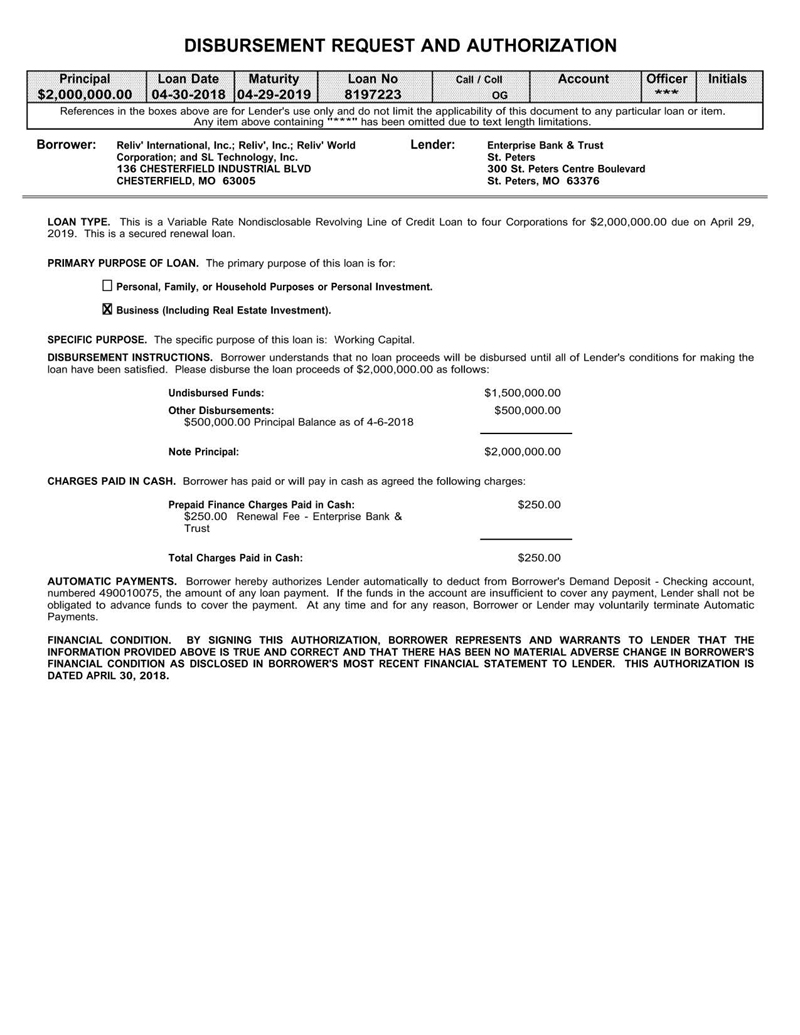

Exhibit 31.1
CERTIFICATION
I, Robert L. Montgomery, certify that:
1. I have reviewed this quarterly report on Form 10-Q of Reliv International, Inc.;
2. Based on my knowledge, this report does not contain any untrue statement of a material fact or omit to state a material fact necessary to make the statements made, in light of the circumstances under which such statements were made, not misleading with respect to the period covered by this report;
3. Based on my knowledge, the financial statements, and other financial information included in this report, fairly present in all material respects the financial condition, results of operations and cash flows of the registrant as of, and for, the periods presented in this report;
4. The registrant’s other certifying officer and I are responsible for establishing and maintaining disclosure controls and procedures (as defined in Exchange Act Rules 13a-15(e) and 15d-15(e)) and internal control over financial reporting (as defined in Exchange Act Rules 13a-15(f) and 15d-15(f)) for the registrant and have:
|
a. |
Designed such disclosure controls and procedures, or caused such disclosure controls and procedures to be designed under our supervision, to ensure that material information relating to the registrant, including its consolidated subsidiaries, is made known to us by others within those entities, particularly during the period in which this report is being prepared; |
|
b. |
Designed such internal control over financial reporting, or caused such internal control over financial reporting to be designed under our supervision, to provide reasonable assurance regarding the reliability of financial reporting and the preparation of financial statements for external purposes in accordance with generally accepted accounting principles; |
|
c. |
Evaluated the effectiveness of the registrant’s disclosure controls and procedures and presented in this report our conclusions about the effectiveness of the disclosure controls and procedures, as of the end of the period covered by this report based on such evaluation; and |
|
d. |
Disclosed in this report any change in the registrant’s internal control over financial reporting that occurred during the registrant’s most recent fiscal quarter (the registrant’s fourth fiscal quarter in the case of an annual report) that has materially affected, or is reasonably likely to materially affect, the registrant’s internal control over financial reporting; and |
5. The registrant’s other certifying officer and I have disclosed, based on our most recent evaluation of internal control over financial reporting, to the registrant’s auditors and the audit committee of the registrant’s board of directors (or persons performing the equivalent functions):
|
a. |
All significant deficiencies and material weaknesses in the design or operation of internal control over financial reporting which are reasonably likely to adversely affect the registrant’s ability to record, process, summarize and report financial information; and |
|
b. |
Any fraud, whether or not material, that involves management or other employees who have a significant role in the registrant’s internal control over financial reporting. |
Date: May 15, 2018
| /s/ Robert L. Montgomery | ||
| Robert L. Montgomery | ||
| Chief Executive Officer |
Exhibit 31.2
CERTIFICATION
I, Steven D. Albright, certify that:
1. I have reviewed this quarterly report on Form 10-Q of Reliv International, Inc.;
2. Based on my knowledge, this report does not contain any untrue statement of a material fact or omit to state a material fact necessary to make the statements made, in light of the circumstances under which such statements were made, not misleading with respect to the period covered by this report;
3. Based on my knowledge, the financial statements, and other financial information included in this report, fairly present in all material respects the financial condition, results of operations and cash flows of the registrant as of, and for, the periods presented in this report;
4. The registrant’s other certifying officer and I are responsible for establishing and maintaining disclosure controls and procedures (as defined in Exchange Act Rules 13a-15(e) and 15d-15(e)) and internal control over financial reporting (as defined in Exchange Act Rules 13a-15(f) and 15d-15(f)) for the registrant and have:
|
a. |
Designed such disclosure controls and procedures, or caused such disclosure controls and procedures to be designed under our supervision, to ensure that material information relating to the registrant, including its consolidated subsidiaries, is made known to us by others within those entities, particularly during the period in which this report is being prepared; |
|
b. |
Designed such internal control over financial reporting, or caused such internal control over financial reporting to be designed under our supervision, to provide reasonable assurance regarding the reliability of financial reporting and the preparation of financial statements for external purposes in accordance with generally accepted accounting principles; |
|
c. |
Evaluated the effectiveness of the registrant’s disclosure controls and procedures and presented in this report our conclusions about the effectiveness of the disclosure controls and procedures, as of the end of the period covered by this report based on such evaluation; and |
|
d. |
Disclosed in this report any change in the registrant’s internal control over financial reporting that occurred during the registrant’s most recent fiscal quarter (the registrant’s fourth fiscal quarter in the case of an annual report) that has materially affected, or is reasonably likely to materially affect, the registrant’s internal control over financial reporting; and |
5. The registrant’s other certifying officer and I have disclosed, based on our most recent evaluation of internal control over financial reporting, to the registrant’s auditors and the audit committee of the registrant’s board of directors (or persons performing the equivalent functions):
|
a. |
All significant deficiencies and material weaknesses in the design or operation of internal control over financial reporting which are reasonably likely to adversely affect the registrant’s ability to record, process, summarize and report financial information; and |
|
b. |
Any fraud, whether or not material, that involves management or other employees who have a significant role in the registrant’s internal control over financial reporting. |
Date: May 15, 2018
|
/s/ Steven D. Albright |
||
|
Steven D. Albright |
||
|
Chief Financial Officer |
Exhibit 32
CERTIFICATION PURSUANT TO
18 U.S.C. SECTION 1350,
AS ADOPTED PURSUANT TO
SECTION 906 OF THE SARBANES-OXLEY ACT OF 2002
In connection with the Quarterly Report on Form 10-Q of Reliv’ International, Inc. (the “Company”) for the quarterly period ended March 31, 2018, as filed with the Securities and Exchange Commission on the date hereof (the “Report”), Robert L. Montgomery, as Chief Executive Officer of the Company, and Steven D. Albright, as Chief Financial Officer of the Company, each hereby certifies, pursuant to 18 U.S.C. Section 1350, as adopted pursuant to Section 906 of the Sarbanes-Oxley Act of 2002, that:
(1) The Report fully complies with the requirements of Section 13(a) or 15(d) of the Securities Exchange Act of 1934; and
(2) The information contained in the Report fairly presents, in all material respects, the financial condition and results of operations of the Company.
| /s/ Robert L. Montgomery | |
| Robert L. Montgomery | |
| Chief Executive Officer | |
| Date: May 15, 2018 | |
| /s/ Steven D. Albright | |
| Steven D. Albright | |
| Chief Financial Officer | |
| Date: May 15, 2018 |
The foregoing certification is being furnished solely pursuant to 18 U.S.C. Section 1350, as adopted pursuant to Section 906 of the Sarbanes-Oxley Act of 2002, and is not being “filed” as part of the Form 10-Q or as a separate disclosure document for purposes of Section 18 of the Securities Exchange Act of 1934, as amended (the “Exchange Act”), or otherwise subject to liability under that section. This certification shall not be deemed to be incorporated by reference into any filing under the Securities Act of 1933, as amended, or the Exchange Act except to the extent that this Exhibit 32 is expressly and specifically incorporated by reference in any such filing.
A signed original of this written statement required by Section 906 has been provided to the Company and will be retained by the Company and furnished to the Securities and Exchange Commission or its staff upon request.
Serious News for Serious Traders! Try StreetInsider.com Premium Free!
You May Also Be Interested In
- Green-X Leads the Charge in GreenPro Capital's Social Value Economy Initiative
- Middlefield Real Estate Dividend ETF Distributions
- Track and Trace Solutions Market Size to be Worth USD 17.15 Billion by 2031, with Notable CAGR of 19.27%
Create E-mail Alert Related Categories
SEC FilingsSign up for StreetInsider Free!
Receive full access to all new and archived articles, unlimited portfolio tracking, e-mail alerts, custom newswires and RSS feeds - and more!
