

Form 10-Q FREEPORT-MCMORAN INC For: Mar 31
 Tweet
Tweet Share
ShareUnited States
SECURITIES AND EXCHANGE COMMISSION
Washington, D.C. 20549
FORM 10-Q
(Mark one)
QUARTERLY REPORT PURSUANT TO SECTION 13 OR 15(d) OF THE SECURITIES EXCHANGE ACT OF 1934 | |||||
For the quarterly period ended March 31, 2022
OR
TRANSITION REPORT PURSUANT TO SECTION 13 OR 15(d) OF THE SECURITIES EXCHANGE ACT OF 1934 | |||||
For the transition period from to
Commission file number: 001-11307-01
(Exact name of registrant as specified in its charter)
| (State or other jurisdiction of | (I.R.S. Employer Identification No.) | |||||||
| incorporation or organization) | ||||||||
| (Address of principal executive offices) | (Zip Code) | |||||||||||||||||||
(Registrant’s telephone number, including area code)
Securities registered pursuant to Section 12(b) of the Act:
| Title of each class | Trading Symbol(s) | Name of each exchange on which registered | ||||||
Indicate by check mark whether the registrant (1) has filed all reports required to be filed by Section 13 or 15(d) of the Securities Exchange Act of 1934 during the preceding 12 months (or for such shorter period that the registrant was required to file such reports), and (2) has been subject to such filing requirements for the past 90 days. ☑ Yes ☐ No
Indicate by check mark whether the registrant has submitted electronically every Interactive Data File required to be submitted pursuant to Rule 405 of Regulation S-T (§ 232.405 of this chapter) during the preceding 12 months (or for such shorter period that the registrant was required to submit such files). ☑ Yes ☐ No
Indicate by check mark whether the registrant is a large accelerated filer, an accelerated filer, a non-accelerated filer, or a smaller reporting company, or an emerging growth company. See the definitions of “large accelerated filer,” “accelerated filer,” “smaller reporting company,” and “emerging growth company” in Rule 12b-2 of the Exchange Act.
☑ | Accelerated filer | ☐ | |||||||||
Non-accelerated filer | ☐ | Smaller reporting company | |||||||||
Emerging growth company | |||||||||||
If an emerging growth company, indicate by check mark if the registrant has elected not to use the extended transition period for complying with any new or revised financial accounting standards provided pursuant to Section 13(a) of the Exchange Act. ☐
Indicate by check mark whether the registrant is a shell company (as defined in Rule 12b-2 of the Exchange Act). ☐ Yes ☑ No
On April 29, 2022, there were issued and outstanding 1,449,262,382 shares of the registrant’s common stock, par value $0.10 per share.
Freeport-McMoRan Inc.
TABLE OF CONTENTS
| Page | |||||
S-1 | |||||
2
Part I.FINANCIAL INFORMATION
Item 1.Financial Statements.
Freeport-McMoRan Inc.
CONSOLIDATED BALANCE SHEETS (Unaudited)
| March 31, 2022 | December 31, 2021 | ||||||||||
| (In millions) | |||||||||||
| ASSETS | |||||||||||
| Current assets: | |||||||||||
| Cash and cash equivalents | $ | $ | |||||||||
| Trade accounts receivable | |||||||||||
| Income and other tax receivables | |||||||||||
| Inventories: | |||||||||||
| Materials and supplies, net | |||||||||||
| Mill and leach stockpiles | |||||||||||
| Product | |||||||||||
| Other current assets | |||||||||||
| Total current assets | |||||||||||
| Property, plant, equipment and mine development costs, net | |||||||||||
| Long-term mill and leach stockpiles | |||||||||||
| Other assets | |||||||||||
| Total assets | $ | $ | |||||||||
| LIABILITIES AND EQUITY | |||||||||||
| Current liabilities: | |||||||||||
| Accounts payable and accrued liabilities | $ | $ | |||||||||
| Accrued income taxes | |||||||||||
| Current portion of debt | |||||||||||
| Current portion of environmental and asset retirement obligations | |||||||||||
| Dividends payable | |||||||||||
| Total current liabilities | |||||||||||
| Long-term debt, less current portion | |||||||||||
| Deferred income taxes | |||||||||||
| Environmental and asset retirement obligations, less current portion | |||||||||||
| Other liabilities | |||||||||||
| Total liabilities | |||||||||||
| Equity: | |||||||||||
| Stockholders’ equity: | |||||||||||
| Common stock | |||||||||||
| Capital in excess of par value | |||||||||||
| Accumulated deficit | ( | ( | |||||||||
| Accumulated other comprehensive loss | ( | ( | |||||||||
| Common stock held in treasury | ( | ( | |||||||||
| Total stockholders’ equity | |||||||||||
| Noncontrolling interests | |||||||||||
| Total equity | |||||||||||
| Total liabilities and equity | $ | $ | |||||||||
The accompanying notes are an integral part of these consolidated financial statements.
3
Freeport-McMoRan Inc.
CONSOLIDATED STATEMENTS OF INCOME (Unaudited)
| Three Months Ended | ||||||||||||||
| March 31, | ||||||||||||||
| 2022 | 2021 | |||||||||||||
| (In millions, except per share amounts) | ||||||||||||||
| Revenues | $ | $ | ||||||||||||
| Cost of sales: | ||||||||||||||
| Production and delivery | ||||||||||||||
| Depreciation, depletion and amortization | ||||||||||||||
| Total cost of sales | ||||||||||||||
| Selling, general and administrative expenses | ||||||||||||||
| Mining exploration and research expenses | ||||||||||||||
Environmental obligations and shutdown costs | ||||||||||||||
| Total costs and expenses | ||||||||||||||
| Operating income | ||||||||||||||
| Interest expense, net | ( | ( | ||||||||||||
| Other income, net | ||||||||||||||
| Income before income taxes and equity in affiliated companies’ net earnings (losses) | ||||||||||||||
| Provision for income taxes | ( | ( | ||||||||||||
| Equity in affiliated companies’ net earnings (losses) | ( | |||||||||||||
| Net income | ||||||||||||||
| Net income attributable to noncontrolling interests | ( | ( | ||||||||||||
| Net income attributable to common stockholders | $ | $ | ||||||||||||
| Net income per share attributable to common stockholders: | ||||||||||||||
Basic | $ | $ | ||||||||||||
Diluted | $ | $ | ||||||||||||
| Weighted-average common shares outstanding: | ||||||||||||||
Basic | ||||||||||||||
Diluted | ||||||||||||||
| Dividends declared per share of common stock | $ | $ | ||||||||||||
The accompanying notes are an integral part of these consolidated financial statements.
4
Freeport-McMoRan Inc.
CONSOLIDATED STATEMENTS OF COMPREHENSIVE INCOME (Unaudited)
| Three Months Ended | ||||||||||||||
| March 31, | ||||||||||||||
| 2022 | 2021 | |||||||||||||
| (In millions) | ||||||||||||||
| Net income | $ | $ | ||||||||||||
| Other comprehensive income, net of taxes: | ||||||||||||||
| Defined benefit plans: | ||||||||||||||
| Actuarial losses arising during the period | ( | |||||||||||||
| Prior service costs arising during the period | ( | |||||||||||||
| Amortization of unrecognized amounts included in net periodic benefit costs | ||||||||||||||
| Foreign exchange losses | ( | |||||||||||||
| Other comprehensive income | ||||||||||||||
| Total comprehensive income | ||||||||||||||
| Total comprehensive income attributable to noncontrolling interests | ( | ( | ||||||||||||
| Total comprehensive income attributable to common stockholders | $ | $ | ||||||||||||
The accompanying notes are an integral part of these consolidated financial statements.
5
Freeport-McMoRan Inc.
CONSOLIDATED STATEMENTS OF CASH FLOWS (Unaudited)
| Three Months Ended | ||||||||||||||
| March 31, | ||||||||||||||
| 2022 | 2021 | |||||||||||||
| (In millions) | ||||||||||||||
| Cash flow from operating activities: | ||||||||||||||
| Net income | $ | $ | ||||||||||||
| Adjustments to reconcile net income to net cash provided by operating activities: | ||||||||||||||
| Depreciation, depletion and amortization | ||||||||||||||
| Stock-based compensation | ||||||||||||||
| Net charges for environmental and asset retirement obligations, including accretion | ||||||||||||||
| Payments for environmental and asset retirement obligations | ( | ( | ||||||||||||
| Net charges for defined pension and postretirement plans | ||||||||||||||
| Pension plan contributions | ( | ( | ||||||||||||
| Deferred income taxes | ||||||||||||||
Charges for Cerro Verde royalty dispute | ||||||||||||||
| Payments for Cerro Verde royalty dispute | ( | |||||||||||||
| Other, net | ||||||||||||||
Changes in working capital and other: | ||||||||||||||
| Accounts receivable | ( | ( | ||||||||||||
| Inventories | ( | |||||||||||||
| Other current assets | ||||||||||||||
| Accounts payable and accrued liabilities | ( | ( | ||||||||||||
| Accrued income taxes and timing of other tax payments | ( | |||||||||||||
| Net cash provided by operating activities | ||||||||||||||
| Cash flow from investing activities: | ||||||||||||||
| Capital expenditures: | ||||||||||||||
| North America copper mines | ( | ( | ||||||||||||
| South America | ( | ( | ||||||||||||
| Indonesia mining | ( | ( | ||||||||||||
| Indonesia smelter projects | ( | ( | ||||||||||||
| Molybdenum mines | ( | ( | ||||||||||||
| Other | ( | ( | ||||||||||||
| Proceeds from sales of assets | ||||||||||||||
| Loans to PT Smelting for expansion | ( | |||||||||||||
| Other, net | ( | ( | ||||||||||||
| Net cash used in investing activities | ( | ( | ||||||||||||
| Cash flow from financing activities: | ||||||||||||||
| Proceeds from debt | ||||||||||||||
| Repayments of debt | ( | ( | ||||||||||||
| Cash dividends and distributions paid: | ||||||||||||||
| Common stock | ( | |||||||||||||
| Noncontrolling interests | ( | |||||||||||||
| Treasury stock purchases | ( | |||||||||||||
| Contributions from noncontrolling interests | ||||||||||||||
| Proceeds from exercised stock options | ||||||||||||||
| Payments for withholding of employee taxes related to stock-based awards | ( | ( | ||||||||||||
| Debt financing costs and other, net | ( | ( | ||||||||||||
| Net cash (used in) provided by financing activities | ( | |||||||||||||
| Net increase in cash, cash equivalents, restricted cash and restricted cash equivalents | ||||||||||||||
| Cash, cash equivalents, restricted cash and restricted cash equivalents at beginning of year | ||||||||||||||
| Cash, cash equivalents, restricted cash and restricted cash equivalents at end of period | $ | $ | ||||||||||||
The accompanying notes are an integral part of these consolidated financial statements.
6
Freeport-McMoRan Inc.
CONSOLIDATED STATEMENTS OF EQUITY (Unaudited)
THREE MONTHS ENDED MARCH 31
| Stockholders’ Equity | |||||||||||||||||||||||||||||||||||||||||||||||||||||||||||
| Common Stock | Accum-ulated Deficit | Accumu- lated Other Compre- hensive Loss | Common Stock Held in Treasury | Total Stock-holders’ Equity | |||||||||||||||||||||||||||||||||||||||||||||||||||||||
| Number of Shares | At Par Value | Capital in Excess of Par Value | Number of Shares | At Cost | Non- controlling Interests | Total Equity | |||||||||||||||||||||||||||||||||||||||||||||||||||||
| (In millions) | |||||||||||||||||||||||||||||||||||||||||||||||||||||||||||
| Balance at December 31, 2021 | $ | $ | $ | ( | $ | ( | $ | ( | $ | $ | $ | ||||||||||||||||||||||||||||||||||||||||||||||||
| Exercised and issued stock-based awards | — | — | — | — | — | ||||||||||||||||||||||||||||||||||||||||||||||||||||||
| Stock-based compensation, including the tender of shares | — | — | — | — | ( | ( | ( | ( | |||||||||||||||||||||||||||||||||||||||||||||||||||
| Treasury stock purchases | — | — | — | — | — | ( | ( | — | ( | ||||||||||||||||||||||||||||||||||||||||||||||||||
| Dividends | — | — | ( | — | — | — | — | ( | ( | ( | |||||||||||||||||||||||||||||||||||||||||||||||||
| Contributions from noncontrolling interests | — | — | — | — | — | — | |||||||||||||||||||||||||||||||||||||||||||||||||||||
| Net income attributable to common stockholders | — | — | — | — | — | — | — | ||||||||||||||||||||||||||||||||||||||||||||||||||||
Net income attributable to noncontrolling interests | — | — | — | — | — | — | — | — | |||||||||||||||||||||||||||||||||||||||||||||||||||
| Other comprehensive income | — | — | — | — | — | — | — | ||||||||||||||||||||||||||||||||||||||||||||||||||||
| Balance at March 31, 2022 | $ | $ | $ | ( | $ | ( | $ | ( | $ | $ | $ | ||||||||||||||||||||||||||||||||||||||||||||||||
| Stockholders’ Equity | |||||||||||||||||||||||||||||||||||||||||||||||||||||||||||
| Common Stock | Accum-ulated Deficit | Accumu- lated Other Compre- hensive Loss | Common Stock Held in Treasury | Total Stock-holders’ Equity | |||||||||||||||||||||||||||||||||||||||||||||||||||||||
| Number of Shares | At Par Value | Capital in Excess of Par Value | Number of Shares | At Cost | Non- controlling Interests | Total Equity | |||||||||||||||||||||||||||||||||||||||||||||||||||||
| (In millions) | |||||||||||||||||||||||||||||||||||||||||||||||||||||||||||
| Balance at December 31, 2020 | $ | $ | $ | ( | $ | ( | $ | ( | $ | $ | $ | ||||||||||||||||||||||||||||||||||||||||||||||||
| Exercised and issued stock-based awards | — | — | — | — | — | ||||||||||||||||||||||||||||||||||||||||||||||||||||||
| Stock-based compensation, including the tender of shares | — | — | — | — | ( | ( | |||||||||||||||||||||||||||||||||||||||||||||||||||||
| Dividends | — | — | ( | — | — | — | — | ( | ( | ( | |||||||||||||||||||||||||||||||||||||||||||||||||
| Contributions from noncontrolling interests | — | — | — | — | — | — | |||||||||||||||||||||||||||||||||||||||||||||||||||||
| Net income attributable to common stockholders | — | — | — | — | — | — | — | ||||||||||||||||||||||||||||||||||||||||||||||||||||
| Net income attributable to noncontrolling interests | — | — | — | — | — | — | — | — | |||||||||||||||||||||||||||||||||||||||||||||||||||
| Other comprehensive income (loss) | — | — | — | — | — | — | ( | ||||||||||||||||||||||||||||||||||||||||||||||||||||
| Balance at March 31, 2021 | $ | $ | $ | ( | $ | ( | $ | ( | $ | $ | $ | ||||||||||||||||||||||||||||||||||||||||||||||||
The accompanying notes are an integral part of these consolidated financial statements.
7
Freeport-McMoRan Inc.
NOTES TO CONSOLIDATED FINANCIAL STATEMENTS (Unaudited)
NOTE 1. GENERAL INFORMATION
The accompanying unaudited consolidated financial statements have been prepared in accordance with the instructions to Form 10-Q and do not include all information and disclosures required by generally accepted accounting principles in the United States (U.S.). Therefore, this information should be read in conjunction with Freeport-McMoRan Inc.’s (FCX) consolidated financial statements and notes contained in its annual report on Form 10-K for the year ended December 31, 2021 (2021 Form 10-K). The information furnished herein reflects all adjustments that are, in the opinion of management, necessary for a fair statement of the results for the interim periods reported. All such adjustments are, in the opinion of management, of a normal recurring nature. Operating results for the three-month period ended March 31, 2022, are not necessarily indicative of the results that may be expected for the year ending December 31, 2022.
Subsequent Events. FCX evaluated events after March 31, 2022, and through the date the consolidated financial statements were issued, and determined any events and transactions occurring during this period that would require recognition or disclosure are appropriately addressed in these consolidated financial statements.
NOTE 2. EARNINGS PER SHARE
FCX calculates its basic net income per share of common stock under the two-class method and calculates its diluted net income per share of common stock using the more dilutive of the two-class method or the treasury-stock method. Basic net income per share of common stock was computed by dividing net income attributable to common stockholders (after deducting accumulated dividends and undistributed earnings to participating securities) by the weighted-average shares of common stock outstanding during the period. Diluted net income per share of common stock was calculated by including the basic weighted-average shares of common stock outstanding adjusted for the effects of all potential dilutive shares of common stock, unless their effect would be antidilutive.
Reconciliations of net income and weighted-average shares of common stock outstanding for purposes of calculating basic and diluted net income per share follow (in millions, except per share amounts):
| Three Months Ended | ||||||||||||||
| March 31, | ||||||||||||||
| 2022 | 2021 | |||||||||||||
| Net income | $ | $ | ||||||||||||
| Net income attributable to noncontrolling interests | ( | ( | ||||||||||||
| Undistributed earnings allocated to participating securities | ( | ( | ||||||||||||
| Net income attributable to common stockholders | $ | $ | ||||||||||||
Basic weighted-average shares of common stock outstanding | ||||||||||||||
| Add shares issuable upon exercise or vesting of dilutive stock options and restricted stock units (RSUs) | ||||||||||||||
Diluted weighted-average shares of common stock outstanding | ||||||||||||||
| Basic net income per share attributable to common stockholders | $ | $ | ||||||||||||
| Diluted net income per share attributable to common stockholders | $ | $ | ||||||||||||
Outstanding stock options with exercise prices greater than the average market price of FCX’s common stock during the period are excluded from the computation of diluted net income per share of common stock. Stock options for 2 million shares of common stock in first-quarter 2022 and 10 million shares of common stock in first-quarter 2021, were excluded.
8
NOTE 3. INVENTORIES, INCLUDING LONG-TERM MILL AND LEACH STOCKPILES
The components of inventories follow (in millions):
| March 31, 2022 | December 31, 2021 | |||||||||||||
| Current inventories: | ||||||||||||||
Total materials and supplies, neta | $ | $ | ||||||||||||
| Mill stockpiles | $ | $ | ||||||||||||
| Leach stockpiles | ||||||||||||||
| Total current mill and leach stockpiles | $ | $ | ||||||||||||
| Raw materials (primarily concentrate) | $ | $ | ||||||||||||
| Work-in-process | ||||||||||||||
| Finished goods | ||||||||||||||
| Total product | $ | $ | ||||||||||||
| Long-term inventories: | ||||||||||||||
| Mill stockpiles | $ | $ | ||||||||||||
| Leach stockpiles | ||||||||||||||
Total long-term mill and leach stockpilesb | $ | $ | ||||||||||||
a.Materials and supplies inventory was net of obsolescence reserves totaling $39 million at March 31, 2022, and $36 million at December 31, 2021.
b.Estimated metals in stockpiles not expected to be recovered within the next 12 months.
NOTE 4. INCOME TAXES
Geographic sources of FCX’s provision for income taxes follow (in millions):
| Three Months Ended | ||||||||||||||
| March 31, | ||||||||||||||
| 2022 | 2021 | |||||||||||||
| U.S. operations | $ | ( | $ | |||||||||||
| International operations | ( | ( | ||||||||||||
| Total | $ | ( | $ | ( | ||||||||||
FCX’s consolidated effective income tax rate was 30 percent for first-quarter 2022 and 32 percent for first-quarter 2021. Variations in the relative proportions of jurisdictional income result in fluctuations to FCX’s consolidated effective income tax rate.
NOTE 5. DEBT AND EQUITY
The components of debt follow (in millions):
| March 31, 2022 | December 31, 2021 | |||||||||||||
| Senior notes and debentures: | ||||||||||||||
| Issued by FCX | $ | $ | ||||||||||||
| Issued by Freeport Minerals Corporation | ||||||||||||||
| PT-FI Term Loan | ||||||||||||||
| Cerro Verde Term Loan | ||||||||||||||
| Other | ||||||||||||||
| Total debt | ||||||||||||||
| Less current portion of debt | ( | a | ( | |||||||||||
| Long-term debt | $ | $ | ||||||||||||
a.Includes $325 million for the Cerro Verde Term Loan due June 2022 and $995 million for the FCX 3.875% Senior Notes due March 2023.
9
Revolving Credit Facility. At March 31, 2022, FCX had no borrowings outstanding and $8 million in letters of credit issued under its revolving credit facility, resulting in availability of approximately $3.5 billion, of which approximately $1.5 billion could be used for additional letters of credit. Availability under FCX’s revolving credit facility consists of $3.28 billion maturing April 2024 and $220 million maturing April 2023. At March 31, 2022, FCX was in compliance with its revolving credit facility covenants.
PT-FI Credit Facility. In July 2021, PT-FI entered into a $1.0 billion, five-year , unsecured credit facility (consisting of a $667 million term loan and a $333 million revolving credit facility) to fund project costs in connection with the PT Smelting expansion and construction of a precious metals refinery (PMR), and for PT-FI’s general corporate purposes. At March 31, 2022, $614 million ($603 million net of debt issuance costs) was drawn under the term loan, no amounts were drawn under the revolving credit facility and PT-FI was in compliance with its credit facility covenants.
Senior Notes issued by PT-FI. In April 2022, PT-FI completed the sale of $3.0 billion of unsecured senior notes, consisting of $750 million of 4.763% Senior Notes due 2027, $1.5 billion of 5.315% Senior Notes due 2032 and $750 million of 6.200% Senior Notes due 2052. PT-FI intends to use the proceeds, net of underwriting fees, of $2.99 billion to finance its smelter projects, to refinance the PT-FI Term Loan and for general corporate purposes.
Interest Expense, Net. Consolidated interest costs (before capitalization) totaled $153 million in first-quarter 2022 and $160 million in first-quarter 2021. Capitalized interest added to property, plant, equipment and mine development costs, net, totaled $26 million in first-quarter 2022 and $15 million in first-quarter 2021. The increase in capitalized interest costs for the 2022 period resulted from increased construction and development projects in process.
Share Repurchase Program. In first-quarter 2022, FCX acquired 12.3 million shares of its common stock under the share repurchase program for a total cost of $541 million ($44.02 average cost per share). Through May 5, 2022, FCX acquired 28.7 million shares of its common stock for a total cost of $1.2 billion ($41.64 average cost per share) and $1.8 billion remains available for repurchases under the program.
Dividends. On March 23, 2022, FCX declared quarterly cash dividends totaling $0.15 per share ($0.075 per share base dividend and $0.075 per share variable dividend) on its common stock, which were paid on May 2, 2022, to common stockholders of record as of April 14, 2022.
The declaration and payment of dividends (base or variable) and timing and amount of any share repurchases is at
the discretion of FCX’s Board of Directors (Board) and management, respectively, and is subject to a number of factors, including maintaining FCX’s net debt target, capital availability, FCX’s financial results, cash requirements, business prospects, global economic conditions, changes in laws, contractual restrictions and other factors deemed relevant by FCX’s Board or management, as applicable. FCX’s share repurchase program may be modified, increased, suspended or terminated at any time at the Board’s discretion.
NOTE 6. FINANCIAL INSTRUMENTS
FCX does not purchase, hold or sell derivative financial instruments unless there is an existing asset or obligation, or it anticipates a future activity that is likely to occur and will result in exposure to market risks, which FCX intends to offset or mitigate. FCX does not enter into any derivative financial instruments for speculative purposes but has entered into derivative financial instruments in limited instances to achieve specific objectives. These objectives principally relate to managing risks associated with commodity price changes, foreign currency exchange rates and interest rates.
Commodity Contracts. From time to time, FCX has entered into derivative contracts to hedge the market risk associated with fluctuations in the prices of commodities it purchases and sells. Derivative financial instruments used by FCX to manage its risks do not contain credit risk-related contingent provisions.
10
A discussion of FCX’s derivative contracts and programs follows:
Derivatives Designated as Hedging Instruments – Fair Value Hedges
Copper Futures and Swap Contracts. Some of FCX’s U.S. copper rod and cathode customers request a fixed market price instead of the Commodity Exchange Inc. (COMEX) average copper price in the month of shipment. FCX hedges this price exposure in a manner that allows it to receive the COMEX average price in the month of shipment while the customers pay the fixed price they requested. FCX accomplishes this by entering into copper futures or swap contracts. Hedging gains or losses from these copper futures and swap contracts are recorded in revenues. FCX did not have any significant gains or losses resulting from hedge ineffectiveness during the three-month periods ended March 31, 2022 and 2021. At March 31, 2022, FCX held copper futures and swap contracts that qualified for hedge accounting for 84 million pounds at an average contract price of $4.47 per pound, with maturities through February 2024.
A summary of gains (losses) recognized in revenues for derivative financial instruments related to commodity contracts that are designated and qualify as fair value hedge transactions, including on the related hedged item follows (in millions):
| Three Months Ended | |||||||||||
| March 31, | |||||||||||
| 2022 | 2021 | ||||||||||
| Copper futures and swap contracts: | |||||||||||
| Unrealized gains (losses): | |||||||||||
| Derivative financial instruments | $ | $ | |||||||||
| Hedged item – firm sales commitments | ( | ( | |||||||||
| Realized gains: | |||||||||||
| Matured derivative financial instruments | |||||||||||
Derivatives Not Designated as Hedging Instruments
Embedded Derivatives. Certain FCX concentrate, copper cathode and gold sales contracts provide for provisional pricing primarily based on the London Metal Exchange (LME) copper price or the COMEX copper price and the London Bullion Market Association (London) gold price at the time of shipment as specified in the contract. FCX receives market prices based on prices in the specified future month, which results in price fluctuations recorded in revenues until the date of settlement. FCX records revenues and invoices customers at the time of shipment based on then-current LME or COMEX copper prices and the London gold prices as specified in the contracts, which results in an embedded derivative (i.e., a pricing mechanism that is finalized after the time of delivery) that is required to be bifurcated from the host contract. The host contract is the sale of the metals contained in the concentrate or cathode at the then-current LME or COMEX copper price, and the London gold price. FCX applies the normal purchases and normal sales scope exception in accordance with derivatives and hedge accounting guidance to the host contract in its concentrate or cathode sales agreements since these contracts do not allow for net settlement and always result in physical delivery. The embedded derivative does not qualify for hedge accounting and is adjusted to fair value through earnings each period, using the period-end LME or COMEX copper forward prices and the adjusted London gold prices, until the date of final pricing. Similarly, FCX purchases copper under contracts that provide for provisional pricing. Mark-to-market price fluctuations from these embedded derivatives are recorded through the settlement date and are reflected in revenues for sales contracts and in inventory for purchase contracts.
A summary of FCX’s embedded derivatives at March 31, 2022, follows:
| Open Positions | Average Price Per Unit | Maturities Through | |||||||||||||||||||||
| Contract | Market | ||||||||||||||||||||||
| Embedded derivatives in provisional sales contracts: | |||||||||||||||||||||||
| Copper (millions of pounds) | $ | $ | August 2022 | ||||||||||||||||||||
| Gold (thousands of ounces) | June 2022 | ||||||||||||||||||||||
| Embedded derivatives in provisional purchase contracts: | |||||||||||||||||||||||
| Copper (millions of pounds) | July 2022 | ||||||||||||||||||||||
11
Copper Forward Contracts. Atlantic Copper, FCX’s wholly owned smelting and refining unit in Spain, enters into copper forward contracts designed to hedge its copper price risk whenever its physical purchases and sales pricing periods do not match. These economic hedge transactions are intended to hedge against changes in copper prices, with the mark-to-market hedging gains or losses recorded in production and delivery costs. At March 31, 2022, Atlantic Copper held net copper forward purchase contracts for 4 million pounds at an average contract price of $4.60 per pound, with maturities through May 2022.
Summary of Gains (Losses). A summary of the realized and unrealized gains (losses) recognized in operating income for commodity contracts that do not qualify as hedge transactions, including embedded derivatives, follows (in millions):
| Three Months Ended | |||||||||||
| March 31, | |||||||||||
| 2022 | 2021 | ||||||||||
Embedded derivatives in provisional sales contracts:a | |||||||||||
| Copper | $ | $ | |||||||||
| Gold and other metals | ( | ||||||||||
Copper forward contractsb | ( | ||||||||||
a.Amounts recorded in revenues.
b.Amounts recorded in cost of sales as production and delivery costs.
Unsettled Derivative Financial Instruments
A summary of the fair values of unsettled commodity derivative financial instruments follows (in millions):
| March 31, 2022 | December 31, 2021 | |||||||||||||
| Commodity Derivative Assets: | ||||||||||||||
Derivatives designated as hedging instruments: | ||||||||||||||
| Copper futures and swap contracts | $ | $ | ||||||||||||
Derivatives not designated as hedging instruments: | ||||||||||||||
| Embedded derivatives in provisional sales/purchase contracts | ||||||||||||||
| Copper forward contracts | ||||||||||||||
| Total derivative assets | $ | $ | ||||||||||||
| Commodity Derivative Liabilities: | ||||||||||||||
Derivatives not designated as hedging instruments: | ||||||||||||||
| Embedded derivatives in provisional sales/purchase contracts | $ | $ | ||||||||||||
| Copper forward contracts | ||||||||||||||
| Total derivative liabilities | $ | $ | ||||||||||||
FCX’s commodity contracts have netting arrangements with counterparties with which the right of offset exists, and it is FCX’s policy to generally offset balances by contract on its balance sheet. FCX’s embedded derivatives on provisional sales/purchase contracts are netted with the corresponding outstanding receivable/payable balances.
12
A summary of these unsettled commodity contracts that are offset in the balance sheets follows (in millions):
| Assets | Liabilities | |||||||||||||||||||||||||
| March 31, 2022 | December 31, 2021 | March 31, 2022 | December 31, 2021 | |||||||||||||||||||||||
| Gross amounts recognized: | ||||||||||||||||||||||||||
| Embedded derivatives in provisional | ||||||||||||||||||||||||||
| sales/purchase contracts | $ | $ | $ | $ | ||||||||||||||||||||||
| Copper derivatives | ||||||||||||||||||||||||||
| Less gross amounts of offset: | ||||||||||||||||||||||||||
| Embedded derivatives in provisional | ||||||||||||||||||||||||||
| sales/purchase contracts | ||||||||||||||||||||||||||
| Copper derivatives | ||||||||||||||||||||||||||
| Net amounts presented in balance sheet: | ||||||||||||||||||||||||||
| Embedded derivatives in provisional | ||||||||||||||||||||||||||
| sales/purchase contracts | ||||||||||||||||||||||||||
| Copper derivatives | ||||||||||||||||||||||||||
| $ | $ | $ | $ | |||||||||||||||||||||||
| Balance sheet classification: | ||||||||||||||||||||||||||
| Trade accounts receivable | $ | $ | $ | $ | ||||||||||||||||||||||
| Other current assets | ||||||||||||||||||||||||||
| Other assets | ||||||||||||||||||||||||||
| Accounts payable and accrued liabilities | ||||||||||||||||||||||||||
| $ | $ | $ | $ | |||||||||||||||||||||||
Credit Risk. FCX is exposed to credit loss when financial institutions with which it has entered into derivative transactions (commodity, foreign exchange and interest rate swaps) are unable to pay. To minimize the risk of such losses, FCX uses counterparties that meet certain credit requirements and periodically reviews the creditworthiness of these counterparties. As of March 31, 2022, the maximum amount of credit exposure associated with derivative transactions was $195 million.
Other Financial Instruments. Other financial instruments include cash and cash equivalents, restricted cash, restricted cash equivalents, accounts receivable, investment securities, legally restricted funds, accounts payable and accrued liabilities, accrued income taxes, dividends payable and debt. The carrying value for these financial instruments classified as current assets or liabilities approximates fair value because of their short-term nature and generally negligible credit losses. Refer to Note 7 for the fair values of investment securities, legally restricted funds and debt.
In addition, as of March 31, 2022, FCX has contingent consideration assets related to the sales of certain oil and gas properties (refer to Note 7 for the related fair values).
Cash, Cash Equivalents, Restricted Cash and Restricted Cash Equivalents. The following table provides a reconciliation of total cash, cash equivalents, restricted cash and restricted cash equivalents presented in the consolidated statements of cash flows (in millions):
| March 31, 2022 | December 31, 2021 | |||||||||||||
| Balance sheet components: | ||||||||||||||
Cash and cash equivalentsa | $ | $ | ||||||||||||
| Restricted cash and restricted cash equivalents included in: | ||||||||||||||
| Other current assets | ||||||||||||||
| Other assets | ||||||||||||||
| Total cash, cash equivalents, restricted cash and restricted cash equivalents presented in the consolidated statements of cash flows | $ | $ | ||||||||||||
a.Includes time deposits of $0.2 billion at each of March 31, 2022, and December 31, 2021.
13
NOTE 7. FAIR VALUE MEASUREMENT
Fair value accounting guidance includes a hierarchy that prioritizes the inputs to valuation techniques used to measure fair value. The hierarchy gives the highest priority to unadjusted quoted prices in active markets for identical assets or liabilities (Level 1) and the lowest priority to unobservable inputs (Level 3). FCX did not have any significant transfers in or out of Level 3 during first-quarter 2022.
FCX’s financial instruments are recorded on the consolidated balance sheets at fair value except for contingent consideration associated with the sale of the Deepwater Gulf of Mexico (GOM) oil and gas properties (which was recorded under the loss recovery approach) and debt. A summary of the carrying amount and fair value of FCX’s financial instruments (including those measured at net asset value (NAV) as a practical expedient), other than cash and cash equivalents, restricted cash, restricted cash equivalents, accounts receivable, accounts payable and accrued liabilities, accrued income taxes and dividends payable (refer to Note 6) follows (in millions):
| At March 31, 2022 | |||||||||||||||||||||||||||||||||||
| Carrying | Fair Value | ||||||||||||||||||||||||||||||||||
| Amount | Total | NAV | Level 1 | Level 2 | Level 3 | ||||||||||||||||||||||||||||||
| Assets | |||||||||||||||||||||||||||||||||||
Investment securities:a,b | |||||||||||||||||||||||||||||||||||
| Equity securities | $ | $ | $ | $ | $ | $ | |||||||||||||||||||||||||||||
| U.S. core fixed income fund | |||||||||||||||||||||||||||||||||||
| Total | |||||||||||||||||||||||||||||||||||
Legally restricted funds:a | |||||||||||||||||||||||||||||||||||
| U.S. core fixed income fund | |||||||||||||||||||||||||||||||||||
| Government bonds and notes | |||||||||||||||||||||||||||||||||||
| Corporate bonds | |||||||||||||||||||||||||||||||||||
| Government mortgage-backed securities | |||||||||||||||||||||||||||||||||||
| Asset-backed securities | |||||||||||||||||||||||||||||||||||
| Money market funds | |||||||||||||||||||||||||||||||||||
| Collateralized mortgage-backed securities | |||||||||||||||||||||||||||||||||||
| Total | |||||||||||||||||||||||||||||||||||
| Derivatives: | |||||||||||||||||||||||||||||||||||
Embedded derivatives in provisional sales/purchase contracts in a gross asset positionc | |||||||||||||||||||||||||||||||||||
Copper futures and swap contractsc | |||||||||||||||||||||||||||||||||||
Copper forward contractsc | |||||||||||||||||||||||||||||||||||
| Total | |||||||||||||||||||||||||||||||||||
| Contingent consideration for the sale of the | |||||||||||||||||||||||||||||||||||
Deepwater GOM oil and gas propertiesa | |||||||||||||||||||||||||||||||||||
| Liabilities | |||||||||||||||||||||||||||||||||||
Derivatives:c | |||||||||||||||||||||||||||||||||||
| Embedded derivatives in provisional sales/purchase contracts in a gross liability position | |||||||||||||||||||||||||||||||||||
| Copper forward contracts | |||||||||||||||||||||||||||||||||||
| Total | |||||||||||||||||||||||||||||||||||
Long-term debt, including current portiond | |||||||||||||||||||||||||||||||||||
14
| At December 31, 2021 | |||||||||||||||||||||||||||||||||||
| Carrying | Fair Value | ||||||||||||||||||||||||||||||||||
| Amount | Total | NAV | Level 1 | Level 2 | Level 3 | ||||||||||||||||||||||||||||||
| Assets | |||||||||||||||||||||||||||||||||||
Investment securities:a,b | |||||||||||||||||||||||||||||||||||
| Equity securities | $ | $ | $ | $ | $ | $ | |||||||||||||||||||||||||||||
| U.S. core fixed income fund | |||||||||||||||||||||||||||||||||||
| Total | |||||||||||||||||||||||||||||||||||
Legally restricted funds:a | |||||||||||||||||||||||||||||||||||
| U.S. core fixed income fund | |||||||||||||||||||||||||||||||||||
| Government bonds and notes | |||||||||||||||||||||||||||||||||||
| Corporate bonds | |||||||||||||||||||||||||||||||||||
| Government mortgage-backed securities | |||||||||||||||||||||||||||||||||||
| Asset-backed securities | |||||||||||||||||||||||||||||||||||
| Money market funds | |||||||||||||||||||||||||||||||||||
| Municipal bonds | |||||||||||||||||||||||||||||||||||
| Total | |||||||||||||||||||||||||||||||||||
| Derivatives: | |||||||||||||||||||||||||||||||||||
Embedded derivatives in provisional sales/purchase contracts in a gross asset positionc | |||||||||||||||||||||||||||||||||||
Copper futures and swap contractsc | |||||||||||||||||||||||||||||||||||
Copper forward contractsc | |||||||||||||||||||||||||||||||||||
| Total | |||||||||||||||||||||||||||||||||||
| Contingent consideration for the sale of the | |||||||||||||||||||||||||||||||||||
Deepwater GOM oil and gas propertiesa | |||||||||||||||||||||||||||||||||||
| Liabilities | |||||||||||||||||||||||||||||||||||
Derivatives:c | |||||||||||||||||||||||||||||||||||
| Embedded derivatives in provisional sales/purchase contracts in a gross liability position | |||||||||||||||||||||||||||||||||||
| Copper forward contracts | |||||||||||||||||||||||||||||||||||
| Total | |||||||||||||||||||||||||||||||||||
Long-term debt, including current portiond | |||||||||||||||||||||||||||||||||||
a.Current portion included in other current assets and long-term portion included in other assets.
b.Excludes time deposits (which approximated fair value) included in (i) other current assets of $117 million at March 31, 2022, and $114 million at December 31, 2021, and (ii) other assets of $133 million at March 31, 2022, and $132 million at December 31, 2021, primarily associated with an assurance bond to support PT-FI’s commitment for additional domestic smelter development in Indonesia and PT-FI’s closure and reclamation guarantees.
c.Refer to Note 6 for further discussion and balance sheet classifications.
d.Recorded at cost except for debt assumed in acquisitions, which are recorded at fair value at the respective acquisition dates.
Valuation Techniques. Equity securities are valued at the closing price reported on the active market on which the individual securities are traded and, as such, are classified within Level 1 of the fair value hierarchy.
The U.S. core fixed income fund is valued at NAV. The fund strategy seeks total return consisting of income and capital appreciation primarily by investing in a broad range of investment-grade debt securities, including U.S. government obligations, corporate bonds, mortgage-backed securities, asset-backed securities and money market instruments. There are no restrictions on redemptions (which are usually within one business day of notice).
Fixed income securities (government securities, corporate bonds, asset-backed securities, collateralized mortgage-backed securities and municipal bonds) are valued using a bid-evaluation price or a mid-evaluation price. These evaluations are based on quoted prices, if available, or models that use observable inputs and, as such, are classified within Level 2 of the fair value hierarchy.
Money market funds are classified within Level 1 of the fair value hierarchy because they are valued using quoted market prices in active markets.
15
FCX’s embedded derivatives on provisional copper concentrate, copper cathode and gold purchases and sales are valued using quoted monthly LME or COMEX copper forward prices and the adjusted London gold prices at each reporting date based on the month of maturity (refer to Note 6 for further discussion); however, FCX’s contracts themselves are not traded on an exchange. As a result, these derivatives are classified within Level 2 of the fair value hierarchy.
FCX’s derivative financial instruments for copper futures and swap contracts and copper forward contracts that are traded on the respective exchanges are classified within Level 1 of the fair value hierarchy because they are valued using quoted monthly COMEX or LME prices at each reporting date based on the month of maturity (refer to Note 6 for further discussion). Certain of these contracts are traded on the over-the-counter market and are classified within Level 2 of the fair value hierarchy based on COMEX and LME forward prices.
In December 2016, FCX’s sale of its Deepwater GOM oil and gas properties included up to $150 million in contingent consideration that was recorded at the total amount under the loss recovery approach. The contingent consideration is being received over time as cash flows are realized from a third-party production handling agreement for an offshore platform, with the related payments commencing in third-quarter 2018. The contingent consideration included in (i) other current assets totaled $20 64 million at March 31, 2022, and $70 million at December 31, 2021. The fair value of this contingent consideration was calculated based on a discounted cash flow model using inputs that include third-party estimates for reserves, production rates and production timing, and discount rates. Because significant inputs are not observable in the market, the contingent consideration is classified within Level 3 of the fair value hierarchy.
Long-term debt, including current portion, is primarily valued using available market quotes and, as such, is classified within Level 2 of the fair value hierarchy.
The techniques described above may produce a fair value that may not be indicative of net realizable value or reflective of future fair values. Furthermore, while FCX believes its valuation techniques are appropriate and consistent with other market participants, the use of different techniques or assumptions to determine fair value of certain financial instruments could result in a different fair value measurement at the reporting date. There have been no changes in the techniques used at March 31, 2022, as compared with those techniques used at December 31, 2021.
A summary of the changes in the fair value of FCX’s Level 3 instrument, contingent consideration for the sale of the Deepwater GOM oil and gas properties, during the first three months of 2022 follows (in millions):
| Fair value at January 1, 2022 | $ | |||||||
| Net unrealized loss related to assets still held at the end of the period | ( | |||||||
Settlements | ( | |||||||
| Fair value at March 31, 2022 | $ | |||||||
NOTE 8. CONTINGENCIES AND COMMITMENTS
Asset Retirement Obligations (ARO)
Arizona Environmental and Reclamation Programs. FCX’s Arizona operations are subject to regulatory oversight by the Arizona Department of Environmental Quality (ADEQ). ADEQ has adopted regulations for its aquifer protection permit (APP) program that require permits for, among other things, certain facilities, activities and structures used for mining, leaching, concentrating and smelting, and require compliance with aquifer water quality standards during operations and closure. An application for an APP requires a proposed closure strategy that will meet applicable groundwater protection requirements following cessation of operations and an estimate of the implementation cost, with a more detailed closure plan required at the time operations cease. A permit applicant must demonstrate its financial ability to meet the closure costs approved by ADEQ. Closure costs for facilities covered by APPs are required to be updated every six years and financial assurance mechanisms are required to be updated every two years . During first-quarter 2022, Bagdad increased its ARO liability and asset retirement cost asset by $45 million associated with an updated closure strategy that Bagdad submitted to ADEQ for approval. Morenci is also preparing an update to its closure strategy for submission to ADEQ, which is expected to result in increased costs that could be significant. FCX will continue updating its closure strategy and closure cost estimates at other Arizona sites, and any such updates may also result in increased costs that could be significant.
16
Litigation
There were no significant updates to previously reported legal proceedings included in Note 12 of FCX’s 2021 Form 10-K.
Other Matters
Smelter Development Progress. On January 7, 2021, the Indonesia government levied an administrative fine of $149 million for the period from March 30, 2020, through September 30, 2020, on PT-FI for failing to achieve physical development progress on its greenfield smelter as of July 31, 2020. On January 13, 2021, PT-FI responded to the Indonesia government objecting to the fine because of events outside of its control causing a delay of the greenfield smelter’s development progress. PT-FI believes that its communications during 2020 with the Indonesia government were not properly considered before the administrative fine was levied.
In June 2021, the Indonesia government issued a ministerial decree for the calculation of an administrative fine for lack of smelter development in light of the COVID-19 pandemic. During 2021, PT-FI recorded charges totaling $16 million for a potential settlement of the administrative fine. On January 25, 2022, the Indonesia government submitted a new estimate of the administrative fine totaling $57 million. In March 2022, PT-FI paid the administrative fine and recorded a charge of $41 million in first-quarter 2022. Based on PT-FI’s revised smelter construction schedule, PT-FI does not believe any additional fines should be applied and will dispute any attempts by the Indonesia government to levy additional fines, which could be significant.
NOTE 9. BUSINESS SEGMENTS
FCX has organized its mining operations into four primary divisions – North America copper mines, South America mining, Indonesia mining and Molybdenum mines – and operating segments that meet certain thresholds are reportable segments. Separately disclosed in the following tables are FCX’s reportable segments, which include the Morenci and Cerro Verde copper mines, the Grasberg minerals district (Indonesia Mining), the Rod & Refining operations and Atlantic Copper Smelting & Refining.
Intersegment sales between FCX’s business segments are based on terms similar to arms-length transactions with third parties at the time of the sale. Intersegment sales may not be reflective of the actual prices ultimately realized because of a variety of factors, including additional processing, timing of sales to unaffiliated customers and transportation premiums.
FCX defers recognizing profits on sales from its mines to other segments, including Atlantic Copper Smelting & Refining, and on 39.5 percent of PT-FI’s sales to PT Smelting, until final sales to third parties occur. Quarterly variations in ore grades, the timing of intercompany shipments and changes in product prices result in variability in FCX’s net deferred profits and quarterly earnings.
FCX allocates certain operating costs, expenses and capital expenditures to its operating divisions and individual segments. However, not all costs and expenses applicable to an operation are allocated. U.S. federal and state income taxes are recorded and managed at the corporate level (included in Corporate, Other & Eliminations), whereas foreign income taxes are recorded and managed at the applicable country level. In addition, most mining exploration and research activities are managed on a consolidated basis, and those costs, along with some selling, general and administrative costs, are not allocated to the operating divisions or individual segments. Accordingly, the following Financial Information by Business Segment reflects management determinations that may not be indicative of what the actual financial performance of each operating division or segment would be if it was an independent entity.
17
Product Revenues. FCX’s revenues attributable to the products it sold for the first quarters of 2022 and 2021 follow (in millions):
| Three Months Ended | ||||||||||||||
| March 31, | ||||||||||||||
| 2022 | 2021 | |||||||||||||
| Copper: | ||||||||||||||
| Concentrate | $ | $ | ||||||||||||
| Cathode | ||||||||||||||
| Rod and other refined copper products | ||||||||||||||
Purchased coppera | ||||||||||||||
| Gold | ||||||||||||||
| Molybdenum | ||||||||||||||
| Other | ||||||||||||||
| Adjustments to revenues: | ||||||||||||||
| Treatment charges | ( | ( | ||||||||||||
Royalty expenseb | ( | ( | ||||||||||||
Export dutiesc | ( | ( | ||||||||||||
| Revenues from contracts with customers | ||||||||||||||
Embedded derivativesd | ||||||||||||||
| Total consolidated revenues | $ | $ | ||||||||||||
a.FCX purchases copper cathode primarily for processing by its Rod & Refining operations.
b.Reflects royalties on sales from PT-FI and Cerro Verde that will vary with the volume of metal sold and prices.
c.Reflects PT-FI export duties, including a first-quarter 2022 charge of $18 million associated with an adjustment to prior-period export duties.
d.Refer to Note 6 for discussion of embedded derivatives related to FCX’s provisionally priced concentrate and cathode sales contracts.
18
Financial Information by Business Segment
| (In millions) | |||||||||||||||||||||||||||||||||||||||||||||||||||||||||||||||||||||||
| Atlantic | Corporate, | ||||||||||||||||||||||||||||||||||||||||||||||||||||||||||||||||||||||
| North America Copper Mines | South America Mining | Copper | Other | ||||||||||||||||||||||||||||||||||||||||||||||||||||||||||||||||||||
| Cerro | Indonesia | Molybdenum | Rod & | Smelting | & Elimi- | FCX | |||||||||||||||||||||||||||||||||||||||||||||||||||||||||||||||||
| Morenci | Other | Total | Verde | Other | Total | Mining | Mines | Refining | & Refining | nations | Total | ||||||||||||||||||||||||||||||||||||||||||||||||||||||||||||
| Three Months Ended March 31, 2022 | |||||||||||||||||||||||||||||||||||||||||||||||||||||||||||||||||||||||
| Revenues: | |||||||||||||||||||||||||||||||||||||||||||||||||||||||||||||||||||||||
| Unaffiliated customers | $ | $ | $ | $ | $ | $ | $ | a | $ | $ | $ | $ | b | $ | |||||||||||||||||||||||||||||||||||||||||||||||||||||||||
| Intersegment | ( | ||||||||||||||||||||||||||||||||||||||||||||||||||||||||||||||||||||||
| Production and delivery | ( | ||||||||||||||||||||||||||||||||||||||||||||||||||||||||||||||||||||||
Depreciation, depletion and amortization | |||||||||||||||||||||||||||||||||||||||||||||||||||||||||||||||||||||||
Selling, general and administrative expenses | |||||||||||||||||||||||||||||||||||||||||||||||||||||||||||||||||||||||
| Mining exploration and research expenses | |||||||||||||||||||||||||||||||||||||||||||||||||||||||||||||||||||||||
Environmental obligations and shutdown costs | |||||||||||||||||||||||||||||||||||||||||||||||||||||||||||||||||||||||
| Operating income (loss) | ( | ( | ( | ||||||||||||||||||||||||||||||||||||||||||||||||||||||||||||||||||||
| Interest expense, net | |||||||||||||||||||||||||||||||||||||||||||||||||||||||||||||||||||||||
| Provision for (benefit from) income taxes | ( | ||||||||||||||||||||||||||||||||||||||||||||||||||||||||||||||||||||||
| Total assets at March 31, 2022 | |||||||||||||||||||||||||||||||||||||||||||||||||||||||||||||||||||||||
| Capital expenditures | c | ||||||||||||||||||||||||||||||||||||||||||||||||||||||||||||||||||||||
| Three Months Ended March 31, 2021 | |||||||||||||||||||||||||||||||||||||||||||||||||||||||||||||||||||||||
| Revenues: | |||||||||||||||||||||||||||||||||||||||||||||||||||||||||||||||||||||||
| Unaffiliated customers | $ | $ | $ | $ | $ | $ | $ | a | $ | $ | $ | $ | b | $ | |||||||||||||||||||||||||||||||||||||||||||||||||||||||||
| Intersegment | ( | ||||||||||||||||||||||||||||||||||||||||||||||||||||||||||||||||||||||
| Production and delivery | ( | d | |||||||||||||||||||||||||||||||||||||||||||||||||||||||||||||||||||||
Depreciation, depletion and amortization | |||||||||||||||||||||||||||||||||||||||||||||||||||||||||||||||||||||||
Selling, general and administrative expenses | |||||||||||||||||||||||||||||||||||||||||||||||||||||||||||||||||||||||
| Mining exploration and research expenses | |||||||||||||||||||||||||||||||||||||||||||||||||||||||||||||||||||||||
Environmental obligations and shutdown costs | |||||||||||||||||||||||||||||||||||||||||||||||||||||||||||||||||||||||
| Operating income (loss) | ( | ( | ( | ||||||||||||||||||||||||||||||||||||||||||||||||||||||||||||||||||||
| Interest expense, net | |||||||||||||||||||||||||||||||||||||||||||||||||||||||||||||||||||||||
| Provision for (benefit from) income taxes | ( | ||||||||||||||||||||||||||||||||||||||||||||||||||||||||||||||||||||||
| Total assets at March 31, 2021 | |||||||||||||||||||||||||||||||||||||||||||||||||||||||||||||||||||||||
| Capital expenditures | c | ||||||||||||||||||||||||||||||||||||||||||||||||||||||||||||||||||||||
a.Includes PT-FI's sales to PT Smelting totaling $917 million in first-quarter 2022 and $792 million in first-quarter 2021.
b.Includes revenues from FCX's molybdenum sales company, which includes sales of molybdenum produced by the Molybdenum mines and by certain of the North America and South America copper mines.
c.Includes capital expenditures for the greenfield smelter and PMR.
d.Includes charges associated with the major maintenance turnaround at the Miami Smelter totaling $68 million.
19
REPORT OF INDEPENDENT REGISTERED PUBLIC ACCOUNTING FIRM
To the Board of Directors and Stockholders of
Freeport-McMoRan Inc.
Results of Review of Interim Financial Statements
We have reviewed the accompanying consolidated balance sheet of Freeport-McMoRan Inc. (the Company) as of March 31, 2022, the related consolidated statements of income, comprehensive income, equity and cash flows for the three-month periods ended March 31, 2022 and 2021, and the related notes (collectively referred to as the “consolidated interim financial statements”). Based on our reviews, we are not aware of any material modifications that should be made to the consolidated interim financial statements for them to be in conformity with U.S. generally accepted accounting principles.
We have previously audited, in accordance with the standards of the Public Company Accounting Oversight Board (United States) (PCAOB), the consolidated balance sheet of the Company as of December 31, 2021, the related consolidated statements of operations, comprehensive income (loss), equity and cash flows for the year then ended, and the related notes (not presented herein); and in our report dated February 15, 2022, we expressed an unqualified audit opinion on those consolidated financial statements. In our opinion, the information set forth in the accompanying consolidated balance sheet as of December 31, 2021, is fairly stated, in all material respects, in relation to the consolidated balance sheet from which it has been derived.
Basis for Review Results
These financial statements are the responsibility of the Company's management. We are a public accounting firm registered with the PCAOB and are required to be independent with respect to the Company in accordance with the U.S. federal securities laws and the applicable rules and regulations of the Securities and Exchange Commission and the PCAOB. We conducted our review in accordance with the standards of the PCAOB. A review of interim financial statements consists principally of applying analytical procedures and making inquiries of persons responsible for financial and accounting matters. It is substantially less in scope than an audit conducted in accordance with the standards of the PCAOB, the objective of which is the expression of an opinion regarding the financial statements taken as a whole. Accordingly, we do not express such an opinion.
/s/ Ernst & Young LLP
Phoenix, Arizona
May 5, 2022
20
Item 2.Management’s Discussion and Analysis of Financial Condition and Results of Operations.
In Management’s Discussion and Analysis of Financial Condition and Results of Operations (MD&A), “we,” “us” and “our” refer to Freeport-McMoRan Inc. (FCX) and its consolidated subsidiaries. You should read this discussion in conjunction with our consolidated financial statements, the related MD&A and the discussion of our Business and Properties in our annual report on Form 10-K for the year ended December 31, 2021 (2021 Form 10-K), filed with the United States (U.S.) Securities and Exchange Commission (SEC). The results of operations reported and summarized below are not necessarily indicative of future operating results (refer to “Cautionary Statement” for further discussion). References to “Notes” are Notes included in our Notes to Consolidated Financial Statements (Unaudited). Throughout MD&A, all references to income or losses per share are on a diluted basis.
OVERVIEW
We are a leading international mining company with headquarters in Phoenix, Arizona. We operate large, long-lived, geographically diverse assets with significant proven and probable mineral reserves of copper, gold and molybdenum. We are one of the world’s largest publicly traded copper producers. Our portfolio of assets includes the Grasberg minerals district in Indonesia, one of the world’s largest copper and gold deposits; and significant mining operations in North America and South America, including the large-scale Morenci minerals district in Arizona and the Cerro Verde operation in Peru.
Our results for first-quarter 2022 reflect strong operating and financial performance, cash flow generation and cash returns to shareholders. We remain focused on cost and capital management and are advancing our sustainability objectives. We achieved a 24 percent increase in copper sales and a 59 percent increase in gold sales, compared to first-quarter 2021. We plan to continue to execute our operating plans, which we expect will provide strong cash flows to support advancement of organic growth initiatives and continued cash returns to shareholders under our established financial policy, based on a favorable operational and market outlook.
As further discussed in “Operations,” first-quarter 2022 highlights include:
•Continued growth in operating rates at Lone Star toward achieving production of 300 million pounds of copper per year from oxide ores (compared with the initial design capacity of 200 million pounds per year).
•Strong performance from Cerro Verde's concentrator facilities, with milling rates averaging 394,400 metric tons of ore per day. Subject to ongoing monitoring of COVID-19 protocols, milling rates are currently expected to average approximately 400,000 metric tons of ore per day for the remainder of 2022.
•Increased milling rates from the underground mines at the Grasberg minerals district, which averaged 186,500 metric tons of ore per day, a 50 percent increase from milling rates in first-quarter 2021. Milling rates at the Grasberg minerals district are expected to average approximately 180,000 to 190,000 metric tons of ore per day for the remainder of 2022.
Net income attributable to common stock totaled $1.5 billion in first-quarter 2022, compared with $0.7 billion in first-quarter 2021, primarily reflecting higher copper and gold sales volumes and prices, partly offset by a higher provision for income taxes and increased energy and other input costs. Refer to “Consolidated Results” for further discussion.
At March 31, 2022, we had consolidated debt of $9.6 billion and consolidated cash and cash equivalents of $8.3 billion, resulting in net debt of $1.3 billion (including $0.6 billion of net debt for the Indonesia smelter projects). Refer to “Net Debt” for reconciliations of consolidated debt and consolidated cash and cash equivalents to net debt.
At March 31, 2022, we had no borrowings and $3.5 billion available under our revolving credit facility. At March 31, 2022, we had $1.4 billion of current debt, including $995 million of senior notes maturing in March 2023 (with redemption rights at par in December 2022) and $325 million under Cerro Verde’s Term Loan maturing in June 2022.
In April 2022, PT Freeport Indonesia (PT-FI) completed the sale of $3.0 billion of senior notes primarily in connection with its financing plans for construction of additional domestic smelting capacity.
In first-quarter 2022, we acquired 12.3 million shares of our common stock under the share repurchase program for a total cost of $541 million ($44.02 average cost per share). Through May 5, 2022, we acquired 28.7 million shares
21
of our common stock for a total cost of $1.2 billion ($41.64 average cost per share) and $1.8 billion remains available under the share repurchase program.
Refer to Note 5 and “Capital Resources and Liquidity” for further discussion.
OUTLOOK
We continue to view the long-term outlook for our business positively, supported by limitations on supplies of copper and the requirements for copper in the world’s economy. Our financial results vary as a result of fluctuations in market prices primarily for copper, gold and, to a lesser extent, molybdenum, as well as other factors. World market prices for these commodities have fluctuated historically and are affected by numerous factors beyond our control. Refer to “Markets” below and “Risk Factors” in Part I, Item 1A. of our 2021 Form 10-K for further discussion. Because we cannot control the prices of our products, the key measures that management focuses on in operating our business are sales volumes, unit net cash costs, operating cash flows and capital expenditures.
Consolidated Sales Volumes
Following are our projected consolidated sales volumes for the year 2022:
Copper (millions of recoverable pounds): | ||||||||
| North America copper mines | 1,536 | |||||||
| South America mining | 1,154 | |||||||
| Indonesia mining | 1,564 | |||||||
| Total | 4,254 | |||||||
Gold (millions of recoverable ounces) | 1.6 | |||||||
Molybdenum (millions of recoverable pounds) | 80 | a | ||||||
a.Projected molybdenum sales include 30 million pounds produced by our Molybdenum mines and 50 million pounds produced by our North America and South America copper mines.
Consolidated sales volumes in second-quarter 2022 are expected to approximate 1.0 billion pounds of copper, 405 thousand ounces of gold and 21 million pounds of molybdenum. Projected sales volumes are dependent on operational performance, weather-related conditions, timing of shipments, and other factors detailed in the “Cautionary Statement” below.
For other important factors that could cause results to differ materially from projections, refer to “Risk Factors” contained in Part I, Item 1A. of our 2021 Form 10-K.
Consolidated Unit Net Cash Costs
Assuming average prices of $1,950 per ounce of gold and $19.00 per pound of molybdenum for the remainder of 2022 and achievement of current sales volume and cost estimates, consolidated unit net cash costs (net of by-product credits) for our copper mines are expected to average $1.44 per pound of copper for the year 2022 (including $1.41 per pound of copper in second-quarter 2022). The increase from the January 2022 estimate of $1.35 per pound of copper primarily reflects higher costs of energy and other consumables and currency exchange rates in South America, partly offset by higher gold volumes and commodity price assumptions. We are experiencing significant cost inflation, principally associated with energy (which represents about 20 percent of our site operating costs) and other consumables such as sulfuric acid, explosives and steel. Russia’s invasion of Ukraine has placed additional pressure on an already challenging global supply chain environment. The impact of price changes during the remainder of 2022 on consolidated unit net cash costs for the year 2022 would approximate $0.03 per pound of copper for each $100 per ounce change in the average price of gold and $0.02 per pound of copper for each $2.00 per pound change in the average price of molybdenum. Quarterly unit net cash costs vary with fluctuations in sales volumes and realized prices, primarily for gold and molybdenum.
22
Consolidated Operating Cash Flows
Our consolidated operating cash flows vary with sales volumes; prices realized from copper, gold and molybdenum sales; production costs; income taxes; other working capital changes; and other factors. Based on current sales volume and cost estimates, and assuming average prices of $4.75 per pound for copper, $1,950 per ounce for gold, and $19.00 per pound for molybdenum for the remainder of 2022, our consolidated operating cash flows are estimated to approximate $8.6 billion (net of $0.9 billion of working capital and other uses) for the year 2022. Estimated consolidated operating cash flows for the year 2022 also reflect an estimated income tax provision of $3.4 billion (refer to “Consolidated Results – Income Taxes” for further discussion of our projected income tax rate for the year 2022). The impact of price changes for the remainder of 2022 on operating cash flows would approximate $300 million for each $0.10 per pound change in the average price of copper, $80 million for each $100 per ounce change in the average price of gold and $75 million for each $2.00 per pound change in the average price of molybdenum.
Consolidated Capital Expenditures
Consolidated capital expenditures for the year 2022 are expected to approximate $4.6 billion ($3.2 billion excluding capital expenditures for the greenfield smelter and precious metals refinery (PMR) - collectively, the Indonesia smelter projects), and include $1.9 billion for major mining projects ($1.3 billion for planned projects primarily associated with underground mine development in the Grasberg minerals district and supporting mill and power capital costs and $0.6 billion for discretionary growth projects).
Capital expenditures for the Indonesia smelter projects are expected to approximate $1.4 billion for the year 2022.
Development of additional smelting capacity in Indonesia will result in the elimination of export duties, providing an
offset to the economic cost associated with the Indonesia smelter projects. Capital expenditures for the Indonesia smelter projects are being funded with the net proceeds from PT-FI's unsecured senior notes issued in April 2022 and its available bank credit facilities.
23
MARKETS
World prices for copper, gold and molybdenum can fluctuate significantly. During the period from January 2012 through March 2022, the London Metal Exchange (LME) copper settlement price varied from a low of $1.96 per pound in 2016 to a record high of $4.87 per pound in 2022; the London Bullion Market Association (London) PM gold price fluctuated from a low of $1,049 per ounce in 2015 to a record high of $2,067 per ounce in 2020; and the Metals Week Molybdenum Dealer Oxide weekly average price ranged from a low of $4.46 per pound in 2015 to a high of $20.01 per pound in 2021. Copper, gold and molybdenum prices are affected by numerous factors beyond our control as described further in “Risk Factors” contained in Part I, Item 1A. of our 2021 Form 10-K.
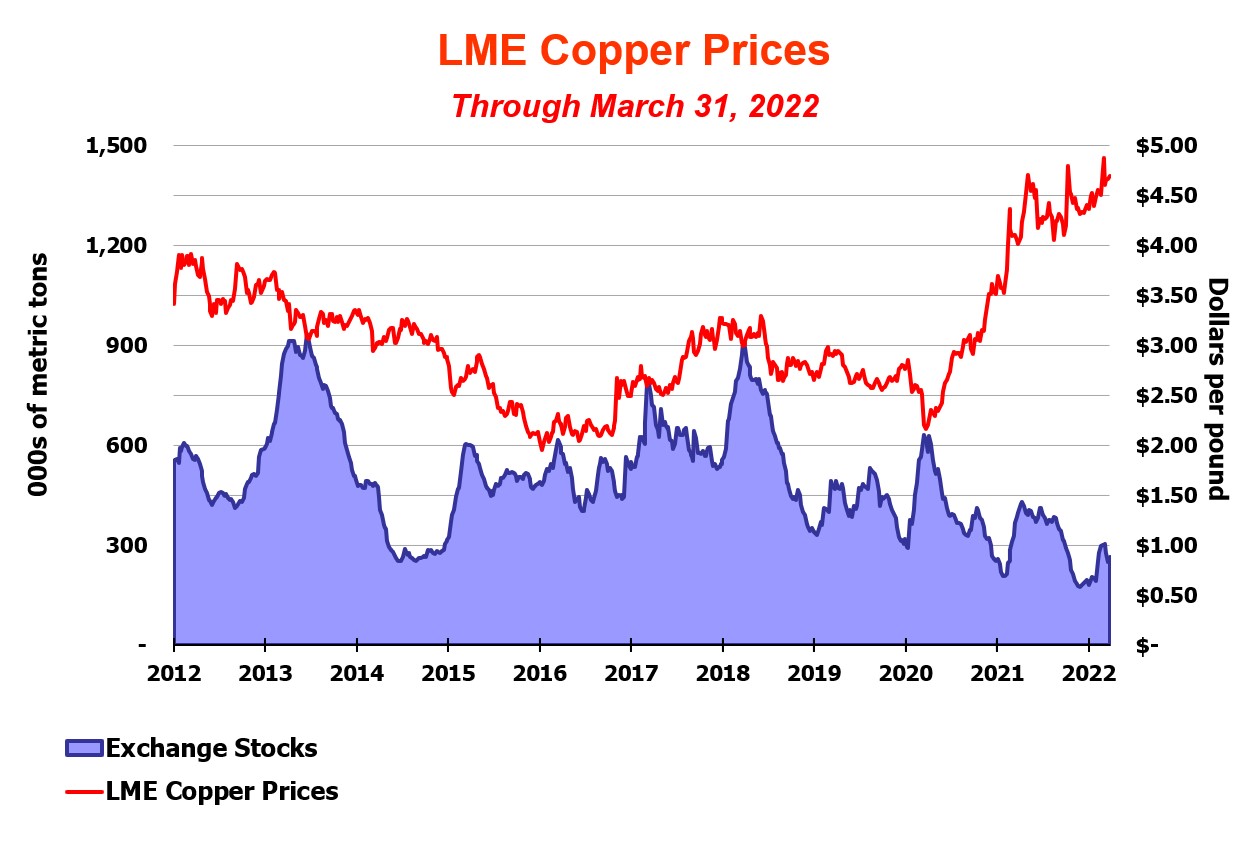
This graph presents LME copper settlement prices and the combined reported stocks of copper at the LME, Commodity Exchange Inc., and the Shanghai Futures Exchange from January 2012 through March 2022. During first-quarter 2022, LME copper settlement prices ranged from a low of $4.34 per pound to a record high of $4.87 per pound, averaged $4.53 per pound and settled at $4.69 per pound on March 31, 2022. Copper prices have been supported by strong demand during the pandemic recovery, rising investor sentiment associated with copper’s prominent role in the global transition to cleaner energy, ongoing supply disruptions and falling inventories. The LME copper settlement price was $4.45 per pound on April 29, 2022.
Long-term fundamentals for copper remain positive. We believe future demand will be supported by copper’s role in the global transition to renewable power, electric vehicles and other carbon-reduction initiatives, and continued urbanization in developing countries. The small number of approved, large-scale projects beyond those expected to commence operations in 2022 and 2023, the long lead times required to permit and build new mines and declining ore grades at existing operations continue to highlight the fundamental supply challenges for copper.
24
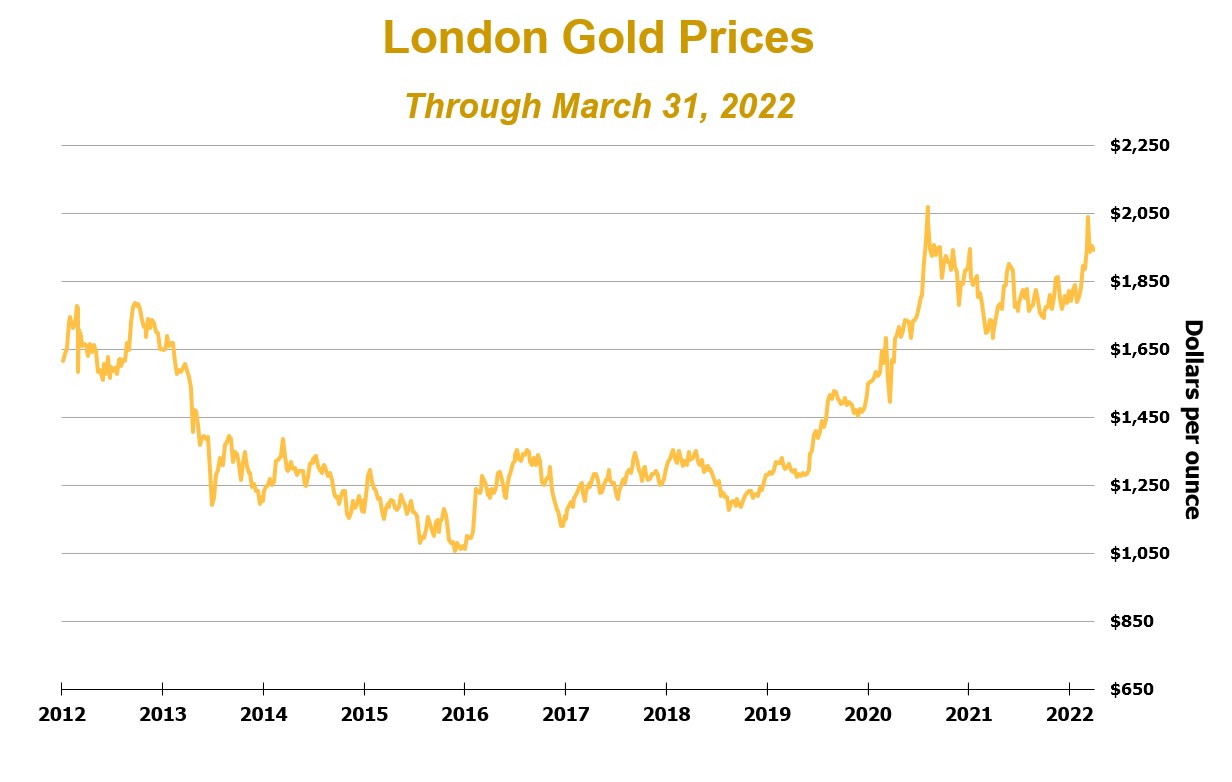
This graph presents London PM gold prices from January 2012 through March 2022. During first-quarter 2022, London PM gold prices ranged from a low of $1,788 per ounce to a high of $2,039 per ounce, averaged $1,877 per ounce, and closed at $1,942 per ounce on March 31, 2022. Many analysts expect future gold prices to be supported by the effects of elevated debt levels associated with large pandemic-related stimulus efforts, historically low U.S. interest rates and a weaker U.S. dollar. The London PM gold price was $1,911 per ounce on April 29, 2022.
25
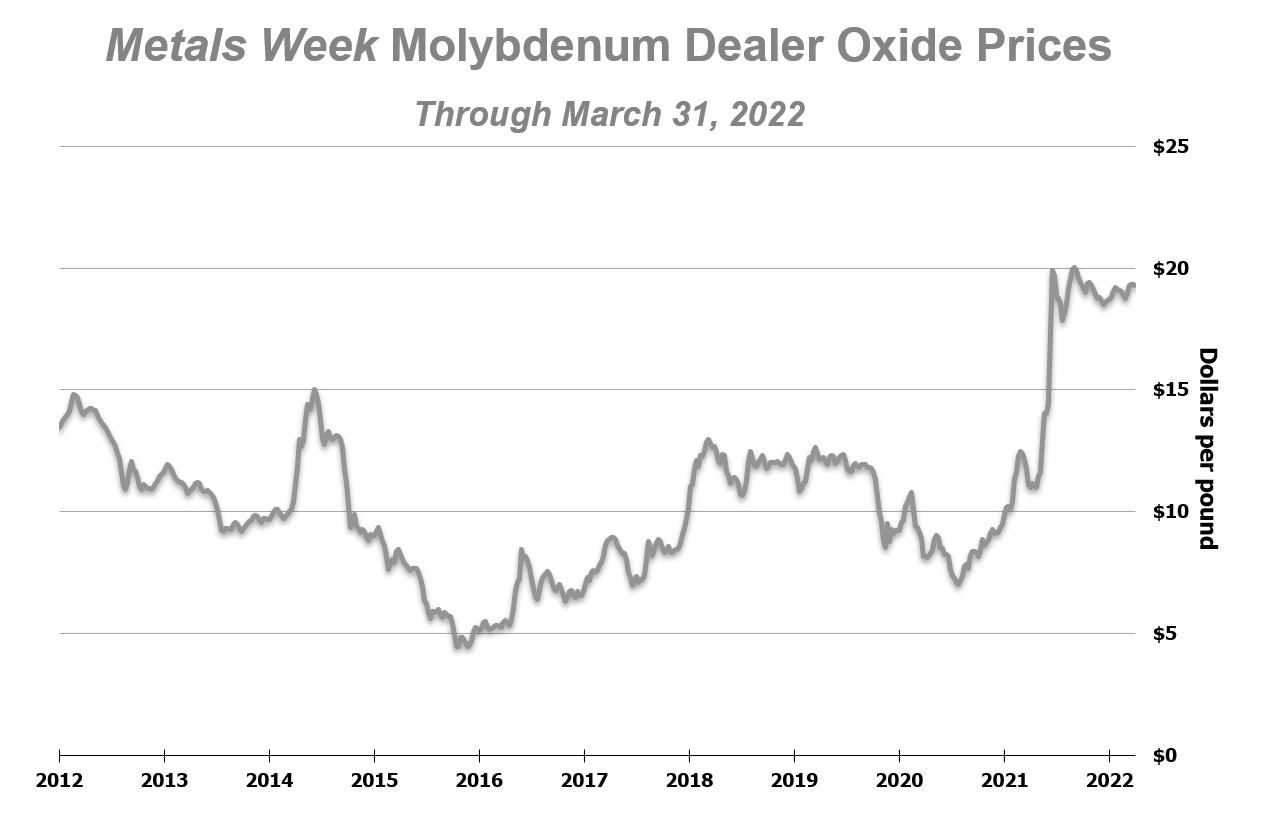
This graph presents the Metals Week Molybdenum Dealer Oxide weekly average price from January 2012 through March 2022. During first-quarter 2022, the weekly average price of molybdenum ranged from a low of $18.74 per pound to a high of $19.33 per pound, averaged $19.08 per pound, and was $19.30 per pound on March 31, 2022. Molybdenum prices continue to be supported by supply constraints and increased demand, as mines in Chile continued to report low production, logistic challenges and geopolitical risk due to Russia’s invasion of Ukraine causing traders to increase inventories. The Metals Week Molybdenum Dealer Oxide weekly average price was $19.22 per pound on April 29, 2022.
26
CONSOLIDATED RESULTS
| Three Months Ended March 31, | ||||||||||||||
| 2022 | 2021 | |||||||||||||
SUMMARY FINANCIAL DATA | (in millions, except per share amounts) | |||||||||||||
Revenuesa,b | $ | 6,603 | $ | 4,850 | ||||||||||
Operating incomea | $ | 2,809 | $ | 1,532 | ||||||||||
Net income attributable to common stockc | $ | 1,527 | d | $ | 718 | e | ||||||||
| Diluted net income per share of common stock | $ | 1.04 | $ | 0.48 | ||||||||||
Diluted weighted-average common shares outstanding | 1,469 | 1,477 | ||||||||||||
Operating cash flowsf | $ | 1,691 | $ | 1,075 | ||||||||||
Capital expenditures | $ | 723 | $ | 370 | ||||||||||
| At March 31: | ||||||||||||||
Cash and cash equivalents | $ | 8,338 | $ | 4,580 | ||||||||||
Total debt, including current portion | $ | 9,621 | $ | 9,809 | ||||||||||
a.Refer to Note 9 for a summary of revenues and operating income by operating division.
b.Includes favorable adjustments to prior period provisionally priced concentrate and cathode copper sales totaling $102 million ($42 million to net income attributable to common stock or $0.03 per share) in first-quarter 2022 and $146 million ($57 million to net income attributable to common stock or $0.04 per share) in first-quarter 2021 (refer to Note 6 for further discussion).
c.We defer recognizing profits on intercompany sales until final sales to third parties occur. Refer to “Operations – Smelting and Refining” for a summary of net impacts from changes in these deferrals.
d.Includes net charges totaling $38 million ($0.03 per share), primarily associated with the settlement of an administrative fine and an adjustment to prior-period export duties at PT-FI. These net charges, before income taxes and noncontrolling interests, were recorded to production and delivery ($43 million) and to revenues ($18 million).
e.Includes net charges totaling $38 million ($0.03 per share), primarily associated with contested matters at PT-FI (including an administrative fine levied by the Indonesia government and historical tax audits), employee separation charges in North America and asset retirement obligation adjustments. These charges, before income taxes and noncontrolling interests, were recorded to production and delivery ($37 million), interest expense, net ($4 million) and other income, net ($5 million), partly offset by credits recorded to environmental obligations and shutdown costs ($3 million).
f.Working capital and other uses totaled $811 million in first-quarter 2022 and $336 million in first-quarter 2021.
| Three Months Ended March 31, | ||||||||||||||
| 2022 | 2021 | |||||||||||||
| SUMMARY OPERATING DATA | ||||||||||||||
Copper (millions of recoverable pounds) | ||||||||||||||
| Production | 1,009 | 910 | ||||||||||||
| Sales, excluding purchases | 1,024 | 825 | ||||||||||||
| Average realized price per pound | $ | 4.66 | $ | 3.94 | ||||||||||
Site production and delivery costs per pounda | $ | 2.03 | $ | 1.86 | ||||||||||
Unit net cash costs per pounda | $ | 1.33 | $ | 1.39 | ||||||||||
Gold (thousands of recoverable ounces) | ||||||||||||||
| Production | 415 | 297 | ||||||||||||
Sales, excluding purchases | 409 | 258 | ||||||||||||
| Average realized price per ounce | $ | 1,920 | $ | 1,713 | ||||||||||
Molybdenum (millions of recoverable pounds) | ||||||||||||||
| Production | 21 | 20 | ||||||||||||
Sales, excluding purchases | 19 | 21 | ||||||||||||
| Average realized price per pound | $ | 19.30 | $ | 11.62 | ||||||||||
a.Reflects per pound weighted-average production and delivery costs and unit net cash costs (net of by-product credits) for all copper mines, before net noncash and other costs. For reconciliations of per pound unit costs (credits) by operating division to production and delivery costs applicable to sales reported in our consolidated financial statements, refer to “Product Revenues and Production Costs.”
27
Revenues
Consolidated revenues totaled $6.6 billion in first-quarter 2022 and $4.9 billion in first-quarter 2021. Revenues from our mining operations primarily include the sale of copper concentrate, copper cathode, copper rod, gold in concentrate and molybdenum. Refer to Note 9 for a summary of product revenues.
Following is a summary of changes in our consolidated revenues between periods (in millions):
| Three Months Ended March 31 | |||||||||||
| Consolidated revenues - 2021 period | $ | 4,850 | |||||||||
| Higher (lower) sales volumes: | |||||||||||
| Copper | 786 | ||||||||||
| Gold | 259 | ||||||||||
| Molybdenum | (16) | ||||||||||
| Higher average realized prices: | |||||||||||
| Copper | 737 | ||||||||||
| Gold | 85 | ||||||||||
| Molybdenum | 149 | ||||||||||
| Adjustments for prior period provisionally priced copper sales | (44) | ||||||||||
| Higher Atlantic Copper revenues | 31 | ||||||||||
| Lower revenues from purchased copper | (148) | ||||||||||
| Higher treatment charges | (36) | ||||||||||
| Higher royalties and export duties | (101) | ||||||||||
| Other, including intercompany eliminations | 51 | ||||||||||
| Consolidated revenues - 2022 period | $ | 6,603 | |||||||||
Sales Volumes. Consolidated copper and gold sales volumes increased in first-quarter 2022, compared with first-quarter 2021, primarily reflecting the ramp-up of underground mining at PT-FI and timing of shipments in North America. Refer to “Operations” for further discussion of sales volumes at our mining operations.
Realized Prices. Our consolidated revenues can vary significantly as a result of fluctuations in the market prices of copper, gold and molybdenum. Average realized prices in first-quarter 2022, compared with first-quarter 2021, were 18 percent higher for copper, 12 percent higher for gold and 66 percent higher for molybdenum.
Average realized copper prices include net favorable adjustments to current period provisionally priced copper sales (i.e., provisionally priced sales at March 31, 2022 and 2021) totaling $116 million in first-quarter 2022 and $61 million in first-quarter 2021. As discussed in Note 6, substantially all of our copper concentrate and cathode sales contracts provide final copper pricing in a specified future month (generally one to four months from the shipment date) based primarily on quoted LME monthly average copper prices. We record revenues and invoice customers at the time of shipment based on then-current LME prices, which results in an embedded derivative on provisionally priced concentrate and cathode sales that is adjusted to fair value through earnings each period, using the period-end forward prices, until final pricing on the date of settlement. To the extent final prices are higher or lower than what was recorded on a provisional basis, an increase or decrease to revenues is recorded each reporting period until the date of final pricing. Accordingly, in times of rising copper prices, our revenues benefit from adjustments to the final pricing of provisionally priced sales pursuant to contracts entered into in prior periods; in times of falling copper prices, the opposite occurs.
Prior Period Provisionally Priced Copper Sales. Net favorable adjustments to prior periods’ provisionally priced copper sales (i.e., provisionally priced sales at December 31, 2021 and 2020) recorded in consolidated revenues totaled $102 million in first-quarter 2022 and $146 million in first-quarter 2021. Refer to Notes 6 and 9 for a summary of total adjustments to prior period and current period provisionally priced sales.
At March 31, 2022, we had provisionally priced copper sales totaling 473 million pounds of copper (net of intercompany sales and noncontrolling interests) recorded at an average of $4.71 per pound, subject to final pricing over the next several months. We estimate that each $0.05 change in the price realized from the March 31, 2022, provisional price recorded would have an approximate $15 million effect on our 2022 net income attributable to common stock. Copper prices have declined from March 31, 2022, the LME copper settlement price averaged $4.62 per pound in April 2022 and approximated $4.30 per pound on May 4, 2022.
28
Atlantic Copper Revenues. Atlantic Copper revenues totaled $718 million in first-quarter 2022, compared with $687 million in first-quarter 2021. Higher revenues in first-quarter 2022, compared with first-quarter 2021, primarily reflect higher copper prices.
Purchased Copper. We purchase copper cathode primarily for processing by our Rod & Refining operations. The volumes of copper purchases vary depending on cathode production from our operations and totaled 15 million pounds in first-quarter 2022 and 53 million pounds in first-quarter 2021.
Treatment Charges. Revenues from our concentrate sales are recorded net of treatment charges (i.e., fees paid to smelters that are generally negotiated annually), which will vary with the sales volumes and the price of copper.
Royalties and Export Duties. Royalties are primarily on PT-FI sales and vary with the volume of metal sold and the prices of copper and gold. PT-FI currently pays duties on concentrate exports of 5 percent, declining to 2.5 percent when development progress for additional smelting capacity in Indonesia exceeds 30 percent, and eliminated when development progress for additional smelting capacity in Indonesia exceeds 50 percent. Refer to “Operations – Indonesia Mining” for further discussion of the current progress on additional smelting capacity in Indonesia and to Note 9 for a summary of royalty expense and export duties.
Production and Delivery Costs
Consolidated production and delivery costs totaled $3.2 billion in first-quarter 2022 and $2.8 billion in first-quarter 2021. Higher consolidated production and delivery costs in first-quarter 2022 primarily reflect higher volumes and increased energy, maintenance and other input costs.
Site Production and Delivery Costs Per Pound. Site production and delivery costs for our copper mining operations primarily include labor, energy and commodity-based inputs, such as sulphuric acid, reagents, liners, tires and explosives. Consolidated site production and delivery costs (before net noncash and other costs) for our copper mines averaged $2.03 per pound of copper in first-quarter 2022 and $1.86 per pound of copper in first-quarter 2021.
Higher consolidated site production and delivery costs per pound of copper for first-quarter 2022, compared with first-quarter 2021, primarily reflect higher mining and milling costs and increased energy and other input costs, partly offset by higher sales volumes. Refer to “Operations – Unit Net Cash Costs” for further discussion of unit net cash costs associated with our operating divisions and to “Product Revenues and Production Costs” for reconciliations of per pound costs by operating division to production and delivery costs applicable to sales reported in our consolidated financial statements.
Depreciation, Depletion and Amortization
Depreciation will vary under the unit-of-production (UOP) method as a result of changes in sales volumes and the related UOP rates at our mining operations. Consolidated depreciation, depletion and amortization (DD&A) totaled $489 million in first-quarter 2022 and $419 million in first-quarter 2021. Higher DD&A in first-quarter 2022 primarily reflects higher sales volumes and assets placed in service associated with the ramp-up of underground mining at PT-FI.
Interest Expense, Net
Consolidated interest costs (before capitalization) totaled $153 million in first-quarter 2022 and $160 million in first-quarter 2021.
Capitalized interest varies with the level of qualifying assets associated with our development projects and average interest rates on our borrowings. Capitalized interest totaled $26 million in first-quarter 2022 and $15 million in first-quarter 2021. The increase in capitalized interest in first-quarter 2022, compared with first-quarter 2021, is related to major mining projects primarily associated with underground development activities in the Grasberg minerals district and development of the greenfield smelter in Indonesia. Refer to “Capital Resources and Liquidity - Investing Activities” for discussion of capital expenditures associated with our major development projects.
29
Income Taxes
Following is a summary of the approximate amounts used in the calculation of our consolidated income tax provision (in millions, except percentages):
| Three Months Ended March 31, | ||||||||||||||||||||||||||||||||||||||
| 2022 | 2021 | |||||||||||||||||||||||||||||||||||||
Income (Loss)a | Effective Tax Rate | Income Tax (Provision) Benefit | Income (Loss)a | Effective Tax Rate | Income Tax (Provision) Benefit | |||||||||||||||||||||||||||||||||
U.S.b | $ | 552 | — | % | c | $ | (2) | $ | 185 | — | % | c | $ | — | ||||||||||||||||||||||||
| South America | 612 | 39 | % | (241) | 493 | 39 | % | (194) | ||||||||||||||||||||||||||||||
| Indonesia | 1,512 | 39 | % | (586) | 757 | 42 | % | (315) | ||||||||||||||||||||||||||||||
| Eliminations and other | 37 | N/A | (10) | (37) | N/A | 4 | ||||||||||||||||||||||||||||||||
Rate adjustmentd | — | N/A | 15 | — | N/A | 62 | ||||||||||||||||||||||||||||||||
| Consolidated FCX | $ | 2,713 | 30 | % | $ | (824) | $ | 1,398 | 32 | % | $ | (443) | ||||||||||||||||||||||||||
a.Represents income before income taxes and equity in affiliated companies’ net earnings (losses).
b.In addition to our North America mining operations, the U.S. jurisdiction reflects corporate-level expenses, which include interest expense associated with senior notes, general and administrative expenses, and environmental obligations and shutdown costs.
c.Includes valuation allowance release on prior year unbenefited net operating losses.
d.In accordance with applicable accounting rules, we adjust our interim provision for income taxes equal to our consolidated tax rate.
Assuming achievement of current sales volume and cost estimates and average prices of $4.75 per pound for copper, $1,950 per ounce for gold and $19.00 per pound for molybdenum for the remainder of 2022, we estimate our consolidated effective tax rate for the year 2022 would approximate 31 percent. Changes in projected sales volumes and average prices during 2022 would incur tax impacts at estimated effective rates of 40 percent for Peru, 38 percent for Indonesia and 0 percent for the U.S.
OPERATIONS
Responsible Production
2021 Annual Report on Sustainability. In April 2022, we published our 2021 Annual Report on Sustainability, which is available on our website at fcx.com/sustainability. We have a long history of environmental, social and governance (ESG) programs and are striving to continuously improve performance in these important areas. This report marks our 21st year of reporting on our sustainability progress and our second year of reporting in alignment with the Value Reporting Foundation’s SASB Standards for the Metals & Mining industry. We are committed to building upon our achievements in sustainability and we are focused on leading as a responsible copper producer.
The Copper Mark. We are committed to validating all of our copper producing sites with the Copper Mark, a comprehensive assurance framework designed to demonstrate the copper industry's responsible production practices. To achieve the Copper Mark, each site is required to complete an external assurance process to assess conformance with 32 ESG requirements. During first-quarter 2022, our Chino and Tyrone sites were awarded the Copper Mark. To date, we have achieved the Copper Mark at nine of our global sites (Chino, Tyrone, Bagdad, Morenci, Miami, El Paso, Cerro Verde, El Abra and Atlantic Copper), two sites have signed letters of commitment (Safford and Sierrita) and we expect to advance preparation for the validation process for PT-FI during 2022.
Leaching Innovation Initiatives
We have a long history of leach production and continue to pursue internal and external initiatives to advance sulfide leaching technologies, which are expected to allow us to recover additional copper from our large existing leach stockpiles. We have several initiatives ongoing across our North America and South America operations that incorporate new applications, technologies and data analytics. Initial results support the potential for incremental low-cost and low-carbon additions to our production and reserve profile.
Feasibility and Optimization Studies
We are engaged in various studies associated with potential future expansion projects primarily in North and South America. The cost of these studies are expensed as incurred. We estimate the costs of these studies will approximate $200 million for the year 2022 (including approximately $60 million in second-quarter 2022), compared with approximately $60 million for the year 2021.
30
North America Copper Mines
We operate seven open-pit copper mines in North America – Morenci, Bagdad, Safford (including Lone Star), Sierrita and Miami in Arizona, and Chino and Tyrone in New Mexico. All of the North America mining operations are wholly owned, except for Morenci. We record our 72 percent undivided joint venture interest in Morenci using the proportionate consolidation method.
The North America copper mines include open-pit mining, sulfide-ore concentrating, leaching and solution extraction/electrowinning (SX/EW) operations. A majority of the copper produced at our North America copper mines is cast into copper rod by our Rod & Refining segment. The remainder of our North America copper production is sold as copper cathode or copper concentrate, a portion of which is shipped to Atlantic Copper (our wholly owned smelter). Molybdenum concentrate, gold and silver are also produced by certain of our North America copper mines.
Operating and Development Activities. We have substantial reserves and future opportunities in the U.S., primarily associated with existing mining operations.
We continue to increase Lone Star operating rates to achieve production of 300 million pounds of copper per year from oxide ores (compared with the initial design capacity of 200 million pounds per year). The oxide project at Lone Star advances the opportunity for development of the underlying, large-scale sulfide resources. We are also increasing exploration in the area to support metallurgical testing and mine development planning for a potential significant long-term investment to build additional scale on an economically attractive basis.
We are planning an expansion to double the concentrator capacity of our Bagdad operation in northwest Arizona and are engaging stakeholders. We are commencing a feasibility study for this project during 2022.
Operating Data. Following is summary consolidated operating data for the North America copper mines:
| Three Months Ended March 31, | ||||||||||||||
| 2022 | 2021 | |||||||||||||
| Operating Data, Net of Joint Venture Interests | ||||||||||||||
Copper (millions of recoverable pounds) | ||||||||||||||
| Production | 354 | 353 | ||||||||||||
| Sales, excluding purchases | 381 | 308 | ||||||||||||
| Average realized price per pound | $ | 4.62 | $ | 3.88 | ||||||||||
Molybdenum (millions of recoverable pounds) | ||||||||||||||
Productiona | 7 | 8 | ||||||||||||
| 100% Operating Data | ||||||||||||||
| Leach operations | ||||||||||||||
| Leach ore placed in stockpiles (metric tons per day) | 708,600 | 705,100 | ||||||||||||
| Average copper ore grade (percent) | 0.28 | 0.28 | ||||||||||||
| Copper production (millions of recoverable pounds) | 245 | 262 | ||||||||||||
| Mill operations | ||||||||||||||
| Ore milled (metric tons per day) | 291,400 | 268,000 | ||||||||||||
| Average ore grade (percent): | ||||||||||||||
| Copper | 0.36 | 0.37 | ||||||||||||
| Molybdenum | 0.02 | 0.03 | ||||||||||||
| Copper recovery rate (percent) | 80.9 | 78.7 | ||||||||||||
| Copper production (millions of recoverable pounds) | 169 | 151 | ||||||||||||
a.Refer to “Consolidated Results” for our consolidated molybdenum sales volumes, which include sales of molybdenum produced at the North America copper mines.
Our consolidated copper sales volumes from North America totaled 381 million pounds in first-quarter 2022, compared with 308 million pounds of copper in first-quarter 2021, primarily reflecting timing of shipments. North America copper sales are estimated to approximate 1.5 billion pounds for the year 2022.
31
Unit Net Cash Costs. Unit net cash costs per pound of copper is a measure intended to provide investors with information about the cash-generating capacity of our mining operations expressed on a basis relating to the primary metal product for our respective operations. We use this measure for the same purpose and for monitoring operating performance by our mining operations. This information differs from measures of performance determined in accordance with U.S. generally accepted accounting principles (GAAP) and should not be considered in isolation or as a substitute for measures of performance determined in accordance with U.S. GAAP. This measure is presented by other metals mining companies, although our measure may not be comparable to similarly titled measures reported by other companies.
Gross Profit per Pound of Copper and Molybdenum
The following table summarizes unit net cash costs and gross profit per pound at our North America copper mines. Refer to “Product Revenues and Production Costs” for an explanation of the “by-product” and “co-product” methods and a reconciliation of unit net cash costs per pound to production and delivery costs applicable to sales reported in our consolidated financial statements.
| Three Months Ended March 31, | ||||||||||||||||||||||||||||||||||||||
| 2022 | 2021 | |||||||||||||||||||||||||||||||||||||
| By- Product Method | Co-Product Method | By- Product Method | Co-Product Method | |||||||||||||||||||||||||||||||||||
| Copper | Molyb- denuma | Copper | Molyb- denuma | |||||||||||||||||||||||||||||||||||
| Revenues, excluding adjustments | $ | 4.62 | $ | 4.62 | $ | 17.97 | $ | 3.88 | $ | 3.88 | $ | 10.49 | ||||||||||||||||||||||||||
Site production and delivery, before net noncash and other costs shown below | 2.38 | 2.20 | 10.95 | 2.04 | 1.89 | 6.67 | ||||||||||||||||||||||||||||||||
| By-product credits | (0.34) | — | — | (0.30) | — | — | ||||||||||||||||||||||||||||||||
| Treatment charges | 0.09 | 0.09 | — | 0.11 | 0.10 | — | ||||||||||||||||||||||||||||||||
| Unit net cash costs | 2.13 | 2.29 | 10.95 | 1.85 | 1.99 | 6.67 | ||||||||||||||||||||||||||||||||
| DD&A | 0.27 | 0.25 | 0.88 | 0.26 | 0.24 | 0.46 | ||||||||||||||||||||||||||||||||
| Noncash and other costs, net | 0.07 | 0.07 | 0.14 | 0.13 | 0.13 | 0.06 | ||||||||||||||||||||||||||||||||
| Total unit costs | 2.47 | 2.61 | 11.97 | 2.24 | 2.36 | 7.19 | ||||||||||||||||||||||||||||||||
Revenue adjustments, primarily for pricing on prior period open sales | 0.03 | 0.03 | — | 0.02 | 0.02 | — | ||||||||||||||||||||||||||||||||
| Gross profit per pound | $ | 2.18 | $ | 2.04 | $ | 6.00 | $ | 1.66 | $ | 1.54 | $ | 3.30 | ||||||||||||||||||||||||||
| Copper sales (millions of recoverable pounds) | 381 | 381 | 308 | 308 | ||||||||||||||||||||||||||||||||||
Molybdenum sales (millions of recoverable pounds)a | 7 | 8 | ||||||||||||||||||||||||||||||||||||
a.Reflects sales of molybdenum produced by certain of the North America copper mines to our molybdenum sales company at market-based pricing.
Our North America copper mines have varying cost structures because of differences in ore grades and characteristics, processing costs, by-product credits and other factors. Average unit net cash costs (net of by-product credits) for the North America copper mines of $2.13 per pound of copper in first-quarter 2022 were higher than unit net cash costs of $1.85 per pound in first-quarter 2021, primarily reflecting increased mining and milling rates and higher energy and other input costs, partly offset by higher sales volumes.
Because certain assets are depreciated on a straight-line basis, North America’s average unit depreciation rate may vary with asset additions and the level of copper production and sales.
Average unit net cash costs (net of by-product credits) for our North America copper mines are expected to approximate $2.22 per pound of copper for the year 2022, based on achievement of current sales volume and cost estimates and assuming an average molybdenum price of $19.00 per pound for the remainder of 2022. North America’s average unit net cash costs for the year 2022 would change by approximately $0.03 per pound for each $2.00 per pound change in the average price of molybdenum for the remainder of 2022.
32
South America Mining
We operate two copper mines in South America – Cerro Verde in Peru (in which we own a 53.56 percent interest) and El Abra in Chile (in which we own a 51 percent interest), which are consolidated in our financial statements.
South America mining includes open-pit mining, sulfide-ore concentrating, leaching and SX/EW operations. Production from our South America mines is sold as copper concentrate or cathode under long-term contracts. Our South America mines also sell a portion of their copper concentrate production to Atlantic Copper. In addition to copper, the Cerro Verde mine produces molybdenum concentrate and silver.
Operating and Development Activities. During first-quarter 2022, milling rates at Cerro Verde's concentrator facilities averaged 394,400 metric tons of ore per day. Subject to ongoing monitoring of COVID-19 protocols, milling rates at Cerro Verde are currently expected to average approximately 400,000 metric tons of ore per day for the remainder of 2022.
Operating rates at El Abra have returned to pre-COVID-19 levels and increased mining and stacking activities are expected to result in an approximate 30 percent increase in El Abra copper production for the year 2022, compared with the year 2021.
El Abra's large sulfide resource supports a potential major mill project similar to the large-scale concentrator constructed at Cerro Verde in 2015. Technical and economic studies continue to be evaluated to determine the optimal scope and timing for the sulfide project. We are engaging stakeholders and preparing data required for submission of a robust permit application, while we continue to monitor potential changes in Chile’s regulatory and fiscal matters. We will defer major investment decisions pending clarity on Chile’s regulatory and fiscal matters.
Operating Data. Following is summary consolidated operating data for South America mining:
| Three Months Ended March 31, | ||||||||||||||
| 2022 | 2021 | |||||||||||||
Copper (millions of recoverable pounds) | ||||||||||||||
| Production | 274 | 259 | ||||||||||||
| Sales | 264 | 259 | ||||||||||||
| Average realized price per pound | $ | 4.69 | $ | 3.96 | ||||||||||
Molybdenum (millions of recoverable pounds) | ||||||||||||||
Productiona | 7 | 5 | ||||||||||||
| Leach operations | ||||||||||||||
| Leach ore placed in stockpiles (metric tons per day) | 139,800 | 153,800 | ||||||||||||
| Average copper ore grade (percent) | 0.36 | 0.36 | ||||||||||||
| Copper production (millions of recoverable pounds) | 61 | 61 | ||||||||||||
| Mill operations | ||||||||||||||
| Ore milled (metric tons per day) | 394,400 | 390,100 | ||||||||||||
| Average ore grade (percent): | ||||||||||||||
| Copper | 0.33 | 0.31 | ||||||||||||
| Molybdenum | 0.02 | 0.01 | ||||||||||||
| Copper recovery rate (percent) | 86.6 | 87.6 | ||||||||||||
| Copper production (millions of recoverable pounds) | 213 | 198 | ||||||||||||
a.Refer to “Consolidated Results” for our consolidated molybdenum sales volumes, which include sales of molybdenum produced at Cerro Verde.
Our consolidated copper sales volumes from South America totaled 264 million pounds in first-quarter 2022, similar to copper sales volumes of 259 million pounds in first-quarter 2021. Copper sales from South America mining are expected to approximate 1.15 billion pounds for the year 2022.
Unit Net Cash Costs. Unit net cash costs per pound of copper is a measure intended to provide investors with information about the cash-generating capacity of our mining operations expressed on a basis relating to the primary metal product for our respective operations. We use this measure for the same purpose and for monitoring operating performance by our mining operations. This information differs from measures of performance determined
33
in accordance with U.S. GAAP and should not be considered in isolation or as a substitute for measures of performance determined in accordance with U.S. GAAP. This measure is presented by other metals mining companies, although our measure may not be comparable to similarly titled measures reported by other companies.
Gross Profit per Pound of Copper
The following table summarizes unit net cash costs and gross profit per pound of copper at our South America mining operations. Unit net cash costs per pound of copper are reflected under the by-product and co-product methods as the South America mining operations also had sales of molybdenum and silver. Refer to “Product Revenues and Production Costs” for an explanation of the “by-product” and “co-product” methods and a reconciliation of unit net cash costs per pound to production and delivery costs applicable to sales reported in our consolidated financial statements.
| Three Months Ended March 31, | ||||||||||||||||||||||||||
| 2022 | 2021 | |||||||||||||||||||||||||
| By-Product Method | Co-Product Method | By-Product Method | Co-Product Method | |||||||||||||||||||||||
| Revenues, excluding adjustments | $ | 4.69 | $ | 4.69 | $ | 3.96 | $ | 3.96 | ||||||||||||||||||
| Site production and delivery, before net noncash and other costs shown below | 2.43 | 2.22 | 2.01 | 1.90 | ||||||||||||||||||||||
| By-product credits | (0.43) | — | (0.21) | — | ||||||||||||||||||||||
| Treatment charges | 0.15 | 0.15 | 0.13 | 0.13 | ||||||||||||||||||||||
| Royalty on metals | 0.01 | 0.01 | 0.01 | 0.01 | ||||||||||||||||||||||
| Unit net cash costs | 2.16 | 2.38 | 1.94 | 2.04 | ||||||||||||||||||||||
| DD&A | 0.37 | 0.33 | 0.39 | 0.37 | ||||||||||||||||||||||
| Noncash and other costs, net | 0.07 | 0.07 | 0.04 | 0.03 | ||||||||||||||||||||||
| Total unit costs | 2.60 | 2.78 | 2.37 | 2.44 | ||||||||||||||||||||||
| Revenue adjustments, primarily for pricing on prior period open sales | 0.21 | 0.21 | 0.32 | 0.32 | ||||||||||||||||||||||
| Gross profit per pound | $ | 2.30 | $ | 2.12 | $ | 1.91 | $ | 1.84 | ||||||||||||||||||
| Copper sales (millions of recoverable pounds) | 264 | 264 | 259 | 259 | ||||||||||||||||||||||
Our South America mines have varying cost structures because of differences in ore grades and characteristics, processing costs, by-product credits and other factors. Average unit net cash costs (net of by-product credits) for South America mining of $2.16 per pound of copper in first-quarter 2022 were higher than unit net cash costs of $1.94 per pound of copper in first-quarter 2021, primarily reflecting higher acid, energy and other input costs, partly offset by higher by-product credits.
Revenues from Cerro Verde’s concentrate sales are recorded net of treatment charges, which will vary with Cerro Verde’s sales volumes and the price of copper.
Because certain assets are depreciated on a straight-line basis, South America’s unit depreciation rate may vary with asset additions and the level of copper production and sales.
Revenue adjustments primarily result from changes in prices on provisionally priced copper sales recognized in prior periods. Refer to “Consolidated Results – Revenues” for further discussion of adjustments to prior period provisionally priced copper sales.
Average unit net cash costs (net of by-product credits) for South America mining are expected to approximate $2.23 per pound of copper for the year 2022, based on current sales volume and cost estimates and assuming an average price of $19.00 per pound of molybdenum for the remainder of 2022.
Indonesia Mining
PT-FI operates one of the world’s largest copper and gold mines at the Grasberg minerals district in Papua, Indonesia. PT-FI produces copper concentrate that contains significant quantities of gold and silver. We have a 48.76 percent interest in PT-FI and manage its mining operations. As further discussed in Note 2 of our 2021 Form 10-K, under the terms of the 2018 shareholders agreement, our economic interest in PT-FI approximates 81 percent through 2022, and 48.76 percent thereafter. PT-FI’s results are consolidated in our financial statements.
34
Substantially all of PT-FI’s copper concentrate is sold under long-term contracts. During first-quarter 2022, 37 percent of PT-FI’s concentrate production was sold to PT Smelting (PT-FI’s 39.5-percent owned copper smelter and refinery in Gresik, Indonesia).
Operating and Development Activities. PT-FI currently has three underground operating mines in the Grasberg minerals district: Grasberg Block Cave, DMLZ and Big Gossan. In late 2021, PT-FI achieved quarterly copper and gold volumes approximating 100 percent of projected annualized levels of approximately 1.6 billion pounds of copper and 1.6 million ounces of gold.
Combined milling rates from PT-FI's underground mines averaged 186,500 metric tons of ore per day in first-quarter 2022, and PT-FI expects milling rates to average approximately 180,000 to 190,000 metric tons of ore per day for the remainder of 2022. The installation of additional milling facilities at PT-FI is in progress and is currently expected to be completed in 2023, which will increase milling capacity to approximately 240,000 metric tons of ore per day.
PT-FI's estimated capital spending on the Grasberg Block Cave and DMLZ underground projects for the year 2022 is expected to approximate $1.0 billion, net of scheduled contributions from PT Indonesia Asahan
Aluminium (Persero) (PT Inalum, also known as MIND ID). PT-FI is also advancing construction of a dual-fuel power plant and upgrades to the mill circuit to improve recoveries. In accordance with applicable accounting guidance, the aggregate costs (before scheduled contributions from PT Inalum), expected to approximate $1.2 billion for the year 2022, will be reflected as an investing activity in our cash flow statement, and contributions from PT Inalum will be reflected as a financing activity.
Kucing Liar. PT-FI commenced long-term mine development activities for its Kucing Liar deposit during 2021, which is expected to produce over 6 billion pounds of copper and 5 million ounces of gold over the life of the project. Pre-production development activities will occur over an approximate 10-year timeframe, and capital investments are expected to average approximately $400 million per year over the next 10 years. At full operating rates, annual production from Kucing Liar is expected to approximate 600 million pounds of copper and 500 thousand ounces of gold, providing PT-FI with sustained long-term, large-scale and low-cost production. Kucing Liar will benefit from substantial shared infrastructure and PT-FI's experience and long-term success in block-cave mining.
Export License. In March 2022, PT-FI received a one-year extension of its export license through March 19, 2023, for two million metric tons of concentrate. Export licenses are valid for a one-year period, subject to review and approval by the Indonesia government every six months, depending on smelter construction progress.
Indonesia Smelter. In connection with PT-FI’s 2018 agreement with the Indonesia government to secure the extension of its long-term mining rights, PT-FI committed to construct additional domestic smelting capacity totaling 2 million metric tons of concentrate per year by the end of 2023 (subject to force majeure provisions).
PT-FI is actively engaged in the following projects for additional domestic smelting capacity:
•Construction of a greenfield smelter in Gresik, Indonesia with a capacity to process approximately 1.7 million metric tons of copper concentrate per year. In July 2021, PT-FI awarded a construction contract to a third-party contractor with an estimated cost of $2.8 billion. PT-FI continues to progress site preparation activities, early works and engineering procurement and construction activities. The smelter construction is expected to be completed as soon as feasible in 2024, consistent with PT-FI’s revised smelter construction schedule.
•Expansion of PT Smelting's capacity by 30 percent to 1.3 million metric tons of concentrate per year, which is expected to be completed by the end of 2023. PT-FI is funding the cost of the expansion, which is estimated to approximate $250 million, with a loan that will convert to equity, and increase ownership in PT Smelting to a majority ownership interest once the expansion is complete.
•Construction of a PMR to process gold and silver from the greenfield smelter and PT Smelting at an estimated cost of $250 million.
During first-quarter 2022, capital expenditures for the greenfield smelter and PMR (collectively, the Indonesia smelter projects) totaled $0.1 billion, and are expected to approximate $1.4 billion for the year 2022. Construction of the additional domestic smelter capacity will result in the elimination of export duties, providing an offset to the economic cost associated with the Indonesia smelter projects.
35
As further discussed in “Capital Resources and Liquidity,” PT-FI completed the sale of $3.0 billion of senior notes in April 2022, which will be used together with PT-FI’s available bank credit facilities primarily to fund the Indonesia smelter projects.
Operating Data. Following is summary consolidated operating data for Indonesia mining:
| Three Months Ended March 31, | ||||||||||||||
| 2022 | 2021 | |||||||||||||
Copper (millions of recoverable pounds) | ||||||||||||||
| Production | 381 | 298 | ||||||||||||
| Sales | 379 | 258 | ||||||||||||
| Average realized price per pound | $ | 4.69 | $ | 4.00 | ||||||||||
Gold (thousands of recoverable ounces) | ||||||||||||||
| Production | 412 | 294 | ||||||||||||
| Sales | 406 | 256 | ||||||||||||
| Average realized price per ounce | $ | 1,920 | $ | 1,713 | ||||||||||
| Ore extracted and milled (metric tons per day): | ||||||||||||||
| Grasberg Block Cave underground mine | 100,400 | 51,800 | ||||||||||||
| DMLZ underground mine | 78,400 | 46,700 | ||||||||||||
| Big Gossan underground mine | 7,700 | 6,800 | ||||||||||||
Deep Ore Zone underground minea and other | — | 18,800 | ||||||||||||
| Total | 186,500 | 124,100 | ||||||||||||
| Average ore grades: | ||||||||||||||
| Copper (percent) | 1.23 | 1.41 | ||||||||||||
| Gold (grams per metric ton) | 1.03 | 1.08 | ||||||||||||
| Recovery rates (percent): | ||||||||||||||
| Copper | 89.4 | 91.3 | ||||||||||||
| Gold | 77.2 | 78.9 | ||||||||||||
a.Ore body depleted in 2021.
Our consolidated sales from PT-FI totaled 379 million pounds of copper and 406 thousand ounces of gold in
first-quarter 2022, compared with consolidated sales of 258 million pounds of copper and 256 thousand ounces of gold in first-quarter 2021, primarily reflecting the ramp-up of underground mining in the Grasberg minerals district.
Consolidated sales volumes from PT-FI are expected to approximate 1.6 billion pounds of copper and 1.6 million ounces of gold for the year 2022.
Unit Net Cash (Credits) Costs. Unit net cash (credits) costs per pound of copper is a measure intended to provide investors with information about the cash-generating capacity of our mining operations expressed on a basis relating to the primary metal product for our respective operations. We use this measure for the same purpose and for monitoring operating performance by our mining operations. This information differs from measures of performance determined in accordance with U.S. GAAP and should not be considered in isolation or as a substitute for measures of performance determined in accordance with U.S. GAAP. This measure is presented by other metals mining companies, although our measure may not be comparable to similarly titled measures reported by other companies.
Gross Profit per Pound of Copper and per Ounce of Gold
The following table summarizes the unit net cash (credits) costs and gross profit per pound of copper and per ounce of gold at our Indonesia mining operations. Refer to “Product Revenues and Production Costs” for an explanation of “by-product” and “co-product” methods and a reconciliation of unit net cash costs per pound to production and delivery costs applicable to sales reported in our consolidated financial statements.
36
| Three Months Ended March 31, | |||||||||||||||||||||||||||||||||||
| 2022 | 2021 | ||||||||||||||||||||||||||||||||||
| By-Product Method | Co-Product Method | By-Product Method | Co-Product Method | ||||||||||||||||||||||||||||||||
| Copper | Gold | Copper | Gold | ||||||||||||||||||||||||||||||||
| Revenues, excluding adjustments | $ | 4.69 | $ | 4.69 | $ | 1,920 | $ | 4.00 | $ | 4.00 | $ | 1,713 | |||||||||||||||||||||||
| Site production and delivery, before net noncash and other costs (credits) shown below | 1.41 | 0.96 | 395 | 1.48 | 1.02 | 438 | |||||||||||||||||||||||||||||
| Gold and silver credits | (2.17) | — | — | (1.79) | — | — | |||||||||||||||||||||||||||||
| Treatment charges | 0.25 | 0.17 | 69 | 0.25 | 0.17 | 74 | |||||||||||||||||||||||||||||
| Export duties | 0.21 | 0.14 | 59 | 0.11 | 0.08 | 33 | |||||||||||||||||||||||||||||
| Royalty on metals | 0.24 | 0.17 | 69 | 0.24 | 0.16 | 71 | |||||||||||||||||||||||||||||
| Unit net cash (credits) costs | (0.06) | 1.44 | 592 | 0.29 | 1.43 | 616 | |||||||||||||||||||||||||||||
| DD&A | 0.66 | 0.45 | 183 | 0.77 | 0.53 | 228 | |||||||||||||||||||||||||||||
| Noncash and other costs (credits), net | 0.07 | a | 0.05 | 20 | (0.03) | b | (0.02) | (10) | |||||||||||||||||||||||||||
| Total unit costs | 0.67 | 1.94 | 795 | 1.03 | 1.94 | 834 | |||||||||||||||||||||||||||||
| Revenue adjustments, primarily for pricing on prior period open sales | 0.15 | 0.15 | 8 | 0.25 | 0.25 | (19) | |||||||||||||||||||||||||||||
| PT Smelting intercompany loss | (0.13) | (0.09) | (39) | (0.20) | (0.14) | (56) | |||||||||||||||||||||||||||||
| Gross profit per pound/ounce | $ | 4.04 | $ | 2.81 | $ | 1,094 | $ | 3.02 | $ | 2.17 | $ | 804 | |||||||||||||||||||||||
| Copper sales (millions of recoverable pounds) | 379 | 379 | 258 | 258 | |||||||||||||||||||||||||||||||
| Gold sales (thousands of recoverable ounces) | 406 | 256 | |||||||||||||||||||||||||||||||||
a.Includes charges totaling $0.11 per pound of copper associated with the settlement of an administrative fine levied by the Indonesia government (refer to Note 8 for further discussion), and $0.05 per pound of copper associated with an adjustment to prior-period export duties, partly offset by credits totaling $0.08 per pound of copper associated with adjustments to prior year treatment and refining costs.
b.Includes credits totaling $0.12 per pound of copper associated with adjustments to prior year treatment and refining costs, partly offset by charges totaling $0.05 per pound of copper associated with a potential settlement of an administrative fine levied by the Indonesia government.
In first-quarter 2022, PT-FI’s gold and silver credits exceeded its cash costs, resulting in unit net cash credits of $0.06 per pound of copper, compared to unit net cash costs (net of gold and silver credits) of $0.29 per pound in first-quarter 2021, primarily reflecting higher sales volumes, partly offset by higher operating rates, energy and other input costs.
Treatment charges vary with the volume of metals sold and the price of copper, and royalties vary with the volume of metals sold and the prices of copper and gold.
PT-FI’s export duties totaled $79 million in first-quarter 2022 and $29 million in first-quarter 2021. The increase in export duties in first-quarter 2022, compared with first-quarter 2021, primarily reflects higher sales volumes.
PT-FI’s royalties totaled $92 million in first-quarter 2022 and $61 million in first-quarter 2021. The increase in export duties and royalties for first-quarter 2022, compared with first-quarter 2021, primarily reflects higher sales volumes and metals prices.
Because certain assets are depreciated on a straight-line basis, PT-FI’s unit depreciation rate may vary with asset additions and the level of copper production and sales. DD&A per pound of copper under the by-product method was $0.66 per pound in first-quarter 2022, compared with $0.77 per pound in first-quarter 2021. The decrease in the rate per pound of copper primarily reflects depletion of the Deep Ore Zone underground mine and the ramp-up of underground mining in the Grasberg minerals district, which resulted in significantly higher copper production and sales volumes, partly offset by significant underground development assets placed into service.
Revenue adjustments primarily result from changes in prices on provisionally priced copper sales recognized in prior periods.
37
PT Smelting intercompany loss represents the change in the deferral of PT-FI’s profit on sales to PT Smelting (25 percent prior to April 30, 2021, and 39.5 percent thereafter). Refer to “Smelting and Refining” below for further discussion.
Assuming an average gold price of $1,950 per ounce for the remainder of 2022 and achievement of current sales volume and cost estimates, unit net cash costs (net of gold and silver credits) for PT-FI are expected to approximate $0.10 per pound of copper for the year 2022. PT-FI’s unit net cash costs for the year 2022 would change by approximately $0.09 per pound of copper for each $100 per ounce change in the average price of gold for the remainder of 2022.
PT-FI’s projected sales volumes and unit net cash costs for the year 2022 are dependent on a number of factors, including operational performance and timing of shipments.
Molybdenum Mines
We operate two wholly owned molybdenum mines in Colorado – the Henderson underground mine and the Climax open-pit mine. The Henderson and Climax mines produce high-purity, chemical-grade molybdenum concentrate, which is typically further processed into value-added molybdenum chemical products. The majority of the molybdenum concentrate produced at the Henderson and Climax mines, as well as from our North America and South America copper mines, is processed at our conversion facilities.
Operating and Development Activities. Production from the Molybdenum mines totaled 7 million pounds of molybdenum in both first-quarter 2022 and first-quarter 2021. We plan on increasing mining rates at the Climax mine during 2022 to provide options to increase volumes in response to market demand for molybdenum. Refer to “Consolidated Results” for our consolidated molybdenum operating data, which includes sales of molybdenum produced at our Molybdenum mines and from our North America and South America copper mines. Refer to “Outlook” for projected consolidated molybdenum sales volumes.
Unit Net Cash Costs Per Pound of Molybdenum. Unit net cash costs per pound of molybdenum is a measure intended to provide investors with information about the cash-generating capacity of our mining operations expressed on a basis relating to the primary metal product for our respective operations. We use this measure for the same purpose and for monitoring operating performance by our mining operations. This information differs from measures of performance determined in accordance with U.S. GAAP and should not be considered in isolation or as a substitute for measures of performance determined in accordance with U.S. GAAP. This measure is presented by other metals mining companies, although our measure may not be comparable to similarly titled measures reported by other companies.
Average unit net cash costs for our Molybdenum mines of $10.89 per pound of molybdenum in first-quarter 2022 were higher than average unit net cash costs of $8.98 per pound in first-quarter 2021, primarily reflecting higher mining rates at the Climax mine and increased development costs at the Henderson mine. Based on current sales volume and cost estimates, average unit net cash costs for the Molybdenum mines are expected to approximate $12.00 per pound of molybdenum for the year 2022.
Refer to “Product Revenues and Production Costs” for a reconciliation of unit net cash costs per pound to production and delivery costs applicable to sales reported in our consolidated financial statements.
Smelting and Refining
We wholly own and operate the Miami smelter in Arizona, the El Paso refinery in Texas and a smelter and refinery in Spain (Atlantic Copper). Additionally, PT-FI has a 39.5 percent ownership interest in PT Smelting and expects its ownership to increase to a majority interest upon completion of the expansion of PT Smelting’s smelting capacity. Treatment charges for smelting and refining copper concentrate consist of a base rate per pound of copper and per ounce of gold and are generally fixed. Treatment charges represent a cost to our mining operations and income to Atlantic Copper and PT Smelting. Thus, higher treatment charges benefit our smelter operations and adversely affect our mining operations. Our North America copper mines are less significantly affected by changes in treatment charges because these operations are largely integrated with our Miami smelter and El Paso refinery.
Through this form of downstream integration, we are assured placement of a significant portion of our concentrate production.
38
Atlantic Copper smelts and refines copper concentrate and markets refined copper and precious metals in slimes. During first-quarter 2022, Atlantic Copper’s concentrate purchases included 12 percent from our copper mining operations and 88 percent from third parties.
Atlantic Copper’s major maintenance turnarounds typically occur approximately every eight years, with shorter-term maintenance turnarounds in the interim. In April 2022, Atlantic Copper began an approximately 60-day major maintenance turnaround, for which maintenance charges are expected to total approximately $25 million.
PT-FI’s contract with PT Smelting provides for PT-FI to supply 100 percent of the copper concentrate requirements (subject to a minimum or maximum treatment charge rate) necessary for PT Smelting to produce 205,000 metric tons of copper annually on a priority basis. PT-FI may also sell copper concentrate to PT Smelting at market rates for quantities in excess of 205,000 metric tons of copper annually. During first-quarter 2022, PT-FI supplied all of PT Smelting’s concentrate requirements. In November 2021, PT-FI entered into a tolling agreement with PT Smelting that will be effective January 1, 2023, and will replace the current concentrate sales agreements between PT-FI and PT Smelting. Under the tolling agreement, PT-FI will pay PT Smelting to smelt and refine its concentrate and will retain title to all products for sale to third parties.
We defer recognizing profits on sales from our mining operations to Atlantic Copper and on 39.5 percent of PT-FI’s sales to PT Smelting (25.0 percent prior to April 30, 2021) until final sales to third parties occur. Changes in these deferrals attributable to variability in intercompany volumes resulted in net additions (reductions) to operating income totaling $46 million ($23 million to net income attributable to common stock) in first-quarter 2022 and $(85) million ($(63) million to net income attributable to common stock) in first-quarter 2021. Our net deferred profits on our inventories at Atlantic Copper and PT Smelting to be recognized in future periods’ net income attributable to common stock totaled $183 million at March 31, 2022. Quarterly variations in ore grades, the timing of intercompany shipments and changes in product prices will result in variability in our net deferred profits and quarterly earnings.
CAPITAL RESOURCES AND LIQUIDITY
Our consolidated operating cash flows vary with sales volumes; prices realized from copper, gold and molybdenum sales; production costs; income taxes; other working capital changes; and other factors.
We generated significant cash flows during first-quarter 2022, reflecting strong operating and financial performance and favorable copper and gold prices. With a favorable market outlook and a focus on executing our operating plans, we expect to continue to generate strong cash flows that will support advancement of organic growth initiatives and additional cash returns to shareholders under our established financial policy.
We believe that we have a high-quality portfolio of long-lived copper assets positioned to generate long-term value. During first-quarter 2022, we continued to increase operating rates at Lone Star and from the underground mines at the Grasberg minerals district. Pre-production development activities for the Kucing Liar deposit, which commenced during 2021, are progressing and we continue to evaluate organic growth opportunities for expansion of certain of our operations in North America and South America, including at Bagdad, Lone Star and El Abra, the timing of which will be dependent on, among other things, market conditions.
Based on current sales volume, cost and metal price estimates discussed in “Outlook,” our projected consolidated operating cash flows of $8.6 billion for the year 2022 significantly exceed our expected consolidated capital expenditures of $4.6 billion (which includes $1.9 billion for major mining projects and $1.4 billion for the Indonesia smelter projects) and other cash requirements for the year, including share repurchases, noncontrolling interest distributions, income tax payments, common stock dividends (base and variable) and debt repayments.
We believe that our cash generating capability and financial condition, which includes $8.3 billion of consolidated
cash and cash equivalents at March 31, 2022, together with $3.5 billion available under our revolving
credit facility, will be adequate to meet our operating, investing and financing needs over the next several years. Additionally, capital expenditures for the Indonesia smelter projects are being funded with the net proceeds from PT-FI’s unsecured senior notes issued in April 2022 and its available bank credit facilities.
Refer to “Outlook” for further discussion of projected operating cash flows and capital expenditures for the year 2022 and to “Debt” below and Note 5 for further discussion of PT-FI’s unsecured senior notes and unsecured bank credit facility.
39
Financial Policy. Our financial policy is aligned with our strategic objectives of maintaining a strong balance sheet and increasing cash returns to shareholders while advancing opportunities for future growth. Under the financial policy up to 50 percent of cash flows, after planned capital spending (excluding Indonesia smelter project investments) and distributions to noncontrolling interests, will be directed to shareholder returns with the balance available for investments in future value enhancing growth projects and further debt reductions. The Board will review the structure and the amount of the performance-based payout framework at least annually.
In February 2021, our Board of Directors (the Board) reinstated a cash dividend on our common stock (base dividend) at an annual rate of $0.30 per share. In mid-2021, FCX achieved its net debt target in the range of $3.0 billion to $4.0 billion (excluding debt for additional smelting capacity in Indonesia). In November 2021, the Board approved the implementation of the performance-based payout framework, including (i) a $3.0 billion share repurchase program and (ii) a variable cash dividend on common stock for 2022 at an expected annual rate of $0.30 per share. The combined annual rate of the base dividend and the variable dividend is expected to total $0.60 per share for 2022. Based on current shares outstanding totaling 1.45 billion, the total common stock dividends (base and variable) for 2022 are expected to approximate $0.9 billion. Refer to Note 5 and “Financing Activities” below for further discussion.
In March 2022, our Board declared dividends totaling $0.15 per share on our common stock (including a $0.075 per share quarterly base cash dividend and a $0.075 per share quarterly variable cash dividend), which were paid on May 2, 2022, to shareholders of record as of April 14, 2022. Refer to Item 1A. “Risk Factors” contained in Part I of our 2021 Form 10-K, and “Cautionary Statement” below for further discussion.
Cash
Following is a summary of the U.S. and international components of consolidated cash and cash equivalents available to the parent company, net of noncontrolling interests’ share, taxes and other costs at March 31, 2022 (in billions):
| Cash at domestic companies | $ | 5.4 | ||||||
| Cash at international operations | 2.9 | |||||||
| Total consolidated cash and cash equivalents | 8.3 | |||||||
| Noncontrolling interests’ share | (0.8) | |||||||
| Cash, net of noncontrolling interests’ share | 7.5 | |||||||
| Withholding taxes | (0.2) | |||||||
| Net cash available | $ | 7.3 | ||||||
Cash held at our international operations is generally used to support our foreign operations’ capital expenditures, operating expenses, debt repayments, working capital and other tax payments, or other cash needs. Management believes that sufficient liquidity is available in the U.S. from cash balances and availability from our revolving credit facility. We have not elected to permanently reinvest earnings from our foreign subsidiaries, and we have recorded deferred tax liabilities for foreign earnings that are available to be repatriated to the U.S. From time to time, our foreign subsidiaries distribute earnings to the U.S. through dividends that are subject to applicable withholding taxes and noncontrolling interests’ share.
Debt
At March 31, 2022, we had consolidated debt of $9.6 billion, with a related weighted-average interest rate of 4.6 percent. We had no borrowings outstanding and $8 million in letters of credit issued under our revolving credit facility, resulting in availability of approximately $3.5 billion.
In April 2022, PT-FI completed the sale of $3.0 billion of unsecured senior notes, consisting of $750 million aggregate principal amount of 4.763% senior notes due April 2027, $1.5 billion aggregate principal amount of 5.315% senior notes due April 2032 and $750 million aggregate principal amount of 6.200% senior notes due April 2052. PT-FI intends to use the proceeds, net of underwriting fees, of $2.99 billion to finance its smelter projects, to refinance the PT-FI Term Loan and for general corporate purposes.
Refer to Note 5 for further discussion of the above items, and refer to Note 8 of our 2021 Form 10-K for additional information regarding our debt arrangements.
40
Operating Activities
We reported consolidated cash provided by operating activities of $1.7 billion (net of $0.8 billion of working capital and other uses) in first-quarter 2022 and $1.1 billion (net of $0.3 billion of working capital and other uses) in first-quarter 2021. Higher operating cash flows in first-quarter 2022, compared with first-quarter 2021, primarily reflect higher copper and gold sales volumes and prices. Increased working capital uses in first-quarter 2022, compared with first-quarter 2021, primarily reflects timing of copper concentrate purchases by Atlantic Copper in anticipation of their major maintenance turnaround that began in April 2022, and additional income tax payments.
Investing Activities
Capital Expenditures. Capital expenditures, including capitalized interest, totaled $0.7 billion in first-quarter 2022, including approximately $0.4 billion for major mining projects primarily associated with underground development activities in the Grasberg minerals district and $0.1 billion for the Indonesia smelter projects. Capital expenditures for the Indonesia smelter projects are being funded with the net proceeds from PT-FI's unsecured senior notes issued in April 2022 and its available bank credit facilities. Refer to “Outlook” for further discussion of projected capital expenditures for the year 2022.
Capital expenditures, including capitalized interest, totaled $0.4 billion in first-quarter 2021, including approximately $0.3 billion for major mining projects primarily associated with underground development activities in the Grasberg minerals district.
Financing Activities
Debt Transactions. Net borrowings of debt totaled $170 million in first-quarter 2022 and $98 million in first-quarter 2021. Refer to Note 5 for further discussion.
Cash Dividends and Distributions Paid. We paid cash dividends on our common stock totaling $220 million in first-quarter 2022 and none in first-quarter 2021. The declaration and payment of dividends (base or variable) is at the discretion of the Board and will depend on our financial results, cash requirements, business prospects, global economic conditions and other factors deemed relevant by the Board. Refer to Note 5, Item 1A. “Risk Factors” contained in Part I of our 2021 Form 10-K, “Cautionary Statement” below and discussion of our financial policy above.
Cash dividends and distributions paid to noncontrolling interests, primarily at PT-FI, totaled $204 million in first-quarter 2022 and none in first-quarter 2021. Based on the estimates discussed in “Outlook,” we currently expect cash dividends and distributions paid to noncontrolling interests to exceed $1.6 billion in 2022. Cash dividends and distributions to noncontrolling interests vary based on the operating results and cash requirements of our consolidated subsidiaries.
Treasury Stock Purchases. In first-quarter 2022, we acquired 12.3 million shares of our common stock under our share repurchase program for a total cost of $541 million ($44.02 average cost per share). Through May 5, 2022, we acquired 28.7 million shares of our common stock for a total cost of $1.2 billion ($41.64 average cost per share) and $1.8 billion remains available under the share repurchase program. As of April 29, 2022, we had 1.45 billion shares of common stock outstanding. The timing and amount of share repurchases is at the discretion of management and will depend on a variety of factors. The share repurchase program may be modified, increased, suspended or terminated at any time at the Board’s discretion. Refer to Item 1A. “Risk Factors” contained in Part I of our 2021 Form 10-K, “Cautionary Statement” below and discussion of our financial policy above.
Contributions from Noncontrolling Interests. We received equity contributions totaling $47 million in first-quarter 2022 and $41 million in first-quarter 2021 from PT Inalum for their share of capital spending on underground mine development projects in the Grasberg minerals district.
Stock-based awards. Proceeds from exercised stock options totaled $101 million in first-quarter 2022 and $106 million in first-quarter 2021, and payments for related employee taxes totaled $55 million in first-quarter 2022 and $19 million in first-quarter 2021. See Note 10 in our 2021 Form 10-K for a discussion of stock-based awards.
CONTRACTUAL OBLIGATIONS
Refer to Note 5 for further discussion of PT-FI’s $3.0 billion unsecured senior notes issued in April 2022. There have been no other material changes in our contractual obligations since December 31, 2021. Refer to Part II, Items 7. and 7A. in our 2021 Form 10-K, for information regarding our contractual obligations.
41
CONTINGENCIES
Environmental and Asset Retirement Obligations
Our current and historical operating activities are subject to stringent laws and regulations governing the protection of the environment. We perform a comprehensive annual review of our environmental and asset retirement obligations and also review changes in facts and circumstances associated with these obligations at least quarterly.
Refer to Note 8 for further discussion of increases in our asset retirement obligation at the Bagdad mine. There have been no other significant changes to our environmental and asset retirement obligations since December 31, 2021. Updated cost assumptions, including increases and decreases to cost estimates, changes in the anticipated scope and timing of remediation activities, and settlement of environmental matters may result in additional revisions to certain of our environmental obligations. Refer to Note 12 in our 2021 Form 10-K, for further information regarding our environmental and asset retirement obligations.
Litigation and Other Contingencies
There have been no material changes to our contingencies associated with legal proceedings, environmental and other matters since December 31, 2021. Refer to Note 12 and “Legal Proceedings” contained in Part I, Item 3. of our 2021 Form 10-K, as updated by Note 8, for further information regarding legal proceedings, environmental and other matters.
NEW ACCOUNTING STANDARDS
There were no significant updates to previously reported accounting standards included in Note 1 of our 2021 Form 10-K.
NET DEBT
Net debt, which we define as consolidated debt less consolidated cash and cash equivalents, is intended to provide investors with information related to the performance-based payout framework in our financial policy, which requires achievement of a net debt target in the range of $3 billion to $4 billion (excluding project debt for additional smelting capacity in Indonesia). This information differs from consolidated debt determined in accordance with U.S. GAAP and should not be considered in isolation or as a substitute for consolidated debt determined in accordance with U.S. GAAP. Our net debt follows, which may not be comparable to similarly titled measures reported by other companies (in millions):
| March 31, 2022 | December 31, 2021 | |||||||||||||
| Current portion of debt | $ | $ | ||||||||||||
| Long-term debt, less current portion | ||||||||||||||
Consolidated debta | 9,621 | 9,450 | ||||||||||||
| Less: consolidated cash and cash equivalents | ||||||||||||||
| Net debt | $ | 1,283 | $ | 1,382 | ||||||||||
a.Includes $603 million at March 31, 2022, and $432 million at December 31, 2021, associated with the Indonesia smelter projects (refer to Note 5).
42
PRODUCT REVENUES AND PRODUCTION COSTS
Unit net cash costs (credits) per pound of copper and molybdenum are measures intended to provide investors with information about the cash-generating capacity of our mining operations expressed on a basis relating to the primary metal product for the respective operations. We use this measure for the same purpose and for monitoring operating performance by our mining operations. This information differs from measures of performance determined in accordance with U.S. GAAP and should not be considered in isolation or as a substitute for measures of performance determined in accordance with U.S. GAAP. These measures are presented by other metals mining companies, although our measures may not be comparable to similarly titled measures reported by other companies.
We present gross profit per pound of copper in the following tables using both a “by-product” method and a “co-product” method. We use the by-product method in our presentation of gross profit per pound of copper because (i) the majority of our revenues are copper revenues, (ii) we mine ore, which contains copper, gold, molybdenum and other metals, (iii) it is not possible to specifically assign all of our costs to revenues from the copper, gold, molybdenum and other metals we produce and (iv) it is the method used by our management and Board to monitor our mining operations and to compare mining operations in certain industry publications. In the co-product method presentations, shared costs are allocated to the different products based on their relative revenue values, which will vary to the extent our metals sales volumes and realized prices change.
We show revenue adjustments for prior period open sales as a separate line item. Because these adjustments do not result from current period sales, these amounts have been reflected separately from revenues on current period sales. Noncash and other costs (credits), which are removed from site production and delivery costs in the calculation of unit net cash costs (credits), consist of items such as stock-based compensation costs, long-lived asset impairments, idle facility costs, restructuring and/or unusual charges (credits). As discussed above, gold, molybdenum and other metal revenues at copper mines are reflected as credits against site production and delivery costs in the by-product method. The following schedules are presentations under both the by-product and co-product methods together with reconciliations to amounts reported in our consolidated financial statements.
43
North America Copper Mines Product Revenues, Production Costs and Unit Net Cash Costs
| Three Months Ended March 31, 2022 | |||||||||||||||||||||||||||||||||||
| (In millions) | By-Product | Co-Product Method | |||||||||||||||||||||||||||||||||
| Method | Copper | Molybdenuma | Otherb | Total | |||||||||||||||||||||||||||||||
| Revenues, excluding adjustments | $ | 1,763 | $ | 1,763 | $ | 138 | $ | 27 | $ | 1,928 | |||||||||||||||||||||||||
| Site production and delivery, before net noncash and other costs shown below | 908 | 839 | 84 | 17 | 940 | ||||||||||||||||||||||||||||||
| By-product credits | (133) | — | — | — | — | ||||||||||||||||||||||||||||||
| Treatment charges | 36 | 35 | — | 1 | 36 | ||||||||||||||||||||||||||||||
| Net cash costs | 811 | 874 | 84 | 18 | 976 | ||||||||||||||||||||||||||||||
| DD&A | 105 | 96 | 7 | 2 | 105 | ||||||||||||||||||||||||||||||
| Noncash and other costs, net | 28 | 27 | 1 | — | 28 | ||||||||||||||||||||||||||||||
| Total costs | 944 | 997 | 92 | 20 | 1,109 | ||||||||||||||||||||||||||||||
| Other revenue adjustments, primarily for pricing on prior period open sales | 11 | 11 | — | — | 11 | ||||||||||||||||||||||||||||||
| Gross profit | $ | 830 | $ | 777 | $ | 46 | $ | 7 | $ | 830 | |||||||||||||||||||||||||
| Copper sales (millions of recoverable pounds) | 381 | 381 | |||||||||||||||||||||||||||||||||
Molybdenum sales (millions of recoverable pounds)a | 7 | ||||||||||||||||||||||||||||||||||
| Gross profit per pound of copper/molybdenum: | |||||||||||||||||||||||||||||||||||
| Revenues, excluding adjustments | $ | 4.62 | $ | 4.62 | $ | 17.97 | |||||||||||||||||||||||||||||
| Site production and delivery, before net noncash and other costs shown below | 2.38 | 2.20 | 10.95 | ||||||||||||||||||||||||||||||||
| By-product credits | (0.34) | — | — | ||||||||||||||||||||||||||||||||
| Treatment charges | 0.09 | 0.09 | — | ||||||||||||||||||||||||||||||||
| Unit net cash costs | 2.13 | 2.29 | 10.95 | ||||||||||||||||||||||||||||||||
| DD&A | 0.27 | 0.25 | 0.88 | ||||||||||||||||||||||||||||||||
| Noncash and other costs, net | 0.07 | 0.07 | 0.14 | ||||||||||||||||||||||||||||||||
| Total unit costs | 2.47 | 2.61 | 11.97 | ||||||||||||||||||||||||||||||||
| Other revenue adjustments, primarily for pricing on prior period open sales | 0.03 | 0.03 | — | ||||||||||||||||||||||||||||||||
| Gross profit per pound | $ | 2.18 | $ | 2.04 | $ | 6.00 | |||||||||||||||||||||||||||||
| Reconciliation to Amounts Reported | |||||||||||||||||||||||||||||||||||
| Revenues | Production and Delivery | DD&A | |||||||||||||||||||||||||||||||||
| Totals presented above | $ | 1,928 | $ | 940 | $ | 105 | |||||||||||||||||||||||||||||
| Treatment charges | (4) | 32 | — | ||||||||||||||||||||||||||||||||
| Noncash and other costs, net | — | 28 | — | ||||||||||||||||||||||||||||||||
| Other revenue adjustments, primarily for pricing on prior period open sales | 11 | — | — | ||||||||||||||||||||||||||||||||
| Eliminations and other | 16 | 18 | — | ||||||||||||||||||||||||||||||||
| North America copper mines | 1,951 | 1,018 | 105 | ||||||||||||||||||||||||||||||||
Other miningc | 6,376 | 3,847 | 368 | ||||||||||||||||||||||||||||||||
| Corporate, other & eliminations | (1,724) | (1,715) | 16 | ||||||||||||||||||||||||||||||||
| As reported in our consolidated financial statements | $ | 6,603 | $ | 3,150 | $ | 489 | |||||||||||||||||||||||||||||
a.Reflects sales of molybdenum produced by certain of the North America copper mines to our molybdenum sales company at market-based pricing.
b.Includes gold and silver product revenues and production costs.
c.Represents the combined total for our other segments, as presented in Note 9.
44
North America Copper Mines Product Revenues, Production Costs and Unit Net Cash Costs
| Three Months Ended March 31, 2021 | |||||||||||||||||||||||||||||||||||
| (In millions) | By-Product | Co-Product Method | |||||||||||||||||||||||||||||||||
| Method | Copper | Molybdenuma | Otherb | Total | |||||||||||||||||||||||||||||||
| Revenues, excluding adjustments | $ | 1,193 | $ | 1,193 | $ | 88 | $ | 34 | $ | 1,315 | |||||||||||||||||||||||||
| Site production and delivery, before net noncash and other costs shown below | 627 | 580 | 56 | 21 | 657 | ||||||||||||||||||||||||||||||
| By-product credits | (92) | — | — | — | — | ||||||||||||||||||||||||||||||
| Treatment charges | 33 | 31 | — | 2 | 33 | ||||||||||||||||||||||||||||||
| Net cash costs | 568 | 611 | 56 | 23 | 690 | ||||||||||||||||||||||||||||||
| DD&A | 80 | 74 | 4 | 2 | 80 | ||||||||||||||||||||||||||||||
| Noncash and other costs, net | 41 | 40 | — | 1 | 41 | ||||||||||||||||||||||||||||||
| Total costs | 689 | 725 | 60 | 26 | 811 | ||||||||||||||||||||||||||||||
| Other revenue adjustments, primarily for pricing on prior period open sales | 7 | 7 | — | — | 7 | ||||||||||||||||||||||||||||||
| Gross profit | $ | 511 | $ | 475 | $ | 28 | $ | 8 | $ | 511 | |||||||||||||||||||||||||
| Copper sales (millions of recoverable pounds) | 308 | 308 | |||||||||||||||||||||||||||||||||
Molybdenum sales (millions of recoverable pounds)a | 8 | ||||||||||||||||||||||||||||||||||
| Gross profit per pound of copper/molybdenum: | |||||||||||||||||||||||||||||||||||
| Revenues, excluding adjustments | $ | 3.88 | $ | 3.88 | $ | 10.49 | |||||||||||||||||||||||||||||
| Site production and delivery, before net noncash and other costs shown below | 2.04 | 1.89 | 6.67 | ||||||||||||||||||||||||||||||||
| By-product credits | (0.30) | — | — | ||||||||||||||||||||||||||||||||
| Treatment charges | 0.11 | 0.10 | — | ||||||||||||||||||||||||||||||||
Unit net cash costs | 1.85 | 1.99 | 6.67 | ||||||||||||||||||||||||||||||||
| DD&A | 0.26 | 0.24 | 0.46 | ||||||||||||||||||||||||||||||||
| Noncash and other costs, net | 0.13 | 0.13 | 0.06 | ||||||||||||||||||||||||||||||||
Total unit costs | 2.24 | 2.36 | 7.19 | ||||||||||||||||||||||||||||||||
| Other revenue adjustments, primarily for pricing on prior period open sales | 0.02 | 0.02 | — | ||||||||||||||||||||||||||||||||
| Gross profit per pound | $ | 1.66 | $ | 1.54 | $ | 3.30 | |||||||||||||||||||||||||||||
| Reconciliation to Amounts Reported | |||||||||||||||||||||||||||||||||||
| Revenues | Production and Delivery | DD&A | |||||||||||||||||||||||||||||||||
| Totals presented above | $ | 1,315 | $ | 657 | $ | 80 | |||||||||||||||||||||||||||||
| Treatment charges | (5) | 28 | — | ||||||||||||||||||||||||||||||||
| Noncash and other costs, net | — | 41 | — | ||||||||||||||||||||||||||||||||
| Other revenue adjustments, primarily for pricing on prior period open sales | 7 | — | — | ||||||||||||||||||||||||||||||||
| Eliminations and other | 21 | 23 | — | ||||||||||||||||||||||||||||||||
| North America copper mines | 1,338 | 749 | 80 | ||||||||||||||||||||||||||||||||
Other miningc | 4,645 | 3,041 | 323 | ||||||||||||||||||||||||||||||||
| Corporate, other & eliminations | (1,133) | (1,003) | 16 | ||||||||||||||||||||||||||||||||
| As reported in our consolidated financial statements | $ | 4,850 | $ | 2,787 | $ | 419 | |||||||||||||||||||||||||||||
a.Reflects sales of molybdenum produced by certain of the North America copper mines to our molybdenum sales company at market-based pricing.
b.Includes gold and silver product revenues and production costs.
c.Represents the combined total for our other segments, as presented in Note 9.
45
South America Mining Product Revenues, Production Costs and Unit Net Cash Costs
| Three Months Ended March 31, 2022 | |||||||||||||||||||||||||||||
| (In millions) | By-Product | Co-Product Method | |||||||||||||||||||||||||||
| Method | Copper | Othera | Total | ||||||||||||||||||||||||||
| Revenues, excluding adjustments | $ | 1,236 | $ | 1,236 | $ | 125 | $ | 1,361 | |||||||||||||||||||||
| Site production and delivery, before net noncash and other costs shown below | 640 | 587 | 67 | 654 | |||||||||||||||||||||||||
| By-product credits | (111) | — | — | — | |||||||||||||||||||||||||
| Treatment charges | 39 | 39 | — | 39 | |||||||||||||||||||||||||
| Royalty on metals | 3 | 3 | — | 3 | |||||||||||||||||||||||||
| Net cash costs | 571 | 629 | 67 | 696 | |||||||||||||||||||||||||
| DD&A | 97 | 88 | 9 | 97 | |||||||||||||||||||||||||
| Noncash and other costs, net | 17 | 16 | 1 | 17 | |||||||||||||||||||||||||
| Total costs | 685 | 733 | 77 | 810 | |||||||||||||||||||||||||
| Other revenue adjustments, primarily for pricing on prior period open sales | 55 | 55 | — | 55 | |||||||||||||||||||||||||
| Gross profit | $ | 606 | $ | 558 | $ | 48 | $ | 606 | |||||||||||||||||||||
| Copper sales (millions of recoverable pounds) | 264 | 264 | |||||||||||||||||||||||||||
| Gross profit per pound of copper: | |||||||||||||||||||||||||||||
| Revenues, excluding adjustments | $ | 4.69 | $ | 4.69 | |||||||||||||||||||||||||
| Site production and delivery, before net noncash and other costs shown below | 2.43 | 2.22 | |||||||||||||||||||||||||||
| By-product credits | (0.43) | — | |||||||||||||||||||||||||||
| Treatment charges | 0.15 | 0.15 | |||||||||||||||||||||||||||
| Royalty on metals | 0.01 | 0.01 | |||||||||||||||||||||||||||
| Unit net cash costs | 2.16 | 2.38 | |||||||||||||||||||||||||||
| DD&A | 0.37 | 0.33 | |||||||||||||||||||||||||||
| Noncash and other costs, net | 0.07 | 0.07 | |||||||||||||||||||||||||||
| Total unit costs | 2.60 | 2.78 | |||||||||||||||||||||||||||
| Other revenue adjustments, primarily for pricing on prior period open sales | 0.21 | 0.21 | |||||||||||||||||||||||||||
| Gross profit per pound | $ | 2.30 | $ | 2.12 | |||||||||||||||||||||||||
| Reconciliation to Amounts Reported | |||||||||||||||||||||||||||||
| Production | |||||||||||||||||||||||||||||
| Revenues | and Delivery | DD&A | |||||||||||||||||||||||||||
| Totals presented above | $ | 1,361 | $ | 654 | $ | 97 | |||||||||||||||||||||||
| Treatment charges | (39) | — | — | ||||||||||||||||||||||||||
| Royalty on metals | (3) | — | — | ||||||||||||||||||||||||||
| Noncash and other costs, net | — | 17 | — | ||||||||||||||||||||||||||
| Other revenue adjustments, primarily for pricing on prior period open sales | 55 | — | — | ||||||||||||||||||||||||||
| Eliminations and other | — | (1) | — | ||||||||||||||||||||||||||
| South America mining | 1,374 | 670 | 97 | ||||||||||||||||||||||||||
Other miningb | 6,953 | 4,195 | 376 | ||||||||||||||||||||||||||
| Corporate, other & eliminations | (1,724) | (1,715) | 16 | ||||||||||||||||||||||||||
| As reported in our consolidated financial statements | $ | 6,603 | $ | 3,150 | $ | 489 | |||||||||||||||||||||||
a.Includes silver sales of 1.0 million ounces ($23.36 per ounce average realized price). Also reflects sales of molybdenum produced by Cerro Verde to our molybdenum sales company at market-based pricing.
b.Represents the combined total for our other segments, as presented in Note 9.
46
South America Mining Product Revenues, Production Costs and Unit Net Cash Costs
| Three Months Ended March 31, 2021 | |||||||||||||||||||||||||||||
| (In millions) | By-Product | Co-Product Method | |||||||||||||||||||||||||||
| Method | Copper | Othera | Total | ||||||||||||||||||||||||||
| Revenues, excluding adjustments | $ | 1,026 | $ | 1,026 | $ | 65 | $ | 1,091 | |||||||||||||||||||||
| Site production and delivery, before net noncash and other costs shown below | 520 | 491 | 39 | 530 | |||||||||||||||||||||||||
| By-product credits | (55) | — | — | — | |||||||||||||||||||||||||
| Treatment charges | 35 | 35 | — | 35 | |||||||||||||||||||||||||
| Royalty on metals | 2 | 2 | — | 2 | |||||||||||||||||||||||||
| Net cash costs | 502 | 528 | 39 | 567 | |||||||||||||||||||||||||
| DD&A | 101 | 95 | 6 | 101 | |||||||||||||||||||||||||
| Noncash and other costs, net | 10 | 9 | 1 | 10 | |||||||||||||||||||||||||
| Total costs | 613 | 632 | 46 | 678 | |||||||||||||||||||||||||
| Other revenue adjustments, primarily for pricing on prior period open sales | 83 | 83 | — | 83 | |||||||||||||||||||||||||
| Gross profit | $ | 496 | $ | 477 | $ | 19 | $ | 496 | |||||||||||||||||||||
| Copper sales (millions of recoverable pounds) | 259 | 259 | |||||||||||||||||||||||||||
| Gross profit per pound of copper: | |||||||||||||||||||||||||||||
| Revenues, excluding adjustments | $ | 3.96 | $ | 3.96 | |||||||||||||||||||||||||
| Site production and delivery, before net noncash and other costs shown below | 2.01 | 1.90 | |||||||||||||||||||||||||||
| By-product credits | (0.21) | — | |||||||||||||||||||||||||||
| Treatment charges | 0.13 | 0.13 | |||||||||||||||||||||||||||
| Royalty on metals | 0.01 | 0.01 | |||||||||||||||||||||||||||
| Unit net cash costs | 1.94 | 2.04 | |||||||||||||||||||||||||||
| DD&A | 0.39 | 0.37 | |||||||||||||||||||||||||||
| Noncash and other costs, net | 0.04 | 0.03 | |||||||||||||||||||||||||||
| Total unit costs | 2.37 | 2.44 | |||||||||||||||||||||||||||
| Other revenue adjustments, primarily for pricing on prior period open sales | 0.32 | 0.32 | |||||||||||||||||||||||||||
| Gross profit per pound | $ | 1.91 | $ | 1.84 | |||||||||||||||||||||||||
| Reconciliation to Amounts Reported | |||||||||||||||||||||||||||||
| Production | |||||||||||||||||||||||||||||
| Revenues | and Delivery | DD&A | |||||||||||||||||||||||||||
| Totals presented above | $ | 1,091 | $ | 530 | $ | 101 | |||||||||||||||||||||||
| Treatment charges | (35) | — | — | ||||||||||||||||||||||||||
| Royalty on metals | (2) | — | — | ||||||||||||||||||||||||||
| Noncash and other costs, net | — | 10 | — | ||||||||||||||||||||||||||
| Other revenue adjustments, primarily for pricing on prior period open sales | 83 | — | — | ||||||||||||||||||||||||||
| Eliminations and other | — | (1) | — | ||||||||||||||||||||||||||
| South America mining | 1,137 | 539 | 101 | ||||||||||||||||||||||||||
Other miningb | 4,846 | 3,251 | 302 | ||||||||||||||||||||||||||
| Corporate, other & eliminations | (1,133) | (1,003) | 16 | ||||||||||||||||||||||||||
| As reported in our consolidated financial statements | $ | 4,850 | $ | 2,787 | $ | 419 | |||||||||||||||||||||||
a.Includes silver sales of 0.9 million ounces ($26.13 per ounce average realized price). Also reflects sales of molybdenum produced by Cerro Verde to our molybdenum sales company at market-based pricing.
b.Represents the combined total for our other segments, as presented in Note 9.
47
Indonesia Mining Product Revenues, Production Costs and Unit Net Cash (Credits) Costs
| Three Months Ended March 31, 2022 | |||||||||||||||||||||||||||||||||||
| (In millions) | By-Product | Co-Product Method | |||||||||||||||||||||||||||||||||
| Method | Copper | Gold | Silvera | Total | |||||||||||||||||||||||||||||||
| Revenues, excluding adjustments | $ | 1,778 | $ | 1,778 | $ | 780 | $ | 38 | $ | 2,596 | |||||||||||||||||||||||||
| Site production and delivery, before net noncash and other costs shown below | 534 | 366 | 160 | 8 | 534 | ||||||||||||||||||||||||||||||
| Gold and silver credits | (821) | — | — | — | — | ||||||||||||||||||||||||||||||
| Treatment charges | 93 | 64 | 28 | 1 | 93 | ||||||||||||||||||||||||||||||
| Export duties | 79 | 54 | 24 | 1 | 79 | ||||||||||||||||||||||||||||||
| Royalty on metals | 92 | 63 | 28 | 1 | 92 | ||||||||||||||||||||||||||||||
| Net cash (credits) costs | (23) | 547 | 240 | 11 | 798 | ||||||||||||||||||||||||||||||
| DD&A | 248 | 169 | 75 | 4 | 248 | ||||||||||||||||||||||||||||||
| Noncash and other costs, net | 27 | b | 19 | 8 | — | 27 | |||||||||||||||||||||||||||||
| Total costs | 252 | 735 | 323 | 15 | 1,073 | ||||||||||||||||||||||||||||||
| Other revenue adjustments, primarily for pricing on prior period open sales | 57 | 57 | 3 | — | 60 | ||||||||||||||||||||||||||||||
| PT Smelting intercompany loss | (53) | (36) | (16) | (1) | (53) | ||||||||||||||||||||||||||||||
| Gross profit | $ | 1,530 | $ | 1,064 | $ | 444 | $ | 22 | $ | 1,530 | |||||||||||||||||||||||||
| Copper sales (millions of recoverable pounds) | 379 | 379 | |||||||||||||||||||||||||||||||||
| Gold sales (thousands of recoverable ounces) | 406 | ||||||||||||||||||||||||||||||||||
| Gross profit per pound of copper/per ounce of gold: | |||||||||||||||||||||||||||||||||||
| Revenues, excluding adjustments | $ | 4.69 | $ | 4.69 | $ | 1,920 | |||||||||||||||||||||||||||||
| Site production and delivery, before net noncash and other costs shown below | 1.41 | 0.96 | 395 | ||||||||||||||||||||||||||||||||
| Gold and silver credits | (2.17) | — | — | ||||||||||||||||||||||||||||||||
| Treatment charges | 0.25 | 0.17 | 69 | ||||||||||||||||||||||||||||||||
| Export duties | 0.21 | 0.14 | 59 | ||||||||||||||||||||||||||||||||
| Royalty on metals | 0.24 | 0.17 | 69 | ||||||||||||||||||||||||||||||||
| Unit net cash (credits) costs | (0.06) | 1.44 | 592 | ||||||||||||||||||||||||||||||||
| DD&A | 0.66 | 0.45 | 183 | ||||||||||||||||||||||||||||||||
| Noncash and other costs, net | 0.07 | b | 0.05 | 20 | |||||||||||||||||||||||||||||||
| Total unit costs | 0.67 | 1.94 | 795 | ||||||||||||||||||||||||||||||||
| Other revenue adjustments, primarily for pricing on prior period open sales | 0.15 | 0.15 | 8 | ||||||||||||||||||||||||||||||||
| PT Smelting intercompany loss | (0.13) | (0.09) | (39) | ||||||||||||||||||||||||||||||||
| Gross profit per pound/ounce | $ | 4.04 | $ | 2.81 | $ | 1,094 | |||||||||||||||||||||||||||||
| Reconciliation to Amounts Reported | |||||||||||||||||||||||||||||||||||
| Production | |||||||||||||||||||||||||||||||||||
| Revenues | and Delivery | DD&A | |||||||||||||||||||||||||||||||||
| Totals presented above | $ | 2,596 | $ | 534 | $ | 248 | |||||||||||||||||||||||||||||
| Treatment charges | (93) | — | — | ||||||||||||||||||||||||||||||||
| Export duties | (79) | — | — | ||||||||||||||||||||||||||||||||
| Royalty on metals | (92) | — | — | ||||||||||||||||||||||||||||||||
| Noncash and other costs, net | 12 | 39 | — | ||||||||||||||||||||||||||||||||
| Other revenue adjustments, primarily for pricing on prior period open sales | 60 | — | — | ||||||||||||||||||||||||||||||||
| PT Smelting intercompany loss | — | 53 | — | ||||||||||||||||||||||||||||||||
| Indonesia mining | 2,404 | 626 | 248 | ||||||||||||||||||||||||||||||||
Other miningc | 5,923 | 4,239 | 225 | ||||||||||||||||||||||||||||||||
| Corporate, other & eliminations | (1,724) | (1,715) | 16 | ||||||||||||||||||||||||||||||||
| As reported in our consolidated financial statements | $ | 6,603 | $ | 3,150 | $ | 489 | |||||||||||||||||||||||||||||
a.Includes silver sales of 1.6 million ounces ($24.35 per ounce average realized price).
b.Includes charges of $41 million ($0.11 per pound of copper) associated with a settlement of an administrative fine levied by the Indonesia government and $18 million ($0.05 per pound of copper) associated with an adjustment to prior-period export duties, partly offset by credits of $30 million ($0.08 per pound of copper) associated with adjustments to prior year treatment and refining costs.
c.Represents the combined total for our other segments, as presented in Note 9.
48
Indonesia Mining Product Revenues, Production Costs and Unit Net Cash Costs
| Three Months Ended March 31, 2021 | |||||||||||||||||||||||||||||||||||
| (In millions) | By-Product | Co-Product Method | |||||||||||||||||||||||||||||||||
| Method | Copper | Gold | Silvera | Total | |||||||||||||||||||||||||||||||
| Revenues, excluding adjustments | $ | 1,032 | $ | 1,032 | $ | 437 | $ | 30 | $ | 1,499 | |||||||||||||||||||||||||
| Site production and delivery, before net noncash and other credits shown below | 383 | 264 | 112 | 7 | 383 | ||||||||||||||||||||||||||||||
| Gold and silver credits | (462) | — | — | — | — | ||||||||||||||||||||||||||||||
| Treatment charges | 65 | 45 | 19 | 1 | 65 | ||||||||||||||||||||||||||||||
| Export duties | 29 | 20 | 8 | 1 | 29 | ||||||||||||||||||||||||||||||
| Royalty on metals | 61 | 42 | 18 | 1 | 61 | ||||||||||||||||||||||||||||||
| Net cash costs | 76 | 371 | 157 | 10 | 538 | ||||||||||||||||||||||||||||||
| DD&A | 199 | 137 | 58 | 4 | 199 | ||||||||||||||||||||||||||||||
| Noncash and other credits, net | (8) | b | (6) | (2) | — | (8) | |||||||||||||||||||||||||||||
| Total costs | 267 | 502 | 213 | 14 | 729 | ||||||||||||||||||||||||||||||
| Other revenue adjustments, primarily for pricing on prior period open sales | 65 | 65 | (5) | — | 60 | ||||||||||||||||||||||||||||||
| PT Smelting intercompany loss | (49) | (34) | (14) | (1) | (49) | ||||||||||||||||||||||||||||||
| Gross profit | $ | 781 | $ | 561 | $ | 205 | $ | 15 | $ | 781 | |||||||||||||||||||||||||
| Copper sales (millions of recoverable pounds) | 258 | 258 | |||||||||||||||||||||||||||||||||
| Gold sales (thousands of recoverable ounces) | 256 | ||||||||||||||||||||||||||||||||||
| Gross profit per pound of copper/per ounce of gold: | |||||||||||||||||||||||||||||||||||
| Revenues, excluding adjustments | $ | 4.00 | $ | 4.00 | $ | 1,713 | |||||||||||||||||||||||||||||
| Site production and delivery, before net noncash and other costs shown below | 1.48 | 1.02 | 438 | ||||||||||||||||||||||||||||||||
| Gold and silver credits | (1.79) | — | — | ||||||||||||||||||||||||||||||||
| Treatment charges | 0.25 | 0.17 | 74 | ||||||||||||||||||||||||||||||||
| Export duties | 0.11 | 0.08 | 33 | ||||||||||||||||||||||||||||||||
| Royalty on metals | 0.24 | 0.16 | 71 | ||||||||||||||||||||||||||||||||
| Unit net cash costs | 0.29 | 1.43 | 616 | ||||||||||||||||||||||||||||||||
| DD&A | 0.77 | 0.53 | 228 | ||||||||||||||||||||||||||||||||
| Noncash and other credits, net | (0.03) | b | (0.02) | (10) | |||||||||||||||||||||||||||||||
| Total unit costs | 1.03 | 1.94 | 834 | ||||||||||||||||||||||||||||||||
| Other revenue adjustments, primarily for pricing on prior period open sales | 0.25 | 0.25 | (19) | ||||||||||||||||||||||||||||||||
| PT Smelting intercompany loss | (0.20) | (0.14) | (56) | ||||||||||||||||||||||||||||||||
| Gross profit per pound/ounce | $ | 3.02 | $ | 2.17 | $ | 804 | |||||||||||||||||||||||||||||
| Reconciliation to Amounts Reported | |||||||||||||||||||||||||||||||||||
| Production | |||||||||||||||||||||||||||||||||||
| Revenues | and Delivery | DD&A | |||||||||||||||||||||||||||||||||
| Totals presented above | $ | 1,499 | $ | 383 | $ | 199 | |||||||||||||||||||||||||||||
| Treatment charges | (65) | — | — | ||||||||||||||||||||||||||||||||
| Export duties | (29) | — | — | ||||||||||||||||||||||||||||||||
| Royalty on metals | (61) | — | — | ||||||||||||||||||||||||||||||||
| Noncash and other credits, net | 31 | 23 | — | ||||||||||||||||||||||||||||||||
| Other revenue adjustments, primarily for pricing on prior period open sales | 60 | — | — | ||||||||||||||||||||||||||||||||
| PT Smelting intercompany loss | — | 49 | — | ||||||||||||||||||||||||||||||||
| Indonesia mining | 1,435 | 455 | 199 | ||||||||||||||||||||||||||||||||
Other miningc | 4,548 | 3,335 | 204 | ||||||||||||||||||||||||||||||||
| Corporate, other & eliminations | (1,133) | (1,003) | 16 | ||||||||||||||||||||||||||||||||
| As reported in our consolidated financial statements | $ | 4,850 | $ | 2,787 | $ | 419 | |||||||||||||||||||||||||||||
a.Includes silver sales of 1.2 million ounces ($24.61 per ounce average realized price).
b.Includes credits of $31 million ($0.12 per pound of copper) associated with adjustments to prior year treatment and refining costs. Also includes a charge of $13 million ($0.05 per pound of copper) associated with a potential settlement of an administrative fine levied by the Indonesia government.
c.Represents the combined total for our other segments, as presented in Note 9.
49
Molybdenum Mines Product Revenues, Production Costs and Unit Net Cash Costs
| Three Months Ended March 31, | ||||||||||||||||||||||||||
| (In millions) | 2022 | 2021 | ||||||||||||||||||||||||
Revenues, excluding adjustmentsa | $ | 134 | $ | 76 | ||||||||||||||||||||||
| Site production and delivery, before net noncash and other costs shown below | 72 | 54 | ||||||||||||||||||||||||
| Treatment charges and other | 6 | 6 | ||||||||||||||||||||||||
| Net cash costs | 78 | 60 | ||||||||||||||||||||||||
| DD&A | 16 | 15 | ||||||||||||||||||||||||
| Noncash and other costs, net | 3 | 4 | ||||||||||||||||||||||||
| Total costs | 97 | 79 | ||||||||||||||||||||||||
| Gross profit (loss) | $ | 37 | $ | (3) | ||||||||||||||||||||||
Molybdenum sales (millions of recoverable pounds)a | 7 | 7 | ||||||||||||||||||||||||
| Gross profit (loss) per pound of molybdenum: | ||||||||||||||||||||||||||
Revenues, excluding adjustmentsa | $ | 18.75 | $ | 11.38 | ||||||||||||||||||||||
| Site production and delivery, before net noncash and other costs shown below | 10.04 | 8.13 | ||||||||||||||||||||||||
| Treatment charges and other | 0.85 | 0.85 | ||||||||||||||||||||||||
| Unit net cash costs | 10.89 | 8.98 | ||||||||||||||||||||||||
| DD&A | 2.27 | 2.23 | ||||||||||||||||||||||||
| Noncash and other costs, net | 0.40 | 0.55 | ||||||||||||||||||||||||
| Total unit costs | 13.56 | 11.76 | ||||||||||||||||||||||||
| Gross profit (loss) per pound | $ | 5.19 | $ | (0.38) | ||||||||||||||||||||||
| Reconciliation to Amounts Reported | ||||||||||||||||||||||||||
| Production | ||||||||||||||||||||||||||
| Three Months Ended March 31, 2022 | Revenues | and Delivery | DD&A | |||||||||||||||||||||||
| Totals presented above | $ | 134 | $ | 72 | $ | 16 | ||||||||||||||||||||
| Treatment charges and other | (6) | — | — | |||||||||||||||||||||||
| Noncash and other costs, net | — | 3 | — | |||||||||||||||||||||||
| Molybdenum mines | 128 | 75 | 16 | |||||||||||||||||||||||
Other miningb | 8,199 | 4,790 | 457 | |||||||||||||||||||||||
| Corporate, other & eliminations | (1,724) | (1,715) | 16 | |||||||||||||||||||||||
| As reported in our consolidated financial statements | $ | 6,603 | $ | 3,150 | $ | 489 | ||||||||||||||||||||
| Three Months Ended March 31, 2021 | ||||||||||||||||||||||||||
| Totals presented above | $ | 76 | $ | 54 | $ | 15 | ||||||||||||||||||||
| Treatment charges and other | (6) | — | — | |||||||||||||||||||||||
| Noncash and other costs, net | — | 4 | — | |||||||||||||||||||||||
| Molybdenum mines | 70 | 58 | 15 | |||||||||||||||||||||||
Other miningb | 5,913 | 3,732 | 388 | |||||||||||||||||||||||
| Corporate, other & eliminations | (1,133) | (1,003) | 16 | |||||||||||||||||||||||
| As reported in our consolidated financial statements | $ | 4,850 | $ | 2,787 | $ | 419 | ||||||||||||||||||||
a.Reflects sales of the Molybdenum mines’ production to our molybdenum sales company at market-based pricing. On a consolidated basis, realizations are based on the actual contract terms for sales to third parties; as a result, our consolidated average realized price per pound of molybdenum will differ from the amounts reported in this table.
b.Represents the combined total for our other segments, as presented in Note 9. Also includes amounts associated with our molybdenum sales company, which includes sales of molybdenum produced by the Molybdenum mines and by certain of the North America and South America copper mines.
50
CAUTIONARY STATEMENT
Our discussion and analysis contains forward-looking statements in which we discuss our potential future performance. Forward-looking statements are all statements other than statements of historical facts, such as plans, projections, or expectations relating to business outlook, strategy, goals or targets; ore grades and milling rates; production and sales volumes; unit net cash costs; capital expenditures; operating costs; operating plans; cash flows; liquidity; PT-FI’s financing, construction and completion of additional domestic smelting capacity in Indonesia in accordance with the terms of the special mining license (IUPK); our commitments to deliver responsibly produced copper, including plans to implement and validate all of our operating sites under the Copper Mark and to comply with other disclosure frameworks; execution of our energy and climate strategies and the underlying assumptions and estimated impacts on our business related thereto; achievement of climate commitments and net zero aspirations; improvements in operating procedures and technology innovations; exploration efforts and results; development and production activities, rates and costs; future organic growth opportunities; tax rates; export quotas and duties; the impact of copper, gold and molybdenum price changes; the impact of deferred intercompany profits on earnings; mineral reserve and mineral resource estimates; final resolution of settlements associated with ongoing legal proceedings; and the ongoing implementation of our financial policy and future returns to shareholders, including dividend payments (base or variable) and share repurchases. The words “anticipates,” “may,” “can,” “plans,” “believes,” “estimates,” “expects,” “projects,” "targets," “intends,” “likely,” “will,” “should,” “could,” “to be,” ”potential," “assumptions,” “guidance,” “aspirations,” “future” and any similar expressions are intended to identify those assertions as forward-looking statements. The declaration and payment of dividends (base or variable) and timing and amount of any share repurchases is at the discretion of the Board and management, respectively, and is subject to a number of factors, including maintaining our net debt target, capital availability, our financial results, cash requirements, business prospects, global economic conditions, changes in laws, contractual restrictions and other factors deemed relevant by the Board or management, as applicable. The share repurchase program may be modified, increased, suspended or terminated at any time at the Board’s discretion.
We caution readers that forward-looking statements are not guarantees of future performance and actual results may differ materially from those anticipated, expected, projected or assumed in the forward-looking statements. Important factors that can cause our actual results to differ materially from those anticipated in the forward-looking statements include, but are not limited to, supply of and demand for; and prices of the commodities we produce, primarily copper; changes in our cash requirements, financial position, financing or investment plans; changes in general market, economic, tax, regulatory or industry conditions, including as a result of Russia’s invasion of Ukraine; reductions in liquidity and access to capital; the ongoing COVID-19 pandemic and any future public health crisis; political and social risks; operational risks inherent in mining, with higher inherent risks in underground mining; fluctuations in price and availability of commodities purchased; constraints on supply, logistics and transportation services; mine sequencing; changes in mine plans or operational modifications, delays, deferrals or cancellations; production rates; timing of shipments; results of technical, economic or feasibility studies; potential inventory adjustments; potential impairment of long-lived mining assets; the potential effects of violence in Indonesia generally and in the province of Papua; the Indonesia government's extension of PT-FI's export license after March 19, 2023; satisfaction of requirements in accordance with PT-FI's IUPK to extend mining rights from 2031 through 2041; the Indonesia government's approval of a deferred schedule for completion of additional domestic smelting capacity in Indonesia; cybersecurity incidents; labor relations, including labor-related work stoppages and costs; the results of the human health assessment to evaluate the potential impacts of tailings and mining waste, and compliance with applicable environmental, health and safety laws and regulations; weather- and climate-related risks; environmental risks and litigation results; our ability to comply with our responsible production commitments under specific frameworks and any changes to such frameworks and other factors described in more detail under the heading “Risk Factors” contained in Part I, Item 1A. of our 2021 Form 10-K.
Investors are cautioned that many of the assumptions upon which our forward-looking statements are based are likely to change after the date the forward-looking statements are made, including for example commodity prices, which we cannot control, and production volumes and costs or technological solutions and innovation, some aspects of which we may not be able to control. Further, we may make changes to our business plans that could affect our results. We caution investors that we undertake no obligation to update any forward-looking statements, which speak only as of the date made, notwithstanding any changes in our assumptions, changes in business plans, actual experience or other changes.
This report on Form 10-Q also contains financial measures such as net debt and unit net cash costs (credits) per pound of copper and molybdenum, which are not recognized under U.S. GAAP. Refer to “Operations – Unit Net Cash Costs (Credits)” for further discussion of unit net cash costs (credits) associated with our operating divisions, and to “Product Revenues and Production Costs” for reconciliations of per pound costs by operating division to
51
production and delivery costs applicable to sales reported in our consolidated financial statements. Refer to “Net Debt” for reconciliations of debt and consolidated cash and cash equivalents to net debt.
Item 3.Quantitative and Qualitative Disclosures About Market Risk.
There have been no material changes in our market risks during the three-month period ended March 31, 2022.
For additional information on market risks, refer to “Disclosures About Market Risks” included in Part II, Items 7. and 7A. of our 2021 Form 10-K. For projected sensitivities of our operating cash flow to changes in commodity prices, refer to “Outlook” in Part I, Item 2. of this quarterly report on Form 10-Q; for projected sensitivities of our provisionally priced copper sales to changes in commodity prices refer to “Consolidated Results – Revenues” in Part I, Item 2. of this quarterly report on Form 10-Q.
Item 4.Controls and Procedures.
(a)Evaluation of disclosure controls and procedures. Our chief executive officer and chief financial officer, with the participation of management, have evaluated the effectiveness of our “disclosure controls and procedures” (as defined in Rules 13a-15(e) and 15d-15(e) under the Securities Exchange Act of 1934) as of the end of the period covered by this quarterly report on Form 10-Q. Based on their evaluation, they have concluded that our disclosure controls and procedures were effective as of March 31, 2022.
(b)Changes in internal control over financial reporting. There has been no change in our internal control over financial reporting that occurred during the quarter ended March 31, 2022, that has materially affected, or is reasonably likely to materially affect, our internal control over financial reporting.
Part II.OTHER INFORMATION
Item 1.Legal Proceedings.
We are involved in numerous legal proceedings that arise in the ordinary course of our business or are associated with environmental issues. We are also involved periodically in reviews, inquiries, investigations and other proceedings initiated by or involving government agencies, some of which may result in adverse judgments, settlements, fines, penalties, injunctions or other relief.
Management does not believe, based on currently available information, that the outcome of any legal proceeding reported in Part I, Item 3. “Legal Proceedings” and Note 12 of our 2021 Form 10-K, and Note 8 herein, will have a material adverse effect on our financial condition; although individual or cumulative outcomes could be material to our operating results for a particular period, depending on the nature and magnitude of the outcome and the operating results for the period.
There have been no material changes to legal proceedings previously disclosed in Part I, Item 3. “Legal Proceedings” and Note 12 of our 2021 Form 10-K.
52
Item 1A. Risk Factors.
There have been no material changes to our risk factors previously disclosed in Part I, Item 1A. “Risk Factors” of our 2021 Form 10-K.
Item 2.Unregistered Sales of Equity Securities and Use of Proceeds.
There were no unregistered sales of equity securities during the three months ended March 31, 2022.
The following table sets forth information with respect to shares of FCX common stock purchased by us during the three months ended March 31, 2022, and the approximate dollar value of shares that may yet be purchased pursuant to our share repurchase program:
| Period | (a) Total Number of Shares Purchased | (b) Average Price Paid Per Share | (c) Total Number of Shares Purchased as Part of Publicly Announced Plans or Programsa | (d) Approximate Dollar Value of Shares That May Yet Be Purchased Under the Plans or Programsa | ||||||||||||||||||||||
| January 1-31, 2022 | 2,630,474 | $ | 42.46 | 2,630,474 | $ | 2,400,065,904 | ||||||||||||||||||||
| February 1-28, 2022 | 5,021,731 | b | $ | 41.05 | 4,858,739 | $ | 2,201,152,367 | |||||||||||||||||||
| March 1-31, 2022 | 4,791,738 | $ | 48.01 | 4,791,738 | $ | 1,971,105,007 | ||||||||||||||||||||
| Total | 12,443,943 | $ | 44.03 | 12,280,951 | ||||||||||||||||||||||
a.On November 1, 2021, our Board approved a share repurchase program authorizing repurchases of up to $3.0 billion of our common stock. The share repurchase program does not obligate us to acquire any specific amount of shares and does not have an expiration date.
b.Includes 162,992 shares acquired in connection with stock option exercises during the period shown. All other share repurchases were made under our publicly announced program.
Item 4.Mine Safety Disclosures.
The safety and health of all employees is our highest priority. Management believes that safety and health considerations are integral to, and compatible with, all other functions in the organization and that proper safety and health management will enhance production and reduce costs. Our approach towards the safety and health of our workforce is to continuously improve performance through implementing robust management systems and providing adequate training, safety incentive and occupational health programs. The information concerning mine safety violations or other regulatory matters required by Section 1503(a) of the Dodd-Frank Wall Street Reform and Consumer Protection Act and Item 104 of Regulation S-K is included in Exhibit 95.1 to this quarterly report on Form 10-Q.
53
Item 6.Exhibits.
| Filed | |||||||||||||||||
| Exhibit | with this | Incorporated by Reference | |||||||||||||||
| Number | Exhibit Title | Form 10-Q | Form | File No. | Date Filed | ||||||||||||
2.1* | PT-FI Divestment Agreement dated as of September 27, 2018 among FCX, International Support LLC, PT Freeport Indonesia, PT Indocopper Investama and PT Indonesia Asahan Aluminium (Persero). | 10-Q | 001-11307-01 | 11/9/2018 | |||||||||||||
| Supplemental and Amendment Agreement to the PT-FI Divestment Agreement, dated December 21, 2018, among FCX, PT Freeport Indonesia, PT Indonesia Papua Metal Dan Mineral (f/k/a PT Indocopper Investama), PT Indonesia Asahan Aluminium (Persero) and International Support LLC. | 10-K | 001-11307-01 | 2/15/2019 | ||||||||||||||
| Amended and Restated Certificate of Incorporation of FCX, effective as of June 8, 2016. | 8-K | 001-11307-01 | 6/9/2016 | ||||||||||||||
| Amended and Restated By-Laws of FCX, effective as of June 3, 2020. | 8-K | 001-11307-01 | 6/3/2020 | ||||||||||||||
| Concentrate Purchase and Sales Agreement dated effective December 11, 1996, between PT Freeport Indonesia and PT Smelting. | S-3 | 001-11307-01 | 11/5/2001 | ||||||||||||||
| Amendment No. 1 dated as of March 19, 1998, Amendment No. 2 dated as of December 1, 2000, Amendment No. 3 dated as of January 1, 2003, Amendment No. 4 dated as of May 10, 2004, Amendment No. 5 dated as of March 19, 2009, Amendment No. 6 dated as of January 1, 2011, and Amendment No. 7 dated as of October 29, 2012, to the Concentrate Purchase and Sales Agreement dated effective December 11, 1996, between PT Freeport Indonesia and PT Smelting. | 10-K | 001-11307-01 | 2/27/2015 | ||||||||||||||
| Amendment No. 9 dated as of April 10, 2017 to the Concentrate Purchase and Sales Agreement dated December 11,1996 between PT Freeport Indonesia and PT Smelting. | 10-K | 001-11307-01 | 2/20/2018 | ||||||||||||||
| Amendment No. 10 dated as of March 5, 2020, Amendment No. 11 dated as of March 31, 2021, Amendment No. 12 dated as of October 13, 2021, and Amendment No. 13 dated as of November 30, 2021, to the Concentrate Purchase and Sales Agreement dated effective December 11, 1996, between PT Freeport Indonesia and PT Smelting. | X | ||||||||||||||||
| Letter from Ernst & Young LLP regarding unaudited interim financial statements. | X | ||||||||||||||||
List of Subsidiary Guarantors and Subsidiary Issuers of Guaranteed Securities. | 10-K | 001-11307-01 | 2/15/2022 | ||||||||||||||
| Certification of Principal Executive Officer pursuant to Rule 13a-14(a)/15d – 14(a). | X | ||||||||||||||||
| Certification of Principal Financial Officer pursuant to Rule 13a-14(a)/15d – 14(a). | X | ||||||||||||||||
| Certification of Principal Executive Officer pursuant to 18 U.S.C. Section 1350. | X | ||||||||||||||||
| Certification of Principal Financial Officer pursuant to 18 U.S.C Section 1350. | X | ||||||||||||||||
| Mine Safety and Health Administration Safety Data. | X | ||||||||||||||||
| 101.INS | XBRL Instance Document- the XBRL Instance Document does not appear in the Interactive Data File because its XBRL tags are embedded within the Inline XBRL document. | X | |||||||||||||||
| 101.SCH | Inline XBRL Taxonomy Extension Schema. | X | |||||||||||||||
| 101.CAL | Inline XBRL Taxonomy Extension Calculation Linkbase. | X | |||||||||||||||
| 101.DEF | Inline XBRL Taxonomy Extension Definition Linkbase. | X | |||||||||||||||
| 101.LAB | Inline XBRL Taxonomy Extension Label Linkbase. | X | |||||||||||||||
54
| Filed | |||||||||||||||||
| Exhibit | with this | Incorporated by Reference | |||||||||||||||
| Number | Exhibit Title | Form 10-Q | Form | File No. | Date Filed | ||||||||||||
| 101.PRE | Inline XBRL Taxonomy Extension Presentation Linkbase. | X | |||||||||||||||
| 104 | The cover page from this Quarterly Report on Form 10-Q, formatted in Inline XBRL. | X | |||||||||||||||
* The registrant agrees to furnish supplementally to the Securities and Exchange Commission (SEC) a copy of any omitted schedule or exhibit upon the request of the SEC in accordance with Item 601(a)(5) of Regulation S-K.
55
SIGNATURE
Pursuant to the requirements of the Securities Exchange Act of 1934, the registrant has duly caused this report to be signed on its behalf by the undersigned thereunto duly authorized.
| Freeport-McMoRan Inc. | ||||||||
| By: | /s/ C. Donald Whitmire, Jr. | |||||||
| C. Donald Whitmire, Jr. | ||||||||
| Vice President and | ||||||||
| Controller - Financial Reporting | ||||||||
| (authorized signatory | ||||||||
| and Principal Accounting Officer) | ||||||||
Date: May 5, 2022
S-1
Serious News for Serious Traders! Try StreetInsider.com Premium Free!
You May Also Be Interested In
- Freeport-McMoRan (FCX) PT Lowered to $53 at Scotiabank
- Rubrik Announces Pricing of Upsized Initial Public Offering
- Freeport-McMoran (FCX) April weekly option implied volatility into quarter results
Create E-mail Alert Related Categories
SEC FilingsSign up for StreetInsider Free!
Receive full access to all new and archived articles, unlimited portfolio tracking, e-mail alerts, custom newswires and RSS feeds - and more!
