

Form 10-Q CONSTELLATION BRANDS, For: May 31
 Tweet
Tweet Share
ShareUNITED STATES
SECURITIES AND EXCHANGE COMMISSION
Washington, D.C. 20549
FORM 10-Q
(Mark One)
| QUARTERLY REPORT PURSUANT TO SECTION 13 OR 15(d) OF THE SECURITIES EXCHANGE ACT OF 1934 | |||||
For the quarterly period ended May 31, 2022
or
| TRANSITION REPORT PURSUANT TO SECTION 13 OR 15(d) OF THE SECURITIES EXCHANGE ACT OF 1934 | |||||
For the transition period from to
Commission File Number: 001-08495

(Exact name of registrant as specified in its charter)
| (State or other jurisdiction of incorporation or organization) | (I.R.S. Employer Identification No.) | ||||
(Address of principal executive offices) (Zip code)
(585 ) 678-7100
(Registrant’s telephone number, including area code)
Not Applicable
(Former name, former address and former fiscal year, if changed since last report)
Securities registered pursuant to Section 12(b) of the Act:
| Title of Each Class | Trading Symbol(s) | Name of Each Exchange on Which Registered | ||||||
Indicate by check mark whether the registrant (1) has filed all reports required to be filed by Section 13 or 15(d) of the Securities Exchange Act of 1934 during the preceding 12 months (or for such shorter period that the registrant was required to file such reports), and (2) has been subject to such filing requirements for the past 90 days. ☒ Yes ☐ No
Indicate by check mark whether the registrant has submitted electronically every Interactive Data File required to be submitted pursuant to Rule 405 of Regulation S-T (§232.405 of this chapter) during the preceding 12 months (or for such shorter period that the registrant was required to submit such files). ☒ Yes ☐ No
Indicate by check mark whether the registrant is a large accelerated filer, an accelerated filer, a non-accelerated filer, a smaller reporting company, or an emerging growth company. See the definitions of “large accelerated filer,” “accelerated filer,” “smaller reporting company,” and “emerging growth company” in Rule 12b-2 of the Exchange Act.
| ☒ | Accelerated filer | ☐ | |||||||||
| Non-accelerated filer | ☐ | Smaller reporting company | |||||||||
| Emerging growth company | |||||||||||
If an emerging growth company, indicate by check mark if the registrant has elected not to use the extended transition period for complying with any new or revised financial accounting standards provided pursuant to Section 13(a) of the Exchange Act. ☐
Indicate by check mark whether the registrant is a shell company (as defined in Rule 12b-2 of the Exchange Act).
Yes ☐ No ☒
There were 159,330,225 shares of Class A Common Stock, 23,205,885 shares of Class B Common Stock, and 2,248,714 shares of Class 1 Common Stock outstanding as of June 24, 2022.
TABLE OF CONTENTS
| Page | ||||||||
| DEFINED TERMS | ||||||||
| PART I - FINANCIAL INFORMATION | ||||||||
| Item 1. Financial Statements | ||||||||
| Consolidated Balance Sheets | ||||||||
| Consolidated Statements of Comprehensive Income (Loss) | ||||||||
| Consolidated Statements of Changes in Stockholders’ Equity | ||||||||
| Consolidated Statements of Cash Flows | ||||||||
| Notes to Consolidated Financial Statements | ||||||||
1. Basis of Presentation | ||||||||
2. Inventories | ||||||||
3. Derivative Instruments | ||||||||
4. Fair Value of Financial Instruments | ||||||||
5. Goodwill | ||||||||
6. Intangible Assets | ||||||||
7. Equity Method Investments | ||||||||
8. Borrowings | ||||||||
9. Income Taxes | ||||||||
10. Stockholders' Equity | ||||||||
11. Net Income (Loss) Per Common Share Attributable to CBI | ||||||||
12. Comprehensive Income (Loss) Attributable to CBI | ||||||||
13. Business Segment Information | ||||||||
| Item 2. Management’s Discussion and Analysis of Financial Condition and Results of Operations | ||||||||
| Item 3. Quantitative and Qualitative Disclosures About Market Risk | ||||||||
| Item 4. Controls and Procedures | ||||||||
| PART II – OTHER INFORMATION | ||||||||
| Item 1A. Risk Factors | ||||||||
| Item 2. Unregistered Sales of Equity Securities and Use of Proceeds | ||||||||
| Item 6. Exhibits | ||||||||
| INDEX TO EXHIBITS | ||||||||
| SIGNATURES | ||||||||
This Form 10-Q contains “forward-looking statements” within the meaning of Section 27A of the Securities Act and Section 21E of the Exchange Act. These forward-looking statements are subject to a number of risks and uncertainties, many of which are beyond the Company’s control, that could cause actual results to differ materially from those set forth in, or implied by, such forward-looking statements. For further information regarding such forward-looking statements, risks, and uncertainties, please see “Information Regarding Forward-Looking Statements” under Part I – Item 2. “Management’s Discussion and Analysis of Financial Condition and Results of Operations.”
Defined Terms
Unless the context otherwise requires, the terms “Company,” “CBI,” “we,” “our,” or “us” refer to Constellation Brands, Inc. and its subsidiaries. We use terms in this Form 10-Q and in our Notes that are specific to us or are abbreviations that may not be commonly known or used.
| Term | Meaning | ||||
| $ | U.S. dollars | ||||
| 3.20% February 2018 Senior Notes | $600.0 million principal amount of 3.20% senior notes issued in February 2018, partially tendered in May 2022, and fully redeemed in June 2022, prior to maturity | ||||
| 4.25% May 2013 Senior Notes | $1,050.0 million principal amount of 4.25% senior notes issued in May 2013, partially tendered in May 2022, and fully redeemed in June 2022, prior to maturity | ||||
| 2018 Authorization | authority to repurchase up to $3.0 billion of our Class A Stock and Class B Stock, authorized in January 2018 by our Board of Directors | ||||
| 2020 U.S. wildfires | significant wildfires that broke out in California, Oregon, and Washington states which affected the 2020 U.S. grape harvest | ||||
| 2021 Authorization | authority to repurchase up to $2.0 billion of our Class A Stock and Class B Stock, authorized in January 2021 by our Board of Directors | ||||
| 2022 Annual Report | our Annual Report on Form 10-K for the fiscal year ended February 28, 2022, unless otherwise specified | ||||
| 2022 Credit Agreement | tenth amended and restated credit agreement, dated as of April 14, 2022, provides for an aggregate revolving credit facility of $2.25 billion | ||||
| 2022 Restatement Agreement | restatement agreement, dated as of April 14, 2022, that amended and restated the ninth amended and restated agreement, dated as of March 26, 2020, which was our then-existing senior credit facility as of February 28, 2022 | ||||
| 2022 Term Credit Agreement | June 2021 Term Credit Agreement, inclusive of amendment dated as of April 14, 2022 | ||||
| 3-tier | distribution channel where products are sold to a distributor (wholesaler) who then sells to a retailer; the retailer sells the products to a consumer | ||||
| 3-tier eCommerce | digital commerce experience for our consumers to purchase beverage alcohol from retailers | ||||
| ABA | alternative beverage alcohol | ||||
| Acreage | Acreage Holdings, Inc. | ||||
| Acreage Financial Instrument | a call option for Canopy to acquire 70% of the shares of Acreage at a fixed exchange ratio and 30% at a floating exchange ratio | ||||
| Acreage Transaction | Canopy’s intention to acquire Acreage upon U.S. federal cannabis legalization, subject to certain conditions | ||||
| Administrative Agent | Bank of America, N.A., as administrative agent for the senior credit facility and term credit agreement | ||||
| AOCI | accumulated other comprehensive income (loss) | ||||
| ASR | accelerated share repurchase agreement with a third-party financial institution | ||||
| Austin Cocktails | we made an initial investment in the Austin Cocktails business and subsequently acquired the remaining ownership interest | ||||
| C$ | Canadian dollars | ||||
| Canopy | we made an investment in Canopy Growth Corporation, an Ontario, Canada-based public company | ||||
| Canopy Debt Securities | convertible debt securities issued by Canopy | ||||
| Canopy Equity Method Investment | November 2017 Canopy Investment, November 2018 Canopy Investment, and May 2020 Canopy Investment, collectively | ||||
| Canopy Strategic Transaction(s) | any potential acquisition, divestiture, investment, or other similar transaction made by Canopy, including but not limited to the Acreage Transaction | ||||
Constellation Brands, Inc. Q1 FY 2023 Form 10-Q | #WORTHREACHINGFOR I i | ||||
| Term | Meaning | ||||
| CARES Act | Coronavirus Aid, Relief, and Economic Security Act | ||||
CB International | CB International Finance S.à r.l., a wholly-owned subsidiary of ours | ||||
| Charter Amendment | amendment and restatement of our Restated Certificate of Incorporation to effect the Reclassification | ||||
| Class 1 Stock | our Class 1 Convertible Common Stock, par value $0.01 per share | ||||
| Class A Stock | our Class A Common Stock, par value $0.01 per share | ||||
| Class B Stock | our Class B Convertible Common Stock, par value $0.01 per share | ||||
| CODM | chief operating decision maker | ||||
| Comparable Adjustments | certain items affecting comparability that have been excluded by management | ||||
| DEI | diversity, equity, and inclusion | ||||
| Depletions | represent U.S. domestic distributor shipments of our respective branded products to retail customers, based on third-party data | ||||
| Digital Business Acceleration | a phased initiative by the Company to create a cohesive digital strategy and build an advanced digital business in the coming years | ||||
| DTC | direct-to-consumer; a digital commerce experience for consumers to purchase directly from brand websites with inventory coming straight from the supplier | ||||
| Effective Time | the time of filing the Charter Amendment with the Delaware Secretary of State | ||||
| ERP | enterprise resource planning system | ||||
| ESG | environmental, social, and governance | ||||
| Exchange Act | Securities Exchange Act of 1934, as amended | ||||
| Financial Statements | our consolidated financial statements and notes thereto included herein | ||||
| First Quarter 2022 | the Company’s three months ended May 31, 2021 | ||||
| First Quarter 2023 | the Company’s three months ended May 31, 2022 | ||||
| Fiscal 2022 | the Company’s fiscal year ended February 28, 2022 | ||||
| Fiscal 2023 | the Company’s fiscal year ending February 28, 2023 | ||||
| Fiscal 2024 | the Company’s fiscal year ending February 29, 2024 | ||||
| Fiscal 2025 | the Company’s fiscal year ending February 28, 2025 | ||||
| Fiscal 2026 | the Company’s fiscal year ending February 28, 2026 | ||||
| Fiscal 2027 | the Company’s fiscal year ending February 28, 2027 | ||||
| Fiscal 2028 | the Company’s fiscal year ending February 29, 2028 | ||||
| Five-Year Term Facility | a five-year term loan facility under the 2022 Term Credit Agreement | ||||
| Form 10-Q | this Quarterly Report on Form 10-Q for First Quarter 2023 unless otherwise specified | ||||
| GHG | greenhouse gas | ||||
| June 2021 Term Credit Agreement | amended and restated term loan credit agreement, dated as of March 26, 2020, that provided for aggregate facilities of $491.3 million, consisting of the Five-Year Term Facility, inclusive of amendment dated as of June 10, 2021 | ||||
| Lender | Bank of America, N.A., as lender for the term credit agreement | ||||
| LIBOR | London Interbank Offered Rate | ||||
| Lingua Franca | Lingua Franca, LLC business, acquired by us | ||||
| May 2020 Canopy Investment | in May 2020, we made an incremental investment for 18.9 million common shares of Canopy through the exercise of warrants obtained in November 2017 | ||||
| May 2022 Senior Notes | $1,850.0 million aggregate principal amount of senior notes issued in May 2022 | ||||
| MD&A | Management’s Discussion and Analysis of Financial Condition and Results of Operations under Item 2. of this Form 10-Q | ||||
Mexicali Brewery | suspended brewery construction project located in Mexicali, Baja California, Mexico | ||||
| Mexico Beer Projects | expansion, optimization, and/or construction activities at the Obregon Brewery, Nava Brewery, and Veracruz Brewery | ||||
Constellation Brands, Inc. Q1 FY 2023 Form 10-Q | #WORTHREACHINGFOR I ii | ||||
| Term | Meaning | ||||
| M&T | Manufacturers and Traders Trust Company | ||||
| My Favorite Neighbor | we made an initial investment in My Favorite Neighbor, LLC and subsequently acquired the remaining ownership interest | ||||
| NA | not applicable | ||||
| Nasdaq | Nasdaq Global Select Market | ||||
| Nava | Nava, Coahuila, Mexico | ||||
| Nava Brewery | brewery located in Nava | ||||
| Net sales | gross sales less promotions, returns and allowances, and excise taxes | ||||
| NM | not meaningful | ||||
| Note(s) | notes to the consolidated financial statements | ||||
| November 2017 Canopy Investment | in November 2017, we made an initial investment for 18.9 million common shares of Canopy | ||||
| November 2018 Canopy Investment | in November 2018, we made an incremental investment for 104.5 million common shares of Canopy | ||||
| November 2018 Canopy Transaction | November 2018 Canopy Investment and the purchase by us of the November 2018 Canopy Warrants, collectively | ||||
| November 2018 Canopy Warrants | Tranche A Warrants, Tranche B Warrants, and Tranche C Warrants, collectively | ||||
| NYSE | New York Stock Exchange | ||||
| Obregon | Obregon, Sonora, Mexico | ||||
Obregon Brewery | brewery located in Obregon | ||||
| OCI | other comprehensive income (loss) | ||||
| Pre-issuance hedge contracts | treasury lock and/or swap lock contracts designated as cash flow hedges entered into to hedge treasury rate volatility on future debt issuances | ||||
| Reclassification | the plan to reclassify the Company’s common stock to eliminate the existing Class B Stock pursuant to the terms and conditions of the Reclassification Agreement | ||||
| Reclassification Agreement | reclassification agreement in support of the Reclassification, dated June 30, 2022, among the Company and the Sands Stockholder Group | ||||
| RTD | ready-to-drink | ||||
| SEC | Securities and Exchange Commission | ||||
| Sands Stockholder Group | Richard Sands, Robert Sands, Astra Legacy LLC, and WildStar Partners LLC | ||||
| Securities Act | Securities Act of 1933, as amended | ||||
SOFR | secured overnight financing rate administered by the Federal Reserve Bank of New York | ||||
| THC | tetrahydrocannabinol | ||||
| Tranche A Warrants | warrants which give us the option to purchase 88.5 million common shares of Canopy expiring November 1, 2023 | ||||
| Tranche B Warrants | warrants which give us the option to purchase 38.4 million common shares of Canopy expiring November 1, 2026 | ||||
| Tranche C Warrants | warrants which give us the option to purchase 12.8 million common shares of Canopy expiring November 1, 2026 | ||||
TSX | Toronto Stock Exchange | ||||
| U.S. | United States of America | ||||
| U.S. GAAP | generally accepted accounting principles in the U.S. | ||||
| Veracruz | Heroica Veracruz, Veracruz, Mexico | ||||
| Veracruz Brewery | a new brewery intended to be located in Veracruz | ||||
VWAP Exercise Price | volume-weighted average of the closing market price of Canopy’s common shares on the TSX for the five trading days immediately preceding the exercise date | ||||
Constellation Brands, Inc. Q1 FY 2023 Form 10-Q | #WORTHREACHINGFOR I iii | ||||
| FINANCIAL STATEMENTS | |||||
PART I – FINANCIAL INFORMATION
Item 1. Financial Statements.
CONSTELLATION BRANDS, INC. AND SUBSIDIARIES
CONSOLIDATED BALANCE SHEETS
(in millions, except share and per share data)
(unaudited)
| May 31, 2022 | February 28, 2022 | ||||||||||
| ASSETS | |||||||||||
| Current assets: | |||||||||||
| Cash and cash equivalents | $ | $ | |||||||||
| Accounts receivable | |||||||||||
| Inventories | |||||||||||
| Prepaid expenses and other | |||||||||||
| Total current assets | |||||||||||
| Property, plant, and equipment | |||||||||||
| Goodwill | |||||||||||
| Intangible assets | |||||||||||
| Equity method investments | |||||||||||
| Securities measured at fair value | |||||||||||
| Deferred income taxes | |||||||||||
| Other assets | |||||||||||
| Total assets | $ | $ | |||||||||
| LIABILITIES AND STOCKHOLDERS’ EQUITY | |||||||||||
| Current liabilities: | |||||||||||
| Short-term borrowings | $ | $ | |||||||||
| Current maturities of long-term debt | |||||||||||
| Accounts payable | |||||||||||
| Other accrued expenses and liabilities | |||||||||||
| Total current liabilities | |||||||||||
| Long-term debt, less current maturities | |||||||||||
| Deferred income taxes and other liabilities | |||||||||||
| Total liabilities | |||||||||||
| Commitments and contingencies | |||||||||||
| CBI stockholders’ equity: | |||||||||||
Class A Stock, $ | |||||||||||
Class B Stock, $ | |||||||||||
| Additional paid-in capital | |||||||||||
| Retained earnings | |||||||||||
| Accumulated other comprehensive income (loss) | ( | ( | |||||||||
| Less: Treasury stock – | |||||||||||
Class A Stock, at cost, | ( | ( | |||||||||
Class B Stock, at cost, | ( | ( | |||||||||
| ( | ( | ||||||||||
| Total CBI stockholders’ equity | |||||||||||
| Noncontrolling interests | |||||||||||
| Total stockholders’ equity | |||||||||||
| Total liabilities and stockholders’ equity | $ | $ | |||||||||
The accompanying notes are an integral part of these statements.
| Constellation Brands, Inc. Q1 FY 2023 Form 10-Q | #WORTHREACHINGFOR I 1 | ||||
| FINANCIAL STATEMENTS | |||||
CONSTELLATION BRANDS, INC. AND SUBSIDIARIES
CONSOLIDATED STATEMENTS OF COMPREHENSIVE INCOME (LOSS)
(in millions, except per share data)
(unaudited)
| For the Three Months Ended May 31, | |||||||||||
| 2022 | 2021 | ||||||||||
| Sales | $ | $ | |||||||||
| Excise taxes | ( | ( | |||||||||
| Net sales | |||||||||||
| Cost of product sold | ( | ( | |||||||||
| Gross profit | |||||||||||
| Selling, general, and administrative expenses | ( | ( | |||||||||
| Impairment of brewery construction in progress | ( | ||||||||||
| Operating income (loss) | |||||||||||
| Income (loss) from unconsolidated investments | ( | ( | |||||||||
| Interest expense | ( | ( | |||||||||
| Loss on extinguishment of debt | ( | ||||||||||
| Income (loss) before income taxes | ( | ||||||||||
| (Provision for) benefit from income taxes | ( | ||||||||||
| Net income (loss) | ( | ||||||||||
| Net (income) loss attributable to noncontrolling interests | ( | ( | |||||||||
| Net income (loss) attributable to CBI | $ | $ | ( | ||||||||
| Comprehensive income (loss) | $ | $ | ( | ||||||||
| Comprehensive (income) loss attributable to noncontrolling interests | ( | ( | |||||||||
| Comprehensive income (loss) attributable to CBI | $ | $ | ( | ||||||||
| Net income (loss) per common share attributable to CBI: | |||||||||||
| Basic – Class A Stock | $ | $ | ( | ||||||||
| Basic – Class B Stock | $ | $ | ( | ||||||||
| Diluted – Class A Stock | $ | $ | ( | ||||||||
| Diluted – Class B Stock | $ | $ | ( | ||||||||
| Weighted average common shares outstanding: | |||||||||||
| Basic – Class A Stock | |||||||||||
| Basic – Class B Stock | |||||||||||
| Diluted – Class A Stock | |||||||||||
| Diluted – Class B Stock | |||||||||||
| Cash dividends declared per common share: | |||||||||||
| Class A Stock | $ | $ | |||||||||
| Class B Stock | $ | $ | |||||||||
The accompanying notes are an integral part of these statements.
| Constellation Brands, Inc. Q1 FY 2023 Form 10-Q | #WORTHREACHINGFOR I 2 | ||||
| FINANCIAL STATEMENTS | |||||
CONSTELLATION BRANDS, INC. AND SUBSIDIARIES CONSOLIDATED STATEMENTS OF CHANGES IN STOCKHOLDERS’ EQUITY (in millions) (unaudited) | |||||||||||||||||||||||||||||||||||||||||||||||
| Stock | Additional Paid-in Capital | Retained Earnings | Accumulated Other Comprehensive Income (Loss) | Treasury Stock | Non-controlling Interests | Total | |||||||||||||||||||||||||||||||||||||||||
| Class A | Class B | ||||||||||||||||||||||||||||||||||||||||||||||
| Balance at February 28, 2022 | $ | $ | $ | $ | $ | ( | $ | ( | $ | $ | |||||||||||||||||||||||||||||||||||||
| Comprehensive income (loss): | |||||||||||||||||||||||||||||||||||||||||||||||
| Net income (loss) | — | — | — | — | — | ||||||||||||||||||||||||||||||||||||||||||
| Other comprehensive income (loss), net of income tax effect | — | — | — | — | — | ||||||||||||||||||||||||||||||||||||||||||
| Comprehensive income (loss) | |||||||||||||||||||||||||||||||||||||||||||||||
| Repurchase of shares | — | — | — | — | — | ( | — | ( | |||||||||||||||||||||||||||||||||||||||
| Dividends declared | — | — | — | ( | — | — | — | ( | |||||||||||||||||||||||||||||||||||||||
| Noncontrolling interest distributions | — | — | — | — | — | — | ( | ( | |||||||||||||||||||||||||||||||||||||||
| Shares issued under equity compensation plans | — | — | ( | — | — | — | |||||||||||||||||||||||||||||||||||||||||
| Stock-based compensation | — | — | — | — | — | — | |||||||||||||||||||||||||||||||||||||||||
| Balance at May 31, 2022 | $ | $ | $ | $ | $ | ( | $ | ( | $ | $ | |||||||||||||||||||||||||||||||||||||
| Balance at February 28, 2021 | $ | $ | $ | $ | $ | ( | $ | ( | $ | $ | |||||||||||||||||||||||||||||||||||||
| Comprehensive income (loss): | |||||||||||||||||||||||||||||||||||||||||||||||
| Net income (loss) | — | — | — | ( | — | — | ( | ||||||||||||||||||||||||||||||||||||||||
| Other comprehensive income (loss), net of income tax effect | — | — | — | — | — | ||||||||||||||||||||||||||||||||||||||||||
| Comprehensive income (loss) | ( | ||||||||||||||||||||||||||||||||||||||||||||||
| Repurchase of shares | — | — | — | — | — | ( | — | ( | |||||||||||||||||||||||||||||||||||||||
| Dividends declared | — | — | — | ( | — | — | — | ( | |||||||||||||||||||||||||||||||||||||||
| Noncontrolling interest distributions | — | — | — | — | — | — | ( | ( | |||||||||||||||||||||||||||||||||||||||
| Shares issued under equity compensation plans | — | — | ( | — | — | — | |||||||||||||||||||||||||||||||||||||||||
| Stock-based compensation | — | — | — | — | — | — | |||||||||||||||||||||||||||||||||||||||||
| Balance at May 31, 2021 | $ | $ | $ | $ | $ | ( | $ | ( | $ | $ | |||||||||||||||||||||||||||||||||||||
The accompanying notes are an integral part of these statements.
| Constellation Brands, Inc. Q1 FY 2023 Form 10-Q | #WORTHREACHINGFOR I 3 | ||||
| FINANCIAL STATEMENTS | |||||
CONSTELLATION BRANDS, INC. AND SUBSIDIARIES
CONSOLIDATED STATEMENTS OF CASH FLOWS
(in millions)
(unaudited)
| For the Three Months Ended May 31, | |||||||||||
| 2022 | 2021 | ||||||||||
| CASH FLOWS FROM OPERATING ACTIVITIES | |||||||||||
| Net income (loss) | $ | $ | ( | ||||||||
| Adjustments to reconcile net income (loss) to net cash provided by (used in) operating activities: | |||||||||||
| Unrealized net (gain) loss on securities measured at fair value | |||||||||||
| Deferred tax provision (benefit) | ( | ||||||||||
| Depreciation | |||||||||||
| Stock-based compensation | |||||||||||
| Equity in (earnings) losses of equity method investees and related activities, net of distributed earnings | |||||||||||
| Noncash lease expense | |||||||||||
| Amortization of debt issuance costs and loss on extinguishment of debt | |||||||||||
| Impairment of brewery construction in progress | |||||||||||
| Gain (loss) on settlement of Pre-issuance hedge contracts | |||||||||||
| Change in operating assets and liabilities, net of effects from purchase and sale of business: | |||||||||||
| Accounts receivable | ( | ||||||||||
| Inventories | ( | ( | |||||||||
| Prepaid expenses and other current assets | ( | ||||||||||
| Accounts payable | |||||||||||
| Deferred revenue | |||||||||||
| Other accrued expenses and liabilities | ( | ( | |||||||||
| Other | ( | ( | |||||||||
| Total adjustments | |||||||||||
| Net cash provided by (used in) operating activities | |||||||||||
| CASH FLOWS FROM INVESTING ACTIVITIES | |||||||||||
| Purchase of property, plant, and equipment | ( | ( | |||||||||
| Purchase of business, net of cash acquired | ( | ||||||||||
| Investments in equity method investees and securities | ( | ||||||||||
| Proceeds from sale of assets | |||||||||||
| Proceeds from sale of business | |||||||||||
| Other investing activities | |||||||||||
| Net cash provided by (used in) investing activities | ( | ( | |||||||||
| Constellation Brands, Inc. Q1 FY 2023 Form 10-Q | #WORTHREACHINGFOR I 4 | ||||
| FINANCIAL STATEMENTS | |||||
CONSTELLATION BRANDS, INC. AND SUBSIDIARIES
CONSOLIDATED STATEMENTS OF CASH FLOWS
(in millions)
(unaudited)
| For the Three Months Ended May 31, | |||||||||||
| 2022 | 2021 | ||||||||||
| CASH FLOWS FROM FINANCING ACTIVITIES | |||||||||||
| Proceeds from issuance of long-term debt | |||||||||||
| Principal payments of long-term debt | ( | ( | |||||||||
| Net proceeds from (repayments of) short-term borrowings | ( | ||||||||||
| Dividends paid | ( | ( | |||||||||
| Purchases of treasury stock | ( | ( | |||||||||
| Proceeds from shares issued under equity compensation plans | |||||||||||
| Payments of minimum tax withholdings on stock-based payment awards | ( | ( | |||||||||
| Payments of debt issuance, debt extinguishment, and other financing costs | ( | ||||||||||
| Distributions to noncontrolling interests | ( | ( | |||||||||
| Net cash provided by (used in) financing activities | ( | ( | |||||||||
| Effect of exchange rate changes on cash and cash equivalents | ( | ||||||||||
| Net increase (decrease) in cash and cash equivalents | ( | ||||||||||
| Cash and cash equivalents, beginning of period | |||||||||||
| Cash and cash equivalents, end of period | $ | $ | |||||||||
| Supplemental disclosures of noncash investing and financing activities | |||||||||||
| Additions to property, plant, and equipment | $ | $ | |||||||||
The accompanying notes are an integral part of these statements.
| Constellation Brands, Inc. Q1 FY 2023 Form 10-Q | #WORTHREACHINGFOR I 5 | ||||
| FINANCIAL STATEMENTS | NOTES TO CONSOLIDATED FINANCIAL STATEMENTS | |||||||
CONSTELLATION BRANDS, INC. AND SUBSIDIARIES
MAY 31, 2022
(unaudited)
1. BASIS OF PRESENTATION
2. INVENTORIES
Inventories are stated at the lower of cost (primarily computed in accordance with the first-in, first-out method) or net realizable value. Elements of cost include materials, labor, and overhead and consist of the following:
| May 31, 2022 | February 28, 2022 | ||||||||||
| (in millions) | |||||||||||
| Raw materials and supplies | $ | $ | |||||||||
| In-process inventories | |||||||||||
| Finished case goods | |||||||||||
| $ | $ | ||||||||||
We assess the valuation of our inventories and reduce the carrying value of those inventories that are obsolete or in excess of our forecasted usage to their estimated net realizable value based on analyses and assumptions including, but not limited to, historical usage, future demand, and market requirements. We evaluated the carrying value of certain inventories and recognized the following in cost of product sold within our consolidated results of operations:
| For the Three Months Ended May 31, | |||||||||||
| 2022 | 2021 | ||||||||||
| (in millions) | |||||||||||
| Loss on inventory write-down | $ | $ | |||||||||
3. DERIVATIVE INSTRUMENTS
Overview
Our risk management and derivative accounting policies are presented in Notes 1 and 6 of our consolidated financial statements included in our 2022 Annual Report and have not changed significantly for the three months ended May 31, 2022.
We have an investment in certain equity securities and other rights which provide us with the option to purchase an additional ownership interest in the equity securities of Canopy (see Note 7). This investment is included in securities measured at fair value and is accounted for at fair value, with the net gain (loss) from the changes in fair value of this investment recognized in income (loss) from unconsolidated investments (see Note 4).
| Constellation Brands, Inc. Q1 FY 2023 Form 10-Q | #WORTHREACHINGFOR I 6 | ||||
| FINANCIAL STATEMENTS | NOTES TO CONSOLIDATED FINANCIAL STATEMENTS | |||||||
The aggregate notional value of outstanding derivative instruments is as follows:
| May 31, 2022 | February 28, 2022 | ||||||||||
| (in millions) | |||||||||||
| Derivative instruments designated as hedging instruments | |||||||||||
| Foreign currency contracts | $ | $ | |||||||||
| Pre-issuance hedge contracts | $ | $ | |||||||||
| Derivative instruments not designated as hedging instruments | |||||||||||
| Foreign currency contracts | $ | $ | |||||||||
| Commodity derivative contracts | $ | $ | |||||||||
Credit risk
We are exposed to credit-related losses if the counterparties to our derivative contracts default. This credit risk is limited to the fair value of the derivative contracts. To manage this risk, we contract only with major financial institutions that have earned investment-grade credit ratings and with whom we have standard International Swaps and Derivatives Association agreements which allow for net settlement of the derivative contracts. We have also established counterparty credit guidelines that are regularly monitored. Because of these safeguards, we believe the risk of loss from counterparty default to be immaterial.
In addition, our derivative instruments are not subject to credit rating contingencies or collateral requirements. As of May 31, 2022, the estimated fair value of derivative instruments in a net liability position due to counterparties was $3.9 million. If we were required to settle the net liability position under these derivative instruments on May 31, 2022, we would have had sufficient available liquidity on hand to satisfy this obligation.
Results of period derivative activity
The estimated fair value and location of our derivative instruments on our balance sheets are as follows (see Note 4):
| Assets | Liabilities | |||||||||||||||||||||||||
| May 31, 2022 | February 28, 2022 | May 31, 2022 | February 28, 2022 | |||||||||||||||||||||||
| (in millions) | ||||||||||||||||||||||||||
| Derivative instruments designated as hedging instruments | ||||||||||||||||||||||||||
| Foreign currency contracts: | ||||||||||||||||||||||||||
| Prepaid expenses and other | $ | $ | Other accrued expenses and liabilities | $ | $ | |||||||||||||||||||||
| Other assets | $ | $ | Deferred income taxes and other liabilities | $ | $ | |||||||||||||||||||||
| Pre-issuance hedge contracts: | ||||||||||||||||||||||||||
| Other assets | $ | $ | Deferred income taxes and other liabilities | $ | $ | |||||||||||||||||||||
| Derivative instruments not designated as hedging instruments | ||||||||||||||||||||||||||
| Foreign currency contracts: | ||||||||||||||||||||||||||
| Prepaid expenses and other | $ | $ | Other accrued expenses and liabilities | $ | $ | |||||||||||||||||||||
| Commodity derivative contracts: | ||||||||||||||||||||||||||
| Prepaid expenses and other | $ | $ | Other accrued expenses and liabilities | $ | $ | |||||||||||||||||||||
| Other assets | $ | $ | Deferred income taxes and other liabilities | $ | $ | |||||||||||||||||||||
| Constellation Brands, Inc. Q1 FY 2023 Form 10-Q | #WORTHREACHINGFOR I 7 | ||||
| FINANCIAL STATEMENTS | NOTES TO CONSOLIDATED FINANCIAL STATEMENTS | |||||||
The principal effect of our derivative instruments designated in cash flow hedging relationships on our results of operations, as well as OCI, net of income tax effect, is as follows:
| Derivative Instruments in Designated Cash Flow Hedging Relationships | Net Gain (Loss) Recognized in OCI | Location of Net Gain (Loss) Reclassified from AOCI to Income (Loss) | Net Gain (Loss) Reclassified from AOCI to Income (Loss) | |||||||||||||||||
| (in millions) | ||||||||||||||||||||
| For the Three Months Ended May 31, 2022 | ||||||||||||||||||||
| Foreign currency contracts | $ | Sales | $ | ( | ||||||||||||||||
| Cost of product sold | ||||||||||||||||||||
| Pre-issuance hedge contracts | Interest expense | ( | ||||||||||||||||||
| $ | $ | |||||||||||||||||||
| For the Three Months Ended May 31, 2021 | ||||||||||||||||||||
| Foreign currency contracts | $ | Sales | $ | ( | ||||||||||||||||
| Cost of product sold | ||||||||||||||||||||
| Pre-issuance hedge contracts | Interest expense | ( | ||||||||||||||||||
| $ | $ | |||||||||||||||||||
We expect $45.6 million of net gains, net of income tax effect, to be reclassified from AOCI to our results of operations within the next 12 months.
The effect of our undesignated derivative instruments on our results of operations is as follows:
| Derivative Instruments Not Designated as Hedging Instruments | Location of Net Gain (Loss) Recognized in Income (Loss) | Net Gain (Loss) Recognized in Income (Loss) | ||||||||||||||||||
| (in millions) | ||||||||||||||||||||
| For the Three Months Ended May 31, 2022 | ||||||||||||||||||||
| Commodity derivative contracts | Cost of product sold | $ | ||||||||||||||||||
| Foreign currency contracts | Selling, general, and administrative expenses | |||||||||||||||||||
| $ | ||||||||||||||||||||
| For the Three Months Ended May 31, 2021 | ||||||||||||||||||||
| Commodity derivative contracts | Cost of product sold | $ | ||||||||||||||||||
| Foreign currency contracts | Selling, general, and administrative expenses | ( | ||||||||||||||||||
| $ | ||||||||||||||||||||
4. FAIR VALUE OF FINANCIAL INSTRUMENTS
Authoritative guidance establishes a framework for measuring fair value, including a hierarchy for inputs used in measuring fair value that maximizes the use of observable inputs and minimizes the use of unobservable inputs by requiring that the most observable inputs be used when available. The hierarchy includes three levels:
•Level 1 inputs are quoted prices in active markets for identical assets or liabilities;
•Level 2 inputs include data points that are observable such as quoted prices for similar assets or liabilities in active markets, quoted prices for identical assets or similar assets or liabilities in markets
| Constellation Brands, Inc. Q1 FY 2023 Form 10-Q | #WORTHREACHINGFOR I 8 | ||||
| FINANCIAL STATEMENTS | NOTES TO CONSOLIDATED FINANCIAL STATEMENTS | |||||||
that are not active, and inputs (other than quoted prices) such as volatility, interest rates, and yield curves that are observable for the asset and liability, either directly or indirectly; and
•Level 3 inputs are unobservable data points for the asset or liability, and include situations where there is little, if any, market activity for the asset or liability.
Fair value methodology
The following methods and assumptions are used to estimate the fair value for each class of our financial instruments:
Foreign currency and commodity derivative contracts
The fair value is estimated using market-based inputs, obtained from independent pricing services, entered into valuation models. These valuation models require various inputs, including contractual terms, market foreign exchange prices, market commodity prices, interest-rate yield curves, and currency volatilities, as applicable (Level 2 fair value measurement).
Interest rate swap and Pre-issuance hedge contracts
The fair value is estimated based on quoted market prices from respective counterparties. Quotes are corroborated by using discounted cash flow calculations based upon forward interest-rate yield curves, which are obtained from independent pricing services (Level 2 fair value measurement).
Canopy investment
Equity securities, Warrants – The November 2018 Canopy Warrants consist of three tranches of warrants, including 88.5 million Tranche A Warrants expiring November 1, 2023, which are currently exercisable, 38.4 million Tranche B Warrants expiring November 1, 2026, and 12.8 million Tranche C Warrants expiring November 1, 2026. The inputs used to estimate the fair value of the November 2018 Canopy Warrants are as follows (1) (2):
| May 31, 2022 | February 28, 2022 | ||||||||||||||||||||||
Tranche A Warrants (3) | Tranche B Warrants (4) | Tranche A Warrants (3) | Tranche B Warrants (4) | ||||||||||||||||||||
Exercise price (5) | C$ | C$ | C$ | C$ | |||||||||||||||||||
Valuation date stock price (6) | C$ | C$ | C$ | C$ | |||||||||||||||||||
Remaining contractual term (7) | |||||||||||||||||||||||
Expected volatility (8) | % | % | % | % | |||||||||||||||||||
Risk-free interest rate (9) | % | % | % | % | |||||||||||||||||||
Expected dividend yield (10) | % | % | % | % | |||||||||||||||||||
(1)The exercise price for the Tranche C Warrants is based on the VWAP Exercise Price. The Tranche C Warrants are not included in the table as there is no fair value assigned.
(2)In connection with the Acreage Transaction, we obtained other rights which include a share repurchase credit. If Canopy has not purchased the lesser of 27,378,866 Canopy common shares, or C$1,583.0 million worth of Canopy common shares for cancellation between April 18, 2019, and two-years after the full exercise of the Tranche A Warrants, we will be credited an amount that will reduce the aggregate exercise price otherwise payable upon each exercise of the Tranche B Warrants and Tranche C Warrants. The credit will be an amount equal to the difference between C$1,583.0 million and the actual price paid by Canopy in purchasing its common shares for cancellation. The likelihood of receiving the share repurchase credit if we were to fully exercise the Tranche A Warrants is remote, therefore, no fair value has been assigned.
(3)The fair value is estimated using the Black-Scholes option-pricing model (Level 2 fair value measurement).
(4)The fair value is estimated using Monte Carlo simulations (Level 2 fair value measurement).
(5)Based on the exercise price from the applicable underlying agreements.
(6)Based on the closing market price for Canopy common stock on the TSX as of the applicable date.
(7)Based on the expiration date of the warrants.
| Constellation Brands, Inc. Q1 FY 2023 Form 10-Q | #WORTHREACHINGFOR I 9 | ||||
| FINANCIAL STATEMENTS | NOTES TO CONSOLIDATED FINANCIAL STATEMENTS | |||||||
(8)Based on consideration of historical and/or implied volatility levels of the underlying equity security and limited consideration of historical peer group volatility levels.
(9)Based on the implied yield currently available on Canadian Treasury zero coupon issues with a remaining term equal to the expiration date of the applicable warrants.
(10)Based on historical dividend levels.
Debt securities, Convertible – We have elected the fair value option to account for the Canopy Debt Securities acquired in June 2018 for C$200.0 million, or $150.5 million. Interest income on the Canopy Debt Securities is calculated using the effective interest method and is recognized separately from the changes in fair value in interest expense. The Canopy Debt Securities have a contractual maturity of five years from the date of issuance but may be converted prior to maturity by either party upon the occurrence of certain events. The fair value is estimated using a binomial lattice option-pricing model (Level 2 fair value measurement), which includes an estimate of the credit spread based on market spreads using bond data as of the valuation date. For additional information on the Canopy Debt Securities refer to Note 7.
The inputs used to estimate the fair value of the Canopy Debt Securities are as follows:
| May 31, 2022 | February 28, 2022 | ||||||||||
Conversion price (1) | C$ | C$ | |||||||||
Valuation date stock price (2) | C$ | C$ | |||||||||
Remaining term (3) | |||||||||||
Expected volatility (4) | % | % | |||||||||
Risk-free interest rate (5) | % | % | |||||||||
Expected dividend yield (6) | % | % | |||||||||
(1)Based on the rate which the Canopy Debt Securities may be converted into equity shares, or the equivalent amount of cash, at the option of the issuer.
(2)Based on the closing market price for Canopy common stock on the TSX as of the applicable date.
(3)Based on the contractual maturity date of the notes.
(4)Based on consideration of historical and/or implied volatility levels of the underlying equity security, adjusted for certain risks associated with debt securities, as appropriate.
(5)Based on the implied yield currently available on Canadian Treasury zero coupon issues with a term equal to the remaining contractual term of the Canopy Debt Securities.
(6)Based on historical dividend levels.
Short-term borrowings
Our short-term borrowings consist of our commercial paper program and the revolving credit facility under our senior credit facility. The revolving credit facility is a variable interest rate bearing note with a fixed margin, adjustable based upon our debt rating (as defined in our senior credit facility). For these short-term borrowings the carrying value approximates the fair value.
Long-term debt
The term loan under our term credit agreement is a variable interest rate bearing note with a fixed margin, adjustable based upon our debt rating. The carrying value approximates the fair value of the term loan. The fair value of the remaining fixed interest rate long-term debt is estimated by discounting cash flows using interest rates currently available for debt with similar terms and maturities (Level 2 fair value measurement).
The carrying amounts of certain of our financial instruments, including cash and cash equivalents, accounts receivable, and accounts payable, approximate fair value as of May 31, 2022, and February 28, 2022, due
| Constellation Brands, Inc. Q1 FY 2023 Form 10-Q | #WORTHREACHINGFOR I 10 | ||||
| FINANCIAL STATEMENTS | NOTES TO CONSOLIDATED FINANCIAL STATEMENTS | |||||||
to the relatively short maturity of these instruments. As of May 31, 2022, the carrying amount of long-term debt, including the current portion, was $10,853.3 million, compared with an estimated fair value of $10,442.9 million. As of February 28, 2022, the carrying amount of long-term debt, including the current portion, was $10,093.5 million, compared with an estimated fair value of $10,345.3 million.
Recurring basis measurements
The following table presents our financial assets and liabilities measured at estimated fair value on a recurring basis:
| Fair Value Measurements Using | |||||||||||||||||||||||
| Quoted Prices in Active Markets (Level 1) | Significant Other Observable Inputs (Level 2) | Significant Unobservable Inputs (Level 3) | Total | ||||||||||||||||||||
| (in millions) | |||||||||||||||||||||||
| May 31, 2022 | |||||||||||||||||||||||
| Assets: | |||||||||||||||||||||||
| Foreign currency contracts | $ | $ | $ | $ | |||||||||||||||||||
| Commodity derivative contracts | $ | $ | $ | $ | |||||||||||||||||||
November 2018 Canopy Warrants (1) | $ | $ | $ | $ | |||||||||||||||||||
Canopy Debt Securities (1) | $ | $ | $ | $ | |||||||||||||||||||
| Liabilities: | |||||||||||||||||||||||
| Foreign currency contracts | $ | $ | $ | $ | |||||||||||||||||||
| Commodity derivative contracts | $ | $ | $ | $ | |||||||||||||||||||
| February 28, 2022 | |||||||||||||||||||||||
| Assets: | |||||||||||||||||||||||
| Foreign currency contracts | $ | $ | $ | $ | |||||||||||||||||||
| Commodity derivative contracts | $ | $ | $ | $ | |||||||||||||||||||
November 2018 Canopy Warrants (1) | $ | $ | $ | $ | |||||||||||||||||||
Canopy Debt Securities (1) | $ | $ | $ | $ | |||||||||||||||||||
| Liabilities: | |||||||||||||||||||||||
| Foreign currency contracts | $ | $ | $ | $ | |||||||||||||||||||
| Commodity derivative contracts | $ | $ | $ | $ | |||||||||||||||||||
| Pre-issuance hedge contracts | $ | $ | $ | $ | |||||||||||||||||||
(1) | Unrealized net gain (loss) from the changes in fair value of our securities measured at fair value recognized in income (loss) from unconsolidated investments, are as follows: | ||||||||||||||||
| For the Three Months Ended May 31, | |||||||||||||||||
| 2022 | 2021 | ||||||||||||||||
| (in millions) | |||||||||||||||||
| November 2018 Canopy Warrants | $ | ( | $ | ( | |||||||||||||
| Canopy Debt Securities | ( | ( | |||||||||||||||
| $ | ( | $ | ( | ||||||||||||||
| Constellation Brands, Inc. Q1 FY 2023 Form 10-Q | #WORTHREACHINGFOR I 11 | ||||
| FINANCIAL STATEMENTS | NOTES TO CONSOLIDATED FINANCIAL STATEMENTS | |||||||
Nonrecurring basis measurements
The following table presents our assets and liabilities measured at estimated fair value on a nonrecurring basis for which an impairment assessment was performed for the period presented:
| Fair Value Measurements Using | |||||||||||||||||||||||
| Quoted Prices in Active Markets (Level 1) | Significant Other Observable Inputs (Level 2) | Significant Unobservable Inputs (Level 3) | Total Losses | ||||||||||||||||||||
| (in millions) | |||||||||||||||||||||||
| For the Three Months Ended May 31, 2021 | |||||||||||||||||||||||
| Long-lived assets | $ | $ | $ | $ | |||||||||||||||||||
Long-lived assets
In April 2021, our Board of Directors authorized management to sell or abandon the Mexicali Brewery. Subsequently, management determined that we will be unable to use or repurpose certain assets at the Mexicali Brewery. Accordingly, for the first quarter of Fiscal 2022, long-lived assets with a carrying value of $685.9 million were written down to their estimated fair value of $20.0 million, resulting in an impairment of $665.9 million. This impairment was included in impairment of brewery construction in progress within our consolidated results of operations for the three months ended May 31, 2021. Our estimate of fair value was determined based on the expected salvage value of the assets. The Mexicali Brewery is a component of the Beer segment. We continue to work with government officials in Mexico to (i) determine next steps for our suspended Mexicali Brewery construction project, (ii) pursue various forms of recovery for capitalized costs and additional expenses incurred in establishing the brewery, however, there can be no assurance of any recoveries, and (iii) explore options to add further capacity at other locations in Mexico, including the construction of the Veracruz Brewery where there is ample water and we will have a skilled workforce to meet our long-term needs. In the medium-term, under normal operating conditions, we have ample capacity at the Nava and Obregon breweries to meet consumer needs based on current growth forecasts and current and planned production capabilities. Expansion, optimization, and/or construction activities continue at our current brewery locations under our Mexico Beer Projects to align with our anticipated future growth expectations.
5. GOODWILL
The changes in the carrying amount of goodwill are as follows:
| Beer | Wine and Spirits | Consolidated | |||||||||||||||
| (in millions) | |||||||||||||||||
| Balance, February 28, 2021 | $ | $ | $ | ||||||||||||||
Purchase accounting allocations (1) | |||||||||||||||||
| Foreign currency translation adjustments | ( | ( | ( | ||||||||||||||
| Balance, February 28, 2022 | |||||||||||||||||
Purchase accounting allocations (2) | |||||||||||||||||
| Foreign currency translation adjustments | ( | ||||||||||||||||
| Balance, May 31, 2022 | $ | $ | $ | ||||||||||||||
(1)Preliminary purchase accounting allocations associated with the acquisition of My Favorite Neighbor and purchase accounting allocations associated with the acquisition of Empathy Wines.
(2)Preliminary purchase accounting allocations associated with the acquisitions of My Favorite Neighbor, Lingua Franca, and Austin Cocktails.
| Constellation Brands, Inc. Q1 FY 2023 Form 10-Q | #WORTHREACHINGFOR I 12 | ||||
| FINANCIAL STATEMENTS | NOTES TO CONSOLIDATED FINANCIAL STATEMENTS | |||||||
Acquisitions
Austin Cocktails
In April 2022, we acquired the remaining 73 % ownership interest in Austin Cocktails, which included a portfolio of small batch, RTD cocktails. This transaction primarily included the acquisition of goodwill and a trademark. In addition, the purchase price for Austin Cocktails includes an earn-out over five years based on performance. The results of operations of Austin Cocktails are reported in the Wine and Spirits segment and have been included in our consolidated results of operations from the date of acquisition. For additional information on this transaction refer to Note 13.
Lingua Franca
In March 2022, we acquired the Lingua Franca business, including a collection of Oregon-based luxury wines, a vineyard, and a production facility. This transaction also includes the acquisition of a trademark and inventory. In addition, the purchase price for Lingua Franca includes an earn-out over seven years based on performance. The results of operations of Lingua Franca are reported in the Wine and Spirits segment and have been included in our consolidated results of operations from the date of acquisition.
My Favorite Neighbor
In November 2021, we acquired the remaining 65 % ownership interest in My Favorite Neighbor, a super-luxury, DTC focused wine business as well as certain wholesale distributed brands. This transaction primarily included the acquisition of goodwill, trademarks, inventory, and property, plant, and equipment. In addition, the My Favorite Neighbor transaction includes an earn-out over 10 years based on performance, with a 50 % minimum guarantee due at the end of the earn-out period. The results of operations of My Favorite Neighbor are reported in the Wine and Spirits segment and have been included in our consolidated results of operations from the date of acquisition.
6. INTANGIBLE ASSETS
The major components of intangible assets are as follows:
| May 31, 2022 | February 28, 2022 | ||||||||||||||||||||||
| Gross Carrying Amount | Net Carrying Amount | Gross Carrying Amount | Net Carrying Amount | ||||||||||||||||||||
| (in millions) | |||||||||||||||||||||||
| Amortizable intangible assets | |||||||||||||||||||||||
| Customer relationships | $ | $ | $ | $ | |||||||||||||||||||
| Other | |||||||||||||||||||||||
| Total | $ | $ | |||||||||||||||||||||
| Nonamortizable intangible assets | |||||||||||||||||||||||
| Trademarks | |||||||||||||||||||||||
| Total intangible assets | $ | $ | |||||||||||||||||||||
We did not incur costs to renew or extend the term of acquired intangible assets for the three months ended May 31, 2022, and May 31, 2021. Net carrying amount represents the gross carrying value net of accumulated amortization.
| Constellation Brands, Inc. Q1 FY 2023 Form 10-Q | #WORTHREACHINGFOR I 13 | ||||
| FINANCIAL STATEMENTS | NOTES TO CONSOLIDATED FINANCIAL STATEMENTS | |||||||
7. EQUITY METHOD INVESTMENTS
Our equity method investments are as follows:
| May 31, 2022 | February 28, 2022 | ||||||||||||||||||||||
| Carrying Value | Ownership Percentage | Carrying Value | Ownership Percentage | ||||||||||||||||||||
| (in millions) | |||||||||||||||||||||||
Canopy Equity Method Investment (1) (2) | $ | % | $ | % | |||||||||||||||||||
| Other equity method investments | |||||||||||||||||||||||
| $ | $ | ||||||||||||||||||||||
(1)The fair value based on the closing price of the underlying equity security as of May 31, 2022, and February 28, 2022, was $711.9 million and $1,014.8 million, respectively. Refer to discussion below on other-than-temporary impairment considerations.
(2)Includes the following:
| Common Shares | Purchase Price | ||||||||||
| (in millions) | |||||||||||
November 2017 Canopy Investment | $ | ||||||||||
| November 2018 Canopy Investment | |||||||||||
May 2020 Canopy Investment | |||||||||||
| $ | |||||||||||
Canopy Equity Method Investment
We complement our beverage alcohol strategy with our investment in Canopy, a leading provider of medicinal and recreational cannabis products. Equity in earnings (losses) from the Canopy Equity Method Investment and related activities is determined by recording the effect of basis differences. Amounts included in our consolidated results of operations for each period are as follows:
| For the Three Months Ended May 31, | |||||||||||
| 2022 | 2021 | ||||||||||
| (in millions) | |||||||||||
| Equity in earnings (losses) from Canopy and related activities | $ | ( | $ | ( | |||||||
Canopy has various equity and convertible debt securities outstanding, including primarily equity awards granted to its employees, and options and warrants issued to various third parties, including our November 2018 Canopy Warrants, Canopy Debt Securities, and the Acreage Financial Instrument (a call option for Canopy to acquire 70 % of the shares of Acreage at a fixed exchange ratio and 30 % at a floating exchange ratio). As of May 31, 2022, the exercise and/or conversion of certain of these outstanding securities could have a significant effect on our share of Canopy’s reported earnings or losses and our ownership interest in Canopy.
We have evaluated the Canopy Equity Method Investment as of May 31, 2022, and determined that there was not an other-than-temporary impairment. Our conclusion was based on several contributing factors, including: (i) the period of time for which the fair value has been less than the carrying value, (ii) an expectation that Canopy’s results will improve, (iii) an expectation that the Canopy stock price will recover in the near-term, and (iv) our ability and intent to hold the investment until that recovery. We will continue to review the Canopy Equity Method Investment for an other-than-temporary impairment. If Canopy’s stock price does not recover above our C$20.54 carrying value in the near-term, it may result in an impairment of our Canopy Equity Method Investment. There may also be a future impairment of our Canopy Equity Method Investment if our expectations about Canopy’s prospective results and cash flows decline, which could be influenced by a variety of factors
| Constellation Brands, Inc. Q1 FY 2023 Form 10-Q | #WORTHREACHINGFOR I 14 | ||||
| FINANCIAL STATEMENTS | NOTES TO CONSOLIDATED FINANCIAL STATEMENTS | |||||||
including adverse market conditions or if Canopy records a significant impairment of goodwill or intangible or other long-lived assets, makes significant asset sales, or has changes in senior management.
The following table presents summarized financial information for Canopy prepared in accordance with U.S. GAAP. We recognize our equity in earnings (losses) for Canopy on a two-month lag. Accordingly, we recognized our share of Canopy’s earnings (losses) for the periods January through March 2022 and January through March 2021 in our three months ended May 31, 2022, and May 31, 2021, results, respectively. The three months ended May 31, 2022, includes substantial costs designed to drive efficiency and accelerate Canopy’s path to profitability. The amounts shown represent 100% of Canopy’s reported results of operations for the respective periods.
| For the Three Months Ended May 31, | |||||||||||
| 2022 | 2021 | ||||||||||
| (in millions) | |||||||||||
| Net sales | $ | $ | |||||||||
| Gross profit (loss) | $ | ( | $ | ||||||||
| Net income (loss) | $ | ( | $ | ( | |||||||
| Net income (loss) attributable to Canopy | $ | ( | $ | ( | |||||||
Subsequent event
Canopy Debt Securities
On June 29, 2022, certain holders of Canopy Debt Securities agreed to sell C$255 million of their Canopy Debt Securities to Canopy at 99 % of principal value in exchange for newly issued shares of Canopy common stock. As part of this transaction, we agreed to sell C$100 million of our Canopy Debt Securities in exchange for Canopy common shares. The number of common shares issuable will be based on the volume-weighted average trading price of Canopy's common shares on the Nasdaq for a 10 -day trading period beginning on and including June 30, 2022, provided that the exchange price will not be less than $2.50 or more than $3.50 . As a result of the exchange, we will receive between 30.7 million and 21.9 million Canopy common shares in July 2022. This sale is not expected to significantly change our Canopy ownership percentage and we will continue to hold C$100 million of our Canopy Debt Securities following this transaction. As part of this transaction, the Canopy Debt Securities were amended to remove Canopy’s right to settle the Canopy Debt Securities on conversion into Canopy equity shares. As a result, the Canopy Debt Securities may only be settled in cash.
8. BORROWINGS
Borrowings consist of the following:
| May 31, 2022 | February 28, 2022 | ||||||||||||||||||||||
| Current | Long-term | Total | Total | ||||||||||||||||||||
| (in millions) | |||||||||||||||||||||||
| Short-term borrowings | |||||||||||||||||||||||
| Commercial paper | $ | $ | |||||||||||||||||||||
| $ | $ | ||||||||||||||||||||||
| Long-term debt | |||||||||||||||||||||||
| Term loan credit facilities | $ | $ | $ | $ | |||||||||||||||||||
| Senior notes | |||||||||||||||||||||||
| Other | |||||||||||||||||||||||
| $ | $ | $ | $ | ||||||||||||||||||||
| Constellation Brands, Inc. Q1 FY 2023 Form 10-Q | #WORTHREACHINGFOR I 15 | ||||
| FINANCIAL STATEMENTS | NOTES TO CONSOLIDATED FINANCIAL STATEMENTS | |||||||
Bank facilities
Senior credit facility
In April 2022, the Company, CB International, the Administrative Agent, and certain other lenders entered into the 2022 Restatement Agreement that amended and restated our then-existing senior credit facility (as amended and restated by the 2022 Restatement Agreement, the 2022 Credit Agreement). The principal changes effected by the 2022 Restatement Agreement were:
•The refinance and increase of the existing revolving credit facility from $2.0 billion to $2.25 billion and extension of its maturity to April 14, 2027;
•The refinement of certain negative covenants; and
•The replacement of LIBOR rates with rates based on term SOFR.
Term credit agreement
In April 2022, the Company, the Administrative Agent, and the Lender amended the June 2021 Term Credit Agreement (as amended, the 2022 Term Credit Agreement). The principal changes effected by the amendment were the refinement of certain negative covenants and replacement of LIBOR rates with rates based on term SOFR.
As of May 31, 2022, aggregate credit facilities under the 2022 Credit Agreement and the 2022 Term Credit Agreement consist of the following:
| Amount | Maturity | ||||||||||
| (in millions) | |||||||||||
| 2022 Credit Agreement | |||||||||||
Revolving credit facility (1) (2) | $ | Apr 14, 2027 | |||||||||
| 2022 Term Credit Agreement | |||||||||||
Five-Year Term Facility (1) (3) | $ | Jun 28, 2024 | |||||||||
(1)Contractual interest rate varies based on our debt rating (as defined in the respective agreement) and is a function of SOFR plus a margin and a credit spread adjustment, or the base rate plus a margin, or, in certain circumstances where SOFR cannot be adequately ascertained or available, an alternative benchmark rate plus a margin.
(2)We and/or CB International are the borrower under the $2,250.0 million revolving credit facility. Includes a sub-facility for letters of credit of up to $200.0 million.
(3)We are the borrower under the Five-Year Term Facility.
As of May 31, 2022, information with respect to borrowings under the 2022 Credit Agreement and the 2022 Term Credit Agreement is as follows:
| Outstanding borrowings | Interest rate | SOFR margin | Outstanding letters of credit | Remaining borrowing capacity (1) | |||||||||||||||||||||||||
| (in millions) | |||||||||||||||||||||||||||||
| 2022 Credit Agreement | |||||||||||||||||||||||||||||
| Revolving credit facility | $ | % | % | $ | $ | ||||||||||||||||||||||||
| 2022 Term Credit Agreement | |||||||||||||||||||||||||||||
| Five-Year Term Facility | $ | % | % | ||||||||||||||||||||||||||
(1)Net of outstanding revolving credit facility borrowings and outstanding letters of credit under the 2022 Credit Agreement and outstanding borrowings under our commercial paper program of $124.0 million (excluding unamortized discount) (see “Commercial paper program” below).
| Constellation Brands, Inc. Q1 FY 2023 Form 10-Q | #WORTHREACHINGFOR I 16 | ||||
| FINANCIAL STATEMENTS | NOTES TO CONSOLIDATED FINANCIAL STATEMENTS | |||||||
We and our subsidiaries are subject to covenants that are contained in the 2022 Credit Agreement and the 2022 Term Credit Agreement, including those restricting the incurrence of additional subsidiary indebtedness, additional liens, mergers and consolidations, transactions with affiliates, and sale and leaseback transactions, in each case subject to numerous conditions, exceptions, and thresholds. The financial covenants are limited to a minimum interest coverage ratio and a maximum net leverage ratio.
Commercial paper program
We have a commercial paper program which provides for the issuance of up to an aggregate principal amount of $2.0 billion of commercial paper. Our commercial paper program is backed by unused commitments under our revolving credit facility under our 2022 Credit Agreement. Accordingly, outstanding borrowings under our commercial paper program reduce the amount available under our revolving credit facility. As of May 31, 2022, we had $124.0 million of outstanding borrowings, net of unamortized discount, under our commercial paper program with a weighted average annual interest rate of 1.3 % and a weighted average remaining term of five days .
Pre-issuance hedge contracts
In connection with the May 2022 Senior Notes, we entered into Pre-issuance hedge contracts, which were designated as cash flow hedges. As a result of these agreements, we hedged the treasury rate volatility on $300.0 million of future debt issuances. In May 2022, we terminated and settled all outstanding Pre-issuance hedge contracts, and recognized an unrealized gain, net of income tax effect, of $15.3 million in AOCI within our consolidated balance sheets. The gain on Pre-issuance hedge contracts is being amortized over 10 years to interest expense within our consolidated results of operations. See “Senior notes” below.
Senior notes
In May 2022, we issued $1,850.0 million aggregate principal amount of senior notes. Proceeds from this offering, net of discount and debt issuance costs, were $1,837.5 million. The May 2022 Senior Notes consist of:
| Date of | Redemption | |||||||||||||||||||||||||||||||
| Principal | Maturity | Interest Payments | Stated Redemption Date | Stated Basis Points | ||||||||||||||||||||||||||||
| (in millions, except basis points) | ||||||||||||||||||||||||||||||||
| $ | May 2024 | May/Nov | (2) | |||||||||||||||||||||||||||||
| $ | May 2027 | May/Nov | Apr 2027 | |||||||||||||||||||||||||||||
| $ | May 2032 | May/Nov | Feb 2032 | |||||||||||||||||||||||||||||
(1)Senior unsecured obligations which rank equally in right of payment to all of our existing and future senior unsecured indebtedness.
(2)Redeemable, in whole or in part, at our option at any time at a redemption price equal to 100 % of the outstanding principal amount, plus accrued and unpaid interest and a make-whole payment based on the present value of the future payments at the applicable treasury rate plus the stated basis points.
(3)Redeemable, in whole or in part, at our option at any time prior to the stated redemption date as defined in the indenture, at a redemption price equal to 100 100
In February 2018, we issued $600.0 million aggregate principal amount of 3.20 % senior notes due February 2023. In May 2013, we issued $1,050.0 million aggregate principal amount of 4.25 % senior notes due May 2023. In May 2022, we used a portion of the proceeds from the May 2022 Senior Notes to complete a series of cash tender offers to purchase the 3.20 % February 2018 Senior Notes and the 4.25 % May 2013 Senior Notes validly tendered pursuant to the tender offers. We settled the tender offers with holders of approximately 67 %
| Constellation Brands, Inc. Q1 FY 2023 Form 10-Q | #WORTHREACHINGFOR I 17 | ||||
| FINANCIAL STATEMENTS | NOTES TO CONSOLIDATED FINANCIAL STATEMENTS | |||||||
and 65 % of the total outstanding principal amount of the 3.20 % February 2018 Senior Notes and the 4.25 % May 2013 Senior Notes, respectively. Total cash consideration paid for these purchases was $1,096.0 million and the total carrying amount of the notes was $1,080.7 million, resulting in a loss on extinguishment of debt of $15.3 million (including an immaterial amount of fees and other costs associated with the tender offers), which is included within our consolidated results. In addition, we paid any accrued interest on the tendered notes up to, but not including the date of settlement. In June 2022, we redeemed the remaining $198.2 million and $369.8 million outstanding principal balance of the 3.20 % February 2018 Senior Notes and the 4.25 % May 2013 Senior Notes, respectively. Total cash consideration paid was $575.5 million, which included the remaining principal amount of the notes of $568.0 million and a make-whole premium of $7.5 million which will be included in loss on extinguishment of debt within our consolidated results. See “Debt payments” below.
Debt payments
As of May 31, 2022, the required principal repayments under long-term debt obligations (excluding unamortized debt issuance costs and unamortized discounts of $63.6 million and $21.3 million, respectively) for the remaining nine months of Fiscal 2023 and for each of the five succeeding fiscal years and thereafter are as follows:
| (in millions) | |||||
Fiscal 2023 (1) | $ | ||||
| Fiscal 2024 | |||||
| Fiscal 2025 | |||||
| Fiscal 2026 | |||||
| Fiscal 2027 | |||||
| Fiscal 2028 | |||||
| Thereafter | |||||
| $ | |||||
(1)Includes $568.0 million remaining principal amount of the 3.20 % February 2018 Senior Notes and 4.25 % May 2013 Senior Notes, fully redeemed in June 2022.
9. INCOME TAXES
Our effective tax rate for the three months ended May 31, 2022, and May 31, 2021, was 23.9 % and 1.5 %, respectively.
For the three months ended May 31, 2022, our effective tax rate was higher than the federal statutory rate of 21% primarily due to valuation allowances on the unrealized net loss from changes in fair value of our investment in Canopy and Canopy equity in earnings (losses), partially offset by the benefit of lower effective tax rates applicable to our foreign businesses.
For the three months ended May 31, 2021, our effective tax rate was lower than the federal statutory rate of 21% primarily due to (i) valuation allowances on the unrealized net loss from changes in fair value of our investment in Canopy and Canopy equity in earnings (losses) and (ii) the impact of the long-lived asset impairment of brewery construction in progress, partially offset by the benefit of lower effective tax rates applicable to our foreign businesses.
| Constellation Brands, Inc. Q1 FY 2023 Form 10-Q | #WORTHREACHINGFOR I 18 | ||||
| FINANCIAL STATEMENTS | NOTES TO CONSOLIDATED FINANCIAL STATEMENTS | |||||||
10. STOCKHOLDERS’ EQUITY
Common stock
The number of shares of common stock issued and treasury stock, and associated share activity, are as follows:
| Common Stock | Treasury Stock | ||||||||||||||||||||||||||||
| Class A | Class B | Class 1 | Class A | Class B | |||||||||||||||||||||||||
| Balance at February 28, 2022 | |||||||||||||||||||||||||||||
| Share repurchases | — | — | — | — | |||||||||||||||||||||||||
| Conversion of shares | ( | — | — | ||||||||||||||||||||||||||
| Exercise of stock options | — | — | ( | — | |||||||||||||||||||||||||
Vesting of restricted stock units (1) | — | — | — | ( | — | ||||||||||||||||||||||||
Vesting of performance share units (1) | — | — | — | ( | — | ||||||||||||||||||||||||
| Balance at May 31, 2022 | |||||||||||||||||||||||||||||
| Balance at February 28, 2021 | |||||||||||||||||||||||||||||
| Share repurchases | — | — | — | — | |||||||||||||||||||||||||
| Conversion of shares | ( | ( | — | — | |||||||||||||||||||||||||
| Exercise of stock options | — | — | ( | — | |||||||||||||||||||||||||
Vesting of restricted stock units (1) | — | — | — | ( | — | ||||||||||||||||||||||||
Vesting of performance share units (1) | — | — | — | ( | — | ||||||||||||||||||||||||
| Balance at May 31, 2021 | |||||||||||||||||||||||||||||
(1) Net of the following shares withheld to satisfy tax withholding requirements:
| For the Three Months Ended May 31, | |||||
| 2022 | |||||
| Restricted Stock Units | |||||
| Performance Share Units | |||||
| 2021 | |||||
| Restricted Stock Units | |||||
| Performance Share Units | |||||
Stock repurchases
In January 2018, our Board of Directors authorized the repurchase of up to $3.0 billion of our Class A Stock and Class B Stock, which was fully utilized during the three months ended May 31, 2022. Shares repurchased under the 2018 Authorization have become treasury shares.
Additionally, in January 2021, our Board of Directors authorized the repurchase of up to $2.0 billion of our Class A Stock and Class B Stock. The Board of Directors did not specify a date upon which this authorization would expire. Shares repurchased under this authorization become treasury shares.
For the three months ended May 31, 2022, we repurchased 2,254,536 shares of Class A Stock pursuant to the 2018 Authorization at an aggregate cost of $563.6 million through a combination of open market transactions and an ASR that was announced in April 2022 and 1,810,972 shares of Class A Stock pursuant to the 2021 Authorization at an aggregate cost of $444.1 million through open market transactions. Subsequent to May 31, 2022, we repurchased 1,240,495 shares of Class A Stock pursuant to the 2021 Authorization at an aggregate cost of $293.0 million through open market transactions. Beginning May 25, 2022, all repurchases were made pursuant to a Rule 10b5-1 trading plan.
| Constellation Brands, Inc. Q1 FY 2023 Form 10-Q | #WORTHREACHINGFOR I 19 | ||||
| FINANCIAL STATEMENTS | NOTES TO CONSOLIDATED FINANCIAL STATEMENTS | |||||||
As of June 30, 2022, total shares repurchased under the 2018 Authorization and the 2021 Authorization are as follows:
| Class A Common Shares | |||||||||||||||||
| Repurchase Authorization | Dollar Value of Shares Repurchased | Number of Shares Repurchased | |||||||||||||||
| (in millions, except share data) | |||||||||||||||||
| 2018 Authorization | $ | $ | |||||||||||||||
| 2021 Authorization | $ | $ | |||||||||||||||
Subsequent event
Reclassification Agreement
On June 30, 2022, we announced the Reclassification. To effect the Reclassification, we will seek to effectuate the Charter Amendment. If the Reclassification is completed, upon the Effective Time, each share of Class B Stock issued and outstanding immediately prior to the Effective Time will be reclassified, exchanged, and converted into one share of Class A Stock and the right to receive $64.64 in cash, without interest.
The closing of the Reclassification is subject to customary conditions, including:
•approval of the Charter Amendment by the affirmative vote of the holders of (i) a majority of the voting power of the issued and outstanding shares of Class A Stock and Class B Stock entitled to vote thereon, voting together as a single class, (ii) a majority of the issued and outstanding shares of Class B Stock, and (iii) the affirmative vote of at least 50.3 % of the issued and outstanding shares of Class A Stock not held by the Sands Stockholder Group, executive officers of the Company, or directors that hold Class B Stock;
•the effectiveness of our registration statement on Form S-4 to be filed with the SEC in connection with the Reclassification;
•approval by the NYSE of the listing of the shares of Class A Stock into which the Class B Stock will be reclassified, exchanged, and converted into, subject to official notice of issuance; and
•the accuracy of the representations and warranties of each party (subject to specified materiality qualifiers) and compliance in all material respects by each party with its obligations under the Reclassification Agreement. The Reclassification Agreement contains customary representations, warranties, and covenants of each of the parties thereto for a transaction of this type.
11. NET INCOME (LOSS) PER COMMON SHARE ATTRIBUTABLE TO CBI
For the three months ended May 31, 2022, net income (loss) per common share – diluted for Class A Stock has been computed using the if-converted method and assumes the exercise of stock options using the treasury stock method and the conversion of Class B Stock as this method is more dilutive than the two-class method. For the three months ended May 31, 2022, net income (loss) per common share – diluted for Class B Stock has been computed using the two-class method and does not assume conversion of Class B Stock into shares of Class A Stock. For the three months ended May 31, 2021, net income (loss) per common share – diluted for Class A Stock and Class B Stock have been computed using the two-class method. The computation of basic and diluted net income (loss) per common share is as follows:
| For the Three Months Ended | |||||||||||||||||||||||
| May 31, 2022 | May 31, 2021 | ||||||||||||||||||||||
| Class A Stock | Class B Stock | Class A Stock | Class B Stock | ||||||||||||||||||||
| (in millions, except per share data) | |||||||||||||||||||||||
| Net income (loss) attributable to CBI allocated – basic | $ | $ | $ | ( | $ | ( | |||||||||||||||||
| Conversion of Class B common shares into Class A common shares | |||||||||||||||||||||||
| Effect of stock-based awards on allocated net income (loss) | ( | ||||||||||||||||||||||
| Net income (loss) attributable to CBI allocated – diluted | $ | $ | $ | ( | $ | ( | |||||||||||||||||
| Weighted average common shares outstanding – basic | |||||||||||||||||||||||
Conversion of Class B common shares into Class A common shares (1) | |||||||||||||||||||||||
Stock-based awards, primarily stock options (1) | |||||||||||||||||||||||
| Weighted average common shares outstanding – diluted | |||||||||||||||||||||||
| Net income (loss) per common share attributable to CBI – basic | $ | $ | $ | ( | $ | ( | |||||||||||||||||
| Net income (loss) per common share attributable to CBI – diluted | $ | $ | $ | ( | $ | ( | |||||||||||||||||
(1) | For the three months ended May 31, 2021, we have excluded the following weighted average common shares outstanding from the calculation of diluted net income (loss) per common share, as the effect of including these would have been anti-dilutive, in millions: | ||||||||||
| Class B Stock | |||||||||||
| Stock-based awards, primarily stock options | |||||||||||
12. COMPREHENSIVE INCOME (LOSS) ATTRIBUTABLE TO CBI
Comprehensive income (loss) consists of net income (loss), foreign currency translation adjustments, unrealized net gain (loss) on derivative instruments, pension/postretirement adjustments, and our share of OCI of equity method investments. The reconciliation of net income (loss) attributable to CBI to comprehensive income (loss) attributable to CBI is as follows:
| Before Tax Amount | Tax (Expense) Benefit | Net of Tax Amount | |||||||||||||||
| (in millions) | |||||||||||||||||
| For the Three Months Ended May 31, 2022 | |||||||||||||||||
| Net income (loss) attributable to CBI | $ | ||||||||||||||||
| Other comprehensive income (loss) attributable to CBI: | |||||||||||||||||
| Foreign currency translation adjustments: | |||||||||||||||||
| Net gain (loss) | $ | $ | |||||||||||||||
| Reclassification adjustments | |||||||||||||||||
| Net gain (loss) recognized in other comprehensive income (loss) | |||||||||||||||||
| Unrealized gain (loss) on cash flow hedges: | |||||||||||||||||
| Net derivative gain (loss) | ( | ||||||||||||||||
| Reclassification adjustments | ( | ( | |||||||||||||||
| Net gain (loss) recognized in other comprehensive income (loss) | ( | ||||||||||||||||
| Pension/postretirement adjustments: | |||||||||||||||||
| Net actuarial gain (loss) | ( | ( | |||||||||||||||
| Reclassification adjustments | |||||||||||||||||
| Net gain (loss) recognized in other comprehensive income (loss) | ( | ( | |||||||||||||||
| Constellation Brands, Inc. Q1 FY 2023 Form 10-Q | #WORTHREACHINGFOR I 20 | ||||
| FINANCIAL STATEMENTS | NOTES TO CONSOLIDATED FINANCIAL STATEMENTS | |||||||
| Before Tax Amount | Tax (Expense) Benefit | Net of Tax Amount | |||||||||||||||
| (in millions) | |||||||||||||||||
| Share of OCI of equity method investments | |||||||||||||||||
| Net gain (loss) | ( | ( | |||||||||||||||
| Reclassification adjustments | |||||||||||||||||
| Net gain (loss) recognized in other comprehensive income (loss) | ( | ( | |||||||||||||||
| Other comprehensive income (loss) attributable to CBI | $ | $ | ( | ||||||||||||||
| Comprehensive income (loss) attributable to CBI | $ | ||||||||||||||||
| For the Three Months Ended May 31, 2021 | |||||||||||||||||
| Net income (loss) attributable to CBI | $ | ( | |||||||||||||||
| Other comprehensive income (loss) attributable to CBI: | |||||||||||||||||
| Foreign currency translation adjustments: | |||||||||||||||||
| Net gain (loss) | $ | $ | |||||||||||||||
| Reclassification adjustments | |||||||||||||||||
| Net gain (loss) recognized in other comprehensive income (loss) | |||||||||||||||||
| Unrealized gain (loss) on cash flow hedges: | |||||||||||||||||
| Net derivative gain (loss) | ( | ||||||||||||||||
| Reclassification adjustments | ( | ( | |||||||||||||||
| Net gain (loss) recognized in other comprehensive income (loss) | ( | ||||||||||||||||
| Pension/postretirement adjustments: | |||||||||||||||||
| Net actuarial gain (loss) | ( | ( | |||||||||||||||
| Reclassification adjustments | |||||||||||||||||
| Net gain (loss) recognized in other comprehensive income (loss) | ( | ( | |||||||||||||||
| Share of OCI of equity method investments | |||||||||||||||||
| Net gain (loss) | ( | ( | |||||||||||||||
| Reclassification adjustments | |||||||||||||||||
| Net gain (loss) recognized in other comprehensive income (loss) | ( | ( | |||||||||||||||
| Other comprehensive income (loss) attributable to CBI | $ | $ | ( | ||||||||||||||
| Comprehensive income (loss) attributable to CBI | $ | ( | |||||||||||||||
AOCI, net of income tax effect, includes the following components:
| Foreign Currency Translation Adjustments | Unrealized Net Gain (Loss) on Derivative Instruments | Pension/ Postretirement Adjustments | Share of OCI of Equity Method Investments | AOCI | |||||||||||||||||||||||||
| (in millions) | |||||||||||||||||||||||||||||
| Balance, February 28, 2022 | $ | ( | $ | $ | ( | $ | $ | ( | |||||||||||||||||||||
| OCI: | |||||||||||||||||||||||||||||
| OCI before reclassification adjustments | ( | ( | |||||||||||||||||||||||||||
| Amounts reclassified from AOCI | ( | ( | |||||||||||||||||||||||||||
| OCI | ( | ( | |||||||||||||||||||||||||||
| Balance, May 31, 2022 | $ | ( | $ | $ | ( | $ | $ | ( | |||||||||||||||||||||
| Constellation Brands, Inc. Q1 FY 2023 Form 10-Q | #WORTHREACHINGFOR I 21 | ||||
| FINANCIAL STATEMENTS | NOTES TO CONSOLIDATED FINANCIAL STATEMENTS | |||||||
13. BUSINESS SEGMENT INFORMATION
Our internal management financial reporting consists of three business divisions: (i) Beer, (ii) Wine and Spirits, and (iii) Canopy and we report our operating results in four segments: (i) Beer, (ii) Wine and Spirits, (iii) Corporate Operations and Other, and (iv) Canopy. The Canopy Equity Method Investment makes up the Canopy segment.
In the Beer segment, our portfolio consists of high-end imported beer brands, craft beer, and ABAs. We have an exclusive perpetual brand license to import, market, and sell our Mexican beer portfolio in the U.S. In the Wine and Spirits segment, we sell a portfolio that includes higher-margin, higher-growth wine brands complemented by certain higher-end spirits brands. Amounts included in the Corporate Operations and Other segment consist of costs of executive management, corporate development, corporate finance, corporate growth and strategy, human resources, internal audit, investor relations, legal, public relations, and information technology, as well as our investments made through our corporate venture capital function. All costs included in the Corporate Operations and Other segment are general costs that are applicable to the consolidated group and are, therefore, not allocated to the other reportable segments. All costs reported within the Corporate Operations and Other segment are not included in our CODM’s evaluation of the operating income (loss) performance of the other reportable segments. The business segments reflect how our operations are managed, how resources are allocated, how operating performance is evaluated by senior management, and the structure of our internal financial reporting. Long-lived tangible assets and total asset information by segment is not provided to, or reviewed by, our CODM as it is not used to make strategic decisions, allocate resources, or assess performance.
In addition, management excludes Comparable Adjustments from its evaluation of the results of each operating segment as these Comparable Adjustments are not reflective of core operations of the segments. Segment operating performance and the incentive compensation of segment management are evaluated based on core segment operating income (loss) which does not include the impact of these Comparable Adjustments.
We evaluate segment operating performance based on operating income (loss) of the respective business units. Comparable Adjustments that impacted comparability in our segment operating income (loss) for each period are as follows:
| For the Three Months Ended May 31, | |||||||||||
| 2022 | 2021 | ||||||||||
| (in millions) | |||||||||||
| Cost of product sold | |||||||||||
| Net gain (loss) on undesignated commodity derivative contracts | $ | $ | |||||||||
| Recovery of inventory write-down | |||||||||||
| Settlements of undesignated commodity derivative contracts | ( | ( | |||||||||
| Flow through of inventory step-up | ( | ||||||||||
| Strategic business development costs | ( | ||||||||||
| Total cost of product sold | |||||||||||
| Selling, general, and administrative expenses | |||||||||||
| Transition services agreements activity | ( | ( | |||||||||
| Restructuring and other strategic business development costs | ( | ( | |||||||||
| Transaction, integration, and other acquisition-related costs | ( | ||||||||||
Other gains (losses) (1) | |||||||||||
| Total selling, general, and administrative expenses | ( | ||||||||||
| Impairment of brewery construction in progress | ( | ||||||||||
| Comparable Adjustments, Operating income (loss) | $ | $ | ( | ||||||||
(1)The three months ended May 31, 2022, primarily includes a gain of $5.2 million related to the remeasurement of our previously held 27 % equity interest in Austin Cocktails to the acquisition date fair value.
| Constellation Brands, Inc. Q1 FY 2023 Form 10-Q | #WORTHREACHINGFOR I 22 | ||||
| FINANCIAL STATEMENTS | NOTES TO CONSOLIDATED FINANCIAL STATEMENTS | |||||||
The accounting policies of the segments are the same as those described for the Company in Note 1 of our consolidated financial statements included in our 2022 Annual Report. Amounts included below for the Canopy segment represent 100% of Canopy’s reported results on a two-month lag, prepared in accordance with U.S. GAAP, and converted from Canadian dollars to U.S. dollars. Although we own less than 100% of the outstanding shares of Canopy, 100% of its results are included in the information below and subsequently eliminated in order to reconcile to our consolidated financial statements. Segment information is as follows:
| For the Three Months Ended May 31, | |||||||||||
| 2022 | 2021 | ||||||||||
| (in millions) | |||||||||||
| Beer | |||||||||||
| Net sales | $ | $ | |||||||||
| Segment operating income (loss) | $ | $ | |||||||||
| Capital expenditures | $ | $ | |||||||||
| Depreciation and amortization | $ | $ | |||||||||
| Wine and Spirits | |||||||||||
| Net sales: | |||||||||||
| Wine | $ | $ | |||||||||
| Spirits | |||||||||||
| Net sales | $ | $ | |||||||||
| Segment operating income (loss) | $ | $ | |||||||||
| Income (loss) from unconsolidated investments | $ | $ | |||||||||
| Equity method investments | $ | $ | |||||||||
| Capital expenditures | $ | $ | |||||||||
| Depreciation and amortization | $ | $ | |||||||||
| Corporate Operations and Other | |||||||||||
| Segment operating income (loss) | $ | ( | $ | ( | |||||||
| Income (loss) from unconsolidated investments | $ | ( | $ | ( | |||||||
| Equity method investments | $ | $ | |||||||||
| Capital expenditures | $ | $ | |||||||||
| Depreciation and amortization | $ | $ | |||||||||
| Canopy | |||||||||||
| Net sales | $ | $ | |||||||||
| Segment operating income (loss) | $ | ( | $ | ( | |||||||
| Capital expenditures | $ | $ | |||||||||
| Depreciation and amortization | $ | $ | |||||||||
| Consolidation and Eliminations | |||||||||||
| Net sales | $ | ( | $ | ( | |||||||
| Operating income (loss) | $ | $ | |||||||||
| Income (loss) from unconsolidated investments | $ | ( | $ | ( | |||||||
| Equity method investments | $ | $ | |||||||||
| Capital expenditures | $ | ( | $ | ( | |||||||
| Depreciation and amortization | $ | ( | $ | ( | |||||||
| Constellation Brands, Inc. Q1 FY 2023 Form 10-Q | #WORTHREACHINGFOR I 23 | ||||
| FINANCIAL STATEMENTS | NOTES TO CONSOLIDATED FINANCIAL STATEMENTS | |||||||
| For the Three Months Ended May 31, | |||||||||||
| 2022 | 2021 | ||||||||||
| (in millions) | |||||||||||
| Comparable Adjustments | |||||||||||
| Operating income (loss) | $ | $ | ( | ||||||||
| Income (loss) from unconsolidated investments | $ | ( | $ | ( | |||||||
| Consolidated | |||||||||||
| Net sales | $ | $ | |||||||||
| Operating income (loss) | $ | $ | |||||||||
Income (loss) from unconsolidated investments (1) | $ | ( | $ | ( | |||||||
| Equity method investments | $ | $ | |||||||||
| Capital expenditures | $ | $ | |||||||||
| Depreciation and amortization | $ | $ | |||||||||
(1) | Income (loss) from unconsolidated investments consists of: | ||||||||||||||||
| For the Three Months Ended May 31, | |||||||||||||||||
| 2022 | 2021 | ||||||||||||||||
| (in millions) | |||||||||||||||||
| Unrealized net gain (loss) on securities measured at fair value | $ | ( | $ | ( | |||||||||||||
| Equity in earnings (losses) from Canopy and related activities | ( | ( | |||||||||||||||
| Equity in earnings (losses) from other equity method investees | ( | ||||||||||||||||
| $ | ( | $ | ( | ||||||||||||||
| Constellation Brands, Inc. Q1 FY 2023 Form 10-Q | #WORTHREACHINGFOR I 24 | ||||
Item 2. Management’s Discussion and Analysis of Financial Condition and Results of Operations.
Introduction
This MD&A provides additional information on our businesses, current developments, financial condition, cash flows, and results of operations. It should be read in conjunction with our Financial Statements and with our consolidated financial statements and notes included in our 2022 Annual Report. This MD&A is organized as follows:
Overview. This section provides a general description of our business, which we believe is important in understanding the results of our operations, financial condition, and potential future trends.
Strategy. This section provides a description of our strategy and a discussion of recent developments, global supply chain and COVID-19 related impacts, and significant acquisitions.
Results of operations. This section provides an analysis of our results of operations presented on a business segment basis for the three months ended May 31, 2022, and May 31, 2021. In addition, a brief description of significant transactions and other items that affect the comparability of the results is provided.
Liquidity and capital resources. This section provides an analysis of our cash flows, outstanding debt, and a discussion of the amount of financial capacity available to fund our on-going operations and future commitments, as well as a discussion of other financing arrangements.
Overview
We are an international producer and marketer of beer, wine, and spirits with operations in the U.S., Mexico, New Zealand, and Italy with powerful, consumer-connected, high-quality brands like Corona Extra, Modelo Especial, the Robert Mondavi Brand Family, Kim Crawford, Meiomi, The Prisoner Wine Company, and High West. In the U.S., we are one of the top growth contributors at retail among beverage alcohol suppliers. We are the third-largest beer company in the U.S. and continue to strengthen our leadership position as the #1 high-end beer supplier and the #1 share gainer across the U.S. beer market. Within wine and spirits, we are making solid progress in transforming our brand portfolio to shift to a higher-end focused business to deliver net sales growth and margin expansion. The strength of our brands makes us a supplier of choice to many of our consumers and our customers, which include wholesale distributors, retailers, and on-premise locations. We conduct our business through entities we wholly own as well as through a variety of joint ventures and other entities.
Our internal management financial reporting consists of three business divisions: (i) Beer, (ii) Wine and Spirits, and (iii) Canopy and we report our operating results in four segments: (i) Beer, (ii) Wine and Spirits, (iii) Corporate Operations and Other, and (iv) Canopy. Our Canopy Equity Method Investment makes up the Canopy segment.
| Constellation Brands, Inc. Q1 FY 2023 Form 10-Q | #WORTHREACHINGFOR I 25 | ||||
In the Beer segment, our portfolio consists of high-end imported beer brands, craft beer, and ABAs. We have an exclusive perpetual brand license to import, market, and sell our Mexican beer portfolio in the U.S. In the Wine and Spirits segment, we sell a portfolio that includes higher-margin, higher-growth wine brands complemented by certain higher-end spirits brands. Amounts included in the Corporate Operations and Other segment consist of costs of executive management, corporate development, corporate finance, corporate growth and strategy, human resources, internal audit, investor relations, legal, public relations, and information technology, as well as our investments made through our corporate venture capital function. All costs included in the Corporate Operations and Other segment are general costs that are applicable to the consolidated group and are, therefore, not allocated to the other reportable segments. All costs reported within the Corporate Operations and Other segment are not included in our CODM’s evaluation of the operating income (loss) performance of the other reportable segments. The business segments reflect how our operations are managed, how resources are allocated, how operating performance is evaluated by senior management, and the structure of our internal financial reporting.
Strategy
Business strategy
Our overall strategic vision is to consistently deliver industry-leading total stockholder returns over the long-term through a focus on these key pillars:
•continue building strong brands people love with advantaged routes to market;
•build a culture that is consumer-obsessed and leverages robust innovation capabilities to stay on the forefront of consumer trends; and
•deliver on impactful ESG initiatives that we believe are not only good business, but also good for the world.
We will continue to strive for success by ensuring consumer-led decision making drives all aspects of our business; building a diverse talent pipeline with best-in-class people development; investing in data systems, architecture, and infrastructure that enables our business; and exemplifying intentional and proactive balance sheet management. We place focus on positioning our portfolio on higher-margin, higher-growth categories of the beverage alcohol industry to align with consumer-led premiumization trends, which we believe will continue to drive faster growth rates across beer, wine, and spirits. To continue capitalizing on consumer-led premiumization trends, become more competitive, and grow our business, we have employed a strategy dedicated to organic growth and supplemented by targeted investments and acquisitions. We also believe a key component to driving faster growth rates is to invest and strengthen our leadership position within the DTC and 3-tier eCommerce channels. As a part of our strategy, we have launched Digital Business Acceleration which we believe will enable us to drive results by enhancing our business in key areas including procurement, end-to-end supply chain planning, and marketing optimization. For further information on First Quarter 2023 Digital Business Acceleration investments, see “Selling, general, and administrative expenses” within Results of Operations below.
Our business strategy for the Beer segment focuses on upholding our leadership position in the high-end segment of the U.S. beer market through maintenance of leading margins, enhancements to our results of operations and operating cash flow, and exploring new avenues for growth. This includes continued focus on growing our beer portfolio in the U.S. through expanding distribution for key brands, including within the DTC and 3-tier eCommerce channels, as well as continued expansion, optimization, and/or construction activities for our Mexico beer operations. Additionally, in an effort to compete more fully in growing sectors of the high-end segment of the U.S. beer market, we have leveraged our innovation capabilities to create new line extensions behind celebrated, trusted brands and package formats that meet emerging needs.
Expansion, optimization, and/or construction activities continue under our Mexico Beer Projects to align with our anticipated future growth expectations. At this time, we have suspended all Mexicali Brewery construction activities, following a negative result from a public consultation held in Mexico. We continue to work with government officials in Mexico to explore options to add further capacity at other locations in Mexico,
| Constellation Brands, Inc. Q1 FY 2023 Form 10-Q | #WORTHREACHINGFOR I 26 | ||||
including the construction of the Veracruz Brewery where there is ample water and we will have a skilled workforce to meet our long-term needs.
Our business strategy for the Wine and Spirits segment focuses on higher-end brands, improving margins, and creating operating efficiencies. We continue to refine our portfolio primarily through the acquisition of higher-margin, higher-growth wine and spirits brands. We recently reorganized this business into two distinct commercial teams, one focused on our fine wine and craft spirits brands and the other focused on our mainstream and premium brands. While each team has its own distinct strategy, both remain aligned to the goal of accelerating performance by growing net sales and expanding margins. In addition, we aim to have the DTC and 3-tier eCommerce channels collectively account for 20% of our wine and spirits business over time. In markets where it is feasible, we entered into a contractual arrangement to consolidate our U.S. distribution in order to obtain dedicated distributor selling resources which focus on our U.S. wine and spirits portfolio to drive organic growth. This U.S. distributor currently represents about 70% of our branded wine and spirits volume in the U.S. We expect U.S. wine and spirits shipment volume to be generally aligned with depletion volume for Fiscal 2023.
Marketing, sales, and distribution of our products are primarily managed on a geographic basis allowing us to leverage leading market positions. In addition, market dynamics and consumer trends vary across each of our markets. Within our primary market in the U.S., we offer a range of beverage alcohol products across the imported beer, craft beer, ABA, and branded wine and spirits categories, with generally separate distribution networks utilized for (i) our beer portfolio and (ii) our wine and spirits portfolio. The environment for our products is competitive in each of our markets.
We complement our strategy with our investment in Canopy by expanding our portfolio into adjacent categories. Canopy is a leading cannabis company with operations in countries across the world. This investment is consistent with our long-term strategy to identify, address, and stay ahead of evolving consumer trends and market dynamics. Our strategic relationship with Canopy is designed to help position it to be successful in cannabis production, branding, and intellectual property.
We remain committed to our long-term financial model of: growing sales, expanding margins, and increasing cash flow in order to achieve earnings per share growth, maintain our targeted net leverage ratio, and deliver returns to stockholders through the payment of dividends and periodic share repurchases. Our results of operations and financial condition have been affected by inflation, changing prices, and reductions in discretionary income of consumers available to purchase our products, and we expect these impacts to continue throughout the remainder of Fiscal 2023. Our Fiscal 2023 results of operations have also been, and may continue to be, impacted by other unfavorable global and regional economic conditions, geopolitical events, and military conflicts, such as repercussions from the recent conflict in Ukraine. We intend to continue to monitor the inflationary environment and the impact on the consumer when we consider passing along rising costs through increased selling prices, subject to normal competitive conditions. In addition, we continue to identify on-going cost savings initiatives, including our commodity hedging program. However, there can be no assurance that we will be able to fully mitigate rising costs through increased selling prices and/or cost savings initiatives. Furthermore, to the extent climate-related severe weather events, such as droughts, floods, wildfires, and/or late frosts, continue to occur or accelerate in future periods, it could have a material impact on our results of operations and financial condition.
ESG strategy
Our ESG strategy is aligned with our business goals and stakeholder interests, reflects our Company values, and more directly addresses pressing societal needs. Specifically, we dedicate our resources towards:
Serving as good stewards of our environment and natural resources – Modeling water stewardship for our industry; and reducing GHG emissions through energy conservation and renewable energy initiatives
Enhancing social equity within our industry and communities – Championing the professional development and advancement of women in beverage alcohol and our communities; and enhancing economic development and prosperity in disadvantaged communities
| Constellation Brands, Inc. Q1 FY 2023 Form 10-Q | #WORTHREACHINGFOR I 27 | ||||
Promoting responsible beverage alcohol consumption – Empowering adults to make responsible choices in their alcohol (substance) consumption by supporting fact-based education, engagement programs, and policies
During First Quarter 2023 we took the following steps to advance our ESG strategy by key area:
Serving as good stewards of our environment and natural resources
•held an interactive virtual presentation by The Nature Conservancy to recognize Earth Day, which is celebrated annually around the world on April 22. Topics discussed included global water challenges, The Nature Conservancy’s water security strategies, how companies like ours can lead in the water space, and how each of us as individuals, families, and communities can preserve our planet. Approximately 500 employees from around the globe attended the virtual presentation
Enhancing social equity within our industry and communities
•supported Dress for Success Worldwide, an organization whose mission is to empower women to achieve economic independence, in their Your Hour, Her Power® annual campaign for Women's History Month and International Women's Day, and we matched employee contributions 2:1. The Your Hour, Her Power® pledge asks individuals to donate one hour of pay to help women gain financial independence and professional mobility. Together with our employees, we raised $16,200 in total contributions
•in response to the Russian invasion of Ukraine, created the Ukraine Humanitarian Support Fund and matched employee donations 2:1. The fund supported United Help Ukraine, a nonprofit organization committed to providing humanitarian aid, including food and medical supplies, to Ukrainians during this conflict. Together with our employees, we raised more than $100,000 in total donations
•collaborated with UnidosUS to host informational sessions in English and Spanish to help winery employees understand the various housing and financial education benefits available to them through our company benefits and UnidosUS
•began supporting an initiative, as a member of Distilled Spirits Council of the United States, to develop a pipeline of talent from the Black community that seeks to fill 1,800 roles from internships to executive levels within the spirits industry over the next ten years
Promoting responsible beverage alcohol consumption
•joined RESPONSIBILITY.ORG, a national not-for-profit that aims to empower adults to make a lifetime of responsible alcohol choices as part of a balanced lifestyle, eliminate drunk driving and work with others to end all impaired driving, and eliminate underage drinking, as a member company
Recent Developments
Reclassification Agreement
On June 30, 2022, we announced the Reclassification. To effect the Reclassification, the Company will seek to effectuate the Charter Amendment. If the Reclassification occurs, at the Effective Time, each share of Class B Stock issued and outstanding immediately prior to the Effective Time will be reclassified, exchanged, and converted into one share of Class A Stock and the right to receive $64.64 in cash, without interest.
The closing of the Reclassification is subject to customary conditions, including:
•approval of the Charter Amendment by the affirmative vote of the holders of (i) a majority of the voting power of the issued and outstanding shares of Class A Stock and Class B Stock entitled to vote thereon, voting together as a single class, (ii) a majority of the issued and outstanding shares of Class B Stock, and (iii) the affirmative vote of at least 50.3% of the issued and outstanding shares of Class A Stock not held by the Sands Stockholder Group, executive officers of the Company, or directors that hold Class B Stock;
•the effectiveness of our registration statement on Form S-4 to be filed with the SEC in connection with the Reclassification;
•approval by the NYSE of the listing of the shares of Class A Stock into which the Class B Stock will be reclassified, exchanged, and converted into, subject to official notice of issuance; and
| Constellation Brands, Inc. Q1 FY 2023 Form 10-Q | #WORTHREACHINGFOR I 28 | ||||
•the accuracy of the representations and warranties of each party (subject to specified materiality qualifiers) and compliance in all material respects by each party with its obligations under the Reclassification Agreement. The Reclassification Agreement contains customary representations, warranties, and covenants of each of the parties thereto for a transaction of this type.
Canopy Debt Securities
On June 29, 2022, certain holders of Canopy Debt Securities agreed to sell C$255 million of their Canopy Debt Securities to Canopy at 99% of principal value in exchange for newly issued shares of Canopy common stock. As part of this transaction, we agreed to sell C$100 million of our Canopy Debt Securities in exchange for Canopy common shares. The number of common shares issuable will be based on the volume-weighted average trading price of Canopy's common shares on the Nasdaq for a 10-day trading period beginning on and including June 30, 2022, provided that the exchange price will not be less than $2.50 or more than $3.50. As a result of the exchange, we will receive between 30.7 million and 21.9 million Canopy common shares in July 2022. This sale is not expected to significantly change our Canopy ownership percentage and we will continue to hold C$100 million of our Canopy Debt Securities following this transaction.
Global Supply Chain and COVID-19 Related Impacts
Fiscal 2023 has been, and is expected to continue to be, impacted by challenges with both global supply chain and transportation which contributed to lower product inventory levels and higher cost of product sold. For example, wine produced in New Zealand and Italy and subsequently shipped to the U.S. for distribution continues to be affected by the lack of availability and increased costs of ocean freight shipping containers and port delays causing increased storage charges. In addition, during Fiscal 2022, we experienced a brown glass purchasing shortage, which impacted certain of our imported beer brands. This supply returned to normal levels in early Fiscal 2023. To the extent these circumstances continue to occur or accelerate in future periods it could have a material impact on our results of operations.
We have seen consumers shift more of their total shopping spend to online channels since the COVID-19 outbreak, which has led to increased eCommerce sales, including DTC, for our business. In response to COVID-19, we have ensured our on-going liquidity and financial flexibility through cash preservation initiatives, capital management adjustments, and cost control measures. We have used opportunities under the CARES Act, afforded to us earlier in the pandemic, to defer some payments including certain payroll taxes. We are not able to estimate the long-term impact of COVID-19 on our business, financial condition, results of operations, and/or cash flow. We believe we have sufficient liquidity available from operating cash flow, cash on hand, and availability under our revolving credit facility. We expect to have continued access to capital markets and to be able to continue to return value to stockholders through dividends and periodic share repurchases.
Acquisitions
Wine and Spirits segment
Austin Cocktails acquisition
In April 2022, we acquired the remaining 73% ownership interest in Austin Cocktails, which included a portfolio of small batch, RTD cocktails. This transaction primarily included the acquisition of goodwill and a trademark. The results of operations of Austin Cocktails are reported in the Wine and Spirits segment and have been included in our consolidated results of operations from the date of acquisition.
Lingua Franca acquisition
In March 2022, we acquired the Lingua Franca business, including a collection of Oregon-based luxury wines, a vineyard, and a production facility. This transaction also includes the acquisition of a trademark and inventory. The results of operations of Lingua Franca are reported in the Wine and Spirits segment and have been included in our consolidated results of operations from the date of acquisition.
| Constellation Brands, Inc. Q1 FY 2023 Form 10-Q | #WORTHREACHINGFOR I 29 | ||||
My Favorite Neighbor acquisition
In November 2021, we acquired the remaining 65% ownership interest in My Favorite Neighbor, a super-luxury, DTC-focused wine business as well as certain wholesale distributed brands. This transaction primarily included the acquisition of goodwill, trademarks, inventory, and property, plant, and equipment. The results of operations of My Favorite Neighbor are reported in the Wine and Spirits segment and have been included in our consolidated results of operations from the date of acquisition.
Our recent acquisitions supported our strategic focus on consumer-led premiumization trends and meeting the evolving needs of our consumers.
For additional information on these recent developments and acquisitions, refer to Notes 5, 7, and 10.
Results of Operations
Financial Highlights
First Quarter 2023 compared to First Quarter 2022
•Our results of operations were largely impacted by (i) a decrease in unrealized net loss from the changes in fair value of our investment in Canopy, (ii) an impairment of long-lived assets for First Quarter 2022 in connection with certain assets at the Mexicali Brewery, and (iii) improvements within the Beer segment driven by shipment volume growth.
•Net sales increased 17% due to an increase in Beer net sales driven primarily by shipment volume growth and favorable impact from pricing.
•Operating income increased largely due to (i) the impact of the First Quarter 2022 impairment of long-lived assets in connection with certain assets at the Mexicali Brewery and (ii) the improvements within the Beer segment.
•Net income (loss) attributable to CBI and diluted net income (loss) per common share attributable to CBI increased largely due to the items discussed above, partially offset by higher provision for income taxes.
Comparable Adjustments
Management excludes items that affect comparability from its evaluation of the results of each operating segment as these Comparable Adjustments are not reflective of core operations of the segments. Segment operating performance and the incentive compensation of segment management are evaluated based on core segment operating income (loss) which does not include the impact of these Comparable Adjustments.
As more fully described herein and in the related Notes, the Comparable Adjustments that impacted comparability in our segment results for each period are as follows:
| First Quarter 2023 | First Quarter 2022 | ||||||||||
| (in millions) | |||||||||||
| Cost of product sold | |||||||||||
| Net gain (loss) on undesignated commodity derivative contracts | $ | 48.5 | $ | 24.1 | |||||||
| Recovery of inventory write-down | 0.2 | — | |||||||||
| Settlements of undesignated commodity derivative contracts | (23.3) | (3.4) | |||||||||
| Flow through of inventory step-up | (1.0) | — | |||||||||
| Strategic business development costs | — | (2.6) | |||||||||
| Total cost of product sold | 24.4 | 18.1 | |||||||||
| Constellation Brands, Inc. Q1 FY 2023 Form 10-Q | #WORTHREACHINGFOR I 30 | ||||
| First Quarter 2023 | First Quarter 2022 | ||||||||||
| (in millions) | |||||||||||
| Selling, general, and administrative expenses | |||||||||||
| Transition services agreements activity | (3.4) | (2.3) | |||||||||
| Restructuring and other strategic business development costs | (1.4) | (0.9) | |||||||||
| Transaction, integration, and other acquisition-related costs | (0.2) | — | |||||||||
Other gains (losses) | 4.5 | 3.3 | |||||||||
| Total selling, general, and administrative expenses | (0.5) | 0.1 | |||||||||
| Impairment of brewery construction in progress | — | (665.9) | |||||||||
| Comparable Adjustments, Operating income (loss) | $ | 23.9 | $ | (647.7) | |||||||
| Income (loss) from unconsolidated investments | $ | (135.4) | $ | (855.6) | |||||||
Cost of product sold
Undesignated commodity derivative contracts
Net gain (loss) on undesignated commodity derivative contracts represents a net gain (loss) from the changes in fair value of undesignated commodity derivative contracts. The net gain (loss) is reported outside of segment operating results until such time that the underlying exposure is recognized in the segment operating results. At settlement, the net gain (loss) from the changes in fair value of the undesignated commodity derivative contracts is reported in the appropriate operating segment, allowing the results of our operating segments to reflect the economic effects of the commodity derivative contracts without the resulting unrealized mark to fair value volatility.
Strategic business development costs
We recognized costs primarily in connection with losses on write-downs of excess inventory and contract terminations resulting from our initiatives to optimize our portfolio, gain efficiencies, and reduce our cost structure within the Wine and Spirits segment (First Quarter 2022).
Selling, general, and administrative expenses
Transition services agreements activity
We recognized costs in connection with transition services agreements related to the sale of a portion of our wine and spirits business.
Other gains (losses)
We recognized other gains (losses) primarily in connection with (i) a gain recognized on the remeasurement of our previously held equity interest in Austin Cocktails to the acquisition-date fair value (First Quarter 2023) and (ii) a net gain recognized from the sale of a portion of the wine and spirits business (First Quarter 2022). For additional information on the First Quarter 2023 transaction, refer to Notes 5 and 13.
Impairment of brewery construction in progress
We recognized an impairment of long-lived assets in connection with certain assets at the Mexicali Brewery. For additional information, refer to Note 4.
Income (loss) from unconsolidated investments
We recognized an unrealized gain (loss) primarily from (i) equity in earnings (losses) from Canopy’s results, including equity in losses from Canopy largely related to costs designed to improve their organizational focus, streamline operations, and align production capability with projected demand and (ii) the changes in fair value of our securities measured at fair value. For additional information, refer to Notes 4 and 7.
| Constellation Brands, Inc. Q1 FY 2023 Form 10-Q | #WORTHREACHINGFOR I 31 | ||||
Business Segments
First Quarter 2023 compared to First Quarter 2022
Net sales
| First Quarter 2023 | First Quarter 2022 | Dollar Change | Percent Change | ||||||||||||||||||||
| (in millions) | |||||||||||||||||||||||
| Beer | $ | 1,898.2 | $ | 1,572.0 | $ | 326.2 | 21 | % | |||||||||||||||
| Wine and Spirits: | |||||||||||||||||||||||
| Wine | 404.1 | 397.7 | 6.4 | 2 | % | ||||||||||||||||||
| Spirits | 60.9 | 56.8 | 4.1 | 7 | % | ||||||||||||||||||
| Total Wine and Spirits | 465.0 | 454.5 | 10.5 | 2 | % | ||||||||||||||||||
| Canopy | 88.2 | 117.3 | (29.1) | (25 | %) | ||||||||||||||||||
| Consolidation and eliminations | (88.2) | (117.3) | 29.1 | 25 | % | ||||||||||||||||||
| Consolidated net sales | $ | 2,363.2 | $ | 2,026.5 | $ | 336.7 | 17 | % | |||||||||||||||
 | Beer segment | First Quarter 2023 | First Quarter 2022 | Dollar Change | Percent Change | |||||||||||||||||||||
| (in millions, branded product, 24-pack, 12-ounce case equivalents) | ||||||||||||||||||||||||||
| Net sales | $ | 1,898.2 | $ | 1,572.0 | $ | 326.2 | 21 | % | ||||||||||||||||||
| Shipments | 99.5 | 84.8 | 17.3 | % | ||||||||||||||||||||||
| Depletions | 8.7 | % | ||||||||||||||||||||||||
The increase in Beer net sales is largely due to (i) $274.5 million of shipment volume growth within our Mexican beer portfolio, which benefited from continued consumer demand and (ii) $63.9 million of favorable impact from pricing in select markets within our Mexican beer portfolio, partially offset by $10.9 million of unfavorable product mix primarily from a shift in package types. The First Quarter 2023 net sales increase also benefited from a favorable overlap due to supply shortages from severe winter storms in First Quarter 2022. First Quarter 2023 cases shipped were generally aligned with cases depleted as product inventories in our 3-tier distribution channel remained at normal levels.
 | Wine and Spirits segment | First Quarter 2023 | First Quarter 2022 | Dollar Change | Percent Change | |||||||||||||||||||||
| (in millions, branded product, 9-liter case equivalents) | ||||||||||||||||||||||||||
| Net sales | $ | 465.0 | $ | 454.5 | $ | 10.5 | 2 | % | ||||||||||||||||||
| Shipments | ||||||||||||||||||||||||||
| Total | 6.8 | 6.7 | 1.5 | % | ||||||||||||||||||||||
| U.S. Domestic | 5.8 | 6.0 | (3.3 | %) | ||||||||||||||||||||||
| Depletions | 1.2 | % | ||||||||||||||||||||||||
The increase in Wine and Spirits net sales is due to (i) $23.5 million from favorable product mix shift driven by our strategic focus on higher-end brands and (ii) $17.5 million of favorable impact from pricing, partially offset by (i) a $21.6 million decrease largely attributable to a reduction in net sales of our U.S. domestic lower-end wine
| Constellation Brands, Inc. Q1 FY 2023 Form 10-Q | #WORTHREACHINGFOR I 32 | ||||
and spirits brands and (ii) an $8.9 million decrease in bulk wine and non-branded net sales as compared to First Quarter 2022. The increase in net sales was hindered by global supply chain constraints.
 | Canopy segment Our ownership interest in Canopy allows us to exercise significant influence, but not control, and, therefore, we account for our investment in Canopy under the equity method. Amounts included for the Canopy segment represent 100% of Canopy’s reported results on a two-month lag. Accordingly, we recognized our share of Canopy’s earnings (losses) for the periods January through March 2022, in our First Quarter 2023 results and January through March 2021, in our First Quarter 2022 results. Although we own less than 100% of the outstanding shares of Canopy, 100% of its results are included and subsequently eliminated to reconcile to our consolidated financial statements. See “Income (loss) from unconsolidated investments” below for a discussion of Canopy’s net sales, gross profit (loss), selling, general, and administrative expenses, and operating income (loss). This discussion is based on information Canopy has publicly disclosed. | ||||
Gross profit
| First Quarter 2023 | First Quarter 2022 | Dollar Change | Percent Change | ||||||||||||||||||||
| (in millions) | |||||||||||||||||||||||
| Beer | $ | 1,019.5 | $ | 893.7 | $ | 125.8 | 14 | % | |||||||||||||||
| Wine and Spirits | 211.1 | 207.5 | 3.6 | 2 | % | ||||||||||||||||||
| Canopy | (125.7) | 7.7 | (133.4) | NM | |||||||||||||||||||
| Consolidation and eliminations | 125.7 | (7.7) | 133.4 | NM | |||||||||||||||||||
| Comparable Adjustments | 24.4 | 18.1 | 6.3 | 35 | % | ||||||||||||||||||
| Consolidated gross profit | $ | 1,255.0 | $ | 1,119.3 | $ | 135.7 | 12 | % | |||||||||||||||
| The increase in Beer is primarily due to $157.0 million of shipment volume growth and the $63.9 million favorable impact from pricing, partially offset by $77.5 million of higher cost of product sold driven by inflation and global supply chain constraints and $16.5 million of unfavorable product mix. The higher cost of product sold is largely due to (i) $43.9 million of higher material costs, including pallets, cartons, aluminum, steel, and corn, (ii) $19.3 million of higher depreciation, (iii) $13.1 million of increased transportation costs, and (iv) a $13.0 million increase in brewery costs primarily driven by incremental headcount to support the growth of our Mexican beer portfolio and increased maintenance and utilities costs, partially offset by $14.2 million of favorable fixed cost absorption related to increased production levels as compared to First Quarter 2022 and $8.0 million of decreased inventory obsolescence primarily related to hard seltzers. | ||||
| The increase in Wine and Spirits gross profit is primarily due to $23.5 million from favorable product mix shift and the $17.5 million favorable impact from pricing, partially offset by $21.6 million of shipment volume decline and $13.8 million of higher cost of product sold driven by global supply chain constraints and inflation. The increase in cost of product sold was largely attributable to (i) $21.4 million of higher material costs, including grapes and glass, and (ii) $8.8 million of increased transportation and warehousing costs, partially offset by (i) $16.5 million related to an out of period inventory adjustment and (ii) $2.9 million of favorable fixed cost absorption as a result of the impact of the 2020 U.S. wildfires in First Quarter 2022. | ||||
Gross profit as a percent of net sales decreased to 53.1% for First Quarter 2023 compared with 55.2% for First Quarter 2022. This decrease was largely due to approximately (i) 320 basis points and 60 basis points of rate decline from cost of product sold within the Beer and Wine and Spirits segments, respectively, driven by the increase in operational and logistics costs, and (ii) 40 basis points related to unfavorable product mix shift within
| Constellation Brands, Inc. Q1 FY 2023 Form 10-Q | #WORTHREACHINGFOR I 33 | ||||
the Beer segment, partially offset by approximately (i) 115 basis points of favorable impact from Beer pricing in select markets and (ii) 45 basis points related to favorable product mix shift within the Wine and Spirits segment.
Selling, general, and administrative expenses
| First Quarter 2023 | First Quarter 2022 | Dollar Change | Percent Change | ||||||||||||||||||||
| (in millions) | |||||||||||||||||||||||
| Beer | $ | 256.7 | $ | 220.6 | $ | 36.1 | 16 | % | |||||||||||||||
| Wine and Spirits | 120.1 | 103.3 | 16.8 | 16 | % | ||||||||||||||||||
| Corporate Operations and Other | 61.3 | 54.5 | 6.8 | 12 | % | ||||||||||||||||||
| Canopy | 292.5 | 191.9 | 100.6 | 52 | % | ||||||||||||||||||
| Consolidation and eliminations | (292.5) | (191.9) | (100.6) | (52 | %) | ||||||||||||||||||
| Comparable Adjustments | 0.5 | (0.1) | 0.6 | NM | |||||||||||||||||||
| Consolidated selling, general, and administrative expenses | $ | 438.6 | $ | 378.3 | $ | 60.3 | 16 | % | |||||||||||||||
| The increase in Beer is driven by $21.6 million of increased marketing spend and a $14.5 million increase in general and administrative expenses. The increase in marketing spend is due largely to planned investment to support the growth of our Mexican beer portfolio. The increase in general and administrative expenses was driven primarily by costs associated with strategic asset relocation, incremental headcount to support the growth of our Mexican beer portfolio, and higher travel as compared to First Quarter 2022, partially offset by a favorable foreign currency impact. | ||||
| The increase in Wine and Spirits is primarily due to $12.8 million of increased general and administrative expenses and a $4.7 million increase in marketing spend. The increase in general and administrative expenses was largely driven by compensation and benefits, primarily related to higher headcount as compared to First Quarter 2022, and expenses associated with an initiative to improve our marketing effectiveness. The increase in marketing spend was driven by planned investments to support the growth of our brands. | ||||
 | The increase in Corporate Operations and Other is primarily due to approximately (i) $9 million related to Digital Business Acceleration investments and (ii) a $2 million increase in compensation and benefits as compared to First Quarter 2022, partially offset by an approximately $6 million decrease in consulting services, driven by the completion of an ERP implementation. | ||||
Selling, general, and administrative expenses as a percent of net sales remained relatively flat at 18.6% for First Quarter 2023 as compared to 18.7% for First Quarter 2022. This was driven by rate decline from the Beer segment as the increase in Beer net sales exceeded the increase in selling, general, and administrative expenses, offset by rate growth from an increase in both the Wine and Spirits and Corporate Operations and Other segments selling, general, and administrative expenses.
| Constellation Brands, Inc. Q1 FY 2023 Form 10-Q | #WORTHREACHINGFOR I 34 | ||||
Operating income (loss)
| First Quarter 2023 | First Quarter 2022 | Dollar Change | Percent Change | ||||||||||||||||||||
| (in millions) | |||||||||||||||||||||||
| Beer | $ | 762.8 | $ | 673.1 | $ | 89.7 | 13 | % | |||||||||||||||
| Wine and Spirits | 91.0 | 104.2 | (13.2) | (13 | %) | ||||||||||||||||||
| Corporate Operations and Other | (61.3) | (54.5) | (6.8) | (12 | %) | ||||||||||||||||||
| Canopy | (418.2) | (184.2) | (234.0) | (127 | %) | ||||||||||||||||||
| Consolidation and eliminations | 418.2 | 184.2 | 234.0 | 127 | % | ||||||||||||||||||
| Comparable Adjustments | 23.9 | (647.7) | 671.6 | 104 | % | ||||||||||||||||||
| Consolidated operating income (loss) | $ | 816.4 | $ | 75.1 | $ | 741.3 | NM | ||||||||||||||||
| The increase in Beer is largely attributable to the strong shipment volume growth within our Mexican beer portfolio and favorable pricing impact, partially offset by the higher operational costs, marketing spend, and general and administrative expenses, as described above, and the unfavorable product mix shift. | ||||
| The decrease in Wine and Spirits is largely attributable to branded wine and spirits volume decline, supply chain constraints, inflation, and increased general and administrative expenses, as described above, partially offset by favorable impacts from product mix shift and pricing. | ||||
| As previously discussed, the Corporate Operations and Other increase in operating loss is largely due to the First Quarter 2023 Digital Business Acceleration investments and increased compensation and benefits, partially offset by the decrease in ERP-related consulting services. | ||||
Income (loss) from unconsolidated investments
General
| First Quarter 2023 | First Quarter 2022 | Dollar Change | Percent Change | ||||||||||||||||||||
| (in millions) | |||||||||||||||||||||||
| Unrealized net gain (loss) on securities measured at fair value | $ | (22.4) | $ | (745.1) | $ | 722.7 | 97 | % | |||||||||||||||
Equity in earnings (losses) from Canopy and related activities (1) | (165.0) | (155.8) | (9.2) | (6 | %) | ||||||||||||||||||
| Equity in earnings (losses) from other equity method investees | (0.5) | 1.7 | (2.2) | (129 | %) | ||||||||||||||||||
| $ | (187.9) | $ | (899.2) | $ | 711.3 | 79 | % | ||||||||||||||||
(1)Includes $100.9 million and $24.6 million of costs designed to improve their organizational focus, streamline operations, and align production capability with projected demand for First Quarter 2023 and First Quarter 2022, respectively.
For additional information regarding our equity method investments, refer to Note 7.
| Constellation Brands, Inc. Q1 FY 2023 Form 10-Q | #WORTHREACHINGFOR I 35 | ||||
| Canopy segment Canopy net sales decreased to $88.2 million for First Quarter 2023 from $117.3 million for First Quarter 2022. This decrease of $29.1 million, or 25%, is largely attributable to lower global cannabis sales. The decline in global cannabis sales primarily resulted from (i) a decrease in Canadian recreational cannabis, largely driven by lower supply of high demand products, unfavorable impacts from product mix shift and pricing, and a rapid increase in third party retail locations across Canada and (ii) a decrease in medical sales driven by the January 2022 divestiture of C3, an international pharmaceutical business. These declines were partially offset by growth in Canadian THC recreational sales driven by Canopy’s Fiscal 2022 acquisitions including the Supreme Cannabis Company, Inc. and AV Cannabis Inc. (“Ace Valley”). Canopy gross profit (loss) decreased to $(125.7) million for First Quarter 2023 from $7.7 million for First Quarter 2022. This decrease of $133.4 million is primarily driven by the write-down of excess inventory balances related to its organizational and strategic review of its business, decreased net sales and price compression in the Canadian recreational channel, and higher shipping, distribution, and warehousing costs in North America. Canopy selling, general, and administrative expenses increased $100.6 million largely driven by higher asset impairment and restructuring costs for First Quarter 2023, partially offset by a continued focus on reducing costs and the closure of certain research and development facilities in Fiscal 2022. The combination of these factors were the main contributors to the increase in operating loss of $234.0 million. | ||||
Interest expense
Interest expense increased to $88.5 million for First Quarter 2023 from $86.7 million for First Quarter 2022. This increase of $1.8 million, or 2%, is due to approximately $90 million of higher average borrowings, largely offset by lower weighted average interest rates.
Loss on extinguishment of debt
Loss on extinguishment of debt consists of a premium payment and the write-off of debt issuance costs in connection with the May 2022 tender offers of our 3.20% February 2018 Senior Notes and 4.25% May 2013 Senior Notes.
(Provision for) benefit from income taxes
The (provision for) benefit from income taxes increased to $(125.4) million for First Quarter 2023 from $13.5 million for First Quarter 2022. Our effective tax rate for First Quarter 2023 was 23.9% as compared with 1.5% for First Quarter 2022. In comparison to prior year, our taxes were impacted primarily by:
•valuation allowances on the unrealized net loss from the changes in fair value of our investment in Canopy and Canopy equity in earnings (losses); and
•the effective tax rates applicable to our foreign businesses, including the impact of the First Quarter 2022 impairment of long-lived assets in connection with certain assets at the Mexicali Brewery.
For additional information, refer to Note 9.
We expect our reported effective tax rate for Fiscal 2023 to be in the range of 20% to 23%. For additional information, refer to Note 4. Since estimates are not currently available, this range does not reflect any future changes in the fair value of our Canopy investment measured at fair value and any future equity in earnings (losses) from the Canopy Equity Method Investment and related activities.
Net income (loss) attributable to CBI
Net income (loss) attributable to CBI increased to $389.5 million for First Quarter 2023 from $(908.1) million for First Quarter 2022. This increase of $1,297.6 million is largely attributable to (i) the decrease in unrealized net loss from the changes in fair value of our investment in Canopy in First Quarter 2023 as compared to First Quarter 2022, (ii) the First Quarter 2022 impairment of long-lived assets in connection with certain assets at the Mexicali Brewery, and (iii) improvements within the Beer segment, partially offset by the higher provision for income taxes.
| Constellation Brands, Inc. Q1 FY 2023 Form 10-Q | #WORTHREACHINGFOR I 36 | ||||
Liquidity and Capital Resources
General
Our primary source of liquidity has been cash flow from operating activities. Our ability to consistently generate robust cash flow from our operations is one of our most significant financial strengths; it enables us to invest in our people and our brands, make capital investments and strategic acquisitions, provide a cash dividend program, and from time-to-time, repurchase shares of our common stock. Our largest use of cash in our operations is for purchasing and carrying inventories and carrying seasonal accounts receivable. Historically, we have used this cash flow to repay our short-term borrowings and fund capital expenditures. Additionally, our commercial paper program is used to fund our short-term borrowing requirements and to maintain our access to the capital markets. We use our short-term borrowings, including our commercial paper program, to support our working capital requirements and capital expenditures.
We seek to maintain adequate liquidity to meet working capital requirements, fund capital expenditures, and repay scheduled principal and interest payments on debt. Absent deterioration of market conditions, we believe that cash flows from operating and financing activities will provide adequate resources to satisfy our working capital, scheduled principal and interest payments on debt, anticipated dividend payments, periodic share repurchases, and anticipated capital expenditure requirements for both our short-term and long-term capital needs.
We expect the Reclassification may require significant cash outlays in the near-term. If the Reclassification is completed, each share of Class B Stock issued and outstanding or held by us as treasury stock immediately prior to the Effective Time will be reclassified, exchanged, and converted into one share of Class A Stock and the right to receive $64.64 in cash, without interest. We expect the aggregate cash payment to holders of Class B Stock at the Effective Time will be $1.5 billion. In addition, we will have to pay certain additional costs related to the Reclassification.
We have an agreement with a financial institution for payable services and plan to facilitate a voluntary supply chain finance program through this participating financial institution in Fiscal 2023. The program will be available to certain of our suppliers allowing them the option to manage their cash flow. We will not be a party to the agreements between the participating financial institution and the suppliers in connection with the program. Our rights and obligations to our suppliers, including amounts due and scheduled payment terms, will not be impacted. We are still evaluating the impact of this program on future liquidity.
As of May 31, 2022, the exercise of the November 2018 Canopy Warrants would have required a cash outflow of approximately $5.9 billion based on the terms of the warrants. The exercise price for the November 2018 Canopy Warrants exceeded Canopy’s stock price as of May 31, 2022.
Cash Flows
| First Quarter 2023 | First Quarter 2022 | Dollar Change | Percent Change | ||||||||||||||||||||
| (in millions) | |||||||||||||||||||||||
| Net cash provided by (used in): | |||||||||||||||||||||||
| Operating activities | $ | 758.2 | $ | 716.0 | $ | 42.2 | 6 | % | |||||||||||||||
| Investing activities | (226.8) | (116.6) | (110.2) | (95) | % | ||||||||||||||||||
| Financing activities | (627.2) | (556.5) | (70.7) | (13) | % | ||||||||||||||||||
| Effect of exchange rate changes on cash and cash equivalents | (1.8) | 0.3 | (2.1) | NM | |||||||||||||||||||
| Net increase (decrease) in cash and cash equivalents | $ | (97.6) | $ | 43.2 | $ | (140.8) | NM | ||||||||||||||||
| Constellation Brands, Inc. Q1 FY 2023 Form 10-Q | #WORTHREACHINGFOR I 37 | ||||
Operating activities
The increase in net cash provided by (used in) operating activities consists of:
| First Quarter 2023 | First Quarter 2022 | Dollar Change | Percent Change | ||||||||||||||||||||
| (in millions) | |||||||||||||||||||||||
| Net income (loss) | $ | 399.3 | $ | (897.3) | $ | 1,296.6 | 145 | % | |||||||||||||||
| Unrealized net (gain) loss on securities measured at fair value | 22.4 | 745.1 | (722.7) | (97) | % | ||||||||||||||||||
| Deferred tax provision (benefit) | 21.5 | (98.7) | 120.2 | 122 | % | ||||||||||||||||||
| Equity in (earnings) losses of equity method investees and related activities, net of distributed earnings | 165.5 | 154.1 | 11.4 | 7 | % | ||||||||||||||||||
| Impairment of brewery construction in progress | — | 665.9 | (665.9) | NM | |||||||||||||||||||
| Other non-cash adjustments | 167.1 | 84.7 | 82.4 | 97 | % | ||||||||||||||||||
| Change in operating assets and liabilities, net of effects from purchase and sale of business | (17.6) | 62.2 | (79.8) | (128) | % | ||||||||||||||||||
| Net cash provided by (used in) operating activities | $ | 758.2 | $ | 716.0 | $ | 42.2 | 6 | % | |||||||||||||||
The net change in operating assets and liabilities was largely driven by accounts payable primarily attributable to the timing of payments for both the Beer and Wine and Spirits segments and an exclusivity payment received in connection with distribution arrangements for our U.S. wine and spirits brand portfolio in First Quarter 2022. This was partially offset by benefits from accounts receivable primarily due to improved timing of collections for both the Beer and Wine and Spirits segments. Additionally, the overall increase in net cash provided by operating activities was partially offset by higher income tax payments in First Quarter 2023 as compared to First Quarter 2022.
Investing activities
Net cash used in investing activities increased to $226.8 million for First Quarter 2023 from $116.6 million for First Quarter 2022. This increase of $110.2 million was primarily due to $82.7 million of higher capital expenditures and $37.2 million of business acquisitions for First Quarter 2023, consisting of Lingua Franca and Austin Cocktails.
Financing activities
The increase in net cash provided by (used in) financing activities consists of:
| First Quarter 2023 | First Quarter 2022 | Dollar Change | Percent Change | ||||||||||||||||||||
| (in millions) | |||||||||||||||||||||||
| Net proceeds from (payments of) debt, current and long-term, and related activities | $ | 537.3 | $ | (1.1) | $ | 538.4 | NM | ||||||||||||||||
| Dividends paid | (149.3) | (146.7) | (2.6) | (2) | % | ||||||||||||||||||
| Purchases of treasury stock | (1,007.6) | (400.8) | (606.8) | (151) | % | ||||||||||||||||||
| Net cash provided by stock-based compensation activities | 3.6 | 2.7 | 0.9 | 33 | % | ||||||||||||||||||
| Distributions to noncontrolling interests | (11.2) | (10.6) | (0.6) | (6) | % | ||||||||||||||||||
| Net cash provided by (used in) financing activities | $ | (627.2) | $ | (556.5) | $ | (70.7) | (13) | % | |||||||||||||||
| Constellation Brands, Inc. Q1 FY 2023 Form 10-Q | #WORTHREACHINGFOR I 38 | ||||
Debt
Total debt outstanding as of May 31, 2022, amounted to $10,977.3 million, an increase of $560.8 million from February 28, 2022. This increase consisted of (1):
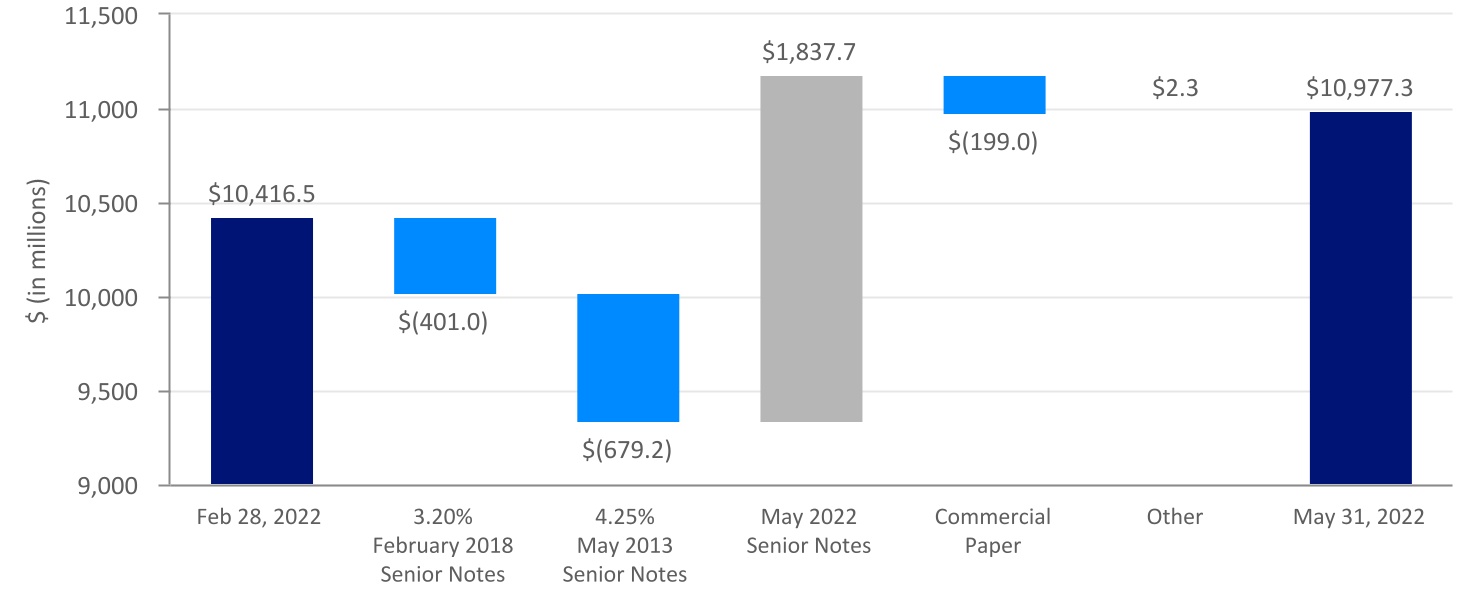
| Debt repayment | Debt issuance | ||||||||||||||||
(1)Total debt outstanding as of May 31, 2022, includes $568.0 million remaining principal amount of the 3.20% February 2018 Senior Notes and 4.25% May 2013 Senior Notes, fully redeemed in June 2022.
Bank facilities
In April 2022, we entered into the 2022 Restatement Agreement that amended and restated our then-existing senior credit facility. The 2022 Restatement Agreement resulted in (i) the refinance and increase of the existing revolving credit facility from $2.0 billion to $2.25 billion and extension of its maturity to April 14, 2027, (ii) the refinement of certain negative covenants, and (iii) the replacement of LIBOR rates with rates based on term SOFR. There are no borrowings outstanding under the 2022 Credit Agreement.
In April 2022, the Company and the Administrative Agent and Lender amended the June 2021 Term Credit Agreement. The principal changes effected by the April 2022 amendment were the refinement of certain negative covenants and replacement of LIBOR rates with rates based on term SOFR.
Senior notes
In May 2022, we issued the May 2022 Senior Notes. Proceeds from this offering, net of discount and debt issuance costs, of $1,837.5 million were used towards a series of cash tender offers, the June 2022 repayment of the 3.20% February 2018 Senior Notes and the 4.25% May 2013 Senior Notes, and for general corporate purposes, including working capital, funding capital expenditures, retirement of debt, and other business opportunities.
General
The majority of our outstanding borrowings as of May 31, 2022, consisted of fixed-rate senior unsecured notes, with maturities ranging from calendar 2023 to calendar 2050, and a variable-rate senior unsecured term loan facility under our 2022 Term Credit Agreement with a calendar 2024 maturity date.
Additionally, we have a commercial paper program which provides for the issuance of up to an aggregate principal amount of $2.0 billion of commercial paper. Our commercial paper program is backed by unused commitments under our revolving credit facility under our 2022 Credit Agreement. Accordingly, outstanding borrowings under our commercial paper program reduce the amount available under our revolving credit facility.
| Constellation Brands, Inc. Q1 FY 2023 Form 10-Q | #WORTHREACHINGFOR I 39 | ||||
We do not have purchase commitments from buyers for our commercial paper and, therefore, our ability to issue commercial paper is subject to market demand. If the commercial paper market is not available to us for any reason when commercial paper borrowings mature, we intend to utilize unused commitments under our revolving credit facility under our 2022 Credit Agreement to repay commercial paper borrowings. We do not expect that fluctuations in demand for commercial paper will affect our liquidity given our borrowing capacity available under our revolving credit facility.
We had the following remaining borrowing capacity available under our 2022 Credit Agreement:
| May 31, 2022 | June 24, 2022 | ||||||||||
| (in millions) | |||||||||||
Revolving credit facility (1) | $ | 2,114.0 | $ | 1,389.1 | |||||||
(1)Net of outstanding revolving credit facility borrowings and outstanding letters of credit under our 2022 Credit Agreement and outstanding borrowings under our commercial paper program.
The financial institutions participating in our 2022 Credit Agreement have complied with prior funding requests and we believe they will comply with any future funding requests. However, there can be no assurances that any particular financial institution will continue to do so.
We and our subsidiaries are subject to covenants that are contained in our 2022 Credit Agreement, including those restricting the incurrence of additional subsidiary indebtedness, additional liens, mergers and consolidations, transactions with affiliates, and sale and leaseback transactions, in each case subject to numerous conditions, exceptions, and thresholds. The financial covenants are limited to a minimum interest coverage ratio and a maximum net leverage ratio, both as defined in our 2022 Credit Agreement. As of May 31, 2022, under our 2022 Credit Agreement, the minimum interest coverage ratio was 2.5x and the maximum net leverage ratio was 4.0x.
The representations, warranties, covenants, and events of default set forth in our 2022 Term Credit Agreement are substantially similar to those set forth in our 2022 Credit Agreement.
Our indentures relating to our outstanding senior notes contain certain covenants, including, but not limited to: (i) a limitation on liens on certain assets, (ii) a limitation on certain sale and leaseback transactions, and (iii) restrictions on mergers, consolidations, and the transfer of all or substantially all of our assets to another person.
As of May 31, 2022, we were in compliance with our covenants under our 2022 Credit Agreement, our 2022 Term Credit Agreement, and our indentures, and have met all debt payment obligations.
For further discussion and presentation of our borrowings and available sources of borrowing, refer to Note 12 of our consolidated financial statements included in our 2022 Annual Report and Note 8.
Common Stock Dividends
On June 29, 2022, our Board of Directors declared a quarterly cash dividend of $0.80 per share of Class A Stock, $0.72 per share of Class B Stock, and $0.72 per share of Class 1 Stock payable on August 24, 2022, to stockholders of record of each class as of the close of business on August 10, 2022.
We currently expect to continue to pay a regular quarterly cash dividend to stockholders of our common stock in the future, but such payments are subject to approval of our Board of Directors and are dependent upon our financial condition, results of operations, capital requirements, and other factors, including those set forth under Item 1A. “Risk Factors” of our 2022 Annual Report.
| Constellation Brands, Inc. Q1 FY 2023 Form 10-Q | #WORTHREACHINGFOR I 40 | ||||
Share Repurchase Program
Our Board of Directors authorized the repurchase of up to $3.0 billion of our Class A Stock and Class B Stock under the 2018 Authorization and an additional repurchase of up to $2.0 billion of our Class A Stock and Class B Stock under the 2021 Authorization. The 2018 Authorization was fully utilized during First Quarter 2023 through a combination of open market transactions and an ASR that was announced in April 2022.
As of June 30, 2022, total shares repurchased under the 2018 Authorization and 2021 Authorization are as follows:
| Class A Common Shares | |||||||||||||||||
| Repurchase Authorization | Dollar Value of Shares Repurchased | Number of Shares Repurchased | |||||||||||||||
| (in millions, except share data) | |||||||||||||||||
| 2018 Authorization | $ | 3,000.0 | $ | 3,000.0 | 13,331,156 | ||||||||||||
| 2021 Authorization | $ | 2,000.0 | $ | 737.1 | 3,051,467 | ||||||||||||
Share repurchases under the 2021 Authorization may be accomplished at management’s discretion from time to time based on market conditions, our cash and debt position, and other factors as determined by management. Shares may be repurchased through open market or privately negotiated transactions. We may fund future share repurchases with cash generated from operations and/or proceeds from borrowings. Any repurchased shares become treasury shares, including shares repurchased under the 2018 Authorization and 2021 Authorization.
We currently expect to continue to repurchase shares in the future, but such repurchases are dependent upon our financial condition, results of operations, capital requirements, and other factors, including those set forth under Item 1A. “Risk Factors” of our 2022 Annual Report as supplemented by the additional factors set forth under Item 1A. “Risk Factors” included in this Form 10-Q.
For additional information, refer to Note 17 of our consolidated financial statements included in our 2022 Annual Report and Note 10.
Accounting Guidance
Accounting guidance adopted for First Quarter 2023 did not have a material impact on our Financial Statements.
Information Regarding Forward-Looking Statements
This Form 10-Q contains “forward-looking statements” within the meaning of Section 27A of the Securities Act and Section 21E of the Exchange Act. These forward-looking statements are subject to a number of risks and uncertainties, many of which are beyond our control, which could cause actual results to differ materially from those set forth in, or implied by, such forward-looking statements. All statements other than statements of historical fact included in this Form 10-Q are forward-looking statements, including without limitation:
•The statements under Part I - Item 2. “Management’s Discussion and Analysis of Financial Condition and Results of Operations” regarding:
◦our business strategy, future operations, innovation strategy and new products, future financial position and liquidity, future net sales, expected volume, inventory, and depletion trends, future marketing spend, long-term financial model, including our targeted net leverage ratio, future effective tax rates and anticipated tax liabilities, access to capital markets, and prospects, plans, and objectives of management;
| Constellation Brands, Inc. Q1 FY 2023 Form 10-Q | #WORTHREACHINGFOR I 41 | ||||
◦anticipated inflationary pressures and our responses thereto as well as other unfavorable global and regional economic conditions, geopolitical events, and military conflicts, such as repercussions from the recent conflict in Ukraine;
◦our ESG strategy;
◦the potential impact to supply, production levels, and costs due to global supply chain constraints and transportation;
◦any delays with respect to, or the failure to complete, the Reclassification, including failure to receive the requisite stockholder approvals, and the impact of the Reclassification on the market price of our common stock;
◦the COVID-19 pandemic;
◦expected or potential actions of third parties, including possible changes to laws, rules, and regulations;
◦the future expected balance of supply and demand for and inventory levels of our products;
◦the refinement of our wine and spirits portfolio;
◦the availability of a supply chain finance program;
◦the manner, timing, and duration of the share repurchase program and source of funds for share repurchases; and
◦the amount and timing of future dividends.
•The statements regarding our beer expansion, optimization, and/or construction activities, including anticipated scope, capacity, costs, capital expenditures, timeframes for completion, discussions with government officials in Mexico, and potential future impairment of non-recoverable brewery construction assets and other costs and expenses.
•The statements regarding:
◦the volatility of the fair value of our investment in Canopy measured at fair value;
◦our activities surrounding our investment in Canopy;
◦Canopy’s expectations and the transaction with Acreage;
◦the timing and source of funds for operating activities and exercises of the November 2018 Canopy Warrants, if any;
◦a potential future impairment of our Canopy Equity Method Investment; and
◦our future ownership level in Canopy and our future share of Canopy’s reported earnings and losses.
•The statements regarding the future reclassification of net gains from AOCI.
When used in this Form 10-Q, the words “anticipate,” “intend,” “expect,” and similar expressions are intended to identify forward-looking statements, although not all forward-looking statements contain such identifying words. All forward-looking statements speak only as of the date of this Form 10-Q. We undertake no obligation to update or revise any forward-looking statements, whether as a result of new information, future events, or otherwise. Although we believe that the expectations reflected in the forward-looking statements are reasonable, we can give no assurance that such expectations will prove to be correct. In addition to the risks and uncertainties of ordinary business operations and conditions in the general economy and markets in which we compete, our forward-looking statements contained in this Form 10-Q are also subject to the risk, uncertainty, and possible variance from our current expectations regarding:
•water, agricultural and other raw material, and packaging material supply, production, and/or shipment difficulties which could adversely affect our ability to supply our customers;
•the ability to respond to anticipated inflationary pressures, including reductions in consumer discretionary income and our ability to pass along rising costs through increased selling prices, and unfavorable global or regional economic conditions, including economic slowdown or recession;
•the actual impact to supply, production levels, and costs from global supply chain constraints, transportation challenges, wildfires, and severe weather events, due to, among other reasons, actual supply chain and transportation performance and the actual severity and geographical reach of wildfires and severe weather events;
| Constellation Brands, Inc. Q1 FY 2023 Form 10-Q | #WORTHREACHINGFOR I 42 | ||||
•the actual balance of supply and demand for our products and percentage of our portfolio distributed through any particular distributor due to, among other reasons, actual raw material and water supply, actual shipments to distributors, and actual consumer demand;
•the actual demand, net sales, channel proportions, and volume trends for our products due to, among other reasons, actual shipments to distributors and actual consumer demand;
•beer operations expansion, optimization, and/or construction activities, scope, capacity, costs (including impairments), capital expenditures, and timing due to, among other reasons, market conditions, our cash and debt position, receipt of required regulatory approvals by the expected dates and on the expected terms, results of discussions with government officials in Mexico, the actual amount of non-recoverable brewery construction assets and other costs and expenses, and other factors as determined by management;
•the duration and impact of the COVID-19 pandemic, including but not limited to the impact and severity of new variants, vaccine efficacy and immunization rates, the closure of non-essential businesses, which may include our manufacturing facilities, and other associated governmental containment actions, and the increase in cyber-security attacks that have occurred while non-production employees work remotely;
•the impact of the military conflict in Ukraine and associated geopolitical tensions and responses, including on inflation, supply chains, commodities, energy, and cyber-security;
•the amount, timing, and source of funds for any share repurchases or future exercises of the November 2018 Canopy Warrants, if any, which may vary due to market conditions; our cash and debt position; the impact of the beer operations expansion, optimization, and/or construction activities; the impact of our investment in Canopy; and other factors as determined by management from time to time;
•the amount and timing of future dividends which are subject to the determination and discretion of our Board of Directors and may be impacted if our ability to use cash flow to fund dividends is affected by unanticipated increases in total net debt, we are unable to generate cash flow at anticipated levels, or we fail to generate expected earnings;
•the fair value of our investment in Canopy due to market and economic conditions in Canopy’s markets and business locations;
•the accuracy of management’s projections relating to the Canopy investment due to Canopy’s actual results and market and economic conditions;
•the timeframe and amount of any potential future impairment of our Canopy Equity Method Investment if our expectations about Canopy’s prospective results and cash flows decline which could be influenced by various factors including adverse market conditions or if Canopy records a significant impairment of goodwill or intangible assets or other long-lived assets, makes significant asset sales, or has changes in senior management;
•the amount of contingent consideration, if any, received in the divestitures of a portion of our wine and spirits business which will depend on actual future brand performance;
•the expected impacts of wine and spirits portfolio refinement activities;
•purchase accounting with respect to any transaction, or the assumptions used regarding the assets purchased and liabilities assumed to determine their fair value;
•any impact of U.S. federal laws on Canopy Strategic Transactions or upon the implementation of such Canopy Strategic Transactions, or the impact of any Canopy Strategic Transaction upon our future ownership level in Canopy or our future share of Canopy’s reported earnings and losses; and
•our targeted net leverage ratio due to market conditions, our ability to generate cash flow at expected levels, and our ability to generate expected earnings.
For additional information about risks and uncertainties that could cause actual results to differ materially from those set forth in or implied by our forward-looking statements, please refer to Item 1A. “Risk Factors” of our 2022 Annual Report.
| Constellation Brands, Inc. Q1 FY 2023 Form 10-Q | #WORTHREACHINGFOR I 43 | ||||
| OTHER KEY INFORMATION | |||||
Item 3. Quantitative and Qualitative Disclosures About Market Risk.
As a result of our global operating, investment, acquisition, divestiture, and financing activities, we are exposed to market risk associated with changes in foreign currency exchange rates, commodity prices, interest rates, and equity prices. To manage the volatility relating to these risks, we periodically purchase and/or sell derivative instruments including foreign currency forward and option contracts, commodity swap contracts, interest rate swap contracts, and Pre-issuance hedge contracts. We use derivative instruments to reduce earnings and cash flow volatility resulting from shifts in market rates, as well as to hedge economic exposures. We do not enter into derivative instruments for trading or speculative purposes.
Foreign currency and commodity price risk
Foreign currency derivative instruments are or may be used to hedge existing foreign currency denominated assets and liabilities, forecasted foreign currency denominated sales/purchases to/from third parties as well as intercompany sales/purchases, intercompany principal and interest payments, and in connection with investments, acquisitions, or divestitures outside the U.S. As of May 31, 2022, we had exposures to foreign currency risk primarily related to the Mexican peso, euro, Canadian dollar, and New Zealand dollar. Approximately 100% of our balance sheet exposures and 78% of our forecasted transactional exposures for the remaining nine months of Fiscal 2023 were hedged as of May 31, 2022.
Commodity derivative instruments are or may be used to hedge forecasted commodity purchases from third parties as either economic hedges or accounting hedges. As of May 31, 2022, exposures to commodity price risk which we are currently hedging include aluminum, corn, diesel fuel, and natural gas prices. Approximately 84% of our forecasted transactional exposures for the remaining nine months of Fiscal 2023 were hedged as of May 31, 2022.
We have performed a sensitivity analysis to estimate our exposure to market risk of foreign exchange rates and commodity prices reflecting the impact of a hypothetical 10% adverse change in the applicable market. The volatility of the applicable rates and prices is dependent on many factors which cannot be forecasted with reliable accuracy. Gains or losses from the revaluation or settlement of the related underlying positions would substantially offset such gains or losses on the derivative instruments. The aggregate notional value, estimated fair value, and sensitivity analysis for our open foreign currency and commodity derivative instruments are summarized as follows:
| Aggregate Notional Value | Fair Value, Net Asset (Liability) | Increase (Decrease) in Fair Value – Hypothetical 10% Adverse Change | |||||||||||||||||||||||||||||||||
| May 31, 2022 | May 31, 2021 | May 31, 2022 | May 31, 2021 | May 31, 2022 | May 31, 2021 | ||||||||||||||||||||||||||||||
| (in millions) | |||||||||||||||||||||||||||||||||||
| Foreign currency contracts | $ | 2,726.2 | $ | 1,891.8 | $ | 125.3 | $ | 86.8 | $ | (198.2) | $ | (121.3) | |||||||||||||||||||||||
| Commodity derivative contracts | $ | 342.0 | $ | 212.2 | $ | 112.8 | $ | 38.0 | $ | (40.2) | $ | (26.0) | |||||||||||||||||||||||
Interest rate risk
The estimated fair value of our fixed interest rate debt is subject to interest rate risk, credit risk, and foreign currency risk. In addition, we also have variable interest rate debt outstanding (primarily SOFR-based), certain of which includes a fixed margin subject to the same risks identified for our fixed interest rate debt.
There were no cash flow designated or undesignated interest rate swap contracts or Pre-issuance hedge contracts outstanding as of May 31, 2022, or May 31, 2021.
We have performed a sensitivity analysis to estimate our exposure to market risk of interest rates reflecting the impact of a hypothetical 1% increase in the prevailing interest rates. The volatility of the applicable rates is dependent on many factors which cannot be forecasted with reliable accuracy.
| Constellation Brands, Inc. Q1 FY 2023 Form 10-Q | #WORTHREACHINGFOR I 44 | ||||
| OTHER KEY INFORMATION | |||||
The aggregate notional value, estimated fair value, and sensitivity analysis for our outstanding fixed-rate debt, including current maturities, are summarized as follows:
| Aggregate Notional Value | Fair Value, Net Asset (Liability) | Increase (Decrease) in Fair Value – Hypothetical 1% Rate Increase | |||||||||||||||||||||||||||||||||
| May 31, 2022 | May 31, 2021 | May 31, 2022 | May 31, 2021 | May 31, 2022 | May 31, 2021 | ||||||||||||||||||||||||||||||
| (in millions) | |||||||||||||||||||||||||||||||||||
| Fixed interest rate debt | $ | 10,638.2 | $ | 10,070.6 | $ | (10,142.9) | $ | (11,027.7) | $ | (689.6) | $ | (772.4) | |||||||||||||||||||||||
A 1% hypothetical change in the prevailing interest rates would have increased interest expense on our variable interest rate debt by $1.4 million and $1.1 million for the three months ended May 31, 2022, and May 31, 2021, respectively.
Equity price risk
The estimated fair value of our investment in the November 2018 Canopy Warrants and the Canopy Debt Securities are subject to equity price risk, interest rate risk, credit risk, and foreign currency risk. This investment is recognized at fair value utilizing various option-pricing models and has the potential to fluctuate from, among other items, changes in the quoted market price of the underlying equity security. We manage our equity price risk exposure by closely monitoring the financial condition, performance, and outlook of Canopy.
As of May 31, 2022, the fair value of our investment in the November 2018 Canopy Warrants and the Canopy Debt Securities was $163.7 million, with an unrealized net gain (loss) on this investment of $(22.4) million recognized in our results of operations for the three months ended May 31, 2022. We have performed a sensitivity analysis to estimate our exposure to market risk of the equity price reflecting the impact of a hypothetical 10% adverse change in the quoted market price of the underlying equity security. As of May 31, 2022, such a hypothetical 10% adverse change would have resulted in a decrease in fair value of $4.7 million.
For additional discussion on our market risk, refer to Notes 3 and 4.
Item 4. Controls and Procedures.
Disclosure controls and procedures
Our Chief Executive Officer and our Chief Financial Officer have concluded, based on their evaluation as of the end of the period covered by this report, that the Company’s “disclosure controls and procedures” (as defined in the Exchange Act Rules 13a-15(e) and 15d-15(e)) are effective to ensure that information required to be disclosed in the reports that we file or submit under the Exchange Act (i) is recorded, processed, summarized, and reported within the time periods specified in the SEC’s rules and forms, and (ii) is accumulated and communicated to our management, including our Chief Executive Officer and our Chief Financial Officer, as appropriate to allow timely decisions regarding required disclosure.
Internal control over financial reporting
In connection with the foregoing evaluation by our Chief Executive Officer and our Chief Financial Officer, no changes were identified in the Company’s “internal control over financial reporting” (as defined in the Exchange Act Rules 13a-15(f) and 15d-15(f)) that occurred during our fiscal quarter ended May 31, 2022, that have materially affected, or are reasonably likely to materially affect, our internal control over financial reporting.
| Constellation Brands, Inc. Q1 FY 2023 Form 10-Q | #WORTHREACHINGFOR I 45 | ||||
| OTHER KEY INFORMATION | |||||
PART II – OTHER INFORMATION
Item 1A. Risk Factors.
In addition to information discussed elsewhere in this Form 10-Q, you should carefully consider the risk factors disclosed in the 2022 Annual Report. The risk factors associated with our business have not materially changed as compared to the risk factors disclosed in the 2022 Annual Report except for the following updated risk factor below. The risk factor described below and the additional risks described in the 2022 Annual Report are not the only risks we face. Additional factors not presently known to us or that we currently deem to be immaterial could materially affect our business, liquidity, financial condition, and/or results of operations in present and/or future periods.
Other Risks
Failure to consummate the Reclassification could adversely affect the price of our Class A Stock and/or our Class B Stock; the Reclassification, if completed, may not benefit us or our stockholders.
Under the terms of the Reclassification Agreement, the Company’s and the Sands Stockholder Group’s obligation to consummate the Reclassification is subject to customary conditions, including, among others, the effectiveness of a Company registration statement on Form S-4 and the approval of the Reclassification by the Company’s stockholders. We cannot be certain that these conditions will be satisfied and its possible that the Reclassification Agreement may be terminated for failure to satisfy a condition precedent or for other reasons. If the Reclassification is not completed, our businesses and financial results may be adversely affected, including as follows: (i) we may experience negative reactions from the financial markets, including negative impacts on the market price of shares of Class A Stock and/or Class B Stock and (ii) we will have expended substantial time and resources that could otherwise have been spent on our existing businesses and the pursuit of other opportunities that could have been beneficial to us.
Even if the Reclassification is completed, it may not result in any recognition of stockholder value or improve the liquidity and marketability of our equity. The perception of the Reclassification by members of the investment community may cause a decrease in the value of our Class A Stock following the Reclassification and impair its liquidity and marketability. Furthermore, securities markets worldwide have recently experienced significant price and volume fluctuations. This market volatility, as well as general economic, market, or political conditions, could cause a reduction in the market price and liquidity of shares our Class A Stock following the Reclassification, particularly if the Reclassification is not viewed favorably by members of the investment community.
| Constellation Brands, Inc. Q1 FY 2023 Form 10-Q | #WORTHREACHINGFOR I 46 | ||||
| OTHER KEY INFORMATION | |||||
Item 2. Unregistered Sales of Equity Securities and Use of Proceeds.
Issuer Purchases of Equity Securities
| Period | Total Number of Shares Purchased | Average Price Paid Per Share | Total Number of Shares Purchased as Part of a Publicly Announced Program | Approximate Dollar Value of Shares that May Yet Be Purchased Under the Program (1)(2)(3)(4) | ||||||||||||||||||||||
| (in millions, except share and per share data) | ||||||||||||||||||||||||||
| March 1 – 31, 2022 | — | $ | — | — | $ | 2,563.6 | ||||||||||||||||||||
| April 1 – 30, 2022 | 1,725,551 | (3) | 1,725,551 | $ | 2,132.4 | |||||||||||||||||||||
| May 1 – 31, 2022 | ||||||||||||||||||||||||||
| ASR transaction | 275,563 | (3) | 275,563 | |||||||||||||||||||||||
| Open market transactions | 2,064,394 | $ | 245.90 | 2,064,394 | ||||||||||||||||||||||
| May 1 – 31, 2022 | 2,339,957 | (3) | 2,339,957 | $ | 1,555.9 | |||||||||||||||||||||
| Total | 4,065,508 | $ | 247.85 | 4,065,508 | ||||||||||||||||||||||
(1)In January 2018, we announced that our Board of Directors authorized the repurchase of up to an aggregate amount of $3.0 billion of our Class A Stock and Class B Stock under the 2018 Authorization. In May 2022, we utilized the remaining $132.4 million available under the 2018 Authorization to repurchase 528,985 shares of Class A Stock, through an ASR that was announced in April 2022 and open market transactions, thereby completing the 2018 Authorization.
(2)In January 2021, we announced that our Board of Directors authorized an additional repurchase of up to an aggregate amount of $2.0 billion of our Class A Stock and Class B Stock under the 2021 Authorization. The Board of Directors did not specify a date upon which the 2021 Authorization would expire. Share repurchases for the periods included herein under the 2021 Authorization were effected through open market transactions.
(3)In April 2022, we entered into an ASR to purchase up to $500.0 million of our Class A Stock. In exchange for our payment of $500.0 million at the beginning of the ASR purchase period, the financial institution party to the ASR committed to deliver shares to us during the ASR purchase period. Pursuant to the terms of the ASR, 1,725,551 shares were delivered in April 2022 at the beginning of the ASR purchase period and 275,563 shares were delivered in May 2022 at the end of the ASR purchase period. In total, 2,001,114 shares were delivered under this ASR at an average purchase price paid of $249.86 per share.
(4)Subsequent to May 31, 2022, we repurchased 1,240,495 shares of Class A Stock pursuant to the 2021 Authorization at an average cost of $236.20 per share through open market transactions. Beginning May 25, 2022, all repurchases were made pursuant to a Rule 10b5-1 trading plan.
Item 6. Exhibits.
Exhibits required to be filed by Item 601 of Regulation S-K.
For the exhibits that are filed or furnished herewith or incorporated herein by reference, see the Index to Exhibits immediately following.
| Constellation Brands, Inc. Q1 FY 2023 Form 10-Q | #WORTHREACHINGFOR I 47 | ||||
| OTHER KEY INFORMATION | |||||
INDEX TO EXHIBITS
| Incorporated by Reference | ||||||||||||||||||||
| Exhibit No. | Exhibit Description | Form | Exhibit | Filing Date | ||||||||||||||||
| 2.1 | 8-K | 2.1 | August 16, 2018 | |||||||||||||||||
| 2.2 | 10-Q | 2.2 | January 9, 2019 | |||||||||||||||||
| 2.3 | 8-K | 2.1 | May 29, 2020 | |||||||||||||||||
| 2.4 | 10-Q | 2.6 | October 1, 2020 | |||||||||||||||||
| 2.5 | 8-K | 2.1 | June 25, 2020 | |||||||||||||||||
| 3.1 | 10-Q | 3.1 | October 13, 2009 | |||||||||||||||||
| 3.2 | 10-Q | 3.2 | October 13, 2009 | |||||||||||||||||
| 3.3 | 8-K | 3.1 | April 7, 2022 | |||||||||||||||||
| 4.1 | 8-K | 4.1 | April 23, 2012 | |||||||||||||||||
| 4.2 | 8-K | 4.1.1 | April 23, 2012 | |||||||||||||||||
| 4.3 | 8-K | 4.1 | May 16, 2013 | |||||||||||||||||
| 4.4 | 8-K | 4.2 | May 16, 2013 | |||||||||||||||||
| 4.5 | 8-K | 4.4 | June 11, 2013 | |||||||||||||||||
| 4.6 | 10-Q | 4.21 | July 10, 2014 | |||||||||||||||||
| 4.7 | 8-K | 4.1 | November 7, 2014 | |||||||||||||||||
| Constellation Brands, Inc. Q1 FY 2023 Form 10-Q | #WORTHREACHINGFOR I 48 | ||||
| OTHER KEY INFORMATION | |||||
| Incorporated by Reference | ||||||||||||||||||||
| Exhibit No. | Exhibit Description | Form | Exhibit | Filing Date | ||||||||||||||||
| 4.8 | 8-K | 4.2 | November 7, 2014 | |||||||||||||||||
| 4.9 | 8-K | 4.1 | December 8, 2015 | |||||||||||||||||
| 4.10 | 10-K | 4.26 | April 25, 2016 | |||||||||||||||||
| 4.11 | 8-K | 4.1 | December 6, 2016 | |||||||||||||||||
| 4.12 | 8-K | 4.1 | May 9, 2017 | |||||||||||||||||
| 4.13 | 8-K | 4.2 | May 9, 2017 | |||||||||||||||||
| 4.14 | 8-K | 4.3 | May 9, 2017 | |||||||||||||||||
| 4.15 | 8-K | 4.1 | November 7, 2017 | |||||||||||||||||
| 4.16 | 8-K | 4.2 | November 7, 2017 | |||||||||||||||||
| 4.17 | 8-K | 4.3 | November 7, 2017 | |||||||||||||||||
| 4.18 | 8-K | 4.1 | February 7, 2018 | |||||||||||||||||
| 4.19 | 8-K | 4.2 | February 7, 2018 | |||||||||||||||||
| 4.20 | 8-K | 4.3 | February 7, 2018 | |||||||||||||||||
| 4.21 | 8-K | 4.1 | October 29, 2018 | |||||||||||||||||
| Constellation Brands, Inc. Q1 FY 2023 Form 10-Q | #WORTHREACHINGFOR I 49 | ||||
| OTHER KEY INFORMATION | |||||
| Incorporated by Reference | ||||||||||||||||||||
| Exhibit No. | Exhibit Description | Form | Exhibit | Filing Date | ||||||||||||||||
| 4.22 | 8-K | 4.2 | October 29, 2018 | |||||||||||||||||
| 4.23 | 8-K | 4.3 | October 29, 2018 | |||||||||||||||||
| 4.24 | 8-K | 4.4 | October 29, 2018 | |||||||||||||||||
| 4.25 | 8-K | 4.1 | July 29, 2019 | |||||||||||||||||
| 4.26 | 8-K | 4.1 | April 27, 2020 | |||||||||||||||||
| 4.27 | 8-K | 4.2 | April 27, 2020 | |||||||||||||||||
| 4.28 | 8-K | 4.1 | July 26, 2021 | |||||||||||||||||
| 4.29 | 8-K | 4.1 | May 9, 2022 | |||||||||||||||||
| 4.30 | 8-K | 4.2 | May 9, 2022 | |||||||||||||||||
| 4.31 | 8-K | 4.3 | May 9, 2022 | |||||||||||||||||
| 4.32 | Restatement Agreement, dated as of March 26, 2020 by and among the Company, CB International, certain of the Company’s subsidiaries as guarantors, Bank of America, N.A., as Administrative Agent, and the Lenders party thereto, including the Ninth Amended and Restated Credit Agreement dated as of March 26, 2020, by and among the Company, CB International, Bank of America, N.A., as Administrative Agent, and the Lenders party thereto. † | 8-K | 4.1 | March 31, 2020 | ||||||||||||||||
| 4.33 | 8-K | 4.3 | March 31, 2020 | |||||||||||||||||
| 4.34 | 10-Q | 4.30 | June 30, 2021 | |||||||||||||||||
| Constellation Brands, Inc. Q1 FY 2023 Form 10-Q | #WORTHREACHINGFOR I 50 | ||||
| OTHER KEY INFORMATION | |||||
| Incorporated by Reference | ||||||||||||||||||||
| Exhibit No. | Exhibit Description | Form | Exhibit | Filing Date | ||||||||||||||||
| 4.35 | Restatement Agreement, dated as of April 14, 2022, by and among the Company, CB International, Bank of America, N.A., as Administrative Agent, and the Lenders party thereto, including the Tenth Amended and Restated Credit Agreement dated as of April 14, 2022, by and among the Company, CB International, Bank of America, N.A., as Administrative Agent, and the Lenders party thereto. † | 8-K | 4.1 | April 15, 2022 | ||||||||||||||||
| 4.36 | 8-K | 4.2 | April 15, 2022 | |||||||||||||||||
| 10.1 | 10-Q | 10.3 | June 29, 2017 | |||||||||||||||||
| 31.1 | ||||||||||||||||||||
| 31.2 | ||||||||||||||||||||
| 32.1 | ||||||||||||||||||||
| 32.2 | ||||||||||||||||||||
| 99.1 | 6-K | 99.4 | April 30, 2019 | |||||||||||||||||
| 99.2 | 6-K | 99.3 | April 30, 2019 | |||||||||||||||||
| 101.INS | XBRL Instance Document - the instance document does not appear in the Interactive Data File because its XBRL tags are embedded within the Inline XBRL document (filed herewith). | |||||||||||||||||||
| 101.SCH | XBRL Taxonomy Extension Schema Document (filed herewith). | |||||||||||||||||||
| 101.CAL | XBRL Taxonomy Extension Calculation Linkbase Document (filed herewith). | |||||||||||||||||||
| 101.DEF | XBRL Taxonomy Extension Definition Linkbase Document (filed herewith). | |||||||||||||||||||
| 101.LAB | XBRL Taxonomy Extension Labels Linkbase Document (filed herewith). | |||||||||||||||||||
| 101.PRE | XBRL Taxonomy Extension Presentation Linkbase Document (filed herewith). | |||||||||||||||||||
| 104 | Cover Page Interactive Data File (formatted as Inline XBRL and contained in Exhibit 101). | |||||||||||||||||||
| Constellation Brands, Inc. Q1 FY 2023 Form 10-Q | #WORTHREACHINGFOR I 51 | ||||
| OTHER KEY INFORMATION | |||||
| * | Designates management contract or compensatory plan or arrangement. | ||||
| † | The exhibits, disclosure schedules, and other schedules, as applicable, have been omitted pursuant to Item 601(a)(5) of Regulation S-K. | ||||
| ‡ | Portions of this exhibit are redacted pursuant to Item 601(b)(2)(ii) of Regulation S-K. | ||||
The Company agrees, upon request of the SEC, to furnish copies of each instrument that defines the rights of holders of long-term debt of the Company or its subsidiaries that is not filed herewith pursuant to Item 601(b)(4)(iii)(A) because the total amount of long-term debt authorized under such instrument does not exceed 10% of the total assets of the Company and its subsidiaries on a consolidated basis.
| Constellation Brands, Inc. Q1 FY 2023 Form 10-Q | #WORTHREACHINGFOR I 52 | ||||
SIGNATURES
Pursuant to the requirements of the Securities Exchange Act of 1934, the registrant has duly caused this report to be signed on its behalf by the undersigned, thereunto duly authorized.
| CONSTELLATION BRANDS, INC. | |||||||||||
| Date: | June 30, 2022 | By: | /s/ Kenneth W. Metz | ||||||||
| Kenneth W. Metz, Senior Vice President and Controller | |||||||||||
| Date: | June 30, 2022 | By: | /s/ Garth Hankinson | ||||||||
| Garth Hankinson, Executive Vice President and Chief Financial Officer (principal financial officer and principal accounting officer) | |||||||||||
| Constellation Brands, Inc. Q1 FY 2023 Form 10-Q | #WORTHREACHINGFOR I 53 | ||||
Serious News for Serious Traders! Try StreetInsider.com Premium Free!
You May Also Be Interested In
- Argus Upgrades Constellation Brands (STZ) to Buy, 'we think a higher multiple is warranted'
- Three From Lyons & Simmons Selected Among Best Lawyers in Dallas
- Voxtur Engages ICP Securities Inc. for Automated Market Making Services
Create E-mail Alert Related Categories
SEC FilingsSign up for StreetInsider Free!
Receive full access to all new and archived articles, unlimited portfolio tracking, e-mail alerts, custom newswires and RSS feeds - and more!
