

Form 10-Q AUTOMATIC DATA PROCESSIN For: Mar 31
 Tweet
Tweet Share
ShareUNITED STATES
SECURITIES AND EXCHANGE COMMISSION
Washington, D.C. 20549
______________
FORM 10-Q
______________
| QUARTERLY REPORT PURSUANT TO SECTION 13 OR 15(d) OF THE SECURITIES EXCHANGE ACT OF 1934 | ||||||||||||||
For the Quarterly Period Ended March 31, 2022
OR
| TRANSITION REPORT PURSUANT TO SECTION 13 OR 15(d) OF THE SECURITIES EXCHANGE ACT OF 1934 | ||||||||||||||
For the Transition Period From to
Commission File Number 1-5397
__________________________
(Exact name of registrant as specified in its charter)
__________________________
| (State or other jurisdiction of incorporation or organization) | (IRS Employer Identification No.) | |||||||
| (Address of principal executive offices) | (Zip Code) | |||||||
Registrant's telephone number, including area code: (973 ) 974-5000
__________________________
| Securities registered pursuant to Section 12(b) of the Act: | ||||||||
| Title of each class | Trading Symbol(s) | Name of each exchange on which registered | ||||||
(voting) | ||||||||
Indicate by check mark whether the registrant: (1) has filed all reports required to be filed by Section 13 or 15(d) of the Securities Exchange Act of 1934 during the preceding 12 months (or for such shorter period that the registrant was required to file such reports), and (2) has been subject to such filing requirements for the past 90 days. Yes ý No o
Indicate by check mark whether the registrant has submitted electronically every Interactive Data File required to be submitted pursuant to Rule 405 of Regulation S-T (§232.405 of this chapter) during the preceding 12 months (or for such shorter period that the registrant was required to submit such files). Yes ý No o
Indicate by check mark whether the registrant is a large accelerated filer, an accelerated filer, a non-accelerated filer, a smaller reporting company, or an emerging growth company. See the definitions of “large accelerated filer,” “accelerated filer,” “smaller reporting company,” and "emerging growth company" in Rule 12b-2 of the Exchange Act.
| ☒ | Accelerated filer | ☐ | |||||||||
| Non-accelerated filer | ☐ | Smaller reporting company | |||||||||
| Emerging growth company | |||||||||||
If an emerging growth company, indicate by check mark if the registrant has elected not to use the extended transition period for complying with any new or revised financial accounting standards provided pursuant to Section 13(a) of the Exchange Act. o
Indicate by check mark whether the registrant is a shell company (as defined in Rule 12b-2 of the
Exchange Act). Yes ☐ No ý
The number of shares outstanding of the registrant’s common stock as of April 26, 2022 was 417,747,152 .
Table of Contents
| Page | ||||||||
Item 1. | ||||||||
Item 2. | ||||||||
| Item 3. | ||||||||
| Item 4. | ||||||||
Item 1. | ||||||||
Item 1A. | ||||||||
Item 2. | ||||||||
Item 6. | ||||||||
2
Part I. FINANCIAL INFORMATION
Item 1. Financial Statements
Automatic Data Processing, Inc. and Subsidiaries
Statements of Consolidated Earnings
(In millions, except per share amounts)
(Unaudited)
| Three Months Ended | Nine Months Ended | ||||||||||||||||||||||
| March 31, | March 31, | ||||||||||||||||||||||
| 2022 | 2021 | 2022 | 2021 | ||||||||||||||||||||
| REVENUES: | |||||||||||||||||||||||
| Revenues, other than interest on funds held for clients and PEO revenues | $ | $ | $ | $ | |||||||||||||||||||
| Interest on funds held for clients | |||||||||||||||||||||||
| PEO revenues (A) | |||||||||||||||||||||||
| TOTAL REVENUES | |||||||||||||||||||||||
| EXPENSES: | |||||||||||||||||||||||
| Costs of revenues: | |||||||||||||||||||||||
| Operating expenses | |||||||||||||||||||||||
| Systems development and programming costs | |||||||||||||||||||||||
| Depreciation and amortization | |||||||||||||||||||||||
| TOTAL COSTS OF REVENUES | |||||||||||||||||||||||
| Selling, general, and administrative expenses | |||||||||||||||||||||||
| Interest expense | |||||||||||||||||||||||
| TOTAL EXPENSES | |||||||||||||||||||||||
| Other (income)/expense, net | ( | ( | ( | ( | |||||||||||||||||||
| EARNINGS BEFORE INCOME TAXES | |||||||||||||||||||||||
| Provision for income taxes | |||||||||||||||||||||||
| NET EARNINGS | $ | $ | $ | $ | |||||||||||||||||||
| BASIC EARNINGS PER SHARE | $ | $ | $ | $ | |||||||||||||||||||
| DILUTED EARNINGS PER SHARE | $ | $ | $ | $ | |||||||||||||||||||
| Basic weighted average shares outstanding | |||||||||||||||||||||||
| Diluted weighted average shares outstanding | |||||||||||||||||||||||
(A) Professional Employer Organization (“PEO”) revenues are net of direct pass-through costs, primarily consisting of payroll wages and payroll taxes of $16,826.6 million and $13,894.6 million for the three months ended March 31, 2022 and 2021, respectively, and $46,863.8 million and $38,259.5 million for the nine months ended March 31, 2022 and 2021, respectively.
See notes to the Consolidated Financial Statements.
3
Automatic Data Processing, Inc. and Subsidiaries
Statements of Consolidated Comprehensive Income
(In millions)
(Unaudited)
| Three Months Ended | Nine Months Ended | ||||||||||||||||||||||
| March 31, | March 31, | ||||||||||||||||||||||
| 2022 | 2021 | 2022 | 2021 | ||||||||||||||||||||
| Net earnings | $ | $ | $ | $ | |||||||||||||||||||
| Other comprehensive (loss)/income: | |||||||||||||||||||||||
| Currency translation adjustments | ( | ( | ( | ||||||||||||||||||||
| Unrealized net (losses)/gains on available-for-sale securities | ( | ( | ( | ( | |||||||||||||||||||
| Tax effect | |||||||||||||||||||||||
| Reclassification of net (gains)/losses on available-for-sale securities to net earnings | ( | ( | |||||||||||||||||||||
| Tax effect | ( | ( | |||||||||||||||||||||
| Unrealized (losses)/gains on cash flow hedging activities | ( | ||||||||||||||||||||||
| Tax effect | |||||||||||||||||||||||
| Amortization of unrealized losses on cash flow hedging activities | |||||||||||||||||||||||
| Tax effect | ( | ( | ( | ( | |||||||||||||||||||
| Reclassification of pension liability adjustment to net earnings | |||||||||||||||||||||||
| Tax effect | ( | ( | ( | ( | |||||||||||||||||||
| Other comprehensive (loss)/income, net of tax | ( | ( | ( | ( | |||||||||||||||||||
| Comprehensive income | $ | ( | $ | $ | $ | ||||||||||||||||||
See notes to the Consolidated Financial Statements.
4
Automatic Data Processing, Inc. and Subsidiaries
Consolidated Balance Sheets
(In millions, except per share amounts)
(Unaudited)
| March 31, | June 30, | |||||||||||||
| 2022 | 2021 | |||||||||||||
| Assets | ||||||||||||||
| Current assets: | ||||||||||||||
| Cash and cash equivalents | $ | $ | ||||||||||||
Accounts receivable, net of allowance for doubtful accounts of $ | ||||||||||||||
| Other current assets | ||||||||||||||
| Total current assets before funds held for clients | ||||||||||||||
| Funds held for clients | ||||||||||||||
| Total current assets | ||||||||||||||
Long-term receivables, net of allowance for doubtful accounts of $ | ||||||||||||||
| Property, plant and equipment, net | ||||||||||||||
| Operating lease right-of-use asset | ||||||||||||||
| Deferred contract costs | ||||||||||||||
| Other assets | ||||||||||||||
| Goodwill | ||||||||||||||
| Intangible assets, net | ||||||||||||||
| Total assets | $ | $ | ||||||||||||
| Liabilities and Stockholders' Equity | ||||||||||||||
| Current liabilities: | ||||||||||||||
| Accounts payable | $ | $ | ||||||||||||
| Accrued expenses and other current liabilities | ||||||||||||||
| Accrued payroll and payroll-related expenses | ||||||||||||||
| Dividends payable | ||||||||||||||
| Short-term deferred revenues | ||||||||||||||
| Obligations under reverse repurchase agreements (A) | ||||||||||||||
| Income taxes payable | ||||||||||||||
| Total current liabilities before client funds obligations | ||||||||||||||
| Client funds obligations | ||||||||||||||
| Total current liabilities | ||||||||||||||
| Long-term debt | ||||||||||||||
| Operating lease liabilities | ||||||||||||||
| Other liabilities | ||||||||||||||
| Deferred income taxes | ||||||||||||||
| Long-term deferred revenues | ||||||||||||||
| Total liabilities | ||||||||||||||
| Commitments and contingencies (Note 13) | ||||||||||||||
| Stockholders' equity: | ||||||||||||||
Preferred stock, $ | ||||||||||||||
Common stock, $ outstanding, | ||||||||||||||
| Capital in excess of par value | ||||||||||||||
| Retained earnings | ||||||||||||||
Treasury stock - at cost: | ( | ( | ||||||||||||
| Accumulated other comprehensive (loss)/ income | ( | |||||||||||||
| Total stockholders’ equity | ||||||||||||||
| Total liabilities and stockholders’ equity | $ | $ | ||||||||||||
(A) As of June 30, 2021, $23.5 million of long-term marketable securities have been pledged as collateral under the Company's reverse repurchase agreements (see Note 9).
See notes to the Consolidated Financial Statements.
5
Automatic Data Processing, Inc. and Subsidiaries
Statements of Consolidated Cash Flows
(In millions)
(Unaudited)
| Nine Months Ended | ||||||||||||||
| March 31, | ||||||||||||||
| 2022 | 2021 | |||||||||||||
| Cash Flows from Operating Activities: | ||||||||||||||
| Net earnings | $ | $ | ||||||||||||
| Adjustments to reconcile net earnings to cash flows provided by operating activities: | ||||||||||||||
| Depreciation and amortization | ||||||||||||||
| Amortization of deferred contract costs | ||||||||||||||
| Deferred income taxes | ( | |||||||||||||
| Stock-based compensation expense | ||||||||||||||
| Net pension income | ( | ( | ||||||||||||
| Net amortization of premiums and accretion of discounts on available-for-sale securities | ||||||||||||||
| Other | ( | |||||||||||||
| Changes in operating assets and liabilities: | ||||||||||||||
| Increase in accounts receivable | ( | ( | ||||||||||||
| Increase in other assets | ( | ( | ||||||||||||
| (Decrease)/Increase in accounts payable | ( | |||||||||||||
| Increase in accrued expenses and other liabilities | ||||||||||||||
| Net cash flows provided by operating activities | ||||||||||||||
| Cash Flows from Investing Activities: | ||||||||||||||
| Purchases of corporate and client funds marketable securities | ( | ( | ||||||||||||
| Proceeds from the sales and maturities of corporate and client funds marketable securities | ||||||||||||||
| Capital expenditures | ( | ( | ||||||||||||
| Additions to intangibles | ( | ( | ||||||||||||
| Acquisitions of businesses, net of cash acquired | ( | |||||||||||||
| Proceeds from sale of property, plant, and equipment and other assets | ||||||||||||||
| Net cash flows used in investing activities | ( | ( | ||||||||||||
| Cash Flows from Financing Activities: | ||||||||||||||
| Net increase in client funds obligations | ||||||||||||||
| Payments of debt | ( | ( | ||||||||||||
| Proceeds from the issuance of debt | ||||||||||||||
| Settlement of cash flow hedges | ( | |||||||||||||
| Repurchases of common stock | ( | ( | ||||||||||||
| Net proceeds from stock purchase plan and stock-based compensation plans | ||||||||||||||
| Dividends paid | ( | ( | ||||||||||||
| Net payments related to reverse repurchase agreements | ( | ( | ||||||||||||
| Net cash flows provided by financing activities | ||||||||||||||
| Effect of exchange rate changes on cash, cash equivalents, restricted cash, and restricted cash equivalents | ( | |||||||||||||
| Net change in cash, cash equivalents, restricted cash, and restricted cash equivalents | ||||||||||||||
| Cash, cash equivalents, restricted cash, and restricted cash equivalents, beginning of period | ||||||||||||||
| Cash, cash equivalents, restricted cash, and restricted cash equivalents, end of period | $ | $ | ||||||||||||
| Reconciliation of cash, cash equivalents, restricted cash, and restricted cash equivalents to the Consolidated Balance Sheets | ||||||||||||||
| Cash and cash equivalents | $ | $ | ||||||||||||
| Restricted cash and restricted cash equivalents included in funds held for clients (A) | ||||||||||||||
| Total cash, cash equivalents, restricted cash, and restricted cash equivalents | $ | $ | ||||||||||||
| Supplemental disclosures of cash flow information: | ||||||||||||||
| Cash paid for interest | $ | $ | ||||||||||||
| Cash paid for income taxes, net of income tax refunds | $ | $ | ||||||||||||
(A) See Note 6 for a reconciliation of restricted cash and restricted cash equivalents in funds held for clients on the Consolidated Balance Sheets.
See notes to the Consolidated Financial Statements.
6
Automatic Data Processing, Inc. and Subsidiaries
Notes to the Consolidated Financial Statements
(Tabular dollars in millions, except per share amounts or where otherwise stated)
(Unaudited)
Note 1. Basis of Presentation
The accompanying Consolidated Financial Statements and footnotes thereto of Automatic Data Processing, Inc., its subsidiaries and variable interest entity (“ADP” or the “Company”) have been prepared in accordance with accounting principles generally accepted in the United States of America (“U.S. GAAP”). The Consolidated Financial Statements and footnotes thereto are unaudited. In the opinion of the Company’s management, the Consolidated Financial Statements reflect all adjustments, which are of a normal recurring nature, that are necessary for a fair presentation of the Company’s interim financial results.
The Company has a grantor trust, which holds the majority of the funds provided by its clients pending remittance to employees of those clients, tax authorities, and other payees. The Company is the sole beneficial owner of the trust. The trust meets the criteria in Accounting Standards Codification (“ASC”) 810, “Consolidation” to be characterized as a variable interest entity (“VIE”). The Company has determined that it has a controlling financial interest in the trust because it has both (1) the power to direct the activities that most significantly impact the economic performance of the trust (including the power to make all investment decisions for the trust) and (2) the right to receive benefits that could potentially be significant to the trust (in the form of investment returns) and, therefore, consolidates the trust. Further information on these funds and the Company’s obligations to remit to its clients’ employees, tax authorities, and other payees is provided in Note 6, “Corporate Investments and Funds Held for Clients.”
The preparation of financial statements in conformity with U.S. GAAP requires management to make estimates and assumptions that affect the assets, liabilities, revenue, expenses, and accumulated other comprehensive income that are reported in the Consolidated Financial Statements and footnotes thereto. Actual results may differ from those estimates. Interim financial results are not necessarily indicative of financial results for a full year. The information included in this Quarterly Report on Form 10-Q should be read in conjunction with the Company’s Annual Report on Form 10-K for the fiscal year ended June 30, 2021 (“fiscal 2021”). Certain amounts from the prior year's financial statements have been reclassified in order to conform to the current year's presentation.
Note 2. New Accounting Pronouncements
Recently Adopted Accounting Pronouncements
During the second quarter of fiscal 2022, the Company early adopted accounting standard update ("ASU") 2021-08, "Business Combinations (Topic 805): Accounting for Contract Assets and Contract Liabilities from Contracts with Customers." ASU 2021-08 requires that an acquirer recognize and measure contract assets and liabilities acquired in a business combination in accordance with ASU 2014-09, "Revenue from Contracts with Customers (Topic 606)". The adoption of this guidance did not have a material impact on the Company's prior interim period consolidated results of operations, financial condition, or cash flows.
Recently Issued Accounting Pronouncements
None.
Note 3. Revenue
Based upon similar operational and economic characteristics, the Company’s revenues are disaggregated by its three strategic pillars: Human Capital Management (“HCM”), HR Outsourcing (“HRO”), and Global (“Global”) Solutions, with separate disaggregation for PEO zero-margin benefits pass-through revenues and client funds interest revenues. The Company believes these revenue categories depict how the nature, amount, timing, and uncertainty of its revenue and cash flows are affected by economic factors.
7
| Three Months Ended | Nine Months Ended | ||||||||||||||||||||||
| March 31, | March 31, | ||||||||||||||||||||||
| Types of Revenues | 2022 | 2021 | 2022 | 2021 | |||||||||||||||||||
| HCM | $ | $ | $ | $ | |||||||||||||||||||
| HRO, excluding PEO zero-margin benefits pass-throughs | |||||||||||||||||||||||
| PEO zero-margin benefits pass-throughs | |||||||||||||||||||||||
| Global | |||||||||||||||||||||||
| Interest on funds held for clients | |||||||||||||||||||||||
| Total Revenues | $ | $ | $ | $ | |||||||||||||||||||
Reconciliation of disaggregated revenue to our reportable segments for the three months ended March 31, 2022:
| Types of Revenues | Employer Services | PEO | Other | Total | |||||||||||||||||||
| HCM | $ | $ | $ | ( | $ | ||||||||||||||||||
| HRO, excluding PEO zero-margin benefits pass-throughs | ( | ||||||||||||||||||||||
| PEO zero-margin benefits pass-throughs | |||||||||||||||||||||||
| Global | |||||||||||||||||||||||
| Interest on funds held for clients | |||||||||||||||||||||||
| Total Segment Revenues | $ | $ | $ | ( | $ | ||||||||||||||||||
Reconciliation of disaggregated revenue to our reportable segments for the three months ended March 31, 2021:
| Types of Revenues | Employer Services | PEO | Other | Total | |||||||||||||||||||
| HCM | $ | $ | $ | ( | $ | ||||||||||||||||||
| HRO, excluding PEO zero-margin benefits pass-throughs | ( | ||||||||||||||||||||||
| PEO zero-margin benefits pass-throughs | |||||||||||||||||||||||
| Global | |||||||||||||||||||||||
| Interest on funds held for clients | |||||||||||||||||||||||
| Total Segment Revenues | $ | $ | $ | ( | $ | ||||||||||||||||||
Reconciliation of disaggregated revenue to our reportable segments for the nine months ended March 31, 2022:
| Types of Revenues | Employer Services | PEO | Other | Total | |||||||||||||||||||
| HCM | $ | $ | $ | ( | $ | ||||||||||||||||||
| HRO, excluding PEO zero-margin benefits pass-throughs | ( | ||||||||||||||||||||||
| PEO zero-margin benefits pass-throughs | |||||||||||||||||||||||
| Global | |||||||||||||||||||||||
| Interest on funds held for clients | |||||||||||||||||||||||
| Total Segment Revenues | $ | $ | $ | ( | $ | ||||||||||||||||||
8
Reconciliation of disaggregated revenue to our reportable segments for the nine months ended March 31, 2021:
| Types of Revenues | Employer Services | PEO | Other | Total | |||||||||||||||||||
| HCM | $ | $ | $ | ( | $ | ||||||||||||||||||
| HRO, excluding PEO zero-margin benefits pass-throughs | ( | ||||||||||||||||||||||
| PEO zero-margin benefits pass-throughs | |||||||||||||||||||||||
| Global | |||||||||||||||||||||||
| Interest on funds held for clients | |||||||||||||||||||||||
| Total Segment Revenues | $ | $ | $ | ( | $ | ||||||||||||||||||
Contract Balances
The timing of revenue recognition for HCM, HRO and Global Solutions is consistent with the invoicing of clients, as invoicing occurs in the period the services are provided. Therefore, the Company does not recognize a contract asset or liability resulting from the timing of revenue recognition and invoicing.
| Contract Liability | |||||
| Contract liability, July 1, 2021 | $ | ||||
| Recognition of revenue included in beginning of year contract liability | ( | ||||
| Contract liability, net of revenue recognized on contracts during the period | |||||
| Currency translation adjustments | ( | ||||
| Contract liability, March 31, 2022 | $ | ||||
Note 4. Earnings per Share (“EPS”)
| Basic | Effect of Employee Stock Option Shares | Effect of Employee Restricted Stock Shares | Diluted | |||||||||||||||||||||||
| Three Months Ended March 31, 2022 | ||||||||||||||||||||||||||
| Net earnings | $ | $ | ||||||||||||||||||||||||
| Weighted average shares (in millions) | ||||||||||||||||||||||||||
| EPS | $ | $ | ||||||||||||||||||||||||
| Three Months Ended March 31, 2021 | ||||||||||||||||||||||||||
| Net earnings | $ | $ | ||||||||||||||||||||||||
| Weighted average shares (in millions) | ||||||||||||||||||||||||||
| EPS | $ | $ | ||||||||||||||||||||||||
| Nine Months Ended March 31, 2022 | ||||||||||||||||||||||||||
| Net earnings | $ | $ | ||||||||||||||||||||||||
| Weighted average shares (in millions) | ||||||||||||||||||||||||||
| EPS | $ | $ | ||||||||||||||||||||||||
| Nine Months Ended March 31, 2021 | ||||||||||||||||||||||||||
| Net earnings | $ | $ | ||||||||||||||||||||||||
| Weighted average shares (in millions) | ||||||||||||||||||||||||||
| EPS | $ | $ | ||||||||||||||||||||||||
9
Note 5. Other (Income)/Expense, Net
| Three Months Ended | Nine Months Ended | ||||||||||||||||||||||
| March 31, | March 31, | ||||||||||||||||||||||
| 2022 | 2021 | 2022 | 2021 | ||||||||||||||||||||
| Interest income on corporate funds | $ | ( | $ | ( | $ | ( | $ | ( | |||||||||||||||
| Realized (gains)/losses on available-for-sale securities, net | ( | ( | |||||||||||||||||||||
| Impairment of assets | |||||||||||||||||||||||
| Gain on sale of assets | ( | ( | ( | ( | |||||||||||||||||||
| Non-service components of pension income, net (see Note 11) | ( | ( | ( | ( | |||||||||||||||||||
| Other (income)/expense, net | $ | ( | $ | ( | $ | ( | $ | ( | |||||||||||||||
Note 6. Corporate Investments and Funds Held for Clients
Corporate investments and funds held for clients at March 31, 2022 and June 30, 2021 were as follows:
| March 31, 2022 | |||||||||||||||||||||||
| Amortized Cost | Gross Unrealized Gains | Gross Unrealized Losses | Fair Market Value (A) | ||||||||||||||||||||
| Type of issue: | |||||||||||||||||||||||
| Money market securities, cash and other cash equivalents | $ | $ | — | $ | — | $ | |||||||||||||||||
| Available-for-sale securities: | |||||||||||||||||||||||
| Corporate bonds | ( | ||||||||||||||||||||||
| U.S. Treasury securities | ( | ||||||||||||||||||||||
| Asset-backed securities | ( | ||||||||||||||||||||||
Canadian government obligations and Canadian government agency obligations | ( | ||||||||||||||||||||||
| U.S. government agency securities | ( | ||||||||||||||||||||||
| Canadian provincial bonds | ( | ||||||||||||||||||||||
| Commercial mortgage-backed securities | ( | ||||||||||||||||||||||
| Other securities | ( | ||||||||||||||||||||||
| Total available-for-sale securities | ( | ||||||||||||||||||||||
| Total corporate investments and funds held for clients | $ | $ | $ | ( | $ | ||||||||||||||||||
(A) Included within available-for-sale securities are corporate investments with fair values of $27.6 million and funds held for clients with fair values of $28,223.2 million. All available-for-sale securities were included in Level 2 of the fair value hierarchy.
10
| June 30, 2021 | |||||||||||||||||||||||
| Amortized Cost | Gross Unrealized Gains | Gross Unrealized Losses | Fair Market Value (B) | ||||||||||||||||||||
| Type of issue: | |||||||||||||||||||||||
| Money market securities, cash and other cash equivalents | $ | $ | — | $ | — | $ | |||||||||||||||||
| Available-for-sale securities: | |||||||||||||||||||||||
| Corporate bonds | ( | ||||||||||||||||||||||
| U.S. Treasury securities | ( | ||||||||||||||||||||||
| Asset-backed securities | ( | ||||||||||||||||||||||
Canadian government obligations and Canadian government agency obligations | ( | ||||||||||||||||||||||
| U.S. government agency securities | ( | ||||||||||||||||||||||
| Canadian provincial bonds | ( | ||||||||||||||||||||||
| Commercial mortgage-backed securities | |||||||||||||||||||||||
| Other securities | ( | ||||||||||||||||||||||
| Total available-for-sale securities | ( | ||||||||||||||||||||||
| Total corporate investments and funds held for clients | $ | $ | $ | ( | $ | ||||||||||||||||||
For a description of the fair value hierarchy and the Company's fair value methodologies, including the use of an independent third-party pricing service, see Note 1 “Summary of Significant Accounting Policies” in the Company's Annual Report on Form 10-K for fiscal 2021. The Company concurred with and did not adjust the prices obtained from the independent pricing service. The Company had no
The unrealized losses and fair values of available-for-sale securities that have been in an unrealized loss position for a period of less than and greater than 12 months as of March 31, 2022, are as follows:
| March 31, 2022 | |||||||||||||||||||||||||||||||||||
| Securities in Unrealized Loss Position Less Than 12 Months | Securities in Unrealized Loss Position Greater Than 12 Months | Total | |||||||||||||||||||||||||||||||||
| Gross Unrealized Losses | Fair Market Value | Gross Unrealized Losses | Fair Market Value | Gross Unrealized Losses | Fair Market Value | ||||||||||||||||||||||||||||||
| Corporate bonds | $ | ( | $ | $ | ( | $ | $ | ( | $ | ||||||||||||||||||||||||||
| U.S. Treasury securities | ( | ( | ( | ||||||||||||||||||||||||||||||||
| Asset-backed securities | ( | ( | ( | ||||||||||||||||||||||||||||||||
Canadian government obligations and Canadian government agency obligations | ( | ( | ( | ||||||||||||||||||||||||||||||||
| U.S. government agency securities | ( | ( | ( | ||||||||||||||||||||||||||||||||
| Canadian provincial bonds | ( | ( | ( | ||||||||||||||||||||||||||||||||
| Commercial mortgage-backed securities | ( | ( | |||||||||||||||||||||||||||||||||
| Other securities | ( | ( | ( | ||||||||||||||||||||||||||||||||
| $ | ( | $ | $ | ( | $ | $ | ( | $ | |||||||||||||||||||||||||||
11
| June 30, 2021 | |||||||||||||||||||||||||||||||||||
| Securities in Unrealized Loss Position Less Than 12 Months | Securities in Unrealized Loss Position Greater Than 12 Months | Total | |||||||||||||||||||||||||||||||||
| Gross Unrealized Losses | Fair Market Value | Gross Unrealized Losses | Fair Market Value | Gross Unrealized Losses | Fair Market Value | ||||||||||||||||||||||||||||||
| Corporate bonds | $ | ( | $ | $ | $ | $ | ( | $ | |||||||||||||||||||||||||||
| U.S. Treasury securities | ( | ( | |||||||||||||||||||||||||||||||||
| Asset-backed securities | ( | ( | |||||||||||||||||||||||||||||||||
Canadian government obligations and Canadian government agency obligations | ( | ( | |||||||||||||||||||||||||||||||||
| U.S. government agency securities | ( | ( | |||||||||||||||||||||||||||||||||
| Canadian provincial bonds | ( | ( | |||||||||||||||||||||||||||||||||
| Commercial mortgage-backed securities | |||||||||||||||||||||||||||||||||||
| Other securities | ( | ( | ( | ||||||||||||||||||||||||||||||||
| $ | ( | $ | $ | ( | $ | $ | ( | $ | |||||||||||||||||||||||||||
At March 31, 2022, Corporate bonds include investment-grade debt securities with a wide variety of issuers, industries, and sectors, primarily carry credit ratings of A and above, and have maturities ranging from April 2022 through March 2032.
At March 31, 2022, asset-backed securities include AAA-rated senior tranches of securities with predominantly prime collateral of fixed-rate auto loan, credit card, equipment lease, and rate reduction receivables with fair values of $1,011.9 million, $688.9 million, $233.4 million, and $50.9 million, respectively. These securities are collateralized by the cash flows of the underlying pools of receivables. The primary risk associated with these securities is the collection risk of the underlying receivables. All collateral on such asset-backed securities has performed as expected through March 31, 2022.
At March 31, 2022, U.S. government agency securities primarily include debt directly issued by Federal Farm Credit Banks and Federal Home Loan Banks with fair values of $1,026.0 million and $544.4 million, respectively. U.S. government agency securities represent senior, unsecured, non-callable debt that primarily carry ratings of Aaa by Moody's, and AA+ by Standard & Poor's, with maturities ranging from April 2022 through March 2032.
At March 31, 2022, U.S government agency commercial mortgage-backed securities of $862.8 million include those issued by Federal Home Loan Mortgage Corporation and Federal National Mortgage Association.
At March 31, 2022, other securities primarily include municipal bonds, diversified with a variety of issuers, with credit ratings of A and above with fair values of $536.9 million and AA-rated United Kingdom Gilt securities of $274.9 million.
Classification of corporate investments on the Consolidated Balance Sheets is as follows:
| March 31, | June 30, | |||||||||||||
| 2022 | 2021 | |||||||||||||
| Corporate investments: | ||||||||||||||
| Cash and cash equivalents | $ | $ | ||||||||||||
| Short-term marketable securities (a) | ||||||||||||||
| Long-term marketable securities (b) | ||||||||||||||
| Total corporate investments | $ | $ | ||||||||||||
(a) - Short-term marketable securities are included within Other current assets on the Consolidated Balance Sheets.
(b) - Long-term marketable securities are included within Other assets on the Consolidated Balance Sheets.
12
Funds held for clients represent assets that, based upon the Company's intent, are restricted for use solely for the purposes of satisfying the obligations to remit funds relating to the Company’s payroll and payroll tax filing services, which are classified as client funds obligations on our Consolidated Balance Sheets.
| March 31, | June 30, | |||||||||||||
| 2022 | 2021 | |||||||||||||
| Funds held for clients: | ||||||||||||||
| Restricted cash and cash equivalents held to satisfy client funds obligations | $ | $ | ||||||||||||
| Restricted short-term marketable securities held to satisfy client funds obligations | ||||||||||||||
| Restricted long-term marketable securities held to satisfy client funds obligations | ||||||||||||||
| Total funds held for clients | $ | $ | ||||||||||||
Client funds obligations represent the Company's contractual obligations to remit funds to satisfy clients' payroll, tax, and other payee payment obligations and are recorded on the Consolidated Balance Sheets at the time that the Company impounds funds from clients. The client funds obligations represent liabilities that will be repaid within one year of the balance sheet date. The Company has reported client funds obligations as a current liability on the Consolidated Balance Sheets totaling $59,387.9 million and $34,403.8 million at March 31, 2022 and June 30, 2021, respectively. The Company has classified funds held for clients as a current asset since these funds are held solely for the purpose of satisfying the client funds obligations. Of the Company’s funds held for clients at March 31, 2022 and June 30, 2021, $53,200.8 million and $31,092.3 million, respectively, are held in the grantor trust. The liabilities held within the trust are intercompany liabilities to other Company subsidiaries and are eliminated in consolidation.
The Company has reported the cash flows related to the purchases of corporate and client funds marketable securities and related to the proceeds from the sales and maturities of corporate and client funds marketable securities on a gross basis in the investing section of the Statements of Consolidated Cash Flows. The Company has reported the cash and cash equivalents related to client funds investments with original maturities of ninety days or less , within the beginning and ending balances of cash, cash equivalents, restricted cash, and restricted cash equivalents. The Company has reported the cash flows related to the cash received from and paid on behalf of clients on a net basis within net increase / (decrease) in client funds obligations in the financing activities section of the Statements of Consolidated Cash Flows.
All available-for-sale securities were rated as investment grade at March 31, 2022.
| One year or less | $ | ||||
| One year to two years | |||||
| Two years to three years | |||||
| Three years to four years | |||||
| After four years | |||||
| Total available-for-sale securities | $ | ||||
Note 7. Leases
The Company records leases on the Consolidated Balance Sheets as operating lease right-of-use (“ROU”) assets, records the current portion of operating lease liabilities within and, separately, records long-term operating lease liabilities. The difference between total ROU assets and total lease liabilities is primarily attributable to pre-payments of our obligations and the recognition of various lease incentives.
The Company has entered into operating lease agreements for facilities and equipment. The Company's leases have remaining lease terms of up to approximately ten years .
13
| Three Months Ended | Nine Months Ended | ||||||||||||||||||||||
| March 31, | March 31, | ||||||||||||||||||||||
| 2022 | 2021 | 2022 | 2021 | ||||||||||||||||||||
| Operating lease cost | $ | $ | $ | $ | |||||||||||||||||||
| Short-term lease cost | |||||||||||||||||||||||
| Variable lease cost | |||||||||||||||||||||||
| Total operating lease cost | $ | $ | $ | $ | |||||||||||||||||||
| Nine Months Ended | |||||||||||
| March 31, | |||||||||||
| 2022 | 2021 | ||||||||||
| Cash paid for operating lease liabilities | $ | $ | |||||||||
| Operating lease ROU assets obtained in exchange for new operating lease liabilities | $ | $ | |||||||||
Other information related to our operating lease liabilities is as follows:
| March 31, | June 30, | ||||||||||
| 2022 | 2021 | ||||||||||
| Weighted-average remaining lease term (in years) | |||||||||||
| Weighted-average discount rate | % | % | |||||||||
| Current operating lease liability | $ | $ | |||||||||
| Three months ending June 30, 2022 | $ | ||||
| Twelve months ending June 30, 2023 | |||||
| Twelve months ending June 30, 2024 | |||||
| Twelve months ending June 30, 2025 | |||||
| Twelve months ending June 30, 2026 | |||||
| Thereafter | |||||
| Total undiscounted lease obligations | |||||
| Less: Imputed interest | ( | ||||
| Net lease obligations | $ | ||||
14
Note 8. Goodwill and Intangible Assets, net
| Employer Services | PEO Services | Total | |||||||||||||||
| Balance at June 30, 2021 | $ | $ | $ | ||||||||||||||
| Additions and other adjustments | |||||||||||||||||
| Currency translation adjustments | ( | ( | |||||||||||||||
| Balance at March 31, 2022 | $ | $ | $ | ||||||||||||||
| March 31, | June 30, | |||||||||||||
| 2022 | 2021 | |||||||||||||
| Intangible assets: | ||||||||||||||
| Software and software licenses | $ | $ | ||||||||||||
| Customer contracts and lists | ||||||||||||||
| Other intangibles | ||||||||||||||
| Less accumulated amortization: | ||||||||||||||
| Software and software licenses | ( | ( | ||||||||||||
| Customer contracts and lists | ( | ( | ||||||||||||
| Other intangibles | ( | ( | ||||||||||||
| ( | ( | |||||||||||||
| Intangible assets, net | $ | $ | ||||||||||||
Other intangibles consist primarily of purchased rights, trademarks and trade names (acquired directly or through acquisitions). All intangible assets have finite lives and, as such, are subject to amortization. The weighted average remaining useful life of the intangible assets is 5 years (6 years for software and software licenses, 4 years for customer contracts and lists, and 2 years for other intangibles). Amortization of intangible assets was $86.1 million and $81.0 million for the three months ended March 31, 2022 and 2021, respectively, and $256.7 million and $245.9 million for the nine months ended March 31, 2022 and 2021, respectively.
| Amount | |||||
| Three months ending June 30, 2022 | $ | ||||
| Twelve months ending June 30, 2023 | $ | ||||
| Twelve months ending June 30, 2024 | $ | ||||
| Twelve months ending June 30, 2025 | $ | ||||
| Twelve months ending June 30, 2026 | $ | ||||
| Twelve months ending June 30, 2027 | $ | ||||
15
Note 9. Short-term Financing
The Company has a $3.75 billion, 364 -day credit agreement that matures in June 2022 with a one year term-out option. The Company also has a $2.75 billion year credit facility that matures in June 2024 that contains an accordion feature under which the aggregate commitment can be increased by $500 million, subject to the availability of additional commitments. In addition, the Company has a year $3.2 billion credit facility maturing in June 2026 that also contains an accordion feature under which the aggregate commitment can be increased by $500 million, subject to the availability of additional commitments. The interest rate applicable to committed borrowings is tied to LIBOR, the effective federal funds rate, or the prime rate, depending on the notification provided by the Company to the syndicated financial institutions prior to borrowing. The Company is also required to pay facility fees on the credit agreements. The primary uses of the credit facilities are to provide liquidity to the commercial paper program and funding for general corporate purposes, if necessary. The Company had no borrowings through March 31, 2022 under the credit agreements.
The Company's U.S. short-term funding requirements related to client funds are sometimes obtained on an unsecured basis through the issuance of commercial paper, rather than liquidating previously-collected client funds that have already been invested in available-for-sale securities. This commercial paper program provides for the issuance of up to $9.7 billion in aggregate maturity value. The Company’s commercial paper program is rated A-1+ by Standard & Poor’s, Prime-1 (“P-1”) by Moody’s and F1+ by Fitch. These ratings denote the highest quality commercial paper securities. Maturities of commercial paper can range from overnight to up to 364 days. At March 31, 2022 and June 30, 2021, the Company had no Details of the borrowings under the commercial paper program are as follows:
| Three Months Ended | Nine Months Ended | ||||||||||||||||||||||
| March 31, | March 31, | ||||||||||||||||||||||
| 2022 | 2021 | 2022 | 2021 | ||||||||||||||||||||
| Average daily borrowings (in billions) | $ | $ | $ | $ | |||||||||||||||||||
| Weighted average interest rates | % | % | % | % | |||||||||||||||||||
| Weighted average maturity (approximately in days) | |||||||||||||||||||||||
The Company’s U.S., Canadian and United Kingdom short-term funding requirements related to client funds obligations are sometimes obtained on a secured basis through the use of reverse repurchase agreements, which are collateralized principally by government and government agency securities, rather than liquidating previously-collected client funds that have already been invested in available-for-sale securities. These agreements generally have terms ranging from overnight to up to business days. At March 31, 2022 there were no outstanding obligations related to reverse repurchase agreements. At June 30, 2021, the Company had $23.5 million of outstanding obligations related to the reverse repurchase agreements. Details of the reverse repurchase agreements are as follows:
| Three Months Ended | Nine Months Ended | ||||||||||||||||||||||
| March 31, | March 31, | ||||||||||||||||||||||
| 2022 | 2021 | 2022 | 2021 | ||||||||||||||||||||
| Average outstanding balances | $ | $ | $ | $ | |||||||||||||||||||
| Weighted average interest rates | % | % | % | % | |||||||||||||||||||
Note 10. Debt
16
The principal amounts and associated effective interest rates of the Notes and other debt as of March 31, 2022 and June 30, 2021, are as follows:
| Debt instrument | Effective Interest Rate | March 31, 2022 | June 30, 2021 | |||||||||||||||||
Fixed-rate | $ | $ | ||||||||||||||||||
Fixed-rate | ||||||||||||||||||||
Fixed-rate | ||||||||||||||||||||
| Other | ||||||||||||||||||||
| Less: current portion (a) | ( | ( | ||||||||||||||||||
| Less: unamortized discount and debt issuance costs | ( | ( | ||||||||||||||||||
| Total long-term debt | $ | $ | ||||||||||||||||||
(a) - Current portion of long-term debt as of March 31, 2022 is included within Accrued expenses and other current liabilities on the Consolidated Balance Sheets.
The effective interest rates for the Notes include the interest on the Notes and amortization of the discount and debt issuance costs.
Note 11. Employee Benefit Plans
A. Stock-based Compensation Plans. Stock-based compensation consists of the following:
The Company's share-based compensation consists of stock options, time-based restricted stock, time-based restricted stock units, performance-based restricted stock, and performance-based restricted stock units. The Company also offers an employee stock purchase plan for eligible employees.
The Company currently utilizes treasury stock to satisfy stock option exercises, issuances under the Company's employee stock purchase plan, and restricted stock awards. From time to time, the Company may repurchase shares of its common stock under its authorized share repurchase program. The Company repurchased 2.3 million and 2.5 million shares in the three months ended March 31, 2022 and 2021, respectively, and repurchased 7.0 million and 5.7 million shares in the nine months ended March 31, 2022 and 2021, respectively. The Company considers several factors in determining when to execute share repurchases, including, among other things, actual and potential acquisition activity, cash balances and cash flows, issuances due to employee benefit plan activity, and market conditions.
| Three Months Ended | Nine Months Ended | ||||||||||||||||||||||
| March 31, | March 31, | ||||||||||||||||||||||
| 2022 | 2021 | 2022 | 2021 | ||||||||||||||||||||
| Operating expenses | $ | $ | $ | $ | |||||||||||||||||||
| Selling, general and administrative expenses | |||||||||||||||||||||||
| System development and programming costs | |||||||||||||||||||||||
| Total stock-based compensation expense | $ | $ | $ | $ | |||||||||||||||||||
17
B. Pension Plans
| Three Months Ended | Nine Months Ended | ||||||||||||||||||||||
| March 31, | March 31, | ||||||||||||||||||||||
| 2022 | 2021 | 2022 | 2021 | ||||||||||||||||||||
| Service cost – benefits earned during the period | $ | $ | $ | $ | |||||||||||||||||||
| Interest cost on projected benefits | |||||||||||||||||||||||
| Expected return on plan assets | ( | ( | ( | ( | |||||||||||||||||||
| Net amortization and deferral | |||||||||||||||||||||||
| Settlement charges and special termination benefits | |||||||||||||||||||||||
| Net pension (income)/expense | $ | ( | $ | ( | $ | ( | $ | ( | |||||||||||||||
Note 12. Income Taxes
The effective tax rate for the three months ended March 31, 2022 and 2021 was 22.0 % and 24.0 %, respectively. The decrease in the effective tax rate is primarily due to an intercompany transfer of certain assets, a lower state income tax rate and a favorable earnings mix in the three months ended March 31, 2022.
The effective tax rate for the nine months ended March 31, 2022 and 2021 was 22.6 % and 22.7 %, respectively. The decrease in the effective tax rate is primarily due to a favorable earnings mix, an increase in the excess tax benefits on stock-based compensation and an intercompany transfer of certain assets in the nine months ended March 31, 2022, partially offset by combined benefits from adjustments to prior year tax liabilities and a foreign tax election in the nine months ended March 31, 2021.
Note 13. Commitments and Contingencies
In May 2020, two potential class action complaints were filed against ADP, TotalSource and related defendants in the U.S. District Court, District of New Jersey. The complaints assert violations of the Employee Retirement Income Security Act of 1974 (“ERISA”) in connection with the ADP TotalSource Retirement Savings Plan’s fiduciary administrative and investment decision-making. The complaints seek statutory and other unspecified monetary damages, injunctive relief and attorney’s fees. These claims are still in their early stages and the Company is unable to estimate any reasonably possible loss, or range of loss, with respect to these matters. The Company intends to vigorously defend against these lawsuits.
The Company is subject to various claims, litigation, and regulatory compliance matters in the normal course of business. When a loss is considered probable and reasonably estimable, the Company records a liability in the amount of its best estimate for the ultimate loss. Management currently believes that the resolution of these claims, litigation and regulatory compliance matters against us, individually or in the aggregate, will not have a material adverse impact on our consolidated results of operations, financial condition or cash flows. These matters are subject to inherent uncertainties and management's view of these matters may change in the future.
It is not the Company’s business practice to enter into off-balance sheet arrangements. In the normal course of business, the Company may enter into contracts in which it makes representations and warranties that relate to the performance of the Company’s services and products. The Company does not expect any material losses related to such representations and warranties.
18
Note 14. Stockholders' Equity
Changes in stockholders' equity by component are as follows:
| Three Months Ended | |||||||||||||||||||||||||||||||||||
| March 31, 2022 | |||||||||||||||||||||||||||||||||||
| Common Stock | Capital in Excess of Par Value | Retained Earnings | Treasury Stock | AOCI | Total | ||||||||||||||||||||||||||||||
| Balance at December 31, 2021 | $ | $ | $ | $ | ( | $ | ( | $ | |||||||||||||||||||||||||||
| Net earnings | — | — | |||||||||||||||||||||||||||||||||
| Other comprehensive income | — | — | ( | ( | |||||||||||||||||||||||||||||||
| Stock-based compensation expense | — | — | — | ||||||||||||||||||||||||||||||||
| Issuances relating to stock compensation plans | — | — | — | ||||||||||||||||||||||||||||||||
Treasury stock acquired ( | — | — | ( | — | ( | ||||||||||||||||||||||||||||||
Dividends declared ($ | — | — | ( | — | — | ( | |||||||||||||||||||||||||||||
| Balance at March 31, 2022 | $ | $ | $ | $ | ( | $ | ( | $ | |||||||||||||||||||||||||||
| Three Months Ended | |||||||||||||||||||||||||||||||||||
| March 31, 2021 | |||||||||||||||||||||||||||||||||||
| Common Stock | Capital in Excess of Par Value | Retained Earnings | Treasury Stock | AOCI | Total | ||||||||||||||||||||||||||||||
| Balance at December 31, 2020 | $ | $ | $ | $ | ( | $ | $ | ||||||||||||||||||||||||||||
| Net earnings | — | — | — | — | |||||||||||||||||||||||||||||||
| Other comprehensive income | — | — | — | — | ( | ( | |||||||||||||||||||||||||||||
| Stock-based compensation expense | — | — | — | — | |||||||||||||||||||||||||||||||
| Issuances relating to stock compensation plans | — | — | — | ||||||||||||||||||||||||||||||||
Treasury stock acquired ( | — | — | — | ( | — | ( | |||||||||||||||||||||||||||||
Dividends declared ($ | — | — | ( | — | — | ( | |||||||||||||||||||||||||||||
| Balance at March 31, 2021 | $ | $ | $ | $ | ( | $ | ( | $ | |||||||||||||||||||||||||||
19
| Nine Months Ended | |||||||||||||||||||||||||||||||||||
| March 31, 2022 | |||||||||||||||||||||||||||||||||||
| Common Stock | Capital in Excess of Par Value | Retained Earnings | Treasury Stock | AOCI | Total | ||||||||||||||||||||||||||||||
| Balance at June 30, 2021 | $ | $ | $ | $ | ( | $ | $ | ||||||||||||||||||||||||||||
| Net earnings | — | — | |||||||||||||||||||||||||||||||||
| Other comprehensive income | — | — | ( | ( | |||||||||||||||||||||||||||||||
| Stock-based compensation expense | — | — | — | ||||||||||||||||||||||||||||||||
| Issuances relating to stock compensation plans | — | — | — | ||||||||||||||||||||||||||||||||
Treasury stock acquired ( | — | — | ( | — | ( | ||||||||||||||||||||||||||||||
Dividends declared ($ | — | — | ( | — | — | ( | |||||||||||||||||||||||||||||
| Balance at March 31, 2022 | $ | $ | $ | $ | ( | $ | ( | $ | |||||||||||||||||||||||||||
| Nine Months Ended | |||||||||||||||||||||||||||||||||||
| March 31, 2021 | |||||||||||||||||||||||||||||||||||
| Common Stock | Capital in Excess of Par Value | Retained Earnings | Treasury Stock | AOCI | Total | ||||||||||||||||||||||||||||||
| Balance at June 30, 2020 | $ | $ | $ | $ | ( | $ | ( | $ | |||||||||||||||||||||||||||
| Net earnings | — | — | — | — | |||||||||||||||||||||||||||||||
| Other comprehensive income | — | — | — | — | ( | ( | |||||||||||||||||||||||||||||
| Stock-based compensation expense | — | — | — | — | |||||||||||||||||||||||||||||||
| Issuances relating to stock compensation plans | — | — | — | ||||||||||||||||||||||||||||||||
Treasury stock acquired ( | — | — | — | ( | — | ( | |||||||||||||||||||||||||||||
Dividends declared ($ | — | — | ( | — | — | ( | |||||||||||||||||||||||||||||
| Balance at March 31, 2021 | $ | $ | $ | $ | ( | $ | ( | $ | |||||||||||||||||||||||||||
20
Note 15. Reclassifications out of Accumulated Other Comprehensive Income (“AOCI”)
Changes in AOCI by component are as follows:
| Three Months Ended | |||||||||||||||||||||||||||||
| March 31, 2022 | |||||||||||||||||||||||||||||
| Currency Translation Adjustment | Net Gains/Losses on Available-for-sale Securities | Cash Flow Hedging Activities | Pension Liability | Accumulated Other Comprehensive (Loss) /Income | |||||||||||||||||||||||||
| Balance at December 31, 2021 | $ | ( | $ | $ | ( | $ | ( | $ | ( | ||||||||||||||||||||
| Other comprehensive (loss)/income before reclassification adjustments | ( | ( | ( | ||||||||||||||||||||||||||
| Tax effect | |||||||||||||||||||||||||||||
| Reclassification adjustments to net earnings | (A) | (C) | (B) | ||||||||||||||||||||||||||
| Tax effect | ( | ( | ( | ( | |||||||||||||||||||||||||
| Balance at March 31, 2022 | $ | ( | $ | ( | $ | ( | $ | ( | $ | ( | |||||||||||||||||||
| Three Months Ended | |||||||||||||||||||||||||||||
| March 31, 2021 | |||||||||||||||||||||||||||||
| Currency Translation Adjustment | Net Gains/Losses on Available-for-sale Securities | Cash Flow Hedging Activities | Pension Liability | Accumulated Other Comprehensive (Loss) /Income | |||||||||||||||||||||||||
| Balance at December 31, 2020 | $ | ( | $ | $ | ( | $ | ( | $ | |||||||||||||||||||||
| Other comprehensive (loss)/income before reclassification adjustments | ( | ( | ( | ||||||||||||||||||||||||||
| Tax effect | |||||||||||||||||||||||||||||
| Reclassification adjustments to net earnings | (A) | (C) | (B) | ||||||||||||||||||||||||||
| Tax effect | ( | ( | ( | ( | |||||||||||||||||||||||||
| Balance at March 31, 2021 | $ | ( | $ | $ | ( | $ | ( | $ | ( | ||||||||||||||||||||
| Nine Months Ended | |||||||||||||||||||||||||||||
| March 31, 2022 | |||||||||||||||||||||||||||||
| Currency Translation Adjustment | Net Gains/Losses on Available-for-sale Securities | Cash Flow Hedging Activities | Pension Liability | Accumulated Other Comprehensive (Loss) /Income | |||||||||||||||||||||||||
| Balance at June 30, 2021 | $ | ( | $ | $ | ( | $ | ( | $ | |||||||||||||||||||||
| Other comprehensive (loss)/income before reclassification adjustments | ( | ( | ( | ||||||||||||||||||||||||||
| Tax effect | |||||||||||||||||||||||||||||
| Reclassification adjustments to net earnings | ( | (A) | (C) | (B) | |||||||||||||||||||||||||
| Tax effect | ( | ( | ( | ||||||||||||||||||||||||||
| Balance at March 31, 2022 | $ | ( | $ | ( | $ | ( | $ | ( | $ | ( | |||||||||||||||||||
21
| Nine Months Ended | |||||||||||||||||||||||||||||
| March 31, 2021 | |||||||||||||||||||||||||||||
| Currency Translation Adjustment | Net Gains/Losses on Available-for-sale Securities | Cash Flow Hedging Activities | Pension Liability | Accumulated Other Comprehensive (Loss) /Income | |||||||||||||||||||||||||
| Balance at June 30, 2020 | $ | ( | $ | $ | ( | $ | ( | $ | ( | ||||||||||||||||||||
| Other comprehensive (loss)/income before reclassification adjustments | ( | ( | ( | ||||||||||||||||||||||||||
| Tax effect | |||||||||||||||||||||||||||||
| Reclassification adjustments to net earnings | ( | (A) | (C) | (B) | |||||||||||||||||||||||||
| Tax effect | ( | ( | ( | ||||||||||||||||||||||||||
| Balance at March 31, 2021 | $ | ( | $ | $ | ( | $ | ( | $ | ( | ||||||||||||||||||||
(A) Reclassification adjustments out of AOCI are included within Other (income)/expense, net, on the Statements of Consolidated Earnings.
(B) Reclassification adjustments out of AOCI are included in net pension (income)/expense (see Note 11).
(C) Reclassification adjustments out of AOCI are included in Interest expense on the Statements of Consolidated Earnings (see Note 10).
Note 16. Interim Financial Data by Segment
Based upon similar economic and operational characteristics, the Company’s strategic business units have been aggregated into the following two reportable segments: Employer Services and PEO Services. The primary components of the “Other” segment are certain corporate overhead charges and expenses that have not been allocated to the reportable segments, including corporate functions, costs related to our transformation office, severance costs, non-recurring gains and losses, the elimination of intercompany transactions, and interest expense. Certain revenues and expenses are charged to the reportable segments at a standard rate for management reasons. Other costs are recorded based on management responsibility.
| Revenues | |||||||||||||||||||||||
| Three Months Ended | Nine Months Ended | ||||||||||||||||||||||
| March 31, | March 31, | ||||||||||||||||||||||
| 2022 | 2021 | 2022 | 2021 | ||||||||||||||||||||
| Employer Services | $ | $ | $ | $ | |||||||||||||||||||
| PEO Services | |||||||||||||||||||||||
| Other | ( | ( | ( | ( | |||||||||||||||||||
| $ | $ | $ | $ | ||||||||||||||||||||
22
| Earnings before Income Taxes | |||||||||||||||||||||||
| Three Months Ended | Nine Months Ended | ||||||||||||||||||||||
| March 31, | March 31, | ||||||||||||||||||||||
| 2022 | 2021 | 2022 | 2021 | ||||||||||||||||||||
| Employer Services | $ | $ | $ | $ | |||||||||||||||||||
| PEO Services | |||||||||||||||||||||||
| Other | ( | ( | ( | ( | |||||||||||||||||||
| $ | $ | $ | $ | ||||||||||||||||||||
23
Item 2. Management's Discussion and Analysis of Financial Condition and Results of Operations
(Tabular dollars are presented in millions, except per share amounts)
FORWARD-LOOKING STATEMENTS
This document and other written or oral statements made from time to time by Automatic Data Processing, Inc., its subsidiaries and variable interest entity (“ADP” or the “Company”) may contain “forward-looking statements” within the meaning of the Private Securities Litigation Reform Act of 1995. Statements that are not historical in nature and which may be identified by the use of words like “expects,” “assumes,” “projects,” “anticipates,” “estimates,” “we believe,” “could” and other words of similar meaning, are forward-looking statements. These statements are based on management’s expectations and assumptions and depend upon or refer to future events or conditions and are subject to risks and uncertainties that may cause actual results to differ materially from those expressed. Factors that could cause actual results to differ materially from those contemplated by the forward-looking statements or that could contribute to such difference include: ADP's success in obtaining and retaining clients, and selling additional services to clients; the pricing of products and services; the success of our new solutions; compliance with existing or new legislation or regulations; changes in, or interpretations of, existing legislation or regulations; overall market, political and economic conditions, including interest rate and foreign currency trends; competitive conditions; our ability to maintain our current credit ratings and the impact on our funding costs and profitability; security or cyber breaches, fraudulent acts, and system interruptions and failures; employment and wage levels; changes in technology; availability of skilled technical associates; the impact of new acquisitions and divestitures; the adequacy, effectiveness and success of our business transformation initiatives; and the impact of any uncertainties related to major natural disasters or catastrophic events, including the coronavirus ("COVID-19") pandemic. ADP disclaims any obligation to update any forward-looking statements, whether as a result of new information, future events, or otherwise, except as required by law. These risks and uncertainties, along with the risk factors discussed under “Item 1A. - Risk Factors” in our Annual Report on Form 10-K for the fiscal year ended June 30, 2021 (“fiscal 2021”), and in other written or oral statements made from time to time by ADP, should be considered in evaluating any forward-looking statements contained herein.
NON-GAAP FINANCIAL MEASURES
In addition to our U.S. GAAP results, we use adjusted results and other non-GAAP metrics to evaluate our operating performance in the absence of certain items and for planning and forecasting of future periods. Adjusted EBIT, adjusted EBIT margin, adjusted net earnings, adjusted diluted earnings per share, adjusted effective tax rate and organic constant currency are all non-GAAP financial measures. Please refer to the accompanying financial tables in the “Non-GAAP Financial Measures” section for a discussion of why ADP believes these measures are important and for a reconciliation of non-GAAP financial measures to their comparable GAAP financial measures.
24
EXECUTIVE OVERVIEW
Highlights from the nine months ended March 31, 2022 include:
| 10% | 60 basis points | 15% | ||||||||||||
| Revenue Growth | Earnings Before Income Taxes Margin Expansion | Diluted EPS Growth | ||||||||||||
| 10% | 70 basis points | 14% | ||||||||||||
| Organic Constant Currency Revenue Growth | Adjusted EBIT Margin Expansion | Adjusted Diluted EPS Growth | ||||||||||||
| 7% | Employer Services Pays Per Control | 16% | PEO Services Average Worksite Employee Growth | ||||||||||||||
$2.7B | Cash Returned via Shareholder Friendly Actions $1.2B Dividends | $1.5B Share Repurchases | ||||||||||||||||
We are a leading global provider of cloud-based Human Capital Management (“HCM”) technology solutions to employers around the world. The business environment for our clients has evolved continuously since our founding, and the current global pandemic has come to represent yet another factor adding complexity to that environment. Our HCM solutions, which include both software and outsourcing services, are designed to help our clients manage their workforces through this dynamic landscape and the changing world of work. We are continuously seeking to enhance our leading HCM solutions to further support our clients.
During the third quarter, we continued our roll-out of a new unified user experience ("UX") across our key platforms. Clients across our RUN, iHCM, and Next Gen HCM client bases have transitioned over to the new UX and we believe will now benefit from more intuitive HCM workflows within these key platforms. This quarter we made progress on the roll-out of the new UX to Workforce Now, and also began the roll-out of the new UX to the ADP Mobile app, used by over 10 million active users. We also enhanced our data offerings during the quarter. Data continues to be one of ADP’s differentiators, and this quarter we began piloting our new Global Insight Dashboard powered by DataCloud, enabling clients outside the US to leverage the same award-winning analytics platform we have scaled in the US.
For the nine months ended March 31, 2022, we delivered solid revenue growth of 10%. Our pays per control metric, which represents the number of employees on ADP clients' payrolls in the United States when measured on a same-store-sales basis for a subset of clients ranging from small to large businesses, grew 7% for the nine months ended March 31, 2022 as compared to the nine months ended March 31, 2021. PEO average worksite employees increased 16% for the nine months ended March 31, 2022, as compared to the nine months ended March 31, 2021.
We have a strong business model, generating significant cash flows with low capital intensity, and offer a suite of products that provide critical support to our clients’ HCM functions. We generate sufficient free cash flow to satisfy our cash dividend and our modest debt obligations, which enables us to absorb the impact of downturns and remain steadfast in our re-investments, our longer term strategy, and our commitments to shareholder friendly actions. We are committed to building upon our past successes by investing in our business through enhancements in research and development and by driving meaningful transformation in the way we operate. ADP was recently named one of Fortune’s Most Admired Companies for the 16th year in a row, which highlights our culture of continuous improvement, our consistency, and our focus on being a true partner to our clients as the world continues to change. Our financial condition remains solid at March 31, 2022 and we remain well positioned to support our associates and our clients.
25
RESULTS AND ANALYSIS OF CONSOLIDATED OPERATIONS
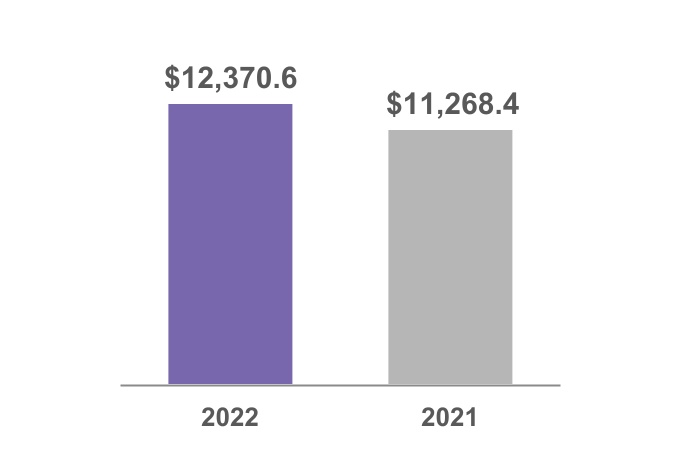
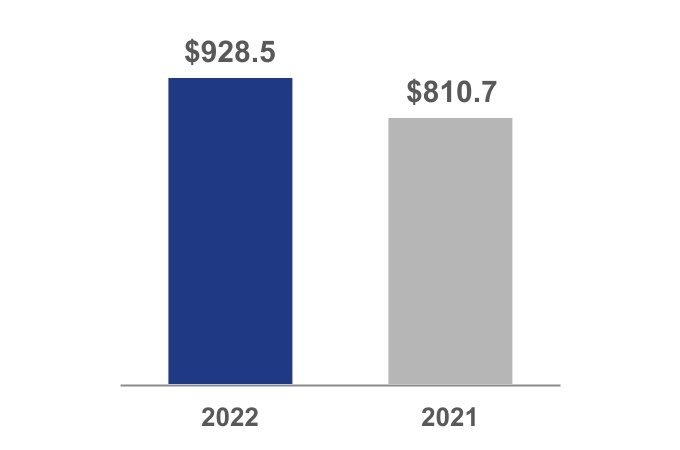
Total Revenues
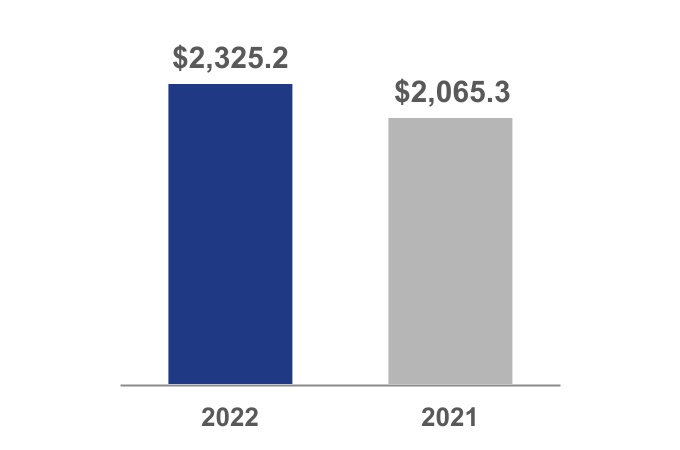
For the three and nine months ended March 31, respectively:
| Total Revenues | Total Revenues | ||||
10% YoY Growth | 10% YoY Growth | ||||
11% YoY Growth, Organic Constant Currency | 10% YoY Growth, Organic Constant Currency | ||||
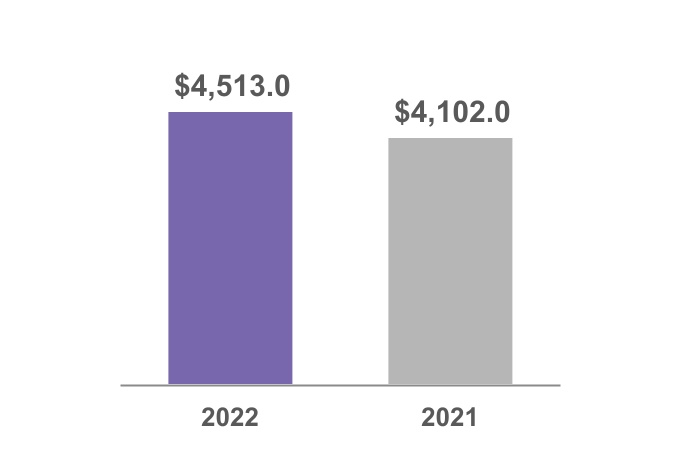
Revenues for the three months ended March 31, 2022 increased due to strong client retention, new business started from New Business Bookings, an increase in zero-margin benefits pass-throughs, and an increase in our pays per control, partially offset by one percentage point of pressure from foreign currency.
Revenues for the nine months ended March 31, 2022 increased due to strong client retention, new business started from New Business Bookings, an increase in zero-margin benefits pass-throughs, and an increase in our pays per control. Refer to “Analysis of Reportable Segments” for additional discussion of the changes in revenue for each of our reportable segments, Employer Services and Professional Employer Organization (“PEO”) Services.
Total revenues for the three months ended March 31, 2022 include interest on funds held for clients of $118.0 million, as compared to $107.4 million for the three months ended March 31, 2021. The increase in the interest earned on funds held for clients resulted from an increase in our average client funds balances of 15.0% to $38.1 billion for the three months ended March 31, 2022, partially offset by the decrease in our average interest rate earned to 1.2% for the three months ended March 31, 2022, as compared to 1.3% for the three months ended March 31, 2021.
Total revenues for the nine months ended March 31, 2022 include interest on funds held for clients of $325.0 million, as compared to $319.2 million for the nine months ended March 31, 2021. The increase in the interest earned on funds held for clients resulted from an increase in our average client funds balances of 21.2% to $32.4 billion for the nine months ended March 31, 2022, partially offset by the decrease in our average interest rate earned to 1.3% for the nine months ended March 31, 2022, as compared to 1.6% for the nine months ended March 31, 2021.
26
Total Expenses
| Three Months Ended | Nine Months Ended | |||||||||||||||||||||||||||||||||||||
| March 31, | March 31, | |||||||||||||||||||||||||||||||||||||
| 2022 | 2021 | % Change | 2022 | 2021 | % Change | |||||||||||||||||||||||||||||||||
| Costs of revenues: | ||||||||||||||||||||||||||||||||||||||
| Operating expenses | $ | 2,212.5 | $ | 1,999.5 | 11 | % | $ | 6,184.0 | $ | 5,609.5 | 10 | % | ||||||||||||||||||||||||||
| Systems development and programming costs | 197.3 | 178.6 | 10 | % | 585.8 | 521.8 | 12 | % | ||||||||||||||||||||||||||||||
| Depreciation and amortization | 102.4 | 100.0 | 2 | % | 306.2 | 303.5 | 1 | % | ||||||||||||||||||||||||||||||
| Total costs of revenues | 2,512.2 | 2,278.1 | 10 | % | 7,076.0 | 6,434.8 | 10 | % | ||||||||||||||||||||||||||||||
| Selling, general and administrative expenses | 817.5 | 763.0 | 7 | % | 2,319.0 | 2,199.8 | 5 | % | ||||||||||||||||||||||||||||||
| Interest expense | 18.4 | 13.5 | 36 | % | 55.3 | 42.4 | 30 | % | ||||||||||||||||||||||||||||||
| Total expenses | $ | 3,348.1 | $ | 3,054.6 | 10 | % | $ | 9,450.3 | $ | 8,677.0 | 9 | % | ||||||||||||||||||||||||||
For the three and nine months ended March 31, 2022, operating expenses increased due to an increase in our PEO Services zero-margin benefits pass-throughs to $897.2 million from $784.7 million for the three months ended March 31, 2022 and 2021, respectively, and to $2,600.6 million from $2,291.7 million for the nine months ended March 31, 2022 and 2021, respectively. Additionally, operating expenses increased due to increased costs to service our client base in support of our growing revenue.
Systems development and programming costs increased for the three and nine months ended March 31, 2022 due to increased investments and costs to develop, support, and maintain our new and existing products.
Selling, general and administrative expenses increased for the three months ended March 31, 2022 due to increased selling expenses as a result of investments in our sales organization, partially offset by decreased amortization of costs to obtain a contract under ASC 606, and a decrease in our allowance for doubtful accounts of $26.0 million as a result of a decrease in estimated credit losses related to the impact of COVID-19 on our clients ("the decrease in our allowance for doubtful accounts").
Selling, general and administrative expenses increased for the nine months ended March 31, 2022 due to increased selling expenses as a result of investments in our sales organization, increased marketing expenses and increased travel expenses, partially offset by the decrease in our allowance for doubtful accounts, and decreased amortization of costs to obtain a contract under ASC 606.
Interest expense increased for the three and nine months ended March 31, 2022 primarily due to the issuance of a 7-year fixed-rate note totaling $1.0 billion issued in the fourth quarter of fiscal 2021, as compared to the three and nine months ended March 31, 2021.
Other (Income)/Expense, net
| Three Months Ended | Nine Months Ended | ||||||||||||||||||||||||||||||||||
| March 31, | March 31, | ||||||||||||||||||||||||||||||||||
| 2022 | 2021 | $ Change | 2022 | 2021 | $ Change | ||||||||||||||||||||||||||||||
| Interest income on corporate funds | $ | (5.6) | $ | (4.7) | $ | 0.9 | $ | (23.8) | $ | (28.9) | $ | (5.1) | |||||||||||||||||||||||
| Realized (gains)/losses on available-for-sale securities, net | 0.3 | 0.4 | 0.1 | (0.2) | (7.6) | (7.4) | |||||||||||||||||||||||||||||
| Impairment of assets | 4.3 | 2.6 | (1.7) | 4.3 | 7.6 | 3.3 | |||||||||||||||||||||||||||||
| Gain on sale of assets | (6.2) | (1.6) | 4.6 | (7.5) | (3.4) | 4.1 | |||||||||||||||||||||||||||||
| Non-service components of pension income, net | (17.8) | (15.5) | 2.3 | (53.2) | (40.4) | 12.8 | |||||||||||||||||||||||||||||
| Other (income)/expense, net | $ | (25.0) | $ | (18.8) | $ | 6.2 | $ | (80.4) | $ | (72.7) | $ | 7.7 | |||||||||||||||||||||||
See Note 11 for further details on non-service components of pension (income)/expense, net.
27
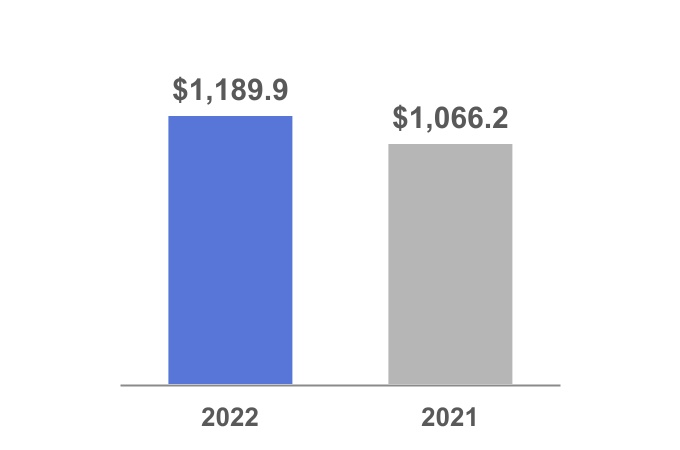
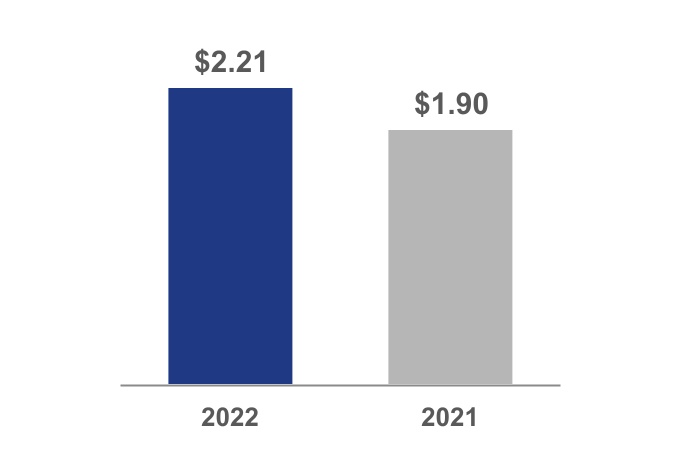
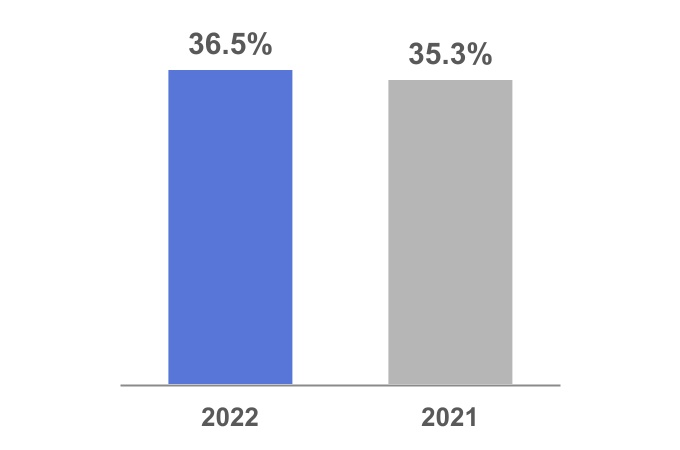
Earnings Before Income Taxes
For the three months ended March 31:
| Earnings Before Income Taxes | Margin | ||||
12% YoY Growth | 40 bps YoY Increase | ||||

For the nine months ended March 31:
| Earnings Before Income Taxes | Margin | ||||
13% YoY Growth | 60 bps YoY Increase | ||||
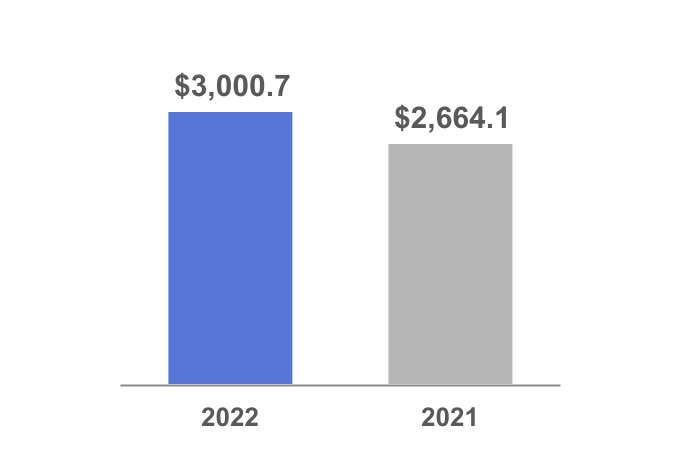
Earnings before income taxes increased for the three and nine months ended March 31, 2022, respectively, due to the components discussed above.
Margin increased for the three and nine months ended March 31, 2022 due to increases in revenues discussed above, and the decrease in our allowance for doubtful accounts, partially offset by increased costs to service our client base in support of our growing revenue, and incremental pressure from growth in our zero-margin benefits pass-throughs.
28
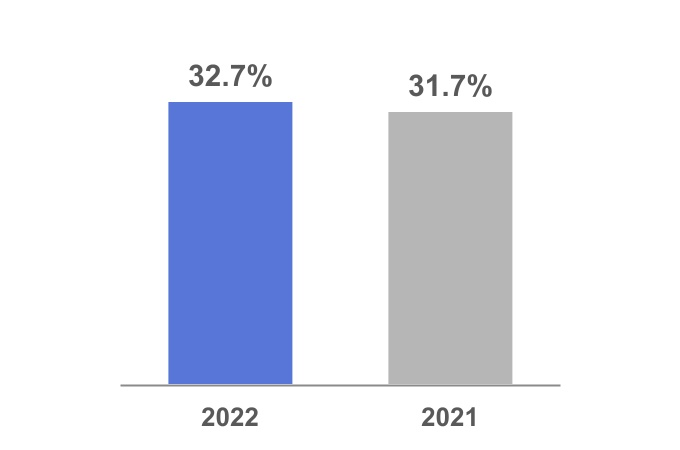
Adjusted Earnings before certain Interest and Taxes ("Adjusted EBIT")
For the three months ended March 31:
| Adjusted EBIT | Adjusted EBIT Margin | ||||
12% YoY Growth | 50 bps YoY Increase | ||||
For the nine months ended March 31:
| Adjusted EBIT | Adjusted EBIT Margin | ||||
13% YoY Growth | 70 bps YoY Increase | ||||

Adjusted EBIT and Adjusted EBIT margin exclude interest income and interest expense that are not related to our client funds extended investment strategy, and net charges, including gain on sale of assets, related to our broad-based transformation initiatives and the impact of the net severance charges, as applicable, in the respective periods.
29
Provision for Income Taxes
The effective tax rate for the three months ended March 31, 2022 and 2021 was 22.0% and 24.0%, respectively. The decrease in the effective tax rate is primarily due to an intercompany transfer of certain assets, a lower state income tax rate and a favorable earnings mix in the three months ended March 31, 2022.
The effective tax rate for the nine months ended March 31, 2022 and 2021 was 22.6% and 22.7%, respectively. The decrease in the effective tax rate is primarily due to a favorable earnings mix, an increase in the excess tax benefits on stock-based compensation and an intercompany transfer of certain assets in the nine months ended March 31, 2022, partially offset by combined benefits from adjustments to prior year tax liabilities and a foreign tax election in the nine months ended March 31, 2021.
Adjusted Provision for Income Taxes
The adjusted effective tax rate for the three months ended March 31, 2022 and 2021 was 22.0% and 23.9%, respectively. The adjusted effective tax rate for the nine months ended March 31, 2022 and 2021 was 22.6% and 22.7%, respectively. The drivers of the adjusted effective tax rate are the same as the drivers of the effective tax rate discussed above.
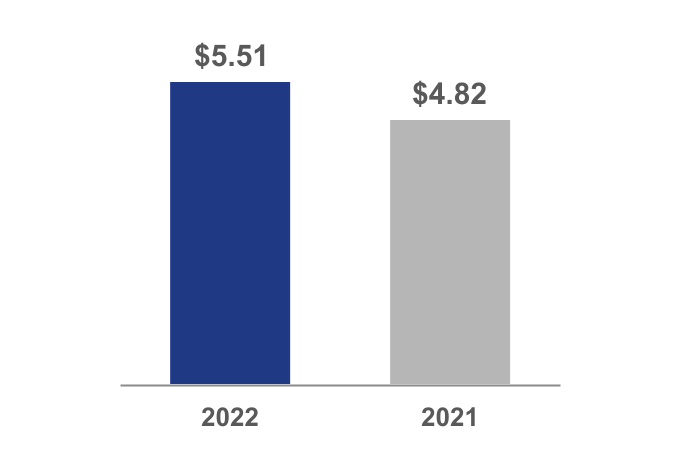
Net Earnings and Diluted EPS
For the three months ended March 31:
| Net Earnings | Diluted EPS | ||||
15% YoY Growth | 16% YoY Growth | ||||
30
For the nine months ended March 31:
| Net Earnings | Diluted EPS | ||||
13% YoY Growth | 15% YoY Growth | ||||
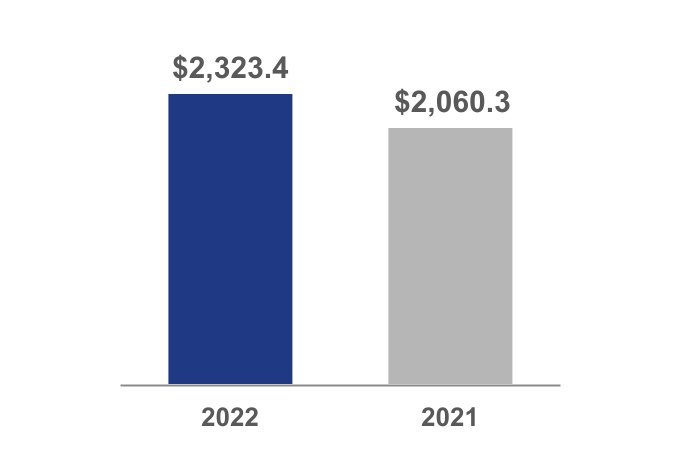
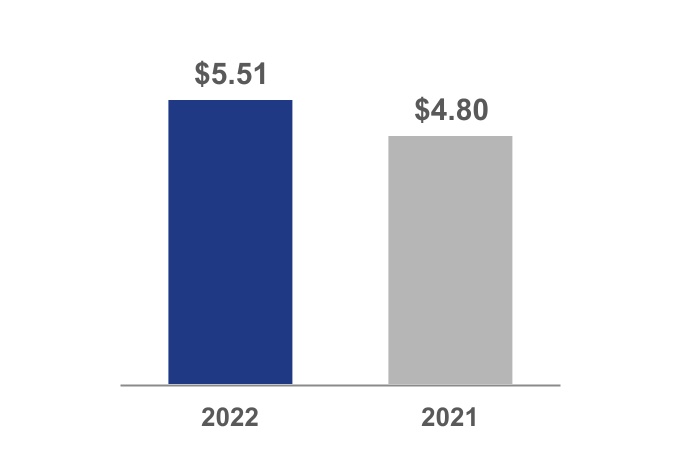
For the three and nine months ended March 31, 2022, net earnings reflect the changes described above in our earnings before income taxes and our effective tax rate.
For the three months ended March 31, 2022, diluted EPS increased as a result of the impact of fewer shares outstanding resulting from the repurchase of approximately 2.3 million shares during the three months ended March 31, 2022 and 2.5 million shares during the three months ended March 31, 2021, partially offset by the issuances of shares under our employee benefit plans.
For the nine months ended March 31, 2022, diluted EPS increased as a result of the impact of fewer shares outstanding resulting from the repurchase of approximately 7.0 million shares during the nine months ended March 31, 2022 and 5.7 million shares during the nine months ended March 31, 2021, partially offset by the issuances of shares under our employee benefit plans.
Adjusted Net Earnings and Adjusted Diluted EPS
For the three months ended March 31:
| Adjusted Net Earnings | Adjusted Diluted EPS | ||||
15% YoY Growth | 17% YoY Growth | ||||


31
For the nine months ended March 31:
| Adjusted Net Earnings | Adjusted Diluted EPS | ||||
13% YoY Growth | 14% YoY Growth | ||||
For the three and nine months ended March 31, 2022, adjusted net earnings and adjusted diluted EPS reflect the changes in components described above.
ANALYSIS OF REPORTABLE SEGMENTS
| Revenues | |||||||||||||||||||||||||||||||||||||||||||||||
| Three Months Ended | % Change | Nine Months Ended | |||||||||||||||||||||||||||||||||||||||||||||
| March 31, | March 31, | % Change | |||||||||||||||||||||||||||||||||||||||||||||
| 2022 | 2021 | As Reported | Organic constant currency | 2022 | 2021 | As Reported | Organic constant currency | ||||||||||||||||||||||||||||||||||||||||
| Employer Services | $ | 3,002.0 | $ | 2,780.0 | 8 | % | 9 | % | $ | 8,244.8 | $ | 7,667.4 | 8 | % | 8 | % | |||||||||||||||||||||||||||||||
| PEO Services | 1,513.8 | 1,324.1 | 14 | % | 14 | % | 4,136.7 | 3,606.1 | 15 | % | 15 | % | |||||||||||||||||||||||||||||||||||
| Other | (2.8) | (2.1) | n/m | n/m | (10.9) | (5.1) | n/m | n/m | |||||||||||||||||||||||||||||||||||||||
| $ | 4,513.0 | $ | 4,102.0 | 10 | % | 11 | % | $ | 12,370.6 | $ | 11,268.4 | 10 | % | 10 | % | ||||||||||||||||||||||||||||||||
| Earnings before Income Taxes | ||||||||||||||||||||||||||||||||||||||
| Three Months Ended | % Change | Nine Months Ended | % Change | |||||||||||||||||||||||||||||||||||
| March 31, | March 31, | |||||||||||||||||||||||||||||||||||||
| 2022 | 2021 | As Reported | 2022 | 2021 | As Reported | |||||||||||||||||||||||||||||||||
| Employer Services | $ | 1,095.7 | $ | 980.0 | 12 | % | $ | 2,697.0 | $ | 2,427.8 | 11 | % | ||||||||||||||||||||||||||
| PEO Services | 227.2 | 198.7 | 14 | % | 632.9 | 545.5 | 16 | % | ||||||||||||||||||||||||||||||
| Other | (133.0) | (112.5) | n/m | (329.2) | (309.2) | n/m | ||||||||||||||||||||||||||||||||
| $ | 1,189.9 | $ | 1,066.2 | 12 | % | $ | 3,000.7 | $ | 2,664.1 | 13 | % | |||||||||||||||||||||||||||
n/m - not meaningful
32
Employer Services
Revenues
Revenues increased for the three months ended March 31, 2022 due to strong retention and new business started from New Business Bookings, an increase in our pays per control of 7%, and an increase in interest earned on funds held for clients, partially offset by one percentage point of pressure from foreign currency.
Revenues increased for the nine months ended March 31, 2022 due to strong retention and new business started from New Business Bookings, and an increase in our pays per control of 7%.
Earnings before Income Taxes
Employer Services' earnings before income taxes increased for the three and nine months ended March 31, 2022 due to increased revenues discussed above, partially offset by increases in expenses. The increases in expenses were due to increased costs to service our client base in support of our growing revenue, increases in selling expenses, and investments and costs to develop, support, and maintain our new and existing products, partially offset by the decrease in our allowance for doubtful accounts.
33
For the three and nine months ended March 31, respectively:
| ES Margin | ES Margin | ||||
120 bps YoY Increase | 100 bps YoY Increase | ||||
Employer Services' margin increased for the three and nine months ended March 31, 2022 due to increases in revenues discussed above, and the decrease in our allowance for doubtful accounts, partially offset by increased costs to service our client base in support of our growing revenue.
PEO Services
Revenues
| PEO Revenues | |||||||||||||||||||||||||||||||||||||||||||||||
| Three Months Ended | Change | Nine Months Ended | Change | ||||||||||||||||||||||||||||||||||||||||||||
| March 31, | March 31, | ||||||||||||||||||||||||||||||||||||||||||||||
| 2022 | 2021 | $ | % | 2022 | 2021 | $ | % | ||||||||||||||||||||||||||||||||||||||||
| PEO Services' revenues | $ | 1,513.8 | $ | 1,324.1 | $ | 189.7 | 14 | % | $ | 4,136.7 | $ | 3,606.1 | $ | 530.6 | 15 | % | |||||||||||||||||||||||||||||||
| Less: PEO zero-margin benefits pass-throughs | 897.2 | 784.7 | 112.5 | 14 | % | 2,600.6 | 2,291.7 | 308.9 | 13 | % | |||||||||||||||||||||||||||||||||||||
| PEO Services' revenues excluding zero-margin benefits pass-throughs | $ | 616.6 | $ | 539.4 | $ | 77.2 | 14 | % | $ | 1,536.1 | $ | 1,314.4 | $ | 221.7 | 17 | % | |||||||||||||||||||||||||||||||
PEO Services' revenue increased 14% and 15% for the three and nine months ended March 31, 2022, respectively, due to increases in average worksite employees of 16% for the three and nine months ended March 31, 2022, respectively, as compared to the three and nine months ended March 31, 2021, and due to an increase in zero-margin benefits pass-throughs.
Earnings before Income Taxes
PEO Services' earnings before income taxes increased 14% and 16% for the three and nine months ended March 31, 2022, respectively, due to increased revenues discussed above, partially offset by the increases in zero-margin benefits pass-throughs of $112.5 million and $308.9 million for the three and nine months ended March 31, 2022, respectively.
34
For the three and nine months ended March 31, respectively:
| PEO Margin | PEO Margin | ||||
| Flat | 20 bps YoY Increase | ||||
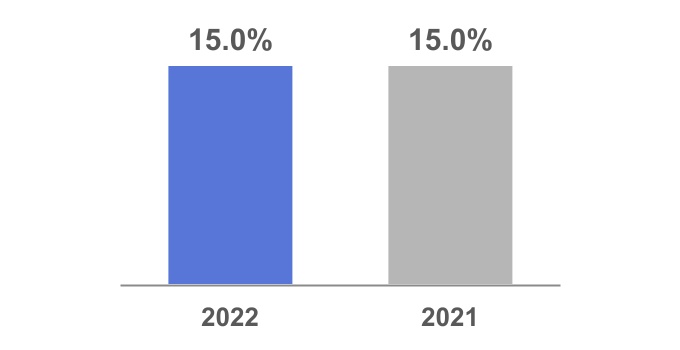
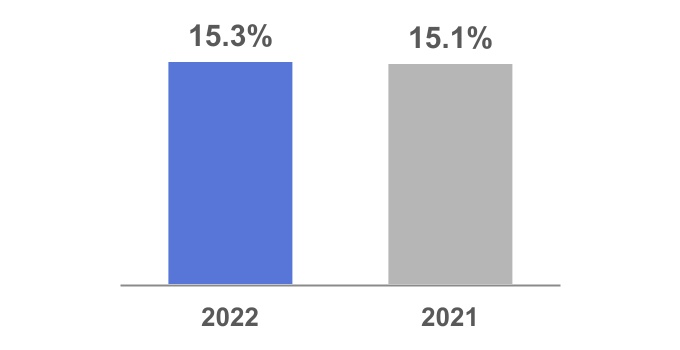
PEO Services' margin was flat for the three months ended March 31, 2022 due to increase in revenues discussed above, offset by increases in selling expenses, changes in our estimated losses related to ADP Indemnity, and increases in zero-margin benefits pass-throughs.
PEO Services' margin increased for the nine months ended March 31, 2022 due to increase in revenues discussed above, partially offset by changes in our estimated losses related to ADP Indemnity, and increases in zero-margin benefits pass-throughs.
ADP Indemnity provides workers’ compensation and employer’s liability deductible reimbursement insurance protection for PEO Services’ worksite employees up to $1 million per occurrence. PEO Services has secured a workers’ compensation and employer’s liability insurance policy that caps the exposure for each claim at $1 million per occurrence and has also secured aggregate stop loss insurance that caps aggregate losses at a certain level in fiscal years 2012 and prior from an admitted and licensed insurance company of AIG. We utilize historical loss experience and actuarial judgment to determine the estimated claim liability, and changes in estimated ultimate incurred losses are included in the PEO segment.
Additionally, starting in fiscal year 2013, ADP Indemnity paid premiums to enter into reinsurance arrangements with ACE American Insurance Company, a wholly-owned subsidiary of Chubb Limited (“Chubb”), to cover substantially all losses incurred by the Company up to the $1 million per occurrence related to the workers' compensation and employer's liability deductible reimbursement insurance protection for PEO Services' worksite employees. Each of these reinsurance arrangements limits our overall exposure incurred up to a certain limit. The Company believes the likelihood of ultimate losses exceeding this limit is remote. ADP Indemnity recorded a pre-tax benefit of approximately $6.9 million and $21.5 million for the three and nine months ended March 31, 2022, as compared to approximately $12.0 million and $27.2 million for the three and nine months ended March 31, 2021, which were primarily a result of changes in our estimated actuarial losses. In July 2021, ADP Indemnity paid a premium of $260 million to enter into a reinsurance arrangement with Chubb Limited to cover substantially all losses incurred by ADP Indemnity for the fiscal 2022 policy year on terms substantially similar to the fiscal 2021 reinsurance policy.
Other
The primary components of “Other” are certain corporate overhead charges and expenses that have not been allocated to the reportable segments, including corporate functions, costs related to our transformation office, severance costs, non-recurring gains and losses, the elimination of intercompany transactions, and other interest income and expense.
35
Non-GAAP Financial Measures
In addition to our U.S. GAAP results, we use the adjusted results and other non-GAAP metrics set forth in the table below to evaluate our operating performance in the absence of certain items and for planning and forecasting of future periods:
| Adjusted Financial Measure | U.S. GAAP Measures | ||||
| Adjusted EBIT | Net earnings | ||||
| Adjusted provision for income taxes | Provision for income taxes | ||||
| Adjusted net earnings | Net earnings | ||||
| Adjusted diluted earnings per share | Diluted earnings per share | ||||
| Adjusted effective tax rate | Effective tax rate | ||||
| Organic constant currency | Revenues | ||||
We believe that the exclusion of the identified items helps us reflect the fundamentals of our underlying business model and analyze results against our expectations and against prior period, and to plan for future periods by focusing on our underlying operations. We believe that the adjusted results provide relevant and useful information for investors because it allows investors to view performance in a manner similar to the method used by management and improves their ability to understand and assess our operating performance. The nature of these exclusions is for specific items that are not fundamental to our underlying business operations. Since these adjusted financial measures and other non-GAAP metrics are not measures of performance calculated in accordance with U.S. GAAP, they should not be considered in isolation from, as a substitute for, or superior to their corresponding U.S. GAAP measures, and they may not be comparable to similarly titled measures at other companies.
36
| Three Months Ended | % Change | Nine Months Ended | % Change | |||||||||||||||||||||||||||||||||||
| March 31, | March 31, | |||||||||||||||||||||||||||||||||||||
| 2022 | 2021 | As Reported | 2022 | 2021 | As Reported | |||||||||||||||||||||||||||||||||
| Net earnings | $ | 928.5 | $ | 810.7 | 15 | % | $ | 2,323.4 | $ | 2,060.3 | 13 | % | ||||||||||||||||||||||||||
| Adjustments: | ||||||||||||||||||||||||||||||||||||||
| Provision for income taxes | 261.4 | 255.5 | 677.3 | 603.8 | ||||||||||||||||||||||||||||||||||
| All other interest expense (a) | 17.9 | 13.2 | 53.5 | 40.5 | ||||||||||||||||||||||||||||||||||
| All other interest income (a) | (1.1) | (1.6) | (3.5) | (4.9) | ||||||||||||||||||||||||||||||||||
| Transformation initiatives (b) | 1.3 | (0.6) | 2.3 | 3.5 | ||||||||||||||||||||||||||||||||||
| Excess capacity severance charges | — | — | — | 2.9 | ||||||||||||||||||||||||||||||||||
| Adjusted EBIT | $ | 1,208.0 | $ | 1,077.2 | 12 | % | $ | 3,053.0 | $ | 2,706.1 | 13 | % | ||||||||||||||||||||||||||
| Adjusted EBIT Margin | 26.8 | % | 26.3 | % | 24.7 | % | 24.0 | % | ||||||||||||||||||||||||||||||
| Provision for income taxes | $ | 261.4 | $ | 255.5 | 2 | % | $ | 677.3 | $ | 603.8 | 12 | % | ||||||||||||||||||||||||||
| Adjustments: | ||||||||||||||||||||||||||||||||||||||
| Transformation initiatives (c) | 0.3 | (0.3) | 0.5 | 0.7 | ||||||||||||||||||||||||||||||||||
| Excess capacity severance charges (c) | — | — | 0.7 | |||||||||||||||||||||||||||||||||||
| Adjusted provision for income taxes | $ | 261.7 | $ | 255.2 | 3 | % | $ | 677.8 | $ | 605.2 | 12 | % | ||||||||||||||||||||||||||
| Adjusted effective tax rate (d) | 22.0 | % | 23.9 | % | 22.6 | % | 22.7 | % | ||||||||||||||||||||||||||||||
| Net earnings | $ | 928.5 | $ | 810.7 | 15 | % | $ | 2,323.4 | $ | 2,060.3 | 13 | % | ||||||||||||||||||||||||||
| Adjustments: | ||||||||||||||||||||||||||||||||||||||
| Transformation initiatives (b) | 1.3 | (0.6) | 2.3 | 3.5 | ||||||||||||||||||||||||||||||||||
| Income tax provision/(benefit) for transformation initiatives (c) | (0.3) | 0.3 | (0.5) | (0.7) | ||||||||||||||||||||||||||||||||||
| Excess capacity severance charges | — | — | — | 2.9 | ||||||||||||||||||||||||||||||||||
| Income tax benefit for excess capacity severance charges (c) | — | — | — | (0.7) | ||||||||||||||||||||||||||||||||||
| Adjusted net earnings | $ | 929.5 | $ | 810.4 | 15 | % | $ | 2,325.2 | $ | 2,065.3 | 13 | % | ||||||||||||||||||||||||||
| Diluted EPS | $ | 2.21 | $ | 1.90 | 16 | % | $ | 5.51 | $ | 4.80 | 15 | % | ||||||||||||||||||||||||||
| Adjustments: | ||||||||||||||||||||||||||||||||||||||
| Transformation initiatives (b) (c) | — | — | — | 0.01 | ||||||||||||||||||||||||||||||||||
| Excess capacity severance charges (c) | — | — | — | 0.01 | ||||||||||||||||||||||||||||||||||
| Adjusted diluted EPS | $ | 2.21 | $ | 1.89 | 17 | % | $ | 5.51 | $ | 4.82 | 14 | % | ||||||||||||||||||||||||||
(a) We include the interest income earned on investments associated with our client funds extended investment strategy and interest expense on borrowings related to our client funds extended investment strategy as we believe these amounts to be fundamental to the underlying operations of our business model. The adjustments in the table above represent the interest income and interest expense that are not related to our client funds extended investment strategy and are labeled as “All other interest expense” and “All other interest income.”
(b) In the three months ended March 31, 2022, transformation initiatives include consulting costs relating to our company wide transformation initiatives. In the nine months ended March 31, 2022, the charges include consulting costs relating to our company wide transformation initiatives, partially offset by net reversals relating to severance, and gain on sale of assets. Unlike other severance charges which are not included as an adjustment to get to adjusted results, these specific charges relate to actions taken as part of our broad-based, company-wide transformation initiative.
(c) The income tax (benefit)/provision was calculated based on the annualized marginal rate in effect during the quarter of the adjustment.
(d) The Adjusted effective tax rate is calculated as our Adjusted provision for income taxes divided by the sum of our Adjusted net earnings plus our Adjusted provision for income taxes.
The following table reconciles our reported growth rates to the non-GAAP measure of organic constant currency, which excludes the impact of acquisitions, the impact of dispositions, and the impact of foreign currency. The impact of acquisitions
37
and dispositions is calculated by excluding the current year revenues of acquisitions until the one-year anniversary of the transaction and by excluding the prior year revenues of divestitures for the one-year period preceding the transaction. The impact of foreign currency is determined by calculating the current year result using foreign exchange rates consistent with the prior year. The PEO segment is not impacted by acquisitions, dispositions or foreign currency.
| Three Months Ended | Nine Months Ended | ||||||||||
| March 31, | March 31, | ||||||||||
| 2022 | 2022 | ||||||||||
| Consolidated revenue growth as reported | 10 | % | 10 | % | |||||||
| Adjustments: | |||||||||||
Impact of acquisitions | — | % | — | % | |||||||
Impact of foreign currency | 1 | % | — | % | |||||||
| Consolidated revenue growth, organic constant currency | 11 | % | 10 | % | |||||||
| Employer Services revenue growth as reported | 8 | % | 8 | % | |||||||
| Adjustments: | |||||||||||
Impact of acquisitions | — | % | — | % | |||||||
Impact of foreign currency | 1 | % | — | % | |||||||
| Employer Services revenue growth, organic constant currency | 9 | % | 8 | % | |||||||
FINANCIAL CONDITION, LIQUIDITY AND CAPITAL RESOURCES
At March 31, 2022, cash and cash equivalents were $1.6 billion, which were primarily invested in time deposits and money market funds.
For corporate liquidity, we expect existing cash, cash equivalents, short-term marketable securities, cash flow from operations together with our $9.7 billion of committed credit facilities and our ability to access both long-term and short-term debt financing from the capital markets will be adequate to meet our operating, investing, and financing activities such as regular quarterly dividends, share repurchases, and capital expenditures for the foreseeable future. Our financial condition remains solid at March 31, 2022 and we have sufficient liquidity.
For client funds liquidity, we have the ability to borrow through our financing arrangements under our U.S. short-term commercial paper program and our U.S., Canadian and United Kingdom short-term reverse repurchase agreements, together with our $9.7 billion of committed credit facilities and our ability to use corporate liquidity when necessary to meet short-term funding requirements related to client funds obligations. Please see “Quantitative and Qualitative Disclosures about Market Risk” for a further discussion of the risks, including with respect to the COVID-19 pandemic, related to our client funds extended investment strategy. See Note 9 of our Consolidated Financial Statements for a description of our short-term financing including commercial paper.
Operating, Investing and Financing Cash Flows
Our cash flows from operating, investing, and financing activities, as reflected in the Statements of Consolidated Cash Flows for the nine months ended March 31, 2022 and 2021, respectively, are summarized as follows:
| Nine Months Ended | ||||||||||||||||||||
| March 31, | ||||||||||||||||||||
| 2022 | 2021 | $ Change | ||||||||||||||||||
| Cash provided by / (used in): | ||||||||||||||||||||
| Operating activities | $ | 2,186.6 | $ | 2,440.5 | $ | (253.9) | ||||||||||||||
| Investing activities | (5,963.7) | (2,366.4) | (3,597.3) | |||||||||||||||||
| Financing activities | 22,378.7 | 12,923.7 | 9,455.0 | |||||||||||||||||
| Effect of exchange rate changes on cash, cash equivalents, restricted cash, and restricted cash equivalents | (14.2) | 70.4 | (84.6) | |||||||||||||||||
| Net change in cash, cash equivalents, restricted cash, and restricted cash equivalents | $ | 18,587.4 | $ | 13,068.2 | $ | 5,519.2 | ||||||||||||||
38
Net cash flows provided by operating activities decreased due to a net unfavorable change in the components of operating assets and liabilities, which includes timing on collections of accounts receivable and an increase in incentive compensation payments, offset by the growth in our underlying business (net income adjusted for non-cash adjustments), as compared to the nine months ended March 31, 2021.
Net cash flows used in investing activities changed due to the timing of proceeds and purchases of corporate and client funds marketable securities of $3,588.4 million, and higher payments related to acquisitions of intangibles and a business, offset by proceeds from the sale of property, plant, and equipment in the nine months ended March 31, 2022.
Net cash flows provided by financing activities changed due to a net increase in the cash flow from client funds obligations of $10,028.8 million, which is due to the timing of impounds from our clients and payments to our clients' employees and other payees, and settlement of cash flow hedges in the nine months ended March 31, 2021. These were partially offset by an increase in repurchases of common stock in the nine months ended March 31, 2022.
We purchased approximately 7.0 million shares of our common stock at an average price per share of $213.17 during the nine months ended March 31, 2022, as compared to purchases of 5.7 million shares at an average price per share of $159.72 during the nine months ended March 31, 2021. From time to time, the Company may repurchase shares of its common stock under its authorized share repurchase program. The Company considers several factors in determining when to execute share repurchases, including, among other things, actual and potential acquisition activity, cash balances and cash flows, issuances due to employee benefit plan activity, and market conditions.
Capital Resources and Client Funds Obligations
We have $3.0 billion of senior unsecured notes with maturity dates in 2025, 2028 and 2030. We may from time to time revisit the long-term debt market to refinance existing debt, finance investments including acquisitions for our growth, and maintain the appropriate capital structure. However, there can be no assurance that volatility in the global capital and credit markets would not impair our ability to access these markets on terms acceptable to us, or at all. See Note 10 of our Consolidated Financial Statements for a description of our long-term financing.
Our U.S. short-term funding requirements related to client funds are sometimes obtained on an unsecured basis through the issuance of commercial paper, rather than liquidating previously-collected client funds that have already been invested in available-for-sale securities. This commercial paper program provides for the issuance of up to $9.7 billion in aggregate maturity value. Our commercial paper program is rated A-1+ by Standard & Poor’s, Prime-1 (“P-1”) by Moody’s and F1+ by Fitch. These ratings denote the highest quality commercial paper securities. Maturities of commercial paper can range from overnight to up to 364 days. At March 31, 2022 and June 30, 2021, the Company had no commercial paper borrowing outstanding. Details of the borrowings under the commercial paper program are as follows:
| Three Months Ended | Nine Months Ended | ||||||||||||||||||||||
| March 31, | March 31, | ||||||||||||||||||||||
| 2022 | 2021 | 2022 | 2021 | ||||||||||||||||||||
| Average daily borrowings (in billions) | $ | 1.2 | $ | 0.7 | $ | 1.7 | $ | 1.6 | |||||||||||||||
| Weighted average interest rates | 0.1 | % | 0.1 | % | 0.1 | % | 0.1 | % | |||||||||||||||
| Weighted average maturity (approximately in days) | 1 day | 1 day | 1 day | 1 day | |||||||||||||||||||
Our U.S., Canadian, and United Kingdom short-term funding requirements related to client funds obligations are sometimes obtained on a secured basis through the use of reverse repurchase agreements, which are collateralized principally by government and government agency securities, rather than liquidating previously-collected client funds that have already been invested in available-for-sale securities. These agreements generally have terms ranging from overnight to up to five business days. We have successfully borrowed through the use of reverse repurchase agreements on an as-needed basis to meet short-term funding requirements related to client funds obligations. At March 31, 2022 there were no outstanding obligations related to reverse repurchase agreements. At June 30, 2021, the Company had $23.5 million of outstanding obligations related to the reverse repurchase agreements. Details of the reverse repurchase agreements are as follows:
39
| Three Months Ended | Nine Months Ended | ||||||||||||||||||||||
| March 31, | March 31, | ||||||||||||||||||||||
| 2022 | 2021 | 2022 | 2021 | ||||||||||||||||||||
| Average outstanding balances | $ | 93.2 | $ | 54.9 | $ | 172.8 | $ | 97.1 | |||||||||||||||
| Weighted average interest rates | 0.3 | % | 0.2 | % | 0.2 | % | 0.3 | % | |||||||||||||||
We vary the maturities of our committed credit facilities to limit the refinancing risk of any one facility. We have a $3.75 billion, 364-day credit agreement that matures in June 2022 with a one year term-out option. In addition, we have a five-year $2.75 billion credit facility and a five-year $3.2 billion credit facility maturing in June 2024 and June 2026, respectively, each with an accordion feature under which the aggregate commitment can be increased by $500 million, subject to the availability of additional commitments. The primary uses of the credit facilities are to provide liquidity to the commercial paper program and funding for general corporate purposes, if necessary. We had no borrowings through March 31, 2022 under the credit facilities. We believe that we currently meet all conditions set forth in the revolving credit agreements to borrow thereunder and we are not aware of any conditions that would prevent us from borrowing part or all of the $9.7 billion available to us under the revolving credit agreements. See Note 9 of our Consolidated Financial Statements for a description of our short-term financing including credit facilities.
Our investment portfolio does not contain any asset-backed securities with underlying collateral of sub-prime mortgages, alternative-A mortgages, sub-prime auto loans or sub-prime home equity loans, collateralized debt obligations, collateralized loan obligations, credit default swaps, derivatives, auction rate securities, structured investment vehicles or non-investment grade fixed-income securities. We own AAA-rated senior tranches of primarily fixed rate auto loan, credit card, equipment lease, and rate reduction receivables, secured predominantly by prime collateral. All collateral on asset-backed securities has performed as expected through March 31, 2022. In addition, we own U.S. government securities which primarily include debt directly issued by Federal Farm Credit Banks and Federal Home Loan Banks. Our client funds investment strategy is structured to allow us to average our way through an interest rate cycle by laddering the maturities of our investments out to five years (in the case of the extended portfolio) and out to ten years (in the case of the long portfolio). This investment strategy is supported by our short-term financing arrangements necessary to satisfy short-term funding requirements relating to client funds obligations. See Note 6 of our Consolidated Financial Statements for a description of our corporate investments and funds held for clients.
Capital expenditures for the nine months ended March 31, 2022 were $126.3 million, as compared to $144.4 million for the nine months ended March 31, 2021. We expect capital expenditures in fiscal 2022 to be between $200 million and $225 million, as compared to $178.3 million in fiscal 2021.
40
QUANTITATIVE AND QUALITATIVE DISCLOSURES ABOUT MARKET RISK
Our overall investment portfolio is comprised of corporate investments (cash and cash equivalents, short-term marketable securities) and client funds assets (funds that have been collected from clients but have not yet been remitted to the applicable tax authorities or client employees).
Our corporate investments are invested in cash and cash equivalents and highly liquid, investment-grade marketable securities. These assets are available for our regular quarterly dividends, share repurchases, capital expenditures and/or acquisitions, as well as other corporate operating purposes. All of our short-term fixed-income securities are classified as available-for-sale securities.
Our client funds assets are invested with safety of principal, liquidity, and diversification as the primary objectives. Consistent with those objectives, we also seek to maximize interest income and to minimize the volatility of interest income. Client funds assets are invested in highly liquid, investment-grade marketable securities, with a maximum maturity of 10 years at the time of purchase, and money market securities and other cash equivalents.
We utilize a strategy by which we extend the maturities of our investment portfolio for funds held for clients and employ short-term financing arrangements to satisfy our short-term funding requirements related to client funds obligations. Our client funds investment strategy is structured to allow us to average our way through an interest rate cycle by laddering the maturities of our investments out to five years (in the case of the extended portfolio) and out to ten years (in the case of the long portfolio). As part of our client funds investment strategy, we use the daily collection of funds from our clients to satisfy other unrelated client funds obligations, rather than liquidating previously-collected client funds that have already been invested in available-for-sale securities. In circumstances where we experience a reduction in employment levels due to a slowdown in the economy, we may make tactical decisions to sell certain securities or not reinvest maturing securities in order to reduce the size of the funds held for clients to correspond to client funds obligations. We minimize the risk of not having funds collected from a client available at the time such client’s obligation becomes due by impounding, in virtually all instances, the client’s funds in advance of the timing of payment of such client’s obligation. As a result of this practice, we have consistently maintained the required level of client funds assets to satisfy all of our obligations.
There are inherent risks and uncertainties involving our investment strategy relating to our client funds assets. Such risks include liquidity risk, including the risk associated with our ability to liquidate, if necessary, our available-for-sale securities in a timely manner in order to satisfy our client funds obligations. However, our investments are made with the safety of principal, liquidity, and diversification as the primary goals to minimize the risk of not having sufficient funds to satisfy all of our client funds obligations. We also believe we have significantly reduced the risk of not having sufficient funds to satisfy our client funds obligations by consistently maintaining access to other sources of liquidity, including our corporate cash balances, available borrowings under our $9.7 billion commercial paper program (rated A-1+ by Standard and Poor’s, P-1 by Moody’s, and F1+ by Fitch, the highest possible short-term credit ratings), and our ability to engage in reverse repurchase agreement transactions and available borrowings under our $9.7 billion committed credit facilities. The reduced availability of financing during periods of economic turmoil, including the COVID-19 pandemic, even to borrowers with the highest credit ratings, may limit our ability to access short-term debt markets to meet the liquidity needs of our business. In addition to liquidity risk, our investments are subject to interest rate risk and credit risk, as discussed below.
We have established credit quality, maturity, and exposure limits for our investments. The minimum allowed credit rating at time of purchase for Corporate, Canadian government agency and Canadian provincial bonds is BBB, for asset-backed securities is AAA, and for municipal bonds is A. The maximum maturity at time of purchase for BBB-rated securities is 5 years, for single A rated securities is 10 years, and for AA-rated and AAA-rated securities is 10 years. Time deposits and commercial paper must be rated A-1 and/or P-1. Money market funds must be rated AAA/Aaa-mf.
41
Details regarding our overall investment portfolio are as follows:
| Three Months Ended | Nine Months Ended | ||||||||||||||||||||||
| March 31, | March 31, | ||||||||||||||||||||||
| 2022 | 2021 | 2022 | 2021 | ||||||||||||||||||||
| Average investment balances at cost: | |||||||||||||||||||||||
| Corporate investments | $ | 3,229.0 | $ | 2,498.8 | $ | 3,771.8 | $ | 3,419.3 | |||||||||||||||
| Funds held for clients | 38,141.4 | 33,167.9 | 32,372.1 | 26,702.6 | |||||||||||||||||||
| Total | $ | 41,370.4 | $ | 35,666.7 | $ | 36,143.9 | $ | 30,121.9 | |||||||||||||||
| Average interest rates earned exclusive of realized (gains)/losses on: | |||||||||||||||||||||||
| Corporate investments | 0.7 | % | 0.7 | % | 0.8 | % | 1.1 | % | |||||||||||||||
| Funds held for clients | 1.2 | % | 1.3 | % | 1.3 | % | 1.6 | % | |||||||||||||||
| Total | 1.2 | % | 1.3 | % | 1.3 | % | 1.5 | % | |||||||||||||||
| Net realized losses/(gains) on available-for-sale securities | 0.3 | $ | 0.4 | (0.2) | $ | (7.6) | |||||||||||||||||
| March 31, 2022 | June 30, 2021 | ||||||||||
| Net unrealized pre-tax (losses)/gains on available-for-sale securities | $ | (1,068.4) | $ | 502.2 | |||||||
| Total available-for-sale securities at fair value | $ | 28,250.8 | $ | 24,371.7 | |||||||
We are exposed to interest rate risk in relation to securities that mature, as the proceeds from maturing securities are reinvested. Factors that influence the earnings impact of interest rate changes include, among others, the amount of invested funds and the overall portfolio mix between short-term and long-term investments. This mix varies during the fiscal year and is impacted by daily interest rate changes. The annualized interest rate earned on our entire portfolio decreased from 1.5% for the nine months ended March 31, 2021 to 1.3% for the nine months ended March 31, 2022. A hypothetical change in both short-term interest rates (e.g., overnight interest rates or the federal funds rate) and intermediate-term interest rates of 25 basis points applied to the estimated average investment balances and any related short-term borrowings would result in approximately a $19 million impact to earnings before income taxes over the ensuing twelve-month period ending March 31, 2023. A hypothetical change in only short-term interest rates of 25 basis points applied to the estimated average short-term investment balances and any related short-term borrowings would result in approximately a $7 million impact to earnings before income taxes over the ensuing twelve-month period ending March 31, 2023.
We are exposed to credit risk in connection with our available-for-sale securities through the possible inability of the borrowers to meet the terms of the securities. We limit credit risk by investing in investment-grade securities, primarily AAA-rated and AA- rated securities, as rated by Moody’s, Standard & Poor’s, DBRS for Canadian dollar denominated securities, and Fitch for asset-backed and commercial-mortgage-backed securities. In addition, we limit amounts that can be invested in any security other than U.S. government and government agency, Canadian government, and United Kingdom government securities.
We operate and transact business in various foreign jurisdictions and are therefore exposed to market risk from changes in foreign currency exchange rates that could impact our consolidated results of operations, financial position, or cash flows. We manage our exposure to these market risks through our regular operating and financing activities and, when deemed appropriate, through the use of derivative financial instruments. We may use derivative financial instruments as risk management tools and not for trading purposes.
42
CRITICAL ACCOUNTING POLICIES
Our Consolidated Financial Statements and accompanying notes have been prepared in accordance with accounting principles generally accepted in the United States of America (“U.S. GAAP”). The preparation of these financial statements requires management to make estimates, judgments, and assumptions that affect reported amounts of assets, liabilities, revenues, expenses, and other comprehensive income. We continually evaluate the accounting policies and estimates used to prepare the Consolidated Financial Statements. The estimates are based on historical experience and assumptions believed to be reasonable under current facts and circumstances. Actual amounts and results could differ from these estimates made by management. Refer to Note 2 of our Consolidated Financial Statements for changes to our accounting policies effective for the fiscal 2022.
NEW ACCOUNTING PRONOUNCEMENTS
See Note 2, New Accounting Pronouncements, of Notes to the Consolidated Financial Statements for a discussion of recent accounting pronouncements.
Item 3. Quantitative and Qualitative Disclosures About Market Risk
The information called for by this item is provided under the caption “Quantitative and Qualitative Disclosures about Market Risk” under Item 2 – Management's Discussion and Analysis of Financial Condition and Results of Operations.
Item 4. Controls and Procedures
The Company carried out an evaluation, under the supervision and with the participation of the Company's management, including its Chief Executive Officer and Chief Financial Officer, of the effectiveness of the Company's disclosure controls and procedures, as defined in Rules 13a-15(e) and 15d-15(e) of the Securities Exchange Act of 1934 (the “evaluation”). Disclosure controls and procedures include, without limitation, controls and procedures designed to ensure that information required to be disclosed by the Company in the reports that it files or submits under the Securities Exchange Act of 1934 is accumulated and communicated to the Company's management, including its Chief Executive Officer and Chief Financial Officer, or persons performing similar functions, as appropriate to allow timely decisions regarding required disclosure. Based on the evaluation, the Company's Chief Executive Officer and Chief Financial Officer have concluded that the Company's disclosure controls and procedures were effective as of March 31, 2022 in ensuring that (i) information required to be disclosed by the Company in reports that it files or submits under the Securities Exchange Act of 1934 is accumulated and communicated to the Company's management, including its Chief Executive Officer and Chief Financial Officer, to allow timely decisions regarding required disclosure and (ii) such information is recorded, processed, summarized and reported within the time periods specified in the Securities and Exchange Commission's rules and forms.
There was no change in the Company's internal control over financial reporting that occurred during the three months ended March 31, 2022 that has materially affected, or is reasonably likely to materially affect, the Company's internal control over financial reporting.
PART II. OTHER INFORMATION
Except as noted below, all other items are either inapplicable or would result in negative responses and, therefore, have been omitted.
Item 1. Legal Proceedings
In the normal course of business, the Company is subject to various claims and litigation. While the outcome of any litigation is inherently unpredictable, the Company believes it has valid defenses with respect to the legal matters pending against it and the Company believes that the ultimate resolution of these matters will not have a material adverse impact on its financial condition, results of operations, or cash flows.
With respect to the disclosure of administrative or judicial proceedings arising under any Federal, State, or local provisions regulating the discharge of materials into the environment or that are primarily for the purpose of protecting the environment, the Company has determined that the following threshold is reasonably designed to result in disclosure of any such proceeding that is material to its business or financial condition: any proceeding when the potential monetary sanctions exceed $1 million.
43
Item 1A. Risk Factors
There have been no material changes in our risk factors disclosed in Part 1, Item 1A, of our Annual Report on Form 10-K for the fiscal year ended June 30, 2021.
Item 2. Unregistered Sales of Equity Securities and Use of Proceeds.
Issuer Purchases of Equity Securities
| Total Number of Shares Purchased (1) | Average Price Paid per Share | Total Number of Shares Purchased as Part of the Publicly Announced Common Stock Repurchase Plan (2) | Maximum Approximate Dollar Value of Shares that may yet be Purchased under the Common Stock Repurchase Plan (2) | |||||||||||||||||||||||
| Period | ||||||||||||||||||||||||||
| January 1 to 31, 2022 | 659,714 | $ | 221.63 | 658,738 | $ | 1,942,567,254 | ||||||||||||||||||||
| February 1 to 28, 2022 | 803,009 | $ | 203.39 | 802,896 | $ | 1,779,266,962 | ||||||||||||||||||||
| March 1 to 31, 2022 | 875,814 | $ | 212.53 | 875,258 | $ | 1,593,254,154 | ||||||||||||||||||||
| Total | 2,338,537 | 2,336,892 | ||||||||||||||||||||||||
(1) During the three months ended March 31, 2022, pursuant to the terms of our restricted stock program, the Company purchased 1,645 shares at the then-market value of the shares to satisfy certain tax withholding requirements for employees upon the vesting of their restricted shares.
(2) The Company received the Board of Directors' approval to repurchase the shares of our common stock included in the table above as follows:
| Date of Approval | |||||
| November 2019 | $5 billion | ||||
There is no expiration date for the common stock repurchase authorization.
44
Item 6. Exhibits
| Exhibit Number | Exhibit | ||||
| Certification by Carlos A. Rodriguez pursuant to Rule 13a-14(a) of the Securities Exchange Act of 1934 | |||||
| Certification by Don McGuire pursuant to Rule 13a-14(a) of the Securities Exchange Act of 1934 | |||||
| Certification by Carlos A. Rodriguez pursuant to 18 U.S.C. Section 1350, as adopted pursuant to Section 906 of the Sarbanes-Oxley Act of 2002 | |||||
| Certification by Don McGuire pursuant to 18 U.S.C. Section 1350, as adopted pursuant to Section 906 of the Sarbanes-Oxley Act of 2002 | |||||
| 101.INS | Instance Document - the instance document does not appear in the Interactive Data File because its XBRL tags are embedded within the Inline XBRL document | ||||
| 101.SCH | Inline XBRL Taxonomy Extension Schema | ||||
| 101.CAL | Inline XBRL Taxonomy Extension Calculation Linkbase | ||||
| 101.LAB | Inline XBRL Taxonomy Label Linkbase | ||||
| 101.PRE | Inline XBRL Taxonomy Extension Presentation Linkbase | ||||
| 101.DEF | Inline XBRL Taxonomy Extension Definition Document | ||||
| 104 | Cover Page Interactive Data File - the cover page interactive data file does not appear in the Interactive Data File because its XBRL tags are embedded within the Inline XBRL document | ||||
45
SIGNATURES
Pursuant to the requirements of the Securities Exchange Act of 1934, the registrant has duly caused this report to be signed on its behalf by the undersigned thereunto duly authorized.
AUTOMATIC DATA PROCESSING, INC. (Registrant) | ||||||||
| Date: | April 29, 2022 | /s/ Don McGuire Don McGuire | ||||||
Chief Financial Officer (Title) | ||||||||
46
Serious News for Serious Traders! Try StreetInsider.com Premium Free!
You May Also Be Interested In
- TabaPay to Acquire the Assets of Synapse Financial Technologies, Inc.
- Four ONDA Partners Earn Placement on D Magazine’s Best Lawyers List
- MCRO Edibles Launches Revolutionary Microdosed Edible Line With Specific Functional Mushrooms for Predictable Cannabis Experiences
Create E-mail Alert Related Categories
SEC FilingsSign up for StreetInsider Free!
Receive full access to all new and archived articles, unlimited portfolio tracking, e-mail alerts, custom newswires and RSS feeds - and more!
