

Form 10-K NEW RELIC, INC. For: Mar 31
 Tweet
Tweet Share
ShareUNITED STATES
SECURITIES AND EXCHANGE COMMISSION
Washington, D.C. 20549
__________________________________________________________________
FORM 10-K
__________________________________________________________________
(Mark One)
| ANNUAL REPORT PURSUANT TO SECTION 13 OR 15(d) OF THE SECURITIES EXCHANGE ACT OF 1934 | |||||
For the fiscal year ended March 31 , 2022
or
| TRANSITION REPORT PURSUANT TO SECTION 13 OR 15(d) OF THE SECURITIES EXCHANGE ACT OF 1934 | |||||
For the transition period from to
Commission File Number: 001-36766
__________________________________________________________________
(Exact name of registrant as specified in its charter)
__________________________________________________________________
| (State or other jurisdiction of incorporation or organization) | (I.R.S. Employer Identification No.) | |||||||
(Address of principal executive offices, including zip code)
(650 ) 777-7600
(Registrant’s telephone number, including area code)
__________________________________________________________________
Securities registered pursuant to Section 12(b) of the Act:
| Title of each class | Trading Symbol(s) | Name of each exchange on which registered | ||||||||||||
Securities registered pursuant to Section 12(g) of the Act: None
__________________________________________________________________
Indicate by check mark if the registrant is a well-known seasoned issuer, as defined in Rule 405 of the Securities Act. Yes ☒ No ☐
Indicate by check mark if the registrant is not required to file reports pursuant to Section 13 or 15(d) of the Act. Yes ☐ No ☒
Indicate by check mark whether the registrant: (1) has filed all reports required to be filed by Section 13 or 15(d) of the Securities Exchange Act of 1934 during the preceding 12 months (or for such shorter period that the registrant was required to file such reports), and (2) has been subject to such filing requirements for the past 90 days. Yes ☒ No ☐
Indicate by check mark whether the registrant has submitted electronically and posted on its corporate Web site, if any, every Interactive Data File required to be submitted and posted pursuant to Rule 405 of Regulation S-T (§232.405 of this chapter) during the preceding 12 months (or for such shorter period that the registrant was required to submit and post such files). Yes ☒ No ☐
Indicate by check mark whether the registrant is a large accelerated filer, an accelerated filer, a non-accelerated filer, a smaller reporting company, or an emerging growth company. See the definitions of “large accelerated filer,” “accelerated filer,” “smaller reporting company,” and “emerging growth company” in Rule 12b-2 of the Exchange Act.
| ☒ | Accelerated filer | ☐ | ||||||||||||||||||
| Non-accelerated filer | ☐ | Small reporting company | ||||||||||||||||||
| Emerging growth company | ||||||||||||||||||||
If an emerging growth company, indicate by check mark if the registrant has elected not to use the extended transition period for complying with any new or revised financial accounting standards provided pursuant to Section 13(a) of the Exchange Act. ☐
Indicate by check mark whether the registrant has filed a report on and attestation to its management’s assessment of the effectiveness of its internal control over financial reporting under Section 404(b) of the Sarbanes-Oxley Act (15 U.S.C. 7262(b)) by the registered public accounting firm that prepared or issued its audit report. ☒
Indicate by check mark whether the registrant is a shell company (as defined in Rule 12b-2 of the Exchange Act). Yes ☐ No ☒
The aggregate market value of the voting and non-voting common equity held by non-affiliates of the registrant on September 30, 2021, based on the closing price of a share of the registrant’s common stock on September 30, 2021 as reported by the New York Stock Exchange on such date, was approximately $4.1 billion. Shares of the registrant’s common stock held by each executive officer, director and holder of 10% or more of the outstanding common stock (as determined based on public filings) have been excluded in that such persons may be deemed to be affiliates. This calculation does not reflect a determination that certain persons are affiliates of the registrant for any other purpose.
As of May 10, 2022, there were 66,920,164 shares of the registrant’s common stock, par value $0.001 per share, outstanding.
TABLE OF CONTENTS
| Page | ||||||||
| PART I | ||||||||
| Item 1. | ||||||||
| Item 1A. | ||||||||
| Item 1B. | ||||||||
| Item 2. | ||||||||
| Item 3. | ||||||||
| Item 4. | ||||||||
| PART II | ||||||||
| Item 5. | ||||||||
| Item 6. | ||||||||
| Item 7. | ||||||||
| Item 7A. | ||||||||
| Item 8. | ||||||||
| Item 9. | ||||||||
| Item 9A. | ||||||||
| Item 9B. | ||||||||
| Item 9C. | ||||||||
| PART III | ||||||||
| Item 10. | ||||||||
| Item 11. | ||||||||
| Item 12. | ||||||||
| Item 13. | ||||||||
| Item 14. | ||||||||
| PART IV | ||||||||
| Item 15. | ||||||||
| Item 16. | ||||||||
Unless the context requires otherwise, the words “New Relic,” “we,” “Company,” “us,” and “our” refer to New Relic, Inc. and our subsidiaries. “New Relic,” the New Relic logo, and other trademarks or service marks of New Relic that may appear in this Annual Report on Form 10-K are our property. This Annual Report on Form 10-K contains additional trade names, trademarks, and service marks of other companies. We do not intend our use or display of other companies’ trade names, trademarks, or service marks to imply a relationship with, or endorsement or sponsorship of us by, these other companies, and all such third-party trade names, trademarks and service marks are the property of their respective owners.
1
SPECIAL NOTE REGARDING FORWARD-LOOKING STATEMENTS
This Annual Report on Form 10-K contains forward-looking statements within the meaning of the federal securities laws, which statements involve substantial risks and uncertainties. Forward-looking statements generally relate to future events or our future financial or operating performance. In some cases, you can identify forward-looking statements because they contain words such as “may,” “will,” “should,” “would,” “shall,” “might,” “expects,” “plans,” “anticipates,” “could,” “intends,” “target,” “projects,” “contemplates,” “believes,” “estimates,” “predicts,” “potential,” or “continue” or the negative of these words or other similar terms or expressions that concern our expectations, strategy, plans, or intentions. Forward-looking statements contained in this Annual Report on Form 10-K include, but are not limited to, statements about:
•the impact of natural disasters and actual or threatened public health emergencies, such as the COVID-19 pandemic;
•our future financial performance, including our revenue, cost of revenue, gross profit, gross margin, operating expenses, ability to generate positive cash flow, and ability to achieve and maintain GAAP (as defined below) and non-GAAP profitability;
•our key operating metrics;
•use and limitations of non-GAAP financial measures;
•the sufficiency of our cash and cash equivalents to meet our working capital, capital expenditure, and liquidity needs;
•our ability to attract and retain customers to use our products, to optimize the pricing for our products, to expand our sales to our customers, and to convince our existing customers to remain on our platform and increase their spend with us;
•our product and pricing strategies and their anticipated impacts on our business and results of operations;
•our growth strategy, including increasing usage within our installed base, addition of new customers, penetration of international markets, and expansion of our platform and capabilities;
•the evolution of technologies affecting our products and markets;
•our ability to innovate and provide a superior user experience and our intentions and strategy with respect thereto;
•our ability to successfully expand in our existing markets and into new markets, including international markets;
•the attraction and retention of key personnel;
•our ability to effectively manage our growth and future expenses;
•our ability to maintain, protect, and enhance our intellectual property rights;
•worldwide economic conditions and their impact on spending; and
•our ability to comply with modified or new laws and regulations applying to our business, including privacy and data security regulations.
We caution you that the foregoing list does not contain all of the forward-looking statements made in this Annual Report on Form 10-K.
You should not rely upon forward-looking statements as predictions of future events. We have based the forward-looking statements contained in this Annual Report on Form 10-K primarily on our current expectations and projections about future events and trends that we believe may affect our business, financial condition, operating results, and prospects. The outcome of the events described in these forward-looking statements is subject to risks, uncertainties, and other factors described in the section titled “Risk Factors” and “Management’s Discussion and Analysis of Financial Condition and Results of Operations” and elsewhere in this Annual Report on Form 10-K. Moreover, we operate in a very competitive and rapidly changing environment. New risks and uncertainties emerge from time to time, and it is not possible for us to predict all risks and uncertainties that could have an impact on the forward-looking statements contained in this Annual Report on Form 10-K. We cannot assure you that the results, events, and circumstances reflected in the forward-looking statements will be achieved or occur, and actual results, events, or circumstances could differ materially from those described in the forward-looking statements.
The forward-looking statements made in this Annual Report on Form 10-K relate only to events as of the date on which the statements are made. We undertake no obligation to update any forward-looking statements made in this Annual Report on Form 10-K to reflect events or circumstances after the date of this Annual Report on Form 10-K or to reflect new information or the occurrence of unanticipated events, except as required by law. We may not actually achieve the plans, intentions, or expectations disclosed in our forward-looking statements and you should not place undue reliance on our forward-looking statements. Our forward-looking statements do not reflect the potential impact of any future acquisitions, mergers, dispositions, joint ventures, or investments we may make.
2
SELECTED RISKS AFFECTING OUR BUSINESS
Investing in our common stock involves a high degree of risk because we are subject to numerous risks and uncertainties that could negatively impact our business, financial condition and results of operations, as more fully described below. These risks and uncertainties include, but are not limited to, the following:
•We have limited experience with respect to determining the optimal prices and pricing strategies for our products.
•The ongoing global coronavirus (“COVID-19”) pandemic could harm our business and results of operations.
•We have a history of losses and our revenue growth rate could continue to decline over time, and as our costs increase, we may not be able to generate sufficient revenue to achieve and sustain profitability.
•We have a limited operating history with our current business model, which makes it difficult to evaluate our current business and future prospects and increases the risk of your investment.
•If we are not able to manage our growth and expansion, or if our business does not grow as we expect, our operating results may suffer.
•Our business depends on our customers remaining on our platform and increasing their spend with us.
•If we are not able to develop enhancements to our products, increase adoption and usage of our products, and introduce new products that achieve market acceptance, our business could be harmed.
•If customers do not expand their use of our products beyond the current predominant use cases, our ability to grow our business and operating results may be adversely affected.
•Our quarterly results may fluctuate, and if we fail to meet the expectations of analysts or investors, our stock price and the value of your investment could decline substantially.
•If we fail to adapt and respond effectively to rapidly changing technology, evolving industry standards, and changing customer needs, requirements, or preferences, our products may become less competitive.
•The markets in which we participate are intensely competitive, and if we do not compete effectively, our operating results could be harmed.
•Interruptions or performance problems associated with our technology and infrastructure may adversely affect our business and operating results.
•Our ongoing and planned expenditures on cloud hosting providers and expenditures on transitioning our services and customers from our data center hosting facilities to public cloud providers are expensive and complex, may result in a negative impact on our cash flows, and may negatively impact our financial results.
•Any failure to protect our intellectual property rights could impair our ability to protect our proprietary technology and our brand.
•Our reliance upon open source software could negatively affect our ability to sell our products and subject us to possible litigation.
•If we lose key members of our management team or are unable to attract and retain executives and employees we need to support our operations and growth, our business may be harmed.
•If we cannot continue to maintain and develop our corporate culture as we grow, we could lose the innovation, teamwork, passion, and focus on execution that we believe contribute to our success.
•Changes in privacy and security laws, regulations, and standards may cause our business to suffer.
•We have incurred substantial indebtedness that may decrease our business flexibility, access to capital, and/or increase our borrowing costs.
•Because our long-term growth strategy involves further expansion of our sales to customers outside the United States, our business will be susceptible to risks associated with international operations.
•We are subject to governmental export and import controls that could impair our ability to compete in international markets or subject us to liability if we violate these controls.
3
PART I
Item 1. Business
Overview
New Relic delivers a software platform for customers to land all of their telemetry data quickly and affordably in one place and derive actionable insights from that data in a unified front-end application. This category of software products is generally referred to as observability. Our customers use the New Relic platform to observe and operate the components of their digital infrastructure and provide a quality digital experience for their customers. With a unified front end, purpose built on top of the world’s most powerful telemetry data platform, the New Relic platform helps our users get a comprehensive and consistent view of their digital estate.
The New Relic platform is designed for all engineers, which fuels our growth strategy that is oriented towards the broader developer productivity market. At present, most observability software is targeted at a small subset of the developer community that works in the “operate” phase of the developer lifecycle. These engineers are primarily concerned with the availability of the applications and infrastructure that are the primary components of a customer’s digital environment. However, a key component of our multi-year strategy is to help all software developers realize the largely dormant value of telemetry data. We fundamentally believe that insights gained from telemetry data are valuable in all of the phases of the developer lifecycle: plan, build, deploy, and operate.
To grow within the market, we employ a land-and-expand business model centered on growing our partnership with our customers as they realize incremental value from the New Relic platform. We drive product awareness, demand, adoption, and activation through self-service, product-led growth strategies. Once activated, customers may increase their consumption of the New Relic platform as they add more data, users, and use cases. For customers with enterprise scale deployment, we deploy sales-led growth strategies to nurture and ensure long-term customer success for larger customers.
We believe our platform is positioned as the only true observability platform, which is grounded in three strategic technological pillars:
1.We serve all engineers: The New Relic platform is used not just by IT operations professionals but by a wide variety of engineers, including application developers, mobile developers, site reliability engineers (“SRE”), network engineers, and more. Our mission is to democratize observability and make observability a daily practice for all engineers at every stage of the software lifecycle, and the goal of our strategic product roadmap is to deliver products that support this mission at a sustained pace.
2.We support the entire software lifecycle: Our platform’s usage is not limited to troubleshooting applications in production environments. Engineers use the New Relic platform across production and pre-production environments to plan, build, and test software before it goes into production. Our ability to ship features and capabilities for the entire software lifecycle increases our platform’s engagement and separates our solutions from other tools that are focused solely on production troubleshooting.
3.We deliver observability as a cohesive platform experience: We view the New Relic platform as a true observability platform and not a bundle of SKUs with disjointed experiences and disparate pricing models stitched into a user interface. The platform has the flexibility to ingest telemetry from any source and modality (metrics, events, logs, and traces) into a unified Telemetry Data Platform. Engineers act on the collected telemetry via a unified and AI-enabled user interface which converges all observability workflows into one cohesive experience.
These three strategic pillars are reinforced by our consumption-based pricing model which we introduced in 2020. We found pre-existing pricing models to have the unintended effect of limiting instrumentation and, ultimately, customer visibility into their system performance. With our consumption-based pricing model and simplified platform offering, we believe we have removed those barriers.
To accelerate engagement, adoption, and consumption of our platform, we price based on consumption as measured by the number of provisioned users and the amount of data ingested into our system. We offer three paid plans—Standard, Pro and Enterprise—designed to meet the needs of our customers of all sizes and maturity levels. We also offer a perpetual free tier of the New Relic platform. As a result, our direct sales prospects are often familiar with our platform and may already be using it in a limited fashion. A core component of our growth strategy is to provide a friction-free environment for developers to
4
familiarize themselves with our solutions, and then offer incremental opportunities to derive more value from our products either by in-product support, or engaging with our technically oriented customer adoption team.
By removing data silos and standardizing on a single observability platform, customers across the globe can more easily understand end-to-end system health and are better able to achieve business imperatives of speed of innovation, operational excellence, system reliability, and cost management. We believe our consumption-based pricing has changed the fundamental unit economics of the industry, and with it the nature of the relationship between us as the vendor and our customers. With consumption-based pricing, our success is directly tied to the value our products deliver to our customers. We believe that as we continue to build and deliver compelling experiences that help customers solve their daily problems, we will continue to attract new customers and our customers will increase the amount of data they send to us, as well as the number of users they have on our platform.
Our customers span the continuum from startups to some of the world’s largest corporations; the common thread among all of the users of our products is a desire to offer their constituents a top-tier digital experience. We engage with prospects and customers directly through our field, inside sales teams and on our website, as well as indirectly through channel partners. The majority of our customers are on either “Pay as You Go” contracts where they are charged for usage in arrears, or commitment contracts where they commit to a minimum spend over their contracted period in exchange for a discount on their usage pricing. The majority of our commitment contracts are one year in duration and are invoiced upfront. When a customer’s data ingest or number of provisioned users exceeds their aggregate commitment, they are invoiced for incremental charges when their consumption exceeds their commitment at the rate they negotiated in the commitment. When we enter into multi-year commitment contracts, we typically invoice the customer on an annual basis.
We also generate revenue from services, which consist primarily of fees associated with consulting and training services. Revenue from services accounts for a de minimis amount of our total revenue. We expect to continue to invest in our product and go-to-market organizations as we believe both the self-serve nature of our products and the customer-specific attention from our technologists play an important role in accelerating our customers’ realization of the benefits of our platform, which helps drive customer retention and expansion.
Key Benefits to Our Customers
The New Relic platform provides the following key benefits:
•Fuel innovation and growth. We empower engineers with data and visibility to support faster software delivery and more experimentation to increase customer satisfaction, revenue, and market share. Powered by the insights and visibility of the New Relic platform, our customers can reduce time to market by building and deploying software faster, improving development efficiency and improving alignment and collaboration across business and technical teams.
•Deliver exceptional customer experience. We enable engineers and organizations to deliver digital customer experiences that drive engagement, conversion, and brand affinity. With the New Relic platform, our customers can view what their own customers are actually experiencing on their digital platforms to avoid churn, lost revenue, and reputational harm.
•Improve system performance. We help engineers proactively identify and resolve issues before they impact customers. With the New Relic platform, our customers have a common platform to adopt and implement DevOps and SRE principles so they can improve incident resolution times, reduce the number of customer-reported incidents, and reduce downtime of the systems they manage.
•Drive operational efficiency. The New Relic platform helps engineering teams build for scale to realize the benefits of cloud investments and optimize resource consumption. Engineering teams leverage observability to improve the pace of cloud adoption, digital transformation, budget predictability, and overall employee productivity.
Our Platform and Key Strengths
With the launch of the New Relic platform, we built upon the foundation of our application performance monitoring (“APM”) offering to deliver what we view as a true observability platform where enterprises large and small can unify all telemetry and observability workflows in a single platform. The motivation for this evolution was to align our roadmap and consumption-based business model to address the needs of our customers. Our vision is to empower all engineers at every phase of the software lifecycle to leverage the power of data-driven engineering, and the New Relic platform is designed to address a multitude of existing and emerging customer use cases:
5
1.Scalable data platform. Sitting at the core of the New Relic platform is our secure, hyper-scalable, cloud-based data platform which serves as the single source of truth for all operational data, providing users with the ability to ask and answer questions within milliseconds. Customers have the flexibility to rapidly ingest all telemetry data (metrics, events, logs, and traces) at scale from any source, and analyze it all in one place. Once ingested, customers can query that data in milliseconds, build, customize and share dashboards, and create alerts based on signals that matter the most.
2.Full-stack monitoring verticals. With all of a customer’s telemetry in one place, the New Relic platform provides end-to-end observability in one curated, connected platform to help users make sense of their data and take action on it. The New Relic platform connects and correlates data from across the full stack—from client-side, to the application, to the underlying infrastructure and network, all with logs and distributed traces in context—so users can analyze, debug, and troubleshoot their full stack in just a few clicks. We continue to launch new vertical monitoring experiences to address new use cases and personas. In fiscal 2022, we launched the following new platform verticals:
◦Pixie, which enhances our Kubernetes Monitoring solution and helps developers debug Kubernetes environments faster;
◦Network Performance Monitoring, which helps DevOps teams to better align with network engineers; and
◦Model Performance Monitoring, which allows data scientists to optimize machine learning models.
With the New Relic platform, customers no longer have to juggle siloed tools with varying and often confusing pricing metrics that have led to selective instrumentation, tool sprawl, and disconnected silos of critical operational data. Our unified, full-stack monitoring UIs give engineers the curated context they need to solve problems across their entire estate—all in one place.
3.Cross-platform observability experiences. Building on our massive and scalable data backend, we are able to solve new use cases for our customers beyond the problems that traditional monitoring solutions address. We have integrated AI and machine learning across the entire platform for AI-assisted incident response. Errors Inbox brings together error data from across the full stack so developers can detect, triage, and resolve errors faster, with persistent context. We are solving exciting new use cases for software developers in pre-production environments where solutions such as New Relic CodeStream and our partnerships with CI/CD vendors are helping developers leverage production telemetry to improve code builds and deploys.
The key strengths of the New Relic platform are:
•End-to-End Observability. All telemetry data, regardless of its source (whether from proprietary or open source agents, APIs, or exporters) is aggregated in one place and available to query, alert, visualize, and navigate, with meaningful analytics powered by comprehensive AI and machine-learning capabilities.
•Faster, Simpler Incident Response. With our AI-assisted incident response, customers can detect issues proactively, reduce alert noise, identify root causes, and take action using two-way integration with widely used incident management systems.
•Cloud Migration and Adoption. Through the strength of our platform and our strategic partnerships, we help engineers minimize cloud migration risk while accelerating migration timelines so they can observe systems, measure efficacy, and optimize costs before, during, and after a migration.
•Dynamic and On-Demand Scalability. Our multi-tenant SaaS platform scales dynamically and on-demand to some of the largest environments without penalty or pre-reservation requirements. This means our customers can meet the demands of their peak business days with confidence. This dynamic scalability is available at a straightforward and predictable cost, regardless of the architecture or environment, and without punitive pricing for data granularity.
•Spend Predictability, Transparency, and Flexibility. Our platform’s simplified consumption-based pricing model incentivizes users to instrument more of their services, applications, and hosts—and thereby get more value out of their observability platform—while also eliminating unforeseen fees and unpredictable overages. Customers now pay for the New Relic platform based on their actual consumption of the platform, not unlike how they pay for their cloud providers, and are able to obtain higher degrees of transparency, flexibility, and control.
•Observability for All. Our mission is to democratize observability by making it a daily practice for all engineers. At the core of our philosophy is an obsession to help teams get past “what” happened and dig deeper to understand "why" their software and systems are behaving as they are. This is increasingly important given the complexity introduced by today’s modern architectures, multi-cloud environments, and distributed teams.
6
•Rapid Time to Value. We make it easy for all engineers to get started quickly with observability best practices. In fiscal 2022, we launched New Relic Instant Observability (New Relic I/O), an open source ecosystem of quickstarts that deliver pre-built integrations, dashboards, and alerts for over 450 technologies and frameworks. With New Relic I/O, engineers don’t need to spend hours manually setting up observability across the stack and can start getting insights in a single click.
•Open Source Commitment. New Relic is making it easier for everyone to instrument everything through our commitment to open standards, open source instrumentation, and the open communities that support them. We have standardized on OpenTelemetry for all collections and most of our agents are open source. We have joined the governing board of the Cloud Native Computing Foundation and contributed Pixie, a Kubernetes-native in-cluster observability platform, as an open source project. We are also a founding member of Eclipse Adoptium, a leading provider of Java runtimes.
•Market Leadership. Innovation and disruption is in our DNA. We continue to disrupt the industry with our visionary approach to observability. We have been named a leader in the Gartner APM Magic Quadrant for nine consecutive years and in October 2020, we tied for the #1 rating in the Gartner Peer Insights APM “Voice of the Customer.”
•Platform Extensibility. In addition to the UIs and workflows provided natively in the New Relic platform, customers can use the data they ingest into the platform to build custom applications that drive measurable value specific to their business. The New Relic platform supports custom app development via common open source frameworks, a library of existing applications, and a rich development environment.
•Enterprise-grade Security. We have developed robust security processes to help protect the confidentiality, integrity, and availability of customer data so that users can control how their data is stored and used. We undergo annual audits by third-party services, our platform is HIPAA and SOC2 compliant, and we have achieved FedRAMP authorization at a moderate impact level.
Our Growth Strategies
We grow using a “land-and-expand” business model with two primary distribution channels, self-serve and sales-led growth. For customers from whom we generate trailing 12-month revenue below a certain threshold, self-serve tactics allow these customers to adopt platform features via marketing and product-driven sales. As a customer starts to exceed that threshold in trailing 12-month revenue, we typically transition the customer to a more traditional direct sales model, or sales-led growth.
We intend to pursue the following growth initiatives:
•Acquire new customers via self-serve initiatives: We believe we have the most competitive product in the industry. We intend to democratize access to it and drive significant awareness, adoption, and growth in new accounts by accelerating our self-service product marketing and sales efforts.
•Expand consumption within our installed base: Our existing customer base across industry verticals and regions represents a sizable captive market to increase users and data by promoting increased platform engagement and addressing new use cases.
•Accelerate platform roadmap and ship innovation at high velocity: We have a proven track record of pioneering innovations in our industry. We intend to build on that reputation and accelerate our roadmap to broaden the platform capabilities and deepen its features so that more engineers can use New Relic and use it more often.
•Expand our customer base globally through an increasing emphasis on alliances: Commercial partner alliances and expansion in international markets presents a significant opportunity to acquire new customers. We intend to increase our investment on both fronts as more businesses across the world accelerate their cloud native journey.
Operations
We host our applications and serve all our customers from data centers and a combination of cloud hosting providers. We utilize third parties to manage the infrastructure at our data centers. In addition, we are continuing to build out services and functionality in the public cloud with a view to migrating our entire platform to the public cloud over time. This strategy provides us flexibility to service customers in new and emerging regions and scale our deployment capabilities. We maintain a formal and comprehensive security program designed to ensure the security and integrity of our data, protect against security threats or data breaches, and prevent unauthorized access to the data of our customers. Our technology uses multi-tenant architecture, enabling all our customers to share the same version of our products and platform capabilities while securely partitioning their data.
7
Human Capital Management
As of March 31, 2022, we had a total of 2,217 employees, including temporary employees, operating across 15 countries, including 637 employees located outside of the U.S. None of our U.S. employees are represented by a labor union with respect to their employment. Employees in certain of our non-U.S. subsidiaries have the benefits of collective bargaining arrangements at the national level. We consider our relations with our employees to be good and have not experienced interruptions of operations or work stoppages due to labor disagreements.
Culture and Engagement
Our “accountable, bold, authentic, passionate, and connected” core values inform and guide our human capital initiatives and objectives. We screen new hires and measure employee performance against these company values, and regularly measure employee engagement against these values through our surveys and all-hands meetings and AMA (“ask me anything”) sessions. We also use these surveys, meetings, and sessions to collect employee feedback and assess the effectiveness of our culture, our strategy, and various health and well-being programs. We believe our values-driven culture has contributed to our recognition as a great place to work by our employees.
Diversity and Inclusion
We strive to build a diverse workforce, promote equity in our practices, and create inclusive communities for all our employees to thrive. Internally, we offer training for employees around unconscious bias, and other diversity and inclusion-related topics designed to create a culture of belonging. In addition, our Diversity, Equity & Inclusion team works closely with division leaders to review current diversity and inclusion data, identify themes, and create action plans with measurable objectives and key results for their divisions, with the goal of increasing diversity and growing every employee’s sense of belonging.
We work hard to maintain and enhance our diverse and inclusive environment, creating a workplace where people are highly valued and are empowered to do their best work. Our employee resource groups offer our employees support, mentoring, and networking opportunities and help to foster a friendly and diverse workplace.
Compensation and Benefits
New Relic is committed to delivering a comprehensive compensation and benefits program that provides support for all of our employees’ well-being. We provide competitive compensation and benefits to attract and retain talented employees, including offering market-competitive salary, bonuses or sales commissions, and equity. We generally offer full-time employees equity at the time of hire and through annual equity grants, as well as provide an employee stock purchase plan, to foster a strong sense of ownership and engage our employees in being committed to our long-term success. We ensure that our compensation is fair for all employees, regardless of classifications, such as race and gender. We routinely run a rigorous statistical analysis to ensure compensation is fair, taking into account factors that should impact pay, like role, level, location and performance.
Our full-time employees are eligible to receive, subject to the satisfaction of certain eligibility requirements, our comprehensive benefits package including our medical, dental, and vision insurance and life and disability insurance plans. In addition, we provide flexible time off, as well as maintain a tax-qualified 401(k) retirement plan that provides eligible U.S employees with an opportunity to save for retirement on a tax-advantaged basis, including providing a match for employee contributions. In structuring these benefit plans, we seek to provide an aggregate level of benefits that are comparable to those provided by similar companies. While the philosophy around our benefits is the same worldwide, specific benefits vary regionally due to local regulations and preferences.
Training and Development
Ensuring our employees have access to development opportunities and understand how to grow their career at New Relic is a critical part of our talent and engagement practices. As part of our efforts, we invest in a robust training portal for employees, complete with online courses and live training on a variety of topics. To recognize and promote outstanding employees, we perform a comprehensive annual talent review process, through which we empower employees to drive their professional development in a way that also aligns with company objectives and our company values.
COVID-19 Response
To support employee well-being, New Relic established a number of programs in response to the COVID-19 pandemic and the transition to a hybrid model where we allow employees an option to work from home full-time. Our top priority has been to ensure our employees have the resources they need to care for themselves and their families. We created
8
flexible work schedule options, gave employees a home office stipend, and implemented for a period of time an unlimited time off code for caregiving or mental health responsibilities, provided additional mental health benefits, hosted learning events such as “Building Resilience” and “Parenting During COVID,” in addition to other various employee-led events such as meditations, workouts, experience sharing, and virtual performances.
Research and Development
Our research and development organization is responsible for the design, development, and testing of all aspects of the New Relic suite of products and platform capabilities. We invest heavily in these efforts to continuously improve, innovate, and add new features to our solutions.
We deploy new features, functionality, and technologies through daily and weekly software releases or updates in order to minimize disruption and provide for constant improvement. Our product managers regularly engage with customers, partners, and industry analysts, as well as other stakeholders, in functions such as sales, customer success, marketing, and business development to understand customer needs as well as general trends in our industry. Once product improvements are identified, the development organization works closely together to design, develop, test, and launch a solution.
As of March 31, 2022, we had 773 employees in our research and development organization.
Sales and Marketing
Our sales and marketing organizations work together closely to drive market awareness, create and manage user and customer leads, provide qualified leads to our sales pipeline, and build customer relationships to drive revenue growth. As of March 31, 2022, we had 860 employees in our sales and marketing organization.
Sales
Under our “land-and-expand” business model, our sales strategy is to rely on two primary distribution channels, self-serve and sales-led growth. For customers from whom we generate trailing 12-month revenue below a certain threshold, self-serve tactics allow these customers to adopt platform features via marketing and product-driven sales. As a customer starts to exceed that threshold in trailing 12-month revenue, we typically transition the customer to a more traditional direct sales model, or sales-led growth, under which our direct sales organization engages with our larger accounts. Our direct sales organization is organized by geography and size of customer and is focused on growing the number of accounts and usage within accounts (i.e., providing our customers with a broader set of our product solutions).
Marketing
Our marketing strategy focuses on meaningful interactions with practitioners and buyers by targeting software developers, operations professionals, IT leaders, and technology executives across many industries and regions. Additionally, our digital engagement strategy, demand generation, customer programs, events, corporate communications, and product marketing teams focus on building brand, engagement, and demand with our target markets. We utilize both online and offline marketing initiatives, including search engine and email marketing, online banner and video advertising, our website, product demonstrations and trials, blogs, corporate communications, whitepapers, case studies, user events, sponsorships, and webinars. We believe an effective method to market our platform is for users to actively use and explore its capabilities. We encourage free trials of one or more of our products in order to successfully convert those accounts to paid subscriptions.
Seasonality
We have experienced seasonality in our sales and operating results in the past, and will continue to experience seasonality in the future. Historically, we have received a higher volume of orders in the fourth fiscal quarter of each year, and to a lesser extent our third fiscal quarter of each year. As a result, we have historically seen higher cash collections in the first and fourth fiscal quarters of each year, and our sequential growth in remaining performance obligations has historically been highest in the fourth fiscal quarter of each year, and to a lesser extent our third fiscal quarter of each year. With our shift to a consumption based pricing model, we expect over time that our revenue will more closely approximate our customer usage of our products and services, and thereby our revenue may experience seasonal fluctuations based upon our customer consumption patterns.
Customer Support
Our products and platform capabilities are designed to minimize the need for customer support, as users can easily download, install, and deploy agents and other technology to ingest data into our platform without needing support. We offer a range of customer support options with multiple levels of support. These include free community support, email support, and
9
phone support, up to our customer support organization, which provides dedicated customer success representatives, onsite support, with global capabilities and is available at all hours of the day. Through our training platform, we offer courses to help our customers quickly learn how to effectively use our products as well as implement best practices. Courses are available online, in-person at events, and, as requested by certain customers, on-site. Our training sessions are typically targeted at specific levels of employee seniority and product experience, such as agent essentials or administrator experts, to more effectively tailor training to intended audiences.
Partnerships and Strategic Relationships
We have built marketing relationships with a number of technology companies to help promote and grow our user base and footprint. We also have developed relationships with several cloud providers including Amazon Web Services, Google Cloud Platform, Microsoft Azure, IBM Cloud, Pivotal Cloud Foundry, and others, through which we collaborate to ensure our products and platform capabilities work well on applications running on their clouds. These providers offer access to our products and platform capabilities through links on their websites, refer developers and other potential users to us, and expand our marketing reach. Additionally, a growing number of system integrators, consultants, and value-added resellers are using the New Relic platform to help their customers make the resourcing and prioritization decisions necessary for successful cloud migrations and transformation projects.
Competition
We operate in a highly competitive industry that is characterized by constant change and innovation. Our unified observability platform combines functionality from numerous traditional product categories, and hence we compete in each of these categories with home-grown and open-source technologies, as well as a number of different commercial vendors.
With respect to application performance monitoring, we compete with providers such as Cisco Systems, Inc. and Dynatrace, Inc. With respect to log management, we compete with Elastic NV and Splunk Inc. With respect to infrastructure monitoring, we compete with diversified technology vendors such as International Business Machines Corporation, BMC Software, Inc. and CA, Inc. (a subsidiary of Broadcom, Inc.); with native solutions from cloud providers such as Amazon Web Services, Inc., Microsoft Corporation, and Google LLC; and with independent vendors such as Datadog, Inc.
The principal competitive factors in our market include:
•product and platform features, architecture, reliability, security, performance, effectiveness, and supported environments;
•product extensibility and ability to integrate with other technology infrastructures;
•digital operations expertise;
•ease of use of products and platform capabilities;
•price and total cost of ownership;
•adherence to industry standards and certifications;
•strength of sales and marketing efforts;
•brand awareness and reputation; and
•focus on customer success.
We believe we generally compete favorably with our competitors on the basis of these factors. Many of our competitors have substantially greater financial, technical, and other resources, greater name recognition, larger sales and marketing budgets, broader distribution, and larger and more mature intellectual property portfolios.
Intellectual Property
We rely on federal, state, common law, and international rights, as well as contractual restrictions, to protect our intellectual property. We control access to our proprietary technology and algorithms by entering into confidentiality and invention assignment agreements with our employees and contractors, and confidentiality agreements with third parties.
In addition to these contractual arrangements, we also rely on a combination of trade secrets, copyrights, trademarks, service marks, and domain names to protect our intellectual property. As of March 31, 2022, we had 40 issued patents in the United States and abroad, and 35 patent applications pending in the United States and abroad. We are also the registered holder
10
of a variety of United States and international domain names that include the term New Relic. Our products utilize our “New Relic” trademark as well as our logo and images.
Circumstances outside our control could pose a threat to our intellectual property rights. For example, effective intellectual property protection may not be available in the United States or other countries in which we operate. Also, the efforts we have taken to protect our proprietary rights may not be sufficient or effective. Any significant impairment of our intellectual property rights could harm our business or our ability to compete. Also, protecting our intellectual property rights is costly and time-consuming. Any unauthorized disclosure or use of our intellectual property could make it more expensive to do business and harm our operating results.
Companies in Internet-related industries may own large numbers of patents, copyrights, and trademarks and may frequently request license agreements, threaten litigation, or file suit against us based on allegations of infringement or other violations of intellectual property rights. We have been subject to, and expect to face in the future, allegations that we have infringed the trademarks, copyrights, patents, and other intellectual property rights of third parties, including our competitors and non-practicing entities. As we face increasing competition and as our business grows, we will likely face more claims of infringement.
Government Regulation
Our worldwide business activities are subject to various laws, rules, and regulations of the United States as well as of foreign governments. Compliance with these laws, rules, and regulations has not had, and is not expected to have, a material effect upon our capital expenditures, results of operations, or competitive position. Nevertheless, compliance with existing or future governmental regulations, including, but not limited to, those pertaining to global trade, business acquisitions, consumer and data protection, and taxes, could have a material impact on our business in subsequent periods. Refer to “Item 1A. Risk Factors” for a discussion of these potential impacts.
Corporate Information
We were formed in Delaware in September 2007 as New Relic Software, LLC. We converted from a Delaware limited liability company to a Delaware corporation and changed our name to New Relic, Inc. in February 2008. Our principal executive offices are located at 188 Spear Street, Suite 1000, San Francisco, California 94105, and our telephone number is (650) 777-7600. Our website is located at www.newrelic.com, and our investor relations website is located at http://ir.newrelic.com/. Information contained on, or that can be accessed through, our website is not incorporated by reference into this Annual Report on Form 10-K and references to our website address in this Annual Report on Form 10-K are intended to be inactive textual references only. We completed our initial public offering in December 2014 and our common stock is listed on the New York Stock Exchange under the symbol “NEWR.”
Available Information
Copies of our Annual Reports on Form 10-K, Quarterly Reports on Form 10-Q, Current Reports on Form 8-K, and amendments to these reports filed or furnished pursuant to Section 13(a) or 15(d) of the Securities Exchange Act of 1934, as amended, or the Exchange Act, are available, free of charge, on our investor relations website as soon as reasonably practicable after we file such material electronically with or furnish it to the Securities and Exchange Commission, or the SEC. The SEC also maintains a website that contains our SEC filings. The address of the site is www.sec.gov. We webcast our earnings calls and certain events we participate in or host with members of the investment community on our investor relations website. Additionally, we provide notifications of news or announcements regarding our financial performance, including SEC filings, investor events, press and earnings releases, and blogs as part of our investor relations website. New Relic has used, and intends to continue to use, our investor relations website, as well as our Twitter account (@newrelic), as means of disclosing material non-public information and for complying with its disclosure obligations under Regulation FD. Further corporate governance information, including our corporate governance guidelines, board committee charters, and code of conduct, is also available on our investor relations website under the subheading “Corporate Governance.” The contents of our website or our Twitter account are not incorporated by reference into this Annual Report on Form 10-K or in any other report or document we file with the SEC, and any references to our website address are intended to be inactive textual references only.
11
Item 1A. Risk Factors
We have identified the following risks and uncertainties that may have a material adverse effect on our business, financial condition, or results of operations. The risks described below are not the only ones we face. Additional risks not presently known to us or that we currently believe are immaterial may also significantly impair our business operations. Our business could be harmed by any of these risks. The trading price of our common stock could decline due to any of these risks, and you may lose all or part of your investment. In assessing these risks, you should also refer to the other information contained in this Annual Report on Form 10-K, including our consolidated financial statements and accompanying notes.
Risks Related to Our Business and Our Industry
We have limited experience with respect to determining the optimal prices and pricing structures for our products and have employed evolving pricing models, which subject us to challenges that could make it difficult for us to derive value from our customers and may adversely affect our operating results.
We have evolved our pricing models over time and we expect that they will continue to evolve. For example, in fiscal 2021, we updated our pricing strategy to calculate customer spend based upon their consumption. Customers may be charged upon their usage in arrears, which we refer to as “Pay as You Go,” or they may commit to a minimum spend over their contracted period in exchange for a discount on their usage pricing. Consumption under this model is measured by number of users and data ingested into our system, thereby collapsing what had previously been a number of different products priced in individualized ways into a simplified strategy that is intended to drive consumption across our platform.
We have seen that the pricing transition has negatively impacted our revenue and deferred revenue for certain customers at the time of their renewal. For example, some customers have decided to take advantage of our consumption pricing model and choose smaller upfront commitments in favor of spending on actual consumption in excess of committed amounts. Whether our consumption pricing model will prove successful is subject to numerous uncertainties, including but not limited to: customer demand, renewal and expansion rates, our ability to further develop and scale infrastructure, the ability of our sales force to successfully execute new sales strategies, tax and accounting implications, pricing, and our costs. In addition, the metrics we use to gauge the status and success of our consumption pricing model may continue to evolve as significant trends emerge.
We have seen indications of acceptance of our pricing model from our customers and the market in general; however, if our pricing model fails to gain continued or broader customer and market acceptance, our business and results of operations could be harmed. In addition, our evolving pricing models may allow competitors with different pricing models to attract customers unfamiliar or uncomfortable with our pricing models, which would cause us to lose business or modify our pricing models, both of which could adversely affect our revenues and operating margins.
We expect that we will continue to evolve our pricing model, including as a result of global economic conditions; reductions in our customers’ spending levels generally; the introduction of new products and services; the evolution of existing products and services; or changes in how computing infrastructure is broadly consumed. We have introduced and expect to continue to introduce variations to our pricing models and other pricing programs that provide broader usage and cost predictability for our customers. Although we may believe that these pricing changes will drive net new customers, increase customer adoption, and support our transition to a consumption-based model, it is possible that they will not and may potentially cause confusion with our customers, which could negatively impact our business, revenue, and other financial results. If we have difficulty determining the appropriate price structure for our products, we may be required from time to time to further revise our pricing structure, increase billing frequency, or reduce our prices, which could adversely affect our business.
The ongoing global coronavirus (“COVID-19”) pandemic could harm our business and results of operations.
The COVID-19 pandemic continues to impact worldwide economic activity and financial markets and has resulted in authorities implementing numerous measures to contain the virus. While the rollout of COVID-19 vaccines is ongoing, the timing and speed of vaccination rollouts and the lifting of occupancy limits and movement restrictions varies from location to location, is evolving, and to varying degrees remains unknown.
In light of the ongoing uncertainty relating to the COVID-19 pandemic, we have taken precautionary measures intended to minimize the risk of the virus to our employees, our customers, and the communities in which we operate, which could negatively impact our business. Although we have recently and may continue to selectively reopen certain of our offices and hold in-person meetings and events in compliance with applicable government orders and guidelines, the majority of our employees continue to work remotely and in-person meetings remain limited. While certain travel bans and other restrictions
12
that were implemented by federal, state, or local authorities at the beginning of the pandemic have been lifted or relaxed in recent months, due to the emergence of new variant strains, among other developments, some of these restrictions have been re-imposed, and new restrictions may be implemented. While we have a distributed workforce and our employees are accustomed to working remotely, our workforce is not normally fully remote and our employees travel frequently to establish and maintain relationships with one another and with our customers, partners and investors. In addition, our management team has, and will likely continue, to spend significant time, attention and resources monitoring the COVID-19 pandemic and seeking to minimize the risk of the virus and manage its effects on our business and workforce.
The extent of the impact of the COVID-19 pandemic on our operational and financial performance will depend on certain developments, including the duration of the pandemic and the successful rollout of vaccines and the efficacy and durability of such vaccines, especially in light of the emergence of new variant strains; impact on our customers and our sales cycles; impact on our customer, employee, and industry events; and effect on our vendors, all of which are uncertain and cannot be predicted at this time. In addition, COVID-19 may continue to disrupt the operations of our customers and partners for an indefinite period of time, including as a result of travel restrictions and/or business shutdowns, all of which could negatively impact our business and results of operations, including cash flows. Our revenue and deferred revenue have been negatively impacted, in part, by the slowdown in activity associated with the COVID-19 pandemic, but at this point, the extent of the impact to our financial condition or results of operations, including cash flows, is uncertain, particularly as the COVID-19 pandemic continues to persist for an extended period of time. Meanwhile, our shift to consumption-based pricing contracts, where the revenue we receive is tied to our customers’ actual usage of our products, may further exacerbate the uncertainty with respect to the revenue we receive from our customers. To the extent the COVID-19 pandemic adversely affects our business and financial results, it may also have the effect of heightening many of the other risks described in this ‘‘Risk Factors’’ section.
We have a history of losses and our revenue growth rate could continue to decline over time. As our costs increase, we may not be able to generate sufficient revenue to achieve and sustain profitability.
We have incurred net losses in each fiscal period since our inception, including net loss attributable to New Relic of $250.4 million, $192.6 million, and $88.9 million in the fiscal years ended March 31, 2022, 2021, and 2020, respectively. At March 31, 2022, we had an accumulated deficit of $783.3 million. We expect to continue to expend substantial financial and other resources on, among other things:
•investments in our research and development team, and the development of new platform offerings, capabilities, features, and functionality;
•expansion of our operations and infrastructure, both domestically and internationally;
•hiring of additional employees; and
•general administration, including legal, accounting, and other expenses related to our growing operations and infrastructure.
In addition, we are currently migrating our entire platform over time from third-party data center hosting facilities to public cloud hosting providers, and our costs and gross margins are significantly influenced by the prices we are able to negotiate with them, which in certain cases are also our competitors. These investments may not result in increased revenue or growth of our business. Our revenue growth rate has declined in recent periods and could continue to decline over time. Accordingly, we may not be able to generate sufficient revenue to offset our expected cost increases and to achieve and sustain profitability. If we fail to achieve and sustain profitability, our operating results and business would be harmed.
We have a limited operating history with our current business model, which makes it difficult to evaluate our current business and future prospects and increases the risk of your investment.
We were founded in 2007, launched our first commercial product in 2008, launched our New Relic platform in 2019, and introduced our updated pricing strategy in 2020. This limited operating history with our current business model limits our ability to forecast our future operating results and subjects us to a number of uncertainties, including our ability to plan for and model future growth. Our historical revenue growth should not be considered indicative of our future performance. We have encountered and will encounter risks and uncertainties frequently experienced by growing companies in rapidly changing industries, such as determining appropriate investments of our limited resources, market adoption of our existing and future products and platform capabilities, competition from other companies, acquiring and retaining customers, hiring, integrating, training and retaining skilled personnel, developing new products and platform capabilities, determining prices and pricing structures for our products and platform capabilities, unforeseen expenses, and challenges in forecasting accuracy. If our assumptions regarding these risks and uncertainties, which we use to plan our business, are incorrect or change, or if we do not address these risks successfully, our operating and financial results and our business could suffer.
13
We have experienced significant growth in prior periods and our historical growth rates may not be indicative of our future growth. If we are not able to manage our growth and expansion, or if our business does not grow as we expect, our operating results may suffer.
We have experienced significant growth in our customer adoption and have expanded and intend to continue to significantly expand our operations, including our domestic and international employee headcount. This growth has placed, and will continue to place, significant demands on our management and our operational and financial infrastructure and we may not be able to sustain revenue growth consistent with prior periods, or at all.
To manage our growth effectively, we must continue to improve our operational, financial, and management systems and controls by, among other things:
•effectively attracting, training, integrating, and retaining a large number of new employees, particularly members of our research and development teams and employees and consultants in jurisdictions outside of the United States;
•further improving our key business systems, processes, and information technology infrastructure, including our cloud services, to support our business needs;
•enhancing our information, training, and communication systems to ensure that our employees are well-coordinated and can effectively communicate with each other and our customers; and
•improving our internal control over financial reporting and disclosure controls and procedures to ensure timely and accurate reporting of our operational and financial results.
If we fail to manage our expansion, implement and transition to our new systems, implement improvements, or maintain effective internal controls and procedures, our costs and expenses may increase more than we plan and we may lose the ability to increase our customer adoption, enhance our existing solutions, develop new solutions, satisfy our customers, respond to competitive pressures, or otherwise execute our business plan. If we are unable to manage our growth, our operating results likely will be harmed.
Our business depends on our customers remaining on our platform and increasing their spend with us. Any decline in our customer expansions and renewals would harm our future operating results.
Our future success depends in part on our ability to retain and expand our platform usage with our current customers. If our customers do not remain on our platform or increase their spend with us, our revenue may decline, and our operating results may be harmed.
In addition, in order for us to maintain or improve our operating results, it is important that our customers renew their commitments or remain on our platform and increase their spend when the contract term expires. Many of our customers may start their accounts on a free tier and have no obligation to enter into a paid commitment or incur spend above the free tier. Our customers that enter into paid commitments have no obligation to renew after the expiration of the contractual term nor an obligation to remain on our platform and incur additional usage fees. Commitments are most often one year in length, and, our customers may renew for lower commitment amounts or instead use our Pay as You Go model, under which they are billed in arrears for their usage. In the past, some of our customers have elected not to renew their agreements with us, and we cannot accurately predict future net expansion rates. Moreover, certain legacy customers with annual subscriptions entered into prior to our consumption pricing model have the right to cancel their agreements prior to the termination of the subscription term. Additionally, some customers have decided and may continue to remain within the limitations of our free-tier or lower-priced offerings.
Our customer expansions and renewals may decline or fluctuate as a result of a number of factors, including: customer usage, customer satisfaction with our products and platform capabilities and customer support, our prices, including as a result of changes to our pricing strategy, the prices of competing products, mergers and acquisitions affecting our customer base, consolidation of affiliates’ multiple accounts into a single account, the effects of global economic conditions, including as a result of the COVID-19 pandemic and Russia’s invasion of Ukraine, or reductions in our customers’ spending levels generally.
If we are not able to develop enhancements to our products, increase adoption and usage of our products, and introduce new products and capabilities that achieve market acceptance, our business could be harmed.
Our ability to attract new customers and increase revenue from existing customers depends in large part on our ability to enhance and improve our existing products, increase adoption and usage of our products, and introduce new products and capabilities. The success of any enhancement or new products depends on several factors, including timely completion,
14
competitive pricing, adequate quality testing, introduction, integration with existing technologies and our platform, and market acceptance. Any products that we develop may not be introduced in a timely or cost-effective manner, may contain errors or defects, or may not achieve the broad market acceptance necessary to generate sufficient revenue. If we are unable to successfully enhance our existing products to meet customer requirements, increase adoption and usage of our products, or develop new products, our business and operating results will be harmed.
If customers do not expand their use of our products beyond the current predominant use cases, our ability to grow our business and operating results may be adversely affected.
Most of our customers currently use our products to support application performance management functions, and the majority of our revenue to date has been from our application performance management products. Our ability to grow our business depends in part on our ability to persuade current and future customers to expand their use of our software to additional use cases across our entire platform. If we fail to achieve market acceptance of our software, or if a competitor establishes a more widely adopted solution, our ability to grow our business and financial results will be adversely affected. In addition, as the amount of data stored for a given customer grows, that customer may have to limit or decrease usage in order to stay within budgeted amounts or lower their cost. If their fees grow significantly, customers may react adversely to this pricing model, particularly if they perceive that the value of our software has become eclipsed by such fees or otherwise.
Failure to effectively align our marketing and sales capabilities with our consumption pricing structure and increase sales efficiency could harm our ability to increase our customer adoption and achieve broader market acceptance of our products.
Our ability to increase our customer adoption and achieve broader market acceptance of our products will depend to a significant extent on our ability to align our marketing and sales capabilities with our consumption pricing structure and increase sales efficiency.
The effectiveness of our marketing programs has varied over time and may vary in the future due to competition, and we are continuously making adjustments to increase our emphasis on overall product experience and reorient our sales organization around customer success. All of these efforts have required and will continue to require us to invest significant resources. If we are unable to hire, develop, and retain talented sales personnel, if our sales personnel are unable to achieve desired productivity levels in a reasonable period of time or unable to successfully execute sales strategies in connection with our pricing model changes, or if our sales and marketing programs are not effective, our ability to increase our customer adoption and achieve broader market acceptance of our products could be harmed.
In particular, we may in the future need to further adjust our go-to-market cost structure and target metrics, particularly as they relate to how we structure, effect, and compensate our sales teams to become more efficient and effective at selling under the consumption-based business model. Any adjustments in compensation structure could negatively affect the productivity of our sales teams, and there is no assurance that we will be able to successfully implement the adjustments in a timely or cost-effective manner, or that we will be able to realize all or any of the expected benefits from such adjustments.
If we are unable to develop and grow a broad base of high-spend customers, many of which we expect to be large enterprise customers, while mitigating the risks associated with serving such customers, our business, financial position, and results of operations may suffer.
Our growth strategy is dependent, in large part, upon developing and growing a broad base of high-spend customers, many of which we expect to be large enterprise customers. Sales to large customers involve risks that may not be present or that are present to a lesser extent with sales to smaller entities, such as longer sales cycles, more complex customer requirements, substantial upfront sales costs, and less predictability in completing some of our sales. For example, enterprise customers may require considerable time to evaluate and test our applications and those of our competitors prior to making a purchase decision and placing an order. A number of factors influence the length and variability of our sales cycle, including the need to educate potential customers about the uses and benefits of our applications, the discretionary nature of purchasing and budget cycles, and the competitive nature of evaluation and purchasing approval processes. As a result, the length of our sales cycle, from identification of the opportunity to deal closure, may vary significantly from customer to customer, with sales to large enterprises typically taking longer to complete. Moreover, large enterprise customers often begin to deploy our products on a limited basis, but nevertheless demand extensive configuration, integration services, and pricing negotiations, which increase our upfront investment in the sales effort with no guarantee that these customers will deploy our products widely enough across their organization to justify our substantial upfront investment.
In addition, our ability to improve our sales of products to large enterprises is dependent on us continuing to attract and retain sales personnel with experience in selling to large organizations. Also, because security breaches with respect to larger, high-profile enterprises are likely to be heavily publicized, there is increased reputational risk associated with serving such
15
customers. If we are unable to continue to increase sales of our products to large enterprise customers while mitigating the risks associated with serving such customers, our business, financial position, and results of operations may suffer.
Our quarterly results may fluctuate and our recent operating results may not be a good indication of our future performance. If we fail to meet the expectations of analysts or investors, our stock price and the value of your investment could decline substantially.
Our quarterly financial results may fluctuate widely as a result of the risks and uncertainties described in this report, many of which are outside of our control. In addition, our pricing model may give rise to a number of risks reflected in risk factors titled “We have limited experience with respect to determining the optimal prices and pricing structures for our products and have employed evolving pricing models, which subject us to challenges that could make it difficult for us to derive value from our customers and may adversely affect our operating results” and “If our estimates or judgments relating to our critical accounting policies prove to be incorrect, our results of operations could be adversely affected.” If our financial results fall below the expectations of investors or any securities analysts who follow our stock, the price of our common stock could decline substantially.
We believe that quarter-to-quarter comparisons of our revenue, operating results, and cash flows may not be meaningful and should not be relied upon as an indication of future performance. If our revenue or operating results fall below the expectations of investors or securities analysts in a particular quarter, or below any guidance we may provide, the price of our common stock could decline.
Because users are able to configure our platform to collect and store confidential, personal or proprietary information, security concerns could result in additional cost and liability to us or inhibit sales of our products.
Our operations involve protection of our intellectual property, along with the storage and transmission and processing of our customers’ proprietary data, which customers might choose to have include some personally identifiable information. While we have developed systems and processes to protect the integrity, confidentiality and security of our customers’ data, our security measures or those of our third-party service providers could fail and result in unauthorized access to or disclosure, modification, misuse, loss or destruction of such data. Any security breaches, computer malware, computer hacking, cyber-attacks, ransomware, phishing attacks and other social engineering schemes, denial or degradation of service attacks, unauthorized access or use, device theft, and other types of security incidents experienced by us or our third-party services providers, could expose us to a risk of loss of confidential, personal or proprietary information, loss of business, severe reputational damage adversely affecting customer or investor confidence, regulatory investigations and orders, litigation, demands, indemnity obligations, damages for contract breach, penalties for violation of applicable laws or regulations, and significant costs for investigation, remediation and incentives offered to customers or other business partners in an effort to maintain business relationships after a breach and other liabilities.
Cyber-attacks, intrusions and other malicious Internet-based activity including by threat actors, personnel (such as through theft or misuse), computer hackers, nation-state-supported actors, foreign governments and cyber terrorists, continue to increase generally as the number, intensity and sophistication of attempted attacks and intrusions from around the world have increased. Such actors now engage and are expected to continue to engage in cyber-attacks for geopolitical reasons and in conjunction with military conflicts and defense activities. During times of war and other major conflicts, we and the third parties upon which we rely may be vulnerable to a heightened risk of these attacks, including cyber-attacks that could materially disrupt our systems and operations, supply chain, and ability to produce, sell and distribute our goods and services. Ransomware attacks are becoming increasingly prevalent and severe and can lead to significant interruptions in our operations, loss of data and income, reputational harm, and diversions of funds. Extortion payments may alleviate the negative impact of a ransomware attack, but we may be unwilling or unable to make such payments. Supply-chain attacks have increased in frequency and severity, and we cannot guarantee that third parties and infrastructure in our supply chain or our third-party partners’ supply chains have not been compromised or that they do not contain exploitable defects or bugs that could result in a breach of or disruption to our information technology systems or the information technology systems of our third-party partners with whom we work.
The costs to us to investigate and mitigate network security problems, bugs, viruses, worms, malicious software programs and security vulnerabilities could be significant, and while we have implemented security measures to protect our data security and information technology systems, our efforts to address these problems may not be successful, and these problems could result in unexpected interruptions, delays, cessation of service, negative publicity and other harm to our business and our competitive position. If our products or security measures are perceived as weak or actually compromised as a result of third-party action, employee or customer error, malfeasance, stolen or fraudulently obtained log-in credentials, or otherwise, our customers may curtail or stop using our products, our reputation could be damaged, our business may be harmed, and we could incur significant liability. We may be unable to anticipate or prevent techniques used to obtain unauthorized
16
access or to sabotage systems because they change frequently and generally are not detected until after an incident has occurred. As we increase our customer adoption and our brand becomes more widely known and recognized, we may become more of a target for third parties seeking to compromise our security systems or gain unauthorized access to our customers’ data. Additionally, with so many of our employees now working remotely due to the COVID-19 pandemic, we may face an increased risk of attempted security breaches and incidents. Moreover, if a high-profile security breach occurs with respect to another cloud platform provider, our customers and potential customers may lose trust in the security of cloud platforms generally, which could adversely impact our ability to retain existing customers or attract new ones. Additionally, future acquisitions could also expose us to additional cybersecurity risks and vulnerabilities from any newly acquired information technology infrastructure.
If we are not able to detect and indicate activity on our platform that might be nefarious in nature or design processes or systems to reduce the impact of similar activity at a third-party service provider, our customers could suffer harm. In such cases, we could face exposure to legal claims, particularly if the customer suffered actual harm. We cannot assure you that any limitations of liability provisions in our contracts for a security lapse or breach would be enforceable or adequate or would otherwise protect us from any liabilities or damages with respect to any particular claim. We also cannot be sure that our existing insurance coverage will continue to be available on acceptable terms or will be available in sufficient amounts to cover one or more large claims related to a security breach, or that the insurer will not deny coverage as to any future claim. The successful assertion of one or more large claims against us that exceed available insurance coverage, or the occurrence of changes in our insurance policies, including premium increases or the imposition of large deductible or co-insurance requirements, could have a material adverse effect on our business, including our expansion rates, financial condition, operating results, and reputation.
If we fail to adapt and respond effectively to rapidly changing technology, evolving industry standards, and changing customer needs, requirements, or preferences, our products may become less competitive.
The software industry is subject to rapid technological change, evolving industry standards and practices, and changing customer needs, requirements, and preferences. The success of our business will depend, in part, on our ability to adapt and respond effectively to these changes on a timely basis. If we are unable to develop and sell new products that satisfy our customers and provide enhancements and new features for our existing products and platform capabilities that keep pace with rapid technological and industry change, our revenue and operating results could be adversely affected. Further, the value of our platform to customers increases to the extent they are able to use it for all of their telemetry data. We need to continue to invest in technologies, services, and partnerships that increase the ease with which customers can ingest data into our platform. If new technologies emerge that are able to deliver competitive products and applications at lower prices, more efficiently, more conveniently, or more securely, such technologies could adversely impact our ability to compete.
Our platform must also integrate with a variety of network, hardware, mobile, and software platforms and technologies, and we need to continuously modify and enhance our products and platform capabilities to adapt to changes and innovation in these technologies. If developers widely adopt new software platforms, we would have to develop new versions of our products and platform capabilities to work with those new platforms. This development effort may require significant engineering, marketing, and sales resources, all of which would affect our business and operating results. Any failure of our products and platform capabilities to operate effectively with future infrastructure platforms and technologies could reduce the demand for our products. If we are unable to respond to these changes in a cost-effective manner, our products may become less marketable and less competitive or obsolete, and our operating results may be negatively affected. Similarly, application stores such as those operated by Apple and Google, may change their technical requirements or policies in a manner that adversely impacts the way in which we or our partners or customers collect, use, and share data from users. If the use of our products does not comply with these requirements, customers may not be able to use our products for their intended purposes and our business could be harmed.
We are dependent upon lead generation strategies to drive our sales and revenue. If these marketing strategies fail to continue to generate sales opportunities, our ability to grow our revenue will be adversely affected.
We are dependent upon lead generation strategies, including our expanded free tier offering, to generate sales opportunities. These strategies may not be successful in continuing to generate sufficient sales opportunities necessary to increase our revenue. To the extent that we are unable to successfully attract and grow paying customers, we will not realize the intended benefits of these marketing strategies and our ability to grow our revenue will be adversely affected.
17
The markets in which we participate are intensely competitive, and if we do not compete effectively, our operating results could be harmed.
The markets in which we compete are rapidly evolving, significantly fragmented, and highly competitive. Our observability platform combines functionality from numerous traditional product categories, and hence we compete in each of these categories with home-grown and open-source technologies, as well as a number of different vendors.
With respect to application performance monitoring, we compete with providers such as Cisco Systems, Inc. and Dynatrace, Inc. With respect to log management, we compete with Elastic NV and Splunk Inc. With respect to infrastructure monitoring, we compete with diversified technology vendors such as International Business Machines Corporation, BMC Software, Inc. and CA, Inc. (a subsidiary of Broadcom, Inc.); with native solutions from cloud providers such as Amazon Web Services, Inc., Microsoft Corporation, and Google LLC; and with independent vendors such as Datadog, Inc. In addition, we may increasingly choose to allow third-party hosting providers to offer our solutions directly through their customer marketplaces. An increasing number of sales through cloud provider marketplaces could reduce both the number of customers with whom we have direct commercial relationships as well as our profit margins on sales made through such marketplaces.
Some of our competitors and potential competitors are larger and have greater name recognition, longer operating histories, more established customer relationships, larger budgets, and significantly greater resources than we do, and have the operating flexibility to bundle competing products and services with other software offerings at little or no perceived incremental cost, including offering them at a lower price as part of a larger sale. As a result, our competitors may be able to respond more quickly and effectively than we can to new or changing opportunities, technologies, standards, or customer requirements. In addition, some competitors may offer products or services that address one or a limited number of functions at lower prices or with greater depth than our products. Our current and potential competitors may develop and market new technologies with comparable functionality to our products and platform capabilities, and this could lead to us having to decrease prices in order to remain competitive.
With the introduction of new technologies, the evolution of our products and platform capabilities and new market entrants, we expect competition to intensify in the future. Moreover, as we expand the scope of our solutions, we may face additional competition. Additionally, some potential customers, particularly large organizations, may elect to develop their own internal products. If one or more of our competitors were to merge or partner with another of our competitors or another large diversified technology company, the change in the competitive landscape could also adversely affect our ability to compete effectively. For example, in March 2017, Cisco Systems, Inc. completed its purchase of AppDynamics, Inc., in November 2018, Broadcom Inc. completed its acquisition of CA, Inc., and, in October 2019, Splunk Inc. completed its acquisition of SignalFX, Inc. If we are unable to maintain our current pricing or fail to gain market acceptance of our updated pricing strategy due to the competitive pressures, our margins will be reduced, and our operating results will be negatively affected. In addition, pricing pressures and increased competition generally could result in reduced sales, reduced margins, losses, or the failure of our solutions to achieve or maintain more widespread market acceptance, any of which could harm our business.
Due to differences between our legacy subscription-based pricing model and our transition to a consumption-based pricing model, we may not have visibility into our financial position and results of operations.
We have historically employed a subscription-based model and for contracts entered into prior to our consumption pricing model, we recognize revenue from customers ratably over the terms of their subscriptions. A portion of the revenue we report in each quarter is derived from the recognition of revenue relating to subscriptions entered into during previous quarters. Consequently, a decline in new or renewed subscriptions in any single quarter may have a small impact on our revenue for that quarter. However, such a decline will negatively affect our revenue in future quarters. Accordingly, the effect of significant downturns in sales and market acceptance of our solutions, and potential changes in our rate of renewals, may not be fully reflected in our results of operations until future periods. As a result, due to this historical reliance on a subscription-based business model, the effects of the COVID-19 pandemic to date were not fully reflected in our results of operations until later periods.
Because our customers have flexibility in the timing of their consumption under our pricing model, we do not have the same visibility into the timing of revenue recognition as we did under the subscription-based model. There is a risk that customers will consume our platform at a different pace than we expect, and our actual results may differ from our forecasts.
Seasonality may cause fluctuations in our sales and operating results.
We have experienced seasonality in our sales and operating results in the past, and we believe that we will continue to experience seasonality in the future. Historically, we have received a higher volume of orders in the fourth fiscal quarter of each year, and to a lesser extent our third fiscal quarter of each year. As a result, we have historically seen higher cash collections in
18
the first and fourth fiscal quarters of each year, and our sequential growth in remaining performance obligations has historically been highest in the fourth fiscal quarter of each year, and to a lesser extent our third fiscal quarter of each year. With our shift to a consumption based pricing model in fiscal 2022, we expect over time that our revenue will more closely approximate our customer usage of our products and services, and thereby our revenue may experience seasonal fluctuations based upon our customer consumption patterns.
If our estimates or judgments relating to our critical accounting policies prove to be incorrect, our results of operations could be adversely affected.
The preparation of financial statements in conformity with U.S. GAAP requires management to make estimates and assumptions that affect the amounts reported in the consolidated financial statements and accompanying notes. We base our estimates on historical experience and on various other assumptions that we believe to be reasonable under the circumstances, as provided in Part I, Item 7, “Management’s Discussion and Analysis of Financial Condition and Results of Operations.” The results of these estimates form the basis for making judgments about the carrying values of assets, liabilities and equity, and the amount of revenue and expenses that are not readily apparent from other sources.
Assumptions and estimates used in preparing our consolidated financial statements include those related to revenue recognition, which include variable consideration, stock-based compensation, and business combinations. For example, the calculations to derive variable consideration require a combination of quantitative and qualitative inputs, which include estimates of our customers’ future consumption and estimates regarding the collectability of consumption above committed amounts, that are based largely on an assessment of information (historical, current and forecasted) that is reasonably available to us at that time.
As a result, the timing of recognizing revenue in any given quarter, including the extent to which revenue from transactions in a given period may not be recognized until a future period, can be variable and difficult to predict and our results of operations may be adversely affected if such assumptions change or if actual circumstances differ from those in our assumptions. This could result in fluctuations in our revenue from period to period, which may make these comparisons less meaningful and make it difficult for us, securities analysts and investors to accurately forecast our revenue and operating results, which could cause our results of operations to differ from our financial outlook or the expectations of securities analysts and investors, potentially resulting in a decline in the market price of our common stock. In addition, our consumption pricing model has only been in place since fiscal 2021 and we are continuing to refine our assumptions and estimates. As we continue to obtain more historical data, we expect that our ability to forecast and derive these estimates will improve over time.
Interruptions or performance problems associated with our technology and infrastructure may adversely affect our business and operating results.
Our continued growth depends in part on the ability of our existing and potential customers to access our products and platform capabilities at any time and within an acceptable amount of time. We have experienced, and may in the future experience, disruptions, outages, and other performance problems due to a variety of factors, including infrastructure changes, introductions of new functionality, human or software errors, capacity constraints due to an overwhelming number of users accessing our products and platform capabilities simultaneously, denial or degradation of service attacks, computer viruses, natural disasters, terrorism, war, telecommunications and electrical failures, cyberattacks or other security related incidents. It may become increasingly difficult to maintain and improve our performance, especially during peak usage times and as our products and platform capabilities become more complex and our user traffic increases. If our products and platform capabilities are unavailable or if our users are unable to access our products and platform capabilities within a reasonable amount of time or at all, our business would be negatively affected. As we expand our business, our customers increasingly rely on our customer support personnel to realize the full benefits that our platform provides, and if we do not help our customers quickly resolve issues and provide effective ongoing support, our ability to maintain and expand our platform usage to existing and new customers could suffer, and our reputation with existing or potential customers could suffer. In addition, to the extent that we do not effectively address capacity constraints, upgrade our systems as needed, and continually develop our technology and network architecture to accommodate actual and anticipated changes in technology, our business and operating results may be adversely affected.
In addition, we currently serve our customers from third-party data centers and a combination of cloud hosting providers. The continuous availability of our products and platform capabilities depends on the operations of our data center facilities, on our cloud hosting providers, on a variety of network service providers, on third-party vendors, and on our own site operations staff. We depend on our third-party providers’ abilities to protect our data center facilities against damage or interruption from natural disasters, power or telecommunications failures, criminal acts, and similar events. If there are any lapses of service, damage to the facilities, or prolonged cloud hosting provider service disruptions or downtime affecting our platform, we could experience lengthy interruptions in our products and platform capabilities as well as delays and additional
19
expenses in arranging new facilities and services. In addition, we are in the process of migrating our entire platform over time from third-party data center hosting facilities to public cloud hosting providers. After we complete this migration, we will rely extensively on these public cloud providers to provide our clients and their users with fast and reliable access to our products. Even with current and planned disaster recovery arrangements, which, to date, have not been tested in an actual crisis, our business could be harmed. Also, in the event of damage or interruption, our insurance policies may not adequately compensate us for any losses that we may incur. These factors in turn could further reduce our revenue, subject us to liability, and cause us to issue credits or cause customers not to renew their commitments or increase their spend with us, any of which could harm our business.
We depend and rely on SaaS technologies and related services from third parties in order to operate critical functions of our business and interruptions or performance problems with these technologies or services may adversely affect our business and operating results.
We depend and rely on software-as-a-service, or SaaS, technologies and related services from third parties in order to operate critical functions of our business, including billing and order management, financial accounting services, and customer relationship management services. If these services become unavailable due to extended outages or interruptions, security vulnerabilities, or cyber-attacks, because they are no longer available on commercially reasonable terms or prices, or due to other unforeseen circumstances, our expenses could increase, our ability to manage these critical functions could be interrupted, and our processes for and ability to manage sales of our products, recognize revenue, and support our customers could be impaired, all of which could adversely affect our business and operating results.
Defects or disruptions in our products and platform capabilities could diminish demand, harm our financial results, and subject us to liability.
Our customers use our products and platform capabilities for important aspects of their businesses, and any errors, defects, or disruptions to our products and platform capabilities or other performance problems with our products and platform capabilities could hurt our brand and reputation and may damage our customers’ businesses. We provide regular product updates, which may contain undetected errors when first introduced or released. In the past, we have discovered software errors, failures, vulnerabilities, and bugs in our products and platform capabilities after they have been released and new errors in our existing products and platform capabilities may be detected in the future. Real or perceived errors, failures, or bugs in our products and platform capabilities could result in negative publicity, loss of or delay in market acceptance of our products, loss of competitive position, delay of payment to us, lower renewal rates, or claims by customers for losses sustained by them. In such an event, we may be required, or may choose, for customer relations or other reasons, to expend additional resources in order to help correct the problem. In addition, we may not carry insurance sufficient to compensate us for the losses that may result from claims arising from defects or disruptions in our products and platform capabilities. As a result, we could lose future sales and our reputation, and our brand could be harmed.
Our ongoing and planned investments in cloud hosting providers and expenditures on transitioning our services and customers from our data center hosting facilities to public cloud providers are expensive and complex, may result in a negative impact on our cash flows, and may negatively impact our financial results.
We have made and will continue to make substantial investments in our cloud hosting providers to support our growth and provide enhanced levels of products and platform capabilities to our customers. We have been continuing to decrease the amount of capital expenditures on hosting equipment for use in our data center hosting facilities as we transition to greater dependence on cloud hosting providers. If costs associated with cloud hosting services utilized to support our growth continue to be greater than originally expected or if we are required to make larger continuing investments in our data centers than we anticipated, the negative impact on our operating results would likely exceed our expectations. Furthermore, if we determine to no longer utilize our data centers and related property, and equipment sooner than planned, we may be forced to accelerate expense recognition as a result of the shorter estimated life of such assets. In addition, ongoing or future improvements to our cloud infrastructure may be more expensive than we anticipate, and may not yield the expected savings in operating costs or the expected performance benefits. We may not be able to maintain or achieve cost savings from our investments, which could harm our financial results.
We plan to continue to invest resources in connection with transitioning our customers and services to third-party cloud hosting providers and may encounter obstacles in completing the transition. Additionally, due to the difficulty in predicting usage of our cloud hosting providers related to customers recently migrated or customers to be migrated from our data centers, we may not be able to accurately forecast our expenditures on such cloud hosting services, which may increase the variability of our results of operations.
20
In addition, we may need to change our current operations infrastructure in order for us to achieve profitability and scale our operations efficiently, which makes our future prospects even more difficult to evaluate. For example, in order to grow our sales in a financially sustainable manner, we may need to further customize our offering and modify our go-to-market strategy to reduce our operating and customer acquisition costs. If we fail to implement these changes on a timely basis or are unable to implement them effectively, our business may suffer.
Because our long-term growth strategy involves further expansion of our sales to customers outside the United States, our business will be susceptible to risks associated with international operations.
During the fiscal year ended March 31, 2022, we derived approximately 32% of our total revenue from customers outside the United States. A component of our growth strategy involves the further expansion of our operations and customer adoption internationally. Operating in international markets requires significant resources and management attention and subjects us to regulatory, economic, and political risks that are different from those in the United States. We have limited operating experience in international markets, and we cannot assure you that our expansion efforts into international markets will be successful. Our international expansion efforts may not be successful in creating further demand for our products outside of the United States or in effectively selling our products in the international markets we enter. Our current international operations and future initiatives involve a variety of risks, including:
•changes in a specific country’s or region’s political or economic conditions;
•unexpected changes in regulatory requirements, taxes, or trade laws;
•economic and political uncertainty around the world, including uncertainty regarding U.S foreign and domestic policies;
•regional data security and privacy laws and regulations and the unauthorized use of, or access to, commercial and personal information;
•differing labor regulations where labor laws are generally more advantageous to employees as compared to the United States, including deemed hourly wage and overtime regulations in these locations;
•challenges inherent in efficiently managing an increased number of employees over large geographic distances, including the need to implement appropriate systems, policies, benefits, and compliance programs;
•difficulties in managing a business in new markets with diverse cultures, languages, customs, legal systems, alternative dispute systems, and regulatory systems;
•significant reliance upon, and potential disputes with, local business partners;
•increased travel, real estate, infrastructure, and legal compliance costs associated with international operations;
•currency exchange rate fluctuations and the resulting effect on our revenue and expenses, and the cost and risk of entering into hedging transactions if we chose to do so in the future;
•limitations on our ability to repatriate earnings;
•the impact of public health epidemics on our employees, partners and customers, such as the coronavirus epidemic, currently impacting various regions throughout the world;
•laws and business practices favoring local competitors, or general preferences for local vendors;
•limited or insufficient intellectual property protection;
•exposure to liabilities under anti-corruption, export controls and anti-money laundering laws, including the U.S. Foreign Corrupt Practices Act, and similar laws and regulations in other jurisdictions; and
•adverse tax burdens and foreign exchange controls that could make it difficult to repatriate earnings and cash or create other collection difficulties.
Our limited experience operating our business internationally increases the risk that recent and any potential future expansion efforts will not be successful. If substantial time and resources invested to expand our international operations do not result in a successful outcome, our operating results and business will suffer.
In addition, in February 2022, Russia launched a large-scale military attack on Ukraine. The invasion significantly amplified pre-existing geopolitical tensions. It is not possible to predict the full extent of the broader consequences of Russia’s invasion of Ukraine, including sanctions, embargoes, regional instability, geopolitical shifts and adverse effects on macroeconomic conditions, currency exchange rates and financial markets. Our business, financial condition and results of
21
operations may be materially adversely affected by any negative impact on the global economy and capital markets resulting from such conflict.
If we lose key members of our management team or are unable to attract and retain executives and employees we need to support our operations and growth, our business may be harmed.
Our success and future growth depend largely upon the continued services of our executive officers and other key employees in the areas of research and development, marketing, sales, services, and general administrative functions. From time to time, there may be changes in our executive management team or other key employees resulting from the hiring or departure of these personnel. For example, in fiscal 2022, Lew Cirne, our founder and former Chief Executive Officer, transitioned from his role as Chief Executive Officer to Executive Chairman of our Board of Directors and Williams Staples, our former President and Chief Product Officer was promoted to Chief Executive Officer. On May 7, 2022, Mark Sachleben, our Chief Financial Officer, announced his decision to retire from the company and has agreed to remain until a successor is named and a transition is complete. We could face difficulty in hiring a qualified successor and could experience a loss in productivity until the transition is complete.
Our executive officers and other key employees are employed on an at-will basis, which means that these personnel could terminate their employment with us at any time. Any changes in our senior management team in particular, even in the ordinary course of business, may be disruptive to our business. While we seek to manage these transitions carefully, including by establishing strong processes and procedures and succession planning, such changes may result in a loss of institutional knowledge and cause disruptions to our business. If our senior management team fails to work together effectively or execute our plans and strategies on a timely basis as a result of management turnover or otherwise, our business could be harmed.
In addition, to execute our growth plan, we must attract and retain highly qualified personnel. Competition for these personnel is intense, especially for engineers experienced in designing and developing software and SaaS, applications and experienced sales professionals. If we are unable to attract such personnel in locations where we are located, we may need to hire in other locations as well as consider alternative flexible work options, which may add to the complexity and costs of our business operations. Complexities in hiring and the need for flexible work arrangements have heightened during the COVID-19 pandemic. We have from time to time experienced, and we expect to continue to experience, difficulty in hiring and retaining employees with appropriate qualifications, especially during the current period of heightened employee attrition in the U.S. and other countries. Many of the companies with which we compete for experienced personnel have greater resources than we have. If we hire employees from competitors or other companies, their former employers may attempt to assert that these employees or we have breached their legal obligations, resulting in a diversion of our time and resources. In addition, prospective and existing employees often consider the value of the equity awards they receive in connection with their employment. If the perceived value of our equity awards declines, or experiences significant volatility, it may adversely affect our ability to recruit and retain key employees. If we fail to attract new personnel or fail to retain and motivate our current personnel, our business and future growth prospects could be adversely affected.
If we fail to enhance our brand, or to do so in a cost-effective manner, our ability to expand our customer adoption will be impaired and our financial condition may suffer.
We believe that our development of the New Relic brand is critical to achieving widespread awareness of our existing and future solutions, and, as a result, is important to attracting new customers and retaining existing customers. We also believe that the importance of brand recognition will increase as competition in our market increases. Successful promotion of our brand will depend largely on the effectiveness of our marketing efforts, including our ability to do so in a cost-effective manner, and on our ability to provide reliable and useful products at competitive prices. In the past, our efforts to build our brand have involved significant expenses. Brand promotion activities may not yield increased revenue, and even if they do, any increased revenue may not offset the expenses we incur in building our brand.
If we cannot continue to maintain and develop our corporate culture as we grow, we could lose the innovation, teamwork, passion, and focus on execution that we believe contribute to our success, and our business may be harmed.
We believe that our corporate culture has been a critical component to our success. We have invested substantial time and resources in building our team. As we grow and mature as a public company, and as we continue to expand internationally and adopt more flexible work arrangements, we may find it difficult to continue to maintain and develop our corporate culture. There have been changes in our senior executive management team resulting from the hiring, promotion or departure of these personnel, and we expect to also recruit and hire other senior executives in the future. Such management changes subject us to a number of risks, such as risks pertaining to the creation of new management systems and processes and differences in management style, any of which could adversely impact our corporate culture. In addition, we may need to continue to adapt our corporate culture and work environments to such changing circumstances. Any failure to preserve our culture could
22
negatively affect our future success, including our ability to recruit and retain personnel and effectively focus on and pursue our corporate objectives.
Acquisitions, strategic investments, partnerships, or alliances could be difficult to identify, pose integration challenges, divert the attention of management, disrupt our business, dilute stockholder value, and adversely affect our operating results and financial condition.
We have in the past and may in the future seek to acquire or invest in businesses, joint ventures, products and platform capabilities, or technologies that we believe could complement or expand our products and platform capabilities, enhance our technical capabilities, or otherwise offer growth opportunities. For example, in the third quarter of fiscal 2021, we acquired Pixie Labs Inc., a company that provides a next generation machine intelligence observability solution for developers using Kubernetes and in the first quarter of fiscal 2022, we acquired CodeStream Inc., a company that provides an integrated developer collaboration platform. Any acquisition or investment may divert the attention of management and cause us to incur various expenses in identifying, investigating, and pursuing suitable opportunities, whether or not the transactions are completed, and may result in unforeseen operating difficulties and expenditures. In particular, we may encounter difficulties assimilating or integrating the businesses, technologies, products and platform capabilities, personnel, or operations of the acquired companies, particularly if the key personnel of the acquired company choose not to work for us, their software is not easily adapted to work with our platform, or we have difficulty retaining the customers of any acquired business due to changes in ownership, management, or otherwise. These transactions may also disrupt our business, divert our resources, and require significant management attention that would otherwise be available for development of our existing business. Any such transactions that we are able to complete may not result in any synergies or other benefits we had expected to achieve, which could result in impairment charges that could be substantial. In addition, we may not be able to find and identify desirable acquisition targets or business opportunities or be successful in entering into an agreement with any particular strategic partner. These transactions could also result in dilutive issuances of equity securities or the incurrence of debt, which could adversely affect our operating results. In addition, if the resulting business from such a transaction fails to meet our expectations, our operating results, business, and financial condition may suffer or we may be exposed to unknown risks or liabilities.
We provide service level commitments under some of our customer contracts. If we fail to meet these contractual commitments, we could be obligated to provide credits or refunds for prepaid amounts related to unused portion of our contractual commitments or face contract terminations, which could adversely affect our revenue.
Some of our customer agreements provide service level commitments. If we are unable to meet the stated service level commitments or suffer extended periods of unavailability for our products and platform capabilities, we may be contractually obligated to provide these customers with service credits or refunds for prepaid amounts related to unused portion of our contractual commitments, or we could face contract terminations. Our revenue could be significantly affected if we suffer unscheduled downtime that exceeds the allowed downtimes under our agreements with our customers. Any extended service outages could adversely affect our reputation, revenue, and operating results.
If third parties, such as customers, partners and third-party software developers fail to maintain interoperability, availability, or privacy compliance controls in the integrations and applications that they provide, our services that rely upon such integrations may have less value to customers, become less marketable, or less competitive, and our brand and financial performance could be harmed.
We provide software that enables customers, partners and third-party software developers to build integrations and applications with our products and extend the functionality of our platform capabilities. This presents certain risks to our business, including:
•customers, partners and third-party developers may not continue developing or supporting the integrations and applications that they provide or they may favor a competitor’s or their own competitive offerings over ours;
•we cannot provide any assurance that these integrations and applications meet the same quality standards that we apply to our own development efforts, and, to the extent they contain bugs, defects, or security risks, they may create disruptions in our customers’ use of our software or negatively affect our brand;
•we do not currently provide support or warranties related to the functionality, security, and integrity of the data transmission or processing for integrations and applications developed by customers, partners and third-party software developers, and users may seek warranties or be left without support and potentially cease using our products if the developers do not provide warranties or support for their integrations and applications; and
•these customers, partners and third-party software developers may not possess the appropriate intellectual property rights to develop and share their integrations and applications or the legal basis and privacy and security compliance measures to process or control personal information that flows through our systems.
23
While many of these risks are not within our control to prevent, our brand and financial performance could be harmed if these integrations and applications do not perform to our customers’ satisfaction and if that dissatisfaction is attributed to us.
Sales to government entities and highly regulated organizations are subject to a number of challenges and risks.
We may sell to U.S. federal, state, and local, as well as foreign, governmental agency customers, as well as to customers in highly regulated industries such as financial services, telecommunications and healthcare. Sales to such entities are subject to a number of challenges and risks. Selling to such entities can be highly competitive, expensive, and time-consuming, often requiring significant upfront time and expense without any assurance that these efforts will generate a sale. Government contracting requirements may change and in doing so restrict our ability to sell into the government sector until we have attained the revised certification. Government demand and payment for our products are affected by public sector budgetary cycles and funding authorizations, with funding reductions or delays adversely affecting public sector demand for our products.
Further, governmental and highly regulated entities may demand contract terms that differ from our standard arrangements and are less favorable than terms agreed with private sector customers. Such entities may have statutory, contractual, or other legal rights to terminate contracts with us or our partners for convenience or for other reasons. Any such termination may adversely affect our ability to contract with other government customers as well as our reputation, business, financial condition and results of operations.
We have incurred substantial indebtedness that may decrease our business flexibility, access to capital, and/or increase our borrowing costs, and we may still incur substantially more debt, which may adversely affect our operations and financial results.
As of March 31, 2022, we had $500.25 million (undiscounted) principal amount of indebtedness under our 0.50% convertible senior notes due 2023 (the “Notes”). Our indebtedness may:
•limit our ability to borrow additional funds for working capital, capital expenditures, acquisitions, or other general business purposes;
•limit our ability to use our cash flow or obtain additional financing for future working capital, capital expenditures, acquisitions, or other general business purposes;
•require us to use a substantial portion of our cash flow from operations to make debt service payments;
•limit our flexibility to plan for, or react to, changes in our business and industry;
•place us at a competitive disadvantage compared to our less leveraged competitors; and
•increase our vulnerability to the impact of adverse economic and industry conditions.
Further, the indenture governing the Notes, or the indenture, does not restrict our ability to incur additional indebtedness and we and our subsidiaries may incur substantial additional indebtedness in the future, subject to the restrictions contained in any future debt instruments existing at the time, some of which may be secured indebtedness.
Servicing our debt will require a significant amount of cash. We may not have sufficient cash flow from our business to pay our substantial debt, and we may not have the ability to raise the funds necessary to settle conversions of the Notes in cash or to repurchase the Notes upon a fundamental change, which could adversely affect our business and results of operations.
Our ability to make scheduled payments of the principal of, to pay interest on, or to refinance our indebtedness, including the amounts payable under the Notes, depends on our future performance, which is subject to economic, financial, competitive, and other factors beyond our control. Our business may not continue to generate cash flow from operations in the future sufficient to service our indebtedness and make necessary capital expenditures. If we are unable to generate such cash flow, we may be required to adopt one or more alternatives, such as selling assets, restructuring debt, or obtaining additional equity capital on terms that may be onerous or highly dilutive. Our ability to refinance our indebtedness will depend on the capital markets and our financial condition at such time. We may not be able to engage in any of these activities or engage in these activities on desirable terms, which could result in a default on our debt obligations.
Further, holders of the Notes will have the right to require us to repurchase all or a portion of their Notes upon the occurrence of a “fundamental change” (as defined in the indenture) before the maturity date of the Notes at a repurchase price equal to 100% of the principal amount of the Notes to be repurchased, plus accrued and unpaid interest, if any. In addition, upon conversion of the Notes, unless we elect to deliver solely shares of our common stock to settle such conversion (other than paying cash in lieu of delivering any fractional share), we will be required to make cash payments in respect of the Notes being
24
converted. However, we may not have enough available cash or be able to obtain financing at the time we are required to make repurchases of Notes being surrendered or pay cash with respect to Notes being converted.
The conditional conversion feature of the Notes, if triggered, may adversely affect our financial condition and operating results.
In the event the conditional conversion feature of the Notes is triggered, holders of the Notes will be entitled to convert their Notes at any time during specified periods at their option. If one or more holders elect to convert their Notes, unless we elect to satisfy our conversion obligation by delivering solely shares of our common stock (other than paying cash in lieu of delivering any fractional share), we would be required to settle a portion or all of our conversion obligation in cash, which could adversely affect our liquidity. In addition, in May 2022, we reclassified all of the outstanding principal of the Notes as a current rather than long-term liability, which we expect to result in a material reduction of our net working capital.
The accounting method for convertible debt securities that may be settled in cash, such as the Notes, could have a material effect on our reported financial results.
In August 2020, the Financial Accounting Standards Board (“FASB”) issued ASU 2020-06, Accounting for Convertible Instruments and Contract on an Entity’s Own Equity (Subtopic 815-40) (“ASU 2020-06”), which amends the accounting standards for convertible debt instruments that may be settled entirely or partially in cash upon conversion. ASU 2020-06 eliminates requirements to separately account for liability and equity components of such convertible debt instruments and eliminates the ability to use the treasury stock method for calculating diluted earnings per share for convertible instruments whose principal amount may be settled using shares. Instead, ASU 2020-06 requires (i) the entire amount of the security to be presented as a liability on the balance sheet and (ii) application of the if-converted method for calculating diluted earnings per share. Under the if-converted method, diluted earnings per share will generally be calculated assuming that all the Notes were converted solely into shares of common stock at the beginning of the reporting period, unless the result would be anti-dilutive, which could adversely affect our diluted earnings per share. However, if the principal amount of the convertible debt security being converted is required to be paid in cash and only the excess is permitted to be settled in shares, the if-converted method will produce a similar result as the treasury stock method prior to the adoption of ASU 2020-06 for such convertible debt security.
We elected to early adopt ASU 2020-06 on April 1, 2021, using the modified retrospective basis. As a result, we no longer separate the liability and equity components of the Notes on our balance sheet and we use the if-converted method of calculating diluted earnings per share. Under the modified retrospective basis, prior periods are not restated. Rather, the cumulative effect of initially applying the new standard was recognized as an adjustment to accumulated deficit. The elimination of the separate accounting reduced the interest expense that we recognized in our fiscal period ended June 30, 2021.
The capped call transactions may affect the value of the Notes and our common stock.
In connection with the pricing of the Notes, we entered into capped call transactions with certain financial institutions (the “Capped Calls”). The Capped Call transactions are generally intended to reduce potential dilution to holders of our common stock upon any conversion of the Notes and/or offset any cash payments we are required to make in excess of the principal amount of converted Notes, as the case may be, with such reduction and/or offset, as the case may be, subject to a cap.
In connection with establishing their initial hedges of the Capped Calls, these financial institutions or their respective affiliates likely purchased shares of our common stock and/or entered into various derivative transactions with respect to our common stock concurrently with or shortly after the pricing of the Notes. These financial institutions or their respective affiliates may modify their hedge positions by entering into or unwinding various derivatives with respect to our common stock and/or purchasing or selling our common stock or other securities of ours in secondary market transactions following the pricing of the Notes and prior to the maturity of the Notes (and are likely to do so during any observation period related to a conversion of Notes). This activity could also cause or avoid an increase or a decrease in the market price of our common stock or the Notes.
The potential effect, if any, of these transactions and activities on the price of our common stock or the Notes will depend in part on market conditions and cannot be ascertained at this time. Any of these activities could adversely affect the value of our common stock.
Provisions in the indenture for the Notes may deter or prevent a business combination that may be favorable to our stockholders.
If a fundamental change occurs prior to the maturity date of the Notes, holders of the Notes will have the right, at their option, to require us to repurchase all or a portion of their Notes. In addition, if a “make-whole fundamental change” (as defined
25
in the indenture) occurs prior to the maturity date, we will in some cases be required to increase the conversion rate of the Notes for a holder that elects to convert its Notes in connection with such make-whole fundamental change.
Furthermore, the indenture will prohibit us from engaging in certain mergers or acquisitions unless, among other things, the surviving entity assumes our obligations under the Notes. These and other provisions in the indenture could deter or prevent a third party from acquiring us even when the acquisition may be favorable to our stockholders.
Conversion of the Notes may dilute the ownership interest of existing stockholders, including holders who had previously converted their Notes, or may otherwise depress the price of our common stock.
The conversion of some or all of the Notes will dilute the ownership interests of existing stockholders to the extent we deliver shares of our common stock upon conversion of any of the Notes and the potential dilution is not reduced or offset by the Capped Calls we entered into. The Notes may become in the future convertible at the option of their holders prior to their scheduled terms under certain circumstances. Any sales in the public market of the common stock issuable upon such conversion could adversely affect prevailing market prices of our common stock. In addition, the existence of the Notes may encourage short selling by market participants because the conversion of the Notes could be used to satisfy short positions, or anticipated conversion of the Notes into shares of our common stock could depress the price of our common stock.
Our ability to use our net operating loss carryforwards to offset future taxable income may be subject to certain limitations.
As of our fiscal year ended March 31, 2022, we had U.S. federal and state net operating losses of approximately $776.7 million and $449.3 million, respectively. Other than federal net operating losses arising in tax years beginning after December 31, 2017, the federal and state net operating loss carryforwards will begin to expire, if not utilized, beginning in 2028 and 2022, respectively. These net operating loss carryforwards could expire unused and be unavailable to offset future income tax liabilities. Under the 2017 federal income tax law, as modified by the federal tax law changes enacted in March 2020, federal net operating losses incurred in tax years beginning after December 31, 2017 may be carried forward indefinitely, but, for taxable years beginning after December 31, 2020, the deductibility of such federal net operating losses is limited. In addition, under Section 382 of the Internal Revenue Code of 1986, as amended, and corresponding provisions of state law, if a corporation undergoes an “ownership change,” which is generally defined as a greater than 50% change, by value, in its equity ownership over a three-year period, the corporation’s ability to use its pre-change net operating loss carryforwards and other pre-change tax attributes to offset its post-change income or taxes may be limited. We may experience ownership changes in the future as a result of subsequent shifts in our stock ownership, some of which may be outside of our control. If an ownership change occurs and our ability to use our net operating loss carryforwards is materially limited, it would harm our future operating results by effectively increasing our future tax obligations. In addition, for state income tax purposes, there may be periods during which the use of net operating losses is suspended or otherwise limited, which could accelerate or permanently increase state taxes owed.
Our effective tax rate may fluctuate, and we may incur obligations in tax jurisdictions in excess of accrued amounts.
We are subject to taxation in numerous U.S. states and territories and in non-U.S. countries. As a result, our effective tax rate is derived from a combination of applicable tax rates in the various places that we operate. In preparing our financial statements, we estimate the amount of tax that will become payable in each of such places. Nevertheless, our effective tax rate may be different than experienced in the past due to numerous factors, including passage of federal income tax law changes, changes in the mix of our profitability from jurisdiction to jurisdiction, the results of examinations and audits of our tax filings, our inability to secure or sustain acceptable agreements with tax authorities, changes in accounting for income taxes and other changes in tax laws. Any of these factors could cause us to experience an effective tax rate significantly different from previous periods or our current expectations and may result in tax obligations in excess of amounts accrued in our financial statements.
We may face exposure to foreign currency exchange rate fluctuations.
While we have historically transacted in U.S. dollars with substantially all of our customers and vendors, we have transacted in foreign currencies and may transact in foreign currencies in the future. In addition, any international subsidiaries will maintain net assets that are denominated in currencies other than the functional operating currencies of these entities. Accordingly, changes in the value of foreign currencies relative to the U.S. dollar can affect our revenue and operating results due to transactional and translational remeasurement that is reflected in our earnings. As a result of such foreign currency exchange rate fluctuations, it could be more difficult to detect underlying trends in our business and results of operations. In addition, to the extent that fluctuations in currency exchange rates cause our results of operations to differ from our expectations or the expectations of our investors, the trading price of our common stock could be adversely affected. We do not currently maintain a program to hedge transactional exposures in foreign currencies. However, in the future, we may use derivative instruments, such as foreign currency forward and option contracts, to hedge certain exposures to fluctuations in foreign currency exchange rates. The use of such hedging activities may not offset any or more than a portion of the adverse financial
26
effects of unfavorable movements in foreign exchange rates over the limited time the hedges are in place. Moreover, the use of hedging instruments may introduce additional risks if we are unable to structure effective hedges with such instruments.
Risks Related to Laws and Regulations
We are subject to stringent and rapidly changing laws, regulations, industry standards, contractual obligations, and other obligations relating to privacy, data protection, and data security. The actual or perceived failure to comply with such obligations by us, our customers, or third parties with whom we work could harm our reputation, subject us to significant fines and liability, or otherwise adversely affect our business.
We, our customers, and third parties who we work with are subject to numerous evolving and increasingly stringent domestic and foreign laws and other obligations relating to privacy, data protection, and data security that are increasing the cost and complexity of operating our business.
Foreign laws relating to privacy, data protection, and data security are undergoing a period of rapid change and have become more stringent in recent years. For example, the General Data Protection Regulation (“GDPR”) took effect in the European Union (“EU”) in May 2018 and has also been transposed into national law in the United Kingdom (“UK”). The GDPR imposes strict requirements for processing personal information, and subjects noncompliant companies to fines of up to the greater of 20 million Euros or 4% of their global annual revenues, restrictions or prohibitions on processing of personal information, and private litigation. Laws in EU member states and the UK also impose restrictions on direct marketing communications and the use of cookies and similar technologies online, and a new regulation proposed in the EU called the e-Privacy Regulation may make such restrictions more stringent.
Globally, certain jurisdictions have enacted data localization laws and have imposed requirements for cross-border transfers of personal information. For example, the GDPR and other European data protection laws generally prohibit the transfer of personal information to countries outside the European Economic Area (“EEA,”), such as the United States, that are not considered by the European Commission to provide an adequate level of data protection. Swiss and UK law contain similar data transfer restrictions as the GDPR. The European Commission recently released a set of Standard Contractual Clauses (“SCCs”), a mechanism to transfer data outside of the EEA, which imposes additional obligations to carry out cross-border data transfers. Although there are currently valid mechanisms available to transfer data from these jurisdictions, there remains some uncertainty regarding the future of these cross-border data transfers. Countries outside of Europe have enacted or are considering similar cross-border data transfer restrictions and laws requiring local data residency and restricting cross-border data transfers, which could increase the cost and complexity of doing business. If we elect to rely on the new SCCs for data transfers, we may be required to incur significant time and resources to update our contractual arrangements and to comply with new obligations. The new SCCs may increase the legal risks and liabilities under European privacy, data protection, and data security laws. If we cannot implement a valid mechanism for cross-border personal information transfers, we may face increased exposure to regulatory actions, penalties, and data processing restrictions or bans, and reduce demand for our services. Loss of our ability to import personal information from Europe and elsewhere may also require us to increase our data processing capabilities outside the U.S. at significant expense.
Other foreign jurisdictions are also passing and proposing more stringent privacy, data protection and data security laws. For example, Brazil’s General Data Protection Law (Lei Geral de Proteção de Dados Pessoais) (Law No. 13,709/2018) (“LGPD”) and Canada’s Personal Information Protection and Electronic Documents Act (“PIPEDA”) impose strict requirements for processing the personal information of individuals and may apply to our operations.
In the United States, federal, state and local governments have enacted numerous privacy, data protection, and data security laws, including data breach notification laws, personal information privacy laws, health information privacy laws, and consumer protection laws. For example, the California Consumer Privacy Act (“CCPA”), which took effect on January 1, 2020, gives California residents expanded rights to access and delete their personal information, opt-out of certain personal information sharing, and receive detailed information about how their personal information is used. The CCPA provides for civil penalties for violations (up to $7,500 per violation), as well as a private right of action for data breaches that is expected to increase data breach litigation. Additionally, the California Privacy Rights Act of 2020 (“CPRA”) will substantially expand the CCPA effective January 1, 2023 and is expected to increase the risk of enforcement actions. Aspects of the CCPA and CPRA and their interpretation and enforcement remain uncertain. Other states are considering or have also enacted privacy and data security laws. For example, Virginia has similarly enacted a comprehensive privacy law, the Consumer Data Protection Act, Colorado recently enacted the Colorado Privacy Act, and Utah recently passed its Consumer Privacy Act, all of which differ from the CCPA and become effective in 2023. A patchwork of differing state privacy and data security laws would increase the cost and complexity of operating our business and increase our exposure to liability.
27
We may also be subject to federal laws related to privacy, data protection, and data security, such as the federal Health Insurance Portability and Accountability Act of 1996 (“HIPAA”) and the Telephone Consumer Protection Act (“TCPA”). HIPAA, as amended by the Health Information Technology for Economic and Clinical Health Act (“HITECH”), imposes specific requirements relating to the privacy, security, and transmission of individually identifiable health information. The TCPA imposes specific requirements relating to marketing to individuals using technology such as telephones, mobile devices, and text messages. TCPA violations can result in significant financial penalties, as businesses can incur penalties or criminal fines imposed by the Federal Communications Commission or be fined up to $1,500 per violation through private litigation or state attorneys general or other state actor enforcement. Class action suits are the most common method for private enforcement.
Like our legal obligations, the demands our customers place on us relating to privacy, data protection, and data security are becoming more stringent. Laws such as the GDPR and CCPA increasingly require companies to impose specific contractual restrictions on their service providers. We are also subject to the terms of our privacy and data security policies, representations, certifications, publications, contractual obligations, and other obligations related to privacy, data protection, and data security, including operating rules and standards imposed by industry organizations such as PCI-DSS. Although we endeavor to comply with our obligations, we and the third parties on which we rely may at times fail to do so or may be perceived to have failed to do so. Such failures could subject us to regulatory enforcement action as well as costly legal claims by affected individuals or our customers.
We strive to comply with applicable privacy, data protection, and data security laws and other obligations, but we cannot fully determine the impact that current or future such laws and other obligations may have on our business or operations. Such laws or obligations may be inconsistent from one jurisdiction to another, subject to differing interpretations, and courts or regulators may deem our efforts to comply as insufficient. Preparing for and attempting to comply with these obligations requires significant resources and, potentially, changes to our technologies, systems, and practices and those of any third parties that process personal information on our behalf. If we or the third parties we rely on to operate our business and deliver our services fail to comply, or are perceived as failing to comply, with our legal, contractual, or other obligations relating to privacy, data protection, or data security or, or our policies and documentation relating to personal information, we could face governmental enforcement action; litigation with our customers, individuals or others; fines and civil or criminal penalties for us or company officials; obligations to cease offering our services or to substantially modify them in ways that make them less effective in certain jurisdictions; negative publicity and harm to our brand and reputation; and reduced overall demand for our services. Such developments could adversely affect our business, financial condition, and results of operations.
We are subject to governmental export and import controls that could impair our ability to compete in international markets or subject us to liability if we violate these controls.
Our products are subject to U.S. export controls, and we incorporate encryption technology into certain of our products. Governmental regulation of encryption technology and regulation of imports or exports of encryption products, or our failure to obtain required import or export authorization for our products, when applicable, could harm our international sales and adversely affect our revenues. Compliance may also create delays in the introduction of our product releases in international markets, prevent our customers with international operations from deploying our products or, in some cases, prevent the export of our products to some countries altogether. If we fail to comply, we could be subject to both civil and criminal penalties, including substantial fines, possible incarceration for employees and managers for willful violations, and the possible loss of export or import privileges. For example, in February 2022, following Russia’s invasion of Ukraine, the United
States and other countries announced economic sanctions against Russia, and the United States and other countries could
impose wider sanctions and take other actions as the conflict continues to escalate. Any decreased use of our products or limitation on our ability to export or sell our products would likely adversely affect our business, financial condition and results of operations.
We are subject to the tax laws of various jurisdictions, which are subject to unanticipated changes and to interpretation, which could harm our future results.
We are subject to income taxes in the United States and foreign jurisdictions, and our domestic and international tax liabilities are subject to the allocation of expenses in differing jurisdictions. Our effective tax rate could be adversely affected by changes in the mix of earnings and losses in countries with differing statutory tax rates, certain non-deductible expenses as a result of acquisitions, the valuation of deferred tax assets and liabilities, and changes in federal, state, or international tax laws and accounting principles.
For example, U.S. tax legislation enacted in December 2017, which was modified by additional U.S. tax legislation enacted in March 2020, made a number of significant changes to the U.S. federal tax code. Future federal and applicable state
28
tax law changes could also be made, including if various proposals for federal tax law changes proposed in the fall of 2021 and in 2022 (none of which has yet been enacted) were to become law.
Further, each jurisdiction has different rules and regulations governing sales and use, value added, and similar taxes, and these rules and regulations are subject to varying interpretations that change over time. Certain jurisdictions in which we did not collect such taxes may assert that such taxes are applicable, which could result in tax assessments, penalties, and interest, and we may be required to collect such taxes in the future. In addition, we may be subject to income tax audits by many tax jurisdictions throughout the world, many of which have not established clear guidance on the tax treatment of SaaS-based companies. In addition, the COVID-19 pandemic and resulting use of flexible work policies may increase the probability of payroll tax audits. Any tax assessments, penalties, and interest, or future requirements may adversely affect our results of operations. Moreover, imposition of such taxes on us going forward would effectively increase the cost of our products to our customers and might adversely affect our ability to retain existing customers or to gain new customers in the areas in which such taxes are imposed.
In addition, the application of the tax laws of various jurisdictions, including the United States, to our international business activities is subject to interpretation and depends on our ability to operate our business in a manner consistent with our corporate structure and intercompany arrangements. The taxing authorities of jurisdictions in which we operate may challenge our methodologies for valuing developed technology or intercompany arrangements, including our transfer pricing, or determine that the manner in which we operate our business does not achieve the intended tax consequences. As we operate in numerous taxing jurisdictions, the application of tax laws can also be subject to diverging and sometimes conflicting interpretations by tax authorities of these jurisdictions. For instance, it is not uncommon for taxing authorities in different countries to have conflicting views, with respect to, among other things, the manner in which the arm’s length standard is applied for transfer pricing purposes, or with respect to the valuation of intellectual property.
Risks Related to Our Intellectual Property
We may incur significant costs due to claims for alleged infringement of proprietary rights.
There is considerable patent, copyright, trademark, trade secret, and other intellectual property development activity in our industry. Our success depends in part on not infringing upon the intellectual property rights of others and how we prepare for and handle claims of infringement. From time to time, our competitors or other third parties may claim that we are infringing upon their intellectual property rights, and we may be found to be infringing upon such rights. We may receive claims that our products, platform capabilities, and underlying technology infringe or violate the claimant’s intellectual property rights. In addition, agreements with customers and other third parties may include indemnification provisions under which we agree to indemnify them in the event of claims of infringement of certain proprietary rights. Any claims or litigation, regardless of merit, could cause us to incur significant expenses and, if successfully asserted against us, could require that we pay substantial damages or ongoing royalty payments, prevent us from offering our products and platform capabilities, or require that we comply with other unfavorable terms.
Even if the claims do not result in litigation or are resolved in our favor, these claims, and the time and resources necessary to resolve them, could divert the resources of our management and harm our business and operating results. We expect that the occurrence of infringement claims is likely to grow as the market for our products grows. Accordingly, our exposure to damages resulting from infringement claims could increase and this could further exhaust our financial and management resources.
Any failure to protect our intellectual property rights could impair our ability to protect our proprietary technology and our brand.
Our success depends to a significant degree on our ability to protect our proprietary technology and our brand. We rely on a combination of trademarks, trade secret laws, patent, copyrights, service marks, contractual restrictions, and other intellectual property laws and confidentiality procedures to establish and protect our proprietary rights. However, the steps we take to protect our intellectual property may be inadequate. We will not be able to protect our intellectual property if we are unable to enforce our rights or if we do not detect unauthorized use of our intellectual property. If we fail to protect our intellectual property rights adequately, our competitors may gain access to our technology and our business may be harmed. In addition, defending our intellectual property rights might entail significant expense. Any patents, trademarks, or other intellectual property rights that we obtain may be challenged by others or invalidated through administrative process or litigation. As of March 31, 2022, we had 40 issued patents in the United States and abroad and 35 patent applications pending in the United States and abroad. Despite our issued patents and pending patent applications, we may be unable to maintain or obtain patent protection for our technology. In addition, our existing patents and any patents issued in the future may not
29
provide us with competitive advantages, or may be successfully challenged by third parties. Furthermore, legal standards relating to the validity, enforceability, and scope of protection of intellectual property rights are uncertain. Despite our precautions, it may be possible for unauthorized third parties to copy our products and platform capabilities and use information that we regard as proprietary to create products and services that compete with ours. Effective patent, trademark, copyright, and trade secret protection may not be available to us in every country in which our products are available. The laws of some foreign countries may not be as protective of intellectual property rights as those in the United States, and mechanisms for enforcement of intellectual property rights may be inadequate. As we expand our international activities, our exposure to unauthorized copying and use of our products and platform capabilities and proprietary information will likely increase. Accordingly, despite our efforts, we may be unable to prevent third parties from infringing upon or misappropriating our intellectual property.
We enter into confidentiality and invention assignment agreements with our employees and consultants and enter into confidentiality agreements with other parties. No assurance can be given that these agreements will be effective in controlling access to and distribution of our proprietary information. Further, these agreements may not prevent our competitors from independently developing technologies that are substantially equivalent or superior to our products and platform capabilities.
In order to protect our intellectual property rights, we may be required to spend significant resources to monitor and protect our intellectual property rights. Litigation may be necessary in the future to enforce our intellectual property rights and to protect our trade secrets. Litigation brought to protect and enforce our intellectual property rights could be costly, time-consuming, and distracting to management, and could result in the impairment or loss of portions of our intellectual property. Further, our efforts to enforce our intellectual property rights may be met with defenses, counterclaims, and countersuits attacking the validity and enforceability of our intellectual property rights. Our inability to protect our proprietary technology against unauthorized copying or use, as well as any costly litigation or diversion of our management’s attention and resources, could delay further sales or the implementation of our products and platform capabilities, impair the functionality of our products and platform capabilities, delay introductions of new solutions, result in our substituting inferior or more costly technologies into our products, or injure our reputation.
Our reliance upon open source software could negatively affect our ability to sell our products and subject us to possible litigation.
We rely heavily upon open source software for the operation of our products and platform capabilities and expect to continue to do so in the future. During fiscal 2021, we strengthened this commitment when we announced that we are making our agents, integrations, and SDKs available under an open source license, and that we are standardizing our future observability offerings in OpenTelemetry, a Cloud Native Computing Foundation project that is an emerging standard for software instrumentation. As a result of our use of open source software in our offerings, as well as our contributions of code to open source software projects, we may face claims from others claiming ownership of, or seeking to enforce the terms of, incompatible or conflicting licenses or other rights. This may include a demand to release the open source software, derivative works, or our proprietary source code that was developed using such software. These claims could also result in litigation, require us to purchase a costly license, or require us to devote additional research and development resources to change our platform, any of which would have a negative effect on our business and operating results. In addition, if the license terms for the software we utilize change, additional licenses from third parties may be required or we may be forced to reengineer or discontinue our products and platform capabilities or incur additional costs. In addition, open source licensors generally do not provide warranties, support, indemnity, or assurance of title or controls on origin of the software which may lead to greater risks. Likewise, some open source projects have known security and other vulnerabilities and architectural instabilities and are provided on an “as-is” basis which, if not properly addressed, could negatively affect the performance of our product. While we have established processes to help alleviate these risks, we cannot assure that these measures will reduce or completely shield us from these risks. Moreover, we cannot be certain that we have not incorporated software in our products and platform capabilities in a manner that is inconsistent with the terms of the applicable proprietary rights that may govern their use, or our own policies and procedures.
Our continued shift to increase reliance upon open source software will also present increased risk from the standpoint of competition. Because any software source code we contribute to open source projects is publicly available, our ability to protect our intellectual property rights with respect to such software source code may be limited or lost entirely. Anyone may obtain access to the source code for our open source features and then redistribute it (either in a modified or unmodified form), and we may be unable to prevent our competitors or others from using such software source code for competitive purposes, or for commercial or other purposes beyond what we intended. For instance, our conversion of the license terms for our agents, integrations and SDKs from our historical proprietary licenses to open source licenses may allow the use of our previous proprietary code with competitor’s platforms. Additionally, we make the source code of our proprietary features publicly available, which may enable others to compete more effectively. Such competition can develop without the degree of overhead
30
and lead time required by traditional proprietary software companies, due to the permissions allowed under open source licensing. It is possible for competitors to develop their own software, including software based on our products, potentially reducing the demand for our services.
Risks Related to Ownership of Our Common Stock
Our stock price has been and will likely continue to be subject to fluctuations, which may be volatile and due to factors beyond our control.
The market price of our common stock is subject to wide fluctuations in response to various factors, some of which are beyond our control. In addition to the factors discussed in this “Risk Factors” section and elsewhere in this report, factors that could cause fluctuations in the market price of our common stock include the following:
•actual or anticipated fluctuations in our operating results;
•seasonal and end-of-quarter concentration of our transactions and variations in the number and size of transactions that close in a particular quarter;
•the financial projections we may provide to the public, any changes in these projections, or our failure to meet these projections;
•failure of securities analysts to initiate or maintain coverage of our company, changes in financial estimates and publication of other news by any securities analysts who follow our company, or our failure to meet these estimates or the expectations of investors;
•ratings changes by any securities analysts who follow our company;
•announcements by us or our competitors of significant technical innovations, acquisitions, strategic partnerships, joint ventures, or capital commitments;
•changes in operating performance and stock market valuations of other technology companies generally, or those in our industry in particular;
•price and volume fluctuations in the overall stock market from time to time, including as a result of trends in the economy as a whole;
•changes in accounting standards, policies, guidelines, interpretations, or principles;
•actual or anticipated developments in our business or our competitors’ businesses or the competitive landscape generally;
•changes in our pricing models and practices or those of our competitors;
•developments or disputes concerning our intellectual property or our products and platform capabilities, or third-party proprietary rights;
•cybersecurity attacks or incidents;
•announced or completed acquisitions of businesses or technologies by us or our competitors;
•new laws or regulations or new interpretations of existing laws, or regulations applicable to our business;
•changes in our board of directors or management;
•announced or completed equity or debt transactions involving our securities;
•sales of shares of our common stock by us, our officers, directors, or other stockholders;
•lawsuits filed or threatened against us; and
•other events or factors, including those resulting from war, incidents of terrorism, public health epidemics, or responses to these events.
In addition, the market for technology stocks and the stock markets in general have experienced extreme price and volume fluctuations. Stock prices of many technology companies have fluctuated in a manner unrelated or disproportionate to the operating performance of those companies. Moreover, fluctuations in our quarterly operating results and the price of our common stock may be particularly pronounced in the current economic environment due to the uncertainty caused by and the unprecedented nature of the COVID-19 pandemic. In the past, stockholders have instituted securities class action litigation following periods of market volatility. If we were to become involved in securities litigation, it could subject us to substantial
31
costs, divert resources and the attention of management from our business, and adversely affect our business, results of operations, financial condition, and cash flows. A decline in the value of our common stock, including as a result of one or more factors set forth above, may result in substantial losses for our stockholders.
Substantial future sales of shares of our common stock could cause the market price of our common stock to decline.
The market price of our common stock could decline as a result of substantial sales of our common stock, particularly sales by our directors, executive officers, and significant stockholders, a large number of shares of our common stock becoming available for sale, or the perception in the market that holders of a large number of shares intend to sell their shares. Further, the Notes may become in the future convertible at the option of their holders prior to their scheduled terms under certain circumstances. Any sales in the public market of the common stock issuable upon such conversion could adversely affect prevailing market prices of our common stock. Additionally, the shares of common stock subject to outstanding options under our equity incentive plans and the shares reserved for future issuance under our equity incentive plans, as well as shares issuable upon vesting of restricted stock awards, will become eligible for sale in the public market in the future, subject to certain legal and contractual limitations. We have also registered shares of common stock that we may issue under our employee equity incentive plans. Accordingly, these shares may be able to be sold freely in the public market upon issuance as permitted by any applicable vesting requirements.
Anti-takeover provisions in our charter documents and under Delaware law could make an acquisition of our company more difficult, limit attempts by our stockholders to replace or remove our current management and limit the market price of our common stock.
Provisions in our amended and restated certificate of incorporation and amended and restated bylaws may have the effect of delaying or preventing a change of control or changes in our management. Our amended and restated certificate of incorporation and amended and restated bylaws include provisions that:
•authorize our board of directors to issue, without further action by the stockholders, shares of undesignated preferred stock with terms, rights, and preferences determined by our board of directors that may be senior to our common stock;
•require that any action to be taken by our stockholders be effected at a duly called annual or special meeting and not by written consent;
•specify that special meetings of our stockholders can be called only by the Chair of our board of directors, our Chief Executive Officer, or by our board of directors pursuant to a resolution adopted by a majority of the total number of authorized directors;
•establish an advance notice procedure for stockholder proposals to be brought before an annual meeting, including proposed nominations of persons for election to our board of directors;
•provide that our board of directors is divided into three classes, with each class serving three-year staggered terms, until our 2023 annual meeting of stockholders;
•prohibit cumulative voting in the election of directors;
•provide that our directors may be removed only for cause until our 2023 annual meeting of stockholders;
•provide that vacancies on our board of directors may be filled only by a majority of directors then in office, even though less than a quorum; and
•require the approval of our board of directors or the holders of at least sixty-six and two thirds percent (66 2/3%) of our outstanding shares of capital stock to amend our bylaws and certain provisions of our certificate of incorporation.
These provisions may frustrate or prevent any attempts by our stockholders to replace or remove our current management by making it more difficult for stockholders to replace members of our board of directors, which is responsible for appointing the members of our management. In addition, because we are incorporated in Delaware, we are subject to the provisions of Section 203 of the Delaware General Corporation Law, which generally prohibits a Delaware corporation from engaging in any of a broad range of business combinations with any “interested” stockholder for a period of three years following the date on which the stockholder became an “interested” stockholder. Any delay or prevention of a change of control transaction or changes in our management could cause the market price of our common stock to decline.
32
Our amended and restated certificate of incorporation provides that the Court of Chancery of the State of Delaware and the US federal district courts will be the exclusive forums for the adjudication of certain disputes, which could limit our stockholders’ ability to obtain a favorable judicial forum for disputes with us or our directors, officers, or employees.
Our amended and restated certificate of incorporation provides that the Court of Chancery of the State of Delaware is the sole and exclusive forum for:
•any derivative action or proceeding brought on our behalf;
•any action asserting a claim of breach of a fiduciary duty owed by any director, officer, or other employee of New Relic to us or our stockholders;
•any action asserting a claim against us or any of our directors, officers, or other employees arising pursuant to any provision of the Delaware General Corporation Law, our amended and restated certificate of incorporation, or our amended and restated bylaws; and
•any action asserting a claim against us or any of our directors, officers, or other employees that is governed by the internal affairs doctrine.
This exclusive-forum provision would not apply to suits brought to enforce a duty or liability created by the Securities Act of 1933, as amended, the Exchange Act or any claim for which the U.S. federal courts have exclusive jurisdiction. Furthermore, Section 22 of the Securities Act creates concurrent jurisdiction for federal and state courts over all such Securities Act actions. Accordingly, both state and federal courts have jurisdiction to entertain such claims. To prevent having to litigate claims in multiple jurisdictions and the threat of inconsistent or contrary rulings by different courts, among other considerations, our amended and restated certificate of incorporation further provides that the federal district courts of the United States will be the exclusive forum for resolving any complaint asserting a cause or causes of action arising under the Securities Act, including all causes of action asserted against any defendant to such complaint. For the avoidance of doubt, this provision is intended to benefit and may be enforced by us, our officers and directors, the underwriters for any offering giving rise to such complaint, and any other professional entity whose profession gives authority to a statement made by that person or entity and who has prepared or certified any part of the documents underlying the offering. While the Delaware courts have determined that such choice of forum provisions are facially valid, a stockholder may nevertheless seek to bring a claim in a venue other than those designated in the exclusive forum provisions. In such instance, we would expect to vigorously assert the validity and enforceability of the exclusive forum provisions of our amended and restated certificate of incorporation. This may require significant additional costs associated with resolving such action in other jurisdictions and there can be no assurance that the provisions will be enforced by a court in those other jurisdictions.
These exclusive-forum provisions may limit a stockholder’s ability to bring a claim in a judicial forum that it finds favorable for disputes with us or our directors, officers, or other employees, which may discourage lawsuits against us and our directors, officers, and other employees.
We do not intend to pay dividends on our common stock so any returns will be limited to changes in the value of our common stock.
We have never declared or paid any cash dividends on our common stock. We currently anticipate that we will retain future earnings for the development, operation, and expansion of our business and do not anticipate declaring or paying any cash dividends for the foreseeable future. In addition, our ability to pay cash dividends on our common stock may be prohibited or limited by the terms of any future debt financing arrangements. Any return to stockholders will therefore be limited to the increase, if any, of our stock price, which may never occur.
If securities or industry analysts do not continue to publish research or publish inaccurate or unfavorable research about our business, our stock price and trading volume could decline.
The trading market for our common stock depends in part on the research and reports that securities or industry analysts publish about us or our business. If industry analysts cease coverage of us, the trading price for our common stock would be negatively affected. If one or more of the analysts who cover us downgrade our common stock or publish inaccurate or unfavorable research about our business, our common stock price would likely decline. If one or more of these analysts cease coverage of us or fail to publish reports on us regularly, demand for our common stock could decrease, which might cause our common stock price and trading volume to decline. In addition, independent industry analysts, such as Gartner and Forrester, often provide reviews of our products and platform capabilities, as well as those of our competitors, and perception of our offerings in the marketplace may be significantly influenced by these reviews. We have no control over what these industry analysts report, and because industry analysts may influence current and potential customers, our brand could be harmed if they do not provide a positive review of our products and platform capabilities or view us as a market leader.
33
General Risk Factors
Our estimates of market opportunity and forecasts of market growth may prove to be inaccurate, and even if the market in which we compete achieves the forecasted growth, our business could fail to grow at similar rates, if at all.
Market opportunity estimates and growth forecasts are subject to significant uncertainty and are based on assumptions and estimates that may not prove to be accurate, especially in a volatile economic environment. Our estimates and forecasts relating to the size and expected growth of our market may prove to be inaccurate. Even if the market in which we compete meets our size estimates and forecasted growth, our business could fail to grow at similar rates, if at all.
Natural disasters and other events beyond our control could harm our business.
Natural disasters or other catastrophic events may cause damage or disruption to our operations, international commerce, and the global economy, and thus could have a strong negative effect on us. Our business operations are subject to interruption by natural disasters, fire, power shortages, pandemics, including the ongoing COVID-19 pandemic, effects of climate change and other events beyond our control. We rely on our network and third-party infrastructure and enterprise applications, internal technology systems, and our website for our development, marketing, operational support, hosted products, and sales activities. The west coast of the United States contains active earthquake zones and this area has also historically experienced, and is projected to continue to experience, climate-related events including drought and water scarcity, warmer temperatures, wildfires and air quality impacts and power shut-offs associated with wildfire prevention. Although we maintain crisis management and disaster response plans, in the event of a major earthquake, hurricane, or catastrophic event such as fire, power loss, telecommunications failure, cyber-attack, war, or terrorist attack, we may be unable to continue our operations and may endure system interruptions, reputational harm, delays in our product development, lengthy interruptions in service, breaches of data security, and loss of critical data, all of which could have an adverse effect on our future operating results.
Weakened global economic conditions may harm our industry, business, and results of operations.
Our overall performance depends in part on worldwide economic conditions. Global financial developments and downturns seemingly unrelated to us or the information technology industry may harm us. The United States and other key international economies have been impacted in the past by falling demand for a variety of goods and services, restricted credit, poor liquidity, reduced corporate profitability, volatility in credit, equity and foreign exchange markets, bankruptcies, inflation, rising interest rates and overall uncertainty with respect to the economy. Further, global events such as Russia’s recent invasion of Ukraine may lead to disruption, instability, deterioration and volatility in global markets and industries that could negatively impact our business, financial condition and results of operations.
Furthermore, the revenue growth and potential profitability of our business depends on demand for software applications and products generally, and application performance monitoring and our other offerings specifically. In addition, our revenue is dependent on the number of users of our products and the degree of adoption of such users with respect to our products and platform capabilities. Historically, during economic downturns there have been reductions in spending on information technology systems as well as pressure for extended billing terms and other financial concessions, which would limit our ability to grow our business and negatively affect our operating results. These conditions affect the rate of information technology spending and could adversely affect our customers’ ability or willingness to purchase our products, delay prospective customers’ purchasing decisions, reduce the value or duration of their commitments or amount of their spend, or affect renewal rates, all of which could harm our operating results.
The nature of our business requires the application of complex revenue recognition rules. Significant changes in U.S. GAAP from the adoption of recently issued accounting standards could materially affect our financial position and results of operations.
We prepare our financial statements in accordance with GAAP, which is subject to interpretation or changes by the Financial Accounting Standards Board, the SEC, and other various bodies formed to promulgate and interpret appropriate accounting principles. New accounting pronouncements and changes in accounting principles have occurred in the past and are expected to occur in the future, which may have a significant effect on our financial results. Any difficulties in implementation of changes in accounting principles, including the ability to modify our accounting systems, could cause us to fail to meet our financial reporting obligations, which could result in regulatory discipline and harm investors’ confidence in us. In addition, certain choices in the method of implementation of any new standard that may be adopted may have an adverse impact on our potential as an acquirer or an acquiree in a business combination.
34
We may not be able to secure additional financing on favorable terms, or at all, to meet our future capital needs. If additional capital is not available, we may have to delay, reduce, or cease certain investments.
We may in the future require additional capital to operate our business and respond to business opportunities that may arise, including the need to develop new products and platform capabilities or enhance our existing products and platform capabilities, enhance our operating infrastructure, protect our intellectual property, pursue possible acquisitions of complementary businesses and technologies, respond to a decline in the level of adoption or usage of our platform, or other circumstances. We may not be able to timely secure additional debt or equity financing on favorable terms, or at all. Any debt financing obtained by us could involve restrictive covenants relating to financial and operational matters, which may make it more difficult for us to obtain additional capital and to pursue business opportunities, including potential acquisitions, and could require us to use a portion of our cash flows to make debt service payments, which could place us at a competitive disadvantage relative to our less leveraged peers. If we raise additional funds through further issuances of equity, convertible debt securities, or other securities convertible into equity, our existing stockholders could suffer significant dilution in their percentage ownership of our company, and any new equity securities we issue could have rights, preferences, and privileges senior to those of holders of our common stock, including registration rights. If we are unable to obtain adequate financing or financing on terms satisfactory to us when we require it, our ability to support our business and to respond to business challenges could be significantly limited, and our business, operating results, financial condition, and prospects could be harmed.
The requirements of being a public company and a growing and increasingly complex organization may strain our resources, divert management’s attention, and affect our ability to attract and retain executive management and qualified board members.
We are subject to the reporting requirements of the Exchange Act, the Sarbanes-Oxley Act, the Dodd-Frank Wall Street Reform and Consumer Protection Act of 2010, the listing requirements of the New York Stock Exchange, and other applicable securities rules and regulations. Compliance with these rules and regulations increases our legal and financial compliance costs, make some activities more difficult, time-consuming, or costly, and increases demand on our systems and resources.
In addition, changing laws, regulations, and standards relating to corporate governance and public disclosure are creating uncertainty for public companies, increasing legal and financial compliance costs, and making some activities more time consuming. These laws, regulations, and standards are subject to varying interpretations, in many cases due to their lack of specificity, and, as a result, their application in practice may evolve over time as new guidance is provided by regulatory and governing bodies or as market practices develop. This could result in continuing uncertainty regarding compliance matters and higher costs necessitated by ongoing revisions to disclosure and governance practices.
As a result of disclosure of information in our filings with the SEC, our business and financial condition have become more visible, which we believe may result in threatened or actual litigation, including by competitors and other third parties. If such claims are successful, our business and operating results could be adversely affected, and even if the claims do not result in litigation or are resolved in our favor, these claims, and the time and resources necessary to resolve them, could divert the resources of our management and adversely affect our business and operating results.
From time to time, public companies are subject to campaigns by investors seeking to increase short-term stockholder value through actions such as financial restructuring, increased debt, special dividends, stock repurchases, management changes or sales of assets or the entire company. If stockholders attempt to effect such changes or acquire control over us, responding to such actions would be costly, time-consuming and disruptive, which could adversely affect our results of operations, financial results and the value of our common stock. These factors could also make it more difficult for us to attract and retain qualified employees, executive officers and members of our board of directors.
Item 1B. Unresolved Staff Comments
Not applicable.
35
Item 2. Properties
Our corporate headquarters is located in San Francisco, California and consists of approximately 73,000 square feet of space under a lease that expires in July 2027.
We do not own any real property and we lease or otherwise rent all of our facilities. We intend to procure additional space as we add employees and expand geographically. We believe our facilities are adequate and suitable for our current needs and that, should it be needed, suitable additional or alternative space will be available to accommodate any such expansion of our operations.
Item 3. Legal Proceedings
From time to time, we may be subject to legal proceedings and claims arising in the ordinary course of our business. We are not presently a party to any legal proceedings that, if determined adversely to us, would individually or taken together have a material adverse effect on our business, results of operations, financial condition or cash flows. We have received, and may in the future continue to receive, claims from third parties asserting, among other things, infringement of their intellectual property rights. Future litigation may be necessary to defend ourselves, our partners and our customers by determining the scope, enforceability and validity of third-party proprietary rights, or to establish our proprietary rights. The results of any current or future litigation cannot be predicted with certainty, and regardless of the outcome, litigation can have an adverse impact on us because of defense and settlement costs, diversion of management resources, and other factors.
Item 4. Mine Safety Disclosures
Not applicable.
36
PART II
Item 5. Related Stockholder Matters and Issuer Purchases of Equity Securities
Market Information for Common Stock
Our common stock is listed on the New York Stock Exchange under the symbol “NEWR.”
Holders of Record
As of May 10, 2022, there were 83 holders of record of our common stock. Because many of our shares are held by brokers and other institutions on behalf of stockholders, we are unable to estimate the total number of stockholders represented by these record holders.
Dividend Policy
We have never declared or paid any cash dividend on our capital stock. We currently intend to retain all available funds and any future earnings for use in the operation of our business and do not anticipate paying any dividends on our common stock in the foreseeable future, if at all. Any future determination to declare cash dividends will be made at the discretion of our board of directors, subject to applicable laws, and will depend on a number of factors, including our financial condition, operating results, capital requirements, contractual restrictions, general business conditions, and other factors that our board of directors may deem relevant.
Recent Sales of Unregistered Securities
None.
Proceeds from Registered Securities
None.
37
Stock Performance Graph
This performance graph shall not be deemed “soliciting material” or to be “filed” with the SEC for purposes of Section 18 of the Exchange Act, or otherwise subject to the liabilities under that Section, and shall not be deemed to be incorporated by reference into any filing of New Relic, Inc. under the Securities Act.
The following graph compares the cumulative total return to stockholders on our common stock relative to the cumulative total returns of the Standard & Poor’s 500 Index, or S&P 500, and the Standard & Poor’s Composite 1500 Information Technology Index, or S&P 1500 IT. An investment of $100 (with reinvestment of all dividends) is assumed to have been made in our common stock and in each index on March 31, 2017, and its relative performance is tracked through March 31, 2022. The returns shown are based on historical results and are not intended to suggest future performance.
Comparison of Cumulative Total Return
Among New Relic, Inc., the S&P 500 Index, and the S&P Composite 1500 IT Index
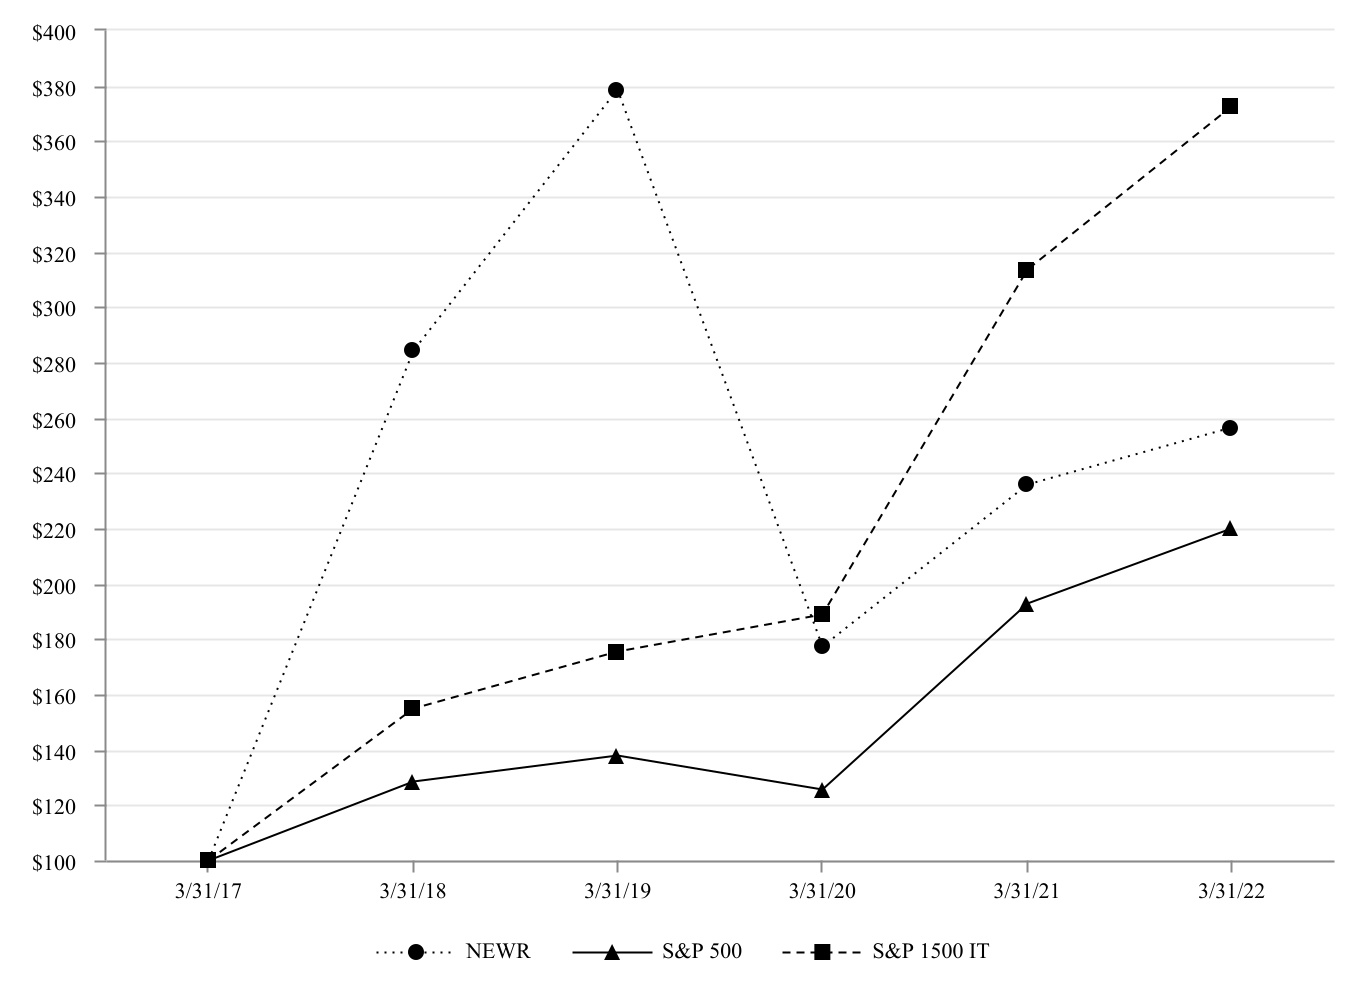
| 3/31/17 | 3/31/18 | 3/31/19 | 3/31/20 | 3/31/21 | 3/31/22 | ||||||||||||||||||||||||||||||
| New Relic, Inc. | $ | 100.00 | $ | 284.20 | $ | 378.45 | $ | 177.30 | $ | 235.74 | $ | 256.44 | |||||||||||||||||||||||
| S&P 500 | $ | 100.00 | $ | 128.21 | $ | 137.61 | $ | 125.48 | $ | 192.88 | $ | 219.95 | |||||||||||||||||||||||
| S&P Composite 1500 Information Technology | $ | 100.00 | $ | 154.73 | $ | 175.39 | $ | 188.63 | $ | 313.37 | $ | 372.41 | |||||||||||||||||||||||
Issuer Purchases of Equity Securities
None.
38
Item 6. [Reserved]
39
Item 7. Management’s Discussion and Analysis of Financial Condition and Results of Operations
The following discussion and analysis of our financial condition and results of operations should be read in conjunction with our consolidated financial statements and related notes appearing elsewhere in this Annual Report on Form 10-K. The following discussion and analysis contains forward-looking statements that involve risks and uncertainties. When reviewing the discussion below, you should keep in mind the substantial risks and uncertainties that could impact our business. In particular, we encourage you to review the risks and uncertainties described in Part I, Item 1A “Risk Factors” included elsewhere in this report. These risks and uncertainties could cause actual results to differ materially from those projected in forward-looking statements contained in this report or implied by past results and trends. Forward-looking statements are statements that attempt to forecast or anticipate future developments in our business, financial condition or results of operations. See the section titled “Special Note Regarding Forward-Looking Statements” in this report. These statements, like all statements in this report, speak only as of their date (unless another date is indicated), and we undertake no obligation to update or revise these statements in light of future developments, except as required by law.
Overview
New Relic delivers a software platform for customers to land all of their telemetry data quickly and affordably in one place and derive actionable insights from that data in a unified front-end application. This category of software products is generally referred to as observability. Our customers use our software platform to ensure that they can observe and operate all of the components of their digital infrastructure and provide a quality digital experience for their customers. With a unified front end, purpose built on top of the world’s most powerful telemetry data platform, the New Relic platform helps our users get a comprehensive and consistent view of their digital estate.
At present, most observability software is targeted at a small subset of the developer community that works in the “operate” phase of the developer lifecycle. These engineers are primarily concerned with the availability of the applications and infrastructure that are the primary components of a customer’s digital environment. However, a key component of our multi-year strategy is to help all software developers realize the largely dormant value of telemetry data. We fundamentally believe that telemetry data is valuable in all of the phases of the developer lifecycle: plan, build, deploy and operate.
To deliver on this strategy, we make data ingest so affordable that customers have no reservations about populating our data platform with their growing amounts of telemetry data. We believe that engineers are attracted to very large data sets, and over time we intend to introduce ways for engineers in the plan, build and deploy phases of the developer lifecycle to realize significant value from that data.
We believe we offer the lowest prices for data ingest in the industry; we can do this because we have built a massively scalable proprietary telemetry data platform, which is a unique competitive advantage and we are able to leverage that scale to offer more cost-effective solutions. Our unified front end and data-centric approach to observability gives our users a consistent and comprehensive view of their digital environment. This is in contrast to most other vendors we compete against that take an application-centric approach that forces users to toggle between a variety of stand-alone applications on top of purpose-built databases, effectively creating silos of data.
Our customers span the continuum from startups to the world’s largest corporations; the common thread among all of the users of our products is a desire to offer their constituents a top-tier digital experience. We primarily sell our platform on a consumption model; customers on this pricing model only pay for data ingest and provisioned users. We engage with prospects and customers directly through our field, inside sales teams and on our website, as well as indirectly through channel partners. The majority of our customers are on either “Pay as You Go” contracts where they are charged for usage in arrears, or commitment contracts where they commit to a minimum spend over their contracted period in exchange for a discount on their usage pricing. The majority of our commitment contracts are one year in duration and are invoiced upfront. When a customer consumes either data or users in excess of their aggregate commitment, they are charged the same rate they negotiated in the commitment, and are invoiced for incremental charges when their consumption exceeds their commitment. When we enter into multi-year commitment contracts, we typically invoice the customer on an annual basis.
We offer a free tier of our New Relic platform. As a result, our direct sales prospects may be familiar with our platform and may already be using it in a limited fashion. A core component of our growth strategy is to provide a friction-free environment for developers to familiarize themselves with our solutions, and then offer incremental opportunities to derive more value from our products either by in-product support, or engaging with our technically oriented customer adoption team.
We also generate revenue from services, which consist primarily of fees associated with consulting and training services. Revenue from services accounts for a de minimis amount of our total revenue. We expect to continue to invest in our
40
product and go-to-market organizations as we believe both the self-serve nature of our products, and the customer specific attention from our technologists, play an important role in accelerating our customers’ realization of the benefits of our platform, which helps drive customer retention and expansion.
Our revenue for the fiscal years ended March 31, 2022 and 2021 was $785.5 million and $667.6 million, respectively, representing year-over-year growth of 18%. We continue to make significant expenditures and investments, including in personnel-related costs, sales and marketing, infrastructure and operations, and have incurred net losses in each period since our inception, including net losses attributable to New Relic of $250.4 million and $192.6 million for the fiscal years ended March 31, 2022 and 2021, respectively. Our accumulated deficit as of March 31, 2022 was $783.3 million.
Internationally, we currently offer our products in Europe, the Middle East, and Africa, (“EMEA”); Asia-Pacific, (“APAC”); and other non-U.S. locations, as determined based on the billing address of our customers, and our revenue from those regions constituted 15%, 10%, and 7%, respectively, of our revenue for the fiscal year ended March 31, 2022, and 16%, 9%, and 6%, respectively, of our revenue for the fiscal year ended March 31, 2021. We believe there is an opportunity to increase our international revenue overall and as a proportion of our revenue, and we are increasingly investing in our international operations and intend to invest in further expanding our footprint in international markets.
Our employee headcount has increased to 2,217 employees as of March 31, 2022 from 2,168 as of March 31, 2021, and we plan to continue to invest aggressively in the growth of our business to take advantage of our market opportunity.
Impact of the Ongoing COVID-19 Pandemic
The COVID-19 pandemic continues to affect the U.S. and the world and has resulted in authorities implementing numerous and changing measures to contain the virus. The extent of the impact of the COVID-19 pandemic on our operational and financial performance will continue to depend on certain developments, including the duration of the pandemic, the successful rollout of vaccines and the efficacy and durability of such vaccines, especially in light of the emergence of new variant strains; impact on our customers and our sales cycles; impact on our customer, employee, and industry events; impact on our employee recruitment and attrition; and effect on our vendors, all of which remain uncertain and cannot be predicted at this time.
Since July 1, 2021, a number of our offices in certain locations were re-opened in limited capacities. As our offices reopen, we expect to incur incremental expenses as we resume onsite services and related in-office costs. While certain travel bans and other restrictions that were implemented by federal, state, or local authorities at the beginning of the pandemic were relaxed earlier in the year, recently, due to the proliferation of the Omicron variant, among other developments, some of these restrictions have been re-imposed, and new restrictions may be implemented. We are continuing to actively monitor the situation and have taken and may take further actions that alter our business operations as may be required or recommended by federal, state, or local authorities, or that we determine are in the best interests of our employees, customers, partners, suppliers, and stockholders. As the development, distribution and public acceptance of treatments and vaccines progress, we continue to evaluate and refine our operational strategies. Our revenue and deferred revenue have been, in part, negatively impacted by the slowdown in activity associated with the COVID-19 pandemic, but at this point, the extent of any continuing impact to our financial condition or results of operations, including cash flows, is uncertain, particularly as the COVID-19 pandemic continues to persist for an extended period of time. Other factors affecting our performance are discussed below, although we caution you that the COVID-19 pandemic may also further impact these factors.
Factors Affecting Our Performance
Market Adoption of Our Platform. Our success, including our rate of customer expansions and renewals, is dependent on the market adoption of our platform. With the introduction of new technologies, the evolution of our platform and new market entrants, competition has intensified and we expect competition to further intensify in the future. We employ a land and expand business model centered around offering a platform that is open, connected and programmable. We believe that we have built a highly differentiated platform and we intend to continue to invest in building additional offerings, features and functionality that expand our capabilities and facilitate the extension of our platform to new use cases. We also intend to continue to evaluate strategic acquisitions and investments in businesses and technologies to drive product and market expansion. Our ability to improve market adoption of our platform will also depend on a number of other factors, including the competitiveness and pricing of our products, offerings of our competitors, success of international expansion, and effectiveness of our sales and marketing efforts. With the shift in our pricing strategy, which now relies primarily upon a per-user license fee and payment based on the quantity of data ingested, we have more closely tied our revenue to the usage of our platform. Together with this pricing strategy, we also launched a new, robust free tier and improved self-service capabilities, which we expect to result in a material increase in our ability to attract and convert free users into new paying customers.
41
Retention and Expansion. A key factor in our success is the retention and expansion of our platform usage with our existing customers. In order for us to continue to grow our business, it is important to generate additional revenue from our existing customers, and we intend to do this in several ways. As we improve our existing products and platform capabilities and introduce new products, we believe that the demand for our products will generally grow. We also believe that there is a significant opportunity for us to increase our revenue from sales to our current customers as they become more familiar with our products and adopt our products to address additional business use cases. In addition, we believe the shift in our pricing strategy will allow sales resources to focus energy on helping customers increase their data ingestion and the number of users and use cases.
Key Operating Metrics
We review the following key metrics to evaluate our business, measure our performance, identify trends affecting our business, formulate business plans, and make key strategic decisions. The calculation of the key operating metrics discussed below may differ from other similarly titled metrics used by other companies, securities analysts, or investors.
Number of Active Customer Accounts. We believe that the number of Active Customer Accounts is an important indicator of the growth of our business, the market adoption of our platform and future revenue trends. We define an Active Customer Account at the end of any period as an individual account, as identified by a unique account identifier, aggregated at the parent hierarchy level, for which we have recognized any revenue in the fiscal quarter. As our customers grow their businesses and extend the use of our platform, they sometimes create multiple customer accounts with us for operational or other reasons. As such, when we identify a parent organization that has created a new Active Customer Account, this new Active Customer Account is combined with, and revenue from this new Active Customer Account is included with, the original Active Customer Account. In addition, our Active Customer Accounts metric is subject to adjustments for acquisitions, consolidations, spin-offs, and other market activity. We round the number of Active Customer Accounts that we report as of a particular date down to the nearest hundred.
For the three-month period ended March 31, 2022, we had 14,800 Active Customer Accounts, which is up from 14,100 Active Customer Accounts for the three-month period ended March 31, 2021 and is up sequentially from 14,600 Active Customer Accounts for the three-month period ended December 31, 2021.
| Mar 31, 2022 | Dec 31, 2021 | Sep 30, 2021 | Jun 30, 2021 | ||||||||||||||||||||
| Active Customer Accounts | 14,800 | 14,600 | 14,300 | 14,100 | |||||||||||||||||||
Number of Active Customer Accounts with Revenue Greater than $100,000. Large customer relationships generally lead to scale and operating leverage in our business model. Compared with smaller customers, large customers present a greater opportunity for us to sell additional capacity because they often have larger budgets, a wider range of potential use cases, and greater potential for migrating new workloads to our platform over time. As a measure of our ability to scale with our customers and attract large enterprises to our platform, we count the number of Active Customer Accounts for which we have recognized greater than $100,000 in revenue in the trailing 12-months.
For the three-month period ended March 31, 2022, we had 1,099 Active Customer Accounts with trailing 12-month revenue over $100,000, which was a 16% increase compared to 945 for the three-month period ended as of March 31, 2021 and a 3% increase compared to 1,064 for the three-month period ended December 31, 2021.
| Mar 31, 2022 | Dec 31, 2021 | Sep 30, 2021 | Jun 30, 2021 | ||||||||||||||||||||
| Active Customer Accounts > $100,000 | 1,099 | 1,064 | 1,011 | 964 | |||||||||||||||||||
Percentage of Revenue from Active Customer Accounts Greater than $100,000. In addition to the number of Active Customer Accounts with revenue greater than $100,000, we also look at our percentage of overall revenue we receive from those accounts in any given quarter as an indicator of our relative performance when selling to our large customer relationships compared to our smaller revenue accounts. An increase in the percentage of revenue reflects relative higher growth in our large customer relationships, whereas a decrease in the percentage reflects relative higher growth in our performance with smaller revenue customers.
Our percentage of revenue from Active Customers with trailing 12-month revenue greater than $100,000 was 82% for the three-month period ended March 31, 2022, compared to 79% for the three-month period ended March 31, 2021 and 81% for the three-month period ended December 31, 2021.
42
| Mar 31, 2022 | Dec 31, 2021 | Sep 30, 2021 | Jun 30, 2021 | ||||||||||||||||||||
| Percentage of Active Customer Accounts > $100,000 | 82 | % | 81 | % | 81 | % | 79 | % | |||||||||||||||
Net Revenue Retention Rate. We believe the growth in use of our platform by our existing Active Customer Accounts is an important measure of the health of our business and our future growth prospects. We monitor our net revenue retention rate (“NRR”) to measure this growth. We expect our NRR to increase when Active Customer Accounts increase their usage of a product, extend their usage of a product to new applications or adopt a new product. We expect our NRR to decrease when Active Customer Accounts cease or reduce their usage of a product.
To calculate NRR, we first identify the cohort of Active Customer Accounts that were Active Customer Accounts in the same quarter of the prior fiscal year. Next, we identify the measurement period as the 12-month period ending with the period reported and the prior comparison period as the corresponding period in the prior year. NRR is the quotient obtained by dividing the revenue generated from a cohort of Active Customer Accounts in the measurement period by the revenue generated from that same cohort in the prior comparison period.
Our NRR increased year-over-year to 119% for the period ended March 31, 2022 compared to 112% for the period ended March 31, 2021 and increased quarter-over-quarter from 116% for the period ended December 31, 2021.
| Mar 31, 2022 | Dec 31, 2021 | Sep 30, 2021 | Jun 30, 2021 | ||||||||||||||||||||
| Net Revenue Retention Rate | 119 | % | 116 | % | 112 | % | 111 | % | |||||||||||||||
Key Components of Results of Operations
Revenue
For the periods presented, we offered access to our products and/or platform under subscription and consumption-based plans that include service and support for one or more of our products. For our paying customers, we offer a variety of pricing plans based on the particular product purchased. Our commitment plans typically have terms of one year, although some of our customers commit for shorter or longer periods; our Pay as You Go plans do not have a commitment.
Most of our revenue comes from contracts that are non-cancellable over the contract term. Our shift to a consumption-based model allows our customers to choose lower up-front commitments and to instead pay for their consumption in excess of their commitments. Meanwhile, if consumption by our users exceeds their up-front commitments, we would see an increase in the amount of revenue that we recognize from those customers.
We have and may continue to experience volatility for our remaining performance obligations and deferred revenue as a result of our shift to our consumption pricing model. We had remaining performance obligations in the amount of $706.1 million and $726.8 million as of March 31, 2022 and March 31, 2021, respectively, consisting of both billed and unbilled consideration. Deferred revenue consists of billings or payments received in advance of revenue being recognized, and can fluctuate with changes in billing frequency and other factors. As a result of these factors, as well as our mix of subscription plans and billing frequencies, we do not believe that changes in our remaining performance obligations and deferred revenue in a given period are directly correlated with our revenue growth in that period. The year over year decline in remaining performance obligations is consistent with our transition from a subscription to a consumption model.
Historically, we have received a higher volume of orders in the fourth fiscal quarter of each year, and to a lesser extent our third fiscal quarter of each year. As a result, we have historically seen higher cash collections in the first and fourth fiscal quarters of each year, and our sequential growth in remaining performance obligations has historically been highest in the fourth fiscal quarter of each year, and to a lesser extent our third fiscal quarter of each year. With our shift to a consumption based pricing model, we expect over time that our revenue will more closely approximate our customer usage of our products and services, and thereby our revenue may experience seasonal fluctuations based upon our customer consumption patterns.
Cost of Revenue
Cost of revenue consists of expenses relating to hosting-related costs, salaries and benefits of operations and global customer support personnel, data center operations, depreciation and amortization, consulting costs, and payment processing fees. Personnel related costs consist of salaries, benefits, bonuses and stock-based compensation. We plan to continue increasing the capacity, capability, and reliability of our infrastructure to support the growth of our customer adoption and the number of products we offer, as customer usage continues to grow. Additionally, we are continuing to build out services and functionality in the public cloud with a view to migrating our entire platform over time from third-party data center hosting
43
facilities to public cloud hosting providers. We are continuing to decrease the amount of capital expenditures on hosting equipment for use in our data center hosting facilities as we transition to greater dependence on cloud hosting providers. This public cloud migration has resulted and will continue to result in significant increased costs in the short term as we are incurring cloud migration costs, increased data ingest costs, as well as costs to maintain our data center operations.
Gross Profit and Margin
Gross profit is revenue less cost of revenue. Gross margin is gross profit expressed as a percentage of revenue. Our gross margin has been, and will continue to be, affected by a number of factors, including the timing and extent of our investments in our hosting-related costs, operations and global customer support personnel, and the amortization of capitalized software. Although we expect our gross margin to fluctuate from period to period as a result of these factors, our recent public cloud migration and, to a lesser extent, our pricing transition, have contributed to lower gross margins.
Operating Expenses
Personnel costs, which consist of salaries, benefits, bonuses, stock-based compensation and, with regard to sales and marketing expenses, sales commissions, are the most significant component of our operating expenses.
Research and Development. Research and development expenses consist primarily of personnel costs and an allocation of our general overhead expenses. We continue to focus our research and development efforts on adding new features and products, and increasing the functionality and enhancing the ease of use of our existing products. We capitalize the portion of our software development costs that meets the criteria for capitalization.
We plan to continue to hire employees for our engineering, product management, and design teams to support our research and development efforts. As a result, we expect our research and development expenses to continue to increase in absolute dollars for the foreseeable future, although our research and development expenses may fluctuate from period to period depending on fluctuations in our revenue and the timing and extent of our research and development expenses.
Sales and Marketing. Sales and marketing expenses consist of personnel costs for our sales, marketing, and business development employees and executives. With our shift to a consumption model pricing strategy, a significant majority of commissions are no longer capitalized and will instead mostly be expensed as incurred. Previously commissions attributable to acquiring new customer contracts were capitalized and amortized on a straight-line basis over the anticipated period of benefit. Therefore, commission expenses will be larger until we have fully recognized the remaining capitalized commissions expenses from prior periods under our subscription model. Sales and marketing expenses also include the costs of our marketing and brand awareness programs, including our free tier offering.
We expect that go-to-market operations in our consumption-based business model will be more efficient, and require less investment, than in our former more traditional subscription model. In furtherance of this strategy shift, we have reallocated some spending from sales and marketing to increase our investment on research and development. While we expect our sales and marketing expenses to decrease as a percentage of our revenue over the long term, our sales and marketing expenses, both in absolute dollars and as a percentage of our revenue, may fluctuate from period to period depending on fluctuations in our revenue and the timing and extent of our sales and marketing expenses.
General and Administrative. General and administrative expenses consist primarily of personnel costs for our administrative, legal, human resources, information technology, finance and accounting employees, and executives. Also included are non-personnel costs, such as legal and other professional fees.
We plan to continue to expand our business both domestically and internationally, and we expect to increase the size of our general and administrative function to support the growth of our business. As a result, we expect our general and administrative expenses to continue to increase in absolute dollars for the foreseeable future. However, we expect our general and administrative expenses to remain flat or decrease modestly as a percentage of our revenue over the long term, although our general and administrative expense, as a percentage of our revenue, may fluctuate from period to period depending on the timing and extent of our general and administrative expenses, such as litigation or accounting costs.
Other Income (Expense)
Other income (expense) consists primarily of interest income, interest expense, foreign exchange gains and losses, and gains on lease modifications.
44
Results of Operations For Fiscal Years Ended March 31, 2022 and 2021
The following tables summarize our consolidated statements of operations data for the fiscal years ended March 31, 2022 and March 31, 2021 and as a percentage of our revenue for those periods. For a discussion of our consolidated statement of operations data for the fiscal year ended March 31, 2020 and as a percentage of revenue for that period, see “Results of Operations for Fiscal Years Ended March 31, 2020, 2019, and 2018” in Part II, Item 7 of our Annual Report on Form 10-K for the fiscal year ended March 31, 2021, filed with the SEC on May 14, 2021, or our Fiscal 2021 Annual Report. For a discussion of our liquidity and capital resources for the fiscal year ended March 31, 2020, see “Liquidity and Capital Resources” in Part II, Item 7 of our Fiscal 2021 Annual Report. The period to period comparison of results is not necessarily indicative of results for future periods.
| Fiscal Year Ended March 31, | |||||||||||
| 2022 | 2021 | ||||||||||
| (in thousands) | |||||||||||
| Consolidated Statements of Operations Data: | |||||||||||
| Revenue | $ | 785,521 | $ | 667,648 | |||||||
| Cost of revenue (1) | 256,279 | 181,564 | |||||||||
| Gross profit | 529,242 | 486,084 | |||||||||
| Operating expenses: | |||||||||||
| Research and development (1) | 211,856 | 174,851 | |||||||||
| Sales and marketing (1) | 394,027 | 361,702 | |||||||||
| General and administrative (1) | 151,912 | 120,931 | |||||||||
| Total operating expenses | 757,795 | 657,484 | |||||||||
| Loss from operations | (228,553) | (171,400) | |||||||||
| Other income (expense): | |||||||||||
| Interest income | 2,862 | 7,888 | |||||||||
| Interest expense | (4,921) | (24,901) | |||||||||
| Other expense, net | (1,170) | (1,918) | |||||||||
| Loss before income taxes | (231,782) | (190,331) | |||||||||
| Income tax provision | 323 | 559 | |||||||||
| Net loss | $ | (232,105) | $ | (190,890) | |||||||
| Net loss and adjustment attributable to redeemable non-controlling interest | $ | (18,297) | $ | (1,720) | |||||||
| Net loss attributable to New Relic | $ | (250,402) | $ | (192,610) | |||||||
(1)Includes stock-based compensation expense as follows:
| Fiscal Year Ended March 31, | |||||||||||
| 2022 | 2021 | ||||||||||
| (in thousands) | |||||||||||
| Cost of revenue | $ | 5,042 | $ | 5,939 | |||||||
| Research and development | 48,355 | 40,964 | |||||||||
| Sales and marketing | 48,986 | 54,695 | |||||||||
General and administrative (2) | 50,656 | 33,545 | |||||||||
Total stock-based compensation expense (3) | $ | 153,039 | $ | 135,143 | |||||||
(2) Includes $9.6 million acceleration of share-based payment expense for the fiscal year ended March 31, 2022 for one of our executives due to his departure at the end of June 2021.
(3) Includes $0.5 million expense for the fiscal year ended March 31, 2022 due to the restructuring activities commenced in April 2021. Refer to Note 18. Restructuring for more information.
45
| Fiscal Year Ended March 31, | |||||||||||
| 2022 | 2021 | ||||||||||
| (as a percentage of revenue) | |||||||||||
| Revenue | 100 | % | 100 | % | |||||||
| Cost of revenue (1) | 33 | 27 | |||||||||
| Gross profit | 67 | 73 | |||||||||
| Operating expenses: | |||||||||||
| Research and development (1) | 27 | 26 | |||||||||
| Sales and marketing (1) | 50 | 54 | |||||||||
| General and administrative (1) | 19 | 18 | |||||||||
| Total operating expenses | 96 | 98 | |||||||||
| Loss from operations | (29) | (25) | |||||||||
| Other income (expense): | |||||||||||
| Interest income | — | 1 | |||||||||
| Interest expense | (1) | (4) | |||||||||
| Other income (expense), net | — | — | |||||||||
| Loss before income taxes | (30) | (28) | |||||||||
| Income tax provision | — | — | |||||||||
| Net loss | (30 | %) | (28 | %) | |||||||
| Net loss and adjustment attributable to redeemable non-controlling interest | (2) | — | |||||||||
| Net loss attributable to New Relic | (32 | %) | (28 | %) | |||||||
(1)Includes stock-based compensation expense as follows:
| Fiscal Year Ended March 31, | |||||||||||
| 2022 | 2021 | ||||||||||
| (as a percentage of revenue) | |||||||||||
| Cost of revenue | 1 | % | 1 | % | |||||||
| Research and development | 6 | 6 | |||||||||
| Sales and marketing | 6 | 8 | |||||||||
| General and administrative | 6 | 5 | |||||||||
| Total stock-based compensation expense | 19 | % | 20 | % | |||||||
Revenue
| Fiscal Year Ended March 31, | Change | ||||||||||||||||||||||
| 2022 | 2021 | Amount | % | ||||||||||||||||||||
| (dollars in thousands) | |||||||||||||||||||||||
| United States | $ | 528,922 | $ | 460,944 | $ | 67,978 | 15 | % | |||||||||||||||
| EMEA | 121,301 | 104,184 | 17,117 | 16 | % | ||||||||||||||||||
| APAC | 79,940 | 62,590 | 17,350 | 28 | % | ||||||||||||||||||
| Other | 55,358 | 39,930 | 15,428 | 39 | % | ||||||||||||||||||
| Total revenue | $ | 785,521 | $ | 667,648 | $ | 117,873 | 18 | % | |||||||||||||||
Revenue increased $117.9 million, or 18%, in the fiscal year ended March 31, 2022 compared to the fiscal year ended March 31, 2021. Our revenue from the United States increased $68.0 million, or 15%, our revenue from EMEA increased $17.1 million, or 16%, our revenue from APAC increased $17.4 million, or 28%, and our revenue from other regions increased $15.4 million, or 39% in the fiscal year ended March 31, 2022 compared to the fiscal year ended March 31, 2021, primarily as a result of growth in our customer base and increase in consumption which resulted in an increase of revenue recognized from variable consideration.
46
Cost of Revenue
| Fiscal Year Ended March 31, | Change | ||||||||||||||||||||||
| 2022 | 2021 | Amount | % | ||||||||||||||||||||
| (dollars in thousands) | |||||||||||||||||||||||
| Cost of revenue | $ | 256,279 | $ | 181,564 | $ | 74,715 | 41 | % | |||||||||||||||
Cost of revenue increased $74.7 million, or 41%, in the fiscal year ended March 31, 2022 compared to the fiscal year ended March 31, 2021. The increase was a result of an increase in hosting-related costs of $75.9 million as a result of the additional expenses incurred in connection with our public cloud migration and an increase in travel expenses of $1.0 million. This was partially offset by a $2.2 million decrease in depreciation and amortization expenses primarily as a result of the reduction of site equipment and acquired technology. This public cloud migration has resulted and will continue to result in significant increased costs in the short term as we are incurring cloud migration costs, increased data ingest costs, as well as costs to maintain our data center operations.
Research and Development
| Fiscal Year Ended March 31, | Change | ||||||||||||||||||||||
| 2022 | 2021 | Amount | % | ||||||||||||||||||||
| (dollars in thousands) | |||||||||||||||||||||||
| Research and development | $ | 211,856 | $ | 174,851 | $ | 37,005 | 21 | % | |||||||||||||||
Research and development expenses increased $37.0 million, or 21%, in the fiscal year ended March 31, 2022 compared to the fiscal year ended March 31, 2021. The increase was primarily the result of an increase in personnel-related costs of $30.0 million, driven by an increase in headcount and compensation-related expenses. The remaining increase was due to a $4.4 million increase in facilities and depreciation expenses and a $2.1 million increase in software subscription and consulting expenses.
Sales and Marketing
| Fiscal Year Ended March 31, | Change | ||||||||||||||||||||||
| 2022 | 2021 | Amount | % | ||||||||||||||||||||
| (dollars in thousands) | |||||||||||||||||||||||
| Sales and marketing | $ | 394,027 | $ | 361,702 | $ | 32,325 | 9 | % | |||||||||||||||
Sales and marketing expenses increased $32.3 million, or 9%, in the fiscal year ended March 31, 2022 compared to the fiscal year ended March 31, 2021. The increase was primarily a result of an increase in personnel-related costs of $20.5 million, driven by an increase in sales commissions expense as a result of our shift to a consumption-business model, where the majority of commissions are expensed as incurred, in addition to historical amortization expense for commissions paid under our subscription-business model. The remaining increase was due to a $4.9 million increase in consulting and software, a $4.5 million increase in marketing programs, and a $4.5 million increase in travel and other expenses. This was partially offset by a $2.2 million decrease in facilities and depreciation expenses.
General and Administrative
| Fiscal Year Ended March 31, | Change | ||||||||||||||||||||||
| 2022 | 2021 | Amount | % | ||||||||||||||||||||
| (dollars in thousands) | |||||||||||||||||||||||
| General and administrative | $ | 151,912 | $ | 120,931 | $ | 30,981 | 26 | % | |||||||||||||||
General and administrative expenses increased $31.0 million, or 26%, in the fiscal year ended March 31, 2022 compared to the fiscal year ended March 31, 2021. The increase was primarily a result of an increase in personnel-related costs of $25.5 million, driven by an increase in headcount and compensation-related expenses. The remaining increase was due to a $3.1 million increase in software subscription and consulting expenses, a $2.5 million increase in other miscellaneous expenses, and a $1.1 million increase in legal, accounting and travel expenses. This was partially offset by a $1.0 million decrease in allocated costs, including facilities and depreciation expenses.
47
Other Income (Expense)
| Fiscal Year Ended March 31, | Change | ||||||||||||||||||||||
| 2022 | 2021 | Amount | % | ||||||||||||||||||||
| (dollars in thousands) | |||||||||||||||||||||||
| Other income (expense) | $ | (3,229) | $ | (18,931) | $ | 15,702 | 83 | % | |||||||||||||||
Other expense decreased by $15.7 million, or 83%, in the fiscal year ended March 31, 2022 compared to the fiscal year ended March 31, 2021. The decrease was primarily due to a $20.0 million decrease in interest expense for our convertible debt due to the adoption of ASU 2020-06, Accounting for Convertible Instruments and Contract on an Entity’s Own Equity (“ASU 2020-06”) in the first quarter of fiscal 2022. This decrease was partially offset by a $5.0 million decrease in interest income.
Provision for Income Tax
| Fiscal Year Ended March 31, | Change | ||||||||||||||||||||||
| 2022 | 2021 | Amount | % | ||||||||||||||||||||
| (dollars in thousands) | |||||||||||||||||||||||
| Income tax provision | $ | 323 | $ | 559 | $ | (236) | 42 | % | |||||||||||||||
Income tax expense decreased $0.2 million, or 42%, from $0.6 million in the fiscal year ended March 31, 2021 to $0.3 million in the fiscal year ended March 31, 2022. The decrease was mostly due to a decrease in U.S. tax expense offset by an increase in foreign tax expense.
Net Loss and Adjustment Attributable to Redeemable Non-controlling Interest
| Fiscal Year Ended March 31, | Change | ||||||||||||||||||||||
| 2022 | 2021 | Amount | % | ||||||||||||||||||||
| (dollars in thousands) | |||||||||||||||||||||||
| Net loss and adjustment attributable to redeemable non-controlling interest | $ | (18,297) | $ | (1,720) | $ | (16,577) | 964 | % | |||||||||||||||
Net loss and adjustment attributable to redeemable non-controlling interest increased by $16.6 million or 964%, in the fiscal year ended March 31, 2022 compared to the fiscal year ended March 31, 2021. The increase in loss and adjustment was related to the redeemable non-controlling interest’s adjustment to estimated redemption value of our joint venture in New Relic K.K., partially offset by share of associated losses.
48
Non-GAAP Financial Measures
Non-GAAP Income (Loss) From Operations
To supplement our consolidated financial statements presented in accordance with GAAP, we provide investors with certain non-GAAP financial measures, including non-GAAP income (loss) from operations and non-GAAP net income (loss) attributable to New Relic. We define non-GAAP income (loss) from operations and non-GAAP net income (loss) attributable to New Relic as the respective GAAP balance, adjusted for, as applicable: (1) stock-based compensation expense, (2) amortization of stock-based compensation capitalized in software development costs, (3) the amortization of purchased intangibles, (4) employer payroll tax expense on equity incentive plans, (5) amortization of debt discount and issuance costs, (6) the transaction costs related to acquisitions, (7) lawsuit litigation cost and other expense, (8) gain or loss from lease modification, (9) adjustment to redeemable non-controlling interest, and (10) restructuring charges. We use non-GAAP financial measures, including non-GAAP income (loss) from operations and non-GAAP net income (loss) attributable to New Relic, internally to understand and compare operating results across accounting periods, for internal budgeting and forecasting purposes, for short- and long-term operating plans, and to evaluate our financial performance. In addition, our bonus opportunity for eligible employees and executives is based in part on non-GAAP income (loss) from operations.
We believe these measures are useful to investors, as a supplement to GAAP measures, in evaluating our operational performance. We have provided below a reconciliation of GAAP loss from operations to non-GAAP income (loss) from operations and a reconciliation of GAAP net loss attributable to New Relic to non-GAAP net income (loss) attributable to New Relic. We believe non-GAAP income (loss) from operations and non-GAAP net income (loss) attributable to New Relic are useful to investors and others in assessing our operating performance due to the following factors:
Stock-based compensation expense and amortization of stock-based compensation capitalized in software development costs. We utilize share-based compensation to attract and retain employees. It is principally aimed at aligning their interests with those of our stockholders and at long-term retention, rather than to address operational performance for any particular period. As a result, share-based compensation expenses vary for reasons that are generally unrelated to financial and operational performance in any particular period.
Amortization of purchased intangibles. We view amortization of purchased intangible assets as items arising from pre-acquisition activities determined at the time of an acquisition. While these intangible assets are evaluated for impairment regularly, amortization of the cost of purchased intangibles is an expense that is not typically affected by operations during any particular period.
Employer payroll tax expense on equity incentive plans. We exclude employer payroll tax expense on equity incentive plans as these expenses are tied to the exercise or vesting of underlying equity awards and the price of our common stock at the time of vesting or exercise. As a result, these taxes may vary in any particular period independent of the financial and operating performance of our business.
Amortization of debt discount and issuance costs. In May 2018, we issued $500.25 million of our 0.50% convertible senior notes due 2023 (the “Notes”), which bear interest at an annual fixed rate of 0.5%. The effective interest rate of the Notes was 5.74%. Effective April 1, 2021 we adopted ASU No. 2020-06, Accounting for Convertible Instruments and Contract on an Entity’s Own Equity. As a result of the adoption, the debt conversion option and debt issuance costs previously attributable to the equity component are no longer presented in equity. Similarly, the debt discount, which was equal to the carrying value of the embedded conversion feature upon issuance, is no longer amortized into income as interest expense over the life of the instrument. This resulted in a $54.2 million decrease to the opening balance of accumulated deficit, a $100.1 million decrease to the opening balance of additional paid-in capital, and a $45.9 million increase to the opening balance of the Notes, net on the consolidated balance sheet. The debt issuance costs were amortized as interest expense. The expense for the amortization of debt issuance costs is a non-cash item, and we believe the exclusion of this interest expense will provide for a more useful comparison of our operational performance in different periods.
Transaction costs related to acquisitions. We may from time to time incur direct transaction costs related to acquisitions. We believe it is useful to exclude such charges because it does not consider such amounts to be part of the ongoing operation of our business.
Lawsuit litigation cost and other expense. We may from time to time incur charges or benefits related to litigation that are outside of the ordinary course of our business. We believe it is useful to exclude such charges or benefits because we do not consider such amounts to be part of the ongoing operation of our business and because of the singular nature of the claims underlying the matter.
49
Gain or loss from lease modification. We may incur a gain or loss from modification related to lease agreements. We believe it is useful to exclude such charges or benefits because we do not consider such amounts to be part of the ongoing operation of our business and because of the singular nature of benefit or charge from such events.
Adjustment to redeemable non-controlling interest. We adjust the value of redeemable non-controlling interest in connection with our joint venture in New Relic K.K. We believe it is useful to exclude the adjustment to redeemable non-controlling interest because it may not be indicative of our future operating results and that investors benefit from an understanding of our operating results without giving effect to this adjustment.
Restructuring charges. In April 2021, we commenced a restructuring plan to realign our cost structure to better reflect significant product and business model innovation over the past 12 months. As a result of the restructuring plan, we incurred charges of approximately $12.6 million for employee terminations and other costs associated with the restructuring plan. Most of these charges consisted of cash expenditures and stock-based compensation expense and were recognized in the first quarter of fiscal 2022. We believe it is appropriate to exclude the restructuring charges because they are not indicative of our future operating results.
Non-GAAP financial measures should not be considered in isolation from, or as a substitute for, financial information prepared in accordance with GAAP. In addition, there are limitations in using non-GAAP financial measures because the non-GAAP financial measures are not prepared in accordance with GAAP and may differ from non-GAAP financial measures used by other companies in our industry and exclude expenses that may have a material impact on our reported financial results.
The following tables present our non-GAAP income (loss) from operations and our non-GAAP net income (loss) attributable to New Relic and reconcile our GAAP loss from operations to non-GAAP income (loss) from operations and our GAAP net loss attributable to New Relic to our non-GAAP net income (loss) attributable to New Relic for the three months ended and fiscal year ended March 31, 2022 and 2021 (in thousands):
| Three Months Ended March 31, | Fiscal Year Ended March 31, | ||||||||||||||||||||||
| 2022 | 2021 | 2022 | 2021 | ||||||||||||||||||||
| GAAP loss from operations | $ | (55,747) | $ | (54,308) | $ | (228,553) | $ | (171,400) | |||||||||||||||
| Plus: Stock-based compensation expense | 35,490 | 32,099 | 153,039 | 135,143 | |||||||||||||||||||
| Plus: Amortization of purchased intangibles | 2,291 | 1,676 | 7,649 | 5,505 | |||||||||||||||||||
| Plus: Transaction costs related to acquisitions | — | — | 361 | 885 | |||||||||||||||||||
| Plus: Amortization of stock-based compensation capitalized in software development costs | 722 | 379 | 2,402 | 1,222 | |||||||||||||||||||
| Plus: Lawsuit litigation cost and other expense | (69) | — | (10) | 254 | |||||||||||||||||||
| Plus: Employer payroll tax on employee equity incentive plans | 1,359 | 1,680 | 3,911 | 3,800 | |||||||||||||||||||
Plus: Restructuring charges (1) | — | — | 12,119 | — | |||||||||||||||||||
| Non-GAAP loss from operations | $ | (15,954) | $ | (18,474) | $ | (49,082) | $ | (24,591) | |||||||||||||||
| Three Months Ended March 31, | Fiscal Year Ended March 31, | ||||||||||||||||||||||
| 2022 | 2021 | 2022 | 2021 | ||||||||||||||||||||
| GAAP net loss attributable to New Relic | $ | (55,513) | $ | (61,677) | $ | (250,402) | $ | (192,610) | |||||||||||||||
| Plus: Stock-based compensation expense | 35,490 | 32,099 | 153,039 | 135,143 | |||||||||||||||||||
| Plus: Amortization of purchased intangibles | 2,291 | 1,676 | 7,649 | 5,505 | |||||||||||||||||||
| Plus: Transaction costs related to acquisitions | — | — | 361 | 885 | |||||||||||||||||||
| Plus: Amortization of stock-based compensation capitalized in software development costs | 722 | 379 | 2,402 | 1,222 | |||||||||||||||||||
| Plus: Lawsuit litigation cost and other expense | (69) | — | (10) | 254 | |||||||||||||||||||
| Plus: Employer payroll tax on employee equity incentive plans | 1,359 | 1,680 | 3,911 | 3,800 | |||||||||||||||||||
| Plus: Amortization of debt discount and issuance costs | 591 | 5,704 | 2,357 | 22,336 | |||||||||||||||||||
| Plus: Adjustment to redeemable non-controlling interest | (871) | 3,141 | 18,579 | 3,141 | |||||||||||||||||||
Plus: Restructuring charges (1) | — | — | 12,119 | — | |||||||||||||||||||
| Non-GAAP net loss attributable to New Relic | $ | (16,000) | $ | (16,998) | $ | (49,995) | $ | (20,324) | |||||||||||||||
50
(1) Restructuring related charge for the stock-based compensation expense of $0.5 million is included on its respective line items.
Non-GAAP loss from operations and non-GAAP net loss attributable to New Relic for the periods presented reflects the same trends discussed above in “Results of Operations.” Although we have generated non-GAAP income from operations and non-GAAP net income attributable to New Relic in past quarters, we expect to remain in a loss position in the near future as we continue to incur additional expenses during our public cloud migration.
Liquidity and Capital Resources
| Fiscal Year Ended March 31, | |||||||||||
| 2022 | 2021 | ||||||||||
| (in thousands) | |||||||||||
| Cash provided by operating activities | $ | 3,624 | $ | 69,866 | |||||||
| Cash used in investing activities | (19,757) | (142,857) | |||||||||
| Cash provided by financing activities | 44,140 | 21,290 | |||||||||
| Net increase (decrease) in cash, cash equivalents and restricted cash | $ | 28,007 | $ | (51,701) | |||||||
Sources of Cash and Material Cash Requirements
To date, we have financed our operations primarily through the issuance of the Notes, private and public equity financings and customer payments. As disclosed in Note 7. Senior Convertible Debt, our 0.5% Convertible Senior Notes and Capped Call will mature on May 1, 2023. We believe that our existing cash, cash equivalents, and short-term investment balances, together with cash generated from operations, will be sufficient to meet our working capital, capital expenditure requirements, and debt retirement obligations for at least the next 12 months.
We believe we will meet longer-term expected future cash requirements and obligations through a combination of cash flows from operating activities, available cash balances, and issuance of equity or debt securities. Our future capital requirements will depend on many factors, including our growth rate, the timing and extent of spending to support research and development efforts, the timing of our public cloud migration and the related decreased spending on capital expenditures, the introduction of new and enhanced products, seasonality of our billing activities, the timing and extent of spending to support our growth strategy, the continued market acceptance of our products, and competitive pressures. We may in the future enter into arrangements to acquire or invest in complementary businesses, services, technologies and intellectual property rights. We may need or choose to raise additional funds from equity or debt securities in order to meet those capital requirements. In the event that additional financing is required from outside sources, we may not be able to raise such financing on terms acceptable to us or at all. If we are unable to raise additional capital when desired, our business, operating results, and financial condition would be adversely affected.
As of March 31, 2022, material cash requirements for future periods were as follows:
| Payments due by period | |||||||||||||||||||||||||||||
| Total | Less than 1 year | 1 to 3 years | 3 to 5 years | After 5 years | |||||||||||||||||||||||||
| (in thousands) | |||||||||||||||||||||||||||||
| Principal amount payable on the Notes (1) | $ | 500,250 | $ | — | $ | 500,250 | $ | — | $ | — | |||||||||||||||||||
| Operating lease obligations (2) | 72,971 | 14,750 | 25,710 | 24,175 | 8,336 | ||||||||||||||||||||||||
| Purchase obligations (3) | 549,358 | 29,715 | 221,431 | 298,212 | — | ||||||||||||||||||||||||
| Total | $ | 1,122,579 | $ | 44,465 | $ | 247,141 | $ | 322,387 | $ | 8,336 | |||||||||||||||||||
(1)For additional information regarding the Notes, refer to Note 7 of Notes to Consolidated Financial Statements included in Part II, Item 8 of this Annual Report on Form 10-K.
(2)Consists of future minimum lease payments under non-cancelable operating leases for office space.
(3)Consists of future minimum payments under non-cancelable purchase commitments primarily related to hosting services and software subscriptions.
As of March 31, 2022, we had accrued liabilities related to uncertain tax positions, which are reflected on our consolidated balance sheet. These accrued liabilities are not reflected in the table above, as it is unclear when these liabilities will be paid.
51
Operating Activities
During the fiscal year ended March 31, 2022, cash provided by operating activities was $3.6 million as a result of a net loss of $232.1 million, adjusted by non-cash charges of $242.9 million and a change of $7.2 million in our operating assets and liabilities. The change in our operating assets and liabilities was primarily the result of a $53.3 million increase in accounts receivable due to increased sales, a $5.8 million increase in prepaid expenses and other assets, a $6.9 million decrease in lease liabilities, and a $2.3 million decrease in deferred contract acquisition costs. This was partially offset by a $23.6 million increase in deferred revenue as a result of timing of renewals, a $19.6 million increase in accrued compensation and benefits and other liabilities due to increased headcount, bonus and merit-based compensation increases, a $9.7 million increase in accounts payable, and a $8.3 million decrease in lease right-of-use assets.
During the fiscal year ended March 31, 2021, cash provided by operating activities was $69.9 million as a result of a net loss of $190.9 million, adjusted by non-cash charges of $250.4 million and a change of $10.4 million in our operating assets and liabilities. The change in our operating assets and liabilities was primarily the result of a $47.0 million increase in deferred contract acquisition costs due to increased sales, a $27.1 million increase in accounts receivable due to increased sales, and a 1.5 million decrease in lease liabilities. This was partially offset by a $58.9 million increase in deferred revenue as a result of the timing of renewals, a $1.0 million decrease in lease right-of-use assets, an $11.8 million increase in accounts payable, an $18.8 million increase in accrued compensation and benefits and other liabilities due to increased headcount and merit-based compensation increases as well as deferred social security taxes, and a $7.6 million decrease in prepaid expenses and other assets.
Investing Activities
Cash used in investing activities during the fiscal year ended March 31, 2022 was $19.8 million, primarily as a result of purchases of short-term investments of $301.1 million, increases in capitalization of software development costs of $12.7 million, cash paid for acquisitions of $7.2 million, and purchases of property and equipment of $5.8 million. These were offset by proceeds from the maturity of short-term investments of $305.9 million and sale of property and equipment of $1.0 million.
Cash used in investing activities during the fiscal year ended March 31, 2021 was $142.9 million, primarily as a result of purchases of short-term investments of $405.1 million, purchases of property and equipment of $18.7 million, increases in capitalization of software development costs of $13.5 million, and cash paid for acquisitions of $41.5 million. These were partially offset by proceeds from the sale and maturity of short-term investments of $336.0 million.
Financing Activities
Cash provided by financing activities during the fiscal year ended March 31, 2022 was $44.1 million, primarily as a result of proceeds from exercise of employee stock options of $31.9 million and proceeds from our employee stock purchase plan of $12.3 million.
Cash provided by financing activities during the fiscal year ended March 31, 2021 was $21.3 million, primarily as a result of proceeds from our employee stock purchase plan of $14.4 million and proceeds from exercise of employee stock options of $6.9 million.
Critical Estimates
We prepare our consolidated financial statements in accordance with United States generally accepted accounting principles, (“GAAP”). In the preparation of these consolidated financial statements, we make estimates and assumptions that affect the reported amounts of assets and liabilities and disclosure of contingent assets and liabilities at the date of the consolidated financial statements and the reported amounts of income and expenses during the reporting period. These estimates are based on information available as of the date of the consolidated financial statements; therefore, actual results could differ from our estimates. To the extent that there are material differences between these estimates and actual results, our financial condition or results of operations would be affected. We base our estimates on past experience and other assumptions that we believe are reasonable under the circumstances, and we evaluate these estimates on an ongoing basis. We refer to accounting estimates of this type as critical accounting policies and estimates.
We believe that accounting policies requiring estimates, assumptions, and judgments have the most significant impact on our consolidated financial statements are described below.
52
Revenue Recognition
We generate revenue from subscription-based arrangements and usage-based arrangements that allow customers to access our products and/or platform. Our sales agreements have contract terms typically for one year.
Revenue from subscription-based arrangements is recognized on a ratable basis over the contractual subscription period of the arrangement beginning when or as control of the promised goods or services is transferred to the customer. Deferred revenue consists of billings or payments received in advance of revenue being recognized.
Beginning in the second quarter of fiscal 2021, we started offering usage-based pricing to our customers. Customers have the option to be charged upon their incurred usage in arrears (“Pay as You Go”), or they may commit to a minimum spend over their contracted period. Revenue related to Pay as You Go contracts are recognized based on the customers’ actual usage. Revenue related to commitment contracts are recognized on a ratable basis over the contract period including an estimate of the usage above the minimum commitment. The usage above minimum commitment is considered variable consideration and is estimated by looking at usage in previous months and other factors and projecting out for the rest of the contract. The estimated usage-based revenues are constrained to the amount we expect to be entitled to receive in exchange for providing access to our platform.
Business Combinations
We make certain judgments to determine whether transactions should be accounted for as acquisitions of assets or as business combinations. While we use our best estimates and assumptions as a part of the purchase price allocation process to accurately value assets acquired and liabilities assumed at the acquisition date, our estimates are inherently uncertain and subject to refinement. Significant estimates in valuing certain identifiable assets and liabilities include, but are not limited to, future expected cash flows from acquired contracts, technology, useful lives, and discount rates. As a result, during the measurement period, which may be up to one year from the acquisition date, we record adjustments to the assets acquired and liabilities assumed, with the corresponding offset to goodwill to the extent that we identify adjustments to the preliminary purchase price allocation. Upon the conclusion of the measurement period or final determination of the values of assets acquired or liabilities assumed, whichever comes first, any subsequent adjustments are recorded to our consolidated statements of operations.
Software Development Costs
We capitalize certain development costs incurred in connection with our internal use software and website. These capitalized costs are primarily related to our software tools that are hosted by us and accessed by our customers on a subscription basis. Costs incurred in the preliminary stages of development are expensed as incurred. Once an application has reached the development stage, internal and external costs, if direct and incremental, are capitalized until the software is substantially complete and ready for its intended use. Capitalization ceases upon completion of all substantial testing. We also capitalize costs related to specific upgrades and enhancements when it is probable the expenditures will result in additional features and functionality. Maintenance costs are expensed as incurred. Internal use software is amortized on a straight-line basis over its estimated useful life, generally three years.
We exercise judgment in determining the point at which various projects may be capitalized, in assessing the ongoing value of the capitalized costs, and in determining the estimated useful lives over which the costs are amortized. To the extent that we change the manner in which we develop and test new features and functionalities related to our platform, assess the ongoing value of capitalized assets, or determine the estimated useful lives over which the costs are amortized, the amount of internal-use software development costs we capitalize and amortize could change in future periods.
Recent Accounting Pronouncements
See Note 1, Description of Business and Summary of Significant Accounting Policies, of our accompanying Notes to Consolidated Financial Statements included in Part II, Item 8.
Item 7A. Quantitative and Qualitative Disclosures About Market Risk
Foreign Currency Exchange Risk
Our subscription and usage-based agreements are primarily denominated in U.S. dollars. A portion of our operating expenses are incurred outside the United States and are denominated in foreign currencies and subject to fluctuations due to changes in foreign currency exchange rates, particularly changes in the Euro and Japanese Yen. Additionally, fluctuations in foreign currency exchange rates may cause us to recognize transaction gains and losses in our statements of operations. To date,
53
foreign currency transaction gains and losses have not been material to our financial statements, and we have not engaged in any foreign currency hedging transactions. As our international operations grow, we will continue to reassess our approach to managing the risks relating to fluctuations in currency rates. The effect of a hypothetical 10% change in foreign currency exchange rates applicable to our business would not have had a material impact on our historical consolidated financial statements.
Interest Rate Risk
We had cash and cash equivalents of $268.7 million as of March 31, 2022, consisting of bank deposits and money market funds. These interest-earning instruments carry a degree of interest rate risk. To date, fluctuations in our interest income have not been significant. We have an agreement to maintain cash balances at a financial institution of no less than $5.8 million as collateral for several letters of credit in favor of our landlords. The letters of credit carry a fixed interest rate of 1%.
We had short-term investments of $560.0 million as of March 31, 2022, consisting of certificates of deposit, commercial paper, corporate notes and bonds, and U.S. treasury securities. Our investments in marketable securities are made for capital preservation purposes. We do not enter into investments for trading or speculative purposes and have not used any derivative financial instruments to manage our interest rate risk exposure. Due to the short-term nature of these investments, we have not been exposed to, nor do we anticipate being exposed to, material risks due to changes in interest rates.
A hypothetical 10% change in interest rates during any of the periods presented would not have had a material impact on our consolidated financial statements.
In March 2018, we issued $500.25 million aggregate principal amount of the Notes. The fair value of the Notes is subject to interest rate risk, market risk and other factors due to the conversion feature in the Notes. The fair value of the Notes will generally increase as our common stock price increases and will generally decrease as our common stock price declines. The interest and market value changes affect the fair value of the Notes but do not impact our financial position, cash flows or results of operations due to the fixed nature of the debt obligation. Additionally, we carry the Notes at face value less unamortized issuance on our balance sheet, and we present the fair value for required disclosure purposes only.
54
Item 8. Financial Statements and Supplementary Data
NEW RELIC, INC.
INDEX TO CONSOLIDATED FINANCIAL STATEMENTS
Report of Independent Registered Public Accounting Firm (PCAOB ID | |||||
55
REPORT OF INDEPENDENT REGISTERED PUBLIC ACCOUNTING FIRM
To the stockholders and the Board of Directors of New Relic, Inc.
Opinion on the Financial Statements
We have audited the accompanying consolidated balance sheets of New Relic, Inc. and subsidiaries (the "Company") as of March 31, 2022 and 2021, the related consolidated statements of operations, comprehensive loss, stockholders’ equity, and cash flows, for each of the three years in the period ended March 31, 2022, and the related notes (collectively, the “financial statements”). In our opinion, the financial statements present fairly, in all material respects, the financial position of the Company as of March 31, 2022 and 2021, and the results of its operations and its cash flows for each of the three years in the period ended March 31, 2022, in conformity with accounting principles generally accepted in the United States of America.
We have also audited, in accordance with the standards of the Public Company Accounting Oversight Board (United States) (PCAOB), the Company’s internal control over financial reporting as of March 31, 2022, based on criteria established in Internal Control—Integrated Framework (2013) issued by the Committee of Sponsoring Organizations of the Treadway Commission and our report dated May 17, 2022, which should be the same as the date of the auditor’s report on the financial statements, expressed an unqualified opinion on the Company’s internal control over financial reporting.
Basis for Opinion
These financial statements are the responsibility of the Company’s management. Our responsibility is to express an opinion on the Company’s financial statements based on our audits. We are a public accounting firm registered with the PCAOB and are required to be independent with respect to the Company in accordance with the US federal securities laws and the applicable rules and regulations of the Securities and Exchange Commission and the PCAOB.
We conducted our audits in accordance with the standards of the PCAOB. Those standards require that we plan and perform the audit to obtain reasonable assurance about whether the financial statements are free of material misstatement, whether due to error or fraud. Our audits included performing procedures to assess the risks of material misstatement of the financial statements, whether due to error or fraud, and performing procedures that respond to those risks. Such procedures included examining, on a test basis, evidence regarding the amounts and disclosures in the financial statements. Our audits also included evaluating the accounting principles used and significant estimates made by management, as well as evaluating the overall presentation of the financial statements. We believe that our audits provide a reasonable basis for our opinion.
Critical Audit Matter
The critical audit matter communicated below is a matter arising from the current-period audit of the financial statements that was communicated or required to be communicated to the audit committee and that (1) relates to accounts or disclosures that are material to the financial statements and (2) involved our especially challenging, subjective, or complex judgments. The communication of critical audit matters does not alter in any way our opinion on the financial statements, taken as a whole, and we are not, by communicating the critical audit matter below, providing a separate opinion on the critical audit matter or on the accounts or disclosures to which it relates.
Revenue Recognition — Refer to Notes 1 and 4 to the financial statements
Critical Audit Matter Description
The Company generates revenue from subscription-based arrangements and usage-based arrangements that allow customers to access its products and/or platform. Generally, subscription revenue is recognized on a ratable basis over the contractual subscription period of the arrangement beginning when or as control of the promised goods or services is transferred to the customer. Revenue related to commitment contracts is recognized on a ratable basis over the contract period, including an estimate of the usage above the minimum commitment. The Company determines revenue recognition through the following steps: (i) identification of the contract, or contracts with a customer; (ii) identification of the performance obligations in the contract; (iii) determination of the transaction price, including estimating the amounts of variable consideration, when applicable; (iv) allocation of the transaction price to the performance obligations in the contract; and (v) recognition of revenue, when, or as, the Company satisfies a performance obligation. For the fiscal year ended March 31, 2022, the Company’s revenue was $785.5 million.
In performing the steps above, management applies significant judgment in evaluating the revenue recognition impact of contractual terms in customer agreements, specifically contractual terms that could result in recognizing material rights or different revenue recognition patterns. In addition, management exercises significant judgement in estimating the amount of
56
variable consideration that should be included in the transaction price. Given these factors, the related audit effort in evaluating management’s judgment in determining revenue recognition was extensive and required a high degree of auditor judgment.
How the Critical Audit Matter Was Addressed in the Audit
Our principal audit procedures related to the Company’s revenue recognition included the following, among others:
•We tested the effectiveness of controls related to the revenue recognition process, including controls related to the evaluation of the revenue recognition impact of contractual terms in customer agreements and estimating variable consideration.
•We evaluated management’s significant accounting policies related to revenue recognition for reasonableness and compliance with accounting principles generally accepted in the United States of America.
•We tested the amounts of variable consideration by performing a combination of procedures, including testing the operating effectiveness of related controls and performing test of details. These procedures include:
–Tested the operating effectiveness of the related controls.
–Evaluated the model used by management to estimate the variable consideration for reasonableness.
–Tested the various inputs to the model.
–Performed look-back testing to compare the historical outputs of the model with the actual results.
•We selected a sample of recorded revenue transactions and performed the following procedures:
–Obtained and read customer source documents and the contract for each selection, including master agreements and related amendments to evaluate if relevant contractual terms have been appropriately considered by management.
–Evaluated management’s application of their accounting policy and tested revenue recognition for each selection by comparing management’s conclusions to the underlying master agreement and any related amendments.
•Tested the mathematical accuracy of management’s calculations of revenue and the associated timing of revenue recognized in the financial statements.
/s/ DELOITTE & TOUCHE LLP
May 17, 2022
We have served as the Company's auditor since 2012.
57
NEW RELIC, INC.
CONSOLIDATED BALANCE SHEETS
(In thousands, except par value)
| March 31, | |||||||||||
| 2022 | 2021 | ||||||||||
| Assets | |||||||||||
| Current assets: | |||||||||||
| Cash and cash equivalents | $ | $ | |||||||||
| Short-term investments | |||||||||||
Accounts receivable, net of allowances of $ | |||||||||||
| Prepaid expenses and other current assets | |||||||||||
| Deferred contract acquisition costs | |||||||||||
| Total current assets | |||||||||||
| Property and equipment, net | |||||||||||
| Restricted cash | |||||||||||
| Goodwill | |||||||||||
| Intangible assets, net | |||||||||||
| Deferred contract acquisition costs, non-current | |||||||||||
| Lease right-of-use assets | |||||||||||
| Other assets, non-current | |||||||||||
| Total assets | $ | $ | |||||||||
| Liabilities, redeemable non-controlling interest and stockholders’ equity | |||||||||||
| Current liabilities: | |||||||||||
| Accounts payable | $ | $ | |||||||||
| Accrued compensation and benefits | |||||||||||
| Other current liabilities | |||||||||||
| Deferred revenue | |||||||||||
| Lease liabilities | |||||||||||
| Total current liabilities | |||||||||||
| Convertible senior notes, net | |||||||||||
| Lease liabilities, non-current | |||||||||||
| Deferred revenue, non-current | |||||||||||
| Other liabilities, non-current | |||||||||||
| Total liabilities | |||||||||||
| Redeemable non-controlling interest | |||||||||||
| Stockholders’ equity: | |||||||||||
Common stock, $ | |||||||||||
Treasury stock—at cost ( | ( | ( | |||||||||
| Additional paid-in capital | |||||||||||
| Accumulated other comprehensive loss | ( | ( | |||||||||
| Accumulated deficit | ( | ( | |||||||||
| Total stockholders’ equity | |||||||||||
| Total liabilities, redeemable non-controlling interest and stockholders’ equity | $ | $ | |||||||||
See notes to consolidated financial statements.
58
NEW RELIC, INC.
CONSOLIDATED STATEMENTS OF OPERATIONS
(In thousands, except per share data)
| Fiscal Year Ended March 31, | |||||||||||||||||
| 2022 | 2021 | 2020 | |||||||||||||||
| Revenue | $ | $ | $ | ||||||||||||||
| Cost of revenue | |||||||||||||||||
| Gross profit | |||||||||||||||||
| Operating expenses: | |||||||||||||||||
| Research and development | |||||||||||||||||
| Sales and marketing | |||||||||||||||||
| General and administrative | |||||||||||||||||
| Total operating expenses | |||||||||||||||||
| Loss from operations | ( | ( | ( | ||||||||||||||
| Other income (expense): | |||||||||||||||||
| Interest income | |||||||||||||||||
| Interest expense | ( | ( | ( | ||||||||||||||
| Other income (expense), net | ( | ( | |||||||||||||||
| Loss before income taxes | ( | ( | ( | ||||||||||||||
| Income tax provision | |||||||||||||||||
| Net loss | $ | ( | $ | ( | $ | ( | |||||||||||
| Net loss and adjustment attributable to redeemable non-controlling interest | $ | ( | $ | ( | $ | ||||||||||||
| Net loss attributable to New Relic | $ | ( | $ | ( | $ | ( | |||||||||||
| Net loss attributable to New Relic per share, basic and diluted | $ | ( | $ | ( | $ | ( | |||||||||||
| Weighted-average shares used to compute net loss per share, basic and diluted | |||||||||||||||||
See notes to consolidated financial statements.
59
NEW RELIC, INC.
CONSOLIDATED STATEMENTS OF COMPREHENSIVE LOSS
(In thousands)
| Fiscal Year Ended March 31, | |||||||||||||||||
| 2022 | 2021 | 2020 | |||||||||||||||
| Net loss attributable to New Relic | $ | ( | $ | ( | $ | ( | |||||||||||
| Other comprehensive loss: | |||||||||||||||||
| Unrealized gain (loss) on available-for-sale securities, net of tax | ( | ( | |||||||||||||||
| Comprehensive loss attributable to New Relic | $ | ( | $ | ( | $ | ( | |||||||||||
See notes to consolidated financial statements.
60
NEW RELIC, INC.
CONSOLIDATED STATEMENTS OF STOCKHOLDERS’ EQUITY
(In thousands)
| Common Stock | Additional Paid-In Capital | Treasury Stock | Accumulated Other Comprehensive Income (Loss) | Accumulated Deficit | Total Stockholders’ Equity | ||||||||||||||||||||||||||||||||||||||||||
| Shares | Amount | Shares | Amount | ||||||||||||||||||||||||||||||||||||||||||||
| Balance at March 31, 2019 | $ | $ | $ | ( | $ | $ | ( | $ | |||||||||||||||||||||||||||||||||||||||
| Issuance of common stock upon exercise of stock options | — | — | — | — | |||||||||||||||||||||||||||||||||||||||||||
| Issuance of common stock for vested restricted stock units | ( | — | — | — | — | ||||||||||||||||||||||||||||||||||||||||||
| Issuance of common stock related to employee stock purchase plan | — | — | — | — | — | ||||||||||||||||||||||||||||||||||||||||||
| Stock-based compensation expense | — | — | — | — | — | — | |||||||||||||||||||||||||||||||||||||||||
| Other comprehensive income, net | — | — | — | — | — | — | |||||||||||||||||||||||||||||||||||||||||
| Net loss attributable to New Relic | — | — | — | — | — | — | ( | ( | |||||||||||||||||||||||||||||||||||||||
| Balance at March 31, 2020 | $ | $ | $ | ( | $ | $ | ( | $ | |||||||||||||||||||||||||||||||||||||||
| Issuance of common stock upon exercise of stock options | — | — | — | — | |||||||||||||||||||||||||||||||||||||||||||
| Issuance of common stock for vested restricted stock units | ( | — | — | — | — | ||||||||||||||||||||||||||||||||||||||||||
| Issuance of common stock related to employee stock purchase plan | — | — | — | — | — | ||||||||||||||||||||||||||||||||||||||||||
| Issuance of common stock related to acquisition of business | — | — | — | — | |||||||||||||||||||||||||||||||||||||||||||
| Stock-based compensation expense | — | — | — | — | — | — | |||||||||||||||||||||||||||||||||||||||||
| Other comprehensive loss, net | — | — | — | — | — | ( | — | ( | |||||||||||||||||||||||||||||||||||||||
| Net loss attributable to New Relic | — | — | — | — | — | — | ( | ( | |||||||||||||||||||||||||||||||||||||||
| Balance at March 31, 2021 | $ | $ | $ | ( | $ | ( | $ | ( | $ | ||||||||||||||||||||||||||||||||||||||
| — | — | ( | — | — | — | ( | |||||||||||||||||||||||||||||||||||||||||
| Issuance of common stock upon exercise of stock options | — | — | — | — | |||||||||||||||||||||||||||||||||||||||||||
| Issuance of common stock for vested restricted stock units | ( | — | — | — | — | ||||||||||||||||||||||||||||||||||||||||||
| Issuance of common stock related to employee stock purchase plan | — | — | — | — | — | ||||||||||||||||||||||||||||||||||||||||||
| Issuance of common stock related to acquisition of business | — | — | — | — | — | ||||||||||||||||||||||||||||||||||||||||||
| Stock-based compensation expense | — | — | — | — | — | — | |||||||||||||||||||||||||||||||||||||||||
| Other comprehensive loss, net | — | — | — | — | ( | — | ( | ||||||||||||||||||||||||||||||||||||||||
| Net loss attributable to New Relic | — | — | — | — | — | — | ( | ( | |||||||||||||||||||||||||||||||||||||||
| Balance at March 31, 2022 | $ | $ | $ | ( | $ | ( | $ | ( | $ | ||||||||||||||||||||||||||||||||||||||
See notes to consolidated financial statements.
61
NEW RELIC, INC.
CONSOLIDATED STATEMENTS OF CASH FLOWS
(In thousands)
| Fiscal Year Ended March 31, | |||||||||||||||||
| 2022 | 2021 | 2020 | |||||||||||||||
| Cash flows from operating activities: | |||||||||||||||||
| Net loss attributable to New Relic | $ | ( | $ | ( | $ | ( | |||||||||||
| Net loss and adjustment attributable to redeemable non-controlling interest (Note 3) | $ | $ | $ | ( | |||||||||||||
| Net loss: | $ | ( | $ | ( | $ | ( | |||||||||||
| Adjustments to reconcile net loss to net cash provided by operating activities: | |||||||||||||||||
| Depreciation and amortization | |||||||||||||||||
| Stock-based compensation expense | |||||||||||||||||
| Amortization of debt discount and issuance costs | |||||||||||||||||
| Gain on lease modification | ( | ||||||||||||||||
| Other | ( | ||||||||||||||||
| Changes in operating assets and liabilities, net of acquisition of businesses: | |||||||||||||||||
| Accounts receivable, net | ( | ( | ( | ||||||||||||||
| Prepaid expenses and other assets | ( | ( | |||||||||||||||
| Deferred contract acquisition costs | ( | ( | ( | ||||||||||||||
| Lease right-of-use assets | |||||||||||||||||
| Accounts payable | |||||||||||||||||
| Accrued compensation and benefits and other liabilities | |||||||||||||||||
| Lease liabilities | ( | ( | |||||||||||||||
| Deferred revenue | |||||||||||||||||
| Net cash provided by operating activities | |||||||||||||||||
| Cash flows from investing activities: | |||||||||||||||||
| Purchases of property and equipment | ( | ( | ( | ||||||||||||||
| Proceeds from sale of property and equipment | |||||||||||||||||
| Cash paid for acquisitions, net of cash acquired | ( | ( | ( | ||||||||||||||
| Purchases of short-term investments | ( | ( | ( | ||||||||||||||
| Proceeds from sale and maturity of short-term investments | |||||||||||||||||
| Capitalized software development costs | ( | ( | ( | ||||||||||||||
| Net cash used in investing activities | ( | ( | ( | ||||||||||||||
| Cash flows from financing activities: | |||||||||||||||||
| Investment from redeemable non-controlling interest | |||||||||||||||||
| Proceeds from employee stock purchase plan | |||||||||||||||||
| Proceeds from exercise of employee stock options | |||||||||||||||||
| Net cash provided by financing activities | |||||||||||||||||
| Net increase (decrease) in cash, cash equivalents and restricted cash | ( | ||||||||||||||||
| Cash, cash equivalents and restricted cash at beginning of period | |||||||||||||||||
| Cash, cash equivalents and restricted cash at end of period | $ | $ | $ | ||||||||||||||
| Reconciliation of cash, cash equivalents and restricted cash to condensed consolidated balance sheets: | |||||||||||||||||
| Cash and cash equivalents | $ | $ | $ | ||||||||||||||
| Restricted cash | |||||||||||||||||
| Total cash, cash equivalents and restricted cash | $ | $ | $ | ||||||||||||||
| Supplemental disclosure of cash flow information: | |||||||||||||||||
| Cash paid for interest and income taxes | $ | $ | $ | ||||||||||||||
| Noncash investing and financing activities: | |||||||||||||||||
| Issuance of common stock for the acquisition of business | $ | $ | $ | ||||||||||||||
| Property and equipment purchased but not paid yet | $ | $ | $ | ||||||||||||||
| Acquisition holdback | $ | $ | $ | ||||||||||||||
See notes to consolidated financial statements.
62
NOTES TO CONSOLIDATED FINANCIAL STATEMENTS
1. Description of Business and Summary of Significant Accounting Policies
Foreign Currency Translation and Transactions—The functional currency of the Company’s foreign subsidiaries is the U.S. dollar. The Company translates all monetary assets and liabilities denominated in foreign currencies into U.S. dollars using the exchange rates in effect at the balance sheet dates and other assets and liabilities using historical exchange rates.
Foreign currency-denominated revenue and expenses have been re-measured using the average exchange rates in effect during each period. Foreign currency re-measurement gains and losses have been included in other income (expense).
Use of Estimates—The preparation of the Company’s consolidated financial statements in conformity with GAAP requires management to make estimates and assumptions that affect the reported amounts of assets and liabilities and disclosure of contingent assets and liabilities at the date of the consolidated financial statements and the reported amounts of income and expenses during the reporting period. Significant items subject to such estimates and assumptions include the fair value of share-based awards, fair value of purchased intangible assets and goodwill, variable consideration included in the transaction price for our customer contracts, useful lives of purchased intangible assets, unrecognized tax benefits, incremental borrowing rate used for operating lease liabilities, and the capitalization and estimated useful life of the Company’s software development costs.
These estimates are based on information available as of the date of the consolidated financial statements; therefore, actual results could differ from management’s estimates.
63
Revenue Recognition—The Company generates revenue from subscription-based arrangements and usage-based arrangements that allow customers to access its products and/or platform. The Company determines revenue recognition through the following steps:
•identification of the contract, or contracts with a customer;
•identification of the performance obligations in the contract;
•determination of the transaction price;
•allocation of the transaction price to the performance obligations in the contract; and
•recognition of revenue, when, or as, the Company satisfies a performance obligation.
Revenue from subscription-based arrangements is recognized on a ratable basis over the contractual subscription period of the arrangement beginning when or as control of the promised goods or services is transferred to the customer.
Beginning in the second quarter of fiscal 2021, the Company started offering usage-based pricing to its customers. Customers have the option to be charged upon their incurred usage in arrears (“Pay as You Go”), or they may commit to a minimum spend over their contracted period. Revenue related to Pay as You Go contracts are recognized based on the customers’ actual usage. Revenue related to commitment contracts are recognized on a ratable basis over the contract period including an estimate of usage above the minimum commitment. Usage above minimum commitment is estimated by looking at usage in previous months and other factors and projecting out for the rest of the contract. The estimated usage-based revenues are constrained to the amount the Company expects to be entitled to receive in exchange for providing access to its platform.
Deferred Revenue—Deferred revenue consists of billings or payments received in advance of revenue being recognized. The Company generally invoices its customers monthly, quarterly, or annually. Deferred revenue that will be recognized during the succeeding 12-month period is recorded as current deferred revenue and the remaining portion is recorded as non-current deferred revenue.
64
The Company capitalized $16.4 million, $17.6 million, and $8.1 million in internal use software during the fiscal years ended March 31, 2022, 2021, and 2020, respectively. Included in the capitalized development costs were $3.7 million, $4.1 million, and $1.5 million of stock-based compensation costs for the fiscal years ended March 31, 2022, 2021, and 2020, respectively. Amortization expense totaled $10.7 million, $7.0 million, and $4.9 million during the fiscal years ended March 31, 2022, 2021, and 2020, respectively. The net book value of capitalized internal use software as of March 31, 2022 and 2021, which is recorded in property and equipment on the accompanying consolidated balance sheets, was $28.0 million and $23.2 million, respectively.
The Company amortizes capitalized implementation costs over the expected life of the service contract. The Company capitalized $1.6 million, $2.1 million, and $2.5 million in implementation costs for software hosting arrangements during the fiscal years ended March 31, 2022, 2021, and 2020, respectively. Amortization expense totaled $1.3 million, $1.2 million, and $0.2 million during the fiscal years ended March 31, 2022, 2021, and 2020, respectively.
65
Lease right-of-use assets and liabilities are recognized at the commencement date based on the present value of lease payments over the lease term. As these leases do not provide an implicit rate, the Company uses its incremental borrowing rate based on the information available at commencement date in determining the present value of lease payments. The Company considers information including, but not limited to, the lease term, the Company's credit rating and interest rates of similar debt instruments with comparable credit ratings. The lease right-of-use assets are also increased by any lease prepayments made and reduced by any lease incentives such as tenant improvement allowances. Options to extend the lease term are included in the lease term when it is reasonably certain that the Company will exercise the extension option.
The Company’s operating leases typically include nonlease components such as common-area maintenance costs. The Company has elected to include nonlease components with lease payments for the purpose of calculating lease right-of-use assets and liabilities, to the extent that they are fixed. Nonlease components that are not fixed are expensed as incurred as variable lease payments.
Leases with a term of one year or less are not recognized on the Company’s consolidated balance sheet.
Stock-Based Compensation—The Company estimates the fair value of share-based awards on the date of grant. The value of the portion of the award that is ultimately expected to vest is recognized as expense over the requisite service periods in the statements of operations. The Company recognizes compensation expense for the majority of its awards over the vesting period of the entire award using the straight-line attribution method. These amounts are reduced by an estimated forfeiture rate. The forfeiture rate is estimated based on actual cancellation experience and is applied to all share-based awards. The rate is estimated at the time of grant and revised, if necessary, in subsequent periods if actual forfeitures differ from those estimates.
The Company selected the Black-Scholes option-pricing model as the method for determining the estimated fair value for stock options and shares pursuant to the Company’s 2014 Employee Stock Purchase Plan, or ESPP. The Black-Scholes option-pricing model requires the use of highly subjective and complex assumptions, which determine the fair value of share-based awards, including the option’s expected term and the price volatility of the underlying stock.
The Company uses a Monte Carlo simulation model to determine the fair value of its performance stock units, or PSUs, and recognizes expense using the accelerated attribution method over the requisite service period.
66
Recently Issued Accounting Pronouncements Not Yet Adopted
In May 2021, the FASB issued ASU 2021-04, Earnings Per Share (Topic 260), Debt-Modifications and Extinguishments (Subtopic 470-50), Compensation-Stock Compensation (Topic 718), and Derivatives and Hedging-Contracts in Entity’s Own Equity (Subtopic 815-40). The new ASU addresses an issuer’s accounting for certain modifications or exchanges of freestanding equity-classified written call options. This guidance is effective for the Company’s fiscal year beginning April 1, 2022. The Company is currently evaluating the impact of adopting this guidance.
In October 2021, the FASB issued ASU No. 2021-08, Business Combinations - Accounting for Contract Liabilities from Contracts with Customers (Topic 805), which requires an acquirer in a business combination to recognize and measure contract assets and contract liabilities from acquired contracts using the revenue recognition guidance under ASC 606 as if the entity had originated the contracts. The guidance is effective for fiscal years beginning after December 15, 2022, including interim periods within those fiscal years. The Company is currently evaluating the impact of adopting this guidance.
Recently Adopted Accounting Pronouncements
In August 2020, the FASB issued ASU 2020-06, Accounting for Convertible Instruments and Contracts on an Entity’s Own Equity (Subtopic 815-40) (“ASU 2020-06”). ASU 2020-06 simplifies the accounting for certain financial instruments with characteristics of liabilities and equity, including convertible instruments and contracts on an entity’s own equity. The Company adopted ASU 2020-06 effective April 1, 2021, using the modified retrospective basis, which resulted in a $54.2 million decrease to the opening balance of accumulated deficit, a $100.1 million decrease to the opening balance of additional paid-in capital, and a $45.9 million increase to the opening balance of the Notes, net on the consolidated balance sheet.
2. Business Combinations
During the fiscal year ended March 31, 2022, the Company completed one acquisition, which is described below.
CodeStream Inc.
On June 8, 2021, the Company acquired all of the equity interests in CodeStream Inc. (“CodeStream”), a company that provides an integrated developer collaboration platform. The aggregate purchase price of $28.6 million consisted of approximately $15.1 million in cash (of which the Company held back approximately $7.3 million from the aggregate purchase
67
price for 18 months after the transaction closing date), and 202,561 shares of the Company’s common stock with an aggregate fair value of approximately $13.5 million. The held back cash was accrued as a long-term liability and has been re-classed as a short-term liability as of March 31. 2022. The fair value of the consideration transferred was determined based on a $66.58 per share price of the Company’s common stock on the closing date of the acquisition. The total purchase price was allocated to the developed technology acquired with an estimated useful life of three years , net assets assumed, and a deferred tax liability related to the developed technology. The excess purchase price was recorded as goodwill. The acquisition was accounted for as a business combination in accordance with ASC 805. The estimated fair value of developed technology acquired of $10.3 million was determined through the use of a third-party valuation firm using cost approach methodology. The business combination did not have a material impact on the condensed consolidated financial statements and therefore historical and proforma disclosures have not been presented.
The acquisition also included a holdback arrangement with certain employees of CodeStream, totaling approximately 199,492 shares of the Company’s common stock, contingent upon their continued employment with the Company. The fair value of these awards, which are subject to the recipients’ continued service, was $13.3 million and was excluded from the aggregate purchase price. These awards will be recognized as stock-based compensation expense over the vesting period, which is 42 months.
| Cash consideration paid | $ | ||||
| Fair value of common shares issued | |||||
| Total consideration | |||||
| Post-business combination compensation expense | ( | ||||
| Total purchase price | |||||
| Net assets assumed | ( | ||||
| Deferred tax liabilities | |||||
| Developed technology acquired | ( | ||||
| Goodwill | $ | ||||
Pixie Labs Inc.
On December 22, 2020, the Company acquired all of the equity interests in Pixie Labs Inc. (“Pixie Labs”), a company that provides a next-generation machine intelligence observability solution for developers using Kubernetes. The aggregate purchase price of $107.9 million consisted of approximately $45.6 million in cash (of which $15.0 million is being held in escrow for 12 months after the transaction closing date) and 884,269 shares of Company common stock with an aggregate fair value of approximately $62.4 million. The fair value of the consideration transferred was determined based on a $70.53 per share price of the Company’s common stock.
The total purchase price was allocated to the developed technology acquired with an estimated useful life of three years , net assets assumed, and a deferred tax liability related to the developed technology. The excess purchase price was recorded as goodwill, as set forth below. Goodwill generated from the acquisition is attributable to expected synergies from future growth and is not deductible for tax purposes.
68
| Cash consideration paid | $ | ||||
| Fair value of common shares issued | |||||
| Total consideration | |||||
| Post-business combination compensation expense | ( | ||||
| Total purchase price | |||||
| Net assets assumed | ( | ||||
| Deferred tax liabilities | |||||
| Developed technology acquired | ( | ||||
| Goodwill | $ | ||||
The acquisition has been accounted for as a business combination. The direct transaction costs of the acquisition have been accounted for separately from the business combination and expensed as incurred. Total direct transaction costs incurred by the Company were $0.9 million, which were included in general and administrative expenses in the Company’s consolidated statement of operations for the fiscal year ended March 31, 2021. The Company paid $0.6 million in acquisition-related expenses incurred by Pixie Labs related to Pixie Labs’ advisors which were included as part of the purchase consideration. The business combination did not have a material impact on the consolidated financial statements and therefore historical and proforma disclosures have not been presented.
The acquisition also included a holdback arrangement with certain employees of Pixie Labs, totaling approximately 736,469 shares of the Company’s common stock, contingent upon their continued employment with the Company. The fair value of these awards, which are subject to the recipients’ continued service, was $51.9 million and was excluded from the aggregate purchase price. These awards will be recognized as stock-based compensation expense over the vesting period, which ranges from 18 months to 37 months.
IOPipe,Inc.
On October 31, 2019, the Company acquired certain assets of IOpipe, Inc., a company that provides monitoring tools for serverless applications, for $5.1 million in cash. The Company held back approximately $0.9 million from the aggregate purchase price which has been accrued as a liability. Of the total purchase price, $1.5 million was allocated to acquired technology with an estimated useful life of three years with the excess $3.6 million of the purchase price over the fair value of the intangible assets acquired recorded as goodwill. The acquisition has been accounted for as a business combination under the acquisition method. Goodwill and other intangibles generated from the acquisition are attributable to expected synergies from future growth and potential future monetization opportunities, and are deductible for tax purposes. The business combination did not have a material impact on the consolidated financial statements and therefore historical and proforma disclosures have not been presented.
3. Joint Venture
On July 13, 2018, the Company entered into an agreement with Japan Cloud Computing L.P. (“JCC”) and M30 LLC (collectively, the Investors) to engage in the investment, organization, management, and operation of New Relic K.K., a Japanese subsidiary of the Company that is focused on the sale of the Company’s products and services in Japan. On August 21, 2018, the investors initially contributed approximately $3.6 million (396,000,000 Japanese Yen) in exchange for 40 % of the outstanding common stock of New Relic K.K. On August 21, 2019, the Company and Investors additionally contributed approximately $1.5 million (156,000,000 Japanese Yen) and approximately $1.0 million (104,000,000 Japanese Yen), respectively, to subscribe to additional shares. As of March 31, 2022, the Company owned approximately 60 % of the outstanding common stock in New Relic K.K.
All of the common stock held by the Investors may be callable by the Company or puttable by the Investors upon certain contingent events. Should the call or put option be exercised, the redemption value would be determined based on a prescribed formula derived from the discrete revenues of New Relic K.K. and the Company and may be settled, at the Company’s discretion, with Company stock or cash. As a result of the put right available to the redeemable non-controlling interest holders in the future, the redeemable non-controlling interest in New Relic K.K. is classified outside of permanent equity in the Company’s consolidated balance sheet as of March 31, 2022, and the balance is reported at the greater of the initial carrying amount adjusted for the redeemable non-controlling interest’s share of earnings or losses, or its estimated
69
redemption value. Accordingly, the Company adjusted the redeemable non-controlling interest by $18.6 million at March 31, 2022.
| March 31, 2022 | March 31, 2021 | March 31, 2020 | |||||||||||||||
| Balance, beginning of period | $ | $ | $ | ||||||||||||||
| Investment by redeemable non-controlling interest | |||||||||||||||||
| Net loss attributable to redeemable non-controlling interest | ( | ( | ( | ||||||||||||||
| Adjustment to redeemable non-controlling interest | |||||||||||||||||
| Balance, end of period | $ | $ | $ | ||||||||||||||
4. Revenue
The Company offers a comprehensive suite of products delivered on its open and extensible cloud-based platform that enable organizations to collect, store, and analyze massive amounts of data in real time so they can better operate their applications and infrastructure and improve their digital customer experience. The Company generates revenue from subscription-based arrangements and usage-based arrangements that allow customers to access its products and/or platform.
Revenue from subscription-based arrangements is recognized on a ratable basis over the contractual subscription period of the arrangement beginning when or as control of the promised goods or services is transferred to the customer.
Beginning in the second quarter of fiscal 2021, the Company started offering usage-based pricing to its customers. Customers have the option to be charged upon their incurred usage in arrears (“Pay as You Go”), or they may commit to a minimum spend over their contracted period. Revenue related to Pay as You Go contracts are recognized based on the customers’ actual usage. Revenue related to commitment contracts are recognized on a ratable basis over the contract period including an estimate of usage above the minimum commitment. Usage above minimum commitment is estimated by looking at usage in previous months and other factors and projecting out for the rest of the contract. The estimated usage-based revenues are constrained to the amount the Company expects to be entitled to receive in exchange for providing access to its platform. Deferred revenue consists of billings or payments received in advance of revenue being recognized.
Disaggregation of Revenue
For disaggregated revenue by geography, refer to Note 16—Revenue by Geographic Location.
Contract Balances
In a response to the COVID-19 pandemic, the Company performed additional procedures to evaluate the creditworthiness of its customers and assess collectability of accounts. Using a current expected credit loss model, the Company determined that, while there may be a delay in collections due to the downturn in economic activity, there has not been a material impact to the risk of credit loss on accounts receivables as of March 31, 2022.
The Company receives payments from customers based upon billing cycles. As the Company performs under customer contracts, its right to consideration that is unconditional is considered to be accounts receivable. If the Company’s right to consideration for such performance is contingent upon a future event or satisfaction of additional performance obligations, the amount of revenues the Company has recognized in excess of the amount it has billed to the customer is considered to be a contract asset. Contract assets were $1.5 million and $2.5 million as of March 31, 2022 and March 31, 2021, respectively. The Company has no asset impairment charges related to contract assets for the periods presented. Deferred revenue represents consideration received from customers in excess of revenues recognized.
70
| March 31, 2022 | March 31, 2021 | ||||||||||
| Deferred revenue, beginning of period | $ | $ | |||||||||
| Contributions from contract asset | ( | ||||||||||
| Billings | |||||||||||
| Revenue recognized | ( | ( | |||||||||
| Deferred revenue, end of period | $ | $ | |||||||||
For the fiscal years ended March 31, 2022 and 2021, approximately 47
For the fiscal year ended March 31, 2022, the Company recognized $9.8 million in revenue from performance obligations satisfied in prior periods. The amount recognized during the fiscal year ended March 31, 2021 from performance obligations satisfied in prior periods was immaterial .
Contract Acquisition Costs
The Company capitalizes certain contract acquisition costs primarily consisting of commissions. The balances of deferred costs to obtain customer contracts were $34.5 million and $68.8 million as of March 31, 2022 and March 31, 2021, respectively. In the fiscal years ended March 31, 2022 and 2021, amortization from amounts capitalized was $36.6 million and $38.3 million, respectively. In the fiscal years ended March 31, 2022 and 2021, amounts expensed as incurred were $62.7 million and $14.5 million, respectively. The Company had no
Remaining Performance Obligations
The Company’s contracts with customers generally include one main performance obligation, which is access to its SaaS-based products and platform. Within the main performance obligation, each service is generally considered a distinct stand-ready obligation that is recognized over the contract term based on the passage of time. As of March 31, 2022, the aggregate unrecognized transaction price of remaining performance obligations was $706.1 million. The Company expects to recognize more than 96 % of the balance as revenue in the 24 months following March 31, 2022 and the remainder thereafter. The aggregate balance of remaining performance obligations represents contracted revenue that has not yet been recognized and does not include contract amounts which are cancellable by the customer and amounts associated with optional renewal periods.
5. Fair Value Measurements
The Company reports assets and liabilities recorded at fair value on the Company’s consolidated balance sheets based upon the level of judgment associated with inputs used to measure their fair value. The categories are as follows:
Level 1—Inputs are unadjusted quoted prices in active markets for identical assets or liabilities.
Level 2—Inputs are quoted prices for similar assets and liabilities in active markets; quoted prices for identical assets or liabilities in markets with insufficient volume or infrequent transactions (less active markets); or inputs other than quoted prices that are observable for the assets or liabilities, either directly or indirectly through market corroboration, for substantially the full term of the financial instruments.
Level 3—Inputs are unobservable inputs based on the Company’s own assumptions used to measure assets and liabilities at fair value. The inputs require significant management judgment or estimation.
71
The following tables present information about the Company’s financial assets measured at fair value on a recurring basis as of March 31, 2022 and 2021 based on the three-tier fair value hierarchy (in thousands):
| Fair Value Measurements as of March 31, 2022 | |||||||||||||||||||||||
| Level 1 | Level 2 | Level 3 | Total | ||||||||||||||||||||
| Cash and cash equivalents: | |||||||||||||||||||||||
| Money market funds | $ | $ | $ | $ | |||||||||||||||||||
| Short-term investments: | |||||||||||||||||||||||
| Certificates of deposit | |||||||||||||||||||||||
| Commercial paper | |||||||||||||||||||||||
| Corporate notes and bonds | |||||||||||||||||||||||
| U.S. treasury securities | |||||||||||||||||||||||
| Restricted cash: | |||||||||||||||||||||||
| Money market funds | |||||||||||||||||||||||
| Total | $ | $ | $ | $ | |||||||||||||||||||
| Included in cash and cash equivalents | $ | ||||||||||||||||||||||
| Included in short-term investments | $ | ||||||||||||||||||||||
| Included in restricted cash | $ | ||||||||||||||||||||||
| Fair Value Measurements as of March 31, 2021 | |||||||||||||||||||||||
| Level 1 | Level 2 | Level 3 | Total | ||||||||||||||||||||
| Cash and cash equivalents: | |||||||||||||||||||||||
| Money market funds | $ | $ | $ | $ | |||||||||||||||||||
| Short-term investments: | |||||||||||||||||||||||
| Certificates of deposit | |||||||||||||||||||||||
| Commercial paper | |||||||||||||||||||||||
| Corporate notes and bonds | |||||||||||||||||||||||
| U.S. treasury securities | |||||||||||||||||||||||
| Restricted cash: | |||||||||||||||||||||||
| Money market funds | |||||||||||||||||||||||
| Total | $ | $ | $ | $ | |||||||||||||||||||
| Included in cash and cash equivalents | $ | ||||||||||||||||||||||
| Included in short-term investments | $ | ||||||||||||||||||||||
| Included in restricted cash | $ | ||||||||||||||||||||||
There were no transfers between fair value measurement levels during the fiscal years ended March 31, 2022 and 2021.
72
The Company invests in certificates of deposit, commercial paper, corporate debt securities, U.S. treasury securities, and U.S. agency securities, which are classified as available-for-sale securities. The following table presents our available-for-sale securities as of March 31, 2022 (in thousands):
| Amortized Cost | Unrealized Gains | Unrealized Losses | Fair Value | ||||||||||||||||||||
| Short-term investments: | |||||||||||||||||||||||
| Certificates of deposit | $ | $ | $ | ( | $ | ||||||||||||||||||
| Commercial paper | ( | ||||||||||||||||||||||
| Corporate notes and bonds | ( | ||||||||||||||||||||||
| U.S. treasury securities | ( | ||||||||||||||||||||||
| Total available-for-sale investments | $ | $ | $ | ( | $ | ||||||||||||||||||
| Amortized Cost | Unrealized Gains | Unrealized Losses | Fair Value | ||||||||||||||||||||
| Short-term investments: | |||||||||||||||||||||||
| Certificates of deposit | $ | $ | $ | ( | $ | ||||||||||||||||||
| Commercial paper | |||||||||||||||||||||||
| Corporate notes and bonds | ( | ||||||||||||||||||||||
| U.S. treasury securities | ( | ||||||||||||||||||||||
| Total available-for-sale investments | $ | $ | $ | ( | $ | ||||||||||||||||||
The Company did not consider any available-for-sale securities to be impaired as of March 31, 2022 or 2021 since a large percentage of the portfolio that was in an unrealized loss position for more than 12 months was invested in US Treasury securities, which have no credit risk.
| March 31, 2022 | March 31, 2021 | ||||||||||
| Due within one year | $ | $ | |||||||||
| Due after one year and within three years | |||||||||||
| Total | $ | $ | |||||||||
For certain other financial instruments, including accounts receivable, accounts payable, and other current liabilities, the carrying amounts approximate their fair value due to the relatively short maturity of these balances.
Convertible Senior Notes
As of March 31, 2022, the fair value of the Company’s 0.50 % convertible senior notes due 2023 (the “Notes”) was $455.0 million. The fair value was determined based on the quoted price of the Notes in an inactive market on the last trading day of the reporting period and has been classified as Level 2 in the fair value hierarchy.
73
6. Property and Equipment
| March 31, 2022 | March 31, 2021 | ||||||||||
| Computers, software, and equipment | $ | $ | |||||||||
| Site operation equipment | |||||||||||
| Furniture and fixtures | |||||||||||
| Leasehold improvements | |||||||||||
| Capitalized software development costs | |||||||||||
| Total property and equipment | |||||||||||
| Less: accumulated depreciation and amortization | ( | ( | |||||||||
| Total property and equipment, net | $ | $ | |||||||||
Depreciation and amortization expense related to property and equipment during the fiscal years ended March 31, 2022, 2021, and 2020 was $40.5 million, $44.3 million, and $41.1 million, respectively.
7. 0.5% Convertible Senior Notes and Capped Call
In May 2018, the Company issued $500.25 million in aggregate principal amount of Notes in a private offering, including $65.25 million in aggregate principal amount of Notes pursuant to the exercise in full of the initial purchasers’ option to purchase additional Notes. The Notes are the Company’s senior unsecured obligations and bear interest at a fixed rate of 0.5 % per annum, payable semi-annually in arrears on May 1 and November 1 of each year, commencing on November 1, 2018. The Notes will mature on May 1, 2023, unless earlier converted or repurchased. Each $1,000 principal amount of the Notes will initially be convertible into 9.0244 shares of the Company’s common stock (the “Conversion Option”), which is equivalent to an initial conversion price of approximately $110.81 per share. The conversion rate is subject to adjustment under certain circumstances in accordance with the terms of the indenture governing the Notes. In addition, following certain corporate events that occur prior to the maturity date, the Company will increase the conversion rate, in certain circumstances, for a holder who elects to convert its Notes in connection with such a corporate event. During the three and twelve months ended March 31, 2022, the conditions allowing holders of the Notes to convert have not been met. The Notes were therefore not convertible during the twelve months ended March 31, 2022 and were classified as long-term debt for such period.
The Notes are convertible at the option of the holders at any time prior to the close of business on the business day immediately preceding November 1, 2022, only under the following circumstances: (1) during any fiscal quarter commencing after the fiscal quarter ending on September 30, 2018 (and only during such fiscal quarter), if the last reported sale price of the Company’s common stock for at least 20 trading days (whether or not consecutive) during a period of 30 consecutive trading days ending on, and including, the last trading day of the immediately preceding fiscal quarter is greater than or equal to 130 % of the conversion price on each applicable trading day; (2) during the five business day period after any five consecutive trading day period (the “measurement period”) in which the trading price (as defined in the indenture governing the Notes) per $1,000 principal amount of Notes for each trading day of the measurement period was less than 98 % of the product of the last reported sale price of our common stock and the conversion rate for the Notes on each such trading day; or (3) upon the occurrence of specified corporate events as set forth in the indenture governing the Notes. On or after November 1, 2022 until the close of business on the second scheduled trading day immediately preceding the maturity date, holders may convert all or any portion of their Notes, in multiples of $1,000 principal amount, at the option of the holder regardless of the foregoing circumstances. Upon conversion, the Company may satisfy its conversion obligation by paying and/or delivering, as the case may be, cash, shares of the Company’s common stock or a combination of cash and shares of the Company’s common stock, at the Company’s election, in the manner and subject to the terms and conditions provided in the indenture governing the Notes.
In accounting for the transaction, the Notes were separated into liability and equity components. The carrying amount of the liability component was calculated by measuring the fair value of a similar debt instrument that does not have an associated conversion feature. The carrying amount of the equity component representing the Conversion Option was $102.5 million and was determined by deducting the fair value of the liability component from the proceeds received upon issuance of the Notes. The equity component was recorded in additional paid-in capital and is not remeasured as long as it continues to meet the conditions for equity classification. The excess of the principal amount of the Notes over the liability component (the “Debt Discount”) and the debt issuance costs were amortized to interest expense over the contractual term of the Notes at an effective interest rate of 5.74 %. This rate is inclusive of the issuance costs.
74
In accounting for the debt issuance costs of $11.6 million related to the Notes, the Company allocated the total amount incurred to the liability and equity components using the same proportions as the proceeds of the Notes. Issuance costs attributable to the liability component were $9.2 million and were amortized to interest expense using the effective interest method over the contractual term of the Notes. Issuance costs attributable to the equity component were $2.4 million and netted with the equity component in additional paid-in capital.
In the first quarter of fiscal 2022, the Company adopted ASU No. 2020-06, Accounting for Convertible Instruments and Contract on an Entity’s Own Equity. As a result of the adoption, the Conversion Option of $102.5 million and issuance costs of $2.4 million previously attributable to the equity component are no longer be presented in equity. Similarly, the debt discount, which was equal to the carrying value of the embedded conversion feature upon issuance, is no longer amortized into income as interest expense over the life of the instrument. As a result, the Company recorded a $54.2 million decrease to the opening balance of accumulated deficit, a $100.1 million decrease to the opening balance of additional paid-in capital, and a $45.9 million increase to the opening balance of the Notes, net on the consolidated balance sheet.
| March 31, 2022 | March 31, 2021 | ||||||||||
| Principal | $ | $ | |||||||||
| Unamortized debt discount | ( | ||||||||||
| Unamortized issuance costs | ( | ( | |||||||||
| Net carrying amount | $ | $ | |||||||||
| March 31, 2022 | March 31, 2021 | ||||||||||
| Amortization of debt discount | $ | $ | |||||||||
| Amortization of issuance costs | |||||||||||
| Contractual interest expense | |||||||||||
| Total interest expense | $ | $ | |||||||||
In connection with the offering of the Notes, the Company entered into privately negotiated capped call transactions with certain financial institutions (the “Capped Calls”). The Capped Calls each have an initial strike price of approximately $110.81 per share, subject to certain adjustments, which correspond to the initial conversion price of the Notes. The Capped Calls have initial cap prices of $173.82 per share, subject to certain adjustments. The Capped Calls cover, subject to anti-dilution adjustments, approximately 4.5 million shares of our common stock. Conditions that cause adjustments to the initial strike price of the Capped Calls mirror conditions that result in corresponding adjustments for the Notes. The Capped Calls are generally intended to reduce potential dilution to holders of the Company’s common stock upon any conversion of the Notes and/or offset any cash payments the Company is required to make in excess of the principal amount of converted Notes, as the case may be, with such reduction and/or offset, as the case may be, subject to a cap based on the cap price. For accounting purposes, the Capped Calls are separate transactions, and not part of the terms of the Notes. As these transactions meet certain accounting criteria, the Capped Calls are recorded in stockholders’ equity and are not accounted for as derivatives. The cost of $63.2 million incurred in connection with the Capped Calls was recorded as a reduction to additional paid-in capital. The net impact related to stockholders’ equity has been included in additional paid-in capital and was a result of the issuance costs of $2.4 million and the purchase of capped calls noted above in the amount of $63.2 million.
75
8. Goodwill and Purchased Intangibles Assets
The changes in the carrying amount of goodwill for the twelve months ended March 31, 2022 consisted of the following (in thousands):
| Goodwill as of March 31, 2021 | $ | ||||
| Goodwill acquired | |||||
| Goodwill as of March 31, 2022 | $ | ||||
Purchased intangible assets subject to amortization as of March 31, 2022 consisted of the following (in thousands):
| Gross Carrying Amount | Accumulated Amortization | Net Carrying Amount | |||||||||||||||
| Developed technology | $ | $ | ( | $ | |||||||||||||
Purchased intangible assets subject to amortization as of March 31, 2021 consisted of the following (in thousands):
| Gross Carrying Amount | Accumulated Amortization | Net Carrying Amount | |||||||||||||||
| Developed technology | $ | $ | ( | $ | |||||||||||||
Amortization expense of purchased intangible assets for the fiscal years ended March 31, 2022, 2021, and 2020 was $7.6 million, $5.5 million, and $1.7 million, respectively, and is included in cost of revenue on the Company’s consolidated statements of operations.
Estimated future amortization expense as of March 31, 2022 is as follows (in thousands):
| Fiscal Years Ending March 31, | Estimated Future Amortization Expense | ||||
| 2023 | $ | ||||
| 2024 | |||||
| 2025 | |||||
| $ | |||||
9. Other Current Liabilities
Other current liabilities consisted of the following (in thousands):
| As of March 31, | |||||||||||
| 2022 | 2021 | ||||||||||
| Accrued liabilities | $ | $ | |||||||||
| Accrued tax liabilities | |||||||||||
| Other | |||||||||||
| Total other current liabilities | $ | $ | |||||||||
76
10. Leases
| March 31, 2022 | March 31, 2021 | ||||||||||
| Assets | |||||||||||
| Lease right-of-use-assets | $ | $ | |||||||||
| Liabilities | |||||||||||
| Lease liabilities | $ | $ | |||||||||
| Lease liabilities, non-current | |||||||||||
| Total operating lease liabilities | $ | $ | |||||||||
As of March 31, 2022, the weighted average remaining lease term was 5.3 years and the weighted average discount rate was 6.8 %.
The following table presents information about leases on its consolidated statement of operations (in thousands):
| Fiscal Year Ended March 31, | |||||||||||||||||
| 2022 | 2021 | 2020 | |||||||||||||||
| Operating lease expense | $ | $ | $ | ||||||||||||||
| Short-term lease expense | |||||||||||||||||
| Variable lease expense | |||||||||||||||||
The following table presents supplemental cash flow information about the Company’s leases (in thousands):
| Fiscal Year Ended March 31, | |||||||||||
| 2022 | 2021 | ||||||||||
| Cash paid for amounts included in the measurement of lease liabilities | $ | $ | |||||||||
| Operating lease assets obtained in exchange for new lease liabilities (1) | |||||||||||
(1) Includes the impact of new leases as well as remeasurements and modifications to existing leases.
| Fiscal Years Ending March 31, | Operating Leases | ||||
| 2023 | $ | ||||
| 2024 | |||||
| 2025 | |||||
| 2026 | |||||
| 2027 | |||||
| Thereafter | |||||
| Total operating lease payments | $ | ||||
| Less imputed interest | ( | ||||
| Total operating lease liabilities | $ | ||||
11. Commitments and Contingencies
Purchase Commitments—As of March 31, 2022 and 2021, the Company had purchase commitments of $549.4 million and $494.6 million, respectively, primarily related to data center, cloud and hosting services.
In September 2020, the Company entered into an agreement with a public cloud hosting provider, under which it now has a total five-year minimum commitment of $500.0 million, which has been included in the commitment balance as of March 31, 2022 above.
Other Contingencies—In the normal course of business, the Company may agree to indemnify third parties with whom it enters into contractual relationships, including customers, lessors, and parties to other transactions with the Company,
77
12. Common Stock and Stockholders’ Equity
Common stock reserved for issuance—The Company had reserved shares of common stock for future issuance pursuant to equity plans as follows (in thousands):
| As of March 31, | |||||||||||
| 2022 | 2021 | ||||||||||
| Common stock options outstanding | |||||||||||
| RSUs outstanding | |||||||||||
| PSUs outstanding | |||||||||||
| Available for future stock option, RSU, and PSU grants | |||||||||||
| Available for future employee stock purchase plan awards | |||||||||||
Employee Stock Purchase Plan—The Company’s board of directors adopted, and the Company’s stockholders approved, the Company’s 2014 Employee Stock Purchase Plan (the “ESPP”), which became effective in December 2014. The ESPP initially reserved and authorized the issuance of up to 1,000,000 shares of common stock. The ESPP provides that the number of shares reserved and available for issuance under the ESPP automatically increases each April, beginning on April 1, 2015, by the lesser of 500,000 shares, 1 % of the number of the Company’s common stock shares issued and outstanding on the immediately preceding March 31, or such lesser number of shares as determined by the Company’s board of directors. For the fiscal years ended March 31, 2022, 2021, and 2020, 0.2 million shares, 0.3 million shares, and 0.3 million shares of common stock were purchased under the ESPP, respectively, and a total of $4.2 million, $5.5 million, and $5.3 million of stock-based compensation expense was recorded, respectively. As of March 31, 2022, 2,987,542 shares of common stock were available for issuance under the ESPP.
2008 Equity Incentive Plan—The Company’s board of directors adopted, and the Company’s stockholders approved, the 2008 Equity Incentive Plan, or the 2008 Plan, in February 2008. The 2008 Plan was terminated in connection with the Company’s initial public offering (“IPO”), and accordingly, no shares are available for future issuance under this plan. The 2008 Plan continues to govern outstanding awards granted thereunder.
2014 Equity Incentive Plan—The Company’s board of directors adopted, and the Company’s stockholders approved, the Company’s 2014 Equity Incentive Plan (the “2014 Plan”), which became effective in December 2014. The 2014 Plan serves as the successor to the Company’s 2008 Plan. The 2014 Plan initially reserved and authorized the issuance of 5,000,000 shares of the Company’s common stock. Additionally, shares not issued or subject to outstanding grants under the 2008 Plan upon its termination became available under the 2014 Plan, resulting in a total of 5,184,878 available shares under the 2014 Plan as of the effective date of the 2014 Plan. Pursuant to the terms of the 2014 Plan, any shares subject to outstanding stock options or other stock awards under the 2008 Plan that (i) expire or terminate for any reason prior to exercise or settlement, (ii) are forfeited because of the failure to meet a contingency or condition required to vest such shares or otherwise return to the Company or (iii) are reacquired, withheld (or not issued) to satisfy a tax withholding obligation in connection with an award or to satisfy the purchase price or exercise price of a stock award will become available for issuance pursuant to awards granted under the 2014 Plan. The 2014 Plan provides that the number of shares reserved and available for issuance under the plan automatically increases each April 1, beginning on April 1, 2015, by 5 % of the outstanding number of shares of the Company’s common stock shares issued and outstanding on the immediately preceding March 31, or such lesser number of shares as determined by the Company’s board of directors. As of March 31, 2022, there were 13,904,194 shares available for issuance under the 2014 Plan.
78
The following table summarizes the Company’s stock option, restricted stock unit (“RSU”), and performance unit (“PSU”) award activities for the fiscal year ended March 31, 2022 (in thousands, except exercise price, contractual term and fair value information):
| Options Outstanding | RSUs Outstanding | PSUs Outstanding | |||||||||||||||||||||||||||||||||||||||||||||||||||||||||||||||||||||
| Number of Shares | Weighted- Average Exercise Price | Weighted-Average Remaining Contractual Term (in years) | Aggregate Intrinsic Value | Number of Shares | Weighted- Average Grant Date Fair Value | Weighted- Average Remaining Contractual Term (in years) | Aggregate Intrinsic Value | Number of Shares | Weighted- Average Grant Date Fair Value | Weighted- Average Remaining Contractual Term (in years) | Aggregate Intrinsic Value | ||||||||||||||||||||||||||||||||||||||||||||||||||||||||||||
| Outstanding—April 1, 2021 | $ | $ | $ | $ | $ | $ | |||||||||||||||||||||||||||||||||||||||||||||||||||||||||||||||||
| Granted (1) | |||||||||||||||||||||||||||||||||||||||||||||||||||||||||||||||||||||||
| Exercised/vested | ( | ( | ( | ||||||||||||||||||||||||||||||||||||||||||||||||||||||||||||||||||||
| Canceled/forfeited | ( | ( | |||||||||||||||||||||||||||||||||||||||||||||||||||||||||||||||||||||
| Outstanding - March 31, 2022 | $ | $ | $ | $ | $ | $ | |||||||||||||||||||||||||||||||||||||||||||||||||||||||||||||||||
| Options vested and expected to vest - March 31, 2022 | $ | $ | |||||||||||||||||||||||||||||||||||||||||||||||||||||||||||||||||||||
| Options vested and exercisable - March 31, 2022 | $ | $ | |||||||||||||||||||||||||||||||||||||||||||||||||||||||||||||||||||||
| RSUs and PSUs expected to vest - March 31, 2022 | $ | $ | $ | $ | |||||||||||||||||||||||||||||||||||||||||||||||||||||||||||||||||||
(1) The above table includes 241,398 performance unit awards and does not include any time-based restricted stock issued as consideration for an acquisition which are further detailed in the table below.
PSUs granted under the 2014 Plan are contingent upon the achievement of pre-determined market and service conditions. The number of shares of common stock to be issued at vesting will range from 0 % to 200 % of the target number based on the Company’s total shareholder return (“TSR”) relative to the performance of peer companies for each measurement period, over a one-year , two-year cumulative, and three-year cumulative period. If these market conditions are not met but service conditions are met, the PSUs will not vest; however, any stock-based compensation expense recognized to date will not be reversed. The Company uses a Monte Carlo simulation model to determine the fair value of its PSUs and recognizes expense using the accelerated attribution method over the requisite service period. The PSUs presented in the table above were calculated based on 100% expected achievement. In April 2022, subsequent to the year-end, 129,991 PSUs had vested.
The weighted-average grant-date fair value of options granted during the fiscal years ended March 31, 2022, 2021, and 2020 was $0.00 , $26.51 , and $30.67 , respectively. Intrinsic value of options exercised during the fiscal years ended March 31, 2022, 2021, and 2020 was $39.0 million, $20.6 million, and $23.8 million, respectively. The total fair value of RSUs vested during the fiscal years ended March 31, 2022, 2021, and 2020 was $99.3 million, $107.1 million, and $63.3 million, respectively.
Aggregate intrinsic value for options, RSUs, and PSUs outstanding represents the difference between the closing stock price of the Company’s common stock and the exercise price of outstanding, in-the-money awards. The Company’s closing stock price as reported on the New York Stock Exchange as of March 31, 2022, the last trading day of fiscal 2022, was $66.88 .
79
The following table summarizes the time-based restricted stock issued as consideration for an acquisition during the fiscal years ended March 31, 2022, 2021, and 2020:
| Fiscal Years Ending March 31, | Number of Shares of Time-Based Restricted Stock Granted as Consideration for Acquisitions | ||||
| 2020 | |||||
| 2021 | |||||
| 2022 | |||||
(1) These shares were issued in connection with the Pixie Labs acquisition, which included a holdback arrangement with certain employees of Pixie Labs. These shares are subject to the recipients’ continued service and will be recognized as stock-based compensation expense over the vesting periods, which range from 18 months to 37 months from the closing date of the acquisition.
(2) These shares were issued in connection with the CodeStream acquisition, which included a holdback arrangement with certain employees of CodeStream. These shares are subject to the recipients’ continued service and will be recognized as stock-based compensation expense over the vesting periods, which range from 18 months to 42 months from the closing date of the acquisition.
Employee Stock Options and ESPP Valuation—The Company estimates the fair value of stock options and ESPP shares on the date of grant using the Black-Scholes option-pricing model. Each of the Black-Scholes inputs is subjective and generally requires significant judgments to determine. The assumptions used to estimate the fair value of stock options granted and ESPP shares to be issued during the fiscal years ended March 31, 2022, 2021, and 2020 were as follows:
| Stock Options: | |||||||||||||||||
| Fiscal Year Ended March 31, | |||||||||||||||||
| 2022 | 2021 | 2020 | |||||||||||||||
| Expected term (years) | |||||||||||||||||
| Expected volatility | |||||||||||||||||
| Risk-free interest rate | |||||||||||||||||
| Dividend yield | |||||||||||||||||
| ESPP: | |||||||||||||||||
| Fiscal Year Ended March 31, | |||||||||||||||||
| 2022 | 2021 | 2020 | |||||||||||||||
| Expected term (years) | |||||||||||||||||
| Expected volatility | |||||||||||||||||
| Risk-free interest rate | |||||||||||||||||
| Dividend yield | |||||||||||||||||
Risk-Free Interest Rate
The Company bases the risk-free interest rate used in the Black-Scholes option-pricing model on the implied yield available on U.S. Treasury zero-coupon issues with an equivalent expected term of the options for each option group.
Expected Term
The Company determines the expected term based on the average period the stock options are expected to remain outstanding generally calculated as the midpoint of the stock options vesting term and contractual expiration period. The Company estimates the expected term for ESPP shares using the purchase period of 6 months.
Expected Volatility
Beginning in April 2020, the expected volatility for options granted is based on the historical volatility of the Company’s common stock. The expected volatility for options granted prior to April 2020 was based on the historical volatilities of our publicly traded peer group. The Company uses historical volatility data when valuing ESPP shares.
Dividend Yield
The expected dividend assumption is based on the Company’s current expectations about its anticipated dividend policy.
80
Stock-Based Compensation Expense—Aggregate stock-based compensation expense for employees and nonemployees was $153.0 million, $135.1 million, and $99.5 million for the fiscal years ended March 31, 2022, 2021, and 2020, respectively. Cost of revenue, research and development, sales and marketing, and general and administrative expenses were as follows (in thousands):
| Fiscal Year Ended March 31, | |||||||||||||||||
| 2022 | 2021 | 2020 | |||||||||||||||
| Cost of revenue | $ | $ | $ | ||||||||||||||
| Research and development | |||||||||||||||||
| Sales and marketing | |||||||||||||||||
General and administrative (1) | |||||||||||||||||
Total stock-based compensation expense (2) | $ | $ | $ | ||||||||||||||
(1) Includes $9.6 million acceleration of share-based payment expense for the fiscal year ended March 31, 2022, for one of the Company’s executives due to his departure at the end of June 2021.
(2) Includes $0.5 million expense for the fiscal year ended March 31, 2022, due to the restructuring activities commenced in the first quarter of fiscal 2022. Refer to Note 18. Restructuring for more information.
As of March 31, 2022, unrecognized stock-based compensation cost related to outstanding unvested stock options was $9.8 million, which is expected to be recognized over a weighted-average period of approximately 1.8 years. As of March 31, 2022, unrecognized stock-based compensation cost related to outstanding unvested stock units was $251.7 million, which is expected to be recognized over a weighted-average period of approximately 2.5 years. As of March 31, 2022, unrecognized stock-based compensation cost related to PSUs was $10.0 million, which is expected to be recognized over a weighted-average period of approximately 1.8 years.
13. Income Taxes
| Fiscal Year Ended March 31, | |||||||||||||||||
| 2022 | 2021 | 2020 | |||||||||||||||
| Domestic | $ | ( | $ | ( | $ | ( | |||||||||||
| Foreign | |||||||||||||||||
| Total | $ | ( | $ | ( | $ | ( | |||||||||||
| Fiscal Year Ended March 31, | |||||||||||||||||
| 2022 | 2021 | 2020 | |||||||||||||||
| Current Provision: | |||||||||||||||||
| Federal | $ | $ | $ | ( | |||||||||||||
| State | ( | ||||||||||||||||
| Foreign | |||||||||||||||||
| Total current provision | |||||||||||||||||
| Deferred Provision: | |||||||||||||||||
| Federal | ( | ||||||||||||||||
| State | ( | ( | |||||||||||||||
| Foreign | ( | ( | ( | ||||||||||||||
| Total deferred provision | ( | ( | ( | ||||||||||||||
| Total income tax provision | $ | $ | $ | ||||||||||||||
81
| Fiscal Year Ended March 31, | |||||||||||||||||
| 2022 | 2021 | 2020 | |||||||||||||||
| Federal statutory rate | % | % | % | ||||||||||||||
| Effect of: | |||||||||||||||||
| State taxes, net of federal benefits | |||||||||||||||||
| Stock-based compensation | ( | ( | |||||||||||||||
| Research and development credits, net of ASC 740-10 | |||||||||||||||||
| Permanent items | ( | ( | ( | ||||||||||||||
| Foreign taxes | |||||||||||||||||
| Intraperiod allocation | |||||||||||||||||
| Other | |||||||||||||||||
| Valuation allowance | ( | ( | ( | ||||||||||||||
| Effective tax rate | ( | % | ( | % | ( | % | |||||||||||
Deferred income taxes reflect the net tax effects of temporary differences between the carrying amounts of assets and liabilities for financial reporting purposes and the amounts used for income tax purposes. The following table presents the significant components of the Company’s deferred tax assets and liabilities for the periods presented (in thousands):
| As of March 31, | |||||||||||
| 2022 | 2021 | ||||||||||
| Deferred tax assets: | |||||||||||
| Accrued expenses | $ | $ | |||||||||
| Depreciation and amortization | |||||||||||
| Capitalized research and development | |||||||||||
| Net operating loss and other attribute carryforwards | |||||||||||
| Stock based compensation | |||||||||||
| Research and development credits | |||||||||||
| Lease liability | |||||||||||
| Convertible debt | |||||||||||
| Other | |||||||||||
| Gross deferred tax assets | |||||||||||
| Valuation allowance | ( | ( | |||||||||
| Total deferred tax assets | |||||||||||
| Deferred tax liabilities: | |||||||||||
| Prepaids | ( | ( | |||||||||
| Intangibles | ( | ( | |||||||||
| Capitalized research and development | ( | ||||||||||
| Deferred contract acquisition costs | ( | ( | |||||||||
| Convertible debt | ( | ||||||||||
| Right of use asset | ( | ( | |||||||||
| Total deferred tax liabilities | ( | ( | |||||||||
| Total net deferred tax assets/(liabilities) | $ | $ | |||||||||
The Company accounts for deferred taxes under ASC 740, Income Taxes, which requires a reduction of the carrying amounts of deferred tax assets by a valuation allowance if, based on available evidence, it is more likely than not that such assets will not be realized. Accordingly, the need to establish valuation allowances for deferred tax assets is assessed periodically based on the ASC 740 more-likely-than-not realization threshold. This assessment considers matters such as future reversals of existing taxable temporary differences, projected future taxable income, tax-planning strategies and results of recent operations. The evaluation of the recoverability of the deferred tax assets requires that we weigh all positive and negative evidence to reach a conclusion that it is more likely than not that all or some portion of the deferred tax assets will not be realized. The weight given to the evidence is commensurate with the extent to which it can be objectively verified. Based upon
82
the weight of available evidence, which includes the Company’s historical operating performance and the U.S. and Japan cumulative net losses in all prior periods, the Company has provided a valuation allowance against its U.S. and Japan deferred tax assets. Overall, the valuation allowance increased by $77.7 million and $47.5 million for the years ended March 31, 2022 and 2021, respectively.
As of March 31, 2022, the Company has U.S. federal and state net operating losses of approximately $776.7 million and $449.3 million, respectively, which expire beginning in the years 2028 and 2020. Of the $776.7 million federal net operating losses, $355.2 million are carried forward indefinitely but are limited to 80 % of taxable income. The remaining $421.5 million begin to expire in 2028. As of March 31, 2022, the Company also has Federal, California and Oregon research and development credits of $37.4 million, $6.1 million, and $1.0 million, respectively. The federal tax credit carryforwards will expire beginning in 2028 if not utilized. The California credit carryforwards do not expire. The Oregon tax credit carryforwards began to expire in 2020.
Utilization of the net operating loss carryforwards may be subject to a substantial annual limitation due to the ownership change limitations provided by the Code, and similar state provisions. The annual limitation may result in the expiration of net operating losses and credits before utilization.
Section 382 of the Code (“Section 382”) ownership change generally occurs if one or more stockholders or groups of stockholders who own at least 5 % of the Company’s stock increase their ownership by more than 50 percentage points over their lowest ownership percentage within a rolling three-year period. Similar rules may apply under state tax laws. The Company did experience one or more ownership changes in financial periods ending on or before March 31, 2022. In this regard, the Company has determined that based on the timing of the ownership changes and the corresponding Section 382 limitations, none of its net operating losses or other tax attributes are subject to such limitation.
The Company has adopted authoritative guidance which prescribes a recognition threshold and measurement attribute for the financial statement recognition and measurement of uncertain tax positions taken or expected to be taken in the Company’s income tax return, and also provides guidance on derecognition, classification, interest and penalties, accounting in interim periods, disclosure, and transition.
The Company had unrecognized tax benefits of $15.0 million, $12.2 million, and $10.3 million as of March 31, 2022, 2021, and 2020. As of March 31, 2022, if recognized, the unrecognized tax benefit of $14.8 million would not affect income tax expense before consideration of any valuation allowance. The Company does not expect the unrecognized tax benefits to change significantly over the next 12 months.
| Balance at March 31, 2019 | $ | ||||
| Additions based on tax positions taken during the current period | |||||
| Additions based on tax positions taken during the prior period | |||||
| Reductions based on tax positions taken during the prior period | ( | ||||
| Balance at March 31, 2020 | |||||
| Additions based on tax positions taken during the current period | |||||
| Additions based on tax positions taken during the prior period | |||||
| Reductions based on tax positions taken during the prior period | ( | ||||
| Balance at March 31, 2021 | |||||
| Additions based on tax positions taken during the current period | |||||
| Additions based on tax positions taken during the prior period | |||||
| Reductions based on tax positions taken during the prior period | ( | ||||
| Balance at March 31, 2022 | $ | ||||
The Company recognizes interest and penalties related to unrecognized tax benefits within the income tax expense line in the consolidated statement of operations. Accrued interest and penalties have no
14. Net Loss Per Share
83
Additionally, the 4.5 million shares underlying the Conversion Option in the Notes are not considered in the calculation of diluted net loss per share as the effect would be anti-dilutive. The Notes were not convertible as of March 31, 2022.
ASU 2020-06 eliminates the treasury stock method and instead requires the application of the if-converted method to calculate the impact of convertible instruments on diluted earnings per share when the instruments may be settled in cash or shares. The required use of the if-converted method did not impact the diluted net loss per share as the Company was in a net loss position.
| Fiscal Year Ended March 31, | |||||||||||||||||
| 2022 | 2021 | 2020 | |||||||||||||||
| Numerator: | |||||||||||||||||
| Net loss attributable to New Relic | $ | ( | $ | ( | $ | ( | |||||||||||
| Denominator: | |||||||||||||||||
| Weighted average shares used to compute net loss per share, basic and diluted | |||||||||||||||||
| Net loss attributable to New Relic per share—basic and diluted | $ | ( | $ | ( | $ | ( | |||||||||||
| As of March 31, | |||||||||||||||||
| 2022 | 2021 | 2020 | |||||||||||||||
| Options to purchase common stock | |||||||||||||||||
| RSUs | |||||||||||||||||
| PSUs | — | ||||||||||||||||
| ESPP shares | |||||||||||||||||
15. Employee Benefit Plan
16. Revenue by Geographic Location
| Fiscal Year Ended March 31, | |||||||||||||||||
| 2022 | 2021 | 2020 | |||||||||||||||
| United States | $ | $ | $ | ||||||||||||||
| EMEA | |||||||||||||||||
| APAC | |||||||||||||||||
| Other | |||||||||||||||||
| Total revenue | $ | $ | $ | ||||||||||||||
Substantially all of the Company’s long-lived assets were attributable to operations in the United States as of March 31, 2022 and 2021.
84
17. Related Party Transactions
18. Restructuring
In the first quarter of fiscal 2022, the Company commenced a restructuring plan to realign its cost structure to better reflect significant product and business model innovation over the past 12 months. As a result of the restructuring plan, the Company incurred charges of approximately $12.6 million for employee terminations and other costs associated with the restructuring plan. Most of these charges consisted of cash expenditures and stock-based compensation expense which were recognized and mostly paid off in the first quarter of fiscal 2022. For the fourth quarter of fiscal 2022, the Company had an immaterial credit adjustment and had no restructuring charges for the same period last year. The Company incurred $12.6 million and $0 million in restructuring charges for the fiscal years ended March 31, 2022 and 2021, respectively.
The following table shows the Company’s restructuring charges for the fiscal year ended March 31, 2022 (in thousands):
| Fiscal Year Ended March 31, 2022 | |||||||||||||||||||||||
| Severance and other employee costs | Stock-based compensation | Asset impairment | Total | ||||||||||||||||||||
| Sales and marketing | $ | $ | $ | $ | |||||||||||||||||||
| General and administrative | |||||||||||||||||||||||
| Total | $ | $ | $ | $ | |||||||||||||||||||
85
Item 9. Changes in and Disagreements With Accountants on Accounting and Financial Disclosure
None.
Item 9A. Controls and Procedures
Evaluation of Disclosure Controls and Procedures
Our management, with the participation of our Chief Executive Officer and Chief Financial Officer, has evaluated the effectiveness of our disclosure controls and procedures (as defined in Rules 13a-15(e) and 15d-15(e) under the Exchange Act) as of the end of the period covered by this Annual Report on Form 10-K.
Based on this evaluation, our Chief Executive Officer and Chief Financial Officer concluded that, as of March 31, 2022, our disclosure controls and procedures were effective to provide reasonable assurance that information we are required to disclose in reports that we file or submit under the Exchange Act is recorded, processed, summarized, and reported within the time periods specified in the SEC’s rules and forms, and that such information is accumulated and communicated to our management, including our Chief Executive Officer and Chief Financial Officer, as appropriate, to allow timely decisions regarding required disclosure.
Management’s Report on Internal Control Over Financial Reporting
Our management is responsible for establishing and maintaining adequate internal control over financial reporting, as defined in Rule 13a-15(f) of the Exchange Act. Our management conducted an evaluation of the effectiveness of our internal control over financial reporting based on the framework in Internal Control—Integrated Framework (2013) issued by the Committee of Sponsoring Organizations of the Treadway Commission. Our internal over control over financial reporting includes policies and procedures that provide reasonable assurance regarding the reliability of financial reporting and the preparation of financial statements for external reporting purposes in accordance with GAAP. Based on this evaluation, management concluded that our internal control over financial reporting was effective as of March 31, 2022. Our independent registered public accounting firm, Deloitte & Touche LLP, has issued an audit report with respect to our internal control over financial reporting, which appears in Part II, Item 8 of this Annual Report on Form 10-K.
Limitations on the Effectiveness of Controls
In designing and evaluating the disclosure controls and procedures and internal control over financial reporting, management recognizes that any controls and procedures, no matter how well designed and operated, can provide only reasonable assurance of achieving the desired control objectives. In addition, the design of disclosure controls and procedures and internal control over financial reporting must reflect the fact that there are resource constraints and that management is required to apply its judgment in evaluating the benefits of possible controls and procedures relative to their costs.
Changes in Internal Control over Financial Reporting
There was no change in our internal control over financial reporting identified in connection with the evaluation required by Rule 13a-15(d) and 15d-15(d) of the Exchange Act that occurred during the quarter ended March 31, 2022 that has materially affected, or is reasonably likely to materially affect, our internal control over financial reporting.
86
REPORT OF INDEPENDENT REGISTERED PUBLIC ACCOUNTING FIRM
To the stockholders and the Board of Directors of New Relic, Inc.
Opinion on Internal Control over Financial Reporting
We have audited the internal control over financial reporting of New Relic, Inc. and subsidiaries (the “Company”) as of March 31, 2022, based on criteria established in Internal Control—Integrated Framework (2013) issued by the Committee of Sponsoring Organizations of the Treadway Commission (COSO). In our opinion, the Company maintained, in all material respects, effective internal control over financial reporting as of March 31, 2022, based on criteria established in Internal Control—Integrated Framework (2013) issued by COSO.
We have also audited, in accordance with the standards of the Public Company Accounting Oversight Board (United States) (PCAOB), the consolidated financial statements as of and for the year ended March 31, 2022, of the Company and our report dated May 17, 2022, expressed an unqualified opinion on those consolidated financial statements.
Basis for Opinion
The Company’s management is responsible for maintaining effective internal control over financial reporting and for its assessment of the effectiveness of internal control over financial reporting, included in the accompanying Management’s Report on Internal Control Over Financial Reporting. Our responsibility is to express an opinion on the Company’s internal control over financial reporting based on our audit. We are a public accounting firm registered with the PCAOB and are required to be independent with respect to the Company in accordance with the U.S. federal securities laws and the applicable rules and regulations of the Securities and Exchange Commission and the PCAOB.
We conducted our audit in accordance with the standards of the PCAOB. Those standards require that we plan and perform the audit to obtain reasonable assurance about whether effective internal control over financial reporting was maintained in all material respects. Our audit included obtaining an understanding of internal control over financial reporting, assessing the risk that a material weakness exists, testing and evaluating the design and operating effectiveness of internal control based on the assessed risk, and performing such other procedures as we considered necessary in the circumstances. We believe that our audit provides a reasonable basis for our opinion.
Definition and Limitations of Internal Control over Financial Reporting
A company’s internal control over financial reporting is a process designed to provide reasonable assurance regarding the reliability of financial reporting and the preparation of financial statements for external purposes in accordance with generally accepted accounting principles. A company’s internal control over financial reporting includes those policies and procedures that (1) pertain to the maintenance of records that, in reasonable detail, accurately and fairly reflect the transactions and dispositions of the assets of the company; (2) provide reasonable assurance that transactions are recorded as necessary to permit preparation of financial statements in accordance with generally accepted accounting principles, and that receipts and expenditures of the company are being made only in accordance with authorizations of management and directors of the company; and (3) provide reasonable assurance regarding prevention or timely detection of unauthorized acquisition, use, or disposition of the company’s assets that could have a material effect on the financial statements.
Because of its inherent limitations, internal control over financial reporting may not prevent or detect misstatements. Also, projections of any evaluation of effectiveness to future periods are subject to the risk that controls may become inadequate because of changes in conditions, or that the degree of compliance with the policies or procedures may deteriorate.
/s/ DELOITTE & TOUCHE LLP
May 17, 2022
87
Item 9B. Other Information
None.
Item 9C. Disclosure Regarding Foreign Jurisdictions that Prevent Inspections
Not applicable.
88
PART III
Item 10. Directors, Executive Officers and Corporate Governance
The information called for by this item will be set forth under the captions “Election of Directors,” “Information Regarding the Board of Directors and Corporate Governance,” “Delinquent Section 16(a) Reports,” “Report of the Audit Committee of the Board of Directors,” “Information Regarding Committees of the Board of Directors” and “Executive Officers” in our Definitive Proxy Statement for the 2022 Annual Meeting of Stockholders to be filed with the SEC within 120 days of the fiscal year ended March 31, 2022, or our Proxy Statement, and is incorporated herein by reference.
Item 11. Executive Compensation
The information called for by this item will be set forth under the captions “Executive Compensation,” “Director Compensation,” “Information Regarding Committees of the Board of Directors” and “Information Regarding the Board of Directors and Corporate Governance” in our Proxy Statement and is incorporated herein by reference.
Item 12. Security Ownership of Certain Beneficial Owners and Management and Related Stockholder Matters
The information called for by this item will be set forth under the captions “Security Ownership of Certain Beneficial Owners and Management” and “Equity Compensation Plan Information” in our Proxy Statement and is incorporated herein by reference.
Item 13. Certain Relationships and Related Transactions, and Director Independence
The information called for by this item will be set forth under the captions “Transactions with Related Persons” and “Information Regarding the Board of Directors and Corporate Governance” in our Proxy Statement and is incorporated herein by reference.
Item 14. Principal Accountant Fees and Services
The information called for by this item will be set forth under the caption “Ratification of Selection of Independent Registered Public Accounting Firm” in our Proxy Statement and is incorporated herein by reference.
89
PART IV
Item 15. Exhibits and Financial Statement Schedules
The following documents are filed as part of this Annual Report on Form 10-K:
(1)Consolidated Financial Statements
Our Consolidated Financial Statements are listed in the “Index to Consolidated Financial Statements” under Part II, Item 8 of this Annual Report on Form 10-K.
(2)Financial Statement Schedules
All financial statement schedules have been omitted because they are not required, not applicable, not present in amounts sufficient to require submission of the schedule, or the required information is shown in our Consolidated Financial Statements or Notes thereto.
(3)Exhibits
The exhibits listed in the accompanying Exhibit Index are filed, furnished or incorporated by reference as part of this Annual Report on Form 10-K.
90
Exhibit Index
| Exhibit No. | Description of Exhibit | Incorporated by Reference | Filed Herewith | |||||||||||||||||||||||||||||||||||
| Form | File No. | Exhibit | File Date | |||||||||||||||||||||||||||||||||||
| Amended and Restated Certificate of Incorporation of the Registrant. | 8-K | 001-36766 | 3.1 | August 19, 2021 | ||||||||||||||||||||||||||||||||||
| Amended and Restated Bylaws of the Registrant. | 8-K | 001-36766 | 3.2 | August 19, 2021 | ||||||||||||||||||||||||||||||||||
| Form of common stock certificate of the Registrant. | S-1/A | 333-200078 | 4.1 | December 1, 2014 | ||||||||||||||||||||||||||||||||||
4.2 | Indenture, dated as of May 18, 2018, by and between New Relic, Inc. and U.S. Bank National Association, as Trustee. | 8-K | 001-36766 | 4.1 | May 18, 2018 | |||||||||||||||||||||||||||||||||
4.3 | Form of Global Note, representing New Relic, Inc.’s 0.50% Convertible Senior Notes due 2023. | 8-K | 001-36766 | 4.2 | May 18, 2018 | |||||||||||||||||||||||||||||||||
| Description of Capital Stock. | X | |||||||||||||||||||||||||||||||||||||
| Form of Indemnification Agreement between the Registrant and each of its directors and executive officers. | S-1/A | 333-200078 | 10.1 | December 1, 2014 | ||||||||||||||||||||||||||||||||||
| 2008 Equity Incentive Plan, as amended, and related form agreements. | 10-Q | 001-36766 | 10.1 | February 13, 2015 | ||||||||||||||||||||||||||||||||||
| 2014 Equity Incentive Plan and related form agreements. | 10-Q | 001-36766 | 10.1 | November 6, 2019 | ||||||||||||||||||||||||||||||||||
| 2014 Employee Stock Purchase Plan. | S-8 | 333-201024 | 99.3 | December 17, 2014 | ||||||||||||||||||||||||||||||||||
| Form of Performance Unit Award Grant Notice under the 2014 Equity Incentive Plan, and related form agreements. | 10-Q | 001-36766 | 10.2+ | August 5, 2020 | ||||||||||||||||||||||||||||||||||
| Offer Letter between the Registrant and Michael Christenson, dated as of September 15, 2019. | 10-Q | 001-36766 | 10.3 | November 6, 2019 | ||||||||||||||||||||||||||||||||||
| Offer Letter between the Registrant and Mark Sachleben, dated as of February 4, 2008. | S-1 | 333-200078 | 10.8 | November 10, 2014 | ||||||||||||||||||||||||||||||||||
| Offer Letter between the Registrant and William Staples, dated as of November 22, 2019. | 10-Q | 001-36766 | 10.1 | February 5, 2020 | ||||||||||||||||||||||||||||||||||
| Amended Terms of Employment Agreement between the Registrant and Michael Christenson, dated as of January 5, 2021. | 10-K | 001-36766 | 10.9+ | May 14, 2021 | ||||||||||||||||||||||||||||||||||
| Office Lease by and between the Registrant and 188 Spear Street LLC, dated as of July 13, 2012, as amended. | S-1 | 333-200078 | 10.11 | November 10, 2014 | ||||||||||||||||||||||||||||||||||
| Fourth Amendment to Lease by and between the Registrant and 188 Spear Street LLC, dated as of November 1, 2017. | 10-Q | 001-36766 | 10.2 | November 8, 2017 | ||||||||||||||||||||||||||||||||||
| Fifth Amendment to Lease by and between the Registrant and 188 Spear Street LLC, dated as of December 29, 2017. | 10-Q | 001-36766 | 10.1 | February 6, 2018 | ||||||||||||||||||||||||||||||||||
| Letter Agreement to Fourth Amendment to Lease by and between the Registrant and 188 Spear Street LLC, dated as of May 5, 2020. | 10-Q | 001-36766 | 10.1 | August 5, 2020 | ||||||||||||||||||||||||||||||||||
| Form of Change in Control and Severance Agreement. | S-1/A | 333-200078 | 10.12 | December 1, 2014 | ||||||||||||||||||||||||||||||||||
| Form of Extension to Change in Control and Severance Agreement. | 10-Q | 001-36766 | 10.1 | February 5, 2021 | ||||||||||||||||||||||||||||||||||
| Form of Confirmation for Capped Call Transactions. | 8-K | 001-36766 | 10.1 | May 18, 2018 | ||||||||||||||||||||||||||||||||||
91
| Exhibit No. | Description of Exhibit | Incorporated by Reference | Filed Herewith | |||||||||||||||||||||||||||||||||||
| Form | File No. | Exhibit | File Date | |||||||||||||||||||||||||||||||||||
| New Relic, Inc. Non-Employee Director Compensation Policy, as amended. | 8-K | 001-36766 | 99.2 | June 25, 2021 | ||||||||||||||||||||||||||||||||||
Cooperation Agreement, by and among the Registrant and affiliates of Engaged Capital, LLC, dated as of June 24, 2021. | 8-K | 001-36766 | 10.1 | June 25, 2021 | ||||||||||||||||||||||||||||||||||
| Offer Letter between the Registrant and Kristy Friedrichs, dated as of February 1, 2017. | 10-Q | 001-36766 | 10.2 | August 4, 2021 | ||||||||||||||||||||||||||||||||||
| Offer Letter between the Registrant and Steve Hurn, dated as of April 20, 2020. | 10-Q | 001-36766 | 10.3 | August 4, 2021 | ||||||||||||||||||||||||||||||||||
| Addendum to Employment Contract between the Registrant and Steve Hurn, dated as of February 1, 2021. | 10-Q | 001-36766 | 10.4 | August 4, 2021 | ||||||||||||||||||||||||||||||||||
| Separation Agreement by and between New Relic, Inc. and Michael Christenson, dated as of June 24, 2021. | 10-Q | 001-36766 | 10.5 | August 4, 2021 | ||||||||||||||||||||||||||||||||||
| List of subsidiaries of Registrant. | S-1 | 333-200078 | 21.1 | November 10, 2014 | ||||||||||||||||||||||||||||||||||
| Consent of Deloitte & Touche LLP, independent registered public accounting firm. | X | |||||||||||||||||||||||||||||||||||||
| Power of Attorney (included on the signature page of this report). | X | |||||||||||||||||||||||||||||||||||||
| Certification of Principal Executive Officer Pursuant to Rules 13a-14(a) and 15d-14(a) under the Securities Exchange Act of 1934, as Adopted Pursuant to Section 302 of the Sarbanes-Oxley Act of 2002. | X | |||||||||||||||||||||||||||||||||||||
| Certification of Principal Financial Officer Pursuant to Rules 13a-14(a) and 15d-14(a) under the Securities Exchange Act of 1934, as Adopted Pursuant to Section 302 of the Sarbanes-Oxley Act of 2002. | X | |||||||||||||||||||||||||||||||||||||
32.1(1) | Certification of Principal Executive Officer and Principal Financial Officer Pursuant to 18 U.S.C. Section 1350, as Adopted Pursuant to Section 906 of the Sarbanes-Oxley Act of 2002. | X | ||||||||||||||||||||||||||||||||||||
| 101.INS | XBRL Instance Document | X | ||||||||||||||||||||||||||||||||||||
| 101.SCH | XBRL Taxonomy Extension Schema Document | X | ||||||||||||||||||||||||||||||||||||
| 101.CAL | XBRL Taxonomy Extension Calculation Linkbase Document | X | ||||||||||||||||||||||||||||||||||||
| 101.DEF | XBRL Taxonomy Extension Definition Linkbase Document | X | ||||||||||||||||||||||||||||||||||||
| 101.LAB | XBRL Taxonomy Extension Label Linkbase Document | X | ||||||||||||||||||||||||||||||||||||
| 101.PRE | XBRL Taxonomy Extension Presentation Linkbase Document | X | ||||||||||||||||||||||||||||||||||||
| 104 | Cover Page Interactive Data File - the cover page interactive data file does not appear in the Interactive Data File because its XBRL tags are embedded within the Inline XBRL document. | |||||||||||||||||||||||||||||||||||||
+ Indicates a management contract or compensatory plan or arrangement.
(1)The certifications attached as Exhibit 32.1 accompany this Annual Report on Form 10-K pursuant to 18 U.S.C. Section 1350, as adopted pursuant to Section 906 of the Sarbanes-Oxley Act of 2002, and shall not be deemed “filed”
92
by the Registrant for purposes of Section 18 of the Securities Exchange Act of 1934, as amended, or the Exchange Act, and are not to be incorporated by reference into any of the Registrant’s filings under the Securities Act, irrespective of any general incorporation language contained in any such filing.
Item 16. Form 10-K Summary
Not provided.
93
SIGNATURES
Pursuant to the requirements of Section 13 or 15(d) of the Securities Exchange Act of 1934, as amended, the registrant has duly caused this Annual Report on Form 10-K to be signed on its behalf by the undersigned, thereunto duly authorized.
| New Relic, Inc. | |||||||||||
| Date: | May 17, 2022 | By: | /s/ Mark Sachleben | ||||||||
| Mark Sachleben | |||||||||||
| Chief Financial Officer (Principal Financial and Accounting Officer and Duly Authorized Signatory) | |||||||||||
POWER OF ATTORNEY
Each person whose signature appears below constitutes and appoints William Staples and Mark Sachleben, and each of them, as his or her true and lawful attorney-in-fact and agent, with full power of substitution and resubstitution, for him or her and in his or her name, place and stead, in any and all capacities, to sign any and all amendments to this Annual Report on Form 10-K, and to file the same, with all exhibits thereto, and other documents in connection therewith, with the Securities and Exchange Commission, granting unto said attorneys-in-fact and agents, and each of them, full power and authority to do and perform each and every act and thing requisite and necessary to be done in connection therewith, as fully to all intents and purposes as he or she might or could do in person, hereby ratifying and confirming all that said attorneys-in-fact and agents, or any of them, or their or his substitutes, may lawfully do or cause to be done by virtue thereof.
Pursuant to the requirements of the Securities Exchange Act of 1934, as amended, this report has been signed below by the following persons on behalf of the registrant in the capacities and on the dates indicated.
94
Name | Title | Date | ||||||||||||
/s/ William Staples | Chief Executive Officer and Director | May 17, 2022 | ||||||||||||
| William Staples | (Principal Executive Officer) | |||||||||||||
/s/ Mark Sachleben | Chief Financial Officer | May 17, 2022 | ||||||||||||
Mark Sachleben | (Principal Financial and Accounting Officer) | |||||||||||||
/s/ Lewis Cirne | Executive Chairman of the Board | May 17, 2022 | ||||||||||||
| Lewis Cirne | ||||||||||||||
/s/ Hope Cochran | Vice Chair of the Board and Lead Independent Director | May 17, 2022 | ||||||||||||
Hope Cochran | ||||||||||||||
/s/ Caroline Watteeuw Carlisle | Director | May 17, 2022 | ||||||||||||
Caroline Watteeuw Carlisle | ||||||||||||||
/s/ Anne DelSanto | Director | May 17, 2022 | ||||||||||||
Anne DelSanto | ||||||||||||||
/s/ David Henshall | Director | May 17, 2022 | ||||||||||||
David Henshall | ||||||||||||||
/s/ Radhakrishnan Mahendran | Director | May 17, 2022 | ||||||||||||
Radhakrishnan Mahendran | ||||||||||||||
/s/ Adam Messinger | Director | May 17, 2022 | ||||||||||||
Adam Messinger | ||||||||||||||
/s/ Takeshi Numoto | Director | May 17, 2022 | ||||||||||||
Takeshi Numoto | ||||||||||||||
/s/ Dan Scholnick | Director | May 17, 2022 | ||||||||||||
Dan Scholnick | ||||||||||||||
/s/ James Tolonen | Director | May 17, 2022 | ||||||||||||
James Tolonen | ||||||||||||||
95
Serious News for Serious Traders! Try StreetInsider.com Premium Free!
You May Also Be Interested In
- Wolters Kluwer’s MediRegs triumphs in 2024 BIG Innovation Awards
- AlayaCare Partners with Corus Health to Enhance Family-Centered Care in New Mexico
- E.BOEHM ENTERS THE WORLD OF LUXURY BY CREATING RESPONSIBLE TEXTILE ART BASED ON NETTLE
Create E-mail Alert Related Categories
SEC FilingsSign up for StreetInsider Free!
Receive full access to all new and archived articles, unlimited portfolio tracking, e-mail alerts, custom newswires and RSS feeds - and more!
