

Form 10-K MONOLITHIC POWER SYSTEMS For: Dec 31
 Tweet
Tweet Share
Share
UNITED STATES
SECURITIES AND EXCHANGE COMMISSION
Washington, D.C. 20549
FORM
(Mark One)
| | ANNUAL REPORT PURSUANT TO SECTION 13 OR 15(d) OF THE SECURITIES EXCHANGE ACT OF 1934 |
For the fiscal year ended
or
| | TRANSITION REPORT PURSUANT TO SECTION 13 OR 15(d) OF THE SECURITIES EXCHANGE ACT OF 1934 |
Commission file number:
Monolithic Power Systems, Inc.
(Exact name of registrant as specified in its charter)
| | |
| (State or other jurisdiction of incorporation or organization) | (I.R.S. Employer Identification Number) |
(Address of principal executive offices)(Zip Code)
(
(Registrant’s telephone number, including area code)
Securities registered pursuant to Section 12(b) of the Act:
| Title of each class | Trading Symbol | Name of each exchange on which registered | ||
| | | The |
Securities registered pursuant to Section 12(g) of the Act: None
Indicate by check mark if the registrant is a well-known seasoned issuer, as defined in Rule 405 of the Securities Act.
Indicate by check mark if the registrant is not required to file reports pursuant to Section 13 or Section 15(d) of the Act. Yes ☐
Indicate by check mark whether the registrant (1) has filed all reports required to be filed by Section 13 or 15(d) of the Securities Exchange Act of 1934 during the preceding 12 months (or for such shorter period that the registrant was required to file such reports), and (2) has been subject to such filing requirements for the past 90 days.
Indicate by check mark whether the registrant has submitted electronically every Interactive Data File required to be submitted pursuant to Rule 405 of Regulation S-T (§ 232.405 of this chapter) during the preceding 12 months (or for such shorter period that the registrant was required to submit such files).
Indicate by check mark whether the registrant is a large accelerated filer, an accelerated filer, a non-accelerated filer, a smaller reporting company, or an emerging growth company. See the definitions of “large accelerated filer,” “accelerated filer,” “smaller reporting company,” and “emerging growth company” in Rule 12b-2 of the Exchange Act.
| | Accelerated filer ☐ |
| Non-accelerated filer ☐ | Smaller reporting company |
| Emerging growth company |
If an emerging growth company, indicate by check mark if the registrant has elected not to use the extended transition period for complying with any new or revised financial accounting standards provided pursuant to Section 13(a) of the Exchange Act. ☐
Indicate by check mark whether the registrant has filed a report on and attestation to its management’s assessment of the effectiveness of its internal control over financial reporting under Section 404(b) of the Sarbanes-Oxley Act (15 U.S.C. 7262(b)) by the registered public accounting firm that prepared or issued its audit report.
If securities are registered pursuant to Section 12(b) of the Act, indicate by check mark whether the financial statements of the registrant included in the filing reflect the correction of an error to previously issued financial statements. ☐
Indicate by check mark whether any of those error corrections are restatements that required a recovery analysis of incentive-based compensation received by any of the registrant's executive officers during the relevant recovery period pursuant to § 240.10D-1(b). ☐
Indicate by check mark whether the registrant is a shell company (as defined in Rule 12b-2 of the Act).
The aggregate market value of the voting and non-voting common equity held by non-affiliates of the registrant, based upon the closing price of the common stock on the Nasdaq Global Select Market on June 30, 2022, was $
There were
DOCUMENTS INCORPORATED BY REFERENCE
Portions of the registrant’s Proxy Statement for the 2023 Annual Meeting of Stockholders are incorporated by reference into Part III of this Annual Report on Form 10-K where indicated. The Proxy Statement will be filed with the Securities and Exchange Commission within 120 days of the registrant’s fiscal year ended December 31, 2022.
| * | Excludes 12,110,000 shares of the registrant’s common stock held by executive officers, directors and stockholders whose ownership exceeds 5% (“affiliates”) of the common stock outstanding at June 30, 2022. Exclusion of such shares should not be construed to indicate that any such person possesses the power, direct or indirect, to direct or cause the direction of the management or policies of the registrant or that such person is controlled by or under common control with the registrant. |
MONOLITHIC POWER SYSTEMS, INC.
FORM 10-K
FOR THE FISCAL YEAR ENDED DECEMBER 31, 2022
TABLE OF CONTENTS
| Page |
||
| Item 1. |
5 | |
| 9 | ||
| Item 1A. |
10 | |
| Item 1B. |
29 | |
| Item 2. |
29 | |
| Item 3. |
29 | |
| Item 4. |
29 | |
| Item 5. |
30 | |
| Item 6. |
31 | |
| Item 7. |
Management’s Discussion and Analysis of Financial Condition and Results of Operations |
31 |
| Item 7A. |
39 | |
| Item 8. |
40 | |
| Item 9. |
Changes in and Disagreements with Accountants on Accounting and Financial Disclosure |
75 |
| Item 9A. |
75 | |
| Item 9B. |
75 | |
| Item 9C |
Disclosure Regarding Foreign Jurisdictions that Prevent Inspections |
75 |
| Item 10. |
76 | |
| Item 11. |
76 | |
| Item 12. |
Security Ownership of Certain Beneficial Owners and Management and Related Stockholder Matters |
76 |
| Item 13. |
Certain Relationships and Related Transactions, and Director Independence |
76 |
| Item 14. |
76 | |
| Item 15. |
77 | |
| Item 16. |
79 | |
| 80 | ||
FORWARD-LOOKING STATEMENTS
This Annual Report on Form 10-K contains forward-looking statements within the meaning of Section 27A of the Securities Act of 1933, as amended, and Section 21E of the Securities Exchange Act of 1934, as amended, that have been made pursuant to and in reliance on the provisions of the Private Securities Litigation Reform Act of 1995. These statements include, among others, statements concerning:
| • |
the above-average industry growth of product and market areas that we have targeted; |
|
| • |
our plan to increase our revenue through the introduction of new products within our existing product families as well as in new product categories and families; |
|
| • |
our belief that we may incur significant legal expenses that vary with the level of activity in each of our current or future legal proceedings; |
|
| • |
the effect that liquidity of our investments has on our capital resources; |
|
| • |
the continuing application of our products in the storage and computing, enterprise data, automotive, industrial, communications and consumer markets; |
|
| • |
estimates of our future liquidity requirements; |
|
| • |
the cyclical nature of the semiconductor industry; |
|
| • |
the effects of macroeconomic factors, including the COVID-19 pandemic, the global economic downturn and the Russia-Ukraine conflict, on the semiconductor industry and our business; |
|
| • |
protection of our proprietary technology; |
|
| • |
business outlook for 2023 and beyond; |
|
| • |
the factors that we believe will impact our business, operations and financial condition, as well as our ability to achieve revenue growth; |
|
| • |
the percentage of our total revenue from various end markets; |
|
| • |
our ability to identify, acquire and integrate companies, businesses and products, and achieve the anticipated benefits from such acquisitions and integrations; |
|
| • |
the impact of various tax laws and regulations on our income tax provision, financial position and cash flows; |
|
| • |
our plan to repatriate cash from our subsidiary in Bermuda; |
|
| • |
our intention and ability to pay cash dividends and dividend equivalents; and |
|
| • |
the factors that differentiate us from our competitors. |
In some cases, words such as “would,” “could,” “may,” “should,” “predict,” “potential,” “targets,” “continue,” “anticipate,” “expect,” “intend,” “plan,” “believe,” “seek,” “estimate,” “project,” “forecast,” “will,” the negative of these terms or other variations of such terms and similar expressions relating to the future identify forward-looking statements. All forward-looking statements are based on our current outlook, expectations, estimates, projections, beliefs and plans or objectives about our business, our industry and the global economy, including our expectations regarding the potential impacts of macroeconomic factors, such as the COVID-19 pandemic, the global economic downturn and the Russia-Ukraine conflict on the semiconductor industry and our business. These statements are not guarantees of future performance and are subject to significant risks and uncertainties. Actual events or results could differ materially and adversely from those expressed in any such forward-looking statements. Risks and uncertainties that could cause actual results to differ materially include those set forth throughout this Annual Report on Form 10-K including, in particular, in the section entitled “Item 1A. Risk Factors.” Except as required by law, we disclaim any duty, and undertake no obligation, to update any forward-looking statements, whether as a result of new information relating to existing conditions, future events or otherwise or to release publicly the results of any future revisions we may make to forward-looking statements to reflect events or circumstances after the date hereof or to reflect the occurrence of unanticipated events. Readers are cautioned not to place undue reliance on such statements, which speak only as of the date of this Annual Report on Form 10-K. Readers should carefully review future reports and documents that we file from time to time with the Securities and Exchange Commission (the “SEC”), such as our Annual Reports on Form 10-K, Quarterly Reports on Form 10-Q and any Current Reports on Form 8-K.
Except as the context otherwise requires, the terms “Monolithic Power Systems,” “MPS,” “Registrant,” “Company,” “we,” “us,” or “our” as used herein are references to Monolithic Power Systems, Inc. and its consolidated subsidiaries.
| Business |
General
Monolithic Power Systems, Inc. (“MPS”) is a fabless company with a global footprint that provides high-performance, semiconductor-based power electronic solutions. Incorporated in 1997, our three core strengths include deep system-level knowledge, strong semiconductor expertise, and innovative proprietary technologies in the areas of semiconductor processes, system integration, and packaging. These combined advantages enable us to deliver reliable, compact, and monolithic solutions found in storage and computing, enterprise data, automotive, industrial, communications and consumer applications. Our mission is to reduce energy and material consumption to improve all aspects of quality of life. We believe that we differentiate ourselves by offering solutions that are more highly integrated, smaller in size, more energy-efficient, more accurate with respect to performance specifications and, consequently, more cost-effective than many competing solutions. We plan to continue to introduce new products within our existing product families, as well as in new innovative product categories.
Our principal executive office is located in Kirkland, Washington. We have over 3,200 employees worldwide, with locations in Asia (primarily in China, India, Japan, South Korea, Singapore and Taiwan), Europe (primarily in France, Germany, Hungary, Italy, Spain, Switzerland and the United Kingdom) and the United States.
Industry Overview
Semiconductors comprise the basic building blocks of electronic systems and equipment. Within the semiconductor industry, components can be classified either as discrete devices, such as individual transistors or integrated circuits (“ICs”), in which a number of transistors and other elements are combined to form a more complicated electronic circuit. ICs can be further divided into three primary categories: digital, analog, and mixed-signal. Digital ICs, such as memory devices and microprocessors, can store or perform arithmetic functions on data that is represented by a series of ones and zeroes. Analog ICs, in contrast, handle real world signals such as temperature, pressure, light, sound, or speed. In addition, analog ICs also perform power management functions, such as regulating or converting voltages, for electronic devices. Mixed-signal ICs combine digital and analog functions onto a single chip and play an important role in bridging real world to digital systems.
Analog and Mixed-Signal Markets. We focus on the market for high performance analog and mixed-signal ICs. High performance products generally are differentiated by functionality and performance factors, which include integration of higher levels of functionality onto a single chip, greater precision, better power efficiency and density, higher speed and lower heat and noise. There are several key factors that distinguish the analog and mixed-signal IC markets from digital IC markets. These factors include longer product life cycles, numerous market segments, technology that is difficult to replicate, relative complexity of design and process technologies, importance of experienced design engineers, lower capital requirements and diversity of end markets. We have targeted product and market areas that we believe have the ability to offer above-average growth over the long term compared to the semiconductor industry as a whole.
End Markets and Applications
We design and develop our products for the storage and computing, enterprise data, automotive, industrial, communications and consumer markets, with the storage and computing market representing the largest portion of our revenue in 2022. The following table is a summary of the various end market applications for our products, and those markets’ contribution as a percentage of our total revenue:
| Percentage of Total Revenue |
||||||||||||||
| End Markets |
Applications |
2022 |
2021 |
2020 |
||||||||||
| Storage and computing |
Storage applications, enterprise notebooks, computers and printers |
25.3 | % | 21.2 | % | 21.4 | % | |||||||
| Enterprise Data |
Data center and workstation computing |
14.0 | % | 9.6 | % | 8.6 | % | |||||||
| Automotive |
Infotainment, digital cockpits and connectivity applications |
16.7 | % | 16.9 | % | 12.9 | % | |||||||
| Industrial |
Power sources, smart meters, security applications and industrial automation |
12.2 | % | 15.3 | % | 14.2 | % | |||||||
| Communications |
5G and satellite communications infrastructure applications |
14.0 | % | 13.6 | % | 16.8 | % | |||||||
| Consumer |
Home appliances, gaming consoles, smart TVs, mobile devices, lighting, monitors, stereos, set-top boxes and chargers |
17.8 | % | 23.4 | % | 26.1 | % | |||||||
Product Families
Our proprietary process technologies enable us to design and deliver smaller, single-chip power management ICs. These technologies simplify the design process and are applicable across a wide range of analog applications within the storage and computing, enterprise data, automotive, industrial, communications and consumer markets. Our product families are differentiated with respect to their high degree of integration and strong levels of accuracy, power efficiency, quality and longevity, making them cost-effective and more sustainable relative to many competing solutions. Our key product families include the following:
Direct Current (“DC”) to DC Products. DC to DC ICs are used to convert and control voltages within a broad range of electronic systems, such as portable electronic devices, wireless LAN access points, computers and notebooks, monitors, infotainment applications and medical equipment. We believe that our DC to DC products are differentiated in the market, particularly with respect to their high degree of integration, high voltage operation, high load current, high switching speed, small footprint, and high energy efficiency. These features are important to our customers as they result in fewer components that need to be produced and consumed, a smaller form factor, more accurate regulation of voltages, lower power consumption and, ultimately, lower system cost, increased reliability and lower carbon emissions through the elimination of many discrete components and power devices. The DC to DC product family accounted for 95% of our total revenue in each of 2022, 2021 and 2020.
Lighting Control Products. Lighting control ICs are used in backlighting and general illumination products. Lighting control ICs for backlighting are used in systems that provide the light source for LCD panels typically found in computers and notebooks, monitors, car navigation systems and televisions. Backlighting solutions are typically either white light emitting diode lighting sources or cold cathode fluorescent lamps. The Lighting Control product family accounted for 5% of our total revenue in each of 2022, 2021 and 2020.
In the future, we plan to continue to introduce new products within our existing product families, as well as in new innovative product categories. Our ability to achieve revenue growth will depend in part upon our ability to continue to innovate while fulfilling our customers’ evolving needs, enter new market segments, gain market share, grow in regions outside of China, Taiwan and other Asian markets, expand our customer base and continue to secure manufacturing capacity.
Customers, Sales and Marketing
We sell our products through third-party distributors, value-added resellers and directly to original equipment manufacturers (“OEMs”), original design manufacturers (“ODMs”), electronic manufacturing service (“EMS”) providers and other end customers. Our third-party distributors are subject to distribution agreements with us, which allow the distributors to sell our products to end customers and other resellers, including OEMs, ODMs or EMS providers. Our value-added resellers may second source our products and provide other services to customers. ODMs typically design and manufacture electronic products on behalf of OEMs, and EMS providers typically provide manufacturing services for OEMs and other electronic product suppliers.
Sales to our largest distributor accounted for 24% of our total revenue in 2022, 26% in 2021, and 24% in 2020. In addition to our largest distributor, one distributor accounted for 19% of our total revenue in 2022, two distributors accounted for 15% and 10% of our total revenue in 2021, and one distributor accounted for 11% of our total revenue in 2020. No other distributors or end customers accounted for more than 10% of our full-year, total revenue in any of the periods presented.
Current distribution agreements with several of our major distributors provide that each distributor has the non-exclusive right to sell and use its best efforts to promote and develop a market for our products. These agreements provide that payment for purchases from us will generally occur within 30 to 90 days from the date of invoice. In addition, we allow for limited stock rotation in certain agreements.
We have sales offices in China, India, Japan, South Korea, Singapore, Taiwan, the United States and throughout Europe. Our products typically require a highly technical sales and applications engineering effort where we assist our customers in the design and use of our products in their application. We maintain a staff of applications engineers who work directly with our customers’ engineers in the development of their systems’ electronics containing our products.
Because our sales are primarily billed and payable in United States dollars, our sales are generally not subject to fluctuating currency exchange rates. However, because a majority of our revenue is attributable to sales to customers in Asia, changes in the relative value of the dollar may create pricing pressures for our products. In 2022, 2021 and 2020, our revenue from sales to customers in Asia was 86%, 90% and 91%, respectively.
Our sales are made primarily pursuant to standard individual purchase orders. Our backlog consists of orders that we have received from customers which have not yet shipped. Because orders in backlog are subject to cancellation or postponement, and backlog at any particular date is not necessarily representative of actual sales for any succeeding period, we believe that our backlog is not necessarily a reliable indicator of future revenue.
Typical supply chain lead times for orders are generally 16 to 26 weeks. We often build inventory in advance based on our forecast of future customer orders. This subjects us to certain risks, most notably the possibility that sales will not meet our forecast, which could lead to inventories in excess of demand. If excess inventory exists, it may be necessary for us to sell it at a substantial discount, take a significant write-down or dispose of it altogether, all of which would negatively affect our profit margins. In addition, in response to market conditions, we may slow the rate of manufacturing our products, which could result in insufficient inventory levels if we underestimate the demand for our products.
Research and Development
We have assembled a qualified team of engineers primarily in China, Taiwan, the United States, Spain, Switzerland, Germany, and Hungary, with core competencies in analog and mixed-signal design. Through our research and development efforts, we have developed a collection of intellectual property and know-how that we are able to leverage across our products and markets. These include the development of high efficiency power devices, the design of precision analog circuits and systems, expertise in mixed-signal design, and integration and the development of proprietary semiconductor process technologies.
Our research and development efforts are generally targeted at three areas: systems architecture, circuit design and implementation, and process technologies. In the area of systems architecture, we are exploring new ways of solving our customers’ system design challenges and are investing in the development of systems expertise in new markets and applications that align well with our core capabilities. In the area of circuit design and implementation, our initiatives include expanding our portfolio of products and adding new features to our products. In the area of process technologies, we are investing in research and development resources to provide leading-edge analog power processes for our next generation of integrated circuits. We believe process technologies are key strategic components to our future growth.
Our growth is fueled by our customers’ need for our power efficient solutions. Consequently, we focus on continually improving the energy efficiency of our products in our research and development efforts in all three targeted areas. Our products are principally positioned as achieving lower power loss and enabling significant reductions in circuit board space and shrinking or eliminating many passive components that are otherwise needed by competitors’ offerings. In addition, the life cycles of our products are typically over 10 years, reducing the manufacturing needs and associated carbon emissions associated with production of replacement products.
Patents and Intellectual Property Matters
We rely on our proprietary technologies, which include both our proprietary circuit designs for our products and our proprietary manufacturing process technologies. Our future success and competitive position depend in part upon our ability to obtain and maintain protection of our proprietary technologies.
In general, we have elected to pursue patent protection for aspects of our circuit and device designs that we believe are patentable and to protect our manufacturing process technologies by maintaining those process technologies as trade secrets. As of December 31, 2022, we had 1,557 patents/applications issued or pending, of which 546 patents have been issued in the United States. Our issued patents are scheduled to expire at various times through December 2042. Our patents are material to our business, but we do not rely on any one particular patent for our success. We also rely on a combination of nondisclosure agreements and other contractual provisions, as well as our employees’ commitment to confidentiality and loyalty, to protect our technology, know-how and processes. We also seek to register certain of our trademarks as we deem appropriate. We have not registered any of our copyrights and do not believe registration of copyrights is material to our business. Despite precautions that we take, it may be possible for unauthorized third parties to copy aspects of our current or future technology or products or to obtain and use information that we regard as proprietary. There can be no assurance that the steps we take are adequate to protect our proprietary rights, that our patent applications will lead to issued patents, that others will not develop or patent similar or superior products or technologies, or that our patents will not be challenged, invalidated or circumvented by others. Furthermore, the laws of the countries in which our products are or may be developed, manufactured or sold may not protect our products and intellectual property rights to the same extent as laws in the United States. Our failure to adequately protect our proprietary technologies could materially harm our business.
The semiconductor industry is characterized by frequent claims of infringement and litigation regarding patent and other intellectual property rights. Patent infringement is an ongoing risk, in part because other companies in our industry could have patent rights that may not be identifiable when we initiate development efforts. Litigation may be necessary to enforce our intellectual property rights, and we may have to defend ourselves against infringement claims. Such litigation can be very costly and may divert our management resources. Further, we have agreed to indemnify certain of our customers and suppliers in some circumstances against liability from infringement by our products. In the event any third party were to make an infringement claim against us or our customers, we could be enjoined from selling selected products, could be required to indemnify our customers or suppliers, or could pay royalties or other damages to third parties. If any of our products are found to infringe and we are unable to obtain necessary licenses or other rights on acceptable terms, we would either have to change our product so that it does not infringe or stop making the infringing product, which could have a material adverse effect on our operating results, financial condition and cash flows.
Manufacturing
We utilize a fabless business model, working with third parties to manufacture and assemble our ICs. This fabless approach allows us to focus our engineering and design resources on our strengths and to reduce our fixed costs and capital expenditures. In contrast to many fabless semiconductor companies, which utilize standard process technologies and design rules established by their foundry partners, we have developed our own proprietary process technologies and collaborate with our foundry partners to install our technologies on their equipment in their facilities for use on our behalf. This close collaboration and control over the manufacturing process has historically resulted in favorable yields and product performance for our ICs.
We currently contract with several suppliers to manufacture our wafers in foundries located in China, Taiwan and South Korea. Once our silicon wafers have been produced, they are shipped to our facilities in Chengdu, China for wafer sort, which is a testing process performed to identify non-functioning dies. Our semiconductor products are then assembled and packaged by independent subcontractors in China and Malaysia. The assembled ICs are then sent either for final testing at our Chengdu facilities, or to other turnkey providers who perform final testing based on our standards prior to shipping to our customers.
Our manufacturing facilities in Chengdu, China, enable us to benefit from shorter manufacturing cycle times and lower labor and overhead costs. We have expanded our product testing capabilities in these facilities and are able to take advantage of the rich pool of local engineering talent to expand our manufacturing support and engineering operations.
Competition
The analog and mixed-signal semiconductor industry is highly competitive, and we expect competitive pressures to continue. Our ability to compete effectively and to expand our business will depend on our ability to continue to recruit both applications engineering and design engineering personnel, our ability to introduce new products, and our ability to maintain the rate at which we introduce these new products, and our ability to meet our and customers’ energy efficiency goals. Our industry is characterized by decreasing average selling prices over the life of a product. We compete with domestic and international semiconductor companies, many of which have substantially greater financial and other resources with which to pursue engineering, manufacturing, marketing, and distribution of their products and, in some cases, have a broader number of product offerings that may enable them to more effectively market and sell to customers and engage sales partners. We are in direct and active competition, with respect to one or more of our product lines, with several manufacturers of such products, of varying size and financial strength. We consider our primary competitors to include Analog Devices, Infineon Technologies, NXP Semiconductors, ON Semiconductor, Power Integrations, Renesas Electronics, ROHM Semiconductor, Semtech and Texas Instruments.
We expect continued competition from existing competitors as well as competition from new entrants into the semiconductor market. We believe that we are competitive in the markets in which we sell and on the basis of key competitive factors in our industry, particularly because our ICs typically are smaller in size, are highly integrated with lower energy consumption, possess higher levels of power management functionalities and achieve high performance specifications at lower price points than most of our competitors. However, there is no assurance that our products will continue to compete favorably or that we will be successful in the face of increasing competition from new products and enhancements introduced by existing competitors or new companies entering this market. In addition, there has recently been a high level of consolidation in the semiconductor industry. If these or future acquisitions are successful, competition may intensify and our competitors may have additional resources to compete against us.
We operate in the cyclical semiconductor industry. While we are not immune from industry downturns, we have targeted product and market areas that we believe have the ability to offer above average industry performance over the long term.
Historically, our revenue has generally been higher in the second half of the year than in the first half although various factors, such as market conditions and the timing of key product introductions, could impact this trend.
Government Regulations
We are subject to international, federal and local legislation, regulations, and other requirements relating to the discharge of substances into the environment; the treatment, transport, and disposal of hazardous wastes; recycling and product packaging; worker health and safety; and other activities affecting the environment, our workforce, and the management of our manufacturing operations. We believe that our operations and facilities comply in all material respects with applicable environmental laws and worker health and safety laws.
We are also subject to import/export controls, tariffs, and other trade-related regulations and restrictions in the countries in which we have operations or otherwise do business. In recent years, these controls, tariffs, regulations, and restrictions have had, and we believe may continue to have, a material impact on our business, including our ability to sell products and to manufacture or source components.
Government regulations can be complex and are subject to change in the future, and accordingly, we are unable to assess the possible effect of compliance with future requirements. Our efforts to comply with these government regulations could have material impacts on our capital expenditures and operating expenses, revenue, resource allocation, competitive position, or financial condition, though the magnitude and duration of such impacts are uncertain and difficult to quantify. Refer to “Item 1A. Risk Factors” for further discussion of material risks related to government policies and regulations on environmental laws, international trade policies and restrictions, including tariffs on imports of foreign goods and regulations restricting the export of goods and services between the U.S. and China.
Human Capital
Our performance is substantially dependent on the performance of our executive officers and key employees. Due to the relative complexity of the design of our analog and mixed-signal ICs, our engineers generally have many years of experience and greater circuit design aptitude. Analog engineers with advanced skills are limited in number and difficult to replace. The loss of the services of key officers, managers, engineers and other technical personnel would materially harm our business. Our future success depends, in part, on our ability to attract, train, retain, and motivate highly qualified technical and managerial personnel. We may not be successful in attracting and retaining such personnel. Our employees are not represented by a collective bargaining organization, and we have never experienced a work stoppage or strike. As of December 31, 2022, we employed 3,247 employees primarily in Asia, Europe, South America and the United States, compared with 2,773 employees as of December 31, 2021.
Competition for talent in the semiconductor industry is strong, and compensation is critical to our recruiting and retention philosophy, especially given our rapid growth and our need to attract talented employees with a broad range of skills. Our total compensation packages are competitive, fair, and structured to encourage employees to invest in our future. Our employee benefits programs include a combination of supplemental benefits including paid time off for holidays and vacations, health insurance and other plan benefits.
We are an equal-opportunity employer, and we make employment decisions based on merit and business needs. We are committed to providing a healthy and safe environment for all our workers. Our Worker Health and Safety Plan is certified to ISO 45001 standards, the world’s voluntary, international standard for occupational health and safety. We believe that certifying to these standards enables our company to provide safe and healthy workplaces by preventing work-related injury and health issues.
Available Information
Our Annual Reports on Form 10-K, Quarterly Reports on Form 10-Q, current reports on Form 8-K, and amendments to those reports that are filed or furnished pursuant to Sections 13(a) or 15(d) of the Securities Exchange Act of 1934, as amended, are available free of charge. They may be obtained from our website at www.monolithicpower.com under “Investor Relations” as soon as reasonably practicable after we electronically file such documents with, or furnish them to, the SEC, or at the SEC website at www.sec.gov. We also make available on our website the charters for our audit committee, compensation committee, and nominating and corporate governance committee, our code of ethics, our director voting policy and our code of social responsibility. In addition, we intend to disclose on our website any amendments to, or waivers from, our codes of business conduct, our code of social responsibility and our report on environment, social responsibility and governance. Information contained on our website is not a part of this Annual Report on Form 10-K.
Information About Executive Officers
Information regarding our executive officers as of February 24, 2023 is as follows:
| Name |
Age |
Position |
||
| Michael Hsing |
63 |
President, Chief Executive Officer and Director |
||
| Bernie Blegen |
65 |
Vice President and Chief Financial Officer |
||
| Deming Xiao |
60 |
President of Asia Operations |
||
| Maurice Sciammas |
63 |
Senior Vice President of Worldwide Sales and Marketing |
||
| Saria Tseng |
52 |
Vice President, Strategic Corporate Development, General Counsel and Corporate Secretary |
Michael Hsing has served on our Board of Directors and has served as our President and Chief Executive Officer since founding MPS in August 1997. Prior to founding MPS, Mr. Hsing was a Senior Silicon Technology Developer at several analog IC companies, where he developed and patented key technologies, which set new standards in the power electronics industry. Mr. Hsing is an inventor on numerous patents related to the process development of bipolar mixed-signal semiconductor manufacturing. Mr. Hsing holds a B.S.E.E. from the University of Florida.
Bernie Blegen has served as our Chief Financial Officer since July 2016 and is responsible for finance, accounting, tax, treasury and investor relations. From August 2011 to June 2016, Mr. Blegen served as our Corporate Controller. Prior to joining MPS, Mr. Blegen held a number of executive finance and accounting positions for other publicly traded technology companies, including Xilinx, Inc. and Credence Systems. Mr. Blegen holds a B.A. from the University of California, Santa Barbara.
Deming Xiao has served as our President of Asia Operations since January 2008. Since joining us in May 2001, Mr. Xiao has held several executive positions, including Foundry Manager and Senior Vice President of Operations. Before joining MPS, from June 2000 to May 2001, Mr. Xiao was Engineering Account Manager at Chartered Semiconductor Manufacturing, Inc. Prior to that, Mr. Xiao spent six years as the Manager of Process Integration Engineering at Fairchild Imaging Sensors. Mr. Xiao holds a B.S. in Semiconductor Physics from Sichuan University, Chengdu, China and an M.S.E.E. from Wayne State University.
Maurice Sciammas has served as our Senior Vice President of Worldwide Sales and Marketing since 2007. Mr. Sciammas joined MPS in July 1999 and served as Vice President of Products and Vice President of Sales (excluding greater China) until he was appointed to his current position. Before joining MPS, he was Director of IC Products at Supertex from 1990 to 1999. He has also held positions at Micrel, Inc. He holds a B.S.E.E. degree from San Jose State University.
Saria Tseng has served as our Vice President, General Counsel and Corporate Secretary since 2004 and additionally as our Vice President, Strategic Corporate Development since 2009. Ms. Tseng joined the Company from MaXXan Systems, Inc., where she was Vice President and General Counsel from 2001 to 2004. Previously, Ms. Tseng was an attorney at Gray Cary Ware & Freidenrich, LLP and Jones, Day, Reavis & Pogue. Ms. Tseng is a member of the state bar in both California and New York and is a member of the bar association of the Republic of China (Taiwan). Ms. Tseng holds Master of Laws degrees from the University of California at Berkeley and the Chinese Culture University in Taipei.
| Risk Factors |
Our business involves numerous risks and uncertainties. You should carefully consider the risks described below, together with all of the other information in this Annual Report on Form 10-K and other filings with the SEC in evaluating our business. If any of the following risks actually occur, our business, financial condition, operating results, and growth prospects would likely be materially and adversely affected. In such an event, the trading price of our common stock could decline, and you could lose all or part of your investment in our common stock. Our past financial performance should not be considered to be a reliable indicator of future performance, and investors should not use historical trends to anticipate results or trends in future periods. These risks involve forward-looking statements and our actual results may differ substantially from those discussed in these forward-looking statements.
Risk Factors Summary
The following summary description sets forth an overview of the material risks we are exposed to in the normal course of our business activities. The summary does not purport to be complete and is qualified in its entirety by reference to the full risk factor discussion immediately following this summary description. We encourage you to read the full risk factor discussion carefully.
Our revenue and expenses are difficult to predict, have varied significantly in the past and could fluctuate significantly in the future due to numerous risks and uncertainties, many of which are beyond our control. As a result, we may not be profitable on a quarterly or annual basis. Our business, results of operations and financial condition, as well as your investment in our common stock, could be materially and adversely affected by any of the following material risks:
| • |
our dependence on the markets in Asia for our customer base, which may expose us to political, cultural, regulatory, economic, foreign currency and operational risks; |
| • |
changes in general economic conditions in the countries where our products are sold or used, particularly those in China; |
| • |
the impact of extensive Chinese government regulations, reduction or elimination of incentives, and uncertainties with respect to China’s legal system, on us and our manufacturing partners and suppliers; |
| • |
changes in international trade policy, such as tariffs on imports of foreign goods and regulations restricting the export of goods and services, between the U.S. and China; |
| • |
political and other risks in Taiwan and Hong Kong due to their tense relationships with China; |
| • |
adverse movements in foreign exchange rates, including the Renminbi; |
| • |
our ability to experience growth rates comparable to past years; |
| • |
changes in general demand for electronic products in the end markets that we serve; |
| • |
our ability to accurately forecast sales and expenses due to the nature of our business as a component supplier; |
| • |
our ability to timely develop and introduce new products, and the acceptance of our new products in the marketplace; |
| • |
our dependency on a limited number of customers, including distributors and value-added resellers, for a significant portion of our revenue; |
| • |
potential product liability risks due to defects or failures to meet specifications; |
| • |
lengthy sales cycles for our products balanced against the fixed nature of a substantial portion of our expenses; |
| • |
availability of adequate manufacturing capacity from our suppliers, and our ability to increase product sales and revenue in spite of capacity issues; |
| • |
increases in unanticipated costs as a result of increasing manufacturing capacity; |
| • |
our dependency on third-party suppliers for wafer purchases and potential increases in prices for wafers due to general capacity shortages; |
| • |
our ability to deliver products on a timely basis despite disruptions in our relationships with assembly and test subcontractors; |
| • |
our ability to manage our inventory levels, including the levels of inventory held by our distributors; |
| • |
increases in manufacturing costs due to commodity price increases; |
| • |
the highly cyclical nature of the semiconductor industry, and increased competition due to industry consolidation; |
| • |
competition from companies with greater financial and technological resources and customers developing products internally; |
| • |
the impact of system upgrades, cyberattacks or other system security, data protection and privacy breaches on our business operations; |
| • |
the impact of various U.S. and international laws and regulations regarding data protection on our business operations; |
| • |
our significant investment of resources in research and development, that may not result in increased future sales; |
| • |
our ability to realize the anticipated benefits of any business acquisitions and other strategic investments; |
| • |
risks associated with financial reporting, including the impact of new tax laws on our tax provision and tax planning; |
| • |
our failure to comply with various governmental laws and regulations, including those related to environmental, social and governance (“ESG”) initiatives; |
| • |
our ability to successfully defend ourselves in legal proceedings and protect our intellectual property, and the significant increase in legal expenses as a result of such proceedings; |
| • |
the loss of key personnel; |
| • |
risks associated with owning our stock, including volatility in our trading price due to our business and financial performance, analyst downgrades, failure to meet our own or analyst expectations, changes to our dividend program, and dilution from issuance of additional shares; |
| • |
the effect of epidemics and pandemics, such as the COVID-19 pandemic, on our business; and |
| • |
climate crises and other natural disasters, health risks, and economic and geopolitical uncertainties, including the Russia-Ukraine conflict. |
Risks Associated with Our Significant Operations in Asia, Particularly in China
We derive most of our revenue from direct or indirect sales to customers in Asia and have significant operations in Asia, which may expose us to political, cultural, regulatory, economic, foreign exchange, and operational risks.
We derive most of our revenue from customers located in Asia through direct sales or indirect sales through distribution arrangements and value-added reseller agreements with parties located in Asia. As a result, we are subject to significant risks due to this geographic concentration of business and operations. For the year ended December 31, 2022, 86% of our revenue was from customers in Asia. There are risks inherent in doing business in Asia, and internationally in general, including:
| • |
changes in, or impositions of, legislative or regulatory requirements or restrictions, including tax and trade laws in the U.S. and in the countries in which we manufacture or sell our products, and government action to restrict our ability to sell to foreign customers where sales of products may require export licenses; |
| • |
trade restrictions imposed by the U.S. related to goods imported from regions in China with records of forced labor and other human rights issues; |
| • |
currency exchange rate fluctuations impacting intercompany transactions; |
| • |
the fluctuations in the value of the U.S. Dollar relative to other foreign currencies, which could affect the competitiveness of our products; |
| • |
transportation delays and other supply chain issues; |
| • |
changes in tax regulations in China that may impact our tax status in Chengdu, Hangzhou and other regions where we have significant operations; |
| • |
tariffs imposed by China and the U.S. that may impact our sales; |
| • |
multi-tiered distribution channels that may diminish visibility to end customer pricing and purchase patterns; |
| • |
international political relationships and acts or threats of war; |
| • |
terrorism and threats of terrorism; |
| • |
epidemics and illnesses, such as the COVID-19 pandemic; |
| • |
adverse weather conditions or other natural disasters such as extreme heatwaves, affecting energy supply in our facilities in China and causing work stoppages; |
| • |
work stoppages related to employee dissatisfaction; |
| • |
economic, social and political instability; |
| • |
longer accounts receivable collection cycles and difficulties in collecting accounts receivables; |
| • |
enforcing contracts generally; and |
| • |
less effective protection of intellectual property and contractual arrangements. |
If we fail to expand our customer base and significantly reduce the geographic concentration of our customers, we will continue to be subject to the foregoing risks, which could materially and adversely affect our business, financial condition and results of operations.
Our business has been and may be significantly impacted by worldwide economic conditions, in particular changing economic conditions in China.
Our operations and performance depend significantly on global economic conditions. Adverse macroeconomic conditions, including inflation, slower growth, recession, stagflation, new or increased tariffs and other barriers to trade, tighter credit, higher interest rates, higher unemployment and currency fluctuations can materially adversely affect logistics or demand for our products. For example, in recent months, some of our customers have cancelled, decreased or delayed their existing and future orders with us. Volatility in the credit markets could severely diminish liquidity and capital availability.
Demand for our products is a function of the health of the economies in the United States, Europe, China and the rest of Asia. We cannot predict the timing, strength or duration of any economic disruptions, such as those resulting from the COVID-19 pandemic, the global economic downturn or the Russia-Ukraine conflict, or subsequent economic recovery worldwide, in our industry, or in the different markets that we serve. We also may not accurately assess the impact of changing market and economic conditions on our business and operations. These and other economic factors could have a material adverse effect on demand for our products and on our financial condition and operating results.
In particular, since we have significant operations in China, our business development plans, results of operations and financial condition may be materially and adversely affected by significant political, social and economic developments in China. A slowdown in economic growth in China could adversely impact our customers, prospective customers, suppliers, distributors and partners in China, which could have a material adverse effect on our results of the operations and financial condition. There is no guarantee that economic downturns, whether actual or perceived, any further decrease in economic growth rates or an otherwise uncertain economic outlook in China will not occur or persist in the future, that they will not be protracted, or that governments will respond adequately to control and reverse such conditions, any of which could materially and adversely affect our business, financial condition and results of operations.
China has continued to experience COVID-19 outbreaks, specifically in Shanghai and Chengdu where we have business operations and where many of our customers and suppliers are located. In response to the outbreaks, local governments have implemented, and may continue to implement, strict measures including quarantines, shutdowns and other business restrictions, which have resulted in logistics challenges throughout China. These strict measures, and the disruptions as a result thereof, did not have a material adverse impact on our operations for the year ended December 31, 2022. However, the impact of any new outbreaks on our business and financial results for 2023 will depend on future developments, which are highly uncertain and cannot be predicted. If governmental restrictions are re-imposed or additional measures are imposed to contain the spread of the virus, we could experience significant disruptions in our operations and reduced capacity available to us at some of our suppliers, all of which could limit our ability to meet customer demand and could have a material adverse effect on our financial condition and results of operations. We will continue to monitor the situation, assess further possible implications to our business, supply chain and customers, and take actions to mitigate adverse consequences to the extent feasible.
There are inherent risks associated with the operation of our manufacturing and testing facilities in China, which could increase product costs or cause a delay in product shipments.
We have manufacturing and testing facilities in China. We face the following risks, among others, with respect to our operations in China:
| • |
challenges to hire and maintain a qualified workforce; |
| • |
natural disasters such as severe heatwaves or droughts, which could result in prolonged power shortages or water restrictions in our facilities; |
| • |
Shutdowns or reduced operations due to COVID-19 outbreaks or government restrictions; |
| • |
challenges to maintain appropriate and acceptable manufacturing controls; and |
| • |
higher than anticipated overhead and other costs of operation. |
If we are unable to maintain our facilities in China at fully operational status with qualified workers, appropriate manufacturing controls and reasonable cost levels, we may incur higher costs than our current expense levels, which would affect our gross margins. In addition, if capacity restraints result in significant delays in product shipments, our business and results of operations would be adversely affected.
We and our manufacturing partners and suppliers are or will be subject to extensive Chinese government regulations, and the benefit of various incentives from Chinese governments that we and our manufacturing partners and suppliers receive may be reduced or eliminated, which could increase our costs or limit our ability to sell products and conduct activities in China.
We have manufacturing and testing facilities in China and most of our manufacturing partners and suppliers are located in China. The Chinese government has broad discretion and authority to regulate the technology industry in China. Additionally, the Chinese government has implemented policies from time to time to regulate economic expansion in China. It exercises significant control over China’s economic growth through the allocation of resources, controlling payment of foreign currency-denominated obligations, setting monetary policy and providing preferential treatment to particular industries or companies.
Any additional new regulations or the amendment of previously implemented regulations could require us and our manufacturing partners and suppliers to change our business plans, increase our costs, or limit our ability to sell products and conduct activities in China, which could adversely affect our business and operating results.
The Chinese government and provincial and local governments also have provided, and continue to provide, various incentives to encourage the development of the semiconductor industry in China. Such incentives include cash awards, tax rebates, reduced tax rates, favorable lending policies and other measures, some or all of which may be available to our manufacturing partners, suppliers and us with respect to our facilities in China. Any of these incentives could be reduced or eliminated by governmental authorities at any time, which could adversely affect our business and operating results.
Uncertainties with respect to China’s legal system, including uncertainties regarding the enforcement of laws, and sudden or unexpected changes in policies, laws and regulations in China could adversely affect our operations.
China’s legal system is a civil law system based on written statutes. Unlike the common law system, prior court decisions under the civil law system may be cited for reference but have limited precedential value. Since China’s legal system continues to rapidly evolve, the interpretations and enforcement of these laws and regulations are not always uniform and involve uncertainties. In addition, any new or amended laws and regulations related to, among other things, foreign investment and manufacturing could have a material adverse effect on our business and our ability to operate our business in China.
From time to time, we may have to resort to administrative and court proceedings to enforce our legal rights. Any administrative and court proceedings in China may be protracted, resulting in substantial costs and diversion of resources and management attention. Since China’s administrative and court authorities have significant discretion in interpreting and implementing statutory provisions and contractual terms, it may be more difficult to evaluate the outcome of administrative and court proceedings and the level of legal protection than those that may be provided in other jurisdictions. These uncertainties may impede our ability to enforce contracts in China and could materially and adversely affect our business and results of operations.
Furthermore, China’s legal system is based in part on government policies and internal rules, some of which are not published on a timely basis, or at all, and may have retroactive effect. As a result, we may not be aware of our violation of any of these policies and rules until sometime after the violation may have occurred. Such unpredictability towards our contractual, property and procedural rights and any failure to quickly respond to changes in the regulatory environment in China could adversely affect our business and impede our ability to continue our operations and proceed with our future business plans in China.
We are subject to export laws, trade policies and restrictions including international tariffs that could materially and adversely affect our business and results of operations.
We are subject to U.S. laws and regulations that could limit and restrict the export of some of our products and services and may restrict our transactions with certain customers, business partners and other persons, including, in certain cases, dealings with or between our employees and subsidiaries. In certain circumstances, export control and economic sanctions regulations may prohibit the export of certain products, services and technologies, and in other circumstances we may be required to obtain an export license before exporting the controlled item. Compliance with these laws and regulations has not materially limited our operations or our sales, but could materially limit them in the future, which would materially and adversely affect our business and results of operations. We maintain an export compliance program but there are risks that the compliance controls could be circumvented, exposing us to legal liabilities. We must also comply with export restrictions and laws imposed by other countries affecting trade and investments. Although these restrictions and laws have not materially restricted our operations in the recent past, there is a significant risk that they could do so in the future, which would materially and adversely affect our business and results of operations. In addition, U.S. laws and regulations and sanctions, or threat of sanctions, that could limit and restrict the export of some of our products and services to our customers may also encourage our customers to develop their own solutions to replace our products, or seek to obtain a greater supply of similar or substitute products from our competitors that are not subject to these restrictions, which could materially and adversely affect our business, financial condition and results of operations.
Since the beginning of 2018, there has been increasing rhetoric, in some cases coupled with legislative or executive action, from several U.S. and foreign leaders regarding tariffs against foreign imports of certain materials. More specifically, there have been several rounds of U.S. tariffs on Chinese goods that have taken effect in the past few years, some of which prompted retaliatory Chinese tariffs on U.S. goods. The institution of trade tariffs both globally and between the U.S. and China specifically carries the risk of negatively affecting both countries’ overall economic condition, as well as our business and financial results. If these tariffs continue or additional new tariffs are imposed in the future, they could have a negative impact on us as we have significant operations in China and the U.S.
Additionally, the imposition of tariffs is dependent upon the classification of goods under the U.S. Harmonized Tariff System (“HTS”) and the country of origin of the goods. Determination of the HTS and the origin of the goods is a technical matter that can be subjective in nature. Accordingly, although we believe our classifications of both HTS and origin are appropriate, there is no certainty that our assessment will be consistent with that of the U.S. government. If the U.S. government does not agree with our determinations, we could be required to pay additional amounts, including potential penalties.
We face political and other risks conducting business in Taiwan and Hong Kong, particularly due to their tense relationships with China.
We have significant business operations in Taiwan, and many of our manufacturing partners and suppliers are located in Taiwan. Accordingly, our business, financial condition and results of operations may be affected by changes in governmental and economic policies in Taiwan, social instability and diplomatic and social developments in or affecting Taiwan due to its unique international political status. Although significant economic and cultural relations have been established between Taiwan and China, we cannot assure that relations between Taiwan and China will not face political or economic uncertainties in the future. Any deterioration in the relations between Taiwan and China, and other factors affecting military, political or economic conditions in Taiwan, could disrupt our business operations and materially and adversely affect our results of operations.
In addition, the Chinese government has promulgated new regulations impacting economic and political stability within Hong Kong where many of our customers are located. Due to the sensitive political climate these regulations created, there are increasing risks that the national security law may trigger sanctions or other forms of restrictions by foreign governments including the U.S., which could affect companies conducting business in Hong Kong. It is difficult for us to predict the impact, if any, the implementation of the national security law will have on our business, as such impact will depend on future developments, which are highly uncertain and cannot be predicted.
Fluctuations in the value of the U.S. Dollar relative to other foreign currencies, including the Renminbi, may adversely affect our results of operations.
Several of our manufacturing and other suppliers are and will continue to be primarily located in China for the foreseeable future. In connection with the global economic downturn, there has been an increased level of global currency fluctuation and volatility. If the value of the Renminbi rises against the U.S. Dollar, there could be an increase in our manufacturing costs relative to competitors who have manufacturing facilities located outside of China, which could adversely affect our operations. In addition, our sales are primarily denominated in the U.S. Dollar. If the value of the U.S Dollar rises against other currencies, it may adversely affect the demand for our products in international markets, which could negatively impact our business and results of operations.
We incur foreign currency exchange gains or losses related to certain transactions, including intercompany transactions between the U.S. and our foreign subsidiaries, that are denominated in currencies other than the functional currencies. Fluctuations in the value of the U.S. Dollar relative to foreign currencies could increase the amount of foreign currency exchange losses we record, which could have an adverse impact on our results of operations.
Risks Associated with Product Demand and Sales
We may not experience growth rates comparable to past years.
In the past, our revenue increased significantly in certain years due to increased sales of certain of our products. We are subject to numerous risks and factors that could cause a decrease in our growth rates compared to past periods, including increased competition, loss of certain of our customers, unfavorable changes in our operations, reduced global electronics demand, a deterioration in market conditions including as a result of the global economic downturn, end-customer market downturn, market acceptance and penetration of our current and future products, and litigation. A material decrease in our growth rates could adversely affect our stock price and results of operations.
If demand for our products declines in the major end markets that we serve, our revenue will decrease and our results of operations and financial condition would be materially and adversely affected.
We believe that the application of our products in the storage and computing, enterprise data, automotive, industrial, communications and consumer markets will continue to account for the majority of our revenue. If we are not able to accurately predict new end markets to serve or if the demand for our products declines in our current major end markets, our revenue will decrease and our results of operations and financial condition would be materially and adversely affected. In addition, as technology evolves, the requirement to integrate the functionalities of various components, including our discrete semiconductor products, onto a single chip and/or onto other components of systems containing our products increases. Should our customers require integrated solutions that we do not offer, demand for our products could decrease, and our business, financial condition and results of operations would be materially and adversely affected.
Due to the nature of our business as a component supplier, we may have difficulty both in accurately predicting our future revenue and appropriately managing our expenses.
Because we provide components for end products and systems, demand for our products is influenced by our customers’ end product demand. As a result, we may have difficulty in accurately forecasting our revenue and expenses. Our expenses and revenue depend on the timing, size, and speed of commercial introductions of end products and systems that incorporate our products, all of which are inherently difficult to forecast, as well as the ongoing demand for previously introduced end products and systems. In addition, demand for our products is influenced by our customers’ ability to manage their inventory. Our sales to distributors are subject to higher volatility because they service demand from multiple levels of the supply chain which, in itself, is inherently difficult to forecast, all of which may be exacerbated by the adverse effects of macroeconomic factors, including increased inflation, increased interest rates, supply chain disruptions, decreased economic output, fluctuations in currency rates, the COVID-19 pandemic and the Russia-Ukraine conflict. If our customers, including distributors, do not manage their inventory correctly or misjudge their customers’ demand, our shipments to and orders from our customers may vary significantly on a quarterly basis, and we may have difficulty forecasting our expenses and inventory levels, which could reduce our revenue, result in inventory write offs, and adversely affect our financial condition and results of operations.
We may be unsuccessful in developing and selling new products with margins similar to, or better than, what we have experienced in the past, which would impact our overall gross margin and financial performance.
Our success depends on our development and sale of products that are differentiated in the market, with gross margins that have historically been above industry averages. Should we fail to improve our gross margin in the future, and accordingly develop and introduce sufficiently differentiated products that result in higher gross margins than industry averages, our business, financial condition and results of operations could be materially and adversely affected.
We may be unsuccessful in developing and selling new products or in penetrating new markets required to maintain or expand our business.
Our competitiveness and future success depend on our ability to design, develop, manufacture, assemble, test, market, and support new products and enhancements on a timely and cost-effective basis. A fundamental shift in technologies in any of our product markets could have a material adverse effect on our competitive position within these markets. Our failure to timely develop new technologies or to react quickly to changes in existing technologies could materially delay our development of new products, which could result in product obsolescence, decreased revenue, and/or a loss of market share to competitors.
As we develop new product lines, we must adapt to market conditions that are unfamiliar to us, such as competitors and distribution channels that are different from those we have known in the past. Some of our new product lines require us to re-equip our labs to test parameters we have not tested in the past. If we are unable to adapt rapidly to these new and additional conditions, we may not be able to successfully penetrate new markets.
The success of a new product depends on accurate forecasts of long-term market demand and future technological developments, as well as on a variety of specific implementation factors, including:
| • |
timely and efficient completion of process design and device structure improvements; |
| • |
timely and efficient implementation of manufacturing, assembly, and test processes; |
| • |
the ability to secure and effectively utilize fabrication capacity in different geometries; |
| • |
product performance; |
| • |
product availability; |
| • |
product quality and reliability; and |
| • |
effective marketing, sales and service. |
To the extent that we fail to timely introduce new products or to quickly penetrate new markets, our business, financial condition and results of operations could be materially and adversely affected.
We receive a significant portion of our revenue from distribution arrangements, and value-added resellers, and the loss of any one of these distributors, value-added resellers or direct customers or failure to collect a receivable from them could adversely affect our financial position and results of operations.
We market our products through distribution arrangements and value-added resellers, and through our direct sales and applications support organization to customers that include OEMs, ODMs and EMS providers. Receivables from our customers are generally not secured by any type of collateral and are subject to the risk of being uncollectible. Significant deterioration in the liquidity or financial condition of any such major customers or any group of our customers could have a material adverse impact on the collectability of our accounts receivable and our future operating results. While we could partner with other distributors or value-added resellers to replace any of our customers, the change in business partners could interrupt our operations and have a materially adverse impact on our business, financial condition and result of operations.
Moreover, we believe a high percentage of our products are eventually sold to a number of OEMs and ODMs. Although we communicate with OEMs and/or ODMs in an attempt to achieve “design wins,” which are decisions by OEMs and/or ODMs to incorporate our products, we do not have purchase commitments from these end users. Therefore, there can be no assurance that the OEMs and/or ODMs will continue to incorporate our ICs into their products, even if we secure a design win. OEM technical specifications and requirements can change rapidly, and we may not have products that fit new specifications from an end customer for whom we have had previous design wins. We cannot be certain that we will continue to achieve design wins from large OEMs, that our direct customers will continue to be successful in selling to the OEMs, or that the OEMs will be successful in selling products which incorporate our ICs. The loss of any significant customer, any material reduction in orders by any of our significant customers or by their OEM customers, the cancellation of a significant customer order, or the cancellation or delay of a customer’s or an OEM’s significant program or product could reduce our revenue and adversely affect our financial condition and results of operations.
Our products must meet specifications, and undetected defects and failures may occur, which may cause customers to return or stop buying our products and may expose us to product liability risk.
Our customers generally establish demanding specifications for quality, performance, energy efficiency and reliability that our products must meet. ICs as complex as ours often encounter development delays and may contain undetected defects or failures when first introduced or after commencement of commercial shipments, which might require product replacement or recall. Further, our third-party manufacturing processes or changes thereto, or changes in the raw material used in the manufacturing processes may cause our products to fail. From time to time, we have experienced product quality, performance or reliability problems. Our standard warranty period is generally one to two years, which exposes us to significant risks of claims for defects and failures. If defects and failures occur in our products, we could experience lost revenue, increased costs, including warranty expense and costs associated with customer support, cancellations or rescheduling of orders or shipments, and product returns or discounts, any of which would harm our operating results.
In addition, product liability claims may be asserted by our customers. Although we currently have insurance, there can be no assurance that we have obtained a sufficient amount of insurance coverage or that asserted claims will be within the scope of coverage. Our insurance providers could deny or challenge these claims, and as a result, reimbursement to us is not guaranteed or could be delayed. If coverage is denied, we may not have sufficient resources to pay for these claims. Furthermore, due to recent changes in the insurance industry, we may experience a significant increase in premiums and therefore decide to self-insure, which may not meet the expectations or requirements of certain customers. All of these factors could have a material and adverse impact on our business, financial condition and results of operations.
Because of the lengthy sales cycles for our products and the fixed nature of a significant portion of our expenses, we may incur substantial expenses before we earn associated revenue and may not ultimately achieve our forecasted sales for our products.
The introduction of new products presents significant business challenges because product development plans and expenditures may be made up to two years or more in advance of any sales. It generally takes us up to 12 months or more to design and manufacture a new product prototype. Only after we have a prototype do we introduce the product to the market and begin selling efforts in an attempt to achieve design wins. This sales process requires us to expend significant sales and marketing resources without any assurance of success. Volume production of products that use our ICs, if any, may not be achieved for an additional period of time after an initial sale. Sales cycles for our products are lengthy for a number of reasons, including:
| • |
our customers usually complete an in-depth technical evaluation of our products before they place a purchase order; |
| • |
the commercial adoption of our products by OEMs and ODMs is typically limited during the initial release of their product to evaluate product performance and consumer demand; |
| • |
our products must be designed into our customers’ products or systems; and |
| • |
the development and commercial introduction of our customers’ products incorporating new technologies are frequently delayed. |
As a result of our lengthy sales cycles, we may incur substantial expenses before we earn associated revenue because a significant portion of our operating expenses is relatively fixed and based on expected revenue. The lengthy sales cycles of our products also make forecasting the volume and timing of orders difficult. In addition, the delays inherent in lengthy sales cycles raise additional risks that customers may cancel or change their orders, particularly as such customers are exposed to economic risks in connection with the global economic downturn. Our sales are made by purchase orders. Because industry practice allows customers to reschedule or cancel orders on relatively short notice, backlog is not always a good indicator of our future sales. If customer cancellations or product changes occur, we could lose anticipated sales and not have sufficient time to reduce our inventory and operating expenses.
Risks Associated with Supply and Manufacturing
Our ability to increase product sales and revenue may be constrained by the manufacturing capacity of our suppliers.
Although we provide our suppliers with rolling forecasts of our production requirements, their ability to provide wafers to us is limited by the available capacity, particularly capacity in the geometries we require, at the facilities in which they manufacture wafers for us. For example, we believe the strong increase in industry-wide demand for electronic equipment for remote work arrangements as a result of the COVID-19 pandemic has resulted, and will continue to result, in capacity shortages of our suppliers. As a result, this lack of capacity has at times constrained our product sales and revenue growth. In addition, an increased need for capacity to meet internal demands or demands of other customers could cause our suppliers to reduce capacity available to us. Our suppliers may also require us to pay amounts in excess of contracted or anticipated amounts for wafer deliveries or require us to make other concessions in order to acquire the wafer supply necessary to meet our customer requirements. If our suppliers extend lead times, limit supplies or the types of capacity we require, or increase prices due to capacity constraints or other factors, our revenue and gross margin may materially decline. In addition, if we experience supply delays or limitations, our customers may reduce their purchase levels with us and/or seek alternative solutions to meet their demand, which could materially and adversely impact our business and results of operations. Delays in increasing third-party manufacturing capacity may also limit our ability to meet customer demand.
There may be unanticipated costs associated with adding to our third-party suppliers’ manufacturing capacity.
We anticipate that future growth of our business will require increased manufacturing capacity on the part of third-party supply foundries, assembly shops, and testing facilities for our products. In order to facilitate such growth, we may need to enter into strategic transactions, investments and other activities, both with our current suppliers and with new suppliers. Such activities are subject to a number of risks, including:
| • |
the costs and expense associated with such activities, including requirements to make long-term purchase commitments and upfront cash deposits to our suppliers; |
| • |
the availability of modern foundries to be developed, acquired, leased or otherwise made available to us or our third-party suppliers; |
| • |
the ability of foundries and our third-party suppliers to obtain the advanced equipment used in the production of our products; |
| • |
delays in identifying and negotiating agreements with new foundries and suppliers; and |
| • |
environmental, engineering or manufacturing qualification problems relating to existing or new foundry facilities, including delays in qualification of new foundries by our customers. |
These and other risks may affect the ultimate cost and timing of any expansion of our third-party supplier capacity. If our manufacturing costs increase, including as a result of inflationary pressure, or we experience supply constraints, we may be required to raise the prices for our products to remain profitable, which could result in a loss of customers.
We currently depend on third-party suppliers to provide us with wafers for our products. If any of our wafer suppliers are acquired, become insolvent or capacity constrained, or are otherwise unable to provide us sufficient wafers at acceptable yields and at anticipated costs, our revenue and gross margin may decline or we may not be able to fulfill our customer orders.
We have supply arrangements with certain suppliers for the production of wafers. Should any of our suppliers be acquired or become insolvent or capacity constrained, we may not be able to fulfill our customer orders, which would likely cause a decline in our revenue.
While certain aspects of our relationships with these suppliers are contractual, many important aspects of our relationships depend on our suppliers’ continued cooperation and our management of the supplier relationships. Our relationships could also be negatively impacted by changes in control or changes in the management team of the suppliers. In addition, the fabrication of ICs is a highly complex and precise process. Problems in the fabrication process can cause a substantial percentage of wafers to be rejected or numerous ICs on each wafer to be non-functional. This could potentially reduce yields and supply of our products. The failure of our suppliers to supply us wafers at acceptable yields could prevent us from fulfilling our customer orders for our products and would likely cause a decline in our revenue.
In addition, adverse macroeconomic conditions, such as inflationary pressures resulting from worldwide supply chain constraints and other factors, have increased, and may continue to increase the prices we pay to our suppliers. As a result of the increased costs, we have raised, and may be required to further raise the prices of our products in order to remain profitable, which could result in a loss of customers and reduced revenue.
Further, as is common in the semiconductor industry, our customers may reschedule or cancel orders on relatively short notice. If our customers cancel orders after we submit a committed forecast to our suppliers for the corresponding wafers, we may be required to purchase wafers that we may not be able to resell, which would adversely affect our financial condition, results of operations and cash flows.
We might not be able to deliver our products on a timely basis if our relationships with our assembly and test subcontractors are disrupted or terminated.
We do not have direct control over product delivery schedules or product quality because all of our products are assembled by third-party subcontractors and a portion of our testing is currently performed by third-party subcontractors. Also, due to the amount of time typically required to qualify assembly and test subcontractors, we could experience delays in the shipment of our products if we were forced to find alternate third parties to assemble or test our products. In addition, events such as the COVID-19 pandemic, the Russia-Ukraine conflict and supply chain disruptions may materially impact our assembly suppliers’ ability to operate. Any future product delivery delays or disruptions in our relationships with our subcontractors could have a material adverse effect on our financial condition, results of operations and cash flows.
We purchase inventory in advance based on expected demand for our products, and if demand is not as expected, we may have insufficient or excess inventory, which could adversely impact our financial position.
As a fabless semiconductor company, we purchase our inventory from third-party manufacturers in advance of selling our products. We place orders with our manufacturers based on existing and expected orders from our customers for particular products. While most of our contracts with our customers and distributors include lead time requirements and cancellation penalties that are designed to protect us from misalignment between customer orders and inventory levels, we must nonetheless make some predictions when we place orders with our manufacturers. Some of our customers and distributors may nevertheless cancel orders as a result of the impacts of the global economic downturn, their own specific business challenges or for other reasons. In the event that our predictions are inaccurate due to unexpected increases in orders or unavailability of products within the timeframe that is required, we may have insufficient inventory to meet our customers’ demands. In addition, a perceived negative trend in market conditions could lead us to decrease the manufacturing volume of our products to avoid excess inventory. If we inaccurately assess market conditions for our products, we would have insufficient inventory to meet our customer demands resulting in lost potential revenue. In the event that we order products that we are unable to sell due to a decrease in orders, unexpected order cancellations, injunctions due to patent litigation, import/export restrictions or product returns, we may have excess inventory which, if not sold, may need to be written down or would result in a decrease in our revenue in future periods as the excess inventory at our distributors is sold. If any of these situations were to arise, it could have a material impact on our business, financial condition and results of operations.
The price and availability of commodities (e.g., gold, copper and silicon) may adversely impact our ability to deliver our products in a timely and cost-effective manner, and may adversely affect our business and results of operations.
Our products incorporate commodities such as gold, copper and silicon. An increase in the price or a decrease in the availability of these commodities and similar commodities that we use could negatively impact our business and results of operations.
Risks Associated with Industry Dynamics and Competition
The highly cyclical nature of the semiconductor industry, which has resulted in significant and sometimes prolonged downturns, could materially and adversely affect our financial condition and results of operations.
Historically, the semiconductor industry has been highly cyclical and, at various times, has experienced significant downturns and wide fluctuations in supply and demand. These conditions have caused significant variances in product demand and production capacity, as well as rapid erosion of average selling prices. The industry may again experience severe or prolonged downturns in the future, which could result in downward pressure on the price of our products as well as lower demand for our products. Because significant portions of our expenses are fixed in the short term or incurred in advance of anticipated sales, we may not be able to decrease our expenses in a timely manner to offset any sales shortfall. Any significant or prolonged downturns could have a material adverse effect on our business, financial condition and results of operations.
Industry consolidation may lead to increased competition and may harm our operating results.
In recent years, there has been a trend toward semiconductor industry consolidation. We expect this trend to continue as companies attempt to improve the leverage of growing research and development costs, strengthen or hold their market positions in an evolving industry, or become unable to continue operations unless they find an acquirer or consolidate with another company. In addition, companies that are strategic alliance partners in some areas of our business may acquire or form alliances with our competitors, thereby reducing their business with us. We believe that semiconductor industry consolidation may result in stronger competitors that are better able to compete as sole-source vendors of multiple products for customers. This could lead to more variability in our operating results and could have a material adverse effect on our business, financial condition and results of operations.
We compete against many companies with substantially greater financial and other resources, and our market share may be reduced if we are unable to respond to our competitors effectively.
The analog and mixed-signal semiconductor industry is highly competitive, and we expect competitive pressures to continue. Our ability to compete effectively and to expand our business will depend on our ability to continue to recruit applications and design talent, our ability to introduce new products, and our ability to maintain the rate at which we introduce these new products. We compete with domestic and non-domestic semiconductor companies, many of which have substantially greater financial and other resources with which to pursue engineering, manufacturing, marketing, and distribution of their products, and, in some cases, may have a broader number of product offerings that enable them to more effectively market and sell to customers and engage sales partners. We are in direct and active competition, with respect to one or more of our product lines, with many manufacturers of such products, of varying size and financial strength. The number of our competitors has grown due to the expansion of the market segments in which we participate.
We cannot assure you that our products will continue to compete favorably, or that we will be successful in the face of increasing competition from new products and enhancements introduced by existing competitors or new companies entering this market, which would materially and adversely affect our results of operations and our financial condition.
In addition, from time to time, governments may provide subsidies or make other investments that could give competitive advantages to many semiconductor companies. For example, in August 2022, the U.S. enacted the U.S. CHIPS and Science Act of 2022 (the “CHIPS Act”), which, among other things, provides funding to increase domestic production and research and development in the semiconductor industry. Because we operate a fabless business model, we do not believe we will be eligible for such investments from the U.S. government. Many of our competitors will benefit from the investments, which will help increase their production capacity, shorten their lead time and gain market share. These competitive pressures could materially and adversely affect our business, financial condition and results of operations.
We may face competition from customers developing products internally.
Our customers generally have substantial technological capabilities and financial resources. Some customers have traditionally used these resources to develop their own products internally. The future prospects for our products in these markets are dependent in part upon our customers’ acceptance of our products as an alternative to their internally developed products. Future sales prospects also are dependent upon acceptance of third-party sourcing for products as an alternative to in-house development. Customers may continue to increase their use of internally developed components. They may also decide to develop or acquire components, technologies or products that are similar to, or that may be substituted for, our products. If our customers fail to accept our products as an alternative, if they develop or acquire the technology to develop such components internally rather than purchase our products, or if we are otherwise unable to develop or maintain strong relationships with them, our business, financial condition and results of operations could be materially and adversely affected.
Risks Associated with Information Technology (“IT”) and Cybersecurity
Implementation of enhanced enterprise resource planning (“ERP”) or other IT systems could result in significant disruptions to our operations.
From time to time, we may implement new ERP software solutions or upgrade existing systems. Implementation of these solutions and systems is highly dependent on coordination of system providers and internal business teams. We may experience difficulties as we transition to these new or upgraded systems and processes, including system downtime causing interruptions in business operations. In addition, transitioning to these new systems requires significant capital investments and personnel resources. Difficulties in implementing new or upgraded information systems or any significant system failures could disrupt our operations and financial reporting, which could have a material adverse effect on our capital resources, financial condition or results of operations.
System security risks, data protection or privacy breaches, cyberattacks and systems integration issues could disrupt our internal operations and/or harm our reputation, and any such disruption or harm could cause a reduction in our expected revenue, increase our expenses, negatively impact our results of operation or otherwise adversely affect our stock price.
Experienced hackers may be able to penetrate our network security and misappropriate or compromise our confidential and proprietary information, create system disruptions or cause shutdowns. The costs to us to eliminate or alleviate cyber or other security problems, bugs, viruses, worms, malicious software programs and security vulnerabilities could be significant, and our efforts to address these problems may not be successful and could result in interruptions and delays that may impede our sales, manufacturing, distribution, financial reporting or other critical functions.
In the ordinary course of business, we store sensitive data on our internal systems, network and servers, such as proprietary business and financial information, and confidential data pertaining to our customers, suppliers and business partners. Maintaining security of sensitive information on our networks and the protection features of our solutions are both critical to our operations and business strategy. We devote significant resources to network security, data encryption, and other security measures to protect our systems and data. However, these security measures cannot provide absolute security. Although we make significant efforts to maintain the security and integrity of our systems and solutions, any destructive or intrusive breach could compromise our networks, creating system disruptions or slowdowns, and the information stored on our networks could be accessed, publicly disclosed, lost or stolen. Remote working arrangements and the Russia-Ukraine conflict have also heightened our potential exposure to cyberattacks, which could put the sensitive proprietary and financial information we store on our internal systems at risk. If any of these types of security breaches were to occur and we were unable to protect sensitive data, our reputation and relationships with our business partners and customers could be materially harmed, and we could be exposed to risks of litigation and possible significant liability.
Portions of our IT infrastructure may also experience interruptions, delays or cessations of service or produce errors in connection with systems integration or migration work that takes place from time to time. We may not be successful in implementing new systems and transitioning data, which could cause business disruptions and our remediation efforts may be expensive, time consuming, disruptive and resource-intensive. Such disruptions could adversely impact our ability to fulfill orders and interrupt other processes. Delayed sales or a loss of customers resulting from these disruptions could adversely affect our financial results, stock price and reputation.
Unauthorized use or disclosure of, or access to, any personal information maintained by us or on our behalf, whether through breach of our systems, breach of the systems of our suppliers or vendors by an unauthorized party, or through employee error, theft or misuse, or otherwise, could harm our business. If any such unauthorized use or disclosure of, or access to, such personal information was to occur, our operations could be seriously disrupted, and we could be subject to demands, claims and litigation by private parties, and investigations, related actions, and penalties by regulatory authorities. In addition, we could incur significant costs in notifying affected persons and entities and otherwise complying with the multitude of foreign, federal, state and local laws and regulations relating to the unauthorized access to, or use or disclosure of, personal information. Finally, any perceived or actual unauthorized access to, or use or disclosure of, such information could harm our reputation and substantially impair our ability to attract and retain customers, which could have an adverse impact on our business, financial condition and results of operations.
We are subject to various U.S. and international laws, policies and other regulations regarding data protection.
Privacy, cyber security, and data protection are becoming increasingly significant issues in China and other countries. To address these issues, the Standing Committee of the National People’s Congress promulgated the Cyber Security Law of the People’s Republic of China (the “Cyber Security Law”), which took effect on June 1, 2017. The Cyber Security Law sets forth various requirements relating to the collection, use, storage, disclosure and security of data, among other things. On June 10, 2021, the National People’s Congress passed the Data Security Law of the People’s Republic of China (the “Data Security Law”), which became effective on September 1, 2021. The Data Security Law is the first comprehensive data security legislation in China, which becomes a key supplement to the Cyber Security Law and aims to regulate a wide range of issues in relation to the collection, storage, processing, use, provision, transaction and publication of any kind of data. Various Chinese agencies are expected to issue additional regulations in the future to define these requirements more precisely. For example, the Personal Information Protection Law (“PIPL”), took effect on November 1, 2021. PIPL is aimed at protecting and controlling the use and transfer of personal data in China. Given its recent passage, there is significant uncertainty in how regulators will interpret and enforce the law, but it contains provisions that allow substantial government oversight and include fines for failure to obtain required approval from China’s cyber and data protection regulators for cross-border transfers of personal data.
Effective May 25, 2018, the European Union (“EU”) implemented the General Data Protection Regulation (“GDPR”), a broad data protection framework that expands the scope of current EU data protection law to non-European Union entities that process, or control the processing of, the personal data of EU subjects. The GDPR allows for the imposition of fines and corrective action on entities that improperly use, disclose or secure the personal data of EU subjects, including through a data security breach. In addition, an increasing number of states in the U.S. have enacted laws containing similar requirements to GDPR for businesses collecting or processing personal data. For example, the State of California enacted the California Consumer Privacy Act of 2018 (“CCPA”), which was significantly amended by the California Privacy Rights Act, and sets forth comprehensive privacy and security obligations regarding the collection and processing of personal data of eligible California residents.
These regulatory requirements may increase our costs of compliance. Any failure to fully comply with the Cyber Security Law, the Data Security Law, PIPL, GDPR, CCPA, and other applicable laws and regulations could lead to significant fines and regulatory corrective actions, along with reputational damage or third-party lawsuits, which could adversely affect our business and results of operations. In addition, data security breaches experienced by us could result in the loss of trade secrets or other intellectual property, public disclosure of sensitive commercial data, and the exposure of personal data (including sensitive personal data) of our employees, customers, suppliers and others. Such incidents could subject us to significant monetary damages, regulatory enforcement actions and/or criminal prosecution, and cause us to lose clients and their related revenue in the future.
Risks Associated with Strategic Investments and Initiatives
Our success depends on our investment of significant resources in research and development. We may have to invest more resources in research and development than anticipated, which could increase our operating expenses and negatively impact our operating results.
Our success depends on us investing significant amounts of resources into research and development. We expect to continue investing heavily in research and development in the future in order to continue to innovate and introduce new products in a timely manner and increase our revenue and profitability. Increased investments in research and development will increase our operating expenses, which may negatively impact our operating results, and we may not achieve the return on these investments that we anticipate, or be able to reduce such expenses in a timely manner if we experience a downturn in sales. Also, if we are unable to properly manage and effectively utilize our research and development resources, we could see material adverse effects on our business, financial condition and operating results.
In addition, if new competitors, technological advances by existing competitors, our entry into new markets, or other competitive factors require us to invest significantly greater resources than anticipated in our research and development efforts, our operating expenses would increase further. If we are required to invest significantly greater resources than anticipated in research and development efforts without a corresponding increase in revenue, our operating results could decline. Research and development expenses are likely to fluctuate from time to time to the extent we make periodic incremental investments in research and development and these investments may be independent of our level of revenue, which could negatively impact our financial results. In order to remain competitive, we anticipate that we will continue to devote substantial resources to research and development, and we expect these expenses to increase in absolute dollars in the foreseeable future due to the increased complexity and the greater number of products under development.
We may not realize the anticipated benefits of any company or business that we acquire. In addition, acquisitions could result in diluting the ownership interests of our stockholders, reduce our cash balances, and cause us to incur debt or to assume contingent liabilities, which could adversely affect our business.
As part of our business strategy, from time to time we review acquisition prospects that would complement our current product offerings, enhance our design capability or offer other competitive opportunities. As a result of completing acquisitions, we could use a significant portion of our available cash, cash equivalents and short-term investments, issue equity securities that would dilute current stockholders’ percentage ownership, or incur substantial debt or contingent liabilities. Such actions could impact our operating results and the price of our common stock.
In addition, we may be unable to identify or complete prospective acquisitions for various reasons, including competition from other companies in the semiconductor industry, the valuation expectations of acquisition candidates and applicable antitrust or other policies, laws or regulations. If we are unable to identify and complete acquisitions, we may not be able to successfully expand our business and product offerings.
We cannot guarantee that any future acquisitions will improve our results of operations or that we will otherwise realize the anticipated benefits of any acquisitions. In addition, if we are unsuccessful in integrating any acquired company or business into our operations or if integration is more difficult than anticipated, we may experience disruptions that could harm our business and result in our failure to realize the anticipated benefits of the acquisitions. Some of the risks that may adversely affect our ability to integrate or realize any anticipated benefits from the acquired companies, businesses or assets include those associated with:
| • |
unexpected losses of key employees or customers of the acquired companies or businesses; |
| • |
integrating the acquired company’s standards, processes, procedures and controls with our operations; |
| • |
coordinating new product and process development; |
| • |
hiring additional management and other critical personnel; |
| • |
increasing the scope, geographic diversity and complexity of our operations; |
| • |
difficulties in consolidating facilities and transferring processes and know-how; |
| • |
difficulties in the assimilation of acquired operations, technologies or products; |
| • |
the risk of undisclosed liabilities of the acquired businesses and potential legal disputes with founders or stockholders of acquired companies; |
| • |
our inability to commercialize acquired technologies; |
| • |
the risk that the future business potential as projected is not realized and as a result, we may be required to take an impairment charge related to goodwill or acquired intangibles that would impact our profitability; |
| • |
difficulties in assessing the fair value of earn-out arrangements; |
| • |
diversion of management’s attention from other business concerns; and |
| • |
adverse effects on existing business relationships with customers. |
Alternatively, third parties may be interested in acquiring us. We will continue to consider, evaluate and negotiate any such transactions as our board of directors deems appropriate and in the best interest of our stockholders. Such potential transactions may divert the attention of management, and cause us to incur various costs and expenses in investigating, evaluating and negotiating such transactions, whether or not they are consummated.
Risks Associated with Financial Reporting
The complexity of calculating our tax provision may result in errors that could result in restatements of our financial statements.
Due to the complexity associated with the calculation of our tax provision, including the effects of the enactment of new tax laws, we engage third-party tax advisors to assist us in the calculation. If we or our tax advisors fail to resolve or fully understand certain issues that we may have had in the past and issues that may arise in the future, we could be subject to errors, which, if material, would result in us having to restate our financial statements. Restatements are generally costly and could adversely impact our results of operations, damage our reputation, and/or have a negative impact on the trading price of our common stock.
Changes in effective tax rates or adverse outcomes resulting from examination of our income tax returns could adversely affect our results of operations.
Our future effective tax rates could be adversely affected by earnings being lower than anticipated in countries where we have lower statutory rates and higher than anticipated in countries where we have higher statutory rates, by changes in the valuation of our deferred tax assets, or by changes in tax laws, regulations, accounting principles or interpretations thereof and discrete items. In addition, we are subject to potential future examinations of our income tax returns by the Internal Revenue Service (the “IRS”) and tax authorities in various jurisdictions where we have business operations. We assess the likelihood of adverse outcomes resulting from these examinations to determine the adequacy of our provision for income taxes. There can be no assurance that the outcomes from any examinations will not have an adverse effect on our financial condition and results of operations.
Our international operations subject us to potentially significant tax consequences, which could adversely affect our results of operations.
We conduct our international operations through wholly-owned subsidiaries, branches and representative offices and report our taxable income in various jurisdictions worldwide based upon our business operations in those jurisdictions. Such corporate structures are subject to complex transfer pricing, permanent establishment challenges and other local regulations administered by taxing authorities in various jurisdictions. The relevant taxing authorities may disagree with our determinations as to the income and expenses attributable to specific jurisdictions. If such a disagreement were to occur, and our positions were not sustained, we could be required to pay additional taxes, interest and penalties, resulting in higher effective tax rates, reduced cash flows and lower overall profitability of our operations. Additionally, our future worldwide tax rate and financial position may be affected by changes in the relevant tax laws, interpretation of such tax laws or the influence of certain tax policy efforts, including in the EU and the Organization for Economic Cooperation and Development.
We face risks in connection with our internal control over financial reporting.
Effective internal control over financial reporting is necessary for us to provide reliable and accurate financial reports. If we cannot provide reliable financial reports or prevent fraud or other financial misconduct, our business and operating results could be harmed. Our failure to implement and maintain effective internal control over financial reporting could result in a material misstatement of our financial statements or otherwise cause us to fail to meet our financial reporting obligations. This, in turn, could result in a loss of investor confidence in the accuracy and completeness of our financial reports, which could have an adverse effect on our results of operations and/or have a negative impact on our reputation and the trading price of our common stock, and could subject us to stockholder litigation. In addition, we cannot assure you that we will not in the future identify material weaknesses in our internal control over financial reporting, which may impact the reliability of our financial reporting and financial statements.
Risks Associated with Regulatory Compliance, Intellectual Property Protection and Litigation
We are subject to anti-corruption laws in the jurisdictions in which we operate, including the U.S. Foreign Corrupt Practices Act (the “FCPA”) and the U.K. Bribery Act. Our failure to comply with these laws could result in penalties which could harm our reputation and have a material adverse effect on our business, financial condition and results of operations.
We are subject to the FCPA, the U.K. Bribery Act and various anti-corruption laws of other jurisdictions, which generally prohibit companies and their intermediaries from making improper payments to foreign officials for the purpose of obtaining or keeping business and/or other benefits. Although we have implemented policies and procedures designed to ensure that we, our employees and other intermediaries comply with the FCPA, the U.K. Bribery Act and other anti-corruption laws to which we are subject, there is no assurance that such policies or procedures will work effectively all of the time or protect us against liability under these laws for actions taken by our employees and other intermediaries with respect to our business or any businesses that we may acquire. We have significant operations in Asia, which place us in frequent contact with persons who may be considered “foreign officials” under the FCPA or other anti-corruption laws, resulting in an elevated risk of potential violations. If we are not in compliance with the FCPA and other laws governing the conduct of business with government entities (including local laws), we may be subject to criminal and civil penalties and other remedial measures, including restatements of our financial reports, which could have a material adverse impact on our business, financial condition, results of operations and liquidity. Any investigation or allegations of any potential violations of the FCPA or other anti-corruption laws by the U.S. or foreign authorities could harm our reputation and have an adverse impact on our business, financial condition and results of operations.
Our business is subject to various governmental laws and regulations, and compliance with these regulations may impact our revenue and cause us to incur significant expense. If we fail to maintain compliance with applicable regulations or obtain government licenses and approvals for our desired international trading activities or technology transfers, we may be forced to recall products and cease their distribution, and we could be subject to civil or criminal penalties.
Our business is subject to various significant laws and other legal requirements imposed by the U.S. and other countries we conduct business in, including export control laws such as the Export Administration Act, the Export Administration Regulations and other laws, regulations and requirements governing international trade and technology transfer. These laws and regulations are complex, change frequently and have generally become more stringent over time. We may be required to incur significant expense to comply with these regulations or to remedy violations of these regulations. In addition, if our customers fail to comply with these regulations, we may be required to suspend sales to these customers, which could negatively impact our results of operations. We must conform the manufacture and distribution of our products to various laws and adapt to regulatory requirements in many countries as these requirements change. If we fail to comply with these requirements in the manufacture or distribution of our products, we could be required to pay civil penalties, face criminal prosecution and, in some cases, be prohibited from distributing our products commercially until the products are brought into compliance.
Environmental laws and regulations could cause a disruption in our business and operations.
We are subject to various foreign, federal, state and local laws and regulations that govern the environment, including those restricting the presence of certain substances in electronic products and making manufacturers of those products financially responsible for the collection, treatment, recycling and disposal of certain products. Such laws and regulations have been passed in several jurisdictions in which we operate, including various EU member countries and countries in Asia. There can be no assurance that similar laws and regulations will not be implemented in other jurisdictions resulting in additional costs, possible delays in delivering products, and even the discontinuance of existing and planned future products if the costs were to become prohibitive.
We are subject to increasing regulatory and reporting standards related to ESG matters, which could increase our expenses.
Recently, there has been an increase in public awareness from regulators, investors and other key stakeholders focusing on ESG compliance efforts, including those related to environmental sustainability and social responsibility. For example, the SEC has proposed a new rule that would require public companies to provide detailed reporting of their climate-related risks, emissions, and net-zero transition plans, and many of our customers routinely include stringent environmental and other non-standard compliance requirements in their contracts with us. While we are fully committed to making our business sustainable and keeping our stakeholders engaged by maintaining strong ESG strategies, practices, processes, policies and disclosures, there can be no assurance that we will be able to achieve our goals, or that our compliance initiatives will be deemed sufficiently robust by regulators and other key stakeholders. Furthermore, our compliance efforts, including the collection, assessment and reporting of ESG data, are subject to evolving reporting standards and can be costly, complex and time-consuming. In addition, climate change concerns and the potential associated environmental impact could result in the proposal and passage of additional laws and regulations in various jurisdictions that may affect us, our suppliers and customers. Such laws and regulations could cause us to incur additional compliance costs, and failure to comply with the regulatory standards in a timely manner could result in penalties and fines. These operational, legal, compliance and other risks could damage our reputation and materially and adversely affect our business, financial condition and results of operations.
If we are unsuccessful in legal proceedings brought against us or any of our customers, we could be prevented from selling many of our products and/or be required to pay substantial damages. An unfavorable outcome or an additional award of damages, attorneys’ fees or an injunction could cause our revenue to decline significantly and could severely harm our business and operating results.
From time to time, we are a party to various legal proceedings. If we are not successful in litigation that could be brought against us or our customers, we could be ordered to pay monetary fines and/or damages. If we are found liable for willful patent infringement, damages could be significant. We and/or our customers could also be prevented from selling some or all of our products. Moreover, our customers and end users could decide not to use our products, and our products and our customers’ accounts payable to us could be seized. Finally, interim developments in these proceedings could increase the volatility in our stock price as the market assesses the impact of such developments on the likelihood that we will or will not ultimately prevail in these proceedings. Even if resolved favorably, such proceedings can be very expensive and time consuming, and may divert management’s attention from other business operations.
Given our inability to control the timing and nature of significant events in our legal proceedings that either have arisen or may arise, our legal expenses are difficult to forecast and may vary substantially from our publicly disclosed forecasts with respect to any given quarter, which could contribute to increased volatility in our stock price and financial condition.
Historically, we have incurred significant expenses in connection with various legal proceedings that vary with the level of activity in the proceeding. It is difficult for us to forecast our legal expenses for any given quarter, which adversely affects our ability to forecast our expected results of operations in general. We may also be subject to unanticipated legal proceedings, which would result in us incurring unexpected legal expenses. If we fail to meet the expectations of securities or industry analysts as a result of unexpected changes in our legal expenses, our stock price could be materially and adversely affected.
Future legal proceedings may divert our financial and management resources.
The semiconductor industry is characterized by frequent claims of infringement and litigation regarding patent and other intellectual property rights. Patent infringement is an ongoing risk, in part because other companies in our industry could have patent rights that may not be identifiable when we initiate development efforts. Litigation may be necessary to enforce our intellectual property rights, and we may have to defend ourselves, and in some circumstances our key customers or suppliers, against additional infringement claims. Such litigation is very costly. Further, in connection with these legal proceedings, we may be required to post bonds to defend our intellectual property rights in certain countries for an indefinite period of time, until such dispute is resolved. If our legal expenses materially increase or exceed anticipated amounts, our capital resources and financial condition could be adversely affected. If we are not successful in any of our intellectual property defenses, we may have to cease production of certain products, design around such technologies, or pay royalty payments, any of which could harm our financial condition and our business. Our management team may also be required to devote a great deal of time and effort to these legal proceedings, which could divert management’s attention from focusing on our operations, which could adversely affect our business.
Failure to protect our proprietary technologies or maintain the right to certain technologies may negatively affect our ability to compete.
We rely heavily on our proprietary technologies. Our future success and competitive position depend in part upon our ability to obtain and maintain protection of certain proprietary technologies used in our products. We pursue patents for some of our new products and unique technologies, and we also rely on a combination of nondisclosure agreements and other contractual provisions, as well as our employees’ commitment to confidentiality and loyalty, to protect our technology, know-how and processes. Despite the precautions we take, it may be possible for unauthorized third parties to copy aspects of our current or future technologies or products, or to obtain and use information that we regard as proprietary. We intend to continue to protect our proprietary technologies, including through patents. However, there can be no assurance that the steps we take will be adequate to protect our proprietary rights, that our patent applications will lead to issued patents, that others will not develop or patent similar or superior products or technologies, or that our patents will not be challenged, invalidated or circumvented by others. Furthermore, the laws of the countries in which our products are or may be developed, manufactured or sold may not protect our products and intellectual property rights to the same extent as laws in the United States. Our failure to adequately protect our proprietary technologies could materially harm our business.
Risks Associated with Human Capital Management
The loss of any of our key personnel or the failure to attract or retain specialized technical and management personnel could affect our operations or impair our ability to grow our business.
Our future success depends upon our ability to attract and retain highly qualified technical and managerial personnel. We are particularly dependent on the continued services of our key executives, including Michael Hsing, our President and Chief Executive Officer, who founded our company and developed our proprietary process technology. In addition, personnel with highly skilled analog and mixed-signal design engineering expertise are scarce and competition for personnel with these skills is intense. There can be no assurance that we will be able to retain existing key employees or that we will be successful in attracting, integrating or retaining other highly qualified personnel with critical capabilities in the future. If we are unable to retain the services of existing key employees or are unsuccessful in attracting new highly qualified employees quickly enough to meet the demands of our business, including design cycles, our business could be harmed. Furthermore, if we lose key personnel, the search for a qualified replacement and the transition could interrupt our operations as the search could take us longer than expected and divert management resources, and the newly hired employee could take longer than expected to effectively integrate into the team.
If we fail to retain key employees in our sales, applications, finance and legal functions or to make continued improvements to our internal systems, our business may suffer.
If we fail to continue to adequately staff our sales, applications, financial and legal positions, maintain or upgrade our business systems and maintain internal control that meet the demands of our business, our ability to operate effectively will suffer. The operation of our business also depends upon our ability to retain these employees, as these employees hold a significant amount of institutional knowledge about us and our products and, if they were to terminate their employment, our sales, operations and internal control over financial reporting could be adversely affected.
Risks Associated with Ownership of Our Stock
The future trading price of our common stock could be subject to wide fluctuations in response to a variety of factors.
The future trading price of our common stock is likely to be highly volatile and could be subject to wide fluctuations in response to various factors, many of which are beyond our control, including:
| • |
actual or anticipated results of operations and financial performance, including our ability to accurately forecast future demand for our products; |
| • |
actual or anticipated manufacturing capacity limitations; |
| • |
our ability to develop new products, enter new market segments, gain market share, manage litigation risk, diversify our customer base and successfully secure manufacturing capacity; |
| • |
our ability to maintain or increase our gross margins; |
| • |
costs of increasing wafer capacity and qualifying additional third-party wafer fabrication facilities; |
| • |
our loss of key customers; |
| • |
investments in sales and marketing resources to enter new markets; |
| • |
commencement of or developments relating to litigation; |
| • |
cyberattacks or other system security, data protection and privacy breaches; |
| • |
the inclusion, exclusion or deletion of our common stock from any major trading indices, such as the S&P 500 Index; |
| • |
our sale of common stock or other securities in the future; |
| • |
any mergers, acquisitions or divestitures of assets undertaken by us; |
| • |
our ability to obtain governmental licenses and approvals for international trading activities or technology transfers, including export licenses; |
| • |
our ability to meet or exceed the guidance that we provide to our investors and analysts; |
| • |
our ability to pay quarterly cash dividends to stockholders; |
| • |
our ability to meet or exceed our, our investors’ or analysts’ expectations; |
| • |
market reactions to guidance from other semiconductor companies or third-party research groups; |
| • |
market reactions to merger and acquisition activities in the semiconductor industry, and rumors or expectations of further consolidation in the industry; |
| • |
investor perceptions of us and our business strategies; |
| • |
the breadth and liquidity of the market for our common stock; |
| • |
trading activity in our common stock, including short positions; |
| • |
actions by institutional or other large stockholders; |
| • |
changes in the estimation of the future size and growth rate of our markets; |
| • |
introduction of new products by us or our competitors; |
| • |
general economic, industry and market conditions worldwide, including the global economic downturn; |
| • |
developments generally affecting the semiconductor industry; |
| • |
terrorist acts or acts of war, including the ongoing conflict between Ukraine and Russia; |
| • |
epidemics and pandemics, such as developments and restrictions with respect to the COVID-19 pandemic; |
| • |
developments with respect to intellectual property rights; |
| • |
conditions and trends in technology industries; |
| • |
changes in market valuation or earnings of our competitors; |
| • |
government debt default; |
| • |
changes in corporate tax laws; |
| • |
government policies and regulations on international trade policies and restrictions, including tariffs on imports of foreign goods; |
| • |
export controls, trade and economic sanctions and regulations, and other regulatory or contractual limitations on our ability to sell or develop our products in certain foreign markets, particularly in China; |
| • |
ratings published by third-party organizations with respect to our ESG compliance efforts; |
| • |
our compliance with regulatory mandates focusing on ESG issues; and |
| • |
our performance against the ESG guidelines set by institutional stockholders and customers, and our ability to meet or exceed their expectations. |
In addition, the stock market often experiences substantial volatility that may be unrelated to the operating performance of particular companies. These broad market fluctuations may adversely affect the trading price of our common stock.
If securities or industry analysts downgrade our stock or do not continue to publish research or reports about our business, our stock price and trading volume could decline.
The trading market for our common stock will depend, in part, on the research and reports that industry or securities analysts publish about us or our business. We do not have any control over these analysts. If we fail to meet the expectations of these analysts, or one or more of the analysts who cover us downgrade our stock, our stock price would likely decline. If one or more of these analysts cease coverage of us or fail to regularly publish reports on us, we could lose visibility in the financial markets, which in turn could cause our stock price or trading volume to decline.
Short positions in our stock could have a substantial impact on the trading price of our stock.
Historically, there have been “short” positions in our common stock. The anticipated downward pressure on our stock price due to actual or anticipated sales of our stock by some institutions or individuals who engage in short sales of our common stock could cause our stock price to decline. Such stock price decreases could encourage further short-sales that could place additional downward pressure on our stock price. This could lead to further increases in the existing short position in our common stock and cause decreases and volatility in our stock price. The volatility of our stock may cause the value of a stockholder’s investment to decline rapidly. Additionally, if our stock price declines, it may be more difficult for us to raise capital and may have other adverse effects on our business.
There can be no assurance that we will continue to declare cash dividends at all or in any particular amounts.
We have a dividend program approved by our Board of Directors, pursuant to which we intend to pay quarterly cash dividends on our common stock. The declaration of any future cash dividends is at the discretion of our Board of Directors and will depend on, among other things, our financial condition, results of operations, capital requirements, business conditions, and other factors that our Board of Directors may deem relevant, as well as a determination that cash dividends are in the best interests of our stockholders. Our dividend payments may change from time to time, and we cannot provide assurance that we will continue to declare dividends at all or in any particular amounts. A reduction in or elimination of our dividend payments could have a negative effect on the price of our common stock and on the return achieved by our stockholders.
If we issue additional shares of stock in the future, it may have a dilutive effect on our stockholders.
We may issue additional shares of common stock in the future in order to raise additional capital to fund our global operations or in connection with an acquisition. We also issue restricted stock units (“RSUs”) to employees, which convert into shares of common stock upon vesting. Any issuance of our common stock may result in immediate dilution to our stockholders. In addition, the issuance of a significant amount of our common stock may require additional regulatory compliance, such as stockholder approval.
General Risk Factors
The effects of global pandemics such as COVID-19 are highly unpredictable and could adversely affect our business, results of operations and financial condition.
We face various risks related to epidemics and pandemics, including the global outbreak of COVID-19 first identified in December 2019. Since the World Health Organization declared the COVID-19 outbreak as a pandemic in March 2020, it has resulted in significant disruptions and uncertainties in the global economy and in the financial markets. While the COVID-19 pandemic did not have a material and adverse impact on our business operations and financial condition, the ongoing effect of the pandemic on our future operational and financial performance will depend on numerous evolving developments, including the duration and magnitude of the pandemic and the introduction of new variants, and the impact on our customers, employees, suppliers and other partners, all of which are uncertain and difficult to predict at this time. Furthermore, due to the complexity and variability of COVID-19 policies and regulations imposed by different countries where we operate, we are subject to significant compliance efforts which could require additional resources and result in increased costs, or we may fail to be in compliance on a timely manner. A prolonged outbreak could negatively affect our business, including:
| • |
unpredictability in demand, pricing and costs for our products, and losses of significant contracts or key customers as a result of a global economic downturn caused by the pandemic; |
| • |
our ability to accurately forecast our results of operation, including products sales and market demand for our products; |
| • |
reductions or delays in production levels, qualification activities with our customers, and valuation of our inventory due to changes in forecasted demand and our outlook on market conditions; |
| • |
disruptions to our distribution channels and supply chain in connection with the sourcing of materials from geographic areas that have been impacted by the pandemic; |
| • |
increased costs resulting from work-from-home and other measures we have enacted at certain of our locations around the world, and increased cyber security risks due to these remote working arrangements; and |
| • |
losses on our investments due to defaults on payments by the issuers, write-offs of our accounts receivable due to defaults and insolvency, or significant delays in payments by our customers. |
We have worked, and will continue to work, with our stakeholders, including customers, suppliers and employees, to address the continuing impact of this global pandemic. We will continue to monitor the situation to assess further possible implications to our business, supply chain and customers, and to take actions in an effort to mitigate adverse consequences. The resumption of normal business operations may be delayed or constrained by lingering effects of the pandemic, including limitations imposed by governmental authorities on our ability to return to normal operating practices. These effects, alone or taken together, could have a material adverse impact on our business, results of operations or financial condition.
Our worldwide operations are subject to economic and geopolitical uncertainty, health risks, climate crises and other natural disasters, which could have a material adverse effect on our business operations.
Our offices in California and Washington, the production facilities of our third-party wafer suppliers, our IC testing and manufacturing facilities, a portion of our assembly and research and development activities, and certain other critical business operations are located in or near seismically active regions and are subject to periodic earthquakes. We do not maintain earthquake insurance and could be materially and adversely affected in the event of a major earthquake. Much of our revenue, as well as our manufacturers and assemblers, are concentrated in Asia, particularly in China. Such concentration increases the risk that earthquakes or other natural disasters, labor strikes, epidemics and pandemics, and/or health advisories could disrupt our operations and have a material adverse impact on our business and results of operations. For example, in 2022, China experienced a severe heatwave during the summer months in the Sichuan province, which resulted in widespread power shortages, rolling backouts and temporary business shutdowns imposed by the local governments. Although we were able to successfully execute our contingency plan and our operations were not materially and adversely disrupted by the events, we cannot guarantee that we will be able to mitigate the operational risks caused by extreme weather conditions or other events in the future.
In addition, we rely heavily on our internal information and communications systems and on systems or support services from third parties to manage our operations efficiently and effectively. Any of these are subject to failure due to a natural disaster or other disruptions. System-wide or local failures that affect our information processing could have material adverse effects on our business, financial condition and results of operations.
Furthermore, worldwide political conditions may create uncertainties that could adversely affect our business. The U.S. and other regions where we conduct business in have been and may continue to be affected by conflicts that could, among other things, disrupt our supply chain, and impact customer demands and component prices. For example, the U.S. and other countries have recently imposed economic sanctions and export control measures on Russia due to the conflict in Ukraine. Although such measures have not significantly affected our business or operations, future developments could adversely affect our operating results and financial condition.
| Unresolved Staff Comments |
None.
| Properties |
The following table summarizes our significant properties as of December 31, 2022:
| Approximate |
|||||
| Building |
|||||
| Location |
Square Footage |
Primary Use |
|||
| Owned: |
|||||
| United States: |
|||||
| Kirkland, Washington |
70,000 | Principal executive office, research and development, sales and marketing |
|||
| Livonia, Michigan |
40,000 | Sales and marketing, research and development |
|||
| San Jose, California |
106,000 | Research and development, sales and marketing, administrative |
|||
| International: |
|||||
| Barcelona, Spain |
12,000 | Research and development, sales and marketing, administrative |
|||
| Chengdu, China |
200,000 | Research and development, administrative |
|||
| Chengdu, China |
60,000 | Manufacturing operations |
|||
| Chengdu, China |
451,000 | Manufacturing operations, research and development, administrative |
|||
| Ettenheim, Germany |
57,000 | Sales and marketing |
|||
| Hangzhou, China |
68,000 | Research and development |
|||
| Shanghai, China |
16,000 | Sales and marketing |
|||
| Shenzhen, China |
8,000 | Sales and marketing |
|||
| Taipei, Taiwan |
47,000 | Sales and marketing, research and development, administrative |
|||
| Leased: |
|||||
| Barcelona, Spain |
12,000 | Research and development |
|||
| Chengdu, China |
235,000 | Manufacturing operations, inventory warehouse |
|||
| Hsinchu, Taiwan |
34,000 | Research and development |
|||
We also lease other sales and marketing, and research and development offices in Asia, Europe and the United States. We believe that our existing facilities are adequate for our current operations.
| Legal Proceedings |
We are a party to actions and proceedings in the ordinary course of business, including challenges to the enforceability or validity of our intellectual property, claims that our products infringe on the intellectual property rights of others, and employment matters. We may also be subject to litigation initiated by our stockholders. These proceedings often involve complex questions of fact and law and may require the expenditure of significant funds and the diversion of other resources to prosecute and defend. We intend to defend ourselves vigorously against any such claims. As of December 31, 2022, there were no material pending legal proceedings to which we were a party.
| Mine Safety Disclosures |
Not applicable.
| Market for Registrant’s Common Equity, Related Stockholder Matters and Issuer Purchases of Equity Securities. |
Common Stock Information
Our common stock is traded on the Nasdaq Global Select Market under the symbol “MPWR.”
Holders of Common Stock
As of February 17, 2023, there were 58 registered holders of record of our common stock. A substantially greater number of holders of our common stock are “street name” or beneficial holders, whose shares are held by banks, brokers and other financial institutions on their behalf.
Dividend Policy
We currently have a dividend program approved by our Board of Directors, pursuant to which we intend to pay quarterly cash dividends on our common stock. Based on our historical practice, stockholders of record as of the last business day of the quarter are entitled to receive the quarterly cash dividends when and if declared by our Board of Directors, which are payable to the stockholders in the following month.
The declaration of any future cash dividends is at the discretion of our Board of Directors and will depend on, among other things, our financial condition, results of operations, capital requirements, business conditions and other factors that our Board of Directors may deem relevant, as well as a determination that cash dividends are in the best interests of the stockholders.
Stock Performance Graph
The following graph compares the cumulative five-year total return on our common stock relative to the cumulative total returns of the Nasdaq Composite Index and the PHLX Semiconductor Sector Index. An investment of $100 is assumed to have been made in our common stock on December 31, 2017 and its performance relative to the performance of a similar investment in the two indexes is shown through December 31, 2022, assuming the reinvestment of dividends. Historic stock performance is not indicative of future performance.
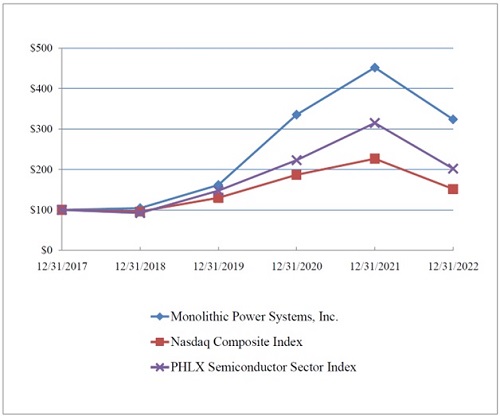
The information contained in this stock performance graph section shall not be deemed to be “soliciting material,” or “filed” or incorporated by reference in future filings with the SEC, or subject to the liabilities of Section 18 of the Securities Exchange Act of 1934, except to the extent that we specifically incorporate it by reference into a document filed under the Securities Act of 1933 or the Securities Exchange Act of 1934.
| [Reserved] |
| Management's Discussion and Analysis of Financial Condition and Results of Operations |
The following discussion should be read in conjunction with the consolidated financial statements and related notes which appear under Item 8 in this Annual Report on Form 10-K. This discussion and analysis contain, in addition to historical information, forward-looking statements that include risks and uncertainties. Our actual results may differ materially from those anticipated in these forward-looking statements as a result of certain factors, including those set forth under “Part I, Item 1A. Risk Factors” and elsewhere in this Annual Report on Form 10-K.
Discussions of 2020 results and year-to-year comparisons between 2021 and 2020 that are omitted in this Annual Report on Form 10-K can be found in “Management’s Discussion and Analysis of Financial Condition and Results of Operations” in Part II, Item 7 of our Annual Report on Form 10-K for the year ended December 31, 2021, filed with the SEC on February 25, 2022.
Overview
We are a fabless company with a global footprint that provides high-performance, semiconductor-based power electronic solutions. Incorporated in 1997, our three core strengths include deep system-level knowledge, strong semiconductor expertise, and innovative proprietary technologies in the areas of semiconductor processes, system integration, and packaging. These combined advantages enable us to deliver reliable, compact, and monolithic solutions found in storage and computing, enterprise data, automotive, industrial, communications and consumer applications. Our mission is to reduce energy and material consumption to improve all aspects of quality of life. We believe that we differentiate ourselves by offering solutions that are more highly integrated, smaller in size, more energy-efficient, more accurate with respect to performance specifications and, consequently, more cost-effective than many competing solutions. We plan to continue to introduce new products within our existing product families, as well as in new innovative product categories.
We operate in the cyclical semiconductor industry. We are not immune from industry downturns, but we have targeted product and market areas that we believe have the ability to offer above average industry performance over the long term. Historically, our revenue has generally been higher in the second half of the year than in the first half although various factors, such as market conditions and the timing of key product introductions, could impact this trend.
We work with third parties to manufacture and assemble our ICs. This has enabled us to limit our capital expenditures and fixed costs, while focusing our engineering and design resources on our core strengths.
Following the introduction of a product, our sales cycle generally takes a number of quarters after we receive an initial customer order for a new product to ramp up. Typical supply chain lead times for orders are generally 16 to 26 weeks. These factors, combined with the fact that our customers can cancel or reschedule orders without significant penalty to the customer, make the forecasting of our orders and revenue difficult.
We derive most of our revenue from sales through distribution arrangements and direct sales to customers in Asia, where our products are incorporated into end-user products. Our revenue from direct or indirect sales to customers in Asia was 86%, 90% and 91% for the years ended December 31, 2022, 2021 and 2020, respectively. We derive a majority of our revenue from the sales of our DC to DC converter products which serve the storage and computing, enterprise data, automotive, industrial, communications and consumer markets. We believe our ability to achieve revenue growth will depend, in part, on our ability to develop new products, enter new market segments, gain market share, manage litigation risk, diversify our customer base and continue to secure manufacturing capacity.
Impact of COVID-19 on Our Business
The COVID-19 pandemic has had, and continues to have, a significant impact around the world. Our primary focus is to continue to execute our business plan and mitigate the effect of the COVID-19 pandemic on our financial position and operations, while actively taking all necessary precautions to ensure the safety of our employees, our suppliers and our customers. The pandemic did not have a material adverse impact on our overall operating results or business operations for the year ended December 31, 2022.
In 2022, China has continued to experience outbreaks, specifically in Shanghai and Chengdu where we have business operations and where many of our customers and suppliers are located. Local governments have implemented, and may continue to implement, strict measures including quarantines, shutdowns and other business restrictions, which have resulted in logistics challenges throughout China. Although these strict measures and the disruptions, as a result thereof, did not have a material adverse impact on our operations in 2022, we will continue to monitor and evaluate future developments. However, we cannot reasonably estimate the potential effect of these measures on the global economy, the semiconductor industry and our business.
We have worked, and are continuing to actively work, with our stakeholders, including customers, suppliers and employees, to address the impact of the pandemic. We will continue to monitor the situation, to assess further possible implications to our business, supply chain and customers, and to take actions in an effort to mitigate adverse consequences to the extent feasible. A prolonged economic slowdown as a result of the pandemic, or otherwise, could materially and adversely impact our business, results of operations and financial condition for 2023 and beyond.
Russia-Ukraine Conflict
As the Russia-Ukraine conflict continues to evolve, we are closely monitoring the impact of future developments on our business, supply chain, employees, customers and other business partners. Our total revenue in Russia has historically not been material and we have stopped shipping to customers in Russia. All accounts receivable balances from our customers in Russia have been paid.
Macroeconomic Conditions and Recent Regulations
During 2022, the semiconductor industry faced a number of macro-economic challenges including the impact of supply chain capacity constraints, wide swings in customer demand, rising inflation, increased interest rates, and fluctuations in currency rates. We remain cautious in light of changing macroeconomic conditions and will continue to monitor potential impact on our operations. The implications of macroeconomic events on our business, results of operations and overall financial position remain uncertain.
There also have been recent changes to export control laws, trade regulations and other trade requirements. As of December 31, 2022 and through the date we filed this Annual Report, there have been a number of additional trade restrictions introduced. To date, those restrictions have had an immaterial impact on our revenue and operations. We will continue to monitor any changes to export control laws, trade regulations and other trade requirements and are committed to complying with all applicable trade laws, regulations and other requirements.
Cybersecurity Risk Management
We are committed to protecting our IT assets, including computers, systems, corporate networks and sensitive data, from unauthorized access or attack. We have established an internal global IT policy handbook as well as IT security management control procedures designed to:
| ● |
Create information security awareness and define responsibilities among our employees and business partners; |
| ● |
Implement controls to identify IT risks and monitor the use of our systems and information resources; |
| ● |
Establish key policies and processes to adequately and timely respond to security threats; |
| ● |
Maintain disaster recovery and business continuity plans; and |
| ● |
Ensure compliance with applicable laws and regulations regarding the management of information security. |
We require all new employees to attend an IT security training orientation. In addition, on a regular basis, our IT team updates training materials related to our policies and procedures and shares news and articles related to cybersecurity awareness, both of which are stored on our intranet and available to all employees. We also currently maintain an insurance policy that provides certain coverage for losses we incur due to data breaches and other cybersecurity incidents.
Our IT Steering Committee, which consists of our senior management and IT team, meets on a regular basis to review initiatives and projects to improve IT security, as well as resources and budgets for our cybersecurity compliance and education efforts. In 2021, we completed the ISO 27001 certification, a globally recognized information security standard.
Our Audit Committee of the Board of Directors, which consists of three independent members, is responsible for the oversight of our cybersecurity risk program. At least quarterly, the Audit Committee reviews reports and updates from our Chief Financial Officer and IT senior management about major risk exposures, their potential impact on our business operations, and management’s strategies to assess, monitor and mitigate those risks. The Audit Committee also provides updates of their oversight and findings to the Board of Directors.
We believe we have adequate resources and sufficient policies, procedures and oversight in place to identify and manage our IT security risks to our business operations. To date, we do not believe we have experienced any material information security breaches and have not incurred significant operating expenses related to information security breaches.
Critical Accounting Policies and Estimates
Our discussion and analysis of our financial condition and results of operations are based upon our consolidated financial statements, which have been prepared in accordance with generally accepted accounting principles in the United States (“GAAP”). The preparation of these financial statements requires us to make estimates and judgments that affect the reported amount of assets, liabilities, revenue and expenses, and related disclosure of contingent assets and liabilities. We evaluate our estimates on an on-going basis, including those related to revenue recognition, stock-based compensation, inventories, income taxes and contingencies. We base our estimates on historical experience and on various other assumptions that are believed to be reasonable under the circumstances, the results of which form the basis for making the judgments about the carrying values of assets and liabilities that are not readily apparent from other sources. Estimates and judgments used in the preparation of our financial statements are, by their nature, uncertain and unpredictable, and depend upon, among other things, many factors outside of our control, including demand for our products, economic conditions and other current and future events, such as macroeconomic factors, including the impact of the COVID-19 pandemic, the global economic downturn and the Russia-Ukraine conflict. Actual results could differ from these estimates and assumptions, and any such differences may be material to our consolidated financial statements. See Note 1 of the Notes to Consolidated Financial Statements included in Item 8 of this Annual Report on Form 10-K for a summary of significant accounting policies and the effect on our financial statements.
As of the date of issuance of these consolidated financial statements, we are not aware of any specific event or circumstance that would require our management to update the significant estimates and assumptions used in the preparation of the consolidated financial statements. As new events continue to evolve and additional information becomes available, any changes to these estimates and assumptions will be recognized in the consolidated financial statements as soon as they become known.
We believe the following critical accounting policies reflect our more significant judgments used in the preparation of our consolidated financial statements.
Revenue Recognition
We account for price adjustments and stock rotation rights as variable consideration that reduces the transaction price, and recognize that reduction in the same period the associated revenue is recognized. Four U.S.-based distributors have price adjustment rights when they sell our products to their end customers at a price that is lower than the distribution price invoiced by us. When we receive claims from the distributors that products have been sold to the end customers at the lower price, we issue the distributors credit memos for the price adjustments. We estimate the price adjustments using the expected value method based on an analysis of historical claims, at both the distributor and product level, as well as an assessment of any known trends of product sales mix.
Certain distributors have limited stock rotation rights that permit the return of a small percentage of the previous six months’ purchases in accordance with the contract terms. We estimate the stock rotation returns using the expected value method based on an analysis of historical returns, and the current level of inventory in the distribution channel.
Overall, our estimates of adjustments to contract price due to variable consideration have been materially consistent with actual results; however, these estimates are subject to management’s judgment and actual provisions could be different from our estimates and current provisions, resulting in future adjustments to our revenue and operating results.
Inventory Valuation
Inventories are stated at the lower of standard cost (which approximates actual cost determined on a first-in first-out basis) and estimated net realizable value. We write down excess and obsolete inventories based on their age and forecasted demand, which includes estimates taking into consideration our revenue forecast, outlook on market and economic conditions, technology changes, new product introductions and changes in strategic direction. If actual demand or market conditions are less favorable than those projected by management, additional inventory write-downs may be required. Conversely, if actual demand or market conditions are more favorable, inventories may be sold that were previously written down.
Accounting for Income Taxes
Our calculation of current and deferred tax assets and liabilities is based on certain estimates and judgments and involves dealing with uncertainties in the application of complex tax laws. Our estimates of current and deferred tax assets and liabilities may change based, in part, on added certainty, finality or uncertainty to an anticipated outcome, changes in accounting or tax laws in the U.S. or foreign jurisdictions where we operate, or changes in other facts or circumstances. In addition, we recognize liabilities for potential U.S. and foreign income tax for uncertain income tax positions taken on our tax returns if it has less than a 50% likelihood of being sustained. If we determine that payment of these amounts is unnecessary or if the recorded tax liability is less than our current assessment, we may be required to recognize an income tax benefit or additional income tax expense in our financial statements in the period such determination is made.
As of December 31, 2022 and 2021, we had a valuation allowance of $20.3 million and $19.5 million, respectively, attributable to management’s determination that it is more likely than not that certain deferred tax assets will not be fully realized. In the event we determine that it is more likely than not that we would be able to realize the deferred tax assets in the future in excess of our net recorded amount, an adjustment to the valuation allowance for the deferred tax assets would increase income in the period such determination was made. Likewise, should it be determined that additional amounts of the net deferred tax assets will not be realized in the future, an adjustment to increase the deferred tax assets valuation allowance will be charged to income in the period such determination is made.
Contingencies
We record a contingent liability related to pending legal and regulatory proceedings when it is probable that a loss has been incurred and the amount is reasonably estimable. Based on the facts and circumstances in each matter, the determination of such liability requires significant judgment. In determining the amount of a contingent loss, we take into account advice received from experts for each specific matter regarding the status of legal proceedings, settlement negotiations, prior case history and other factors. Should the judgments and estimates made by management need to be adjusted as additional information becomes available, we may need to record additional contingent losses that could materially and adversely impact our results of operations. Alternatively, if the judgments and estimates made by management are adjusted, for example, if a particular contingent loss does not occur, the contingent loss recorded would be reversed which could result in a favorable impact on our results of operations.
Stock-Based Compensation
For equity awards with performance conditions, as well as awards containing both market and performance conditions, we recognize compensation expense when it becomes probable that the performance goals will be achieved. Management performs the probability assessment on a quarterly basis by reviewing external factors, such as macroeconomic conditions and the analog industry revenue forecasts, and internal factors, such as our business and operational objectives and revenue forecasts. Changes in the probability assessment of achievement of the performance conditions are accounted for in the period of change by recording a cumulative catch-up adjustment as if the new estimate had been applied since the service inception date. If the projected achievement was revised upward or if the actual results were higher than the projected achievement, additional compensation expense would be recorded for the awards due to the cumulative catch-up adjustment, which would have an adverse impact on our results of operations. Conversely, if the projected achievement was revised downward or if the actual results were lower than the projected achievement, previously accrued compensation expense would be reversed for the awards, which would have a favorable impact on our results of operations. As a result, our stock-based compensation expense is subject to volatility and may fluctuate significantly each quarter due to changes in our probability assessment of achievement of the performance conditions or actual results being different from projections made by management.
Recent Accounting Pronouncements
See Note 1 of the Notes to Consolidated Financial Statements regarding accounting pronouncements not yet adopted as of December 31, 2022.
Results of Operations
The following table summarizes our results of operations:
| Year Ended December 31, |
||||||||||||||||||||||||
| 2022 |
2021 |
2020 |
||||||||||||||||||||||
| (in thousands, except percentages) |
||||||||||||||||||||||||
| Revenue |
$ | 1,794,148 | 100.0 | % |
$ | 1,207,798 | 100.0 | % |
$ | 844,452 | 100.0 | % |
||||||||||||
| Cost of revenue |
745,596 | 41.6 | 522,339 | 43.2 | 378,498 | 44.8 | ||||||||||||||||||
| Gross profit |
1,048,552 | 58.4 | 685,459 | 56.8 | 465,954 | 55.2 | ||||||||||||||||||
| Operating expenses: |
||||||||||||||||||||||||
| Research and development |
240,171 | 13.4 | 190,627 | 15.8 | 137,598 | 16.3 | ||||||||||||||||||
| Selling, general and administrative |
273,595 | 15.2 | 226,190 | 18.7 | 161,670 | 19.1 | ||||||||||||||||||
| Litigation expense, net |
8,001 | 0.4 | 6,225 | 0.6 | 7,804 | 1.0 | ||||||||||||||||||
| Total operating expenses |
521,767 | 29.0 | 423,042 | 35.1 | 307,072 | 36.4 | ||||||||||||||||||
| Operating income |
526,785 | 29.4 | 262,417 | 21.7 | 158,882 | 18.8 | ||||||||||||||||||
| Other income (expense), net |
(1,848 | ) | (0.1 | ) | 9,802 | 0.8 | 10,460 | 1.3 | ||||||||||||||||
| Income before income taxes |
524,937 | 29.3 | 272,219 | 22.5 | 169,342 | 20.1 | ||||||||||||||||||
| Income tax expense |
87,265 | 4.9 | 30,196 | 2.5 | 4,967 | 0.6 | ||||||||||||||||||
| Net income |
$ | 437,672 | 24.4 | % |
$ | 242,023 | 20.0 | % |
$ | 164,375 | 19.5 | % |
||||||||||||
Revenue
The following table summarizes our revenue by end market:
| Year Ended December 31, |
Change |
|||||||||||||||||||||||||||||||
| From | From | |||||||||||||||||||||||||||||||
| % of | % of | % of | 2021 to | 2020 to | ||||||||||||||||||||||||||||
| End Market |
2022 |
Revenue |
2021 |
Revenue |
2020 |
Revenue |
2022 |
2021 |
||||||||||||||||||||||||
| (in thousands, except percentages) |
||||||||||||||||||||||||||||||||
| Storage and Computing |
$ | 452,594 | 25.3 | % |
$ | 255,933 | 21.2 | % |
$ | 180,293 | 21.4 | % |
76.8 | % | 42.0 | % | ||||||||||||||||
| Enterprise Data |
251,415 | 14.0 | 116,345 | 9.6 | 72,884 | 8.6 | 116.1 | % | 59.6 | % | ||||||||||||||||||||||
| Automotive |
300,016 | 16.7 | 204,335 | 16.9 | 108,966 | 12.9 | 46.8 | % | 87.5 | % | ||||||||||||||||||||||
| Industrial |
219,179 | 12.2 | 184,784 | 15.3 | 119,603 | 14.2 | 18.6 | % | 54.5 | % | ||||||||||||||||||||||
| Communications |
251,452 | 14.0 | 164,091 | 13.6 | 142,326 | 16.8 | 53.2 | % | 15.3 | % | ||||||||||||||||||||||
| Consumer |
319,492 | 17.8 | 282,310 | 23.4 | 220,380 | 26.1 | 13.2 | % | 28.1 | % | ||||||||||||||||||||||
| Total |
$ | 1,794,148 | 100.0 | % |
$ | 1,207,798 | 100.0 | % |
$ | 844,452 | 100.0 | % |
48.5 | % | 43.0 | % | ||||||||||||||||
Revenue for the year ended December 31, 2022 was $1,794.1 million, an increase of $586.3 million, or 48.5%, from $1,207.8 million for the year ended December 31, 2021. The increase in revenue was primarily due to increases in the average selling prices resulting primarily from the sale of higher value products and increases in shipment volume.
For the year ended December 31, 2022, revenue from the storage and computing market increased $196.7 million, or 76.8%, from the same period in 2021. This increase was primarily driven by strong sales growth for storage applications and enterprise notebooks. Revenue from the enterprise data market increased $135.1 million, or 116.1%, from the same period in 2021. This increase was primarily due to higher sales of our power management solutions for cloud-based CPU and GPU server applications. Revenue from the automotive market increased $95.7 million, or 46.8%, from the same period in 2021. This increase was primarily due to increased sales of our highly integrated applications supporting automated driver assistance systems, digital cockpits and connectivity. Revenue from the industrial market increased $34.4 million, or 18.6%, from the same period in 2021. This increase was primarily due to higher sales in applications for smart meters and industrial automation. Revenue from the communications market increased $87.4 million, or 53.2%, from the same period in 2021. The increase was primarily due to higher sales of products for both 5G and satellite communications infrastructure applications. Revenue from the consumer market increased $37.2 million, or 13.2%, from the same period in 2021. This increase was primarily driven by increased sales for home appliances, gaming consoles and smart TVs.
Cost of Revenue and Gross Margin
Cost of revenue primarily consists of costs incurred to manufacture, assemble and test our products, as well as warranty costs, inventory-related and other overhead costs, and stock-based compensation expenses.
| Year Ended December 31, |
Change |
|||||||||||||||||||
| From 2021 to | From 2020 to | |||||||||||||||||||
| 2022 |
2021 |
2020 |
2022 |
2021 |
||||||||||||||||
| (in thousands, except percentages) |
||||||||||||||||||||
| Cost of revenue |
$ | 745,596 | $ | 522,339 | $ | 378,498 | 42.7 | % | 38.0 | % | ||||||||||
| As a percentage of revenue |
41.6 | % | 43.2 | % | 44.8 | % | ||||||||||||||
| Gross profit |
$ | 1,048,552 | $ | 685,459 | $ | 465,954 | 53.0 | % | 47.1 | % | ||||||||||
| Gross margin |
58.4 | % | 56.8 | % | 55.2 | % | ||||||||||||||
Cost of revenue was $745.6 million, or 41.6% of revenue, for the year ended December 31, 2022, and $522.3 million, or 43.2% of revenue, for the year ended December 31, 2021. The $223.3 million increase in cost of revenue was primarily due to increased shipment volume, product mix, increases in manufacturing overhead costs and increased input cost.
Gross margin was 58.4% for the year ended December 31, 2022, compared with 56.8% for the year ended December 31, 2021. The increase in gross margin was mainly driven by lower warranty expenses as a percentage of revenue and a favorable product mix.
Research and Development (“R&D”)
R&D expenses primarily consist of salary and benefit expenses, bonuses, stock-based compensation and deferred compensation for design and product engineers, expenses related to new product development and supplies, and facility costs.
| Year Ended December 31, |
Change |
|||||||||||||||||||
| From 2021 to | From 2020 to | |||||||||||||||||||
| 2022 |
2021 |
2020 |
2022 |
2021 |
||||||||||||||||
| (in thousands, except percentages) |
||||||||||||||||||||
| R&D expenses |
$ | 240,171 | $ | 190,627 | $ | 137,598 | 26.0 | % | 38.5 | % | ||||||||||
| As a percentage of revenue |
13.4 | % | 15.8 | % | 16.3 | % | ||||||||||||||
R&D expenses were $240.2 million, or 13.4% of revenue, for the year ended December 31, 2022, and $190.6 million, or 15.8% of revenue, for the year ended December 31, 2021. The $49.6 million increase in R&D expenses was primarily due to an increase of $40.1 million in cash compensation expenses, which include salary, benefits and bonuses, and an increase of $9.3 million in stock-based compensation expenses, which were mainly associated with performance-based equity awards. The increase was partially offset by a $4.7 million benefit related to changes in the value of deferred compensation plan liabilities. Our R&D headcount was 1,328 employees as of December 31, 2022, compared with 1,087 employees as of December 31, 2021.
Selling, General and Administrative (“SG&A”)
SG&A expenses primarily include salary and benefit expenses, bonuses, stock-based compensation and deferred compensation for sales, marketing and administrative personnel, sales commissions, travel expenses, facilities costs, and professional service fees.
| Year Ended December 31, |
Change |
|||||||||||||||||||
| From 2021 to | From 2020 to | |||||||||||||||||||
| 2022 |
2021 |
2020 |
2022 |
2021 |
||||||||||||||||
| (in thousands, except percentages) |
||||||||||||||||||||
| SG&A expenses |
$ | 273,595 | $ | 226,190 | $ | 161,670 | 21.0 | % | 39.9 | % | ||||||||||
| As a percentage of revenue |
15.2 | % | 18.7 | % | 19.1 | % | ||||||||||||||
SG&A expenses were $273.6 million, or 15.2% of revenue, for the year ended December 31, 2022, and $226.2 million, or 18.7% of revenue, for the year ended December 31, 2021. The $47.4 million increase in SG&A expenses was primarily due to an increase of $27.0 million in stock-based compensation expenses, which were mainly associated with performance-based equity awards, and $20.7 million in cash compensation expenses, which include salary, benefits and bonuses. The increase was partially offset by a $7.2 million benefit related to changes in the value of deferred compensation plan liabilities. Our SG&A headcount was 780 employees as of December 31, 2022, compared with 688 employees as of December 31, 2021.
Litigation Expense, Net
Litigation expense was $8.0 million for the year ended December 31, 2022, compared with litigation expense, net, of $6.2 million for the year ended December 31, 2021. The expense for both periods was attributable to litigation activity related to ongoing patent infringement and other matters.
Other Income (Expense), Net
Other expense, net, was $1.8 million for the year ended December 31, 2022, compared with other income, net, of $9.8 million for the year ended December 31, 2021. The increase in other expense was primarily due to an increase of $11.2 million in expense related to changes in the value of deferred compensation plan investments and an increase of $4.4 million in charitable contributions, which was partially offset by an increase of $3.0 million in net interest income.
Income Tax Expense
The income tax expense for the year ended December 31, 2022 was $87.3 million, or 16.6% of pre-tax income. The effective tax rate was lower than the federal statutory rate primarily due to foreign income from our subsidiaries in Bermuda and China being taxed at lower statutory tax rates, and excess tax benefits from stock-based compensation. The decrease in the effective tax rate relative to the federal statutory rate was partially offset by the inclusion of the global intangible low-taxed income (“GILTI”) tax.
The income tax expense for the year ended December 31, 2021 was $30.2 million, or 11.1% of pre-tax income. The effective tax rate was lower than the federal statutory rate primarily due to foreign income from our subsidiaries in Bermuda and China being taxed at lower statutory tax rates. The decrease in the effective tax rate relative to the federal statutory rate was partially offset by the inclusion of the GILTI tax.
The increase in the effective tax rate for the year ended December 31, 2022 compared to the prior period was primarily due to an increase in GILTI inclusion due to the capitalization of research and experimental expenditures under Section 174 of the Internal Revenue Code (the “IRC”) and lower excess tax benefits from stock-based compensation. The increase was partially offset by higher foreign income from our subsidiaries in Bermuda and China taxed at lower statutory tax rates.
In August 2022, the CHIPS Act and the Inflation Reduction Act of 2022 (the “IRA”) were enacted and signed into law, which did not have a material impact on our income tax provisions, results of operations or financial condition for the year ending December 31, 2022. We will continue to monitor any new developments related to the CHIPS Act and the IRA and evaluate their impact on our financial statements.
See Note 11 of the Notes to Consolidated Financial Statements for further discussion.
Liquidity and Capital Resources
| December 31, |
||||||||
| 2022 |
2021 |
|||||||
| (in thousands, except percentages) |
||||||||
| Cash and cash equivalents |
$ | 288,607 | $ | 189,265 | ||||
| Short-term investments |
449,266 | 535,817 | ||||||
| Total cash, cash equivalents and short-term investments |
$ | 737,873 | $ | 725,082 | ||||
| Percentage of total assets |
35.8 | % | 45.7 | % | ||||
| Total current assets |
$ | 1,410,619 | $ | 1,124,852 | ||||
| Total current liabilities |
(263,400 | ) | (226,944 | ) | ||||
| Working capital |
$ | 1,147,219 | $ | 897,908 | ||||
As of December 31, 2022, we had cash and cash equivalents of $288.6 million and short-term investments of $449.3 million, compared with cash and cash equivalents of $189.3 million and short-term investments of $535.8 million as of December 31, 2021. As of December 31, 2022, $253.8 million of cash and cash equivalents and $270.4 million of short-term investments were held by our international subsidiaries. We have and may continue to repatriate cash from our Bermuda subsidiary to fund our expenditures in future periods. We anticipate that earnings from other foreign subsidiaries will continue to be indefinitely reinvested.
Summary of Cash Flows
The following table summarizes our cash flow activities:
| Year Ended December 31, |
||||||||||||
| 2022 |
2021 |
2020 |
||||||||||
| (in thousands) |
||||||||||||
| Net cash provided by operating activities |
$ | 246,674 | $ | 320,010 | $ | 267,803 | ||||||
| Net cash used in investing activities |
(12,510 | ) | (378,886 | ) | (39,177 | ) | ||||||
| Net cash used in financing activities |
(128,785 | ) | (90,206 | ) | (71,557 | ) | ||||||
| Effect of change in exchange rates |
(6,039 | ) | 3,400 | 4,926 | ||||||||
| Net increase (decrease) in cash, cash equivalents and restricted cash |
$ | 99,340 | $ | (145,682 | ) | $ | 161,995 | |||||
For the year ended December 31, 2022, the $73.3 million decrease in cash provided by operating activities compared to the prior period was primarily due to changes in operating assets and liabilities, in particular, inventories and prepaid wafer purchases, partially offset by an increase of $195.6 million in net income and an increase of $37.5 million in stock-based compensation expenses.
For the year ended December 31, 2022, the $366.4 million decrease in cash used in investing activities compared to the prior period was primarily due to a $331.2 million decrease in purchases of short-term investments and a $35.6 million decrease in capital expenditures.
For the year ended December 31, 2022, the $38.6 million increase in cash used in financing activities compared to the prior period was primarily due to a $28.6 million increase in dividend and dividend equivalent payments and a $12.0 million decrease in proceeds from common stock issued under the employee equity incentive plan.
In the future, in order to strengthen our financial position, respond to adverse developments, changes in our circumstance or unforeseen events or conditions, or fund our growth, we may need to raise additional funds by any one or a combination of the following: issuing equity securities, issuing debt or convertible debt securities, incurring indebtedness secured by our assets, or selling certain product lines and/or portions of our business. There can be no guarantee that we will be able to raise additional funds on terms acceptable to us, or at all.
From time to time, we have engaged in discussions with third parties concerning capital investments and potential acquisitions of product lines, technologies, businesses and companies, and we continue to consider potential investments and acquisition candidates. Any such transactions could involve the issuance of a significant number of new equity securities, assumptions of debt, and/or payment of cash consideration. We may also be required to raise additional funds to complete any such investments or acquisitions, through either the issuance of equity and/or debt securities or incurring indebtedness secured by our assets. If we raise additional funds or acquire businesses or technologies through the issuance of equity securities or convertible debt securities, our existing stockholders may experience significant dilution.
Cash Requirements
Although consequences of economic uncertainty and macroeconomic conditions and other factors could adversely affect our liquidity and capital resources in the future, and cash requirements may fluctuate based on the timing and extent of many factors such as those discussed above, we believe that our balances of cash, cash equivalents and short-term investments of $737.9 million as of December 31, 2022, along with cash generated by ongoing operations, will be sufficient to satisfy our liquidity requirements for the next 12 months and beyond.
Our material cash requirements include the following contractual and other obligations:
Purchase Obligations
Purchase obligations represent our obligations with our suppliers and other parties that require the purchases of goods or services, which primarily consist of wafer and other inventory purchases, assembly and other manufacturing services, construction of manufacturing and R&D facilities, purchases of production and other equipment, and license arrangements.
In May 2022, we entered into a long-term supply agreement in order to secure manufacturing production capacity for silicon wafers over a four-year period. As of December 31, 2022, the Company had made prepayments under this agreement of $170.0 million.
As of December 31, 2022, total estimated future unconditional purchase commitments to all suppliers and other parties were $1.1 billion, of which $455.4 million was short-term.
Transition Tax Liability
The transition tax liability represents the one-time, mandatory deemed repatriation tax imposed on previously deferred foreign earnings under the U.S. Tax Cuts and Jobs Act enacted in December 2017 (“2017 Tax Act”). As permitted by the 2017 Tax Act, we have elected to pay the tax liability in installments on an interest-free basis through 2025. As of December 31, 2022, the remaining liability totaled $14.8 million, of which $3.7 million was short-term.
Operating Leases
Operating lease obligations represent the undiscounted remaining lease payments primarily for our leased facilities and equipment. As of December 31, 2022, these obligations totaled $3.8 million, of which $2.1 million was short-term.
Dividends
We currently have a dividend program approved by our Board of Directors, pursuant to which we intend to pay quarterly cash dividends on our common stock. Based on our historical practice, stockholders of record as of the last business day of the quarter are entitled to receive the quarterly cash dividends when and if declared by the Board of Directors, which are payable to the stockholders in the following month. As of December 31, 2022, accrued dividends totaled $35.3 million. The declaration of any future cash dividends is at the discretion of our Board of Directors and will depend on, among other things, our financial condition, results of operations, capital requirements, business conditions and other factors that our Board of Directors may deem relevant, as well as a determination that cash dividends are in the best interests of our stockholders.
In February 2023, our Board of Directors approved an increase in the quarterly cash dividend from $0.75 per share to $1.00 per share, which amount will be paid on April 14, 2023 to all stockholders of record as of the close of business on March 31, 2023.
Other Long-Term Obligations
Other long-term obligations primarily include payments for deferred compensation plan liabilities and accrued dividend equivalents. As of December 31, 2022, these obligations totaled $71.7 million.
| Quantitative and Qualitative Disclosures about Market Risk |
Interest Rate Risk
Our cash equivalents and short-term investments are subject to market risk, primarily interest rate and credit risk. Our investments are managed by outside professional managers within investment guidelines set by management and approved by the Audit Committee of the Board of Directors. Such guidelines include security type, credit quality and maturity and are intended to limit market risk by restricting our investments to high quality debt instruments with relatively short-term maturities. Based on our investment positions as of December 31, 2022, the impact of changes in interest rates on our interest income was immaterial.
Investments in debt securities are classified as available-for-sale, which are reported at fair value with the unrealized gains or losses being included in accumulated other comprehensive income (loss) on the Consolidated Balance Sheets. When the fair value of an investment is below its amortized cost basis, unrealized losses due to changes in interest rates (i.e., non-credit loss factors) are not recognized in our results of operations unless we have the intent to sell the securities or it is more likely than not that we will be required to sell the securities before recovery of the entire amortized cost basis. Based on our investment positions as of December 31, 2022, a hypothetical 100 basis point increase in interest rates would result in a $3.2 million decline in the fair value of our investments. Any losses resulting from such interest rate changes would only be realized if we sold the investments prior to maturity.
We do not use derivative financial instruments in our investment portfolio.
Foreign Currency Exchange Risk
Our sales outside the United States are primarily transacted in U.S. dollars through our subsidiary in Bermuda. Accordingly, our sales are not generally impacted by foreign currency rate changes. The functional currency of our offshore operations is generally the local currency, primarily including the Renminbi, the New Taiwan Dollar and the Euro. We incur foreign currency exchange gains or losses related to certain transactions, including intercompany transactions between the U.S. and our foreign subsidiaries, that are denominated in a currency other than the functional currency. Gains or losses from the remeasurement and settlement of the balances are reported in other income (expense), net, on the Consolidated Statements of Operations. Fluctuations in foreign currency exchange rates have not had a material impact on our results of operations for the periods presented.
| Financial Statements and Supplementary Data |
MONOLITHIC POWER SYSTEMS, INC.
CONSOLIDATED FINANCIAL STATEMENTS
Contents
| Page | |
| Reports of Independent Registered Public Accounting Firm (PCAOB ID: | 41 |
| 43 | |
| 44 | |
| 45 | |
| 46 | |
| 47 | |
| 48 |
Report of Independent Registered Public Accounting Firm
To the Stockholders and the Board of Directors of Monolithic Power Systems, Inc.
Opinion on the Financial Statements
We have audited the accompanying consolidated balance sheets of Monolithic Power Systems, Inc. (the Company) as of December 31, 2022 and 2021, the related consolidated statements of operations, comprehensive income, stockholders’ equity and cash flows for each of the three years in the period ended December 31, 2022, and the related notes (collectively referred to as the “consolidated financial statements”). In our opinion, the consolidated financial statements present fairly, in all material respects, the financial position of the Company at December 31, 2022 and 2021, and the results of its operations and its cash flows for each of the three years in the period ended December 31, 2022, in conformity with U.S. generally accepted accounting principles.
We also have audited, in accordance with the standards of the Public Company Accounting Oversight Board (United States) (PCAOB), the Company’s internal control over financial reporting as of December 31, 2022, based on criteria established in Internal Control - Integrated Framework issued by the Committee of Sponsoring Organizations of the Treadway Commission (2013 framework) and our report dated February 24, 2023 expressed an unqualified opinion thereon.
Basis for Opinion
These financial statements are the responsibility of the Company’s management. Our responsibility is to express an opinion on the Company’s financial statements based on our audits. We are a public accounting firm registered with the PCAOB and are required to be independent with respect to the Company in accordance with the U.S. federal securities laws and the applicable rules and regulations of the Securities and Exchange Commission and the PCAOB.
We conducted our audits in accordance with the standards of the PCAOB. Those standards require that we plan and perform the audit to obtain reasonable assurance about whether the financial statements are free of material misstatement, whether due to error or fraud. Our audits included performing procedures to assess the risks of material misstatement of the financial statements, whether due to error or fraud, and performing procedures that respond to those risks. Such procedures included examining, on a test basis, evidence regarding the amounts and disclosures in the financial statements. Our audits also included evaluating the accounting principles used and significant estimates made by management, as well as evaluating the overall presentation of the financial statements. We believe that our audits provide a reasonable basis for our opinion.
Critical Audit Matter
The critical audit matter communicated below is a matter arising from the current period audit of the financial statements that was communicated or required to be communicated to the audit committee and that: (1) relates to accounts or disclosures that are material to the financial statements and (2) involved our especially challenging, subjective, or complex judgments. The communication of the critical audit matter does not alter in any way our opinion on the consolidated financial statements, taken as a whole, and we are not, by communicating the critical audit matter below, providing a separate opinion on the critical audit matter or on the accounts or disclosures to which it relates.
| Inventory Valuation | ||
| Description of the Matter | The Company’s inventories totaled $447.3 million as of December 31, 2022, representing 21.7% of total assets. As explained in Note 1 to the consolidated financial statements, the Company values inventories at the lower of standard cost (which approximates actual cost determined on a first-in first-out basis) and estimated net realizable value in each reporting period. Excess and obsolete inventory is written down to its estimated net realizable value if less than cost. | |
| Auditing management’s estimates for excess and obsolete inventory involved subjective auditor judgment because management’s assessment of whether a write down is required and the measurement of any excess of cost over net realizable value is judgmental and considers a number of qualitative factors that are affected by market and economic conditions outside the Company’s control. In particular, the excess and obsolete inventory calculations are sensitive to significant assumptions, including demand for the Company’s products, which considers adjustments to sales forecasts for specific product considerations, including but not limited to new product launches and expected industry sales growth. |
| How We Addressed the Matter in Our Audit | We obtained an understanding, evaluated the design, and tested the operating effectiveness of internal controls over the Company's excess and obsolete inventory write down process. This included controls over management’s assessment of inventory valuation, including the determination of forecasted usage of inventories. | |
| Our substantive audit procedures included, among others, evaluating the significant assumptions stated above and testing the completeness and accuracy of the underlying data used in management’s excess and obsolete inventory valuation assessment. We evaluated inventory levels compared to forecasted product demand, historical sales and specific product considerations. We also assessed the historical accuracy of management’s estimates and performed sensitivity analyses over the significant assumptions to evaluate the changes in the excess and obsolete inventory estimates that would result from changes in the underlying assumptions. |
/s/ Ernst & Young LLP
We have served as the Company's auditor since 2019.
San Jose, California
February 24, 2023
Report of Independent Registered Public Accounting Firm
To the Stockholders and the Board of Directors of Monolithic Power Systems, Inc.
Opinion on Internal Control Over Financial Reporting
We have audited Monolithic Power Systems, Inc.’s internal control over financial reporting as of December 31, 2022, based on criteria established in Internal Control – Integrated Framework issued by the Committee of Sponsoring Organizations of the Treadway Commission (2013 framework) (the COSO criteria). In our opinion, Monolithic Power Systems, Inc. (the Company) maintained, in all material respects, effective internal control over financial reporting as of December 31, 2022, based on the COSO criteria.
We also have audited, in accordance with the standards of the Public Company Accounting Oversight Board (United States) (PCAOB), the consolidated balance sheets of the Company as of December 31, 2022 and 2021, the related consolidated statements of operations, comprehensive income, stockholders’ equity and cash flows for each of the three years in the period ended December 31, 2022, and the related notes and our report dated February 24, 2023 expressed an unqualified opinion thereon.
Basis for Opinion
The Company’s management is responsible for maintaining effective internal control over financial reporting and for its assessment of the effectiveness of internal control over financial reporting included in the accompanying Management’s Report on Internal Control over Financial Reporting. Our responsibility is to express an opinion on the Company’s internal control over financial reporting based on our audit. We are a public accounting firm registered with the PCAOB and are required to be independent with respect to the Company in accordance with the U.S. federal securities laws and the applicable rules and regulations of the Securities and Exchange Commission and the PCAOB.
We conducted our audit in accordance with the standards of the PCAOB. Those standards require that we plan and perform the audit to obtain reasonable assurance about whether effective internal control over financial reporting was maintained in all material respects.
Our audit included obtaining an understanding of internal control over financial reporting, assessing the risk that a material weakness exists, testing and evaluating the design and operating effectiveness of internal control based on the assessed risk, and performing such other procedures as we considered necessary in the circumstances. We believe that our audit provides a reasonable basis for our opinion.
Definition and Limitations of Internal Control Over Financial Reporting
A company’s internal control over financial reporting is a process designed to provide reasonable assurance regarding the reliability of financial reporting and the preparation of financial statements for external purposes in accordance with generally accepted accounting principles. A company’s internal control over financial reporting includes those policies and procedures that (1) pertain to the maintenance of records that, in reasonable detail, accurately and fairly reflect the transactions and dispositions of the assets of the company; (2) provide reasonable assurance that transactions are recorded as necessary to permit preparation of financial statements in accordance with generally accepted accounting principles, and that receipts and expenditures of the company are being made only in accordance with authorizations of management and directors of the company; and (3) provide reasonable assurance regarding prevention or timely detection of unauthorized acquisition, use, or disposition of the company’s assets that could have a material effect on the financial statements.
Because of its inherent limitations, internal control over financial reporting may not prevent or detect misstatements. Also, projections of any evaluation of effectiveness to future periods are subject to the risk that controls may become inadequate because of changes in conditions, or that the degree of compliance with the policies or procedures may deteriorate.
/s/
February 24, 2023
MONOLITHIC POWER SYSTEMS, INC.
CONSOLIDATED BALANCE SHEETS
(in thousands, except par value)
| December 31, | ||||||||
| 2022 | 2021 | |||||||
| ASSETS | ||||||||
| Current assets: | ||||||||
| Cash and cash equivalents | $ | $ | ||||||
| Short-term investments | ||||||||
| Accounts receivable, net | ||||||||
| Inventories | ||||||||
| Other current assets | ||||||||
| Total current assets | ||||||||
| Property and equipment, net | ||||||||
| Goodwill | ||||||||
| Deferred tax assets, net | ||||||||
| Other long-term assets | ||||||||
| Total assets | $ | $ | ||||||
| LIABILITIES AND STOCKHOLDERS’ EQUITY | ||||||||
| Current liabilities: | ||||||||
| Accounts payable | $ | $ | ||||||
| Accrued compensation and related benefits | ||||||||
| Other accrued liabilities | ||||||||
| Total current liabilities | ||||||||
| Income tax liabilities | ||||||||
| Other long-term liabilities | ||||||||
| Total liabilities | ||||||||
| Commitments and contingencies | ||||||||
| Stockholders’ equity: | ||||||||
| Common stock and additional paid-in capital: $ par value; shares authorized: ; shares issued and outstanding: and , respectively | ||||||||
| Retained earnings | ||||||||
| Accumulated other comprehensive income (loss) | ( | ) | ||||||
| Total stockholders’ equity | ||||||||
| Total liabilities and stockholders’ equity | $ | $ | ||||||
See accompanying notes to consolidated financial statements.
MONOLITHIC POWER SYSTEMS, INC.
CONSOLIDATED STATEMENTS OF OPERATIONS
(in thousands, except per share amounts)
| Year Ended December 31, |
||||||||||||
| 2022 |
2021 |
2020 |
||||||||||
| Revenue |
$ | $ | $ | |||||||||
| Cost of revenue |
||||||||||||
| Gross profit |
||||||||||||
| Operating expenses: |
||||||||||||
| Research and development |
||||||||||||
| Selling, general and administrative |
||||||||||||
| Litigation expense, net |
||||||||||||
| Total operating expenses |
||||||||||||
| Operating income |
||||||||||||
| Other income (expense), net |
( |
) | ||||||||||
| Income before income taxes |
||||||||||||
| Income tax expense |
||||||||||||
| Net income |
$ | $ | $ | |||||||||
| Net income per share: |
||||||||||||
| Basic |
$ | $ | $ | |||||||||
| Diluted |
$ | $ | $ | |||||||||
| Weighted-average shares outstanding: |
||||||||||||
| Basic |
||||||||||||
| Diluted |
||||||||||||
See accompanying notes to consolidated financial statements.
MONOLITHIC POWER SYSTEMS, INC.
CONSOLIDATED STATEMENTS OF COMPREHENSIVE INCOME
(in thousands)
| Year Ended December 31, | ||||||||||||
| 2022 | 2021 | 2020 | ||||||||||
| Net income | $ | $ | $ | |||||||||
| Other comprehensive income (loss), net of tax: | ||||||||||||
| Foreign currency translation adjustments | ( | ) | ||||||||||
| Change in unrealized gain (loss) on available-for-sale securities, net of tax of $, $ and $, respectively | ( | ) | ( | ) | ||||||||
| Other comprehensive income (loss), net of tax | ( | ) | ||||||||||
| Comprehensive income | $ | $ | $ | |||||||||
See accompanying notes to consolidated financial statements.
MONOLITHIC POWER SYSTEMS, INC.
CONSOLIDATED STATEMENTS OF STOCKHOLDERS’ EQUITY
(in thousands, except per share amounts)
| Accumulated | ||||||||||||||||||||||||
| Common Stock and | Other | Total | ||||||||||||||||||||||
| Additional Paid-in Capital | Retained | Comprehensive | Stockholders’ | |||||||||||||||||||||
| Shares | Amount | Earnings | Income (Loss) | Equity | ||||||||||||||||||||
| Balance as of January 1, 2020 |
| $ |
| $ |
| $ | ( | ) |
| $ | ||||||||||||||
| Net income | - | |||||||||||||||||||||||
| Other comprehensive income | - | |||||||||||||||||||||||
| Dividends and dividend equivalents declared ($ per share) | - | ( | ) | ( | ) | |||||||||||||||||||
| Common stock issued under the employee equity incentive plan | ||||||||||||||||||||||||
| Common stock issued under the employee stock purchase plan | ||||||||||||||||||||||||
| Stock-based compensation expense | - | |||||||||||||||||||||||
| Balance as of December 31, 2020 | ||||||||||||||||||||||||
| Net income | - | |||||||||||||||||||||||
| Other comprehensive income | - | |||||||||||||||||||||||
| Dividends and dividend equivalents declared ($ per share) | - | ( | ) | ( | ) | |||||||||||||||||||
| Common stock issued under the employee equity incentive plan | ||||||||||||||||||||||||
| Common stock issued under the employee stock purchase plan | ||||||||||||||||||||||||
| Stock-based compensation expense | - | |||||||||||||||||||||||
| Balance as of December 31, 2021 | ||||||||||||||||||||||||
| Net income | - | |||||||||||||||||||||||
| Other comprehensive loss | - | ( | ) | ( | ) | |||||||||||||||||||
| Dividends and dividend equivalents declared ($ per share) | - | ( | ) | ( | ) | |||||||||||||||||||
| Common stock issued under the employee equity incentive plan | ||||||||||||||||||||||||
| Common stock issued under the employee stock purchase plan | ||||||||||||||||||||||||
| Stock-based compensation expense | - | |||||||||||||||||||||||
| Balance as of December 31, 2022 | $ | $ | $ | ( | ) | $ | ||||||||||||||||||
See accompanying notes to consolidated financial statements.
MONOLITHIC POWER SYSTEMS, INC.
CONSOLIDATED STATEMENTS OF CASH FLOWS
(in thousands)
| Year Ended December 31, | ||||||||||||
| 2022 | 2021 | 2020 | ||||||||||
| Cash flows from operating activities: | ||||||||||||
| Net income | $ | $ | $ | |||||||||
| Adjustments to reconcile net income to net cash provided by operating activities: | ||||||||||||
| Depreciation and amortization | ||||||||||||
| Amortization of premium on available-for-sale securities | ||||||||||||
| Loss (gain) on deferred compensation plan investments | ( | ) | ( | ) | ||||||||
| Deferred taxes, net | ( | ) | ( | ) | ( | ) | ||||||
| Stock-based compensation expense | ||||||||||||
| Other | ( | ) | ||||||||||
| Changes in operating assets and liabilities: | ||||||||||||
| Accounts receivable | ( | ) | ( | ) | ( | ) | ||||||
| Inventories | ( | ) | ( | ) | ( | ) | ||||||
| Other assets | ( | ) | ( | ) | ( | ) | ||||||
| Accounts payable | ( | ) | ||||||||||
| Accrued compensation and related benefits | ||||||||||||
| Income tax liabilities | ||||||||||||
| Other accrued liabilities | ||||||||||||
| Net cash provided by operating activities | ||||||||||||
| Cash flows from investing activities: | ||||||||||||
| Purchases of property and equipment | ( | ) | ( | ) | ( | ) | ||||||
| Purchases of short-term investments | ( | ) | ( | ) | ( | ) | ||||||
| Maturities and sales of short-term investments | ||||||||||||
| Purchases of long-term investments | ( | ) | ( | ) | ||||||||
| Sales of long-term investments | ||||||||||||
| Contributions to deferred compensation plan, net | ( | ) | ( | ) | ( | ) | ||||||
| Purchases of intangible assets | ( | ) | ||||||||||
| Net cash used in investing activities | ( | ) | ( | ) | ( | ) | ||||||
| Cash flows from financing activities: | ||||||||||||
| Property and equipment purchased on extended payment terms | ( | ) | ( | ) | ( | ) | ||||||
| Proceeds from common stock issued under the employee equity incentive plan | ||||||||||||
| Proceeds from common stock issued under the employee stock purchase plan | ||||||||||||
| Dividends and dividend equivalents paid | ( | ) | ( | ) | ( | ) | ||||||
| Net cash used in financing activities | ( | ) | ( | ) | ( | ) | ||||||
| Effect of change in exchange rates | ( | ) | ||||||||||
| Net increase (decrease) in cash, cash equivalents and restricted cash | ( | ) | ||||||||||
| Cash, cash equivalents and restricted cash, beginning of period | ||||||||||||
| Cash, cash equivalents and restricted cash, end of period | $ | $ | $ | |||||||||
| Supplemental disclosures for cash flow information: | ||||||||||||
| Cash paid for taxes | $ | $ | $ | |||||||||
| Non-cash investing and financing activities: | ||||||||||||
| Liability accrued for property and equipment purchases | $ | $ | $ | |||||||||
| Liability accrued for dividends and dividend equivalents | $ | $ | $ | |||||||||
See accompanying notes to consolidated financial statements.
MONOLITHIC POWER SYSTEMS, INC.
NOTES TO CONSOLIDATED FINANCIAL STATEMENTS
1. SUMMARY OF SIGNIFICANT ACCOUNTING POLICIES
Business
Monolithic Power Systems, Inc. (the “Company”) was incorporated in the State of California on August 22, 1997. On November 17, 2004, the Company was reincorporated in the State of Delaware. MPS designs, develops and markets high-performance, semiconductor-based power electronic solutions. MPS’s mission is to provide innovative power solutions in the storage and computing, enterprise data, automotive, industrial, communications and consumer markets.
Basis of Presentation
The consolidated financial statements include the accounts of the Company and its wholly-owned subsidiaries. Intercompany accounts and transactions have been eliminated in consolidation.
Use of Estimates
The preparation of financial statements in conformity with GAAP requires management to make estimates and assumptions that affect the reported amounts of assets and liabilities and disclosure of contingent assets and liabilities at the date of the financial statements, and reported amounts of revenue and expenses during the reporting period. Significant estimates and assumptions used in these consolidated financial statements primarily include those related to revenue recognition, inventory valuation, valuation of share-based awards, contingencies and income tax valuation allowances. Actual results could differ from these estimates and assumptions, and any such differences may be material to the Company’s consolidated financial statements.
Certain Significant Risks and Uncertainties
Financial instruments which potentially subject the Company to concentrations of credit risk consist primarily of cash equivalents, short-term and long-term investments and accounts receivable. The Company’s cash equivalents include short-term, highly liquid investments purchased with remaining maturities at the date of purchase of three months or less. The Company’s short-term investments may consist of corporate debt securities, certificates of deposit, commercial paper and government agency bonds and treasuries, and the long-term investments consist of government-backed student loan auction-rate securities and non-marketable equity investments.
The Company does not require its customers to provide collateral to support accounts receivable. The Company assesses the collectability by reviewing accounts receivable on a customer-by-customer basis. To manage credit risk, management performs ongoing credit evaluations of the customers’ financial condition, monitors payment performance, and assesses current economic conditions, as well as reasonable and supportable forecasts of future economic conditions, that may affect collectability of the outstanding receivables. For certain high-risk customers, the Company requires standby letters of credit or advance payment prior to shipments of goods.
The Company participates in the dynamic high technology industry and believes that changes in any of the following areas could have a material adverse effect on its future financial position, results of operations or cash flows: advances and trends in new technologies and industry standards; competitive pressures in the form of new products or price reductions on current products; changes in product mix; changes in the overall demand for products offered by the Company; changes in third-party manufacturers or the terms of such arrangements; changes in key suppliers; changes in certain strategic relationships or customer relationships; litigation or claims against the Company based on intellectual property, patent, product, regulatory or other factors; fluctuations in foreign currency exchange rates; risk associated with changes in government policies and regulations on trade restrictions and corporate taxes; availability of necessary components or sub-assemblies; availability of foundry capacity; ability to integrate acquired companies; and the Company’s ability to attract and retain employees necessary to support its growth.
Foreign Currency
In general, the functional currency of the Company’s international subsidiaries is the local currency. The primary subsidiaries are located in China, Taiwan and Europe, which utilize the Renminbi, the New Taiwan Dollar and the Euro as their currencies, respectively. Accordingly, assets and liabilities of the foreign subsidiaries are translated using exchange rates in effect at the end of the period. Revenue and costs are translated using average exchange rates for the period. The resulting translation adjustments are recorded in accumulated other comprehensive income (loss) on the Consolidated Balance Sheets.
In addition, the Company incurs foreign currency exchange gains or losses related to certain transactions, including intercompany transactions, that are denominated in a currency other than the functional currency. In connection with the remeasurement and settlement of the balances, the Company recorded foreign currency exchange gain (loss) of $
For intercompany transactions that are of a long-term investment nature, the Company records the foreign currency exchange gains and losses in accumulated other comprehensive income (loss) on the Consolidated Balance Sheets.
Cash Equivalents and Debt Investments
The Company classifies all highly liquid investments with stated maturities of three months or less from date of purchase as cash equivalents. The Company may classify investments with maturities beyond one year as short-term based on the nature of the investments and their availability for use in current operations.
Cash equivalents are stated at cost, which approximates fair market value. The Company’s short-term and long-term debt investments are classified as available-for-sale securities and are stated at their fair market value, with unrealized gains and losses recorded in accumulated other comprehensive income (loss) on the Consolidated Balance Sheets. Premiums and discounts on debt investments are generally amortized or accreted over the life of the related available-for-sale securities. Interest income is recognized when earned. The cost of investments sold is determined on a specific identification method.
Available-for-sale investments are subject to impairment reviews when the fair value is below the amortized cost basis. If the Company determines that the decline in fair value below the amortized cost basis is due to credit-related factors, the impairment is recognized as an allowance on the Consolidated Balance Sheets with a corresponding adjustment to earnings. An impairment that is not credit-related is recognized in accumulated other comprehensive income (loss) on the Consolidated Balance Sheets. If the Company intends to sell the impaired investments, or more likely than not will be required to sell such investments before recovering the amortized cost basis, the entire impairment amount is recognized in earnings with a corresponding adjustment to the amortized cost basis.
Equity Investments
Equity investments in privately held companies without readily determinable fair values are accounted for under the measurement alternative method, provided that the Company does not have the ability to exercise significant influence or control over the investees. Under this method, the Company measures the investments at cost, less any impairment, and adjusts the carrying value of the investments to fair value resulting from observable transactions for identical or similar investments of the same issuer. The Company records the investments in other long-term assets on the Consolidated Balance Sheets, and gains and losses on the investments are recognized in other income (expense), net, on the Consolidated Statements of Operations.
The Company monitors its non-marketable equity investments for impairment indicators, such as negative changes in industry and market conditions, financial performance, business prospects, and other relevant events and factors. If indicators exist for a security and the fair value is below the carrying amount, the Company writes down the security to fair value.
Fair Value of Financial Instruments
Fair value is defined as the price that would be received from selling an asset or paid to transfer a liability in an orderly transaction between market participants at the measurement date. When determining the fair value, the Company considers the principal or most advantageous market in which the Company would transact, as well as assumptions that market participants would use when pricing the assets or liabilities. Fair value is estimated by applying the following hierarchy, which prioritizes the inputs used to measure fair value into three levels and bases the categorization within the hierarchy upon the lowest level of input that is available and significant to the fair value measurement:
| ● | Level 1 - Observable inputs that reflect quoted prices (unadjusted) for identical assets or liabilities in active markets. |
| ● | Level 2 - Inputs that are based upon quoted prices for similar instruments in active markets, quoted prices for identical or similar instruments in markets that are not active, and model-based valuation techniques for which all significant inputs are observable in the market or can be derived from observable market data. |
| ● | Level 3 - Significant unobservable inputs to the valuation methodology and typically reflect management’s estimates of assumptions that market participants would use in pricing the asset or liability. |
Inventories
Inventories are stated at the lower of standard cost (which approximates actual cost determined on a first-in first-out basis) and estimated net realizable value. The Company writes down excess and obsolete inventories based on their age and forecasted demand, which includes estimates taking into consideration the Company’s revenue forecast, outlook on market and economic conditions, technology changes, new product introductions and changes in strategic direction. Actual demand may differ from forecasted demand, and such differences may have a material effect on recorded inventory values. When the Company records a write-down on inventory, it establishes a new, lower cost basis for that inventory, and subsequent changes in facts and circumstances will not result in the restoration or increase in that newly established cost basis.
Property and Equipment
Property and equipment are stated at cost. Depreciation commences when an asset is placed in service and available for its intended use. Depreciation is computed using the straight-line method over the estimated useful lives of the assets. Buildings and building improvements have estimated useful lives of
Impairment of Long-Lived Assets
The Company evaluates its long-lived assets other than goodwill for impairment whenever events or changes in circumstances indicate that the carrying amount of an asset may not be recoverable. An impairment loss would be recognized when the sum of the undiscounted future net cash flows expected to result from the use of the asset and its eventual disposition is less than its carrying amount. Such impairment loss would be measured as the difference between the carrying amount of the asset and its fair value based on the present value of estimated future cash flows. The Company did not record material impairments in any of the periods presented.
Goodwill
Goodwill represents the excess of the fair value of purchase consideration over the fair value of net tangible and identified intangible assets as of the date of acquisition. Goodwill is not amortized.
The Company tests goodwill for impairment at least annually in the fourth quarter of each year, or whenever events or changes in circumstances indicate that goodwill may be impaired. The Company has elected to first assess the qualitative factors to determine whether it is more likely than not that the fair value of the reporting unit is less than its carrying amount. If the Company determines that it is more likely than not that the fair value of the reporting unit is less than the carrying amount, then a quantitative goodwill impairment test is performed to measure the impairment loss. impairment of goodwill has been identified in any of the periods presented.
Deferred Compensation Plan
The Company has a non-qualified, unfunded deferred compensation plan, which provides certain key employees, including executive officers, with the ability to defer the receipt of compensation in order to accumulate funds for retirement on a tax deferred basis. The Company does not make contributions to the plan or guarantee returns on the investments. The Company is responsible for the plan’s administrative expenses. Participants’ deferrals and investment gains and losses remain as the Company’s liabilities and the underlying assets are subject to claims of general creditors.
The liabilities for compensation deferred under the plan are recorded at fair value in each reporting period. Changes in the fair value of the liabilities are included in operating expense on the Consolidated Statements of Operations. The Company manages the risk of changes in the fair value of the liabilities by electing to match the liabilities with investments in corporate-owned life insurance policies, mutual funds and money market funds that offset a substantial portion of the exposure. The investments are recorded at the cash surrender value of the corporate-owned life insurance policies, and at the fair value of the mutual funds and money market funds, which are classified as trading securities. Changes in the cash surrender value of the corporate-owned life insurance policies and the fair value of mutual fund and money market fund investments are included in other income (expense), net, on the Consolidated Statements of Operations. The following table summarizes the deferred compensation plan balances on the Consolidated Balance Sheets (in thousands):
| December 31, | ||||||||
| 2022 | 2021 | |||||||
| Deferred compensation plan asset components: | ||||||||
| Cash surrender value of corporate-owned life insurance policies | $ | $ | ||||||
| Fair value of mutual funds and money market funds | ||||||||
| Total | $ | $ | ||||||
| Deferred compensation plan assets reported in: | ||||||||
| Other long-term assets | $ | $ | ||||||
| Deferred compensation plan liabilities reported in: | ||||||||
| Accrued compensation and related benefits (short-term) | $ | $ | ||||||
| Other long-term liabilities | ||||||||
| Total | $ | $ | ||||||
Revenue Recognition
The Company recognizes revenue when it transfers control of promised goods or services to its customers in an amount that reflects the consideration to which it expects to be entitled to in exchange for those goods or services. See Note 2 for further discussion.
R&D
Costs incurred in R&D are expensed as incurred.
Warranty Reserve
The Company generally provides to -year warranties against defects in materials and workmanship and will repair the products, provide replacements at no charge to customers or issue a refund. As they are considered assurance-type warranties, the Company does not account for them as separate performance obligations. Warranty reserve requirements are generally based on a specific assessment of the products sold with warranties when a customer asserts a claim for warranty or a product defect.
Leases
The Company determines if an arrangement is a lease at inception. Lease terms may include options to extend or terminate the lease when it is reasonably certain that the Company will exercise that option. Operating lease right-of-use (“ROU”) assets represent the Company’s right to use an underlying asset for the lease term, and operating lease liabilities represent the Company’s obligation to make lease payments arising from the lease. Operating lease ROU assets and liabilities are recognized at the commencement date based on the present value of remaining lease payments over the lease term. ROU assets also include any initial direct costs incurred and prepaid lease payments, less lease incentives received. Because the implicit rate in each lease is not readily determinable, the Company uses its estimated incremental borrowing rate to determine the present value of the remaining lease payment. The Company recognizes operating lease costs on a straight-line basis over the lease term.
The Company does not record short-term leases with a term of 12 months or less at the commencement date on the Consolidated Balance Sheets. For lease arrangements that contain lease and non-lease components, the Company accounts for them as single lease components.
For lease arrangements where the Company is the lessor, the Company recognizes lease income from operating leases on a straight-line basis over the lease term.
Stock-Based Compensation
The Company measures the cost of employee services received in exchange for an award of equity instruments based on the grant-date fair value of the award. The fair value of RSUs with only service conditions is determined based on the grant date stock price. The fair value of all other awards is determined based on the following valuation methods:
| Type of Awards | Valuation Method | |
| RSUs with performance conditions (“PSUs”) | Black-Scholes model | |
| RSUs with market conditions (“MSUs”) | Monte Carlo simulation model | |
| RSUs with both performance and market conditions (“MPSUs”) | Monte Carlo simulation model | |
| Shares issued under the employee stock purchase plan (“ESPP”) | Black-Scholes model |
The valuation models consider inputs including stock price, expected volatility, expected term of awards, risk-free interest rate, and expected dividend yield. Expected volatility used in the models is determined based on historical volatility of the Company's stock price for the period, which corresponds to the expected term of the awards, immediately preceding the granting of the awards.
Compensation expense related to awards with service conditions is recorded on a straight-line basis over the requisite service period. Compensation expense related to awards subject to performance or market conditions is recognized over the requisite service period for each separately vesting tranche. For awards with only market conditions, compensation expense is not reversed if the market conditions are not satisfied. For awards with only performance conditions, as well as awards containing both market and performance conditions, the Company recognizes compensation expense when it becomes probable that the performance goals will be achieved. Management performs the probability assessment on a quarterly basis by reviewing external factors, such as macroeconomic conditions and the analog industry revenue forecasts, and internal factors, such as the Company’s business and operational objectives and revenue forecasts. Changes in the probability assessment of achievement of the performance conditions are accounted for in the period of change by recording a cumulative catch-up adjustment as if the new estimate had been applied since the service inception date. Any previously recognized compensation expense is reversed if the performance conditions are not expected to be satisfied as a result of management’s assessment.
The Company accounts for forfeitures of equity awards when they occur.
Accounting for Income Taxes
The Company recognizes federal, state and foreign current tax liabilities or assets based on its estimate of taxes payable or refundable in the current fiscal year by tax jurisdiction. The Company also recognizes federal, state and foreign deferred tax assets or liabilities for its estimate of future tax effects attributable to temporary differences and carryforwards. The Company records a valuation allowance to reduce any deferred tax assets by the amount of any tax benefits that, based on available evidence and judgment, are not expected to be realized.
The Company’s calculation of current and deferred tax assets and liabilities is based on certain estimates and judgments and involves dealing with uncertainties in the application of complex tax laws. The Company’s estimates of current and deferred tax assets and liabilities may change based, in part, on added certainty, finality or uncertainty to an anticipated outcome, changes in accounting or tax laws in the U.S. or foreign jurisdictions where the Company operates, or changes in other facts or circumstances. In addition, the Company recognizes liabilities for potential U.S. and foreign income tax for uncertain income tax positions taken on its tax returns if it has less than a 50% likelihood of being sustained. If the Company determines that payment of these amounts is unnecessary or if the recorded tax liability is less than its current assessment, the Company may be required to recognize an income tax benefit or additional income tax expense in its financial statements in the period such determination is made. The Company has calculated its uncertain tax positions which were attributable to certain estimates and judgments.
Litigation and Contingencies
The Company is a party to actions and proceedings in the ordinary course of business, including challenges to the enforceability or validity of its intellectual property, claims that the Company’s products infringe on the intellectual property rights of others, and employment matters. The Company may also be subject to litigation initiated by its stockholders. The pending proceedings involve complex questions of fact and law and will require the expenditure of significant funds and the diversion of other resources to prosecute and defend. In addition, from time to time, the Company becomes aware that it is subject to other contingent liabilities. When this occurs, the Company will evaluate the appropriate accounting for the potential contingent liabilities to determine whether a contingent liability should be recorded. In making this determination, management may, depending on the nature of the matter, consult with internal and external legal counsel and technical experts. Based on the facts and circumstances in each matter, the Company uses its judgment to determine whether it is probable that a contingent loss has occurred and whether the amount of such loss can be estimated. If the Company determines a loss is probable and estimable, the Company records a contingent loss. In determining the amount of a contingent loss, the Company takes into account advice received from experts for each specific matter regarding the status of legal proceedings, settlement negotiations, prior case history and other factors. Should the judgments and estimates made by management need to be adjusted as additional information becomes available, the Company may need to record additional contingent losses. Alternatively, if the judgments and estimates made by management are adjusted, for example, if a particular contingent loss does not occur, the contingent loss recorded would be reversed.
Litigation expense, net, recorded on the Consolidated Statements of Operations includes primarily patent infringement litigation and other business matters. The Company records litigation costs in the period in which they are incurred. Proceeds resulting from settlement of litigation or favorable judgments are recorded as a reduction against litigation expense.
Net Income per Share
Basic net income per share is computed by dividing net income by the weighted-average number of common shares outstanding for the period. Diluted net income per share reflects the potential dilution that would occur if outstanding securities or other contracts to issue common stock were exercised or converted into common shares, and calculated using the treasury stock method. Contingently issuable shares, including equity awards with performance conditions or market conditions, are considered outstanding common shares and included in the basic net income per share as of the date that all necessary conditions to earn the awards have been satisfied. Prior to the end of the contingency period, the number of contingently issuable shares included in the diluted net income per share is based on the number of shares, if any, that would be issuable under the terms of the arrangement at the end of the reporting period.
The Company’s RSUs contain forfeitable rights to receive cash dividend equivalents, which are accumulated and paid to the employees when the underlying RSUs vest. Dividend equivalents accumulated on the underlying RSUs are forfeited if the employees do not fulfill the requisite service requirement and, as a result, the awards do not vest. Accordingly, these awards are not treated as participating securities in the net income per share calculation.
Comprehensive Income
Comprehensive income represents the change in the Company’s net assets during the period from non-owner sources. Accumulated other comprehensive income (loss) presented on the Consolidated Balance Sheets primarily consists of unrealized gains or losses related to available-for-sale investments and foreign currency translation adjustments.
Recent Accounting Pronouncements Not Yet Adopted as of December 31, 2022
In October 2021, the Financial Accounting Standards Board issued Accounting Standards Update No. 2021-08, Business Combinations (Topic 805): Accounting for Contract Assets and Contract Liabilities from Contracts with Customers, which improves the accounting for acquired revenue contracts with customers in a business combination. The standard requires an acquirer to recognize and measure contract assets and contract liabilities acquired in a business combination in accordance with Revenue from Contracts with Customers (“Topic 606”). The standard is effective for fiscal years beginning after December 15, 2022, including interim period within those fiscal years, and is applied prospectively. The Company does not expect the adoption of this standard to have a material impact on its consolidated financial statements.
2. REVENUE RECOGNITION
Revenue from Product Sales
The Company generates revenue primarily from product sales, which include assembled and tested ICs, as well as dies in wafer form. These product sales accounted for
The Company sells its products primarily through third-party distributors, value-added resellers, OEMs, ODMs and EMS providers. For the years ended December 31, 2022, 2021 and 2020,
The Company recognizes revenue when it satisfies a performance obligation by transferring control of the promised goods or services to its customers, in an amount that reflects the consideration the Company expects to be entitled to in exchange for those goods or services. The Company excludes taxes assessed by government authorities, such as sales taxes, from revenue.
Product sales consist of a single performance obligation that the Company satisfies at a point in time. The Company recognizes product revenue from distributors and direct end customers when the following events have occurred: (a) the Company has transferred physical possession of the products, (b) the Company has a present right to payment, (c) the customer has legal title to the products, and (d) the customer bears significant risks and rewards of ownership of the products. In accordance with the shipping terms specified in the contracts, these criteria are generally met when the products are shipped from the Company’s facilities (such as the “Ex Works” shipping term) or delivered to the customers’ locations (such as the “Delivered Duty Paid” shipping term).
Under certain consignment agreements, revenue is not recognized when the products are shipped and delivered to be held at customers’ designated locations because the Company continues to control the products and retain ownership, and the customers do not have an unconditional obligation to pay. The Company recognizes revenue when the customers consume the products from the consigned inventory locations or, in some cases, after a
Variable Consideration
The Company accounts for price adjustment and stock rotation rights as variable consideration that reduces the transaction price and recognizes that reduction in the same period the associated revenue is recognized. Four U.S.-based distributors have price adjustment rights when they sell the Company’s products to their end customers at a price that is lower than the distribution price invoiced by the Company. When the Company receives claims from the distributors that products have been sold to the end customers at the lower prices, the Company issues the distributors credit memos for the price adjustments. The Company estimates the price adjustments using the expected value method based on an analysis of historical claims, at both the distributor and product level, as well as an assessment of any known trends of product sales mix. Other U.S. distributors and non-U.S. distributors do not have price adjustment rights. The Company records a credit against accounts receivable for the estimated price adjustments, with a corresponding reduction to revenue.
Certain distributors have limited stock rotation rights that permit the return of a small percentage of the previous six months’ purchases in accordance with the contract terms. The Company estimates the stock rotation returns using the expected value method based on an analysis of historical returns, and the current level of inventory in the distribution channel. The Company records a liability for the stock rotation reserve, with a corresponding reduction to revenue. In addition, the Company recognizes an asset for product returns which represents the right to recover products from the customers related to stock rotations, with a corresponding reduction to cost of revenue.
Contract Balances
Accounts Receivable:
The Company records a receivable when it has an unconditional right to receive consideration after the performance obligations are satisfied. As of December 31, 2022 and 2021, accounts receivable totaled $
Contract Liabilities:
For certain customers located in Asia, the Company requires cash payments weeks before the products are scheduled to be shipped to the customers. The Company records these payments received in advance of performance as customer prepayments within current accrued liabilities. As of December 31, 2022 and 2021, customer prepayments totaled $
Practical Expedients
The Company has elected the practical expedient to expense sales commissions as incurred because the amortization period would have been one year or less.
The Company’s standard payment terms generally require customers to pay
The Company’s unsatisfied performance obligations primarily include products held in consignment arrangements and customer purchase orders for products that the Company has not yet shipped. Because the Company expects to fulfill these performance obligations within one year, the Company has elected not to disclose the amount of these remaining performance obligations.
3. CASH, CASH EQUIVALENTS, INVESTMENTS AND RESTRICTED CASH
The following is a summary of the Company’s cash, cash equivalents and debt investments (in thousands):
| December 31, | ||||||||
| 2022 | 2021 | |||||||
| Cash | $ | $ | ||||||
| Money market funds | ||||||||
| Certificates of deposit | ||||||||
| Corporate debt securities | ||||||||
| Commercial paper | ||||||||
| U.S. treasuries and government agency bonds | ||||||||
| Auction-rate securities backed by student-loan notes | ||||||||
| Total | $ | $ | ||||||
| December 31, | ||||||||
| 2022 | 2021 | |||||||
| Reported as: | ||||||||
| Cash and cash equivalents | $ | $ | ||||||
| Short-term investments | ||||||||
| Investment within other long-term assets | ||||||||
| Total | $ | $ | ||||||
The following table summarizes the contractual maturities of the short-term and long-term available-for-sale investments as of December 31, 2022 (in thousands):
| Amortized Cost | Fair Value | |||||||
| Due in less than 1 year | $ | $ | ||||||
| Due in 1 - 5 years | ||||||||
| Due in greater than 5 years | ||||||||
| Total | $ | $ | ||||||
For the year ended December 31, 2020, the Company recognized gross realized gains of $
The following tables summarize the unrealized gain and loss positions related to the available-for sale investments (in thousands):
| December 31, 2022 | ||||||||||||||||
| Amortized Cost | Unrealized Gains | Unrealized Losses | Fair Value | |||||||||||||
| Money market funds | $ | $ | $ | $ | ||||||||||||
| Certificates of deposit | ||||||||||||||||
| Corporate debt securities | ( | ) | ||||||||||||||
| Commercial paper | ||||||||||||||||
| U.S. treasuries and government agency bonds | ( | ) | ||||||||||||||
| Auction-rate securities backed by student-loan notes | ( | ) | ||||||||||||||
| Total | $ | $ | $ | ( | ) | $ | ||||||||||
| December 31, 2021 | ||||||||||||||||
| Amortized Cost | Unrealized Gains | Unrealized Losses | Fair Value | |||||||||||||
| Money market funds | $ | $ | $ | $ | ||||||||||||
| Certificates of deposit | ||||||||||||||||
| Corporate debt securities | ( | ) | ||||||||||||||
| U.S. treasuries and government agency bonds | ( | ) | ||||||||||||||
| Auction-rate securities backed by student-loan notes | ( | ) | ||||||||||||||
| Total | $ | $ | $ | ( | ) | $ | ||||||||||
The following tables present information about the available-for-sale investments that had been in a continuous unrealized loss position for less than 12 months and for greater than 12 months (in thousands):
| December 31, 2022 | ||||||||||||||||||||||||
| Less than 12 Months | Greater than 12 Months | Total | ||||||||||||||||||||||
| Fair Value | Unrealized Losses | Fair Value | Unrealized Losses | Fair Value | Unrealized Losses | |||||||||||||||||||
| Corporate debt securities | $ | $ | ( | ) | $ | $ | ( | ) | $ | $ | ( | ) | ||||||||||||
| U.S. treasuries and government agency bonds | ( | ) | ( | ) | ( | ) | ||||||||||||||||||
| Auction-rate securities backed by student-loan notes | ( | ) | ( | ) | ||||||||||||||||||||
| Total | $ | $ | ( | ) | $ | $ | ( | ) | $ | $ | ( | ) | ||||||||||||
| December 31, 2021 | ||||||||||||||||||||||||
| Less than 12 Months | Greater than 12 Months | Total | ||||||||||||||||||||||
| Fair Value | Unrealized Losses | Fair Value | Unrealized Losses | Fair Value | Unrealized Losses | |||||||||||||||||||
| Corporate debt securities | $ | $ | ( | ) | $ | $ | ( | ) | $ | $ | ( | ) | ||||||||||||
| U.S. treasuries and government agency bonds | ( | ) | ( | ) | ||||||||||||||||||||
| Auction-rate securities backed by student-loan notes | ( | ) | ( | ) | ||||||||||||||||||||
| Total | $ | $ | ( | ) | $ | $ | ( | ) | $ | $ | ( | ) | ||||||||||||
An impairment exists when the fair value of an investment is less than its amortized cost basis. As of December 31, 2022 and 2021, the Company did consider the impairment of its investments to be a result of credit losses. The Company typically invests in highly rated securities, with the primary objective of minimizing the potential risk of principal loss. The Company’s investment policy generally requires securities to be investment grade and limits the amount of credit exposure to any one issuer. When evaluating a debt security for impairment, management reviews factors such as the Company’s intent to sell, or whether it will more likely than not be required to sell, the security before recovery of its amortized cost basis, the extent to which the fair value of the security is less than its cost, the financial condition of the issuer and the credit quality of the investment.
The Company’s auction-rate securities are backed by pools of student loans supported by guarantees by the U.S. Department of Education. The underlying maturities of these securities are up to 23 years. The Company has received all scheduled interest payments on a timely basis pursuant to the terms and conditions of the securities. The Company does not intend to sell these securities, and it is more likely than not that the Company will not be required to sell these securities, before recovery of its amortized cost basis. To date, the Company has redeemed $
Non-Marketable Equity Investment
In November 2020, the Company made an equity investment in a privately held Swiss company (the “Investee”) that is accounted for under the measurement alternative. In April 2022, the Company made an investment in a convertible loan that will convert into additional shares of the Investee. One member of the Company’s Board of Directors is an executive officer of a company that has a commercial relationship with the Investee. In addition, the Company’s Chief Executive Officer has a personal investment in the Investee and is on the Investee’s board of directors. As of December 31, 2022 and 2021, the Company’s investment in the Investee, which is denominated in Swiss Franc, had a carrying value of $
Restricted Cash
The following table provides a reconciliation of cash, cash equivalents and restricted cash reported on the Consolidated Balance Sheets to the amounts reported on the Consolidated Statements of Cash Flows (in thousands):
| December 31, | ||||||||
| 2022 | 2021 | |||||||
| Cash and cash equivalents | $ | $ | ||||||
| Restricted cash included in other long-term assets | ||||||||
| Total cash, cash equivalents and restricted cash reported on the Consolidated Statements of Cash Flows | $ | $ | ||||||
As of December 31, 2022 and 2021, restricted cash included a security deposit that is set aside in a bank account and cannot be withdrawn by the Company under the terms of a lease agreement. The restriction will end upon the expiration of the lease.
4. FAIR VALUE MEASUREMENTS
The following table details the fair value of the financial assets measured on a recurring basis (in thousands):
| December 31, 2022 | ||||||||||||||||
| Total | Level 1 | Level 2 | Level 3 | |||||||||||||
| Money market funds | $ | $ | $ | $ | ||||||||||||
| Certificates of deposit | ||||||||||||||||
| Corporate debt securities | ||||||||||||||||
| Commercial paper | ||||||||||||||||
| U.S. treasuries and government agency bonds | ||||||||||||||||
| Auction-rate securities backed by student-loan notes | ||||||||||||||||
| Mutual funds and money market funds under deferred compensation plan | ||||||||||||||||
| Total | $ | $ | $ | $ | ||||||||||||
| December 31, 2021 | ||||||||||||||||
| Total | Level 1 | Level 2 | Level 3 | |||||||||||||
| Money market funds | $ | $ | $ | $ | ||||||||||||
| Certificates of deposit | ||||||||||||||||
| Corporate debt securities | ||||||||||||||||
| U.S. treasuries and government agency bonds | ||||||||||||||||
| Auction-rate securities backed by student-loan notes | ||||||||||||||||
| Mutual funds and money market funds under deferred compensation plan | ||||||||||||||||
| Total | $ | $ | $ | $ | ||||||||||||
| ● | Level 1 —includes instruments with quoted prices in active markets for identical assets. |
| ● | Level 2 —includes instruments for which the valuations are based upon quoted market prices in active markets involving similar assets or inputs other than quoted prices that are observable for the assets. The market inputs used to value these instruments generally consist of market yields, recently executed transactions, broker/dealer quotes or alternative pricing sources with reasonable levels of price transparency. Pricing sources may include industry standard data providers, security master files from large financial institutions, and other third-party sources used to determine a daily market value. |
| ● | Level 3 —includes instruments for which the valuations are based on inputs that are unobservable and significant to the overall fair value measurement. |
Redemptions and changes in the fair value of the auction-rate securities classified as Level 3 assets were not material for the periods presented.
5. BALANCE SHEET COMPONENTS
Inventories
Inventories consist of the following (in thousands):
| December 31, | ||||||||
| 2022 | 2021 | |||||||
| Raw materials | $ | $ | ||||||
| Work in process | ||||||||
| Finished goods | ||||||||
| Total | $ | $ | ||||||
Other Current Assets
Other current assets consist of the following (in thousands):
| December 31, | ||||||||
| 2022 | 2021 | |||||||
| RSU tax withholding proceeds receivable | $ | $ | ||||||
| Prepaid expense | ||||||||
| Accrued interest receivable | ||||||||
| Other | ||||||||
| Total | $ | $ | ||||||
Property and Equipment, Net
Property and equipment, net, consist of the following (in thousands):
| December 31, | ||||||||
| 2022 | 2021 | |||||||
| Land | $ | $ | ||||||
| Production equipment and software | ||||||||
| Buildings and improvements | ||||||||
| Transportation equipment | ||||||||
| Leasehold improvements | ||||||||
| Furniture and fixtures | ||||||||
| Construction in progress | ||||||||
| Property and equipment, gross | ||||||||
| Less: accumulated depreciation and amortization | ( | ) | ( | ) | ||||
| Total | $ | $ | ||||||
Depreciation and amortization expense on property and equipment was $
Other Long-Term Assets
Other long-term assets consist of the following (in thousands):
| December 31, | ||||||||
| 2022 | 2021 | |||||||
| Deferred compensation plan assets | $ | $ | ||||||
| Prepaid wafer purchase | ||||||||
| Other | ||||||||
| Total | $ | $ | ||||||
Prepaid wafer purchase of $
Other Accrued Liabilities
Other accrued liabilities consist of the following (in thousands):
| December 31, | ||||||||
| 2022 | 2021 | |||||||
| Dividends and dividend equivalents | $ | $ | ||||||
| Warranty | ||||||||
| Stock rotation and sales returns | ||||||||
| Income tax payable | ||||||||
| Other | ||||||||
| Total | $ | $ | ||||||
As of December 31, 2022, stock rotation and sales returns included a $
Other Long-Term Liabilities
Other long-term liabilities consist of the following (in thousands):
| December 31, | ||||||||
| 2022 | 2021 | |||||||
| Deferred compensation plan liabilities | $ | $ | ||||||
| Dividend equivalents | ||||||||
| Other | ||||||||
| Total | $ | $ | ||||||
6. LEASES
Lessee
The Company has operating leases primarily for administrative and sales and marketing offices, manufacturing operations and R&D facilities, employee housing units and certain equipment. These leases have remaining lease terms from less than year to years. Some of these leases include options to renew the lease term for up to years or on a month-to-month basis. The Company does not have finance lease arrangements.
The following table summarizes the balances of operating lease ROU assets and liabilities (in thousands):
| December 31, | ||||||||||
| Financial Statement Line Item | 2022 | 2021 | ||||||||
| Operating lease ROU assets | Other long-term assets | $ | $ | |||||||
| Operating lease liabilities | Other accrued liabilities | $ | $ | |||||||
| Other long-term liabilities | $ | $ | ||||||||
The following tables summarize certain information related to the leases (in thousands, except percentages):
| Year Ended December 31, | ||||||||||||
| 2022 | 2021 | 2020 | ||||||||||
| Lease costs: | ||||||||||||
| Operating lease costs | $ | $ | $ | |||||||||
| Other | ||||||||||||
| Total lease costs | $ | $ | $ | |||||||||
| Year Ended December 31, | ||||||||||||
| 2022 | 2021 | 2020 | ||||||||||
| Cash paid for amounts included in the measurement of lease liabilities: | ||||||||||||
| Operating cash flows for operating leases | $ | $ | $ | |||||||||
| ROU assets obtained in exchange for new operating lease liabilities | $ | $ | $ | |||||||||
| December 31, | ||||||||
| 2022 | 2021 | |||||||
| Weighted-average remaining lease term (in years) | ||||||||
| Weighted-average discount rate | % | % | ||||||
As of December 31, 2022, the maturities of the lease liabilities were as follows (in thousands):
| 2023 | $ | |||
| 2024 | ||||
| 2025 | ||||
| 2026 | ||||
| Total remaining lease payments | ||||
| Less: imputed interest | ( | ) | ||
| Total lease liabilities | $ |
As of December 31, 2022, the Company had no operating leases that have yet commenced.
Lessor
The Company owns certain office buildings and leases a portion of these properties to third parties under arrangements that are classified as operating leases. These leases have remaining lease terms ranging from less than year to years. Some of these leases include options to renew the lease term for up to years.
Income related to lease payments was $
| 2023 | $ | |||
| 2024 | ||||
| 2025 | ||||
| 2026 | ||||
| Total | $ |
7. STOCK-BASED COMPENSATION
2014 Equity Incentive Plan
In April 2013, the Board of Directors adopted the 2014 Equity Incentive Plan (the “2014 Plan”), which the Company’s stockholders approved in June 2013. In October 2014, the Board of Directors approved certain amendments to the 2014 Plan. The amended 2014 Plan became effective on November 13, 2014 and provided for the issuance of up to
Stock-Based Compensation Expense
The Company recognized stock-based compensation expense as follows (in thousands):
| Year Ended December 31, | ||||||||||||
| 2022 | 2021 | 2020 | ||||||||||
| Cost of revenue | $ | $ | $ | |||||||||
| Research and development | ||||||||||||
| Selling, general and administrative | ||||||||||||
| Total stock-based compensation expense | $ | $ | $ | |||||||||
| Tax benefit related to stock-based compensation (1) | $ | $ | $ | |||||||||
(1) Amount reflects the tax benefit related to stock-based compensation recorded for equity awards that are expected to generate tax deductions when they vest in future periods. Equity awards granted to the Company’s executive officers are subject to the tax deduction limitations set by Section 162(m) of the IRC.
RSUs
The Company’s RSUs include time-based RSUs, PSUs, MSUs, and MPSUs. Vesting of awards with performance conditions or market conditions is subject to the achievement of pre-determined performance goals and the approval of such achievement by the Compensation Committee of the Board of Directors (the “Compensation Committee”). All awards include service conditions which require continued employment with the Company.
A summary of RSU activity is presented in the table below (in thousands, except per-share amounts):
| Time-Based RSUs | PSUs and MPSUs | MSUs | Total | ||||||||||||||||||||||||||||||
| Weighted- | Weighted- | Weighted- | Weighted- | ||||||||||||||||||||||||||||||
| Average Grant | Average Grant | Average Grant | Average Grant | ||||||||||||||||||||||||||||||
| Date Fair | Date Fair | Date Fair | Date Fair | ||||||||||||||||||||||||||||||
| Number of | Value Per | Number of | Value Per | Number of | Value Per | Number of | Value Per | ||||||||||||||||||||||||||
| Shares | Share | Shares | Share | Shares | Share | Shares | Share | ||||||||||||||||||||||||||
| Outstanding at January 1, 2020 | $ | $ | $ | $ | |||||||||||||||||||||||||||||
| Granted | $ | (1) | $ | $ | $ | ||||||||||||||||||||||||||||
| Vested | ( | ) | $ | ( | ) | $ | ( | ) | $ | ( | ) | $ | |||||||||||||||||||||
| Forfeited | ( | ) | $ | ( | ) | $ | ( | ) | $ | ( | ) | $ | |||||||||||||||||||||
| Outstanding at December 31, 2020 | $ | $ | $ | $ | |||||||||||||||||||||||||||||
| Granted | $ | (1) | $ | $ | $ | ||||||||||||||||||||||||||||
| Vested | ( | ) | $ | ( | ) | $ | ( | ) | $ | ( | ) | $ | |||||||||||||||||||||
| Forfeited | ( | ) | $ | ( | ) | $ | ( | ) | $ | ( | ) | $ | |||||||||||||||||||||
| Outstanding at December 31, 2021 | $ | $ | $ | $ | |||||||||||||||||||||||||||||
| Granted | $ | (1)(2) | $ | $ | $ | ||||||||||||||||||||||||||||
| Vested | ( | ) | $ | ( | ) | $ | ( | ) | $ | ( | ) | $ | |||||||||||||||||||||
| Forfeited | ( | ) | $ | ( | ) | $ | ( | ) | $ | ( | ) | $ | |||||||||||||||||||||
| Outstanding at December 31, 2022 | $ | $ | $ | $ | |||||||||||||||||||||||||||||
| (1) | Amount reflects the number of awards that may ultimately be earned based on management’s probability assessment of the achievement of performance conditions at each reporting period. |
| (2) | Amount includes grants and cancellations of the 2022 Executive PSUs as defined under the “2022 PSUs” section. |
The intrinsic value related to vested RSUs was $
Cash proceeds from vested PSUs with a purchase price totaled $
Time-Based RSUs
For the years ended December 31, 2022, 2021 and 2020, the Compensation Committee granted
PSUs and MPSUs
2022 PSUs:
In February 2022, the Compensation Committee granted
In February 2022, the Compensation Committee granted
The 2022 Executive PSUs and the 2022 Non-Executive PSUs contain a purchase price feature, which requires the employees to pay the Company $
2021 PSUs:
In February 2021, the Compensation Committee granted
In February 2021, the Compensation Committee granted
The 2021 Executive PSUs and the 2021 Non-Executive PSUs contained a purchase price feature, which required the employees to pay the Company $
2020 PSUs:
In February 2020, the Compensation Committee granted
In February 2020, the Compensation Committee granted
The 2020 Executive PSUs and the 2020 Non-Executive PSUs contained a purchase price feature, which required the employees to pay the Company $
2020 MPSUs:
In July 2020, the Compensation Committee granted
The Company determined the grant date fair value of the 2020 MPSUs using a Monte Carlo simulation model with the following assumptions: stock price of $
2019 PSUs:
In February 2019, the Compensation Committee granted
The 2019 Executive PSUs contained a purchase price feature, which required the employees to pay the Company $
In October 2018, the Compensation Committee granted
The 2019 Non-Executive PSUs contained a purchase price feature, which required the employees to pay the Company $
MSUs
2022 MSUs:
In October 2022, the Compensation Committee cancelled the 2022 Executive PSUs and granted
The Company determined the grant date fair value of the 2022 Executive MSUs using a Monte Carlo simulation model with the following assumptions: stock price of $
In February 2022, the Compensation Committee granted
The Company determined the grant date fair value of the 2022 Non-Executive MSUs using a Monte Carlo simulation model with the following assumptions: stock price of $
2018 MSUs:
In October 2018, the Compensation Committee granted
The Company determined the grant date fair value of the 2018 MSUs using a Monte Carlo simulation model with the following assumptions: stock price of $
2013 MSUs:
In December 2013, the Compensation Committee granted
The Company determined the grant date fair value of the 2013 MSUs using a Monte Carlo simulation model with the following assumptions: stock price of $
ESPP
Under the ESPP, eligible employees may purchase common stock through payroll deductions. Participants may not purchase more than
For the years ended December 31, 2022, 2021 and 2020,
| Year Ended December 31, | ||||||||||||
| 2022 | 2021 | 2020 | ||||||||||
| Expected term (in years) | ||||||||||||
| Expected volatility | % | % | % | |||||||||
| Risk-free interest rate | % | % | % | |||||||||
| Dividend yield | % | % | % | |||||||||
Cash proceeds from the shares issued under the ESPP were $
8. DIVIDENDS AND DIVIDEND EQUIVALENTS
Cash Dividend Program
The Company has a dividend program approved by the Board of Directors, pursuant to which the Company intends to pay quarterly cash dividends on its common stock. Based on the Company’s historical practice, stockholders of record as of the last business day of the quarter are entitled to receive the quarterly cash dividends when and if declared by the Board of Directors, which are payable to the stockholders in the following month. The Board of Directors declared the following cash dividends (in thousands, except per-share amounts):
| Year Ended December 31, | ||||||||||||
| 2022 | 2021 | 2020 | ||||||||||
| Dividend declared per share | $ | $ | $ | |||||||||
| Total amount | $ | $ | $ | |||||||||
As of December 31, 2022 and 2021, accrued dividends totaled $
The declaration of any future cash dividends is at the discretion of the Board of Directors and will depend on, among other things, the Company’s financial condition, results of operations, capital requirements, business conditions, and other factors that the Board of Directors may deem relevant, as well as a determination that cash dividends are in the best interests of the Company’s stockholders.
The Company anticipates that cash used for future dividend payments will come from its domestic cash, cash generated from ongoing U.S. operations, and cash repatriated from its Bermuda subsidiary. The Company also anticipates that earnings from other foreign subsidiaries will continue to be indefinitely reinvested.
Cash Dividend Equivalent Rights
The Company’s RSUs contain rights to receive cash dividend equivalents, which entitle employees who hold RSUs to the same dividend value per share as holders of common stock. The dividend equivalents are accumulated and paid to the employees when the underlying RSUs vest. Dividend equivalents accumulated on the underlying RSUs are forfeited if the employees do not fulfill the requisite service requirement and, as a result, the awards do not vest. As of December 31, 2022 and 2021, accrued dividend equivalents totaled $
9. OTHER INCOME (EXPENSE), NET
The components of other income (expense), net, are as follows (in thousands):
| Year Ended December 31, | ||||||||||||
| 2022 | 2021 | 2020 | ||||||||||
| Interest income | $ | $ | $ | |||||||||
| Amortization of premium on available-for-sale securities | ( | ) | ( | ) | ( | ) | ||||||
| Gain (loss) on deferred compensation plan investments | ( | ) | ||||||||||
| Foreign currency exchange gain (loss) | ( | ) | ( | ) | ||||||||
| Charitable contributions | ( | ) | ( | ) | ( | ) | ||||||
| Other | ||||||||||||
| Total | $ | ( | ) | $ | $ | |||||||
10. NET INCOME PER SHARE
The following table sets forth the computation of basic and diluted net income per share (in thousands, except per share amounts):
| Year Ended December 31, | ||||||||||||
| 2022 | 2021 | 2020 | ||||||||||
| Numerator: | ||||||||||||
| Net income | $ | $ | $ | |||||||||
| Denominator: | ||||||||||||
| Weighted-average outstanding shares - basic | ||||||||||||
| Effect of dilutive securities | ||||||||||||
| Weighted-average outstanding shares - diluted | ||||||||||||
| Net income per share: | ||||||||||||
| Basic | $ | $ | $ | |||||||||
| Diluted | $ | $ | $ | |||||||||
Anti-dilutive common stock equivalents were not material for the periods presented.
11. INCOME TAXES
The components of income before income taxes are as follows (in thousands):
| Year Ended December 31, | ||||||||||||
| 2022 | 2021 | 2020 | ||||||||||
| United States | $ | ( | ) | $ | ( | ) | $ | |||||
| Foreign | ||||||||||||
| Income before income taxes | $ | $ | $ | |||||||||
| Year Ended December 31, | ||||||||||||
| 2022 | 2021 | 2020 | ||||||||||
| Current: | ||||||||||||
| Federal | $ | $ | $ | |||||||||
| State | ( | ) | ||||||||||
| Foreign | ||||||||||||
| Deferred: | ||||||||||||
| Federal | ( | ) | ( | ) | ||||||||
| Foreign | ( | ) | ( | ) | ( | ) | ||||||
| Income tax expense | $ | $ | $ | |||||||||
The effective tax rate differs from the applicable U.S. statutory federal income tax rate as follows:
| Year Ended December 31, | ||||||||||||
| 2022 | 2021 | 2020 | ||||||||||
| U.S. statutory federal tax rate | % | % | % | |||||||||
| Foreign income at lower rates | ( | ) | ( | ) | ( | ) | ||||||
| GILTI | ||||||||||||
| Changes in valuation allowance | ||||||||||||
| Stock-based compensation | ( | ) | ||||||||||
| Tax credits, net of reserves | ( | ) | ( | ) | ( | ) | ||||||
| State income taxes | ( | ) | ( | ) | ( | ) | ||||||
| Other adjustments | ||||||||||||
| Effective tax rate | % | % | % | |||||||||
The components of net deferred tax assets consist of the following (in thousands):
| December 31, | ||||||||
| 2022 | 2021 | |||||||
| Deferred tax assets: | ||||||||
| Tax credits | $ | $ | ||||||
| Stock-based compensation | ||||||||
| Deferred compensation | ||||||||
| Net operating losses | ||||||||
| Other expenses not currently deductible | ||||||||
| Deferred tax assets, gross | ||||||||
| Valuation allowance | ( | ) | ( | ) | ||||
| Deferred tax assets, net of valuation allowance | ||||||||
| Deferred tax liabilities: | ||||||||
| Depreciation and amortization | ( | ) | ( | ) | ||||
| Undistributed foreign earnings | ( | ) | ( | ) | ||||
| Other expenses currently deductible | ( | ) | ( | ) | ||||
| Deferred tax liabilities | ( | ) | ( | ) | ||||
| Net deferred tax assets | $ | $ | ||||||
GILTI:
The Company accounts for GILTI as a period cost.
Valuation Allowance:
The Company periodically evaluates its deferred tax assets, including a determination of whether a valuation allowance is necessary, based upon its ability to utilize the assets using a more likely than not analysis. The realizability of the Company’s net deferred tax assets is dependent on its ability to generate sufficient future taxable income during periods prior to the expiration of tax attributes to fully utilize these assets. As of December 31, 2022 and 2021, the Company has evaluated the realization of its deferred tax assets and recorded a valuation allowance for assets that do not meet the more-likely-than-not recognition threshold.
Undistributed Earnings of Subsidiaries:
The Company has analyzed its global working capital and cash requirements, and has determined that it plans to repatriate cash from its Bermuda subsidiary on an ongoing basis to fund its future U.S.-based expenditures and dividends. No cash was repatriated from the subsidiary during the year ended December 31, 2022. For the years ended December 31, 2021 and 2020, the Company repatriated $
For all other foreign subsidiaries, the Company expects to indefinitely reinvest undistributed earnings to fund their operations and R&D. As of December 31, 2022 and 2021, the undistributed earnings were approximately $
Other Income Tax Provision Matters
As of December 31, 2022, the Company did have federal net operating loss carryforwards. As of December 31, 2022, the state net operating loss carryforwards for income tax purposes were $
As of December 31, 2022, the Company had
In the event of a change in ownership, as defined under federal and state tax laws, the Company's net operating loss and tax credit carryforwards could be subject to annual limitations. The annual limitations could result in the expiration of the net operating loss and tax credit carryforwards prior to utilization.
As of December 31, 2022, the Company had $
A reconciliation of the gross unrecognized tax benefits is as follows (in thousands):
| Balance as of January 1, 2020 | $ | |||
| Increase for tax position of current year | ||||
| Decrease for tax position of prior year | ( | ) | ||
| Decrease due to settlement with tax authorities | ( | ) | ||
| Decrease due to lapse of statute of limitation | ( | ) | ||
| Balance as of December 31, 2020 | ||||
| Increase for tax position of current year | ||||
| Decrease for tax position of prior year | ( | ) | ||
| Decrease due to settlement with tax authorities | ( | ) | ||
| Decrease due to lapse of statute of limitation | ( | ) | ||
| Balance as of December 31, 2021 | ||||
| Increase for tax position of current year | ||||
| Increase for tax position of prior year | ||||
| Decrease due to settlement with tax authorities | ( | ) | ||
| Decrease due to lapse of statute of limitation | ( | ) | ||
| Balance as of December 31, 2022 | $ |
The Company recognizes interest and penalties, if any, related to uncertain tax positions in its income tax provision. As of December 31, 2022 and 2021, the Company has $
Uncertain tax positions relate to the allocation of income and deductions among the Company’s global entities and to the determination of the R&D tax credit. It is reasonably possible that the balance of gross unrecognized tax benefits could significantly change in the next 12 months. However, it is not possible to determine either the magnitude or the range of increases or decreases at this time.
The Company currently has reduced tax rates in its subsidiaries in Chengdu and Hangzhou, China through 2023 and 2030, respectively, for performing R&D activities.
On August 9, 2022, the U.S. government enacted the CHIPS Act to provide certain financial and tax incentives to the semiconductor industry, primarily for manufacturing activities within the United States. On August 16, 2022, the IRA was enacted and signed into law. The IRA, among other things, introduces a new 15% corporate minimum tax, based on adjusted financial statement income of certain large corporations, and imposes a 1% surcharge on stock repurchases. This excise tax is effective January 1, 2023. The Company does not believe the CHIPS Act or the IRA had a material impact on its income tax provisions, results of operations or financial condition for the year ended December 31, 2022.
Income Tax Examination
The Company is subject to examination of its income tax returns by the IRS and other tax authorities. In general, the tax years for 2007 and forward are open for examination for U.S. federal and state income tax purposes.
12. COMMITMENTS AND CONTINGENCIES
Warranty and Indemnification Provisions
The changes in warranty reserves are as follows (in thousands):
| Year Ended December 31, | ||||||||||||
| 2022 | 2021 | 2020 | ||||||||||
| Balance at beginning of period | $ | $ | $ | |||||||||
| Warranty issued | ||||||||||||
| Repairs, replacement and refund | ( | ) | ( | ) | ( | ) | ||||||
| Changes in liability for pre-existing warranties, including expirations | ||||||||||||
| Balance at end of period | $ | $ | $ | |||||||||
The Company provides indemnification agreements to certain direct or indirect customers. The Company agrees to reimburse these parties for any damages, costs and expenses incurred by them as a result of legal actions taken against them by third parties for infringing upon their intellectual property rights as a result of using the Company’s products and technologies. These indemnification provisions are varied in their scope and are subject to certain terms, conditions, limitations and exclusions. In addition, the Company has entered into indemnification agreements with its directors and officers.
It is not possible to predict the maximum potential amount of future payments under these agreements due to the limited history of indemnification claims and the unique facts and circumstances involved in each particular agreement. There were no indemnification liabilities incurred for the periods presented. However, there can be no assurances that the Company will not incur any financial liabilities in the future as a result of these obligations.
Purchase Commitments
The Company has outstanding purchase obligations with its suppliers and other parties that require the purchases of goods or services, which primarily consist of wafer and other inventory purchases, assembly and other manufacturing services, construction of manufacturing and R&D facilities, purchases of production and other equipment, and license arrangements.
In May 2022, the Company entered into a long-term supply agreement in order to secure manufacturing production capacity for silicon wafers over a four-year period. As of December 31, 2022, the Company had made prepayments under this agreement of $
Total estimated future unconditional purchase commitments to all suppliers and other parties as of December 31, 2022 were as follows (in thousands):
| 2023 | $ | |||
| 2024 | ||||
| 2025 | ||||
| Total | $ |
Litigation
The Company is a party to actions and proceedings in the ordinary course of business, including challenges to the enforceability or validity of its intellectual property, claims that the Company’s products infringe on the intellectual property rights of others, and employment matters. The Company may also be subject to litigation initiated by its stockholders. These proceedings often involve complex questions of fact and law and may require the expenditure of significant funds and the diversion of other resources to prosecute and defend. The Company defends itself vigorously against any such claims. As of December 31, 2022, there were no material pending legal proceedings to which the Company was a party.
13. EMPLOYEE 401(k) PLAN
The Company sponsors a 401(k) retirement savings plan for all employees in the U.S. who meet certain eligibility requirements. Participants may contribute up to the amount allowable as a deduction for federal income tax purposes. The Company is not required to contribute and did contribute to the plan for the years ended December 31, 2022, 2021 and 2020.
14. SIGNIFICANT CUSTOMERS
The Company sells its products primarily through third-party distributors and value-added resellers, and directly to OEMs, ODMs and EMS providers. The following table summarizes those customers with sales equal to 10% or more of the Company's total revenue:
| Year Ended December 31, | ||||||||||
| Customer | 2022 | 2021 | 2020 | |||||||
| Distributor A | % | % | % | |||||||
| Distributor B | % | % | % | |||||||
| Distributor C | * | % | * | |||||||
* Represents less than 10%.
The Company’s agreements with these third-party customers were made in the ordinary course of business and may be terminated with or without cause by these customers with advance notice. Although the Company may experience a short-term disruption in the distribution of its products and a short-term decline in revenue if its agreement with any of the distributors was terminated, the Company believes that such termination would not have a material adverse effect on its financial statements because it would be able to engage alternative distributors, resellers and other distribution channels to deliver its products to end customers within a short period following the termination of the agreement with the distributor.
The following table summarizes those customers with accounts receivable equal to 10% or more of the Company’s total accounts receivable:
| December 31, | ||||||||
| 2022 | 2021 | |||||||
| Distributor A | % | % | ||||||
| Distributor B | % | % | ||||||
| Value-added reseller A | * | % | ||||||
* Represents less than 10%.
15. SEGMENT AND GEOGRAPHIC INFORMATION
The Company operates in
The following is a summary of revenue by geographic regions (in thousands):
| Year Ended December 31, | ||||||||||||
| Country or Region | 2022 | 2021 | 2020 | |||||||||
| China | $ | $ | $ | |||||||||
| Taiwan | ||||||||||||
| Europe | ||||||||||||
| South Korea | ||||||||||||
| Southeast Asia | ||||||||||||
| Japan | ||||||||||||
| United States | ||||||||||||
| Other | ||||||||||||
| Total | $ | $ | $ | |||||||||
The following is a summary of revenue by major product families (in thousands):
| Year Ended December 31, | ||||||||||||
| Product Family | 2022 | 2021 | 2020 | |||||||||
| DC to DC | $ | $ | $ | |||||||||
| Lighting Control | ||||||||||||
| Total | $ | $ | $ | |||||||||
The following is a summary of long-lived assets by geographic regions (in thousands):
| December 31, | ||||||||||||
| Country | 2022 | 2021 | 2020 | |||||||||
| China | $ | $ | $ | |||||||||
| United States | ||||||||||||
| Taiwan | ||||||||||||
| Other | ||||||||||||
| Total | $ | $ | $ | |||||||||
16. ACCUMULATED OTHER COMPREHENSIVE INCOME (LOSS)
The following table summarizes the changes in accumulated other comprehensive income (loss) (in thousands):
| Unrealized Gains | ||||||||||||
| (Losses) on | Foreign Currency | |||||||||||
| Available-for-Sale | Translation | |||||||||||
| Securities | Adjustments | Total | ||||||||||
| Balance as of January 1, 2021 | $ | $ | $ | |||||||||
| Other comprehensive income (loss) before reclassifications | ( | ) | ||||||||||
| Amounts reclassified from accumulated other comprehensive income | ( | ) | ( | ) | ||||||||
| Tax effect | ||||||||||||
| Net current period other comprehensive income (loss) | ( | ) | ||||||||||
| Balance as of December 31, 2021 | ( | ) | ||||||||||
| Other comprehensive loss before reclassifications | ( | ) | ( | ) | ( | ) | ||||||
| Amounts reclassified from accumulated other comprehensive loss | ||||||||||||
| Tax effect | ||||||||||||
| Net current period other comprehensive loss | ( | ) | ( | ) | ( | ) | ||||||
| Balance as of December 31, 2022 | $ | ( | ) | $ | ( | ) | $ | ( | ) | |||
The amounts reclassified from accumulated other comprehensive income (loss) were recorded in other income (expense), net, on the Consolidated Statements of Operations.
17. SUBSEQUENT EVENT
Cash Dividend Increase
In February 2023, the Company’s Board of Directors approved an increase in quarterly cash dividends from $
| Changes in and Disagreements with Accountants on Accounting and Financial Disclosure |
None.
| Controls and Procedures |
Evaluation of Disclosure Controls and Procedures
Our management, with the participation of our Chief Executive Officer and Chief Financial Officer, evaluated the effectiveness of our disclosure controls and procedures pursuant to Rule 13a-15(e) and Rule 15d-15(e) under the Securities Exchange Act of 1934 as of the end of the period covered by this Annual Report on Form 10-K.
Based on this evaluation, our Chief Executive Officer and Chief Financial Officer concluded that, as of December 31, 2022, our disclosure controls and procedures are designed at a reasonable assurance level and are effective to provide reasonable assurance that information we are required to disclose in reports that we file or submit under the Exchange Act is recorded, processed, summarized, and reported within the time periods specified in the SEC’s rules and forms, and that such information is accumulated and communicated to our management, including our Chief Executive Officer and Chief Financial Officer, as appropriate, to allow timely decisions regarding required disclosure.
Management’s Report on Internal Control over Financial Reporting
Our management is responsible for establishing and maintaining adequate internal control over financial reporting. Our management conducted an evaluation of the effectiveness of our internal control over financial reporting based on the framework in Internal Control—Integrated Framework (2013) issued by the Committee of Sponsoring Organizations of the Treadway Commission. Based on this evaluation, management concluded that our internal control over financial reporting was effective as of December 31, 2022. Management reviewed the results of its assessment with our Audit Committee.
Our independent registered public accounting firm, Ernst & Young LLP, independently assessed the effectiveness of our internal control over financial reporting, as stated in the firm’s attestation report, which appears in Part II, Item 8 of this Annual Report on Form 10-K.
Changes in Internal Control over Financial Reporting
There were no changes in our internal control over financial reporting that occurred during the quarter ended December 31, 2022, that have materially affected, or are reasonably likely to materially affect, our internal control over financial reporting.
Limitations on Effectiveness of Controls and Procedures
In designing and evaluating the disclosure controls and procedures, management recognizes that any controls and procedures, no matter how well designed and operated, can provide only reasonable assurance of achieving the desired control objectives. In addition, the design of disclosure controls and procedures must reflect the fact that there are resource constraints and that management is required to apply its judgment in evaluating the benefits of possible controls and procedures relative to their costs.
| Other Information |
None.
| Disclosure Regarding Foreign Jurisdictions that Prevent Inspections |
Not applicable.
| Directors, Executive Officers and Corporate Governance |
Reference is made to the information regarding directors and nominees, code of ethics, corporate governance matters and disclosure relating to compliance with Section 16(a) of the Securities Exchange Act of 1934 appearing under the captions “Election of Directors” and “Delinquent Section 16(a) Reports” in the Company’s Proxy Statement for its 2023 Annual Meeting of Stockholders (the “2023 Annual Meeting”), which information is incorporated in this Annual Report on Form 10-K by reference. Information regarding executive officers is set forth under the caption “Information about Executive Officers” in Part I of this Annual Report on Form 10-K.
| Executive Compensation |
The information required by this item will be set forth under the caption “Executive Officer Compensation” in the Company’s Proxy Statement for the 2023 Annual Meeting, and is incorporated herein by reference.
| Security Ownership of Certain Beneficial Owners and Management and Related Stockholder Matters |
The information required by this item will be set forth under the captions “Security Ownership of Certain Beneficial Owners and Management” and “Equity Compensation Plan Information” in the Company’s Proxy Statement for the 2023 Annual Meeting, and is incorporated herein by reference.
| Certain Relationships and Related Transactions, and Director Independence |
The information required by this item will be set forth under the captions “Certain Relationships and Related Transactions” and “Election of Directors” in the Company’s Proxy Statement for the 2023 Annual Meeting, and is incorporated herein by reference.
| Principal Accountant Fees and Services |
The information required by this item will be set forth under the caption “Audit and Other Fees” in the Company’s Proxy Statement for the 2023 Annual Meeting, and is incorporated herein by reference.
| Exhibits and Financial Statement Schedules |
(a) Documents filed as part of this report
(1) All financial statements
| Page |
|
| 41 | |
| 43 | |
| 44 | |
| 45 | |
| 46 | |
| 47 | |
| 48 |
(2) Financial Statement Schedules
All schedules have been omitted because the required information is not present or not present in amounts sufficient to require submission of the schedules, or because the information required is included in the consolidated financial statements or notes thereto.
(3) Exhibits
| Exhibit Number |
Description |
|
|
|
||
| 3.1 (1) |
||
|
|
||
| 3.2 (2) |
Amended and Restated Bylaws of Monolithic Power Systems, Inc., effective April 26, 2022. |
|
|
|
||
| 4.1 (3) |
||
|
|
||
| 10.1+ (4) |
Registrant’s 2004 Employee Stock Purchase Plan and form of subscription agreement. |
|
|
|
||
| 10.2+ (5) |
||
|
|
||
| 10.3+ (6) |
Employment Agreement with Michael Hsing, and Amendment thereof. |
|
|
|
||
| 10.4+ (7) |
Employment Agreement with Maurice Sciammas, and Amendment thereof. |
|
|
|
||
| 10.5+ (8) |
||
|
|
||
| 10.6+(9) |
Employment Agreement with Deming Xiao, and Amendment thereof. |
|
|
|
||
| 10.7+(10) |
||
|
|
||
| 10.8+(11) |
||
|
|
||
| 10.9+(12) |
Monolithic Power Systems, Inc. Master Cash Performance Bonus Plan. |
|
|
|
||
| 10.10+(13) |
||
|
|
||
| 10.11+(14) |
Monolithic Power Systems, Inc. 2004 Equity Incentive Plan, as Amended, and Form of Grant Agreement. |
|
|
|
||
| 10.12+(15) |
Monolithic Power Systems, Inc. 2014 Equity Incentive Plan, as Amended, and Form of Grant Agreement. |
| 10.13+(16) |
||
|
|
||
| 10.14+(17) |
Employment Agreement with Saria Tseng and Amendment thereof. |
|
|
|
||
| 10.15+(18) |
Monolithic Power Systems, Inc. Amended and Restated 2014 Equity Incentive Plan. |
|
|
|
||
| 10.16+(19) |
||
|
|
||
| 10.17+(20) |
||
|
|
||
| 10.18+(21) |
||
|
|
||
| 10.19+(22) | Letter Agreement with Eileen Wynne. | |
| 10.20+(23) | Indemnification Agreement with Eileen Wynne. | |
| 21.1 |
||
|
|
||
| 23.1 |
||
|
|
||
| 24.1 |
Power of Attorney (included on Signature page to this Form 10-K). |
|
|
|
||
| 31.1 |
||
|
|
||
| 31.2 |
||
|
|
||
| 32.1* |
||
|
|
||
| 101.INS |
Inline XBRL Instance Document - the instance document does not appear in the Interactive Data File because its XBRL tags are embedded within the Inline XBRL document |
|
|
|
||
| 101.SCH |
Inline XBRL Taxonomy Extension Schema Document |
|
|
|
||
| 101.CAL |
Inline XBRL Taxonomy Extension Calculation Linkbase Document |
|
|
|
||
| 101.DEF |
Inline XBRL Taxonomy Extension Definition Linkbase Document |
|
|
|
||
| 101.LAB |
Inline XBRL Taxonomy Extension Label Linkbase Document |
|
|
|
||
| 101.PRE |
Inline XBRL Taxonomy Extension Presentation Linkbase Document |
|
|
|
||
| 104 |
Cover Page Interactive Data File (formatted as Inline XBRL and contained in Exhibit 101) |
| + |
Management contract or compensatory plan or arrangement. |
| * |
This exhibit shall not be deemed “filed” for purposes of Section 18 of the Securities Exchange Act of 1934 or otherwise subject to the liabilities of that Section, nor shall it be deemed incorporated by reference in any filings under the Securities Act of 1933 or the Securities Exchange Act of 1934, whether made before or after the date hereof and irrespective of any general incorporation language in any filings. |
| (1) |
Incorporated by reference to Exhibit 3.2 of the Registrant’s Registration Statement on Form S-1/A (Registration No. 333-117327), filed with the Securities and Exchange Commission on November 15, 2004. |
| (2) |
Incorporated by reference to Exhibit 3.1 of the Registrant’s current report on Form 8-K (File No. 000-51026), filed with the Securities and Exchange Commission on April 27, 2022. |
| (3) |
Incorporated by reference to Exhibit 4.1 of the Registrant’s annual report on Form 10-K (File No. 000-51026), filed with the Securities and Exchange Commission on February 28, 2020. |
| (4) |
Incorporated by reference to Exhibit 10.3 of the Registrant’s Registration Statement on Form S-1/A (Registration No. 333-117327), filed with the Securities and Exchange Commission on November 15, 2004. |
| (5) |
Incorporated by reference to Exhibit 10.4 of the Registrant’s Registration Statement on Form S-1/A (Registration No. 333-117327), filed with the Securities and Exchange Commission on November 15, 2004. |
| (6) |
Incorporated by reference to Exhibit 10.7 of the Registrant’s annual report on Form 10-K (File No. 000-51026), filed with the Securities and Exchange Commission on March 11, 2008 and Exhibit 10.1 of the Registrant’s current report on Form 8-K (File No. 000-51026), filed with the Securities and Exchange Commission on December 19, 2008. |
| (7) |
Incorporated by reference to Exhibit 10.8 of the Registrant’s annual report on Form 10-K (File No. 000-51026), filed with the Securities and Exchange Commission on March 11, 2008 and Exhibit 10.3 of the Registrant’s current report on Form 8-K (File No. 000-51026), filed with the Securities and Exchange Commission on December 19, 2008. |
| (8) |
Incorporated by reference to Exhibit 10.9 of the Registrant’s Registration Statement on Form S-1 (Registration No. 333-117327), filed with the Securities and Exchange Commission on July 13, 2004. |
| (9) |
Incorporated by reference to Exhibit 10.10 of the Registrant’s annual report on Form 10-K (File No. 000-51026), filed with the Securities and Exchange Commission on March 11, 2008 and Exhibit 10.4 of the Registrant’s current report on Form 8-K (File No. 000-51026), filed with the Securities and Exchange Commission on December 19, 2008. |
| (10) |
Incorporated by reference to Exhibit 10.1 of the Registrant’s current report on Form 8-K (File No. 000-51026), filed with the Securities and Exchange Commission on September 14, 2006. |
| (11) |
Incorporated by reference to Exhibit 10.1 of the Registrant’s current report on Form 8-K (File No. 000-51026), filed with the Securities and Exchange Commission on February 3, 2010. |
| (12) |
Incorporated by reference to Annexure C of the Registrant’s Proxy Statement on Schedule 14A (File No. 000-51026), filed with the Securities and Exchange Commission on April 30, 2013. |
| (13) |
Incorporated by reference to Exhibit 10.36 of the Registrant’s annual report on Form 10-K (File No. 000-51026), filed with the Securities and Exchange Commission on March 10, 2014. |
| (14) |
Incorporated by reference to Exhibit 4.4 of the Registrant’s Registration Statement on Form S-8 (Registration No. 333-199782), filed with the Securities and Exchange Commission on November 3, 2014. |
| (15) |
Incorporated by reference to Exhibit 4.6 of the Registrant’s Registration Statement on Form S-8 (Registration No. 333-199782), filed with the Securities and Exchange Commission on November 3, 2014. |
| (16) |
Incorporated by reference to Exhibit 10.1 of the Registrant’s current report on Form 8-K (File No. 000-51026), filed with the Securities and Exchange Commission on July 22, 2016. |
| (17) |
Incorporated by reference to Exhibit 10.14 of the Registrant’s annual report on Form 10-K (File No. 000-51026), filed with the Securities and Exchange Commission on February 28, 2020. |
| (18) |
Incorporated by reference to Annexure B of the Registrant’s Proxy Statement on Schedule 14A (File No. 000-51026), filed with the Securities and Exchange Commission on April 29, 2020. |
| (19) |
Incorporated by reference to Exhibit 10.1 of the Registrant’s quarterly report on Form 10-Q (File No. 000-51026), filed with the Securities and Exchange Commission on November 6, 2020. |
| (20) |
Incorporated by reference to Exhibit 10.1 of the Registrant’s current report on Form 8-K (File No. 000-51026), filed with the Securities and Exchange Commission on May 28, 2021. |
| (21) |
Incorporated by reference to Exhibit 10.2 of the Registrant’s current report on Form 8-K (File No. 000-51026), filed with the Securities and Exchange Commission on May 28, 2021. |
| (22) | Incorporated by reference to Exhibit 10.1 of the Registrant’s current report on Form 8-K (File No. 000-51026), filed with the Securities and Exchange Commission on February 8, 2023. |
| (23) | Incorporated by reference to Exhibit 10.2 of the Registrant’s current report on Form 8-K (File No. 000-51026), filed with the Securities and Exchange Commission on February 8, 2023. |
| Form 10-K Summary |
None.
Pursuant to the requirements of Section 13 or 15(d) of the Securities Exchange Act of 1934, the registrant has duly caused this report to be signed on its behalf by the undersigned, thereunto duly authorized.
| MONOLITHIC POWER SYSTEMS, INC. |
|||
| Date: February 24, 2023 |
By: |
/s/ Michael Hsing |
|
| Michael Hsing |
|||
| President and Chief Executive Officer |
|||
KNOW ALL PERSONS BY THESE PRESENTS, that each person whose signature appears below constitutes and appoints Michael Hsing and T. Bernie Blegen, jointly and severally, his or her attorneys-in-fact, each with the power of substitution, for him or her in any and all capacities, to sign any amendments to this report, and to file the same, with exhibits thereto and other documents in connection therewith, with the Securities and Exchange Commission, hereby ratifying and confirming all that each of said attorneys-in-fact, or his or her substitute or substitutes, may do or cause to be done by virtue hereof.
Pursuant to the requirements of the Securities Exchange Act of 1934, this report has been signed below on February 24, 2023 by the following persons on behalf of the registrant and in the capacities indicated:
| /s/ Michael Hsing |
President, Chief Executive Officer, and Director (Principal Executive Officer) |
|
| MICHAEL HSING |
||
| /s/ T. Bernie Blegen |
Chief Financial Officer (Principal Financial and Accounting Officer) |
|
| T. BERNIE BLEGEN |
||
| /s/ Herbert Chang |
Director |
|
| HERBERT CHANG |
||
| /s/ Eugen Elmiger |
Director |
|
| EUGEN ELMIGER |
||
| /s/ Victor K. Lee |
Director |
|
| VICTOR K. LEE |
||
| /s/ Carintia Martinez |
Director |
|
| CARINTIA MARTINEZ |
||
| /s/ James C. Moyer |
Director |
|
| JAMES C. MOYER |
||
| /s/ Eileen Wynne |
Director |
|
| EILEEN WYNNE |
||
| /s/ Jeff Zhou | Director | |
| JEFF ZHOU |
ATTACHMENTS / EXHIBITS
XBRL TAXONOMY EXTENSION SCHEMA
XBRL TAXONOMY EXTENSION CALCULATION LINKBASE
XBRL TAXONOMY EXTENSION DEFINITION LINKBASE
XBRL TAXONOMY EXTENSION LABEL LINKBASE
XBRL TAXONOMY EXTENSION PRESENTATION LINKBASE
Serious News for Serious Traders! Try StreetInsider.com Premium Free!
You May Also Be Interested In
- Monolithic Power Systems to Report First Quarter 2024 Results on May 1, 2024
- NEXEN Tire hosts ‘2024 Purple Summit Korea’
- GoviEx Uranium Reports on Discussions with the Government of Niger Regarding Its Mining Permit
Create E-mail Alert Related Categories
SEC FilingsSign up for StreetInsider Free!
Receive full access to all new and archived articles, unlimited portfolio tracking, e-mail alerts, custom newswires and RSS feeds - and more!
