

Form 10-K Investors Bancorp, Inc. For: Dec 31
 Tweet
Tweet Share
ShareUNITED STATES
SECURITIES AND EXCHANGE COMMISSION
Washington, D.C. 20549
Form 10-K
| ANNUAL REPORT PURSUANT TO SECTION 13 OR 15(d) OF THE SECURITIES EXCHANGE ACT OF 1934 | |||||
For the Fiscal Year Ended December 31 , 2020
| TRANSITION REPORT PURSUANT TO SECTION 13 OR 15(d) OF THE SECURITIES EXCHANGE ACT OF 1934 | |||||
For the transition period from to
Commission File No. 001-36441
(Exact name of registrant as specified in its charter)
| (State or other jurisdiction of incorporation or organization) | (I.R.S. Employer Identification Number) | |||||||||||||
| (Address of Principal Executive Offices) | Zip Code | |||||||||||||
(973 ) 924-5100
(Registrant’s telephone number)
Securities Registered Pursuant to Section 12(b) of the Act:
| Title of each class | Trading Symbol(s) | Name of each exchange on which registered | ||||||||||||
Securities Registered Pursuant to Section 12(g) of the Act:
None
Indicate by check mark if the registrant is a well-known seasoned issuer, as defined in Rule 405 of the Securities Act. Yes ☑ No ☐
Indicate by check mark if the registrant is not required to file reports pursuant to Section 13 or Section 15(d) of the Act. Yes ☐ No ☑
Indicate by check mark whether the registrant (1) has filed all reports required to be filed by Section 13 or 15(d) of the Securities Exchange Act of 1934 during the preceding twelve months (or for such shorter period that the Registrant was required to file such reports) and (2) has been subject to such requirements for the past 90 days. Yes ☑ No ☐
Indicate by check mark whether the registrant has submitted electronically every Interactive Data File required to be submitted pursuant to Rule 405 of Regulation S-T during the preceding 12 months (or for such shorter period that the registrant was required to submit such files). Yes ☑ No ☐
Indicate by check mark whether the registrant is a large accelerated filer, an accelerated filer, a non-accelerated filer, a smaller reporting company, or an emerging growth company. See the definitions of “large accelerated filer,” “accelerated filer,” “smaller reporting company,” and “emerging growth company” in Rule 12b-2 of the Exchange Act.
| ☑ | Accelerated filer | ☐ | ||||||||||||||||||||||||
| Non-accelerated filer | ☐ | Smaller reporting company | ||||||||||||||||||||||||
| Emerging growth company | ||||||||||||||||||||||||||
If an emerging growth company, indicate by check mark if the registrant has elected not to use the extended transition period for complying with any new or revised financial accounting standards provided pursuant to Section 13(a) of the Exchange Act. ☐
Indicate by check mark whether the registrant has filed a report on and attestation to its management’s assessment of the effectiveness of its internal control over financial reporting under Section 404(b) of the Sarbanes-Oxley Act (15 U.S.C. 7262(b)) by the registered public accounting firm that prepared or issued its audit report. ☑
Indicate by check mark whether the registrant is a shell company (as defined in Rule 12b-2 of the Exchange Act). Yes ☐ No ☑
As of February 19, 2021, the registrant had 361,869,872 shares of common stock, par value $0.01 per share, issued and 247,386,035 shares outstanding.
The aggregate market value of the voting and non-voting common equity held by non-affiliates of the registrant, computed by reference to the last sale price on June 30, 2020, as reported by the NASDAQ Global Select Market, was approximately $1.94 billion.
DOCUMENTS INCORPORATED BY REFERENCE
INVESTORS BANCORP, INC.
2020 ANNUAL REPORT ON FORM 10-K
TABLE OF CONTENTS
| Page | ||||||||
| Part I. | ||||||||
| Item 1. | ||||||||
| Item 1A. | ||||||||
| Item 1B. | ||||||||
| Item 2. | ||||||||
| Item 3. | ||||||||
| Item 4. | ||||||||
| Part II. | ||||||||
| Item 5. | ||||||||
| Item 6. | ||||||||
| Item 7. | ||||||||
| Item 7A. | ||||||||
| Item 8. | ||||||||
| Item 9. | ||||||||
| Item 9A. | ||||||||
| Item 9B. | ||||||||
| Part III. | ||||||||
| Item 10. | ||||||||
| Item 11. | ||||||||
| Item 12. | ||||||||
| Item 13. | ||||||||
| Item 14. | ||||||||
| Part IV. | ||||||||
| Item 15. | ||||||||
| Item 16. | ||||||||
PRIVATE SECURITIES LITIGATION REFORM ACT SAFE HARBOR STATEMENT
This Annual Report on Form 10-K contains a number of forward-looking statements within the meaning of Section 27A of the Securities Act of 1933, as amended, or the Securities Act, and Section 21E of the Securities Exchange Act of 1934, as amended, or the Exchange Act. These statements may be identified by the use of the words “anticipate,” “believe,” “could,” “estimate,” “expect,” “intend,” “may,” “outlook,” “plan,” “potential,” “predict,” “project,” “should,” “will,” “would” and similar terms and phrases, including references to assumptions.
Forward-looking statements are based on various assumptions and analyses made by us in light of our management’s experience and its perception of historical trends, current conditions and expected future developments, as well as other factors we believe are appropriate under the circumstances. These statements are not guarantees of future performance and are subject to risks, uncertainties and other factors (many of which are beyond our control) that could cause actual results to differ materially from future results expressed or implied by such forward-looking statements. These factors are outlined in Item 1A. Risk Factors herein and include, without limitation, the following:
•the timing and occurrence or non-occurrence of events may be subject to circumstances beyond our control;
•there may be increases in competitive pressure among financial institutions or from non-financial institutions;
•changes in the interest rate environment may reduce interest margins or affect the value of our investments or derivative instruments;
•changes in deposit flows, loan demand or real estate values may adversely affect our business;
•changes in accounting principles, policies or guidelines may cause our financial condition to be perceived differently;
•general economic conditions, either nationally or locally in some or all areas in which we do business, or conditions in the real estate or securities markets or the banking industry may be less favorable than we currently anticipate;
•legislative or regulatory changes may adversely affect our business;
•technological changes may be more difficult or expensive than we anticipate;
•the COVID-19 pandemic may continue to adversely impact the local and national economy and our business and results of operations may continue to be adversely affected;
•success or consummation of new business initiatives may be more difficult or expensive than we anticipate;
•litigation or other matters before regulatory agencies, whether currently existing or commencing in the future, may be determined adverse to us or may delay the occurrence or non-occurrence of events longer than we anticipate;
•the risks associated with continued diversification and growth of assets and adverse changes to credit quality;
•difficulties associated with achieving expected future financial results;
•impact on our financial performance associated with the effective deployment of capital; and
•the risk of an economic slowdown that would adversely affect credit quality and loan originations.
We have no obligation to update any forward-looking statements to reflect events or circumstances after the date of this document.
As used in this Form 10-K, “we,” “us” and “our” refer to Investors Bancorp, Inc. and its consolidated subsidiary, Investors Bank. Investors Bancorp, Inc.’s electronic filings with the SEC, including the Annual Report on Form 10-K, Quarterly Reports on Form 10-Q, Current Reports on Form 8-K and amendments to these reports filed or furnished pursuant to Sections 13(a) or 15(d) of the Exchange Act, as amended, are made available at no cost in the Investor Relations section of the Company’s website, www.investorsbank.com, as soon as reasonably practicable after the Company files such material with, or furnishes it to, the SEC. The Company’s SEC filings are also available through the SEC’s website at www.sec.gov.
PART I
| ITEM 1. | BUSINESS | ||||
Investors Bancorp, Inc. (the “Company”) is a Delaware corporation and the holding company for Investors Bank (the “Bank”). At December 31, 2020, the Company had 361,869,872 common stock issued and 247,929,216 outstanding.
The Company is subject to regulation as a bank holding company by the Federal Reserve Board. The Company neither owns nor leases any property, but instead uses the premises, equipment and furniture of the Bank. The Company currently employs as officers only certain persons who are also officers of the Bank and uses the support staff of the Bank from time to time. These persons are not separately compensated by the Company. The Company may hire additional employees, as appropriate, to the extent it expands its business in the future.
1
The Bank is a New Jersey-chartered commercial bank headquartered in Short Hills, New Jersey. Originally founded in 1926 as a New Jersey-chartered mutual savings and loan association, it has grown through acquisitions and internal growth, including de novo branching. In 1992, the charter was converted to a mutual savings bank and in 1997 the charter was converted to a New Jersey-chartered stock savings bank in connection with a reorganization into the mutual holding company structure. In 2019, the charter was converted to a New Jersey-chartered commercial bank.
The Bank is in the business of attracting deposits from the public through its branch network and a secure online channel and borrowing funds in the wholesale markets to originate loans and to invest in securities. The Bank originates multi-family loans, commercial real estate loans, commercial and industrial (“C&I”) loans, one-to four- family residential mortgage loans secured by one- to four-family residential real estate, construction loans and consumer loans, the majority of which are cash surrender value lending on life insurance contracts, home equity loans and home equity lines of credit. Securities, primarily mortgage-backed securities, U.S. Government and Federal Agency obligations, and other securities represented 15.5% of consolidated assets at December 31, 2020. The Bank is subject to comprehensive regulation and examination by the New Jersey Department of Banking and Insurance (“NJDOBI”), the Federal Deposit Insurance Corporation (“FDIC”) and the Consumer Financial Protection Bureau (“CFPB”).
COVID-19 Pandemic
During 2020 and continuing into 2021, the entire country has been negatively impacted by the COVID-19 pandemic. Beginning in March 2020, the impacts of the COVID-19 pandemic, including social distancing guidelines, closure of non-essential businesses and shelter-at-home mandates, caused a global economic downturn. The economic downturn included an increase in unemployment and a decline in gross domestic product. Since April 2020, the unemployment rate has declined but remains elevated above the pre-pandemic unemployment rate. Gross domestic product grew in the third and fourth quarters of 2020 after declining in the first and second quarters. The COVID-19 pandemic and its impact on the economy have led to actions including the enactment of the Coronavirus Aid, Relief and Economic Security Act (“CARES Act”), the establishment of the Paycheck Protection Program (“PPP”) administered by the Small Business Administration (“SBA”) and Economic Impact Payments paid directly to eligible individuals from the Internal Revenue Service. In addition, the Federal Reserve reduced the federal funds target rate by 150 basis points in March 2020. On December 27, 2020, the Consolidated Appropriations Act, 2021, was enacted and included a reopening of the PPP, additional Economic Impact Payments and extension of several unemployment insurance benefit programs and other provisions of the CARES Act.
We continue to monitor developments related to COVID-19, including, but not limited to, its impact on our employees, customers, communities and results of operations. During the first quarter of 2020, the majority of our corporate workforce had transitioned to working remotely and we successfully transitioned to a “limited service” branch model including drive-thru operations and ATM services, as well as in-branch services available by appointment only. During the second quarter of 2020, all of our branches resumed normal operating hours and all lobbies re-opened for our clients. In addition, a portion of our corporate workforce has returned to our corporate offices in some capacity while the remainder continue to work remotely in an effective manner. Proper protocols have been put in place in our branches and corporate offices to ensure the continued safety of our employees and customers.
As a result of the pandemic, certain borrowers are currently unable to meet their contractual payment obligations. In an effort to mitigate these effects, we have worked with our customers in offering short-term modifications in the form of a deferral of payment, or portion thereof. In the absence of other intervening factors, such short-term modifications or deferrals made on a good faith basis are not categorized as troubled debt restructurings in accordance with the CARES Act. We have also waived and reduced certain fees. While we have continued to support our customers by granting payment deferrals for those experiencing continued hardship because of the pandemic, we have also worked diligently with our customers to ensure a return to current payment status for a significant portion of our clients who have ended their deferral period. At February 14, 2021, loans with an aggregate outstanding balance of approximately $756 million were in COVID-19 related deferment.
We have offered increased mobile deposit limits and increased customer support through our call center and bankers to further support our customers. Our continued focus on digital transformation and implementation of online account opening during 2020 has also benefited our customers. We have also waived and reduced certain fees. In addition, we have participated in government-sponsored programs including PPP and Main Street Lending. During 2020, we originated approximately $335 million of PPP loans and subsequently sold approximately $328 million of these PPP loans to a well-established SBA lender that could continue to assist our customers in the forgiveness process. We will continue to support our customers to ensure they are able to participate in government-sponsored economic relief programs.
We continue to provide support to our communities through grants from the Investors Foundation, as well as through the actions of our employees. Most notably, the Investors Foundation granted $100,000 to Stony Brook University Hospital Foundation on Long Island to support its treatment of patients suffering from COVID-19 and will be providing a grant to a regional hospital to establish the Investors Bank Post-COVID Care Center to serve as both a clinical and research-based facility to support and treat post-COVID patients. The Investors Foundation made grants of approximately $4 million during 2020. In
2
addition, our employees have provided meals and other support to healthcare workers and their families through the New York metro area.
Our Business Strategy
Since the Company’s initial public offering in 2005, we have transitioned from a wholesale thrift business to a retail commercial bank. This transition has been primarily accomplished by increasing the amount of our commercial loans and core deposits (savings, checking and money market accounts). Our transformation can be attributed to a number of factors, including organic growth, de novo branch openings, bank and branch acquisitions, as well as product expansion. We believe the attractive markets we operate in, namely, New Jersey and the greater New York metropolitan area, will continue to provide us with growth opportunities. In addition, the Bank has national exposure through our Investors eAccess online deposit platform and our equipment finance, healthcare and leveraged lending portfolios. Our primary focus is to build and develop profitable customer relationships across all lines of business, both consumer and commercial.
Opportunities through Our Attractive Markets
The primary markets in which we have a retail presence are considered attractive banking markets within the United States, and we believe they will continue to provide us with opportunities to grow. We have expanded our retail franchise to include the suburbs of Philadelphia and the boroughs of New York City as well as Nassau and Suffolk Counties on Long Island. With the December 2020 agreement to acquire eight branches from Berkshire Hills Bancorp, Inc., we will expand our branch footprint by adding two branches in affluent Pennsylvania markets once the transaction closes in 2021. Additionally, we have strengthened our presence in our historic markets throughout New Jersey. We accomplished this expansion through de novo growth and select bank and branch acquisitions. As a result of this growth, the Bank is one of the largest banks headquartered in the state of New Jersey as measured by New Jersey deposits as of June 30, 2020. The markets in which we operate are desirable from an economic and demographic perspective as they are characterized by large and dense population centers, areas of high income households and centers of robust business and commercial activity. Our competition in these markets tends to be from out-of-state headquartered money centers and super-regional financial institutions as well as smaller, local community banks. We believe that as a locally headquartered institution, situated between these extremes, we can compete and capitalize on opportunities that exist in our market area. We continue to examine our branch network to optimize our market presence, which may include branch rationalization plans.
Many of the counties we serve are projected to experience moderate to strong household income growth through 2026. Though slower population growth is projected for many of the counties we serve, it is important to note that these counties are densely populated. All of the counties we serve have a strong mature market and nearly all have median household incomes greater than the national median.
We face intense competition in making loans as well as attracting deposits in our market area. Our competition for loans and deposits comes principally from commercial banks, savings institutions, mortgage banking firms, credit unions, insurance companies and new technology-driven market entrants. We face additional competition for deposits from short-term money market funds, brokerage firms and mutual funds. Some of our competitors offer products and services that we currently do not offer, such as trust services and private banking. As of June 30, 2020, the latest date for which statistics are available, our market share of deposits was ranked in the top 10 of total deposits in the State of New Jersey and in the top 20 within the New York metropolitan area for all institutions.
Diversifying the Loan Portfolio
To further diversify our loan portfolio, we have increased C&I lending by building relationships with small to medium sized companies. In recent years, we have hired a number of experienced C&I lending teams, including a team specializing in the healthcare industry, and in 2018, we acquired an equipment finance team and portfolio. For the year ended December 31, 2020, excluding $335 million of PPP loan originations, we originated $721 million in C&I loans. A significant portion of our C&I loans are secured by commercial real estate and are primarily on properties and businesses located in New Jersey and New York. In addition, we have national exposure through our equipment finance, healthcare and leveraged lending portfolios. Our Equipment Finance Group originates equipment finance loans and leases which are primarily secured by critical use assets. We have diversified our loan portfolio, as evidenced by the fact that C&I loans represent approximately 17% of our loan portfolio at December 31, 2020 as compared to December 31, 2016, when C&I loans were approximately 7% of total loans. Diversifying our loan portfolio will continue to be a major focus of our business strategy going forward, however, we are mindful of concentrations as it pertains to capital.
3
Deposit Strategy
We are focused on generating relationship-based core deposits (savings, checking and money market accounts). As of December 31, 2020, we had core deposits of $16.81 billion, representing approximately 86% of total deposits. Core deposits are an attractive funding alternative because they are generally a more stable source of low cost funding and are less sensitive to changes in market interest rates. The percent of non-interest bearing deposits to total deposits has grown to 19% at December 31, 2020. Despite intense competition for deposits, we will continue to pursue a customer-centric model to meeting their financial needs and continue to invest in branch staff training, product development, de novo branch growth based on existing market presence and acquired branches, as well as commercial deposit gathering efforts. Over the past few years we have developed a suite of commercial deposit and treasury management products, designed to appeal to small and mid-sized businesses and non-profit organizations including electronic deposit services such as mobile and remote deposit capture.
Our deposit business has become more commercial oriented over the past few years as we attract more deposits from commercial entities, including businesses that borrow from us. The Bank is one of the largest depositories for government and municipal deposits in New Jersey, which provides us with an additional funding source. Government and municipal deposits were 28.2% of our total deposits at December 31, 2020. Our branch network, concentrated in markets with attractive demographics and a high-density population, will continue to provide us with opportunities to grow and improve our deposit base. During 2020, we saw a notable increase in our deposits as a result of the current economic environment including government stimulus and increased savings rates.
Digital Capabilities and Strategy
In addition to our branch network, we offer online banking capabilities for consumers and small businesses. We are always looking to enhance our mobile and online banking services which allow us to serve our customers’ needs in an omnichannel environment. We offer account opening capabilities on our website and also offer online-exclusive deposit accounts through Investors eAccess, a secure online channel to attract consumer deposits nationwide. Other capabilities include Zelle® for real-time person to person payments, the ability to view personal credit scores, and online alerts. For our commercial customers, we have Small Business Online Banking and Commercial Online Banking, including robust online treasury management services.
In addition to our deposit-related digital capabilities, we continue to enhance our digital capabilities related to originating and servicing loans. We have partnered with ODX, a leading digital small business originations platform, to streamline our small business lending process. We continue to enhance our digital capabilities as a way to enhance the customer experience and deliver our products and services in a safe and secure manner.
Acquisitions
A significant portion of our historic growth can be attributed to our acquisition strategy. Although management evaluates a number of factors when considering an acquisition, we have maintained a fundamental focus on preserving tangible book value per share. Acquisitions have provided us with the opportunity to grow our business, expand our geographic footprint and improve our financial performance. We intend to continue to evaluate potential acquisition opportunities that may present themselves in the future while maintaining the financial and pricing discipline that we have adhered to in the past.
On December 2, 2020, we announced the signing of a definitive purchase and assumption agreement under which we will acquire the eight New Jersey and eastern Pennsylvania branches of Berkshire Bank, the wholly-owned subsidiary of Berkshire Hills Bancorp, Inc., including the assumption and acquisition of approximately $639.0 million of deposits and $308.0 million of consumer and commercial loans. Completion of the transaction is conditioned upon the receipt of all regulatory approvals.
On April 3, 2020, we completed the acquisition of Gold Coast Bancorp, Inc. (“Gold Coast Bancorp”) under which we acquired Gold Coast Bancorp. The acquisition included six branches in Nassau and Suffolk counties in suburban Long Island and one branch in Brooklyn, NY, as well as total assets of $535.3 million and deposits of $489.9 million.
On February 2, 2018, we completed the acquisition of a $345.8 million equipment finance portfolio. The acquisition included a seven-person team of financing professionals to lead our Equipment Finance Group, which is a part of our commercial lending group and is classified within our C&I loan portfolio.
Capital Management
Capital management is a key component of our business strategy. As of December 31, 2020, our tangible equity to asset ratio was 10.03%. We continue to manage our capital through a combination of organic growth, stock repurchases, dividends and acquisitions. Effective capital management and prudent growth allows us to effectively leverage our capital, while being mindful of tangible book value for stockholders. Since March 2015, we have repurchased 129.5 million shares totaling $1.56 billion at an average price per share of $12.07.
4
We have paid continuous quarterly dividends since September 2012. For the year ended December 31, 2020, our dividend payout ratio per share was approximately 51%. We have recently increased our quarterly dividend to $0.14 per share.
Involvement in Our Communities
The Bank proudly promotes a higher quality of life in the communities it serves in New Jersey and New York through employee volunteer efforts and our Charitable Foundations. Employees are continually encouraged to become leaders in their communities and use the Bank’s support to help others. Through the Investors Charitable Foundation, established in 2005, and the Roma Charitable Foundation, which we acquired in December 2013, the Bank has contributed or committed $43.8 million in donations to enrich the lives of New Jersey and New York citizens by supporting initiatives in the arts, education, youth development, affordable housing, financial education, and health and human services.
Community involvement is one of the principal values of the Bank and provides our staff with a meaningful ability to help others. We believe these efforts contribute to creating a culture at the Bank that promotes high employee morale while enhancing the presence of the Bank in our local markets. We continue to look for opportunities to help the communities we serve including during the COVID-19 pandemic.
Lending Activities
Our loan portfolio is comprised of multi-family loans, commercial real estate loans, C&I loans, construction loans, residential mortgage loans and consumer and other loans. At December 31, 2020, multi-family loans totaled $7.12 billion, or 34.1% of our total loan portfolio, commercial real estate loans totaled $4.95 billion, or 23.7% of our total loan portfolio, C&I loans totaled $3.58 billion, or 17.1% of our total loan portfolio, and construction loans totaled $404.4 million, or 2.0% of our total loan portfolio. Residential mortgage loans represented $4.12 billion, or 19.7% of our total loans at December 31, 2020. We also offer consumer loans, which consist primarily of cash surrender value lending on life insurance contracts, home equity loans and home equity lines of credit. At December 31, 2020, consumer and other loans totaled $702.8 million, or 3.4% of our total loan portfolio.
Our lending strategy at the beginning of 2020 was to continue to diversify our portfolio out of residential and multi-family loans and into higher-yielding C&I loans. This strategy was impacted by the low interest rate environment that began in March 2020, which led to an acceleration of loan prepayments during 2020. As a result of our strategy, the low rate environment during 2020 and the effects of the pandemic, our net loans decreased $895.6 million from December 31, 2019 to December 31, 2020, which was driven by a decline in residential loans of $1.02 billion and a decline in multi-family loans of $690.4 million.
5
Loan Portfolio Composition. The following table sets forth the composition of our loan portfolio by type of loan. Commercial loans are comprised of multi-family loans, commercial real estate loans, C&I loans and construction loans. Our primary focus over recent years has been on the origination of commercial loans.
| December 31, | |||||||||||||||||||||||||||||||||||||||||||||||
| 2020 | 2019 | 2018 | 2017 | 2016 | |||||||||||||||||||||||||||||||||||||||||||
| Amount | % | Amount | % | Amount | % | Amount | % | Amount | % | ||||||||||||||||||||||||||||||||||||||
| (Dollars in thousands) | |||||||||||||||||||||||||||||||||||||||||||||||
| Commercial loans: | |||||||||||||||||||||||||||||||||||||||||||||||
| Multi-family loans | $ | 7,122,840 | 34.1 | % | $ | 7,813,236 | 36.0 | % | $ | 8,165,187 | 37.7 | % | $ | 7,802,835 | 38.8 | % | $ | 7,459,131 | 39.6 | % | |||||||||||||||||||||||||||
| Commercial real estate loans | 4,947,212 | 23.7 | 4,831,347 | 22.3 | 4,786,825 | 22.1 | 4,548,101 | 22.6 | 4,452,300 | 23.7 | |||||||||||||||||||||||||||||||||||||
| Commercial and industrial loans | 3,575,641 | 17.1 | 2,951,306 | 13.6 | 2,389,756 | 11.1 | 1,625,375 | 8.1 | 1,275,283 | 6.8 | |||||||||||||||||||||||||||||||||||||
| Construction loans | 404,367 | 2.0 | 262,866 | 1.2 | 227,015 | 1.1 | 416,883 | 2.1 | 314,843 | 1.7 | |||||||||||||||||||||||||||||||||||||
| Total commercial loans | 16,050,060 | 76.9 | 15,858,755 | 73.1 | 15,568,783 | 72.0 | 14,393,194 | 71.6 | 13,501,557 | 71.8 | |||||||||||||||||||||||||||||||||||||
| Residential mortgage loans | 4,119,894 | 19.7 | 5,144,718 | 23.7 | 5,351,115 | 24.8 | 5,026,517 | 25.0 | 4,711,880 | 25.0 | |||||||||||||||||||||||||||||||||||||
| Consumer and other loans: | |||||||||||||||||||||||||||||||||||||||||||||||
| Cash surrender value | 411,734 | 2.0 | 370,245 | 1.7 | 344,628 | 1.6 | 279,355 | 1.4 | 191,949 | 1.0 | |||||||||||||||||||||||||||||||||||||
| Home equity credit lines | 216,451 | 1.0 | 226,136 | 1.0 | 246,198 | 1.1 | 251,654 | 1.3 | 240,518 | 1.3 | |||||||||||||||||||||||||||||||||||||
| Home equity loans | 70,801 | 0.3 | 101,332 | 0.5 | 114,207 | 0.5 | 137,964 | 0.7 | 161,356 | 0.9 | |||||||||||||||||||||||||||||||||||||
| Other | 3,815 | — | 2,083 | — | 2,833 | — | 2,164 | — | 3,442 | — | |||||||||||||||||||||||||||||||||||||
| Total consumer and other loans | 702,801 | 3.4 | 699,796 | 3.2 | 707,866 | 3.2 | 671,137 | 3.4 | 597,265 | 3.2 | |||||||||||||||||||||||||||||||||||||
| Total loans | $ | 20,872,755 | 100.0 | % | $ | 21,703,269 | 100.0 | % | $ | 21,627,764 | 100.0 | % | $ | 20,090,848 | 100.0 | % | $ | 18,810,702 | 100.0 | % | |||||||||||||||||||||||||||
Deferred fees, premiums and other, net (1) | (9,318) | 907 | (13,811) | (7,778) | (12,474) | ||||||||||||||||||||||||||||||||||||||||||
| Allowance for credit losses | (282,986) | (228,120) | (235,817) | (230,969) | (228,373) | ||||||||||||||||||||||||||||||||||||||||||
| Net loans | $ | 20,580,451 | $ | 21,476,056 | $ | 21,378,136 | $ | 19,852,101 | $ | 18,569,855 | |||||||||||||||||||||||||||||||||||||
(1) Included in deferred fees and premiums are accretable purchase accounting adjustments in connection with loans acquired and an adjustment to the carrying amount of the residential loans hedged when applicable.
6
The following table presents the Company’s loan portfolio at December 31, 2020 by industry sector:
| Segment/Industry | Loan Balance (in millions) | % of Total Segment | ||||||||||||
| Commercial and industrial: | ||||||||||||||
| Accommodation and food service | $ | 290 | 8.1 | % | ||||||||||
| Administrative and support and waste management | 127 | 3.6 | % | |||||||||||
| Agriculture, forestry, fishing and hunting | 19 | 0.5 | % | |||||||||||
| Arts, entertainment, and recreation | 50 | 1.4 | % | |||||||||||
| Construction | 282 | 7.9 | % | |||||||||||
| Educational service | 124 | 3.5 | % | |||||||||||
| Finance and insurance | 225 | 6.3 | % | |||||||||||
| Health care and social assistance | 663 | 18.5 | % | |||||||||||
| Information | 135 | 3.8 | % | |||||||||||
| Management of companies and enterprises | 5 | 0.1 | % | |||||||||||
| Manufacturing | 202 | 5.6 | % | |||||||||||
| Mining, quarrying, and oil and gas extraction | 50 | 1.4 | % | |||||||||||
| Professional, scientific, and technical services | 113 | 3.2 | % | |||||||||||
| Public administration | 1 | 0.0 | % | |||||||||||
| Real estate and rental | 584 | 16.3 | % | |||||||||||
| Retail trade - clothing, home, gasoline, health | 100 | 2.8 | % | |||||||||||
| Retail trade - sporting, hobby, vending, e-commerce | 22 | 0.6 | % | |||||||||||
| Transportation - air, rail, truck, water, pipeline | 232 | 6.5 | % | |||||||||||
| Utilities | 2 | 0.1 | % | |||||||||||
| Wholesale trade | 147 | 4.1 | % | |||||||||||
| Other | 203 | 5.7 | % | |||||||||||
| Total commercial and industrial | $ | 3,576 | 100.0 | % | ||||||||||
| Commercial real estate: | ||||||||||||||
| Accommodation and food service | $ | 106 | 2.1 | % | ||||||||||
| Arts, entertainment, and recreation | 15 | 0.3 | % | |||||||||||
| Health care and social assistance | 53 | 1.1 | % | |||||||||||
| Mixed use property | 477 | 9.6 | % | |||||||||||
| Office | 1,221 | 24.7 | % | |||||||||||
| Retail store | 902 | 18.2 | % | |||||||||||
| Shopping center | 953 | 19.3 | % | |||||||||||
| Warehouse | 769 | 15.5 | % | |||||||||||
| Other | 451 | 9.1 | % | |||||||||||
| Total commercial real estate | $ | 4,947 | 100.0 | % | ||||||||||
| Multi-family | 7,123 | |||||||||||||
| Construction | 404 | |||||||||||||
| Residential and consumer | 4,823 | |||||||||||||
| Total loans | $ | 20,873 | ||||||||||||
7
Portfolio Maturities. The following table summarizes the scheduled repayments of our loan portfolio based on contractual maturity or next repricing date at December 31, 2020. Overdraft loans are reported as being due in one year or less.
| At December 31, 2020 | |||||||||||||||||||||||||||||||||||||||||
| Multi-Family Loans | Commercial Real Estate Loans | Commercial and Industrial Loans | Construction Loans | Residential Mortgage Loans | Consumer and Other Loans | Total | |||||||||||||||||||||||||||||||||||
| (In thousands) | |||||||||||||||||||||||||||||||||||||||||
| Amounts Due: | |||||||||||||||||||||||||||||||||||||||||
| One year or less | $ | 757,858 | $ | 555,403 | $ | 941,381 | $ | 313,516 | $ | 264,838 | $ | 108,432 | $ | 2,941,428 | |||||||||||||||||||||||||||
| After one year: | |||||||||||||||||||||||||||||||||||||||||
| One to three years | 2,080,311 | 1,345,877 | 436,905 | 90,851 | 227,375 | 187,358 | 4,368,677 | ||||||||||||||||||||||||||||||||||
| Three to five years | 1,836,777 | 1,594,006 | 830,685 | — | 306,688 | 84,433 | 4,652,589 | ||||||||||||||||||||||||||||||||||
| Five to ten years | 2,226,991 | 1,166,010 | 931,349 | — | 677,964 | 126,747 | 5,129,061 | ||||||||||||||||||||||||||||||||||
| Ten to twenty years | 220,903 | 283,100 | 418,711 | — | 720,256 | 86,314 | 1,729,284 | ||||||||||||||||||||||||||||||||||
| Over twenty years | — | 2,816 | 16,610 | — | 1,922,773 | 109,517 | 2,051,716 | ||||||||||||||||||||||||||||||||||
| Total due after one year | 6,364,982 | 4,391,809 | 2,634,260 | 90,851 | 3,855,056 | 594,369 | 17,931,327 | ||||||||||||||||||||||||||||||||||
| Total loans | $ | 7,122,840 | $ | 4,947,212 | $ | 3,575,641 | $ | 404,367 | $ | 4,119,894 | $ | 702,801 | $ | 20,872,755 | |||||||||||||||||||||||||||
| Deferred fees, premiums and other, net | (9,318) | ||||||||||||||||||||||||||||||||||||||||
| Allowance for credit losses | (282,986) | ||||||||||||||||||||||||||||||||||||||||
| Net loans | $ | 20,580,451 | |||||||||||||||||||||||||||||||||||||||
The following table sets forth fixed- and adjustable-rate loans at December 31, 2020 that are contractually due after December 31, 2021.
| Due After December 31, 2021 | |||||||||||||||||
| Fixed | Adjustable | Total | |||||||||||||||
| (In thousands) | |||||||||||||||||
| Commercial loans: | |||||||||||||||||
| Multi-family loans | $ | 2,562,132 | $ | 3,802,850 | $ | 6,364,982 | |||||||||||
| Commercial real estate loans | 1,830,133 | 2,561,676 | 4,391,809 | ||||||||||||||
| Commercial and industrial loans | 1,933,730 | 700,530 | 2,634,260 | ||||||||||||||
| Construction loans | 90,851 | — | 90,851 | ||||||||||||||
| Total commercial loans | 6,416,846 | 7,065,056 | 13,481,902 | ||||||||||||||
| Residential mortgage loans | 2,961,002 | 894,054 | 3,855,056 | ||||||||||||||
| Consumer and other loans: | |||||||||||||||||
| Cash surrender value | — | 346,613 | 346,613 | ||||||||||||||
| Home equity credit lines | — | 177,121 | 177,121 | ||||||||||||||
| Home equity loans | 69,794 | — | 69,794 | ||||||||||||||
| Other | 841 | — | 841 | ||||||||||||||
| Total consumer and other loans | 70,635 | 523,734 | 594,369 | ||||||||||||||
| Total loans | $ | 9,448,483 | $ | 8,482,844 | $ | 17,931,327 | |||||||||||
Multi-family Loans. At December 31, 2020, $7.12 billion, or 34.1%, of our total loan portfolio was comprised of multi-family loans. Our policy generally has been to originate multi-family loans in New York, New Jersey and surrounding states, which represent approximately 96% of total multi-family loans at December 31, 2020. The multi-family loans in our portfolio consist of both fixed-rate and adjustable-rate loans, which were originated at prevailing market rates. Multi-family loans are generally five to fifteen year term balloon loans amortized over fifteen to thirty years.
Commercial Real Estate Loans. At December 31, 2020, $4.95 billion, or 23.7%, of our total loan portfolio was commercial real estate loans. We originate commercial real estate loans which are generally secured by industrial properties, retail buildings, office buildings and other commercial properties. As of December 31, 2020, commercial real estate loans in
8
New Jersey, New York and surrounding states represent approximately 93% of our commercial real estate loans. Commercial real estate loans in our portfolio consist of both fixed-rate and adjustable-rate loans which were originated at prevailing market rates. Commercial real estate loans are generally five to fifteen year term balloon loans amortized over fifteen to thirty years.
Commercial and Industrial Loans. At December 31, 2020, $3.58 billion, or 17.1%, of our total loan portfolio were classified as C&I loans. We offer a wide range of credit facilities to C&I clients throughout our geographic footprint and nationally. Our credit offerings are lines of credit, fixed-rate and adjustable-rate term loans, lease financing and letters of credit. A significant portion of our C&I loans are secured by commercial real estate and are primarily properties and businesses located in New Jersey and New York. Other collateral for these types of loans can be comprised of real estate, equipment and/or a lien on the general assets, including inventory and receivables of the underlying business, and in many cases are further supported by a personal guarantee of the owner. Our product offerings include certain C&I lending subspecialties that originate loans both locally and nationally, including leveraged lending, healthcare lending and equipment finance. Our equipment finance portfolio totaled $839.3 million, or 23.5% of our C&I portfolio at December 31, 2020 and has grown substantially from the $345.8 million portfolio acquired in February 2018. Our equipment finance portfolio, comprised of both loans and leases throughout the U.S., is primarily secured by critical use assets. At December 31, 2020, approximately 32% of our C&I loans were to borrowers outside of New Jersey and New York.
Construction Loans. At December 31, 2020, we held $404.4 million in construction loans representing 2.0% of our total loan portfolio. We offer loans directly to owners and developers on income-producing properties and residential for-sale housing units. Generally, construction loans are structured to have a three-year term and are made in amounts of up to 70% of the appraised value of the completed property, or a maximum up to the cost of the improvements. Funds are disbursed based on inspections in accordance with a schedule reflecting the completion of portions of the project. Construction financing for units to be sold require a pre-sale contract or we will limit the amount of speculative building without a sales contract.
Residential Mortgage Loans. At December 31, 2020, $4.12 billion, or 19.7%, of our loan portfolio consisted of residential mortgage loans. We originate residential mortgage loans for our loan portfolio and for sale to third parties. During 2020, we sold more of our residential mortgage loans originated into the secondary market. While we have also purchased mortgage loans from correspondent entities including other banks and mortgage brokers, we did not purchase such loans in 2020. Our agreements call for these correspondent entities to originate loans that adhere to our underwriting standards and we generally acquire the loans with servicing rights.
We offer various loan programs to provide financing for low-and moderate-income home buyers, some of which include down payment assistance for home purchases. Through these programs, qualified individuals receive a reduced rate of interest on most of our loan programs and have their application fee refunded at closing, as well as other incentives if certain conditions are met.
Consumer and Other Loans. At December 31, 2020, consumer loans totaled $702.8 million, or 3.4% of our total loan portfolio. We offer consumer loans, most of which consist of cash surrender value lending on life insurance contracts, home equity loans and home equity lines of credit. At December 31, 2020, cash surrender value loans totaled $411.7 million, or 59% of consumer and other loans. Acceptable credit history and FICO scores are reviewed along with the evaluation of the financial rating of the insurance carrier. Home equity loans and home equity lines of credit are secured by residences primarily located in New Jersey and New York. Home equity loans are offered with fixed rates of interest, with terms generally up to 20 years and to a maximum of $750,000. Home equity lines of credit have adjustable rates of interest, indexed to the prime rate.
9
Loan Originations and Purchases. The following table shows our loan originations, loan purchases and repayment activities with respect to our portfolio of loans receivable for the periods indicated. Origination, sale and repayment activities with respect to our loans-held-for-sale are excluded from the table.
| Years Ended December 31, | |||||||||||||||||
| 2020 | 2019 | 2018 | |||||||||||||||
| (In thousands) | |||||||||||||||||
| Loan originations and purchases | |||||||||||||||||
| Loan originations: | |||||||||||||||||
| Commercial loans: | |||||||||||||||||
| Multi-family loans | $ | 1,026,593 | $ | 793,611 | $ | 1,583,196 | |||||||||||
| Commercial real estate loans | 605,531 | 861,040 | 801,784 | ||||||||||||||
| Commercial and industrial loans | 1,056,086 | 1,271,773 | 957,722 | ||||||||||||||
| Construction loans | 129,595 | 69,790 | 104,530 | ||||||||||||||
| Total commercial loans | 2,817,805 | 2,996,214 | 3,447,232 | ||||||||||||||
| Residential mortgage loans | 652,501 | 462,618 | 593,642 | ||||||||||||||
| Consumer and other loans: | |||||||||||||||||
| Cash surrender value | 73,023 | 41,692 | 69,277 | ||||||||||||||
| Home equity credit lines | 26,802 | 22,704 | 31,184 | ||||||||||||||
| Home equity loans | 2,704 | 11,772 | 9,993 | ||||||||||||||
| Total consumer and other loans | 102,529 | 76,168 | 110,454 | ||||||||||||||
| Total loan originations | 3,572,835 | 3,535,000 | 4,151,328 | ||||||||||||||
| Loan purchases: | |||||||||||||||||
| Commercial loans: | |||||||||||||||||
| Multi-family loans | 42,500 | — | — | ||||||||||||||
| Commercial real estate loans | — | 19,681 | — | ||||||||||||||
| Commercial and industrial loans | 115,920 | 113,308 | 66,072 | ||||||||||||||
| Total commercial loans | 158,420 | 132,989 | 66,072 | ||||||||||||||
| Residential mortgage loans | — | 294,064 | 447,968 | ||||||||||||||
| Total loan purchases | 158,420 | 427,053 | 514,040 | ||||||||||||||
| Loans sold | (347,896) | (220,069) | — | ||||||||||||||
| Principal repayments | (4,667,506) | (3,658,317) | (3,472,097) | ||||||||||||||
Other items, net (1) | (59,137) | 14,254 | 2,017 | ||||||||||||||
| Net loans acquired in acquisition | 447,679 | — | 330,747 | ||||||||||||||
| Net increase in loan portfolio | $ | (895,605) | $ | 97,921 | $ | 1,526,035 | |||||||||||
(1) Other items include charge-offs and recoveries, impairment write-downs, loan loss provisions, loans transferred to other real estate owned, amortization and accretion of deferred fees and costs, discounts and premiums, purchase accounting adjustments, and an adjustment to the carrying amount of the residential loans hedged when applicable.
Credit Policy and Procedures
Loan Approval Procedures and Authority. The credit approval process provides for prompt and thorough underwriting and approval or decline of loan requests. The approval method used is a hierarchy of individual credit authorities for new credit requests and renewals according to the Bank’s credit policies. All commercial credit actions require a total of two signatures, one from the Bank’s business line and one from the Bank’s credit risk management group. Transactions exceeding certain thresholds are submitted to the Bank’s Credit Approval Committee for decision. Consumer and small business transactions are underwritten according to guidelines and policy approved by the Credit Risk Committee. Any exceptions are approved by a credit risk officer. Our credit authority standards and limits are reviewed periodically by the Board of Directors (the “Board”). Approval limits are established on criteria such as the risk associated with each credit action, amount, and aggregate credit exposure of a borrower. While the Bank’s Board has delegated credit authority and the responsibility to approve authorities for lending and credit personnel to the Chief Credit Officer, the Board regularly monitors credit authority. Credit authorities are based on position, capability, and experience of the individuals.
10
Loans to One Borrower. With certain specified exceptions, a New Jersey-chartered commercial bank may not make loans or extend credit to a single borrower or to entities related to the borrower in an aggregate amount that would exceed 15% of the Bank’s capital funds. As of December 31, 2020, our regulatory lending limit was $397.0 million. We may lend an additional 10% of the Bank’s capital funds if secured by collateral meeting the requirements of the New Jersey Banking Act. The Bank’s internal policy limit is $150.0 million, with exceptions to this policy communicated to the Board. The Bank reviews these group exposures on a regular basis. The Bank also sets additional limits on size of loans by loan type. At December 31, 2020, there was one relationship that exceeded the internal limit totaling $178.1 million. The relationship was communicated to the Board and was performing in accordance with its contractual terms as of December 31, 2020.
Asset Quality. One of our key operating objectives has been, and continues to be, maintaining a high level of asset quality. We maintain sound credit standards for new loan originations and purchases. We do not originate or purchase sub-prime loans, negative amortization loans or option ARM loans. Our portfolio contains interest-only and no income verification residential mortgage loans. We have not originated residential mortgage loans without verifying income in recent years. At December 31, 2020, these loans totaled $109.0 million. At December 31, 2020, interest-only residential and consumer loans totaled $32.1 million, which represented less than 1% of the residential and consumer portfolio. Although it is not a standard product offering for commercial real estate and multi-family loans, we originate interest-only in addition to amortizing loans in these segments. At December 31, 2020, interest-only loans in these segments totaled $1.25 billion. As part of our underwriting, these loans are evaluated as fully amortizing for risk classification purposes, with the interest-only period generally ranging from one to ten years. In addition, we evaluate our policy limits on a regular basis. We believe these criteria adequately control the potential risks of such loans and that adequate provisions for loan losses are provided for all known and inherent risks. Since April 2020, we have, at the request of commercial borrowers experiencing financial difficulty resulting from the pandemic, temporarily deferred the payment of principal and/or interest for an agreed-upon period of time. Although a significant portion of these loans are paying interest-only during the deferral period, they are not included in the amount of interest-only loans disclosed in this section.
Direct finance leases are stated as the sum of remaining minimum lease payments from lessees plus estimated residual values less unearned lease income. On an annual basis, the Company reviews the lease residuals and assets currently off-lease for potential impairment. For the year ended December 31, 2019, the Company recorded an impairment charge of $2.6 million as the fair value of certain equipment decreased at a rate greater than originally projected. An additional impairment charge of $2.2 million was recorded on the same equipment class during the year ended December 31, 2020 given the extended downturn in the market for these assets.
The underlying credit quality of our loan portfolio is dependent primarily on each borrower’s continued ability to make required loan payments and, in the event a borrower is unable to do so, is dependent on the value of the collateral securing the loan, if any. A borrower’s ability to pay is typically dependent on employment and other sources of income in the case of one-to four-family mortgage loans and consumer loans. In the case of multi-family and commercial real estate loans, repayment is dependent on the cash flow generated by the property; in the case of C&I loans, on the cash flows generated by the business, which in turn is impacted by general economic conditions. Other factors, such as unanticipated expenditures or changes in the financial markets, may also impact a borrower’s ability to pay. Collateral values, particularly real estate values, may also be impacted by a variety of factors including general economic conditions, demographics, maintenance and collection or foreclosure delays, including delays resulting from local, state and federal laws.
11
Loan Deferrals. While we have continued to support our customers by granting payment deferrals for those experiencing continued hardship because of the pandemic, we have also worked diligently with our customers to ensure a return to current payment status for a significant portion of our clients who have ended their initial deferral period. At May 4, 2020, loans with an aggregated outstanding balance of $4.3 billion, or 20.1% of total loans, were in COVID-19 related deferment. Since then, customers representing over $3.5 billion have ended their COVID-19 related deferrals and as of February 14, 2021, loans with an aggregate outstanding balance of approximately $756 million, or 3.6% of total loans, were in COVID-19 related deferment.
The following table presents the balance of deferred loans in the Company’s loan portfolio by loan segment, industry sector and type of deferral as of February 14, 2021 which have not significantly changed since December 31, 2020.
| Segment and industry sector | Principal and Interest Deferral | Principal Deferral | Total | Deferred Loan % of Total Loans (1) | ||||||||||||||||||||||
| (Dollars in millions) | ||||||||||||||||||||||||||
| Commercial and industrial | ||||||||||||||||||||||||||
| Accommodation and food service | $ | 2 | 205 | 207 | 1.0 | % | ||||||||||||||||||||
| Arts, entertainment and recreation | 23 | — | 23 | 0.1 | % | |||||||||||||||||||||
| Real estate and rental | 4 | 8 | 12 | 0.1 | % | |||||||||||||||||||||
| Total deferred commercial and industrial | 29 | 213 | 242 | 1.2 | % | |||||||||||||||||||||
| Commercial real estate | ||||||||||||||||||||||||||
| Office | 4 | 52 | 56 | 0.3 | % | |||||||||||||||||||||
| Accommodation and food service | — | 66 | 66 | 0.3 | % | |||||||||||||||||||||
| Other | — | 4 | 4 | — | % | |||||||||||||||||||||
| Total deferred commercial real estate | 4 | 122 | 126 | 0.6 | % | |||||||||||||||||||||
| Construction | — | — | — | — | % | |||||||||||||||||||||
| Multi-family | 52 | 212 | 264 | 1.3 | % | |||||||||||||||||||||
| Total deferred commercial loans | 85 | 547 | 632 | 3.0 | % | |||||||||||||||||||||
| Residential and consumer | 124 | 0 | 124 | 0.6 | % | |||||||||||||||||||||
Total deferred loans (2) | $ | 209 | 547 | 756 | 3.6 | % | ||||||||||||||||||||
| (1) Percentage calculated using total loan balance as of December 31, 2020 | ||||||||||||||||||||||||||
| (2) Of the total deferred loans, approximately 25% of the deferments expire by the second quarter of 2021, 36% in the second half of 2021 with the remainder expiring in January 2022. | ||||||||||||||||||||||||||
Given the unprecedented uncertainty and continually evolving economic effects and social impacts of the COVID-19 pandemic, the future direct and indirect impact on our business, results of operations and financial condition are highly uncertain. Should current economic conditions persist or continue to deteriorate, we expect that this macroeconomic environment will have a continued adverse effect on our business and results of operations, including additional borrower deferral requests, delinquent loans and non-accrual loans. For more information on how the risks related to COVID-19 may adversely affect our business, results of operations and financial condition, see Item 1A. Risk Factors herein.
Purchased Financial Assets with Credit Deterioration - Loans. Loans purchased with credit deterioration (“PCD loans”) are loans acquired that, as of the date of acquisition, have experienced a more-than-insignificant deterioration in credit quality since origination. PCD loans are accounted for in accordance with Accounting Standards Codification (“ASC”) Subtopic 326-20 and are initially recorded at fair value with an allowance recognized on acquisition through a gross-up that increases the amortized cost basis of the asset with no effect on net income. As of December 31, 2020, PCD loans totaled $238.0 million. The Company acquired PCD loans with a par value of $251.5 million and an allowance for credit losses of $4.2 million in its acquisition of Gold Coast on April 3, 2020. See Note 3, Business Combinations, of Notes to Consolidated Financial Statements in “Item 15 - Exhibits and Financial Statement Schedules.”
As of December 31, 2019, purchased credit-impaired loans (“PCI”) totaled $4.1 million. PCI loans had been initially recorded under ASC 310-30 at fair value with no valuation allowance.
12
Delinquent Loans. The following table sets forth our loan delinquencies by type and by amount at the dates indicated.
| Loans Delinquent For | |||||||||||||||||||||||||||||||||||
| 60-89 Days | 90 Days and Over | Total | |||||||||||||||||||||||||||||||||
| Number | Amount | Number | Amount | Number | Amount | ||||||||||||||||||||||||||||||
| (Dollars in thousands) | |||||||||||||||||||||||||||||||||||
| At December 31, 2020 | |||||||||||||||||||||||||||||||||||
| Commercial loans: | |||||||||||||||||||||||||||||||||||
| Multi-family loans | — | $ | — | 11 | $ | 32,884 | 11 | $ | 32,884 | ||||||||||||||||||||||||||
| Commercial real estate loans | 7 | 2,450 | 9 | 6,356 | 16 | 8,806 | |||||||||||||||||||||||||||||
| Commercial and industrial loans | 8 | 3,116 | 10 | 1,769 | 18 | 4,885 | |||||||||||||||||||||||||||||
| Construction loans | — | — | — | — | — | — | |||||||||||||||||||||||||||||
| Total commercial loans | 15 | 5,566 | 30 | 41,009 | 45 | 46,575 | |||||||||||||||||||||||||||||
| Residential mortgage loans | 24 | 4,258 | 114 | 29,124 | 138 | 33,382 | |||||||||||||||||||||||||||||
| Consumer and other loans | 13 | 1,476 | 25 | 1,984 | 38 | 3,460 | |||||||||||||||||||||||||||||
| Total | 52 | $ | 11,300 | 169 | $ | 72,117 | 221 | $ | 83,417 | ||||||||||||||||||||||||||
| At December 31, 2019 | |||||||||||||||||||||||||||||||||||
| Commercial loans: | |||||||||||||||||||||||||||||||||||
| Multi-family loans | 1 | $ | 1,946 | 6 | $ | 22,055 | 7 | $ | 24,001 | ||||||||||||||||||||||||||
| Commercial real estate loans | 1 | 525 | 6 | 3,787 | 7 | 4,312 | |||||||||||||||||||||||||||||
| Commercial and industrial loans | 7 | 2,767 | 11 | 5,053 | 18 | 7,820 | |||||||||||||||||||||||||||||
| Construction loans | — | — | — | — | — | — | |||||||||||||||||||||||||||||
| Total commercial loans | 9 | 5,238 | 23 | 30,895 | 32 | 36,133 | |||||||||||||||||||||||||||||
| Residential mortgage loans | 28 | 6,195 | 120 | 27,729 | 148 | 33,924 | |||||||||||||||||||||||||||||
| Consumer and other loans | 10 | 1,174 | 27 | 1,330 | 37 | 2,504 | |||||||||||||||||||||||||||||
| Total | 47 | $ | 12,607 | 170 | $ | 59,954 | 217 | $ | 72,561 | ||||||||||||||||||||||||||
Non-Performing Assets. Non-performing assets include loans delinquent 90 days or more, non-accrual loans, performing troubled debt restructurings, real estate owned and other repossessed assets. Loans are classified as non-accrual when they are delinquent 90 days or more or if management has specific information that it is probable they will not collect all amounts due under the contractual terms of the loan agreement. We did not have any loans delinquent 90 days or more and still accruing interest at December 31, 2020 and 2019. Non-accrual loans increased by $11.8 million to $107.1 million at December 31, 2020 from $95.3 million at December 31, 2019. Included in the amount of non-accrual loans at December 31, 2020 were $4.8 million of C&I loans, $3.7 million of commercial real estate loans and $1.5 million of multi-family loans that were classified as non-accrual which were performing in accordance with their contractual terms. Included in the amount of non-accrual loans at December 31, 2019 were $4.1 million of commercial real estate loans, $3.8 million of commercial and industrial loans and $1.3 million of multi-family loans that were classified as non-accrual which were performing in accordance with their contractual terms. During the year ended December 31, 2020, the Company sold a non-performing multi-family loan with a net book balance of $18.1 million. The Company recognized a recovery of $1.9 million in the allowance for credit losses on the sale. During 2019, the Company sold $173,000 of non-performing commercial real estate loans, resulting in $29,000 of additional charge-offs.
13
The ratio of non-accrual loans to total loans increased to 0.51% at December 31, 2020 from 0.44% at December 31, 2019. Our ratio of non-performing assets to total assets increased to 0.47% at December 31, 2020 from 0.46% at December 31, 2019. The allowance for credit losses on loans as a percentage of total non-accrual loans increased to 264.17% at December 31, 2020 from 239.66% at December 31, 2019. For further discussion of our non-performing assets and non-performing loans and the allowance for credit losses, see Item 7, “Management’s Discussion and Analysis of Financial Condition and Results of Operations.” The table below sets forth the amounts and categories of our non-performing assets at the dates indicated.
| December 31, | |||||||||||||||||||||||||||||
| 2020 | 2019 | 2018 | 2017 | 2016 | |||||||||||||||||||||||||
| (Dollars in thousands) | |||||||||||||||||||||||||||||
| Non-accrual loans: | |||||||||||||||||||||||||||||
| Multi-family loans | $ | 35,567 | $ | 23,322 | $ | 33,940 | $ | 14,978 | $ | 482 | |||||||||||||||||||
| Commercial real estate loans | 15,894 | 11,945 | 12,391 | 34,043 | 9,205 | ||||||||||||||||||||||||
| Commercial and industrial loans | 9,212 | 12,482 | 19,394 | 9,989 | 4,659 | ||||||||||||||||||||||||
| Construction loans | — | — | 227 | 295 | — | ||||||||||||||||||||||||
| Total commercial loans | 60,673 | 47,749 | 65,952 | 59,305 | 14,346 | ||||||||||||||||||||||||
| Residential mortgage loans | 43,958 | 45,627 | 55,801 | 71,015 | 73,632 | ||||||||||||||||||||||||
| Consumer and other loans | 2,494 | 1,939 | 3,408 | 6,439 | 7,586 | ||||||||||||||||||||||||
| Total non-accrual loans | 107,125 | 95,315 | 125,161 | 136,759 | 95,564 | ||||||||||||||||||||||||
| Real estate owned and other repossessed assets | 7,115 | 13,538 | 6,911 | 5,830 | 4,492 | ||||||||||||||||||||||||
| Performing troubled debt restructurings | 9,232 | 13,084 | 13,620 | 10,957 | 9,445 | ||||||||||||||||||||||||
| Total non-performing assets | $ | 123,472 | $ | 121,937 | $ | 145,692 | $ | 153,546 | $ | 109,501 | |||||||||||||||||||
| Total non-accrual loans to total loans | 0.51 | % | 0.44 | % | 0.58 | % | 0.68 | % | 0.50 | % | |||||||||||||||||||
| Total non-performing assets to total assets | 0.47 | % | 0.46 | % | 0.56 | % | 0.61 | % | 0.47 | % | |||||||||||||||||||
At December 31, 2020, there were $34.5 million of loans deemed troubled debt restructured loans, of which $9.2 million were classified as accruing and $25.3 million were classified as non-accrual. Short-term loan modifications made in good faith to help ease the adverse effects of the COVID-19 pandemic are not categorized as TDRs in accordance with the CARES Act. For the year ended December 31, 2020, interest income that would have been recorded had our non-accruing loans been current in accordance with their original terms amounted to $6.1 million. We recognized interest income of $1.4 million on such loans for the year ended December 31, 2020.
Other Real Estate Owned and Other Repossessed Assets. Real estate and other assets we acquire as a result of foreclosure, by deed in lieu of foreclosure or repossession are classified as other real estate owned and other repossessed assets until sold. When property is acquired it is recorded at fair value at the date of foreclosure or repossession less estimated costs to sell the property. Holding costs and declines in fair value result in charges to expense after acquisition. At December 31, 2020, we had other real estate owned of $2.2 million, consisting of 7 residential properties and other repossessed assets of $4.9 million, consisting of 99 pieces of industrial equipment.
Classified Assets. Federal regulations provide that loans and other assets of lesser quality should be classified as “substandard,” “doubtful” or “loss” assets. An asset is considered “substandard” if it is inadequately protected by the current net worth and paying capacity of the obligor or by the collateral pledged, if any. “Substandard” assets include those characterized by the distinct possibility we will sustain some loss if the deficiencies are not corrected. An asset classified as “doubtful” has all the weaknesses inherent in one classified substandard with the added characteristic the weaknesses present make collection or liquidation in full highly questionable and improbable. An asset classified as “loss” is considered uncollectible and of such little value that its continuance on the institution’s books as an asset, without the establishment of a specific valuation allowance or charge-off, is not warranted. We classify an asset as “special mention” if the asset has potential weaknesses that deserve management’s close attention. If left uncorrected, these potential weaknesses may result in deterioration of the repayment prospects for the asset or in the institution’s credit position at some future date. Special mention assets are not adversely classified and do not expose an institution to sufficient risk to warrant adverse classification. See Note 5, Loans Receivable, Net, of Notes to Consolidated Financial Statements in “Item 15 - Exhibits and Financial Statement Schedules.”
We are required to establish an allowance for credit losses on loans in an amount that management considers prudent for loans classified substandard or doubtful, as well as for other problem loans. Expected losses are evaluated and calculated on a collective basis for those loans which share similar risk characteristics. Loans which do not share risk characteristics with other loans are evaluated for an allowance on an individual basis. When we classify problem assets as “loss,” we are required either
14
to establish a specific allowance for losses equal to 100% of the amount of the asset so classified or to charge off such amount. Our determination as to the classification of our assets and the amount of our valuation allowances is subject to review by the NJDOBI and the FDIC, which can require that we establish additional loss allowances.
We review the loan portfolio on a quarterly basis to determine whether any loans require classification in accordance with applicable regulations. Not all classified assets constitute non-performing assets.
Collateral Dependent Loans. A collateral dependent loan is a loan for which repayment is expected to be provided substantially through the operation or sale of the collateral. A loan is individually evaluated when it is a collateral dependent commercial loan with an outstanding balance greater than $1.0 million and on non-accrual status, a loan modified in a troubled debt restructuring, or is a commercial loan with $1.0 million in outstanding principal if management has specific information that it is probable they will not collect all amounts due under the contractual terms of the loan agreement. When the Company determines that the loan no longer shares similar risk characteristics of other loans in the portfolio, the allowance will be determined on an individual basis using the present value of expected cash flows or, for loans secured by real estate, the fair value of the collateral as of the reporting date, less estimated selling costs, as applicable, to ensure that the credit loss is not delayed until actual loss. If the fair value of the collateral is less than the amortized cost basis of the loan, the Company will charge off the difference between the fair value of the collateral, less costs to sell at the reporting date and the amortized cost basis of the loan. Smaller balance loans are evaluated collectively unless they are modified in a TDR. Such loans include residential mortgage loans, consumer loans, and loans not meeting the Company’s criteria for individual evaluation. At December 31, 2020, loans meeting the requirements to be individually evaluated totaled $72.0 million. For further detail on individually evaluated loans, see Note 1 and Note 5 of Notes to Consolidated Financial Statements in “Item 15 - Exhibits and Financial Statement Schedules.”
Allowance for Credit Losses - Loans
On January 1, 2020, the Company adopted ASU 2016-13, “Financial Instruments - Credit Losses (Topic 326): Measurement of Credit Losses on Financial Instruments”, which replaces the incurred loss methodology with an expected loss methodology that is referred to as the CECL methodology. The Company adopted ASU 2016-13 using a modified retrospective approach. See Note 1, Summary of Significant Accounting Principles, of Notes to Consolidated Financial Statements in “Item 15 - Exhibits and Financial Statement Schedules.” Prior to the adoption of ASU 2016-13, the allowance for credit losses on loans was a contra-asset valuation account established through a provision for loan losses charged to expense, which represented management’s best estimate of inherent losses that had been incurred within the existing portfolio of loans. The allowance for credit losses on loans included allowance allocations calculated in accordance with ASC Topic 310, “Receivables” and allowance allocations calculated in accordance with ASC Topic 450, “Contingencies.”
A description of our methodology in establishing our allowance for credit losses is set forth in the section “Management’s Discussion and Analysis of Financial Condition and Results of Operations — Critical Accounting Policies — Allowance for Credit Losses.”
15
Our allowance for credit losses is maintained at a level necessary to cover lifetime expected credit losses inherent in financial assets at the balance sheet date. The following table sets forth activity in our allowance for credit losses on loans for the periods indicated.
| Years Ended December 31, | |||||||||||||||||||||||||||||
| 2020 | 2019 | 2018 | 2017 | 2016 | |||||||||||||||||||||||||
| (Dollars in thousands) | |||||||||||||||||||||||||||||
| Allowance balance (beginning of period) | $ | 228,120 | $ | 235,817 | $ | 230,969 | $ | 228,373 | $ | 218,505 | |||||||||||||||||||
| Adjustment for adoption of ASC 326 | (3,551) | — | — | — | — | ||||||||||||||||||||||||
| Provision for credit losses | 64,890 | (1,000) | 12,000 | 16,250 | 19,750 | ||||||||||||||||||||||||
| Charge-offs: | |||||||||||||||||||||||||||||
| Multi-family loans | (4,631) | (2,973) | (2,603) | (6) | (161) | ||||||||||||||||||||||||
| Commercial real estate loans | (521) | (151) | (7,200) | (8,072) | (455) | ||||||||||||||||||||||||
| Commercial and industrial loans | (12,005) | (6,833) | (7,078) | (5,656) | (4,485) | ||||||||||||||||||||||||
| Construction loans | — | — | — | (100) | (52) | ||||||||||||||||||||||||
| Residential mortgage loans | (1,190) | (2,241) | (5,246) | (4,875) | (9,425) | ||||||||||||||||||||||||
| Consumer and other loans | (41) | (934) | (1,963) | (500) | (419) | ||||||||||||||||||||||||
| Total charge-offs | (18,388) | (13,132) | (24,090) | (19,209) | (14,997) | ||||||||||||||||||||||||
| Recoveries: | |||||||||||||||||||||||||||||
| Multi-family loans | 1,965 | 1,244 | 17 | 1,677 | 1,885 | ||||||||||||||||||||||||
| Commercial real estate loans | 412 | 2,204 | 5,213 | 549 | 689 | ||||||||||||||||||||||||
| Commercial and industrial loans | 4,459 | 1,203 | 9,478 | 200 | 541 | ||||||||||||||||||||||||
| Construction loans | — | — | — | — | 267 | ||||||||||||||||||||||||
| Residential mortgage loans | 677 | 1,448 | 2,193 | 2,816 | 1,631 | ||||||||||||||||||||||||
| Consumer and other loans | 222 | 336 | 37 | 313 | 102 | ||||||||||||||||||||||||
| Total recoveries | 7,735 | 6,435 | 16,938 | 5,555 | 5,115 | ||||||||||||||||||||||||
| Net charge-offs | (10,653) | (6,697) | (7,152) | (13,654) | (9,882) | ||||||||||||||||||||||||
| Allowance at acquisition on loans purchased with credit deterioration | 4,180 | — | — | — | — | ||||||||||||||||||||||||
| Allowance balance (end of period) | $ | 282,986 | $ | 228,120 | $ | 235,817 | $ | 230,969 | $ | 228,373 | |||||||||||||||||||
| Total loans outstanding | $ | 20,872,755 | $ | 21,703,269 | $ | 21,627,764 | $ | 20,090,848 | $ | 18,810,702 | |||||||||||||||||||
| Average loans outstanding | 21,040,964 | 21,576,829 | 20,498,857 | 19,414,842 | 17,479,932 | ||||||||||||||||||||||||
| Allowance for credit losses on loans as a percent of total loans outstanding | 1.36 | % | 1.05 | % | 1.09 | % | 1.15 | % | 1.21 | % | |||||||||||||||||||
| Net loans charged off as a percent of average loans outstanding | 0.05 | % | 0.03 | % | 0.03 | % | 0.07 | % | 0.06 | % | |||||||||||||||||||
Allowance for credit losses on loans to non-performing loans (1) | 243.21 | % | 210.70 | % | 170.22 | % | 157.46 | % | 220.18 | % | |||||||||||||||||||
(1) Non-performing loans include non-accrual loans and performing TDRs.
16
Allocation of Allowance for Credit Losses on Loans. The following table sets forth the allowance for credit losses on loans allocated by loan category and the percent of loans in each category to total loans at the dates indicated. The allowance for credit losses allocated to each category is the estimated amount considered necessary to cover lifetime expected credit losses inherent in any particular category as of the balance sheet date and does not restrict the use of the allowance to absorb losses in other categories. For periods prior to 2020, the allowance for credit losses represented management’s best estimate of inherent losses that had been incurred within the existing portfolio of loans.
| December 31, | ||||||||||||||||||||||||||||||||
| 2020 | 2019 | 2018 | 2017 | 2016 | ||||||||||||||||||||||||||||
| Allowance for Loan Losses | Percent of Loans in Each Category to Total Loans | Allowance for Loan Losses | Percent of Loans in Each Category to Total Loans | Allowance for Loan Losses | Percent of Loans in Each Category to Total Loans | Allowance for Loan Losses | Percent of Loans in Each Category to Total Loans | Allowance for Loan Losses | Percent of Loans in Each Category to Total Loans | |||||||||||||||||||||||
| (Dollars in thousands) | ||||||||||||||||||||||||||||||||
| End of period allocated to: | ||||||||||||||||||||||||||||||||
| Multi-family loans | $ | 56,731 | 34.1 | % | $ | 74,099 | 36.0 | % | $ | 82,876 | 37.7 | % | $ | 81,469 | 38.8 | % | $ | 95,561 | 39.6 | % | ||||||||||||
| Commercial real estate loans | 115,918 | 23.7 | 50,925 | 22.3 | 48,449 | 22.1 | 56,137 | 22.6 | 52,796 | 23.7 | ||||||||||||||||||||||
| Commercial and industrial loans | 79,327 | 17.1 | 74,396 | 13.6 | 71,084 | 11.1 | 54,563 | 8.1 | 43,492 | 6.8 | ||||||||||||||||||||||
| Construction loans | 7,267 | 2.0 | 6,816 | 1.2 | 7,486 | 1.1 | 11,609 | 2.1 | 11,653 | 1.7 | ||||||||||||||||||||||
| Residential mortgage loans | 19,941 | 19.7 | 17,391 | 23.7 | 20,776 | 24.8 | 21,835 | 25.0 | 19,831 | 25.0 | ||||||||||||||||||||||
| Consumer and other loans | 3,802 | 3.4 | 2,548 | 3.2 | 3,102 | 3.2 | 3,099 | 3.4 | 2,850 | 3.2 | ||||||||||||||||||||||
| Unallocated | — | 1,945 | 2,044 | 2,257 | 2,190 | |||||||||||||||||||||||||||
| Total allowance | $ | 282,986 | 100.0 | % | $ | 228,120 | 100.0 | % | $ | 235,817 | 100.0 | % | $ | 230,969 | 100.0 | % | $ | 228,373 | 100.0 | % | ||||||||||||
The allowance for credit losses on loans as of December 31, 2020 is maintained at a level that represents management’s best estimate of lifetime expected credit losses inherent in loans at the balance sheet date. However, this analysis process involves a high degree of judgment due to the subjectivity of assumptions used and the potential for changes in the forecasted economic environment. Although we believe we have established and maintained the allowance for credit losses at adequate levels, additions may be necessary if the future economic environment deteriorates from forecasted conditions.
As an integral part of their examination processes, the NJDOBI and the FDIC will periodically review our allowance for credit losses. Such agencies may require us to recognize additions to the allowance based on their judgments about information available to them at the time of their examination.
Securities
The Board has adopted our Investment Policy. This policy determines the types of securities in which we may invest. The Investment Policy is reviewed annually by management and changes to the policy are recommended to and subject to approval by the Board. The Board delegates operational responsibility for the implementation of the Investment Policy to the Asset Liability Committee, which is primarily comprised of senior officers. While general investment strategies are developed by the Asset Liability Committee, the execution of specific actions rests primarily with our Treasurer. The Treasurer is responsible for ensuring the guidelines and requirements included in the Investment Policy are followed and all securities are considered prudent for investment. Investment transactions are reviewed and ratified by the Board at their regularly scheduled meetings.
Our Investment Policy requires that investment transactions conform to Federal and State investment regulations. Our investments purchased may include, but are not limited to, U.S. Treasury obligations, securities issued by various Federal Agencies, State and Municipal subdivisions, mortgage-backed securities, certain certificates of deposit of insured financial
17
institutions, overnight and short-term loans to other banks, corporate debt instruments, and mutual funds. In addition, the Company may invest in equity securities subject to certain limitations.
The Investment Policy requires that securities transactions be conducted in a safe and sound manner. Purchase and sale decisions are based upon a thorough pre-transaction analysis of each instrument to determine if it conforms to our overall asset/liability management objectives. The analysis must consider its effect on our risk-based capital measurement, prospects for yield and/or appreciation and other risk factors.
In December 2013, regulatory agencies adopted a rule on the treatment of certain collateralized debt obligations backed by trust preferred securities as covered funds under the Dodd-Frank Wall Street Reform and Consumer Protection Act (the “Dodd-Frank Act”), known as the Volcker Rule. At December 31, 2020, none of our securities were deemed to be a covered fund under the Volcker Rule.
On January 1, 2020, the Company adopted ASU 2016-13, which requires the measurement of expected credit losses for financial assets, including debt securities. See Note 1, Summary of Significant Accounting Principles, of Notes to Consolidated Financial Statements in “Item 15 - Exhibits and Financial Statement Schedules.”
At December 31, 2020, our securities portfolio totaled $4.04 billion representing 15.5% of our total assets. At December 31, 2020, equity securities reported at fair value totaled $36.0 million. Debt securities are classified as held-to-maturity or available-for-sale when purchased. At December 31, 2020, $1.25 billion of our debt securities were classified as held-to-maturity and reported at amortized cost less allowance for credit losses and $2.76 billion were classified as available-for-sale and reported at fair value.
Mortgage-Backed Securities. We purchase mortgage-backed pass through and collateralized mortgage obligation (“CMO”) securities insured or guaranteed by Fannie Mae, Freddie Mac (government-sponsored enterprises) and Ginnie Mae (government agency), and to a lesser extent, a variety of federal and state housing authorities (collectively referred to below as “agency-issued mortgage-backed securities”). At December 31, 2020, agency-issued mortgage-backed securities including CMOs, totaled $3.52 billion, or 87.1%, of our total securities portfolio.
Actual cash flows on mortgage-backed securities may differ from estimated cash flows over the life of the security, which may require adjustments to the amortization of any premium or accretion of any discount relating to such instruments that can change the yield on such securities. There is reinvestment risk associated with the cash flows from such securities. The fair value of such securities may be adversely affected by changes in interest rates and/or other market variables.
Our mortgage-backed securities portfolio had a weighted average yield of 2.23% for the year ended December 31, 2020. The estimated fair value of our mortgage-backed securities at December 31, 2020 was $3.55 billion, which is $107.1 million more than the carrying value. The unrealized gain is attributed primarily to a decline in interest rates during 2020. At December 31, 2020, we had no allowance for credit losses on mortgage-backed securities.
We also may invest in securities issued by non-agency or private mortgage originators, provided those securities are rated AAA by nationally recognized rating agencies and satisfactorily pass an internal credit review at the time of purchase. Currently, the Company does not hold any non-agency mortgage-backed securities in its portfolio.
Corporate and Other Debt Securities. Our corporate and other debt securities portfolio primarily consists of subordinated debt issued by other financial institutions. In addition, our corporate and other debt securities portfolio contains collateralized debt obligations (“CDOs”) backed by pooled trust preferred securities (“TruPS”), principally issued by banks and to a lesser extent insurance companies and real estate investment trusts. These securities have been classified in the held-to-maturity portfolio since their purchase. At December 31, 2020, corporate and other debt securities totaled $130.6 million, or 3.2%, of our total securities portfolio.
At December 31, 2020, the TruPS portfolio had a carrying value of $50.1 million, or 1.24% of our total securities portfolio, and a fair value of $67.3 million. TruPS with a carrying value of $15.9 million were in an unrealized loss position at December 31, 2020. Throughout the year we engage an independent valuation firm to assist us in valuing our TruPS portfolio. As a result of the adoption of ASU 2016-13 on January 1, 2020, our TruPS and other held-to-maturity debt securities are evaluated for expected credit losses. At December 31, 2020, our allowance for credit losses on corporate and other debt securities was $3.2 million. Prior to January 1, 2020, an other-than temporary impairment (“OTTI”) analysis was performed. We did not recognize any OTTI charges for the years ended December 31, 2019 and 2018. For the year ended December 31, 2018, the Company received proceeds of $7.3 million from the payoff and paydown of TruPS which resulted in $3.2 million of interest income from securities, as well as a gain of $1.2 million recognized as non-interest income. We continue to closely monitor the performance of our CDO portfolio.
18
Municipal Bonds. At December 31, 2020, we had $246.6 million in municipal bonds which represents 6.1% of our total securities portfolio. These bonds are comprised of $51.9 million in short-term Bond Anticipation or Tax Anticipation notes and $194.7 million of longer term bonds. At December 31, 2020, our allowance for credit losses on municipal bonds was $34,000.
Government Sponsored Enterprises. At December 31, 2020, debt securities issued by Government Sponsored Enterprises held in our security portfolio totaled $113.5 million representing 2.8% of our total securities portfolio. At December 31, 2020, we had no allowance for credit losses on debt securities issued by Government Sponsored Enterprises.
Equity Securities. At December 31, 2020, the fair value of equity securities was $36.0 million, representing 0.9% of our total securities portfolio. The equity securities portfolio primarily consists of preferred stock carried at a fair value of $29.8 million at December 31, 2020. Equity securities are not insured or guaranteed investments and are affected by market interest rates and other factors. Such investments are carried at their fair value with fluctuations in the fair value of such investments reflected in the consolidated income statement.
Securities Portfolios. The following table sets forth the composition of our investment securities portfolios at the dates indicated.
| At December 31, | |||||||||||||||||||||||||||||||||||
| 2020 | 2019 | 2018 | |||||||||||||||||||||||||||||||||
| Carrying Value | Estimated Fair Value | Carrying Value | Estimated Fair Value | Carrying Value | Estimated Fair Value | ||||||||||||||||||||||||||||||
| (In thousands) | |||||||||||||||||||||||||||||||||||
| Equity securities | $ | 34,801 | 36,000 | 5,096 | 6,039 | 5,001 | 5,793 | ||||||||||||||||||||||||||||
| Available-for-sale: | |||||||||||||||||||||||||||||||||||
| Debt securities: | |||||||||||||||||||||||||||||||||||
| Government sponsored enterprises | $ | 4,260 | 4,482 | — | — | — | — | ||||||||||||||||||||||||||||
| Mortgage-backed securities: | |||||||||||||||||||||||||||||||||||
| Federal National Mortgage Association | 1,167,057 | 1,205,426 | 1,159,446 | 1,178,049 | 980,546 | 968,556 | |||||||||||||||||||||||||||||
| Federal Home Loan Mortgage Corporation | 1,286,195 | 1,317,052 | 1,223,587 | 1,240,379 | 988,348 | 986,650 | |||||||||||||||||||||||||||||
| Government National Mortgage Association | 225,810 | 231,477 | 273,676 | 276,962 | 165,211 | 166,956 | |||||||||||||||||||||||||||||
| Total mortgage-backed securities available-for-sale | 2,679,062 | 2,753,955 | 2,656,709 | 2,695,390 | 2,134,105 | 2,122,162 | |||||||||||||||||||||||||||||
| Total debt securities available-for-sale | $ | 2,683,322 | 2,758,437 | 2,656,709 | 2,695,390 | 2,134,105 | 2,122,162 | ||||||||||||||||||||||||||||
| Held-to-maturity: | |||||||||||||||||||||||||||||||||||
| Debt securities: | |||||||||||||||||||||||||||||||||||
| Government sponsored enterprises | $ | 109,016 | 112,414 | 58,624 | 58,312 | 41,258 | 40,022 | ||||||||||||||||||||||||||||
| Municipal bonds | 246,601 | 261,591 | 143,151 | 146,905 | 25,513 | 26,455 | |||||||||||||||||||||||||||||
| Corporate and other debt securities | 130,565 | 149,713 | 72,537 | 98,695 | 50,441 | 87,033 | |||||||||||||||||||||||||||||
| Total debt securities | 486,182 | 523,718 | 274,312 | 303,912 | 117,212 | 153,510 | |||||||||||||||||||||||||||||
| Mortgage-backed securities: | |||||||||||||||||||||||||||||||||||
| Federal National Mortgage Association | 413,426 | 434,331 | 542,210 | 549,862 | 954,548 | 932,396 | |||||||||||||||||||||||||||||
| Federal Home Loan Mortgage Corporation | 308,219 | 317,686 | 261,945 | 265,349 | 401,636 | 392,335 | |||||||||||||||||||||||||||||
| Government National Mortgage Association | 43,290 | 45,137 | 70,348 | 70,981 | 81,741 | 80,323 | |||||||||||||||||||||||||||||
| Total mortgage-backed securities held-to-maturity | 764,935 | 797,154 | 874,503 | 886,192 | 1,437,925 | 1,405,054 | |||||||||||||||||||||||||||||
| Total debt securities held-to-maturity | 1,251,117 | 1,320,872 | 1,148,815 | 1,190,104 | 1,555,137 | 1,558,564 | |||||||||||||||||||||||||||||
| Allowance for credit losses | 3,264 | — | — | — | — | — | |||||||||||||||||||||||||||||
| Total debt securities held-to-maturity, net of allowance for credit losses | $ | 1,247,853 | 1,320,872 | 1,148,815 | 1,190,104 | 1,555,137 | 1,558,564 | ||||||||||||||||||||||||||||
| Total securities | $ | 3,965,976 | 4,115,309 | 3,810,620 | 3,891,533 | 3,694,243 | 3,686,519 | ||||||||||||||||||||||||||||
At December 31, 2020, except for our investments in Fannie Mae and Freddie Mac securities, we had no investment in the securities of any issuer that had an aggregate book value in excess of 10% of our equity.
19
Portfolio Maturities and Coupon. The composition, maturities and weighted average coupon rate of the securities portfolio at December 31, 2020 are summarized in the following table. Maturities are based on the final contractual payment dates, and do not reflect the impact of prepayments or early redemptions that may occur. Municipal securities coupons have not been adjusted to a tax-equivalent basis.
| One Year or Less | More than One Year through Five Years | More than Five Years through Ten Years | More than Ten Years | Total Securities | ||||||||||||||||||||||||||||||||||||||||||||||||||||||||||||||||
| Carrying Value | Weighted Average Coupon | Carrying Value | Weighted Average Coupon | Carrying Value | Weighted Average Coupon | Carrying Value | Weighted Average Coupon | Carrying Value | Fair Value | Weighted Average Coupon | ||||||||||||||||||||||||||||||||||||||||||||||||||||||||||
| (Dollars in thousands) | ||||||||||||||||||||||||||||||||||||||||||||||||||||||||||||||||||||
| Equity securities | $ | — | — | % | $ | — | — | % | $ | 2,500 | 7.00 | % | $ | 32,301 | 3.41 | % | $ | 34,801 | $ | 36,000 | 3.66 | % | ||||||||||||||||||||||||||||||||||||||||||||||
| Available-for-Sale: | ||||||||||||||||||||||||||||||||||||||||||||||||||||||||||||||||||||
| Debt Securities: | ||||||||||||||||||||||||||||||||||||||||||||||||||||||||||||||||||||
| Government sponsored enterprises | — | — | % | — | — | % | 1,446 | 2.83 | % | 2,814 | 2.74 | % | 4,260 | 4,482 | 2.77 | % | ||||||||||||||||||||||||||||||||||||||||||||||||||||
| Mortgage-backed securities: | ||||||||||||||||||||||||||||||||||||||||||||||||||||||||||||||||||||
| Federal Home Loan Mortgage Corporation | — | — | 4,114 | 2.81 | 629,532 | 1.05 | 652,549 | 2.29 | 1,286,195 | 1,317,052 | 1.69 | |||||||||||||||||||||||||||||||||||||||||||||||||||||||||
| Federal National Mortgage Association | 463 | 2.49 | 2,726 | 2.62 | 161,384 | 1.02 | 1,002,484 | 2.01 | 1,167,057 | 1,205,426 | 1.88 | |||||||||||||||||||||||||||||||||||||||||||||||||||||||||
| Government National Mortgage Association | — | — | 248 | 2.48 | 2,823 | 1.17 | 222,739 | 2.52 | 225,810 | 231,477 | 2.51 | |||||||||||||||||||||||||||||||||||||||||||||||||||||||||
| Total mortgage-backed securities | 463 | 2.49 | 7,088 | 2.72 | 793,739 | 1.05 | 1,877,772 | 2.17 | 2,679,062 | 2,753,955 | 1.84 | |||||||||||||||||||||||||||||||||||||||||||||||||||||||||
| Total available-for-sale debt securities | $ | 463 | 2.49 | % | $ | 7,088 | 2.72 | % | $ | 795,185 | 1.05 | % | $ | 1,880,586 | 2.17 | % | $ | 2,683,322 | $ | 2,758,437 | 1.84 | % | ||||||||||||||||||||||||||||||||||||||||||||||
| Held-to-Maturity: | ||||||||||||||||||||||||||||||||||||||||||||||||||||||||||||||||||||
| Debt securities: | ||||||||||||||||||||||||||||||||||||||||||||||||||||||||||||||||||||
| Government sponsored enterprises | $ | — | — | % | $ | — | — | % | $ | 49,087 | 1.46 | % | $ | 59,929 | 1.91 | % | $ | 109,016 | $ | 112,414 | 1.71 | % | ||||||||||||||||||||||||||||||||||||||||||||||
| Municipal bonds | 52,178 | 1.72 | 10,248 | 1.34 | 6,731 | 5.63 | 177,444 | 2.72 | 246,601 | 261,591 | 2.53 | |||||||||||||||||||||||||||||||||||||||||||||||||||||||||
| Corporate and other debt securities | — | — | — | — | 80,489 | 4.31 | 50,076 | 1.71 | 130,565 | 149,713 | 3.31 | |||||||||||||||||||||||||||||||||||||||||||||||||||||||||
| Total debt securities | 52,178 | 1.72 | 10,248 | 1.34 | 136,307 | 3.35 | 287,449 | 2.38 | 486,182 | 523,718 | 2.56 | |||||||||||||||||||||||||||||||||||||||||||||||||||||||||
| Mortgage-backed securities: | ||||||||||||||||||||||||||||||||||||||||||||||||||||||||||||||||||||
| Federal Home Loan Mortgage Corporation | — | — | 402 | 3.42 | 160,473 | 2.66 | 147,344 | 1.53 | 308,219 | 317,686 | 2.12 | |||||||||||||||||||||||||||||||||||||||||||||||||||||||||
| Federal National Mortgage Association | — | — | — | — | 188,727 | 2.42 | 224,699 | 2.76 | 413,426 | 434,331 | 2.60 | |||||||||||||||||||||||||||||||||||||||||||||||||||||||||
| Government National Mortgage Association | — | — | — | — | 4,965 | 2.39 | 38,325 | 2.69 | 43,290 | 45,137 | 2.66 | |||||||||||||||||||||||||||||||||||||||||||||||||||||||||
| Total mortgage-backed securities | — | — | 402 | 3.42 | 354,165 | 2.53 | 410,368 | 2.31 | 764,935 | 797,154 | 2.41 | |||||||||||||||||||||||||||||||||||||||||||||||||||||||||
| Total held-to-maturity debt securities | $ | 52,178 | 1.72 | % | $ | 10,650 | 1.42 | % | $ | 490,472 | 2.76 | % | $ | 697,817 | 2.34 | % | $ | 1,251,117 | $ | 1,320,872 | 2.47 | % | ||||||||||||||||||||||||||||||||||||||||||||||
| Allowance for credit losses | $ | 3,264 | ||||||||||||||||||||||||||||||||||||||||||||||||||||||||||||||||||
| Total held-to-maturity debt securities, net of allowance for credit losses | $ | 1,247,853 | ||||||||||||||||||||||||||||||||||||||||||||||||||||||||||||||||||
20
Sources of Funds
General. Deposits are the primary source of funds used for our lending and investment activities. Our strategy is to increase core deposit (savings, checking and money market accounts) growth to fund these activities. In addition, we use a significant amount of borrowings, primarily advances from the Federal Home Loan Bank of New York (“FHLB”), to supplement cash flow needs, to lengthen the maturities of liabilities for interest rate risk management and to manage our cost of funds. Additional sources of funds include principal and interest payments from loans and securities, loan and securities prepayments and maturities, repurchase agreements, brokered deposits, income on other earning assets and retained earnings. While cash flows from loans and securities payments can be relatively stable sources of funds, deposit inflows and outflows can vary widely and are influenced by prevailing interest rates, market conditions and levels of competition.
Deposits. At December 31, 2020, we held $19.53 billion in total deposits, representing 83.8% of our total liabilities. Our long-term deposit strategy has been focused on attracting core deposits (savings, checking and money market accounts) as they represent a more stable source of low cost funds and may be less sensitive to changes in market interest rates. At December 31, 2020, we held $16.81 billion in core deposits, representing 86.1% of total deposits, of which $886.5 million are brokered money market deposits. At December 31, 2020, $2.72 billion, or 13.9%, of our total deposit balances were certificates of deposit, which included $327.0 million of brokered certificates of deposit. Municipal deposits are a significant source of funds. At December 31, 2020, $5.50 billion, or 28.2%, of our total deposits consisted of public fund deposits from local government entities, predominately domiciled in the state of New Jersey. During 2020, deposits increased by $1.67 billion, or 9.3% partially as a result of the current economic environment including government stimulus and increased savings rates.
We have a suite of commercial deposit products, designed to appeal to small and mid-sized businesses and non-profit organizations. Interest rates, maturity terms, service fees and withdrawal penalties are all reviewed on a periodic basis. Deposit rates and terms are based primarily on our current operating strategies, market rates, liquidity requirements and competitive forces. We also rely on personalized customer service, long-standing relationships with customers and an active marketing program to attract and retain deposits.
The flow of deposits is influenced significantly by general economic conditions, changes in money market rates and other prevailing interest rates and competition. The variety of deposit accounts we offer allows us to respond to changes in consumer demands and to be competitive in obtaining deposit funds. Our ability to attract and maintain deposits and the rates we pay on deposits will continue to be significantly affected by market conditions.
We intend to continue to invest in technology platforms and branch staff training, de novo and acquired branches, and to aggressively market and advertise our core deposit products and will attempt to generate our deposits from a diverse client group within our primary market area. We remain focused on attracting and maintaining deposits from consumers, businesses and municipalities which operate in our marketplace. The Bank also utilizes Investors eAccess, a secure online channel, to attract deposits nationwide.
The following table sets forth the distribution of total deposit accounts, by account type, at the dates indicated.
| At December 31, | |||||||||||||||||||||||||||||||||||||||||||||||||||||
| 2020 | 2019 | 2018 | |||||||||||||||||||||||||||||||||||||||||||||||||||
| Balance | Percent of Total Deposits | Weighted Average Rate | Balance | Percent of Total Deposits | Weighted Average Rate | Balance | Percent of Total Deposits | Weighted Average Rate | |||||||||||||||||||||||||||||||||||||||||||||
| (Dollars in thousands) | |||||||||||||||||||||||||||||||||||||||||||||||||||||
| Non-interest bearing: | |||||||||||||||||||||||||||||||||||||||||||||||||||||
| Checking accounts | $ | 3,663,073 | 18.8 | % | — | % | $ | 2,472,232 | 13.8 | % | — | % | $ | 2,535,848 | 14.4 | % | — | % | |||||||||||||||||||||||||||||||||||
| Interest-bearing: | |||||||||||||||||||||||||||||||||||||||||||||||||||||
| Checking accounts | 6,043,393 | 30.9 | 0.49 | 5,512,979 | 30.9 | 1.36 | 4,783,563 | 27.2 | 1.53 | ||||||||||||||||||||||||||||||||||||||||||||
| Money market deposits | 5,037,327 | 25.8 | 0.42 | 3,817,718 | 21.4 | 1.50 | 3,641,070 | 20.7 | 1.55 | ||||||||||||||||||||||||||||||||||||||||||||
| Savings | 2,063,447 | 10.6 | 0.48 | 2,050,101 | 11.5 | 0.86 | 2,048,941 | 11.7 | 0.64 | ||||||||||||||||||||||||||||||||||||||||||||
| Certificates of deposit | 2,718,179 | 13.9 | 0.97 | 4,007,308 | 22.4 | 1.67 | 4,570,847 | 26.0 | 1.35 | ||||||||||||||||||||||||||||||||||||||||||||
| Total deposits | $ | 19,525,419 | 100.0 | % | 0.45 | % | $ | 17,860,338 | 100.0 | % | 1.21 | % | $ | 17,580,269 | 100.0 | % | 1.16 | % | |||||||||||||||||||||||||||||||||||
21
The following table sets forth, by rate category, the amount of certificates of deposit outstanding as of the dates indicated.
| At December 31, | |||||||||||||||||
| 2020 | 2019 | 2018 | |||||||||||||||
| (Dollars in thousands) | |||||||||||||||||
| Certificates of Deposit | |||||||||||||||||
| 0.00% - 0.25% | $ | 297,596 | 238,369 | 355,822 | |||||||||||||
| 0.26% - 0.50% | 647,849 | 77,234 | 107,088 | ||||||||||||||
| 0.51% - 1.00% | 743,457 | 116,783 | 157,646 | ||||||||||||||
| 1.01% - 2.00% | 846,349 | 1,921,656 | 942,149 | ||||||||||||||
| 2.01% - 3.00% | 179,616 | 1,651,388 | 3,006,347 | ||||||||||||||
| Over 3.00% | 3,312 | 1,878 | 1,795 | ||||||||||||||
| Total | $ | 2,718,179 | 4,007,308 | 4,570,847 | |||||||||||||
The following table sets forth, by rate category, the remaining period to maturity of certificates of deposit outstanding at December 31, 2020.
| Rate Category | Within Three Months | Over Three to Six Months | Over Six Months to One Year | Over One Year to Two Years | Over Two Years to Three Years | Over Three Years | Total | |||||||||||||||||||||||||||||||||||||
| (Dollars in thousands) | ||||||||||||||||||||||||||||||||||||||||||||
| 0.00% - 0.25% | $ | 100,481 | $ | 62,108 | $ | 131,557 | $ | 1,886 | $ | 1,562 | $ | 2 | $ | 297,596 | ||||||||||||||||||||||||||||||
| 0.26% - 0.50% | 28,965 | 77,729 | 384,922 | 140,801 | 10,314 | 5,118 | 647,849 | |||||||||||||||||||||||||||||||||||||
| 0.51% - 1.00% | 58,914 | 207,951 | 424,301 | 26,388 | 11,679 | 14,224 | 743,457 | |||||||||||||||||||||||||||||||||||||
| 1.01% - 2.00% | 343,006 | 365,892 | 37,118 | 93,270 | 2,876 | 4,187 | 846,349 | |||||||||||||||||||||||||||||||||||||
| 2.01% - 3.00% | 88,405 | 51,794 | 22,660 | 7,360 | 5,166 | 4,231 | 179,616 | |||||||||||||||||||||||||||||||||||||
| Over 3.00% | 247 | — | 800 | 1,597 | 296 | 372 | 3,312 | |||||||||||||||||||||||||||||||||||||
| Total | $ | 620,018 | $ | 765,474 | $ | 1,001,358 | $ | 271,302 | $ | 31,893 | $ | 28,134 | $ | 2,718,179 | ||||||||||||||||||||||||||||||
The following table sets forth the aggregate amount of outstanding certificates of deposit in amounts greater than or equal to $100,000 and the respective maturity of those certificates as of December 31, 2020.
| At December 31, 2020 | |||||
| (In thousands) | |||||
| Three months or less | $ | 394,049 | |||
| Over three months through six months | 539,051 | ||||
| Over six months through one year | 632,217 | ||||
| Over one year | 207,149 | ||||
| Total | $ | 1,772,466 | |||
22
Borrowings. We borrow directly from the FHLB. All of our FHLB borrowings are collateralized by pledged residential and commercial mortgage collateral. The following table sets forth information concerning balances and interest rates, including effects of derivative contracts, on our advances from the FHLB at the dates and for the periods indicated.
| At or for the Year Ended December 31, | |||||||||||||||||||||||||||||
| 2020 | 2019 | 2018 | 2017 | 2016 | |||||||||||||||||||||||||
| (Dollars in thousands) | |||||||||||||||||||||||||||||
| Balance at end of period | $ | 2,662,574 | $ | 4,979,201 | $ | 4,930,681 | $ | 4,331,052 | $ | 4,391,420 | |||||||||||||||||||
| Average balance during period | 4,213,353 | 5,205,066 | 4,655,757 | 4,526,596 | 3,663,087 | ||||||||||||||||||||||||
| Maximum outstanding at any month end | 5,057,338 | 5,723,556 | 5,080,960 | 5,355,298 | 4,391,420 | ||||||||||||||||||||||||
| Weighted average interest rate at end of period | 2.08 | % | 2.06 | % | 2.16 | % | 1.96 | % | 1.79 | % | |||||||||||||||||||
| Average interest rate during period | 2.13 | % | 2.18 | % | 2.01 | % | 1.88 | % | 1.86 | % | |||||||||||||||||||
We also borrow funds under repurchase agreements with the FHLB and various brokers. These agreements are recorded as financing transactions as we maintain effective control over the transferred or pledged securities. The dollar amount of the securities underlying the agreements continues to be carried in our securities portfolio while the obligations to repurchase the securities are reported as liabilities. The securities underlying the existing repurchase agreements are delivered to the party with whom each transaction is executed. Those parties agree to resell to us the identical securities we delivered to them at the maturity of the agreement. The following table sets forth information concerning balances and interest rates on our securities sold under agreements to repurchase at the dates and for the periods indicated.
| At or for the Year Ended December 31, | |||||||||||||||||||||||||||||
| 2020 | 2019 | 2018 | 2017 | 2016 | |||||||||||||||||||||||||
| (Dollars in thousands) | |||||||||||||||||||||||||||||
| Balance at end of period | $ | 448,514 | $ | 447,910 | $ | 250,000 | $ | 130,481 | $ | 154,831 | |||||||||||||||||||
| Average balance during period | 451,741 | 369,046 | 202,027 | 149,030 | 153,000 | ||||||||||||||||||||||||
| Maximum outstanding at any month end | 547,961 | 447,910 | 280,000 | 153,000 | 154,831 | ||||||||||||||||||||||||
| Weighted average interest rate at end of period | 1.97 | % | 2.16 | % | 2.67 | % | 1.87 | % | 2.19 | % | |||||||||||||||||||
| Average interest rate during period | 2.17 | % | 2.45 | % | 2.68 | % | 2.11 | % | 2.16 | % | |||||||||||||||||||
In addition, the Bank had unsecured overnight borrowing lines with other institutions totaling $590.0 million, of which $170.0 million was outstanding at December 31, 2020. In April 2020, the Company assumed $13.5 million of subordinated notes in the acquisition of Gold Coast.
Subsidiary Activities
Investors Bancorp, Inc. has one direct subsidiary, which is Investors Bank.
Investors Bank. Investors Bank is a New Jersey-chartered commercial bank headquartered in Short Hills, New Jersey. Originally founded in 1926, the bank is in the business of attracting deposits from the public through its branch network and Investors eAccess, and borrowing funds in the wholesale markets to originate loans and to invest in securities. Investors Bank has the following active direct and indirect subsidiaries: Investors Investment Corp., Investors Commercial, Inc., Investors Financial Group, Inc., Investors Financial Group Insurance Agency, Inc., MNBNY Holdings Inc. and Marathon Realty Investors Inc. Investors Bank also has several additional subsidiaries which are inactive: My Way Development LLC, Investors Financial Services, Inc. and Investors Real Estate Corporation.
•Investors Investment Corp. Investors Investment Corp. is a New Jersey corporation that was formed in 2004 as an investment company subsidiary. The purpose of this subsidiary is to manage and invest in securities such as, but not limited to, U.S. Treasury obligations, mortgage-backed securities, certificates of deposit, mutual funds, and equity securities, subject to certain limitations.
•Investors Commercial, Inc. Investors Commercial, Inc. is a New Jersey corporation that was formed in 2010 as an operating subsidiary of Investors Bank. The purpose of this subsidiary is to originate and purchase residential mortgage loans and commercial loans including multi-family mortgage loans, commercial real estate mortgage loans and C&I mortgage loans primarily in New York State.
23
•Investors Financial Group, Inc. Investors Financial Group, Inc. is a New Jersey corporation that was formed in 2011 as an operating subsidiary of Investors Bank. The primary purpose of this subsidiary is to process sales of non-deposit investment products through third party service providers to customers and consumers as may be referred by Investors Bank.
•Investors Financial Group Insurance Agency, Inc. Investors Financial Group Insurance Agency, Inc. is a New Jersey licensed insurance agency formed in 2016 as an operating subsidiary of Investors Financial Group, Inc. The purpose of this subsidiary is to receive commissions relating to the sale of certain insurance products, including, but not limited to, life insurance, fixed annuities and indexed annuities.
•MNBNY Holdings Inc. MNBNY Holdings Inc. is a New York corporation that was formed in 2006 and acquired in the merger with Marathon Banking Corporation in October 2012. MNBNY Holdings Inc. serves as a holding company and is the 100% owner of Marathon Realty Investors Inc.
•Marathon Realty Investors Inc. Marathon Realty Investors Inc. is a New York corporation established in 2006 and acquired in the merger with Marathon Banking Corporation in October 2012. Marathon Realty Investors Inc. engages in the business of a real estate investment trust for the purpose of acquiring mortgage loans and other real estate related assets from Investors Bank.
Enterprise Risk Management Framework
Our Board oversees our risk management process, including the bank-wide approach to risk management, carried out by our management. Our Board approves the strategic plans and the policies that set standards for the nature and level of risk we are willing to assume. The Board receives reports on the management of critical risks and the effectiveness of risk management systems. While our full Board maintains the ultimate oversight responsibility for the risk management process, its committees, including Audit, Risk Oversight and Compensation and Benefits committees, oversee risk in certain specified areas. The Risk Oversight Committee of the Board meets quarterly and provides independent oversight of all risk functions. Our Board has assigned responsibility to our Chief Risk Officer for maintaining the Enterprise Risk Management (“ERM”) framework to identify, assess, monitor and mitigate risks in the execution of our strategic goals and objectives and ensure we operate in a safe and sound manner in accordance with the Board approved policies.
The Bank’s Management Risk Committee meets regularly and provides governance over risk policy and risk escalation. The ERM framework supports a culture that promotes proactive risk management by all Bank employees, a risk appetite framework with defined risk tolerance limits, and risk governance with a three lines of defense model to manage and oversee risk. In a three lines of defense structure, each line of business and corporate function serves as the first line of defense and has responsibility for identifying, assessing, managing and mitigating risks in their areas. Independent Risk Management serves as the second line of defense and is responsible for providing guidance, oversight and appropriate challenge to the first line of defense. Internal Audit serves as the third line of defense and ensures that appropriate risk management controls, processes and systems are in place and functioning effectively.
Our ERM framework is consistent with common industry practices and regulatory guidance and is appropriate to our size, growth trajectory and the complexity of our business activities. The ERM Framework encompasses the following categories of risks; credit risk, interest rate risk, liquidity risk, price risk, operational risk, model risk, supplier risk, fraud risk, information security including cybersecurity, compliance risk, strategic risk, and reputational risk.
Human Capital Management
As of December 31, 2020, we had 1,751 full-time employees and 123 part-time employees. None of our employees are represented by a collective bargaining unit and we consider our relationship with our employees to be good.
Our Company respects, values and invites diversity in our employees, customers, suppliers, marketplace and community. We seek to recognize and develop the unique contributions which each individual brings to our Company, and we are fully committed to supporting a culture of diversity as a pillar to our values and our success. The Company provides multiple opportunities for professional development and growth and we are committed to promoting and improving retention, development and job satisfaction among our employees by providing skills training, peer mentoring and opportunities to interact and collaborate with senior leaders.
The Company reinforces its commitment to diversity, equity and inclusion through ongoing efforts to reflect and adapt to the changing demographics of our communities. Our recruitment efforts at all levels of the Company are centered on our commitment to attract diverse, emerging and established talent. In 2019, the Company expanded its diversity, equity and inclusion efforts through its “iBelong” initiative. This Company-wide strategic initiative continues to build on and strengthen our internal and external recruiting efforts, our internal policies, the education and development of our employees, and procurement and supplier diversity. During 2020, several programs were adopted and implemented as part of our iBelong
24
initiative including the establishment of an employee-driven Diversity, Equity and Inclusion Council (the “DE&I Council”). The mission and objective of our DE&I Council has been and continues to be to create and execute on our plans to drive a diversity and inclusion strategy and develop the framework for implementing and impacting initiatives, programs, policies and processes. The DE&I Council will also work closely with our business leaders to identify and address specific needs of diverse populations within our Company and our markets. Within 2020, the DE&I Council developed, organized and implemented numerous training, education and awareness activities and campaigns throughout our Company.
We are committed to the good health and welfare of our employees, customers and communities. The COVID-19 pandemic presented significant challenges to our Company and our employees to maintain employee and client health and well-being while continuing to be open for business for customers and our communities. Accordingly, we established a proactive response to the escalating COVID-19 outbreak in our communities that included enhanced employee and customer communication and providing access to evolving safety standards and guidance from the Centers for Disease Control and Prevention, and state and local governmental agencies, as well as our workplace guidelines for customer and noncustomer environments. In addition, updated information is shared through regular emails and other digital communications with our employees and our customers facing financial hardship due to the COVID-19 pandemic. Additional actions included adjusting our branch hours and lobby usage, for employee and customer safety, while remaining open for business to provide banking services. We continue to encourage employees to work remotely where possible during the pandemic. We also continue to monitor our communities and markets for areas where there is a resurgence or regression of COVID-19 and adjust our branch access accordingly. We also continue to follow and adhere to state and local restrictions related to COVID-19 to the extent applicable to help ensure the safety or our employees and customers. Our branches continue to be open for business and we continue to provide deposit, lending and other banking services, while our mobile and online banking networks are continuously available for digital banking transactions.
Our Company’s employees actively give their time and talents to their communities through volunteer activities in financial education, economic development, health and human services, and community development. Within 2020, even during the COVID-19 pandemic, our employees donated nearly 1,000 hours in support of more than 60 community organizations and charities.
Supervision and Regulation
The Bank is a New Jersey-chartered commercial bank, and its deposit accounts are insured up to applicable limits by the FDIC under the Deposit Insurance Fund (“DIF”). The Bank is subject to extensive regulation, examination and supervision by the Commissioner of the NJDOBI (the “Commissioner”) as the issuer of its charter, and, as a non-member state chartered commercial bank, by the FDIC as the deposit insurer and its primary federal regulator. The Bank must file reports with the Commissioner and the FDIC concerning its activities and financial condition, and it must obtain regulatory approval prior to entering into certain transactions, such as mergers with, or acquisitions of, other depository institutions and opening or acquiring branch offices. The Commissioner and the FDIC each conduct periodic examinations to assess the Bank’s compliance with various regulatory requirements. This regulation and supervision establishes a comprehensive framework of activities in which a commercial bank may engage and is intended primarily for the protection of the DIF and its depositors. The regulatory structure also gives the regulatory authorities extensive discretion in connection with their supervisory and enforcement activities and examination policies, including policies with respect to the classification of assets and the establishment of adequate loan loss reserves for regulatory purposes.
As a bank holding company controlling the Bank, the Company is subject to the Bank Holding Company Act of 1956, as amended (“BHCA”), and the rules and regulations of the Federal Reserve Board under the BHCA and to the provisions of the New Jersey Banking Act of 1948 (the “New Jersey Banking Act”) and the regulations of the Commissioner under the New Jersey Banking Act applicable to bank holding companies.
The regulatory framework applicable to bank holding companies and their subsidiary banks is intended to protect depositors, the DIF, and the U.S. banking system as a whole. This system is not designed to protect equity investors in bank holding companies. The Company is required to file reports with, and otherwise comply with the rules and regulations of, the Federal Reserve Board, the Commissioner and the FDIC. The Federal Reserve Board and the Commissioner conduct periodic examinations to assess the Company’s compliance with various regulatory requirements. The Company files certain reports with, and otherwise complies with, the rules and regulations of the Securities and Exchange Commission under the federal securities laws and the listing requirements of NASDAQ.
Our business is heavily regulated by both state and federal agencies. Both the scope of the laws and regulations and the intensity of supervision to which our business is subject have increased in recent years, in response to the financial crisis as well as other factors such as technological and market changes. Regulatory enforcement and fines have also increased across the banking and financial services sector. Many of these changes have occurred as a result of the Dodd-Frank Act and its
25
implementing regulations, most of which are now in place. In addition, on May 24, 2018, the Economic Growth, Regulatory Relief and Consumer Protection Act (the “EGRRCP Act”) was enacted. This legislation includes targeted amendments to the Dodd-Frank Act and other financial services laws. While there have been some changes to the post-financial crisis framework applicable to the Company, primarily relating to stress testing, the Company expects that its business will remain subject to extensive regulation and supervision.
Stress Tests
Prior to the enactment of the EGRRCP Act, the Dodd-Frank Act required banks with total consolidated assets of more than $10 billion to conduct annual stress tests. The Dodd-Frank Act also required the FDIC, in coordination with federal financial regulatory agencies, to issue regulations establishing methodologies for stress testing that provide for at least three different sets of conditions, including baseline, adverse, and severely adverse. The regulations also required banks to publish a summary of the results of the stress tests. The EGRRCP Act has eliminated the annual mandated stress test requirement for banks like us with total consolidated assets of less than $100 billion.
While we are no longer required to conduct annual stress tests, we have advised our regulators that we will continue to conduct stress testing of our loan portfolio and advise our Board and our regulators of the results of such testing.
Volcker Rule
Under the provisions of the Volcker Rule we are prohibited from: (i) engaging in short-term proprietary trading for our own account; and (ii) having certain ownership interest in and relationships with hedge funds or private equity funds. The final Volcker Rule regulations impose significant compliance and reporting obligations on banking entities. The Company has put in place the compliance programs required by the Volcker Rule and has also implemented a governance and control program to ensure appropriate oversight and ongoing compliance. In 2019, the U.S. banking agencies adopted changes to the regulations implementing the Volcker Rule designed to establish a more risk-based approach to compliance and reduce the complexity of the regulations. The changes were effective January 1, 2020. Regulatory changes to the Volcker Rule effective October 1, 2020, streamlined portions of the rule and loosened certain restrictions so that banks may engage in certain activities that the Volcker Rule was not intended to address but there was no impact to the Company.
Consumer Protection and Consumer Financial Protection Bureau Supervision
The Dodd-Frank Act also established the CFPB. The CFPB has rulemaking authority over all banks, and its examination and enforcement authority applies to banks at or greater than $10 billion in total assets. The Bank is subject to CFPB supervision and examination of compliance with Federal Consumer Protection Laws. In addition, this agency is responsible for interpreting and enforcing a broad range of consumer protection laws (“Federal Consumer Protection Laws”) that govern the provision of deposit accounts and the making of loans, including the regulation of mortgage lending and servicing. This includes laws such as the Equal Credit Opportunity Act, the Truth in Lending Act, the Truth in Savings Act, the Home Mortgage Disclosure Act, the Real Estate Settlement Procedures Act and the Fair Credit Reporting Act.
The Dodd-Frank Act permits states to adopt stricter consumer protection laws and for state attorneys general to enforce consumer protection rules issued by the CFPB. The Company expects that its business will remain subject to extensive regulations and supervision by the CFPB as well as applicable state consumer protection laws and regulations, which will continue to increase our operating and compliance costs.
New Jersey Banking Regulation
Activity Powers. The Bank derives its lending, investment and other powers primarily from the applicable provisions of the New Jersey Banking Act and its related regulations. Under these laws and regulations, commercial banks, including the Bank, generally may invest in:
•real estate mortgages;
•consumer and commercial loans;
•specific types of debt securities, including certain corporate debt securities and obligations of federal, state and local governments and agencies;
•certain types of corporate equity securities; and
•certain other assets.
A commercial bank may also make investments pursuant to a “leeway” power, which permits investments not otherwise permitted by the New Jersey Banking Act, subject to certain restrictions imposed by the FDIC. “Leeway” investments must comply with a number of limitations on the individual and aggregate amounts of “leeway” investments. A commercial bank may also exercise trust powers upon approval of the Commissioner. Lastly, New Jersey commercial banks may exercise those powers, rights, benefits or privileges authorized for national banks or out-of-state banks or for federal or
26
out-of-state commercial banks or savings associations, provided that before exercising any such power, right, benefit or privilege, prior approval by the Commissioner by regulation or by specific authorization is required. The exercise of these lending, investment and activity powers are limited by federal law and the related regulations. See “Federal Banking Regulation — Activity Restrictions on State-Chartered Banks” below.
Loans-to-One-Borrower Limitations. With certain specified exceptions, a New Jersey-chartered commercial bank may not make loans or extend credit to a single borrower or to entities related to the borrower in an aggregate amount that would exceed 15% of the bank’s capital funds. A commercial bank may lend an additional 10% of the bank’s capital funds if secured by collateral meeting the requirements of the New Jersey Banking Act. The Bank currently complies with applicable loans-to-one-borrower limitations.
Dividends. Under the New Jersey Banking Act, a commercial bank may declare and pay a dividend on its capital stock only to the extent that the payment of the dividend would not impair the capital stock of the commercial bank. In addition, a commercial bank may not pay a dividend unless the commercial bank would, after the payment of the dividend, have a surplus of not less than 50% of its capital stock, or if not, the payment of the dividend would not reduce the surplus. Federal law may also limit the amount of dividends that may be paid by the Bank. See “— Federal Banking Regulation — Prompt Corrective Action” below.
Minimum Capital Requirements. Regulations of the Commissioner impose on New Jersey-chartered depository institutions, including the Bank, minimum capital requirements similar to those imposed on insured state banks. See “— Federal Banking Regulation — Capital Requirements” below.
Examination and Enforcement. The NJDOBI may examine the Bank whenever it deems an examination advisable. The NJDOBI engages in routine annual examinations of the Bank. The Commissioner may order any commercial bank to discontinue any violation of law or unsafe or unsound business practice, and may direct any director, officer, attorney or employee of a commercial bank engaged in an objectionable activity, after the Commissioner has ordered the activity to be terminated, to show cause at a hearing before the Commissioner why such person should not be removed. The Commissioner may also seek the appointment of receiver or conservator for a New Jersey commercial bank under certain conditions.
Federal Banking Regulation
Capital Requirements. Federal regulations require FDIC insured depository institutions to meet several minimum capital standards: a common equity Tier 1 capital to risk-based assets ratio of 4.5%, a Tier 1 capital to risk-based assets ratio of 6.0%, a total capital to risk-based assets of 8.0%, and a 4.0% Tier 1 capital to total assets leverage ratio.
Common equity Tier 1 capital is generally defined as common stockholders’ equity and retained earnings. Tier 1 capital is generally defined as common equity Tier 1 and additional Tier 1 capital. Additional Tier 1 capital includes certain noncumulative perpetual preferred stock and related surplus and minority interests in equity accounts of consolidated subsidiaries. Total capital includes Tier 1 capital (common equity Tier 1 capital plus additional Tier 1 capital) and Tier 2 capital. Tier 2 capital is comprised of capital instruments and related surplus meeting specified requirements, and may include cumulative preferred stock and long-term perpetual preferred stock, mandatory convertible securities, intermediate preferred stock and subordinated debt. Also included in Tier 2 capital is the allowance for loan and lease losses limited to a maximum of 1.25% of risk-weighted assets and, for institutions that have exercised an opt-out election regarding the treatment of accumulated other comprehensive income (“AOCI”), up to 45% of net unrealized gains on available-for-sale equity securities with readily determinable fair market values. Institutions that have not exercised the AOCI opt-out have AOCI incorporated into common equity Tier 1 capital (including unrealized gains and losses on available-for-sale-securities). The Bank exercised its AOCI opt-out election. Calculation of all types of regulatory capital is subject to deductions and adjustments specified in the regulations.
In determining the amount of risk-weighted assets for purposes of calculating risk-based capital ratios, all assets, including certain off-balance sheet assets (e.g., recourse obligations, direct credit substitutes, residual interests) are multiplied by a risk weight factor assigned by the regulations based on the risks believed inherent in the type of asset. Higher levels of capital are required for asset categories believed to present greater risk. For example, a risk weight of 0% is assigned to cash and U.S. government securities, a risk weight of 50% is generally assigned to prudently underwritten first lien one to four- family residential real estate loans, a risk weight of 100% is assigned to commercial and consumer loans, a risk weight of 150% is assigned to certain past due loans and a risk weight of between 0% to 600% is assigned to permissible equity interests, depending on certain specified factors.
In addition to establishing the minimum regulatory capital requirements, the regulations limit capital distributions and certain discretionary bonus payments to management if the institution does not hold a “capital conservation buffer” consisting of 2.5% of common equity Tier 1 capital to risk-weighted asset above the amount necessary to meet its minimum risk-based
27
capital requirements. The capital conservation buffer requirement was phased in beginning January 1, 2016 until fully implemented at 2.5% on January 1, 2019.
CECL Capital Implications. On January 1, 2020, the Company adopted the new accounting standard that requires the measurement of the allowance for credit loss to be based on the best estimate of lifetime expected credit losses inherent in the Company’s relevant financial asset. For more information, see Note 1, Summary of Significant Accounting Principles, of Notes to Consolidated Financial Statements in “Item 15 - Exhibits and Financial Statement Schedules.” On March 27, 2020, in response to the COVID-19 pandemic, U.S. banking regulators issued an interim final rule that the Company adopted to delay for two years the initial adoption impact of CECL on regulatory capital, followed by a three-year transition period to phase out the aggregate amount of the capital benefit provided during 2020 and 2021 (i.e. a five-year transition period). During the two-year delay, the Company will add back to common equity tier 1 capital (“CET1”) 100% of the initial adoption impact of CECL plus 25% of the cumulative quarterly changes in the allowance for credit losses (i.e., quarterly transitional amounts). After two years, starting on January 1, 2022, the quarterly transitional amounts along with the initial adoption impact of CECL will be phased out of CET1 capital over the three-year period.
Paycheck Protection Program. On April 9, 2020, in response to the economic impact of the COVID-19 pandemic, the Federal Reserve, OCC and FDIC issued an interim final rule that excludes loans pledged as collateral to the Federal Reserve’s PPP Lending Facility from supplemental leverage ratio exposure, average total consolidated assets and Advanced and Standardized risk-weighted assets. Additionally, PPP loans, which are guaranteed by the SBA, will receive a zero percent risk weight under the Basel 3 Advanced and Standardized approaches regardless of whether they are pledged as collateral to the PPP Lending Facility. On December 27, 2020, the Consolidated Appropriations Act, 2021, was enacted and included a reopening of the PPP.
Qualitative Capital Factors. In assessing an institution’s capital adequacy, the FDIC takes into consideration, not only these numeric factors, but qualitative factors as well, and has the authority to establish higher capital requirements for individual institutions where deemed necessary.
The federal banking agencies, including the FDIC, have also adopted regulations to require an assessment of an institution’s exposure to declines in the economic value of a bank’s capital due to changes in interest rates when assessing the bank’s capital adequacy. Under such a risk assessment, examiners evaluate a bank’s capital for interest rate risk on a case-by-case basis, with consideration of both quantitative and qualitative factors. Institutions with significant interest rate risk may be required to hold additional capital. According to the agencies, applicable considerations include:
•the quality of the bank’s interest rate risk management process;
•the overall financial condition of the bank; and
•the level of other risks at the bank for which capital is needed.
As of December 31, 2020, the Bank and the Company were considered “well capitalized” under applicable regulations and exceeded all regulatory capital requirements as follows:
As of December 31, 2020 (1) | ||||||||||||||||||||||||||||||||||||||
| Actual | Minimum Capital Requirement with Conservation Buffer | To be Well Capitalized under Prompt Corrective Action Provisions (2) | ||||||||||||||||||||||||||||||||||||
| Amount | Ratio | Amount | Ratio | Amount | Ratio | |||||||||||||||||||||||||||||||||
| (Dollars in thousands) | ||||||||||||||||||||||||||||||||||||||
| Bank: | ||||||||||||||||||||||||||||||||||||||
| Tier 1 Leverage Ratio | $ | 2,391,126 | 9.08 | % | $ | 1,053,636 | 4.000 | % | $ | 1,317,045 | 5.00 | % | ||||||||||||||||||||||||||
| Common Equity Tier 1 Risk-Based Capital | 2,391,126 | 11.72 | % | 1,428,527 | 7.000 | % | 1,326,489 | 6.50 | % | |||||||||||||||||||||||||||||
| Tier 1 Risk-Based Capital | 2,391,126 | 11.72 | % | 1,734,640 | 8.500 | % | 1,632,602 | 8.00 | % | |||||||||||||||||||||||||||||
| Total Risk-Based Capital | 2,646,520 | 12.97 | % | 2,142,790 | 10.500 | % | 2,040,753 | 10.00 | % | |||||||||||||||||||||||||||||
| Investors Bancorp, Inc.: | ||||||||||||||||||||||||||||||||||||||
| Tier 1 Leverage Ratio | $ | 2,674,590 | 10.14 | % | $ | 1,054,677 | 4.000 | % | n/a | n/a | ||||||||||||||||||||||||||||
| Common Equity Tier 1 Risk-Based Capital | 2,674,590 | 13.07 | % | 1,432,164 | 7.000 | % | n/a | n/a | ||||||||||||||||||||||||||||||
| Tier 1 Risk-Based Capital | 2,674,590 | 13.07 | % | 1,739,056 | 8.500 | % | n/a | n/a | ||||||||||||||||||||||||||||||
| Total Risk-Based Capital | 2,944,128 | 14.39 | % | 2,148,246 | 10.500 | % | n/a | n/a | ||||||||||||||||||||||||||||||
(1)For purposes of calculating Tier 1 leverage ratio, assets are based on adjusted total average assets. In calculating Tier 1 risk-based capital and Total risk-based capital, assets are based on total risk-weighted assets.
28
(2)Prompt corrective action provisions do not apply to the bank holding company.
Activity Restrictions on State-Chartered Banks. Federal law and FDIC regulations generally limit the activities and investments of state-chartered FDIC insured banks and their subsidiaries to those permissible for national banks and their subsidiaries, unless such activities and investments are specifically exempted by law or consented to by the FDIC.
Before making a new investment or engaging in a new activity that is not permissible for a national bank or otherwise permissible under federal law or FDIC regulations, an insured bank must seek approval from the FDIC to make such investment or engage in such activity. The FDIC will not approve the activity unless the bank meets its minimum capital requirements and the FDIC determines that the activity does not present a significant risk to the FDIC insurance funds. Certain activities of subsidiaries that are engaged in activities permitted for national banks only through a “financial subsidiary” are subject to additional restrictions.
Federal law permits a state-chartered commercial bank to engage, through financial subsidiaries, in any activity in which a national bank may engage through a financial subsidiary and on substantially the same terms and conditions. In general, the law permits a national bank that is well-capitalized and well-managed to conduct, through a financial subsidiary, any activity permitted for a financial holding company other than insurance underwriting, insurance investments or real estate development or merchant banking. The total assets of all such financial subsidiaries may not exceed the lesser of 45% of the bank’s total assets or $50 billion. The bank must have policies and procedures to assess the financial subsidiary’s risk and protect the bank from such risk and potential liability, must not consolidate the financial subsidiary’s assets with the bank’s and must exclude from its own assets and equity all equity investments, including retained earnings, in the financial subsidiary. State-chartered commercial banks may retain subsidiaries in existence as of March 11, 2000 and may engage in activities that are not authorized under federal law. Although the Bank meets all conditions necessary to establish and engage in permitted activities through financial subsidiaries, it has not chosen to engage in such activities.
Federal Home Loan Bank System. The Bank is a member of the Federal Home Loan Bank system, which consists of the regional Federal Home Loan Banks, each subject to supervision and regulation by the Federal Housing Finance Agency (“FHFA”). The Federal Home Loan Banks provide a credit facility for member institutions. It is funded primarily from proceeds derived from the sale of consolidated obligations of the Federal Home Loan Banks. The Federal Home Loan Banks make loans to members (i.e., advances) in accordance with policies and procedures, including collateral requirements, established by the respective Boards of Directors of the Federal Home Loan Banks. These policies and procedures are subject to the regulation and oversight of the FHFA. The FHFA has also established standards of community or investment service that members must meet to maintain access to such long-term advances.
Safety and Soundness Standards. Pursuant to the requirements of FDICIA, as amended by the Riegle Community Development and Regulatory Improvement Act of 1994, each federal banking agency, including the FDIC, has adopted guidelines establishing general standards relating to matters such as internal controls, information and internal audit systems, loan documentation, credit underwriting, interest rate exposure, asset growth, asset quality, earnings and compensation, fees and benefits. In general, the guidelines require, among other things, appropriate systems and practices to identify and manage the risks and exposures specified in the guidelines. The guidelines prohibit excessive compensation as an unsafe and unsound practice and describe compensation as excessive when the amounts paid are unreasonable or disproportionate to the services performed by an executive officer, employee, director, or principal stockholder.
In addition, the FDIC adopted regulations to require a commercial bank that is given notice by the FDIC that it is not satisfying any of such safety and soundness standards to submit a compliance plan to the FDIC. If, after being so notified, a commercial bank fails to submit an acceptable compliance plan or fails in any material respect to implement an accepted compliance plan, the FDIC may issue an order directing corrective and other actions of the types to which a significantly undercapitalized institution is subject under the “prompt corrective action” provisions of FDICIA. If a commercial bank fails to comply with such an order, the FDIC may seek to enforce such an order in judicial proceedings and to impose civil monetary penalties.
Enforcement. The FDIC has extensive enforcement authority over insured commercial banks, including the Bank. This enforcement authority includes, among other things, the ability to assess civil money penalties, to issue cease and desist orders and to remove directors and officers. In general, these enforcement actions may be initiated in response to violations of laws and regulations and to unsafe or unsound practices.
Prompt Corrective Action. Federal law establishes a prompt corrective action framework to resolve the problems of undercapitalized institutions. The FDIC has adopted regulations to implement the prompt corrective action legislation. Those regulations were amended effective January 1, 2015 to incorporate the previously mentioned increased regulatory capital standards that were effective on the same date. An institution is deemed to be “well capitalized” if it has a total risk-based capital ratio of 10.0% or greater, a Tier 1 risk-based capital ratio of 8.0% or greater, a leverage ratio of 5.0% or greater and a
29
common equity Tier 1 ratio of 6.5% or greater. An institution is “adequately capitalized” if it has a total risk-based capital ratio of 8.0% or greater, a Tier 1 risk-based capital ratio of 6.0% or greater, a leverage ratio of 4.0% or greater and a common equity Tier 1 ratio of 4.5% or greater. An institution is “undercapitalized” if it has a total risk-based capital ratio of less than 8.0%, a Tier 1 risk-based capital ratio of less than 6.0%, a leverage ratio of less than 4.0% or a common equity Tier 1 ratio of less than 4.5%. An institution is deemed to be “significantly undercapitalized” if it has a total risk-based capital ratio of less than 6.0%, a Tier 1 risk-based capital ratio of less than 4.0%, a leverage ratio of less than 3.0% or a common equity Tier 1 ratio of less than 3.0%. An institution is considered to be “critically undercapitalized” if it has a ratio of tangible equity (as defined in the regulations) to total assets that is equal to or less than 2.0%.
Generally, a receiver or conservator must be appointed for an institution that is “critically undercapitalized” within specific time frames. The regulations also provide that a capital restoration plan must be filed with the FDIC within 45 days of the date a commercial bank receives notice that it is “undercapitalized,” “significantly undercapitalized” or “critically undercapitalized.” Various restrictions, such as restrictions on capital distributions and growth, also apply to “undercapitalized” institutions. The FDIC may also take any one of a number of discretionary supervisory actions against undercapitalized institutions, including the issuance of a capital directive and the replacement of senior executive officers and directors.
The Bank was classified as “well-capitalized” under the prompt corrective action framework as of December 31, 2020.
Liquidity. The Bank maintains sufficient liquidity to ensure its safe and sound operation, in accordance with FDIC regulations. See “Management’s Discussion and Analysis of Financial Condition and Results of Operations — Liquidity and Capital Resources.”
Deposit Insurance. The Bank is a member of the DIF, which is administered by the FDIC. Deposit accounts in the Bank are insured by the FDIC, up to a maximum of $250,000 for each separately insured depositor.
The FDIC imposes an assessment for deposit insurance against all insured depository institutions. Each institution’s assessment is based on the perceived risk to the insurance fund of the institution, with institutions deemed riskiest paying higher assessments. The Dodd-Frank Act required the FDIC to revise its procedures to base assessments on average total assets less tangible capital, rather than deposits. The FDIC’s assessment schedule ranges from 1.5 basis points to 40 basis points of average total assets less tangible capital for institutions of the Bank’s asset size. The FDIC has a more comprehensive approach to evaluating, for assessment purposes, the risk presented by larger institutions such as the Bank. Large institutions (i.e., $10 billion or more in assets) such as the Bank are subject to assessment based upon a detailed scorecard approach involving (i) a performance score determined using forward-looking risk measures, including certain stress testing, and (ii) a loss severity score, which is designed to measure, based on modeling, potential loss to the FDIC insurance fund if the institution failed. The total score is converted to an assessment rate, subject to certain adjustments. In addition, effective as of July 1, 2016, the FDIC implemented a requirement of the Dodd-Frank Act that institutions with assets of $10 billion or more be responsible for increasing the DIF reserve ratio from 1.15% to 1.35%. On September 30, 2018, the DIF reached 1.36%, ahead of the September 30, 2020 deadline required under the Dodd-Frank Act. FDIC regulations provide that surcharges on insured depository institutions with total consolidated assets of $10 billion or more cease upon the DIF reserve ratio reaching the statutorily required minimum. Assessments on large banks for periods subsequent to September 30, 2018 no longer include a quarterly surcharge.
Insurance of deposits may be terminated by the FDIC upon a finding that an institution has engaged in unsafe or unsound practices, is in an unsafe or unsound condition to continue operations or has violated any applicable law, regulation, rule, order or condition imposed by the FDIC. We are not currently aware of any practice, condition or violation that may lead to termination of our deposit insurance.
In addition to the FDIC assessments, the Financing Corporation was authorized to impose and collect, with the approval of the FDIC, assessments for anticipated payments, issuance costs and custodial fees on bonds issued by the FICO in the 1980s to recapitalize the former Federal Savings and Loan Insurance Corporation. The bonds issued by the FICO began to mature in 2017 and fully matured in 2019. Consequently, insured banks are no longer paying a FICO assessment.
Transactions with Affiliates of Investors Bank. Transactions between an insured bank, such as the Bank, and any of its affiliates are governed by Sections 23A and 23B of the Federal Reserve Act and implementing regulations. An affiliate of a bank is any company or entity that controls, is controlled by or is under common control with the bank. Generally, a subsidiary of a bank that is not also a depository institution or financial subsidiary is not treated as an affiliate of the bank for purposes of Sections 23A and 23B.
30
Section 23A:
•limits the extent to which a bank or its subsidiaries may engage in “covered transactions” with any one affiliate to an amount equal to 10% of such bank’s capital and surplus, as defined in the applicable regulations. Such transactions with all affiliates are limited to an amount equal to 20% of such capital and surplus; and
•requires that all such transactions be on terms that are consistent with safe and sound banking practices.
The term “covered transaction” includes the making of loans, purchase of assets, issuance of guarantees and other similar types of transactions. Further, most loans by a bank to any of its affiliates must be secured by collateral in amounts ranging from 100% to 130% of the loan amounts. In addition, any covered transaction by a bank with an affiliate and any purchase of assets or services by a bank from an affiliate must be on terms that are substantially the same, or at least as favorable to the bank, as those that would be provided to a non-affiliate.
Pursuant to Federal Reserve Board Regulation O, we are also subject to quantitative restrictions on extensions of credit to executive officers, directors, principal stockholders and their related interests. In general, such extensions of credit (i) may not exceed certain dollar limitations, (ii) must be made on substantially the same terms, including interest rates and collateral, as those prevailing at the time for comparable transactions with third parties and (iii) must not involve more than the normal risk of repayment or present other unfavorable features. Certain extensions of credit also require the approval of our Board.
Prohibitions Against Tying Arrangements. Banks are subject to the prohibitions of 12 U.S.C. Section 1972 on certain tying arrangements. A depository institution is prohibited, subject to specific exceptions, from extending credit to or offering any other service, or fixing or varying the consideration for such extension of credit or service, on the condition that the customer obtain some additional service from the institution or its affiliates or not obtain services of a competitor of the institution.
Privacy Standards. FDIC regulations require the Bank to disclose its privacy policy, including identifying with whom it shares “non-public personal information,” to customers at the time of establishing the customer relationship and annually thereafter.
The Bank is also required to provide its customers with the ability to “opt-out” of having the Bank share their non-public personal information with unaffiliated third parties before it can disclose such information, subject to certain exceptions.
In addition, in accordance with the Fair Credit Reporting Act, the Bank must provide its customers with the ability to “opt-out” of having the Bank share their non-public personal information for marketing purposes with an affiliate or subsidiary before it can disclose such information.
The FDIC and other federal banking agencies adopted guidelines establishing standards for safeguarding customer information. The guidelines describe the agencies’ expectations for the creation, implementation and maintenance of an information security program, which includes administrative, technical and physical safeguards appropriate to the size and complexity of the institution and the nature and scope of its activities. The standards set forth in the guidelines are intended to insure the security and confidentiality of customer records and information, protect against any anticipated threats or hazards to the security or integrity of such records and protect against unauthorized access to or use of such records or information that could result in substantial harm or inconvenience to any customer.
Community Reinvestment Act and Fair Lending Laws. All FDIC-insured institutions have a responsibility under the Community Reinvestment Act (“CRA”) and related regulations to help meet the credit needs of their communities, including low- and moderate-income individuals and neighborhoods. In connection with its examination of a state chartered commercial bank, the FDIC is required to assess the institution’s record of compliance with the CRA. Among other things, the current CRA regulations rates an institution based on its actual performance in meeting community needs. In particular, the current evaluation system focuses on three tests:
•a lending test, to evaluate the institution’s record of making loans in its service areas;
•an investment test, to evaluate the institution’s record of investing in community development projects, affordable housing, and programs benefiting low- or moderate-income individuals and/or census tracts and businesses; and
•a service test, to evaluate the institution’s delivery of services through its branches, ATMs and other offices.
An institution’s failure to comply with the provisions of the CRA could, at a minimum, result in regulatory restrictions on its activities. The Bank received a “satisfactory” CRA rating in our most recent publicly-available federal evaluation, which was conducted by the FDIC in October 2017.
In addition, the Equal Credit Opportunity Act and the Fair Housing Act prohibit lenders from discriminating in their lending practices on the basis of characteristics specified in those statutes. The failure to comply with the Equal Credit
31
Opportunity Act and the Fair Housing Act could result in enforcement actions by the FDIC, as well as other federal regulatory agencies and the Department of Justice.
In April 2018, the U.S. Department of Treasury issued a memorandum to the Federal banking regulators with recommended changes to the CRA’s implementing regulations to reduce their complexity and associated burden on banks. In December 2019, the FDIC, along with the Office of the Comptroller of the Currency, the agency that regulates national banks, issued a proposed rule that would significantly amend the CRA regulations. In May 2020, the Office of the Comptroller of the Currency adopted a final rule amending its CRA regulations. The FDIC, however, indicated it was not then prepared to issue a final rule. We will continue to evaluate the impact of any changes to the regulations implementing the CRA.
Loans to a Bank’s Insiders
Federal Regulation. A bank’s loans to its insiders — executive officers, directors, principal shareholders (any owner of 10% or more of its stock) and any of certain entities affiliated with any such persons (an insider’s related interest) are subject to the conditions and limitations imposed by Section 22(h) of the Federal Reserve Act and its implementing regulations. Under these restrictions, the aggregate amount of the loans to any insider and the insider’s related interests may not exceed the loans-to-one-borrower limit applicable to national banks, which is comparable to the loans-to-one-borrower limit applicable to the Bank. All loans by a bank to all insiders and insiders’ related interests in the aggregate may not exceed the bank’s capital and surplus. Federal regulation also requires that any proposed loan to an insider or a related interest of that insider be approved in advance by a majority of the board of directors of the bank, with any interested directors not participating in the voting, if such loan, when aggregated with any existing loans to that insider and the insider’s related interests, would exceed either (1) $500,000 or (2) the greater of $25,000 or 5% of the bank’s unimpaired capital and surplus.
Generally, loans to insiders must be made on substantially the same terms as, and follow credit underwriting procedures that are not less stringent than, those that are prevailing at the time for comparable transactions with other persons. An exception is made for extensions of credit made pursuant to a benefit or compensation plan of a bank that is widely available to employees of the bank and that does not give any preference to insiders of the bank over other employees of the bank.
In addition, federal law prohibits extensions of credit to a bank’s insiders and their related interests by any other institution that has a correspondent banking relationship with the bank, unless such extension of credit is on substantially the same terms as those prevailing at the time for comparable transactions with other persons and does not involve more than the normal risk of repayment or present other unfavorable features.
With certain exceptions, loans to an executive officer, other than loans for the education of the officer’s children and certain loans secured by the officer’s residence, may not exceed the lesser of (1) $100,000 or (2) the greater of $25,000 or 2.5% of the bank’s capital and surplus.
New Jersey Regulation. The New Jersey Banking Act imposes conditions and limitations on loans and extensions of credit to directors and executive officers of a commercial bank and to corporations and partnerships controlled by such persons, which are comparable in many respects to the conditions and limitations imposed on the loans and extensions of credit to insiders and their related interests under federal law, as discussed above. The New Jersey Banking Act also provides that a commercial bank that is in compliance with federal law is deemed to be in compliance with such provisions of the New Jersey Banking Act.
Federal Reserve System
Under Federal Reserve Board regulations, the Bank was required to maintain reserves against its transaction accounts. The requirements were adjusted annually by the Federal Reserve Board. Required reserves were maintained in the form of vault cash and/or an interest-bearing account at a Federal Reserve Bank; or a pass-through account as defined by the Federal Reserve Board. Effective March 26, 2020, the Federal Reserve Board reduced reserve requirement ratios to zero, effectively eliminating the requirements, due to a change in its approach to monetary policy. The Federal Reserve Board indicated that it has no plans to re-impose reserve requirements but could in the future if conditions warrant.
32
Anti-Money Laundering and Customer Identification
The Bank is subject to FDIC regulations implementing the Uniting and Strengthening America by Providing Appropriate Tools Required to Intercept and Obstruct Terrorism Act of 2001, or the USA PATRIOT Act. The USA PATRIOT Act gives the federal government powers to address terrorist threats through enhanced domestic security measures, expanded surveillance powers, increased information sharing, and broadened anti-money laundering (“AML”) requirements. By way of amendments to the Bank Secrecy Act (“BSA”), Title III of the USA PATRIOT Act contains measures intended to encourage information sharing among bank regulatory and law enforcement agencies. Further, certain provisions of Title III impose affirmative obligations on a broad range of financial institutions, including banks, thrifts, brokers, dealers, credit unions, money transfer agents and parties registered under the Commodity Exchange Act.
Title III of the USA PATRIOT Act and the related FDIC regulations require the:
•Establishment of AML compliance programs that includes policies, procedures, and internal controls; the appointment of an AML compliance officer; an effective training program; and independent testing;
•Making of certain reports to FinCEN and law enforcement that are designated to assist in the detection and prevention of money laundering and terrorist financing activities;
•Establishment of a program specifying procedures for obtaining and maintaining certain records from customers seeking to open new accounts, including verifying the identity of customers within a reasonable period of time;
•Establishment of enhanced due diligence policies, procedures and controls designed to detect and report money-laundering, terrorist financing and other suspicious activity;
•Monitoring account activity for suspicious transactions; and
•Impose a heightened level of review for certain high risk customers or accounts.
The USA PATRIOT Act also includes prohibitions on correspondent accounts for foreign shell banks and requires compliance with record keeping obligations with respect to correspondent accounts of foreign banks. Bank regulators are directed to consider a holding company’s effectiveness in combating money laundering when ruling on Federal Reserve Act and Bank Merger Act applications.
The bank regulatory agencies have increased the regulatory scrutiny of the BSA and AML programs maintained by financial institutions. Significant penalties and fines, as well as other supervisory orders may be imposed on a financial institution for non-compliance with these requirements. In addition, the federal bank regulatory agencies must consider the effectiveness of financial institutions engaging in a merger transaction in combating money laundering activities. The Bank has adopted policies and procedures to comply with these requirements.
Holding Company Regulation
Federal Regulation. Bank holding companies, including the Company, are subject to examination, regulation and periodic reporting under the Bank Holding Company Act, as administered by the Federal Reserve Board. Federal Reserve Board regulations impose consolidated capital adequacy requirements on bank holding companies. The Dodd-Frank Act required the Federal Reserve Board to promulgate consolidated regulatory capital requirements for depository institution holding companies that are no less stringent, both quantitatively and in terms of components of capital, than those applicable to institutions themselves. The Company is therefore subject to such capital requirements.
In addition, Federal Reserve Board guidance sets forth the supervisory expectation that bank holding companies will inform and consult with Federal Reserve Board staff in advance of issuing a dividend that exceeds earnings for the quarter and should inform the Federal Reserve Board and should eliminate, defer or significantly reduce dividends if (i) net income available to shareholders for the past four quarters, net of dividends previously paid during that period, is not sufficient to fully fund the dividends, (ii) prospective rate of earnings retention is not consistent with the bank holding company’s capital needs and overall current and prospective financial condition, or (iii) the bank holding company will not meet, or is in danger of not meeting, its minimum regulatory capital adequacy ratios.
A bank holding company is required to provide the Federal Reserve Board prior written notice of any purchase or redemption of its outstanding equity securities if the gross consideration for the purchase or redemption, when combined with the net consideration paid for all such purchases or redemptions during the preceding 12 months, would be equal to 10% or more of the company’s consolidated net worth. The Federal Reserve Board may disapprove such a purchase or redemption if it determines that the proposal would constitute an unsafe and unsound practice, or would violate any law, regulation, Federal Reserve Board order or directive, or any condition imposed by, or written agreement with, the Federal Reserve Board. Such notice and approval is not required for a bank holding company that is as “well capitalized” under applicable regulations of the Federal Reserve Board, that has received a composite “1” or “2” rating, as well as a “satisfactory” rating for management, at its
33
most recent bank holding company examination by the Federal Reserve Board, and that is not the subject of any unresolved supervisory issues. Notwithstanding that regulation, Federal Reserve Board guidance provides that bank holding companies should notify the Federal Reserve Board of any proposed redemption or repurchase of outstanding stock that will result in a net reduction in total shares outstanding over the quarter. The guidance indicates that such notification is to allow the Federal Reserve Board to review the proposed redemption or repurchase from a supervisory perspective and possibly object to the redemption or repurchase.
As a bank holding company, the Company is required to obtain the prior approval of the Federal Reserve Board to acquire all, or substantially all, of the assets of any bank or bank holding company. Prior Federal Reserve Board approval is also required for the Company to acquire direct or indirect ownership or control of any voting securities of any bank or bank holding company if, after giving effect to such acquisition, it would, directly or indirectly, own or control more than 5% of any class of voting shares of such bank or bank holding company.
In addition, a bank holding company that does not elect to be a financial holding company under federal regulations is generally prohibited from engaging in, or acquiring direct or indirect control of any company engaged in non-banking activities. One of the principal exceptions to this prohibition is for activities found by the Federal Reserve Board to be so closely related to banking or managing or controlling banks. Some of the principal activities that the Federal Reserve Board has determined by regulation to be closely related to banking are:
•making or servicing loans;
•performing certain data processing services;
•providing discount brokerage services; or acting as fiduciary, investment or financial advisor;
•leasing personal or real property; and
•making investments in corporations or projects designed primarily to promote community welfare.
A bank holding company that elects to be a financial holding company may engage in activities that are financial in nature or incident to activities which are financial in nature. The Company has not elected to be a financial holding company, although it may seek to do so in the future. A bank holding company may elect to become a financial holding company if:
•each of its depository institution subsidiaries is “well capitalized”;
•each of its depository institution subsidiaries is “well managed”;
•each of its depository institution subsidiaries has at least a “satisfactory” Community Reinvestment Act rating at its most recent examination; and
•the bank holding company has filed a certification with the Federal Reserve Board stating that it elects to become a financial holding company.
Under federal law, depository institutions are liable to the FDIC for losses suffered or anticipated by the FDIC in connection with the default of a commonly controlled depository institution, or for any assistance provided by the FDIC to such an institution in danger of default. This law would potentially be applicable to the Company if it ever acquired as a separate subsidiary a depository institution in addition to the Bank.
The Riegle-Neal Interstate Banking and Branching Efficiency Act of 1994, as amended by Section 613 of the Dodd-Frank Act, regulates interstate banking activities by establishing a framework for nationwide interstate banking and branching. As amended, this interstate banking and branching authority generally permits a bank in one state to establish a de novo branch at a location in another host state if state banks chartered in such host state would also be permitted to establish a branch at that location in the state. Under these amendments, the Bank is permitted to establish branch offices in other states in addition to its existing New Jersey and New York branch offices.
The Gramm-Leach-Bliley Act of 1999 eliminated most of the barriers to affiliations among banks, securities firms, insurance companies, and other financial companies previously imposed under federal banking laws if certain criteria are satisfied. Certain subsidiaries of well-capitalized and well-managed banks may be treated as “financial subsidiaries,” which are generally permitted to engage in activities that are financial in nature, including securities underwriting, dealing, and market making; sponsoring mutual funds and investment companies, and other activities that the Federal Reserve has determined to be closely related to banking.
New Jersey Regulation. Under the New Jersey Banking Act, a company owning or controlling a bank is regulated as a bank holding company. The New Jersey Banking Act defines the terms “company” and “bank holding company” as such terms are defined under the BHCA. Each bank holding company controlling a New Jersey-chartered bank must file certain reports with the Commissioner and is subject to examination by the Commissioner.
34
Acquisition of Investors Bancorp, Inc. Under federal law and under the New Jersey Banking Act, no person may acquire control of the Company or the Bank without first obtaining approval of such acquisition of control by the Federal Reserve Board and the Commissioner.
Federal Securities Laws. The Company’s common stock is registered with the Securities and Exchange Commission under the Securities Exchange Act of 1934, as amended. The Company is subject to the information, proxy solicitation, insider trading restrictions and other requirements under the Securities Exchange Act of 1934.
The Company’s common stock held by persons who are affiliates (generally officers, directors and principal stockholders) of the Company may not be resold without registration or unless sold in accordance with certain resale restrictions. If the Company meets specified current public information requirements, each affiliate of the Company is able to sell in the public market, without registration, a limited number of shares in any three-month period.
Sarbanes-Oxley Act of 2002. The Sarbanes-Oxley Act of 2002 was enacted to address, among other issues, corporate governance, auditing and accounting, executive compensation, and enhanced and timely disclosure of corporate information.
As directed by the Sarbanes-Oxley Act, our Chief Executive Officer and Chief Financial Officer are required to certify that our quarterly and annual reports do not contain any untrue statement of a material fact. The rules adopted by the SEC under the Sarbanes-Oxley Act have several requirements, including having these officers certify that: they are responsible for establishing, maintaining and regularly evaluating the effectiveness of our internal control over financial reporting; they have made certain disclosures to our auditors and the audit committee of the Board about our internal control over financial reporting; and they have included information in our quarterly and annual reports about their evaluation and whether there have been changes in our internal control over financial reporting or in other factors that could materially affect internal control over financial reporting. We have existing policies, procedures and systems designed to comply with these regulations.
Taxation
Federal Taxation
General. The Company and its subsidiary are subject to federal income taxation in the same general manner as other corporations, with some exceptions discussed below. The Company and its subsidiary file a consolidated federal income tax return. The Company’s federal tax returns are not currently under audit.
The following discussion of federal taxation is intended only to summarize certain pertinent federal income tax matters and is not a comprehensive description of the tax rules applicable to the Company or its subsidiary.
Method of Accounting. For federal income tax purposes, the Company currently reports its income and expenses on the accrual method of accounting and uses a tax year ending December 31 for filing its federal and state income tax returns.
Bad Debt Reserves. Historically, the Bank was subject to special provisions in the tax law regarding allowable bad debt tax deductions and related reserves. Tax law changes were enacted in 1996 pursuant to the Small Business Protection Act of 1996 (the “1996 Act”), which eliminated the use of the percentage of taxable income method for tax years after 1995 and required recapture into taxable income over a six-year period of all bad debt reserves accumulated after 1987. The Bank has fully recaptured its post-1987 reserve balance. Currently, the Bank uses the specific charge off method to account for bad debt deductions for income tax purposes.
Taxable Distributions and Recapture. Prior to the 1996 Act, bad debt reserves created prior to January 1, 1988 (pre-base year reserves) were subject to recapture into taxable income if the Bank failed to meet certain thrift asset and definitional tests. As a result of the 1996 Act, bad debt reserves accumulated after 1987 are required to be recaptured into income over a six-year period. However, all pre-base year reserves are subject to recapture if the Bank makes certain non-dividend distributions, repurchases any of its stock, pays dividends in excess of tax earnings and profits, or ceases to maintain a bank charter. At December 31, 2020, the Bank’s total federal pre-base year reserve was approximately $45.2 million.
Net Operating Loss Carryovers. A corporation may carry forward net operating losses arising in tax years ending after December 31, 2017 indefinitely, subject to a deduction limitation of 80% of taxable income in a given year. However, net operating losses arising in tax years on or before December 31, 2017 are not subject to the 80% limitation deduction. As of December 31, 2020, the Company had total federal net operating loss carryforwards of $4.5 million related to prior acquisitions, arising in tax years prior to December 31, 2017.
Corporate Dividends-Received Deduction. The Company may exclude from its federal taxable income 100% of dividends received from the Bank as a wholly owned subsidiary. The corporate dividends-received deduction is 65% when the dividend is received from a corporation having at least 20% of its stock owned by the recipient corporation. A 50% dividends-
35
received deduction is available for dividends received from a corporation having less than 20% of its stock owned by the recipient corporation.
CARES Act. On March 27, 2020, the CARES Act was enacted in response to the COVID-19 pandemic. The CARES Act includes a number of changes to the current tax laws. The Company has evaluated the impact of the CARES Act and does not believe the CARES Act has a material financial impact on the income taxes of the Company.
State Taxation
New Jersey State Taxation. Generally, the income of corporations and savings institutions in New Jersey, which is calculated based on federal taxable income, subject to certain adjustments, and allocable to New Jersey is subject to New Jersey tax at a rate of 9.0%. On July 1, 2018, Assembly Bill 4202 (“A.4202”) was signed into law, providing significant revisions to New Jersey’s Corporation Business Tax laws. Among the changes provided for in the new legislation was a surtax, an additional imposition of tax, on corporate taxpayers that have allocated New Jersey net income in excess of $1 million. For tax years 2018 and 2019, the surtax rate imposed was 2.5%; and for tax years 2020 and 2021, the surtax rate was to be 1.5%. On September 29, 2020, Assembly Bill 4721 was signed into law, extending and retroactively increasing the surtax rate to 2.5% through December 31, 2023.
In addition, A.4202 mandated combined reporting for tax years ending on or after July 31, 2019. In December 2019, a technical bulletin was issued by the State of New Jersey providing clarification on mandatory combined reporting, excluding investment companies and real estate investment trusts. The Company meets the definition of an investment company and one of its indirect subsidiaries meets the definition of a real estate investment trust, and therefore are excluded from combined filing with the Company’s other affiliates and required to file standalone returns.
Prior to the issuance of the technical bulletin, the Company believed it would file a combined tax return for 2019 and therefore fully utilize its charitable contributions carried over from prior years as the recently reformed New Jersey tax law allows for charitable contributions of a member entity to be subtracted from the combined group’s entire net income. However, due to the clarification, the Company believed it would be excluded from the combined group, and therefore unable to fully deduct the charitable contributions. At December 31, 2019, the Company did not establish another valuation allowance and instead wrote off the state tax effect of the $9.7 million charitable contribution as it expired in 2019.
New York State Taxation. The New York State corporate franchise tax is based on the federal consolidated taxable income of the Company and its affiliates allocable and apportionable to New York State and taxed at a rate of 6.5%. The amount of revenues that are sourced to New York State can be expected to fluctuate over time. In addition, the Company and its affiliates are subject to the Metropolitan Transportation Authority (“MTA”) Surcharge allocable to business activities carried on in the Metropolitan Commuter Transportation District. The MTA surcharge for 2020 was 29.4% of a recomputed New York State franchise tax, calculated using a 6.5% tax rate on allocated and apportioned entire net income. The Company and its affiliates are currently under audit with respect to their New York State combined franchise tax return for tax years 2015 and 2016.
New York City Taxation. The Company and its affiliates are subject to the combined corporate tax for New York City calculated on a similar basis as the New York State franchise tax, subject to the New York City apportionment rules. The Company and its affiliates are currently under audit with respect to their New York City combined business corporation tax return for tax years 2016 through 2018.
Pennsylvania Taxation. Considered a mutual thrift institution conducting business in Pennsylvania, the Bank is subject to the mutual thrift institutions tax. The mutual thrift institutions tax is imposed at the rate of 11.5% on apportionable net taxable income and is required to be reported and filed on the annual Net Income Tax Report. Mutual thrift institutions are exempt from all other Pennsylvania corporate taxes.
Delaware State Taxation. As a Delaware holding company not earning income in Delaware, the Company is exempted from Delaware corporate income tax but is required to file annual returns and pay annual fees and an annual franchise tax to the State of Delaware.
Other State Taxation. To a lesser extent, the Company receives income from customers in other states. The Company’s filing obligations with respect to the receipts vary from state to state and depend upon the reporting requirements in the various jurisdictions.
36
| ITEM 1A. | RISK FACTORS | ||||
The risks set forth below, in addition to the other risks described in this Annual Report on Form 10-K, may adversely affect our business, financial condition and operating results. In addition to the risks set forth below and the other risks described in this annual report, there may also be additional risks and uncertainties that are not currently known to us or that we currently deem to be immaterial that could materially and adversely affect our business, financial condition or operating results. As a result, past financial performance may not be a reliable indicator of future performance, and historical trends should not be used to anticipate results or trends in future periods. Further, to the extent that any of the information contained in this Annual Report on Form 10-K constitutes forward-looking statements, the risk factors set forth below also are cautionary statements identifying important factors that could cause our actual results to differ materially from those expressed in any forward-looking statements made by or on behalf of us.
Economic and Market Area
The economic impact of the COVID-19 pandemic may continue to have an adverse impact on our business and results of operations.
The COVID-19 pandemic, which was declared a national emergency in the United States in March 2020, continues to create extensive disruptions to the global economy and financial markets and to businesses and the lives of individuals throughout the world. Federal and state governments, including in New Jersey and New York, have taken, and continue to take, unprecedented actions to contain the spread of the disease, including by instituting quarantines, travel bans, shelter-in-place orders, closures of businesses and schools, fiscal stimulus, and legislation designed to deliver monetary aid and other relief to businesses and individuals impacted by the pandemic. Although in various locations certain activity restrictions have been relaxed with some level of success, including in New Jersey and New York, in many states and localities the number of individuals diagnosed with COVID-19 has increased significantly. Reporting of COVID-19 case data as of January 20, 2021 indicates that, on a national level, the number of reported positive cases in the United States now exceeds 24 million and the seven-day average of new positive cases exceeds 200,000. This figure is more than twice the volume of new positive cases per week reported as of November 1, 2020, when the spread of COVID-19 in the United States began to increase at its most rapid pace since the onset of the pandemic. Despite governmental approval of three COVID-19 vaccines and the initial distribution of these vaccines to certain high-risk populations, the sustained surge of positive cases across a number of jurisdictions throughout the United States has increased pressure on governmental officials to reverse the relaxation of activity restrictions, which could lead to the shutdown of certain businesses and operations and exacerbate economic uncertainty and instability related to the pandemic.
The governmental and social response to the COVID-19 pandemic has resulted in an unprecedented slow-down in economic activity and a related increase in unemployment. Since the outbreak of COVID-19 in the United States, more than 70 million people nationwide have filed claims for unemployment. For the week ending January 8, 2021, first-time unemployment claims increased to 965,000, representing the largest volume of new weekly unemployment claims since late August 2020. As of the end of December 2020, the national unemployment rate was 6.7%. Although an improvement from the 11.1% national unemployment rate observed in June 2020, the current rate of unemployment is substantially higher than the 3.6% national unemployment rate observed in January 2020 prior to the outbreak of COVID-19 in the United States. Through the enactment of the Consolidated Appropriations Act of 2021, Congress revived and extended through March 14, 2021 several unemployment insurance benefit programs established under the CARES Act which had previously expired. In addition, the new Administration has proposed a substantial COVID-19 relief package which includes, among other programs and provisions, direct stimulus payments, small business funding and further extension and expansion of unemployment insurance programs. The prospects and timing for congressional consideration of the package, as well as the substantive modifications that may be pursued by Congress, are not certain at this time.
The COVID-19 pandemic, and related efforts to contain it, have caused significant disruptions in the functioning of the financial markets and have increased economic and market uncertainty and volatility. To help address these issues, the Federal Open Market Committee (“FOMC”) has reduced the benchmark federal funds rate to a target range of 0% to 0.25%, and the yields on 10- and 30-year U.S. Treasury notes have declined to historic lows. At its June and July meetings, the FOMC continued its commitment to this approach, indicating that the target federal funds rate would remain at current levels until the economy is in position to achieve the FOMC’s maximum-employment and price-stability goals. In its November and December meetings, the FOMC indicated that overall financial conditions remain accommodative, in part due to the policy measures that have been implemented to ensure the flow of credit to U.S. businesses and households, but that the pandemic will continue to pose considerable risks to the economic outlook over the medium term. Accordingly, the FOMC did not deviate from the approach described above as established in earlier meetings. In addition, in order to support the flow of credit to households and businesses, the Federal Reserve indicated that it will continue to increase its holdings of U.S. Treasury securities and agency residential and commercial mortgage-backed securities to sustain proper functioning of the financial markets.
37
Congress and various state governments and federal agencies have taken actions to require lenders to provide forbearance and other relief to borrowers (e.g., waiving late payment and other fees). The federal banking agencies have encouraged financial institutions to prudently work with affected borrowers, and legislation passed in 2020 has provided relief from reporting loan classifications due to modifications related to the COVID-19 pandemic. More specifically, through Section 4022 of the CARES Act, Congress provided relief to borrowers with federally-backed one-to-four family mortgage loans experiencing a financial hardship due to COVID-19 by allowing such borrowers to request forbearance, regardless of delinquency status, for up to 360 days. Section 4022 of the CARES Act also prohibited servicers of federally-backed mortgage loans from initiating foreclosures during the 60-day period beginning March 18, 2020. The statutory period for relief afforded under Section 4022 of the CARES Act expired on December 31, 2020; however, in recent weeks the Biden Administration and the federal agencies that guarantee covered mortgages each have extended the moratorium deadline beyond that date.
On February 9, 2021, the Federal Housing Finance Agency (“FHFA”) announced that Fannie Mae and Freddie Mac (each an “Enterprise”) would extend the single-family moratorium on foreclosures on Enterprise-guaranteed mortgage loans and evictions involving Enterprise-owned properties through March 31, 2021 and that borrowers of Enterprise-guaranteed mortgage loans who had entered forbearance for a period that is scheduled to expire may be eligible for an extension of the forbearance period of up to three additional months. On February 16, 2021, the Administration, together with the Department of Housing and Urban Development and the Departments of Veterans Affairs and Agriculture extended and expanded the mortgage forbearance and foreclosure relief programs administered by those agencies. Specifically, the joint action (i) extended the foreclosure moratorium for relevant borrowers through June 30, 2021; (ii) extended the mortgage payment forbearance enrollment window until June 30, 2021 for relevant borrowers who wish to request forbearance; and (iii) provided up to six months of additional mortgage payment forbearance, in three-month increments, for relevant borrowers who entered forbearance on or before June 30, 2021. These actions followed a series of short-term extensions approved independently by the relevant agencies.
Under Section 4023 of the CARES Act, until the earlier of December 31, 2020 and the date of termination of the national emergency declaration, borrowers with federally-backed multifamily mortgage loans whose payments were current as of February 1, 2020, but who have since experienced financial hardship due to COVID-19, may request a forbearance for up to 90 days. Borrowers receiving such forbearance may not evict or charge late fees to tenants during the duration of such forbearance. On December 23, 2020, the FHFA announced an extension of its forbearance program for qualifying multi-family properties through March 31, 2021. Moreover, on January 20, 2021, the Biden Administration issued an Executive Order extending the federal eviction moratorium issued through the Centers for Disease Control and Prevention––which was recently extended by Congress through January 31, 2021––through March 31, 2021. As part of the COVID-19 relief package proposed by the Administration, this eviction moratorium would be further extended through September 30, 2021 if adopted as proposed.
Additionally, in many states in which we do business or in which our borrowers and loan collateral are located, temporary bans on evictions and foreclosures have been enacted through a mix of executive orders, regulations, and judicial orders. Certain such relief orders have since expired, although several states, including New York and New Jersey, have extended their temporary orders and may continue to do so for so long as the public health emergency persists. In addition, in New York, Governor Andrew Cuomo signed legislation on June 17, 2020 that expands mortgage forbearance available for those experiencing financial hardship during the crisis caused by the COVID-19 pandemic. The legislation applies to those who have mortgages with state-regulated financial institutions and is intended to be an expansion of the CARES Act’s mortgage forbearance provisions. The legislation provides up to one year of forbearance if the borrower’s hardship persists and provides flexible payment options. Further, on December 28, 2020, Governor Cuomo signed the COVID-19 Emergency Eviction and Foreclosure Prevention Act of 2020, which prevents residential evictions, foreclosure proceedings, credit discrimination and negative credit reporting related to the COVID-19 pandemic. Of note, this legislation imposes a moratorium on residential foreclosure proceedings and evictions in New York State until May 1, 2021. The New Jersey Legislature currently is debating several comparable legislative proposals; however, residential mortgage foreclosure and tenant eviction relief have been addressed to date through executive orders issued by New Jersey Governor Phil Murphy.
Certain industries have been particularly hard-hit by the COVID-19 pandemic, including the travel and hospitality industry, the restaurant industry and the retail industry. Refer to the COVID-19 Pandemic section included in Part I, Item 1 of this Annual Report on Form 10-K for details on the Company’s loan portfolio by industry as of December 31, 2020. In addition, the spread of COVID-19 has caused us to modify our business practices, including employee travel, employee work locations, and cancellation of physical participation in meetings, events and conferences. We have many employees working remotely and we may take further actions as may be required by government authorities or that we determine are in the best interests of our employees, customers and business partners.
Given the ongoing and dynamic nature of the circumstances, it is difficult to predict the full impact of the COVID-19 outbreak on our business. The extent of such impact will depend on future developments, which are highly uncertain, including when the spread of COVID-19 can be controlled and abated and when and how the economy may be fully reopened. As the result of the COVID-19 pandemic and the related adverse local and national economic consequences, we may be subject to any
38
of the following risks, any of which could have a material, adverse effect on our business, financial condition, liquidity, results of operations, risk-weighted assets and regulatory capital:
•because the incidence of reported COVID-19 cases and related hospitalizations and deaths varies significantly by state and locality, the economic downturn caused by the pandemic may be deeper and more sustained in certain areas, including those in which we do business relative to other areas of the country;
•our ability to market our products and services maybe impaired by a variety of external factors, including a prolonged reduction in economic activity and continued economic and financial market volatility, which could cause demand for our products and services to decline, in turn making it difficult for us to grow assets and income;
•if the economy is unable to substantially reopen, and high levels of unemployment continue for an extended period of time, loan delinquencies, problem assets, and foreclosures may increase, resulting in increased charges and reduced income;
•collateral for loans, especially real estate, may decline in value, which may reduce our ability to liquidate such collateral and could cause loan losses to increase and impair our ability over the long run to maintain our targeted loan origination volume;
•our delinquent, adversely classified assets and non-accrual loans could increase substantially if borrowers continue to experience financial difficulties beyond forbearance/payment deferral periods resulting in adversely impacted asset quality, capital and earnings. As of February 14, 2021, we had $756 million, or 3.6%, of loans deferring principal and/or interest payments as a result of COVID-19;
•our allowance for loan losses may have to be increased if borrowers experience financial difficulties beyond forbearance periods, which will adversely affect our net income;
•an increase in non-performing loans due to the COVID-19 pandemic would result in a corresponding increase in the risk-weighting of assets and therefore an increase in required regulatory capital;
•the net worth and liquidity of loan guarantors may decline, impairing their ability to honor commitments to us;
•as the result of the reduction of the Federal Reserve’s target federal funds rate to near 0%, the yield on our assets may decline to a greater extent than the decline in our cost of interest-bearing liabilities, reducing our net interest margin and spread and reducing net income;
•deposits, including municipal deposits, could decline if customers need to draw on available balances as a result of the economic downturn;
•a material decrease in net income or a net loss over several quarters could result in a decrease in our quarterly cash dividend;
•we face heightened cybersecurity risk in connection with our operation of a remote working environment, which risks include, among others, greater phishing, malware, and other cybersecurity attacks, vulnerability to disruptions of our information technology infrastructure and telecommunications systems, increased risk of unauthorized dissemination of confidential information, limited ability to restore our systems in the event of a systems failure or interruption, greater risk of a security breach resulting in destruction or misuse of valuable information, and potential impairment of our ability to perform critical functions--all of which could expose us to risks of data or financial loss, litigation and liability and could seriously disrupt our operations and the operations of any impacted customers;
•we rely on third party vendors for certain services and the unavailability of a critical service or limitations on the business capacities of our vendors for extended periods of time due to the COVID-19 pandemic could have an adverse effect on our operations; and
•as a result of the COVID-19 pandemic, there may be unexpected developments in financial markets, legislation, regulations and supervisory expectations, and consumer and customer behavior.
The Company is not a traditional SBA lender however, we have been an active participant in the PPP. The PPP authorizes financial institutions to make federally-guaranteed loans to qualifying small businesses and non-profits organizations. These loans carry an interest rate of 1% per annum and a maturity of two years if originated before June 5, 2020 and five years if originated on or after June 5, 2020. The PPP provides that such loans may be forgiven if the borrowers meet certain requirements with respect to maintaining employee headcount and payroll and the use of the loan proceeds after the loan is originated. If not forgiven, these loans will be guaranteed by the SBA under the SBA’s section 7(a) program. We sold approximately $328 million of PPP loans in December 2020 to The Loan Source, Inc. (“Loan Source”), a company with significant experience in the origination, funding and servicing of PPP loans, including the PPP loan forgiveness process. We had approximately $4.8 million of PPP loans outstanding as of December 31, 2020.
The PPP loan application submission deadline was August 8, 2020. However, on December 27, 2020, the Economic Aid to Hard-Hit Small Businesses, Nonprofits, and Venues Act (“Economic Aid Act”) was adopted as part of the Consolidated Appropriations Act, 2021, and reopened the PPP to certain businesses that satisfy applicable eligibility criteria. Specifically, among other things, the Economic Aid Act: (i) extends the original PPP (or the “First Draw”) deadline from August 8, 2020 to March 31, 2021; and (ii) establishes “Second Draw” PPP loans, which enables certain entities to receive a second round of PPP credit. Any customer inquiries received by the Company regarding the second round of PPP will be referred to Loan Source.
As a result of our participation in the PPP, we may be subject to litigation and claims by borrowers in connection with the PPP loans that we have made, as well as investigation and scrutiny by our regulators, Congress, the SBA, the Treasury
39
Department and other governmental authorities. Regardless of whether these claims and investigations may be founded or unfounded, if such claims and investigations are not resolved in a timely and favorable manner for us, they may result in significant costs and liabilities (including increased legal and professional costs) and/or adversely affect the market perception of us and our products and services.
Moreover, our future success and profitability substantially depends on the management skills of our executive officers and directors, many of whom have held officer and director positions with us for many years. The unanticipated loss or unavailability of key employees due to COVID-19 pandemic could harm our ability to operate our business or execute our business strategy. We may not be successful in finding and integrating suitable successors in the event of key employee loss or unavailability. Any one or a combination of the factors identified above could negatively impact our business, financial condition and results of operations and prospects.
A worsening of national or local economic conditions could adversely affect our financial condition and results of operations.
Deteriorating economic or business conditions could significantly affect the markets in which we do business, the value of our loans and investments, and our on-going operations, costs and profitability. Declines in real estate values and sales volumes and unemployment levels, particularly in New York and New Jersey given our concentration in this region, may result in greater loan delinquencies, increases in our nonperforming, criticized and classified assets and a decline in demand for our products and services. These events may cause us to incur losses and may adversely affect our financial condition and results of operations. The majority of our loan portfolio is secured by real estate in New York and New Jersey. In addition, a migration of individuals and businesses from urban areas, including New York City, could adversely affect our financial condition and results of operations in similar ways given our concentration in New York City. At December 31, 2020, approximately $6.7 billion, or 42% of our commercial loans were to borrowers or secured by collateral in New York City.
Our inability to achieve profitability on new branches may negatively affect our earnings.
We have expanded our presence throughout our market area and may pursue further expansion through de novo branching or the purchase of branches from other financial institutions. The profitability of our expansion strategy will depend on whether the income that we generate from the new branches will offset the increased expenses resulting from operating these branches. We expect that it may take a period of time before these branches can become profitable, especially in areas in which we do not have an established presence. During this period, the expense of operating these branches may negatively affect our net income.
Strong competition within our market area may limit our growth and profitability.
Competition in the banking and financial services and non-bank industry is intense. In our market area, we compete with numerous commercial banks, savings institutions, mortgage brokerage firms, credit unions, finance companies, mutual funds, insurance companies, and brokerage and investment banking firms operating locally and elsewhere. In addition, we compete with numerous online financial service providers who compete in the new digital fintech marketplace and who may not be subject to our regulatory requirements. Some of our competitors have substantially greater resources and lending limits than we have, have greater name recognition and market presence that benefit them in attracting business, and offer certain services that we do not or cannot provide. In addition, larger bank and non-bank competitors may be able to price loans and deposits more aggressively than we can. Our profitability depends upon our continued ability to successfully compete in our market area. The greater resources and deposit and loan products offered by some of our competitors may limit our ability to increase our interest-earning assets. For additional information see “Item 1. Business.”
Severe weather, acts of terrorism and other external events could impact our ability to conduct business.
Weather-related events have adversely impacted our market area in recent years, especially areas located near coastal waters and flood prone areas. Such events that may cause significant flooding and other storm-related damage may become more common events in the future. Financial institutions have been, and continue to be, targets of terrorist threats aimed at compromising operating and communication systems and the metropolitan New York area and Northern New Jersey remain central targets for potential acts of terrorism. Such events could cause significant damage, impact the stability of our facilities and result in additional expenses, impair the ability of our borrowers to repay their loans, reduce the value of collateral securing repayment of our loans, and result in the loss of revenue. While we have established and regularly test disaster recovery procedures, the occurrence of any such event could have a material adverse effect on our business, operations and financial condition.
Additionally, global markets may be adversely affected by natural disasters, the emergence of widespread health emergencies or pandemics, cyber attacks or campaigns, military conflict, terrorism or other geopolitical events. Global market fluctuations may affect our business liquidity. Also, any sudden or prolonged market downturn in the U.S. or abroad, as a result of the above factors or otherwise could result in a decline in revenue and adversely affect our results of operations and financial condition, including capital and liquidity levels.
40
Asset Quality and Interest Rate
If our allowance for credit losses is not sufficient to cover actual losses, our earnings could decrease.
We make various assumptions and judgments about the collectability of our loan portfolio, including the creditworthiness of our borrowers and the value of the real estate and other assets serving as collateral for the repayment of many of our loans. In determining the amount of the allowance for credit losses, we review our loans and our loss and delinquency experience, and we evaluate economic conditions. If actual results differ significantly from our assumptions, our allowance for credit losses may not be sufficient to cover losses inherent in our loan portfolio, resulting in additions to our allowance. Bank regulators also periodically review our loan portfolio, the allowance for credit losses, and our assumptions underlying the determinations we have made regarding the allowance for credit losses, and as a result can require us to increase our provision for credit losses or recognize further loan charge-offs.
Because we intend to continue to increase our commercial originations, our credit risk will increase.
At December 31, 2020, our portfolio of multi-family, commercial real estate, C&I and construction loans totaled $16.05 billion, or 76.9% of our total loans. We intend to continue to increase our originations of multi-family, commercial real estate, C&I and construction loans, which generally have more risk than one- to four-family residential mortgage loans. Since repayment of commercial loans depends on the successful management and operation of the borrower’s properties or related businesses, repayment of such loans can be affected by adverse conditions in the real estate market, local economy or the management of the business or property. In addition, our commercial borrowers may have more than one loan outstanding with us. Consequently, an adverse development with respect to one loan or one credit relationship can expose us to significantly greater risk of loss compared to an adverse development with respect to a one- to four-family residential mortgage loan. Because we plan to continue to increase our originations of these loans, it may be necessary to increase the level of our allowance for loan losses because of the increased risk characteristics associated with these types of loans. Any such increase to our allowance for loan losses would adversely affect our earnings.
Our C&I loan portfolio is unseasoned. It is difficult to judge the future performance of unseasoned loans.
Our C&I loan portfolio has increased to $3.58 billion at December 31, 2020 from $1.28 billion at December 31, 2016. Consequently, a substantial portion of our C&I loans are unseasoned. It is difficult to assess the future performance of these recently originated loans because of their relatively limited payment history from which to judge future collectability, especially in the economic environment since 2016. These loans may experience higher delinquency or charge-off levels than our historical loan portfolio experience, which could adversely affect our future performance.
We continue to expand our commercial lending efforts and footprint, which may expose us to increased lending risks and may have a negative effect on our results of operations.
In an effort to diversify our loan portfolio, we have expanded our commercial lending team to include leveraged lending and equipment finance teams, as well as a healthcare lending team that originate loans nationally. We will continue to explore other markets within commercial lending. These types of loans generally have a higher risk of loss compared to our one- to four-family residential real estate loans and multi-family loans, which could have a negative effect on our results of operations. In addition, some of our equipment finance portfolio relies on the residual values of the underlying equipment and therefore could be negatively impacted by a change in valuation. Because we are not as experienced with these new loan products and areas, we may incur losses or require additional time and resources for offering and managing such products effectively. At December 31, 2020, C&I loans represent approximately 17% of our total loans. In addition, at December 31, 2020, approximately 10% of our total commercial loans are to borrowers or secured by collateral located outside of New Jersey, New York and surrounding states.
Changes in interest rates could have a material adverse effect on our results of operations, financial condition, cash flows and capital.
Our ability to make a profit largely depends on our net interest income, which could be negatively affected by changes in interest rates. Net interest income is the difference between the interest income we earn on our interest-earning assets, such as loans and securities, and the interest expense we pay on our interest-bearing liabilities, such as deposits and borrowings.
The interest income we earn on our assets and the interest expense we pay on our liabilities are generally fixed for a contractual period of time. Our liabilities generally have shorter contractual maturities than our assets. This imbalance can create significant earnings volatility, because market interest rates change over time. In periods of rising short-term interest rates as well as flattening or inverted interest rates, the interest income earned on our assets may not increase as rapidly as the interest paid on our liabilities. See “Management’s Discussion and Analysis of Financial Condition and Results of Operations-Management of Market Risk.”
41
In addition, changes in interest rates can affect the average life of loans and mortgage-backed and related securities. Increases in interest rates may decrease loan demand and/or make it more difficult for borrowers to repay adjustable-rate loans. An increase in interest rates can also result in decreased prepayment of loans and mortgage-backed and related securities. Conversely, a decrease in interest rates may cause increased prepayments of loans and mortgage-backed and related securities as borrowers refinance their debt to reduce their borrowing costs. This creates reinvestment risk, which is the risk that we may not be able to reinvest the funds from faster prepayments at rates that are comparable to the rates we earned on the prepaid loans or securities.
Changes in interest rates also affect the current market value of our interest-earning securities portfolio. Generally, the value of securities moves inversely with changes in interest rates. At December 31, 2020, the fair value of our total securities portfolio was $4.12 billion. Unrealized net losses on debt securities available-for-sale are reported, after tax, as a separate component of equity. To the extent interest rates increase and the value of our available-for-sale portfolio decreases, our stockholders’ equity will be adversely affected.
We evaluate interest rate sensitivity using models that estimate net interest income sensitivity and the change in our economic value of equity over a range of interest rate scenarios. The economic value of equity analysis is the discounted present value of expected cash flows from assets, liabilities and off-balance sheet contracts. At December 31, 2020, in the event of a 200 basis point increase in interest rates, whereby rates increase evenly over a twelve-month period, and assuming management took no action to mitigate the effect of such change, the model projects that we would experience a 3.7% or $27.1 million decrease in net interest income. In a 200 basis point instantaneous increase in interest rates scenario, the economic value of equity (“EVE”) model projects a 2.0% or $70.1 million increase in EVE.
Source of Funds
Public funds deposits are an important source of funds for us and a reduced level of those deposits may hurt our profits and liquidity position.
Public funds deposits are a significant source of funds for our lending and investment activities. At December 31, 2020, $5.50 billion, or 28.2% of our total deposits, consisted of public funds deposits from local government entities, predominately domiciled in the state of New Jersey, such as townships, school districts, hospital districts, sheriff departments and other municipalities, which are collateralized by letters of credit from the FHLB or investment securities. Given our use and concentration of these typically high-average balance public funds deposits as a source of funds, our inability to retain such funds could adversely affect our liquidity. Further, our public funds deposits are primarily interest-bearing demand deposit accounts or short-term time deposits and therefore their pricing is more sensitive to changes in interest rate risks. If we are forced to pay higher rates on our public funds accounts to retain those funds, or if we are unable to retain such funds and we are forced to resort to other sources of funds for our lending and investment activities, such as borrowings from the FHLB, the interest expense associated with these other funding sources may be higher than the rates we are currently paying on our public funds deposits, which would adversely affect our net interest income.
In addition, the State of New Jersey is considering creating a State Bank, the purpose of which would be to promote economic development, commerce, and industry in the State. The proposal under consideration would permit State funds, including funds from State institutions and any State public source, to be held by the State Bank. Given the degree of our funding reliance on New Jersey-based municipal deposits and the potential lending ability of the proposed State Bank, we are uncertain of the impact this proposal may have on us. The possible loss of public funds on deposit may increase the costs of our funding needs, which could have a negative impact on our net income and negatively impact liquidity. The proposed legislation was first introduced in 2018, and in 2019, the Governor of New Jersey signed an executive order establishing an implementation board to develop criteria for establishing a State Bank. At this time, there is no assurance that a State Bank will be established or what its powers or authority may be.
FHLB funds are an important source of funding for the Company and reduced available capacity may have an adverse impact on our liquidity, results of operations and financial condition.
We borrow directly from the FHLB and various other financial institutions. Our financial flexibility will be severely constrained if we are unable to maintain our access to funding or if adequate financing is not available to accommodate future growth at acceptable interest rates. If we are unable to secure alternative funding or need to rely on more expensive funding sources, our operating margins, profitability and liquidity would be negatively impacted.
Regulatory Matters
We operate in a highly regulated environment and may be adversely affected by changes in laws and regulations.
The Bank is subject to extensive regulation, supervision and examination by the NJDOBI, our chartering authority, by the FDIC, as insurer of our deposits, and by the CFPB, with respect to consumer protection laws. As a bank holding company,
42
the Company is subject to regulation and oversight by the Federal Reserve Board. Such regulation and supervision govern the activities in which a bank and its holding company may engage and are intended primarily for the protection of the insurance fund and depositors. These regulatory authorities have extensive discretion in connection with their supervisory and enforcement activities, including the requirement for additional capital, the imposition of restrictions on our operations, restrictions on our ability to pay dividends and make other capital distributions to shareholders, restrictions on our ability to repurchase shares, the classification of our assets and the adequacy of our allowance for loan losses, compliance and privacy issues, BSA and AML compliance, and approval of merger transactions. Any change in such regulation and oversight, whether in the form of regulatory policy, regulations, or legislation, could have a material impact on the Bank, the Company and our operations.
The potential exists for additional Federal or state laws and regulations regarding capital requirements, lending and funding practices and liquidity standards, and bank regulatory agencies are expected to remain active in responding to concerns and trends identified in examinations, including the potential issuance of formal enforcement orders. New laws, regulations, and other legal and regulatory changes, along with negative developments in the financial industry and the domestic and international credit markets, could increase our costs of regulatory compliance and may significantly affect the markets in which we do business, the markets for and value of our loans and investments, and our ongoing operations, costs and profitability.
If the bank regulators impose limitations on our commercial real estate lending activities, our earnings, dividend paying capacity and/or ability to repurchase shares could be adversely affected.
In 2006, the FDIC, the Office of the Comptroller of the Currency and the Board of Governors of the Federal Reserve System (collectively, the “Agencies”) issued joint guidance entitled “Concentrations in Commercial Real Estate Lending, Sound Risk Management Practices” (the “CRE Guidance”). Although the CRE Guidance did not establish specific lending limits, it provides that a bank’s commercial real estate lending exposure may receive increased supervisory scrutiny where total non-owner occupied commercial real estate loans, including loans secured by apartment buildings, investor commercial real estate and construction and land loans, represent 300% or more of an institution’s total risk-based capital and the outstanding balance of the commercial real estate loan portfolio has increased by 50% or more during the preceding 36 months. Our level of non-owner occupied commercial real estate equaled 488% of Bank total risk-based capital at December 31, 2020, however our commercial real estate loan portfolio increased by only 3% during the preceding 36 months.
In December 2015, the Agencies released a new statement on prudent risk management for commercial real estate lending (the “2015 Statement”). In the 2015 Statement, the Agencies express concerns about easing commercial real estate underwriting standards, direct financial institutions to maintain underwriting discipline and exercise risk management practices to identify, measure and monitor lending risks, and indicate that the Agencies will continue “to pay special attention” to commercial real estate lending activities and concentrations going forward. If the FDIC, the Bank’s primary federal regulator were to impose restrictions on the amount of commercial real estate loans we can hold in our portfolio, or require higher capital ratios as a result of the level of commercial real estate loans we hold, our earnings, dividend paying capacity and/or ability to repurchase shares would be adversely affected.
The performance of our multi-family and commercial real estate loan portfolios could be adversely impacted by recent or proposed changes in laws and regulation.
On June 14, 2019, the State of New York enacted legislation increasing restrictions on rent increases in a rent-regulated apartment building, including, among other provisions, (i) repealing the “vacancy bonus” and “longevity bonus”, which allowed a property owner to raise rents as much as 20% each time a rental unit became vacant, (ii) eliminating high rent vacancy deregulation and high-income deregulation, which allowed a rental unit to be removed from rent stabilization once it crossed a statutory high-rent threshold and became vacant, or the tenant’s income exceeded the statutory amount in the preceding two years, and (iii) eliminating an exception that allowed a property owner who offered preferential rents to tenants to raise the rent to the full legal rent upon renewal. As a result of this new legislation as well as previously existing laws and regulations, which are outside the control of the borrower or the Bank, the value of the collateral for our multi-family loans or the future cash flow of such properties could be impaired. It is possible that rental income might not rise sufficiently over time to satisfy increases in the loan rate at repricing or increases in overhead expenses (e.g., utilities, taxes, etc.). In addition, if the cash flow from a collateral property is reduced or constrained, the borrower’s ability to repay the loan and the value of the collateral for the loan may be impaired.
43
Any future increase in FDIC insurance premiums will adversely impact our earnings.
As a “large institution” within the meaning of FDIC regulations (i.e., greater than $10 billion in assets), the Bank’s deposit insurance premium is determined differently than smaller banks. Small banks are assessed based on a risk classification determined by examination ratings, financial ratios and certain specified adjustments. Large institutions are subject to assessment based upon a more detailed scorecard approach involving (i) a performance score determined using forward-looking risk measures, including certain stress testing, and (ii) a loss severity score, which is designed to measure, based on modeling, potential loss to the FDIC insurance fund if the institution failed. The total score is converted to an assessment rate, subject to certain adjustments, with institutions deemed riskier paying higher assessments.
Capital requirements for financial institutions have increased in recent years, which may adversely impact our return on equity, or constrain us from paying dividends or repurchasing shares.
In 2015, the FDIC and the Federal Reserve Board instituted a new rule which substantially amended the regulatory risk-based capital rules applicable to the Bank and the Company. This rule implemented the “Basel III” regulatory capital reforms and changes required by the Dodd-Frank Act.
The rule included new minimum risk-based capital and leverage ratios, and refines the definition of what constitutes “capital” for purposes of calculating these ratios. The new minimum capital requirements are: (i) a new common equity Tier 1 to risk-based capital ratio of 4.5%; (ii) a Tier 1 to risk-based assets capital ratio of 6% (increased from 4% under prior rules); (iii) a total capital to risk-based assets ratio of 8%; and (iv) a Tier 1 leverage ratio of 4%. The rule also established a “capital conservation buffer” of 2.5% of common equity Tier 1 capital, and resulted in the following minimum ratios: (i) a common equity Tier 1 capital ratio of 7.0%; (ii) a Tier 1 to risk-based assets capital ratio of 8.5%; and (iii) a total capital to risk-based assets ratio of 10.5%. The required minimum capital conservation buffer increased in annual increments to 2.5% on January 1, 2019, which is the fully phased in conservation buffer. An institution will be subject to limitations on paying dividends, engaging in share repurchases, and paying discretionary bonuses if its capital level falls below the buffer amount. These limitations will establish a maximum percentage of eligible retained income that can be utilized for such actions.
The application of these more stringent capital requirements for the Bank and the Company could, among other things, result in lower returns on equity, require the raising of additional capital, and result in regulatory actions constraining us from paying dividends or repurchasing shares if we were to be unable to comply with such requirements.
The recent change in Administration could result in changes to tax laws and regulations.
The recent change in Administration could lead to changes in tax laws as well as changes in regulatory requirements. We are subject to changes in tax law that could increase our effective tax rates. These law changes may be retroactive to previous periods and as a result could negatively affect our current and future financial performance. An increase in our corporate tax rate could have an unfavorable impact on our earnings and capital generation abilities. Similarly, the Bank’s customers could experience varying effects from changes in tax laws and such effects, whether positive or negative, may have a corresponding impact on our business and the economy as a whole. In addition, changes to regulatory requirements could increase our costs of regulatory compliance and may significantly affect the markets in which we do business, the markets for and value of our loans and investments, and our ongoing operations, costs and profitability.
Business Issues
We will be required to transition from the use of LIBOR in the future.
On July 27, 2017, the Chief Executive of the United Kingdom Financial Conduct Authority, which regulates LIBOR, announced that it intends to stop persuading or compelling banks to submit rates for the calibration of LIBOR to the administrator of LIBOR after 2021. The continuation of LIBOR cannot be guaranteed after 2021. In November 2020, the LIBOR administrator announced plans to consult on easing publication of USD LIBOR on December 31, 2021 for only the one-week and two-month USD LIBOR tenors, and on June 30, 2023 for all other USD LIBOR tenors. The United States banking regulators concurrently issued a joint statement advising banks to stop new USD LIBOR issuances by the end of 2021. The Federal Reserve, in conjunction with the Alternative Reference Rates Committee (“ARRC”), a steering committee comprised of large U.S. financial institutions, is considering replacing USD LIBOR with a new index calculated by short-term repurchase agreements, backed by Treasury securities (“SOFR”). Although the ARRC has announced SOFR as its recommended alternative to LIBOR, SOFR may not gain market acceptance or be widely used as a benchmark. At this time, no consensus exists as to what rate or rates may become acceptable alternatives to LIBOR and it is impossible to predict the effect of any such alternatives on the value of LIBOR-based securities and variable rate loans, subordinated debentures, or other securities or financial arrangements, given LIBOR's role in determining market interest rates globally. Uncertainty as to the nature of alternative reference rates and as to potential changes or other reforms to LIBOR may adversely affect LIBOR rates and the value of LIBOR-based loans and securities in our portfolio, and may impact the availability and cost of hedging
44
instruments and borrowings. The Company has approximately $7.61 billion in financial instruments which are indexed to USD-LIBOR at December 31, 2020. If LIBOR rates are no longer available and we are required to implement substitute indices for the calculation of interest rates, we may incur expenses in effecting the transition, we may suffer a loss in the conversion to a new rate because the new rate may not be equal to what we were being paid on the LIBOR rate, and may be subject to disputes or litigation with customers and security holders over the appropriateness or comparability to LIBOR of the substitute indices, which could have an adverse effect on our results of operations. In the interim, we have established a cross-functional team to develop transition plans to address potential revisions to documentation, as well as customer management and communication, internal training, financial, operational and risk management implications, and legal and contract management. In addition, we have engaged with our regulators and with industry working groups and trade associations to develop strategies for transitioning away from LIBOR.
We may not be able to continue to grow our business, which may adversely impact our results of operations.
Our total assets have grown from approximately $23.17 billion at December 31, 2016 to $26.02 billion at December 31, 2020. Our business strategy calls for continued growth. Our ability to continue to grow depends, in part, upon our ability to successfully attract deposits, identify favorable loan and investment opportunities, acquire other banks and non-bank entities and enhance our market presence. In the event that we do not continue to grow, our results of operations could be adversely impacted.
Our ability to grow successfully will depend on whether we can continue to fund this growth while maintaining cost controls and asset quality, remain in good standing with our regulators, as well as on factors beyond our control, such as national and regional economic conditions and interest rate trends. If we are not able to control costs and maintain asset quality, such growth could adversely impact our earnings and financial condition.
We could be required to repurchase mortgage loans or indemnify mortgage loan purchasers due to breaches of representations and warranties, borrower fraud, or certain borrower defaults, which could have an adverse impact on our liquidity, results of operations and financial condition.
We sell into the secondary market a portion of the residential mortgage loans that we originate. The whole loan sale agreements we enter into in connection with such loan sales require us to repurchase or substitute mortgage loans in the event there is a breach of any of representations or warranties. In addition, we may be required to repurchase mortgage loans as a result of borrower fraud or in the event of early payment default of the borrower on a mortgage loan. We have established a reserve for estimated repurchase and indemnification obligations on the residential mortgage loans that we sell. We make various assumptions and judgments in determining this reserve. If our assumptions are incorrect, our reserve may not be sufficient to cover losses from repurchase and indemnification obligations related to our residential loans sold. Such event would have an adverse effect on our earnings.
We may incur impairments to goodwill.
At December 31, 2020, we had approximately $94.5 million recorded as goodwill. We evaluate goodwill for impairment, at least annually. Significant negative industry or economic trends, including declines in the market price of our common stock, reduced estimates of future cash flows or disruptions to our business, could result in impairments to goodwill. We operate in competitive environments and projections of future operating results and cash flows may vary significantly from actual results. If our analysis results in impairment to goodwill, we would be required to record an impairment charge to earnings in our financial statements during the period in which such impairment is determined to exist. Any such change could have an adverse effect on our results of operations.
Growing by acquisition entails integration and certain other risks.
Although we have successfully integrated business acquisitions in recent years, failure to successfully integrate systems subsequent to the completion of any future acquisitions could have a material impact on the operations of the Bank.
Future acquisition activity could dilute book value.
Both nationally and in our region, the banking industry is undergoing consolidation marked by numerous mergers and acquisitions. From time to time we may be presented with opportunities to acquire institutions and/or bank branches and we may engage in discussions and negotiations. Acquisitions typically involve the payment of a premium over book and trading values, and therefore, may result in the dilution of our book value per share.
45
We currently utilize incentive-based payment arrangements with our employees as compensation practices. Potential regulatory changes to this practice could have an impact on our current practices and impact our results of operations.
The Bank is subject to the compensation-related provisions of the Dodd-Frank Act which prohibit incentive-based payment arrangements that encourage inappropriate risk taking. The scope and content of the U.S. banking regulators’ policies on incentive compensation are continuing to develop and are likely to continue evolving in the future.
We may eliminate dividends on our common stock.
Although we pay quarterly cash dividends to our stockholders, stockholders are not entitled to receive dividends. Downturns in domestic and global economies and other factors could cause our board of directors to consider, among other things, the elimination of or reduction in the amount and/or frequency of cash dividends paid on our common stock.
We could be adversely affected by failure in our internal controls.
We continue to devote a significant amount of effort, time and resources to continually strengthen our controls and ensure compliance with complex accounting standards and banking regulations. A failure in our internal controls could have a significant negative impact not only on our earnings, but also on the perception that customers, regulators and investors may have of us.
Our recruitment efforts may not be sufficient to implement our business strategy and execute successful operations.
As we continue to grow, we may find our recruitment efforts more challenging. If we do not succeed in attracting, hiring, and integrating experienced or qualified personnel, we may not be able to continue to successfully implement our business strategy.
Our failure to effectively deploy capital may have an adverse effect on our financial performance.
We utilize our capital for general corporate purposes, including, among other items, organic growth, paying cash dividends, repurchasing shares of our common stock and acquisitions. Our failure to deploy capital effectively may reduce our profitability and may adversely affect the value of our common stock.
Information Security
A failure in or breach of our operational or security systems or infrastructure, or those of third parties, could disrupt our businesses, and adversely impact our results of operations, liquidity and financial condition, as well as cause reputational harm.
The Bank collects, processes and stores sensitive consumer data by utilizing computer systems and telecommunications networks operated by both the Bank and third-party service providers. Our operational and security systems, infrastructure, including our computer systems, data management, and internal processes, as well as those of third parties, are integral to our business. We rely on our employees and third parties in our day-to-day and ongoing operations, who may, as a result of human error, misconduct or malfeasance, or failure or breach of third- party systems or infrastructure, expose us to risk. We have taken measures to implement backup systems and other safeguards to support our operations, but our ability to conduct business may be adversely affected by any significant disruptions to us or to third parties with whom we interact. In addition, our ability to implement backup systems and other safeguards with respect to third-party systems is more limited than with our own systems.
We handle a substantial volume of customer and other financial transactions every day. Our financial, accounting, data processing, check processing, electronic funds transfer, loan processing, online and mobile banking, automated teller machines, or ATMs, backup or other operating or security systems and infrastructure may fail to operate properly or become disabled or damaged as a result of a number of factors including events that are wholly or partially beyond our control. This could adversely affect our ability to process these transactions or provide these services. There could be sudden increases in customer transaction volume, electrical, telecommunications or other major physical infrastructure outages, natural disasters, events arising from local or larger scale political or social matters, including terrorist acts, and cyber attacks. We continuously update these systems to support our operations and growth. This updating entails significant costs and creates risks associated with implementing new systems and integrating them with existing ones. Operational risk exposures could adversely impact our results of operations, liquidity and financial condition, and cause reputational harm.
46
A cyber attack, information or security breach, or a technology failure of ours or of a third-party could adversely affect our ability to conduct our business or manage our exposure to risk, result in the disclosure or misuse of confidential or proprietary information, increase our costs to maintain and update our operational and security systems and infrastructure, and adversely impact our results of operations, liquidity and financial condition, as well as cause reputational harm.
Our business is highly dependent on the security and efficacy of our infrastructure, computer and data management systems, as well as those of third parties with whom we interact. Cyber security risks for financial institutions have significantly increased in recent years in part because of the proliferation of new technologies, the use of the Internet and telecommunications technologies to conduct financial transactions, and the increased sophistication and activities of organized crime, hackers, terrorists and other external parties, including foreign state actors. Our operations rely on the secure processing, transmission, storage and retrieval of confidential, proprietary and other information in our computer and data management systems and networks, and in the computer and data management systems and networks of third parties. We rely on digital technologies, computer, database and email systems, software, and networks to conduct our operations. In addition, to access our network, products and services, our customers and third parties may use personal mobile devices or computing devices that are outside of our network environment.
Financial services institutions have been subject to, and are likely to continue to be the target of, cyber attacks, including computer viruses, malicious or destructive code, phishing attacks, denial of service or other security breaches that could result in the unauthorized release, gathering, monitoring, misuse, loss or destruction of confidential, proprietary and other information of the institution, its employees or customers or of third parties, or otherwise materially disrupt network access or business operations. For example, denial of service attacks have been launched against a number of large financial institutions and several large retailers have disclosed substantial cyber security breaches affecting debit and credit card accounts of their customers. We have experienced cyber security incidents in the past, although not material, and we anticipate that, as a larger bank, we could experience further incidents. There can be no assurance that we will not suffer material losses or other material consequences relating to technology failure, cyber attacks or other information or security breaches.
Misconduct by employees could also result in fraudulent, improper or unauthorized activities on behalf of clients or improper use of confidential information. The Bank may not be able to prevent employee errors or misconduct, and the precautions the Bank takes to detect this type of activity might not be effective in all cases. Employee errors or misconduct could subject the Bank to civil claims for negligence or regulatory enforcement actions, including fines and restrictions on our business.
In addition, there have been instances where financial institutions have been victims of fraudulent activity in which criminals pose as customers to initiate wire and automated clearinghouse transactions out of customer accounts. The recent massive breach of the systems of a credit bureau presents additional threats as criminals now have more information about a larger portion of the population of the United States than past breaches have involved, which could be used by criminals to pose as customers initiating transfers of money from customer accounts. Although the Bank has policies and procedures in place to verify the authenticity of its customers, the Bank cannot assure that such policies and procedures will prevent all fraudulent transfers. Such activity can result in financial liability and harm to our reputation.
As cyber threats and other fraudulent activity continues to evolve, we may be required to expend significant additional resources to continue to modify and enhance our protective measures or to investigate and remediate any information security vulnerabilities or incidents. Any of these matters could result in our loss of customers and business opportunities, significant disruption to our operations and business, misappropriation or destruction of our confidential information and/or that of our customers, or damage to our customers’ and/or third parties’ computers or systems, and could result in a violation of applicable privacy laws and other laws, litigation exposure, regulatory fines, penalties or intervention, loss of confidence in our security measures, reputational damage, reimbursement or other compensatory costs, and additional compliance costs. In addition, any of the matters described above could adversely impact our results of operations and financial condition.
We rely on third-party providers and other suppliers for a number of services that are important to our business. An interruption or cessation of an important service by any third-party could have a material adverse effect on our business.
We are dependent for the majority of our technology, including our core operating system, on third-party providers. If these companies were to discontinue providing services to us, we may experience significant disruption to our business. In addition, each of these third parties faces the risk of cyber attack, information breach or loss, or technology failure. If any of our third-party service providers experience such difficulties, or if there is any other disruption in our relationships with them, we may be required to find alternative sources of such services. We are dependent on these third-party providers securing their information systems, over which we have limited control, and a breach of their information systems could adversely affect our ability to process transactions, service our clients or manage our exposure to risk and could result in the disclosure of sensitive, personal customer information, which could have a material adverse impact on our business through damage to our reputation, loss of business, remedial costs, additional regulatory scrutiny or exposure to civil litigation and possible financial liability.
47
Assurance cannot be provided that we could negotiate terms with alternative service sources that are as favorable or could obtain services with similar functionality as found in existing systems without the need to expend substantial resources, if at all, thereby resulting in a material adverse impact on our business and results of operations.
| ITEM 1B. | UNRESOLVED STAFF COMMENTS | ||||
None.
| ITEM 2. | PROPERTIES | ||||
At December 31, 2020, the Company and the Bank conducted business from their corporate headquarters in Short Hills, New Jersey, with operation centers located in Iselin, Robbinsville, Dunellen and Millburn, New Jersey as well as lending offices within our primary market areas in Short Hills, Iselin, Robbinsville, Mount Laurel, Spring Lake, Newark and Jackson, New Jersey, the New York City boroughs of Manhattan, Queens and Brooklyn, and Islandia, New York, as well as a full-service branch network of 156 offices. We also have lending offices in Danbury, Connecticut and Charlotte, North Carolina.
| ITEM 3. | LEGAL PROCEEDINGS | ||||
The Company, the Bank and its subsidiaries are subject to various legal actions arising in the normal course of business. In the opinion of management, the resolution of these legal actions is not expected to have a material adverse effect on our financial condition or results of operations.
| ITEM 4. | MINE SAFETY DISCLOSURES | ||||
Not applicable.
48
Part II
| ITEM 5. | MARKET FOR REGISTRANT’S COMMON EQUITY, RELATED STOCKHOLDER MATTERS AND ISSUER PURCHASES OF EQUITY SECURITIES | ||||
Our shares of common stock are traded on the NASDAQ Global Select Market under the symbol “ISBC”. The approximate number of holders of record of Investors Bancorp, Inc.’s common stock as of February 19, 2021 was approximately 8,000. Certain shares of Investors Bancorp, Inc. are held in “nominee” or “street” name and accordingly, the number of beneficial owners of such shares is not known or included in the foregoing number.
Stock Performance Graph
Set forth below is a stock performance graph comparing (a) the cumulative total return on the Company’s common stock for the period beginning December 31, 2015 through December 31, 2020, (b) the cumulative total return of publicly traded thrifts over such period, and, (c) the cumulative total return of all publicly traded banks and thrifts over such period. Cumulative return assumes the reinvestment of dividends and is expressed in dollars based on an assumed investment of $100.
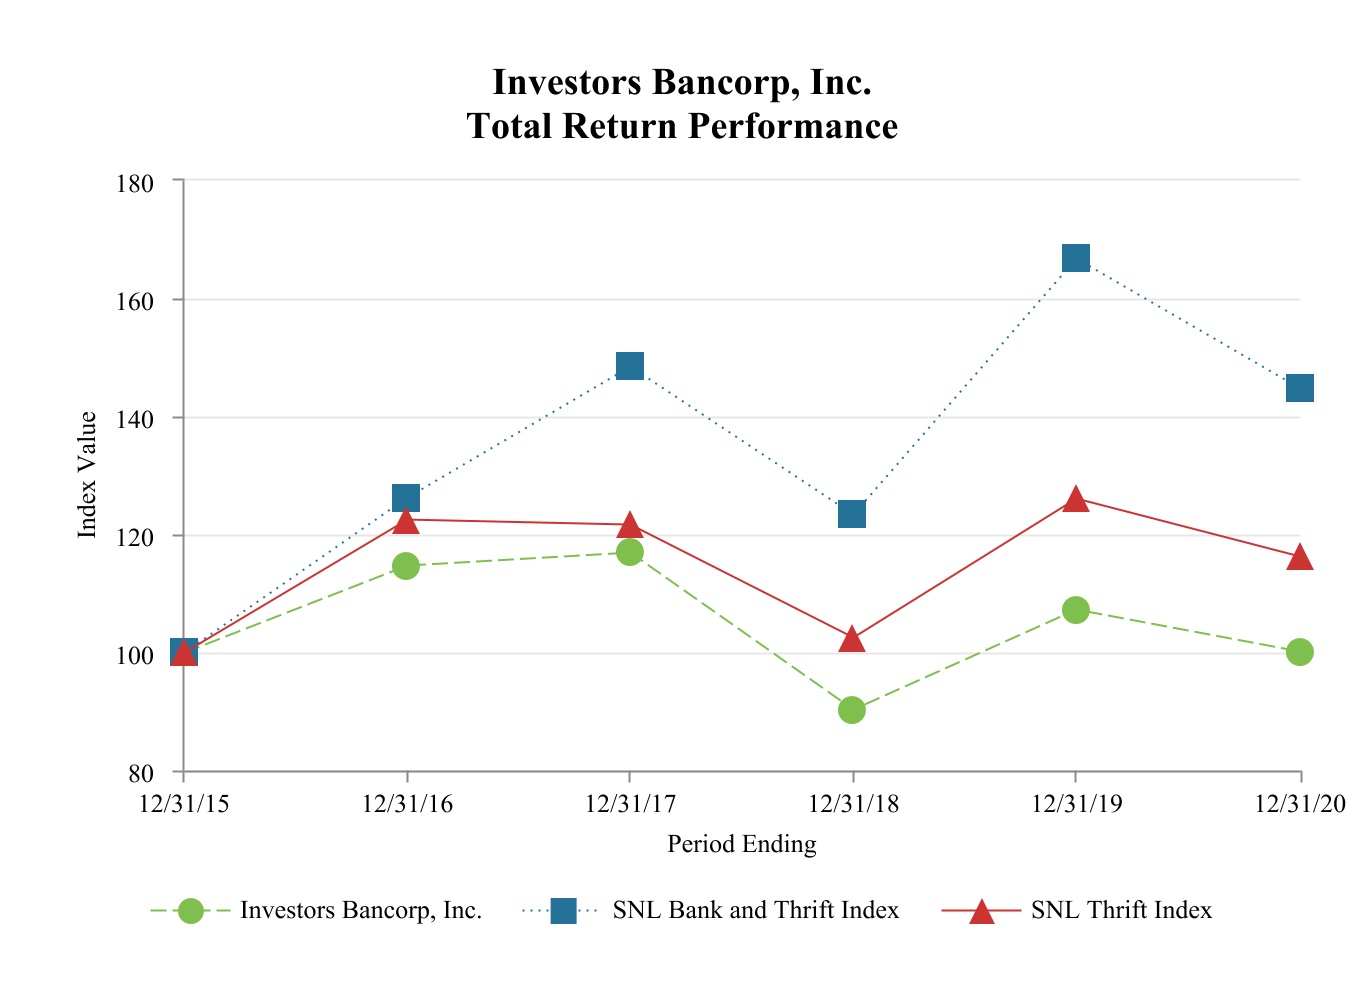
| Index | 12/31/2015 | 12/31/2016 | 12/31/2017 | 12/31/2018 | 12/31/2019 | 12/31/2020 | |||||||||||||||||||||||||||||
| Investors Bancorp, Inc. | 100.00 | 114.66 | 116.89 | 90.19 | 107.25 | 100.02 | |||||||||||||||||||||||||||||
| SNL U.S. Bank and Thrift | 100.00 | 126.25 | 148.45 | 123.32 | 166.67 | 144.61 | |||||||||||||||||||||||||||||
| SNL U.S. Thrift | 100.00 | 122.49 | 121.60 | 102.42 | 126.10 | 116.21 | |||||||||||||||||||||||||||||
Source: S&P Global Market Intelligence
49
Stock Repurchases
The following table reports information regarding repurchases of our common stock during the quarter ended December 31, 2020 and the stock repurchase plans approved by our Board.
| Period | Total Number of Shares Purchased (1)(2) | Average Price paid Per Share | As part of Publicly Announced Plans or Programs | Yet to be Purchased Under the Plans or Programs | ||||||||||||||||||||||
| October 1, 2020 through October 31, 2020 | 2,722 | $ | 7.67 | — | 14,607,794 | |||||||||||||||||||||
| November 1, 2020 through November 30, 2020 | 1,545 | $ | 8.95 | — | 14,607,794 | |||||||||||||||||||||
| December 1, 2020 through December 31, 2020 | 1,982,835 | $ | 10.32 | 1,982,592 | 12,625,202 | |||||||||||||||||||||
| Total | 1,987,102 | $ | 10.32 | 1,982,592 | ||||||||||||||||||||||
(1) On October 25, 2018, the Company announced its fourth share repurchase program, which authorized the purchase of 10% of its publicly-held outstanding shares of common stock, or 28,886,780 shares. The plan commenced upon the completion of the third repurchase plan on December 10, 2018. This program has no expiration date and has 12,625,202 shares yet to be repurchased as of December 31, 2020.
(2) 4,510 shares were withheld to cover income taxes related to restricted stock vesting under our 2015 Equity Incentive Plan. Shares withheld to pay income taxes are repurchased pursuant to the terms of the 2015 Equity Incentive Plan and not under our share repurchase program.
Equity Compensation Plan Information
The information set forth in Item 12 of Part III of this Annual Report under the heading “Equity Compensation Plan Information” is incorporated by reference herein.
50
| ITEM 6. | SELECTED FINANCIAL DATA | ||||
The following information is derived in part from the consolidated financial statements of Investors Bancorp, Inc. For additional information, reference is made to “Item 7. Management’s Discussion and Analysis of Financial Condition and Results of Operations” and the Consolidated Financial Statements of Investors Bancorp, Inc. and related notes included elsewhere in this Annual Report. Certain reclassifications have been made to conform with current year classifications.
| At December 31, | |||||||||||||||||||||||||||||
| 2020 | 2019 | 2018 | 2017 | 2016 | |||||||||||||||||||||||||
| (In thousands) | |||||||||||||||||||||||||||||
| Selected Financial Condition Data: | |||||||||||||||||||||||||||||
| Total assets | $ | 26,023,159 | $ | 26,698,766 | $ | 26,229,008 | $ | 25,129,244 | $ | 23,174,675 | |||||||||||||||||||
| Loans receivable, net | 20,580,451 | 21,476,056 | 21,378,136 | 19,852,101 | 18,569,855 | ||||||||||||||||||||||||
| Loans held-for-sale | 30,357 | 29,797 | 4,074 | 5,185 | 38,298 | ||||||||||||||||||||||||
| Equity securities | 36,000 | 6,039 | 5,793 | 5,701 | 6,660 | ||||||||||||||||||||||||
| Debt securities held-to-maturity, net | 1,247,853 | 1,148,815 | 1,555,137 | 1,796,621 | 1,755,556 | ||||||||||||||||||||||||
| Debt securities available-for-sale, at estimated fair value | 2,758,437 | 2,695,390 | 2,122,162 | 1,982,026 | 1,653,773 | ||||||||||||||||||||||||
| Bank owned life insurance | 223,714 | 218,517 | 211,914 | 155,635 | 161,940 | ||||||||||||||||||||||||
| Deposits | 19,525,419 | 17,860,338 | 17,580,269 | 17,357,697 | 15,280,833 | ||||||||||||||||||||||||
| Borrowed funds | 3,295,790 | 5,827,111 | 5,435,681 | 4,461,533 | 4,546,251 | ||||||||||||||||||||||||
| Goodwill | 94,535 | 82,546 | 82,546 | 77,571 | 77,571 | ||||||||||||||||||||||||
| Stockholders’ equity | 2,710,003 | 2,621,950 | 3,005,330 | 3,125,451 | 3,123,245 | ||||||||||||||||||||||||
| Year Ended December 31, | |||||||||||||||||||||||||||||
| 2020 | 2019 | 2018 | 2017 | 2016 | |||||||||||||||||||||||||
| (In thousands) | |||||||||||||||||||||||||||||
| Selected Operating Data: | |||||||||||||||||||||||||||||
| Interest and dividend income | $ | 980,894 | $ | 1,040,219 | $ | 968,416 | $ | 881,683 | $ | 793,521 | |||||||||||||||||||
| Interest expense | 255,208 | 385,146 | 288,399 | 201,907 | 153,336 | ||||||||||||||||||||||||
| Net interest income | 725,686 | 655,073 | 680,017 | 679,776 | 640,185 | ||||||||||||||||||||||||
| Provision for credit losses | 70,158 | (1,000) | 12,000 | 16,250 | 19,750 | ||||||||||||||||||||||||
| Net interest income after provision for credit losses | 655,528 | 656,073 | 668,017 | 663,526 | 620,435 | ||||||||||||||||||||||||
| Non-interest income | 90,518 | 53,413 | 10,081 | 35,637 | 37,201 | ||||||||||||||||||||||||
| Non-interest expenses | 449,505 | 422,754 | 407,680 | 418,574 | 358,564 | ||||||||||||||||||||||||
| Income before income tax expense | 296,541 | 286,732 | 270,418 | 280,589 | 299,072 | ||||||||||||||||||||||||
| Income tax expense | 74,961 | 91,248 | 67,842 | 153,845 | 106,947 | ||||||||||||||||||||||||
| Net income | $ | 221,580 | $ | 195,484 | $ | 202,576 | $ | 126,744 | $ | 192,125 | |||||||||||||||||||
| Earnings per share — basic | $ | 0.94 | $ | 0.75 | $ | 0.72 | $ | 0.44 | $ | 0.65 | |||||||||||||||||||
| Earnings per share — diluted | $ | 0.94 | $ | 0.74 | $ | 0.72 | $ | 0.43 | $ | 0.64 | |||||||||||||||||||
51
| At or for the Year Ended December 31, | ||||||||||||||||||||||||||||||||
| 2020 | 2019 | 2018 | 2017 | 2016 | ||||||||||||||||||||||||||||
| Selected Financial Ratios and Other Data: | ||||||||||||||||||||||||||||||||
| Performance Ratios: | ||||||||||||||||||||||||||||||||
| Return on assets (ratio of net income to average total assets) | 0.82 | % | 0.73 | % | 0.80 | % | 0.52 | % | 0.88 | % | ||||||||||||||||||||||
| Return on equity (ratio of net income to average equity) | 8.35 | % | 6.64 | % | 6.57 | % | 4.00 | % | 6.06 | % | ||||||||||||||||||||||
Net interest rate spread (1) | 2.56 | % | 2.19 | % | 2.46 | % | 2.67 | % | 2.83 | % | ||||||||||||||||||||||
Net interest margin (2) | 2.80 | % | 2.54 | % | 2.76 | % | 2.89 | % | 3.04 | % | ||||||||||||||||||||||
Efficiency ratio (3) | 55.07 | % | 59.67 | % | 59.08 | % | 58.51 | % | 52.93 | % | ||||||||||||||||||||||
| Non-interest expenses to average total assets | 1.66 | % | 1.58 | % | 1.61 | % | 1.73 | % | 1.64 | % | ||||||||||||||||||||||
| Average interest-earning assets to average interest-bearing liabilities | 1.25x | 1.23x | 1.25x | 1.26x | 1.29x | |||||||||||||||||||||||||||
Dividend payout ratio (4) | 51.06 | % | 58.67 | % | 52.78 | % | 75.00 | % | 40.00 | % | ||||||||||||||||||||||
| Cash dividends paid | $ | 0.48 | $ | 0.44 | $ | 0.38 | $ | 0.33 | $ | 0.26 | ||||||||||||||||||||||
| Asset Quality Ratios: | ||||||||||||||||||||||||||||||||
| Non-performing assets to total assets | 0.47 | % | 0.46 | % | 0.56 | % | 0.61 | % | 0.47 | % | ||||||||||||||||||||||
| Non-accrual loans to total loans | 0.51 | % | 0.44 | % | 0.58 | % | 0.68 | % | 0.50 | % | ||||||||||||||||||||||
Allowance for loan losses to non-performing loans (5) | 243.21 | % | 210.70 | % | 170.22 | % | 157.46 | % | 220.18 | % | ||||||||||||||||||||||
| Allowance for loan losses to total loans | 1.36 | % | 1.05 | % | 1.09 | % | 1.15 | % | 1.21 | % | ||||||||||||||||||||||
| Capital Ratios: | ||||||||||||||||||||||||||||||||
Tier 1 leverage ratio (6) | 9.08 | % | 8.22 | % | 10.28 | % | 11.00 | % | 12.03 | % | ||||||||||||||||||||||
Common equity tier 1 risk-based (6) | 11.72 | % | 11.03 | % | 13.41 | % | 13.94 | % | 14.75 | % | ||||||||||||||||||||||
Tier 1 risk-based capital (6) | 11.72 | % | 11.03 | % | 13.41 | % | 13.94 | % | 14.75 | % | ||||||||||||||||||||||
Total-risk-based capital (6) | 12.97 | % | 12.18 | % | 14.60 | % | 15.13 | % | 15.99 | % | ||||||||||||||||||||||
| Equity to total assets | 10.41 | % | 9.82 | % | 11.46 | % | 12.44 | % | 13.48 | % | ||||||||||||||||||||||
Tangible equity to tangible assets (7) | 10.03 | % | 9.49 | % | 11.12 | % | 12.10 | % | 13.10 | % | ||||||||||||||||||||||
| Average equity to average assets | 9.82 | % | 11.00 | % | 12.15 | % | 13.06 | % | 14.52 | % | ||||||||||||||||||||||
| Other Data: | ||||||||||||||||||||||||||||||||
Book value per common share (7) | $ | 11.43 | $ | 11.11 | $ | 10.95 | $ | 10.64 | $ | 10.53 | ||||||||||||||||||||||
Tangible book value per common share (7) | $ | 10.97 | $ | 10.69 | $ | 10.59 | $ | 10.31 | $ | 10.18 | ||||||||||||||||||||||
| Number of full service offices | 156 | 147 | 151 | 156 | 151 | |||||||||||||||||||||||||||
| Full time equivalent employees | 1,806 | 1,761 | 1,928 | 1,931 | 1,829 | |||||||||||||||||||||||||||
(1)The net interest rate spread represents the difference between the weighted-average yield on interest-earning assets and the weighted- average cost of interest-bearing liabilities for the period.
(2)The net interest margin represents net interest income as a percent of average interest-earning assets for the period.
(3)The efficiency ratio represents non-interest expense divided by the sum of net interest income and non-interest income.
(4)The dividend payout ratio represents dividends paid per share divided by net income per share.
(5)Non-performing loans include non-accrual loans and performing troubled debt restructured loans.
(6)Ratios are for Investors Bank and do not include capital retained at the holding company level.
(7)Excludes goodwill and intangible assets for the calculation of tangible book value and tangible equity. The common share calculation excludes treasury shares and unallocated ESOP shares.
52
| ITEM 7. | MANAGEMENT’S DISCUSSION AND ANALYSIS OF FINANCIAL CONDITION AND RESULTS OF OPERATIONS | ||||
Since the Company’s initial public offering in 2005, we have transitioned from a wholesale thrift business to a retail commercial bank. This transition has been primarily accomplished by increasing the amount of our commercial loans and core deposits (savings, checking and money market accounts). Our transformation can be attributed to a number of factors, including organic growth, de novo branch openings, bank and branch acquisitions, as well as the expansion of our offered loan and deposit products. We believe the attractive markets we operate in, namely, New Jersey and the greater New York metropolitan area, will continue to provide us with growth opportunities. In addition, we have national exposure through our Investors eAccess online deposit platform and our equipment finance, healthcare and leveraged lending portfolios. Our primary focus is to build and develop profitable customer relationships across all lines of business, both consumer and commercial.
Our results of operations depend primarily on net interest income, which is directly impacted by the interest rate environment. Net interest income is the difference between the interest income we earn on our interest-earning assets, primarily loans and investment securities, and the interest we pay on our interest-bearing liabilities, primarily interest-bearing transaction accounts, time deposits, and borrowed funds. Net interest income is affected by the level and direction of interest rates, the shape of the yield curve, the timing of the placement and the repricing of interest-earning assets and interest-bearing liabilities on our balance sheet, and the rate of prepayments on our loans and mortgage-related assets.
We continue to manage our interest rate risk against a backdrop of low interest rates and uncertainty regarding when rates will rise. Should the yield curve steepen, we may experience an improvement in net interest income, particularly if short-term interest rates do not increase. If the yield curve stays flat, inverts or deposit competition increases, we may be subject to net interest margin compression.
Our results of operations are also significantly affected by current economic conditions. Beginning in March 2020, the impacts of the COVID-19 pandemic, including social distancing guidelines, closure of non-essential businesses and shelter-at-home mandates, caused a global economic downturn. The economic downturn included an increase in unemployment and a decline in gross domestic product. The impacts on our results of operations included an increase in our provision for credit losses, the deferral of loan payments, an increase in the percentage of adversely classified loans, lower fee income and an increase in expenses resulting from safety protocols adopted in branches and corporate offices. In addition, the Federal Reserve reduced the federal funds target rate by 150 basis points in March 2020 in reaction to the COVID-pandemic. As a result of the decrease in the federal funds target rate, we ultimately had lower interest expense and lower yields on new loan origination, as well as an increase in loan prepayments as loan pricing competition increased.
Total assets decreased $675.6 million, or 2.5%, to $26.02 billion at December 31, 2020 from $26.70 billion at December 31, 2019. Net loans decreased $895.6 million, or 4.2%, to $20.58 billion at December 31, 2020 from $21.48 billion at December 31, 2019. Securities increased $192.0 million, or 5.0%, to $4.04 billion at December 31, 2020 from $3.85 billion at December 31, 2019. During the year ended December 31, 2020, we originated or funded $1.06 billion in commercial and industrial loans (including $334.7 million of PPP loans), $1.03 billion in multi-family loans, $652.5 million in residential loans, $605.5 million in commercial real estate loans, $129.6 million in construction loans and $102.5 million in consumer and other loans. Our ongoing strategy is to continue to enhance our commercial banking capabilities and maintain a well-diversified loan portfolio. We have shifted focus to C&I originations while maintaining our commercial real estate and multi-family portfolio and continue to be diligent in our underwriting and credit risk monitoring of these portfolios. The overall level of non-performing loans remains low compared to our national and regional peers.
Capital management is a key component of our business strategy. We continue to manage our capital through a combination of organic growth, stock repurchases, cash dividends and acquisitions. Effective capital management and prudent growth allows us to effectively leverage our capital, while being mindful of tangible book value for stockholders. Our capital to total assets ratio has increased to 10.41% at December 31, 2020 from 9.82% at December 31, 2019. Since March 2015, we have repurchased 129.5 million shares at an average cost of $12.07 per share totaling $1.56 billion. Stockholders’ equity was impacted for the year ended December 31, 2020 by cash dividends of $0.48 per share totaling $119.7 million and the repurchase of 2.4 million shares of common stock for $23.9 million.
In addition to our branch network, we offer online banking capabilities for consumers as well as small businesses, including providing robust online treasury capabilities to our customers. We complement our branch network with Investors eAccess, a secure online channel to attract deposits nationwide. Mobile and online banking services allow us to serve our customers’ needs and adapt to a changing environment. In addition to our deposit-related digital capabilities, we continue to enhance our digital capabilities related to originating and servicing loans. We have partnered with ODX, a leading digital small business originations platform, to streamline our small business lending process. We continue to enhance our digital
53
capabilities as a way to enhance the customer experience and deliver our services in a safe and secure manner. We will continue to execute our business strategies with a focus on prudent and opportunistic growth while striving to produce financial results that will create value for our stockholders. We intend to continue to grow our business by successfully attracting deposits, identifying favorable loan and investment opportunities, acquiring other banks and non-bank entities, enhancing our market presence and product offerings as well as continuing to invest in our people.
Critical Accounting Policies
We consider accounting policies that require management to exercise significant judgment or discretion or to make significant assumptions that have, or could have, a material impact on the carrying value of certain assets or on income to be critical accounting policies. As of December 31, 2020, we consider the following to be our critical accounting policies.
Allowance for Credit Losses. The allowance for credit losses represents the estimated amount considered necessary to cover lifetime expected credit losses inherent in financial assets at the balance sheet date. The measurement of expected credit losses is applicable to financial assets measured at amortized cost, including loan receivables and held-to-maturity debt securities. It also applies to off-balance sheet credit exposures such as loan commitments and unused lines of credit. The allowance is established through the provision for credit losses that is charged against income. The methodology for determining the allowance for credit losses is considered a critical accounting policy by management because of the high degree of judgment involved, the subjectivity of the assumptions used, and the potential for changes in the forecasted economic environment that could result in changes to the amount of the recorded allowance for credit losses. The allowance for loan and security losses is reported separately as contra-assets to loans and securities on the consolidated balance sheet. The expected credit loss for unfunded lending commitments and unfunded loan commitments is reported on the consolidated balance sheet in other liabilities. The provision for credit losses related to loans, unfunded commitments and debt securities is reported on the consolidated statement of income.
Allowance for Credit Losses on Loans Receivable
Collectively evaluated. The allowance for credit losses on loans is deducted from the amortized cost basis of the loan to present the net amount expected to be collected. Expected losses are evaluated and calculated on a collective basis for those loans which share similar risk characteristics. At each reporting period, the Company evaluates whether the loans in a pool continue to exhibit similar risk characteristics as the other loans in the pool. If the risk characteristics of a loan change, such that they are no longer similar to other loans in the pool, the Company will evaluate the loan with a different pool of loans that share similar risk characteristics. If the loan does not share risk characteristics with other loans, the Company will evaluate the allowance on an individual basis. The Company evaluates the segmentation at least annually to determine whether loans continue to share similar risk characteristics. Loans are charged off against the allowance when the Company believes the loan balances become uncollectible. Expected recoveries do not exceed the aggregate of amounts previously charged off or expected to be charged off.
The Company has chosen to segment its portfolio consistent with the manner in which it manages the risk of the type of credit. The Company’s segments for loans include multi-family, commercial real estate, commercial and industrial, construction, residential and consumer.
The Company calculates estimated credit loss on its loan portfolio primarily using quantitative methodologies that consider a variety of factors such as historical loss experience, loan characteristics, the current credit quality of the portfolio as well as an economic outlook over the life of the loan. The expected credit losses are the product of multiplying the Company’s estimates of probability of default (PD), loss given default (LGD) and individual loan level exposure at default on an undiscounted basis. For a small portion of the loan portfolio, i.e. unsecured consumer loans, small business loans and loans to individuals, the Company utilizes a loss rate method to calculate the expected credit loss of that asset segment.
Included in the Company’s framework for estimating credit losses, the Company incorporates forward-looking information through the use of macroeconomic scenarios applied over a two-year reasonable and supportable forecast period, after which, the Company reverts to average historical losses on a straight line basis over a two-year period. These macroeconomic scenarios include variables that have historically been key drivers of increases and decreases in credit losses and include, but are not limited to, unemployment rates, real estate prices, gross domestic product levels, corporate bond spreads and long-term interest rate forecasts. The Company evaluates the use of multiple economic scenarios and the weighting of those scenarios on a quarterly basis. The scenarios that are chosen and the amount of weighting given to each scenario consider a variety of factors including third party economists and firms, industry trends and other available published economic information.
Expected credit losses are estimated over the contractual term of each loan taking into consideration expected prepayments which are developed using industry standard estimation techniques. The contractual term excludes expected
54
extensions, renewals, and modifications unless either of the following applies: management has a reasonable expectation at the reporting date that a troubled debt restructuring will be executed with an individual borrower or the extension or renewal options are included in the original or modified contract at the reporting date and are not unconditionally cancelable by the Company.
Also included in the allowance for loans are qualitative reserves to cover losses that are expected but, in the Company’s assessment, may not be adequately represented in the quantitative method or the economic assumptions described above. For example, factors that the Company considers include changes in lending policies and procedures, business conditions, the nature and size of the portfolio, portfolio concentrations, the volume and severity of past due loans and non-accrual loans, the effect of external factors such as competition, and the legal and regulatory requirements, among others.
Individually evaluated. On a case-by-case basis, the Company may conclude a loan should be evaluated on an individual basis based on its disparate risk characteristics. The Company individually evaluates loans that meet the following criteria for expected credit loss, as the Company has determined that these loans generally do not share similar risk characteristics with other loans in the portfolio:
•Commercial loans with an outstanding balance greater than $1.0 million and on non-accrual status;
•Troubled debt restructured loans; and
•Other commercial loans with greater than $1.0 million in outstanding principal, if management has specific information that it is probable they will not collect all principal amounts due under the contractual terms of the loan agreement.
When the Company determines that the loan no longer shares similar risk characteristics of other loans in the portfolio, the allowance will be determined on an individual basis using the present value of expected cash flows or, for collateral-dependent loans, the fair value of the collateral as of the reporting date, less estimated selling costs, as applicable, to ensure that the credit loss is not delayed until actual loss. If the fair value of the collateral is less than the amortized cost basis of the loan, the Company will charge off the difference between the fair value of the collateral, less costs to sell at the reporting date and the amortized cost basis of the loan.
In determining the fair value for collateral-dependent loans, the Company reviews whether there has been an adverse change in the collateral value supporting the loan. As a substantial amount of the Company’s loan portfolio is collateralized by real estate, appraisals of the underlying value of property are used. The Company utilizes information from its commercial lending officers and its credit department and special assets department’s knowledge of changes in real estate conditions to identify if possible deterioration has occurred. Based on the severity of the changes in market conditions, management determines if an updated appraisal is warranted or if downward adjustments to the previous appraisal are warranted.
For residential mortgage loans, the Company’s policy is to obtain an appraisal upon the origination of the loan and an updated appraisal in the event a loan becomes 90 days delinquent. Thereafter, the appraisal is updated every two years if the loan remains in non-performing status and the foreclosure process has not been completed. Management adjusts the appraised value of residential loans to reflect estimated selling costs and declines in the real estate market.
Management believes the potential risk for outdated appraisals has been mitigated due to the fact that the loans are individually assessed to determine that the loan’s carrying value is not in excess of the fair value of the collateral. Loans are generally charged off after an analysis is completed which indicates that collectability of the full principal balance is in doubt.
Consistent with the CARES Act, modifications that met the criteria discussed in Note 1, Summary of Significant Accounting Policies, of Notes to Consolidated Financial Statements in “Item 15 - Exhibits and Financial Statement Schedules” are not included in individually evaluated loans discussed above.
Acquired assets. Subsequent to the adoption of CECL, acquired assets are included in the Company's calculation of the allowance for credit losses. How the allowance on an acquired asset is recorded depends on whether it has been classified as a Purchased Financial Asset with Credit Deterioration (“PCD”). PCD assets are assets acquired at a discount that is due, in part, to credit quality. PCD assets are accounted for in accordance with ASC Subtopic 326-20 and are initially recorded at fair value as determined by the sum of the present value of expected future cash flows and an allowance for credit losses at acquisition. The allowance for PCD assets is recorded through a gross-up effect, while the allowance for acquired non-PCD assets such as loans is recorded through provision expense, consistent with originated loans. Thus, the determination of which assets are PCD and non-PCD can have a significant effect on the accounting for these assets.
55
Subsequent to acquisition, the allowance for PCD loans will generally follow the same estimation, provision and charge-off process as non-PCD acquired and originated loans. Additionally, TDR identification for acquired loans (PCD and non-PCD) will be consistent with the TDR identification for originated loans.
Allowance for Credit Losses on Debt Securities
Management measures expected credit losses on held-to-maturity debt securities on a collective basis by major security type. Management classifies the held-to-maturity portfolio into the following major security types: mortgage-backed residential securities, municipal bonds, trust preferred securities (“TruPS”) and other. Nearly all of the mortgage-backed securities in the Company's portfolio are issued by U.S. government agencies and are either explicitly or implicitly guaranteed by the U.S government, are highly rated by major rating agencies and have a long history of no credit losses and therefore the expectation of non-payment is zero. Other securities consist primarily of investments in pooled trust preferred securities.
At each reporting period, the Company evaluates whether the securities in a segment continue to exhibit similar risk characteristics as the other securities in the segment. If the risk characteristics of a security change, such that they are no longer similar to other securities in the segment, the Company will evaluate the security with a different segment that shares more similar risk characteristics.
In estimating the net amount expected to be collected for mortgage-backed residential securities and municipal bonds, a range of historical losses method is utilized. In estimating the net amount expected to be collected for TruPS, the Company employs a single scenario forecast methodology. The scenario is informed by historical industry default data as well as current and near term operating conditions for the banks and other financial institutions that are the underlying issuers. In addition, expected prepayments are included in the analysis of the individually assessed TruPS applied at the collateral level.
Allowance for Credit Losses on Off-Balance Sheet Credit Exposures
The Company is required to include the unfunded commitment that is expected to be funded in the future within the allowance calculation. The Company participates in lending that results in an off-balance sheet unfunded commitment balance. The Company currently underwrites funding commitments with conditionally cancelable language. To determine the expected funding balance remaining, the Company uses a historical utilization rate for each of the segments to calculate the expected commitment balance. The reserve percentage for each respective loan portfolio is applied to the remaining unused portion of the expected commitment balance and the expected funded commitment in determining the allowance for credit loss on off-balance sheet credit exposures.
Derivative Financial Instruments. As required by ASC 815, the Company records all derivatives on the balance sheet at fair value. The accounting for changes in the fair value of derivatives depends on the intended use of the derivative, whether the Company has elected to designate a derivative in a hedging relationship and apply hedge accounting and whether the hedging relationship has satisfied the criteria necessary to apply hedge accounting. Derivatives designated and qualifying as a hedge of the exposure to changes in the fair value of an asset, liability, or firm commitment attributable to a particular risk, such as interest rate risk, are considered fair value hedges. Derivatives designated and qualifying as a hedge of the exposure to variability in expected future cash flows, or other types of forecasted transactions, are considered cash flow hedges. Hedge accounting generally provides for the matching of the timing of gain or loss recognition on the hedging instrument with the recognition of the changes in the fair value of the hedged asset or liability that are attributable to the hedged risk in a fair value hedge or the earnings effect of the hedged forecasted transactions in a cash flow hedge. The Company may enter into derivative contracts that are intended to economically hedge certain of its risks, even though hedge accounting does not apply or the Company elects not to apply hedge accounting.
Comparison of Financial Condition at December 31, 2020 and December 31, 2019
Total Assets. Total assets decreased by $675.6 million, or 2.5%, to $26.02 billion at December 31, 2020 from $26.70 billion at December 31, 2019. Net loans decreased by $895.6 million, or 4.2%, to $20.58 billion at December 31, 2020. Securities increased by $192.0 million, or 5.0%, to $4.04 billion at December 31, 2020 from $3.85 billion at December 31, 2019.
56
Net Loans. Net loans decreased by $895.6 million, or 4.2%, to $20.58 billion at December 31, 2020 from $21.48 billion at December 31, 2019. The detail of the loan portfolio is below:
| December 31, 2020 | December 31, 2019 | ||||||||||
| (Dollars in thousands) | |||||||||||
| Commercial Loans: | |||||||||||
| Multi-family loans | $ | 7,122,840 | 7,813,236 | ||||||||
| Commercial real estate loans | 4,947,212 | 4,831,347 | |||||||||
| Commercial and industrial loans | 3,575,641 | 2,951,306 | |||||||||
| Construction loans | 404,367 | 262,866 | |||||||||
| Total commercial loans | 16,050,060 | 15,858,755 | |||||||||
| Residential mortgage loans | 4,119,894 | 5,144,718 | |||||||||
| Consumer and other | 702,801 | 699,796 | |||||||||
| Total Loans | 20,872,755 | 21,703,269 | |||||||||
| Deferred fees, premiums and other, net | (9,318) | 907 | |||||||||
| Allowance for loan losses | (282,986) | (228,120) | |||||||||
| Net loans | $ | 20,580,451 | $ | 21,476,056 | |||||||
During the year ended December 31, 2020, we originated or funded $1.06 billion in commercial and industrial loans (including $334.7 million of PPP loans), $1.03 billion in multi-family loans, $652.5 million in residential loans, $605.5 million in commercial real estate loans, $129.6 million in construction loans and $102.5 million in consumer and other loans. Our originations reflect our continued focus on diversifying our loan portfolio. In addition, we acquired $453.3 million of loans from Gold Coast on April 3, 2020. A significant portion of our commercial loan portfolio, including commercial and industrial loans, are secured by commercial real estate and are primarily on properties and businesses located in New Jersey and New York. The Company sold approximately $328 million of PPP loans during the year ended December 31, 2020. In addition to the loans originated for our portfolio, we originated residential mortgage loans for sale to third parties totaling $564.5 million for the year ended December 31, 2020.
The following table sets forth non-accrual loans (excluding loans held-for-sale) on the dates indicated as well as certain asset quality ratios:
| December 31, 2020 | September 30, 2020 | June 30, 2020 | March 31, 2020 | December 31, 2019 | ||||||||||||||||||||||||||||||||||||||||
| # of Loans | Amount | # of Loans | Amount | # of Loans | Amount | # of Loans | Amount | # of Loans | Amount | |||||||||||||||||||||||||||||||||||
| (Dollars in millions) | ||||||||||||||||||||||||||||||||||||||||||||
| Multi-family | 15 | $ | 35.6 | 13 | $ | 51.1 | 14 | $ | 48.3 | 9 | $ | 23.4 | 8 | $ | 23.3 | |||||||||||||||||||||||||||||
| Commercial real estate | 29 | 15.9 | 28 | 17.8 | 22 | 12.3 | 21 | 11.4 | 22 | 12.0 | ||||||||||||||||||||||||||||||||||
| Commercial and industrial | 21 | 9.2 | 19 | 10.9 | 29 | 15.6 | 22 | 17.0 | 18 | 12.5 | ||||||||||||||||||||||||||||||||||
| Construction | — | — | — | — | — | — | — | — | — | — | ||||||||||||||||||||||||||||||||||
| Total commercial loans | 65 | 60.7 | 60 | 79.8 | 65 | 76.2 | 52 | 51.8 | 48 | 47.8 | ||||||||||||||||||||||||||||||||||
| Residential and consumer | 246 | 46.4 | 250 | 52.2 | 255 | 50.6 | 258 | 46.6 | 260 | 47.5 | ||||||||||||||||||||||||||||||||||
| Total non-accrual loans | 311 | $ | 107.1 | 310 | $ | 132.0 | 320 | $ | 126.8 | 310 | $ | 98.4 | 308 | $ | 95.3 | |||||||||||||||||||||||||||||
| Accruing troubled debt restructured loans | 47 | $ | 9.2 | 51 | $ | 9.8 | 52 | $ | 12.2 | 55 | $ | 12.8 | 57 | $ | 13.1 | |||||||||||||||||||||||||||||
| Non-accrual loans to total loans | 0.51 | % | 0.63 | % | 0.59 | % | 0.46 | % | 0.44 | % | ||||||||||||||||||||||||||||||||||
| Allowance for loan losses as a percent of non-accrual loans | 264.17 | % | 217.75 | % | 215.48 | % | 247.22 | % | 239.66 | % | ||||||||||||||||||||||||||||||||||
| Allowance for loan losses as a percent of total loans | 1.36 | % | 1.37 | % | 1.28 | % | 1.14 | % | 1.05 | % | ||||||||||||||||||||||||||||||||||
57
Total non-accrual loans increased to $107.1 million at December 31, 2020 compared to $95.3 million at December 31, 2019. At December 31, 2020, there were $4.8 million of commercial and industrial loans, $3.7 million of commercial real estate loans and $1.5 million of multi-family loans that were classified as non-accrual which were performing in accordance with their contractual terms. During the year ended December 31, 2020, we sold an $18.1 non-performing multi-family loan. During the year ended December 31, 2019, we sold $173,000 of non-performing commercial real estate loans. Criticized and classified loans as a percent of total loans increased to 7.99% at December 31, 2020 from 5.36% at December 31, 2019. At December 31, 2020, our allowance for loan losses as a percent of total loans was 1.36%. At December 31, 2020, there were $34.5 million of loans deemed as TDRs, of which $25.3 million were residential and consumer loans, $5.7 million were commercial real estate loans and $3.5 million were commercial and industrial loans. TDRs of $9.2 million were classified as accruing and $25.3 million were classified as non-accrual at December 31, 2020. We continue to proactively and diligently work to resolve our troubled loans.
In addition to non-accrual loans, we continue to monitor our portfolio for potential problem loans. Potential problem loans are defined as loans about which we have concerns as to the ability of the borrower to comply with the current loan repayment terms and which may cause the loan to be placed on non-accrual status. As of December 31, 2020, the Company has deemed potential problem loans totaling $27.4 million, which is comprised of 15 commercial real estate loans totaling $13.3 million, 6 multi-family loans totaling $8.2 million and 16 commercial and industrial loans totaling $5.9 million. In addition, we continue to support our customers by deferring payments for borrowers experiencing hardship because of the COVID-19 pandemic. As of February 14, 2021, $756 million, or 3.6%, of loans were deferring principal and/or interest payments. Consistent with the CARES Act and the interagency guidelines, such modifications that met the criteria discussed in Note 1 are not included in our TDRs. See Note 1, Summary of Significant Accounting Principles - Section 4013 of the CARES Act, of Notes to Consolidated Financial Statements in “Item 15 - Exhibits and Financial Statement Schedules.” Management is actively monitoring all of these loans.
The allowance for loan losses increased by $54.9 million to $283.0 million at December 31, 2020 from $228.1 million at December 31, 2019. The increase reflects an increase of $64.9 million from the provision for loan losses and an increase of $4.2 million from the initial allowance on PCD loans upon the Gold Coast acquisition, partially offset by a decrease of $10.7 million resulting from net charge-offs and a decrease of $3.6 million upon CECL adoption. Our allowance for loan losses at December 31, 2020 continued to be affected by the impact of COVID-19 on current and forecasted economic conditions. Future increases in the allowance for loan losses may be necessary based on the composition of and change in the loan portfolio, the level of loan delinquency and the current and forecasted economic condition over the life of our loans. At December 31, 2020, our allowance for loan losses as a percent of total loans was 1.36%.
Securities. Securities are held primarily for liquidity, interest rate risk management and yield enhancement. Our Investment Policy requires that investment transactions conform to Federal and State investment regulations. Our investments purchased may include, but are not limited to, U.S. Treasury obligations, securities issued by various Federal Agencies, State and Municipal subdivisions, mortgage-backed securities, certain certificates of deposit of insured financial institutions, overnight and short-term loans to other banks, corporate debt instruments, and mutual funds. In addition, the Company may invest in equity securities subject to certain limitations. Purchase decisions are based upon a thorough analysis of each security to determine if it conforms to our overall asset/liability management objectives. The analysis must consider its effect on our risk-based capital measurement, prospects for yield and/or appreciation and other risk factors. Debt securities are classified as held-to-maturity or available-for-sale when purchased.
At December 31, 2020, our securities portfolio represented 15.5% of our total assets. Securities, in the aggregate, increased by $192.0 million, or 5.0%, to $4.04 billion at December 31, 2020 from $3.85 billion at December 31, 2019. This increase was a result of purchases, partially offset by paydowns.
Stock in the Federal Home Loan Bank, Bank Owned Life Insurance and Other Assets. The amount of stock we own in the FHLB decreased by $107.4 million, or 40.2% to $159.8 million at December 31, 2020 from $267.2 million at December 31, 2019. The amount of stock we own in the FHLB is primarily related to the balance of our outstanding borrowings from the FHLB. Bank owned life insurance was $223.7 million at December 31, 2020 and $218.5 million at December 31, 2019. Other assets were $163.2 million at December 31, 2020 and $82.3 million at December 31, 2019.
Deposits. At December 31, 2020, deposits totaled $19.53 billion, representing 83.8% of our total liabilities. Our deposit strategy is focused on attracting core deposits (savings, checking and money market accounts), resulting in a deposit mix of lower cost core products. We remain committed to our plan of attracting more core deposits because core deposits represent a more stable source of low cost funds and may be less sensitive to changes in market interest rates.
Deposits increased by $1.67 billion, or 9.3%, to $19.53 billion at December 31, 2020 from $17.86 billion at December 31, 2019. Total checking accounts increased $1.72 billion to $9.71 billion at December 31, 2020 from $7.99 billion
58
at December 31, 2019. At December 31, 2020, we held $16.81 billion in core deposits, representing 86.1% of total deposits, of which $886.5 million are brokered money market deposits. At December 31, 2020, $2.72 billion, or 13.9%, of our total deposit balances were certificates of deposit, of which included $327.0 million of brokered certificates of deposit. At December 31, 2020, $5.50 billion, or 28.2%, of our total deposits consisted of public fund deposits from local government entities, predominately domiciled in the state of New Jersey. Core deposits are an attractive funding alternative because they are generally a more stable source of low cost funding and are less sensitive to changes in market interest rates.
Borrowed Funds. Borrowings are primarily with the FHLB which are collateralized by our residential and commercial mortgage portfolios. Borrowed funds decreased by $2.53 billion, or 43.4%, to $3.30 billion at December 31, 2020 from $5.83 billion at December 31, 2019 primarily driven by the increase in deposits. During the year ended December 31, 2020, we prepaid $1.40 billion of wholesale funding including $1.20 billion of FHLB advances. These prepayments, along with the termination of $400.0 million in interest rate swaps, resulted in the recognition of $24.1 million of early extinguishment costs during the year ended December 31, 2020 on the Consolidated Statement of Income.
Stockholders’ Equity. Stockholders’ equity increased by $88.1 million to $2.71 billion at December 31, 2020 from $2.62 billion at December 31, 2019. The increase was primarily attributed to net income of $221.6 million, common stock issued to finance the Gold Coast acquisition of $20.9 million and share-based plan activity of $19.1 million for the year ended December 31, 2020. These increases were partially offset by cash dividends of $0.48 per share totaling $119.7 million, the repurchase of 2.4 million shares of common stock for $23.9 million and other comprehensive loss of $21.4 million during the year ended December 31, 2020. In addition, stockholders’ equity decreased by $8.5 million on January 1, 2020 in connection with the adoption of CECL.
Analysis of Net Interest Income
Net interest income represents the difference between income we earn on our interest-earning assets and the expense we pay on interest-bearing liabilities. Net interest income depends on the volume of interest-earning assets and interest-bearing liabilities and the interest rates earned on such assets and paid on such liabilities.
Average Balances and Yields. The following tables set forth average balance sheets, average yields and costs, and certain other information for the periods indicated. No tax-equivalent yield adjustments were made, as the effect thereof was not material. All average balances are daily average balances. Non-accrual loans were included in the computation of average balances, however interest receivable on these loans have been fully reserved for and not included in interest income. The yields set forth below include the effect of deferred fees, discounts and premiums that are amortized or accreted to interest income or expense.
59
| For the Year Ended December 31, | ||||||||||||||||||||||||||||||||||||||||||||||||||||||||
| 2020 | 2019 | 2018 | ||||||||||||||||||||||||||||||||||||||||||||||||||||||
| Average Outstanding Balance | Interest Earned/ Paid | Average Yield/ Rate | Average Outstanding Balance | Interest Earned/ Paid | Average Yield/ Rate | Average Outstanding Balance | Interest Earned/ Paid | Average Yield/ Rate | ||||||||||||||||||||||||||||||||||||||||||||||||
| (Dollars in thousands) | ||||||||||||||||||||||||||||||||||||||||||||||||||||||||
| Interest-earning assets: | ||||||||||||||||||||||||||||||||||||||||||||||||||||||||
| Interest-bearing deposits | $ | 773,177 | $ | 1,460 | 0.19 | % | $ | 215,447 | $ | 2,805 | 1.30 | % | 212,980 | $ | 2,435 | 1.14 | % | |||||||||||||||||||||||||||||||||||||||
| Equity securities | 11,365 | 362 | 3.19 | 5,938 | 143 | 2.41 | 5,754 | 134 | 2.33 | |||||||||||||||||||||||||||||||||||||||||||||||
| Debt securities available-for-sale | 2,672,537 | 58,873 | 2.20 | 2,395,047 | 67,822 | 2.83 | 2,042,129 | 46,057 | 2.26 | |||||||||||||||||||||||||||||||||||||||||||||||
| Debt securities held-to-maturity, net | 1,184,984 | 34,049 | 2.87 | 1,317,322 | 40,017 | 3.04 | 1,668,106 | 48,989 | 2.94 | |||||||||||||||||||||||||||||||||||||||||||||||
| Net loans | 21,040,964 | 871,411 | 4.14 | 21,576,829 | 912,091 | 4.23 | 20,498,857 | 854,595 | 4.17 | |||||||||||||||||||||||||||||||||||||||||||||||
| Stock in FHLB | 229,120 | 14,739 | 6.43 | 274,661 | 17,341 | 6.31 | 247,513 | 16,206 | 6.55 | |||||||||||||||||||||||||||||||||||||||||||||||
| Total interest-earning assets | 25,912,147 | 980,894 | 3.79 | 25,785,244 | 1,040,219 | 4.03 | 24,675,339 | 968,416 | 3.92 | |||||||||||||||||||||||||||||||||||||||||||||||
| Non-interest-earning assets | 1,096,400 | 975,585 | 707,370 | |||||||||||||||||||||||||||||||||||||||||||||||||||||
| Total assets | $ | 27,008,547 | $ | 26,760,829 | $ | 25,382,709 | ||||||||||||||||||||||||||||||||||||||||||||||||||
| Interest-bearing liabilities: | ||||||||||||||||||||||||||||||||||||||||||||||||||||||||
| Savings deposits | $ | 2,039,686 | $ | 12,056 | 0.59 | % | $ | 1,985,142 | $ | 17,148 | 0.86 | % | $ | 2,170,510 | $ | 13,240 | 0.61 | % | ||||||||||||||||||||||||||||||||||||||
| Interest-bearing checking | 5,869,801 | 42,014 | 0.72 | 5,020,991 | 84,698 | 1.69 | 4,651,313 | 62,447 | 1.34 | |||||||||||||||||||||||||||||||||||||||||||||||
| Money market accounts | 4,367,498 | 42,568 | 0.97 | 3,703,413 | 60,896 | 1.64 | 3,837,174 | 46,394 | 1.21 | |||||||||||||||||||||||||||||||||||||||||||||||
| Certificates of deposit | 3,819,029 | 58,951 | 1.54 | 4,609,274 | 99,115 | 2.15 | 4,149,438 | 66,564 | 1.60 | |||||||||||||||||||||||||||||||||||||||||||||||
| Total interest-bearing deposits | 16,096,014 | 155,589 | 0.97 | 15,318,820 | 261,857 | 1.71 | 14,808,435 | 188,645 | 1.27 | |||||||||||||||||||||||||||||||||||||||||||||||
| Borrowed funds | 4,665,094 | 99,619 | 2.14 | 5,611,206 | 123,289 | 2.20 | 4,898,867 | 99,754 | 2.04 | |||||||||||||||||||||||||||||||||||||||||||||||
| Total interest-bearing liabilities | 20,761,108 | 255,208 | 1.23 | 20,930,026 | 385,146 | 1.84 | 19,707,302 | 288,399 | 1.46 | |||||||||||||||||||||||||||||||||||||||||||||||
| Non-interest-bearing liabilities | 3,594,290 | 2,887,601 | 2,590,675 | |||||||||||||||||||||||||||||||||||||||||||||||||||||
| Total liabilities | 24,355,398 | 23,817,627 | 22,297,977 | |||||||||||||||||||||||||||||||||||||||||||||||||||||
| Stockholders’ equity | 2,653,149 | 2,943,202 | 3,084,732 | |||||||||||||||||||||||||||||||||||||||||||||||||||||
| Total liabilities and stockholders’ equity | $ | 27,008,547 | $ | 26,760,829 | $ | 25,382,709 | ||||||||||||||||||||||||||||||||||||||||||||||||||
| Net interest income | $ | 725,686 | $ | 655,073 | $ | 680,017 | ||||||||||||||||||||||||||||||||||||||||||||||||||
Net interest rate spread (1) | 2.56 | % | 2.19 | % | 2.46 | % | ||||||||||||||||||||||||||||||||||||||||||||||||||
Net interest-earning assets (2) | $ | 5,151,039 | $ | 4,855,218 | $ | 4,968,037 | ||||||||||||||||||||||||||||||||||||||||||||||||||
Net interest margin (3) | 2.80 | % | 2.54 | % | 2.76 | % | ||||||||||||||||||||||||||||||||||||||||||||||||||
| Ratio of interest-earning assets to total interest-bearing liabilities | 1.25 | 1.23 | 1.25 | |||||||||||||||||||||||||||||||||||||||||||||||||||||
(1)Net interest rate spread represents the difference between the yield on average interest-earning assets and the cost of average interest-bearing liabilities.
(2)Net interest-earning assets represent total interest-earning assets less total interest-bearing liabilities.
(3)Net interest margin represents net interest income divided by average total interest-earning assets.
60
Rate/Volume Analysis
The following table presents the effects of changing rates and volumes on our net interest income for the periods indicated. The rate column shows the effects attributable to changes in rate (changes in rate multiplied by prior volume). The volume column shows the effects attributable to changes in volume (changes in volume multiplied by prior rate). The net column represents the sum of the prior columns. For purposes of this table, changes attributable to both rate and volume, which cannot be segregated, have been allocated proportionately, based on the changes due to rate and the changes due to volume.
| Years Ended December 31, 2020 vs. 2019 | Years Ended December 31, 2019 vs. 2018 | |||||||||||||||||||||||||||||||||||||
| Increase (Decrease) Due to | Net Increase (Decrease) | Increase (Decrease) Due to | Net Increase (Decrease) | |||||||||||||||||||||||||||||||||||
| Volume | Rate | Volume | Rate | |||||||||||||||||||||||||||||||||||
| (In thousands) | ||||||||||||||||||||||||||||||||||||||
| Interest-earning assets: | ||||||||||||||||||||||||||||||||||||||
| Interest-earning cash accounts | $ | 7,244 | (8,589) | (1,345) | $ | 28 | 342 | 370 | ||||||||||||||||||||||||||||||
| Equities | 131 | 88 | 219 | 4 | 5 | 9 | ||||||||||||||||||||||||||||||||
| Debt securities available-for-sale | 7,753 | (16,702) | (8,949) | 8,027 | 13,738 | 21,765 | ||||||||||||||||||||||||||||||||
| Debt securities held-to-maturity, net | 3,548 | (9,516) | (5,968) | (5,724) | (3,248) | (8,972) | ||||||||||||||||||||||||||||||||
| Net loans | (11,876) | (28,804) | (40,680) | 46,098 | 11,398 | 57,496 | ||||||||||||||||||||||||||||||||
| Federal Home Loan Bank stock | (2,877) | 275 | (2,602) | 1,790 | (655) | 1,135 | ||||||||||||||||||||||||||||||||
| Total interest-earning assets | 3,923 | (63,248) | (59,325) | 50,223 | 21,580 | 71,803 | ||||||||||||||||||||||||||||||||
| Interest-bearing liabilities: | ||||||||||||||||||||||||||||||||||||||
| Savings deposits | 465 | (5,557) | (5,092) | (1,117) | 5,025 | 3,908 | ||||||||||||||||||||||||||||||||
| Interest-bearing checking | 14,326 | (57,010) | (42,684) | 4,893 | 17,358 | 22,251 | ||||||||||||||||||||||||||||||||
| Money market accounts | 10,903 | (29,231) | (18,328) | (1,600) | 16,102 | 14,502 | ||||||||||||||||||||||||||||||||
| Certificates of deposit | (16,939) | (23,225) | (40,164) | 7,322 | 25,229 | 32,551 | ||||||||||||||||||||||||||||||||
| Total deposits | 8,755 | (115,023) | (106,268) | 9,498 | 63,714 | 73,212 | ||||||||||||||||||||||||||||||||
| Borrowed funds | (20,307) | (3,363) | (23,670) | 15,450 | 8,085 | 23,535 | ||||||||||||||||||||||||||||||||
| Total interest-bearing liabilities | (11,552) | (118,386) | (129,938) | 24,948 | 71,799 | 96,747 | ||||||||||||||||||||||||||||||||
| Increase (decrease) in net interest income | $ | 15,475 | 55,138 | 70,613 | $ | 25,275 | (50,219) | (24,944) | ||||||||||||||||||||||||||||||
Comparison of Operating Results for the Year Ended December 31, 2020 and 2019
Net Income. Net income for the year ended December 31, 2020 was $221.6 million compared to net income of $195.5 million for the year ended December 31, 2019.
Net Interest Income. Net interest income increased by $70.6 million to $725.7 million for the year ended December 31, 2020 from $655.1 million for the year ended December 31, 2019. The net interest margin increased 26 basis points to 2.80% for the year ended December 31, 2020 from 2.54% for the year ended December 31, 2019.
Interest and Dividend Income. Total interest and dividend income decreased by $59.3 million, or 5.7%, to $980.9 million for the year ended December 31, 2020. Interest income on loans decreased by $40.7 million, or 4.5%, to $871.4 million for the year ended December 31, 2020, as a result of a $535.9 million, or 2.5%, decrease in the average balance of net loans to $21.04 billion for the year ended December 31, 2020, primarily attributed to paydowns and payoffs, partially offset by originations and $453.3 million of loans acquired from Gold Coast. In addition, the weighted average yield on net loans decreased 9 basis points to 4.14% primarily driven by lower average yields on originations and adjustable loans, partially offset by an increase in prepayment penalties. Prepayment penalties, which are included in interest income, totaled $32.4 million for the year ended December 31, 2020 compared to $16.8 million for the year ended December 31, 2019. Interest income on all other interest-earning assets, excluding loans, decreased by $18.6 million, or 14.6%, to $109.5 million for the year ended December 31, 2020 which is attributable to a decrease of 79 basis points to 2.25% in the weighted average yield on interest-earning assets, excluding loans. Partially offsetting this decrease, the average balance of all other interest earning assets, excluding loans, increased $662.8 million to $4.87 billion for the year ended December 31, 2020.
Interest Expense. Total interest expense decreased by $129.9 million, or 33.7%, to $255.2 million for the year ended December 31, 2020. Interest expense on interest-bearing deposits decreased $106.3 million, or 40.6%, to $155.6 million for the
61
year ended December 31, 2020. The weighted average cost of interest-bearing deposits decreased 74 basis points to 0.97% for the year ended December 31, 2020. Partially offsetting this decrease, the average balance of total interest-bearing deposits increased $777.2 million, or 5.1%, to $16.10 billion for the year ended December 31, 2020. Interest expense on borrowed funds decreased by $23.7 million, or 19.2%, to $99.6 million for the year ended December 31, 2020. The average balance of borrowed funds decreased $946.1 million, or 16.9%, to $4.67 billion for the year ended December 31, 2020. In addition, the weighted average cost of borrowings decreased 6 basis points to 2.14% for the year ended December 31, 2020.
Non-Interest Income. Total non-interest income increased by $37.1 million to $90.5 million for the year ended December 31, 2020. The increase was primarily due to a gain of $23.1 million on the sale-leaseback of 15 branch locations and one corporate location during 2020. In addition, gain on loans increased $10.9 million as a result of a higher volume of mortgage banking loan sales to third parties and we recognized a $5.7 million loss on the sale of securities during 2019.
Non-Interest Expense. Total non-interest expenses were $449.5 million for the year ended December 31, 2020, an increase of $26.8 million, or 6.3%, as compared to the year ended December 31, 2019. Excluding $24.1 million of costs from the early extinguishment of $1.40 billion of wholesale funding, which included $1.20 billion of FHLB advances along with the termination of $400.0 million of interest rate swaps during the year ended December 31, 2020, $11.7 million of costs associated with our branch rationalization announcement in December 2020, $3.6 million of Gold Coast acquisition-related expenses and a $1.0 million tax credit investment, non-interest expenses for the year ended December 31, 2020 were $409.1 million, a decrease of $13.6 million compared to the year ended December 31, 2019. This decrease was driven by a decrease of $8.6 million in other non-interest expense, a decrease of $4.5 million in advertising and promotional expense and a decrease of $3.5 million in compensation and fringe benefit expense.
Income Taxes. Income tax expense was $75.0 million and $91.2 million for the years ended December 31, 2020 and December 31, 2019, respectively. The effective tax rate was 25.3% for the year ended December 31, 2020 and 31.8% for the year ended December 31, 2019. The effective tax rate for the year ended December 31, 2019 was negatively impacted by the revaluation of our net deferred tax asset resulting from the State of New Jersey providing clarification in December 2019 in regard to previously enacted tax law changes.
Comparison of Operating Results for the Year Ended December 31, 2019 and 2018
Refer to “Item 7. - Management’s Discussion and Analysis of Financial Condition and Results of Operations” of our Annual Report on Form 10-K for the year ended December 31, 2019 for a discussion of 2019 results as compared to 2018 results.
Management of Market Risk
Qualitative Analysis. One significant form of market risk is interest rate risk. Interest rate risk results from timing differences in the cash flow or re-pricing of our assets, liabilities and off-balance sheet contracts (e.g., loan commitments); the effect of loan and securities prepayments, deposit activity; “basis risk” arising from potential differences in the behavior of lending and funding rates arising from the use of different indices; and “yield curve risk” arising from changes in the term structure of interest rates. Changes in market interest rates can affect net interest income by influencing the volume and pricing of new loan originations and securities purchases, the ability of borrowers to repay variable rate loans, the volume of loan and securities prepayments and the mix and flow of deposits.
The general objective of our interest rate risk management process is to align and manage forecasted interest rate risk with our business model and risk appetite. Our Asset Liability Committee, which consists of senior management and executives, evaluates the interest rate risk inherent in our balance sheet, and the operating environment and to assess capital and liquidity requirements and modify our lending, investing and deposit gathering strategies accordingly. On a quarterly basis, our Board reviews various Asset Liability Committee reports that estimate the sensitivity of the economic value of equity and net interest income under various interest rate scenarios.
Our tactics and strategies may include the use of various financial instruments, including derivatives, to manage our exposure to interest rate risk. Certain derivatives are designated as hedging instruments in a qualifying hedge accounting relationship (fair value or cash flow hedge). Hedged items can be either assets or liabilities. Given the historically low interest rate environment during 2020, the Company proactively positioned the balance sheet in an effort to better protect against rising rates.
As of December 31, 2020, the Company had cash flow hedges with aggregate notional amounts of $3.33 billion and had no interest rate swaps designated as fair value hedges. As of December 31, 2019, the Company had cash flow and fair value hedges with aggregate notional amounts of $2.20 billion and $475.0 million, respectively. The fair value hedges at December 31, 2019 were in asset swap transactions where fixed rate loan payments were exchanged for variable rate payments. During the
62
year ended December 31, 2020, the Company terminated those fair value hedges and also terminated $400.0 million in cash flow hedges.
We actively evaluate interest rate risk in connection with our lending, investing and deposit activities and our off-balance sheet positions. At December 31, 2020, 19.7% of our total loan portfolio was comprised of residential mortgages, of which approximately 28.1% was in variable rate products, while 71.9% was in fixed rate products. Our variable rate and short term fixed rate mortgage related assets have helped to reduce our exposure to interest rate fluctuations. Long term fixed-rate products may adversely impact our net interest income in a rising rate environment. The origination of commercial loans, particularly commercial and industrial loans, commercial real estate loans and multi-family loans, which have outpaced the growth in the residential portfolio in recent years, generally help reduce our interest rate risk due to their shorter term compared to fixed rate residential mortgage loans. In addition, we primarily invest in securities which display relatively conservative interest rate risk characteristics.
In July 2017, the Chief Executive of the United Kingdom Financial Conduct Authority, which regulates LIBOR, announced that it intends to stop persuading or compelling banks to submit rates for the calibration of LIBOR to the administrator of LIBOR after 2021. In November 2020, the LIBOR administrator announced plans to consult on easing publication of USD LIBOR on December 31, 2021 for only the one-week and two-month USD LIBOR tenors, and on June 30, 2023 for all other USD LIBOR tenors. The United States banking regulators concurrently issued a joint statement advising banks to stop new USD LIBOR issuances by the end of 2021. The Alternative Reference Rates Committee (“ARRC”) has proposed that the Secured Overnight Financing Rate (“SOFR”) is the recommended alternative rate to USD-LIBOR for use in derivatives and other financial contracts that are currently indexed to USD-LIBOR. The ARRC has proposed a paced market transition plan to SOFR from USD-LIBOR and organizations are currently working on industry wide and company specific transition plans as it relates to derivatives and cash markets exposed to USD-LIBOR. The Company has approximately $7.61 billion in financial instruments which are indexed to USD-LIBOR at December 31, 2020 for which it is monitoring the activity and evaluating the related risks.
We use an internally managed and implemented industry standard asset/liability model to complete our quarterly interest rate risk reports. The model projects net interest income based on various interest rate scenarios and horizons. We use a combination of analyses to monitor our exposure to changes in interest rates.
Our net interest income sensitivity analysis determines the relative balance between the repricing of assets, liabilities and off-balance sheet positions over various horizons. This asset and liability analysis includes expected cash flows from loans and securities, using forecasted prepayment rates, reinvestment rates, as well as contractual and forecasted liability cash flows. This analysis identifies mismatches in the timing of asset and liability cash flows but does not necessarily provide an accurate indicator of interest rate risk because the rate forecasts and assumptions used in the analysis may not reflect actual experience. The economic value of equity (“EVE”) analysis estimates the change in the net present value (“NPV”) of assets and liabilities and off-balance sheet contracts over a range of immediate rate shock interest rate scenarios. In calculating changes in EVE, for the various scenarios we forecast loan and securities prepayment rates and deposit decay rates.
Quantitative Analysis. The table below sets forth, as of December 31, 2020, the estimated changes in our EVE and our net interest income that would result from the designated changes in interest rates. Such changes to interest rates are calculated as an immediate and permanent change for the purposes of computing EVE and a gradual change over a one-year period for the purposes of computing net interest income. Computations of prospective effects of hypothetical interest rate changes are based on numerous assumptions including relative levels of market interest rates, loan prepayments and deposit decay, and should not be relied upon as indicative of actual results. The following table reflects management’s expectations of the changes in EVE and net interest income for an interest rate decrease of 100 basis points and increase of 200 basis points.
EVE (1) | Net Interest Income (2) | ||||||||||||||||||||||||||||||||||||||||
| Change in Interest Rates (basis points) | Estimated EVE | Estimated Increase (Decrease) | Estimated Net Interest Income | Estimated Increase (Decrease) | |||||||||||||||||||||||||||||||||||||
| Amount | Percent | Amount | Percent | ||||||||||||||||||||||||||||||||||||||
| (Dollars in thousands) | |||||||||||||||||||||||||||||||||||||||||
| + 200bp | $ | 3,521,263 | 70,065 | 2.0 | % | $ | 714,245 | (27,130) | (3.7) | % | |||||||||||||||||||||||||||||||
| 0bp | $ | 3,451,198 | — | — | $ | 741,375 | — | — | |||||||||||||||||||||||||||||||||
| -100bp | $ | 3,195,213 | (255,985) | (7.4) | % | $ | 745,681 | 4,306 | 0.6 | % | |||||||||||||||||||||||||||||||
(1)EVE is the discounted present value of expected cash flows from assets, liabilities and off-balance sheet contracts.
(2)Assumes a gradual change in interest rates over a one year period at all maturities.
63
The table above indicates that at December 31, 2020, in the event of a 200 basis point increase in interest rates, we would be expected to experience a 2.0% increase in EVE and a $27.1 million, or 3.7%, decrease in net interest income. In the event of a 100 basis point decrease in interest rates, we would be expected to experience a 7.4% decrease in EVE and a $4.3 million, or 0.6%, increase in net interest income. This data does not reflect any future actions we may take in response to changes in interest rates, such as changing the mix in or growth of our assets and liabilities, which could change the results of the EVE and net interest income calculations.
As mentioned above, we use an internally developed asset liability model to compute our quarterly interest rate risk reports. Certain shortcomings are inherent in any methodology used to calculate interest rate risk. Modeling EVE and net interest income sensitivity requires certain assumptions that may or may not reflect the manner in which actual yields and market values respond to changes in market interest rates. The EVE and net interest income results presented above assume no balance sheet growth and that generally the composition of our interest-rate sensitive assets and liabilities existing at the beginning of the analysis remains constant over the period being measured and, accordingly, the data does not reflect any actions we may take in response to changes in interest rates. The EVE and net interest income results presented in the table above provide an indication of our sensitivity to interest rate changes at a point in time.
Liquidity and Capital Resources
Liquidity is the ability to economically meet current and future financial obligations. The Company’s primary sources of funds are deposits, principal and interest payments on loans and securities, FHLB advances and other borrowings and, to a lesser extent, proceeds from the sale of loans and investment maturities. While scheduled amortization of loans is usually a predictable source of funds, deposit flows and mortgage and loan prepayments are greatly influenced by general interest rates, economic conditions and competition. The Company has other sources of liquidity, including unsecured overnight lines of credit, brokered deposits and other types of borrowings. The Company’s total borrowing capacity from the FHLB and other borrowing sources was approximately $21.72 billion, which includes outstanding borrowings at December 31, 2020. Excluding outstanding borrowings, available borrowing capacity and other available liquidity sources totaled approximately $11.24 billion at December 31, 2020. Our Asset Liability Committee is responsible for establishing and monitoring our liquidity targets and strategies to ensure that sufficient liquidity exists for meeting the needs of our customers as well as unanticipated contingencies. These liquidity risk management practices have allowed us to effectively manage the market stress related to the COVID-19 pandemic that began in the first quarter of 2020.
A primary source of funds is provided by cash flows on loans and securities. Principal repayments on loans for the years ended December 31, 2020, 2019 and 2018 were $4.67 billion, $3.66 billion and $3.47 billion, respectively. Principal repayments on securities for the years ended December 31, 2020, 2019 and 2018 were $1.30 billion, $744.0 million and $685.5 million, respectively. There were no sales of securities during year ended December 31, 2020. During the years ended December 31, 2019 and 2018, there were sales of securities of $399.4 million and $632.4 million, respectively. For the year ended December 31, 2020, the Company received proceeds from the call of a held-to-maturity security which resulted in a gain of $124,000 and received a principal payment of $26,000 on a held-to-maturity security which resulted in a gain recognized as non-interest income. There were no unusual payoffs or paydowns of TruPS for the year ended December 31, 2019. For the year ended December 31, 2018, the Company received proceeds of $7.3 million from the payoff and paydown of TruPS which resulted in $3.2 million of interest income from securities, as well as a gain of $1.2 million recognized as non-interest income.
In addition to cash provided by principal and interest payments on loans and securities, our other sources of funds include cash provided by operating activities, deposits and borrowings. Net cash provided by operating activities for the years ended December 31, 2020, 2019 and 2018 totaled $224.3 million, $160.7 million and $275.6 million, respectively. For the year ended December 31, 2020, excluding deposits assumed in the Gold Coast acquisition, deposits increased $1.18 billion. For the years ended December 31, 2019 and 2018, deposits increased $280.1 million and $222.6 million, respectively. Deposit flows are affected by the overall level of and direction of changes in market interest rates, the pricing of products offered by us and our local competitors, and other factors.
For the year ended December 31, 2020, excluding borrowed funds assumed in the Gold Coast acquisition, net borrowed funds decreased $2.55 billion primarily driven by the increase in deposits. The decrease includes the early extinguishment of $1.20 billion of FHLB advances during the year ended December 31, 2020. For the year ended December 31, 2019 and 2018, net borrowed funds increased $391.4 million and $974.1 million, respectively.
Our primary use of funds is for the origination and purchase of loans and the purchase of securities. During the years ended December 31, 2020, 2019 and 2018, we originated loans totaling $3.57 billion, $3.53 billion and $4.15 billion, respectively. During the year ended December 31, 2020, excluding loans purchased in the acquisition of Gold Coast, we purchased loans of $158.4 million. During the year ended December 31, 2019, we purchased loans of $427.1 million. During the year ended December 31, 2018, excluding loans and leases acquired in the acquisition of the equipment finance portfolio,
64
we purchased loans of $514.0 million. During the year ended December 31, 2020, excluding securities purchased in the acquisition of Gold Coast, we purchased securities of $1.41 billion. During the years ended December 31, 2019 and 2018, we purchased securities of $1.27 billion and $1.24 billion, respectively. In addition, we utilized $23.9 million, $475.9 million and $258.2 million during the years ended December 31, 2020, 2019 and 2018, respectively, to repurchase shares of our common stock. During December 2019, we entered into a purchase and sale agreement with Blue Harbour Group, L.P. (“Blue Harbour”), pursuant to which we purchased from Blue Harbour the 27,318,628 shares of our common stock beneficially owned by Blue Harbour, at a purchase price of $12.29 per share, representing aggregate consideration of approximately $335.7 million. During the year ended December 31, 2020, we issued $20.9 million of common stock to finance the Gold Coast acquisition.
At December 31, 2020, we had commitments to originate commercial loans of $374.5 million. Additionally, we had commitments to originate residential loans of approximately $77.6 million. While we have historically purchased residential loans from correspondent banks, we did not purchase such loans in 2020. We had no purchase commitments as of December 31, 2020 or 2019. Unused home equity lines of credit and undisbursed business and constructions loans totaled approximately $1.97 billion at December 31, 2020. Certificates of deposit due within one year of December 31, 2020 totaled $2.39 billion, or 12.2% of total deposits. If these deposits do not remain with us, we will be required to seek other sources of funds, including but not limited to other retail and commercial deposits and wholesale funding. Depending on market conditions, we may be required to pay higher rates on such deposits or other borrowings than we currently pay.
Liquidity management is both a short and long-term function of business management. Our most liquid assets are cash and cash equivalents. The levels of these assets depend upon our operating, financing, lending and investing activities during any given period. At December 31, 2020, cash and cash equivalents totaled $170.4 million. Securities, which provide an additional source of liquidity, totaled $4.04 billion at December 31, 2020, of which $1.90 billion are pledged to secure borrowings, municipal deposits and available borrowing capacity at the Federal Reserve Bank of New York. If we require funds beyond our ability to generate them internally, we have wholesale funding alternatives, which provide an additional source of funds. At December 31, 2020, our total borrowing capacity at the FHLB was $11.08 billion, of which we had outstanding borrowings of $6.59 billion, which included letters of credit totaling $3.92 billion. Our remaining borrowing capacity at the FHLB was $4.49 billion. We also had available unsecured overnight borrowing lines (Fed Funds) with other financial institutions totaling $590.0 million, of which $170.0 million was outstanding at December 31, 2020. In addition, our total borrowing capacity from other sources was $5.97 billion, of which $1.69 billion was outstanding at December 31, 2020.
Investors Bank is subject to various regulatory capital requirements, including a risk-based capital measure. The risk-based capital guidelines include both a definition of capital and a framework for calculating risk-weighted assets by assigning balance sheet assets and off-balance sheet items to broad risk categories. At December 31, 2020, Investors Bank exceeded all regulatory capital requirements. Investors Bank is considered “well capitalized” under regulatory guidelines. See “Item 1. Supervision and Regulation — Federal Banking Regulation — Capital Requirements.”
Credit ratings and outlooks are opinions expressed by rating agencies on our creditworthiness and that of our obligations or securities, including long-term debt, short-term borrowings, preferred stock and other securities. On May 4, 2020, S&P revised our rating outlook to negative due to economic downturn from COVID-19.
Contractual Obligations and Off-Balance Sheet Arrangements
Contractual Obligations and Commitments. In the ordinary course of business, we routinely enter into various financial obligations, including contractual obligations that may require future cash payments. As a financial provider, we routinely enter into commitments to extend credit, including loan commitments, standby and commercial letters of credit as well as unused lines of credit as discussed above in Liquidity and Capital Resources. While these contractual obligations represent our potential future cash requirements, a significant portion of our commitments to extend credit may expire without being drawn upon. Such commitments are subject to the same credit policies and approval processes that we use for loans that we originate. See Note 14, Commitments and Contingencies, of Notes to Consolidated Financial Statements in “Item 15 - Exhibits and Financial Statement Schedules” for further details.
The following table summarizes our significant fixed and determinable contractual obligations and other funding needs by payment date at December 31, 2020. The payment amounts represent those amounts due to the recipient and do not include any unamortized premiums or discounts or other similar carrying amount adjustments.
65
| Payments Due by Period | ||||||||||||||||||||||||||||||||
| Contractual Obligations | Less than One Year | One to Three Years | Three to Five Years | More than Five Years | Total | |||||||||||||||||||||||||||
| (In thousands) | ||||||||||||||||||||||||||||||||
| Other borrowed funds | $ | 1,513,000 | 847,216 | 472,358 | 14,702 | 2,847,276 | ||||||||||||||||||||||||||
| Repurchase agreements | — | 248,514 | 200,000 | — | 448,514 | |||||||||||||||||||||||||||
| Operating leases | 28,844 | 53,802 | 51,796 | 104,729 | 239,171 | |||||||||||||||||||||||||||
| Total | $ | 1,541,844 | 1,149,532 | 724,154 | 119,431 | 3,534,961 | ||||||||||||||||||||||||||
During the year ended December 31, 2019, the Company invested $10.0 million in a low income housing tax credit program that qualifies for community reinvestment tax credits. Commitments related to the tax credit investments are payable on demand and are recorded in other liabilities on our Consolidated Balance Sheets. Total commitments related to tax credit investments were $5.5 million and $9.2 million as of December 31, 2020 and 2019, respectively.
Derivative Instruments and Hedging Activities. The Company has entered into derivative financial instruments to manage exposures that arise from business activities that result in the receipt or payment of future known and uncertain cash amounts, the value of which are determined by interest rates. Derivative financial instruments present on the Company’s balance sheet as of December 31, 2020 are used to manage differences in the amount, timing, and duration of the Company’s known or expected cash receipts and its known or expected cash payments principally related to the Company’s borrowings. During the year ended December 31, 2020, such derivatives were used to hedge the variability in cash flows associated with borrowings. These derivatives had an aggregate notional amount of $3.33 billion as of December 31, 2020. The fair value of derivatives designated as hedging activities as of December 31, 2020 was an asset of $370,000, inclusive of accrued interest and variation margin posted in accordance with the Chicago Mercantile Exchange. Derivatives with an aggregate notional amount of $475.0 million that had been used to hedge changes in the fair value of certain pools of prepayable fixed- and adjustable-rate assets were terminated during the year ended December 31, 2020. Interest rate swaps with an aggregate notional amount of $400.0 million that had been designated as cash flow hedges on wholesale funding were terminated during the year ended December 31, 2020.
The Company has credit derivatives resulting from participation in interest rate swaps provided to external lenders as part of loan participation arrangements which are, therefore, not used to manage interest rate risk in the Company’s assets or liabilities. Additionally, the Company provides interest rate risk management services to commercial customers, primarily interest rate swaps. The Company’s market risk from unfavorable movements in interest rates related to these derivative contracts is minimized by concurrently entering into offsetting derivative contracts that have identical notional values, terms and indices. As of December 31, 2020, the fair value of the derivatives resulting from participation in interest rate swaps provided to lenders was a liability of $217,000. The fair value of the derivatives resulting from customer interest rate risk management services was an asset of $34.2 million as of December 31, 2020; however, not all of the derivatives resulting from customer interest rate risk management services were cleared through a clearing agent, for which we have recorded a liability of $237,000 as a result. Interest rate swaps with customers under interest rate risk management services are offset by interest rate swaps that the Company executes with a third party, which minimizes the Company’s net risk in these transactions.
Impact of Inflation and Changing Prices
The consolidated financial statements and related notes of Investors Bancorp, Inc. have been prepared in accordance with U.S. generally accepted accounting principles (“GAAP”). GAAP generally requires the measurement of financial position and operating results in terms of historical dollars without considering changes in the relative purchasing power of money over time due to inflation. The impact of inflation is reflected in the increased cost of our operations. Unlike industrial companies, our assets and liabilities are primarily monetary in nature. As a result, changes in market interest rates have a greater impact on performance than the effects of inflation.
Recent Accounting Pronouncements
See Note 23 in Notes to Consolidated Financial Statements in “Item 15 - Exhibits and Financial Statement Schedules” for a description of recent accounting pronouncements already adopted.
New Accounting Pronouncements Issued But Not Yet Adopted
In October 2020 the FASB issued ASU 2020-10: Codification Improvements 2020-10: Codification Improvements. The amendments include all disclosure guidance in the Disclosure Section to reduce the potential that disclosure requirements would be missed. The Company adopted ASU 2020-10 on January 1, 2021. The adoption of this update did not have a material impact on the Company’s Consolidated Financial Statements.
66
In October 2020 the FASB issued ASU 2020-08: Codification Improvements to Subtopic 310-20, Receivables—Nonrefundable Fees and Other Costs Accounting Standards Update (ASU) No. 2020-08: Codification Improvements to Subtopic 310-20, Receivables—Nonrefundable Fees and Other Costs. The amendments in this update clarify guidance as to whether a callable debt security with multiple call dates is within the scope of paragraph 310-20-35-33. The Company adopted ASU 2020-08 on January 1, 2021. The adoption of this update did not have a material impact on the Company’s Consolidated Financial Statements.
In August 2020, the FASB issued ASU 2020-06, Debt - Debt with Conversion and Other Options (Subtopic 470-20) and Derivatives and Hedging - Contracts in Entity’s Own Equity (Subtopic 815-40): Accounting for Convertible Instruments and Contracts in an Entity’s Own Equity. The amendments simplify the accounting for certain financial instruments with the characteristics of liabilities and equity by reducing the number of models for convertible debt instruments and convertible preferred stock and amends how convertible instruments and equity contracts with an option to be settled in cash or shares affect the EPS calculation. The update also amends the derivatives scope exception for contracts in an entity’s own equity. The update will be effective for the Company January 1, 2022 with early adoption permitted not earlier than fiscal years beginning 2021. The Company does not expect the update to have a material impact on the Company’s Consolidated Financial Statements.
In March 2020, the FASB issued ASU 2020-04, Reference Rate Reform (Topic 848): Facilitation of the Effects of Reference Rate Reform on Financial Reporting. The amendments provide expedients and exceptions for applying GAAP to contracts or hedging relationships affected by the discontinuance of LIBOR as a benchmark rate to alleviate the burden and cost of such modifications. The expedients and exceptions provided by the amendments do not apply to contract modifications made and hedging relationships entered into or evaluated after December 31, 2022, except for hedging relationships existing as of December 31, 2022, that an entity has elected certain optional expedients for and that are retained through the end of the hedging relationship. The amendments also provide a one-time election to sell and/or transfer debt securities classified as held to maturity that reference a rate affected by reference rate reform. The update is in effect for a limited time from March 12, 2020 through December 31, 2022. The Company is evaluating its financial instruments indexed to USD-LIBOR for which the amendments provide expedients and administrative relief.
In January 2020, the FASB issued ASU 2020-01, Investments-Equity Securities (Topic 321), Investments-Equity Method and Joint Ventures (Topic 323), and Derivatives and Hedging (Topic 815): Clarifying the Interactions between Topic 321, Topic 323, and Topic 815 (a consensus of the Emerging Issues Task Force). This update clarifies the application of the alternative provided in ASU 2016-01 to measure certain equity securities without a readily determinable fair value. The amendments in this update clarify that a company should consider observable transactions that require it to either apply or discontinue the equity method of accounting under Topic 323 for the purposes of applying the measurement alternative in accordance with Topic 321 immediately before applying or upon discontinuing the equity method. The amendments further provide clarification related to the accounting for certain forward contracts and purchased options. The Company adopted ASU 2020-01 on January 1, 2021. The amendments in this update will be applied prospectively. The adoption of this update did not have a material impact on Company’s Consolidated Financial Statements.
In December 2019, the FASB issued ASU 2019-12, Income Taxes (Topic 740): Simplifying the Accounting for Income Taxes. The amendments simplify the accounting for income taxes by removing certain exceptions to general principles in Topic 740 and also clarify and amend existing guidance. The Company adopted ASU 2019-12 on January 1, 2021. The adoption of this update did not have a material impact on the Company’s Consolidated Financial Statements.
In August 2018, the FASB issued ASU 2018-14, Compensation-Retirement Benefits-Defined Benefit Plans-General (Subtopic 715-20): Disclosure Framework-Changes to the Disclosure Requirements for Defined Benefit Plans. The amendments in this update modify the disclosure requirements for employers that sponsor defined benefit pension or other postretirement plans by removing disclosures that no longer are considered cost beneficial, clarifying the specific requirements of disclosures, and adding disclosure requirements identified as relevant. The Company adopted ASU 2018-14 on January 1, 2021. The update will be applied on a retrospective basis to disclosures with regard to employee benefit plans. The adoption of this update did not have a material impact on the Company’s Consolidated Financial Statements.
| ITEM 7A. | QUANTITATIVE AND QUALITATIVE DISCLOSURE ABOUT MARKET RISK | ||||
For information regarding market risk see “Item 7. - Management’s Discussion and Analysis of Financial Condition and Results of Operations.”
| ITEM 8. | FINANCIAL STATEMENTS AND SUPPLEMENTARY DATA | ||||
The Financial Statements are included in Part IV, Item 15 of this Form 10-K.
67
| ITEM 9. | CHANGES IN AND DISAGREEMENTS WITH ACCOUNTANTS ON ACCOUNTING AND FINANCIAL DISCLOSURE | ||||
Not applicable.
| ITEM 9A. | CONTROLS AND PROCEDURES | ||||
(a) Evaluation of disclosure controls and procedures.
With the participation of management, the Principal Executive Officer and Principal Financial Officer have evaluated the effectiveness of the design and operation of the Company’s disclosure controls and procedures (as defined in Rule 13a-15(e) and 15d-15(e) under the Exchange Act) as of December 31, 2020. Based upon that evaluation, the Principal Executive Officer and Principal Financial Officer concluded that, as of that date, the Company’s disclosure controls and procedures are effective.
(b) Changes in internal controls.
There were no changes in our internal control over financial reporting that occurred during the quarter ended December 31, 2020 that have materially affected, or are reasonably likely to materially affect, our internal control over financial reporting.
(c) Management’s report on internal control over financial reporting.
The management of Investors Bancorp, Inc. is responsible for establishing and maintaining adequate internal control over financial reporting. Investors Bancorp’s internal control system is a process designed to provide reasonable assurance to the Company’s management and board of directors regarding the preparation and fair presentation of published financial statements.
Our internal control over financial reporting includes policies and procedures that pertain to the maintenance of records that, in reasonable detail, accurately and fairly reflect transactions and dispositions of assets; provide reasonable assurances that transactions are recorded as necessary to permit preparation of financial statements in accordance with U.S. generally accepted accounting principles, and that receipts and expenditures are being made only in accordance with authorizations of management and the directors of Investors Bancorp; and provide reasonable assurance regarding prevention or timely detection of unauthorized acquisition, use or disposition of Investors Bancorp’s assets that could have a material effect on our financial statements.
All internal control systems, no matter how well designed, have inherent limitations. Therefore, even those systems determined to be effective can provide only reasonable assurance with respect to financial statement preparation and presentation. Also, projections of any evaluation of effectiveness to future periods are subject to the risk that controls may become inadequate because of changes in conditions, or that the degree of compliance with the policies or procedures may deteriorate.
Investors Bancorp’s management assessed the effectiveness of the Company’s internal control over financial reporting as of December 31, 2020. In making this assessment, we used the criteria set forth by the Committee of Sponsoring Organizations of the Treadway Commission in Internal Control-Integrated Framework (2013). Based on our assessment we believe that, as of December 31, 2020, the Company’s internal control over financial reporting is effective based on those criteria.
Investors Bancorp’s independent registered public accounting firm that audited the consolidated financial statements has issued an audit report on the effectiveness of the Company’s internal control over financial reporting as of December 31, 2020. This report appears on page 73.
The Sarbanes-Oxley Act Section 302 Certifications have been filed with the SEC as Exhibit 31.1 and Exhibit 31.2 to this Annual Report on Form 10-K.
| ITEM 9B. | OTHER INFORMATION | ||||
Not applicable.
68
Part III
| ITEM 10. | DIRECTORS, EXECUTIVE OFFICERS AND CORPORATE GOVERNANCE | ||||
Information regarding directors, executive officers and corporate governance of the Company is incorporated herein by reference in the Company’s definitive Proxy Statement to be filed with respect to the Annual Meeting of Stockholders to be held on May 25, 2021.
| ITEM 11. | EXECUTIVE COMPENSATION | ||||
Information regarding executive compensation is incorporated herein by reference in the Company’s definitive Proxy Statement to be filed with respect to the Annual Meeting of Stockholders to be held on May 25, 2021.
| ITEM 12. | SECURITY OWNERSHIP OF CERTAIN BENEFICIAL OWNERS AND MANAGEMENT AND RELATED STOCKHOLDER MATTERS | ||||
Information regarding security ownership of certain beneficial owners and management is incorporated herein by reference in the Company’s definitive Proxy Statement to be filed with respect to the Annual Meeting of Stockholders to be held on May 25, 2021. Information regarding equity compensation plans is incorporated herein by reference in the Company’s definitive Proxy Statement to be filed with respect to the Annual Meeting of Stockholders to be held on May 25, 2021.
| ITEM 13. | CERTAIN RELATIONSHIPS, RELATED TRANSACTIONS AND DIRECTOR INDEPENDENCE | ||||
Information regarding certain relationships and related transactions, and director independence is incorporated herein by reference in the Company’s definitive Proxy Statement to be filed with respect to the Annual Meeting of Stockholders to be held on May 25, 2021.
| ITEM 14. | PRINCIPAL ACCOUNTANT FEES AND SERVICES | ||||
Information regarding principal accounting fees and services is incorporated herein by reference in Investors Bancorp’s definitive Proxy Statement to be filed with respect to the Annual Meeting of Stockholders to be held on May 25, 2021.
Part IV
| ITEM 15. | EXHIBITS AND FINANCIAL STATEMENT SCHEDULES | ||||
(a) (1) Financial Statements
69
Report of Independent Registered Public Accounting Firm
To the Stockholders and Board of Directors
Investors Bancorp, Inc.:
Opinion on the Consolidated Financial Statements
We have audited the accompanying consolidated balance sheets of Investors Bancorp, Inc. and subsidiary (the Company) as of December 31, 2020 and 2019, the related consolidated statements of income, comprehensive income, stockholders’ equity, and cash flows for each of the years in the three‑year period ended December 31, 2020, and the related notes (collectively, the consolidated financial statements). In our opinion, the consolidated financial statements present fairly, in all material respects, the financial position of the Company as of December 31, 2020 and 2019, and the results of its operations and its cash flows for each of the years in the three‑year period ended December 31, 2020, in conformity with U.S. generally accepted accounting principles.
We also have audited, in accordance with the standards of the Public Company Accounting Oversight Board (United States) (PCAOB), the Company’s internal control over financial reporting as of December 31, 2020, based on criteria established in Internal Control – Integrated Framework (2013) issued by the Committee of Sponsoring Organizations of the Treadway Commission, and our report dated March 1, 2021 expressed an unqualified opinion on the effectiveness of the Company’s internal control over financial reporting.
Change in Accounting Principle
As discussed in Note 1 to the consolidated financial statements, the Company has changed its method of accounting for the recognition and measurement of credit losses as of January 1, 2020 due to the adoption of ASU 2016-13, “Financial Instruments – Credit Losses (Topic 326): Measurements of Credit Losses on Financial Instruments.”
Basis for Opinion
These consolidated financial statements are the responsibility of the Company’s management. Our responsibility is to express an opinion on these consolidated financial statements based on our audits. We are a public accounting firm registered with the PCAOB and are required to be independent with respect to the Company in accordance with the U.S. federal securities laws and the applicable rules and regulations of the Securities and Exchange Commission and the PCAOB.
We conducted our audits in accordance with the standards of the PCAOB. Those standards require that we plan and perform the audit to obtain reasonable assurance about whether the consolidated financial statements are free of material misstatement, whether due to error or fraud. Our audits included performing procedures to assess the risks of material misstatement of the consolidated financial statements, whether due to error or fraud, and performing procedures that respond to those risks. Such procedures included examining, on a test basis, evidence regarding the amounts and disclosures in the consolidated financial statements. Our audits also included evaluating the accounting principles used and significant estimates made by management, as well as evaluating the overall presentation of the consolidated financial statements. We believe that our audits provide a reasonable basis for our opinion.
Critical Audit Matter
The critical audit matter communicated below is a matter arising from the current period audit of the consolidated financial statements that was communicated or required to be communicated to the audit committee and that: (1) relates to accounts or disclosures that are material to the consolidated financial statements and (2) involved our especially challenging, subjective, or complex judgments. The communication of a critical audit matter does not alter in any way our opinion on the consolidated financial statements, taken as a whole, and we are not, by communicating the critical audit matter below, providing a separate opinion on the critical audit matter or on the accounts or disclosures to which it relates.
Assessment of the allowance for credit losses related to loans receivable evaluated and calculated on a collective basis
As discussed in Notes 1 and 6 to the consolidated financial statements, the Company’s total allowance for credit losses as of December 31, 2020 was $283.0 million, a portion of which related to the allowance for credit losses on loans receivable evaluated and calculated on a collective basis (the collective ACL). The collective ACL includes the measurement of expected credit losses on a collective basis for those loans that share similar risk characteristics. In order to capture the specific risk characteristics of the loan portfolio, the Company segments the portfolio based upon
70
loan type. The Company’s collective ACL consists of both quantitative methodologies and qualitative reserves. The quantitative methodologies consider a variety of factors such as historical loss experience, loan characteristics, the current credit quality of the portfolio as well as multiple weighted economic scenarios over a reasonable and supportable forecast period, after which, the Company reverts to average historical losses on a straight line basis. The expected credit losses are the product of multiplying the Company’s estimates of probability of default (PD), loss given default (LGD) and individual loan level exposure at default on an undiscounted basis. Expected credit losses are estimated over the contractual term of each loan, adjusted for expected prepayments. The collective ACL also includes qualitative reserves to cover losses that are expected but, in the Company’s assessment, may not be adequately represented in the quantitative methodologies or the related economic assumptions.
We identified the assessment of the collective ACL as a critical audit matter. A high degree of audit effort, including specialized skills and knowledge, and subjective and complex auditor judgment was involved in the assessment of the collective ACL due to significant measurement uncertainty. Specifically, the assessment encompassed an evaluation of (1) the quantitative methodologies, including the methods and models used to estimate the PD and LGD, (2) the key assumptions for the quantitative methodologies, including the segmentation of the loan portfolio by similar risk characteristics, the reasonable and supportable forecast period including the reversion period, multiple economic scenarios including the weighting of those scenarios, and expected prepayments, and (3) the qualitative reserves. The assessment also included an evaluation of the conceptual soundness and performance of the PD and LGD models. In addition, auditor judgment was required to evaluate the sufficiency of audit evidence obtained.
The following are the primary procedures we performed to address the critical audit matter. We evaluated the design and tested the operating effectiveness of certain internal controls related to the Company’s measurement of the collective ACL, including controls over the:
•development of the collective ACL methodology
•development of the PD and LGD models
•performance monitoring of the PD and LGD models
•identification and determination of the key assumptions used in the quantitative methodologies
•evaluation of qualitative reserves
•analysis of the collective ACL results, trends and ratios.
We evaluated the Company’s process to develop the collective ACL by testing certain sources of data, inputs, factors and assumptions that the Company used, and considered the relevance and reliability of such data, inputs, factors and assumptions. In addition, we involved credit risk professionals with specialized skills and knowledge, who assisted in evaluating the:
•Company’s collective ACL estimate methodology, including the key assumptions, for compliance with U.S. generally accepted accounting principles
•judgments made by the Company relative to the development and performance testing of the PD and LGD models by comparing them to relevant Company-specific metrics and trends and the applicable industry and regulatory practices
•conceptual soundness and performance testing of the PD and LGD models by inspecting the model documentation to determine whether the models are suitable for their intended use
•multiple economic scenarios and the relative weightings of each scenario by comparing the scenarios to the Company’s business environment, relevant industry practices, and publicly available forecasts
•length of the reasonable and supportable forecast period and the reversion period by comparing them to specific portfolio risk characteristics and trends
•expected prepayments by comparing to specific portfolio risk characteristics
•segmentation of the loan portfolio by similar risk characteristics by comparing to the Company’s business environment and relevant industry practices
•methodology used to develop the qualitative reserves and the effect of those reserves on the collective ACL compared with relevant credit risk factors and consistency with credit trends and identified limitations of the underlying quantitative methods.
71
We also assessed the sufficiency of the audit evidence obtained related to the December 31, 2020 collective ACL by evaluating the:
•cumulative results of the audit procedures
•qualitative aspects of the Company’s accounting practices
•potential bias in the accounting estimate.
/s/ KPMG LLP
We have not been able to determine the specific year that we began serving as the Company’s auditor, however we are aware that we have served as the Company’s auditor since at least 1954.
Short Hills, New Jersey
March 1, 2021
72
Report of Independent Registered Public Accounting Firm
To the Stockholders and Board of Directors
Investors Bancorp, Inc.:
Opinion on Internal Control Over Financial Reporting
We have audited Investors Bancorp, Inc.’s and subsidiary (the Company) internal control over financial reporting as of December 31, 2020, based on criteria established in Internal Control – Integrated Framework (2013) issued by the Committee of Sponsoring Organizations of the Treadway Commission. In our opinion, the Company maintained, in all material respects, effective internal control over financial reporting as of December 31, 2020, based on criteria established in Internal Control – Integrated Framework (2013) issued by the Committee of Sponsoring Organizations of the Treadway Commission.
We also have audited, in accordance with the standards of the Public Company Accounting Oversight Board (United States) (PCAOB), the consolidated balance sheets of the Company as of December 31, 2020 and 2019, the related consolidated statements of income, comprehensive income, stockholders’ equity, and cash flows for each of the years in the three-year period ended December 31, 2020, and the related notes (collectively, the consolidated financial statements), and our report dated March 1, 2021 expressed an unqualified opinion on those consolidated financial statements.
Basis for Opinion
The Company’s management is responsible for maintaining effective internal control over financial reporting and for its assessment of the effectiveness of internal control over financial reporting, included in the accompanying Management’s report on internal control over financial reporting. Our responsibility is to express an opinion on the Company’s internal control over financial reporting based on our audit. We are a public accounting firm registered with the PCAOB and are required to be independent with respect to the Company in accordance with the U.S. federal securities laws and the applicable rules and regulations of the Securities and Exchange Commission and the PCAOB.
We conducted our audit in accordance with the standards of the PCAOB. Those standards require that we plan and perform the audit to obtain reasonable assurance about whether effective internal control over financial reporting was maintained in all material respects. Our audit of internal control over financial reporting included obtaining an understanding of internal control over financial reporting, assessing the risk that a material weakness exists, and testing and evaluating the design and operating effectiveness of internal control based on the assessed risk. Our audit also included performing such other procedures as we considered necessary in the circumstances. We believe that our audit provides a reasonable basis for our opinion.
Definition and Limitations of Internal Control Over Financial Reporting
A company’s internal control over financial reporting is a process designed to provide reasonable assurance regarding the reliability of financial reporting and the preparation of financial statements for external purposes in accordance with generally accepted accounting principles. A company’s internal control over financial reporting includes those policies and procedures that (1) pertain to the maintenance of records that, in reasonable detail, accurately and fairly reflect the transactions and dispositions of the assets of the company; (2) provide reasonable assurance that transactions are recorded as necessary to permit preparation of financial statements in accordance with generally accepted accounting principles, and that receipts and expenditures of the company are being made only in accordance with authorizations of management and directors of the company; and (3) provide reasonable assurance regarding prevention or timely detection of unauthorized acquisition, use, or disposition of the company’s assets that could have a material effect on the financial statements.
Because of its inherent limitations, internal control over financial reporting may not prevent or detect misstatements. Also, projections of any evaluation of effectiveness to future periods are subject to the risk that controls may become inadequate because of changes in conditions, or that the degree of compliance with the policies or procedures may deteriorate.
/s/ KPMG LLP
Short Hills, New Jersey
March 1, 2021
73
INVESTORS BANCORP, INC. AND SUBSIDIARY
Consolidated Balance Sheets
| December 31, 2020 | December 31, 2019 | ||||||||||
| (In thousands except share data) | |||||||||||
| ASSETS | |||||||||||
| Cash and cash equivalents | $ | ||||||||||
| Equity securities | |||||||||||
| Debt securities available-for-sale, at estimated fair value | |||||||||||
Debt securities held-to-maturity, net (estimated fair value of $ | |||||||||||
| Loans receivable, net | |||||||||||
| Loans held-for-sale | |||||||||||
| Federal Home Loan Bank stock | |||||||||||
| Accrued interest receivable | |||||||||||
| Other real estate owned and other repossessed assets | |||||||||||
| Office properties and equipment, net | |||||||||||
| Operating lease right-of-use assets | |||||||||||
| Net deferred tax asset | |||||||||||
| Bank owned life insurance | |||||||||||
| Goodwill and intangible assets | |||||||||||
| Other assets | |||||||||||
| Total assets | $ | ||||||||||
| LIABILITIES AND STOCKHOLDERS’ EQUITY | |||||||||||
| Liabilities: | |||||||||||
| Deposits | $ | ||||||||||
| Borrowed funds | |||||||||||
| Advance payments by borrowers for taxes and insurance | |||||||||||
| Operating lease liabilities | |||||||||||
| Other liabilities | |||||||||||
| Total liabilities | |||||||||||
| Commitments and contingencies | |||||||||||
| Stockholders’ equity: | |||||||||||
Preferred stock, $ | |||||||||||
Common stock, $ | |||||||||||
| Additional paid-in capital | |||||||||||
| Retained earnings | |||||||||||
Treasury stock, at cost; | ( | ( | |||||||||
| Unallocated common stock held by the employee stock ownership plan | ( | ( | |||||||||
| Accumulated other comprehensive loss | ( | ( | |||||||||
| Total stockholders’ equity | |||||||||||
| Total liabilities and stockholders’ equity | $ | ||||||||||
See accompanying notes to consolidated financial statements.
74
INVESTORS BANCORP, INC. AND SUBSIDIARY
Consolidated Statements of Income
| For the Years Ended December 31, | |||||||||||||||||
| 2020 | 2019 | 2018 | |||||||||||||||
| (Dollars in thousands, except per share data) | |||||||||||||||||
| Interest and dividend income: | |||||||||||||||||
| Loans receivable and loans held-for-sale | $ | ||||||||||||||||
| Securities: | |||||||||||||||||
| Equity | |||||||||||||||||
| Government-sponsored enterprise obligations | |||||||||||||||||
| Mortgage-backed securities | |||||||||||||||||
| Municipal bonds and other debt | |||||||||||||||||
| Interest-bearing deposits | |||||||||||||||||
| Federal Home Loan Bank stock | |||||||||||||||||
| Total interest and dividend income | |||||||||||||||||
| Interest expense: | |||||||||||||||||
| Deposits | |||||||||||||||||
| Borrowed Funds | |||||||||||||||||
| Total interest expense | |||||||||||||||||
| Net interest income | |||||||||||||||||
| Provision for credit losses | ( | ||||||||||||||||
| Net interest income after provision for credit losses | |||||||||||||||||
| Non-interest income | |||||||||||||||||
| Fees and service charges | |||||||||||||||||
| Income on bank owned life insurance | |||||||||||||||||
| Gain on loans, net | |||||||||||||||||
| Gain (loss) on securities, net | ( | ( | |||||||||||||||
| Gain on sale-leaseback transactions | |||||||||||||||||
| Gain on sale of other real estate owned, net | |||||||||||||||||
| Other income | |||||||||||||||||
| Total non-interest income | |||||||||||||||||
| Non-interest expense | |||||||||||||||||
| Compensation and fringe benefits | |||||||||||||||||
| Advertising and promotional expense | |||||||||||||||||
| Office occupancy and equipment expense | |||||||||||||||||
| Federal deposit insurance premiums | |||||||||||||||||
| General and administrative | |||||||||||||||||
| Professional fees | |||||||||||||||||
| Data processing and communication | |||||||||||||||||
| Debt extinguishment | |||||||||||||||||
| Other operating expenses | |||||||||||||||||
| Total non-interest expenses | |||||||||||||||||
| Income before income tax expense | |||||||||||||||||
| Income tax expense | |||||||||||||||||
| Net income | $ | ||||||||||||||||
| Basic earnings per share | $ | ||||||||||||||||
| Diluted earnings per share | $ | ||||||||||||||||
| Weighted average shares outstanding | |||||||||||||||||
| Basic | |||||||||||||||||
| Diluted | |||||||||||||||||
See accompanying notes to consolidated financial statements.
75
INVESTORS BANCORP, INC. AND SUBSIDIARY
Consolidated Statements of Comprehensive Income
| For the Years Ended December 31, | |||||||||||||||||
| 2020 | 2019 | 2018 | |||||||||||||||
| (In thousands) | |||||||||||||||||
| Net income | $ | ||||||||||||||||
| Other comprehensive (loss) income, net of tax: | |||||||||||||||||
| Change in funded status of retirement obligations | ( | ( | |||||||||||||||
| Unrealized gains (losses) on debt securities available-for-sale | ( | ||||||||||||||||
| Accretion of loss on debt securities reclassified to held to maturity | |||||||||||||||||
| Reclassification adjustment for security losses included in net income | |||||||||||||||||
| Other-than-temporary impairment accretion on debt securities recorded prior to January 1, 2020 | |||||||||||||||||
| Net losses on derivatives | ( | ( | ( | ||||||||||||||
| Total other comprehensive (loss) income | ( | ( | |||||||||||||||
| Total comprehensive income | $ | ||||||||||||||||
See accompanying notes to consolidated financial statements.
76
INVESTORS BANCORP, INC. AND SUBSIDIARY
Consolidated Statements of Stockholders’ Equity
Years Ended December 31, 2020, 2019 and 2018
| Common stock | Additional paid-in capital | Retained earnings | Treasury stock | Unallocated Common Stock Held by ESOP | Accumulated other comprehensive loss | Total stockholders’ equity | |||||||||||||||||||||||||||||||||||
| (In thousands except share data) | |||||||||||||||||||||||||||||||||||||||||
| Balance at December 31, 2017 | $ | ( | ( | ( | |||||||||||||||||||||||||||||||||||||
| Net income | — | — | — | — | — | ||||||||||||||||||||||||||||||||||||
Effect of adopting | — | — | — | — | ( | ||||||||||||||||||||||||||||||||||||
| Other comprehensive income, net of tax | — | — | — | — | — | ||||||||||||||||||||||||||||||||||||
Purchase of treasury stock ( | — | — | — | ( | — | — | ( | ||||||||||||||||||||||||||||||||||
Treasury stock allocated to restricted stock plan ( | — | ( | — | — | |||||||||||||||||||||||||||||||||||||
| Compensation cost for stock options and restricted stock | — | — | — | — | — | ||||||||||||||||||||||||||||||||||||
| Exercise of stock options | — | ( | — | — | — | ||||||||||||||||||||||||||||||||||||
Restricted stock forfeitures ( | — | ( | ( | — | — | ||||||||||||||||||||||||||||||||||||
Cash dividend paid ($ | — | — | ( | — | — | — | ( | ||||||||||||||||||||||||||||||||||
| ESOP shares allocated or committed to be released | — | — | — | — | |||||||||||||||||||||||||||||||||||||
| Balance at December 31, 2018 | ( | ( | ( | ||||||||||||||||||||||||||||||||||||||
| Net income | — | — | — | — | — | ||||||||||||||||||||||||||||||||||||
| Other comprehensive loss, net of tax | — | — | — | — | — | ( | ( | ||||||||||||||||||||||||||||||||||
Purchase of treasury stock ( | — | — | — | ( | — | — | ( | ||||||||||||||||||||||||||||||||||
Treasury stock allocated to restricted stock plan ( | — | ( | — | — | |||||||||||||||||||||||||||||||||||||
| Compensation cost for stock options and restricted stock | — | — | — | — | — | ||||||||||||||||||||||||||||||||||||
| Exercise of stock options | — | ( | — | — | — | ||||||||||||||||||||||||||||||||||||
Restricted stock forfeitures ( | — | ( | ( | — | — | ||||||||||||||||||||||||||||||||||||
Cash dividend paid ($ | — | — | ( | — | — | — | ( | ||||||||||||||||||||||||||||||||||
| ESOP shares allocated or committed to be released | — | — | — | — | |||||||||||||||||||||||||||||||||||||
| Balance at December 31, 2019 | ( | ( | ( | ||||||||||||||||||||||||||||||||||||||
Cumulative effect of adopting | — | — | ( | — | — | — | ( | ||||||||||||||||||||||||||||||||||
| Balance at January 1, 2020 | ( | ( | ( | ||||||||||||||||||||||||||||||||||||||
| Net income | — | — | — | — | — | ||||||||||||||||||||||||||||||||||||
| Other comprehensive loss, net of tax | — | — | — | — | — | ( | ( | ||||||||||||||||||||||||||||||||||
| Common stock issued to finance acquisition | — | — | — | — | |||||||||||||||||||||||||||||||||||||
Purchase of treasury stock ( | — | — | — | ( | — | — | ( | ||||||||||||||||||||||||||||||||||
Treasury stock allocated to restricted stock plan ( | — | ( | ( | — | — | ||||||||||||||||||||||||||||||||||||
| Compensation cost for stock options and restricted stock | — | — | — | — | — | ||||||||||||||||||||||||||||||||||||
Restricted stock forfeitures ( | — | ( | ( | — | — | ||||||||||||||||||||||||||||||||||||
Cash dividend paid ($ | — | — | ( | — | — | — | ( | ||||||||||||||||||||||||||||||||||
| ESOP shares allocated or committed to be released | — | — | — | — | |||||||||||||||||||||||||||||||||||||
| Balance at December 31, 2020 | $ | ( | ( | ( | |||||||||||||||||||||||||||||||||||||
See accompanying notes to consolidated financial statements.
77
INVESTORS BANCORP, INC. AND SUBSIDIARY
Consolidated Statements of Cash Flows
| For the Years Ended December 31, | |||||||||||||||||
| 2020 | 2019 | 2018 | |||||||||||||||
| (In thousands) | |||||||||||||||||
| Cash flows from operating activities: | |||||||||||||||||
| Net income | $ | ||||||||||||||||
| Adjustments to reconcile net income to net cash provided by operating activities: | |||||||||||||||||
| ESOP and stock-based compensation expense | |||||||||||||||||
| Amortization of premiums and accretion of discounts on securities, net | |||||||||||||||||
| Amortization of premiums and accretion of fees and costs on loans, net | ( | ( | |||||||||||||||
| Amortization of other intangible assets | |||||||||||||||||
| Amortization of debt modification costs and premium on borrowings | |||||||||||||||||
| Provision for credit losses | ( | ||||||||||||||||
| Loss from extinguishment of debt | |||||||||||||||||
| Depreciation and amortization of office properties and equipment | |||||||||||||||||
| (Gain) loss on securities, net | ( | ||||||||||||||||
| Mortgage loans originated for sale | ( | ( | ( | ||||||||||||||
| Proceeds from mortgage loan sales | |||||||||||||||||
| Gain on sales of mortgage loans, net | ( | ( | ( | ||||||||||||||
| Gain on sale of other real estate owned | ( | ( | ( | ||||||||||||||
| Gain on sale of real estate property, net | ( | ||||||||||||||||
| Income on bank owned life insurance | ( | ( | ( | ||||||||||||||
| Amortization of lease right-of-use assets | |||||||||||||||||
| Decrease (increase) in accrued interest receivable | ( | ( | |||||||||||||||
| Deferred tax (benefit) expense | ( | ||||||||||||||||
| Increase in other assets | ( | ( | ( | ||||||||||||||
| Increase (decrease) in other liabilities | ( | ( | |||||||||||||||
| Net cash provided by operating activities | |||||||||||||||||
| Cash flows from investing activities: | |||||||||||||||||
| Purchases of loans receivable | ( | ( | ( | ||||||||||||||
| Net payoffs (originations) of loans receivable | ( | ||||||||||||||||
| Proceeds from disposition of loans receivable | |||||||||||||||||
| Gain on disposition of loans receivable | ( | ( | ( | ||||||||||||||
| Gain on disposition of leased equipment | ( | ( | |||||||||||||||
| Net proceeds from sale of other real estate owned | |||||||||||||||||
| Proceeds from principal repayments/calls/maturities of debt securities available for sale | |||||||||||||||||
| Proceeds from sales of debt securities available for sale | |||||||||||||||||
| Proceeds from principal repayments/calls/maturities of debt securities held to maturity | |||||||||||||||||
| Purchases of equity securities | ( | ( | ( | ||||||||||||||
| Purchases of debt securities available for sale | ( | ( | ( | ||||||||||||||
| Purchases of debt securities held to maturity | ( | ( | ( | ||||||||||||||
| Proceeds from redemptions of Federal Home Loan Bank stock | |||||||||||||||||
| Purchases of Federal Home Loan Bank stock | ( | ( | ( | ||||||||||||||
| Purchases of office properties and equipment | ( | ( | ( | ||||||||||||||
| Proceeds from sale of real estate property | |||||||||||||||||
| Death benefit proceeds from bank owned life insurance | |||||||||||||||||
| Purchases of bank owned life insurance | ( | ||||||||||||||||
| Proceeds from surrender of bank owned life insurance contract | |||||||||||||||||
78
| Cash received, net of cash consideration paid for acquisitions | ( | ||||||||||||||||
| Net cash provided by (used in) investing activities | ( | ( | |||||||||||||||
| Cash flows from financing activities: | |||||||||||||||||
| Net increase in deposits | |||||||||||||||||
| Repayments of principal under finance leases | ( | ( | |||||||||||||||
| Funds borrowed under other repurchase agreements | |||||||||||||||||
| Net (repayments) proceeds of borrowed funds | ( | ||||||||||||||||
| Payments related to extinguishment of debt | ( | ||||||||||||||||
| Net (decrease) increase in advance payments by borrowers for taxes and insurance | ( | ( | |||||||||||||||
| Dividends paid | ( | ( | ( | ||||||||||||||
| Exercise of stock options | |||||||||||||||||
| Purchase of treasury stock | ( | ( | ( | ||||||||||||||
| Net cash (used in) provided by financing activities | ( | ||||||||||||||||
| Net decrease in cash and cash equivalents | ( | ( | ( | ||||||||||||||
| Cash and cash equivalents at beginning of period | |||||||||||||||||
| Cash and cash equivalents at end of period | $ | ||||||||||||||||
| Supplemental cash flow information: | |||||||||||||||||
| Non-cash investing activities: | |||||||||||||||||
| Real estate acquired through foreclosure and other assets repossessed | $ | ||||||||||||||||
| Cash paid during the year for: | |||||||||||||||||
| Interest | |||||||||||||||||
| Income taxes | |||||||||||||||||
| Significant non-cash transactions | |||||||||||||||||
| Debt securities transferred from held-to-maturity to available-for-sale | |||||||||||||||||
| Loans transferred to held-for-sale portfolio | |||||||||||||||||
| Investment in low income housing tax credit | |||||||||||||||||
| Right-of-use assets obtained in exchange for new lease liabilities | |||||||||||||||||
| Acquisition: | |||||||||||||||||
| Non-cash assets acquired: | |||||||||||||||||
| Debt securities available-for-sale | |||||||||||||||||
| Debt securities held to maturity | |||||||||||||||||
| Loans receivable, net | |||||||||||||||||
| Office properties and equipment, net | |||||||||||||||||
| Accrued interest receivable | |||||||||||||||||
| Right of use assets - leases | |||||||||||||||||
| Deferred tax asset | |||||||||||||||||
| Intangible assets, net | |||||||||||||||||
| Other assets | |||||||||||||||||
| Total non-cash assets acquired | |||||||||||||||||
| Liabilities assumed: | |||||||||||||||||
| Deposits | |||||||||||||||||
| Borrowed funds | |||||||||||||||||
| Advance payment by borrowers | |||||||||||||||||
| Other liabilities | |||||||||||||||||
| Total liabilities assumed | |||||||||||||||||
| Net non-cash assets acquired | |||||||||||||||||
| Common stock issued for acquisition | |||||||||||||||||
See accompanying notes to consolidated financial statements.
79
INVESTORS BANCORP, INC. AND SUBSIDIARY
Notes to Consolidated Financial Statements
1. Summary of Significant Accounting Policies
Business
Investors Bancorp Inc. (the “Company”) is the holding company for Investors Bank (“the Bank”) and the Bank’s wholly-owned subsidiaries. The Bank is a New Jersey-chartered commercial bank headquartered in Short Hills, NJ and provides a full range of banking and related financial services to consumer and commercial customers through its subsidiaries. The Company is subject to the regulations of certain federal and state regulatory authorities and undergoes periodic examinations by those regulatory authorities.
Basis of Presentation
The consolidated financial statements are comprised of the accounts of Investors Bancorp, Inc. and its wholly owned subsidiary, Investors Bank and the Bank’s wholly-owned subsidiaries (collectively, the “Company”). All significant intercompany accounts and transactions have been eliminated in consolidation. Certain reclassifications have been made in the consolidated financial statements to conform with current year classifications. In the opinion of management, all the adjustments (consisting of normal and recurring adjustments) necessary for the fair presentation of the consolidated financial condition and the consolidated results of operations for the periods presented have been included. The results of operations and other data presented are not necessarily indicative of the results of operations that may be expected for subsequent years.
The preparation of financial statements in conformity with GAAP requires us to make estimates and assumptions that affect the reported amounts of assets and liabilities and disclosure of contingent assets and liabilities at the dates of the financial statements and the reported amounts of revenues and expenses during the reporting periods. Several accounting estimates are particularly critical and are susceptible to significant near-term change, including the allowance for credit losses, valuation of deferred tax assets, impairment judgements and fair value regarding securities, stock-based compensation and derivative instruments. These accounting estimates, which are included in the discussion below, involve a higher degree of complexity and subjectivity and require estimate and assumptions about highly uncertain matters.
Adoption of New Accounting Standards
On January 1, 2020, the Company adopted ASU 2016-13, “Financial Instruments - Credit Losses (Topic 326): Measurement of Credit Losses on Financial Instruments”, which replaced the previous incurred loss methodology, which encompassed allowance for current known and inherent losses within the portfolio, with an expected loss methodology, which encompasses allowance for losses expected to be incurred over the life of the portfolio, referred to as the current expected credit loss (“CECL”) methodology. The new CECL model requires the measurement of all expected credit losses for financial assets measured at amortized cost and certain off-balance-sheet credit exposures based on historical experience, current conditions, and reasonable and supportable forecasts. The Company adopted ASU 2016-13 using a modified retrospective approach. Results for reporting periods beginning after January 1, 2020 are presented under Topic 326, while prior period amounts continue to be reported in accordance with previously applicable GAAP. At adoption, the Company increased its allowance for credit losses by $11.7 million, comprised of $12.7 million and $2.6 million, respectively, for unfunded commitments and held-to-maturity debt securities, partially offset by a decrease of $3.6 million for loans. Upon adoption the Company recorded a cumulative effect adjustment that reduced stockholders’ equity by $8.5 million net of an increase to deferred tax assets of $3.2 million. In connection with the adoption of ASC 326, the Company revised certain accounting policies and implemented certain accounting policy elections.
Significant Accounting Principles
80
Securities
The Company’s securities portfolio includes equity securities, debt securities held-to-maturity and debt securities available-for-sale. Management determines the appropriate classification of securities at the time of purchase. If management has the positive intent not to sell and the Company would not be required to sell a debt security prior to maturity, it is classified as held-to-maturity. Such securities are stated at amortized cost, adjusted for unamortized purchase premiums and discounts and an allowance for credit losses. Securities in the available-for-sale category are securities which the Company may sell prior to maturity. Available-for-sale securities are reported at fair value with any unrealized appreciation or depreciation, net of tax effects, reported as accumulated other comprehensive income/loss in stockholders’ equity. Discounts and premiums on debt securities are accreted or amortized using the level-yield method over the estimated lives of the securities, including the effect of prepayments. Realized gains and losses are recognized when securities are sold or called using the specific identification method. Unrealized gains and losses on equity securities are recognized in the Consolidated Statements of Income.
Loans Receivable, Net
Loans receivable, other than loans held-for-sale, are stated at unpaid principal balance, adjusted for unamortized premiums, unearned discounts, deferred origination fees and costs, net purchase accounting adjustments, hedged items and the allowance for loan losses. Interest income on loans is accrued and credited to income as earned. Premiums and discounts on purchased loans and net loan origination fees and costs are deferred and amortized to interest income over the estimated life of the loan as an adjustment to yield.
Also included in loans receivable are direct finance leases which are stated as the sum of remaining minimum lease payments from lessees plus estimated residual values less unearned lease income. At the inception of each lease, the Company records a residual value for the leased equipment based on its estimate of the future value of the equipment at the end of the lease term or end of the equipment’s estimated useful life. On an annual basis, the Company reviews the lease residuals for potential impairment.
A loan is considered delinquent when we have not received a payment within 30 days of its contractual due date. The accrual of income on loans is discontinued when required interest or principal payments are 90 days in arrears or when the timely collection of such income is doubtful. Loans on which the accrual of income has been discontinued are designated as non-accrual loans and outstanding interest previously credited is reversed. Interest income on non-accrual loans and impaired loans is recognized in the period collected unless the ultimate collection of principal is considered doubtful. A loan is returned to accrual status when all amounts due have been received and the remaining principal is deemed collectible. Loans are generally charged off after an analysis is completed which indicates that collectability of the full principal balance is in doubt.
Troubled Debt Restructuring. On a case-by-case basis, the Company may agree to modify the contractual terms of a borrower’s loan to remain competitive and assist customers who may be experiencing financial difficulty, as well as preserve the Company’s position in the loan. If the borrower is experiencing financial difficulties and a concession has been made at the time of such modification, the loan is classified as a TDR.
Substantially all of our TDR loan modifications involve lowering the monthly payments on such loans through either a reduction in interest rate below a market rate, an extension of the term of the loan, or a combination of these two methods. These modifications rarely result in the forgiveness of principal or accrued interest. In addition, we frequently obtain additional collateral or guarantor support when modifying commercial loans. Restructured loans remain on non-accrual status until there has been a sustained period of repayment performance (generally six consecutive months of payments) and both principal and interest are deemed collectible.
Guidance on Non-TDR Loan Modifications due to COVID-19. On March 22, 2020, a statement was issued by the Company’s banking regulators and titled the “Interagency Statement on Loan Modifications and Reporting for Financial Institutions Working with Customers Affected by the Coronavirus” (the “Interagency Statement”) that encourages financial institutions to work prudently with borrowers who are or may be unable to meet their contractual payment obligations due to the effects of COVID-19. Additionally, Section 4013 of the CARES Act that passed on March 27, 2020 further provides that a qualified loan modification is exempt by law from classification as a TDR as defined by GAAP, from the period beginning March 1, 2020 until the earlier of December 31, 2020 or the date that is 60 days after the date on which the national emergency concerning the COVID-19 outbreak declared by the President of the United States under the National Emergencies Act terminates. Section 541 of the Consolidated Appropriations Act, 2021, extends this relief to the earlier of January 1, 2022 or 60 days after the national emergency termination date. For loan modifications that include a payment deferral and are not TDRs, the borrower’s past due and non-accrual status have not been impacted during the deferral period. The majority of our deferrals initially consisted of 90-day principal and interest deferrals with additional deferral periods of varying duration granted on a case by case basis at the Company’s option. Interest income has continued to be recognized over the contractual life of the loan. At December 31,
81
2020, loans with an aggregate outstanding balance of approximately $790.0 million were in COVID-19 related deferment and qualified for exemption from TDR classification.
Allowance for Credit Losses
The allowance for credit losses represents the estimated amount considered necessary to cover lifetime expected credit losses inherent in financial assets at the balance sheet date. The measurement of expected credit losses is applicable to financial assets measured at amortized cost, including loan receivables and held-to-maturity debt securities. It also applies to off-balance sheet credit exposures such as loan commitments and unused lines of credit. The allowance is established through the provision for credit losses that is charged against income. The methodology for determining the allowance for credit losses is considered a critical accounting policy by management because of the high degree of judgment involved, the subjectivity of the assumptions used, and the potential for changes in the forecasted economic environment that could result in changes to the amount of the recorded allowance for credit losses. The allowance for loan and security losses is reported separately as contra-assets to loans and securities on the consolidated balance sheet. The expected credit loss for unfunded lending commitments and unfunded loan commitments is reported on the consolidated balance sheet in other liabilities. The provision for credit losses related to loans, unfunded commitments and debt securities is reported on the consolidated statement of income.
Prior to the adoption of ASU 2016-13, the allowance for credit losses on loans was a contra-asset valuation account established through a provision for loan losses charged to expense, which represented management’s best estimate of inherent losses that had been incurred within the existing portfolio of loans. The allowance for credit losses on loans included allowance allocations calculated in accordance with ASC Topic 310, “Receivables” and allowance allocations calculated in accordance with ASC Topic 450, “Contingencies.”
Prior to January 1, 2020, under previous other-than-temporary impairment guidance, the Company conducted a quarterly review and evaluation of the securities portfolio to determine if the value of any security had declined below its cost or amortized cost, and whether such decline was other-than-temporary. If a determination was made that a debt security was other-than-temporarily impaired, the Company would estimate the amount of the unrealized loss that was attributable to credit and all other non-credit related factors. The credit related component would be recognized as an other-than-temporary impairment charge in non-interest income. The non-credit related component would be recorded as an adjustment to accumulated other comprehensive income (loss), net of tax.
Allowance for Credit Losses on Loans Receivable
Collectively evaluated. The allowance for credit losses on loans is deducted from the amortized cost basis of the loan to present the net amount expected to be collected. Expected losses are evaluated and calculated on a collective basis for those loans which share similar risk characteristics. At each reporting period, the Company evaluates whether the loans in a pool continue to exhibit similar risk characteristics as the other loans in the pool. If the risk characteristics of a loan change, such that they are no longer similar to other loans in the pool, the Company will evaluate the loan with a different pool of loans that share similar risk characteristics. If the loan does not share risk characteristics with other loans, the Company will evaluate the allowance on an individual basis. The Company evaluates the segmentation at least annually to determine whether loans continue to share similar risk characteristics. Loans are charged off against the allowance when the Company believes the loan balances become uncollectible. Expected recoveries do not exceed the aggregate of amounts previously charged off or expected to be charged off.
The Company has chosen to segment its portfolio consistent with the manner in which it manages the risk of the type of credit. The Company’s segments for loans include multi-family, commercial real estate, commercial and industrial, construction, residential and consumer.
The Company calculates estimated credit loss on its loan portfolio primarily using quantitative methodologies that consider a variety of factors such as historical loss experience, loan characteristics, the current credit quality of the portfolio as well as an economic outlook over the life of the loan. The expected credit losses are the product of multiplying the Company’s estimates of probability of default (PD), loss given default (LGD) and individual loan level exposure at default on an undiscounted basis. For a small portion of the loan portfolio, i.e. unsecured consumer loans, small business loans and loans to individuals, the Company utilizes a loss rate method to calculate the expected credit loss of that asset segment.
Included in the Company’s framework for estimating credit losses, the Company incorporates forward-looking information through the use of macroeconomic scenarios applied over a two-year reasonable and supportable forecast period, after which, the Company reverts to average historical losses on a straight line basis over a two-year period. These macroeconomic scenarios include variables that have historically been key drivers of increases and decreases in credit losses and include, but are not limited to, unemployment rates, real estate prices, gross domestic product levels, corporate bond spreads and long-term interest rate forecasts. The Company evaluates the use of multiple economic scenarios and the weighting
82
of those scenarios on a quarterly basis. The scenarios that are chosen and the amount of weighting given to each scenario consider a variety of factors including third party economists and firms, industry trends and other available published economic information.
Expected credit losses are estimated over the contractual term of each loan taking into consideration expected prepayments which are developed using industry standard estimation techniques. The contractual term excludes expected extensions, renewals, and modifications unless either of the following applies: management has a reasonable expectation at the reporting date that a troubled debt restructuring will be executed with an individual borrower or the extension or renewal options are included in the original or modified contract at the reporting date and are not unconditionally cancelable by the Company.
Also included in the allowance for loans are qualitative reserves to cover losses that are expected but, in the Company’s assessment, may not be adequately represented in the quantitative method or the economic assumptions described above. For example, factors that the Company considers include changes in lending policies and procedures, business conditions, the nature and size of the portfolio, portfolio concentrations, the volume and severity of past due loans and non-accrual loans, the effect of external factors such as competition, and the legal and regulatory requirements, among others.
Individually evaluated. On a case-by-case basis, the Company may conclude a loan should be evaluated on an individual basis based on its disparate risk characteristics. The Company individually evaluates loans that meet the following criteria for expected credit loss, as the Company has determined that these loans generally do not share similar risk characteristics with other loans in the portfolio:
•Commercial loans with an outstanding balance greater than $1.0 million and on non-accrual status;
•Troubled debt restructured loans; and
•Other commercial loans with greater than $1.0 million in outstanding principal, if management has specific information that it is probable they will not collect all principal amounts due under the contractual terms of the loan agreement.
When the Company determines that the loan no longer shares similar risk characteristics of other loans in the portfolio, the allowance will be determined on an individual basis using the present value of expected cash flows or, for collateral-dependent loans, the fair value of the collateral as of the reporting date, less estimated selling costs, as applicable, to ensure that the credit loss is not delayed until actual loss. If the fair value of the collateral is less than the amortized cost basis of the loan, the Company will charge off the difference between the fair value of the collateral, less costs to sell at the reporting date and the amortized cost basis of the loan.
In determining the fair value for collateral-dependent loans, the Company reviews whether there has been an adverse change in the collateral value supporting the loan. As a substantial amount of the Company’s loan portfolio is collateralized by real estate, appraisals of the underlying value of property are used. The Company utilizes information from its commercial lending officers and its credit department and special assets department’s knowledge of changes in real estate conditions to identify if possible deterioration has occurred. Based on the severity of the changes in market conditions, management determines if an updated appraisal is warranted or if downward adjustments to the previous appraisal are warranted.
For residential mortgage loans, the Company’s policy is to obtain an appraisal upon the origination of the loan and an updated appraisal in the event a loan becomes 90 days delinquent. Thereafter, the appraisal is updated every two years if the loan remains in non-performing status and the foreclosure process has not been completed. Management adjusts the appraised value of residential loans to reflect estimated selling costs and declines in the real estate market.
Management believes the potential risk for outdated appraisals has been mitigated due to the fact that the loans are individually assessed to determine that the loan’s carrying value is not in excess of the fair value of the collateral. Loans are generally charged off after an analysis is completed which indicates that collectability of the full principal balance is in doubt.
Acquired assets. Subsequent to the adoption of CECL, acquired assets are included in the Company's calculation of the allowance for credit losses. How the allowance on an acquired asset is recorded depends on whether it has been classified as a Purchased Financial Asset with Credit Deterioration (“PCD”). PCD assets are assets acquired at a discount that is due, in part, to credit quality. PCD assets are accounted for in accordance with ASC Subtopic 326-20 and are initially recorded at fair value as determined by the sum of the present value of expected future cash flows and an allowance for credit losses at acquisition. The allowance for PCD assets is recorded through a gross-up effect, while the allowance for acquired non-PCD assets such as loans is recorded through provision expense, consistent with originated loans. Thus, the determination of which assets are PCD and non-PCD can have a significant effect on the accounting for these assets.
83
Subsequent to acquisition, the allowance for PCD loans will generally follow the same estimation, provision and charge-off process as non-PCD acquired and originated loans. Additionally, TDR identification for acquired loans (PCD and non-PCD) will be consistent with the TDR identification for originated loans.
Allowance for Credit Losses on Debt Securities
Management measures expected credit losses on held-to-maturity debt securities on a collective basis by major security type. Management classifies the held-to-maturity portfolio into the following major security types: mortgage-backed residential securities, municipal bonds, trust preferred securities (“TruPS”) and other. Nearly all of the mortgage-backed securities in the Company's portfolio are issued by U.S. government agencies and are either explicitly or implicitly guaranteed by the U.S government, are highly rated by major rating agencies and have a long history of no credit losses and therefore the expectation of non-payment is zero. Other securities consist primarily of investments in pooled trust preferred securities.
At each reporting period, the Company evaluates whether the securities in a segment continue to exhibit similar risk characteristics as the other securities in the segment. If the risk characteristics of a security change, such that they are no longer similar to other securities in the segment, the Company will evaluate the security with a different segment that shares more similar risk characteristics.
In estimating the net amount expected to be collected for mortgage-backed residential securities and municipal bonds, a range of historical losses method is utilized. In estimating the net amount expected to be collected for TruPS, the Company employs a single scenario forecast methodology. The scenario is informed by historical industry default data as well as current and near term operating conditions for the banks and other financial institutions that are the underlying issuers. In addition, expected prepayments are included in the analysis of the individually assessed TruPS applied at the collateral level.
Allowance for Credit Losses on Off-Balance Sheet Credit Exposures
The Company is required to include the unfunded commitment that is expected to be funded in the future within the allowance calculation. The Company participates in lending that results in an off-balance sheet unfunded commitment balance. The Company currently underwrites funding commitments with conditionally cancelable language. To determine the expected funding balance remaining, the Company uses a historical utilization rate for each of the segments to calculate the expected commitment balance. The reserve percentage for each respective loan portfolio is applied to the remaining unused portion of the expected commitment balance and the expected funded commitment in determining the allowance for credit loss on off-balance sheet credit exposures.
Loans Held-for-Sale
Loans held-for-sale are carried at the lower of cost or estimated fair value. Net unrealized losses, if any, are recognized in a valuation allowance through charges to earnings. Premiums and discounts and origination fees and costs on loans held-for-sale are deferred and recognized as a component of the gain or loss on sale. Gains and losses on sales of loans held-for-sale are recognized on settlement dates and are determined by the difference between the sale proceeds and the carrying value of the loans. These transactions are accounted for as sales based on our satisfaction of the criteria for such accounting which provide that, as transferor, we have surrendered control over the loans.
Stock in the Federal Home Loan Bank
The Bank, as a member of the Federal Home Loan Bank of New York (“FHLB”), is required to hold shares of capital stock of the FHLB based on our activities, primarily our outstanding borrowings, with the FHLB. The stock is carried at cost, less any impairment.
Office Properties and Equipment, Net
Land is carried at cost. Office buildings, leasehold improvements and furniture, fixtures and equipment are carried at cost, less accumulated depreciation and amortization. Office buildings and furniture, fixtures and equipment are depreciated using the straight-line method over the estimated useful lives of the respective assets. Leasehold improvements are amortized using the straight-line method over the terms of the respective leases or the lives of the assets, whichever is shorter.
Right-of-Use Assets
The determination of the presence of a lease in a contract is performed at the inception date. At the lease commencement date, the Company recognizes a right-of-use asset and a related lease liability for leases with an original term longer than twelve months. Right-of-use assets represent the Corporation’s right to use an underlying asset for the lease term, and lease liabilities represent the obligation to make lease payments arising from the lease initially measured at the present value of future lease payments. The Company has operating leases for corporate offices, branch locations and certain
84
Intangible Assets
Goodwill. Goodwill is presumed to have an indefinite useful life and is tested, at least annually, for impairment at the reporting unit level. Impairment exists when the carrying amount of goodwill exceeds its implied fair value. For purposes of our goodwill impairment testing, we have identified the Bank as a single reporting unit.
At December 31, 2020, the carrying amount of our goodwill totaled $94.5 million. In connection with our annual impairment assessment we performed a qualitative assessment of goodwill to determine whether it is more likely than not that a reporting unit’s fair value is less than its carrying amount. For the year ended December 31, 2020, the Company’s qualitative assessment concluded that it was not more likely than not that the fair value of the reporting unit is less than its carrying amount.
Mortgage Servicing Rights. The Company recognizes as separate assets the rights to service mortgage loans. The right to service loans for others is generally obtained through the sale of loans with servicing retained. The initial asset recognized for originated mortgage servicing rights (“MSR”) is measured at fair value. The estimated fair value of MSR is obtained through independent third party valuations through an analysis of future cash flows, incorporating assumptions market participants would use in determining fair value including market discount rates, prepayment speeds, servicing income, servicing costs, default rates and other market driven data, including the market’s perception of future interest rate movements. MSR are amortized in proportion to and over the period of estimated net servicing income. We apply the amortization method for measurements of our MSR. MSR are assessed for impairment based on fair value at each reporting date. MSR impairment, if any, is recognized in a valuation allowance through charges to earnings as a component of fees and service charges. Subsequent increases in the fair value of impaired MSR are recognized only up to the amount of the previously recognized valuation allowance. Fees earned for servicing loans are reported as income when the related mortgage loan payments are collected.
Other Real Estate Owned and Other Repossessed Assets
Properties and other assets acquired through foreclosure, deed in lieu of foreclosure or repossession are carried at estimated fair value, less estimated selling costs. The estimated fair value of real estate property and other repossessed assets is generally based on independent appraisals. When an asset is acquired, the excess of the loan balance over fair value, less estimated selling costs, is charged to the allowance for loan losses. Thereafter, decreases in the properties’ estimated fair value are charged to income along with any additional property maintenance and protection expenses incurred in owning the properties.
85
Income Taxes
The Company records income taxes in accordance with ASC 740, “Income Taxes,” as amended, using the asset and liability method. Accordingly, deferred tax assets and liabilities: (i) are recognized for the expected future tax consequences of events that have been recognized in the financial statements or tax returns; (ii) are attributable to differences between the financial statement carrying amounts of existing assets and liabilities and their respective tax bases; and (iii) are measured using enacted tax rates expected to apply in the years when those temporary differences are expected to be recovered or settled. The ultimate realization of the deferred tax asset is dependent upon the generation of future taxable income during the periods in which those temporary differences and carryforwards became deductible. Where applicable, deferred tax assets are reduced by a valuation allowance for any portions determined not likely to be realized. The effect on deferred tax assets and liabilities of a change in tax rates is recognized in income tax expense in the period of enactment. The valuation allowance is adjusted, by a charge or credit to income tax expense, as changes in facts and circumstances warrant. The Company recognizes accrued interest and penalties related to unrecognized tax benefits, where applicable, in income tax expense.
Share Based Compensation
The Company maintains an equity incentive plan under which restricted stock and stock options may be granted to employees and directors.
The Company recognizes the cost of employee services received in exchange for awards of equity instruments based on the grant-date fair value of those awards in accordance with ASC 718, “Compensation-Stock Compensation”. The Company estimates the per share fair value of option grants on the date of grant using the Black-Scholes option pricing model using assumptions for the expected dividend yield, expected stock price volatility, risk-free interest rate and expected option term. These assumptions are subjective in nature, involve uncertainties and, therefore, cannot be determined with precision. The Black-Scholes option pricing model also contains certain inherent limitations when applied to options that are not traded on public markets.
The per share fair value of options is highly sensitive to changes in assumptions. In general, the per share fair value of options will move in the same direction as changes in the expected stock price volatility, risk-free interest rate and expected option term, and in the opposite direction as changes in the expected dividend yield. For example, the per share fair value of options will generally increase as expected stock price volatility increases, risk-free interest rate increases, expected option term increases and expected dividend yield decreases. The use of different assumptions or different option pricing models could result in materially different per share fair values of options.
Earnings Per Share
Basic earnings per common share, or EPS, are computed by dividing net income by the weighted-average common shares outstanding during the year. The weighted-average common shares outstanding includes the weighted-average number of shares of common stock outstanding less the weighted average number of unvested shares of restricted stock and unallocated shares held by the ESOP. For EPS calculations, ESOP shares that have been committed to be released are considered outstanding. ESOP shares that have not been committed to be released are excluded from outstanding shares on a weighted average basis for EPS calculations.
Diluted EPS is computed using the same method as basic EPS, but includes the effect of all potentially dilutive common shares that were outstanding during the period, such as unexercised stock options and unvested shares of restricted stock, calculated using the treasury stock method. When applying the treasury stock method, we add: (1) the assumed proceeds from option exercises and (2) the average unamortized compensation costs related to unvested shares of restricted stock and stock options. We then divide this sum by our average stock price to calculate shares repurchased. The excess of the number of shares issuable over the number of shares assumed to be repurchased is added to basic weighted average common shares to calculate diluted EPS.
Derivative Financial Instruments
As required by ASC 815, the Company records all derivatives on the balance sheet at fair value. The accounting for changes in the fair value of derivatives depends on the intended use of the derivative, whether the Company has elected to designate a derivative in a hedging relationship and apply hedge accounting and whether the hedging relationship has satisfied the criteria necessary to apply hedge accounting. Derivatives designated and qualifying as a hedge of the exposure to changes in the fair value of an asset, liability, or firm commitment attributable to a particular risk, such as interest rate risk, are considered fair value hedges. Derivatives designated and qualifying as a hedge of the exposure to variability in expected future cash flows, or other types of forecasted transactions, are considered cash flow hedges. Hedge accounting generally provides for the matching of the timing of gain or loss recognition on the hedging instrument with the recognition of the changes in the fair
86
2. Stock Transactions
Stock Repurchase Programs
On October 25, 2018, the Company announced its fourth share repurchase program, which authorized the purchase of 10 % of its publicly-held outstanding shares of common stock, or 28,886,780 shares. The fourth program commenced immediately upon completion of the third program on December 10, 2018. This program has no expiration date and has 12,625,202 shares yet to be repurchased as of December 31, 2020.
During the year ended December 31, 2020, the Company purchased 2,377,814 shares at a cost of $23.9 million, or approximately $10.06 per share. During the year ended December 31, 2019, the Company purchased 39,365,145 shares at a cost of $475.9 million, or approximately $12.09 per share. During December 2019, we entered into a purchase and sale agreement with Blue Harbour Group, L.P. (“Blue Harbour”), pursuant to which we purchased from Blue Harbour the 27,318,628 shares of our common stock beneficially owned by Blue Harbour, at a purchase price of $12.29 per share, representing aggregate consideration of approximately $335.7 million. This share repurchase was outside of, and did not count toward, our existing share repurchase program. During the year ended December 31, 2018, the Company purchased 20,380,355 shares at a cost of $258.2 million, or approximately $12.67 per share.
For the years ended December 31, 2020, 2019 and 2018, shares repurchased include 395,222 , 387,477 and 395,233 shares, respectively, purchased in connection with the vesting of shares of restricted stock under our 2015 Equity Incentive Plan and the withholding of shares to pay income taxes. These shares are repurchased pursuant to the terms of the 2015 Equity Incentive Plan and therefore are not part of the Company’s repurchase program.
Cash Dividends
Dividends paid for the years ended December 31, 2020, 2019 and 2018 were $0.48 , $0.44 and $0.38 , resulting in dividend payout ratios of 51 %, 59 % and 53 %, respectively.
3. Business Combinations
Berkshire Bank
On December 2, 2020, Investors Bancorp announced the signing of a definitive purchase and assumption agreement under which Investors Bancorp’s wholly-owned subsidiary, Investors Bank, will acquire the eight New Jersey and eastern Pennsylvania branches of Berkshire Bank, the wholly-owned subsidiary of Berkshire Hills Bancorp, including the assumption and acquisition of approximately $639 million of deposits and $308 million of consumer and commercial loans. Completion of the transaction is awaiting receipt of all regulatory approvals. The transaction is not reflected in the Consolidated Financial Statements as of December 31, 2020.
Gold Coast Bancorp
As of the close of business on April 3, 2020, the Company completed its acquisition of Gold Coast Bancorp (“Gold Coast”) pursuant to the Agreement and Plan of Merger, dated as of July 24, 2019 by and between the Company and Gold Coast. As a result of the completion of the acquisition, the Company issued approximately 2.8 million shares to the former stockholders of Gold Coast and paid approximately $31.0 million in cash to the former stockholders of Gold Coast. Under the terms of the merger agreement, 50 % of the common shares of Gold Coast were converted into Investors Bancorp common stock and the remaining 50 % was exchanged for cash. For each share of Gold Coast Bancorp common stock, Gold Coast shareholders were given an option to receive either (i) 1.422 shares of Investors Bancorp common stock, $0.01 par value per share, (ii) a cash payment of $15.75 , or (iii) a combination of Investors Bancorp common stock and cash. The foregoing was subject to proration to ensure that, in the aggregate, 50 % of Gold Coast’s shares would be converted into Investors Bancorp common stock.
The acquisition was accounted for under the acquisition method of accounting as prescribed by Financial Accounting Standards Board (“FASB”) Accounting Standards Codification (“ASC”) 805 “Business Combinations”, as amended. Under this method of accounting, the purchase price has been allocated to the respective assets acquired based on their estimated fair values, net of applicable income tax effects. The excess cost over fair value of assets acquired, or $12.0 million, has been recorded as goodwill.
87
The acquired portfolio was fair valued on the date of acquisition based on guidance from ASC 820-10 which defines fair value as the price that would be received to sell an asset or transfer a liability in an orderly transaction between market participants at the measurement date. The valuation methods utilized took into consideration adjustments for interest rate risk, funding cost, servicing cost, residual risk, credit and liquidity risk.
The following table summarizes the estimated fair values of the assets acquired and liabilities assumed at the date of acquisition for Gold Coast, net of cash consideration paid:
| At April 3, 2020 | |||||
| (In millions) | |||||
| Cash and cash equivalents | $ | ||||
| Debt securities available-for-sale | |||||
| Debt securities held to maturity | |||||
| Loans receivable, net | |||||
| Accrued interest receivable | |||||
| Right-of-use assets | |||||
| Net deferred tax asset | |||||
| Intangible assets | |||||
| Other assets | |||||
| Total assets acquired | |||||
| Deposits | |||||
| Borrowed funds | |||||
| Other liabilities | |||||
| Total liabilities assumed | |||||
| Net assets acquired | $ | ||||
As the Company finalizes its analysis of these assets, there may be adjustments to the recorded carrying values. Any adjustments to carrying values will be recorded in goodwill. The calculation of goodwill is subject to change for up to one year after closing date of the transaction as additional information relative to closing date estimates and uncertainties becomes available. As of December 31, 2020, there has been no change to the amount of goodwill recorded for this acquisition.
Financial assets acquired in a business combination after January 1, 2020 are recorded in accordance with ASC Topic 326, after which acquired assets are separated into two types. PCD assets are acquired assets that, as of the acquisition date, have experienced a more-than-insignificant deterioration in credit quality since origination. Non-PCD assets are acquired assets that have experienced no, or insignificant, deterioration in credit quality since origination. To distinguish between the two types of acquired assets, the Company evaluates risk characteristics that have been determined to be indicators of deteriorated credit quality. In the case of loans, the determining criteria may involve general characteristics, such as loan payment history or changes in creditworthiness since the loan was originated, while others are relevant to recent economic conditions, such as borrowers in industries impacted by the pandemic.
In its acquisition of Gold Coast, the Company has purchased loans which have been determined to be PCD. The carrying amount of those loans was as follows:
| At April 3, 2020 | |||||
| (In millions) | |||||
| Purchase price of loans at acquisition | $ | ||||
| Allowance for credit losses at acquisition | |||||
| Non-credit discount at acquisition | |||||
| Par value of acquired loans at acquisition | $ | ||||
88
Fair Value Measurement of Assets Acquired and Liabilities Assumed
Described below are the methods used to determine the fair values of the significant assets acquired and liabilities assumed in the Gold Coast acquisition based on guidance from ASC 820-10 which defines fair value as the price that would be received to sell an asset or transfer a liability in an orderly transaction between market participants at the measurement date.
Securities. The securities acquired are bought and sold in active markets. The estimated fair values of securities were calculated using external third party broker opinions of the market values. Due to the instability of the market at the time of acquisition as well as the odd lot position sizes of the securities, the Company reviewed the data and assumptions used in pricing the securities by third-parties and made qualitative adjustments to reflect the then current market conditions and the characteristics of each position.
Loans. The estimated fair values of the loan portfolio generally consider adjustments for interest rate risk, required funding costs, servicing costs, prepayments, credit and liquidity. Level 3 inputs were utilized to determine the fair value of the acquired loan portfolio and included the use of present value techniques employing cash flow estimates and incorporated assumptions that market participants would use in estimating fair values. In instances where reliable market information was not available, the Company used its own assumptions in an effort to determine fair value. The primary approach to determining the fair value of the loan portfolio was a discounted cash flow methodology that considered factors including the type of loan, underlying collateral, classification status or grade, interest rate structure (fixed or variable interest rate), and remaining term. For the non-credit component, loans were grouped together according to similar characteristics when applying the various valuations techniques. For the credit component, loans were also grouped based on whether they had more than insignificant deterioration in credit since origination (purchase credit deteriorated “PCD” as defined by ASC 326-20). The expected life of loan loss estimates were calculated based on an annual loss rate developed by using the historical annual average charge-off percentages for New York institutions as a proxy for how a market participant acquirer would value the portfolio. Additionally, a qualitative credit adjustment was applied to the historical annual loss rates, due to COVID-19 and the uncertainty of future losses.
Deposits / Core Deposit Intangible. The core deposit intangible represents the value assigned to the stable and below market rate funding sources within the acquired deposit base; typically demand deposits, interest checking, money market and savings accounts. The core deposit intangible value represents the value of the relationships with deposit customers as a below market rate funding source. The fair value was based on a discounted cash flow methodology that gave appropriate consideration to expected deposit attrition rates, net maintenance costs of the deposit base, projected interest costs and alternative funding costs. Certificates of deposit (time deposits) are not considered to be core deposits as they typically are less stable and generally do not have an “all-in” favorable funding advantage to alternative funding costs. The fair value of certificates of deposit represents the present value of the certificates’ expected contractual payments discounted by market rates for similar certificates and is determined utilizing Level 2 inputs.
Borrowed Funds. A discounted cash flow approach was used to determine the fair value of the debt acquired. The fair value of the liability represents the present value of the expected payments discounted using a risk adjusted discount rate. The discount rate was developed based on comparable rated securities, as that backed by companies with similar credit ratings as the Company.
Equipment Finance Portfolio
On February 2, 2018, the Company completed the acquisition of a $345.8 million equipment finance portfolio. The acquisition included a seven -person team of financing professionals to lead the Company’s Equipment Finance Group. This group is part of the Company’s commercial lending group and the loan and lease balances are included within our commercial and industrial loan portfolio. The purchase price of $340.2 million was paid using available cash.
The acquisition was accounted for under the acquisition method of accounting as prescribed by FASB ASC 805 “Business Combinations”, as amended. Under this method of accounting, the purchase price has been allocated to the respective assets acquired based on their estimated fair values, net of applicable income tax effects. The excess cost over fair value of assets acquired, or $5.0 million, has been recorded as goodwill.
The acquired portfolio was fair valued on the date of acquisition based on guidance from ASC 820-10 which defines fair value as the price that would be received to sell an asset or transfer a liability in an orderly transaction between market participants at the measurement date. The valuation methods utilized took into consideration adjustments for interest rate risk, funding cost, servicing cost, residual risk, credit and liquidity risk. The accounting for the acquisition of the equipment finance portfolio is complete and is reflected in our Consolidated Financial Statements.
89
4. Securities
Equity Securities
Equity securities are reported at fair value on the Company’s Consolidated Balance Sheets. The Company’s portfolio of equity securities had an estimated fair value of $36.0 million and $6.0 million as of December 31, 2020 and December 31, 2019, respectively. Realized gains and losses from sales of equity securities, as well as changes in fair value of equity securities still held at the reporting date are recognized in the Consolidated Statements of Income.
The following table presents the disaggregated net gains on equity securities reported in the Consolidated Statements of Income:
| For the Year Ended December 31, | |||||||||||||||||
| 2020 | 2019 | 2018 | |||||||||||||||
| (In thousands) | |||||||||||||||||
| Net gains recognized on equity securities | $ | ||||||||||||||||
| Less: Net gains recognized on equity securities sold | |||||||||||||||||
| Unrealized gains recognized on equity securities | $ | ||||||||||||||||
Debt Securities
The following tables present the carrying value, gross unrealized gains and losses, and estimated fair value for available-for-sale debt securities and the amortized cost, net unrealized losses, carrying value, gross unrecognized gains and losses, estimated fair value and allowance for credit losses for held-to-maturity debt securities as of the dates indicated.
| At December 31, 2020 | |||||||||||||||||||||||
| Carrying value | Gross unrealized gains | Gross unrealized losses | Estimated fair value | ||||||||||||||||||||
| (In thousands) | |||||||||||||||||||||||
| Available-for-sale: | |||||||||||||||||||||||
| Debt securities: | |||||||||||||||||||||||
| Government-sponsored enterprises | $ | ||||||||||||||||||||||
| Mortgage-backed securities: | |||||||||||||||||||||||
| Federal Home Loan Mortgage Corporation | |||||||||||||||||||||||
| Federal National Mortgage Association | |||||||||||||||||||||||
| Government National Mortgage Association | |||||||||||||||||||||||
| Total mortgage-backed securities available-for-sale | |||||||||||||||||||||||
| Total debt securities available-for-sale | $ | ||||||||||||||||||||||
90
| At December 31, 2020 | |||||||||||||||||||||||||||||||||||
| Amortized cost | Net unrealized losses (1) | Carrying value | Gross unrecognized gains (2) | Gross unrecognized losses (2) | Estimated fair value | ||||||||||||||||||||||||||||||
| (In thousands) | |||||||||||||||||||||||||||||||||||
| Held-to-maturity: | |||||||||||||||||||||||||||||||||||
| Debt securities: | |||||||||||||||||||||||||||||||||||
| Government-sponsored enterprises | $ | ||||||||||||||||||||||||||||||||||
| Municipal bonds | |||||||||||||||||||||||||||||||||||
| Corporate and other debt securities | |||||||||||||||||||||||||||||||||||
| Total debt securities held-to-maturity | |||||||||||||||||||||||||||||||||||
| Mortgage-backed securities: | |||||||||||||||||||||||||||||||||||
| Federal Home Loan Mortgage Corporation | |||||||||||||||||||||||||||||||||||
| Federal National Mortgage Association | |||||||||||||||||||||||||||||||||||
| Government National Mortgage Association | |||||||||||||||||||||||||||||||||||
| Total mortgage-backed securities held-to-maturity | |||||||||||||||||||||||||||||||||||
| Total debt securities held-to-maturity | $ | ||||||||||||||||||||||||||||||||||
| Allowance for credit losses | |||||||||||||||||||||||||||||||||||
| Total debt securities held-to-maturity, net of allowance for credit losses | |||||||||||||||||||||||||||||||||||
(1) Net unrealized losses of held-to-maturity corporate and other debt securities represent the other than temporary impairment related to other non-credit factors recorded prior to January 1, 2020 that is being amortized through accumulated other comprehensive income over the remaining life of the securities. For mortgage-backed securities, it represents the net loss on previously designated available-for sale debt securities transferred to held-to-maturity at fair value and is being amortized through accumulated other comprehensive income over the remaining life of the securities.
(2) Unrecognized gains and losses of held-to-maturity debt securities are not reflected in the financial statements, as they represent fair value fluctuations from the later of: (i) the date a security is designated as held-to-maturity; or (ii) the date that an other than temporary impairment charge is recognized on a held-to-maturity security, through the date of the balance sheet. Effective January 1, 2020, held-to-maturity debt securities are evaluated for credit losses to determine if an allowance is necessary. Any allowance required is recorded through the provision for credit losses.
| At December 31, 2019 | |||||||||||||||||||||||
| Carrying value | Gross unrealized gains | Gross unrealized losses | Estimated fair value | ||||||||||||||||||||
| (In thousands) | |||||||||||||||||||||||
| Available-for-sale: | |||||||||||||||||||||||
| Mortgage-backed securities: | |||||||||||||||||||||||
| Federal Home Loan Mortgage Corporation | $ | ||||||||||||||||||||||
| Federal National Mortgage Association | |||||||||||||||||||||||
| Government National Mortgage Association | |||||||||||||||||||||||
| Total debt securities available-for-sale | $ | ||||||||||||||||||||||
91
| At December 31, 2019 | |||||||||||||||||||||||||||||||||||
| Amortized cost | Net unrealized losses (1) | Carrying Value | Gross unrecognized gains (2) | Gross unrecognized losses (2) | Estimated fair value | ||||||||||||||||||||||||||||||
| (In thousands) | |||||||||||||||||||||||||||||||||||
| Held-to-maturity: | |||||||||||||||||||||||||||||||||||
| Debt securities: | |||||||||||||||||||||||||||||||||||
| Government-sponsored enterprises | $ | ||||||||||||||||||||||||||||||||||
| Municipal bonds | |||||||||||||||||||||||||||||||||||
| Corporate and other debt securities | |||||||||||||||||||||||||||||||||||
| Total debt securities held-to-maturity | |||||||||||||||||||||||||||||||||||
| Mortgage-backed securities: | |||||||||||||||||||||||||||||||||||
| Federal Home Loan Mortgage Corporation | |||||||||||||||||||||||||||||||||||
| Federal National Mortgage Association | |||||||||||||||||||||||||||||||||||
| Government National Mortgage Association | |||||||||||||||||||||||||||||||||||
| Total mortgage-backed securities held-to-maturity | |||||||||||||||||||||||||||||||||||
| Total held-to-maturity securities | $ | ||||||||||||||||||||||||||||||||||
(1) Net unrealized losses of held-to-maturity corporate and other debt securities represent the other than temporary impairment related to other non-credit factors recorded prior to January 1, 2020 that is being amortized through accumulated other comprehensive income over the remaining life of the securities. For mortgage-backed securities, it represents the net loss on previously designated available-for sale debt securities transferred to held-to-maturity at fair value and is being amortized through accumulated other comprehensive income over the remaining life of the securities.
Gross unrealized losses on debt securities and the estimated fair value of the related securities, aggregated by investment category and length of time that individual securities have been in a continuous unrealized loss position at December 31, 2020 and December 31, 2019, were as follows:
| December 31, 2020 | |||||||||||||||||||||||||||||||||||
| Less than 12 months | 12 months or more | Total | |||||||||||||||||||||||||||||||||
| Estimated fair value | Unrealized losses | Estimated fair value | Unrealized losses | Estimated fair value | Unrealized losses | ||||||||||||||||||||||||||||||
| (In thousands) | |||||||||||||||||||||||||||||||||||
| Available-for-sale: | |||||||||||||||||||||||||||||||||||
| Mortgage-backed securities: | |||||||||||||||||||||||||||||||||||
| Federal Home Loan Mortgage Corporation | $ | ||||||||||||||||||||||||||||||||||
| Federal National Mortgage Association | |||||||||||||||||||||||||||||||||||
| Government National Mortgage Association | |||||||||||||||||||||||||||||||||||
| Total debt securities available-for-sale | |||||||||||||||||||||||||||||||||||
| Held-to-maturity: | |||||||||||||||||||||||||||||||||||
| Debt securities: | |||||||||||||||||||||||||||||||||||
| Government-sponsored enterprises | |||||||||||||||||||||||||||||||||||
| Corporate and other debt securities | |||||||||||||||||||||||||||||||||||
| Total debt securities held-to-maturity | |||||||||||||||||||||||||||||||||||
| Mortgage-backed securities: | |||||||||||||||||||||||||||||||||||
| Federal Home Loan Mortgage Corporation | |||||||||||||||||||||||||||||||||||
| Total debt securities held-to-maturity | |||||||||||||||||||||||||||||||||||
| Total | $ | ||||||||||||||||||||||||||||||||||
92
| December 31, 2019 | |||||||||||||||||||||||||||||||||||
| Less than 12 months | 12 months or more | Total | |||||||||||||||||||||||||||||||||
| Estimated fair value | Unrealized losses | Estimated fair value | Unrealized losses | Estimated fair value | Unrealized losses | ||||||||||||||||||||||||||||||
| (In thousands) | |||||||||||||||||||||||||||||||||||
| Available-for-sale: | |||||||||||||||||||||||||||||||||||
| Mortgage-backed securities: | |||||||||||||||||||||||||||||||||||
| Federal Home Loan Mortgage Corporation | $ | ||||||||||||||||||||||||||||||||||
| Federal National Mortgage Association | |||||||||||||||||||||||||||||||||||
| Government National Mortgage Association | |||||||||||||||||||||||||||||||||||
| Total debt securities available-for-sale | |||||||||||||||||||||||||||||||||||
| Held-to-maturity: | |||||||||||||||||||||||||||||||||||
| Debt securities: | |||||||||||||||||||||||||||||||||||
| Government-sponsored enterprises | |||||||||||||||||||||||||||||||||||
| Municipal bonds | |||||||||||||||||||||||||||||||||||
| Total debt securities held-to-maturity | |||||||||||||||||||||||||||||||||||
| Mortgage-backed securities: | |||||||||||||||||||||||||||||||||||
| Federal Home Loan Mortgage Corporation | |||||||||||||||||||||||||||||||||||
| Federal National Mortgage Association | |||||||||||||||||||||||||||||||||||
| Total mortgage-backed securities held-to-maturity | |||||||||||||||||||||||||||||||||||
| Total debt securities held-to-maturity | |||||||||||||||||||||||||||||||||||
| Total | $ | ||||||||||||||||||||||||||||||||||
We conduct periodic reviews of individual securities to assess whether an allowance for credit loss is required. Held-to-maturity debt securities are evaluated for expected credit loss utilizing a historical loss methodology, or a discounted cash flows approach which is assessed against the book value of the investment security excluding accrued interest. Refer to Note 1, Summary of Significant Accounting Principles, for additional information. Available-for-sale debt securities are evaluated to determine if a decline in fair value below the amortized cost basis has resulted from a credit loss or other factors. An impairment related to credit factors would be recorded through an allowance for credit losses. The allowance is limited to the amount by which the security’s amortized cost basis exceeds the fair value. An impairment that has not been recorded through an allowance for credit losses shall be recorded through other comprehensive income, net of applicable taxes. Investment securities will be written down to fair value through the consolidated statement of income when management intends to sell (or may be required to sell) the securities before they recover in value.
The majority of our held-to-maturity debt securities portfolio is comprised of agency mortgage-backed securities. For agency (FNMA, FHLMC and GNMA) mortgage-backed securities, and other agency debt instruments, the expectation of non-payment is zero. The timely payment of principal and interest on FNMA and FHLMC securities is guaranteed by each corporation. As each of these corporations is in conservatorship with the federal government, the payment guarantees are considered implicit obligations of the US government. GNMA securities carry the full faith and credit guarantee of the federal government. Because of the existence of government guarantees of timely payment of principal and interest, expected losses on agency securities are assumed to be zero. Changes in the fair value of agency securities in this portfolio are primarily driven by changes in interest rates and other non-credit related factors. At December 31, 2020, our held-to-maturity debt securities portfolio had an allowance for credit losses of $3.3 million. The allowance is related to non-agency corporate and other debt securities. The majority of the allowance is related to a portfolio of collateralized debt obligations backed by pooled TruPS, principally issued by banks and to a lesser extent insurance companies and real estate investment trusts. At December 31, 2020 the TruPS had a carrying value before allowance for credit losses and estimated fair value of $50.1 million and $67.3 million, respectively. The Company does not have the intent to sell these securities and does not believe it is more likely than not that the Company will be required to sell these securities before a recovery of amortized cost. Refer to Note 6, Allowance for Credit Losses, for additional information on the Company’s allowance for credit losses.
At December 31, 2020, the available-for-sale debt securities portfolio was almost entirely comprised of agency securities. As such, the unrealized losses in this portfolio are primarily driven by changes in interest rates and other non-credit related factors. The Company does not have the intent to sell these securities and does not believe it is more likely than not that
93
the Company will be required to sell these securities before a recovery of amortized cost. At December 31, 2020, there is no allowance for credit losses related to the Company’s available-for-sale debt securities as the decline in fair value did not result from credit issues.
Debt securities with a carrying value before allowance for credit losses of $1.87 billion and an estimated fair value of $1.93 billion are pledged to secure borrowings and municipal deposits. The contractual maturities of the Bank’s mortgage-backed securities are generally less than 20 years with effective lives expected to be shorter due to prepayments. Expected maturities may differ from contractual maturities due to underlying loan prepayments or early call privileges of the issuer; therefore, mortgage-backed securities are not included in the following table. Excluding the allowance for credit losses, the amortized cost and estimated fair value of debt securities other than mortgage-backed securities at December 31, 2020, by contractual maturity, are shown below.
| December 31, 2020 | |||||||||||
| Carrying Value | Estimated fair value | ||||||||||
| (In thousands) | |||||||||||
| Due in one year or less | $ | ||||||||||
| Due after one year through five years | |||||||||||
| Due after five years through ten years | |||||||||||
| Due after ten years | |||||||||||
| Total | $ | ||||||||||
Gains and Losses
Gains and losses on the sale of all securities are determined using the specific identification method. For the year ended December 31, 2020, there were no sales of securities; however, the Company received proceeds of $16.5 million from the call of a held-to-maturity debt security which resulted in a gain of $124,000 and received a principal payment of $26,000 on a held-to-maturity debt security. The Company recognized net unrealized gains on equity securities of $256,000 for the year ended December 31, 2020.
For the year ended December 31, 2019, the Company received proceeds of $399.4 million on securities sold from the debt securities available-for-sale portfolio resulting in gross realized losses of $5.7 million recognized in non-interest income. Proceeds from the sale were reinvested in higher yielding debt securities. There were no sales of equity securities or debt securities held-to-maturity for the year ended December 31, 2019. The Company recognized net unrealized gains on equity securities of $150,000 for the year ended December 31, 2019.
For the year ended December 31, 2018, the Company received proceeds of $632.4 million on its lower yielding mortgage-backed securities sold from the debt securities available-for-sale portfolio resulting in gross realized losses of $32.8 million. Proceeds from the sale were reinvested in higher yielding debt securities. There were no sales of equity securities or debt securities held-to-maturity for the year ended December 31, 2018; however, the Company received proceeds of $7.3 million from the payoff and paydown of TruPS which resulted in $3.2 million of interest income from securities, as well as a gain of $1.2 million recognized as non-interest income. The Company recognized net unrealized gains on equity securities of $2,000 for the year ended December 31, 2018.
Other-Than-Temporary Impairment (“OTTI”)
Prior to January 1, 2020, under previous other-than-temporary impairment guidance, the Company conducted a quarterly review and evaluation of the securities portfolio to determine if the value of any security had declined below its cost or amortized cost, and whether such decline was other-than-temporary. If a determination was made that a debt security was other-than-temporarily impaired, the Company would estimate the amount of the unrealized loss that was attributable to credit and all other non-credit related factors. The credit related component would be recognized as an other-than-temporary impairment charge in non-interest income. The non-credit related component would be recorded as an adjustment to accumulated other comprehensive income (loss), net of tax.
With the assistance of a valuation specialist, the Company evaluated the credit and performance of each issuer underlying the Company’s pooled TruPS. Cash flows for each security were forecasted using assumptions for defaults, recoveries, pre-payments and amortization. At December 31, 2019 and 2018, the Company deemed that the present value of projected cash flows for each security was greater than the book value and did not recognize any additional OTTI charges for the years ended December 31, 2019 and 2018.
94
The following table presents the changes in the credit loss component of the impairment loss of debt securities that the Company has written down for such loss as an other-than-temporary impairment recognized in earnings.
| For the Years Ended December 31, | |||||||||||
| 2019 | 2018 | ||||||||||
| (In thousands) | |||||||||||
| Balance of credit related OTTI, beginning of period | $ | ||||||||||
| Reductions: | |||||||||||
| Accretion of credit loss impairment due to an increase in expected cash flows | ( | ( | |||||||||
| Reductions for securities sold or paid off during the period | ( | ||||||||||
| Balance of credit related OTTI, end of period | $ | ||||||||||
The credit loss component of the impairment loss represented the difference between the present value of expected future cash flows and the amortized cost basis of the securities prior to considering credit losses. The beginning balance represented the credit loss component for debt securities for which OTTI occurred prior to the period presented. If OTTI was recognized in earnings for credit impaired debt securities, it would have been presented as an addition based upon whether it was the first time a debt security was credit impaired (initial credit impairment) or was not the first time a debt security was credit impaired (subsequent credit impairments). The credit loss component was reduced if the Company sold, intended to sell or believed it would have been required to sell previously credit impaired debt securities. Additionally, the credit loss component was reduced if (i) the Company received cash flows in excess of what it expected to receive over the remaining life of the credit impaired debt security, (ii) the security matured or (iii) the security was fully written down.
5. Loans Receivable, Net
The Company adopted the CECL methodology for measuring credit losses as of January 1, 2020. All disclosures as of and for the year ended December 31, 2020 are presented in accordance with Topic 326. The Company did not recast comparative financial periods and has presented those disclosures under previously applicable GAAP. The detail of the loan portfolio as of December 31, 2020 and December 31, 2019 was as follows:
| December 31, 2020 | December 31, 2019 | ||||||||||
| (In thousands) | |||||||||||
| Multi-family loans | $ | ||||||||||
| Commercial real estate loans | |||||||||||
| Commercial and industrial loans | |||||||||||
| Construction loans | |||||||||||
| Total commercial loans | |||||||||||
| Residential mortgage loans | |||||||||||
| Consumer and other loans | |||||||||||
| Total loans | |||||||||||
| Deferred fees, premiums and accretable purchase accounting adjustments, net | ( | ||||||||||
Allowance for credit losses (1) | ( | ( | |||||||||
| Net loans | $ | ||||||||||
(1) Refer to Note 6, Allowance for Credit Losses, for further details.
Credit Quality Indicators
The Company has lending policies and procedures that provide target market, underwriting and other criteria for identified lending segments to codify the level of credit risk the Company is willing to accept. Approval authority levels are delegated to qualified individuals and approval bodies for the extension of credit within the guidance of these policies and procedures. In addition, the Company maintains an independent loan review department that reviews and validates risk assessment on a continual basis.
95
The Company assigns ratings to borrowers and transactions based on the assessment of a borrower’s ability to service their debt based on relevant information such as: current financial information, historical payment experience, credit documentation, public information and current economic trends, among other factors.
In connection with the adoption of Topic 326 on January 1, 2020, the Company implemented new risk rating models for borrowers and transactions within its commercial loan portfolio. The risk rating methodology transitioned to a dual risk rating framework which bifurcates ratings into probability of default (PD) and loss given default (LGD). Relevant risks are evaluated prior to approving a transaction to determine if the transaction is within the Company’s risk appetite and the appropriate rating. Strong credit analysis requires current, reliable financial information and documented assessment of the customer’s:
•ability to perform in accordance with the terms of the credit, including adherence to covenants;
•assets and liabilities, liquidity, net worth, and contingent and other off-balance sheet items;
•tax liabilities;
•cash reserves and ability to convert assets to cash;
•income statement and the sources, level, stability, and quality of earnings:
•projected performance, sensitized for stressed circumstances; and
•industry performance relative to peers and industry.
Each commercial credit facility is assigned a PD and LGD rating for the purpose of informing a credit decision, facilitating the determination of the expected level of credit loss and other portfolio management activities (as well as relationship profitability). The dual risk rating framework and risk rating methodologies allow for consistent determination of risk across the Commercial business as indicated by the risk rating assigned. The methodology used by the Bank applies the same criteria for identification of a credit as for the regulatory definitions of risk ratings:
Pass - “Pass” assets are well protected by the current net worth and paying capacity of the obligor (or guarantors, if any) or by the fair value, less cost to acquire and sell, of any underlying collateral in a timely manner.
Watch - A “Watch” asset has all the characteristics of a Pass asset but warrants more than the normal level of supervision. These loans may require more detailed reporting to management because some aspects of underwriting may not conform to policy or adverse events may have affected or could affect the cash flow or ability to continue operating profitably, provided, however, the events do not constitute an undue credit risk. Residential and consumer loans delinquent 30 -59 days are considered watch if not a troubled debt restructuring (“TDR”). In addition, any residential or consumer loan currently on deferment in accordance with the CARES Act or the interagency statement issued by bank regulatory agencies are considered watch.
Special Mention - A “Special Mention” asset has potential weaknesses that deserve management’s close attention. If left uncorrected, these potential weaknesses may result in deterioration of the repayment prospects for the asset or in the institution’s credit position at some future date. Special Mention assets are not adversely classified and do not expose an institution to sufficient risk to warrant adverse classification. Residential and consumer loans delinquent 60 -89 days are considered special mention if not a TDR.
Substandard - A “Substandard” asset is inadequately protected by the current worth and paying capacity of the obligor or by the collateral pledged, if any. Assets so classified must have a well-defined weakness, or weaknesses that jeopardize the liquidation of the debt. They are characterized by the distinct possibility that the institution will sustain some loss if the deficiencies are not corrected. Residential and consumer loans delinquent 90 days or greater as well as TDRs are considered substandard.
Doubtful - An asset classified “Doubtful” has all the weaknesses inherent in one classified substandard with the added characteristic that the weaknesses make collection or liquidation in full highly questionable and improbable on the basis of currently known facts, conditions, and values.
Loss - An asset or portion thereof, classified “Loss” is considered uncollectible and of such little value that its continuance on the institution’s books as an asset, without establishment of a specific valuation allowance or charge-off, is not warranted. This classification does not necessarily mean that an asset has no recovery or salvage value; but rather, there is much doubt about whether, how much, or when the recovery will occur. As such, it is not practical or desirable to defer the write-off.
96
The following table presents the risk category of loans as of December 31, 2020 by class of loan and vintage year:
| Term Loans by Origination Year | |||||||||||||||||||||||||||||||||||||||||||||||
| 2020 | 2019 | 2018 | 2017 | 2016 | Prior | Revolving Loans | Total | ||||||||||||||||||||||||||||||||||||||||
| (In thousands) | |||||||||||||||||||||||||||||||||||||||||||||||
| Multi-family | |||||||||||||||||||||||||||||||||||||||||||||||
| Pass | $ | ||||||||||||||||||||||||||||||||||||||||||||||
| Watch | |||||||||||||||||||||||||||||||||||||||||||||||
| Special mention | |||||||||||||||||||||||||||||||||||||||||||||||
| Substandard | |||||||||||||||||||||||||||||||||||||||||||||||
Total Multi-family | |||||||||||||||||||||||||||||||||||||||||||||||
| Commercial real estate | |||||||||||||||||||||||||||||||||||||||||||||||
| Pass | |||||||||||||||||||||||||||||||||||||||||||||||
| Watch | |||||||||||||||||||||||||||||||||||||||||||||||
| Special mention | |||||||||||||||||||||||||||||||||||||||||||||||
| Substandard | |||||||||||||||||||||||||||||||||||||||||||||||
Total Commercial real estate | |||||||||||||||||||||||||||||||||||||||||||||||
| Commercial and industrial | |||||||||||||||||||||||||||||||||||||||||||||||
| Pass | |||||||||||||||||||||||||||||||||||||||||||||||
| Watch | |||||||||||||||||||||||||||||||||||||||||||||||
| Special mention | |||||||||||||||||||||||||||||||||||||||||||||||
| Substandard | |||||||||||||||||||||||||||||||||||||||||||||||
| Total Commercial and industrial | |||||||||||||||||||||||||||||||||||||||||||||||
| Construction | |||||||||||||||||||||||||||||||||||||||||||||||
| Pass | |||||||||||||||||||||||||||||||||||||||||||||||
| Watch | |||||||||||||||||||||||||||||||||||||||||||||||
| Special mention | |||||||||||||||||||||||||||||||||||||||||||||||
| Substandard | |||||||||||||||||||||||||||||||||||||||||||||||
Total Construction | |||||||||||||||||||||||||||||||||||||||||||||||
| Residential mortgage | |||||||||||||||||||||||||||||||||||||||||||||||
| Pass | |||||||||||||||||||||||||||||||||||||||||||||||
| Watch | |||||||||||||||||||||||||||||||||||||||||||||||
| Special mention | |||||||||||||||||||||||||||||||||||||||||||||||
| Substandard | |||||||||||||||||||||||||||||||||||||||||||||||
Total residential mortgage | |||||||||||||||||||||||||||||||||||||||||||||||
| Consumer and other | |||||||||||||||||||||||||||||||||||||||||||||||
| Pass | |||||||||||||||||||||||||||||||||||||||||||||||
| Watch | |||||||||||||||||||||||||||||||||||||||||||||||
| Special mention | |||||||||||||||||||||||||||||||||||||||||||||||
| Substandard | |||||||||||||||||||||||||||||||||||||||||||||||
Total Consumer and other | |||||||||||||||||||||||||||||||||||||||||||||||
| Total | $ | ||||||||||||||||||||||||||||||||||||||||||||||
97
The following table presents the risk category of loans as of December 31, 2019 by class of loan:
| December 31, 2019 | |||||||||||||||||||||||||||||||||||||||||
| Pass | Watch | Special Mention | Substandard | Doubtful | Loss | Total | |||||||||||||||||||||||||||||||||||
| (In thousands) | |||||||||||||||||||||||||||||||||||||||||
| Commercial loans: | |||||||||||||||||||||||||||||||||||||||||
| Multi-family | $ | ||||||||||||||||||||||||||||||||||||||||
| Commercial real estate | |||||||||||||||||||||||||||||||||||||||||
| Commercial and industrial | |||||||||||||||||||||||||||||||||||||||||
| Construction | |||||||||||||||||||||||||||||||||||||||||
| Total commercial loans | |||||||||||||||||||||||||||||||||||||||||
| Residential mortgage | |||||||||||||||||||||||||||||||||||||||||
| Consumer and other | |||||||||||||||||||||||||||||||||||||||||
| Total | $ | ||||||||||||||||||||||||||||||||||||||||
Delinquent and Non-Accrual Loans
In the absence of other intervening factors, loans granted payment deferrals related to COVID-19 are not reported as past due or placed on non-accrual status provided the borrowers have met the criteria in the CARES Act or otherwise have met the criteria included in an interagency statement issued by bank regulatory agencies. See Note 1, Summary of Significant Accounting Principles.
The following tables present the payment status of the recorded investment in past due loans as of December 31, 2020 and December 31, 2019 by class of loans:
| December 31, 2020 | |||||||||||||||||||||||||||||||||||
| 30-59 Days | 60-89 Days | Greater than 90 Days | Total Past Due | Current | Total Loans Receivable | ||||||||||||||||||||||||||||||
| (In thousands) | |||||||||||||||||||||||||||||||||||
| Commercial loans: | |||||||||||||||||||||||||||||||||||
| Multi-family | $ | ||||||||||||||||||||||||||||||||||
| Commercial real estate | |||||||||||||||||||||||||||||||||||
| Commercial and industrial | |||||||||||||||||||||||||||||||||||
| Construction | |||||||||||||||||||||||||||||||||||
| Total commercial loans | |||||||||||||||||||||||||||||||||||
| Residential mortgage | |||||||||||||||||||||||||||||||||||
| Consumer and other | |||||||||||||||||||||||||||||||||||
| Total | $ | ||||||||||||||||||||||||||||||||||
98
| December 31, 2019 | |||||||||||||||||||||||||||||||||||
| 30-59 Days | 60-89 Days | Greater than 90 Days | Total Past Due | Current | Total Loans Receivable | ||||||||||||||||||||||||||||||
| (In thousands) | |||||||||||||||||||||||||||||||||||
| Commercial loans: | |||||||||||||||||||||||||||||||||||
| Multi-family | $ | ||||||||||||||||||||||||||||||||||
| Commercial real estate | |||||||||||||||||||||||||||||||||||
| Commercial and industrial | |||||||||||||||||||||||||||||||||||
| Construction | |||||||||||||||||||||||||||||||||||
| Total commercial loans | |||||||||||||||||||||||||||||||||||
| Residential mortgage | |||||||||||||||||||||||||||||||||||
| Consumer and other | |||||||||||||||||||||||||||||||||||
| Total | $ | ||||||||||||||||||||||||||||||||||
The following table presents non-accrual loans at the dates indicated:
| December 31, 2020 | December 31, 2019 | ||||||||||||||||||||||
| # of loans | Amount | # of loans | Amount | ||||||||||||||||||||
| (Dollars in thousands) | |||||||||||||||||||||||
| Non-accrual: | |||||||||||||||||||||||
| Multi-family | $ | $ | |||||||||||||||||||||
| Commercial real estate | |||||||||||||||||||||||
| Commercial and industrial | |||||||||||||||||||||||
| Construction | |||||||||||||||||||||||
| Total commercial loans | |||||||||||||||||||||||
| Residential mortgage and consumer | |||||||||||||||||||||||
| Total non-accrual loans | $ | $ | |||||||||||||||||||||
The Company recognized $1.4 million of interest income on non-accrual loans during the year ended December 31, 2020.
Individually Evaluated Loans
Loans which do not share common risk characteristics with other loans are individually evaluated as part of the process of calculating the allowance for credit losses. The evaluation is determined on an individual basis using the present value of expected cash flows or the fair value of the collateral as of the reporting date. When management determines that the fair value of collateral securing a collateral dependent loan inadequately covers the balance of net principal, the net principal balance is written down to the fair value of the collateral, net of estimated selling costs as applicable, rather than assigning an allowance. See Note 16, Fair Value Measurements, for information regarding the valuation process for collateral dependent loans.
99
The following table presents individually evaluated collateral-dependent loans by class of loans at the date indicated:
December 31, 2020 | |||||||||||||||||
| Real Estate | Other | Total | |||||||||||||||
| (Dollars in thousands) | |||||||||||||||||
| Multi-family | $ | ||||||||||||||||
| Commercial real estate | |||||||||||||||||
| Commercial and industrial | |||||||||||||||||
| Construction | |||||||||||||||||
| Total commercial loans | |||||||||||||||||
| Residential mortgage and consumer | |||||||||||||||||
| Total collateral-dependent loans | $ | ||||||||||||||||
Direct finance leases are stated as the sum of remaining minimum lease payments from lessees plus estimated residual values less unearned lease income. On an annual basis, the Company reviews the lease residuals and assets currently off-lease for potential impairment. For the year ended December 31, 2019, the Company recorded an impairment charge of $2.6 million as the fair value of certain equipment decreased at a rate greater than originally projected. An additional impairment charge of $2.2 million was recorded on the same equipment class during the year ended December 31, 2020 given the extended downturn in the market for these assets.
TDR Loans Included in Non-Accrual
Included in the non-accrual table above are TDR loans whose payment status is current but the Company has classified as non-accrual as the loans have not maintained their current payment status for six consecutive months under the restructured terms and therefore do not meet the criteria for accrual status. As of December 31, 2020 and December 31, 2019, these loans are comprised of the following:
| December 31, 2020 | December 31, 2019 | ||||||||||||||||||||||
| # of loans | Amount | # of loans | Amount | ||||||||||||||||||||
| (Dollars in thousands) | |||||||||||||||||||||||
| TDR with payment status current classified as non-accrual: | |||||||||||||||||||||||
| Commercial real estate | $ | $ | |||||||||||||||||||||
| Residential mortgage and consumer | |||||||||||||||||||||||
| Total TDR with payment status current classified as non-accrual | $ | $ | |||||||||||||||||||||
The following table presents TDR loans which were also 30 -89 days delinquent and classified as non-accrual at the dates indicated:
| December 31, 2020 | December 31, 2019 | ||||||||||||||||||||||
| # of loans | Amount | # of loans | Amount | ||||||||||||||||||||
| (Dollars in thousands) | |||||||||||||||||||||||
| TDR 30-89 days delinquent classified as non-accrual: | |||||||||||||||||||||||
| Commercial real estate | $ | $ | |||||||||||||||||||||
| Residential mortgage and consumer | |||||||||||||||||||||||
| Total TDR 30-89 days delinquent classified as non-accrual | $ | $ | |||||||||||||||||||||
The Company has no loans past due 90 days or more delinquent that are still accruing interest.
100
Troubled Debt Restructurings
On a case-by-case basis, the Company may agree to modify the contractual terms of a borrower’s loan to remain competitive and assist customers who may be experiencing financial difficulty, as well as preserve the Company’s position in the loan. If the borrower is experiencing financial difficulties and a concession has been made at the time of such modification, the loan is classified as a TDR.
Substantially all of our TDR loan modifications involve lowering the monthly payments on such loans through either a reduction in interest rate below a market rate, an extension of the term of the loan, or a combination of these two methods. These modifications rarely result in the forgiveness of principal or accrued interest. In addition, we frequently obtain additional collateral or guarantor support when modifying commercial loans. Restructured loans remain on non-accrual status until there has been a sustained period of repayment performance (generally six consecutive months of payments) and both principal and interest are deemed collectible.
Consistent with the CARES Act and interagency guidance which allows temporary relief for current borrowers affected by COVID-19, we are working with borrowers and granting certain modifications through programs related to COVID-19 relief. At December 31, 2020, loans with an aggregate outstanding balance of approximately $790.0 million have been granted modifications as a result of financial disruptions associated with the COVID-19 pandemic. Also, consistent with the CARES Act and the interagency guidelines, such modifications that met the criteria discussed in Note 1 are not included in our TDR totals and discussion below. For more information on the criteria for classifying loans as TDRs, see Note 1, Summary of Significant Accounting Principles - Loans Receivable, Net - Guidance on Non-TDR Loan Modifications due to COVID-19.
The following tables present the total TDR loans at December 31, 2020 and December 31, 2019:
| December 31, 2020 | |||||||||||||||||||||||||||||||||||
| Accrual | Non-accrual | Total | |||||||||||||||||||||||||||||||||
| # of loans | Amount | # of loans | Amount | # of loans | Amount | ||||||||||||||||||||||||||||||
| (Dollars in thousands) | |||||||||||||||||||||||||||||||||||
| Commercial loans: | |||||||||||||||||||||||||||||||||||
| Commercial real estate | $ | $ | $ | ||||||||||||||||||||||||||||||||
| Commercial and industrial | |||||||||||||||||||||||||||||||||||
| Total commercial loans | |||||||||||||||||||||||||||||||||||
| Residential mortgage and consumer | |||||||||||||||||||||||||||||||||||
| Total | $ | $ | $ | ||||||||||||||||||||||||||||||||
| December 31, 2019 | |||||||||||||||||||||||||||||||||||
| Accrual | Non-accrual | Total | |||||||||||||||||||||||||||||||||
| # of loans | Amount | # of loans | Amount | # of loans | Amount | ||||||||||||||||||||||||||||||
| (Dollars in thousands) | |||||||||||||||||||||||||||||||||||
| Commercial loans: | |||||||||||||||||||||||||||||||||||
| Commercial real estate | $ | $ | $ | ||||||||||||||||||||||||||||||||
| Commercial and industrial | |||||||||||||||||||||||||||||||||||
| Total commercial loans | |||||||||||||||||||||||||||||||||||
| Residential mortgage and consumer | |||||||||||||||||||||||||||||||||||
| Total | $ | $ | $ | ||||||||||||||||||||||||||||||||
101
The following tables present information about TDRs that occurred during the years ended December 31, 2020 and 2019:
| Years Ended December 31, | |||||||||||||||||||||||||||||||||||
| 2020 | 2019 | ||||||||||||||||||||||||||||||||||
| Number of Loans | Pre-modification Recorded Investment | Post- modification Recorded Investment | Number of Loans | Pre-modification Recorded Investment | Post- modification Recorded Investment | ||||||||||||||||||||||||||||||
| (Dollars in thousands) | |||||||||||||||||||||||||||||||||||
| Troubled Debt Restructurings: | |||||||||||||||||||||||||||||||||||
| Commercial real estate | $ | $ | $ | $ | |||||||||||||||||||||||||||||||
| Commercial and industrial | |||||||||||||||||||||||||||||||||||
| Residential mortgage and consumer | |||||||||||||||||||||||||||||||||||
Post-modification recorded investment represents the net book balance immediately following modification.
Collateral dependent loans classified as TDRs were written down to the estimated fair value of the collateral. There were $163,000 in charge-offs for a TDR of an unsecured commercial and industrial loan and $159,000 in charge offs for TDRs of collateral dependent residential loans during the year ended December 31, 2020. There were $729,000 in charge-offs for TDRs of unsecured commercial and industrial loans during the year ended December 31, 2019. The allowance for credit losses associated with the TDRs presented in the above tables totaled $1.4 million and $1.8 million at December 31, 2020 and 2019, respectively.
Loan modifications generally involve the reduction in loan interest rate and/or extension of loan maturity dates and also may include step up interest rates in their modified terms which will impact their weighted average yield in the future. Prior to 2020, all residential loans deemed to be TDRs were modified to reflect a reduction in interest rates to current market rates. Residential loans modified in 2020 and deemed to be TDRs were granted a payment deferral related to COVID-19 but did not meet the criteria to be excluded from TDR as described in Note 1, Summary of Significant Accounting Principles - Loans Receivable, Net - Guidance on Non-TDR Loan Modifications due to COVID-19. Three of the commercial loan modifications which qualified as a TDR in the year ended December 31, 2020 resulted from forbearance agreements. Two of the commercial loan modifications which qualified as a TDR in the year ended December 31, 2020 were loans which had already been on non-accrual status and were granted a deferral of payment due to circumstances related to COVID-19. Another commercial loan modification which qualified as a TDR in the first quarter of 2020 had its maturity extended. The commercial loan modifications which qualified as TDRs in the year ended December 31, 2019 had their maturity extended and/or interest rate reduced to current market terms.
The following tables present information about pre and post modification interest yield for TDRs which occurred during the years ended December 31, 2020 and 2019:
| Years Ended December 31, | |||||||||||||||||||||||||||||||||||
| 2020 | 2019 | ||||||||||||||||||||||||||||||||||
| Number of Loans | Pre-modification Interest Yield | Post- modification Interest Yield | Number of Loans | Pre-modification Interest Yield | Post- modification Interest Yield | ||||||||||||||||||||||||||||||
| Commercial real estate | % | % | % | % | |||||||||||||||||||||||||||||||
| Commercial and industrial | % | % | % | % | |||||||||||||||||||||||||||||||
| Residential mortgage and consumer | % | % | % | % | |||||||||||||||||||||||||||||||
Payment defaults for loans modified as a TDR in the previous 12 months to December 31, 2020 consisted of 1 commercial real estate loan and 5 residential loans with a recorded investment of $1.8 million and $1.2 million. Payment defaults for loans modified as a TDR in the previous 12 months to December 31, 2019 consisted of 2 residential loans with a recorded investment of $152,000 .
102
Loan Sales
In December 2020, the Company sold $328.0 million of loans originated during the year ended December 31, 2020 under the U.S Small Business Administration Paycheck Protection Program. The resulting loss on the sale was less than $1,000 . Also during the year ended December 31, 2020, the Company sold a non-performing multi-family loan with a net book balance of $18.1 million. The Company recognized a recovery of $1.9 million in the allowance for credit losses on the sale.
For the year ended December 31, 2019, the Company sold $147.2 million of performing commercial loans and $49.2 million of residential performing loans resulting in a gain on sale of $1.8 million. In addition, the Company sold $173,000 of non-performing commercial real estate loans resulting in $29,000 of additional charge offs recorded through the allowance.
For the year ended December 31, 2020, the Company sold its interest in $21.6 million of leased equipment resulting in a gain on sale of $1.5 million, which is included in other income in the Consolidated Statements of Income. For the year ended December 31, 2019, the Company sold its interest in $23.6 million of leased equipment resulting in a gain on sale of $5.7 million.
Impaired Loans
The following table presents, under previously applicable U.S. GAAP, loans individually evaluated for impairment by portfolio segment as of December 31, 2019:
| December 31, 2019 | |||||||||||||||||||||||||||||
| Recorded Investment | Unpaid Principal Balance | Related Allowance | Average Recorded Investment | Interest Income Recognized | |||||||||||||||||||||||||
| (In thousands) | |||||||||||||||||||||||||||||
| With no related allowance: | |||||||||||||||||||||||||||||
| Multi-family | $ | — | |||||||||||||||||||||||||||
| Commercial real estate | — | ||||||||||||||||||||||||||||
| Commercial and industrial | — | ||||||||||||||||||||||||||||
| Construction | — | ||||||||||||||||||||||||||||
| Total commercial loans | — | ||||||||||||||||||||||||||||
| Residential mortgage and consumer | — | ||||||||||||||||||||||||||||
| With an allowance recorded: | |||||||||||||||||||||||||||||
| Multi-family | |||||||||||||||||||||||||||||
| Commercial real estate | |||||||||||||||||||||||||||||
| Commercial and industrial | |||||||||||||||||||||||||||||
| Construction | |||||||||||||||||||||||||||||
| Total commercial loans | |||||||||||||||||||||||||||||
| Residential mortgage and consumer | |||||||||||||||||||||||||||||
| Total: | |||||||||||||||||||||||||||||
| Multi-family | |||||||||||||||||||||||||||||
| Commercial real estate | |||||||||||||||||||||||||||||
| Commercial and industrial | |||||||||||||||||||||||||||||
| Construction | |||||||||||||||||||||||||||||
| Total commercial loans | |||||||||||||||||||||||||||||
| Residential mortgage and consumer | |||||||||||||||||||||||||||||
| Total impaired loans | $ | ||||||||||||||||||||||||||||
The average recorded investment is the annual average calculated based upon the ending quarterly balances. The interest income recognized is the year to date interest income recognized on a cash basis.
103
6. Allowance for Credit Losses
On January 1, 2020, the Company adopted ASU 2016-13, “Financial Instruments - Credit Losses (Topic 326): Measurement of Credit Losses on Financial Instruments”, which replaces the incurred loss methodology with an expected loss methodology that is referred to as the CECL methodology. See Note 1, Summary of Significant Accounting Principles.
An analysis of the provision for credit losses is summarized as follows:
| Year Ended December 31, | ||||||||||||||
| 2020 | 2019 | |||||||||||||
| (In thousands) | ||||||||||||||
| Provision for loan losses | $ | ( | ||||||||||||
| Provision for debt securities held-to-maturity | ||||||||||||||
| Provision for off-balance sheet credit exposures | ||||||||||||||
| Total provision for credit losses | $ | ( | ||||||||||||
Allowance for Credit Losses on Loans Receivable
An analysis of the allowance for credit losses for loans receivable is summarized as follows:
| Year Ended December 31, | ||||||||||||||
| 2020 | 2019 | |||||||||||||
| (In thousands) | ||||||||||||||
| Balance at beginning of period | $ | |||||||||||||
Adjustment for adoption of ASC 326 | ( | |||||||||||||
| Gross charge offs | ( | ( | ||||||||||||
| Recoveries | ||||||||||||||
| Net charge-offs | ( | ( | ||||||||||||
| Allowance at acquisition on loans purchased with credit deterioration | ||||||||||||||
| Provision for credit loss expense | ( | |||||||||||||
| Balance at end of period | $ | |||||||||||||
Accrued interest receivable on loans, reported as a component of accrued interest receivable on the balance sheet, totaled $69.6 million at December 31, 2020 and is excluded from the estimate of credit losses; however, during the year ended December 31, 2020, the Company recorded a provision for loan loss related to interest accrued on residential and consumer loans in payment deferral.
The allowance for credit losses represents the estimated amount considered necessary to cover lifetime expected credit losses inherent in financial assets at the balance sheet date. The lifetime estimate considers multiple economic scenarios, including recessionary scenarios that assume deterioration in key economic variables such as gross domestic product, unemployment rate and real estate prices. As of January 1, 2020, the Company’s economic outlook was weighted to include a moderate potential of a recession with some expectation of tail risk similar to the severely adverse scenario used in stress testing. During the year ended December 31, 2020, there was a significant change in the economic outlook impacting the allowance for credit losses, with key economic factors such as the unemployment rate and gross domestic product severely affected by the impact of COVID-19. For the second half of December 31, 2020, there was improvement in the U.S. and global macroeconomic consensus outlooks, which resulted in an improvement in the economic outlook used to determine the allowance for credit losses when compared to June 30, 2020. In response to these changes, the Company continues to assess the selection and probability weightings of the economic scenarios. Multiple economic outlooks were used for the December 31, 2020 estimate of the allowance for credit losses that included a base or consensus case, a downside recessionary case and an upside scenario to reflect the potential for continued improvement in the economic outlook. In addition, the allowance for credit losses at December 31, 2020 included qualitative reserves for certain segments that may not be fully recognized through its quantitative models. There are still many unknowns including the duration of the impact of COVID-19 on the economy and the results of the government fiscal and monetary actions along with recently implemented payment deferral programs, and the Company will continue to evaluate the allowance for credit losses and the related economic outlook each quarter.
104
The following tables present the balance in the allowance for credit losses for loans by portfolio segment as of December 31, 2020 and December 31, 2019:
| December 31, 2020 | |||||||||||||||||||||||||||||||||||||||||||||||
| Multi- Family Loans | Commercial Real Estate Loans | Commercial and Industrial Loans | Construction Loans | Residential Mortgage Loans | Consumer and Other Loans | Unallocated | Total | ||||||||||||||||||||||||||||||||||||||||
| (Dollars in thousands) | |||||||||||||||||||||||||||||||||||||||||||||||
| Allowance for credit losses: | |||||||||||||||||||||||||||||||||||||||||||||||
Balance as of December 31, 2019 | $ | ||||||||||||||||||||||||||||||||||||||||||||||
Adjustment for adoption of ASC 326 | ( | ( | ( | ( | ( | ( | |||||||||||||||||||||||||||||||||||||||||
| Balance as of January 1, 2020 | |||||||||||||||||||||||||||||||||||||||||||||||
| Charge-offs | ( | ( | ( | ( | ( | ( | |||||||||||||||||||||||||||||||||||||||||
| Recoveries | |||||||||||||||||||||||||||||||||||||||||||||||
| Allowance at acquisition on loans purchased with credit deterioration | |||||||||||||||||||||||||||||||||||||||||||||||
| Provision for credit loss expense | ( | ( | ( | ||||||||||||||||||||||||||||||||||||||||||||
Ending balance-December 31, 2020 | $ | ||||||||||||||||||||||||||||||||||||||||||||||
| December 31, 2019 | |||||||||||||||||||||||||||||||||||||||||||||||
| Multi- Family Loans | Commercial Real Estate Loans | Commercial and Industrial Loans | Construction Loans | Residential Mortgage Loans | Consumer and Other Loans | Unallocated | Total | ||||||||||||||||||||||||||||||||||||||||
| (Dollars in thousands) | |||||||||||||||||||||||||||||||||||||||||||||||
| Allowance for credit losses: | |||||||||||||||||||||||||||||||||||||||||||||||
Beginning balance-December 31, 2018 | $ | ||||||||||||||||||||||||||||||||||||||||||||||
| Charge-offs | ( | ( | ( | ( | ( | ( | |||||||||||||||||||||||||||||||||||||||||
| Recoveries | |||||||||||||||||||||||||||||||||||||||||||||||
| Provision for credit loss expense | ( | ( | ( | ( | ( | ||||||||||||||||||||||||||||||||||||||||||
Ending balance-December 31, 2019 | $ | ||||||||||||||||||||||||||||||||||||||||||||||
105
Allowance for Credit Losses on Debt Securities
An analysis of the allowance for credit losses for debt securities held-to-maturity is summarized as follows:
| Year Ended December 31, | |||||
| 2020 | |||||
| (In thousands) | |||||
| Balance at beginning of period | $ | ||||
Impact of adopting ASC 326 | |||||
| Provision for credit losses | |||||
| Balance at end of period | $ | ||||
The following tables present the balance in the allowance for credit losses for debt securities held-to-maturity by portfolio segment as of December 31, 2020:
| December 31, 2020 | |||||||||||||||||
| Municipal Bonds | Corporate and Other Debt Securities | Total | |||||||||||||||
| (Dollars in thousands) | |||||||||||||||||
| Allowance for credit losses: | |||||||||||||||||
Beginning balance-December 31, 2019 | $ | ||||||||||||||||
Impact of adopting ASC 326 | |||||||||||||||||
| Provision for credit loss | |||||||||||||||||
Ending balance-December 31, 2020 | $ | ||||||||||||||||
Accrued interest receivable on debt securities held-to-maturity totaled $5.2 million at December 31, 2020 and is excluded from the estimate of credit losses.
Allowance for Credit Losses on Off-Balance Sheet Credit Exposures
An analysis of the allowance for credit losses for off-balance sheet credit exposures is as follows:
| Year Ended December 31, | |||||
| 2020 | |||||
| (In thousands) | |||||
| Balance at beginning of period | $ | ||||
Impact of adopting ASC 326 | |||||
| Provision for credit losses | |||||
| Balance at end of period | $ | ||||
106
7. Office Properties and Equipment, Net
Office properties and equipment are summarized as follows:
| December 31, | ||||||||||||||
| 2020 | 2019 | |||||||||||||
| (In thousands) | ||||||||||||||
| Land | $ | |||||||||||||
| Office buildings | ||||||||||||||
| Leasehold improvements | ||||||||||||||
| Furniture, fixtures and equipment | ||||||||||||||
| Construction in process | ||||||||||||||
| Less accumulated depreciation and amortization | ||||||||||||||
| $ | ||||||||||||||
Depreciation and amortization expense for the years ended December 31, 2020, 2019 and 2018 was $21.3 million, $19.6 million and $17.1 million, respectively.
During the year ended December 31, 2020, the Bank completed the sale-leaseback of 15 branch locations and a corporate office location. These transactions involved the sale of land and buildings with a net book value of $24.8 million. The Bank received proceeds of $50.0 million, realized a gain of $23.1 million ($16.7 million after-tax) net of transaction related expenses for the year ended December 31, 2020 and recorded operating lease right-of-use assets and operating lease liabilities of $32.2
8. Leases
The Company has operating leases for corporate offices, branch locations and certain equipment. For these operating leases, the Company recognizes a lease liability and a right-of-use asset, measured at the present value of the future minimum lease payments, at the lease commencement date. The Company’s leases have remaining lease terms of up to 15 years, some of which include options to extend the leases for up to 10 years. Certain of our operating leases for branch locations contain variable lease payments related to consumer price index adjustments.
The following table presents the balance sheet information related to our operating leases:
| December 31, | |||||||||||
| 2020 | 2019 | ||||||||||
| (Dollars in thousands) | |||||||||||
| Operating lease right-of-use assets | $ | $ | |||||||||
| Operating lease liabilities | |||||||||||
| Weighted average remaining lease term | |||||||||||
| Weighted average discount rate | % | % | |||||||||
In determining the present value of lease payments, the discount rate used for each individual lease is the rate implicit in the lease, unless that rate cannot be readily determined, in which case the Company is required to use its incremental borrowing rate based on the information available at commencement date. For its incremental borrowing rate, the Company uses the borrowing rates offered to the Company by the Federal Home Loan Bank, which reflects the rates a lender would charge the Company to obtain a collateralized loan.
At December 31, 2020, operating lease right-of-use assets and operating lease liabilities include amounts recorded in conjunction with sale-leaseback transactions. See Note 7, Office Properties and Equipment, Net, for further details.
107
The following table presents the components of total operating lease cost recognized in the Consolidated Statements of Income:
| Year Ended December 31, | |||||||||||
| 2020 | 2019 | ||||||||||
| (In thousands) | |||||||||||
| Included in office occupancy and equipment expense: | |||||||||||
| Operating lease cost | $ | ||||||||||
| Short-term lease cost | |||||||||||
| Variable lease cost | ( | ( | |||||||||
| Included in other income: | |||||||||||
| Sublease income | |||||||||||
Rental expense under operating leases aggregated approximately $24.4 million for the year ended December 31, 2018.
The following table presents supplemental cash flow information related to operating leases:
| Year Ended December 31, | |||||||||||
| 2020 | 2019 | ||||||||||
| (In thousands) | |||||||||||
| Cash paid for amounts included in the measurement of operating lease liabilities: | |||||||||||
| Operating cash flows from operating leases | $ | ||||||||||
| Operating lease liabilities arising from obtaining right-of-use assets (non-cash): | |||||||||||
| Operating leases | |||||||||||
Future minimum operating lease payments and reconciliation to operating lease liabilities at December 31, 2020 and 2019:
| December 31, 2020 | |||||
| (In thousands) | |||||
| 2021 | $ | ||||
| 2022 | |||||
| 2023 | |||||
| 2024 | |||||
| 2025 | |||||
| Thereafter | |||||
| Total lease payments | |||||
| Less: Imputed interest | ( | ||||
| Total operating lease liabilities | $ | ||||
| December 31, 2019 | |||||
| (In thousands) | |||||
| 2020 | $ | ||||
| 2021 | |||||
| 2022 | |||||
| 2023 | |||||
| 2024 | |||||
| Thereafter | |||||
| Total lease payments | |||||
| Less: Imputed interest | ( | ||||
| Total operating lease liabilities | $ | ||||
108
9. Goodwill and Other Intangible Assets
The following table summarizes goodwill and intangible assets at December 31, 2020 and 2019:
| December 31, 2020 | December 31, 2019 | |||||||||||||
| (In thousands) | ||||||||||||||
| Mortgage servicing rights | $ | |||||||||||||
| Core deposit premiums | ||||||||||||||
| Other | ||||||||||||||
| Total other intangible assets | ||||||||||||||
| Goodwill | ||||||||||||||
| Goodwill and intangible assets | $ | |||||||||||||
For the year ended December 31, 2020, the increase in goodwill reflects the acquisition of Gold Coast Bancorp. See Note 3, Business Combinations.
The following table summarizes other intangible assets as of December 31, 2020 and December 31, 2019:
| Gross Intangible Asset | Accumulated Amortization | Valuation Allowance | Net Intangible Assets | |||||||||||||||||||||||
| (In thousands) | ||||||||||||||||||||||||||
| December 31, 2020 | ||||||||||||||||||||||||||
| Mortgage Servicing Rights | $ | ( | ( | |||||||||||||||||||||||
| Core Deposit Premiums | ( | |||||||||||||||||||||||||
| Other | ( | |||||||||||||||||||||||||
| Total other intangible assets | $ | ( | ( | |||||||||||||||||||||||
| December 31, 2019 | ||||||||||||||||||||||||||
| Mortgage Servicing Rights | $ | ( | ( | |||||||||||||||||||||||
| Core Deposit Premiums | ( | |||||||||||||||||||||||||
| Other | ( | |||||||||||||||||||||||||
| Total other intangible assets | $ | ( | ( | |||||||||||||||||||||||
Mortgage servicing rights are accounted for using the amortization method. Under this method, the Company amortizes the loan servicing asset in proportion to, and over the period of, estimated net servicing revenues. The Company sells loans on a servicing-retained basis. Loans that were sold on this basis had an unpaid principal balance of $1.69 billion and $1.67 billion at December 31, 2020 and 2019, respectively, all of which relate to mortgage loans. At December 31, 2020 and 2019, the servicing asset, included in intangible assets, had an estimated fair value of $11.2 million and $14.1 million, respectively. At December 31, 2020, fair value was based on expected future cash flows considering a weighted average discount rate of 12.03 %, a weighted average constant prepayment rate on mortgages of 17.76 % and a weighted average life of 4.4 years. Based on an analysis of fair values as of December 31, 2020, the Company determined that a $1.0 million valuation allowance for mortgage servicing rights was required. See Note 16, Fair Value Measurements, for additional details.
Core deposit premiums are amortized using an accelerated method and having a weighted average amortization period of 10 years. For the year ended December 31, 2020, the Company recorded $2.5 million in core deposit premiums resulting from the acquisition of Gold Coast.
109
The following presents the estimated future amortization expense of other intangible assets for the next five years:
| Mortgage Servicing Rights | Core Deposit Premiums | Other | |||||||||||||||
| (In thousands) | |||||||||||||||||
| 2021 | $ | $ | $ | ||||||||||||||
| 2022 | |||||||||||||||||
| 2023 | |||||||||||||||||
| 2024 | |||||||||||||||||
| 2025 | |||||||||||||||||
10. Deposits
Deposits are summarized as follows:
| December 31, | |||||||||||||||||||||||||||||||||||
| 2020 | 2019 | ||||||||||||||||||||||||||||||||||
| Weighted Average Rate | Amount | % of Total | Weighted Average Rate | Amount | % of Total | ||||||||||||||||||||||||||||||
| (In thousands) | |||||||||||||||||||||||||||||||||||
| Non-interest bearing: | |||||||||||||||||||||||||||||||||||
| Checking accounts | — | % | $ | % | — | % | $ | % | |||||||||||||||||||||||||||
| Interest-bearing: | |||||||||||||||||||||||||||||||||||
| Checking accounts | % | % | % | % | |||||||||||||||||||||||||||||||
| Money market deposits | % | % | % | % | |||||||||||||||||||||||||||||||
| Savings | % | % | % | % | |||||||||||||||||||||||||||||||
| Certificates of deposit | % | % | % | % | |||||||||||||||||||||||||||||||
| Total Deposits | % | $ | % | % | $ | % | |||||||||||||||||||||||||||||
Included in the above balances for the years ended December 31, 2020 and December 31, 2019 are money market deposits of $886.5 million and $266.4 million, respectively, obtained through brokers and certificates of deposit of $327.0 million and $1.31 billion, respectively, obtained through brokers.
Scheduled maturities of certificates of deposit are as follows:
| December 31, | ||||||||||||||
| 2020 | 2019 | |||||||||||||
| (In thousands) | ||||||||||||||
| Within one year | $ | |||||||||||||
| One to two years | ||||||||||||||
| Two to three years | ||||||||||||||
| Three to four years | ||||||||||||||
| After four years | ||||||||||||||
| $ | ||||||||||||||
The aggregate amount of certificates of deposit in denominations of $100,000 or more totaled approximately $1.77 billion and $2.93 billion at December 31, 2020 and December 31, 2019, respectively.
110
Interest expense on deposits consists of the following:
| For the Years Ended December 31, | |||||||||||||||||
| 2020 | 2019 | 2018 | |||||||||||||||
| (In thousands) | |||||||||||||||||
| Checking accounts | $ | ||||||||||||||||
| Money market deposits | |||||||||||||||||
| Savings | |||||||||||||||||
| Certificates of deposit | |||||||||||||||||
| Total | $ | ||||||||||||||||
11. Borrowed Funds
Borrowed funds are summarized as follows:
| December 31, | ||||||||||||||||||||||||||
| 2020 | 2019 | |||||||||||||||||||||||||
| Principal | Weighted Average Rate (1) | Principal | Weighted Average Rate (1) | |||||||||||||||||||||||
| (Dollars in thousands) | ||||||||||||||||||||||||||
| Funds borrowed under repurchase agreements: | ||||||||||||||||||||||||||
| Other brokers | $ | $ | ||||||||||||||||||||||||
| Other borrowed funds: | ||||||||||||||||||||||||||
| FHLB advances | ||||||||||||||||||||||||||
Subordinated debt (2) | ||||||||||||||||||||||||||
| Other | ||||||||||||||||||||||||||
| Total other borrowed funds | ||||||||||||||||||||||||||
| Total borrowed funds | $ | $ | ||||||||||||||||||||||||
(1) The weighted average interest rate excludes the effects of our derivative contracts. See Note 15, Derivatives and Hedging Activities.
(2) Subordinated debt was assumed in the acquisition of Gold Coast Bancorp in April 2020.
Borrowed funds had contractual scheduled maturities as follows:
| December 31, | ||||||||||||||||||||||||||
| 2020 | 2019 | |||||||||||||||||||||||||
| Principal | Weighted Average Rate (1) | Principal | Weighted Average Rate (1) | |||||||||||||||||||||||
| (Dollars in thousands) | ||||||||||||||||||||||||||
| Within one year | $ | $ | ||||||||||||||||||||||||
| One to two years | ||||||||||||||||||||||||||
| Two to three years | ||||||||||||||||||||||||||
| Three to four years | ||||||||||||||||||||||||||
| Four to five years | ||||||||||||||||||||||||||
After five years (2) | ||||||||||||||||||||||||||
| Total borrowed funds | $ | $ | ||||||||||||||||||||||||
(1) The weighted average interest rate excludes the effects of our derivative contracts. See Note 15, Derivatives and Hedging Activities.
(2) For December 31, 2020, the borrowed funds maturing after five years are subordinated notes maturing in 2027 assumed in the acquisition of Gold Coast Bancorp in April 2020. Interest on the notes is fixed at a rate of 6.50 % until September 2022, after which interest is floating until maturity.
111
Mortgage-backed securities have been sold, subject to repurchase agreements, to the FHLB and various brokers. Mortgage-backed securities sold, subject to repurchase agreements, are held by the FHLB for the benefit of the Company. Repurchase agreements require repurchase of the identical securities. Whole mortgage loans have been pledged to the FHLB as collateral for advances, but are held by the Company.
The amortized cost and fair value of the underlying securities used as collateral for borrowings are as follows:
| December 31, | ||||||||||||||
| 2020 | 2019 | |||||||||||||
| (Dollars in thousands) | ||||||||||||||
| Amortized cost of collateral: | ||||||||||||||
| Mortgage-backed securities | $ | |||||||||||||
| Total amortized cost of collateral | $ | |||||||||||||
| Fair value of collateral: | ||||||||||||||
| Mortgage-backed securities | $ | |||||||||||||
| Total fair value of collateral | $ | |||||||||||||
During the years ended December 31, 2020, 2019 and 2018, the maximum month-end balance of the repurchase agreements was $548.0 million, $447.9 million and $280.0 million, respectively. The average amount of repurchase agreements outstanding during the years ended December 31, 2020, 2019 and 2018 was $451.7 million, $369.0 million and $202.0 million, respectively, and the average interest rate was 2.17 %, 2.45 % and 2.68 %, respectively.
At December 31, 2020, our borrowing capacity at the FHLB was $11.08 billion, of which the Company had outstanding borrowings of $6.59 billion, which included letters of credit totaling $3.92 billion. In addition, the Bank had access to unsecured overnight borrowings (Fed Funds) with other financial institutions totaling $590.0 million, of which $170.0 million was outstanding at December 31, 2020.
In April 2020, we assumed $13.5 million of subordinated notes in the acquisition of Gold Coast Bancorp. The notes were originally issued in September 2017. Interest is payable in arrears at 6.50 % on two fixed dates annually until September 2022, after which interest will be payable in arrears at 3-month LIBOR plus 4.55 % on four fixed dates annually until maturity in October 2027.
During the year ended December 31, 2020, we prepaid $1.20 billion of FHLB advances with an average interest rate of 1.47 % and maturity dates from 2020 to 2022 and terminated $400.0 million of interest rate swaps with an average interest rate of 2.30 % and maturity dates in 2022 and 2023 at a total cost of $24.1 million. Since the debt was not replaced upon extinguishment, the prepayment penalties were recognized in our Consolidated Statement of Income.
In June 2019, we prepaid $200.0 million of FHLB advances and a $150.0 million repurchase agreement with a total average interest rate of 3.00 % and maturity dates in 2020 and 2021. The prepaid borrowings were replaced with $200.0 million of FHLB advances and a $150.0 million repurchase agreement with a total average interest rate of 2.55 % and maturity dates averaging 4 years. Included in the interest rate is a prepayment penalty of 0.47 %. In August 2019, we prepaid $275.0 million of FHLB advances with a total average interest rate of 2.46 % and maturity dates in 2021. The prepaid borrowings were replaced with $275.0 million of FHLB advances with a total average interest rate of 2.16 % and maturity dates of 5 years. Included in the interest rate is a prepayment penalty of 0.27 %. The prepayment penalties are amortized over the life of the new debt instruments in accordance with ASC 470-50, Debt - Modifications and Extinguishments.
112
12. Income Taxes
The components of income tax expense are as follows:
| Years Ended December 31, | ||||||||||||||||||||
| 2020 | 2019 | 2018 | ||||||||||||||||||
| (In thousands) | ||||||||||||||||||||
| Current tax expense: | ||||||||||||||||||||
| Federal | $ | |||||||||||||||||||
| State | ||||||||||||||||||||
| Deferred tax (benefit) expense: | ||||||||||||||||||||
| Federal | ( | |||||||||||||||||||
| State | ( | ( | ||||||||||||||||||
| ( | ||||||||||||||||||||
| Total income tax expense | $ | |||||||||||||||||||
The following table presents the reconciliation between the actual income tax expense and the “expected” amount computed using the applicable statutory federal income tax rate of 21% for the years ended December 31, 2020, 2019 and 2018:
| Years Ended December 31, | ||||||||||||||||||||
| 2020 | 2019 | 2018 | ||||||||||||||||||
| (In thousands) | ||||||||||||||||||||
| “Expected” federal income tax expense | $ | |||||||||||||||||||
| State tax, net | ||||||||||||||||||||
| Impact of tax law changes | ( | |||||||||||||||||||
| Tax exempt interest | ( | ( | ( | |||||||||||||||||
| Non-deductible FDIC premiums | ||||||||||||||||||||
| Bank owned life insurance | ( | ( | ( | |||||||||||||||||
| Tax credits | ( | |||||||||||||||||||
| Other | ||||||||||||||||||||
| Total income tax expense | $ | |||||||||||||||||||
113
The temporary differences and loss carryforwards which comprise the deferred tax asset and liability are as follows:
| December 31, | ||||||||||||||
| 2020 | 2019 | |||||||||||||
| (In thousands) | ||||||||||||||
| Deferred tax asset: | ||||||||||||||
| Employee benefits | $ | |||||||||||||
| Deferred compensation | ||||||||||||||
| Premises and equipment | ||||||||||||||
| Allowance for credit losses | ||||||||||||||
| Net unrealized loss on hedging activities | ||||||||||||||
| ESOP | ||||||||||||||
| Fair value adjustments related to acquisitions | ||||||||||||||
| Loan origination costs | ||||||||||||||
| State NOL | ||||||||||||||
| Other | ||||||||||||||
| Gross deferred tax asset | ||||||||||||||
| Deferred tax liability: | ||||||||||||||
| Mortgage servicing rights | ||||||||||||||
| Premises and equipment | ||||||||||||||
| Net unrealized gain on debt securities available-for-sale | ||||||||||||||
| Equipment financing | ||||||||||||||
| Other | ||||||||||||||
| Gross deferred tax liability | ||||||||||||||
| Net deferred tax asset | $ | |||||||||||||
A deferred tax asset or liability is recognized for the estimated future tax effects attributable to temporary differences and carryforwards. The measurement of such deferred tax items is reduced by the amount that is more likely than not to be realized based on available evidence. The ultimate realization of the deferred tax asset is dependent upon the generation of future taxable income during the periods in which those temporary differences and carryforwards become deductible. A valuation allowance is recorded for tax benefits which management has determined are not more likely than not to be realized. At December 31, 2020 and 2019, there was no
Under ASC 740, “Income Taxes”, companies are required to recognize the effect of tax law changes in the period of enactment; therefore, the Company re-measures its deferred tax assets and liabilities at the enacted tax rate expected to apply when its temporary differences are expected to be realized or settled. On July 1, 2018, New Jersey Assembly Bill 4202 was signed into law, providing significant revisions to New Jersey’s Corporation Business Tax laws. The new legislation provided for temporary increases to the corporate income tax rate for tax years beginning on or after January 1, 2018, as well as mandatory combined reporting effective for tax years beginning after 2018. As of the date of enactment, the resulting impact of the re-measurement of the Company’s deferred tax balances was an increase of $2.3 million. In December 2019, a technical bulletin was issued by the State of New Jersey providing clarification on mandatory combined reporting, causing a remeasurement of the Company’s deferred tax balances. This remeasurement resulted in a decrease of $7.8 million to the deferred tax asset.
Based upon projections of future taxable income and the ability to carry forward net operating losses indefinitely, management believes it is more likely than not the Company will realize the remaining deferred tax asset.
Retained earnings at December 31, 2020 included approximately $45.2 million for which deferred income taxes of approximately $12.5 million have not been provided. The retained earnings amount represents the base year allocation of income to bad debt deductions for tax purposes only. Base year reserves are subject to recapture if the Bank makes certain non-dividend distributions, repurchases any of its stock, pays dividends in excess of tax earnings and profits, or ceases to maintain a bank charter. Under ASC 740, this amount is treated as a permanent difference and deferred taxes are not recognized unless it appears that it will be reduced and result in taxable income in the foreseeable future. Events that would result in taxation of these reserves include failure to qualify as a bank for tax purposes or distributions in complete or partial liquidation.
114
The Company had no
The Company files income tax returns in the United States federal jurisdiction, New Jersey, New York and various other state jurisdictions. As of December 31, 2020, the Company is no longer subject to federal income tax examination for years prior to 2016. The Company and its affiliates are currently under audit by the New York State Department of Taxation and Finance for tax years 2015 and 2016, as well as the New York City Department of Finance for tax years 2016 through 2018. Neither the Company nor its subsidiaries are currently under audit by any other state jurisdiction.
13. Benefit Plans
Defined Benefit Pension Plan
The Company participates in the Pentegra Defined Benefit Plan for Financial Institutions (“Pentegra DB Plan”), a tax-qualified defined-benefit pension plan. The Pentegra DB Plan’s Employer Identification Number is 13-5645888 and the Plan Number is 333. The Pentegra DB Plan operates as a multi-employer plan for accounting purposes and as a multiple-employer plan under the Employee Retirement Income Security Act of 1974 and the Internal Revenue Code. There are no collective bargaining agreements in place that require contributions to the Pentegra DB Plan.
The Pentegra DB Plan is a single plan under Internal Revenue Code Section 413(c) and, as a result, all of the assets stand behind all of the liabilities. Accordingly, under the Pentegra DB Plan, contributions made by a participating employer may be used to provide benefits to participants of other participating employers. As of December 31, 2016, the annual benefit provided under the Pentegra DB Plan was frozen by an amendment to the plan. Freezing the plan eliminated all future benefit accruals and each participant’s frozen accrued benefit was determined as of December 31, 2016 and no further benefits accrued subsequent to December 31, 2016.
The funded status (fair value of plan assets divided by funding target) as of July 1, 2020 and 2019 was 87.34 % and 88.08 %, respectively. The fair value of plan assets reflects any contributions received through June 30, 2020.
The Company’s contribution and pension cost was $5.5 million, $4.8 million and $3.8 million for the years ended December 31, 2020, 2019 and 2018, respectively. The Company’s contributions to the Pentegra DB Plan are not more than 5 % of the total contributions to the Pentegra DB Plan. The Company’s expected contribution for the 2021 plan year is approximately $5.9 million. The Company’s accrued pension liability was $874,000 and $686,000 at December 31, 2020 and 2019, respectively.
SERPs, Directors’ Plan and Other Postretirement Benefits Plan
The Company has an Executive Supplemental Retirement Wage Replacement Plan (“SERP II”) and the Supplemental ESOP and Retirement Plan (“SERP I”) (collectively, the “SERPs”). The SERP II is a nonqualified, defined benefit plan which provides benefits to certain executives as designated by the Compensation and Benefits Committee of the Board of Directors (the “Board”). More specifically, the SERP II was designed to provide participants with a normal retirement benefit equal to an annual benefit of 60 % of the participant’s highest annual base salary and cash incentive (over a consecutive 36-month period within the participant’s credited service period) reduced by the sum of the benefits provided under the Pentegra DB Plan and the SERP I. Effective as of the close of business of December 31, 2016, the SERP II was amended to freeze future benefit accruals subsequent to the 2016 year of service.
The SERP I compensates certain executives (as designated by the Compensation and Benefits Committee of the Board) participating in the ESOP whose contributions are limited by the Internal Revenue Code. The Company also maintains the Amended and Restated Director Retirement Plan (“Directors’ Plan”) for certain directors, which is a nonqualified, defined benefit plan. The Directors’ Plan was frozen on November 21, 2006 such that no new benefits accrued under, and no new directors were eligible to participate in the plan. The SERPs and the Directors’ Plan are unfunded and the costs of the plans are recognized over the period that services are provided.
115
The following table sets forth information regarding the SERP II and the Directors’ Plan:
| December 31, | |||||||||||
| 2020 | 2019 | ||||||||||
| (In thousands) | |||||||||||
| Change in benefit obligation: | |||||||||||
| Benefit obligation at beginning of year | $ | ||||||||||
| Interest cost | |||||||||||
| Gain due to change in mortality assumption | ( | ( | |||||||||
| Loss due to change in discount rate | |||||||||||
| Loss due to demographic changes | |||||||||||
| Actuarial loss | |||||||||||
| Benefits paid | ( | ( | |||||||||
| Benefit obligation at end of year | |||||||||||
| Funded status | $ | ( | ( | ||||||||
The unfunded pension benefits of $51.3 million and $46.0 million at December 31, 2020 and 2019, respectively, are included in other liabilities in the consolidated balance sheets. The components of accumulated other comprehensive loss related to pension plans, on a pre-tax basis, at December 31, 2020 and 2019, are summarized in the following table.
| December 31, | |||||||||||
| 2020 | 2019 | ||||||||||
| (In thousands) | |||||||||||
| Net actuarial loss | $ | ||||||||||
| Total amounts recognized in accumulated other comprehensive loss | $ | ||||||||||
The accumulated benefit obligation for the SERP II and the Directors’ Plan was $39.5 million and $37.9 million at December 31, 2020 and 2019, respectively. The measurement date for our SERP II and Directors’ Plan is December 31 for the years ended December 31, 2020 and 2019.
The weighted-average actuarial assumptions used in the plan determinations at December 31, 2020 and 2019 were as follows:
| December 31, | |||||||||||
| 2020 | 2019 | ||||||||||
| Discount rate | % | % | |||||||||
| Rate of compensation increase | % | % | |||||||||
The components of net periodic benefit cost are as follows:
| Years Ended December 31, | |||||||||||||||||
| 2020 | 2019 | 2018 | |||||||||||||||
| (In thousands) | |||||||||||||||||
| Interest cost | $ | ||||||||||||||||
| Amortization of: | |||||||||||||||||
| Net loss | |||||||||||||||||
| Total net periodic benefit cost | $ | ||||||||||||||||
The following are the weighted average assumptions used to determine net periodic benefit cost:
| Years Ended December 31, | |||||||||||||||||
| 2020 | 2019 | 2018 | |||||||||||||||
| Discount rate | % | % | % | ||||||||||||||
| Rate of compensation increase | % | % | % | ||||||||||||||
116
Estimated future benefit payments, which reflect expected future service, as appropriate for the next ten calendar years are as follows:
| Amount | |||||
| (In thousands) | |||||
| 2021 | $ | ||||
| 2022 | |||||
| 2023 | |||||
| 2024 | |||||
| 2025 | |||||
| 2026 through 2030 | |||||
401(k) Plan
The Company has a 401(k) plan covering substantially all employees provided they meet the eligibility age requirement of age 21. For the years ended December 31, 2020, 2019 and 2018, the Company matched 50 8 no 1 % of eligible earnings for eligible employees. The Company’s aggregate contributions to the 401(k) plan for the years ended December 31, 2020, 2019 and 2018 were $4.3 million, $3.6 million and $4.8 million, respectively.
Employee Stock Ownership Plan
The ESOP is a tax-qualified plan designed to invest primarily in the Company’s common stock that provides employees with the opportunity to receive a funded retirement benefit from the Bank, based primarily on the value of the Company’s common stock. During the Company’s initial public stock offering in October 2005, the ESOP was authorized to purchase, and did purchase, 10,847,883 shares of the Company’s common stock at a price of $3.92 per share with the proceeds of a loan from the Company to the ESOP. In connection with the completion of the Company’s mutual to stock conversion on May 7, 2014, the ESOP purchased an additional 6,617,421 common shares of stock at a price of $10.00 per share with the proceeds of a loan from the Company to the ESOP. The Company refinanced the outstanding principal and interest balance of $33.9 million and borrowed an additional $66.2 million to purchase the additional shares. The outstanding loan principal balance at December 31, 2020 was $85.1 million. Shares of the Company’s common stock pledged as collateral for the loan are released from the pledge pro-rata for allocation to participants as loan payments are made.
At December 31, 2020, shares allocated to participants were 6,570,252 since the plan inception. ESOP shares that were unallocated or not yet committed to be released totaled 10,895,052 at December 31, 2020 and had a fair value of $115.1 million. ESOP compensation expense recognized in the Consolidated Statements of Income for the years ended December 31, 2020, 2019 and 2018 was $3.0 million, $5.1 million and $5.5 million, respectively, representing the fair value of shares allocated or committed to be released during the year.
The SERP I also provides supplemental benefits to certain executives as designated by the Compensation and Benefits Committee of the Board who are prevented from receiving the full benefits contemplated by ESOP’s benefit formula due to the Internal Revenue Code. During the year ended December 31, 2020, the decline in our stock price resulted in a compensation benefit related to this plan of $105,000 . During the year ended December 31, 2019, compensation expense related to this plan amounted to $827,000 . During the year ended December 31, 2018, the decline in our stock price resulted in a compensation benefit related to this plan of $672,000 .
Equity Incentive Plan
At the annual meeting held on June 9, 2015, stockholders of the Company approved the Investors Bancorp, Inc. 2015 Equity Incentive Plan (“2015 Plan”) which provides for the issuance or delivery of up to 30,881,296 shares (13,234,841 restricted stock awards and 17,646,455 stock options) of Investors Bancorp, Inc. common stock.
Restricted shares granted under the 2015 Plan vest in equal installments, over the service period generally ranging from 5 to 7 years beginning one year from the date of grant. Additionally, certain restricted shares awarded are performance vesting awards, which may or may not vest depending upon the attainment of certain corporate financial targets. The vesting of restricted stock may accelerate in accordance with the terms of the 2015 Plan. The product of the number of shares granted and the grant date closing market price of the Company’s common stock determine the fair value of restricted shares under the 2015 Plan. Management recognizes compensation expense for the fair value of restricted shares on a straight-line basis over the
117
requisite service period. For the year ended December 31, 2020, the Company granted 91,249 shares of restricted stock awards under the 2015 Plan.
Stock options granted under the 2015 Plan vest in equal installments, over the service period generally ranging from 5 to 7 years beginning one year from the date of grant. The vesting of stock options may accelerate in accordance with the terms of the 2015 Plan. Stock options were granted at an exercise price equal to the fair value of the Company’s common stock on the grant date based on the closing market price and have an expiration period of 10 years. For the year ended December 31, 2020, the Company granted no stock options under the 2015 Plan.
During the year ended December 31, 2019, the Compensation and Benefits Committee approved the issuance of 2,360,919 restricted stock awards and 995,216 stock options to certain officers under the 2015 Plan inclusive of the Replacement Awards - refer to Shareholder Litigation Settlement below. During the year ended December 31, 2018, the Compensation and Benefits Committee approved the issuance of 91,982 restricted stock awards and 50,000 stock options to certain officers under the 2015 Plan. During the year ended December 31, 2018, it was determined that the performance-based stock awards granted during 2015 were achieved at 70 % of target based upon the performance criteria. This resulted in 70 % of these performance-based stock awards being earned and converted to time-based stock awards that vest over a service period and the balance being forfeited.
The fair value of stock options granted as part of the 2015 Plan was estimated utilizing the Black-Scholes option pricing model using the following assumptions for the periods presented below:
| For the Year Ended December 31, | |||||||||||
2019(1) | 2018 | ||||||||||
| Weighted average expected life (in years) | |||||||||||
| Weighted average risk-free rate of return | % | % | |||||||||
| Weighted average volatility | % | % | |||||||||
| Dividend yield | % | % | |||||||||
| Weighted average fair value of options granted | $ | $ | |||||||||
| Total stock options granted | |||||||||||
(1) Includes assumptions for the Replacement Award granted in 2019. For additional information about the Replacement Awards, refer to Shareholder Litigation Settlement below.
The weighted average expected life of the stock option represents the period of time that stock options are expected to be outstanding and is estimated using historical data of stock option exercises and forfeitures. The risk-free interest rate is based on the U.S. Treasury yield curve in effect at the time of grant. The expected volatility is based on the historical volatility of the Company’s stock. The Company recognizes compensation expense for the fair values of these awards, which have graded vesting, on a straight-line basis over the requisite service period of the awards. Upon exercise of vested options, management expects to draw on treasury stock as the source for shares.
The following table presents the share-based compensation expense for the years ended December 31, 2020, 2019 and 2018:
| Years Ended December 31, | |||||||||||||||||
| 2020 | 2019 | 2018 | |||||||||||||||
| (Dollars in thousands) | |||||||||||||||||
| Stock option expense | $ | ||||||||||||||||
| Restricted stock expense | |||||||||||||||||
Total share-based compensation expense (1) | $ | ||||||||||||||||
(1) Included in share-based compensation expense for the year ended December 31, 2019 was $2.0 million of accelerated stock compensation expense resulting from the settlement of shareholder litigation during 2019. For additional information about the settlement, refer to Shareholder Litigation Settlement below.
118
The following is a summary of the status of the Company’s restricted shares as of December 31, 2020 and changes therein during the year then ended:
| Number of Shares Awarded | Weighted Average Grant Date Fair Value | |||||||||||||
| Outstanding at December 31, 2019 | $ | |||||||||||||
| Granted | ||||||||||||||
| Vested | ( | |||||||||||||
| Forfeited | ( | |||||||||||||
| Outstanding and non-vested at December 31, 2020 | $ | |||||||||||||
Expected future expenses relating to the non-vested restricted shares outstanding as of December 31, 2020 is $17.5 million over a weighted average period of 2.07 years.
The following is a summary of the Company’s stock option activity and related information for its option plan for the year ended December 31, 2020:
| Number of Stock Options | Weighted Average Exercise Price | Weighted Average Remaining Contractual Life (in years) | Aggregate Intrinsic Value | |||||||||||||||||||||||
| Outstanding at December 31, 2019 | $ | $ | ||||||||||||||||||||||||
| Granted | ||||||||||||||||||||||||||
| Exercised | ||||||||||||||||||||||||||
| Forfeited | ( | |||||||||||||||||||||||||
| Expired | ( | |||||||||||||||||||||||||
| Outstanding at December 31, 2020 | $ | $ | ||||||||||||||||||||||||
| Exercisable at December 31, 2020 | $ | $ | ||||||||||||||||||||||||
The weighted average grant date fair value of options granted during the years ended December 31, 2019 and 2018 were $0.89 and $1.94 per share, respectively. Expected future expense relating to the non-vested options outstanding as of December 31, 2020 is $5.6 million over a weighted average period of 1.25 years.
Shareholder Litigation Settlement
On March 6, 2019, a Stipulation and Agreement of Compromise, Settlement and Release was filed in the Court of Chancery of the State of Delaware (the “Court”) in relation to a lawsuit involving the Company and certain of its current and former directors entitled In re Investors Bancorp Inc. Stockholder Litigation, C.A. No. 12327-VCS (the “Settlement”). The Settlement resolves a lawsuit challenging the equity compensation granted on or about June 23, 2015 to persons who were then-directors of the Company.
On June 21, 2019, the Court entered an order approving the Settlement. Following the expiration of a thirty-day appeal period, the Settlement became effective. Accordingly, pursuant to the Settlement (i) all of the stock options granted to non-employee directors (excluding Brendan J. Dugan who is deceased) and stock options granted to Paul Stathoulopoulos (who was not a director of the Company at the time of the equity grant on or about June 23, 2015), have been surrendered; (ii) a total of 95,694 shares of the restricted stock granted to the then non-employee directors of the Company (excluding Brendan J. Dugan) and to then non-director Paul Stathoulopoulos scheduled to vest in 2020 have been surrendered; and (iii) 925,000 shares of restricted stock and 1,333,333 stock options granted to the Company’s Chief Executive Officer and 740,000 shares of restricted stock and 1,066,667 stock options granted to the Company’s President have been surrendered. As a result of the Settlement, the Company recorded $2.0 million of accelerated stock compensation expense during the third quarter of 2019.
The Compensation and Benefits Committee, with the assistance of its independent legal advisor and compensation consultant, considered the issuance of equity grants to both the Company’s Chief Executive Officer and President to replace those being surrendered pursuant to the Settlement. On May 20, 2019, the Compensation and Benefits Committee authorized and approved, and recommended to the Board, the issuance of (i) 925,000 shares of restricted stock and 525,120 stock options to the Company’s Chief Executive Officer, and (ii) 740,000 shares of restricted stock and 420,096 stock options to the Company’s President (the “Replacement Awards”). The Board, excluding both the Company’s Chief Executive Officer and
119
President, determined that it was advisable and in the best interests of the Company to approve and issue the Replacement Awards, subject to the surrender of awards pursuant to the Settlement.
The Replacement Awards were subsequently issued to both the Company’s Chief Executive Officer and President on July 22, 2019. The Replacement Awards were issued from the 2015 Equity Incentive Plan and were accounted for as a modification of the original awards, which resulted in no incremental expense as the compensation cost of the Replacement Awards was less than the compensation cost of the original awards. The stock options have an exercise price of $12.54 per share and vested 25 % on July 22, 2019 with the remaining to vest ratably over a three-year period. Approximately 59 % of the restricted shares vested on July 22, 2019 with the remainder to vest on the same vesting schedule as applicable to the June 23, 2015 award.
On September 26, 2019, a related shareholder derivative action was filed in the Delaware Chancery Court. The complaint claims breach of fiduciary duty on the part of the Company’s Board in the issuance of the replacement awards to both the Company’s Chief Executive Officer and President in connection with the settlement of the case referenced above. The case is active and limited discovery is ongoing.
14. Commitments and Contingencies
The Company is a defendant in certain claims and legal actions arising in the ordinary course of business. Management and the Company’s legal counsel are of the opinion that the ultimate disposition of these matters will not have a material adverse effect on the Company’s financial condition, results of operations or liquidity.
At December 31, 2020, the Company was obligated under various non-cancelable operating leases on buildings and land used for office space and banking purposes. These operating leases contain escalation clauses which provide for increased rental expense, based primarily on increases in real estate taxes and cost-of-living indices. See Note 7, Leases, for further details on rental commitments.
Financial Transactions with Off-Balance-Sheet Risk and Concentrations of Credit Risk
The Company is a party to transactions with off-balance-sheet risk in the normal course of business in order to meet the financing needs of its customers. These transactions consist of commitments to extend credit. These transactions involve, to varying degrees, elements of credit and interest rate risk in excess of the amounts recognized in the accompanying consolidated balance sheets. We maintain an allowance at a level that is estimated to absorb estimated lifetime credit losses on unfunded loan commitments and letters of credit. See Note 6, Allowance for Credit Losses, and Note 1, Summary of Significant Accounting Policies, for further details of our allowance for credit losses on off-balance sheet credit exposures.
At December 31, 2020, the Company had commitments to originate total commercial loans of $374.5 million. Additionally, the Company had commitments to originate residential loans of approximately $77.6 million. While we historically purchase residential loans from correspondent banks, we have no such commitment as of December 31, 2020. Unused home equity lines of credit and undisbursed business and construction lines totaled approximately $1.97 billion at December 31, 2020. No commitments are included in the accompanying consolidated financial statements. The Company has no exposure to credit loss if the customer does not exercise its rights to borrow under the commitment.
The Company uses the same credit policies and collateral requirements in making commitments and conditional obligations as it does for on-balance-sheet loans. Commitments to extend credit are agreements to lend to customers as long as there is no violation of any condition established in the contract. Commitments generally have fixed expiration dates or other termination clauses and may require payment of a fee. Since the commitments may expire without being drawn upon, the total commitment amounts do not necessarily represent future cash requirements. The Company evaluates each customer’s creditworthiness on a case-by-case basis. The amount of collateral obtained if deemed necessary by the Company upon extension of credit is based on management’s credit evaluation of the borrower.
The Company principally grants commercial real estate loans, multi-family loans, commercial and industrial loans, construction loans, residential mortgage loans and consumer and other loans to borrowers throughout New Jersey, New York, Pennsylvania and states in close proximity. Its borrowers’ abilities to repay their obligations are dependent upon various factors, including the borrowers’ income and net worth, cash flows generated by the underlying collateral or from business operations, value of the underlying collateral and priority of the Company’s lien on the property. Such factors are dependent upon various economic conditions and individual circumstances beyond the Company’s control; the Company is, therefore, subject to risk of loss. The Company believes its lending policies and procedures adequately minimize the potential exposure to such risks and adequate provisions for loan losses are provided for all probable and estimable losses.
Our portfolio contains interest-only and no income verification mortgage loans. We have not originated residential mortgage loans without verifying income in recent years. At December 31, 2020 and 2019, these loans totaled $109.0 million
120
and $143.1 million. At December 31, 2020 and 2019, interest-only residential and consumer loans totaled $32.1 million and $28.3 million, respectively, which represented less than 1 1.25 billion and $1.23 billion, respectively. As part of its underwriting, these loans are evaluated as fully amortizing for risk classification purposes, with the interest-only period generally ranging from one year to ten years . In addition, the Company evaluates its policy limits on a regular basis. We believe these criteria adequately control the potential risks of such loans and that adequate provisions for loan losses are provided for all known and inherent risks. Since April 2020, we have, at the request of commercial borrowers experiencing financial difficulty resulting from the pandemic, temporarily deferred the payment of principal and/or interest for an agreed-upon period of time. Although a significant portion of these loans are paying interest-only during the deferral period, they are not included in the amount of interest-only loans disclosed in this section.
In the normal course of business the Company sells residential mortgage loans to third parties. These loan sales are subject to customary representations and warranties. In the event that the Company is found to be in breach of these representations and warranties, it may be obligated to repurchase certain of these loans.
The Company has entered into derivative financial instruments to manage exposures that arise from business activities that result in the receipt or payment of future known and uncertain cash amounts, the value of which are determined by interest rates. The Company’s derivative financial instruments are used to manage differences in the amount, timing, and duration of the Company’s known or expected cash receipts and its known or expected cash payments principally related to the Company’s borrowings and loans. During the year ended December 31, 2020, such derivatives were used (i) to hedge the variability in cash flows associated with borrowings and (ii) to hedge changes in the fair value of certain pools of prepayable fixed-rate assets. These derivatives had an aggregate notional amount of $3.33 billion as of December 31, 2020. The fair value of derivatives designated as hedging activities as of December 31, 2020 was an asset of $370,000 , inclusive of accrued interest and variation margin posted in accordance with the Chicago Mercantile Exchange. During the year ended December 31, 2020, the Company terminated two interest rate swaps with an aggregate notional amount of $475.0 million which had been used to hedge changes in the fair value of certain pools of prepayable fixed- and adjustable-rate assets. Also during the year ended December 31, 2020, the Company terminated four interest rate swaps with an aggregate notional of $400.0 million which had been used to hedge the variability in cash flows associated with wholesale funding.
The Company has credit derivatives resulting from participations in interest rate swaps provided to external lenders as part of loan participation arrangements which are, therefore, not used to manage interest rate risk in the Company’s assets or liabilities. Additionally, the Company provides interest rate risk management services to commercial customers, primarily interest rate swaps. The fair value of the derivatives resulting from participations in interest rate swaps provided to lenders was a liability of $217,000 as of December 31, 2020. The fair value of the derivatives resulting from customer interest rate risk management services was an asset of $34.2 million as of December 31, 2020; however, not all of the derivatives resulting from customer interest rate risk management services were cleared through a clearing agent, for which we have recorded a liability of $237,000 as a result.
In connection with its mortgage banking activities, the Company has certain freestanding derivative instruments. At December 31, 2020, the Company had commitments of approximately $158.8 million to fund loans which will be classified as held-for-sale with a like amount of commitments to sell such loans which are considered derivative instruments under ASC 815, “Derivatives and Hedging.” The Company also had commitments of $106.5 million to sell loans at December 31, 2020. The fair values of these derivative instruments are immaterial to the Company’s financial condition and results of operations.
Standby letters of credit are conditional commitments issued by the Company to guarantee the performance of a customer to a third party. The guarantees generally extend for a term of up to one year and are fully collateralized. For each guarantee issued, if the customer defaults on a payment or performance to the third party, the Company would have to perform under the guarantee. Outstanding standby letters of credit totaled $44.0 million at December 31, 2020. The fair values of these obligations were immaterial at December 31, 2020. At December 31, 2020, the Company had no commercial letters of credit outstanding.
Other Commitments
During the year ended December 31, 2019, the Company invested $10.0 million in a low income housing tax credit program that qualifies for community reinvestment tax credits. Commitments related to the tax credit investments are payable on demand and are recorded in other liabilities on our Consolidated Balance Sheets. Total commitments related to tax credit investments were $5.5 million and $9.2 million as of December 31, 2020 and 2019, respectively.
121
15. Derivatives and Hedging Activities
The Company is exposed to certain risk arising from both its business operations and economic conditions. The Company principally manages its exposures to a wide variety of business and operational risks through management of its core business activities. The Company manages economic risks, including interest rate, liquidity, and credit risk primarily by managing the amount, sources, and duration of its assets and liabilities and the use of derivative financial instruments. Specifically, the Company enters into derivative financial instruments to manage exposures that arise from business activities that result in the receipt or payment of future known and uncertain cash amounts, the value of which are determined by interest rates. The Company’s derivative financial instruments are used to manage differences in the amount, timing, and duration of the Company’s known or expected cash receipts and its known or expected cash payments principally related to the Company’s floating rate borrowings and pools of fixed-rate assets.
Cash Flow Hedges of Interest Rate Risk
The Company’s objectives in using interest rate derivatives are primarily to reduce cost and add stability to interest expense in an effort to manage its exposure to interest rate movements. Interest rate swaps designated as cash flow hedges involve the receipt of amounts subject to variability caused by changes in interest rates from a counterparty in exchange for the Company making fixed-rate payments over the life of the agreements without exchange of the underlying notional amount. Changes in the fair value of derivatives designated and that qualify as cash flow hedges are initially recorded in other comprehensive income and are subsequently reclassified into earnings in the period that the hedged forecasted transaction affects earnings. Such derivatives were used to hedge the variability in cash flows associated with wholesale fundings. The Company is hedging its exposure to the variability in future cash flows for forecasted transactions over a maximum period of 16 months (excluding forecasted transactions related to the payment of variable interest on existing financial instruments).
During the year ended December 31, 2020, the Company terminated four interest rate swaps with an aggregate notional of $400.0 million. Upon termination, the Company accelerated the reclassification of amounts in other comprehensive income to earnings as a result of the hedged forecasted transactions becoming probable not to occur. The accelerated amounts combined to a pre-tax loss of $14.2 million, which has been included in debt extinguishment cost within non-operating expenses on the Consolidated Statements of Income.
Amounts reported in accumulated other comprehensive income (loss) related to derivatives will be reclassified to interest expense as interest payments are made on the Company’s variable-rate borrowings. During the next twelve months, the Company estimates that an additional $39.3 million will be reclassified as an increase to interest expense.
Fair Value Hedges of Interest Rate Risk
The Company is exposed to changes in the fair value of certain of its pools of fixed rate assets due to changes in benchmark interest rates. The Company may use interest rate swaps to manage its exposure to changes in fair value on these instruments attributable to changes in the designated benchmark interest rate. Interest rate swaps designated as fair value hedges involve the payment of fixed-rate amounts to a counterparty in exchange for the Company receiving variable-rate payments over the life of the agreements without the exchange of the underlying notional amount. Such derivatives were used to hedge the changes in fair value of certain of its pools of prepayable fixed rate assets.
For derivatives designated and that qualify as fair value hedges, the gain or loss on the derivative as well as the offsetting loss or gain on the hedged item attributable to the hedged risk are recognized in interest income.
The Company terminated two interest rate swaps with an aggregate notional of $475.0 million during the year ended December 31, 2020. The terminated swaps were due to mature in April and May 2021. The Company terminated three interest rate swaps with an aggregate notional amount of $1.00 billion during the year ended December 31, 2019. The terminated swaps were due to mature in February 2020. There were no interest rate swaps designated as fair value hedges as of December 31, 2020. The remaining balance of the fair value hedging adjustment included in the carrying amount of the assets previously hedged is being amortized into interest income on a straight-line basis over the remaining lives of the assets previously hedged.
Derivatives Not Designated as Hedges
The Company has credit derivatives resulting from participation in interest rate swaps provided to external lenders as part of loan participation arrangements which are, therefore, not used to manage interest rate risk in the Company’s assets or liabilities. Additionally, the Company provides interest rate risk management services to commercial customers, primarily interest rate swaps. The Company’s market risk from unfavorable movements in interest rates related to these derivative contracts is economically hedged by concurrently entering into offsetting derivative contracts that have identical notional values, terms and indices.
122
Derivatives not designated as hedges are not speculative and result from a service the Company provides to certain lenders which participate in loans and commercial customers.
| Asset Derivatives | Liability Derivatives | ||||||||||||||||||||||||||||||||||||||||||||||
| At December 31, 2020 | At December 31, 2019 | At December 31, 2020 | At December 31, 2019 | ||||||||||||||||||||||||||||||||||||||||||||
| Notional amount | Balance Sheet Location | Fair Value | Notional amount | Balance Sheet Location | Fair Value | Notional amount | Balance Sheet Location | Fair Value | Notional amount | Balance Sheet Location | Fair Value | ||||||||||||||||||||||||||||||||||||
| (In millions) | (In thousands) | (In millions) | (In thousands) | (In millions) | (In thousands) | (In millions) | (In thousands) | ||||||||||||||||||||||||||||||||||||||||
| Derivatives designated as hedging instruments: | |||||||||||||||||||||||||||||||||||||||||||||||
| Interest Rate Swaps | $ | Other assets | $ | $ | Other assets | $ | $ | Other liabilities | $ | $ | Other liabilities | $ | |||||||||||||||||||||||||||||||||||
| Total derivatives designated as hedging instruments | $ | $ | $ | $ | |||||||||||||||||||||||||||||||||||||||||||
| Derivatives not designated as hedging instruments: | |||||||||||||||||||||||||||||||||||||||||||||||
| Interest Rate Swaps | $ | Other assets | $ | $ | Other assets | $ | $ | Other liabilities | $ | $ | Other liabilities | $ | |||||||||||||||||||||||||||||||||||
| Other Contracts | Other assets | Other assets | Other liabilities | Other liabilities | |||||||||||||||||||||||||||||||||||||||||||
| Total derivatives not designated as hedging instruments | $ | $ | $ | $ | |||||||||||||||||||||||||||||||||||||||||||
The Chicago Mercantile Exchange (“CME”) legally characterizes the variation margin posted between counterparties as settlements of the outstanding derivative contracts instead of cash collateral.
Effect of Derivative Instruments on Accumulated Other Comprehensive Income (Loss)
The following table presents the effect of the Company’s derivative financial instruments on the Accumulated Comprehensive Income (Loss) for the years ended December 31, 2020 and 2019.
| Years Ended December 31, | |||||||||||
| 2020 | 2019 | ||||||||||
| (In thousands) | |||||||||||
| Cash Flow Hedges - Interest rate swaps | |||||||||||
| Amount of loss recognized in other comprehensive income (loss) | $ | ( | $ | ( | |||||||
| Amount of (loss) gain reclassified from accumulated other comprehensive income (loss) to interest expense | ( | ||||||||||
| Amount of (loss) gain reclassified from accumulated other comprehensive income (loss) to other expense | ( | ||||||||||
123
Location and Amount of Gain or (Loss) Recognized in Income on Fair Value and Cash Flow Hedging Relationships
The following table presents the effect of the Company’s derivative financial instruments on the Consolidated Statements of Income as of December 31, 2020 and 2019.
| Years Ended December 31, | ||||||||||||||
| 2020 | 2019 | |||||||||||||
| The effects of fair value and cash flow hedging: | Income statement location | (In thousands) | ||||||||||||
| Gain or (loss) on fair value hedging relationships in Subtopic 815-20 | ||||||||||||||
| Interest contracts | ||||||||||||||
| Hedged items | Interest income | $ | $ | |||||||||||
Derivatives designated as hedging instruments (1) | Interest income | ( | ( | |||||||||||
| Gain or (loss) on cash flow hedging relationships in Subtopic 815-20 | ||||||||||||||
| Interest contracts | ||||||||||||||
| Amount of (loss) gain reclassified from accumulated other comprehensive income (loss) | Interest expense | ( | ||||||||||||
| Amount of gain or (loss) reclassified from accumulated other comprehensive income (loss) as a result that a forecasted transaction is no longer probable of occurring | Other expense | ( | ||||||||||||
| Total amounts of income and expense line items presented in the income statement in which the effects of fair value are recorded | $ | ( | $ | |||||||||||
(1) The amount includes reclassification of ineffectiveness and pre-tax gains on fair value hedging relationships which have been terminated.
Fee income related to derivative interest rate swaps executed with commercial loan customers totaled $8.5 million and $7.4 million for the years ended December 31, 2020 and 2019.
As of December 31, 2020 and 2019, the following amounts were recorded on the Consolidated Balance Sheets related to cumulative basis adjustment for fair value hedges:
| Carrying Amount of the Hedged Assets/(Liabilities) | Cumulative Amount of Fair Value Hedging Adjustment Included in the Carrying Amount of the Hedged Assets/(Liabilities) | ||||||||||||||||||||||
| Balance sheet location | December 31, 2020 | December 31, 2019 | December 31, 2020 | December 31, 2019 | |||||||||||||||||||
| (In thousands) | |||||||||||||||||||||||
Loans receivable, net (1) | $ | $ | $ | $ | |||||||||||||||||||
(1) The balance of Cumulative Amount of Fair Value Hedging Adjustment Included in the Carrying Amount of the Hedged Assets/(Liabilities) as of December 31, 2020 represents $8.8 million of hedging adjustment on discontinued hedging relationships.
Location and Amount of Gain or (Loss) Recognized in Income on Derivatives Not Designated as Hedging Instruments
The table below presents the effect of the Company’s derivative financial instruments that are not designated as hedging instruments on the Consolidated Statements of Income as of December 31, 2020:
| Consolidated Statements of Income location | Amount of Gain or (Loss) Recognized in Income on Derivative | |||||||||||||
| Years Ended December 31, | ||||||||||||||
| 2020 | 2019 | |||||||||||||
| (In thousands) | ||||||||||||||
| Other Contracts | Other income / (expense) | $ | ( | |||||||||||
| Total | $ | ( | ||||||||||||
124
Offsetting Derivatives
The following table presents a gross presentation, the effects of offsetting, and a net presentation of the Company’s derivatives in the Consolidated Balance Sheets as of December 31, 2020 and December 31, 2019. The net amounts of derivative assets and liabilities and assets can be reconciled to the tabular disclosure of the fair value hierarchy, see Note 16, Fair Value Measurements. The tabular disclosure of fair value provides the location that derivative assets and liabilities are presented on the Company’s Consolidated Balance Sheets.
| Gross Amounts Not Offset | |||||||||||||||||||||||||||||||||||
| Gross Amounts Recognized | Gross Amounts Offset | Net Amounts Presented | Financial Instruments | Cash Collateral Posted | Net Amount | ||||||||||||||||||||||||||||||
| (In thousands) | |||||||||||||||||||||||||||||||||||
| December 31, 2020 | |||||||||||||||||||||||||||||||||||
| Assets: | |||||||||||||||||||||||||||||||||||
| Derivative contracts | $ | ||||||||||||||||||||||||||||||||||
| Liabilities: | |||||||||||||||||||||||||||||||||||
| Derivative contracts | $ | ||||||||||||||||||||||||||||||||||
| December 31, 2019 | |||||||||||||||||||||||||||||||||||
| Assets: | |||||||||||||||||||||||||||||||||||
| Derivative contracts | $ | ||||||||||||||||||||||||||||||||||
| Liabilities: | |||||||||||||||||||||||||||||||||||
| Derivative contracts | $ | ||||||||||||||||||||||||||||||||||
16. Fair Value Measurements
We use fair value measurements to record fair value adjustments to certain assets and liabilities and to determine fair value disclosures. Our debt securities available-for-sale and derivatives are recorded at fair value on a recurring basis. Additionally, from time to time, we may be required to record at fair value other assets or liabilities on a non-recurring basis, such as held-to-maturity debt securities, mortgage servicing rights (“MSR”), loans receivable and other real estate owned. These non-recurring fair value adjustments involve the application of lower-of-cost-or-market accounting or write-downs of individual assets. Additionally, in connection with our mortgage banking activities we have commitments to fund loans held-for-sale and commitments to sell loans, which are considered free-standing derivative instruments, the fair values of which are not material to our financial condition or results of operations.
In accordance with FASB ASC 820, “Fair Value Measurements and Disclosures”, we group our assets and liabilities at fair value in three levels, based on the markets in which the assets are traded and the reliability of the assumptions used to determine fair value. These levels are:
•Level 1 – Valuation is based upon quoted prices for identical instruments traded in active markets.
•Level 2 – Valuation is based upon quoted prices for similar instruments in active markets, quoted prices for identical or similar instruments in markets that are not active and model-based valuation techniques for which all significant assumptions are observable in the market.
•Level 3 – Valuation is generated from model-based techniques that use significant assumptions not observable in the market. These unobservable assumptions reflect our own estimates of assumptions that market participants would use in pricing the asset or liability. Valuation techniques include the use of option pricing models, discounted cash flow models and similar techniques. The results cannot be determined with precision and may not be realized in an actual sale or immediate settlement of the asset or liability.
We base our fair values on the price that would be received to sell an asset or paid to transfer a liability in an orderly transaction between market participants at the measurement date. ASC 820 requires us to maximize the use of observable inputs and minimize the use of unobservable inputs when measuring fair value.
125
Assets Measured at Fair Value on a Recurring Basis
Equity securities
Our equity securities portfolio is carried at estimated fair value on a recurring basis, with any unrealized gains and losses recognized in the Consolidated Statements of Income. The fair values of equity securities are based on quoted market prices (Level 1).
Debt securities available-for-sale
Our debt securities available-for-sale portfolio is carried at estimated fair value on a recurring basis, with any unrealized gains and losses, net of taxes, reported as accumulated other comprehensive income (loss) in stockholders’ equity. The fair values of debt securities available-for-sale that are provided by a third-party pricing service are based upon quoted prices for similar instruments in active markets (Level 2). The pricing service may use quoted market prices of comparable instruments or a variety of other forms of analysis, incorporating inputs that are currently observable in the markets for similar securities. Inputs that are often used in the valuation methodologies include, but are not limited to, benchmark yields, credit spreads, default rates, prepayment speeds and non-binding broker quotes. As the Company is responsible for the determination of fair value, it performs quarterly analyses on the prices received from the pricing service to determine whether the prices are reasonable estimates of fair value. Specifically, the Company compares the prices received from the pricing service to a secondary pricing source. Additionally, the Company compares changes in the reported market values and returns to relevant market indices to test the reasonableness of the reported prices. The Company’s internal price verification procedures and review of the fair value methodology documentation provided by independent pricing services has generally not resulted in material adjustments in the prices obtained from the pricing service.
Derivatives
Derivatives are reported at fair value utilizing Level 2 inputs. The fair values of interest rate swap and risk participation agreements are based on a valuation model that uses primarily observable inputs, such as benchmark yield curves and interest rate spreads.
The following tables provide the level of valuation assumptions used to determine the carrying value of our assets and liabilities measured at fair value on a recurring basis at December 31, 2020 and December 31, 2019.
| Carrying Value at December 31, 2020 | |||||||||||||||||||||||
| Total | Level 1 | Level 2 | Level 3 | ||||||||||||||||||||
| Assets: | (In thousands) | ||||||||||||||||||||||
| Equity securities | $ | ||||||||||||||||||||||
| Debt securities available for sale: | |||||||||||||||||||||||
| Government-sponsored enterprises | $ | ||||||||||||||||||||||
| Mortgage-backed securities: | |||||||||||||||||||||||
| Federal Home Loan Mortgage Corporation | |||||||||||||||||||||||
| Federal National Mortgage Association | |||||||||||||||||||||||
| Government National Mortgage Association | |||||||||||||||||||||||
| Total debt securities available-for-sale | $ | ||||||||||||||||||||||
| Interest rate swaps | $ | ||||||||||||||||||||||
| Liabilities: | |||||||||||||||||||||||
| Derivatives: | |||||||||||||||||||||||
| Interest rate swaps | $ | ||||||||||||||||||||||
| Other contracts | |||||||||||||||||||||||
| Total derivatives | $ | ||||||||||||||||||||||
126
| Carrying Value at December 31, 2019 | |||||||||||||||||||||||
| Total | Level 1 | Level 2 | Level 3 | ||||||||||||||||||||
| Assets: | (In thousands) | ||||||||||||||||||||||
| Equity securities | $ | ||||||||||||||||||||||
| Debt securities available for sale: | |||||||||||||||||||||||
| Mortgage-backed securities: | |||||||||||||||||||||||
| Federal Home Loan Mortgage Corporation | $ | ||||||||||||||||||||||
| Federal National Mortgage Association | |||||||||||||||||||||||
| Government National Mortgage Association | |||||||||||||||||||||||
| Total debt securities available-for-sale | $ | ||||||||||||||||||||||
| Interest rate swaps | $ | ||||||||||||||||||||||
| Liabilities: | |||||||||||||||||||||||
| Derivatives: | |||||||||||||||||||||||
| Other contracts | $ | ||||||||||||||||||||||
| Total derivatives | $ | ||||||||||||||||||||||
There have been no changes in the methodologies used at December 31, 2020 from December 31, 2019, and there were no transfers between Level 1 and Level 2 during the year ended December 31, 2020.
There were no Level 3 assets measured at fair value on a recurring basis for the years ended December 31, 2020 and December 31, 2019.
Assets Measured at Fair Value on a Non-Recurring Basis
Mortgage Servicing Rights, Net
Mortgage servicing rights are carried at the lower of cost or estimated fair value. The estimated fair value of MSR is obtained through independent third party valuations through an analysis of future cash flows, incorporating assumptions market participants would use in determining fair value including market discount rates, prepayment speeds, servicing income, servicing costs, default rates and other market driven data, including the market’s perception of future interest rate movements. The prepayment speed and the discount rate are considered two of the most significant inputs in the model. At December 31, 2020, the fair value model used prepayment speeds ranging from 14.46 % to 23.58 % and a discount rate of 12.03 % for the valuation of the mortgage servicing rights. At December 31, 2019, the fair value model used prepayment speeds ranging from 6.60 % to 29.10 % and a discount rate of 12.05 % for the valuation of the mortgage servicing rights. A significant degree of judgment is involved in valuing the mortgage servicing rights using Level 3 inputs. The use of different assumptions could have a significant positive or negative effect on the fair value estimate.
Collateral Dependent Loans
A collateral dependent loan is a loan for which repayment is expected to be provided substantially through the operation or sale of the collateral. A loan is individually evaluated when it is a collateral dependent commercial loan with an outstanding balance greater than $1.0 million and on non-accrual status, a loan modified in a troubled debt restructuring, or is a commercial loan with $1.0 million in outstanding principal if management has specific information that it is probable they will not collect all amounts due under the contractual terms of the loan agreement. Collateral dependent loans secured by property are carried at the estimated fair value of the collateral less estimated selling costs. Estimated fair value is calculated using an independent third-party appraiser. In the event the most recent appraisal does not reflect the current market conditions due to the passage of time and other factors, management will obtain an updated appraisal or make downward adjustments to the existing appraised value based on their knowledge of the property, local real estate market conditions, recent real estate transactions, and for estimated selling costs, if applicable. Appraisals were generally discounted in a range of 0 % to 25 %. Collateral securing a loan may consist of real estate or other property such as equipment or inventory. Collateral securing commercial and industrial loans may include real estate, other property or the operating results of the business. For non-collateral dependent loans, management estimates the fair value using discounted cash flows based on inputs that are largely unobservable and instead reflect management’s own estimates of the assumptions as a market participant would in pricing such loans.
127
Other Real Estate Owned and Other Repossessed Assets
Other Real Estate Owned and Other Repossessed Assets are recorded at estimated fair value, less estimated selling costs when acquired, thus establishing a new cost basis. Repossessed assets that are available for lease are included in operating lease equipment reviewed below. Fair value of foreclosed real estate property and other repossessed assets is generally based on independent appraisals. These appraisals include adjustments to comparable assets based on the appraisers’ market knowledge and experience, and are discounted an additional 0 % to 25 % for estimated costs to sell. When an asset is acquired, the excess of the loan balance over fair value, less estimated selling costs, is charged to the allowance for loan losses. If further declines in the estimated fair value of the asset occur, a writedown is recorded through expense. The valuation of foreclosed and repossessed assets is subjective in nature and may be adjusted in the future because of changes in economic conditions. Operating costs after acquisition are generally expensed.
Operating Lease Equipment
On an annual basis, the Company reviews the lease residuals and off-lease equipment for potential impairment. Repossessed assets are also available for lease and are included in operating lease equipment reviewed. Operating lease equipment is recorded at estimated fair value, generally determined by independent appraisal. If declines in the estimated fair value of the asset occur, a writedown is recorded through expense.
The following tables provide the level of valuation assumptions used to determine the carrying value of our assets measured at fair value on a non-recurring basis at December 31, 2020 and December 31, 2019. For the three months ended December 31, 2020 there was no change to the carrying value of real estate owned or collateral dependent loans. For the three months ended December 31, 2019, there was no change to the carrying value of impaired loans or operating lease equipment.
| Security Type | Valuation Technique | Unobservable Input | Range | Weighted Average Input | Carrying Value at December 31, 2020 | ||||||||||||||||||||||||
| Minimum | Maximum | Total | Level 1 | Level 2 | Level 3 | ||||||||||||||||||||||||
| (In thousands) | |||||||||||||||||||||||||||||
| MSR, net | Estimated cash flow | Prepayment speeds | $ | ||||||||||||||||||||||||||
| Operating lease equipment | Market comparable | Lack of marketability | |||||||||||||||||||||||||||
| $ | |||||||||||||||||||||||||||||
| Security Type | Valuation Technique | Unobservable Input | Range | Weighted Average Input | Carrying Value at December 31, 2019 | ||||||||||||||||||||||||
| Minimum | Maximum | Total | Level 1 | Level 2 | Level 3 | ||||||||||||||||||||||||
| (In thousands) | |||||||||||||||||||||||||||||
| MSR, net | Estimated cash flow | Prepayment speeds | $ | ||||||||||||||||||||||||||
| Other real estate owned | Market comparable | Lack of marketability | |||||||||||||||||||||||||||
| $ | |||||||||||||||||||||||||||||
Other Fair Value Disclosures
Fair value estimates, methods and assumptions for the Company’s financial instruments that are not recorded at fair value on a recurring or non-recurring basis are set forth below.
Cash and Cash Equivalents
For cash, short-term U.S. Treasury securities and due from banks, the carrying amount approximates fair value.
Debt Securities Held-to-Maturity, net
Our debt securities held-to-maturity portfolio, consisting primarily of agency mortgage backed securities and other debt securities for which we have a positive intent and ability to hold to maturity, is carried at amortized cost less any allowance for credit losses. Management utilizes various inputs to determine the fair value of the portfolio. The Company obtains pricing for each security primarily from a third-party pricing service. The pricing service may use quoted market prices of comparable instruments or a variety of other forms of analysis, incorporating inputs that are currently observable in the markets for similar
128
securities. For securities not actively traded, the pricing service may use quoted market prices of comparable instruments or discounted cash flow analyses, incorporating inputs that are currently observable in the markets for similar securities. Inputs that are often used in the valuation methodologies include, but are not limited to, benchmark yields, credit spreads, default rates, prepayment speeds and non-binding broker quotes. In the absence of quoted prices and in illiquid markets, valuation techniques, which require inputs that are both significant to the fair value measurement and unobservable, are used to determine fair value of the investment. Valuation techniques are based on various assumptions, including, but not limited to forecasted cash flows, discount rates, required rate of return, adjustments for nonperformance and liquidity, and liquidation values. As the Company is responsible for the determination of fair value, it performs quarterly analyses on the prices received from the pricing service to determine whether the prices are reasonable estimates of fair value. Specifically, the Company compares the prices received from the pricing service to a secondary pricing source. Additionally, the Company compares changes in the reported market values and returns to relevant market indices to test the reasonableness of the reported prices. The Company’s internal price verification procedures and review of the fair value methodology documentation provided by independent pricing services has generally not resulted in material adjustment in the prices obtained from the pricing service.
FHLB Stock
The fair value of the Federal Home Loan Bank of New York (“FHLB”) stock is its carrying value, since this is the amount for which it could be redeemed. There is no active market for FHLB stock. The Bank is required to hold and purchase FHLB stock based upon the balance of mortgage related assets held by the member and the amount of outstanding FHLB advances.
Loans
Fair values are estimated for portfolios of loans with similar financial characteristics. Loans are segregated by type such as residential mortgage and consumer. Each loan category is further segmented into fixed and adjustable rate interest terms and by performing and non-performing categories.
The fair value estimates are made at a specific point in time based on relevant market information. The fair value estimates do not reflect any premium or discount that could result from offering for sale a particular financial instrument. Fair value estimates are based on judgments regarding future expected loss experience, risk characteristics and economic conditions. These estimates are subjective, involve uncertainties, and cannot be determined with precision.
Loans Held For Sale
Residential mortgage loans held for sale are recorded at the lower of cost or fair value and are therefore considered to be measured at fair value on a recurring basis. When available, the Company uses observable secondary market data, including pricing on recent closed market transactions for loans with similar characteristics.
Deposit Liabilities
The fair value of deposits with no stated maturity, such as savings, checking and money market accounts, is equal to the amount payable on demand. The fair value of certificates of deposit is based on the discounted value of contractual cash flows. The discount rate is estimated using rates for currently offered deposits of similar remaining maturities.
Borrowings
The fair value of borrowings are based on securities dealers’ estimated fair values, when available, or estimated using discounted cash flow analysis. The discount rates used approximate the rates offered for similar borrowings of similar remaining terms.
129
Commitments to Extend Credit
The fair value of commitments to extend credit is estimated using the fees currently charged to enter into similar agreements, taking into account the remaining terms of the agreements and the present creditworthiness of the counterparties. For commitments to originate fixed rate loans, fair value also considers the difference between current levels of interest rates and the committed rates. Due to the short-term nature of our outstanding commitments, the fair values of these commitments are immaterial to our financial condition.
The carrying values and estimated fair values of the Company’s financial instruments are presented in the following table.
| December 31, 2020 | |||||||||||||||||||||||||||||
| Carrying | Estimated Fair Value | ||||||||||||||||||||||||||||
| value | Total | Level 1 | Level 2 | Level 3 | |||||||||||||||||||||||||
| (In thousands) | |||||||||||||||||||||||||||||
| Financial assets: | |||||||||||||||||||||||||||||
| Cash and cash equivalents | $ | ||||||||||||||||||||||||||||
| Equities | |||||||||||||||||||||||||||||
| Debt securities available-for-sale | |||||||||||||||||||||||||||||
| Debt securities held-to-maturity, net | |||||||||||||||||||||||||||||
| FHLB stock | |||||||||||||||||||||||||||||
| Loans held for sale | |||||||||||||||||||||||||||||
| Net loans | |||||||||||||||||||||||||||||
| Derivative financial instruments | |||||||||||||||||||||||||||||
| Financial liabilities: | |||||||||||||||||||||||||||||
| Deposits, other than time deposits | $ | ||||||||||||||||||||||||||||
| Time deposits | |||||||||||||||||||||||||||||
| Borrowed funds | |||||||||||||||||||||||||||||
| Derivative financial instruments | |||||||||||||||||||||||||||||
| December 31, 2019 | |||||||||||||||||||||||||||||
| Carrying | Estimated Fair Value | ||||||||||||||||||||||||||||
| value | Total | Level 1 | Level 2 | Level 3 | |||||||||||||||||||||||||
| (In thousands) | |||||||||||||||||||||||||||||
| Financial assets: | |||||||||||||||||||||||||||||
| Cash and cash equivalents | $ | ||||||||||||||||||||||||||||
| Equities | |||||||||||||||||||||||||||||
| Debt securities available-for-sale | |||||||||||||||||||||||||||||
| Debt securities held-to-maturity | |||||||||||||||||||||||||||||
| FHLB stock | |||||||||||||||||||||||||||||
| Loans held for sale | |||||||||||||||||||||||||||||
| Net loans | |||||||||||||||||||||||||||||
| Derivative financial instruments | |||||||||||||||||||||||||||||
| Financial liabilities: | |||||||||||||||||||||||||||||
| Deposits, other than time deposits | $ | ||||||||||||||||||||||||||||
| Time deposits | |||||||||||||||||||||||||||||
| Borrowed funds | |||||||||||||||||||||||||||||
| Derivative financial instruments | |||||||||||||||||||||||||||||
130
Limitations
Fair value estimates are made at a specific point in time, based on relevant market information and information about the financial instrument. These estimates do not reflect any premium or discount that could result from offering for sale at one time the Company’s entire holdings of a particular financial instrument. Because no market exists for a portion of the Company’s financial instruments, fair value estimates are based on judgments regarding future expected loss experience, current economic conditions, risk characteristics of various financial instruments, and other factors. These estimates are subjective in nature and involve uncertainties and matters of significant judgment and therefore cannot be determined with precision. Changes in assumptions could significantly affect the estimates.
Fair value estimates are based on existing on- and off-balance-sheet financial instruments without attempting to estimate the value of anticipated future business and the value of assets and liabilities that are not considered financial instruments. Significant assets that are not considered financial assets include deferred tax assets, premises and equipment and bank owned life insurance. Liabilities for pension and other postretirement benefits are not considered financial liabilities. In addition, the tax ramifications related to the realization of the unrealized gains and losses can have a significant effect on fair value estimates and have not been considered in the estimates.
17. Regulatory Capital
The Bank and the Company are subject to various regulatory capital requirements administered by the federal banking agencies. Failure to meet minimum capital requirements can initiate certain mandatory and possibly additional discretionary actions by regulators that, if undertaken, could have a direct material effect on the Company’s consolidated financial statements. Under capital adequacy guidelines and the regulatory framework for prompt corrective action, the Bank and the Company must meet specific capital guidelines that involve quantitative measures of assets, liabilities and certain off-balance-sheet items as calculated under regulatory accounting practices. Capital amounts and classification are also subject to qualitative judgments by the regulators about components, risk weightings, and other factors.
Quantitative measures established by regulation to ensure capital adequacy require the Bank and the Company to maintain minimum amounts and ratios of Tier 1 leverage ratio, Common equity tier 1 risk-based, Tier 1 risk-based capital and Total risk-based capital (as defined in the regulations). In July 2013, the Federal Deposit Insurance Corporation and the other federal bank regulatory agencies issued a final rule that revised their leverage and risk-based capital requirements and the method for calculating risk-weighted assets to make them consistent with agreements that were reached by the Basel Committee on Banking Supervision and certain provisions of the Dodd-Frank Act. The Final Capital Rules also revised the quantity and quality of required minimum risk-based and leverage capital requirements, consistent with the Reform Act and the Third Basel Accord adopted by the Basel Committee on Banking Supervision, or Basel III capital standards. The Common equity tier 1 risk-based ratio and changes to the calculation of risk-weighted assets became effective for the Bank and Company on January 1, 2015. The required minimum Conservation Buffer commenced on January 1, 2016 at 0.625% and increased in annual increments to 2.5% on January 1, 2019. The rules impose restrictions on capital distributions and certain discretionary cash bonus payments if the minimum Conservation Buffer is not met. As of December 31, 2020, the Company and the Bank met the currently applicable Conservation Buffer of 2.5%.
As of December 31, 2020, the most recent notification from the Federal Deposit Insurance Corporation categorized the Bank as well capitalized under the regulatory framework for prompt corrective action. To be categorized as well capitalized, the Bank and the Company must maintain minimum Tier 1 leverage ratio, Common equity tier 1 risk-based, Tier 1 risk-based capital and Total risk-based capital as set forth in the tables. There are no conditions or events since that notification that management believes have changed the Bank and the Company’s category.
131
| Actual | Minimum Capital Requirement with Conservation Buffer | To be Well Capitalized Under Prompt Corrective Action Provisions (2) | ||||||||||||||||||||||||||||||||||||
| Amount | Ratio | Amount | Ratio | Amount | Ratio | |||||||||||||||||||||||||||||||||
| (Dollars in thousands) | ||||||||||||||||||||||||||||||||||||||
As of December 31, 2020 (1) | ||||||||||||||||||||||||||||||||||||||
| Bank: | ||||||||||||||||||||||||||||||||||||||
| Tier 1 Leverage Ratio | $ | % | $ | % | $ | % | ||||||||||||||||||||||||||||||||
| Common equity tier 1 risk-based | % | % | % | |||||||||||||||||||||||||||||||||||
| Tier 1 Risk-Based Capital | % | % | % | |||||||||||||||||||||||||||||||||||
| Total Risk-Based Capital | % | % | % | |||||||||||||||||||||||||||||||||||
| Investors Bancorp, Inc: | ||||||||||||||||||||||||||||||||||||||
| Tier 1 Leverage Ratio | $ | % | $ | % | n/a | n/a | ||||||||||||||||||||||||||||||||
| Common equity tier 1 risk-based | % | % | n/a | n/a | ||||||||||||||||||||||||||||||||||
| Tier 1 Risk-Based Capital | % | % | n/a | n/a | ||||||||||||||||||||||||||||||||||
| Total Risk-Based Capital | % | % | n/a | n/a | ||||||||||||||||||||||||||||||||||
| Actual | Minimum Capital Requirement with Conservation Buffer | To be Well Capitalized Under Prompt Corrective Action Provisions (2) | ||||||||||||||||||||||||||||||||||||
| Amount | Ratio | Amount | Ratio | Amount | Ratio | |||||||||||||||||||||||||||||||||
| (Dollars in thousands) | ||||||||||||||||||||||||||||||||||||||
As of December 31, 2019 (1) | ||||||||||||||||||||||||||||||||||||||
| Bank: | ||||||||||||||||||||||||||||||||||||||
| Tier 1 Leverage Ratio | $ | % | $ | % | $ | % | ||||||||||||||||||||||||||||||||
| Common equity tier 1 risk-based | % | % | % | |||||||||||||||||||||||||||||||||||
| Tier 1 Risk-Based Capital | % | % | % | |||||||||||||||||||||||||||||||||||
| Total Risk-Based Capital | % | % | % | |||||||||||||||||||||||||||||||||||
| Investors Bancorp, Inc: | ||||||||||||||||||||||||||||||||||||||
| Tier 1 Leverage Ratio | $ | % | $ | % | n/a | n/a | ||||||||||||||||||||||||||||||||
| Common equity tier 1 risk-based | % | % | n/a | n/a | ||||||||||||||||||||||||||||||||||
| Tier 1 Risk-Based Capital | % | % | n/a | n/a | ||||||||||||||||||||||||||||||||||
| Total Risk-Based Capital | % | % | n/a | n/a | ||||||||||||||||||||||||||||||||||
(1) For purposes of calculating Tier 1 leverage ratio, assets are based on adjusted total average assets. In calculating Tier 1 risk-based capital and Total risk-based capital, assets are based on total risk-weighted assets.
(2) Prompt corrective action provisions do not apply to the bank holding company.
132
18. Parent Company Only Financial Statements
The following condensed financial statements for Investors Bancorp, Inc. (parent company only) reflect the investment in its wholly-owned subsidiary, Investors Bank, using the equity method of accounting.
Balance Sheets
| December 31, | ||||||||||||||
| 2020 | 2019 | |||||||||||||
| (In thousands) | ||||||||||||||
| Assets: | ||||||||||||||
| Cash and cash equivalents | $ | |||||||||||||
| Equity securities | ||||||||||||||
Debt securities held-to-maturity, net (estimated fair value of $ | ||||||||||||||
| Investment in subsidiary | ||||||||||||||
| ESOP loan receivable | ||||||||||||||
| Other assets | ||||||||||||||
| Total Assets | $ | |||||||||||||
| Liabilities and Stockholders’ Equity: | ||||||||||||||
| Total liabilities | $ | |||||||||||||
| Total stockholders’ equity | ||||||||||||||
| Total Liabilities and Stockholders’ Equity | $ | |||||||||||||
Statements of Operations
| Year Ended December 31, | |||||||||||||||||
| 2020 | 2019 | 2018 | |||||||||||||||
| (In thousands) | |||||||||||||||||
| Income: | |||||||||||||||||
| Interest on ESOP loan receivable | $ | ||||||||||||||||
| Dividend from subsidiary | |||||||||||||||||
| Interest on deposit with subsidiary | |||||||||||||||||
| Interest and dividends on investments | |||||||||||||||||
| Gain on securities, net | |||||||||||||||||
| Other income | |||||||||||||||||
| Expenses: | |||||||||||||||||
| Interest expense | |||||||||||||||||
| Provision for credit losses | |||||||||||||||||
| Other expenses | |||||||||||||||||
| Income before income tax expense | |||||||||||||||||
| Income tax expense | |||||||||||||||||
| Income before undistributed earnings of subsidiary | |||||||||||||||||
| Equity in undistributed earnings of subsidiary (dividend in excess of earnings) | ( | ( | |||||||||||||||
| Net income | $ | ||||||||||||||||
133
| Year Ended December 31, | |||||||||||||||||
| 2020 | 2019 | 2018 | |||||||||||||||
| (In thousands) | |||||||||||||||||
| Net income | $ | ||||||||||||||||
| Total other comprehensive income | |||||||||||||||||
| Total comprehensive income | $ | ||||||||||||||||
Statements of Cash Flows
| Year Ended December 31, | ||||||||||||||||||||
| 2020 | 2019 | 2018 | ||||||||||||||||||
| (In thousands) | ||||||||||||||||||||
| Cash flows from operating activities: | ||||||||||||||||||||
| Net income | $ | |||||||||||||||||||
| Adjustments to reconcile net income to net cash provided by operating activities: | ||||||||||||||||||||
| (Equity in undistributed earnings of subsidiary) dividend in excess of earnings | ( | |||||||||||||||||||
| Provision for credit losses | ||||||||||||||||||||
| Gain on securities transactions, net | ( | ( | ||||||||||||||||||
| Decrease in other assets | ||||||||||||||||||||
| Increase (decrease) in other liabilities | ( | |||||||||||||||||||
| Net cash provided by operating activities | ||||||||||||||||||||
| Cash flows from investing activities: | ||||||||||||||||||||
| Cash consideration paid, net of cash consideration received for acquisition | ( | |||||||||||||||||||
| Purchases of equity securities | ( | |||||||||||||||||||
| Purchases of debt securities held-to-maturity | ( | |||||||||||||||||||
| Principal collected on ESOP loan | ||||||||||||||||||||
| Net cash (used in) provided by investing activities | ( | ( | ||||||||||||||||||
| Cash flows from financing activities: | ||||||||||||||||||||
| Loan to ESOP | ( | |||||||||||||||||||
| Purchase of treasury stock | ( | ( | ( | |||||||||||||||||
| Exercise of stock options | ||||||||||||||||||||
| Dividends paid | ( | ( | ( | |||||||||||||||||
| Net cash used in financing activities | ( | ( | ( | |||||||||||||||||
| Net (decrease) increase in cash and cash equivalents | ( | ( | ||||||||||||||||||
| Cash and cash equivalents at beginning of year | ||||||||||||||||||||
| Cash and cash equivalents at end of year | $ | |||||||||||||||||||
134
19. Selected Quarterly Financial Data (Unaudited)
The following tables are a summary of certain quarterly financial data for the years ended December 31, 2020 and 2019.
2020 Quarter Ended | ||||||||||||||||||||||||||
| March 31 | June 30 | September 30 | December 31 | |||||||||||||||||||||||
| (In thousands, except per share data) | ||||||||||||||||||||||||||
| Interest and dividend income | $ | |||||||||||||||||||||||||
| Interest expense | ||||||||||||||||||||||||||
| Net interest income | ||||||||||||||||||||||||||
| Provision for credit losses | ( | |||||||||||||||||||||||||
| Net interest income after provision for credit losses | ||||||||||||||||||||||||||
| Non-interest income | ||||||||||||||||||||||||||
| Non-interest expenses | ||||||||||||||||||||||||||
| Income before income tax expense | ||||||||||||||||||||||||||
| Income tax expense | ||||||||||||||||||||||||||
| Net income | $ | |||||||||||||||||||||||||
| Basic earnings per common share | $ | |||||||||||||||||||||||||
| Diluted earnings per common share | $ | |||||||||||||||||||||||||
2019 Quarter Ended | ||||||||||||||||||||||||||
| March 31 | June 30 | September 30 | December 31 | |||||||||||||||||||||||
| (In thousands, except per share data) | ||||||||||||||||||||||||||
| Interest and dividend income | $ | |||||||||||||||||||||||||
| Interest expense | ||||||||||||||||||||||||||
| Net interest income | ||||||||||||||||||||||||||
| Provision for loan losses | ( | ( | ||||||||||||||||||||||||
| Net interest income after provision for loan losses | ||||||||||||||||||||||||||
| Non-interest income | ||||||||||||||||||||||||||
| Non-interest expenses | ||||||||||||||||||||||||||
| Income before income tax expense | ||||||||||||||||||||||||||
| Income tax expense | ||||||||||||||||||||||||||
| Net income | $ | |||||||||||||||||||||||||
| Basic earnings per common share | $ | |||||||||||||||||||||||||
| Diluted earnings per common share | $ | |||||||||||||||||||||||||
135
20. Earnings Per Share
The following is a summary of our earnings per share calculations and reconciliation of basic to diluted earnings per share.
| For the Year Ended December 31, | |||||||||||||||||
| 2020 | 2019 | 2018 | |||||||||||||||
| (Dollars in thousands, except per share data) | |||||||||||||||||
| Earnings for basic and diluted earnings per common share | |||||||||||||||||
| Earnings applicable to common stockholders | $ | $ | $ | ||||||||||||||
| Shares | |||||||||||||||||
| Weighted-average common shares outstanding - basic | |||||||||||||||||
Effect of dilutive common stock equivalents(1) | |||||||||||||||||
| Weighted-average common shares outstanding - diluted | |||||||||||||||||
| Earnings per common share | |||||||||||||||||
| Basic | $ | $ | $ | ||||||||||||||
| Diluted | $ | $ | $ | ||||||||||||||
(1) For the years ended December 31, 2020, 2019 and 2018, there were 7,390,470 , 6,468,307 , and 9,761,548 equity awards, respectively, that could potentially dilute basic earnings per share in the future that were not included in the computation of diluted earnings per share because to do so would have been anti-dilutive for the periods presented.
21. Comprehensive Income
The components of comprehensive income, gross and net of tax, are as follows:
| Year Ended December 31, 2020 | Year Ended December 31, 2019 | Year Ended December 31, 2018 | |||||||||||||||||||||||||||||||||||||||||||||||||||
| Gross | Tax | Net | Gross | Tax | Net | Gross | Tax | Net | |||||||||||||||||||||||||||||||||||||||||||||
| (Dollars in thousands) | |||||||||||||||||||||||||||||||||||||||||||||||||||||
| Net income | $ | ( | ( | ( | |||||||||||||||||||||||||||||||||||||||||||||||||
| Other comprehensive (loss) income: | |||||||||||||||||||||||||||||||||||||||||||||||||||||
| Change in funded status of retirement obligations | ( | ( | ( | ( | ( | ||||||||||||||||||||||||||||||||||||||||||||||||
| Unrealized gains (losses) on debt securities available-for-sale | ( | ( | ( | ( | |||||||||||||||||||||||||||||||||||||||||||||||||
| Accretion of loss on debt securities reclassified to held-to-maturity from available-for-sale | ( | ( | ( | ||||||||||||||||||||||||||||||||||||||||||||||||||
| Reclassification adjustment for security losses included in net income | ( | ( | |||||||||||||||||||||||||||||||||||||||||||||||||||
| Other-than-temporary impairment accretion on debt securities recorded prior to January 1, 2020 | ( | ( | ( | ||||||||||||||||||||||||||||||||||||||||||||||||||
| Net losses on derivatives | ( | ( | ( | ( | ( | ( | |||||||||||||||||||||||||||||||||||||||||||||||
| Total other comprehensive (loss) income | ( | ( | ( | ( | ( | ||||||||||||||||||||||||||||||||||||||||||||||||
| Total comprehensive income | $ | ( | ( | ( | |||||||||||||||||||||||||||||||||||||||||||||||||
136
The following table presents the after-tax changes in the balances of each component of accumulated other comprehensive loss for the years ended December 31, 2020 and 2019:
| Change in funded status of retirement obligations | Accretion of loss on debt securities reclassified to held-to-maturity | Unrealized gains (losses) on debt securities available-for-sale and gains included in net income | Other-than-temporary impairment accretion on debt securities | Unrealized (losses) gains on derivatives | Total accumulated other comprehensive loss | ||||||||||||||||||||||||||||||
| (Dollars in thousands) | |||||||||||||||||||||||||||||||||||
| Balance - December 31, 2019 | $ | ( | ( | ( | ( | ( | |||||||||||||||||||||||||||||
| Net change | ( | ( | ( | ||||||||||||||||||||||||||||||||
| Balance - December 31, 2020 | $ | ( | ( | ( | ( | ( | |||||||||||||||||||||||||||||
| Balance - December 31, 2018 | $ | ( | ( | ( | ( | ( | |||||||||||||||||||||||||||||
| Net change | ( | ( | ( | ||||||||||||||||||||||||||||||||
| Balance - December 31, 2019 | $ | ( | ( | ( | ( | ( | |||||||||||||||||||||||||||||
The following table presents information about amounts reclassified from accumulated other comprehensive loss to the consolidated statements of income and the affected line item in the statement where net income is presented.
| Year Ended December 31, | |||||||||||
| 2020 | 2019 | ||||||||||
| (In thousands) | |||||||||||
| Reclassification adjustment for losses included in net income | |||||||||||
| Loss on securities, net | $ | ||||||||||
| Change in funded status of retirement obligations | |||||||||||
| Adjustment of net obligation | ( | ||||||||||
| Amortization of net loss (gain) | ( | ||||||||||
| Compensation and fringe benefits | |||||||||||
| Reclassification adjustment for unrealized losses (gains) on derivatives | |||||||||||
| Interest expense | ( | ||||||||||
| Debt extinguishment | |||||||||||
| Total unrealized losses (gains) on derivatives reclassified | ( | ||||||||||
| Total before tax | |||||||||||
| Income tax expense | ( | ( | |||||||||
| Net of tax | $ | ||||||||||
22. Revenue Recognition
137
Revenue from contracts with customers included in fees and service charges and other income was as follows:
| For the Year Ended December 31, | |||||||||||||||||
| 2020 | 2019 | 2018 | |||||||||||||||
| (In thousands) | |||||||||||||||||
| Revenue from contracts with customers included in: | |||||||||||||||||
| Fees and service charges | $ | ||||||||||||||||
| Other income | |||||||||||||||||
| Total revenue from contracts with customers | $ | ||||||||||||||||
For our contracts with customers, we satisfy our performance obligations each day as services are rendered. For our deposit account revenue, we receive payment on a daily basis as services are rendered and for our non-deposit investment account revenue, we receive payment on a monthly basis from our third-party service provider as services are rendered.
138
23. Recent Accounting Pronouncements
Standards Adopted in 2020 | |||||||||||
Standard | Description | Required date of adoption | Effect on Consolidated Financial Statements | ||||||||
| Measurement of Credit Losses on Financial Instruments | This ASU changes how entities report credit losses for financial assets held at amortized cost and available-for-sale debt securities. The amendments replace the “incurred loss” approach with a methodology that incorporates macroeconomic forecast assumptions and management judgments applicable to and through the expected life of the portfolios based on relevant information about past events, including historical loss experience, current conditions, and reasonable and supportable forecasts that affect the collectability of the reported amounts. The amendments apply to financial assets such as loans, leases and held-to-maturity investments; and certain off-balance sheet credit exposures. The amendments expand credit quality disclosure requirements. | January 1, 2020 | The Company adopted the standard’s provisions and all of its related updates on January 1, 2020. The amendments were applied on a modified retrospective basis. See Note 1 - Summary of Significant Accounting Principles for information on the impact of the adoption of ASU 2016-13 on the Company’s Consolidated Financial Statements. | ||||||||
Intangibles-Goodwill and Other- Internal-Use Software (Subtopic 350-40): Customer’s Accounting for Implementation Costs Incurred in a Cloud Computing Arrangement That Is a Service Contract (a consensus of the FASB Emerging Issues Task Force) | This new guidance aligns the requirements for capitalizing implementation costs incurred in a hosting arrangement that is a service contract with the requirements for capitalizing implementation costs incurred to develop or obtain internal-use software. Specifically, where a cloud computing arrangement includes a license to internal-use software, the software license is accounted for by the customer in accordance with Subtopic 350-40, “Intangibles- Goodwill and Other-Internal-Use Software”. | January 1, 2020 Early adoption permitted | The Company will apply the amendments in this Update prospectively to all implementation costs incurred after January 1, 2020. The adoption of ASU No. 2018-15 did not have an impact on the Company’s Consolidated Financial Statements. | ||||||||
| Fair Value Measurement (Topic 820): Disclosure Framework-Changes to the Disclosure Requirements for Fair Value Measurement | The amendments remove the requirement to disclose the amount of, and reasons for, transfers between Level 1 and Level 2 of the fair value hierarchy, the policy for timing of such transfers and the valuation processes for Level 3 fair value measurements. The ASU modifies the disclosure requirements for investments in certain entities that calculate net asset value and clarify the purpose of the measurement uncertainty disclosure. The ASU adds disclosure requirements about the changes in unrealized gains and losses included in other comprehensive income for recurring Level 3 fair value measurements and the range and weighted average of significant unobservable inputs used to develop Level 3 fair value measurements. | January 1, 2020 Early adoption permitted to any removed or modified disclosures and delay of adoption of additional disclosures until the effective date | Changes should be applied retrospectively to all periods presented upon the effective date with the exception of the following, which should be applied prospectively: disclosures relating to changes in unrealized gains and losses, the range and weighted average of significant unobservable inputs used to develop Level 3 fair value measurements, and the disclosures for uncertainty measurement. The adoption of ASU 2018-13 did not have an impact on the Company’s Consolidated Financial Statements. | ||||||||
| Intangibles - Goodwill and Other (Topic 350): Simplifying the Test for Goodwill Impairment | This ASU simplifies subsequent measurement of goodwill by eliminating Step 2 of the impairment test while retaining the option to perform the qualitative assessment for a reporting unit to determine whether the quantitative impairment test is necessary. The ASU also eliminates the requirements for any reporting unit with a zero or negative carrying amount to perform a qualitative assessment and, if it fails that qualitative test, to perform Step 2 of the goodwill impairment test. Therefore, the same impairment assessment applies to all reporting units. | January 1, 2020 Early adoption permitted for interim or annual goodwill impairment testing dates beginning after January 1, 2017 | The Company is applying the amendments in ASU 2017-04 prospectively for goodwill impairment testing conducted after January 1, 2020. | ||||||||
139
24. Subsequent Events
140
| (a)(3) | Exhibits | ||||
The following exhibits are either filed as part of this report or are incorporated herein by reference:
141
| 101 | Interactive data files pursuant to Rule 405 of Regulation S-T: (i) the Consolidated Balance Sheets, (ii) the Consolidated Statements of Income, (iii) the Consolidated Statements of Comprehensive Income, (iv) the Consolidated Statements of Stockholders’ Equity, (v) the Consolidated Statements of Cash Flows, and (vi) related notes to these financial statements | |||||||
| 104 | Cover Page Interactive Data File (embedded in the cover page formatted in Inline XBRL) | |||||||
| (1) | Incorporated by reference to the Registration Statement on Form S-1 of Investors Bancorp, Inc. (Commission File no. 333-192966), originally filed with the Securities and Exchange Commission on December 20, 2013. | ||||
| (2) | Incorporated by reference to Exhibit 10.1 to the Current Report on Form 8-K of Investors Bancorp, Inc. (Commission File No. 000-51557) filed with the Securities and Exchange Commission on April 1, 2010. | ||||
| (3) | Incorporated by reference to Exhibits 10.1, 10.2 and 10.3 to the Quarterly Report on 10-Q of Investors Bancorp, Inc. (Commission File No. 001-36441) filed with the Securities and Exchange Commission on May 10, 2016. | ||||
| (4) | Incorporated by reference to Exhibit 10.2 to the Current Report on Form 8-K of Investors Bancorp, Inc. (Commission File No. 000-51557) filed with the Securities and Exchange Commission on April 1, 2010. | ||||
| (5) | Incorporated by reference to Exhibit 10.5 to the Annual Report on Form 10-K of Investors Bancorp, Inc. (Commission File No. 001-36441) filed with the Securities and Exchange Commission on March 3, 2015. | ||||
| (6) | Incorporated by reference to Appendix A to the Definitive Proxy Statement for Investors Bancorp, Inc.’s 2015 Annual Meeting of Stockholders (Commission File No. 001-36441) filed with the Securities and Exchange Commission on April 30, 2015. | ||||
| (7) | Incorporated by reference to Appendix B to the Definitive Proxy Statement for Investors Bancorp, Inc.’s 2006 Annual Meeting of Stockholders (Commission File No. 000-51557) filed with the Securities and Exchange Commission on September 15, 2006. | ||||
| (8) | Incorporated by reference to Annex D to the Definitive Proxy Statement for Investors Bancorp, Inc.’s 2013 Annual Meeting of Stockholders (Commission File No. 000-51557) filed with the Securities and Exchange Commission on April 29, 2013. | ||||
| (9) | Incorporated by reference to the Amended Registration Statement on Form S-1 of Investors Bancorp, Inc. (Commission File No. 333-192966) filed with the Securities and Exchange Commission on February 11, 2014. | ||||
| (10) | Incorporated by reference to Exhibits 10.15 and 10.16 to the Annual Report on Form 10-K of Investors Bancorp, Inc. (Commission File No. 001-36441) filed with the Securities and Exchange Commission on March 1, 2017. | ||||
| (11) | Incorporated by reference to Exhibits 10.1 and 10.2 to the Quarterly Report on Form 10-Q of Investors Bancorp, Inc. (Commission File No. 001-36441) filed with the Securities and Exchange Commission on May 10, 2017. | ||||
| (12) | Incorporated by reference to Exhibits 10.1 and 10.2 to the Current Report on Form 8-K of Investors Bancorp, Inc. (Commission File No. 001-36441) filed with the Securities and Exchange Commission on July 10, 2018. | ||||
| (13) | Incorporated by reference to Exhibit 10.1 to the Current Report on Form 8-K of Investors Bancorp, Inc. (Commission File No. 001-36441) filed with the Securities and Exchange Commission on December 7, 2018. | ||||
| (14) | Incorporated by reference to Exhibit 10.1 to the Quarterly Report on Form 10-Q of Investors Bancorp, Inc. (Commission File No. 001-36441) filed with the Securities and Exchange Commission on May 10, 2019. | ||||
| (15) | Incorporated by reference to Exhibit 2.1 to the Current Report on Form 8-K of Investors Bancorp, Inc. (Commission File No. 001-36441) filed with the Securities and Exchange Commission on July 30, 2019. | ||||
| (16) | Incorporated by reference to Exhibit 10.1 to the Current Report on Form 8-K of Investors Bancorp, Inc. (Commission File No. 001-36441) filed with the Securities and Exchange Commission on December 18, 2019. | ||||
| (17) | Incorporated by reference to Exhibit 2.1 to the Current Report on Form 8-K of Investors Bancorp, Inc. (Commission File No. 001-36441) filed with the Securities and Exchange Commission on December 3, 2020. | ||||
| (18) | Incorporated by reference to Exhibit 4.2 to the Annual Report on Form 10-K of Investors Bancorp, Inc. (Commission File No. 001-36441) filed with the Securities and Exchange Commission on February 28, 2020. | ||||
142
| ITEM 16. | FORM 10-K SUMMARY | ||||
None.
143
SIGNATURES
Pursuant to the requirements of Section 13 or 15(d) of the Securities Exchange Act of 1934, the Registrant has duly caused this report to be signed on its behalf by the undersigned, thereunto duly authorized.
| INVESTORS BANCORP, INC. | |||||||||||||||||
| Date: | March 1, 2021 | By: | /s/ Kevin Cummings | ||||||||||||||
| Kevin Cummings Chief Executive Officer (Principal Executive Officer) (Duly Authorized Representative) | |||||||||||||||||
Pursuant to the requirements of the Securities Exchange of 1934, this report has been signed below by the following persons on behalf of the Registrant and in the capacities and on the dates indicated.
144
| Signatures | Title | Date | ||||||||||||
/s/ Kevin Cummings Kevin Cummings | Director, Chairman and Chief Executive Officer (Principal Executive Officer) | March 1, 2021 | ||||||||||||
/s/ Domenick Cama Domenick Cama | Director, President and Chief Operating Officer | March 1, 2021 | ||||||||||||
/s/ Sean Burke Sean Burke | Chief Financial Officer and Executive Vice President (Principal Financial and Accounting Officer) | March 1, 2021 | ||||||||||||
/s/ Robert C. Albanese Robert C. Albanese | Director | March 1, 2021 | ||||||||||||
/s/ Dennis M. Bone Dennis M. Bone | Director | March 1, 2021 | ||||||||||||
/s/ Doreen R. Byrnes Doreen R. Byrnes | Director | March 1, 2021 | ||||||||||||
/s/ William Cosgrove William Cosgrove | Director | March 1, 2021 | ||||||||||||
/s/ James Garibaldi James Garibaldi | Director | March 1, 2021 | ||||||||||||
/s/ John E. Harmon, Sr. John E. Harmon, Sr. | Director | March 1, 2021 | ||||||||||||
/s/ Michele N. Siekerka Michele N. Siekerka | Director | March 1, 2021 | ||||||||||||
/s/ Paul N. Stathoulopoulos Paul N. Stathoulopoulos | Director | March 1, 2021 | ||||||||||||
/s/ Kim Wales Kim Wales | Director | March 1, 2021 | ||||||||||||
/s/ James H. Ward III James H. Ward III | Director | March 1, 2021 | ||||||||||||
145
Serious News for Serious Traders! Try StreetInsider.com Premium Free!
You May Also Be Interested In
- IHT S-3 OPENS DOORS FOR DIVERSIFICATION CAPITAL INFUSION
- Ridgeline Minerals Announces Upsized Non-Brokered Private Placement to $2.2M
- Elevate Textiles Names Jeffrey P. Pritchett Chief Executive Officer and Director of the Board
Create E-mail Alert Related Categories
SEC FilingsSign up for StreetInsider Free!
Receive full access to all new and archived articles, unlimited portfolio tracking, e-mail alerts, custom newswires and RSS feeds - and more!
