

Form 10-K Integer Holdings Corp For: Dec 31
 Tweet
Tweet Share
ShareUNITED STATES
SECURITIES AND EXCHANGE COMMISSION
Washington, D.C. 20549
_____________________________________
FORM 10-K
_____________________________________
ANNUAL REPORT PURSUANT TO SECTION 13 or 15(d)
OF THE SECURITIES EXCHANGE ACT OF 1934
(Mark One) | ||||||||
ANNUAL REPORT PURSUANT TO SECTION 13 or 15(d) OF THE SECURITIES EXCHANGE ACT OF 1934 | ||||||||
For The Fiscal Year Ended December 31 , 2020
or
| TRANSITION REPORT PURSUANT TO SECTION 13 OR 15(d) OF THE SECURITIES EXCHANGE ACT OF 1934 | |||||
For the transition period from ____ to ____
Commission File Number 1-16137
_____________________________________

(Exact name of Registrant as specified in its charter)
_____________________________________
| (State or other jurisdiction of incorporation or organization) | (I.R.S. Employer Identification No.) | |||||||
| (Address of principal executive offices) | (Zip Code) | ||||||||||||||||
(214 ) 618-5243
(Registrant’s telephone number, including area code)
Securities Registered Pursuant to Section 12(b) of the Act:
| Title of each class | Trading Symbol(s) | Name of each exchange on which registered | ||||||||||||
Securities Registered Pursuant to Section 12(g) of the Act: None
Indicate by check mark if the registrant is a well-known seasoned issuer, as defined in Rule 405 of the Securities Act.
Indicate by check mark if the registrant is not required to file reports pursuant to Section 13 or Section 15(d) of the Act.
Yes ☐ No ☒
Indicate by check mark whether the registrant (1) has filed all reports required to be filed by Section 13 or 15(d) of the Securities Exchange Act of 1934 during the preceding 12 months (or for such shorter period that the registrant was required to file such reports), and (2) has been subject to such filing requirements for the past 90 days.
Indicate by checkmark whether the registrant has submitted electronically every Interactive Data File required to be submitted pursuant to Rule 405 of Regulation S-T (§232.405 of this chapter) during the preceding 12 months (or for such shorter period that the registrant was required to submit such files).
Indicate by check mark whether the registrant is a large accelerated filer, an accelerated filer, a non-accelerated filer, a smaller reporting company, or emerging growth company. See the definitions of “large accelerated filer,” “accelerated filer,” “smaller reporting company,” and “emerging growth company” in Rule 12b-2 of the Exchange Act.
| ☒ | Accelerated filer | ☐ | ||||||||||||
| Non-accelerated filer | ☐ | Smaller reporting company | ||||||||||||
| Emerging growth company | ||||||||||||||
If an emerging growth company, indicate by check mark if the registrant has elected not to use the extended transition period for complying with any new or revised financial accounting standards provided pursuant to Section 13(a) of the Exchange Act. ☐
Indicate by check mark whether the registrant has filed a report on and attestation to its management’s assessment of the effectiveness of its internal control over financial reporting under Section 404(b) of the Sarbanes-Oxley Act (15 U.S.C. 7262(b)) by the registered public accounting firm that prepared or issued its audit report.
Yes ☒ No ☐
Indicate by check mark whether the registrant is a shell company (as defined in Rule 12b-2 of the Act). Yes ☐ No ☒
The aggregate market value of common stock held by non-affiliates as of July 2, 2020 (the last business day of the registrant’s most recently completed second fiscal quarter), based on the last sale price of $72.28, as reported on the New York Stock Exchange on that date: $2.3 billion. Solely for the purpose of this calculation, shares held by directors and officers and 10 percent stockholders of the registrant have been excluded. This exclusion should not be deemed a determination or an admission that these individuals are, in fact, affiliates of the registrant.
Shares of common stock outstanding as of February 12, 2021: 32,957,035
DOCUMENTS INCORPORATED BY REFERENCE
Portions of the following document are specifically incorporated by reference into the indicated parts of this report:
| Document | Part | |||||||
| Proxy Statement for the 2021 Annual Meeting of Stockholders | Part III, Item 10 “Directors, Executive Officers and Corporate Governance” | |||||||
| Part III, Item 11 “Executive Compensation” | ||||||||
| Part III, Item 12 “Security Ownership of Certain Beneficial Owners and Management and Related Stockholder Matters” | ||||||||
| Part III, Item 13 “Certain Relationships and Related Transactions, and Director Independence” | ||||||||
| Part III, Item 14 “Principal Accounting Fees and Services” | ||||||||
TABLE OF CONTENTS
| PAGE | ||||||||
| Item 1. | Business..................................................................................................................................................................... | |||||||
| Item 1A. | Risk Factors............................................................................................................................................................... | |||||||
| Item 1B. | Unresolved Staff Comments...................................................................................................................................... | |||||||
| Item 2. | Properties................................................................................................................................................................... | |||||||
| Item 3. | Legal Proceedings..................................................................................................................................................... | |||||||
| Item 4. | Mine Safety Disclosures............................................................................................................................................ | |||||||
| Item 5. | ||||||||
| Item 6. | Selected Financial Data............................................................................................................................................. | |||||||
| Item 7. | Management’s Discussion and Analysis of Financial Condition and Results of Operations.................................... | |||||||
| Item 7A. | Quantitative and Qualitative Disclosures About Market Risk.................................................................................. | |||||||
| Item 8. | Financial Statements and Supplementary Data......................................................................................................... | |||||||
| Item 9. | Changes in and Disagreements With Accountants on Accounting and Financial Disclosure................................... | |||||||
| Item 9A. | Controls and Procedures............................................................................................................................................ | |||||||
| Item 9B. | Other Information...................................................................................................................................................... | |||||||
| Item 10. | Directors, Executive Officers and Corporate Governance........................................................................................ | |||||||
| Item 11. | Executive Compensation........................................................................................................................................... | |||||||
| Item 12. | ||||||||
| Item 13. | Certain Relationships and Related Transactions, and Director Independence.......................................................... | |||||||
| Item 14. | Principal Accounting Fees and Services.................................................................................................................... | |||||||
| Item 15. | Exhibits and Financial Statement Schedules............................................................................................................. | |||||||
| Item 16. | Form 10-K Summary................................................................................................................................................. | |||||||
Signatures.................................................................................................................................................................. | ||||||||
- 2 -
PART I
ITEM 1. BUSINESS
OVERVIEW
Integer Holdings Corporation, headquartered in Plano, Texas, is among the world’s largest medical device outsource (“MDO”) manufacturing companies, serving the cardiac, neuromodulation, orthopedics, vascular, advanced surgical and portable medical markets. We provide innovative, high quality medical technologies that enhance the lives of patients worldwide. In addition to medical technologies, we develop batteries for high-end niche applications in energy, military, and environmental markets. Our brands include Greatbatch Medical®, Lake Region Medical® and Electrochem®. Our primary customers include large, multi-national original equipment manufacturers (“OEMs”) and their affiliated subsidiaries. When used in this report, the terms “Integer,” “we,” “us,” “our” and the “Company” mean Integer Holdings Corporation and its subsidiaries.
We organize our business into two reportable segments, Medical and Non-Medical, and derive our revenues from four principal product lines. The Medical segment includes the Cardio & Vascular, Cardiac Rhythm Management & Neuromodulation (“Cardiac & Neuromodulation”) and Advanced Surgical, Orthopedics & Portable Medical product lines and the Non-Medical segment comprises the Electrochem product line.
Our Acquisitions and Divestitures
On February 19, 2020, we acquired certain assets and liabilities of InoMec Ltd. (“InoMec”), a privately-held company based in Israel that specializes in the research, development and manufacturing of medical devices, including minimally invasive tools, delivery systems, tubing and catheters, surgery tools, drug-device combination, laser combined devices, and tooling and production. The acquisition enables us to create a research and development center in Israel, closer to the customer base in the region. Refer to Note 2 “Business Acquisitions, Divestiture and Discontinued Operations” of the Notes to Consolidated Financial Statements contained in Item 8 of this report for additional information about the acquisition.
On October 7, 2019, we acquired certain assets and liabilities of US BioDesign, LLC (“USB”), a privately-held developer and manufacturer of complex braided biomedical structures for disposable and implantable medical devices. The acquisition added a differentiated capability related to the complex development and manufacture of braided and formed biomedical structures to our broad portfolio, that we believe further positions us as a partner of choice for innovative medical technologies. Refer to Note 2 “Business Acquisitions, Divestiture and Discontinued Operations” of the Notes to Consolidated Financial Statements contained in Item 8 of this report for additional information about the acquisition.
On July 2, 2018, we completed the sale of the Advanced Surgical and Orthopedic product lines (the “AS&O Product Line”) to Viant. As a result, we classified the results of operations of the AS&O Product Line as discontinued operations in the Consolidated Statements of Operations for all periods presented and classified the related assets and liabilities associated with the discontinued operations as held for sale in the Consolidated Balance Sheet as of December 29, 2017. All results and information presented exclude the AS&O Product Line unless otherwise noted. Refer to Note 2 “Business Acquisitions, Divestiture and Discontinued Operations” of the Notes to Consolidated Financial Statements contained in Item 8 of this report for additional information about the divestiture.
On October 27, 2015, we completed the acquisition of Lake Region Medical Holdings, Inc. (“LRM”), headquartered in Wilmington, MA, in a cash and stock transaction for a total purchase price including debt assumed of approximately $1.77 billion. LRM was primarily a manufacturer of interventional and diagnostic wire-formed medical devices and components specializing in minimally invasive devices for cardiovascular, endovascular, and neurovascular applications. The acquisition of LRM added scale and diversity to our legacy operations, which has enhanced our opportunities to access customers and customer experience by providing a more comprehensive portfolio of technologies.
- 3 -
MEDICAL SEGMENT
Cardio & Vascular
The Cardio & Vascular product line leverages a global footprint to produce a full range of components, subassemblies, and finished devices used in interventional cardiology, structural heart, heart failure, peripheral vascular, neurovascular, interventional oncology, electrophysiology, vascular access, infusion therapy, hemodialysis, urology, and gastroenterology procedures.
The following are the principal products and services offered by our Cardio & Vascular product line:
Interventional Cardiology. Our interventional cardiology portfolio is focused primarily on the design, development and manufacture of catheter and wire-based technologies intended to diagnose and treat cardiac disease. Key products and capabilities span a full suite of devices including coronary stents, balloon catheters, atherectomy devices, imaging and sensing devices, chronic total occlusion solutions, percutaneous transluminal coronary amgioplasty and access guidewires, introducer sheaths, and vascular closure devices. Core areas of technical expertise include laser-cut hypotubes, catheter shafts (extrusion, filmcast, and reflow), integrated hub assemblies, pad printing, tip shaping, polytetrafluoroethylene (PTFE) coating, complex machining, and sensor integration.
Structural Heart and Heart Failure. Structural heart and heart failure products include those used by cardiologists, echocardiographers, cardiac surgeons, and heart failure specialists to treat diseases or defects of the heart, such as valvular diseases and congenital defects. Integer provides components, subassemblies, and finished devices to these markets leveraging a wide range of technologies and capabilities. These include laser-cut and machined components, complex braided meshes, guidewires, introducer sheaths, steerable sheaths and delivery catheters, and implants used in transcatheter aortic valve replacement, balloon aortic valvuloplasty, transcatheter mitral valve repair and replacement, atrial and defect closure, left ventricular assist, and shunt procedures.
Peripheral Vascular, Neurovascular, and Interventional Oncology. Our peripheral vascular, neurovascular, urology and oncology portfolio is primarily focused on the design, development and manufacture of devices used during the treatment of peripheral artery disease, transcatheter embolization and occlusion, aortic aneurysm repair, and neurovascular stroke prevention. Our broad portfolio of devices, capabilities and technology platforms provides our customers with cost effective, high quality solutions ranging from device components to complex assemblies to finished devices such as regulatory approved guidewires and introducers.
Integer’s broad technology and capability portfolio within the peripheral vascular markets enables us to address the full spectrum of devices needed in the diagnoses and treatment of peripheral vascular disease. In the peripheral artery disease markets our technologies are focused on the manufacture and development of interventional guidewires, support catheters, introducers and guiding sheaths, balloon catheters, self-expanding stents and stent grafts as well as embolic protection devices. Our neurovascular technology portfolio encompasses micro guidewires, micro and access catheters, aspiration catheters, stent retrievers, embolization coils, as well as flow diverters. In the interventional oncology market, we offer customers guidewires and microcatheters designed to enable the effective delivery of embolic agents.
Electrophysiology. Electrophysiology products include devices used by electrophysiologists and interventional cardiologists for the treatment of cardiac arrythmias, such as atrial fibrillation. Integer primarily produces devices used for treatment of atrial fibrillation, the most prevalent cardiac arrythmia. These devices include sheaths and needles for transseptal access, diagnostic and mapping catheters to record and map the arrythmia sources, and ablation catheters to create lesions for blocking the arrythmia signals. Integer has the technical capabilities and expertise to provide the full spectrum of products from components to finished devices. Typical components include polyimide tubing, electrode rings, platinum tips and fine wires. Sub-assemblies include electrode ring and wire assemblies, steerable handle assemblies, and spline and basket assemblies. Finished devices include steerable transseptal sheaths, diagnostic catheters and ablation catheters.
Vascular Access, Infusion Therapy and Hemodialysis. Our solutions in these markets are focused on vessel access, treatment and device placement for medication and fluid delivery in patients with severe conditions requiring repeated vessel access. We design and manufacture a wide range of vascular access guidewires, stylets, catheters, valved / non-valved peelable and micro introducers. Our portfolio of market-ready vascular access guidewires and introducers kits enables a range of venous and arterial access applications, including transradial access. Additionally, we support customers with custom introducer sheaths and kit solutions leveraging our deep expertise in thin-wall sheath design, hydrophilic coatings and guidewire manufacturing (including poly-jacketed, mandrel, and nitinol core guidewire constructions).
- 4 -
Non-vascular Markets: Within the Cardio & Vascular group, we also manage non-vascular markets for which we have expertise and a broad offering of products, technologies and capabilities. Those markets include:
Urology. Our main focus is in endourology for which we develop and manufacture finished devices and components for access and interventional devices such as guidewires, ureteral access sheaths, dilation devices, retrieval devices, ureteral stents, biopsy forceps, holmium laser fibers, and endoscopes.
Gastroenterology. Our comprehensive range of technologies and capabilities enable us to support our customers’ needs with a broad variety of products such as guidewires, dilatation devices, retrieval devices, snares, wire-formed and polymer stents, stent delivery systems, RF ablation devices, and endoscopes.
Cardiac & Neuromodulation
The Cardiac & Neuromodulation product line offers design, development and manufacturing capabilities for components, sub-assemblies, assemblies, and finished medical device systems. We support a variety of clinical markets, with an emphasis on the following markets:
Cardiac Rhythm Management. The Cardiac Rhythm Management (“CRM”) market comprises implanted medical devices (“IMDs”), implanted leads, procedure accessories, as well as external devices that monitor and treat heart rhythm disorders and heart disease. Examples of CRM products include implantable pacemakers, implantable cardioverter defibrillators (“ICDs”), insertable cardiac monitors (“ICMs”), implantable cardiac pacing and defibrillation leads, and heart failure therapies such as ventricular assist devices and cardiac resynchronization devices (“CRT-P” and “CRT-D”). An IMD system generally includes an implantable pulse generator (“IPG”) and one or more stimulation leads. An IPG is a small battery powered device implanted under the skin in the chest that can sense and produce electrical pulses through specialized wires called leads. These leads sense electrical heart signals and carry them back to the IPG which in turn delivers electrical pulses back through the lead to the heart to deliver therapy.
Our portfolio of technologies and products include components, sub-assemblies, and assemblies for active IPGs, implanted sensing and stimulation leads, accessories, or external instruments. Our investments in research and development have created leadership positions in battery, capacitor, and feedthrough technology, including filtered feedthroughs. We are also a supplier of medical stamped components, and shallow and deep draw casings and assemblies.
Beyond the IPG, Integer’s CRM product line provides lead development and manufacturing solutions including expertise in low-polarization specialty-coated electrodes and components, and lead and device accessories such as stylets, guidewires, introducers, and lead adapters. Integer also offers fully designed and manufactured epicardial pacing leads.
Neuromodulation. Similar to the CRM market, the Neuromodulation (“Neuro”) market comprises IPGs, implanted leads, procedure accessories, and external devices, such as battery chargers, trial stimulators and patient controllers. Examples of Neuro products include implantable spinal cord stimulators for chronic pain, sacral nerve stimulators for incontinence, deep brain stimulators for movement disorders and other IMDs to treat psychiatric disorders, sleep disorders and hearing loss. The Neuro market also includes several new emerging applications, such as implanted bioelectronic devices aimed at treating chronic diseases.
Within the Neuro market we offer IMD component technologies that have been developed to meet the needs of our customers including our Xcellion® line of lithium-ion rechargeable batteries, QMR® and CFx non-rechargeable batteries, feedthroughs, device enclosures, machined components and lead components and sub-assemblies. Additionally, Integer helps OEMs and other emerging companies with the development and manufacture of complete neuromodulation IMD solutions, including custom IPGs, programmer systems, battery chargers, patient controllers, fully finished lead systems and accessories from initial development through commercial quantities.
- 5 -
Advanced Surgical, Orthopedics & Portable Medical
The Advanced Surgical, Orthopedics & Portable Medical (“AS&O”) product line offers a broad range of products and services across the many businesses it serves. This product line includes sales to the acquirer of our AS&O Product Line, Viant. In partnership with customers, AS&O offers advanced development, engineering and program management, which provides us with an in-depth understanding of our customers’ market drivers and end-user needs.
The following are the principal products and services offered by our AS&O product line:
Portable Medical. We are a leading provider of advanced batteries and power solutions for global OEMs. We specialize in the design and manufacture of Li-ion battery packs and chargers. Through the combination of our innovative research and development expertise, manufacturing excellence and leading customer partnerships we advance the way healthcare is powered. Our offerings include customized rechargeable batteries and chargers to power medical devices across multiple clinical markets including patient monitoring, ventilators, portable defibrillators, and portable ultrasound, X-Ray machines, hearing devices, and LVAD devices. We collaborate with our customers on product development opportunities incorporating our power solutions into Class I, II or III medical devices.
Minimally Invasive & General Surgery. Our minimally invasive and general surgery products are primarily arthroscopic, laparoscopic, and general surgery devices and components used for minimally invasive procedures in the joint, abdominal, gastroesophageal reflux disease (“GERD”), ophthalmology, oncology, and general surgery spaces. Our products include, harmonic scalpels, shaver blades, burr shavers, radio frequency probes, biopsy probes, trocars, electrocautery components, wound dressings, GERD treatment components, and phacoemulsification needles.
Orthopedic. Our orthopedic products include instruments used in hip, knee, and spine surgeries. Our products primarily consist of reamers and chisels.
NON-MEDICAL SEGMENT
Our power solutions enable the success and advancement of our customers’ critical non-medical applications. We provide custom battery packs to the energy, military and environmental markets for use in extreme environments where failure is not an option.
The following are the principal products and services offered by our Non-Medical product line:
Electrochem. Electrochem provides customized battery power and management systems, charging and docking stations, and power supplies to markets where safety, reliability, quality and durability are critical. We design customized primary (non-rechargeable) and secondary (rechargeable) battery solutions, which are used in the energy, military and environmental markets.
Electrochem’s primary lithium power solutions, which include high, moderate and low rate non-rechargeable cell solutions, are utilized in extreme conditions and can withstand exceptionally high and low temperatures, and high shock and vibration. Electrochem’s product design capability includes protective circuitry, glass-to-metal hermetic seals, fuses and diodes to help ensure safe, durable and reliable power as devices using our battery solutions are subjected to harsh conditions. Electrochem also manufactures complementary technologies in the form of real time battery monitoring, and an alternate power technology in the form of high temperature super capacitors. Our primary batteries are often used in remote and demanding environments, including down hole drilling tools, military devices, and oceanographic buoys.
In addition to primary power solutions, Electrochem offers customized secondary or rechargeable battery packs, in a diverse range of chemistries for critical applications requiring rechargeable solutions.
OTHER FACTORS IMPACTING OUR OPERATIONS
Customers
Our products are designed to provide reliable, long-lasting solutions that meet the evolving requirements and needs of our customers. The nature and extent of our commercial relationships with each of our customers are different in terms of breadth of products purchased, product volumes, length of contractual commitment, ordering patterns, inventory management, and selling prices. Contracts with customers can include rebates and tiered pricing arrangements based on pre-determined volume levels, in which higher volume levels typically have lower pricing, or fixed annual price downs that are offered to customers in exchange for increased volume levels and/or longer contract terms. Typically, our contracts specify minimum order quantities and lead times.
- 6 -
We have limited visibility into our customers’ future purchases, covering only a relatively short period of time. Our customers may have inventory management programs, vertical integration plans and/or alternate supply arrangements that may not be communicated to or shared with us. Additionally, the relative market share among the OEM manufacturers changes periodically, which may cause customer inventory levels to rebalance to match new demand. Consequently, these and other factors can significantly impact our sales in any given period. Our customers may initiate field actions with respect to market-released products. These actions may include product recalls or communications with a significant number of physicians about a product or labeling issue. The scope of such actions can range from very minor issues affecting a small number of units to more significant actions.
Our Medical customers include large multi-national medical device OEMs and their subsidiaries such as Abbott Laboratories, Medtronic, and Boston Scientific. Our Non-Medical customers include large multi-national OEMs and their subsidiaries serving the energy, military and environmental services markets such as Halliburton, and Baker Hughes. During 2020, sales to Abbott Laboratories, Medtronic and Boston Scientific were each in excess of 10% of total sales and collectively accounted for 48 % of our total sales. We believe that the diversification of our sales among the various subsidiaries and market segments with those three customers reduces our exposure to negative developments with any one customer. The loss of a significant amount of business from any large customer or a further consolidation of such customers could have a material adverse effect on our financial condition and results of operations, as further explained in Item 1A “Risk Factors” of this report.
Sales and Marketing
We sell our products directly to our customers. In 2020, approximately 56% of our products were sold in the U.S. Sales within and outside the U.S. are primarily to customers whose corporate offices are located and headquartered in the U.S. Information regarding our sales by geographic area is set forth in Note 18 “Segment and Geographic Information” of the Notes to Consolidated Financial Statements contained in Item 8 of this report.
Although the majority of our customers contract with us to develop custom components and assemblies to fit their product specifications, we also provide system and device solutions ready for market distribution by OEMs. We have established close working relationships between our internal program managers and our customers. We market our products and technologies at industry meetings and trade shows domestically and internationally. We have placed additional emphasis on reaching long-term agreements with our OEM customers to secure our revenue base and incentivize growth.
Internal account executives support all sales activity and involve engineers and technology professionals in the sales process to address customer requests across all product lines. For system and device solutions, we partner with our customers’ research, marketing, and clinical groups to jointly develop technology platforms in alignment with their product roadmaps and therapy needs.
We leverage our account executives with support from our engineers to design and sell product solutions into our targeted markets. Our account executives are trained to assist our customers in selecting appropriate materials and configurations. We market our products and services through well-defined selling strategies and marketing campaigns that are customized for each of the industries we target.
Firm backlog orders at December 31, 2020 were approximately $289 million. The majority of the orders outstanding at December 31, 2020 are expected to be shipped within one year.
Competition
The MDO manufacturing industry has traditionally been highly fragmented with several thousand companies, many of which we believe have limited manufacturing capabilities and limited sales and marketing expertise. We believe that very few companies offer the scope of manufacturing capabilities and services that we provide to medical device companies, however, we may compete in the future against other companies that provide broad manufacturing capabilities and related services. We compete against different companies depending on the type of product or service offered or the geographic area served. We also face competition from existing and prospective customers that employ in-house capabilities to produce some of the products we provide.
Our existing or potential competitors include suppliers with different subsets of our manufacturing capabilities, suppliers that concentrate in niche markets, and suppliers that have, are developing, or may in the future develop, broad manufacturing capabilities and related services. We compete for new business at all phases of the product life cycle, which includes development of new products, the redesign of existing products and transfer of mature product lines to outsourced manufacturers. Competitive advantage is generally based on reputation, quality, delivery, responsiveness, breadth of capabilities, including design and engineering support, price, customer relationships and increasingly the ability to provide complete supply chain solutions rather than only producing and providing individual components.
- 7 -
Acquisitions and Investments
One facet of our growth strategy is to acquire additional technology or manufacturing capability to expand our product offering in our key existing growth markets. We expect to continue to engage in business development activities and technology licensing arrangements to support our growth in these markets.
As our customers grow and consolidate, they seek suppliers who can offer broad product capabilities, manufacturing scale and facilitate speed to market. Our strategy aligns with enhancing our portfolio from both organic and inorganic means to partner more broadly with our customers to support their growth. Our inorganic strategy will be primarily focused on smaller strategic “bolt-on” acquisitions that will supplement our existing product portfolio.
Research and Product Development
Our position as a leading developer and manufacturer of medical devices and components is largely the result of our long history of technological innovation. Our scientists, engineers and technicians focus on developing new products, improving and enhancing existing products, and expanding the use of our products in new or tangential applications. In addition to our internal technology and capability development efforts aimed at providing our customers with differentiated solutions, we also engage outside research institutions for unique technology projects.
Medical. We believe our core business is well positioned because our OEM customers leverage our portfolio of intellectual property. We continue to build a healthy pipeline of diverse medical technology opportunities and provide a new level of industry leading capabilities and services to our OEM customers across the full range of medical device products and services continuum. We are at the forefront of innovating technologies and products that help change the face of healthcare, enabling us to provide our customers with a distinct advantage as they bring complete medical systems and solutions to market. In turn, our customers are able to accelerate patient access to life enhancing therapies. We offer our customers a comprehensive portfolio comprising the best technologies, providing a single point of support, and driving optimal outcomes.
Some of the more significant product development opportunities our Medical segment is pursuing are as follows:
| Product Line | Product Development Projects | |||||||||||||
| Cardio & Vascular | Active projects in structural heart delivery systems subassemblies, structural heart delivery accessories, structural heart implants, electrophysiology catheters, accessories and subassemblies, peripheral vascular catheters and guidewires, neurovascular therapies to prevent hemorrhagic, neurovascular therapies to treat ischemic stroke, enhanced access introducers, gastrointestinal scope components, fractional flow reserve guidewire subassemblies, sensor-enabled catheters and guidewires, and oncology catheters. Technology investments to enable our customer’s catheter, delivery system, introducer, guidewire, and implant development programs in our core Cardio & Vascular markets. | |||||||||||||
| Cardiac & Neuromodulation | Active projects to develop next generation technology programs for our batteries, filtered feedthroughs, high voltage capacitors and finished device solutions including both leads and IPG systems that reduce the size and cost, while improving performance, for cardiac and neuromodulation devices. | |||||||||||||
Non-Medical. Some of the more significant product development opportunities in our Non-Medical segment are next generation medium-rate and high-rate batteries that offer extended performance such as higher power pulsing capabilities and increased operating temperature range, real time battery monitoring, and high temperature super capacitors.
Patents and Proprietary Technology
Our policy is to protect our intellectual property rights related to our technologies and products, and we rely on a combination of patents, licenses, trade secrets and know-how to establish and protect our rights. Where appropriate, we apply for U.S. and foreign patents. We also are a party to license agreements with third parties under which we have obtained, on varying terms, exclusive or non-exclusive rights to patents held by them. In the aggregate, these intellectual property assets and licenses are of material importance to our business; however, we believe that no single patent, technology, trademark, intellectual property asset or license is material in relation to any segment of our business or to our business as a whole. As of December 31, 2020, we owned 691 U.S. and foreign patents, of which 196 are licensed.
Design, development and regulatory aspects of our business also provide competitive advantages, and we require our employees, consultants and other parties having access to our confidential information to execute confidentiality agreements. These agreements prohibit disclosure of confidential information to third parties, except in specified circumstances. In the case of employees and consultants, the agreements generally provide that all confidential information relating to our business is the exclusive property of Integer.
- 8 -
Manufacturing, Regulatory and Quality Assurance
We leverage our strength as an innovative designer and manufacturer of finished devices and components to the medical device industry. Our manufacturing and engineering services include: design, testing, component manufacture, and device manufacture. We also provide regulatory services including product registration and post-market surveillance in accordance with the regulatory requirements of the U.S. and EU as well as other geographies. We have integrated our proprietary technologies in our own products and those of our customers. Our flexible, high productivity manufacturing capabilities span sites across the United States, Mexico, Uruguay, Ireland, Malaysia, and Israel.
Due to the highly regulated nature of the products we produce, we have implemented strong quality systems across all sites. The quality systems at our sites are compliant with and certified to various recognized international standards, requirements, and directives. Each site’s quality system is certified under an applicable International Organization for Standardization (“ISO”) quality system standard, such as ISO 13485 (Medical device and component sites) or ISO 9001 (Electrochem). This certification requires, among other things, an implemented quality system that applies (where applicable) to the design and manufacture of components, assemblies and finished medical devices, including component quality and supplier control. Maintenance of these certifications for each facility requires periodic re-examination from an independent notified body.
Along with ISO 13485, the facilities producing finished medical devices are subject to oversight by Notified Bodies and extensive and rigorous regulation by numerous government bodies, including the U.S. Food and Drug Administration (“FDA”) and other international regulatory agencies, to assure the conformance of devices and components on a worldwide basis. For these facilities, we maintain FDA registration and compliance with all applicable domestic and international regulations. Compliance with applicable regulatory requirements is subject to continual review and is monitored through periodic inspections by the FDA and international regulatory bodies.
Suppliers and Raw Materials
We purchase some critical raw materials from a limited number of suppliers due to the technically challenging requirements of the supplied product and/or the lengthy process required to qualify these materials both internally and with our customers. We cannot quickly establish additional or replacement suppliers for these materials because of these rigid requirements. For these critical raw materials, we maintain safety stocks and partner with suppliers through contract to help ensure the continuity of supply. Historically, we have not experienced significant interruptions or delays in obtaining critical raw materials.
Many of the raw materials that are used in our products are subject to fluctuations in market price. In particular, the prices of precious metals, such as platinum, have historically fluctuated, and the prices that we pay for these materials, and, in some cases, their availability, are dependent upon general market conditions. In most cases, we have pass-through pricing arrangements with our customers that purchase components containing precious metals or have established firm-pricing agreements with our suppliers that are designed to minimize our exposure to market fluctuations.
We utilize competitive pricing methods such as bulk purchases, precious metal pool buys, blanket orders, and long-term contracts to secure supply.
As discussed more fully in Item 1A “Risk Factors” of this report, our business depends on a continuous supply of raw materials from a limited number of suppliers. If an unforeseen interruption of supply were to occur, we may be unable to obtain substitute sources for these raw materials on a timely basis, on terms acceptable to us or at all, which could harm our ability to manufacture our products profitably or on time. Additionally, we may be unable to quickly establish additional or replacement suppliers for these materials as there are a limited number of worldwide suppliers.
Working Capital Practices
Our goal is to carry sufficient levels of inventory to ensure that we have adequate supply of raw materials from suppliers and meet the product delivery needs of our customers. We also provide and receive payment terms to customers and from suppliers in the normal course of business. It will continue to be a priority for us to maintain appropriate working capital levels while improving our operating cash flow and pay down outstanding debt.
Government Regulation
Medical Device Regulation
Integer develops, manufactures, markets and sells products in multiple countries throughout the world and is therefore subject to regulation by numerous agencies and legislative bodies, including the FDA, European Commission, Health Product Regulatory Agency, Health Canada, Therapeutics Goods Administration and other comparable foreign counterparts. These regulatory requirements subject our products and our business to numerous risks that are specifically discussed within “Risks Related to Our Industries” under Item 1A “Risk Factors” of this report. A summary of critical aspects of our regulatory environment is included below.
- 9 -
In the U.S., these regulations are enacted by the Federal Food, Drug and Cosmetic Act and its subsequent amendments, and the regulations issued or proposed thereunder.
The FDA’s Quality System Regulation sets forth basic quality requirements for our sites that includes product design and manufacturing processes, requires the maintenance of certain records, and provides for on-site inspection of our facilities and continuing review by the FDA. Authorization to commercially market our non-exempt products in the U.S. is granted by the FDA under procedures referred to as 510(k) pre-market notification or pre-market approval (“PMA”). These processes require us to notify the FDA of the new product and obtain FDA clearance or approval before marketing the device.
The FDA classifies medical devices based on the risks associated with use of the device. Devices are classified into one of three categories - Class I, Class II, or Class III. Class I devices are deemed to be low risk and are therefore subject to the least regulatory controls, referred to as General Controls. Class II devices are higher risk devices than Class I and require greater regulatory controls, generally General Controls, and Special Controls which includes a pre-market notification called a 510(k), which provides reasonable assurance of the device’s safety and effectiveness as well as substantial equivalence to a previously cleared device, as demonstrated by data. Class III devices are generally the highest risk devices and are therefore subject to the highest level of regulatory control, requiring a PMA by the FDA before they are marketed and continued controls in the form of amendments or supplements required when product or process changes are made.
The member countries of the European Union (“EU”) have adopted the European Medical Device Directives ("MDD”) and Active Implantable Medical Device Directive (“AIMDD”), which create a single set of requirements for all member countries that apply to our products. The MDD and AIMDD are in the process of being replaced by the European Medical Device Regulation (“EU-MDR”) which becomes effective in May 2021 after being delayed one (1) year due to the COVID-19 pandemic. These directives require, and the EU-MDR will require, companies that wish to manufacture and distribute medical devices in the EU to obtain a CE Mark for those products. The CE Mark indicates the product has met minimum standards of performance, essential requirements, safety conformity assessment and quality. Companies must work with an EU recognized Notified Body to gain approval for the product and manufacturing site before obtaining free movement of products throughout the member countries. In Europe, our devices are considered either Class I, Class IIa, Class III, or AIMD, under MDD or AIMDD and will be with Class I, Class IIa or Class III under the EU-MDR.
In addition to the U.S. and EU, we have approval to manufacture or market our products in numerous foreign countries and therefore are subject to other regulations affecting, among other things, product standards, sterilization, packaging requirements, labeling requirements, and import laws. We are also subject to onsite inspection by independent bodies with the authority to issue or not issue certifications we may require to be able to sell products in certain countries. Many of the regulations applicable to our devices and products in these countries are similar to those of the FDA or EU; however, others vary widely, ranging from simple product registrations to detailed submissions such as those required by the FDA.
We believe that the procedures we use for quality controls, development, testing, manufacturing, labeling, marketing and distribution of our medical devices conform to the requirements of all pertinent regulations.
Environmental Health and Safety Laws
We are subject to direct governmental regulation, including the laws and regulations generally applicable to all businesses in the jurisdictions in which we operate. We are subject to federal, state and local environmental laws and regulations governing the emission, discharge, use, storage and disposal of hazardous materials and the remediation of contamination associated with the release of these materials at our facilities and at off-site disposal locations. Our manufacturing and RD&E activities may involve the controlled use of small amounts of hazardous materials. Liabilities associated with hazardous material releases arise principally under the Federal Comprehensive Environmental Response, Compensation and Liability Act and analogous state laws that impose strict, joint and several liability on owners and operators of contaminated facilities and parties that arrange for the off-site disposal of hazardous materials. We are not aware of any material noncompliance with the environmental laws currently applicable to our business and we are not subject to any material claim for liability with respect to contamination at any of our facilities or any off-site location. We may, however, become subject to these environmental liabilities in the future as a result of our historic or current operations.
Conflict Minerals and Supply Chain
We are subject to Securities and Exchange Commission (“SEC”) rules adopted pursuant to the Dodd-Frank Wall Street Reform and Consumer Protection Act concerning “conflict minerals” (generally tin, tantalum, tungsten and gold) and similar rules are being implemented by the EU. Certain of these conflict minerals are used in the manufacture of our products. These rules require us to investigate the source of any conflict minerals necessary to the production or functionality of our products. If any such conflict minerals originated in the Democratic Republic of the Congo or adjoining countries (the “DRC region”), we must undertake due diligence efforts to determine whether such minerals financed or benefited armed groups in the DRC region. Since our supply chain is complex, our ongoing compliance with these rules could affect the pricing, sourcing and availability of conflict minerals used in the manufacture of our products.
- 10 -
We are also subject to disclosure requirements regarding abusive labor practices in portions of our supply chain under the California Transparency in Supply Chains Act and the UK Modern Slavery Act.
Other Laws and Regulations
Our sales and marketing practices are subject to regulation by the U.S. Department of Health and Human Services pursuant to federal anti-kickback laws, and are also subject to similar state laws.
Human Capital
As of December 31, 2020, Integer employed approximately 7,500 associates worldwide, of whom approximately 3,400 are located in the U.S., 2,300 in Mexico, 1,200 in Ireland, 300 in Uruguay, 300 in Malaysia, as well as a small number of associates in Israel and Switzerland. We also employ approximately 17 temporary employees worldwide to assist with various projects and service functions and address peaks in staff requirements. We believe that we have a good relationship with our employees. Our Board of Directors and the executive team put significant focus on our human capital resources, as we strive to build leadership capability and create a diverse, inclusive work environment that inspires excellence. This cultural framework recognizes the value of individuals as critical to Integer’s operational strategy.
Associate Management and Development
The internal leaders at Integer are responsible for managing the talent of our associates. To effectively manage associate development, we utilize a “Talent Cycle” framework, which provides an integrated approach to meet the human capital needs of the company. The Talent Cycle (i) defines the major categories of leadership responsibilities in alignment with the employment lifecycle and (ii) prioritizes programs and resources to ensure these responsibilities are executed consistently. Stages of the Talent Cycle include:
•Planning for current and future capabilities
•Acquiring the critical talent needed to run our business
•Engaging our associates to motivate and retain them
•Differentiating our talent at all levels to foster a performance culture
•Developing our talent to achieve performance excellence
•Promoting associates who have demonstrated strong leadership capability
Woven throughout this cyclical approach to managing talent is an emphasis on diversity and inclusion. Developing our talent is one of the most critical stages in the Talent Cycle and an ongoing focus at Integer. To support the advancement of our associates, we have defined a model of core skills and competencies to guide associates in their development planning, and we encourage associates to actively focus on their own development though individual development plans, designed to help each associate be more effective in their current role and to prepare for their next role. Additionally, we regularly conduct talent reviews and succession planning to identify and develop our top leadership talent.
Competitive Pay/Benefits
Our total rewards program is designed to attract, retain and motivate associates to contribute to Integer’s success, and includes market-competitive elements reflective of the geographies in which we operate. We incorporate many factors into associate pay decisions, including market comparisons of compensation and benefits for similar roles, individual associate skills and experience in their role, individual performance over multiple years, and relative contributions to the Company’s short- and long-term success. We have analyzed the compensation of our senior leadership team and concluded there is no pay gap between genders.
Focus on Inclusion
At Integer, through our values, Code of Conduct, and commitment to diversity and inclusion, we strive to create a culture that unifies and embraces the uniqueness each associate brings to Integer, positioning the company for long-term success. To advance our efforts to build a more unified and diverse culture, we have a Senior Director of Diversity and Inclusion, who is tasked with leading us in the development of the strategies and actions necessary to create an inclusive environment. We are committed to creating a better, more inclusive company in which all of us accept, respect and value one another’s individual differences, encouraging different perspectives and ideas that improve team synergy and communication.
In 2020, we also formalized our diversity and inclusion strategy, creating a robust engagement platform designed to increase innovation and enhance business. We have infused diversity and inclusion into our business processes and created local and global engagement opportunities for associates.
- 11 -
Key successes in 2020 from our diversity and inclusion strategy include:
•100% executive leadership actively serve as executive sponsors of D&I initiatives
•Formation of two cross functional governing diversity and inclusion councils, which advance the global D&I strategy at all levels of the organization
•Launched employee resource groups, which are voluntary, employee-led groups comprised of associates who join together based on common interests, backgrounds or demographic factors
•Establishment of diversity and inclusion site champions, whose responsibility it is to promote the company’s diversity and inclusion initiative at each Integer location
Impact of COVID-19
Throughout the COVID-19 global pandemic, the health and safety of our associates has remained a priority for us. We implemented a comprehensive pandemic plan to safeguard our associates from COVID-19 infection and exposure, including policies, procedures, protocols, and guidance related to, among other things, COVID-19 symptom awareness, effective hygiene practices, travel restrictions, visitor restrictions, social distancing, face covering expectations, temperature and health screening, work-from-home requirements, absenteeism policies, enhanced workplace cleaning, and large-scale decontamination.
To balance cost management during what we expect to be temporary sales declines in certain areas, we utilized reductions-in-force, furloughs and temporary shutdowns to more closely align labor with customer demand, and we will continue to assess the need for further actions in this area. In doing so, we have consistently monitored benefits available to our associates under various governmental programs, including assistance for associates unable to work for COVID-19 reasons. We have sought, and will continue to seek to understand whether these benefits apply to our associates, how the available benefits support the best interests of our associates, and how the available benefits may impact our business now and in the future as we return to more normalized operations.
Seasonality
Our business is generally not seasonal in nature. However, since our customers are large OEM businesses, our sales are influenced by the inventory levels they carry, which can cause shifts in our sales volume as their inventories fluctuate.
Available Information
Our Internet address is www.integer.net. We also make available free of charge through our website our annual report on Form 10-K, quarterly reports on Form 10-Q, current reports on Form 8-K and amendments to those reports filed or furnished pursuant to Section 13(a) or 15(d) of the Exchange Act as soon as reasonably practicable after we electronically file those reports with, or furnish them to, the SEC. The information contained on our website is not incorporated by reference in this annual report on Form 10-K and should not be considered a part of this report. The SEC maintains a website that contains reports, proxy and information statements, and other information regarding issuers, including the Company, that file electronically with the SEC. The public can obtain any documents that we file with the SEC at www.sec.gov.
INFORMATION ABOUT OUR EXECUTIVE OFFICERS
Information concerning our executive officers is presented below as of February 18, 2021. The officers’ terms of office run from year to year until the first meeting of the Board of Directors occurring immediately following our Annual Meeting of Stockholders, and until their successors are elected and qualified, except in the case of earlier death, retirement, resignation or removal.
Joseph W. Dziedzic, age 52, is President and Chief Executive Officer of the Company and a member of our Board of Directors. He assumed that role on July 16, 2017 following his appointment as interim President & Chief Executive Officer on March 27, 2017. Mr. Dziedzic was the Executive Vice President and Chief Financial Officer of The Brink’s Company from 2009 to 2016, and prior to joining The Brink’s Company in 2009, he had a 20-year career with General Electric.
Jason K. Garland, age 47, is the Company’s Executive Vice President and Chief Financial Officer. Mr. Garland had served as Divisional Vice President & Chief Financial Officer, Global Sales, for Tiffany & Co. from October 2017 until joining the Company in October 2018, and had served as Divisional Vice President & Chief Financial Officer, Diamond & Jewelry Supply, for Tiffany & Co. from July 2015 to October 2017. From 1995 to 2015, Mr. Garland served in various financial and operational roles at General Electric, including as Chief Financial Officer, GE Industrial Solutions, from March 2010 to June 2015.
- 12 -
Joel Becker, age 53, is President, CRM & Neuromodulation, and joined the Company in April 2019. Mr. Becker is also the leader for the Sales Force Excellence strategic imperative. Prior to joining the Company, he was the President of Viking North Ventures from October 2016 to April 2019 and served as the Chief Executive Officer of XchangeLabs LLC from August 2017 to August 2018. Prior to those positions, Mr. Becker had a nearly 20-year career with St. Jude Medical where he held a variety of different roles including President, Americas Division from July 2013 to February 2016, and President, United States Division from October 2011 to July 2013.
Jennifer M. Bolt, age 52, is Senior Vice President, Global Operations, and has served in that position since April 2019. From October 2015 to April 2019, Ms. Bolt served as President, Electrochem. In November 2017, Ms. Bolt assumed leadership of the Portable Medical product line, and in February 2018, she assumed leadership for the Integer Manufacturing Excellence strategic imperative. From June 2013 to October 2015, she was Vice President, Supply Chain and Operational Excellence for Greatbatch. Ms. Bolt held the position of Vice President, Operations for Electrochem from May 2012 to June 2013, and prior to that served as Director of Operations of our Raynham, MA facility from September 2007 to May 2012. Ms. Bolt joined our Company in May 2005 as the Manufacturing Engineering Manager for our Alden, New York facility. Prior to joining our Company, she served in a variety of engineering and operational roles at General Motors/Delphi and Eastman Kodak.
Anthony Borowicz, age 64, is Senior Vice President, Strategy, Corporate Development & Investor Relations and joined the Company in April 2002 and has served in various leadership roles including Vice President, Business Development from December 2014 to December 2018 and Executive Director, Business Development from July 2013 to December 2014. Mr. Borowicz had served as the Vice President, Finance for Kendall Healthcare from April 2001 until joining the Company. Previously, he was the Vice President & Chief Financial Officer for Graphic Controls Corporation from January 1995 to April 2001.
Joseph Flanagan, age 62, is Executive Vice President for Quality and Regulatory Affairs, a position he has held since October 2015. In February 2018, he assumed leadership for the Integer Business Process Excellence strategic imperative. From January 2012 until the Company’s acquisition of Lake Region Medical in October 2015, he was Vice President of Quality and Regulatory Affairs for Lake Region Medical. Prior to joining Lake Region Medical, Mr. Flanagan served as Vice President of Quality and Regulatory Affairs for NP Medical from April 2008 until January 2012.
Elizabeth Giddens, age 50, is Senior Vice President, General Counsel, Chief Ethics and Compliance Officer and Corporate Secretary, and has served in that position since joining the Company in August 2019. Prior to joining the Company, Ms. Giddens was Senior Vice President, Deputy General Counsel and Corporate Secretary at Mr. Cooper Group Inc. from June 2012 to August 2019. Between 2005 to 2012, she served in a variety of senior legal roles for Quicksilver Resources. She also worked as an attorney in private practice from 1998 to 2005, including at the Jones Day law firm.
Carter Houghton, age 52, is President, Electrochem and Power Solutions. From December 2016 until joining the Company in May 2019, Mr. Houghton was President of the Hospital Business Unit at Haemonetics Corporation. Prior to joining Haemonetics, Mr. Houghton had over an 11-year career with Hologic where he served in various leadership roles including Senior Vice President & General Manager, GYN Surgical Solutions Division from February 2013 to August 2015, and Vice President & General Manager, Interventional Breast Solutions Division from February 2010 to September 2013.
Payman Khales, age 51, is President, Cardio & Vascular, and joined the Company on February 20, 2018. Mr. Khales is also the leader for the Integer Market Focused Innovation strategic imperative. Prior to joining Integer, Mr. Khales was the President of the Environmental Technologies Segment at CECO Environmental Company from May 2014 through July 2017. Previously, he was employed by Ingersoll Rand Company where he held a variety of different roles in the United States and Canada, including Vice President Product Management for the global Power Tools division from January 2012 through April 2014, and Vice President Strategic Accounts & Channels from February 2010 through December 2011.
Kirk Thor, age 57, is Executive Vice President and Chief Human Resources Officer. From 2013 until joining the Company in January 2018, Mr. Thor was Vice President for Global Talent Management & Organization Effectiveness at Flowserve Corporation. From 2007 to 2012, he served as Vice President for Talent Management & Organization Development at JC Penney. In February 2018, he assumed leadership for the Integer Culture strategic imperative.
- 13 -
CAUTIONARY FACTORS THAT MAY AFFECT FUTURE RESULTS
Some of the statements contained in this report and other written and oral statements made from time to time by us and our representatives are not statements of historical or current fact. As such, they are “forward-looking statements” within the meaning of Section 27A of the Securities Act of 1933, as amended, and Section 21E of the Securities Exchange Act of 1934, as amended (the “Exchange Act”). We have based these forward-looking statements on our current expectations, and these statements are subject to known and unknown risks, uncertainties and assumptions. Forward-looking statements include statements relating to:
•the impact of the COVID-19 global pandemic;
•future development and expected growth of our business and industry;
•our ability to execute our business model and our business strategy;
•having available sufficient cash and borrowing capacity to meet working capital, debt service and capital expenditure requirements for the next twelve months; and
•projected capital spending.
You can identify forward-looking statements by terminology such as “may,” “will,” “should,” “could,” “expects,” “intends,” “plans,” “anticipates,” “believes,” “estimates,” “predicts,” “potential” or “continue” or variations or the negative of these terms or other comparable terminology. These statements are only predictions. Actual events or results may differ materially from those stated or implied by these forward-looking statements. In evaluating these statements and our prospects, you should carefully consider the factors set forth below. All forward-looking statements attributable to us or persons acting on our behalf are expressly qualified in their entirety by these cautionary factors and to others contained throughout this report.
Although it is not possible to create a comprehensive list of all factors that may cause actual results to differ from the results expressed or implied by our forward-looking statements or that may affect our future results, some of these factors include the following:
•the impact of the COVID-19 global pandemic;
•future sales, expenses, and profitability;
•our dependence upon a limited number of customers;
•pricing pressures that we face from customers;
•our ability to respond to changes in technology;
•the intense competition we face and our ability to successfully market our products;
•our ability to develop new products and expand into new geographic and product markets;
•our reliance on third party suppliers for raw materials, key products and subcomponents;
•the potential for harm to our reputation caused by quality problems related to our products;
•regulatory issues resulting from products complaints, recalls or regulatory audits;
•the potential of becoming subject to product liability claims;
•our ability to protect our intellectual property and proprietary rights;
•our significant amount of outstanding indebtedness and our ability to remain in compliance with financial and other covenants under our senior secured credit facilities;
•our ability to integrate acquisitions and operate acquired businesses in accordance with expectations;
•our dependence upon our senior management team and technical personnel;
•our ability to realize the benefits from cost savings and consolidation initiatives;
•interruptions in our manufacturing operations;
•our ability to comply with environmental regulations;
•our complex international tax profile;
•our dependence upon our information technology systems and our ability to prevent cyber-attacks and other failures;
•market, financial and other risks related to our international operations and sales;
•global economic factors, including currency exchange rates and interest rates;
•the fact that the healthcare industry is highly regulated and subject to various regulatory changes;
•the dependence of our energy market-related revenues on the conditions in the oil and natural gas industry; and
•other risks and uncertainties that arise from time to time and are described in Item 1A “Risk Factors” of this report.
- 14 -
ITEM 1A. RISK FACTORS
Our business faces many risks, and you should carefully consider the following risk factors, together with all of the other information included in this report, including the financial statements and related notes, when deciding to invest in us. Any of the risks discussed below, or elsewhere in this report or in our other SEC filings, could have a material impact on our business, financial condition or results of operations. Additional risks not currently known to us or that we currently consider immaterial also may materially adversely affect our business, financial condition or results of operations in the future.
Operational Risks
Our operations have been and may continue to be adversely impacted by the ongoing global impact of the COVID-19 pandemic.
The global spread of the novel coronavirus, or COVID-19, has created significant uncertainty and worldwide economic disruption. COVID-19 has negatively impacted our operating results and may continue to do so in the future. The duration and scope of the impact is uncertain given the evolving health, economic, social and governmental environments.
Specific impacts to our business have included delayed and reduced customer orders, restrictions on our associates’ ability to travel or work, delays in shipments to and from certain countries, and disruptions in our supply chain. We expect delayed and reduced customer demand will continue to impact our operations, and the timing of that impact will continue to lag our customers, based on varying demand for products and approaches to inventory management. The pandemic has affected and continues to affect our manufacturing facilities and our associates’ health. If the operations of any of our manufacturing sites are materially impacted as a result of the pandemic, it may not be possible for us to continue to timely manufacture relevant products at required levels, or at all. We have modified, and may continue to further modify, our business practices in response to the COVID-19 pandemic and related third-party responses, including from government authorities. Any continued or renewed business closures, operating disruptions, or travel or work restrictions that impact our associates, customers, suppliers or manufacturing facilities will likely continue to adversely affect our operations locally and worldwide and could have a material adverse effect on our operating results and financial condition.
The ultimate impact of the COVID-19 pandemic on our operations and financial performance depends on many factors that are not within our control, including, but not limited, to: governmental, business and individuals’ actions that have been and continue to be taken in response to the pandemic (including restrictions on travel, transport and workforce pressures); the impact of the pandemic and actions taken in response on global and regional economies, travel, and economic activity; the availability of federal, state, local or non-U.S. funding programs; general economic uncertainty in key global markets and financial market volatility; global economic conditions and levels of economic growth; and the pace of recovery when the COVID-19 pandemic subsides, which could be impacted by a number of factors, including limited provider capacity to perform procedures using our products that were deferred as a result of the pandemic.
We depend heavily on a limited number of customers, and if we lose any of them or they reduce their business with us, we would lose a substantial portion of our revenues.
In 2020, our top three customers collectively accounted for approximately 48% of our revenues. Reductions in demand from these customers, largely because of reduction in demand for medical procedures during the pandemic, has negatively impacted our results of operations and may impact our future results of operations if material reductions in demand recur. These customers may not agree to renew or extend our supply agreements with them. Furthermore, many of our supply agreements do not contain minimum purchase level requirements and therefore there is no guaranteed source of revenue that we can depend upon under these agreements. In addition, we are dependent on the continued growth, viability and financial stability of these customers. The markets in which these customers operate are subject to rapid technological change, vigorous competition and short product life cycles. As a result, when these customers are adversely affected by these factors, we may be similarly adversely affected. The loss of any large customer, a material reduction of business with that customer, or a delay or failure by that customer to make payments due to us, would harm our business, financial condition and results of operations.
We are subject to pricing pressures from customers, which could harm our operating results and financial condition.
Given the highly competitive industry in which we operate, we have reduced price to some of our customers in recent years and we expect customer pressure for continued price reductions. These price reductions may cause our operating results and financial condition to suffer.
- 15 -
We rely on third party suppliers for raw materials, key products and subcomponents. Increased prices for, or unavailability of, these materials, products or subcomponents could adversely affect our results of operations.
Our business depends on a continuous supply of raw materials. The principal raw materials used in our business include platinum, stainless steel, gold, titanium, nitrinol, lithium, palladium, iridium, tantalum, nickel cobalt, ruthenium, gallium trichloride, vanadium oxide, CFx and plastics. The supply and price of raw materials may be susceptible to fluctuations due to transportation issues, government regulations, price controls, foreign civil unrest, tariffs, worldwide economic conditions or other unforeseen circumstances, including the continuing impact of the global pandemic. Increasing global demand for raw materials has caused prices of certain materials to increase. Significant increases in the cost of raw materials that cannot be recovered through increases in the prices of our products could adversely affect our results of operations. There can be no assurance that the marketplace will support higher prices or that price increases and productivity gains, procurement deflation projects or savings will fully offset any raw material cost increases in the future. In addition, there are a limited number of worldwide suppliers of several raw materials needed to manufacture our products. For reasons of quality, cost effectiveness or availability, we obtain some raw materials from a single supplier. Although we work closely with our suppliers to seek to ensure continuity of supply, we may not be able to continue to procure raw materials critical to our business at all or to procure them at acceptable price levels. A disruption in deliveries from our suppliers, price increases or decreased availability of raw materials could have an adverse effect on our ability to meet our commitments to our customers and increase our operating costs.
In addition, we rely on third party manufacturers to supply many of the products and subcomponents that are incorporated into our products and components. These third party manufacturers have their own complex supply chains. Manufacturing problems may occur with these and other outside sources, as a supplier may fail to develop or manufacture products and subcomponents for us on a timely basis, or may supply us with products and subcomponents that do not meet our quality, quantity and cost requirements. If any of these problems occur, we may be unable to obtain substitute sources for these products and subcomponents on a timely basis or on terms acceptable to us, which could harm our ability to manufacture our own products and components profitably or on time. In addition, to the extent the processes our suppliers use to manufacture products and subcomponents are proprietary, we may be unable to obtain comparable products and subcomponents from alternative suppliers.
Our business is also subject to risks associated with U.S. and foreign legislation, regulations and trade agreements relating to the materials we import, including the tariffs on steel that the U.S. has imposed and other quotas, duties, tariffs or taxes or restrictions on imports, which could adversely affect our operations and our ability to import materials used in our products at current or increased levels. We cannot predict whether additional U.S. and foreign customs quotas, duties (including antidumping or countervailing duties), tariffs, taxes or other charges or restrictions, requirements as to where raw materials must be purchased or other restrictions on our imports will be imposed in the future or adversely modified, or what effect such actions would have on our costs of operations. Future quotas, duties or tariffs may adversely affect our business, financial condition, results of operations or cash flows. Future trade agreements could also provide our competitors with an advantage over us, or increase our costs, either of which could adversely affect our business, financial condition, results of operations or cash flows.
Quality problems with our products could result in warranty claims and additional costs, could harm our reputation and could erode our competitive advantage.
Quality is important to us and our customers, and our products are held to high quality and performance standards. In the event our products fail to meet these standards, we generally allow customers to return defective or damaged products under warranty. We carry a safety stock of inventory for our customers that may be impacted by warranty claims. We reserve for our exposure to warranty claims based upon recent historical experience and other specific information as it becomes available. However, these reserves may not be adequate to cover future warranty claims. If our reserves for warranty claims are inadequate, additional warranty costs or inventory write-offs may need to be incurred in the future, which could harm our operating results. We also could be subject to negative publicity and our reputation could be harmed if we fail to meet quality standards. This could erode our competitive advantage over competitors, causing us to lose or see a material reduction in business from customers and resulting in lower revenues. In addition, we might be required to devote significant resources to address any quality issues associated with our products, which could reduce the resources available for product development and other matters.
- 16 -
Our energy market revenues are dependent on conditions in the oil and natural gas industry, which historically have been volatile.
Sales of our products into the energy market depends upon the condition of the oil and gas industry. In the recent past, oil and natural gas prices have been subject to significant fluctuation and the oil and gas exploration and production industry has historically been cyclical. It is likely that oil and natural gas prices will continue to fluctuate in the future. The current and anticipated prices of oil and natural gas influence the oil and gas exploration and production industry and are affected by a variety of political and economic factors, including worldwide demand for oil and natural gas, worldwide and domestic supplies of oil and natural gas, the ability of the Organization of Petroleum Exporting Countries (“OPEC”) to set and maintain production levels and pricing, the level of production of non-OPEC countries, the price and availability of alternative fuels, political stability in oil producing regions and the policies of the various governments regarding exploration and development of their oil and natural gas reserves. The collapse in the demand for oil caused by the unprecedented global health and economic crisis resulting from the worldwide pandemic, coupled with oil oversupply worldwide has had, and is reasonably likely to continue to have, a material adverse impact on the demand for our Electrochem products.
Interruptions of our manufacturing operations could delay production and adversely affect our operations.
Our products are designed and manufactured in facilities located around the world. In most cases, the manufacturing of specific product lines is concentrated in one or a few locations. If an event (including any weather or natural disaster-related event) occurred that resulted in material damage or loss of one or more of these manufacturing facilities or we lacked sufficient labor to fully operate the facility, we might be unable to transfer the manufacture of the relevant products to another facility or location in a cost-effective or timely manner, if at all. This potential inability to transfer production could occur for a number of reasons, including but not limited to a lack of necessary relevant manufacturing capability at another facility, or the regulatory requirements of the FDA or other governmental regulatory bodies. Other disruptions in our manufacturing operations for any reason, including equipment malfunction, failure to follow specific protocols and procedures, or environmental factors could lead to an inability to supply our customers with our products, unanticipated costs, lost revenues and damage to our reputation. The ongoing pandemic has caused, and may continue to cause, delays in production, unanticipated costs and lost revenues. In addition, our business involves complex manufacturing processes and the use of various hazardous materials, chemicals and other regulated substances, such as trichloroethylene, that can be dangerous to our associates. We must also comply with various health and safety regulations in the United States and abroad in connection with our operations. Although we employ safety procedures in the design and operation of our facilities, there is a risk that an accident or death could occur. Any accident, such as a chemical spill or fire, could result in significant manufacturing delays or claims for damages resulting from injuries, which would harm our operations and financial condition. The potential liability resulting from any such accident or death, to the extent not covered by insurance, could harm our financial condition or operating results. Any disruption of operations at any of our facilities, and in particular our larger facilities, could result in production delays, which could adversely affect our operations and harm our business.
Our operations are subject to cyber-attacks and other information technology disruptions that could have a material adverse effect on our business, consolidated results of operations and consolidated financial condition.
In the ordinary course of business, our operations are, and in the future are expected to continue to be, dependent on digital technologies and information technology (“IT”) systems. The COVID-19 pandemic has caused us to modify our business practices, including the requirement that many of our office-based employees work from home. As a result, we are increasingly dependent upon our technology systems to operate our business and our ability to effectively manage our business depends on the security, reliability and adequacy of our technology systems and data. We use these technologies and systems for internal purposes, including data storage, processing and transmissions, as well as in our interactions with customers and suppliers. The security of this information and these systems are important to our operations and business strategy. Our IT systems and infrastructure have been, and in the future are expected to continue to be, subject to the risk of cyber-attacks by hackers or malware, or breach due to associate error, malfeasance or other disruptions, including natural disasters, failures in hardware or software, and power fluctuations. As the techniques used to obtain unauthorized access, disable or degrade service, or sabotage infrastructure and systems change frequently and may be difficult to detect for long periods of time, we may be unable to anticipate these techniques or implement adequate preventive measures. If our systems for protecting against cybersecurity risks or other IT disruptions prove insufficient, our business could be disrupted, resulting in numerous consequences, including temporary or permanent loss of, damage to, third party access to, or misappropriation or public disclosure of intellectual property, proprietary or confidential information, or customer, supplier, or employee data; interruption of our business operations; and increased costs required to prevent, respond to, or mitigate such cybersecurity attacks or IT disruptions. In addition, any such breach could compromise our networks and the information stored there could be accessed, publicly disclosed or stolen. These risks could harm our reputation and brand, and our relationships with customers, suppliers, employees and other third parties, and may result in claims or proceedings against us. In certain circumstances, we may rely on third party vendors to process, store and transmit data for our business whose operations are subject to similar risks. These risks could have a material adverse effect on
- 17 -
our business, financial condition and results of operations. While we maintain insurance for cyber events, our insurance may not be sufficient to cover us against all losses that could potentially result from a breach of our systems or loss of sensitive data.
We may not be able to attract, train and retain a sufficient number of qualified associates to maintain and grow our business.
We monitor the markets in which we compete and assess opportunities to better align expenses with revenues, while preserving our ability to make needed investments in RD&E projects, capital and our associates that we believe are critical to our long-term success. Our success will depend in large part upon our ability to attract, train, retain and motivate highly skilled associates. There is currently aggressive competition for employees who have experience in technology and engineering. We compete intensely with other companies to recruit and hire from this limited pool. The industries in which we compete for employees are characterized by high levels of employee attrition. Although we believe we offer competitive salaries and benefits, we may have to increase spending to attract, train and retain qualified personnel.
We are dependent upon our senior management team and key technical personnel and the loss of any of them could significantly harm us.
Our future performance depends to a significant degree upon the continued contributions of our senior management team and key technical personnel. In general, only highly qualified and trained scientists have the necessary skills to develop our products, which are often highly technical in nature. The loss or unavailability to us of any member of our senior management team or a key technical employee could significantly harm us. We face intense competition for these professionals from our competitors, customers and companies operating in our industry. To the extent that the services of members of our senior management team and key technical personnel would be unavailable to us for any reason, we would be required to hire other personnel to manage and operate our Company and to develop our products and technology, which could adversely impact our business. We may not be able to locate or employ these qualified personnel on acceptable terms or may need to increase spending to attract these qualified personnel.
Consolidation in the healthcare industry could result in greater competition and reduce our revenues and harm our business.
Many healthcare industry companies are consolidating to create new companies with greater market power. As the healthcare industry consolidates, competition to provide products and services to industry participants will become more intense. These industry participants may try to use their market power to negotiate price reductions for our products or may undertake additional vertical integration or supplier diversification initiatives. If we are forced to reduce our prices, our revenues would decrease and our operating results would suffer.
Strategic Risks
If we are unable to successfully market our current or future products, our business will be harmed and our revenues and operating results will be adversely affected.
If the markets for our products do not grow as we or industry experts forecast, our revenues could be less than expected. Furthermore, it is difficult to predict the rate at which the markets for our products will grow or if new and increased competition will result in market saturation. Slower growth in the cardiac rhythm, neuromodulation, cardio and vascular, environmental, military or energy markets in particular would adversely impact our revenues. In addition, we face the risk that our products will lose widespread market acceptance. Our customers may not continue to utilize the products we offer and a market may not develop for our future products.
We may at times determine that it is not technically or economically feasible for us to continue to manufacture certain products and we may not be successful in developing or marketing replacement products. Additionally, new technologies that we develop may not be rapidly accepted because of industry-specific factors, including the need for regulatory clearance, entrenched patterns of clinical practice and uncertainty over third party reimbursement. If any of these events occurs, our business will be harmed and our revenues and operating results will be adversely affected.
- 18 -
We may face intense competition that could harm our business and we may be unable to compete successfully against new entrants and established companies with greater resources.
Competition in connection with the manufacturing of our medical products across all of our product lines has intensified in recent years and may continue to intensify in the future. We encounter significant competition across our product lines and in each market in which our medical products are sold from various medical device companies, many of which may have greater financial, technical and marketing resources than we do and are more well-established. In addition, one of our medical customers has announced vertical integration and others may do so, and one or more of our customers may implement supplier diversification initiatives. Such actions would result in the customer manufacturing or dual-sourcing some or all of the components or products that we currently supply to them, which could cause our operating results to suffer. The market for commercial power sources is competitive, fragmented and subject to rapid technological change. Many other commercial power source suppliers are larger than us and have greater financial, operational, personnel, sales, technical and marketing resources and are able to take advantage of greater economies of scale than we can. These and other companies may develop products that are superior, technologically or otherwise, or more cost effective than our products, which could result in lower revenues and operating results.
If we do not respond to changes in technology, our products may become obsolete or less competitive and we may experience a loss of customers and lower revenues.
We sell our products to customers in several industries that are characterized by extensive research and development, rapid technological changes, new product introductions and evolving industry standards. Without the timely introduction of new products, technologies and enhancements, our products and services will likely become technologically obsolete or less competitive over time and we may lose or see a reduction in business from a significant number of our customers. We dedicate a significant amount of effort and resources to the development of our products, technologies and enhancements. Our product development efforts may be affected by a number of factors, including our ability to anticipate customer needs, develop or acquire new technologies and enhancements, secure intellectual property protection for our products, and manufacture products in a cost effective manner. We would be harmed if we did not meet customer requirements and expectations. Our inability, for technological or other reasons, to successfully develop and introduce new and innovative products, technologies and enhancements could result in a loss of customers and lower revenues.
We intend to develop new products and expand into new geographic and product markets, which may not be successful and could harm our operating results.
We intend to develop new and modified products using our existing technologies and engineering capabilities and expand into new geographic and product markets. These efforts have required and will continue to require us to make substantial investments, including significant RD&E expenditures and capital expenditures for new, expanded or improved manufacturing facilities. Additionally, many of the new products we are developing take longer and more resources to develop and commercialize than those products we are currently marketing, including more time and resources required to obtain regulatory approvals.
Specific risks in connection with expanding into new products and product markets include: longer product development cycles, the inability to transfer our quality standards and technology into new products, the failure to receive or the delay in receipt of regulatory approval for new products or modifications to existing products, and the failure of our existing customers or the market generally to accept the new or modified products. Our inability to develop new products or expand into new geographic and product markets, as currently intended, could hurt our business, financial condition and results of operations.
If we are not successful in making acquisitions to expand and develop our business, our operating results may suffer.
One facet of our growth strategy is to make acquisitions that complement our core competencies in technology and manufacturing to enable us to manufacture and sell additional or enhanced products to our existing customers and to expand our business into related markets. Our continued growth may depend on our ability to successfully identify and acquire companies that complement or enhance our existing business on acceptable terms. We may not be able to identify or complete future acquisitions. In addition, we will need to comply with the terms of our Senior Secured Credit Facility and any future financing that we may incur, to pursue and complete future acquisitions. In connection with pursuing this growth strategy, some of the risks that we may encounter include expenses associated with and difficulties in identifying potential targets, the costs associated with unsuccessful acquisitions, and higher prices for acquired companies because of significant competition for attractive acquisition targets.
- 19 -
Successful integration and anticipated benefits of acquisitions cannot be assured and integration matters could divert attention of management away from operations.
Part of our business strategy includes acquiring additional businesses and assets. If we do not successfully integrate acquisitions, we may not realize anticipated operating advantages and cost savings. Our ability to realize the anticipated benefits from acquisitions will depend, to a large extent, on our ability to integrate these acquired businesses with our legacy businesses. Integrating and coordinating aspects of the operations and personnel of the acquired business with legacy businesses involves complex operational, technological and personnel-related challenges. This process is time-consuming and expensive, disrupts the businesses of both companies and may not result in the achievement of the full benefits expected by us, including cost synergies expected to arise from supply chain efficiencies and overlapping general and administrative functions.
The potential difficulties, and resulting costs and delays, include:
•managing a larger combined company;
•consolidating corporate and administrative infrastructures;
•issues in integrating manufacturing, warehouse and distribution facilities, RD&E and sales forces;
•difficulties attracting and retaining key personnel;
•loss of customers and suppliers and inability to attract new customers and suppliers;
•unanticipated issues in integrating information technology, communications and other systems;
•incompatibility of purchasing, logistics, marketing, administration and other systems and processes; and
•unforeseen and unexpected liabilities related to the acquired business.
Additionally, the integration of our legacy businesses with an acquired company’s operations, products and personnel may place a significant burden on management and other internal resources. The attention of our management may be directed towards integration considerations and may be diverted from our day-to-day business operations, and matters related to the integration may require commitments of time and resources that could otherwise have been devoted to other opportunities that might have been beneficial to us and our business. The diversion of management’s attention, and any difficulties encountered in the transition and integration process, could harm our business, financial condition and operating results.
We may not be able to maintain the levels of operating efficiency that acquired companies have achieved or might achieve separately. Successful integration of each acquisition will depend upon our ability to manage those operations and to eliminate redundant and excess costs. Difficulties in integration may be magnified if we make multiple acquisitions over a relatively short period of time. Because of difficulties in combining and expanding operations, we may not be able to achieve the cost savings and other size-related benefits that we hoped to achieve after these acquisitions.
Financial Risks
Our operating results may fluctuate, which may make it difficult to forecast our future performance and may result in volatility in our stock price.
Our operating results have fluctuated in the past and are likely to continue to fluctuate from quarter to quarter, making forecasting future performance difficult and resulting in volatility in our stock price. These fluctuations are due to a variety of factors, including the following:
•the impact of the ongoing pandemic and the pace of recovery;
•timing of orders placed by our customers;
•our customers’ approach to inventory management;
•changes in the mix of our revenue represented by our various products and customers could result in reductions in our profits if the mix of our revenue represented by lower margin products increases;
•a portion of our costs are fixed in nature, which results in our operations being particularly sensitive to fluctuations in production volumes;
•increased costs and decreased availability of raw materials or supplies; and
•our ability to effectively execute on operational initiatives to drive manufacturing efficiencies.
- 20 -
We have significant indebtedness that could affect our operations, financial condition, and cash flows if we fail to meet certain financial covenants required by our debt agreements or if our access to capital markets is interrupted.
At December 31, 2020,we had $738 million in principal amount of debt outstanding. As of December 31, 2020, our debt service obligations, comprising principal and interest, are estimated to be approximately $60 million for 2021. The outstanding indebtedness and the terms and covenants of the agreements under which this debt was incurred, could, among other things:
•require us to dedicate a large portion of our cash flow from operations to the servicing and repayment of our outstanding indebtedness, thereby reducing funds available for working capital, capital expenditures, RD&E expenditures and other general corporate requirements;
•limit our ability to obtain additional financing to fund future working capital, capital expenditures, RD&E expenditures and other general corporate requirements in the future;
•limit our flexibility in planning for, or reacting to, changes in our business and the industry in which we operate;
•restrict our ability to make strategic acquisitions or dispositions or to exploit business opportunities;
•place us at a competitive disadvantage compared to our competitors that have less outstanding indebtedness; and
•adversely affect the market price of our common stock.
Additionally, our failure to comply with the covenants contained in our debt agreements, if not waived, could cause a default under the applicable debt agreement that requires repayment in full, or acceleration, of debt payments. If that were to occur, there can be no assurance that we would be able to refinance or obtain a replacement financing on favorable terms or at all. Further, our senior credit facility matures in October 2022, and the adverse impact of the ongoing pandemic on market and business conditions, as well as on our operations, may make it more difficult to refinance this credit facility on favorable terms or at all.
Economic and credit market uncertainty could interrupt our access to capital markets, borrowings, or financial transactions to hedge certain risks, which could adversely affect our financial condition.
To date, we have been able to access debt and equity financing that has allowed us to complete acquisitions, make investments in growth opportunities and fund working capital requirements. In addition, we enter into financial transactions to hedge certain risks, including foreign exchange and interest rate risk. Our continued access to capital markets, the stability of our lenders under our Senior Secured Credit Facility and their willingness to support our needs, and the stability of the parties to our financial transactions that hedge risks are essential for us to meet our current and long-term obligations, fund operations, and fund our strategic initiatives. An interruption in our access to external financing or financial transactions to hedge risk could affect our business prospects and financial condition.
Our international sales and operations are subject to a variety of market and financial risks and costs that could affect our profitability and operating results.
Our sales outside the U.S., which accounted for approximately 44% of sales for 2020, and our operations in Europe, Asia, the Middle East, Mexico and South America are and will continue to be subject to a number of risks and potential costs, including:
•changes in foreign economic conditions or regulatory requirements;
•changes in foreign currency exchange rates;
•local product preferences and product requirements;
•outstanding accounts receivables that take longer to collect than is typical in the U.S.;
•difficulties in enforcing agreements through foreign legal systems;
•less protection of intellectual property in some countries outside of the U.S.;
•trade protection measures and import and export licensing requirements;
•work force instability;
•political and economic instability; and
•complex tax and cash management issues.
These risks are also present in connection with our entry into new geographic markets.
Additionally, as a result of our international operations, we are subject to exposure from currency exchange rate fluctuations. We purchase forward currency contracts in certain currencies to reduce our exposure; however, these transactions may not be adequate or effective to protect us from the exposure for which they are purchased. Historically, foreign currency exchange rate fluctuations have not had a material effect on our net financial results. However, fluctuations in foreign currency exchange rates could have a significant impact on our financial results in the future.
- 21 -
We have a complex tax profile due to the global nature of our operations and may experience significant variability in our quarterly and annual effective tax rate due to several factors, including changes in the mix of pre-tax income and the jurisdictions to which it relates, business acquisitions, settlements with taxing authorities, and changes in tax rates.
Our global operations encompass multiple taxing jurisdictions. Variability in the mix and profitability of domestic and international activities, identification and resolution of various tax uncertainties, changes in tax laws and rates, and the extent to which we are able to realize net operating loss and other carryforwards included in deferred tax assets and avoid potential adverse outcomes included in deferred tax liabilities, among other matters, may significantly affect our effective income tax rate in the future.
Changes in international tax laws or additional changes in U.S. tax laws could materially affect our financial position and results of operations. In addition, many countries in the EU, as well as a number of other countries and organizations such as the Organization for Economic Cooperation and Development, are also actively considering changes to existing tax laws. If tax laws and related regulations change, our financial results could be materially impacted. Given the unpredictability of these possible changes and their potential interdependency, it is possible such changes could adversely impact our financial results.
Our effective income tax rate is the result of the income tax rates in the various countries in which we do business. Our mix of income and losses in these jurisdictions affects our effective tax rate. For example, relatively more income in higher tax rate jurisdictions would increase our effective tax rate and thus lower our net income. Similarly, if we generate losses in tax jurisdictions for which no benefits are available, our effective income tax rate will increase. Our effective income tax rate may also be impacted by the recognition of discrete income tax items, such as required adjustments to our liabilities for uncertain tax positions or our deferred tax asset valuation allowance. A significant increase in our effective income tax rate could have a material adverse impact on our earnings.
We have recorded deferred tax assets based on our assessment that we will be able to realize the benefits of our net operating losses and other favorable tax attributes. Realization of deferred tax assets involve significant judgments and estimates which are subject to change and ultimately depends on generating sufficient taxable income of the appropriate character during the appropriate periods. Changes in circumstances may affect the likelihood of such realization, which in turn may trigger a write-down of our deferred tax assets, the amount of which would depend on a number of factors. A write-down would reduce our reported net income, which may adversely impact our financial condition or results of operations or cash flows. In addition, we are potentially subject to ongoing and periodic tax examinations and audits in various jurisdictions, including with respect to the amount of our net operating losses and any limitation thereon. An adjustment to such net operating loss carryforwards, including an adjustment from a taxing authority, could result in higher tax costs, penalties and interest, thereby adversely impacting our financial condition, results of operations or cash flows.
We may never realize the full value of our intangible assets, which represent a significant portion of our total assets.
At December 31, 2020, we had $1.6 billion of goodwill and other intangible assets, representing 68% of our total assets. These intangible assets consist primarily of goodwill, trademarks, tradenames, customer lists and patented technology arising from our acquisitions. Goodwill and other intangible assets with indefinite lives are not amortized, but are tested annually or upon the occurrence of certain events that indicate that the assets may be impaired. Definite lived intangible assets are amortized over their estimated useful lives and are tested for impairment upon the occurrence of certain events that indicate that the assets may not be recoverable. We may not receive the recorded value for our intangible assets if we sell or liquidate our business or assets. In addition, our significant amount of intangible assets increases the risk of a large charge to earnings in the event that the recoverability of these intangible assets is impaired. In the event of a significant charge to earnings, the market price of our common stock could be adversely affected. In addition, intangible assets with definite lives, which represent $666.9 million of our net intangible assets at December 31, 2020, will continue to be amortized. These expenses will continue to reduce our future earnings or increase our future losses. The accounting for intangible assets requires reliance on forward looking estimates of sales and/or earnings. Due to the uncertainty surrounding the global pandemic, estimating the future performance of our business is extremely challenging and the range of deviation from internal estimates could be more significant in this environment. As of December 31, 2020, the pandemic has not had an impact on the carrying value of our goodwill and other intangible assets. A prolonged pandemic could have adverse changes on the underlying estimates, assumptions or judgments and could have a material adverse impact on the fair value of our goodwill and other indefinite-lived intangible assets.
- 22 -
Legal and Compliance Risks
Regulatory issues resulting from product complaints, or recalls, or regulatory audits could harm our ability to produce and supply products or bring new products to market.
The products that we design, manufacture and distribute, including our customers’ finished medical devices, product components that are incorporated into our customers’ finished medical devices, and our own finished medical devices, are designed, manufactured and distributed globally in compliance with applicable regulations and standards. However, a product complaint, recall or negative regulatory audit may cause our products, including product components and finished medical devices, to be removed from the market and harm our operating results or financial condition. In addition, during the period in which corrective action is being taken by us to remedy a complaint, recall or negative audit, regulators may not allow our new products to be cleared for marketing and sale.
If we become subject to product liability claims, our operating results and financial condition could suffer.
Our business exposes us to potential product liability claims, which may take the form of a one-off claim from a single claimant or a class action lawsuit covering multiple claimants. Product failures, including those that arise from the failure to meet product specifications, misuse or malfunction, or design flaws, or the use of our products with other components, systems or medical devices not manufactured or sold by us could result in product liability claims or a recall. Many of our products are components that interact with our customers’ medical devices. For example, our batteries are produced to meet electrical performance, longevity and other specifications, but the actual performance of those products is dependent on how they are utilized as part of our customers’ devices over the lifetime of their products. Product performance and device interaction from time to time have been, and may in the future be, different than expected for a number of reasons. Consequently, it is possible that customers may experience problems with their medical devices that could require device recall or other corrective action, where our batteries met the specification at delivery, and for reasons that are not related primarily or at all to any failure by our product to perform in accordance with specifications. It is possible that our customers (or end-users) may in the future assert that our products caused or contributed to device failure. Even if these assertions do not lead to product liability or contract claims, they could harm our reputation and our customer relationships. Furthermore, the design and manufacturing of finished medical devices of the types that we also produce entail an inherent risk of product liability claims. Some of the medical devices that we manufacture and sell are designed to be implanted into the human body. A number of factors could result in an unsafe condition or injury to, or death of, a patient with respect to these medical devices. These factors could also result in product liability claims, a recall of one or more of our medical devices or a safety alert relating to one or more of our medical devices.
Provisions contained in our agreements with key customers attempting to limit our damages, including provisions to limit damages to liability for negligence, may not be enforceable in all instances or may otherwise fail to adequately protect us from liability for damages. Product liability claims or product recalls, regardless of their ultimate outcome and whether related to a product component or a finished medical device, could require us to spend significant time and money in litigation and require us to pay significant damages and could divert the attention of our management from our business operations. The occurrence of product liability claims or product recalls could affect our operating results and financial condition.
We carry product liability insurance with coverage that is limited in scope and amount. We may not be able to maintain this insurance at a reasonable cost or on reasonable terms, or at all. This insurance may not be adequate to protect us against product liability claims made against us.
If we are unable to protect our intellectual property and proprietary rights, our business could be harmed.
We rely on a combination of patents, licenses, trade secrets and know-how to establish and protect our rights to our technologies and products. However, these measures afford only limited protection, and our patent rights, whether issued, subject to license or in process, and our other intellectual property protections may be misappropriated, circumvented or invalidated. The laws of some foreign countries do not offer the same level of protection for our intellectual property as the laws of the U.S. Further, no assurances can be given that any patent application we have filed or will file will result in a patent being issued, or that any existing or future patents will afford adequate or meaningful protection against competitors or against similar technologies. In addition, competitors may design around our technology or develop competing technologies that do not infringe our proprietary rights. As patents and other intellectual property protection expire, we may lose our competitive advantage. If third parties infringe or misappropriate our patents or other proprietary rights, our businesses could be seriously harmed.
- 23 -
In addition, we cannot be assured that our existing or planned products do not or will not infringe on the intellectual property rights of others or that others will not claim such infringement. Our industry has experienced extensive ongoing patent litigation which can result in the incurrence of significant legal costs for indeterminate periods of time, injunctions against the manufacture or sale of infringing products and significant royalty payments. At any given time, we may be a plaintiff or defendant in these types of actions. We cannot assure you that we will be able to prevent competitors from challenging our patents or other intellectual property rights or entering markets we currently serve.
In addition to seeking formal patent protection whenever possible, we attempt to protect our proprietary rights and trade secrets by entering into confidentiality agreements with employees, consultants and third parties with which we do business. However, these agreements may be breached and, if a breach occurs, there may be no adequate remedies available to us and we may be unable to prevent the unauthorized disclosure or use of our technical knowledge, practices or procedures. If our trade secrets become known, we may lose our competitive advantages.
We may be subject to intellectual property claims, which could be costly and time consuming and could divert our management’s attention from our business operations.
In producing our products, third parties may claim that we are infringing on their intellectual property rights, and we may be found to have infringed on those intellectual property rights. We may be unaware of the intellectual property rights of others that may be used in our technology and products. In addition, third parties may claim that our patents have been improperly granted and may seek to invalidate our existing or future patents. If any claim for invalidation prevailed, third parties may manufacture and sell products that compete with our products and our revenues from any related license agreements would decrease accordingly. Former employers of our associates may assert claims that these associates have improperly disclosed to us the confidential or proprietary information of those former employers. We also typically do not receive significant indemnification from parties that license technology to us against third party claims of intellectual property infringement.
Any litigation or other challenges regarding our patents or other intellectual property, with or without merit, could be costly and time consuming and could divert the attention of our management and key personnel from our business operations. The complexity of the technology involved in producing our products and the uncertainty of intellectual property litigation increases these risks. If we are not successful in defending these claims, we could be required to stop selling, delay shipments of, or redesign our products, discontinue the use of related technologies or designs, pay monetary amounts as damages, and satisfy indemnification obligations that we have with some of our customers. Claims of intellectual property infringement may also require us to enter into costly royalty or license agreements. However, we may not be able to obtain royalty or license agreements on terms acceptable to us, or at all. We also may be made subject to significant damages or injunctions against development and sale of our products.
A failure to comply with customer-driven policies and standards and third-party certification requirements or standards could adversely affect our business and reputation.
Our customers may require us to comply with their own or third-party quality standards, business policies, commercial terms, or other policies or standards, which may be even more restrictive than current laws and regulations as well as our pre-existing policies or terms with our suppliers, before they commence, or continue, doing business with us. These policies or standards may be customer-driven, established by the market sectors in which we operate or imposed by third party organizations.
Our compliance with these heightened or additional policies, standards and third-party certification requirements, and managing a supply chain in accordance with those policies, standards and requirements, could be costly, and our failure to comply could adversely affect our operations, customer relationships, reputation and profitability. In addition, our adoption of these standards could adversely affect our cost competitiveness and ability to provide customers with required service levels. In certain circumstances, to meet the requirements or standards of our customers, we may be obligated to select certain suppliers or make other sourcing choices, and we may bear responsibility for adverse outcomes even if these matters are the result of third-party actions or outside of our control.
Our failure to obtain licenses from third parties for new technologies or the loss of these licenses could impair our ability to design and manufacture new products and reduce our revenues.
We occasionally license technologies from third parties rather than depending exclusively on our own proprietary technology and developments. Our ability to license new technologies from third parties is and will continue to be critical to our ability to offer new and improved products. We may not be able to continue to identify new technologies developed by others and even if we are able to identify new technologies, we may not be able to negotiate licenses on favorable terms, or at all. Additionally, we may lose rights granted under licenses for reasons beyond our control or if the license has a finite term and cannot be renewed on favorable terms or at all.
- 24 -
Our business is subject to environmental regulations that could be costly to comply with.
Federal, state and local regulations impose various environmental controls on the manufacturing, transportation, storage, use and disposal of batteries and hazardous chemicals and other materials used in, and hazardous waste produced by the manufacturing of our products. Conditions relating to our historical operations, including a former manufacturing facility located in South Plainfield, New Jersey previously operated by a subsidiary of Lake Region Medical, may require expenditures for clean-up in the future that could materially adversely affect our financial results. In addition, changes in environmental laws and regulations may impose costly compliance requirements on us or otherwise subject us to future liabilities. Additional or modified regulations relating to the manufacture, transportation, storage, use and disposal of materials used to manufacture our products or restricting disposal or transportation of batteries may be imposed that may result in higher costs or lower operating results. In addition, we cannot predict the effect that additional or modified environmental regulations may have on us or our customers.
Our international operations expose us to legal and regulatory risks, which could adversely affect our business.
Our profitability and international operations are, and will continue to be, subject to risks relating to changes in foreign legal and regulatory requirements. In addition, our international operations are governed by various U.S. laws and regulations, including the U.S. Foreign Corrupt Practices Act (“FCPA”) and other similar anti-corruption laws in other countries that prohibit us and our business partners and other intermediaries from making improper payments or offers of payment to foreign governments and their officials and political parties for the purpose of obtaining or retaining business. Any alleged or actual violations of these regulations may subject us to government scrutiny, severe criminal or civil sanctions and other liabilities and could adversely affect our business, reputation, operating results, and financial condition.
The healthcare industry is highly regulated and subject to various political, economic and regulatory changes that could increase our compliance costs and force us to modify how we develop and price our products.
The healthcare industry is highly regulated and is influenced by changing political, economic and regulatory factors. Several of our product lines are subject to international, federal, state and local health and safety, packaging and product content regulations, including the new European Medical Device Regulation that goes into effect in May 2021, which was adopted by the European Union as a common legal framework for all European Union member states. In addition, medical devices are subject to regulation by the FDA and similar governmental agencies. These regulations cover a wide variety of product activities from design and development to labeling, manufacturing, promotion, sales and distribution. Compliance with these regulations is time consuming, burdensome and expensive and could adversely affect our ability to sell products. This may result in higher than anticipated costs or lower than anticipated revenues.
Furthermore, healthcare industry regulations are complex, change frequently and have tended to become more stringent over time. Federal and state legislatures have periodically considered and implemented programs to reform or amend the U.S. healthcare system at both the federal and state levels. In addition, these regulations may contain proposals to increase governmental involvement in healthcare, lower reimbursement rates or otherwise change the environment in which healthcare industry participants operate. We may be required to incur significant expenses to comply with these regulations or remedy past violations of these regulations. Our failure to comply with applicable government regulations could also result in cessation of portions or all of our operations, impositions of fines and restrictions on our ability to carry on or expand our operations. In addition, because many of our products are sold into regulated industries, we must comply with additional regulations in marketing our products.
In response to perceived increases in healthcare costs in recent years, there have been and continue to be proposals by the Presidential administrations, members of Congress, state governments, regulators and third-party payors to control these costs and, more generally, to reform the U.S. healthcare system, including by amending, repealing or replacing the Patient Protection and Affordable Care Act. It is unclear how such reforms will progress under the new presidential administration. Elements of health care reform such as comparative effectiveness research, an independent payment advisory board, payment system reforms including shared savings pilots and other provisions could meaningfully change the way healthcare is developed and delivered, and may materially adversely impact numerous aspects of our business, results of operations and financial condition.
Our business is indirectly subject to healthcare industry cost containment measures that could result in reduced sales of our products.
Several of our customers rely on third party payors, such as government programs and private health insurance plans, to reimburse some or all of the cost of the procedures in which our products are used. The continuing efforts of governments, insurance companies and other payors of healthcare costs to contain or reduce those costs could lead to patients being unable to obtain approval for payment from these third party payors for procedures in which our products are used. If this occurs, sales of medical devices may decline significantly and our customers may reduce or eliminate purchases of our products, or demand further price reductions. The cost containment measures that healthcare payors are instituting, both in the U.S. and internationally, could reduce our revenues and harm our operating results.
- 25 -
ITEM 1B. UNRESOLVED STAFF COMMENTS
None.
ITEM 2. PROPERTIES
Our principal executive office and headquarters is located in Plano, Texas, in a leased facility. As of December 31, 2020, we operated 19 facilities in the U.S., four in Europe, three in Mexico, one in South America, two in Asia, and one in the Middle East. Of these facilities, 22 were leased and 8 were owned. We occupy approximately 1.8 million square feet of manufacturing and RD&E space worldwide. We believe the facilities we operate and their equipment are effectively utilized, well maintained, generally are in good condition, and will be able to accommodate our capacity needs to meet current levels of demand. We continuously review our anticipated requirements for facilities and, on the basis of that review, may from time to time acquire additional facilities, expand or dispose of existing facilities.
ITEM 3. LEGAL PROCEEDINGS
For information regarding certain legal proceedings pending against us, see Note 13 “Commitments and Contingencies” of the Notes to Consolidated Financial Statements contained in Item 8 of this report.
ITEM 4. MINE SAFETY DISCLOSURES
Not applicable.
- 26 -
PART II
ITEM 5. MARKET FOR REGISTRANT’S COMMON EQUITY, RELATED STOCKHOLDER MATTERS AND
ISSUER PURCHASES OF EQUITY SECURITIES
Market Information for Common Stock. The Company’s common stock trades on the New York Stock Exchange (“NYSE”) under the symbol “ITGR.”
Stockholders. According to the records of our transfer agent, there were approximately 100 holders of record of our common stock on February 12, 2021. Because many of these shares are held by brokers and other institutions on behalf of the ultimate beneficial holders of these shares, we are unable to estimate the total number of stockholders represented by these record holders.
Dividends. We have not paid cash dividends and do not anticipate paying any cash dividends in the foreseeable future.
PERFORMANCE GRAPH
The following graph compares, for the five year period ended December 31, 2020, the cumulative total stockholder return for Integer Holdings Corporation, the S&P SmallCap 600 Index, and the Hemscott Peer Group Index. The Hemscott Peer Group Index includes approximately 100 comparable companies included in the Hemscott Industry Group 520 Medical Instruments & Supplies and 521 Medical Appliances & Equipment. The graph assumes that $100 was invested on January 1, 2016 and assumes reinvestment of dividends. No adjustments have been made for the value provided to shareholders for spin-offs, including the spin-off of Nuvectra by the Company in March 2016. The stock price performance shown on the following graph is not necessarily indicative of future price performance.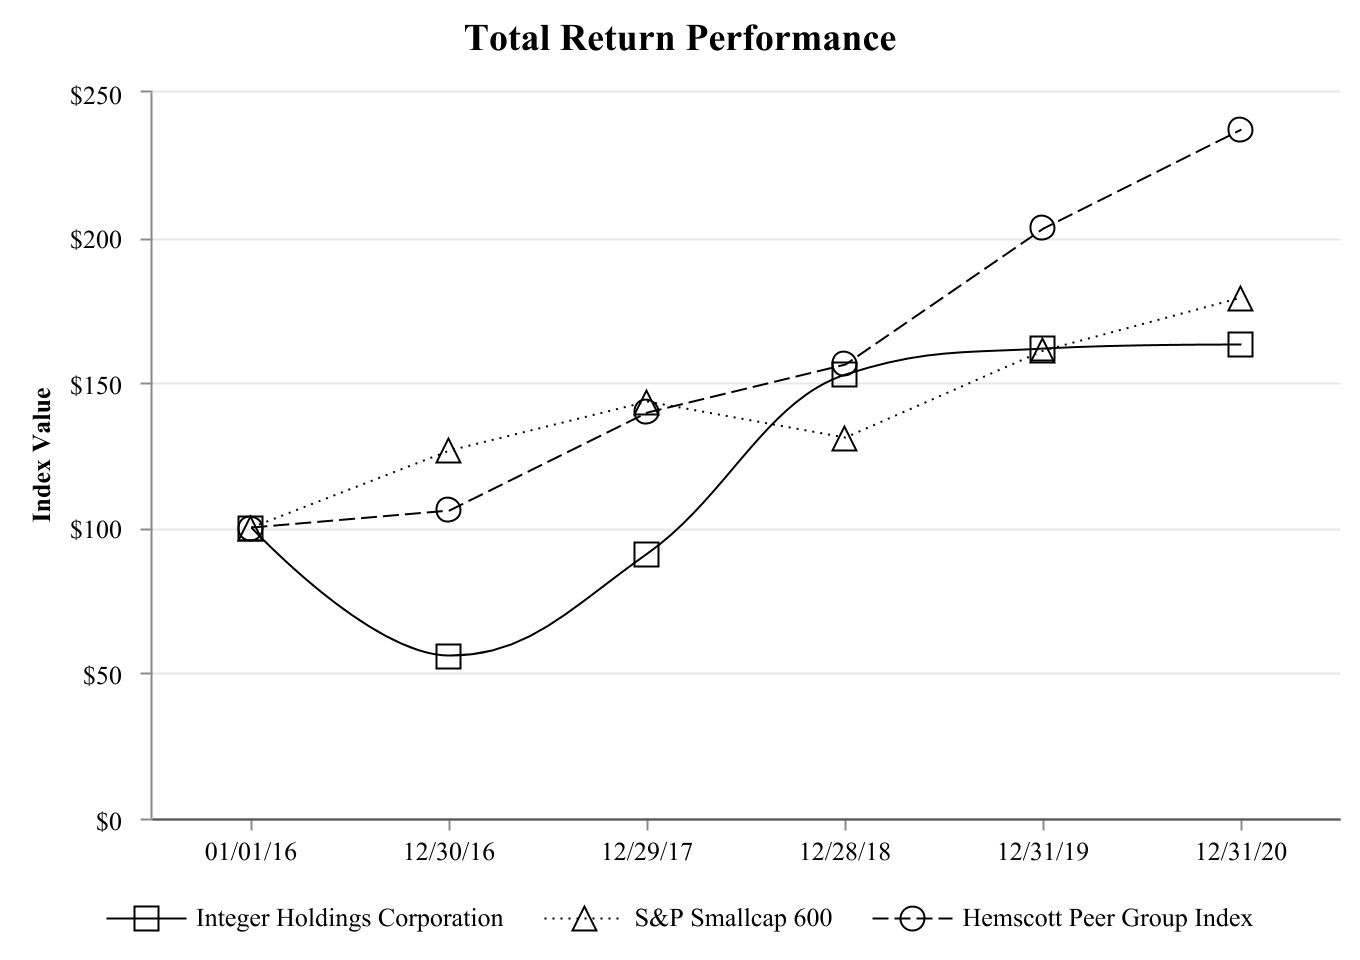
| Company/Index | 01/01/16 | 12/30/16 | 12/29/17 | 12/28/18 | 12/31/19 | 12/31/20 | |||||||||||||||||
| Integer Holdings Corporation | $ | 100.00 | $ | 56.10 | $ | 90.97 | $ | 152.68 | $ | 161.52 | $ | 163.05 | |||||||||||
| S&P Smallcap 600 | 100.00 | 126.56 | 143.30 | 131.15 | 161.03 | 179.20 | |||||||||||||||||
| Hemscott Peer Group Index | 100.00 | 106.06 | 139.59 | 156.04 | 202.99 | 237.14 | |||||||||||||||||
- 27 -
ITEM 6. SELECTED FINANCIAL DATA
Five-Year Summary Financial Data
(in thousands, except per share amounts)
This data should be read along with Item 7 “Management’s Discussion and Analysis of Financial Condition and Results of Operations” and Item 8 “Financial Statements and Supplementary Data” appearing elsewhere in this report. Operating results for the 2016 though 2017 fiscal years were retrospectively revised from previously reported amounts to reclassify the operations for the AS&O Product Line as discontinued operations.
The Company’s 2020, 2019, 2018, 2017 and 2016 fiscal years ended on December 31, 2020, December 31, 2019, December 28, 2018, December 29, 2017 and December 30, 2016, respectively.
2020(1)(2) | 2019(1)(2) | 2018(2) | 2017(2)(3) | 2016(1)(2) | |||||||||||||||||||||||||
| Summary of Operations for the Fiscal Year: | |||||||||||||||||||||||||||||
| Sales | $ | 1,073,442 | $ | 1,258,094 | $ | 1,215,012 | $ | 1,136,080 | $ | 1,075,502 | |||||||||||||||||||
| Income from continuing operations | 77,258 | 91,218 | 47,033 | 87,087 | 24,878 | ||||||||||||||||||||||||
| Income (loss) from discontinued operations | — | 5,118 | 120,931 | (20,408) | (18,917) | ||||||||||||||||||||||||
| Net income | 77,258 | 96,336 | 167,964 | 66,679 | 5,961 | ||||||||||||||||||||||||
| Basic earnings (loss) per share: | |||||||||||||||||||||||||||||
| Income from continuing operations | $ | 2.35 | $ | 2.80 | $ | 1.46 | $ | 2.77 | $ | 0.81 | |||||||||||||||||||
| Income (loss) from discontinued operations | — | 0.16 | 3.76 | (0.65) | (0.61) | ||||||||||||||||||||||||
| Basic earnings per share | 2.35 | 2.95 | 5.23 | 2.12 | 0.19 | ||||||||||||||||||||||||
| Diluted earnings (loss) per share: | |||||||||||||||||||||||||||||
| Income from continuing operations | $ | 2.33 | $ | 2.76 | $ | 1.44 | $ | 2.72 | $ | 0.80 | |||||||||||||||||||
| Income (loss) from discontinued operations | — | 0.15 | 3.71 | (0.64) | (0.61) | ||||||||||||||||||||||||
| Diluted earnings per share | 2.33 | 2.92 | 5.15 | 2.08 | 0.19 | ||||||||||||||||||||||||
| Financial Position at Year End: | |||||||||||||||||||||||||||||
| Working capital | $ | 256,746 | $ | 236,317 | $ | 251,680 | $ | 322,906 | $ | 332,087 | |||||||||||||||||||
| Total assets | 2,371,857 | 2,353,093 | 2,326,681 | 2,848,345 | 2,832,543 | ||||||||||||||||||||||||
| Long-term obligations | 944,611 | 1,021,527 | 1,101,618 | 1,745,961 | 1,922,084 | ||||||||||||||||||||||||
__________
(1)We acquired certain assets and liabilities of InoMec in 2020 and USB in 2019. In 2016, we spun-off a portion of our former QiG segment, which became Nuvectra Corporation. This data includes the results of operations of InoMec and USB subsequent to acquisition and does not include the result of operations of Nuvectra subsequent to the Spin-off.
(2)From 2016 to 2020, we recorded charges in Other Operating Expenses (“OOE”), primarily related to our cost savings and consolidation initiatives and cost of acquisitions. Additional information is set forth in Note 11 “Other Operating Expenses” of the Notes to Consolidated Financial Statements contained in Item 8 of this report.
(3)In the fourth quarter of 2017, we recognized a net benefit of $39.4 million as a result of the Tax Cuts and Jobs Act of 2017.
- 28 -
ITEM 7. MANAGEMENT’S DISCUSSION AND ANALYSIS OF FINANCIAL CONDITION AND RESULTS OF
OPERATIONS
The following discussion and analysis of our financial condition and results of operations should be read together with our selected financial data and our consolidated financial statements and the related notes appearing elsewhere in this report.
This discussion and analysis contains forward-looking statements that involve risks, uncertainties and assumptions. Our actual results may differ materially from those anticipated in these forward-looking statements as a result of many factors, including but not limited to those under the heading “Risk Factors” in Item 1A of this report.
Our Business
•Our business
•Impact of COVID-19
•Recent business acquisitions
•Discontinued operations and divestiture
•Patent litigation
•Strategic overview
•Financial overview
Our Financial Results
•Fiscal 2020 compared with fiscal 2019
•Liquidity and capital resources
•Off-balance sheet arrangements
•Contractual obligations
•Impact of recently issued accounting standards
Critical Accounting Estimates
•Inventories
•Valuation of goodwill and intangible assets
Our Business
Integer Holdings Corporation is one of the largest MDO manufacturers in the world serving the cardiac, neuromodulation, orthopedics, vascular and advanced surgical markets. We also develop batteries for high-end niche applications in the non-medical energy, military, and environmental markets. Our vision is to enhance the lives of patients worldwide by being our customers’ partner of choice for innovative technologies and services.
We organize our business into two reportable segments, Medical and Non-Medical, and derive our revenues from four principle product lines. The Medical segment includes the Cardio & Vascular, Cardiac & Neuromodulation and Advanced Surgical, Orthopedics & Portable Medical product lines and the Non-Medical segment comprises the Electrochem product line. For more information on our segments, please refer to Note 18 “Segment and Geographic Information” of the Notes to Consolidated Financial Statements contained in Item 8 of this report.
Impact of COVID-19
Beginning in early March 2020, the global spread of the novel coronavirus (“COVID-19”) created significant uncertainty and worldwide economic disruption. Specific impacts to our business include delayed or reduced customer orders and sales, restrictions on our associates’ ability to travel or work, delays in shipments to and from certain countries, and disruptions in our supply chain. The extent to which COVID-19 impacts our operations will depend on future developments, which are highly uncertain, including, among others, the duration of the outbreak, new information that may emerge concerning the severity of COVID-19 and the actions, especially those taken by governmental authorities, to contain the pandemic or treat its impact. As pandemic-related events continue to evolve, additional impacts may arise that we are not aware of currently. Any prolonged material disruption of our associates, suppliers, manufacturing, or customers could materially impact our consolidated financial position, results of operations or cash flows.
- 29 -
MANAGEMENT’S DISCUSSION AND ANALYSIS
Recent Business Acquisitions
On February 19, 2020, we acquired certain assets and liabilities of InoMec Ltd. (“InoMec”), a privately-held company based in Israel that specializes in the research, development and manufacturing of medical devices, including minimally invasive tools, delivery systems, tubing and catheters, surgery tools, drug-device combination, laser combined devices, and tooling and production. The acquisition enables us to create a research and development center in Israel, closer to the customer base in the region.
In October 2019, we purchased certain assets and liabilities of US BioDesign, LLC (“USB”), a privately-held developer and manufacturer of complex braided biomedical structures for disposable and implantable medical devices. The acquisition added a differentiated capability related to the development and manufacture of complex braided and formed biomedical structures to our broad portfolio, that we believe further positions us as a partner of choice for innovative medical technologies.
Discontinued Operations and Divestiture
In July 2018, we completed the sale of the AS&O Product Line for net cash proceeds of approximately $581 million. In connection with the sale, the parties executed a transition services agreement whereby we provided certain corporate services (including accounting, payroll, and information technology services) to Viant to facilitate an orderly transfer of business operations. Viant paid us for these services as specified in the transition services agreement, which were complete as of June 28, 2019. In addition, the parties executed long-term supply agreements under which the parties have agreed to supply the other with certain products at prices specified in the agreements for a term of three years.
In connection with the closing of the transaction but prior to a net working capital adjustment, we recognized a pre-tax gain on sale of discontinued operations of $195.0 million during the year ended December 28, 2018. During 2019, we received, and recognized as gain on sale from discontinued operations, $4.8 million due to the final net working capital adjustment agreed to with Viant.
The results of operations of the AS&O Product Line have been classified as discontinued operations for all periods presented. Prior period amounts have been reclassified to conform to the continuing operations reporting presentation. All results and information presented exclude the AS&O Product Line unless otherwise noted.
Refer to Note 2 “Business Acquisitions, Divestiture and Discontinued Operations” of the Notes to Consolidated Financial Statements contained in Item 8 of this report for additional information about the acquisition of certain assets of InoMec and USB and the divestiture of the AS&O Product Line.
Patent Litigation
In April 2013, we commenced an action against a competitor alleging they had infringed on the our patents by manufacturing and selling filtered feedthrough assemblies used in implantable pacemakers and cardioverter defibrillators that incorporate our patented technology.
Following four trials and an appeal, the United States Court of Appeals for the Federal Circuit affirmed, in all respects, a judgment in our favor. We received proceeds related to the judgment of $28.9 million in October 2020, and after recognizing certain related expenses, recognized a net gain of $28.2 million, which is recorded in Selling, general and administrative expenses. The proceeds were used to pay down a portion of our Revolving Credit Facility.
Refer to Note 13 “Commitments and Contingencies” of the Notes to Consolidated Financial Statements contained in Item 8 of this report for additional information on this matter.
- 30 -
MANAGEMENT’S DISCUSSION AND ANALYSIS
Strategic Overview
We continue to take steps to better align our resources in order to invest to grow and protect, and preserve our portfolio of products. In addition to our portfolio strategy, we continue to execute our six key operational strategic imperatives designed to drive excellence in everything we do:
•Sales Force Excellence: We have changed the organizational structure to match product line growth strategies and customer needs. This change is about getting more out of the capabilities we already have, and has increased individual accountability and clarity of ownership, while serving customers more effectively.
•Market Focused Innovation: We are ensuring we get the most return on our research and development investments. We are focused on having a clear picture of how we spend our money so we can increase investments to drive future growth.
•Manufacturing Excellence: The goal is to deliver world-class operational performance in the areas of safety, quality, delivery and overall efficiency. We want to transition our manufacturing into a competitive advantage through a single, enterprise-wide manufacturing structure known as the Integer Production System. This system will provide standardized systems and processes by leveraging best practices and applying them across all of our global sites.
•Business Process Excellence: We are taking a systematic approach to driving excellence in everything we do by standardizing, optimizing and ultimately sustaining all of our processes.
•Leadership Capability: We have a robust plan to make leadership a competitive advantage for us, and as the success rate is higher with internal hires, we are focusing on finding and developing leaders from within the Company to build critical capabilities for future success.
•Performance Excellence: We are raising the bar on associate performance to maximize our impact. This includes aligning key roles with critical capabilities, positioning the best talent against the biggest work, and putting tools and processes in place to provide higher financial rewards for top performers, so our top performers can see increased results in pay for increased results in their performance.
We believe we are well-positioned within the medical technology and MDO manufacturing market and that there is a robust pipeline of opportunities to pursue. We have expanded our medical device capabilities and are excited about opportunities to partner with customers to drive innovation. We believe we have the scale and global presence, supported by world-class manufacturing and quality capabilities, to capture these opportunities. We are confident in our capabilities as one of the largest MDO manufacturers, with a long history of successfully integrating companies, driving down costs and growing revenues over the long-term. Ultimately, our strategic vision is to drive shareholder value by enhancing the lives of patients worldwide by being our customers’ partner of choice for innovative technologies and services.
Financial Overview
Fiscal 2020 Compared with Fiscal 2019
Income from continuing operations for 2020 was $77.3 million or $2.33 per diluted share compared to $91.2 million or $2.76 per diluted share for 2019. These variances are primarily the result of the following:
•Sales from continuing operations for 2020 decreased 15% primarily due to the impact of the COVID-19 pandemic.
•Gross profit for 2020 decreased $69.3 million or 20%, primarily from a decrease in sales volume, price reductions to our customers, and a loss in volume leverage, which resulted from our sales decrease, partially offset by 2019 charges associated with a customer bankruptcy (see Customer Bankruptcy under Our Financial Results below).
•Operating expenses for 2020 decreased by $32.3 million compared to 2019, due to decreases of $29.7 million in SG&A expenses and $4.5 million in Other operating expenses, partially offset by a $1.9 million increase in RD&E expenses. Included in SG&A expenses for 2020 is a net gain of $28.2 million recognized in connection with a previously mentioned patent litigation judgment.
•Interest expense for 2020 decreased by $14.3 million primarily due to lower interest rates and lower outstanding debt balances.
•We recognized a net gain on equity investments of $5.3 million in 2020, compared to a net loss on equity investments of $0.5 million during 2019. Gains and losses on equity investments are generally unpredictable in nature.
•Other loss, net for 2020 was $1.5 million compared to other income, net of $0.6 million during 2019, primarily due to fluctuations in foreign currency gains and losses in the respective periods.
•We recorded provisions for income taxes of $8.9 million and $14.0 million for 2020 and 2019, respectively. The decrease in provision for income taxes is primarily due to our decrease in pre-tax income and the beneficial impact of the final Treasury Regulations issued in 2020.
- 31 -
MANAGEMENT’S DISCUSSION AND ANALYSIS
Fiscal 2019 Compared with Fiscal 2018
Income from continuing operations for 2019 was $91.2 million or $2.76 per diluted share compared to $47.0 million or $1.44 per diluted share for 2018. These variances are primarily the result of the following:
•Sales from continuing operations for 2019 increased 4% primarily driven by growth in Cardio & Vascular and Cardiac & Neuromodulation sales.
•Gross profit for 2019 decreased $7.7 million, primarily due to higher costs of sales due to inventory write-downs and other expenses totaling $21.4 million related to a customer who filed bankruptcy in 2019 (see “Customer Bankruptcy”), partially offset by a $43.1 million increase in sales from continuing operations.
•Operating expenses for 2019 decreased by 5% compared to 2018, due to decreases of $3.7 million in SG&A expenses, $2.1 million in RD&E expenses and $3.9 million in Other operating expenses.
•Interest expense for 2019 decreased by $46.8 million primarily due to lower outstanding debt balances due to the repayment of debt over the last year and extinguishment of debt charges included in 2018 related to the repayment of indebtedness in connection with the divestiture of the AS&O Product Line. Debt extinguishment expenses included in Interest expense for 2019 were lower by $40.1 million compared to 2018.
•We recognized a net loss on equity investments of $0.5 million in 2019, compared to a net gain on equity investments of $5.6 million during 2018. Gains and losses on equity investments are generally unpredictable in nature.
•Other income, net for 2019 was $0.6 million compared to other loss, net of $0.8 million during 2018, primarily due to foreign currency gains in 2019 compared to foreign currency losses in 2018.
•We recorded an income tax provision of $14.0 million for 2019, compared to a provision of $14.1 million for 2018.
- 32 -
MANAGEMENT’S DISCUSSION AND ANALYSIS
Our Financial Results
The following table presents selected financial information derived from our Consolidated Financial Statements, contained in Item 8 of this report, for the periods presented (dollars in thousands, except per share amounts):
| Change | Change | ||||||||||||||||||||||||||||||||||||||||
| 2020 vs. 2019 | 2019 vs. 2018 | ||||||||||||||||||||||||||||||||||||||||
| 2020 | 2019 | 2018 | $ | % | $ | % | |||||||||||||||||||||||||||||||||||
| Medical Sales: | |||||||||||||||||||||||||||||||||||||||||
| Cardio & Vascular | $ | 569,948 | $ | 610,056 | $ | 585,464 | $ | (40,108) | (7) | % | $ | 24,592 | 4 | % | |||||||||||||||||||||||||||
| Cardiac & Neuromodulation | 346,242 | 457,194 | 443,347 | (110,952) | (24) | % | 13,847 | 3 | % | ||||||||||||||||||||||||||||||||
| Advanced Surgical, Orthopedics & Portable Medical | 121,788 | 132,429 | 133,225 | (10,641) | (8) | % | (796) | (1) | % | ||||||||||||||||||||||||||||||||
| Total Medical Sales | 1,037,978 | 1,199,679 | 1,162,036 | (161,701) | (13) | % | 37,643 | 3 | % | ||||||||||||||||||||||||||||||||
| Non-Medical | 35,464 | 58,415 | 52,976 | (22,951) | (39) | % | 5,439 | 10 | % | ||||||||||||||||||||||||||||||||
| Total sales | 1,073,442 | 1,258,094 | 1,215,012 | (184,652) | (15) | % | 43,082 | 4 | % | ||||||||||||||||||||||||||||||||
| Cost of sales | 787,735 | 903,084 | 852,347 | (115,349) | (13) | % | 50,737 | 6 | % | ||||||||||||||||||||||||||||||||
| Gross profit | 285,707 | 355,010 | 362,665 | (69,303) | (20) | % | (7,655) | (2) | % | ||||||||||||||||||||||||||||||||
| Gross profit as a % of sales | 26.6 | % | 28.2 | % | 29.8 | % | |||||||||||||||||||||||||||||||||||
| Operating expenses: | |||||||||||||||||||||||||||||||||||||||||
| Selling, general and administrative (“SG&A”) | 109,006 | 138,695 | 142,441 | (29,689) | (21) | % | (3,746) | (3) | % | ||||||||||||||||||||||||||||||||
| SG&A as a % of sales | 10.2 | % | 11.0 | % | 11.7 | % | |||||||||||||||||||||||||||||||||||
| Research, development and engineering (“RD&E”) | 48,468 | 46,529 | 48,604 | 1,939 | 4 | % | (2,075) | (4) | % | ||||||||||||||||||||||||||||||||
| RD&E as a % of sales | 4.5 | % | 3.7 | % | 4.0 | % | |||||||||||||||||||||||||||||||||||
| Other operating expenses | 7,621 | 12,151 | 16,065 | (4,530) | (37) | % | (3,914) | (24) | % | ||||||||||||||||||||||||||||||||
| Total operating expenses | 165,095 | 197,375 | 207,110 | (32,280) | (16) | % | (9,735) | (5) | % | ||||||||||||||||||||||||||||||||
| Operating income | 120,612 | 157,635 | 155,555 | (37,023) | (23) | % | 2,080 | 1 | % | ||||||||||||||||||||||||||||||||
| Operating income as a % of sales | 11.2 | % | 12.5 | % | 12.8 | % | |||||||||||||||||||||||||||||||||||
| Interest expense | 38,220 | 52,545 | 99,310 | (14,325) | (27) | % | (46,765) | (47) | % | ||||||||||||||||||||||||||||||||
| (Gain) loss on equity investments, net | (5,337) | 475 | (5,623) | (5,812) | NM | 6,098 | NM | ||||||||||||||||||||||||||||||||||
| Other (income) loss, net | 1,522 | (578) | 752 | 2,100 | NM | (1,330) | NM | ||||||||||||||||||||||||||||||||||
| Income from continuing operations before taxes | 86,207 | 105,193 | 61,116 | (18,986) | (18) | % | 44,077 | 72 | % | ||||||||||||||||||||||||||||||||
| Provision for income taxes | 8,949 | 13,975 | 14,083 | (5,026) | (36) | % | (108) | (1) | % | ||||||||||||||||||||||||||||||||
| Effective tax rate | 10.4 | % | 13.3 | % | 23.0 | % | |||||||||||||||||||||||||||||||||||
| Income from continuing operations | $ | 77,258 | $ | 91,218 | $ | 47,033 | $ | (13,960) | (15) | % | $ | 44,185 | 94 | % | |||||||||||||||||||||||||||
| Income from continuing operations as a % of sales | 7.2 | % | 7.3 | % | 3.9 | % | |||||||||||||||||||||||||||||||||||
| Diluted earnings per share from continuing operations | $ | 2.33 | $ | 2.76 | $ | 1.44 | $ | (0.43) | (16) | % | $ | 1.32 | 92 | % | |||||||||||||||||||||||||||
NM - Calculated change not meaningful.
Customer Bankruptcy
In November 2019, one of our customers, Nuvectra, filed a voluntary petition in U.S. Bankruptcy Court for the Eastern District of Texas seeking relief under Chapter 11 of the U.S. Bankruptcy Code. During 2020 and 2019, we recorded pre-tax charges totaling $1.2 million and $24.2 million, respectively, in connection with the bankruptcy. These charges were primarily non-cash and were associated with certain Nuvectra-related assets, primarily consisting of inventory, accounts receivable, as well as certain non-cancelable inventory commitments. The charges for 2020 were included in Cost of sales ($1.1 million) and SG&A expenses ($0.1 million). The charges for 2019 were included in Cost of sales ($21.4 million), SG&A expenses ($2.4 million) and Other operating expenses ($0.4 million).
- 33 -
MANAGEMENT’S DISCUSSION AND ANALYSIS
The following discussion is a comparison between fiscal year 2020 and fiscal year 2019 results. For a discussion of our results of operations for fiscal year 2019 compared to fiscal year 2018, please refer to Item 7 of Part II, “Management’s Discussion and Analysis of Financial Condition and Results of Operations” in our Annual Report on Form 10-K for the fiscal year ended December 31, 2019, which was filed with the SEC on February 20, 2020.
Fiscal 2020 Compared with Fiscal 2019
Sales
Sales by product line for 2020 and 2019 were as follows (dollars in thousands):
| Change | |||||||||||||||||||||||
| 2020 | 2019 | $ | % | ||||||||||||||||||||
| Medical Sales: | |||||||||||||||||||||||
| Cardio & Vascular | $ | 569,948 | $ | 610,056 | $ | (40,108) | (6.6) | % | |||||||||||||||
| Cardiac & Neuromodulation | 346,242 | 457,194 | (110,952) | (24.3) | % | ||||||||||||||||||
| Advanced Surgical, Orthopedics & Portable Medical | 121,788 | 132,429 | (10,641) | (8.0) | % | ||||||||||||||||||
| Total Medical Sales | 1,037,978 | 1,199,679 | (161,701) | (13.5) | % | ||||||||||||||||||
| Non-Medical | 35,464 | 58,415 | (22,951) | (39.3) | % | ||||||||||||||||||
| Total sales | $ | 1,073,442 | $ | 1,258,094 | $ | (184,652) | (14.7) | % | |||||||||||||||
Total 2020 sales decreased 15% to $1.073 billion in comparison to 2019. The most significant drivers of this decrease were as follows:
Cardio & Vascular sales for 2020 decreased $40.1 million or 7% in comparison to 2019. Cardio & Vascular sales were negatively impacted by the COVID-19 pandemic and a blend of our customers’ responses across nearly all Cardio & Vascular markets. During 2020, price reductions reduced Cardio & Vascular sales by $7.1 million in comparison to 2019. Foreign currency exchange rate fluctuations and acquisitions of USB and Inomec increased Cardio & Vascular sales for 2020 by $0.8 million and $7.9 million, respectively, in comparison to 2019.
Cardiac & Neuromodulation sales for 2020 decreased $111.0 million or 24% in comparison to 2019. Cardiac & Neuromodulation sales were negatively impacted by the COVID-19 pandemic and a blend of our customers’ responses. Additionally, the Nuvectra bankruptcy created a headwind of $16.7 million for the 2020 fiscal year. During 2020, price reductions reduced Cardiac & Neuromodulation sales by approximately $10.7 million in comparison to 2019. Foreign currency exchange rate fluctuations and acquisitions did not have a material impact on Cardiac & Neuromodulation sales during 2020 in comparison to 2019.
Advanced Surgical, Orthopedic & Portable Medical includes sales to the acquirer of our AS&O Product Lines, Viant, under the LSA for the sale of products by the Company to Viant. Advanced Surgical, Orthopedics & Portable Medical sales for 2020 decreased by $10.6 million in comparison to 2019, driven by the impact of COVID-19 and a blend of our customers’ responses. Price reductions reduced Advanced Surgical, Orthopedic & Portable Medical sales by $1.4 million in comparison to 2019. Foreign currency exchange rate fluctuations and acquisitions did not have a material impact on Advanced Surgical, Orthopedic & Portable Medical sales during 2020 in comparison to 2019.
Non-Medical sales for 2020 decreased $23.0 million or 39% in comparison to 2019. The decreases in Non-Medical sales were primarily driven by a severe decline in the energy market and demand fall-out from the COVID-19 pandemic. Price and foreign currency exchange rate fluctuations did not have a material impact on Non-Medical sales during 2020 in comparison to 2019.
- 34 -
MANAGEMENT’S DISCUSSION AND ANALYSIS
Gross Profit
Changes to gross profit as a percentage of sales (“Gross Margin”) from the prior year were due to the following:
| % Change | |||||
| 2020 vs. 2019 | |||||
Price(a) | (1.3) | % | |||
Mix(b) | (0.6) | ||||
Volume Leverage(c) | (1.3) | ||||
Customer Bankruptcy(d) | 1.6 | ||||
| Total percentage point change to gross profit as a percentage of sales | (1.6) | % | |||
__________
(a)Our Gross Margin for 2020 was negatively impacted by price reductions given to our larger OEM customers in return for long-term volume commitments.
(b)Amount represents the impact to our Gross Margin attributable to changes in the mix of product sales during the period.
(c)Our gross margin for 2020 was negatively impacted by lower sales from the COVID-19 pandemic. Given our indirect labor and overhead costs are less variable, and in most cases fixed, the resulting reduction in sales negatively impacted gross margin. However, we continue to execute on our Manufacturing Excellence strategic imperative and maintain our facility infrastructure as we expect the sales decline to be temporary.
(d)Amount represents the impact to our Gross Margin attributable to the Customer Bankruptcy.
SG&A Expenses
Changes to SG&A expenses were primarily due to the following (in thousands):
| $ Change | |||||
| 2020 vs. 2019 | |||||
Customer Bankruptcy(a) | $ | (2,274) | |||
Transition services agreement(b) | 2,733 | ||||
Patent litigation gain, net(c) | (28,167) | ||||
All other SG&A, net(d) | (1,981) | ||||
| Net decrease in SG&A Expenses | $ | (29,689) | |||
__________
(a)Amount consists primarily of a $2.3 million reserve against outstanding receivables recorded during 2019 attributable to the Customer Bankruptcy.
(b)Represents the amount included in SG&A expenses which was billed to Viant for transition services during 2019. We executed a transition services agreement in conjunction with the sale of the AS&O Product Line, whereby we agreed to provide certain corporate services (including accounting, payroll, and information technology services) to Viant to facilitate an orderly transfer of business operations. This provision of services under the agreement was completed during the second quarter of 2019.
(c)We recognized a net gain of $28.2 million during 2020 related to a patent litigation judgment. Refer to Note 13 “Commitments and Contingencies” of the Notes to Consolidated Financial Statements contained in Item 8 of this report for additional information on this matter.
(d)The net decrease in all other SG&A expenses for 2020 compared to 2019 is primarily attributable to lower compensation and benefits cost, travel related expenses and depreciation expense, partially offset by an increase in amortization expense.
RD&E Expenses
RD&E expenses for 2020 and 2019 were $48.5 million and $46.5 million, respectively. The increase in RD&E expenses for 2020 compared to 2019 is primarily attributable to increased compensation and benefits costs, consistent with our strategy to invest in capabilities for growth. RD&E expenses are influenced by the number and timing of in-process projects and labor hours and other costs associated with these projects. Our research and development initiatives continue to emphasize new product development, product improvements, and the development of new technological platform innovations.
- 35 -
MANAGEMENT’S DISCUSSION AND ANALYSIS
Other Operating Expenses
OOE comprises the following for 2020 and 2019 (in thousands):
| 2020 | 2019 | Change | |||||||||||||||
Operational excellence(a) | $ | 2,791 | $ | — | $ | 2,791 | |||||||||||
Strategic reorganization and alignment(b) | 686 | 5,812 | (5,126) | ||||||||||||||
Manufacturing alignment to support growth(c) | 241 | 2,145 | (1,904) | ||||||||||||||
Acquisition and integration costs(d) | (776) | 377 | (1,153) | ||||||||||||||
Other general expenses(e) | 4,679 | 3,817 | 862 | ||||||||||||||
| Other operating expenses | $ | 7,621 | $ | 12,151 | $ | (4,530) | |||||||||||
__________
(a)These projects focus on changing our organizational structure to match product line growth strategies and customer needs, transitioning our manufacturing process into a competitive advantage and standardizing and optimizing our business processes. Costs related to our 2020 initiatives mainly include termination benefits.
(b)As a result of the strategic review of our customers, competitors and markets, we began taking steps in 2017 to better align our resources to enhance the profitability of our portfolio of products. These initiatives primarily included aligning resources with our strategic direction, improving profitability to invest in accelerated growth and the expansion of a facility. Costs related to these initiatives mainly included termination benefits and fees for professional services. These actions were completed during 2020.
(c)In 2017, we commenced several initiatives designed to reduce costs, increase manufacturing capacity to accommodate growth and improve operating efficiencies. The plan involved the relocation of certain manufacturing operations and expansion of certain of our facilities. These actions were completed during 2020.
(d)Amounts include expenses related to the purchase of certain assets and liabilities from InoMec and USB. The 2020 amount also includes a $2.0 million adjustment to reduce the fair value of acquisition-related contingent consideration liabilities. See Note 17 “Financial Instruments and Fair Value Measurements” of the Notes to Consolidated Financial Statements contained in Item 8 of this report for additional information related to the fair value measurement of the contingent consideration.
(e)Amounts include expenses related to other initiatives not described above, which relate primarily to actions to align labor with customer demand as a result of COVID-19 and the decline of the energy market and integration and operational initiatives to reduce future costs and improve efficiencies. The 2020 and 2019 amounts primarily include severance, information technology systems conversion expenses, expenses incurred in connection with the Customer Bankruptcy, and expenses related to the restructuring of certain legal entities of the Company.
Refer to Note 11 “Other Operating Expenses” of the Notes to Consolidated Financial Statements contained in Item 8 of this report for additional information regarding these initiatives.
- 36 -
MANAGEMENT’S DISCUSSION AND ANALYSIS
Interest Expense
Interest expense consists primarily of cash interest and debt related charges, such as amortization of debt issuance costs and original issue discount. Interest expense decreased $14.3 million to $38.2 million in 2020 from $52.5 million in 2019, primarily from a decrease in cash interest due to lower interest rates. The weighted average interest rates paid on the average principal amount of debt outstanding during 2020 and 2019 was 3.79% and 4.99%, respectively. The weighted average interest rates paid in 2020 compared to 2019 reflect decreases in LIBOR. In November 2019, we reduced the applicable interest rate margins by amending our Senior Secured Credit Facilities.
Debt related charges included in interest expense were $4.8 million for 2020 compared to $7.8 million for 2019. The decrease in debt related charges during 2020 compared to 2019 is primarily attributable to lower accelerated write-offs (losses from extinguishment of debt) of debt issuance costs and unamortized discounts related to prepayments of portions of our Term Loan B facility. We recognized losses from extinguishment of debt during 2020 and 2019 of $0.5 million and $2.5 million, respectively.
As of December 31, 2020, approximately 27% of our principal amount of debt outstanding was subject to variable rates, in comparison to approximately 20% as of December 31, 2019. We enter into interest rate swap agreements to reduce our exposure to fluctuations in the LIBOR rate. See Note 17 “Financial Instruments and Fair Value Measurements” of the Notes to the Consolidated Financial Statements contained in Item 8 of this report for additional information pertaining to our interest rate swap agreements.
(Gain) Loss on Equity Investments, Net
During 2020, we realized net gains of $5.3 million on our equity investments compared to net losses of $0.5 million for 2019. Gains and losses on equity investments are generally unpredictable in nature. During 2020 and 2019, we recognized impairment charges of $0.4 million and $1.6 million, respectively, related to investments in our non-marketable equity securities. The residual amounts for 2020 and 2019 relate to our share of equity method investee gains/losses, including unrealized appreciation of the underlying interests of the investee. As of December 31, 2020 and December 31, 2019, the carrying value of our equity investments were $27.2 million and $22.3 million, respectively. See Note 17 “Financial Instruments and Fair Value Measurements” of the Notes to Consolidated Financial Statements contained in Item 8 of this report for further details regarding these investments.
Other (Income) Loss, Net
Other (income) loss, net was a loss of $1.5 million during 2020 compared to income of $0.6 million during 2019. Other (income) loss, net primarily comprises gains/losses from the impact of exchange rates on transactions denominated in foreign currencies. Our foreign currency transaction gains/losses are based primarily on fluctuations of the U.S. dollar relative to the Euro, Mexican peso, Uruguayan pesos, Malaysian ringgits, or Israeli shekel.
The impact of foreign currency exchange rates on transactions denominated in foreign currencies included in Other (income) loss, net for 2020 and 2019 were losses of $1.6 million and $0.04 million, respectively. We continually monitor our foreign currency exposures and seek to take steps to mitigate these risks. However, fluctuations in foreign currency exchange rates could have a significant impact, positive or negative, on our financial results in the future.
- 37 -
MANAGEMENT’S DISCUSSION AND ANALYSIS
Provision for Income Taxes
During 2020 and 2019, our provision for income taxes was $8.9 million on worldwide pre-tax income of $86.2 million
(10.4%) and $14.0 million on worldwide pre-tax income of $105.1 million (13.3%), respectively. The stand-alone U.S. component of the effective tax rate for 2020 reflected a $3.1 million provision on $35.3 million of pre-tax book income (8.9%) versus a $5.7 million provision on $40.2 million of pre-tax book income (14.2%) for 2019. The stand-alone International component of the effective tax rate for 2020 reflected a $5.8 million provision on $50.9 million of pre-tax book income (11.4%) versus a $8.3 million provision on $65.0 million of pre-tax book income (12.7%) for 2019.
The provision for income taxes for 2020 differs from the U.S. statutory rate due to the following (dollars in thousands):
| U.S. | International | Combined | |||||||||||||||||||||||||||||||||
| $ | % | $ | % | $ | % | ||||||||||||||||||||||||||||||
| Income before provision for income taxes | $ | 35,337 | $ | 50,870 | $ | 86,207 | |||||||||||||||||||||||||||||
| Provision at statutory rate | $ | 7,420 | 21.0 | % | $ | 10,683 | 21.0 | % | $ | 18,103 | 21.0 | % | |||||||||||||||||||||||
| Federal tax credits (including R&D) | (7,009) | (19.9) | — | — | (7,009) | (8.1) | |||||||||||||||||||||||||||||
| Foreign rate differential | 339 | 1.0 | (5,672) | (11.2) | (5,333) | (6.2) | |||||||||||||||||||||||||||||
| Stock-based compensation | (1,459) | (4.1) | — | — | (1,459) | (1.7) | |||||||||||||||||||||||||||||
| Uncertain tax positions | 1,208 | 3.4 | — | — | 1,208 | 1.4 | |||||||||||||||||||||||||||||
| State taxes, net of federal benefit | 553 | 1.6 | — | — | 553 | 0.6 | |||||||||||||||||||||||||||||
| U.S. tax on foreign earnings, net of §250 deduction | 3,216 | 9.1 | — | — | 3,216 | 3.7 | |||||||||||||||||||||||||||||
| Valuation allowance | (470) | (1.3) | 125 | 0.2 | (345) | (0.4) | |||||||||||||||||||||||||||||
| Other | (674) | (1.9) | 689 | 1.4 | 15 | 0.1 | |||||||||||||||||||||||||||||
| Provision for income taxes | $ | 3,124 | 8.9 | % | $ | 5,825 | 11.4 | % | $ | 8,949 | 10.4 | % | |||||||||||||||||||||||
The provision for income taxes for 2019 differs from the U.S. statutory rate due to the following (dollars in thousands):
| U.S. | International | Combined | |||||||||||||||||||||||||||||||||
| $ | % | $ | % | $ | % | ||||||||||||||||||||||||||||||
| Income before provision for income taxes | $ | 40,203 | $ | 64,990 | $ | 105,193 | |||||||||||||||||||||||||||||
| Provision at statutory rate | $ | 8,443 | 21.0 | % | $ | 13,648 | 21.0 | % | $ | 22,091 | 21.0 | % | |||||||||||||||||||||||
| Federal tax credits (including R&D) | (4,751) | (11.8) | (46) | (0.1) | (4,797) | (4.6) | |||||||||||||||||||||||||||||
| Foreign rate differential | — | — | (5,479) | (8.4) | (5,479) | (5.2) | |||||||||||||||||||||||||||||
| Stock-based compensation | (2,422) | (6.0) | — | — | (2,422) | (2.3) | |||||||||||||||||||||||||||||
| Uncertain tax positions | (920) | (2.3) | — | — | (920) | (0.9) | |||||||||||||||||||||||||||||
| State taxes, net of federal benefit | 1,106 | 2.8 | — | — | 1,106 | 1.1 | |||||||||||||||||||||||||||||
| U.S. tax on foreign earnings, net of §250 deduction | 5,201 | 12.9 | — | — | 5,201 | 4.9 | |||||||||||||||||||||||||||||
| Valuation allowance | (956) | (2.4) | (650) | (1.0) | (1,606) | (1.5) | |||||||||||||||||||||||||||||
| Other | (5) | — | 806 | 1.2 | 801 | 0.8 | |||||||||||||||||||||||||||||
| Provision for income taxes | $ | 5,696 | 14.2 | % | $ | 8,279 | 12.7 | % | $ | 13,975 | 13.3 | % | |||||||||||||||||||||||
Our effective tax rate of 10.4% for 2020 is lower than our effective tax rate of 13.3% for 2019, primarily due to the beneficial impact of the final Treasury Regulations with respect to the Global Intangible Low-Taxed Income (“GILTI”), Foreign Derived Intangible Income “(FDII”) and Foreign Tax Credits that were issued during the third quarter of 2020, producing a non-recurring benefit to our effective tax rate in 2020.
- 38 -
MANAGEMENT’S DISCUSSION AND ANALYSIS
The Company’s effective tax rate for 2020 differs from the U.S. federal statutory tax rate of 21% due principally to the estimated impact of Federal Tax Credits (including R&D credits and Foreign tax credits), stock based compensation windfalls, and the impact of the Company’s earnings realized in foreign jurisdictions with statutory rates that are different than the U.S. federal statutory rate. These benefits are partially offset by the impact of U.S taxes on foreign earnings, including the GILTI provision which requires the Company to include foreign subsidiary earnings in excess of a deemed return on a foreign subsidiary’s tangible assets in its U.S. income tax return. The U.S. tax on foreign earnings is reflected net of a statutory deduction of 50% of the GILTI inclusion (subject to limitations based on U.S. taxable income, if any) and net of FDII that provides a 37.5% deduction to domestic companies for certain foreign sales and services income. The primary foreign jurisdictions in which we operate and the statutory tax rate for each respective jurisdiction include Switzerland (22%), Mexico (30%), Uruguay (25%), and Ireland (12.5%). We currently have a tax holiday in Malaysia through April 2023 provided certain conditions continue to be met.
There is a potential for volatility of our effective tax rate due to several factors, including changes in the mix of pre-tax income and the jurisdictions to which it relates, business acquisitions, settlements with taxing authorities, changes in tax rates, and foreign currency exchange rate fluctuations. In addition, we continue to explore tax planning opportunities that may have a material impact on our effective tax rate.
We believe it is reasonably possible that a reduction of approximately $3.4 million of the balance of unrecognized tax benefits may occur within the next twelve months as a result of the lapse of the statute of limitations and/or audit settlements. As of December 31, 2020, approximately $5.5 million of unrecognized tax benefits would favorably impact the effective tax rate (net of federal impact on state issues), if recognized.
Liquidity and Capital Resources
| (dollars in thousands) | December 31, 2020 | December 31, 2019 | |||||||||
| Cash and cash equivalents | $ | 49,206 | $ | 13,535 | |||||||
| Working capital from continuing operations | $ | 256,746 | $ | 236,317 | |||||||
| Current ratio from continuing operations | 2.64 | 2.32 | |||||||||
Cash and cash equivalents at December 31, 2020 increased by $35.7 million from December 31, 2019 primarily as a result of cash generated from operating activities, inclusive of proceeds from the sale of accounts receivable under a supplier financing program, partially offset by purchases of property, plant and equipment and a net reduction of borrowings outstanding on our Senior Secured Credit Facility. The increase in cash and cash equivalents is consistent with our actions to increase liquidity given the uncertainty surrounding the COVID-19 pandemic.
During 2020, we began utilizing supplier financing arrangements with financial institutions to sell certain accounts receivable on a non-recourse basis. These transactions are treated as a sale of, and are accounted for as a reduction to, accounts receivable. The agreement transfers control and risk related to the receivables to the respective financial institution. We have no continuing involvement in the transferred receivables subsequent to the sale.
Working capital increased by $20.4 million from December 31, 2019, primarily due to an increase in cash and cash equivalents supplemented by a decrease in current liabilities primarily from lower purchasing levels in 2020, partially offset by a decrease in accounts receivable from lower sales volume.
At December 31, 2020, $12.9 million of our cash and cash equivalents were held by foreign subsidiaries. We intend to limit our distributions from foreign subsidiaries to previously taxed income or current period earnings. If distributions are made utilizing current period earnings, we will record foreign withholding taxes in the period of the distribution.
Summary of Cash Flow
The following cash flow summary information includes cash flows related to discontinued operations (in thousands):
| 2020 | 2019 | ||||||||||
| Cash provided by (used in): | |||||||||||
| Operating activities | $ | 181,341 | $ | 165,358 | |||||||
| Investing activities | (56,576) | (58,862) | |||||||||
| Financing activities | (88,578) | (117,926) | |||||||||
| Effect of foreign currency exchange rates on cash and cash equivalents | (516) | (604) | |||||||||
| Net change in cash and cash equivalents | $ | 35,671 | $ | (12,034) | |||||||
- 39 -
MANAGEMENT’S DISCUSSION AND ANALYSIS
Operating Activities - During 2020, we generated $181.3 million in cash from operations compared to $165.4 million in 2019. The increase of $15.9 million was due to an an increase of $56.2 million in cash flow provided by working capital, offset by a decrease of $40.3 million in cash net income (net income plus adjustments to reconcile net income to net cash provided by operating activities). The increase in cash from working capital is the result of changes in certain assets and liabilities affecting cash flows, primarily an increase in cash flows from accounts receivable of $45.1 million, which decreased in the current year from lower sales and supplier financing, and inventory of $14.7 million, partially offset by a decrease in cash flows from accounts payable of $10.9 million. The decrease in cash net income is primarily from lower gross profit from sales and gross margin declines partially offset by lower SG&A expenses, interest expense, and income tax expense.
Investing Activities – The $2.3 million decrease in net cash used in investing activities was primarily attributable to a decrease in net cash paid for business acquisitions of $9.8 million and decreased purchases of property, plant, and equipment of $1.4 million, partially offset by an increase from the purchase of an intangible asset of $4.6 million in 2020 and lower net cash proceeds from the sale of the AS&O Product Line of $4.7 million in 2019.
Financing Activities – Net cash used in financing activities during 2020 was $88.6 million compared to $117.9 million in 2019. Financing activities during 2020 included net payments of $87.5 million related to paying down our debt obligations compared to $116.5 million in 2019. The payments made during 2020 include the utilization of proceeds received in conjunction with the patent litigation judgment during the fourth quarter of 2020.
Capital Structure - As of December 31, 2020, our capital structure consists of $731.3 million of debt, net of deferred debt issuance costs and unamortized discounts, outstanding under our Senior Secured Credit Facilities and 33 million shares of common stock outstanding. We continue to have access to $193.2 million of borrowing capacity under our Revolving Credit Facility, available for normal course of business and letters of credit. We are also authorized to issue up to 100 million shares of common stock and 100 million shares of preferred stock. As of December 31, 2020, our contractual debt service obligations for 2021, consisting of principal and interest on our outstanding debt, are estimated to be approximately $60 million. Actual principal and interest payments may be higher if, for instance, the applicable interest rates on our Senior Secured Credit Facilities increase, we borrow additional amounts on our Revolving Credit Facility, or we pay principal amounts in excess of the required minimums reflected in the contractual debt service obligations above.
Based on current expectations, we believe that our projected cash flows provided by operations, available cash and cash equivalents and borrowings under our Revolving Credit Facility are sufficient to meet our working capital, debt service and capital expenditure requirements for the next twelve months. If our future financing needs increase, we may need to arrange additional debt or equity financing. We continually evaluate and consider various financing alternatives to enhance or supplement our existing financial resources, including our Senior Secured Credit Facilities. However, we cannot be assured that we will be able to enter into any such arrangements on acceptable terms or at all. In addition, the recent COVID-19 pandemic, which has caused disruption in the capital markets, could make any such financing more difficult and/or expensive.
Credit Facilities - As of December 31, 2020, we had senior secured credit facilities (the “Senior Secured Credit Facilities”) that consist of (i) a $200 million revolving credit facility (the “Revolving Credit Facility”), which had available borrowing capacity of $193.2 million as of December 31, 2020, (ii) a term loan A facility (the “TLA Facility”) with outstanding principal balance of $230 million, and (iii) a term loan B facility (the “TLB Facility”) with outstanding principal balance of $508 million. The Senior Secured Credit Facilities will mature on October 27, 2022. The Senior Secured Credit Facilities include a mandatory prepayment provision customary for credit facilities of its nature.
The Revolving Credit Facility and TLA Facility contain covenants requiring (A) a maximum total net leverage ratio of 4.75:1.00 subject to a step down to 4.50 to 1.00 for the third fiscal quarter of 2021, and reverting to and remaining at 4.00 to 1.00 beginning with the fourth quarter of 2021 through maturity, and (B) a minimum interest coverage ratio of adjusted EBITDA (as defined in the Senior Secured Credit Facilities) to interest expense of 3.0:1.0. Additionally, the total net leverage ratio can be increased by 0.50 for up to four consecutive quarters commencing in any fiscal quarter in which we consummate an Eligible Adjustment Acquisition (as defined in the Amendment) with a $40 million or greater purchase price. As of December 31, 2020, the Company was in compliance with these financial covenants. The TLB Facility does not contain any financial maintenance covenants. As of December 31, 2020, our total net leverage ratio, calculated in accordance with our Senior Secured Credit Facilities agreement, was approximately 3.2 to 1.0. For the twelve month period ended December 31, 2020, our ratio of adjusted EBITDA to interest expense, calculated in accordance with our Senior Secured Credit Facilities agreement, was approximately 6.5 to 1.0.
- 40 -
MANAGEMENT’S DISCUSSION AND ANALYSIS
Failure to comply with these financial covenants would result in an event of default as defined under the Revolving Credit Facility and TLA Facility unless waived by the lenders. An event of default may result in the acceleration of our indebtedness. As a result, management believes that compliance with these covenants is material to us. As of December 31, 2020, our adjusted EBITDA would have to decline by approximately $70 million, or approximately 32%, for us to not be in compliance with our financial covenants. The Revolving Credit Facility is supported by a consortium of twelve lenders with no lender controlling more than 27% of the facility.
Refer to Note 8 “Debt” of the Notes to Consolidated Financial Statements contained in Item 8 of this report for further description of our outstanding debt.
Off-Balance Sheet Arrangements
We have no off-balance sheet arrangements within the meaning of Item 303(a)(4) of Regulation S-K.
Contractual Obligations
Presented below is a summary of contractual obligations and other minimum commitments as of December 31, 2020. Refer to Note 13 “Commitments and Contingencies” of the Notes to Consolidated Financial Statements contained in Item 8 of this report for additional information regarding self-insurance liabilities, which are not reflected in the table below.
| Payments due by period | |||||||||||||||||||||||||||||
| Total | Less than 1 year | 1-3 years | 3-5 years | More than 5 years | |||||||||||||||||||||||||
| Principal amount of debt outstanding | $ | 737,973 | $ | 37,500 | $ | 700,473 | $ | — | $ | — | |||||||||||||||||||
Interest on debt(a) | 41,205 | 22,965 | 18,240 | — | — | ||||||||||||||||||||||||
Operating lease obligations(b) | 55,782 | 10,627 | 16,365 | 12,979 | 15,811 | ||||||||||||||||||||||||
Other(c) | 107,217 | 93,275 | 13,023 | 919 | — | ||||||||||||||||||||||||
| Total | $ | 942,177 | $ | 164,367 | $ | 748,101 | $ | 13,898 | $ | 15,811 | |||||||||||||||||||
(a)Interest payments in the table above reflect the contractual interest payments on our outstanding debt based upon the balance outstanding and applicable interest rates at December 31, 2020, and exclude the impact of the debt issuance cost and discount amortization and the impact of interest rate swap agreements. Refer to Note 8 “Debt” of the Notes to Consolidated Financial Statements contained in Item 8 of this report for additional information regarding long-term debt.
(b)Refer to Note 14 “Leases” of the Notes to Consolidated Financial Statements contained in Item 8 of this report for additional information about our operating lease obligations.
(c)Amounts include inventory purchase commitments, which are legally binding and specify minimum purchase quantities. These commitments do not include open purchase orders.
This table does not reflect $5.5 million of unrecognized tax benefits, as we are uncertain if or when such amounts may be settled. Refer to Note 12 “Income Taxes” of the Notes to Consolidated Financial Statements in Item 8 of this report for additional information about these unrecognized tax benefits.
Impact of Recently Issued Accounting Standards
In the normal course of business, we evaluate all new accounting pronouncements issued by the Financial Accounting Standards Board (“FASB”), SEC, or other authoritative accounting bodies to determine the potential impact they may have on our Consolidated Financial Statements. Refer to Note 1 “Summary of Significant Accounting Policies” of the Notes to Consolidated Financial Statements contained in Item 8 of this report for additional information about these recently issued accounting standards and their potential impact on our financial condition or results of operations.
CRITICAL ACCOUNTING ESTIMATES
Management’s discussion and analysis of financial condition and results of operations are based upon our consolidated financial statements which have been prepared in accordance with GAAP. We make estimates and assumptions in the preparation of our consolidated financial statements that affect the reported amounts of assets and liabilities, revenue and expenses and related disclosures of contingent assets and liabilities. We base our estimates and judgments upon historical experience and other factors that are believed to be reasonable under the circumstances. Changes in estimates or assumptions could result in a material adjustment to the consolidated financial statements.
- 41 -
MANAGEMENT’S DISCUSSION AND ANALYSIS
We have identified several critical accounting estimates. An accounting estimate is considered critical if both: (a) the nature of the estimates or assumptions is material due to the levels of subjectivity and judgment involved, and (b) the impact of changes in the estimates and assumptions would have a material effect on the consolidated financial statements. This listing is not a comprehensive list of all of our accounting policies. For further information regarding the application of these and other accounting policies, see Note 1 “Summary of Significant Accounting Policies” of the Notes to Consolidated Financial Statements contained in Item 8 of this report.
Inventories
Inventories are measured on a first-in, first-out basis at the lower of cost or net realizable value. Net realizable value is the estimated selling prices in the ordinary course of business, less reasonably predictable costs of completion, disposal, and transportation. The valuation of inventory requires us to estimate obsolete or excess inventory, as well as inventory that is not of saleable quality.
Historically, our inventory adjustment has been adequate to cover our losses. However, variations in methods or assumptions could have a material impact on our results. If our demand forecast for specific products is greater than actual demand and we fail to reduce manufacturing output accordingly, we could be required to record additional inventory write-down or expense a greater amount of overhead costs, which would negatively impact our net income.
Valuation of Goodwill and Intangible Assets
We make assumptions in establishing the carrying value, fair value and, if applicable, the estimated lives of our goodwill, intangible and other long-lived assets. Goodwill and intangible assets determined to have an indefinite useful life are not amortized. Instead, these assets are evaluated for impairment on an annual basis on the last day of our fiscal year and whenever events or business conditions change that could indicate that the asset is impaired. Long-lived assets are reviewed for impairment whenever events or changes in circumstances indicate that the carrying amount of an asset (asset group) may not be recoverable.
Evaluation of goodwill for impairment
We test each reporting unit’s goodwill for impairment on the last day of our fiscal year and between annual tests if an event occurs or circumstances change that would more-likely-than-not reduce the fair value of a reporting unit below its carrying value. In conducting this annual impairment testing, we may first perform a qualitative assessment of whether it is more-likely-than-not that a reporting unit’s fair value is less than its carrying value. If not, no further goodwill impairment testing is required. If it is more-likely-than-not that a reporting unit’s fair value is less than its carrying value, or if we elect not to perform a qualitative assessment of a reporting unit, a quantitative analysis is performed, in which the fair value of the reporting unit is compared to its carrying value. If the carrying value of a reporting unit exceeds its fair value, an impairment loss is recognized equal to the excess, limited to the amount of goodwill allocated to that reporting unit.
In the first quarter of 2020, a trigger event was identified as a result of the collapse in the demand for oil caused by this unprecedented global health and economic crisis, coupled with oil oversupply, and adversely impacted the demand for products in the Company’s Non-Medical reportable segment. The Company performed a quantitative analysis to test goodwill for impairment as of April 3, 2020. The fair value of the Non-Medical reporting unit exceeded its carrying amount as of April 3, 2020.
We performed a qualitative assessment of our Medical reporting unit as of December 31, 2020. As part of this analysis, we evaluated factors including, but not limited to, our market capitalization and stock price performance, macro-economic conditions, market and industry conditions, cost factors, the competitive environment, and the operational stability and overall financial performance of the reporting unit. The assessment indicated that it was more likely than not that the fair value of the Medical reporting unit exceeded its carrying value.
We elected to bypass the qualitative assessment and performed a quantitative analysis for our Non-Medical reporting unit. Resulting from the quantitative analysis, the fair value exceeded the carrying value of the Non-Medical reporting unit by approximately 85%. We do not believe that any of our reporting units are at risk for impairment. However, changes to the factors considered above could affect the estimated fair value of one or more of our reporting units and could result in a goodwill impairment charge in a future period. We may be unaware of one or more significant factors that, if we had been aware of, would cause our conclusion to change, which could result in a goodwill impairment charge in a future period.
- 42 -
MANAGEMENT’S DISCUSSION AND ANALYSIS
Evaluation of indefinite-lived intangible assets for impairment
Our indefinite-lived intangible assets include the Greatbatch Medical and Lake Region Medical tradenames. Similar to goodwill, we perform an annual impairment review of our indefinite-lived intangible assets on the last day of our fiscal year, unless events occur that trigger the need for an interim impairment review. We have the option to first assess qualitative factors in determining whether it is more-likely-than-not that an indefinite-lived intangible asset is impaired. If we elect not to use this option, or we determine that it is more-likely-than-not that the asset is impaired, we perform a quantitative assessment that requires us to estimate the fair value of each indefinite-lived intangible asset and compare that amount to its carrying value. Fair value is estimated using the relief-from-royalty method. Significant assumptions inherent in this methodology include estimates of royalty rates and discount rates. The discount rate applied is based on the risk inherent in the respective intangible assets and royalty rates are based on the rates at which comparable tradenames are being licensed in the marketplace. Impairment, if any, is based on the excess of the carrying value over the fair value of these assets.
We performed a quantitative assessment to test our indefinite-lived intangible assets for impairment as of December 31, 2020. For the Greatbatch Medical tradename, the excess of the estimated fair value over carrying value (expressed as a percentage of carrying value) was in excess of its carrying value of $20 million by approximately 278% as of December 31, 2020. The Lake Region Medical tradename had an excess of the estimated fair value over carrying value of approximately 43% and a carrying value of $70 million at December 31, 2020. We do not believe that our indefinite-lived intangible assets are at risk for impairment. However, a significant increase in the discount rate, decrease in the terminal growth rate, increase in tax rates, decrease in the royalty rate or substantial reductions in our end-markets and volume assumptions could have a negative impact on the estimated fair values of either of our tradenames and require us to recognize impairments of these indefinite-lived intangible assets in a future period.
Evaluation of long-lived assets for impairment
When impairment indicators exist, we determine if the carrying value of the long-lived asset(s) or definite-lived intangible asset(s) exceeds the related undiscounted future cash flows. In cases where the carrying value exceeds the undiscounted future cash flows, the carrying value is written down to fair value. Fair value is generally determined using a discounted cash flow analysis. When it is determined that the useful life of an asset (asset group) is shorter than the originally estimated life, and there are sufficient cash flows to support the carrying value of the asset (asset group), we accelerate the rate of depreciation/amortization in order to fully depreciate/amortize the asset over its shorter useful life.
Estimation of the cash flows and useful lives of long-lived assets and definite-lived intangible assets requires significant management judgment. Events could occur that would materially affect our estimates and assumptions. Unforeseen changes, such as the loss of one or more significant customers, technology obsolescence, or significant manufacturing disruption, among other factors, could substantially alter the assumptions regarding the ability to realize the return of our investment in long-lived assets, definite-lived intangible assets or their estimated useful lives.
- 43 -
ITEM 7A. QUANTITATIVE AND QUALITATIVE DISCLOSURES ABOUT MARKET RISK
MARKET RISK
In the normal course of business, we are exposed to market risk primarily due to changes in foreign currency exchange rates and interest rates. Changes in these rates could result in fluctuations in our earnings and cash flows. We regularly assess these risks and have established policies and business practices to help protect against the adverse effects of these and other potential exposures. However, fluctuations in foreign currency exchange rates and interest rates could have a significant impact, positive or negative, on our financial results in the future.
Foreign Currency Exchange Rate Risk
We have foreign operations in Ireland, Israel, Malaysia, Mexico, Switzerland, and Uruguay which expose us to foreign currency exchange rate fluctuations due to transactions denominated in Euros, Israeli shekels, Malaysian ringgits, Mexican pesos, Swiss francs, and Uruguayan pesos, respectively. We continuously evaluate our foreign currency risk, and we use operational hedges, as well as forward currency exchange rate contracts, to manage the impact of currency exchange rate fluctuations on earnings and cash flows. We do not enter into currency exchange rate derivative instruments for speculative purposes. A hypothetical 10% change in the value of the U.S. dollar in relation to our most significant foreign currency exposures would have had an impact of approximately $5 million on our 2020 annual sales. This amount is not indicative of the hypothetical net earnings impact due to the partially offsetting impacts on cost of sales and operating expenses in those currencies. We estimate that foreign currency exchange rate fluctuations during 2020 increased sales in comparison to 2019 by $0.8 million.
We had currency derivative instruments outstanding in the notional amount of $43.5 million as of December 31, 2020 and $11.2 million as of December 31, 2019. As of December 31, 2020 and December 31, 2019, we recorded assets of $2.1 million and $0.7 million, respectively, to recognize the fair value of these derivative instruments on our Consolidated Balance Sheets. The amounts recorded during 2020 related to our forward contracts were increases in Sales, Cost of sales and Operating expenses of $0.6 million, $1.2 million and $0.1 million, respectively. Refer to Note 17 “Financial Instruments and Fair Value Measurements” to the Consolidated Financial Statements contained in Item 8 of this report for additional information regarding our outstanding forward contracts.
To the extent that our monetary assets and liabilities, including short-term and long-term intercompany loans, are recorded in a currency other than the functional currency of the subsidiary, these amounts are remeasured each period at the period-end exchange rate, with the resulting gain or loss being recorded in Other (income) loss, Net, in the Consolidated Statements of Operations. Net foreign currency transaction gains and losses included in Other (income) loss, Net, for 2020 and 2019 amounted to a loss of $1.6 million and $0.04 million, respectively.
We translate all assets and liabilities of our foreign operations where the U.S. dollar is not the functional currency at the period-end exchange rate and translate sales and expenses at the average exchange rates in effect during the period. The net effect of these translation adjustments is recorded in the Consolidated Financial Statements as Comprehensive Income (Loss). The translation adjustment for 2020 was a gain of $34.9 million and primarily related to the weakening U.S. dollar relative to the Euro. Translation adjustments are not adjusted for income taxes as they relate to permanent investments in our foreign subsidiaries. A hypothetical 10% change in the value of the U.S. dollar in relation to our most significant foreign currency net assets would have had an impact of approximately $40 million on our foreign net assets as of December 31, 2020.
Interest Rate Risk
We regularly monitor interest rate risk attributable to our outstanding debt obligations. From time to time, we enter into interest rate swap agreements in order to reduce the cash flow risk caused by interest rate changes on our outstanding floating rate borrowings.
As of December 31, 2020, we had $738 million in principal amount of debt outstanding. Interest rates on our Revolving Credit Facility, TLA Facility and TLB Facility, reset, at our option, based upon the prime rate or LIBOR rate, thus subjecting us to interest rate risk. Our TLB Facility has a 1.00% LIBOR floor, thus is only variable when LIBOR interest rates are above 1.00%. A hypothetical one percentage point (100 basis points) change in the LIBOR rate on the $538 million of unhedged variable rate debt outstanding at December 31, 2020 would increase our interest expense by approximately $1 million.
As of December 31, 2020, approximately 27% of our principal amount of debt outstanding was subject to variable rates, in comparison to approximately 20% as of December 31, 2019. We enter into interest rate swap agreements in order to reduce our exposure to fluctuations in the LIBOR rate.
- 44 -
Under these swap agreements, we pay a fixed rate of interest and receive a floating rate equal to one-month LIBOR. The variable rate received from the swap agreements and the variable rate paid on the outstanding debt will have the same rate of interest, excluding the credit spread, and will reset and pay interest on the same date. The amount recorded during 2020 related to these interest rate swaps was an increase of $3.4 million to Interest expense. We apply hedge accounting to the interest rate swap and account for it as a cash flow hedge. As of December 31, 2020, these swaps had an unfavorable fair value of $7.0 million.
Refer to Note 8 “Debt” and Note 17 “Financial Instruments and Fair Value Measurements” of the Notes to Consolidated Financial Statements in Item 8 of this report for additional information about our outstanding debt and interest rate swap agreements, respectively.
- 45 -
ITEM 8. FINANCIAL STATEMENTS AND SUPPLEMENTARY DATA
INTEGER HOLDINGS CORPORATION
Index to Consolidated Financial Statements
| Page | |||||
Management’s Report on Internal Control Over Financial Reporting..................................................................................... | |||||
Reports of Independent Registered Public Accounting Firm................................................................................................... | |||||
Consolidated Balance Sheets as of December 31, 2020 and December 31, 2019................................................................... | |||||
| Consolidated Statements of Operations for the years ended December 31, 2020, December 31 2019 and December 28, 2018.............................................................................................................................................................. | |||||
| Consolidated Statements of Comprehensive Income for the years ended December 31, 2020, December 31, 2019 and December 28, 2018........................................................................................................................................................ | |||||
| Consolidated Statements of Cash Flows for the years ended December 31, 2020, December 31, 2019 and December 28, 2018.............................................................................................................................................................. | |||||
| Consolidated Statements of Stockholders’ Equity for the years ended December 31, 2020, December 31, 2019 and December 28, 2018........................................................................................................................................................ | |||||
Notes to Consolidated Financial Statements............................................................................................................................ | |||||
- 46 -
MANAGEMENT’S REPORT ON INTERNAL CONTROL OVER FINANCIAL REPORTING
The Company’s certifying officers are responsible for establishing and maintaining adequate internal control over financial reporting. The Company’s internal control over financial reporting is designed and maintained under the supervision of its certifying officers to provide reasonable assurance regarding the reliability of financial reporting and the preparation of the Company’s consolidated financial statements for external reporting purposes in accordance with accounting principles generally accepted in the United States of America.
As of December 31, 2020, management conducted an assessment of the effectiveness of the Company’s internal control over financial reporting based on the framework established in Internal Control – Integrated Framework (2013) issued by the Committee of Sponsoring Organizations of the Treadway Commission. Based on this assessment, management has determined that the Company’s internal control over financial reporting as of December 31, 2020 is effective.
The effectiveness of internal control over financial reporting as of December 31, 2020 has been audited by Deloitte & Touche LLP, the Company’s independent registered public accounting firm.
Dated: February 18, 2021
| /s/ Joseph W. Dziedzic | /s/ Jason K. Garland | |||||||
| Joseph W. Dziedzic | Jason K. Garland | |||||||
| President & Chief Executive Officer | Executive Vice President & Chief Financial Officer | |||||||
- 47 -
REPORT OF INDEPENDENT REGISTERED PUBLIC ACCOUNTING FIRM
To the stockholders and the Board of Directors of Integer Holdings Corporation
Opinion on Internal Control over Financial Reporting
We have audited the internal control over financial reporting of Integer Holdings Corporation and subsidiaries (the “Company”) as of December 31, 2020, based on criteria established in Internal Control — Integrated Framework (2013) issued by the Committee of Sponsoring Organizations of the Treadway Commission (COSO). In our opinion, the Company maintained, in all material respects, effective internal control over financial reporting as of December 31, 2020, based on criteria established in Internal Control — Integrated Framework (2013) issued by COSO.
We have also audited, in accordance with the standards of the Public Company Accounting Oversight Board (United States) (PCAOB), the consolidated financial statements and financial statement schedule as of and for the year ended December 31, 2020 of the Company and our report dated February 18, 2021 expressed an unqualified opinion on those consolidated financial statements and financial statement schedule.
Basis for Opinion
The Company’s management is responsible for maintaining effective internal control over financial reporting and for its assessment of the effectiveness of internal control over financial reporting, included in the accompanying Management’s Report on Internal Control Over Financial Reporting. Our responsibility is to express an opinion on the Company’s internal control over financial reporting based on our audit. We are a public accounting firm registered with the PCAOB and are required to be independent with respect to the Company in accordance with the U.S. federal securities laws and the applicable rules and regulations of the Securities and Exchange Commission and the PCAOB.
We conducted our audit in accordance with the standards of the PCAOB. Those standards require that we plan and perform the audit to obtain reasonable assurance about whether effective internal control over financial reporting was maintained in all material respects. Our audit included obtaining an understanding of internal control over financial reporting, assessing the risk that a material weakness exists, testing and evaluating the design and operating effectiveness of internal control based on the assessed risk, and performing such other procedures as we considered necessary in the circumstances. We believe that our audit provides a reasonable basis for our opinion.
Definition and Limitations of Internal Control over Financial Reporting
A company’s internal control over financial reporting is a process designed to provide reasonable assurance regarding the reliability of financial reporting and the preparation of financial statements for external purposes in accordance with generally accepted accounting principles. A company’s internal control over financial reporting includes those policies and procedures that (1) pertain to the maintenance of records that, in reasonable detail, accurately and fairly reflect the transactions and dispositions of the assets of the company; (2) provide reasonable assurance that transactions are recorded as necessary to permit preparation of financial statements in accordance with generally accepted accounting principles, and that receipts and expenditures of the company are being made only in accordance with authorizations of management and directors of the company; and (3) provide reasonable assurance regarding prevention or timely detection of unauthorized acquisition, use, or disposition of the company’s assets that could have a material effect on the financial statements.
Because of its inherent limitations, internal control over financial reporting may not prevent or detect misstatements. Also, projections of any evaluation of effectiveness to future periods are subject to the risk that controls may become inadequate because of changes in conditions, or that the degree of compliance with the policies or procedures may deteriorate.
/s/ Deloitte & Touche LLP
Williamsville, New York
February 18, 2021
- 48 -
REPORT OF INDEPENDENT REGISTERED PUBLIC ACCOUNTING FIRM
To the stockholders and the Board of Directors of Integer Holdings Corporation
Opinion on the Financial Statements
We have audited the accompanying consolidated balance sheets of Integer Holdings Corporation and subsidiaries (the “Company”) as of December 31, 2020 and December 31, 2019, the related consolidated statements of operations, comprehensive income, cash flows, and stockholders’ equity for the years ended December 31, 2020, December 31, 2019, and December 28, 2018, and the related notes and the schedule listed in the Index at Item 15 (collectively referred to as the “financial statements”). In our opinion, the financial statements present fairly, in all material respects, the financial position of the Company as of December 31, 2020 and December 31, 2019, and the results of its operations and its cash flows for the years ended December 31, 2020, December 31, 2019, and December 28, 2018, in conformity with accounting principles generally accepted in the United States of America.
We have also audited, in accordance with the standards of the Public Company Accounting Oversight Board (United States) (PCAOB), the Company’s internal control over financial reporting as of December 31, 2020, based on criteria established in Internal Control — Integrated Framework (2013) issued by the Committee of Sponsoring Organizations of the Treadway Commission and our report dated February 18, 2021 expressed an unqualified opinion on the Company’s internal control over financial reporting.
Change in Accounting Principle
As discussed in Note 1 to the financial statements, the Company changed its method of accounting for leases in fiscal year 2019 due to the adoption of Accounting Standards Update No. 2016-02, Leases (Topic 842), as amended, using the option to not restate comparative periods and apply the standard as of the date of initial application.
Basis for Opinion
These financial statements are the responsibility of the Company’s management. Our responsibility is to express an opinion on the Company’s financial statements based on our audits. We are a public accounting firm registered with the PCAOB and are required to be independent with respect to the Company in accordance with the U.S. federal securities laws and the applicable rules and regulations of the Securities and Exchange Commission and the PCAOB.
We conducted our audits in accordance with the standards of the PCAOB. Those standards require that we plan and perform the audit to obtain reasonable assurance about whether the financial statements are free of material misstatement, whether due to error or fraud. Our audits included performing procedures to assess the risks of material misstatement of the financial statements, whether due to error or fraud, and performing procedures that respond to those risks. Such procedures included examining, on a test basis, evidence regarding the amounts and disclosures in the financial statements. Our audits also included evaluating the accounting principles used and significant estimates made by management, as well as evaluating the overall presentation of the financial statements. We believe that our audits provide a reasonable basis for our opinion.
Critical Audit Matters
The critical audit matters communicated below are matters arising from the current-period audit of the financial statements that were communicated or required to be communicated to the audit committee and that (1) relate to accounts or disclosures that are material to the financial statements and (2) involved our especially challenging, subjective, or complex judgments. The communication of critical audit matters does not alter in any way our opinion on the financial statements, taken as a whole, and we are not, by communicating the critical audit matters below, providing separate opinions on the critical audit matters or on the accounts or disclosures to which they relate.
Inventories - Refer to Notes 1 and 4 to the financial statements
Critical Audit Matter Description
Inventories are stated at the lower of cost, determined using the first-in first-out method, or net realizable value. The valuation of inventory requires the Company to estimate obsolete or excess inventory, as well as inventory that is not of saleable quality. Variations in assumptions used could have a material impact to the amount of write-downs for excess, obsolete or expired inventory. A significant change in the timing or level of demand for specific products may result in recording material adjustments for excess, obsolete or expired inventory in the future.
Given the amount of judgment required by management in estimating the timing or level of demand forecast for a specific product, performing audit procedures to evaluate the reasonableness of the estimated excess or obsolete inventory, or inventory that is not of saleable quality required a high degree of auditor judgment and an increased extent of effort.
- 49 -
How the Critical Audit Matter Was Addressed in the Audit
Our audit procedures related to the valuation of excess or obsolete inventory or inventory that is not of saleable quality, included the following, among others:
•We tested the effectiveness of controls over management’s review of the periodic calculation of the valuation for excess or obsolete inventory or inventory that is not of saleable quality.
•We tested management’s process for determining the valuation of inventory, including:
◦We tested the accuracy and completeness of the source information underlying the determination of the valuation for excess or obsolete inventory, or inventory that is not of saleable quality.
◦We tested the demand forecast by obtaining documentation to support customer orders, contracts with customers, as well as historical and future sales that corroborate the amount stated for the demand forecast.
◦We evaluated whether the methodology and assumptions applied by management are reasonable and consistent with the nature of the inventory.
◦We performed a retrospective review of the prior-year estimates for excess or obsolete inventory, or inventory that is not of saleable quality, to determine whether management’s judgments and assumptions relating to those estimates indicate a possible bias.
Other Intangible Assets, Net - Lake Region Medical Tradename - Refer to Notes 1 and 6 to the financial statements
Critical Audit Matter Description
The carrying value of the Lake Region Medical tradename intangible asset was $70 million as of December 31, 2020. The Company assesses its indefinite-lived intangible assets for impairment at least annually by comparing the fair value of the indefinite-lived asset to the carrying value. The fair value of the tradename is estimated using the relief-from-royalty method. The determination of the fair value requires management to make estimates and use assumptions, including those assumptions related to royalty rates for similar transactions and the discount rate to estimate the present value of cash flows that would be derived from the royalties. Changes in these assumptions could have a significant impact on the fair value of the Lake Region Medical tradename asset and a significant change in fair value could cause a material impairment of the asset.
Given the determination of fair value of the Lake Region Medical tradename asset requires management to make significant estimates and assumptions relating to the selection of royalty and discount rates, performing audit procedures to evaluate the reasonableness of such estimates and assumptions required a high degree of auditor judgment and an increased extent of effort, including the need to involve our fair value specialists.
How the Critical Audit Matter Was Addressed in the Audit
Our audit procedures related to the assumptions used for the selection of the royalty rate and discount rate, included the following, among others:
•We tested the effectiveness of controls over management’s intangible asset impairment evaluation, including those over the determination of the fair value of the Lake Region Medical tradename asset, such as controls related to management’s selection of the royalty and discount rates.
•We performed sensitivity analysis of significant assumptions to evaluate changes in the fair value of the Lake Region Medical tradename asset that would result from changes in the underlying assumptions.
•With the assistance of our fair value specialists, we evaluated the reasonableness of the royalty rate and discount rate by:
◦Testing the source information underlying the determination of the royalty and discount rates and the mathematical accuracy of the calculation.
◦Developing a range of independent estimates and comparing those to both market and industry data as well as to the royalty and discount rates selected by management.
/s/ Deloitte & Touche LLP
Williamsville, New York
February 18, 2021
We have served as the Company’s auditor since 1985.
- 50 -
INTEGER HOLDINGS CORPORATION
CONSOLIDATED BALANCE SHEETS
| (in thousands except share and per share data) | December 31, 2020 | December 31, 2019 | |||||||||
| ASSETS | |||||||||||
| Current assets: | |||||||||||
| Cash and cash equivalents | $ | $ | |||||||||
Accounts receivable, net of provision for credit losses of $ | |||||||||||
| Inventories | |||||||||||
| Refundable income taxes | |||||||||||
| Contract assets | |||||||||||
| Prepaid expenses and other current assets | |||||||||||
| Total current assets | |||||||||||
| Property, plant and equipment, net | |||||||||||
| Goodwill | |||||||||||
| Other intangible assets, net | |||||||||||
| Deferred income taxes | |||||||||||
| Operating lease assets | |||||||||||
| Other assets | |||||||||||
| Total assets | $ | $ | |||||||||
| LIABILITIES AND STOCKHOLDERS’ EQUITY | |||||||||||
| Current liabilities: | |||||||||||
| Current portion of long-term debt | $ | $ | |||||||||
| Accounts payable | |||||||||||
| Income taxes payable | |||||||||||
| Operating lease liabilities | |||||||||||
| Accrued expenses and other current liabilities | |||||||||||
| Total current liabilities | |||||||||||
| Long-term debt | |||||||||||
| Deferred income taxes | |||||||||||
| Operating lease liabilities | |||||||||||
| Other long-term liabilities | |||||||||||
| Total liabilities | |||||||||||
| Commitments and contingencies (Note 13) | |||||||||||
| Stockholders’ equity: | |||||||||||
Preferred stock, $ | |||||||||||
Common stock, $ | |||||||||||
| Additional paid-in capital | |||||||||||
Treasury stock, at cost, | ( | ||||||||||
| Retained earnings | |||||||||||
| Accumulated other comprehensive income | |||||||||||
| Total stockholders’ equity | |||||||||||
| Total liabilities and stockholders’ equity | $ | $ | |||||||||
The accompanying notes are an integral part of these consolidated financial statements.
- 51 -
INTEGER HOLDINGS CORPORATION
CONSOLIDATED STATEMENTS OF OPERATIONS
| Fiscal Year Ended | |||||||||||||||||
| (in thousands except per share data) | December 31, 2020 | December 31, 2019 | December 28, 2018 | ||||||||||||||
| Sales | $ | $ | $ | ||||||||||||||
| Cost of sales | |||||||||||||||||
| Gross profit | |||||||||||||||||
| Operating expenses: | |||||||||||||||||
| Selling, general and administrative | |||||||||||||||||
| Research, development and engineering | |||||||||||||||||
| Other operating expenses | |||||||||||||||||
| Total operating expenses | |||||||||||||||||
| Operating income | |||||||||||||||||
| Interest expense | |||||||||||||||||
| (Gain) loss on equity investments, net | ( | ( | |||||||||||||||
| Other (income) loss, net | ( | ||||||||||||||||
| Income from continuing operations before taxes | |||||||||||||||||
| Provision for income taxes | |||||||||||||||||
| Income from continuing operations | $ | $ | $ | ||||||||||||||
| Discontinued operations: | |||||||||||||||||
| Income from discontinued operations before taxes | |||||||||||||||||
| Provision for income taxes | |||||||||||||||||
| Income from discontinued operations | $ | $ | $ | ||||||||||||||
| Net income | $ | $ | $ | ||||||||||||||
| Basic earnings per share: | |||||||||||||||||
| Income from continuing operations | $ | $ | $ | ||||||||||||||
| Income from discontinued operations | |||||||||||||||||
| Basic earnings per share | |||||||||||||||||
| Diluted earnings per share: | |||||||||||||||||
| Income from continuing operations | $ | $ | $ | ||||||||||||||
| Income from discontinued operations | |||||||||||||||||
| Diluted earnings per share | |||||||||||||||||
| Weighted average shares outstanding: | |||||||||||||||||
| Basic | |||||||||||||||||
| Diluted | |||||||||||||||||
The accompanying notes are an integral part of these consolidated financial statements.
- 52 -
INTEGER HOLDINGS CORPORATION
CONSOLIDATED STATEMENTS OF COMPREHENSIVE INCOME
| Fiscal Year Ended | |||||||||||||||||
| (in thousands) | December 31, 2020 | December 31, 2019 | December 28, 2018 | ||||||||||||||
| Comprehensive Income | |||||||||||||||||
| Net income | $ | $ | $ | ||||||||||||||
| Other comprehensive income (loss): | |||||||||||||||||
| Foreign currency translation gain (loss) | ( | ( | |||||||||||||||
| Net change in cash flow hedges, net of tax | ( | ( | |||||||||||||||
| Defined benefit plan liability adjustment, net of tax | ( | ( | |||||||||||||||
| Other comprehensive income (loss), net | ( | ( | |||||||||||||||
| Comprehensive income | $ | $ | $ | ||||||||||||||
The accompanying notes are an integral part of these consolidated financial statements.
- 53 -
INTEGER HOLDINGS CORPORATION
CONSOLIDATED STATEMENTS OF CASH FLOWS
| Fiscal Year Ended | |||||||||||||||||
| (in thousands) | December 31, 2020 | December 31, 2019 | December 28, 2018 | ||||||||||||||
| Cash flows from operating activities: | |||||||||||||||||
| Net income | $ | $ | $ | ||||||||||||||
| Adjustments to reconcile net income to net cash provided by operating activities: | |||||||||||||||||
| Depreciation and amortization | |||||||||||||||||
| Debt related charges included in interest expense | |||||||||||||||||
| Stock-based compensation | |||||||||||||||||
| Non-cash charges related to customer bankruptcy | |||||||||||||||||
| Non-cash lease expense | |||||||||||||||||
| Non-cash (gain) loss on equity investments | ( | ( | |||||||||||||||
| Contingent consideration fair value adjustment | ( | ||||||||||||||||
| Other non-cash (gains) losses | ( | ||||||||||||||||
| Deferred income taxes | ( | ( | |||||||||||||||
| Gain on sale of discontinued operations | ( | ( | |||||||||||||||
| Changes in operating assets and liabilities, net of acquisitions: | |||||||||||||||||
| Accounts receivable | ( | ||||||||||||||||
| Inventories | ( | ||||||||||||||||
| Prepaid expenses and other assets | ( | ( | |||||||||||||||
| Contract assets | ( | ( | |||||||||||||||
| Accounts payable | ( | ( | |||||||||||||||
| Accrued expenses and other liabilities | ( | ( | ( | ||||||||||||||
| Income taxes | ( | ( | |||||||||||||||
| Net cash provided by operating activities | |||||||||||||||||
| Cash flows from investing activities: | |||||||||||||||||
| Acquisition of property, plant and equipment | ( | ( | ( | ||||||||||||||
| Purchase of intangible asset | ( | ||||||||||||||||
| Proceeds from sale of property, plant and equipment | |||||||||||||||||
| Purchase of equity investments | ( | ( | |||||||||||||||
| Proceeds from sale of discontinued operations | |||||||||||||||||
| Acquisitions, net | ( | ( | |||||||||||||||
| Net cash (used in) provided by investing activities | ( | ( | |||||||||||||||
| Cash flows from financing activities: | |||||||||||||||||
| Principal payments of long-term debt | ( | ( | ( | ||||||||||||||
| Proceeds from senior secured revolving line of credit | |||||||||||||||||
| Payments of senior secured revolving line of credit | ( | ( | ( | ||||||||||||||
| Proceeds from the exercise of stock options | |||||||||||||||||
| Payment of debt issuance costs | ( | ( | ( | ||||||||||||||
| Tax withholdings related to net share settlements of restricted stock awards | ( | ( | ( | ||||||||||||||
| Principal payments on finance leases | ( | ||||||||||||||||
| Net cash used in financing activities | ( | ( | ( | ||||||||||||||
| Effect of foreign currency exchange rates on cash and cash equivalents | ( | ( | |||||||||||||||
| Net increase (decrease) in cash and cash equivalents | ( | ( | |||||||||||||||
| Cash and cash equivalents, beginning of year | |||||||||||||||||
| Cash and cash equivalents, end of year | $ | $ | $ | ||||||||||||||
The accompanying notes are an integral part of these consolidated financial statements.
- 54 -
INTEGER HOLDINGS CORPORATION
CONSOLIDATED STATEMENTS OF STOCKHOLDERS’ EQUITY
| Fiscal Year Ended | |||||||||||||||||
| (in thousands) | December 31, 2020 | December 31, 2019 | December 28, 2018 | ||||||||||||||
| Total stockholders’ equity, beginning balance | $ | $ | $ | ||||||||||||||
| Common stock and additional paid-in capital | |||||||||||||||||
| Balance, beginning of period | |||||||||||||||||
| Stock awards exercised or vested | ( | ||||||||||||||||
| Stock-based compensation | |||||||||||||||||
| Balance, end of period | |||||||||||||||||
| Treasury stock | |||||||||||||||||
| Balance, beginning of period | ( | ( | ( | ||||||||||||||
| Treasury shares purchased | ( | ( | |||||||||||||||
| Treasury shares reissued | |||||||||||||||||
| Balance, end of period | ( | ( | |||||||||||||||
| Retained earnings | |||||||||||||||||
| Balance, beginning of period | |||||||||||||||||
| Reclassification of certain tax effects related to the adoption of ASU 2018-02 | — | — | |||||||||||||||
| — | ( | — | |||||||||||||||
| Net income | |||||||||||||||||
| Balance, end of period | |||||||||||||||||
| Accumulated other comprehensive income | |||||||||||||||||
| Balance, beginning of period | |||||||||||||||||
Other comprehensive income (loss) | ( | ( | |||||||||||||||
| — | — | ( | |||||||||||||||
| Reclassified to earnings due to divestiture, net | |||||||||||||||||
| Balance, end of period | |||||||||||||||||
| Total stockholders’ equity, ending balance | $ | $ | $ | ||||||||||||||
The accompanying notes are an integral part of these consolidated financial statements.
- 55 -
INTEGER HOLDINGS CORPORATION
NOTES TO CONSOLIDATED FINANCIAL STATEMENTS
(1.) SUMMARY OF SIGNIFICANT ACCOUNTING POLICIES
Integer Holdings Corporation (together with its consolidated subsidiaries, “Integer” or the “Company”) is a publicly traded corporation listed on the New York Stock Exchange under the symbol “ITGR.” Integer is one of the largest medical device outsource manufacturers in the world serving the cardiac, neuromodulation, orthopedics, vascular, advanced surgical and portable medical markets. The Company provides innovative, high-quality medical technologies that enhance the lives of patients worldwide. In addition to medical technologies, the Company develops batteries for high-end niche applications in the energy, military, and environmental markets. The Company’s customers include large multi-national original equipment manufacturers (“OEMs”) and their affiliated subsidiaries.
On May 3, 2018, the Company entered into a definitive agreement to sell the Advanced Surgical and Orthopedic product lines (the “AS&O Product Line”) within its Medical segment to Viant (formerly MedPlast, LLC), and on July 2, 2018 completed the sale. Refer to Note 2 “Business Acquisitions, Divestiture and Discontinued Operations” for further details of these transactions.
Basis of Presentation and Principles of Consolidation
The consolidated financial statements have been prepared in conformity with accounting principles generally accepted in the United States of America (“GAAP”) and include the accounts of Integer Holdings Corporation and its wholly owned subsidiaries. All intercompany balances and transactions have been eliminated in consolidation.
The results of operations of the AS&O Product Line are reported as discontinued operations in the Consolidated Statements of Operations for all periods presented. The Consolidated Statements of Cash Flows includes cash flows related to the discontinued operations due to Integer’s (parent) centralized treasury and cash management processes, and, accordingly, cash flow amounts for discontinued operations are disclosed in Note 2 “Business Acquisitions, Divestiture and Discontinued Operations.” All results and information in the consolidated financial statements are presented as continuing operations and exclude the AS&O Product Line unless otherwise noted specifically as discontinued operations.
The Company organizes its business into two reportable segments: (1) Medical and (2) Non-Medical. The discontinued operations of the AS&O Product Line were reported in the Medical segment. Refer to Note 18 “Segment and Geographic Information,” for additional information on the Company’s reportable segments.
Fiscal Year
Effective at the end of the 2019 fiscal year, the Company changed its fiscal year end from a 52/53-week year ending on the Friday nearest December 31 to a calendar year ending on December 31.
Use of Estimates
The preparation of financial statements in conformity with GAAP requires management to make estimates and assumptions that affect the reported amounts of assets and liabilities and disclosure of contingent assets and liabilities at the date of the financial statements and reported amounts of sales and expenses during the reporting periods. Actual results could differ materially from those estimates.
Risks and Uncertainties
Beginning in early March 2020, the global spread of the novel coronavirus (“COVID-19”) created significant uncertainty and worldwide economic disruption. Specific impacts to the Company’s business include delayed or reduced customer orders and sales, restrictions on its associates’ ability to travel or work, delays in shipments to and from certain countries, and disruptions in its supply chain. The extent to which COVID-19 impacts the Company’s operations will depend on future developments, which are highly uncertain, including, among others, the duration of the outbreak, new information that may emerge concerning the severity of COVID-19 and the actions, especially those taken by governmental authorities, to contain the pandemic or treat its impact. As pandemic-related events continue to evolve, additional impacts may arise that the Company is not aware of currently. Any prolonged material disruption of the Company’s associates, suppliers, manufacturing, or customers could materially impact its consolidated financial position, results of operations or cash flows.
- 56 -
INTEGER HOLDINGS CORPORATION
NOTES TO CONSOLIDATED FINANCIAL STATEMENTS
(1.) SUMMARY OF SIGNIFICANT ACCOUNTING POLICIES (Continued)
Concentration of Credit Risk
Financial instruments that potentially subject the Company to concentration of credit risk consist principally of accounts receivable. A significant portion of the Company’s sales and accounts receivable are to three customers, all in the medical device industry, and, as such, the Company is directly affected by the condition of those customers and that industry. However, the credit risk associated with trade receivables is partially mitigated due to the stability of those customers. The Company performs on-going credit evaluations of its customers. Note 19 “Revenue from Contracts with Customers” contains information on sales and accounts receivable for these customers. The Company maintains cash deposits with major banks, which from time to time may exceed insured limits. The Company performs on-going credit evaluations of its banks.
Leases
The Company determines if an arrangement is, or contains, a lease at inception and classifies it at as finance or operating. The Company primarily leases certain office and manufacturing facilities under operating leases, with additional operating leases for machinery, office equipment and vehicles. The Company leases certain computer hardware under finance leases. Finance lease assets and corresponding liabilities are included in Other assets and Other long-term liabilities, respectively, on the Consolidated Balance Sheets. Finance leases are no no
Lease right-of-use (“ROU”) assets and corresponding liabilities are recognized based on the present value of the lease payments over the lease term at commencement date. When discount rates implicit in leases cannot be readily determined, the Company uses its incremental borrowing rate based on information available at commencement date in determining the present value of future payments. The incremental borrowing rate is determined based on the Company’s recent debt issuances, the Company’s specific credit rating, lease term and the currency in which lease payments are made.
- 57 -
INTEGER HOLDINGS CORPORATION
NOTES TO CONSOLIDATED FINANCIAL STATEMENTS
(1.) SUMMARY OF SIGNIFICANT ACCOUNTING POLICIES (Continued)
Lease terms may include options to extend or terminate the lease when it is reasonably certain that the Company will exercise such option. Lease expense is recognized on a straight-line basis over the lease term. The Company elected to combine lease and non-lease components for all asset classes. For certain leases where rent escalates based upon a change in a financial index, such as the Consumer Price Index, the difference between the rate at lease inception and the subsequent fluctuations in that rate are included in variable lease costs. Additionally, because the Company has elected to not separate lease and non-lease components, variable costs also include payments to the landlord for common area maintenance, real estate taxes, insurance and other operating expenses. In addition, the Company does not apply the recognition requirements to leases with lease terms of 12 months or less. Note 14 “Leases” contains additional information on the Company’s leases.
Property, Plant and Equipment (“PP&E”)
PP&E is carried at cost less accumulated depreciation. Depreciation is computed by the straight-line method over the estimated useful lives of the assets, as follows: buildings and building improvements 12 -30 years; machinery and equipment 3 -10 years; office equipment 3 -10 years; and leasehold improvements over the remaining lives of the improvements or the lease term, whichever is shorter. The costs of repairs and maintenance are expensed as incurred; renewals and betterments are capitalized. Upon retirement or sale of an asset, its cost and related accumulated depreciation or amortization is removed from the accounts and any gain or loss is recorded in operating income or expense. The Company also reviews its PP&E for impairment when impairment indicators exist. When impairment indicators exist, the Company determines if the carrying value of its fixed assets exceeds the related undiscounted future cash flows. In cases where the carrying value of the Company's long-lived assets or asset groups (excluding goodwill and indefinite-lived intangible assets) exceeds the related undiscounted cash flows, the carrying value is written down to fair value. Fair value is generally determined using a discounted cash flow analysis. Note 5 “Property, Plant and Equipment, Net” contains additional information on the Company’s PP&E.
Fair Value Measurements
Fair value is defined as the price that would be received to sell an asset or paid to transfer a liability (i.e. the “exit price”) in an orderly transaction between market participants at the measurement date. ASC 820, Fair Value Measurements, establishes a hierarchy for inputs used in measuring fair value that maximizes the use of observable inputs and minimizes the use of unobservable inputs by requiring that the most observable inputs be used when available. Observable inputs are inputs that market participants would use in pricing the asset or liability developed based on market data obtained from sources independent of the Company. Unobservable inputs are inputs that reflect the Company’s assumptions about the assumptions market participants would use in pricing the asset or liability developed based on the best information available in the circumstances. The hierarchy is broken down into three levels based on the reliability of inputs as follows:
Level 1 – Valuation is based on quoted prices in active markets for identical assets or liabilities that the Company has the ability to access. Level 1 valuations do not entail a significant degree of judgment.
Level 2 – Valuation is determined from quoted prices for similar assets or liabilities in active markets, quoted prices for identical instruments in markets that are not active or by model-based techniques in which all significant inputs are observable in the market.
Level 3 – Valuation is based on unobservable inputs that are significant to the overall fair value measurement. The degree of judgment in determining fair value is greatest for Level 3 valuations.
Fair value is a market-based measure considered from the perspective of a market participant rather than an entity-specific measure. Therefore, even when market assumptions are not readily available, assumptions are required to reflect those that market participants would use in pricing the asset or liability at the measurement date. Note 17 “Financial Instruments and Fair Value Measurements” contains additional information on assets and liabilities recorded at fair value in the consolidated financial statements.
Acquisitions
Results of operations of acquired companies are included in the Company’s results of operations as of the respective acquisition dates. The purchase price of each acquisition is allocated to the net assets acquired based on estimates of their fair values at the date of the acquisition. Any purchase price in excess of these net assets is recorded as goodwill.
All direct acquisition-related costs are expensed as incurred and are recognized as a component of Other operating expenses. The allocation of purchase price in certain cases may be subject to revision based on the final determination of fair values during the measurement period, which may be up to one year from the acquisition date.
- 58 -
INTEGER HOLDINGS CORPORATION
NOTES TO CONSOLIDATED FINANCIAL STATEMENTS
(1.) SUMMARY OF SIGNIFICANT ACCOUNTING POLICIES (Continued)
Contingent Consideration
In circumstances where an acquisition involves a contingent consideration arrangement, the Company recognizes a liability equal to the fair value of the contingent payments it expects to make as of the acquisition date. Increases or decreases in the fair value of the contingent consideration liability can result from changes in discount periods and rates, as well as changes in the timing, amount of, or the likelihood of achieving the applicable performance target. Increases in projected revenues, estimated cash flows and probabilities of payment may result in significantly higher fair value measurements; decreases in these items may have the opposite effect. Increases in the discount rates in periods prior to payment may result in significantly lower fair value measurements and decreases in the discount rates may have the opposite effect.
The contingent consideration fair value measurement is based on significant inputs not observable in the market and therefore constitute Level 3 inputs within the fair value hierarchy. The Company determines the initial fair value of contingent consideration liabilities using a Monte Carlo (“Monte Carlo”) valuation model, which involves a simulation of future revenues during the earn out-period using management’s best estimates, or a probability-weighted discounted cash flow analysis.
In periods subsequent to the initial measurement, contingent consideration liabilities are remeasured to fair value each reporting period until the contingent consideration is settled using various assumptions including estimated revenues (based on internal operational budgets and long-range strategic plans), discount rates, revenue volatility and projected payment dates. The current portion of contingent consideration liabilities is included in Accrued expenses and other current liabilities and the non-current portion is included in Other long-term liabilities on the Consolidated Balance Sheets. Adjustments to the fair value of contingent consideration liabilities are included in Other operating expenses in the Consolidated Statements of Operations, and operating activities in the Consolidated Statements of Cash Flows. Note 17 “Financial Instruments and Fair Value Measurements” contains additional information on contingent consideration recorded at fair value in the consolidated financial statements.
Discontinued Operations
In determining whether a group of assets which has been disposed of (or is to be disposed of) should be presented as a discontinued operation, the Company analyzes whether the group of assets being disposed of represented a component of the entity; that is, whether it had historic operations and cash flows that were clearly distinguished (both operationally and for financial reporting purposes). In addition, the Company considers whether the disposal represents a strategic shift that has or will have a major effect on the Company’s operations and financial results.
The assets and liabilities of a discontinued operation held for sale, other than goodwill, are measured at the lower of carrying amount or fair value less cost to sell. When a portion of a goodwill reporting unit that constitutes a business is to be disposed of, the goodwill associated with that business is included in the carrying amount of the business based on the relative fair values of the business to be disposed of and the portion of the reporting unit that will be retained. The Company allocates interest to discontinued operations if the interest is directly attributable to the discontinued operations or is interest on debt that is required to be repaid as a result of the disposal transaction.
Goodwill
Goodwill represents the excess of cost over the fair value of identifiable net assets of a business acquired and is assigned to one or more reporting units. The Company’s reporting units are the same as its reportable segments, Medical and Non-Medical. The Company tests each reporting unit’s goodwill for impairment at least annually as of the last day of the fiscal year and between annual tests if an event occurs or circumstances change that would more-likely-than-not reduce the fair value of a reporting unit below its carrying amount. In conducting its goodwill test, the Company either performs a qualitative assessment or a quantitative assessment. A qualitative assessment requires that the Company consider events or circumstances including, but not limited to, macro-economic conditions, market and industry conditions, cost factors, competitive environment, changes in strategy, changes in customers, changes in the Company’s stock price, results of the last impairment test, and the operational stability and the overall financial performance of the reporting units. If, after assessing the totality of events or circumstances, the Company determines that it is more likely than not that the fair values of its reporting units are greater than the carrying amounts, then the quantitative goodwill impairment test is not performed. The Company may elect to bypass the qualitative analysis and perform a quantitative analysis.
- 59 -
INTEGER HOLDINGS CORPORATION
NOTES TO CONSOLIDATED FINANCIAL STATEMENTS
(1.) SUMMARY OF SIGNIFICANT ACCOUNTING POLICIES (Continued)
If the qualitative assessment indicates that the quantitative analysis should be performed or if management elects to bypass a qualitative analysis to perform a quantitative analysis, the Company then evaluates goodwill for impairment by comparing the fair value of each of its reporting units to its carrying value, including the associated goodwill. To determine the fair values, the Company uses a weighted combination of the market approach based on comparable publicly traded companies and the income approach based on estimated discounted future cash flows. The cash flow assumptions consider historical and forecasted revenue, operating costs and other relevant factors.
Throughout 2020, the Company evaluated the effects of the COVID-19 pandemic and its negative impact on the global economy on each of the Company’s reporting units and indefinite-lived intangible assets. Further, the collapse in the demand for oil caused by this unprecedented global health and economic crisis, coupled with oil oversupply, adversely impacted the demand for products in the Company’s Non-Medical reportable segment. In the first quarter of 2020, a trigger event was identified and accordingly the Company performed a quantitative analysis to test goodwill for impairment as of April 3, 2020. The fair value of the Non-Medical reporting unit exceeded its carrying amount as of April 3, 2020. No further impairment indicators have been identified since the first quarter of 2020 through December 31, 2020.
The Company completed its annual goodwill impairment test as of December 31, 2020 and determined, after performing a qualitative review of its Medical reporting unit, that it is more likely than not that the fair value of the Medical reporting unit exceeds its carrying amount. Accordingly, there was no indication of impairment and the quantitative goodwill impairment test was not performed for the Medical reporting unit. The Company bypassed the qualitative analysis for its Non-Medical reporting unit and performed a quantitative analysis. The fair value of the Non-Medical reporting unit exceeded its carrying amount as of December 31, 2020.
Other Intangible Assets
Other intangible assets consist of purchased technology and patents, customer lists and trademarks. Definite-lived intangible assets are amortized on an accelerated or straight-line basis, which approximates the projected cash flows used to determine the fair value of those definite-lived intangible assets at the time of acquisition, as follows: purchased technology and patents 5 -15 years; customer lists 7 -20 years and other intangible assets 1 -10 years. Certain trademark assets are considered indefinite-lived intangible assets and are not amortized. The Company expenses the costs incurred to renew or extend the term of intangible assets.
The Company reviews its definite-lived intangible assets for impairment when impairment indicators exist. When impairment indicators exist, the Company determines if the carrying value of its definite-lived intangible assets or asset groups exceeds the related undiscounted future cash flows. In cases where the carrying value exceeds the undiscounted future cash flows, the carrying value is written down to fair value. Fair value is generally determined using a discounted cash flow analysis.
The Company assesses its indefinite-lived intangible assets for impairment periodically to determine if any adverse conditions exist that would indicate impairment or when impairment indicators exist. The Company assesses its indefinite-lived intangible assets for impairment at least annually by comparing the fair value of the indefinite-lived intangible asset to its carrying value. The fair value is determined using the relief from royalty method.
Refer to Note 6 “Goodwill and Other Intangible Assets, Net” for further details of the Company’s goodwill and other intangible assets.
- 60 -
INTEGER HOLDINGS CORPORATION
NOTES TO CONSOLIDATED FINANCIAL STATEMENTS
(1.) SUMMARY OF SIGNIFICANT ACCOUNTING POLICIES (Continued)
Equity Investments
The Company holds long-term, strategic investments in companies to promote business and strategic objectives. These investments are included in Other assets on the Consolidated Balance Sheets. Equity investments are measured and recorded as follows:
•Non-marketable equity securities are equity securities without readily determinable fair value that are measured and recorded at fair value with changes in fair value recognized within net income. The Company measures the securities at cost minus impairment, if any, plus or minus changes resulting from qualifying observable price changes. If an impairment is recognized on the Company’s non-marketable equity securities during the period, these assets are classified as Level 3 within the fair value hierarchy based on the nature of the fair value inputs.
•Equity method investments are equity securities in investees the Company does not control but over which it has the ability to exercise influence. Equity method investments are measured at cost minus impairment, if any, plus or minus our share of equity method investee income or loss.
Realized and unrealized gains and losses resulting from changes in fair value or the sale of these equity investments are recorded through (Gain) Loss on Equity Investments, Net. The carrying value of the Company’s non-marketable equity securities is adjusted for qualifying observable price changes resulting from the issuance of similar or identical securities by the same issuer. Determining whether an observed transaction is similar to a security within the Company’s portfolio requires judgment based on the rights and preferences of the securities. Recording upward and downward adjustments to the carrying value of the Company’s equity securities as a result of observable price changes requires quantitative assessments of the fair value of these securities using various valuation methodologies and involves the use of estimates.
Non-marketable equity securities and equity method investments (collectively referred to as non-marketable equity investments) are also subject to periodic impairment reviews. The Company’s quarterly impairment analysis considers both qualitative and quantitative factors that may have a significant impact on the investee’s fair value. Qualitative factors considered include the investee’s financial condition and business outlook, market for technology, operational and financing cash flow activities, technology and regulatory approval progress, and other relevant events and factors affecting the investee. When indicators of impairment exist, quantitative assessments of the fair value of the Company’s non-marketable equity investments are prepared.
To determine the fair value of these investments, the Company uses all pertinent financial information available related to the investees, including financial statements, market participant valuations from recent and proposed equity offerings, and other third-party data. Non-marketable equity securities are tested for impairment using a qualitative model similar to the model used for goodwill and long-lived assets. Upon determining that an impairment may exist, the security’s fair value is calculated and compared to its carrying value and an impairment is recognized immediately if the carrying value exceeds the fair value. Equity method investments are subject to periodic impairment reviews using the other-than-temporary impairment model, which considers the severity and duration of a decline in fair value below cost and the Company’s ability and intent to hold the investment for a sufficient period of time to allow for recovery.
The Company has determined that its investments are not considered variable interest entities. The Company’s exposure related to these entities is limited to its recorded investment. These investments are in start-up research and development companies whose fair value is highly subjective in nature and subject to future fluctuations, which could be significant. Refer to Note 17 “Financial Instruments and Fair Value Measurements” for additional information on the Company’s equity investments.
Debt Issuance Costs and Discounts
Debt issuance costs and discounts associated with the issuance of debt by the Company are deferred and amortized over the lives of the related debt. Debt issuance costs incurred in connection with the Company’s issuance of its revolving credit facility are classified within Other assets and amortized to Interest expense on a straight-line basis over the contractual term of the revolving credit facility. Debt issuance costs and discounts related to the Company’s term-debt are recorded as a reduction of the carrying value of the related debt and are amortized to Interest expense using the effective interest method over the period from the date of issuance to the put option date (if applicable) or the maturity date, whichever is earlier. The amortization of debt issuance costs and discounts are included in Debt related charges included in interest expense in the Consolidated Statements of Cash Flows. Upon prepayment of the related debt, the Company accelerates the recognition of a proportionate amount of the costs as refinancing or extinguishment of debt. Note 8 “Debt” contains additional information on the Company’s debt issuance costs and discounts.
- 61 -
INTEGER HOLDINGS CORPORATION
NOTES TO CONSOLIDATED FINANCIAL STATEMENTS
(1.) SUMMARY OF SIGNIFICANT ACCOUNTING POLICIES (Continued)
Income Taxes
The consolidated financial statements of the Company have been prepared using the asset and liability approach to account for income taxes, which requires the recognition of deferred income taxes for the expected future tax consequences of net operating losses, credits, and temporary differences between the financial statement carrying amounts and the tax bases of assets and liabilities. A valuation allowance is provided on deferred tax assets if it is determined, within each taxing jurisdiction, that it is more likely than not that the asset will not be realized.
The Company accounts for uncertain tax positions using a more likely than not recognition threshold. The evaluation of uncertain tax positions is based on factors including, but not limited to, changes in tax law, the measurement of tax positions taken or expected to be taken in tax returns, the effective settlement of matters subject to audit, new audit activity and changes in facts or circumstances related to a tax position. These tax positions are evaluated on a quarterly basis. The Company recognizes interest expense related to uncertain tax positions as Provision for income taxes. Penalties, if incurred, are recognized as a component of Selling, general and administrative (“SG&A”) expenses.
The Company and its subsidiaries file a consolidated U.S. federal income tax return. State tax returns are filed on a combined or separate basis depending on the applicable laws in the jurisdictions where the tax returns are filed. The Company also files foreign tax returns on a separate company basis in the countries in which it operates.
Derivative Financial Instruments
The Company recognizes all derivative financial instruments in its consolidated financial statements at fair value. Changes in the fair value of derivative instruments are recorded in earnings unless hedge accounting criteria are met. Under master agreements with the respective counterparties to our derivative contracts, subject to applicable requirements, we have the right of set-off and are allowed to net settle transactions of the same type with a single net amount payable by one party to the other. The Company designated its interest rate swaps and foreign currency forward contracts as cash flow hedges (refer to Note 17 “Financial Instruments and Fair Value Measurements”). Gains and losses on cash flow hedges are recorded in Accumulated Other Comprehensive Income in the Consolidated Balance Sheets until the underlying transaction is recorded in earnings. When the hedged item is realized, gains or losses are reclassified from Accumulated Other Comprehensive Income to the Consolidated Statement of Operations on the same line item as the underlying transaction. In the event the forecasted transactions do not occur, or it becomes probable that they will not occur, the Company reclassifies any gain or loss on the related cash flow hedge to earnings in the respective period. Cash flows related to these derivative financial instruments are included in cash flows from operating activities. The resulting cash flow from the termination of interest rate swap agreements is reported in cash flows from operations in the Consolidated Statements of Cash Flows.
Revenue Recognition
The majority of the Company’s revenues consist of sales of various medical devices and products to large, multinational OEMs and their affiliated subsidiaries. The Company considers the customer’s purchase order, which in some cases is governed by a long-term agreement, and the Company’s corresponding sales order acknowledgment as the contract with the customer. Consideration payable to customers is included in the transaction price. In accordance with ASC 340-40-25-4, the Company expenses incremental costs of obtaining a contract when incurred because the amortization period is less than one year.
The Company evaluates revenue recognition in contracts with customers as performance obligations are satisfied and the customer obtains control of the products. Control is defined as the ability to direct the use of and obtain substantially all of the remaining benefits of the products. The customer obtains control of the products when title and risk of ownership transfers to them, which is primarily based upon shipping terms. Most of the Company’s revenues are recognized at the point in time when the products are shipped to customers. When contracts with customers for products, which do not have an alternative use to the Company, contain provisions that provide the Company with an enforceable right to payment for performance completed to date for costs incurred plus a reasonable profit throughout the duration of the contract, revenue is recognized over time as control is transferred to the customer. In contracts with customers where revenue is recognized over time, the Company uses an input measure to determine progress towards completion and total estimated costs at completion. Under this method, sales and gross profit are recognized as work is performed generally based on actual costs incurred. Revenue is recognized net of sales tax, value-added taxes and other taxes.
- 62 -
INTEGER HOLDINGS CORPORATION
NOTES TO CONSOLIDATED FINANCIAL STATEMENTS
(1.) SUMMARY OF SIGNIFICANT ACCOUNTING POLICIES (Continued)
Performance Obligations
The Company considers each shipment of an individual product included on a purchase order to be a separate performance obligation, as each shipment is separately identifiable and the customer can benefit from each individual product separately from the other products included on the purchase order. Accordingly, a contract can have one or more performance obligations to manufacture products. Standard payment terms range from 30 to 90 days and can include a discount for early payment.
The Company does not offer its customers a right of return. Rather, the Company warrants that each unit received by the customer will meet the agreed upon technical and quality specifications and requirements. Only when the delivered units do not meet these requirements can the customer return the non-compliant units as a corrective action under the warranty. The remedy offered to the customer is repair of the returned units or replacement if repair is not viable. Accordingly, the Company records a warranty reserve and any warranty activities are not considered to be a separate performance obligation.
Contract Balances
The timing of revenue recognition, billings and cash collections results in billed accounts receivable and less frequently, unearned revenue. Accounts receivable are recorded when the right to consideration becomes unconditional. Unearned revenue is recorded when customers pay or are billed in advance of the Company’s satisfaction of performance obligations. Contract liabilities are classified as Accrued expenses and other current liabilities on the Consolidated Balance Sheets. For contracts with customers where revenue is recognized over time, the Company records a contract asset for unbilled revenue associated with non-cancellable customer orders, which is recorded within Contract assets on the Consolidated Balance Sheets.
Transaction Price
Generally, the transaction price of the Company’s contracts consists of a unit price for each individual product included in the contract, which can be fixed or variable based on the number of units ordered. In some instances, the transaction price also includes a rebate for meeting certain volume-based targets over a specified period of time. The transaction price of a contract is determined based on the unit price and the number of units ordered, reduced by the rebate expected to be earned on those units. Rebates are estimated based on the expected achievement of the volume-based target using the most likely amount method and updated quarterly. Any adjustments to these estimates are recognized under the cumulative catch-up method, such that impact of the adjustment is recognized in the period in which it is identified. When contracts with customers include consideration payable at the beginning of the contract, the transaction price is reduced at the later of when the Company recognizes revenue for the transfer of the related goods to the customer or when the Company pays or promises to pay the consideration. Volume discounts and rebates and other pricing reductions earned by customers are offset against their receivable balances.
The transaction price is allocated to each performance obligation on a relative standalone selling price basis. As the majority of products sold to customers are manufactured to meet the specific requirements and technical specifications of that customer, the products are considered unique to that customer and the unit price stated in the contract is considered the standalone selling price.
The Company does not disclose the aggregate amount of the transaction price allocated to unsatisfied performance obligations and an expectation of when those amounts are expected to be recognized as revenue because the majority of contracts have an original expected duration of one year or less.
Contract Modifications
Environmental Costs
Environmental expenditures that relate to an existing condition caused by past operations and that do not provide future benefits are expensed as incurred. Liabilities are recorded when environmental assessments are made, the requirement for remedial efforts is probable and the amount of the liability can be reasonably estimated. Liabilities are recorded generally no later than the completion of feasibility studies. The Company has a process in place to monitor, identify, and assess how the current activities for known exposures are progressing against the recorded liabilities. The process is also designed to identify other potential remediation sites that are not presently known.
- 63 -
INTEGER HOLDINGS CORPORATION
NOTES TO CONSOLIDATED FINANCIAL STATEMENTS
(1.) SUMMARY OF SIGNIFICANT ACCOUNTING POLICIES (Continued)
Restructuring Expenses
The Company continually evaluates alternatives to align its resources with the changing needs of its customers and markets, and to lower operating costs. This includes realignment of existing manufacturing capacity, facility closures, process optimization, or similar actions, either in the normal course of business or pursuant to significant restructuring programs. These actions may result in voluntary or involuntary employee termination benefits. Voluntary termination benefits are accrued when an employee accepts the related offer. Involuntary termination benefits are accrued upon the commitment to a termination plan and the benefit arrangement is communicated to affected employees, or when liabilities are determined to be probable and estimable, depending on the existence of a substantive plan for severance or termination. All other exit costs are expensed as incurred. Refer to Note 11 “Other Operating Expenses” for additional information.
Product Warranties
The Company allows customers to return defective or damaged products for credit, replacement, or repair. The Company warrants that its products will meet customer specifications and will be free from defects in materials and workmanship. The Company accrues its estimated exposure to warranty claims, through Cost of Sales, based upon experience and other specific information as it becomes available. The product warranty liability is classified as Accrued expenses and other current liabilities on the Consolidated Balance Sheets. Adjustments to pre-existing estimated exposure for warranties are made as changes to the obligations become reasonably estimable. Note 13 “Commitments and Contingencies” contains additional information on the Company’s product warranties.
Stock-Based Compensation
The Company recognizes stock-based compensation expense for its compensation plans. These plans include stock options, restricted stock awards (“RSAs”), restricted stock units (“RSUs”) and performance-based restricted stock units (“PRSUs”). For the Company’s PRSUs, in addition to service conditions, the ultimate number of shares to be earned depends on the achievement of targets based on market conditions, such as total shareholder return, or performance conditions based on the Company’s operating results. The Company records forfeitures of equity awards in the period in which they occur.
The fair value of the stock-based compensation is determined at the grant date. The Company uses the Black-Scholes standard option pricing model (“Black-Scholes model”) to determine the fair value of stock options. The fair value of each RSU and RSA is determined based on the Company’s closing stock price on the date of grant. The fair value of each PRSU is determined based on either the Company’s closing stock price on the date of grant or through a Monte Carlo valuation model for those awards that include a market-based condition. In addition to the closing stock price on the date of grant, the determination of the fair value of awards using both the Black-Scholes and Monte Carlo valuation models is affected by other assumptions, including the following:
Expected Term - The Company analyzes historical employee exercise and termination data to estimate the expected term assumption for stock options. For market-based awards, the term is commensurate with the performance period remaining as of the grant date.
Risk-free Interest Rate - A risk-free rate is based on the U.S. Treasury rates in effect on the grant date for a maturity equal to or approximating the expected term of the award.
Expected Volatility - For stock options, expected volatility is calculated using historical volatility based on the daily closing prices of the Company’s common stock over a period equal to the expected term. For market-based awards, a combination of historical and implied volatility for the Company and members of its peer group are used in developing the expected volatility assumption.
Dividend Yield - The dividend yield assumption is based on the Company’s expected annual dividend yield on the grant date.
The Company recognizes compensation expense over the required service or vesting period based on the fair value of the award on the date of grant. Certain executive stock-based awards contain market, performance and service conditions. Compensation expense for awards with market conditions is recognized over the service period and is not reversed if the market condition is not met. Compensation expense for awards with performance conditions is reassessed each reporting period and recognized based upon the probability that the performance targets will be achieved.
- 64 -
INTEGER HOLDINGS CORPORATION
NOTES TO CONSOLIDATED FINANCIAL STATEMENTS
(1.) SUMMARY OF SIGNIFICANT ACCOUNTING POLICIES (Continued)
All stock option awards granted under the Company’s compensation plans have an exercise price equal to the closing stock price on the date of grant, a ten-year contractual life and generally, vest annually over a three-year vesting term. RSUs typically vest in equal annual installments over a or year period. RSUs issued to members of the Company’s Board of Directors as a portion of their annual retainer vest quarterly over a one-year vesting term. Earned PRSUs typically vest or three years from the date of grant.
The Company records deferred tax assets for awards that result in deductions on the Company’s income tax returns, based on the amount of stock-based compensation expense recognized and the statutory tax rate in the jurisdiction in which it will receive a deduction. Differences between the deferred tax assets recognized for financial reporting purposes and the actual tax deduction reported on the income tax return are recorded as a component of Provision for income taxes in the Consolidated Statements of Operations. Note 10 “Stock-Based Compensation” contains additional information on the Company’s stock-based compensation.
Defined Benefit Plans
The Company recognizes in its balance sheet as an asset or liability the overfunded or underfunded status of its defined benefit plans provided to its employees located in Mexico and Switzerland. This asset or liability is measured as the difference between the fair value of plan assets, if any, and the benefit obligation of those plans. For these plans, the benefit obligation is the projected benefit obligation, which is calculated based on actuarial computations of current and future benefits for employees. Actuarial gains or losses and prior service costs or credits that arise during the period, but are not included as components of net periodic benefit expense, are recognized as a component of Accumulated other comprehensive income (“AOCI”) on the Consolidated Balance Sheets. The Company records the service cost component of net benefit costs in Cost of sales and SG&A expenses. The interest cost component of net benefit costs is recorded in Interest expense and the remaining components of net benefit costs, amortization of net losses and expected return on plan assets, are recorded in Other (income) loss, net.
Foreign Currency Translation and Remeasurement
The Company translates all assets and liabilities of its foreign subsidiaries, where the U.S. dollar is not the functional currency, at the period-end exchange rate and translates income and expenses at the average exchange rates in effect during the period. The net effect of this translation is recorded in the consolidated financial statements as a component of AOCI. Translation adjustments are not adjusted for income taxes as they relate to permanent investments in the Company’s foreign subsidiaries.
The Company has foreign operations in Ireland, Israel, Malaysia, Mexico, Switzerland, and Uruguay, which expose the Company to foreign currency exchange rate fluctuations due to transactions denominated in Euros, Israeli shekels, Malaysian ringgits, Mexican pesos, Swiss francs, and Uruguayan pesos. To the extent that monetary assets and liabilities, including short-term and long-term intercompany loans, are recorded in a currency other than the functional currency of the subsidiary, these amounts are remeasured each period at the period-end exchange rate, with the resulting gain or loss being recorded in Other (income) loss, net in the Consolidated Statements of Operations. Net foreign currency transaction losses included in Other (income) loss, net amounted to $1.6 million, $0.1 million and $1.6 million for 2020, 2019 and 2018, respectively, and primarily related to the fluctuation of the U.S. dollar relative to the Euro and the remeasurement of intercompany loans.
Earnings Per Share (“EPS”)
Basic EPS is calculated by dividing Net Income by the weighted average number of shares outstanding during the period. Diluted EPS is calculated by adjusting the weighted average number of shares outstanding for potential common shares if dilutive to the EPS calculation. Note 15 “Earnings Per Share” contains additional information on the computation of the Company’s EPS.
Comprehensive Income
The Company’s comprehensive income as reported in the Consolidated Statements of Comprehensive Income includes net income, foreign currency translation adjustments, the net change in cash flow hedges, net of tax, and defined benefit plan liability adjustments, net of tax. The Consolidated Statements of Comprehensive Income and Note 16 “Stockholders’ Equity” contain additional information on the computation of the Company’s comprehensive income.
- 65 -
INTEGER HOLDINGS CORPORATION
NOTES TO CONSOLIDATED FINANCIAL STATEMENTS
(1.) SUMMARY OF SIGNIFICANT ACCOUNTING POLICIES (Continued)
Recent Accounting Pronouncements
In the normal course of business, management evaluates all new Accounting Standards Updates (“ASU”) and other accounting pronouncements issued by the Financial Accounting Standards Board (“FASB”), Securities and Exchange Commission (“SEC”), or other authoritative accounting bodies to determine the potential impact they may have on the Company’s Consolidated Financial Statements. Except as noted below, management does not expect any of the recently issued accounting pronouncements, which have not already been adopted, to have a material impact on the Company’s Consolidated Financial Statements.
Accounting Guidance Adopted in Fiscal Year 2020
Adoption of ASC Topic 326
The Company adopted ASC 326, Financial Instruments-Credit Losses, effective January 1, 2020. Under the current expected credit losses (“CECL”) model, the Company immediately recognizes an estimate of credit losses expected to occur over the life of the financial asset at the time the financial asset is originated or acquired. Estimated credit losses are determined by taking into consideration historical loss conditions, current conditions and reasonable and supportable forecasts. Changes to the expected lifetime credit losses are recognized each period. The adoption of ASC 326 did not have a material impact to the Company’s Consolidated Financial Statements.
Accounting Guidance Adopted in Fiscal Year 2019
Adoption of ASC Topic 842
The Company adopted ASC 842, Leases, effective December 29, 2018, the first day of the Company’s 2019 fiscal year. ASC 842 requires the recognition of lease assets and lease liabilities by lessees for those leases classified as operating leases under previous guidance. The Company elected to transition to ASC 842 using the option to not restate comparative periods and apply the standard as of the date of initial application. In addition, certain practical expedients were elected which permit the Company to not reassess whether existing contracts are or contain leases, to not reassess the lease classification of any existing leases, and to not reassess initial direct costs for any existing leases. The Company also elected the practical expedient to not separate lease and non-lease components for all classes of underlying assets and the practical expedient related to land easements, allowing the Company to carry-forward its accounting treatment for land easements on existing agreements. The Company did not elect the practical expedient pertaining to the use of hindsight. The Company also made an accounting policy election to keep leases with an initial term of 12 months or less and no purchase option the Company is reasonably certain to exercise off the balance sheet for all classes of underlying assets.
As a result of the adoption of ASC 842, the Company recognized operating lease right-of-use assets of $40.9 million and operating lease liabilities of $43.4 million on December 29, 2018. The difference between the lease assets and lease liabilities primarily represents the existing prepaid rent assets, deferred rent liabilities, and tenant improvement allowances, along with a cumulative-effect adjustment to beginning retained earnings. The adoption of ASC 842 did not have a material impact on the Company’s Consolidated Statement of Operations and Consolidated Statement of Cash Flows for the periods presented.
Refer to Note 14 “Leases” for additional information on the Company’s leases.
Accounting Guidance Not Yet Elected or Adopted
In March 2020, the FASB issued ASU 2020-04, Reference Rate Reform (Topic 848) - Facilitation of the Effects of Reference Rate Reform on Financial Reporting, in response to concerns about structural risks of interbank offered rates (“IBORs”). ASU 2020-04 provides optional expedients and exceptions for applying GAAP to contracts, hedging relationships, and other transactions if certain criteria are met. The ASU applies only to contracts, hedging relationships, and other transactions that reference LIBOR or another reference rate expected to be discontinued because of reference rate reform. The amendments in ASU 2020-04 are elective for all entities through December 31, 2022. ASU 2020-04 has not yet affected the Company’s Condensed Consolidated Financial Statements.
- 66 -
INTEGER HOLDINGS CORPORATION
NOTES TO CONSOLIDATED FINANCIAL STATEMENTS
(2.) BUSINESS ACQUISITIONS, DIVESTITURE AND DISCONTINUED OPERATIONS
Business Acquisitions
On February 19, 2020, the Company acquired certain assets and liabilities of InoMec Ltd. (“InoMec”), a privately-held company based in Israel that specializes in the research, development and manufacturing of medical devices, including minimally invasive tools, delivery systems, tubing and catheters, surgery tools, drug-device combination, laser combined devices, and tooling and production. The acquisition enables the Company to create a research and development center in Israel, closer to the customer base in the region. The fair value of the consideration transferred was $7.0 million, which included an initial cash payment of $5.3 million and $1.7 million in estimated fair value of contingent consideration.
The contingent consideration represents the estimated fair value of the Company’s obligation, under the asset purchase agreement, to make additional payments of up to $3.5 million over the next four years based on specified conditions being met. Based on the final purchase price allocation, the assets acquired principally comprise $2.0 million of intangible assets, $4.8 million of goodwill, $0.3 million of acquired property, plant and equipment, and a net liability for other working capital items of $0.1 million. Intangible assets included developed technology, customer relationships and non-compete provisions, which are being amortized over a weighted average period of 5.9 years.
On October 7, 2019, the Company acquired certain assets and liabilities of US BioDesign, LLC (“USB”), a privately-held developer and manufacturer of complex braided biomedical structures for disposable and implantable medical devices. The acquisition added a differentiated capability related to the complex development and manufacture of braided and formed biomedical structures to the Company’s broad portfolio. The fair value of the consideration transferred was $19.1 million, which included a cash payment of $14.9 million, which reflects a $0.1 million favorable working capital adjustment finalized in the first quarter of 2020, and $4.2 million in estimated fair value of contingent consideration.
The contingent consideration represents the estimated fair value of the Company’s obligation, under the asset purchase agreement, to make additional payments of up to $5.5 million if certain revenue goals are met through 2023. Based on the final purchase price allocation, the assets acquired principally consist of $7.4 million of developed technology, $10.4 million of goodwill, $0.7 million of acquired property, plant and equipment, and $0.6 million of other working capital items. The $10.4 million of goodwill reflects a $0.1 million decrease resulting from the working capital adjustment. The technology intangible asset is being amortized over a useful life of 8 years.
The amount allocated to goodwill for these acquisitions is deductible for income tax purposes. The fair value of the contingent consideration was estimated using the Monte Carlo valuation approach. See Note 17 “Financial Instruments and Fair Value Measurements” for additional information related to the fair value measurement of the contingent consideration.
For segment reporting purposes, the results of operations and assets from the InoMec and USB acquisitions have been included in the Company’s Medical segment since the respective acquisition dates. For the year ended December 31, 2020, sales related to InoMec and USB were $3.4 million and $4.5 million, respectively. For the year ended December 31, 2019, sales related to USB were $0.8 million. Earnings related to the operations consisting of the assets and liabilities acquired from InoMec and USB for the years ended December 31, 2020 and December 31, 2019 were not material.
During the years ended December 31, 2020 and December 31, 2019, direct costs of these acquisitions of $0.9 million and $0.4 million, respectively, were expensed as incurred and included in Other Operating Expenses in the Consolidated Statement of Operations. Pro forma financial information has not been presented for these acquisitions as the net effects were not significant or material to the Company’s results of operations or financial position.
- 67 -
INTEGER HOLDINGS CORPORATION
NOTES TO CONSOLIDATED FINANCIAL STATEMENTS
(2.) BUSINESS ACQUISITIONS, DIVESTITURE AND DISCONTINUED OPERATIONS (Continued)
Discontinued Operations and Divestiture of AS&O Product Line
On July 2, 2018, the Company completed the sale of its AS&O Product Line to Viant, collecting net cash proceeds of approximately $581 million. In connection with the sale, the parties executed a transition services agreement whereby the Company agreed to provide certain corporate services (including accounting, payroll, and information technology services) to Viant for a period of up to one year from the date of the closing to facilitate an orderly transfer of business operations. Viant paid Integer for these services as specified in the transition services agreement, which were completed during 2019. The Company recognized $2.9 million of income under the transition services agreement for the performance of services during 2019, of which $0.1 million is recorded as a reduction of Cost of Sales and $2.8 million is recorded as a reduction of SG&A expenses in the Consolidated Statement of Operations for the year ended December 31, 2019. The Company recognized $3.6 million of income under the transition services agreement for the performance of services during 2018, of which $0.2 million is recorded as a reduction of Cost of Sales and $3.4 million is recorded as a reduction of SG&A expenses for the year ended December 28, 2018. In addition, the parties executed long-term supply agreements under which the Company and Viant have agreed to supply the other with certain products at prices specified in the agreements for a term of three years .
In connection with the closing of the transaction but prior to a net working capital adjustment, the Company recognized a pre-tax gain on sale of discontinued operations of $195.0 million during the year ended December 28, 2018. During 2019, the Company received, and recognized as gain on sale from discontinued operations, $4.8 million due to the final net working capital adjustment agreed to with Viant.
There were no amounts from discontinued operations for fiscal years 2020. Income from discontinued operations for fiscal years 2019 and 2018 were as follows (in thousands):
| 2019 | 2018 | ||||||||||
| Sales | $ | $ | |||||||||
| Cost of sales | |||||||||||
| Gross profit | |||||||||||
| SG&A expenses | |||||||||||
| Research, development and engineering costs | |||||||||||
| Other operating expenses | |||||||||||
| Interest expense | |||||||||||
| Gain on sale of discontinued operations | ( | ( | |||||||||
| Other (income) loss, net | ( | ||||||||||
| Income from discontinued operations before taxes | |||||||||||
| Provision for income taxes | |||||||||||
| Income from discontinued operations | $ | $ | |||||||||
Interest expense included in discontinued operations reflects an estimate of interest expense related to the debt that was required to be repaid with the proceeds from the sale of the AS&O Product Line.
There were no amounts from discontinued operations for fiscal years 2020. Cash flow information from discontinued operations for fiscal years 2019 and 2018 was as follows (in thousands):
| 2019 | 2018 | ||||||||||
| Cash used in operating activities | $ | ( | $ | ( | |||||||
| Cash provided by investing activities | |||||||||||
| Depreciation and amortization | $ | ||||||||||
| Capital expenditures | |||||||||||
- 68 -
INTEGER HOLDINGS CORPORATION
NOTES TO CONSOLIDATED FINANCIAL STATEMENTS
(3.) SUPPLEMENTAL CASH FLOW INFORMATION
The following represents supplemental cash flow information for fiscal years 2020, 2019 and 2018 (in thousands):
| 2020 | 2019 | 2018 | |||||||||||||||
| Non-cash investing and financing activities: | |||||||||||||||||
| Property, plant and equipment purchases included in accounts payable | $ | $ | $ | ||||||||||||||
| Cash paid during the year for: | |||||||||||||||||
| Interest | |||||||||||||||||
| Income taxes | |||||||||||||||||
(4.) INVENTORIES
Inventories comprise the following (in thousands):
| December 31, 2020 | December 31, 2019 | ||||||||||
| Raw materials | $ | $ | |||||||||
| Work-in-process | |||||||||||
| Finished goods | |||||||||||
| Total | $ | $ | |||||||||
(5.) PROPERTY, PLANT AND EQUIPMENT, NET
PP&E comprises the following (in thousands):
| December 31, 2020 | December 31, 2019 | ||||||||||
| Manufacturing machinery and equipment | $ | $ | |||||||||
| Buildings and building improvements | |||||||||||
| Information technology hardware and software | |||||||||||
| Leasehold improvements | |||||||||||
| Furniture and fixtures | |||||||||||
| Land and land improvements | |||||||||||
| Construction work in process | |||||||||||
| Other | |||||||||||
| Accumulated depreciation | ( | ( | |||||||||
| Total | $ | $ | |||||||||
Depreciation expense for PP&E was as follows for fiscal years 2020, 2019 and 2018 (in thousands):
| 2020 | 2019 | 2018 | |||||||||||||||
| Depreciation expense | $ | $ | $ | ||||||||||||||
- 69 -
INTEGER HOLDINGS CORPORATION
NOTES TO CONSOLIDATED FINANCIAL STATEMENTS
(6.) GOODWILL AND OTHER INTANGIBLE ASSETS, NET
Goodwill
The change in the carrying amount of goodwill by reportable segment during fiscal years 2020 and 2019 was as follows (in thousands):
| Medical | Non-Medical | Total | |||||||||||||||
| December 28, 2018 | $ | $ | $ | ||||||||||||||
| Acquisition (Note 2) | |||||||||||||||||
| Foreign currency translation | ( | ( | |||||||||||||||
| December 31, 2019 | |||||||||||||||||
| Acquisition (Note 2) | |||||||||||||||||
| Acquisition-related adjustments (Note 2) | ( | ( | |||||||||||||||
| Foreign currency translation | |||||||||||||||||
| December 31, 2020 | $ | $ | $ | ||||||||||||||
As of December 31, 2020, no
Intangible Assets
Intangible assets comprise the following (in thousands):
| Gross Carrying Amount | Accumulated Amortization | Net Carrying Amount | |||||||||||||||
| December 31, 2020 | |||||||||||||||||
| Definite-lived: | |||||||||||||||||
| Purchased technology and patents | $ | $ | ( | $ | |||||||||||||
| Customer lists | ( | ||||||||||||||||
| Other | ( | ||||||||||||||||
| Total amortizing intangible assets | $ | $ | ( | $ | |||||||||||||
| Indefinite-lived: | |||||||||||||||||
| Trademarks and tradenames | $ | ||||||||||||||||
| December 31, 2019 | |||||||||||||||||
| Definite-lived: | |||||||||||||||||
| Purchased technology and patents | $ | $ | ( | $ | |||||||||||||
| Customer lists | ( | ||||||||||||||||
| Other | ( | ||||||||||||||||
| Total amortizing intangible assets | $ | $ | ( | $ | |||||||||||||
| Indefinite-lived: | |||||||||||||||||
| Trademarks and tradenames | $ | ||||||||||||||||
See Note 2 “Business Acquisitions, Divestiture and Discontinued Operations” for additional details regarding intangible assets acquired from business acquisitions during 2020 and 2019. Included in the Company’s indefinite-lived intangible assets is the Lake Region Medical tradename with a carrying value of $70.0 million.
When acquiring certain assets, the Company assesses whether the acquired assets are a result of a business combination or a purchase of an asset. During 2020, the Company acquired a set of similar identifiable intangible assets relating to a license to use technology within its Non-Medical segment. The Company purchased the technology for $4.5 million, which includes $1.0 million of contingent consideration paid during 2020 upon completion of certain milestones, and capitalized $0.1 million of costs associated with acquiring the license as an intangible asset. The intangible asset of $4.6 million is being amortized over 11 years, the remaining useful life of the patented technology.
- 70 -
INTEGER HOLDINGS CORPORATION
NOTES TO CONSOLIDATED FINANCIAL STATEMENTS
(6.) GOODWILL AND OTHER INTANGIBLE ASSETS, NET (Continued)
Aggregate intangible asset amortization expense comprises the following for fiscal years 2020, 2019 and 2018 (in thousands):
| 2020 | 2019 | 2018 | |||||||||||||||
| Cost of Sales | $ | $ | $ | ||||||||||||||
| SG&A | |||||||||||||||||
| RD&E | |||||||||||||||||
| Other Operating Expenses (“OOE”) | |||||||||||||||||
| Total intangible asset amortization expense | $ | $ | $ | ||||||||||||||
Estimated future intangible asset amortization expense based upon the carrying value as of December 31, 2020 is as follows (in thousands):
| 2021 | 2022 | 2023 | 2024 | 2025 | After 2025 | ||||||||||||||||||||||||||||||
| Amortization Expense | $ | $ | $ | $ | $ | $ | |||||||||||||||||||||||||||||
(7.) ACCRUED EXPENSES AND OTHER CURRENT LIABILITIES
Accrued expenses and other current liabilities comprise the following (in thousands):
| December 31, 2020 | December 31, 2019 | ||||||||||
| Salaries and benefits | $ | $ | |||||||||
| Profit sharing and bonuses | |||||||||||
| Contract liabilities | |||||||||||
| Accrued interest | |||||||||||
| Product warranties | |||||||||||
| Other | |||||||||||
| Total | $ | $ | |||||||||
(8.) DEBT
Long-term debt comprises the following (in thousands):
| December 31, 2020 | December 31, 2019 | ||||||||||
| Senior secured term loan A | $ | $ | |||||||||
| Senior secured term loan B | |||||||||||
| Unamortized discount on term loan B and debt issuance costs | ( | ( | |||||||||
| Total debt | |||||||||||
| Current portion of long-term debt | ( | ( | |||||||||
| Total long-term debt | $ | $ | |||||||||
Senior Secured Credit Facilities
The Company has senior secured credit facilities (the “Senior Secured Credit Facilities”) consisting of (i) a $200 million revolving credit facility (the “Revolving Credit Facility”), (ii) a term loan A facility (the “TLA Facility”), and (iii) a term loan B facility (the “TLB Facility”). The TLA Facility and TLB Facility are collectively referred to as the “Term Loan Facilities.” The TLB Facility was issued at a 1 % discount.
- 71 -
INTEGER HOLDINGS CORPORATION
NOTES TO CONSOLIDATED FINANCIAL STATEMENTS
(8.) DEBT (Continued)
On July 13, 2020, the Company amended the Senior Secured Credit Facilities (the “Amendment”) to increase the total net leverage ratio. In connection with the Amendment, the Company paid consenting lenders advanced amendment fees totaling $0.4 million. The Company will also pay the consenting lenders a deferred amendment fee, payable in installments of 0.03125 % of the outstanding Revolving Credit Facility and TLA Facility each quarter through maturity when the Company’s total net leverage ratio equals or exceeds 3.00 to 1.00. The advanced amendment fees and deferred amendment fees, which were not material for the year ended December 31, 2020, are debt issuance costs which will be deferred and amortized over the remaining life of the related debt.
Revolving Credit Facility
The Revolving Credit Facility matures on October 27, 2022. The Revolving Credit Facility includes a $15 million sublimit for swingline loans and a $25 million sublimit for standby letters of credit. The Company is required to pay a commitment fee on the unused portion of the Revolving Credit Facility, which will range between 0.175 % and 0.25 %, depending on the Company’s Total Net Leverage Ratio (as defined in the Senior Secured Credit Facilities agreement). As of December 31, 2020, the commitment fee on the unused portion of the Revolving Credit Facility was 0.25 %. Interest rates on the Revolving Credit Facility, as well as the TLA Facility, are at the Company’s option, either at: (i) the prime rate plus the applicable margin, which will range between 0.50 % and 2.00 %, based on the Company’s Total Net Leverage Ratio, or (ii) the applicable London Interbank Offered Rate (“LIBOR”) plus the applicable margin, which will range between 1.50 % and 3.00 %, based on the Company’s Total Net Leverage Ratio.
As of December 31, 2020, the Company had no outstanding borrowings on the Revolving Credit Facility and an available borrowing capacity of $193.2 million after giving effect to $6.8 million of outstanding standby letters of credit.
Subject to certain conditions, commitments under the Revolving Credit Facility may be increased through an incremental revolving facility so long as, on a pro forma basis (as defined in the Amendment), the Company’s first lien net leverage ratio does not exceed 4.25 :1.00.
Term Loan Facilities
The TLA Facility and TLB Facility mature on October 27, 2022. Interest rates on the TLB Facility are, at the Company’s option, either at: (i) the prime rate plus 1.50 % or (ii) the applicable LIBOR rate plus 2.50 %, with LIBOR subject to a 1.00 % floor. As of December 31, 2020, the interest rates on the TLA Facility and TLB Facility were 2.40 % and 3.50 %, respectively.
Subject to certain conditions, one or more incremental term loan facilities may be added to the Term Loan Facilities so long as, on a pro forma basis (as defined in the Amendment), the Company’s first lien net leverage ratio does not exceed 4.25 :1.00.
Covenants
The Revolving Credit Facility and the TLA Facility contain covenants requiring (A) a maximum total net leverage ratio of 4.75 4.50 to 1.00 for the third fiscal quarter of 2021, and reverting to and remaining at 4.00 to 1.00 beginning with the fourth quarter of 2021 through maturity, and (B) a minimum interest coverage ratio of adjusted EBITDA (as defined in the Senior Secured Credit Facilities) to interest expense of not less than 3.00 0.50 for up to four consecutive quarters commencing in any fiscal quarter in which the Company consummates an eligible adjustment acquisition (as defined in the Amendment) with a $40 million or greater purchase price. As of December 31, 2020, the Company was in compliance with these financial covenants. The TLB Facility does not contain any financial maintenance covenants.
The Senior Secured Credit Facilities also contain negative covenants that restrict the Company’s ability to (i) incur additional indebtedness; (ii) create certain liens; (iii) consolidate or merge; (iv) sell assets, including capital stock of the Company’s subsidiaries; (v) engage in transactions with the Company’s affiliates; (vi) create restrictions on the payment of dividends or other amounts from the Company’s restricted subsidiaries; (vii) pay dividends on capital stock or redeem, repurchase or retire capital stock; (viii) pay, prepay, repurchase or retire certain subordinated indebtedness; (ix) make investments, loans, advances and acquisitions; (x) make certain amendments or modifications to the organizational documents of the Company or its subsidiaries or the documentation governing other senior indebtedness of the Company; and (xi) change the Company’s type of business. These negative covenants are subject to a number of limitations and exceptions that are described in the Senior Secured Credit Facilities agreement. As of December 31, 2020, the Company was in compliance with all negative covenants under the Senior Secured Credit Facilities.
- 72 -
INTEGER HOLDINGS CORPORATION
NOTES TO CONSOLIDATED FINANCIAL STATEMENTS
(8.) DEBT (Continued)
The Senior Secured Credit Facilities provide for customary events of default. Upon the occurrence and during the continuance of an event of default, the outstanding advances and all other obligations under the Senior Secured Credit Facilities become immediately due and payable.
9.125% Senior Notes due 2023
On October 27, 2015, the Company completed a private offering of $360 million aggregate principal amount of 9.125 % senior notes due on November 1, 2023 (the “Senior Notes”). On July 10, 2018, the Company completed the redemption in full of the Senior Notes at a redemption price of 100 % of the principal amount of the Senior Notes plus the applicable “make-whole” premium of $31.3 million and accrued and unpaid interest through the redemption date. The “make-whole” premium is included in Interest Expense in the accompanying Consolidated Statements of Operations for the year ended December 28, 2018. Upon completion of the redemption of the Senior Notes, the indenture governing the Senior Notes was satisfied and discharged.
As of December 31, 2020, the weighted average interest rate on all outstanding borrowings is 3.16 %.
Contractual maturities of the Company’s debt facilities for the next five years and thereafter as of December 31, 2020 are as follows (in thousands):
| 2021 | 2022 | ||||||||||
| Future minimum principal payments | $ | $ | |||||||||
Debt Issuance Costs and Discounts
The Company incurred debt issuance costs in conjunction with the issuance of the Senior Secured Credit Facilities. The change in deferred debt issuance costs related to the Company’s Revolving Credit Facility is as follows (in thousands):
| December 28, 2018 | $ | ||||
| Financing costs incurred | |||||
Write-off of debt issuance costs(1) | ( | ||||
| Amortization during the period | ( | ||||
| December 31, 2019 | |||||
| Financing costs incurred | |||||
| Amortization during the period | ( | ||||
| December 31, 2020 | $ | ||||
The change in unamortized discount and debt issuance costs related to the Term Loan Facilities is as follows (in thousands):
| Debt Issuance Costs | Unamortized Discount on TLB Facility | Total | |||||||||||||||
| December 28, 2018 | $ | $ | $ | ||||||||||||||
| Financing costs incurred | |||||||||||||||||
Write-off of debt issuance costs and unamortized discount(1) | ( | ( | ( | ||||||||||||||
| Amortization during the period | ( | ( | ( | ||||||||||||||
| December 31, 2019 | |||||||||||||||||
| Financing costs incurred | |||||||||||||||||
Write-off of debt issuance costs and unamortized discount(1) | ( | ( | ( | ||||||||||||||
| Amortization during the period | ( | ( | ( | ||||||||||||||
| December 31, 2020 | $ | $ | $ | ||||||||||||||
__________
(1)The Company recognized losses from extinguishment of debt in connection with prepaying portions of its TLB Facility and amending the Senior Secured Credit Facilities during 2020 and 2019. The losses from extinguishment of debt are included in Interest Expense in the accompanying Consolidated Statements of Operations.
- 73 -
INTEGER HOLDINGS CORPORATION
NOTES TO CONSOLIDATED FINANCIAL STATEMENTS
(9.) BENEFIT PLANS
Savings Plan
The Company sponsors a defined contribution 401(k) plan (the “Plan”) for its U.S. based employees. The Plan provides for the deferral of employee compensation under Internal Revenue Code §401(k) and a Company match. The Company matches $0.50 per dollar of each participant’s deferral made to the Plan up to 6 % of their compensation, subject to Internal Revenue Service guidelines. The Company temporarily suspended the Company match beginning in August 2020 through the end of 2020 as part of its cost reduction actions to reduce discretionary spending in response to the effect of the COVID-19 pandemic on its operations.
Contributions from employees, as well as those matched by the Company, vest immediately. Net costs related to defined contribution plans were $5.0 million in 2020, $7.2 million in 2019 and $6.8 million in 2018.
Defined Benefit Plans
The Company is required to provide its employees located in Switzerland and Mexico certain statutorily mandated defined benefits. Under these plans, benefits accrue to employees based upon years of service, position, age and compensation. The defined benefit pension plan provided to the Company’s employees located in Switzerland is a funded contributory plan, while the plans that provide benefits to the Company’s employees located in Mexico are unfunded and noncontributory. The assets of the Switzerland plan are held at an AA- rated insurance carrier who bears the pension risk and longevity risk, and will be used to cover the pension liability for the remaining retirees of the Swiss plan, as well as the remaining employees at that location. The liability and corresponding expense related to these benefit plans is based on actuarial computations of current and future benefits for employees.
The aggregated projected benefit obligation for these plans was $3.7 million and $3.0 million as of December 31, 2020 and December 31, 2019, respectively. Net periodic pension cost for fiscal years 2020, 2019 and 2018 was $0.4 million, $0.3 million and $0.3 million, respectively. Over the next ten years, we expect gross benefit payments to be $0.8 million in total for the years 2021 through 2025, and $1.4 million in total for the years 2026 through 2030.
(10.) STOCK-BASED COMPENSATION
Stock-based Compensation Plans
The Company maintains certain stock-based compensation plans that were approved by the Company’s stockholders and are administered by the Board of Directors, or the Compensation and Organization Committee of the Board. The stock-based compensation plans provide for the granting of stock options, RSAs, RSUs, stock appreciation rights and stock bonuses to employees, non-employee directors, consultants, and service providers.
The 2011 Stock Incentive Plan (the “2011 Plan”), as amended, authorizes the issuance of up to 1,350,000 shares of equity incentive awards and the 2016 Stock Incentive Plan (the “2016 Plan”) authorizes the issuance of up to 1,450,000 shares of equity incentive awards. Awards remain outstanding under the 2005 Stock Incentive Plan and the 2009 Stock Incentive Plan, as amended, but the plans have been frozen to any new award issuances. As of December 31, 2020, there were 482,014 and 1,883 shares available for future grants under the 2016 Plan and 2011 Plan, respectively.
The Company recognized a net tax benefit from the exercise of stock options and vesting of RSAs and RSUs of $1.5 million, $2.8 million and $3.8 million for 2020, 2019 and 2018, respectively. These amounts are recorded as a component of Provision for Income Taxes.
- 74 -
INTEGER HOLDINGS CORPORATION
NOTES TO CONSOLIDATED FINANCIAL STATEMENTS
(10.) STOCK-BASED COMPENSATION (Continued)
Stock-based Compensation Expense
The components and classification of stock-based compensation expense for fiscal years 2020, 2019 and 2018 were as follows (in thousands):
| 2020 | 2019 | 2018 | |||||||||||||||
| Stock options | $ | $ | $ | ||||||||||||||
| RSAs and RSUs | |||||||||||||||||
| Discontinued operations | |||||||||||||||||
| Total stock-based compensation expense | $ | $ | $ | ||||||||||||||
| Cost of sales | $ | $ | $ | ||||||||||||||
| SG&A | |||||||||||||||||
| RD&E | |||||||||||||||||
| OOE | |||||||||||||||||
| Discontinued operations | |||||||||||||||||
| Total stock-based compensation expense | $ | $ | $ | ||||||||||||||
Stock Options
There were no The following table includes the weighted average grant date fair value of stock options granted to employees during fiscal years 2018 and the related weighted average assumptions used in the Black-Scholes model:
| 2018 | |||||||||||||||||
| Weighted average fair value of options granted | $ | ||||||||||||||||
| Assumptions: | |||||||||||||||||
| Expected term (in years) | |||||||||||||||||
| Risk-free interest rate | % | ||||||||||||||||
| Expected volatility | % | ||||||||||||||||
| Expected dividend yield | % | ||||||||||||||||
The following table summarizes stock option activity during the fiscal year ended December 31, 2020:
| Number of Stock Options | Weighted Average Exercise Price | Weighted Average Remaining Contractual Term (in years) | Aggregate Intrinsic Value (in millions) | ||||||||||||||||||||
| Outstanding at December 31, 2019 | $ | ||||||||||||||||||||||
| Exercised | ( | ||||||||||||||||||||||
| Outstanding at December 31, 2020 | $ | $ | |||||||||||||||||||||
| Vested and expected to vest at December 31, 2020 | $ | $ | |||||||||||||||||||||
| Exercisable at December 31, 2020 | $ | $ | |||||||||||||||||||||
Intrinsic value is calculated for in-the-money options (exercise price less than market price) as the difference between the market price of the Company’s common shares as of December 31, 2020 ($81.19 ) and the weighted average exercise price of the underlying stock options, multiplied by the number of options outstanding and/or exercisable. Shares are distributed from the Company’s authorized but unissued reserve and if available, treasury stock, upon the exercise of stock options.
- 75 -
INTEGER HOLDINGS CORPORATION
NOTES TO CONSOLIDATED FINANCIAL STATEMENTS
(10.) STOCK-BASED COMPENSATION (Continued)
The following table provides certain information relating to the exercise of stock options during fiscal years 2020, 2019 and 2018 (in thousands):
| 2020 | 2019 | 2018 | |||||||||||||||
| Intrinsic value | $ | $ | $ | ||||||||||||||
| Cash received | |||||||||||||||||
Restricted Stock Units
The following table summarizes time-vested RSU activity during the fiscal year ended December 31, 2020:
| Time-Vested Activity | Weighted Average Grant Date Fair Value | ||||||||||
| Nonvested at December 31, 2019 | $ | ||||||||||
| Granted | |||||||||||
| Vested | ( | ||||||||||
| Forfeited | ( | ||||||||||
| Nonvested at December 31, 2020 | $ | ||||||||||
As of December 31, 2020, there was $10.8 million of total unrecognized compensation cost related to time-based RSAs and RSUs, which is expected to be recognized over a weighted-average period of approximately 1.8 years. The fair value of RSA and RSU shares vested in 2020, 2019 and 2018 was $9.9 million, $2.4 million and $9.7 million, respectively. The weighted average grant date fair value of RSAs and RSUs granted during fiscal years 2020, 2019 and 2018 was $83.94 , $82.31 and $52.14 , respectively.
The following table summarizes PRSU activity during the fiscal year ended December 31, 2020:
| Performance- Vested Activity | Weighted Average Grant Date Fair Value | ||||||||||
| Nonvested at December 31, 2019 | $ | ||||||||||
| Granted | |||||||||||
| Vested | ( | ||||||||||
| Forfeited | ( | ||||||||||
| Nonvested at December 31, 2020 | $ | ||||||||||
For the Company’s PRSUs, in addition to service conditions, the ultimate number of shares earned depends on the achievement of financial performance or market-based conditions. The financial performance condition is based on the Company’s sales targets. The market conditions are based on the Company’s achievement of a relative total shareholder return (“TSR”) performance requirement, on a percentile basis, compared to a defined group of peer companies over year performance periods.
At December 31, 2020, there was $4.9 million of total unrecognized compensation cost related to unvested PRSUs, which is expected to be recognized over a weighted-average period of approximately 1.7 years. The fair value of PRSU shares vested in 2020, 2019 and 2018 was $2.9 million, $6.7 million and $9.1 million, respectively. The weighted average grant date fair value of PRSUs granted during fiscal years 2020, 2019 and 2018 was $95.06 , $101.17 and $45.37 , respectively.
- 76 -
INTEGER HOLDINGS CORPORATION
NOTES TO CONSOLIDATED FINANCIAL STATEMENTS
(10.) STOCK-BASED COMPENSATION (Continued)
The grant-date fair value of the market-based portion of the PRSUs granted during fiscal year 2020, 2019 and 2018 was determined using the Monte Carlo valuation model on the date of grant. The weighted average fair value and assumptions used to value the TSR portion of the PRSUs granted are as follows:
| 2020 | 2019 | 2018 | |||||||||||||||
| Weighted average fair value | $ | $ | $ | ||||||||||||||
| Risk-free interest rate | % | % | % | ||||||||||||||
| Expected volatility | % | % | % | ||||||||||||||
| Expected life (in years) | |||||||||||||||||
| Expected dividend yield | % | % | % | ||||||||||||||
(11.) OTHER OPERATING EXPENSES
The Company continuously evaluates the business and identifies opportunities to realign its resources to better serve its customers and markets, improve operational efficiency and capabilities, and lower its operating costs. To realize the benefits associated with these opportunities, the Company undertakes restructuring-type activities to transform its business. In addition, from time to time, the Company incurs cost associated with acquiring and integrating businesses and certain other general expenses, including asset impairments. The Company classifies costs associated with these items as OOE.
The following tables summarize OOE by program in each of the preceding three years (in thousands):
| 2020 | 2019 | 2018 | |||||||||||||||
| Operational excellence initiatives | $ | $ | $ | ||||||||||||||
| Strategic reorganization and alignment | |||||||||||||||||
| Manufacturing alignment to support growth | |||||||||||||||||
| Consolidation and optimization initiatives | |||||||||||||||||
| Acquisition and integration costs (adjustments) | ( | ||||||||||||||||
| Other general expenses | |||||||||||||||||
| Total other operating expenses | $ | $ | $ | ||||||||||||||
Operational excellence initiatives
2020 Initiatives
The Company’s 2020 initiatives mainly consist of costs associated with executing on its sales force, manufacturing, business process and performance excellence operational strategic imperatives. These projects focus on changing the Company’s organizational structure to match product line growth strategies and customer needs, transitioning its manufacturing process into a competitive advantage and standardizing and optimizing its business processes. Costs related to the Company’s 2020 initiatives are primarily recorded within the Medical segment and mainly include termination benefits. As of December 31, 2020, total restructuring and related charges incurred since inception was $2.8 million. These actions were substantially complete at the end of 2020.
Strategic reorganization and alignment
As a result of the strategic review of its customers, competitors and markets, the Company began taking steps in 2017 to better align its resources to enhance the profitability of its portfolio of products. These initiatives primarily included aligning resources with the Company’s strategic direction, improving profitability to invest in accelerated growth and the expansion of a facility. Costs related to these initiatives were primarily recorded within the Medical segment and mainly included termination benefits and fees for professional services. As of December 31, 2020, total restructuring and related charges incurred since inception, including amounts reported in discontinued operations, was $23.0 million. These actions were completed during 2020.
- 77 -
INTEGER HOLDINGS CORPORATION
NOTES TO CONSOLIDATED FINANCIAL STATEMENTS
(11.) OTHER OPERATING EXPENSES (Continued)
Manufacturing alignment to support growth
In 2017, the Company commenced several initiatives designed to reduce costs, increase manufacturing capacity to accommodate growth and improve operating efficiencies. The plan involved the relocation of certain manufacturing operations and expansion of certain of the Company’s facilities. Costs related to the Company’s manufacturing alignment to support growth initiative were primarily recorded within the Medical segment. As of December 31, 2020, total restructuring and related charges incurred for this initiative since inception was $5.8 million. These actions were completed during 2020.
Consolidation and optimization initiatives
Costs related to the Company’s consolidation and optimization initiatives were primarily recorded within the Medical segment. The Company does not expect to incur any material additional costs associated with these activities.
The following table summarizes the change in accrued liabilities, presented within Accrued expenses and other current liabilities on the Consolidated Balance Sheets, related to the initiatives described above (in thousands):
Operational excellence initiatives | Strategic reorganization and alignment | Manufacturing alignment to support growth | Total | ||||||||||||||||||||
| December 31, 2019 | $ | $ | $ | $ | |||||||||||||||||||
| Charges incurred, net of reversals | |||||||||||||||||||||||
| Cash payments | ( | ( | ( | ( | |||||||||||||||||||
| December 31, 2020 | $ | $ | $ | $ | |||||||||||||||||||
Acquisition and integration costs
During 2020, acquisition and integration costs included $1.2 million of expenses primarily related to the acquisition of certain assets and liabilities of InoMec, and a $2.0 million adjustment to reduce the fair value of acquisition-related contingent consideration liability associated with the Company’s acquisition of USB. During 2019, acquisition and integration costs primarily related to direct acquisition costs incurred in connection with the acquisition of USB. Acquisition and integration costs primarily consist of professional fees and other costs. See Note 17 “Financial Instruments and Fair Value Measurements” for additional information related to the fair value measurement of the contingent consideration.
Other general expenses
During 2020, 2019 and 2018, the Company recorded expenses related to other initiatives not described above, which relate primarily to actions taken to align labor with reduced customer demand as a result of COVID-19 and the decline of the energy market, integration and operational initiatives to reduce future costs and improve efficiencies. The 2020 and 2019 amounts primarily include severance, information technology systems conversion expenses, expenses incurred in connection with a customer filing Chapter 11 bankruptcy, and expenses related to the restructuring of certain legal entities of the Company.
- 78 -
INTEGER HOLDINGS CORPORATION
NOTES TO CONSOLIDATED FINANCIAL STATEMENTS
(12.) INCOME TAXES
Income from continuing operations before taxes for fiscal years 2020, 2019 and 2018 consisted of the following (in thousands):
| 2020 | 2019 | 2018 | |||||||||||||||
| U.S. | $ | $ | $ | ( | |||||||||||||
| International | |||||||||||||||||
| Total income from continuing operations before taxes | $ | $ | $ | ||||||||||||||
The provision for income taxes from continuing operations for fiscal years 2020, 2019 and 2018 comprises the following (in thousands):
| 2020 | 2019 | 2018 | |||||||||||||||
| Current: | |||||||||||||||||
| Federal | $ | $ | $ | ||||||||||||||
| State | |||||||||||||||||
| International | |||||||||||||||||
| Deferred: | |||||||||||||||||
| Federal | ( | ( | |||||||||||||||
| State | ( | ||||||||||||||||
| International | ( | ( | ( | ||||||||||||||
| ( | ( | ||||||||||||||||
| Total provision for income taxes | $ | $ | $ | ||||||||||||||
The provision for income taxes from continuing operations differs from the U.S. statutory rate for fiscal years 2020, 2019 and 2018 due to the following:
| 2020 | 2019 | 2018 | ||||||||||||||||||||||||
| Statutory rate | $ | % | $ | % | $ | % | ||||||||||||||||||||
| Federal tax credits (including R&D) | ( | ( | ( | ( | ( | ( | ||||||||||||||||||||
| Foreign rate differential | ( | ( | ( | ( | ( | ( | ||||||||||||||||||||
| Stock-based compensation | ( | ( | ( | ( | ( | ( | ||||||||||||||||||||
| Uncertain tax positions | ( | ( | ||||||||||||||||||||||||
| State taxes, net of federal benefit | ||||||||||||||||||||||||||
| U.S. tax on foreign earnings, net of §250 deduction | ||||||||||||||||||||||||||
| Valuation allowance | ( | ( | ( | ( | ( | ( | ||||||||||||||||||||
| Other | ||||||||||||||||||||||||||
| Effective tax rate | $ | % | $ | % | $ | % | ||||||||||||||||||||
The difference between the Company’s effective tax rate and the U.S. federal statutory income tax rate in the current year is primarily attributable to the availability of Foreign Tax Credits, R&D Credits, the impact of the Company’s earnings realized in foreign jurisdictions with statutory rates that are different than the U.S. federal statutory rate, and the provision for Global Intangible Low Taxed income (“GILTI”), net of the statutory deduction of 50% of the GILTI inclusion and the Foreign Derived Intangible Income (“FDII”) deduction (collectively “Section 250 deduction”). In 2018, the Section 250 deduction associated with GILTI and FDII, were subject to limitations based on U.S. taxable income. The Company’s foreign earnings are primarily derived from Switzerland, Mexico, Uruguay, and Ireland. The Company currently has a tax holiday in Malaysia through April 2023 provided certain conditions continue to be met.
- 79 -
INTEGER HOLDINGS CORPORATION
NOTES TO CONSOLIDATED FINANCIAL STATEMENTS
(12.) INCOME TAXES (Continued)
Difference Attributable to Foreign Investment: Certain foreign subsidiary earnings are subject to U.S. taxation under the Tax Cuts and Jobs Act of 2017 (the “Tax Reform Act”) . The Company intends to permanently reinvest substantially all of our foreign subsidiary earnings, as well as our capital in our foreign subsidiaries, with the exception of planned distributions made out of current year earnings and profits (“E&P”) and E&P previously taxed as of and for the year ended December 29, 2017, including E&P subject to the toll charge under the Tax Reform Act. The Company accrues for withholding taxes on distributions in the year associated with earnings that are intended to be distributed.
The net deferred tax liability consists of the following (in thousands):
| December 31, 2020 | December 31, 2019 | ||||||||||
| Tax credit carryforwards | $ | $ | |||||||||
| Inventories | |||||||||||
| Net operating loss carryforwards | |||||||||||
| Operating lease liabilities | |||||||||||
| Stock-based compensation | |||||||||||
| Accrued expenses | |||||||||||
| Gross deferred tax assets | |||||||||||
| Less valuation allowance | ( | ( | |||||||||
| Net deferred tax assets | |||||||||||
| Property, plant and equipment | ( | ( | |||||||||
| Intangible assets | ( | ( | |||||||||
| Operating lease assets | ( | ( | |||||||||
| Other | ( | ( | |||||||||
| Gross deferred tax liabilities | ( | ( | |||||||||
| Net deferred tax liability | $ | ( | $ | ( | |||||||
| Presented as follows: | |||||||||||
| Noncurrent deferred tax asset | $ | $ | |||||||||
| Noncurrent deferred tax liability | ( | ( | |||||||||
| Net deferred tax liability | $ | ( | $ | ( | |||||||
As of December 31, 2020, the Company has the following carryforwards available:
| Jurisdiction | Tax Attribute | Amount (in millions) | Begin to Expire | |||||||||||||||||
| U.S. State | Net operating losses(1) | $ | 2021 | |||||||||||||||||
| International | Net operating losses(1) | 2022 | ||||||||||||||||||
| U.S. Federal | Foreign tax credits | 2021 | ||||||||||||||||||
| U.S. Federal and State | R&D tax credits | 2021 | ||||||||||||||||||
| U.S. State | State tax credits | 2021 | ||||||||||||||||||
__________
(1) Net operating losses (“NOLs”) are presented as pre-tax amounts.
- 80 -
INTEGER HOLDINGS CORPORATION
NOTES TO CONSOLIDATED FINANCIAL STATEMENTS
(12.) INCOME TAXES (Continued)
In assessing the realizability of deferred tax assets, management considers, within each taxing jurisdiction, whether it is more likely than not that some portion or all of the deferred tax assets will not be realized. Management considers the scheduled reversal of deferred tax liabilities, projected future taxable income and tax planning strategies in making this assessment. Based on the consideration of the weight of both positive and negative evidence, management has determined it is more likely than not that a portion of the deferred tax assets as of December 31, 2020 and December 31, 2019 related to certain foreign tax credits, state investment tax credits, and foreign and state net operating losses will not be realized.
The Company files annual income tax returns in the U.S., various state and local jurisdictions, and in various foreign jurisdictions. A number of years may elapse before an uncertain tax position, for which the Company has unrecognized tax benefits, is examined and finally settled. While it is often difficult to predict the final outcome or the timing of resolution of any particular uncertain tax position, the Company believes that its unrecognized tax benefits reflect the most probable outcome. The Company adjusts these unrecognized tax benefits, as well as the related interest, in light of changing facts and circumstances. The resolution of an uncertain tax position, if recognized, would be recorded as an adjustment to the provision for income taxes and the effective tax rate in the period of resolution.
Below is a summary of changes to the unrecognized tax benefit for fiscal years 2020, 2019 and 2018 (in thousands):
| 2020 | 2019 | 2018(1) | |||||||||||||||
| Balance, beginning of year | $ | $ | $ | ||||||||||||||
| Additions based upon tax positions related to the current year | |||||||||||||||||
| Additions (reductions) related to prior period tax returns | ( | ( | |||||||||||||||
| Reductions relating to settlements with tax authorities | ( | ||||||||||||||||
| Reductions relating to divestiture | ( | ||||||||||||||||
| Balance, end of year | $ | $ | $ | ||||||||||||||
__________
(1)The amounts for 2018 reflect discontinued operations through the date of divestiture of the AS&O Product Line, which is reflected in the table as a reduction relating to divestiture.
The tax years that remain open and subject to tax audits vary depending on the tax jurisdiction. The Internal Revenue Service (“IRS”) is currently examining the U.S. subsidiaries of the Company for the taxable years 2017 - 2018 and the 2019 taxable year remains subject to examination by the IRS. The U.S. subsidiaries of the former Lake Region Medical, acquired by the Company in 2015, are still subject to U.S. federal, state, and local examinations for the taxable years 2006 to 2014.
It is reasonably possible that a reduction of approximately $3.4 million of the balance of unrecognized tax benefits may occur within the next twelve months as a result of the lapse of the statute of limitations and/or audit settlements. As of December 31, 2020, approximately $5.5 million of unrecognized tax benefits would favorably impact the effective tax rate (net of federal impact on state issues), if recognized.
The Company recognizes interest related to unrecognized tax benefits as a component of Provision for Income Taxes on the Consolidated Statements of Operations. During 2020, 2019 and 2018, the recorded amounts for interest and penalties, respectively, were not significant.
In response to the COVID-19 pandemic, many governments have enacted or are contemplating measures to provide aid and economic stimulus. These measures may include deferring the due dates of tax payments or other changes to their income and non-income-based tax laws. The Coronavirus Aid, Relief, and Economic Security Act (the “CARES Act”), which was enacted on March 27, 2020 in the U.S., includes measures to assist companies, including temporary changes to income and non-income-based tax laws. The CARES Act provides for deferred payment of the employer portion of social security taxes through the end of 2020, with 50% of the deferred amount due December 31, 2021 and the remaining 50% due December 31, 2022. As allowed under the CARES Act, the Company is deferring payment of the employer portion of Social Security taxes through the end of 2020. As of December 31, 2020, the Company had deferred a total of $9.7 million of payroll taxes during 2020, to be paid equally in the fourth quarters of 2021 and 2022. The deferred payroll taxes are included within Accrued expenses and other current liabilities and Other long-term liabilities on the Consolidated Balance Sheets.
- 81 -
INTEGER HOLDINGS CORPORATION
NOTES TO CONSOLIDATED FINANCIAL STATEMENTS
(13.) COMMITMENTS AND CONTINGENCIES
Contingent Consideration Arrangements
The Company records contingent consideration liabilities related to the earn-out provisions for certain acquisitions. See Note 17 “Financial Instruments and Fair Value Measurements” for additional information.
Litigation
The Company is subject to litigation arising from time to time in the ordinary course of its business. The Company does not expect that the ultimate resolution of any pending legal actions will have a material effect on its consolidated results of operations, financial position, or cash flows. However, litigation is subject to inherent uncertainties. As such, there can be no assurance that any pending legal action will not become material in the future.
The Company records a contingent gain for litigation when all of the following conditions have been met: (a) the amount to be paid to the Company is known, (b) there is no potential for appeal or reversal, and (c) collectability is reasonably assured.
In April 2013, the Company commenced an action against AVX Corporation and AVX Filters Corporation (collectively “AVX”) alleging that AVX had infringed on the Company’s patents by manufacturing and selling filtered feedthrough assemblies used in implantable pacemakers and cardioverter defibrillators that incorporate the Company’s patented technology. Following four trials and an appeal, the United States Court of Appeals for the Federal Circuit affirmed, in all respects, a judgment in favor of the Company. The Company received the payment of $28.9 million in October 2020, and after recognizing certain related expenses, recognized a net gain of $28.2 million.
Selling, general and administrative expenses
The net gain on patent litigation of $28.2 million is recorded in Selling, general and administrative expenses in the Company’s Consolidated Statements of Operations for the year ended December 31, 2020.
Environmental Matters
The Company acquired Lake Region Medical Holdings, Inc. (“LRM”) in 2015. At the direction of the New Jersey Department of Environmental Protection (“NJDEP”), LRM has been performing, and has agreed to fund approximately $0.3 million for, environmental investigations of a manufacturing facility LRM owned in South Plainfield, New Jersey from 1971 to 2004, and where it conducted operations from 1971 to 2007. NJDEP required LRM to perform and fund these environmental investigations due to concerns that prior investigations by LRM at the property were inadequate and because NJDEP concluded that the property was a source of local ground water contamination during LRM’s operations, including the Franklin Street Regional Groundwater Contamination Area, which has been designated as an immediate environmental concern by NJDEP. LRM disagrees with NJDEP’s conclusions but is cooperating with NJDEP and agreed to fund the environmental investigation currently being undertaken by NJDEP’s contractor at an anticipated cost of approximately $0.3 million. These environmental investigations may conclude that remediation of the property by LRM, and the reimbursement of costs and damages, including natural resource damages, associated with the groundwater immediate environmental concern, are necessary. Further, the current owner of the property claims to have been financially impacted by LRM’s inadequate environmental investigations. While the Company does not expect this environmental matter will have a material effect on its consolidated results of operations, financial position or cash flows, there can be no assurance that this environmental matter will not become material in the future. As of December 31, 2020, there was $0.3 million recorded in Accrued expenses and other current liabilities in the Consolidated Balance Sheets in connection with this environmental matter.
License Agreements
The Company is a party to various license agreements for technology that is utilized in certain of its products. The most significant of these agreements are the licenses for basic technology used in the production of wet tantalum capacitors, filtered feedthroughs and MRI compatible lead systems. Expenses related to license agreements were $1.2 million, $1.4 million, and $1.6 million, for 2020, 2019 and 2018, respectively, and are primarily included in Cost of Sales.
- 82 -
INTEGER HOLDINGS CORPORATION
NOTES TO CONSOLIDATED FINANCIAL STATEMENTS
(13.) COMMITMENTS AND CONTINGENCIES (Continued)
Product Warranties
The Company generally warrants that its products will meet customer specifications and will be free from defects in materials and workmanship. The change in product warranty liability for fiscal years 2020 and 2019 comprises the following (in thousands):
| 2020 | 2019 | ||||||||||
| Beginning balance | $ | $ | |||||||||
| Additions to warranty reserve, net of reversals | ( | ||||||||||
| Adjustments to pre-existing warranties | ( | ( | |||||||||
| Warranty claims settled | ( | ( | |||||||||
| Ending balance | $ | $ | |||||||||
Self-Insurance Liabilities
(14.) LEASES
The Company primarily leases certain office and manufacturing facilities under operating leases, with additional operating leases for machinery, office equipment and vehicles.
The components and classification of lease cost are as follows (in thousands):
| December 31, 2020 | December 31, 2019 | ||||||||||
| Operating lease cost | $ | $ | |||||||||
| Short-term lease cost (leases with initial term of 12 months or less) | |||||||||||
| Variable lease cost | |||||||||||
| Sublease income | ( | ( | |||||||||
| Total lease cost | $ | $ | |||||||||
| Cost of sales | $ | $ | |||||||||
| SG&A | |||||||||||
| RD&E | |||||||||||
| OOE | |||||||||||
| Total lease cost | $ | $ | |||||||||
The Company’s sublease income is derived primarily from certain real estate leases to several non-affiliated tenants under operating sublease arrangements. Operating lease expense for fiscal year 2018, under ASC 840, the predecessor to ASC 842, was $10.8 million.
- 83 -
INTEGER HOLDINGS CORPORATION
NOTES TO CONSOLIDATED FINANCIAL STATEMENTS
(14.) LEASES (Continued)
At December 31, 2020, the maturities of operating lease liabilities were as follows (in thousands):
| 2021 | |||||
| 2022 | |||||
| 2023 | |||||
| 2024 | |||||
| 2025 | |||||
| Thereafter | |||||
| Total lease payments | |||||
| Less imputed interest | ( | ||||
| Total | $ | ||||
As of December 31, 2020, the Company did not have any leases that have not yet commenced.
The following table presents the weighted average remaining lease term and discount rate.
| December 31, 2020 | December 31, 2019 | ||||||||||
| Weighted-average remaining lease term of operating leases (in years) | |||||||||||
| Weighted-average discount rate of operating leases | % | % | |||||||||
Supplemental cash flow information related to leases for fiscal years 2020 and 2019 is as follows (in thousands):
| 2020 | 2019 | ||||||||||
| Cash paid for amounts included in the measurement of operating lease liabilities | $ | $ | |||||||||
| ROU assets obtained in exchange for new operating lease liabilities | |||||||||||
During the fiscal year ended December 31, 2020, the Company extended the lease terms for five of its manufacturing facilities. As a result of these lease modifications, the Company re-measured the lease liability and adjusted the ROU asset on the modification dates.
- 84 -
(15.) EARNINGS PER SHARE
The following table sets forth a reconciliation of the information used in computing basic and diluted EPS for fiscal years 2020, 2019 and 2018 (in thousands, except per share amounts):
| 2020 | 2019 | 2018 | |||||||||||||||
| Numerator for basic and diluted EPS: | |||||||||||||||||
| Income from continuing operations | $ | $ | $ | ||||||||||||||
| Income from discontinued operations | |||||||||||||||||
| Net income | $ | $ | $ | ||||||||||||||
| Denominator for basic EPS: | |||||||||||||||||
| Weighted average shares outstanding | |||||||||||||||||
| Effect of dilutive securities: | |||||||||||||||||
| Stock options, restricted stock and restricted stock units | |||||||||||||||||
| Denominator for diluted EPS | |||||||||||||||||
| Basic earnings per share: | |||||||||||||||||
| Income from continuing operations | $ | $ | $ | ||||||||||||||
| Income from discontinued operations | |||||||||||||||||
| Basic earnings per share | |||||||||||||||||
| Diluted earnings per share: | |||||||||||||||||
| Income from continuing operations | $ | $ | $ | ||||||||||||||
| Income from discontinued operations | |||||||||||||||||
| Diluted earnings per share | |||||||||||||||||
The diluted weighted average share calculations do not include the following securities for fiscal years 2020, 2019 and 2018, which are not dilutive to the EPS calculations or the performance criteria have not been met (in thousands):
| 2020 | 2019 | 2018 | |||||||||||||||
| Time-vested stock options, restricted stock and restricted stock units | |||||||||||||||||
| Performance-vested restricted stock units | |||||||||||||||||
- 85 -
INTEGER HOLDINGS CORPORATION
NOTES TO CONSOLIDATED FINANCIAL STATEMENTS
(16.) STOCKHOLDERS’ EQUITY
Common Stock
The following table sets forth the changes in the number of shares of common stock for fiscal years 2020 and 2019:
| Issued | Treasury Stock | Outstanding | |||||||||||||||
| Shares outstanding at December 28, 2018 | ( | ||||||||||||||||
| Stock options exercised | |||||||||||||||||
| RSAs forfeitures and vesting of RSUs | ( | ||||||||||||||||
| Shares outstanding at December 31, 2019 | ( | ||||||||||||||||
| Stock options exercised | |||||||||||||||||
| Vesting of RSUs, net of shares withheld to cover taxes | |||||||||||||||||
| Shares outstanding at December 31, 2020 | |||||||||||||||||
Accumulated Other Comprehensive Income
Accumulated other comprehensive income comprises the following (in thousands):
| Defined Benefit Plan Liability | Cash Flow Hedges | Foreign Currency Translation Adjustment | Total Pre-Tax Amount | Tax | Net-of-Tax Amount | ||||||||||||||||||||||||||||||
| December 28, 2018 | $ | ( | $ | $ | $ | $ | ( | $ | |||||||||||||||||||||||||||
| Unrealized loss on cash flow hedges | — | ( | — | ( | ( | ||||||||||||||||||||||||||||||
| Realized gain on foreign currency hedges | — | ( | — | ( | ( | ||||||||||||||||||||||||||||||
| Realized gain on interest rate swap hedges | — | ( | — | ( | ( | ||||||||||||||||||||||||||||||
| Net defined benefit plan adjustments | ( | — | — | ( | ( | ||||||||||||||||||||||||||||||
| Foreign currency translation loss | — | — | ( | ( | ( | ||||||||||||||||||||||||||||||
| December 31, 2019 | $ | ( | $ | ( | $ | $ | $ | $ | |||||||||||||||||||||||||||
| Unrealized loss on cash flow hedges | — | ( | — | ( | ( | ||||||||||||||||||||||||||||||
| Realized loss on foreign currency hedges | — | — | ( | ||||||||||||||||||||||||||||||||
| Realized loss on interest rate swap hedges | — | — | ( | ||||||||||||||||||||||||||||||||
| Net defined benefit plan adjustments | ( | — | — | ( | ( | ||||||||||||||||||||||||||||||
| Foreign currency translation gain | — | — | 34,907 | ||||||||||||||||||||||||||||||||
| December 31, 2020 | $ | ( | $ | ( | $ | $ | $ | $ | |||||||||||||||||||||||||||
- 86 -
INTEGER HOLDINGS CORPORATION
NOTES TO CONSOLIDATED FINANCIAL STATEMENTS
(17.) FINANCIAL INSTRUMENTS AND FAIR VALUE MEASUREMENTS
Assets and Liabilities Measured at Fair Value on a Recurring Basis
Fair value measurement standards apply to certain financial assets and liabilities that are measured at fair value on a recurring basis (each reporting period). For the Company, these financial assets and liabilities include its derivative instruments and contingent consideration. The Company does not have any nonfinancial assets or liabilities that are measured at fair value on a recurring basis.
The Company is exposed to global market risks, including the effect of changes in interest rates and foreign currency exchange rates, and uses derivatives to manage these exposures that occur in the normal course of business. The Company does not hold or issue derivatives for trading or speculative purposes. All derivatives are recorded at fair value on the balance sheet.
The following tables provide information regarding assets and liabilities recorded at fair value on a recurring basis (in thousands):
| Fair Value | Quoted Prices in Active Markets (Level 1) | Significant Other Observable Inputs (Level 2) | Significant Unobservable Inputs (Level 3) | ||||||||||||||||||||
| December 31, 2020 | |||||||||||||||||||||||
| Assets: Foreign currency contracts | $ | $ | $ | $ | |||||||||||||||||||
| Liabilities: Interest rate swap | |||||||||||||||||||||||
| Liabilities: Contingent consideration | |||||||||||||||||||||||
| December 31, 2019 | |||||||||||||||||||||||
| Assets: Foreign currency contracts | $ | $ | $ | $ | |||||||||||||||||||
| Liabilities: Interest rate swaps | |||||||||||||||||||||||
| Liabilities: Contingent consideration | |||||||||||||||||||||||
Interest Rate Swaps
The Company periodically enters into interest rate swap agreements to reduce the cash flow risk caused by interest rate changes on its outstanding floating rate borrowings. Under these swap agreements, the Company pays a fixed rate of interest and receives a floating rate equal to one-month LIBOR. The variable rate received from the swap agreements and the variable rate paid on the outstanding debt will have the same rate of interest, excluding the credit spread, and will reset and pay interest on the same date. The Company has designated these swap agreements as cash flow hedges based on concluding the hedged forecasted transaction is probable of occurring within the period the cash flow hedge is anticipated to affect earnings.
The Company receives fair value estimates from the swap agreement counterparties. The fair value of the Company’s swap agreements are determined through the use of a cash flow model that utilizes observable market data inputs. These observable market data inputs include LIBOR, swap rates, and credit spread curves. The Company’s interest rate swap agreements are categorized in Level 2 of the fair value hierarchy. The estimated fair value of the swap agreements represents the amount the Company would receive (pay) to terminate the contracts.
Information regarding the Company’s outstanding interest rate swap designated as a cash flow hedge as of December 31, 2020 is as follows (dollars in thousands):
| Notional Amount | Start Date | End Date | Pay Fixed Rate | Receive Current Floating Rate | Fair Value | Balance Sheet Location | ||||||||||||||||||||||||||||||||
| $ | Jun 2020 | Jun 2023 | % | % | $ | ( | Other long-term liabilities | |||||||||||||||||||||||||||||||
- 87 -
INTEGER HOLDINGS CORPORATION
NOTES TO CONSOLIDATED FINANCIAL STATEMENTS
(17.) FINANCIAL INSTRUMENTS AND FAIR VALUE MEASUREMENTS (Continued)
Information regarding the Company’s outstanding interest rate swaps designated as cash flow hedges as of December 31, 2019 is as follows (dollars in thousands):
| Notional Amount | Start Date | End Date | Pay Fixed Rate | Receive Current Floating Rate | Fair Value | Balance Sheet Location | ||||||||||||||||||||||||||||||||
| $ | Jun 2017 | Jun 2020 | % | % | $ | Accrued expenses and other current liabilities | ||||||||||||||||||||||||||||||||
| Jul 2019 | Jul 2020 | ( | Accrued expenses and other current liabilities | |||||||||||||||||||||||||||||||||||
| Apr 2019 | Apr 2020 | ( | Accrued expenses and other current liabilities | |||||||||||||||||||||||||||||||||||
| Jun 2020 | Jun 2023 | (1) | ( | Other long-term liabilities | ||||||||||||||||||||||||||||||||||
__________
(1) The interest rate swap was not in effect until June 2020.
Foreign Currency Contracts
The Company periodically enters into foreign currency forward contracts to hedge its exposure to foreign currency exchange rate fluctuations in its international operations. The Company has designated these foreign currency forward contracts as cash flow hedges.
The Company receives fair value estimates from the foreign currency contract counterparties. The fair value of foreign currency contracts are determined through the use of cash flow models that utilize observable market data inputs to estimate fair value. These observable market data inputs include foreign exchange rate and credit spread curves. The Company’s foreign currency contracts are categorized in Level 2 of the fair value hierarchy. The fair value of the Company’s foreign currency contracts will be realized as Sales or Cost of Sales as the inventory, which the contracts are hedging, is sold.
Information regarding outstanding foreign currency forward contracts designated as cash flow hedges as of December 31, 2020 is as follows (dollars in thousands):
| Notional Amount | Start Date | End Date | $/Foreign Currency | Fair Value | Balance Sheet Location | |||||||||||||||||||||||||||||||||
| $ | Nov 2020 | Sep 2021 | Euro | $ | Prepaid expenses and other current assets | |||||||||||||||||||||||||||||||||
| Jan 2021 | Sep 2021 | MXN Peso | Prepaid expenses and other current assets | |||||||||||||||||||||||||||||||||||
| Jan 2021 | Mar 2021 | MXN Peso | Prepaid expenses and other current assets | |||||||||||||||||||||||||||||||||||
| Apr 2021 | Dec 2021 | MXN Peso | Prepaid expenses and other current assets | |||||||||||||||||||||||||||||||||||
| Jan 2021 | Aug 2021 | UYU Peso | Prepaid expenses and other current assets | |||||||||||||||||||||||||||||||||||
| Jan 2021 | Nov 2021 | UYU Peso | Prepaid expenses and other current assets | |||||||||||||||||||||||||||||||||||
Information regarding outstanding foreign currency forward contracts designated as cash flow hedges as of December 31, 2019 is as follows (dollars in thousands):
| Notional Amount | Start Date | End Date | $/Foreign Currency | Fair Value | Balance Sheet Location | |||||||||||||||||||||||||||||||||
| $ | Jan 2020 | Jun 2020 | Peso | $ | Prepaid expenses and other current assets | |||||||||||||||||||||||||||||||||
- 88 -
INTEGER HOLDINGS CORPORATION
NOTES TO CONSOLIDATED FINANCIAL STATEMENTS
(17.) FINANCIAL INSTRUMENTS AND FAIR VALUE MEASUREMENTS (Continued)
Derivative Instruments with Hedge Accounting Designation
The following table presents the impact of cash flow hedge derivative instruments on other comprehensive income (“OCI”), AOCI and the Company’s Consolidated Statement of Operations for fiscal years 2020, 2019 and 2018 (in thousands):
| Gain (Loss) Recognized in OCI | Gain (Loss) Reclassified from AOCI | |||||||||||||||||||||||||||||||||||||||||||
| Derivative | 2020 | 2019 | 2018 | Location in Statement of Operations | 2020 | 2019 | 2018 | |||||||||||||||||||||||||||||||||||||
| Interest rate swaps | $ | ( | $ | ( | $ | Interest expense | $ | ( | $ | $ | ||||||||||||||||||||||||||||||||||
| Foreign exchange contracts | ( | ( | Sales | ( | ( | |||||||||||||||||||||||||||||||||||||||
| Foreign exchange contracts | ( | Cost of sales | ( | |||||||||||||||||||||||||||||||||||||||||
| Foreign exchange contracts | Operating expenses | ( | ||||||||||||||||||||||||||||||||||||||||||
The Company expects to reclassify net losses totaling $1.3 million related to its cash flow hedges from AOCI into earnings during the next twelve months.
Contingent Consideration
The following table presents the changes in the estimated fair values of the Company’s liabilities for contingent consideration measured using significant unobservable inputs (Level 3) for fiscal years 2020 and 2019 (in thousands):
| December 28, 2018 | $ | ||||
Amount recorded for current year acquisitions | |||||
| December 31, 2019 | |||||
Amount recorded for current year acquisitions | |||||
| Fair value measurement adjustment | ( | ||||
Payments | ( | ||||
| December 31, 2020 | $ | ||||
The acquisition-related contingent consideration represents the estimated fair value of the Company’s obligations, under the asset purchase agreements, to make additional payments if certain revenue goals are met. The Company estimated the original fair value of the contingent consideration liabilities for the InoMec and USB acquisitions using a Monte Carlo valuation model to forecast the value of the potential future payment. For the February 19, 2020 InoMec acquisition, the Company estimated the original fair value of the contingent consideration to be $1.7 million. For the October 7, 2019 USB acquisition, the Company estimated the original fair value of the contingent consideration to be $4.2 million. See Note 2 “Business Acquisitions, Divestiture and Discontinued Operations” for additional information about these acquisitions.
As of December 31, 2020, the current portion of contingent consideration liabilities is $1.7 million and included in Accrued expenses and other current liabilities, and the non-current portion is $2.2 million and included in Other long-term liabilities on the Consolidated Balance Sheets. All contingent consideration liabilities were non-current and included in Other long-term liabilities as of December 31, 2019.
The following table provides quantitative information associated with the fair value measurement of the Company’s liabilities for contingent consideration:
| December 31, 2020 | ||||||||||||||||||||||||||||||||
| Contingency Type | Maximum Payout (undiscounted) | Fair Value | Valuation Technique | Unobservable Inputs | Weighted Average or Range | |||||||||||||||||||||||||||
| Revenue-based payments | $ | $ | Monte Carlo | Revenue volatility | % | |||||||||||||||||||||||||||
| Discount rate | % | |||||||||||||||||||||||||||||||
| Projected year(s) of payment | 2021-2024 | |||||||||||||||||||||||||||||||
- 89 -
INTEGER HOLDINGS CORPORATION
NOTES TO CONSOLIDATED FINANCIAL STATEMENTS
(17.) FINANCIAL INSTRUMENTS AND FAIR VALUE MEASUREMENTS (Continued)
| December 31, 2019 | ||||||||||||||||||||||||||||||||
| Contingency Type | Maximum Payout (undiscounted) | Fair Value | Valuation Technique | Unobservable Inputs | Weighted Average or Range | |||||||||||||||||||||||||||
| Revenue-based payments | $ | $ | Monte Carlo | Revenue volatility | % | |||||||||||||||||||||||||||
| Discount rate | % | |||||||||||||||||||||||||||||||
| Projected year(s) of payment | 2021-2024 | |||||||||||||||||||||||||||||||
During the first quarter of 2020, the Company acquired a set of similar identifiable intangible assets relating to a license to use technology within its Non-Medical segment. At the date of acquisition, the Company estimated the original fair value of the contingent consideration to be $1.0 million, which was paid during 2020 upon achievement of the applicable milestones.
Assets and Liabilities Measured at Fair Value on a Nonrecurring Basis
Fair value standards also apply to certain assets and liabilities that are measured at fair value on a nonrecurring basis. The carrying amounts of cash, accounts receivable, contract assets, accounts payable and accrued expenses approximate fair value due to the short-term nature of these items.
Borrowings under the Company’s Revolving Credit Facility, TLA Facility and TLB Facility accrue interest at a floating rate tied to a standard short-term borrowing index, selected at the Company’s option, plus an applicable margin. The carrying amount of this floating rate debt approximates fair value based upon the respective interest rates adjusting with market rate adjustments.
Equity Investments
Equity investments comprise the following (in thousands):
| December 31, 2020 | December 31, 2019 | ||||||||||||||||||||||
| Equity method investment | $ | $ | |||||||||||||||||||||
| Non-marketable equity securities | |||||||||||||||||||||||
Total equity investments | $ | $ | |||||||||||||||||||||
The components of (Gain) Loss on Equity Investments, Net for each period were as follows (in thousands):
| 2020 | 2019 | 2018 | |||||||||||||||||||||
| Equity method investment income | $ | ( | $ | ( | $ | ( | |||||||||||||||||
| Impairment charges | |||||||||||||||||||||||
Total (gain) loss on equity investments, net | $ | ( | $ | $ | ( | ||||||||||||||||||
During 2020 and 2019, the Company determined that certain non-marketable equity securities were impaired. In 2020, a new equity financing by one of the Company’s non-marketable equity securities indicated a new value for the investment. During the fourth quarter of 2020, the Company recorded an impairment charge of $0.4 million to reduce the carrying value of this non-marketable equity security to its estimated fair value of $2.2 million. The fair value of this investment was derived from observable price changes of similar securities of the investee. In 2019, the Company determined the fair value for one of its non-marketable equity securities to be zero based upon available market information. This assessment was based on qualitative indications of impairment. Factors that significantly influenced the determination of the impairment loss included the equity security’s investee’s financial condition, priority claims to the equity security, distributions rights and preferences, and status of the regulatory approval required to bring its product to market.
The Company’s equity method investment is in a Chinese venture capital fund focused on investing in life sciences companies. As of December 31, 2020, the Company owned 6.5 % of this fund.
Pension Plan Assets
The fair value of the Company’s pension plan assets are determined based upon quoted market prices in inactive markets or valuation models with observable market data inputs to estimate fair value. These observable market data inputs include benchmark yields, reported trades, broker/dealer quotes, issuer spreads, benchmark securities, bids, offers and reference data. The Company’s pension plan assets are categorized in Level 2 of the fair value hierarchy.
- 90 -
INTEGER HOLDINGS CORPORATION
NOTES TO CONSOLIDATED FINANCIAL STATEMENTS
(18.) SEGMENT AND GEOGRAPHIC INFORMATION
The Company organizes its business into two reportable segments: (1) Medical and (2) Non-Medical. This segment structure reflects the financial information and reports used by the Company’s management, specifically its Chief Operating Decision Maker, to make decisions regarding the Company’s business, including resource allocations and performance assessments. This segment structure reflects the Company’s current operating focus in compliance with ASC 280, Segment Reporting.
The Company defines segment income from operations as sales less cost of sales including amortization and expenses attributable to segment-specific selling, general, administrative, research, development, engineering and other operating activities. The remaining unallocated operating and other expenses are primarily administrative corporate headquarter expenses and capital costs that are not allocated to reportable segments. Transactions between the two segments are not significant.
The following table presents sales by product line for fiscal years 2020, 2019 and 2018 (in thousands).
| 2020 | 2019 | 2018 | |||||||||||||||
| Segment sales by product line: | |||||||||||||||||
| Medical | |||||||||||||||||
| Cardio & Vascular | $ | $ | $ | ||||||||||||||
| Cardiac & Neuromodulation | |||||||||||||||||
| Advanced Surgical, Orthopedics & Portable Medical | |||||||||||||||||
| Total Medical | |||||||||||||||||
| Non-Medical | |||||||||||||||||
| Total sales | $ | $ | $ | ||||||||||||||
Geographic Area Information
The following table presents sales by significant country for fiscal years 2020, 2019 and 2018. In these tables, sales are allocated based on where the products are shipped (in thousands).
| 2020 | 2019 | 2018 | |||||||||||||||
| Sales by geographic area: | |||||||||||||||||
| United States | $ | $ | $ | ||||||||||||||
| Non-Domestic locations: | |||||||||||||||||
| Puerto Rico | |||||||||||||||||
| Costa Rica | |||||||||||||||||
| Rest of world | |||||||||||||||||
| Total sales | $ | $ | $ | ||||||||||||||
The following table presents revenues by significant customers, which are defined as any customer who individually represents 10% or more of a segment’s total revenues for fiscal years 2020 and 2019.
| 2020 | 2019 | |||||||||||||||||||||||||
| Customer | Medical | Non-Medical | Medical | Non-Medical | ||||||||||||||||||||||
| Customer A | * | * | ||||||||||||||||||||||||
| Customer B | * | * | ||||||||||||||||||||||||
| Customer C | * | * | ||||||||||||||||||||||||
| Customer D | * | * | ||||||||||||||||||||||||
| Customer E | * | * | * | |||||||||||||||||||||||
| All other customers | ||||||||||||||||||||||||||
__________
* Less than 10% of segment’s total revenues for the period.
- 91 -
INTEGER HOLDINGS CORPORATION
NOTES TO CONSOLIDATED FINANCIAL STATEMENTS
(18.) SEGMENT AND GEOGRAPHIC INFORMATION (Continued)
The following table presents revenues by significant ship to location, which is defined as any country where 10% or more of a segment’s total revenues are shipped for fiscal years 2020 and 2019.
| 2020 | 2019 | |||||||||||||||||||||||||
| Ship to Location | Medical | Non-Medical | Medical | Non-Medical | ||||||||||||||||||||||
| United States | ||||||||||||||||||||||||||
| Puerto Rico | * | * | * | |||||||||||||||||||||||
| Canada | * | * | * | |||||||||||||||||||||||
| Rest of world | ||||||||||||||||||||||||||
__________
* Less than 10% of segment’s total revenues for the period.
The following table presents income from continuing operations for the Company’s reportable segments for fiscal years 2020, 2019 and 2018 (in thousands).
| 2020 | 2019 | 2018 | |||||||||||||||
| Segment income from continuing operations: | |||||||||||||||||
| Medical | $ | $ | $ | ||||||||||||||
| Non-Medical | |||||||||||||||||
| Total segment income from continuing operations | |||||||||||||||||
| Unallocated operating expenses | ( | ( | ( | ||||||||||||||
| Operating income | |||||||||||||||||
| Unallocated expenses, net | ( | ( | ( | ||||||||||||||
| Income from continuing operations before taxes | $ | $ | $ | ||||||||||||||
The following table presents depreciation and amortization expense for the Company’s reportable segments for fiscal years 2020, 2019 and 2018 (in thousands).
| 2020 | 2019 | 2018 | |||||||||||||||
| Segment depreciation and amortization: | |||||||||||||||||
| Medical | $ | $ | $ | ||||||||||||||
| Non-Medical | |||||||||||||||||
Total depreciation and amortization included in segment income from continuing operations | |||||||||||||||||
| Unallocated depreciation and amortization | |||||||||||||||||
| Total depreciation and amortization | $ | $ | $ | ||||||||||||||
The following table presents total assets for the Company’s reportable segments as of December 31, 2020 and December 31, 2019 (in thousands).
| December 31, 2020 | December 31, 2019 | ||||||||||
| Identifiable assets: | |||||||||||
| Medical | $ | $ | |||||||||
| Non-Medical | |||||||||||
| Total reportable segments | |||||||||||
| Unallocated assets | |||||||||||
| Total assets | $ | $ | |||||||||
- 92 -
INTEGER HOLDINGS CORPORATION
NOTES TO CONSOLIDATED FINANCIAL STATEMENTS
(18.) SEGMENT AND GEOGRAPHIC INFORMATION (Continued)
The following table presents capital expenditures for the Company’s reportable segments for fiscal years 2020, 2019 and 2018 (in thousands).
| 2020 | 2019 | 2018 | |||||||||||||||
| Expenditures for tangible long-lived assets: | |||||||||||||||||
| Medical | $ | $ | $ | ||||||||||||||
| Non-Medical | |||||||||||||||||
| Total reportable segments | |||||||||||||||||
| Unallocated long-lived tangible assets | |||||||||||||||||
| Total expenditures | $ | $ | $ | ||||||||||||||
The following table presents PP&E by geographic area as of December 31, 2020 and December 31, 2019. In these tables, PP&E is aggregated based on the physical location of the tangible long-lived assets (in thousands).
| December 31, 2020 | December 31, 2019 | ||||||||||
| Long-lived tangible assets by geographic area: | |||||||||||
| United States | $ | $ | |||||||||
| Mexico | |||||||||||
| Ireland | |||||||||||
| Rest of world | |||||||||||
| Total | $ | $ | |||||||||
(19.) REVENUE FROM CONTRACTS WITH CUSTOMERS
Disaggregated Revenue
In general, the Company’s business segmentation is aligned according to the nature and economic characteristics of its products and customer relationships and provides meaningful disaggregation of each business segment's results of operations. For a summary by disaggregated product line sales for each segment, refer to Note 18, “Segment and Geographic Information.”
A significant portion of the Company’s sales for fiscal years 2020, 2019 and 2018 and accounts receivable at December 31, 2020 and December 31, 2019 were to three customers as follows:
| Sales | Accounts Receivable | ||||||||||||||||||||||||||||
| 2020 | 2019 | 2018 | December 31, 2020 | December 31, 2019 | |||||||||||||||||||||||||
| Customer A | |||||||||||||||||||||||||||||
| Customer B | |||||||||||||||||||||||||||||
| Customer C | |||||||||||||||||||||||||||||
Revenue recognized from products and services transferred to customers over time during fiscal years 2020 and 2019 represented 29 % and 12 %, respectively, of total revenue. The Company did not have any significant revenue related to contracts recognized over time for fiscal year 2018. Substantially all of the revenue recognized from products and services transferred to customers over time during fiscal years 2020 and 2019 was within the Medical segment.
- 93 -
INTEGER HOLDINGS CORPORATION
NOTES TO CONSOLIDATED FINANCIAL STATEMENTS
(19.) REVENUE FROM CONTRACTS WITH CUSTOMERS (Continued)
Contract Balances
The opening and closing balances of the Company’s contract assets and contract liabilities are as follows (in thousands):
| December 31, 2020 | December 31, 2019 | ||||||||||
| Contract assets | $ | $ | |||||||||
| Contract liabilities | |||||||||||
Contract assets at December 31, 2020, increased $15.5 million from December 31, 2019, due to a new contract with an existing customer where control is transferred over time. During the fiscal year ended December 31, 2020, the Company recognized $1.3 million of revenue that was included in the contract liability balance as of December 31, 2019. During the fiscal year ended December 31, 2019, the Company recognized $1.4 million of revenue that was included in the contract liability balance as of December 28, 2018.
(20.) QUARTERLY SALES AND EARNINGS DATA—UNAUDITED
The Company’s first three fiscal quarters in each fiscal year end on the Friday nearest March 31, June 30 and September 30, respectively. The Company’s fourth fiscal quarter ends on December 31.
| (in thousands, except per share data) | Fourth Quarter | Third Quarter | Second Quarter | First Quarter | |||||||||||||||||||||||||||||||
| Fiscal Year 2020 | |||||||||||||||||||||||||||||||||||
| Sales | $ | (1) | $ | (1) | $ | (1) | $ | ||||||||||||||||||||||||||||
| Gross profit | |||||||||||||||||||||||||||||||||||
| Income from continuing operations | (2) | ||||||||||||||||||||||||||||||||||
| EPS—basic | (2) | ||||||||||||||||||||||||||||||||||
| EPS—diluted | (2) | ||||||||||||||||||||||||||||||||||
| Fiscal Year 2019 | |||||||||||||||||||||||||||||||||||
| Sales | $ | $ | $ | $ | |||||||||||||||||||||||||||||||
| Gross profit | (3) | ||||||||||||||||||||||||||||||||||
| Income from continuing operations | (3) | ||||||||||||||||||||||||||||||||||
| EPS—basic | |||||||||||||||||||||||||||||||||||
| EPS—diluted | |||||||||||||||||||||||||||||||||||
__________
(1)Primarily beginning in the second quarter of 2020, sales were were negatively impacted by the COVID-19 pandemic and a severe decline in the energy market.
(2)The third quarter of 2020 includes a pre-tax net gain of $28.2 million, resulting in an after-tax impact of $0.67 per basic and diluted share from a patent litigation judgment affirmed by the United States Court of Appeals in the Company’s favor. See Note 13 “Commitments and Contingencies” for additional information.
(3)In the fourth quarter of 2019, the Company recorded pre-tax charges and other expenses of $24 million related to the bankruptcy filing of a customer. These charges were included in cost of sales ($21 million) and operating expenses ($3 million).
- 94 -
ITEM 9. CHANGES IN AND DISAGREEMENTS WITH ACCOUNTANTS ON ACCOUNTING AND
FINANCIAL DISCLOSURE
None.
ITEM 9A. CONTROLS AND PROCEDURES
Management’s Report on Internal Control Over Financial Reporting appears in Part II, Item 8, “Financial Statements and Supplementary Data” of this report and is incorporated into this Item 9A by reference.
a.Evaluation of Disclosure Controls and Procedures
Our management, including the principal executive officer and principal financial officer, evaluated our disclosure controls and procedures (as defined in Rules 13a-15(e) and 15d-15(e) under the Securities Exchange Act of 1934) related to the recording, processing, summarization and reporting of information in our reports that we file with the SEC as of December 31, 2020. These disclosure controls and procedures have been designed to provide reasonable assurance that material information relating to us, including our subsidiaries, is made known to our management, including these officers, by our employees, and that this information is recorded, processed, summarized, evaluated and reported, as applicable, within the time periods specified in the SEC’s rules and forms. Based on their evaluation, as of December 31, 2020, our principal executive officer and principal financial officer have concluded that our disclosure controls and procedures are effective.
b. Changes in Internal Control Over Financial Reporting
There were no changes in our internal control over financial reporting during our last fiscal quarter to which this Annual Report on Form 10-K relates that have materially affected, or are reasonably likely to materially affect, internal control over financial reporting.
ITEM 9B. OTHER INFORMATION
None.
- 95 -
PART III
ITEM 10. DIRECTORS, EXECUTIVE OFFICERS AND CORPORATE GOVERNANCE
Information regarding the Company’s directors appearing under the caption “Election of Directors” in the Company’s Proxy Statement for its 2021 Annual Meeting of Stockholders is incorporated herein by reference.
Information regarding the Company’s executive officers is presented under the caption “Information About our Executive Officers” in Part I of this Annual Report on Form 10-K.
The other information required by Item 10 is incorporated herein by reference from the Company’s Proxy Statement for its 2021 Annual Meeting of Stockholders.
ITEM 11. EXECUTIVE COMPENSATION
Information regarding executive compensation appearing under the captions “Compensation Discussion and Analysis”, “Executive Compensation” and “Compensation Committee Interlocks and Insider Participation” in the Company’s Proxy Statement for the 2021 Annual Meeting of Stockholders is incorporated herein by reference.
ITEM 12. SECURITY OWNERSHIP OF CERTAIN BENEFICIAL OWNERS AND MANAGEMENT AND
RELATED STOCKHOLDER MATTERS
Information regarding security ownership of certain beneficial owners and management and related stockholder matters, including the table titled “Equity Compensation Plan Information” and under the caption “Stock Ownership by Directors and Executive Officers” in the Company’s Proxy Statement for the 2021 Annual Meeting of Stockholders is incorporated herein by reference.
ITEM 13. CERTAIN RELATIONSHIPS AND RELATED TRANSACTIONS, AND DIRECTOR INDEPENDENCE
Information regarding certain relationships and related transactions, and director independence under the captions “Related Person Transactions” and “Board Independence” in the Company’s Proxy Statement for the 2021 Annual Meeting of Stockholders is incorporated herein by reference.
ITEM 14. PRINCIPAL ACCOUNTING FEES AND SERVICES
Information regarding the fees paid to and services provided by Deloitte & Touche LLP, the Company’s independent registered public accounting firm under the caption “Ratification of the Appointment of Independent Registered Public Accounting Firm” in the Company’s Proxy Statement for the 2021 Annual Meeting of Stockholders is incorporated herein by reference.
- 96 -
PART IV
ITEM 15. EXHIBITS AND FINANCIAL STATEMENT SCHEDULES
(a) LIST OF DOCUMENTS FILED AS PART OF THIS REPORT
(1)Financial statements and financial statement schedules filed as part of this Annual Report on Form 10-K. Refer to Part II, Item 8. “Financial Statements and Supplementary Data.”
(2)The following financial statement schedule is included in this Annual Report on Form 10-K (in thousands):
Schedule II—Valuation and Qualifying Accounts
| Col. C—Additions | ||||||||||||||||||||||||||||||||
| Column A Description | Col. B Balance at Beginning of Period | Charged to Costs & Expenses | Charged to Other Accounts- Describe | Col. D Deductions - Describe | Col. E Balance at End of Period | |||||||||||||||||||||||||||
| December 31, 2020 | ||||||||||||||||||||||||||||||||
Provision for credit losses | $ | $ | (1) | $ | $ | ( | (4) | $ | ||||||||||||||||||||||||
| Valuation allowance for deferred tax assets | $ | $ | ( | (2) | $ | $ | ( | (2)(4)(5) | $ | |||||||||||||||||||||||
| December 31, 2019 | ||||||||||||||||||||||||||||||||
| Allowance for doubtful accounts | $ | $ | (1) | $ | (3) | $ | ( | (4) | $ | |||||||||||||||||||||||
| Valuation allowance for deferred tax assets | $ | $ | (2) | $ | $ | ( | (2)(4)(5) | $ | ||||||||||||||||||||||||
| December 28, 2018 | ||||||||||||||||||||||||||||||||
| Allowance for doubtful accounts | $ | $ | (1) | $ | ( | (3) | $ | ( | (4) | $ | ||||||||||||||||||||||
| Valuation allowance for deferred tax assets | $ | $ | $ | ( | (3) | $ | ( | (2)(4)(5) | $ | |||||||||||||||||||||||
(1)Valuation allowance recorded in the provision for credit losses (allowance for doubtful accounts in years prior to 2020). The 2019 amount includes a $2.3 million reserve recorded in connection with a customer bankruptcy, net of adjustments to the Company’s general and specific reserves.
(2)Valuation allowance recorded in the provision for income taxes for certain net operating losses and tax credits. The 2020 and 2019 deductions include releases of the allowance for net operating losses utilized during that year and the expiration of certain net operating losses, foreign and state tax credits. The decrease in 2018 includes the impact of the divestiture of the AS&O Product Line.
(3)Includes foreign currency translation effect.
(4)Accounts written off and reductions to allowances existing at the beginning of the year. The 2020 amount includes $2.3 million of accounts receivable recorded during 2019 in connection with a customer bankruptcy.
(5)Includes return to provision adjustments for prior years.
Schedules not listed above have been omitted because the information required to be set forth therein is not applicable or is shown in the financial statements or notes thereto.
(3)See exhibits listed under Part (b) below.
- 97 -
(b) EXHIBITS:
| EXHIBIT NUMBER | DESCRIPTION | |||||||
| 2.1 | ||||||||
| 2.2 | ||||||||
| 2.3 | ||||||||
| 3.1 | ||||||||
| 3.2 | ||||||||
| 4.1* | ||||||||
| 10.1 | ||||||||
| 10.2 | ||||||||
| 10.3 | ||||||||
| 10.4 | ||||||||
| 10.5 | ||||||||
| 10.6 | ||||||||
| 10.7 | ||||||||
| 10.8 | ||||||||
| 10.9# | ||||||||
| 10.10#* | ||||||||
| 10.11# | ||||||||
- 98 -
| EXHIBIT NUMBER | DESCRIPTION | |||||||
| 10.12# | ||||||||
| 10.13# | ||||||||
| 10.14# | ||||||||
| 10.15# | ||||||||
| 10.16# | ||||||||
| 10.17# | ||||||||
| 10.18# | ||||||||
| 10.19# | ||||||||
| 10.20# | ||||||||
| 10.21# | ||||||||
| 10.22# | ||||||||
| 10.23# | ||||||||
| 10.24# | ||||||||
| 10.25# | ||||||||
| 10.26# | ||||||||
| 10.27# | ||||||||
| 10.28# | ||||||||
| 10.29# | ||||||||
| 10.30# | ||||||||
| 10.31# | ||||||||
- 99 -
| EXHIBIT NUMBER | DESCRIPTION | |||||||
| 10.32# | ||||||||
| 10.33# | ||||||||
| 10.34# | ||||||||
| 10.35# | ||||||||
| 10.36# | ||||||||
| 10.37# | ||||||||
| 10.38#* | ||||||||
| 10.39#* | ||||||||
| 10.40#* | ||||||||
| 10.41#* | ||||||||
| 10.42# | ||||||||
| 10.43# | ||||||||
| 10.44# | ||||||||
| 10.45# | ||||||||
| 10.46# | ||||||||
| 10.47# | ||||||||
| 10.48# | ||||||||
| 10.49# | ||||||||
| 10.50#* | ||||||||
| 21.1* | ||||||||
- 100 -
| EXHIBIT NUMBER | DESCRIPTION | |||||||
| 23.1* | ||||||||
| 31.1* | ||||||||
| 31.2* | ||||||||
| 32.1** | ||||||||
| 101.INS* | XBRL Instance Document - the instance document does not appear in the Interactive Data File because its XBRL tags are embedded within the Inline XBRL document. | |||||||
| 101.SCH* | XRBL Taxonomy Extension Schema Document | |||||||
| 101.CAL* | XBRL Taxonomy Extension Calculation Linkbase Document | |||||||
| 101.LAB* | XBRL Taxonomy Extension Labels Linkbase Document | |||||||
| 101.PRE* | XBRL Taxonomy Extension Presentation Linkbase Document | |||||||
| 101.DEF* | XBRL Taxonomy Extension Definition Linkbase Document | |||||||
| 104 | Cover Page Interactive Data File (embedded within the Inline XBRL document and included in Exhibit 101) | |||||||
| * - | Filed herewith. | ||||
| ** - | Furnished herewith. | ||||
| # - | Indicates exhibits that are management contracts or compensation plans or arrangements required to be filed pursuant to Item 15(b) of Form 10-K. | ||||
ITEM 16. FORM 10-K SUMMARY
None.
- 101 -
SIGNATURES
Pursuant to the requirements of Sections 13 or 15(d) of the Securities Exchange Act of 1934, the registrant has duly caused this report to be signed on its behalf by the undersigned, thereunto duly authorized.
| INTEGER HOLDINGS CORPORATION | |||||||||||
| Dated: | February 18, 2021 | By | /s/ Joseph W. Dziedzic | ||||||||
| Joseph W. Dziedzic (Principal Executive Officer) | |||||||||||
| President and Chief Executive Officer | |||||||||||
Pursuant to the requirements of the Securities Exchange Act of 1934, this report has been signed below by the following persons on behalf of the registrant and in the capacities and on the date indicated.
| Signature | Title | Date | ||||||||||||
| /s/ Joseph W. Dziedzic | President, Chief Executive Officer and Director | February 18, 2021 | ||||||||||||
| Joseph W. Dziedzic | (Principal Executive Officer) | |||||||||||||
| /s/ Jason K. Garland | Executive Vice President and Chief Financial Officer | February 18, 2021 | ||||||||||||
| Jason K. Garland | (Principal Financial Officer) | |||||||||||||
| /s/ Tom P. Thomas | Vice President, Corporate Controller | February 18, 2021 | ||||||||||||
| Tom P. Thomas | (Principal Accounting Officer) | |||||||||||||
| /s/ Bill R. Sanford | Chairman | February 18, 2021 | ||||||||||||
| Bill R. Sanford | ||||||||||||||
| /s/ Pamela G. Bailey | Director | February 18, 2021 | ||||||||||||
| Pamela G. Bailey | ||||||||||||||
| /s/ James F. Hinrichs | Director | February 18, 2021 | ||||||||||||
| James F. Hinrichs | ||||||||||||||
| /s/ Jean M. Hobby | Director | February 18, 2021 | ||||||||||||
| Jean M. Hobby | ||||||||||||||
| /s/ M. Craig Maxwell | Director | February 18, 2021 | ||||||||||||
| M. Craig Maxwell | ||||||||||||||
| /s/ Filippo Passerini | Director | February 18, 2021 | ||||||||||||
| Filippo Passerini | ||||||||||||||
| /s/ Donald J. Spence | Director | February 18, 2021 | ||||||||||||
| Donald J. Spence | ||||||||||||||
| /s/ William B. Summers, Jr. | Director | February 18, 2021 | ||||||||||||
| William B. Summers, Jr. | ||||||||||||||
- 102 -
Serious News for Serious Traders! Try StreetInsider.com Premium Free!
You May Also Be Interested In
- BofA Securities Upgrades Integer Holding (ITGR) to Buy, 'Bullish on PFA opportunity'
- RE Royalties Publishes Green Bond Framework and Report, Assessed as Dark Green, and Announces Investor Appreciation Day
- Federal Court Rules CVS Acted With "Deliberate Indifference" When It Adopted Rx Program That Discriminates Against People Living With HIV, Says Consumer Watchdog
Create E-mail Alert Related Categories
SEC FilingsSign up for StreetInsider Free!
Receive full access to all new and archived articles, unlimited portfolio tracking, e-mail alerts, custom newswires and RSS feeds - and more!
