

Form 10-K IRADIMED CORP For: Dec 31
 Tweet
Tweet Share
ShareUNITED STATES
SECURITIES AND EXCHANGE COMMISSION
WASHINGTON, D.C. 20549
FORM
ANNUAL REPORT PURSUANT TO SECTION 13 OR 15(d) OF THE SECURITIES EXCHANGE ACT OF 1934 |
FOR THE FISCAL YEAR ENDED
OR
TRANSITION REPORT PURSUANT TO SECTION 13 OR 15(d) OF THE SECURITIES EXCHANGE ACT OF 1934 |
FOR THE TRANSITION PERIOD FROM TO
COMMISSION FILE NO.
(Exact Name of Registrant As Specified In Its Charter)
| ||
(State or other jurisdiction of |
| (I.R.S. Employer |
|
|
|
| ||
(Address of principal executive offices) |
| (Zip Code) |
Registrant’s telephone number, including area code: (
SECURITIES REGISTERED PURSUANT TO SECTION 12(b) OF THE ACT:
Title of each class: |
| Trading Symbol |
| Name of each exchange on which registered: |
SECURITIES REGISTERED PURSUANT TO SECTION 12(g) OF THE ACT: None.
Indicate by check mark if the registrant is a well-known seasoned issuer, as defined in Rule 405 of the Securities Act. Yes ◻
Indicate by check mark if the registrant is not required to file reports pursuant to Section 13 or Section 15(d) of the Act. Yes ◻
Indicate by check mark whether the registrant (1) has filed all reports required to be filed by Section 13 or 15(d) of the Securities Exchange Act of 1934 during the preceding 12 months (or for such shorter period that the registrant was required to file such reports), and (2) has been subject to such filing requirements for the past 90 days.
Indicate by check mark whether the registrant has submitted electronically every Interactive Data File required to be submitted pursuant to Rule 405 of Regulation S-T (§ 232.405 of this chapter) during the preceding 12 months (or for such shorter period that the registrant was required to submit such files).
Indicate by check mark whether the registrant is a large accelerated filer, an accelerated filer, a non-accelerated filer, a smaller reporting company, or an emerging growth company. See the definitions of “large accelerated filer,” “accelerated filer,” “smaller reporting company,” and "emerging growth company” in Rule 12b-2 of the Exchange Act.
Large accelerated filer ◻ |
| Accelerated filer ◻ |
Smaller reporting company | ||
Emerging growth company |
If an emerging growth company, indicate by check mark if the registrant has elected not to use the extended transition period for complying with any new or revised financial accounting standards provided pursuant to Section 13(a) of the Exchange Act. ◻
Indicate by check mark whether the registrant has filed a report on and attestation to its management's assessment of the effectiveness of its internal control over financial reporting under Section 404(b) of the Sarbanes-Oxley Act (15 U.S.C. 7262(b)) by the registered public accounting firm that prepared or issued its audit report. / /
Indicate by check mark whether the registrant is a shell company (as defined in Rule 12b-2 of the Act). Yes ◻ No
As of June 30, 2020, the last business day of the registrant’s most recently completed second fiscal quarter, the aggregate market value of its shares held by non-affiliates was approximately $
There were
DOCUMENTS INCORPORATED BY REFERENCE
The information that is required to be included in Part III of this Annual Report on Form 10-K is incorporated by reference from the registrant’s definitive proxy statement for the 2020 Annual Meeting of Stockholders to be filed by the registrant within 120 days of December 31, 2020. Only those portions of any such definitive proxy statement that are specifically incorporated by reference herein shall constitute a part of this Annual Report on Form 10-K.
TABLE OF CONTENTS
IRADIMED CORPORATION.
TABLE OF CONTENTS TO ANNUAL REPORT ON FORM 10-K
For the Fiscal Year Ended December 31, 2020
i
CAUTIONARY STATEMENTS REGARDING FORWARD-LOOKING STATEMENTS
This Annual Report on Form 10-K contains “forward-looking statements” that involve substantial risks and uncertainties. The forward-looking statements are contained principally in the sections entitled “Business,” “Risk Factors” and “Management’s Discussion and Analysis and Results of Operations.” In some cases, you can identify forward-looking statements by the following words: “may,” “will,” “could,” “would,” “should,” “expect,” “intend,” “plan,” “anticipate,” “believe,” “estimate,” “predict,” “project,” “potential,” “continue,” “ongoing” or the negative of these terms or other comparable terminology, although not all forward-looking statements contain these words. These statements relate to future events or our future financial performance or condition and involve known and unknown risks, uncertainties and other factors that could cause our actual results, levels of activity, performance or achievement to differ materially from those expressed or implied by these forward-looking statements. These forward-looking statements include, but are not limited to, statements about:
| ● | our ability to respond and adapt to unexpected hospital, legal and regulatory changes resulting from the ongoing COVID-19 pandemic, such as changes in hospital treatment and financial practices, shelter-in-place orders, travel, social distancing and quarantine policies, curtailment of trade, and other business restrictions affecting our ability to assemble and sell our products; |
| ● | our ability to receive 510(k) clearance for our products and product candidates, complete inspections conducted by the FDA or other regulatory bodies resulting in favorable outcomes, additional actions by or requests from the U.S. Food & Drug Administration (“FDA”), including a request to cease domestic distribution of products, or other regulatory bodies and unanticipated costs or delays associated with the resolution of these matters; |
| ● | the timing and likelihood of regulatory approvals or clearances from the FDA or other regulatory bodies and regulatory actions on our product candidates and product marketing activities; |
| ● | unexpected costs, expenses and diversion of management attention resulting from actions or requests posed to us by the FDA or other regulatory bodies; |
| ● | our primary reliance on a limited number of products; |
| ● | our ability to retain the continued service of our key professionals and to identify, hire and retain additional qualified professionals; |
| ● | our expectations regarding the sales and marketing of our products, product candidates and services; |
| ● | our expectations regarding the integrity of our supply chain for our products; |
| ● | the potential for adverse application of environmental, health and safety and other laws and regulations of any jurisdiction on our operations; |
| ● | our expectations for market acceptance of our new products; |
| ● | the potential for our marketed products to be withdrawn due to recalls, patient adverse events or deaths; |
| ● | our ability to establish and maintain intellectual property on our products and our ability to successfully defend these in cases of infringement; |
| ● | the implementation of our business strategies; |
| ● | the potential for exposure to product liability claims; |
| ● | our financial performance expectations and interpretations thereof by securities analysts and investors; |
| ● | our ability to compete in the development and marketing of our products and product candidates with other companies in our industry; |
ii
| ● | difficulties or delays in the development, production, manufacturing and marketing of new or existing products and services, including difficulties or delays associated with obtaining requisite regulatory approvals or clearances associated with those activities; |
| ● | changes in laws and regulations or in the interpretation or application of laws or regulations, as well as possible failures to comply with applicable laws or regulations as a result of possible misinterpretations or misapplications; |
| ● | cost-containment efforts of our customers, purchasing groups, third-party payers and governmental organizations; |
| ● | costs associated with protecting our trade secrets and enforcing our patent, copyright and trademark rights, and successful challenges to the validity of our patents, copyrights or trademarks; |
| ● | actions of regulatory bodies and other government authorities, including the FDA and foreign counterparts, that could delay, limit or suspend product development, manufacturing or sales or result in recalls, seizures, consent decrees, injunctions and monetary sanctions; |
| ● | costs or claims resulting from potential errors or defects in our manufacturing that may injure persons or damage property or operations, including costs from remediation efforts or recalls; |
| ● | the results, consequences, effects or timing of any commercial disputes, patent infringement claims or other legal proceedings or any government investigations; |
| ● | interruption in our ability to manufacture our products or an inability to obtain key components or raw materials or increased costs in such key components or raw materials; |
| ● | uncertainties in our industry due to the effects of government-driven or mandated healthcare reform; |
| ● | competitive pressures in the markets in which we operate; |
| ● | the loss of, or default by, one or more key customers or suppliers; and |
| ● | unfavorable changes to the terms of key customer or supplier relationships. |
Forward-looking statements are not guarantees of future performance and are subject to substantial risks and uncertainties that could cause the actual results to differ materially from those that we predicted in the forward-looking statements. Investors should carefully review the information contained under the caption “Risk Factors” contained in Item 1A for a description of risks and uncertainties that could cause actual results to differ from those that we predicted. All forward-looking statements are based on information available to us on the date hereof, and we assume no obligation to update forward-looking statements, except as required by Federal Securities laws.
iii
PART I
ITEM 1. | BUSINESS |
Overview
IRADIMED CORPORATION (“IRADIMED”, the “Company”, “we”, “us”, “our”) develops, manufactures, markets and distributes Magnetic Resonance Imaging (“MRI”) compatible medical devices and accessories and services relating to them. We were incorporated in Oklahoma in July 1992 and reincorporated in Delaware in April 2014.
MRidium 3860+ MRI Compatible IV Infusion Pump System
We are the only known provider of a non-magnetic Intravenous (“IV”) infusion pump system that is specifically designed for safe use during MRI procedures. We were the first to develop an infusion delivery system that largely eliminates many of the dangers and problems present during MRI procedures. Standard infusion pumps contain magnetic and electronic components which can create radio frequency (“RF”) interference and are dangerous to operate in the presence of the powerful magnet that drives an MRI system. Our patented MRidium® MRI compatible IV infusion pump system has been designed with a non-magnetic ultrasonic motor, uniquely designed non-ferrous parts and other special features to safely and predictably deliver anesthesia and other IV medications or fluids during various MRI procedures. Our pump solution provides a seamless approach that enables accurate, safe and dependable fluid delivery before, during and after an MRI scan, which is important to critically-ill patients who cannot be removed from their vital or life sustaining medications, and children and infants who must generally be sedated to remain immobile during an MRI scan.
Each IV infusion pump system consists of an MRidium® MRI compatible IV infusion pump, non-magnetic mobile stand, proprietary disposable IV tubing sets and many of these systems contain additional optional upgrade accessories.
IRadimed 3880 MRI Compatible Patient Vital Signs Monitoring System
Our 3880 MRI compatible patient vital signs monitoring system has been designed with non-magnetic components and other special features to safely and accurately monitor a patient’s vital signs during various MRI procedures. The IRADIMED 3880 system operates dependably in magnetic fields up to 30,000 gauss, which means it can operate virtually anywhere in the MRI scanner room. The IRADIMED 3880 has a compact, lightweight design allowing it to travel with the patient from their critical care unit, to the MRI and back, resulting in increased patient safety through uninterrupted vital signs monitoring and decreasing the amount of time critically ill patients are away from critical care units. The features of the IRADIMED 3880 include: wireless ECG with dynamic gradient filtering; wireless SpO2 using Masimo® algorithms; non-magnetic respiratory CO2; invasive and non-invasive blood pressure; patient temperature, and; optional advanced multi-gas anesthetic agent unit featuring continuous Minimum Alveolar Concentration measurements. The IRADIMED 3880 MRI compatible patient vital signs monitoring system has an easy-to-use design and allows for the effective communication of patient vital signs information to clinicians.
With the expanding use of MRI procedures, both traditional procedures, and intraoperative and interventional procedures, safe and reliable infusion delivery and patient monitoring in an MRI environment is becoming increasingly important to hospitals and other medical providers. Our founder, President,Chief Executive Officer, and Chairman of the Board of Directors, Roger Susi, is a pioneer in the MRI compatible medical device industry, having invented the first MRI compatible patient monitoring system in 1986 and the first non-magnetic MRI compatible IV infusion system in 2004.
We sell our products primarily to hospitals and acute care facilities, both in the United States and internationally. We currently employ a direct sales strategy in the United States and as of December 31, 2020, our direct sales force consisted of 22 field sales representatives, supported by 4 regional sales directors and supplemented by 5 clinical application specialists. Internationally, we market our products into approximately 77 countries through the use of independent distributors.
1
As of December 31, 2020, we have sold approximately 5,794 MRI compatible IV infusion pump systems and approximately 794 of our 3880 MRI compatible patient vital signs monitoring systems.
We generate revenue from the sale of MRI compatible medical devices and accessories, extended warranty agreements, services related to maintaining our products and the sale of disposable products used with our devices. In fiscal year 2020, our revenue was $31.7 million and our loss from operations was $(0.8) million representing an operating profit margin of (2.4) percent. Refer to the information contained under the caption “Financial Highlights and Outlook” regarding our outlook for 2021.
Our internet website is www.iradimed.com. We make available on the Investors section of our website, free of charge, our Annual Reports on Form 10-K, Quarterly Reports on Form 10-Q, Current Reports on Form 8-K and Proxy Statements, and amendments to those reports, as soon as reasonably practicable after filing such documents with, or furnishing such documents to, the SEC. We include our website address throughout this filing for reference only. The information contained on our website is not incorporated by reference to this report.
History and Development
Mr. Susi founded Invivo Research Inc. in 1979 where he developed the first MRI compatible patient monitoring system. Mr. Susi served as the President of Invivo Research Inc. from 1979 until 1998, and as its Chairman of the Board of Directors from 1998 until 2000. Under Mr. Susi’s leadership, Invivo Research matured from a start-up medical device company into a leading producer of vital signs monitoring devices used during MRI procedures. Invivo Research was acquired by Invivo Corporation in 1992, which began trading on the Nasdaq Stock Exchange in 1994. Mr. Susi served as a Director of Invivo Corporation from 1998 until 2000 and oversaw technical areas from 2000 to 2004. Invivo Corporation was acquired by Intermagnetics General Corporation in 2004, which was later acquired by Koninklijke Philips NV (NYSE: PHG).
Mr. Susi began exploring the market for an MRI compatible IV infusion pump while at Invivo. Invivo subsequently disclaimed any interest in the infusion pump and acknowledged that Mr. Susi was free to pursue the infusion pump development for his own account. Accordingly, Mr. Susi began the formal and detailed development of what subsequently has become our MRidium MRI compatible IV infusion pump system. This first-generation MRI compatible IV infusion pump system and its associated proprietary IV tubing sets obtained FDA 510(k) clearance in March 2005 after which we began our sales and marketing efforts.
We commenced international sales through a network of distributors and in 2006, we signed an exclusive distribution agreement with Mallinckrodt/Tyco Healthcare (now part of Medtronic plc (NYSE: MDT)) for domestic and Canadian distribution of our products including the MRidium 3850 MRI compatible IV infusion pump system (the predecessor to our current 3860+ model). The exclusive arrangement ended in 2010, allowing us to implement a direct marketing strategy with our own sales force in the U.S.
In 2009, we introduced our second-generation MRI compatible IV infusion pump system, the MRidium 3860+ which improved upon the previous 3850 version in a number of areas, including the addition of blood oxygen saturation monitoring (“SpO2”), and remote wireless monitoring capability. An SpO2 monitor can signal when an insufficient level of oxygen is being supplied to the body. Our MRidium 3860+ is the only MRI compatible IV infusion pump system on the market today.
In 2014, we began developing our own MRI compatible patient vital signs monitoring system (“3880 Monitor”). Through the use of current and new technologies, and our trade secrets, we believe our 3880 Monitor improves on the design of other MRI compatible vital signs monitors. Our 3880 Monitor is compact and lightweight, overcoming many of the workflow issues created by other larger and heavier MRI compatible monitors currently in the market. In December 2016, we made our first shipments of the 3880 Monitor to international customers. In October 2017, we received FDA 510(k) clearance for our 3880 Monitor and immediately began our direct selling efforts in the United States.
Industry
We currently compete in the MRI compatible medical device market.
Need for MRI Compatible IV Infusion Pumps and Vital Signs Monitors
2
MRI is a widely used, non-invasive medical imaging technique to visualize vital organs, bodily function and to identify blockages, abnormalities and growths. MRI is generally considered safer than other scanning techniques that expose the body to radiation. This is particularly true for children. As such, practitioners at hospitals and other medical facilities have been increasingly developing and using MRI for new procedures. These procedures include cardiac stress testing, intraoperative MRI and neurology MRI techniques. Our MRI compatible products offer a way to continuously deliver essential IV fluids safely and accurately while also monitoring the vital signs of critically ill or sedated patients, thereby allowing the expanded use of MRI procedures, better or quicker diagnoses and treatments that may lead to shorter hospital stays resulting in lower health care costs.
While the benefits and uses of interventional magnetic resonance (“MR”) are known, there are hazards intrinsic to the MR environment which must be respected. These hazards may be attributed to a powerful static magnetic field, pulsed gradient magnetic fields, and pulsed radio frequency fields. The MRI suite is a harsh place for medical devices, and safe and proper patient care requires specialty equipment that is specifically designed and built for the MR environment. Many of the dangers and problems present in the MR environment can be solved through use of non-magnetic equipment that have operational safeguards and that maintain performance standards within a harsh magnetic environment while simultaneously maintaining patient safety. Designing MRI compatible medical devices that operate safely and effectively in the MR environment requires overcoming significant technical hurdles.
Intravenous fluids and vital signs monitoring are needed during MRI procedures for many different reasons. Infusion pumps provide sedation to patients who are not able to remain immobile during an MRI scan and a continuous flow of critical medications to seriously ill patients, including those from critical care departments. Given the benefits to patient safety, radiology departments performing the scan, anesthesia departments delivering sedation and critical care specialists responsible for delivering critical medications during MRI procedures often initiate requests for an MRI compatible IV infusion pump. Additionally, the Joint Commission on Accreditation of Healthcare Organizations requires monitoring of a patient’s vital signs while under sedation. Further, vital signs monitoring is also required when the patient’s condition prevents them from alerting clinicians when experiencing pain, respiratory problems, cardiac distress or other difficulties that may arise during an MRI scan.
Standard Infusion Pumps and Other Inadequate Alternatives
For those medical facilities that do not currently own an MRI compatible IV infusion pump, there are five general methods that are used to deal with patients undergoing an MRI who require IV medications during their imaging procedure: (1) do not offer MRI treatment to patients requiring IV delivered medications or sedation; (2) use standard (magnetic) pumps with long IV lines that extend outside the MRI scanner room; (3) proceed and accept patients for an MRI procedure but stop the flow of IV fluids during the procedure; (4) allow the gravity controlled free drip of IV fluids; and (5) attempt to shield a conventional IV infusion pump. All of these approaches have drawbacks, introduce safety risks and may result in deficient patient care.
Use of multiple lengths of extension tubing can cause infusion inaccuracies, unnecessary waste of costly medications and false alarms or, more seriously, delayed alarms for equipment issues such as occlusion, especially when low flow rates are being used. Such makeshift extension sets can also affect the effectiveness of fluid delivery. A clinician’s adjustment of dosage and other settings may take longer to reach the patient due to the over-extended tubing.
Further, there are risks in using a standard IV infusion pump that is mistakenly believed to be at a safe distance from the MR scanner. The powerful magnetic fields may cause metal objects in the MR environment to be drawn with great force into the bore of the MRI system, resulting in potentially deadly projectiles. Moreover, an MRI scanner’s gradient magnetic field and RF fields can send electrical currents through cables and other conductive materials that are near the MRI system and cause the cables to heat, which may result in burns if they come into contact with the patient or facility staff.
Other problems include devices malfunctioning if they are not properly designed for use in the harsh MR environment and low-quality MR images due to artifacts caused by RF interference emitted from ancillary equipment.
To deal with the harsh environment of MR, some manufacturers have offered a “shielded box” solution (also known as a Faraday cage) for use with their standard IV pumps, but the approach has not been widely accepted by customers. The major problem with this approach is that a highly magnetic standard IV infusion pump is still being introduced into a hazardous MRI environment which can lead to projectile accidents. Additionally, placing a highly
3
magnetic standard IV infusion pump inside a shielded box hinders an operator’s ability to determine the pump’s status and creates inefficiencies when addressing an alarm or revising a pump’s flow rate. Moreover, a Faraday cage with a standard IV infusion pump must be kept approximately 5 to 10 feet from the scanner, which may result in the use of long IV lines. By contrast, our MRI compatible IV infusion pump system can be safely placed anywhere in the scanner room including next to the scanner. We are not aware of any “shielded box” installations in use in the U.S.
We believe that our MRidium MRI compatible IV infusion pump system is the first and only product to provide an easy-to-operate, non-magnetic, safe and RF-quiet solution and hence a truly MRI compatible product.
Market Opportunities
Addressable Market
MRI Compatible IV Infusion Pump
We view our MRI compatible IV infusion pump primarily as a patient safety device. Accordingly, we do not actively market our IV infusion pump system in countries that we believe do not have a minimum level of patient safety standards to warrant a device like ours. We estimate there is the potential for the sale of approximately 27,350 MRI compatible IV infusion pump systems based on the number of MRI scanners installed globally in acute care facilities of sufficient sophistication as to be considered supporting favorable market conditions for utilization of our MRI compatible IV infusion pump system. Additionally, based on historical sales data and customer purchasing behaviors, we believe, through the use of our direct U.S. sales team, there is potential for sales of our MRI compatible IV infusion pump system within critical care departments of U.S. hospitals (refer to the section below titled Expansion of Intra-Hospital Use of MRI Compatible Devices). Based on an estimate of the number of critical care departments in the U.S., we believe there is the potential for the sale of an additional 10,450 of our MRI compatible IV infusion pump systems. The combination of sales based on the number of targeted MRI scanners and critical care departments of U.S. hospitals results in a current global target market of approximately 37,800 of our MRI compatible IV infusion pump systems.
MRI Compatible Patient Vital Signs Monitor
The market for MRI compatible multi-parameter vital signs monitors is well-developed and more subject to replacement cycles than new adoptions. As with our MRI compatible IV infusion pump, we also consider our MRI compatible multi-parameter vital signs monitor primarily as a patient safety device. Accordingly, we do not actively market our MRI vital signs monitor in countries that we believe do not have a minimum level of patient safety standards to warrant a device like ours. We estimate there is the potential for the sale of approximately 27,350 MRI vital signs monitoring systems based on the number of MRI scanners installed globally in acute care facilities of sufficient sophistication as to be considered supporting favorable market conditions for utilization of our MRI vital signs monitoring system. Additionally, based on historical sales data and customer purchasing behaviors, we believe, through the use of our direct U.S. sales team, there is potential for sales of our MRI vital signs monitoring system within critical care departments of U.S. hospitals (refer to the section below titled Expansion of Intra-Hospital Use of MRI Compatible Devices). Based on an estimate the number of critical care departments in the U.S. and an estimate of the anticipated adoption rate in these critical care departments, we believe there is potential for the sale of an additional 5,250 of our MRI vital signs monitoring systems. The combination of sales based on the number of targeted MRI scanners and critical care departments of U.S. hospitals results in a current global target market of approximately 32,600 of our MRI patient vital signs monitoring systems.
4
Expansion of Intra-Hospital Use of MRI Compatible Devices
Historically, we marketed our MRI compatible devices primarily to the MRI departments of U.S. hospitals. We believe, however, based on feedback and historical successes selling our devices, that there is potential for expanded deployment of our MRI compatible IV infusion pumps and MRI compatible monitors within the Intensive Care Unit (“ICU”), Emergency Room (“ER”), and other critical care departments within U.S. hospitals where there is a high probability that MRI procedures will need to be performed on these patients. Expanded use of our MRI compatible medical devices would serve as a type of transport package and allow for consistent and uninterrupted administration of IV fluids and monitoring of vital signs, allowing for easier and safer intra-hospital transport of patients to and from the MRI scanner.
It is often necessary for a patient in a critical care department of the hospital who is connected to a standard vital signs monitor and a standard IV infusion pump that is delivering critical medications to be quickly moved to the MRI facility for immediate imaging. The presence of our MRI compatible medical devices in those critical care departments enables the orderly and rapid transfer between those standard medical devices to our 3880 Monitor and MRidium MRI compatible IV infusion pump in the critical care department prior to transporting the patient for an MRI. Seriously ill patients are generally at higher risk when they are away from the resources of critical care departments, and efficient transfers to MRI compatible devices while the patient is in the critical care environment minimizes the time the patient spends away from the critical care department.
We believe there is a higher occurrence of equipment-related adverse events during the intra-hospital transport of critically ill patients. We therefore believe that placing our MRI compatible devices in critical care departments could reduce patient adverse events associated with vital signs monitors and IV pump transfers typically performed within MRI departments.
Some hospitals use MRI during surgical procedures. Neurosurgical interventions have been at the forefront of this development in image-guided surgery, followed by otolaryngological procedures. As MR-guided intervention during surgery has been deployed, the degree of complexity in supplemental devices has increased markedly. Much of the effort required for successful implementation of intraoperative MRI has been in development and testing of anesthesia equipment, patient monitoring devices, infusion pumps and surgical instruments and accessories, all of which need to be MRI compatible if used near the MRI scanner. Intraoperative MRI is expanding demand for our MRI compatible devices from the MRI suite to the surgical suite of the hospital.
Strategy
Company Objective
Our objective is to become the leader in providing safe and effective care for all patients undergoing MRI procedures through the development and commercialization of a portfolio of MRI compatible products, accessories and related services. By increasing the safety parameters of equipment operating within the harsh magnetic environment of the MRI scanner room, we hope to enable hospitals and other healthcare providers to offer the MRI diagnostic procedures patients require. We believe our current products increase the safety of performing MRI diagnostics for patients by minimizing potential complications with IV infusions and vital signs monitoring.
We seek to grow our business by, among other things:
Driving market awareness of our MRI compatible IV infusion pump and the safety risks associated with using conventional IV pumps with long IV lines
We believe that the largest potential market for our MRI compatible IV infusion pumps is the segment of the market that is currently using workaround solutions. Such solutions include using conventional pumps outside the MRI scanner room and attaching multiple extension lines of IV tubing sets through the wall or under the door into the MRI scanner room to reach the patient. This practice of makeshift setups is fraught with risks to the patient and unnecessary costs and inefficiencies. These risks and inefficiencies include:
| ● | Infection risk from running lengthy IV tubing sets with multiple extensions through the wall or under the door; |
5
| ● | Risk of inaccuracy from using a conventional IV infusion pump with multiple extension lines; |
| ● | Potential medication occlusion and lengthy alarm notification delays due to multiple extension lines, posing great risks to patients on critical medications; |
| ● | Excess medication costs due to the disposal of multiple extension IV tubing sets filled with unused medication at the end of the procedure; and |
| ● | Lost productivity and MRI scanning time due to the lengthy set up time required for multiple extension lines. |
We believe that increased market awareness and education will be required for potential customers to appreciate the value for patients and the hospital of an efficient and patient-safe MRI environment which includes MRI compatible IV infusion pumps.
Driving market awareness of our MRI compatible patient vital signs monitoring system
We believe our 3880 MRI compatible patient vital signs monitoring system creates customer value by resolving significant workflow issues through the additional utilization achievable with our MRI monitor that is not possible with other MRI monitors. Our 3880 Monitor’s compact and lightweight design facilitates the transportation of patients from their critical care unit, to the MRI and back, resulting in increased patient safety through uninterrupted vital signs monitoring and decreasing the amount of time critically ill patients are away from critical care units. Because of the transport capabilities that only our 3880 Monitor offers, we believe multiple departments within a hospital will be interested in purchasing our device. Other MRI monitors are too large and heavy for use in patient transport scenarios are therefore typically only located in the MRI departments of hospitals.
Continuing to innovate with MRI compatible patient care products
Our management team has a significant amount of experience developing and commercializing MRI compatible products. We have entrenched relationships with several of the industry’s top thought leaders and we have, and will continue to, closely collaborate with them to build upon IRADIMED’s innovative MRI compatible technologies. We intend to leverage this experience and collaboration to innovate and commercialize other technologically advanced MRI compatible patient care products.
When reasonably available, acquiring synergistic MRI patient care companies, products or technology licenses to accelerate our product development and leverage our existing sales organization
We have an experienced team of engineering and operations managers committed to improving on existing MRI patient care designs through our internal development efforts and the possible acquisition of technologies and intellectual property of others. We have a direct sales organization in the U.S. and a team of experienced international distributors that we believe can effectively go to market with additional MRI compatible patient care products. While we have not completed an acquisition, we continue to analyze such opportunities to improve our product mix and profitability.
Commercial Strategy
We believe that the MRI compatible IV infusion pump market continues to have growth potential given the low rate of market penetration, and we aim to drive increased awareness, adoption and utilization of our MRI compatible products by:
6
Continued development of our MRI-focused U.S. direct sales force and our international sales efforts
We believe the most meaningful aspect of our commercialization strategy in the U.S. is the continued development of the market through driving awareness and education by our direct sales force. Since there is no current direct competitor for an MRI compatible IV infusion pump, our focus is on expanding the market through better education on the advantages to patients, clinicians and hospitals of our infusion pump solution and the shortcomings of current workaround practices. Additionally, with our 3880 Monitor, we focus on educating customers on the total workflow benefits our devices offer and how our devices increase patient safety through their combined transport capabilities.
As business progress dictates, we intend to add to our specialized, MRI product-focused direct sales team, including our supporting clinical application specialists.We believe that we can significantly increase sales of our MRI compatible medical devices by continuing to call on critical care departments, which may help influence hospitals’ purchasing decisions. We believe that this strategy is likely expanding the number of acute care facilities using our MRI compatible products and increasing the average number of MRI compatible IV infusion pumps and monitors per MRI scanner.
Internationally, our focus is to continue working with our distributors in key target markets, such as Europe and Asia, to expand the business and augment our market penetration rates. As business progress dictates, we plan to expand our internal capacity to serve high potential markets by adding dedicated resources located outside the U.S. to oversee our relationships at the local level.
Supporting commercial efforts with evidence-based information
We focus our sales team on educating customers on the safety and efficiency benefits of using our MRI compatible products. To assist in the education process, we have developed materials that document the risks and additional costs associated with using a workaround solution of running long lines from conventional IV pumps outside the MRI scanner room. We are also continuing the development of and enhancing our materials documenting the benefits of uninterrupted vital signs monitoring that allows for easy transfer of critically ill patients from critical care to the MRI scanner room and back. We believe this kind of evidence-based documentation will help us provide widespread education to the clinicians that are driving clinical practice. We also believe that documented evidence will serve to inform the quality and risk management leaders in these organizations, which in turn may help drive the overall adoption of our MRI compatible products.
Providing best in class customer service and user experience
We believe that the expectations of our customers for service and a superior user experience have risen with the advancement of technology. Once a customer purchases our products, it is imperative that they receive first-class clinical education and support to encourage usage of our products. We devote a significant amount of time and training to ensure that this educational experience is a success. This training is performed most commonly by our sales staff and is augmented by our clinical application specialists; however, we intend to hire more clinical application specialists to strengthen our initial training experience and increase ongoing customer support. We believe that a positive user experience is critical to driving increased rates of utilization of our products.
7
Our Products
Typical MRI Scanner Room
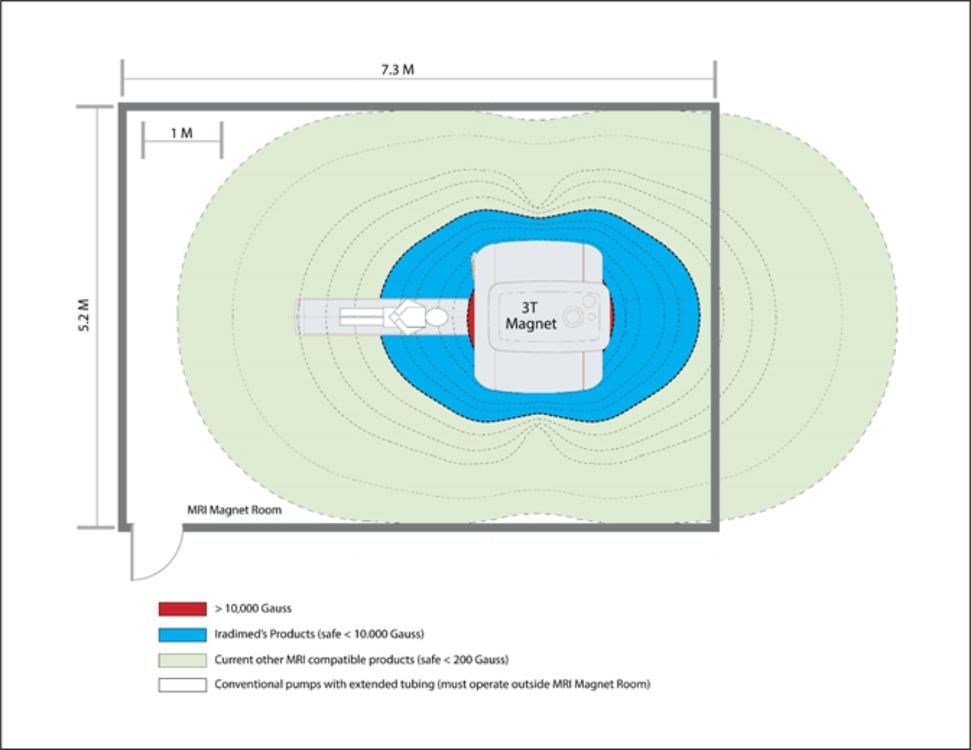
The following diagram is representation of an aerial view of a typical MRI scanner room with a typical three Tesla magnet. The gauss-lines illustrate the distance from the magnet where various types of medical devices can safely operate. Our 3880 MRI compatible patient vital signs monitor is the only MRI monitor that can operate safely and reliably in very close proximity to the bore of the powerful magnet used to operate the MRI (area shown in red). Additionally, our MRidium MRI compatible IV infusion pump is the only pump on the market approved to operate safely and reliably near the patient (area shown in blue). All other pumps must be placed at a distance from the MRI scanner, which may include being outside of the scanner room entirely.
We currently offer two primary products for sale: (1) our MRidium 3860+ MRI compatible IV infusion pump system with associated disposable IV tubing sets, and (2) our 3880 MRI compatible patient vital signs monitoring system with associated disposable products.
8
MRidium MRI Compatible IV Infusion Pump System
The patented MRidium MRI compatible IV infusion pump system is based upon a non-magnetic, ultrasonic motor and other uniquely designed non-ferrous parts in order to provide accurate and dependable fluid delivery to patients undergoing an MRI procedure. Our MRidium MRI compatible IV infusion pump system has been designed to offer numerous advantages to hospitals, clinicians and patients. MRidium’s strengths include the following:
| ● | The only non-magnetic MRI compatible IV infusion pump system specifically designed and built to operate inside the MR environment. |
| ● | A mobile, rugged, easy-to-operate, and reliable system with a strong safety record. |
| ● | Able to operate virtually anywhere in the MRI scanner room; approved for use in the presence of 0.2T to 3T magnets and fully operational up to the 10,000 gauss-line. |
| ● | Available with a Dose Error Reduction System (“DERS”) to reduce the risk of medication errors and simplify clinician monitoring. |
| ● | Available with a wireless remote display/control providing clinicians and technicians control and visibility from outside of the MRI scanner room. |
| ● | Available with an add-on channel (3861 Side Car Module) allowing for the easy addition of a second IV line for patients requiring multiple IV medications at a low incremental cost to the hospital. |
| ● | Available with a built-in SpO2 monitor using Masimo SET® technology and a specially designed fiber optic SpO2 sensor allowing one device to monitor oxygen saturation levels while safely providing IV infusion during an MRI procedure. |
Our MRI compatible IV infusion pump system includes the 3860+ MRI compatible IV infusion pump, proprietary single-use IV tubing sets, a non-magnetic pole and a lithium battery. In addition, we offer optional upgrade systems including the 3861 Side Car, 3865 Remote Display/Control, DERS and an SpO2 monitor as discussed below.
MRidium 3860+ MRI Compatible IV Infusion Pump
The MRidium 3860+ MRI compatible IV infusion pump was introduced in 2009 and improved upon the performance and features of our first generation MRidium 3850 MRI compatible IV infusion pump. The MRidium 3860+ pump system can operate dependably in the presence of 0.2T to 3T magnets and is fully operational up to the 10,000 gauss-line. This means our MRidium 3860+ is highly versatile and can operate virtually anywhere in the MRI scanner room, including close to the MRI scanner. The MRidium 3860+ MRI compatible IV infusion pump system has a 10-key numeric input keypad making our system easy to accurately program and operate. Our pumping range of 0.1 mL per hour to 1,400 mL per hour provides a broad range of fluid flow control. Our broad range of infusion rates support differing patient needs including low levels for pediatric sedation, mid-levels for continued IV infusion of medications to critically ill patients and high levels in the event of emergency situations. Our MRidium 3860+ MRI compatible IV infusion pump system offers a dose rate calculator, bolus dose programming, full alarm settings, and a rechargeable battery with a 12-hour life.
MRidium 3860+ IV Tubing Sets
The MRidium 3860+ MRI compatible IV infusion pump system utilizes proprietary fluid delivery tubing sets, each known as an “IV tubing set.” Each use of our MRI compatible IV infusion pump requires a disposable IV tubing set. We offer a variety of IV tubing sets for varying infusion scenarios and these include our standard “spike” infusion set, syringe adapter infusion set and extension infusion set. Each of our IV tubing sets is latex-free and DEHP-free.
| ● | MRidium 1056 Standard Infusion Set. Our standard “spike” infusion set features the ability to accurately deliver liquids from either a bottle or IV bag. The 1056 standard infusion set contains two needle-free injection ports and is typically used when starting a new infusion from a bottle or bag. |
9
| ● | MRidium 1057 Syringe Adapter Infusion Set. Our syringe adapter IV set enables users to provide accurate delivery of IV fluids directly from standard syringes. The 1057 vented syringe adapter set benefits from a low priming volume of 4 ml, which minimizes inefficient waste of medication. This product is most commonly used for cardiac medications, anesthesia, and pediatric drug delivery. |
| ● | MRidium 1058 Extension Infusion Set. Our extension infusion set allows users to transfer a patient on a non-MRI infusion pump to our MRidium MRI compatible IV infusion pump. The user simply disconnects the existing IV tubing at the patient site and connects and primes the MRidium extension set to the existing IV tubing. Once removed from the conventional infusion pump and connected to our MRidium MRI compatible IV infusion pump, the user can program the pump and begin the infusion. The 1058 extension set includes one needle-free injection port and is typically used to provide uninterrupted critical medications to a severely ill patient during an MRI procedure. |
MR IV Pole
We offer a fully functional and weighted non-magnetic IV pole that is designed for mobility within the hospital and the MRI scanner room. The IV pole can support two MRidium 3860+ MRI compatible IV infusion pumps, each with a 3861 Side Car Pump Module. The IV pole is 66 inches (1.68 meters) high, stabilized with a wide pole radius and mobilized with five casters designed to roll easily during transport. The IV pole is equipped with four hooks for holding fluid bags.
Optional Features
Our 3860+ MRI compatible IV infusion pump system gives customers the ability to adapt their systems to meet their specific needs. In addition to our standard product features, we also offer system upgrades which include a modular add-on second IV channel through our 3861 Side Car, a wireless remote control/display, DERS and an imbedded SpO2 monitor. We also offer rechargeable lithium polymer battery packs which have 12-hour life when not connected to an electrical outlet.
3861 Side Car Pump Module
Our Side Car Pump Module can be attached to our 3860+ MRidium MRI compatible IV infusion pump to provide a second channel for infusion delivery. This flexible option allows hospitals to convert their single-channel infusion pump into a dual-channel system designed to deliver both large and small volume fluids in the MRI scanner room. The side car is fully functional with our 3865 MRidium Wireless Remote, allowing clinicians the ability to control both channels with one remote control unit outside of the MRI scanner room. The additional delivery line has all of the same features and benefits as the 3860+ MRidium MRI compatible IV infusion pump, as described above.
3865 MRidium Wireless Remote Display/Control
Our wireless remote control unit allows for complete control and monitoring of the MRidium MRI compatible IV infusion pump system from the control room (outside of the MRI scanner room). The 3865 MRidium Wireless Remote relays all commands and displays information bi-directionally between the MRI compatible IV infusion pump and the remote control unit. Utilizing the same user interface and large bright display as the MRidium pump, our wireless remote control unit permits clinicians to adjust all pump parameters, including SpO2 monitoring parameters, rates, dose, volume, pump run/stop, alarms (adjust or reset), as well as real-time titration. Our remote control unit utilizes a proven MRI compatible 2.4 GHz frequency hopping spread spectrum radio technology for artifact-free operation that does not disturb the MRI imaging process. Clinicians may also use the remote control unit to adjust a second pump
10
channel when used in combination with our Side Car unit discussed above. Our 3865 MRidium Wireless Remote also functions as a battery charger for our MRidium battery pack.
Dose Error Reduction System (“DERS”)
Our DERS software for use with our MRidium 3860+ MRI compatible IV infusion pump system incorporates the latest dosing safety features for patients. The DERS system enables users to create a unique drug library and establish nominal values and limits for dose and concentration for specified infusion protocols. With DERS, patient safety and user convenience are supported by user-programmed infusion hard limits (maximum and minimum) and soft limits (high and low limits that require user confirmation to exceed). The dose applied via DERS is displayed and can be adjusted directly on the running screen at any time during the infusion. The memory card port allows for easy archiving and updating of the drug library.
SpO2 Monitoring with Sensor and Accessories
Our MRidium 3860+ MRI compatible IV infusion pump system also offers state-of-the-art Masimo SET® SpO2™ capability providing a unique ability to have SpO2 monitoring and IV delivery combined in one unit. This feature offers users the ability to start sedations outside of the MRI scanner room, transport to the scanner, and then back to recovery without having to discontinue SpO2 monitoring of the patient. In addition, our fiber optic MRI SpO2 sensor and accessories provide a safe connection between the patient and our MRI compatible IV infusion pumps. This fiber optic-based SpO2 sensor delivers outstanding performance while avoiding potentially hazardous heating or image artifact during MRI scans. The method of patient attachment uses a medical-grade silicone rubber sensor grip that allows easy and convenient attachment to the patient’s hand or foot, and accommodates pediatric, adult, and infant patients with various size grips.
We believe our MRidium 3860+ MRI compatible IV infusion pump system and its customizable features comprehensively and uniquely address the needs of MRI departments within hospitals and other medical facilities.
MRI Compatible Patient Vital Signs Monitoring System
Our 3880 Monitor has been designed with non-magnetic components and other special features in order to safely and accurately monitor a patient’s vital signs during various MRI procedures. The 3880 Monitor system is fully operational in magnetic fields up to 30,000 gauss, which means it can operate virtually anywhere in the MRI scanner room (see above diagram).
Our 3880 Monitor has a compact, lightweight design allowing it to travel with the patient from their critical care unit, to the MRI and back, resulting in increased patient safety through uninterrupted vital signs monitoring and decreasing the amount of time critically ill patients are away from critical care units.
The basic configuration of the 3880 Monitor includes wireless ECG with dynamic gradient filtering; wireless SpO2 using Masimo® algorithms, and non-invasive blood pressure. Optional features include all or a combination of non-magnetic respiratory CO2; invasive blood pressure; patient temperature, and/or; optional advanced multi-gas anesthetic agent unit featuring continuous Minimum Alveolar Concentration measurements.
The MRI compatible patient vital signs monitoring system also includes: (1) an extended range remote tablet that allows for remote monitoring from outside the MRI scanner room; (2) a base station control center that facilitates printing, wireless communications between the remote tablet and the monitor, and acts as a battery charger for the remote tablet, and; (3) wireless ECG, SpO2 and invasive blood pressure pods that facilitate the respective monitoring modalities.
11
Intellectual Property
We protect our proprietary technology through a combination of patents, trade secrets and confidentiality agreements. During the development of our products, our founder, Roger Susi, obtained a number of patents regarding our MRI compatible IV infusion pump and related systems. Mr. Susi has irrevocably assigned these patents to us. We consider our patents important but do not believe our future success is materially dependent upon patents.
We have 14 issued U.S. patents and 4 issued foreign patents with remaining lives that range from 2 to 13 years. We also have a number of U.S. patent applications pending. These patents and patent applications relate to several of our products, including our MRI compatible IV infusion pump system and its components and our MRI compatible patient vital signs monitoring system. We intend to file patent applications with respect to future patentable developments and improvements when we believe that such protection is in our best interest.
We also rely on trade secrets, copyright and other laws and on confidentiality agreements to protect our technology, but we believe that neither our patents nor other legal rights will necessarily prevent third parties from developing or using similar or related technology to compete against our products. Moreover, our technology may be viewed as improvements or adaptations of known MRI infusion or monitoring technology, which might be duplicated or discovered through our patents, reverse engineering or both.
Sales and Marketing
We sell our MRI compatible products through our direct sales force in the U.S. and independent distributors internationally. In the U.S., we sell our products through our 22 direct field sales representatives, 4 regional sales directors and 5 clinical application specialists. We have distribution agreements for our products with independent distributors selling our products internationally. We have developed an experienced team of international distributors that have a strong MRI/radiology product portfolio and focus. Our international distributors are managed by our international sales team.
The percentage of total revenue generated by geographic region was as follows:
Percent of Revenue |
| ||||||
Years Ended December 31, |
| ||||||
| 2020 |
| 2019 |
| 2018 |
| |
United States |
| 77.4 | % | 80.3 | % | 80.5 | % |
International |
| 22.6 | % | 19.7 | % | 19.5 | % |
The percentage of total revenue generated by product type was as follows:
Percent of Revenue |
| ||||||
Years Ended December 31, |
| ||||||
| 2020 |
| 2019 |
| 2018 |
| |
Devices |
| 60.3 | % | 72.1 | % | 69.6 | % |
Disposable, service and other |
| 33.8 | % | 23.1 | % | 25.4 | % |
Amortization of extended warranty agreements |
| 5.9 | % | 4.8 | % | 5.0 | % |
We define backlog as of a particular date to mean firm purchase orders from customers for which we have not yet fulfilled. As part of our commitment to customer service, our goal is to ship products to meet the customers’ requested shipment dates. Our backlog is occasionally subject to cancellation or rescheduling by the customer on short notice with little or no penalty. Because of the uncertainty of order cancellations or rescheduling, we do not believe our backlog as of any particular date is indicative of actual sales for any future period and, therefore, should not be used as a measure of future revenue.
For the years ended December 31, 2020, 2019 and 2018, backlog was approximately:
Years ended December 31, | |||||||||
(In millions) |
| 2020 |
| 2019 |
| 2018 | |||
Backlog | $ | 4.4 | $ | 1.6 | $ | 2.6 | |||
12
Selling cycles for our devices have varied widely and have historically ranged between three and six months in duration with more recent trends lengthening beyond this historical range due to the COVID-19 pandemic.
The principal customers for our MRI compatible products include hospitals and acute care facilities. The key decision maker in a purchase varies on the hospital department making the purchase. We serve these customers through our sales and service specialists and believe that our specialists are well-positioned to build upon these customer relationships. We communicate with our customers on a regular basis in an attempt to understand potential issues or concerns as well as to improve our products and services in response to their needs. Product orders and inquiries are handled by trained service representatives who communicate with customers after equipment shipments, installations and service repair calls. We have implemented various other programs which enable us to assess our customers’ needs. These programs include surveys and visits to customer sites.
We enter into agreements with healthcare supply contracting companies, commonly referred to as Group Purchasing Organizations (“GPOs”) in the U.S., which enable us to sell and distribute our products to their member hospitals. GPOs negotiate volume purchase prices for hospitals, group practices, and other clinics that are members of a GPO. Our agreements with GPOs typically include the following provisions:
| ● | Negotiated pricing for all group members; |
| ● | Volume discounts and other preferential terms on member purchases from us; |
| ● | Promotion of our products by the GPO to its members; and |
| ● | Payment of administrative fees by us to the GPO, based on purchases of our products by group members. |
Under these agreements, we are required to pay the GPOs a fee of three percent of the sales of our products to members of the GPO.
Manufacturing and Suppliers
We assemble our products in our facility in Winter Springs, Florida, from components and sub-assemblies purchased from outside suppliers. We perform final assembly, testing and packaging to control quality and manufacturing efficiency. We purchase components and sub-assemblies from qualified suppliers that are subject to our stringent quality specifications and inspections by us. We conduct quality audits of our key suppliers, several of which are experienced in the supply of components to manufacturers of finished medical devices or disposables for use with these medical devices. Our historical track record of producing MRI compatible products has been good; however, there can be no assurance that this trend will continue or that we will be able to produce sufficient units to reach our expected revenue growth rates.
Some of the raw materials and parts that are critical to the production and operation of our products are sourced from single suppliers and some components we or our suppliers utilize are from Chinese manufacturers. We have never encountered a significant supply interruption from any sole supplier; however, the operations of our third-party suppliers could be disrupted by conditions unrelated to our business operations or that are beyond our control, including but not limited to international trade restrictions, excessive demand creating shortages of available supply, and conditions related to COVID-19 or other epidemics. We are unsure whether an extended period of general supplier disruption caused by COVID-19 will affect us directly or through our suppliers; however, we continue to monitor our supply chain regarding the matter. We typically maintain no less than a three-month supply of raw materials and parts that are sourced from sole suppliers and make efforts to identify additional suppliers who may be able to provide such raw materials or parts. For example, the non-magnetic, ultrasonic motor which drives our MRI compatible IV infusion pump is sole sourced from a major multinational Japanese manufacturing company with whom we have an excellent long-term relationship. This company has exclusively provided us with these motors since 2005. Our exclusive supply agreement with this company was renewed in March 2019 and extends through February 25, 2024.
13
We place significant emphasis on providing quality products and services to our customers. Quality management and oversight play an essential role in understanding and meeting customer requirements, effectively resolving quality issues and improving our products and services. We have a network of quality systems throughout our facilities that relate to the design, development, assembly, packaging, sterilization, handling, distribution and labeling of our products.
To assess and facilitate compliance with applicable requirements, we periodically review our quality systems to determine their effectiveness and identify areas for improvement.
We also conduct compliance training programs for our sales and marketing personnel and perform assessments of our suppliers of raw materials, components and finished goods. In addition, we conduct quality management reviews designed to inform management of key issues that may affect the quality of our products. From time to time, we may determine that products manufactured or marketed by us do not meet our specifications, published standards or regulatory requirements. When a quality issue is identified, we investigate the issue and seek to take appropriate corrective action, such as withdrawal of the product from the market, correction of the product at the customer location, notice to the customer of revised labeling or a combination of these or other corrective actions.
In January 2007, we received ISO 13485 certification and met the requirements under the European Medical Device Directive to use the CE Mark, thereby allowing us to continue to market our products in the European Community. In January 2018 we underwent an audit to update our ISO 13485:2016 and Medical Device Single Audit Program certifications and received our certificates in November 2018. These certificates will need renewal again in January 2022.
Competition
The medical products industry is generally characterized by intense competition and extensive research and development. The market for medical products is subject to rapid change due to an increasingly competitive, cost-conscious environment and to government programs intended to reduce the cost of medical care. Many manufacturers and distributors of medical equipment are large, well-established companies whose resources, reputations and ability to leverage existing customer relationships might give them a competitive advantage over us. We believe that a company’s reputation for producing accurate, reliable and technologically-advanced products, references from users, features (speed, safety, ease of use, patient convenience and range of applicability), product effectiveness and price are the principal competitive factors in the medical products industry.
Our SpO2 products, which measure blood oxygen saturation and included in our MRI compatible IV infusion pump and our MRI compatible vital signs monitor, also compete indirectly with many other methods currently used to measure blood oxygen levels or the effects of low blood oxygen levels.
MRidium MRI Compatible IV Infusion Pump System
We do not believe there is currently any direct competition for our MRI compatible IV infusion pump system. Historically, our only direct competitor in the MRI compatible IV infusion pump market, Bayer Radiology, formerly MEDRAD, Inc., announced during 2013 its decision to remove its competing Continuum pump system from the market, and discontinued support throughout the world in June 2015 due to ongoing regulatory issues. As a result, we believe that our MRidium 3860+ MRI compatible IV infusion pump is the only true MRI compatible IV infusion pump available today.
The medical device and IV infusion market is highly regulated and is typically one of the areas that the FDA scrutinizes closely for new market introductions. Because of this, the FDA 510(k) clearance process for new infusion pumps is usually long and requires significant testing and documentation. This long development timeline coupled with the low market penetration to date may discourage new competitors from undertaking a complex project like building an MRI compatible IV infusion pump. We believe that the market for MRI compatible IV infusion pump products is in relatively early stages of development and may become highly competitive if, and when, the market develops further.
We also compete with manufacturers of “shielded box” solutions that are intended to permit use of conventional IV pumps inside the MRI scanner room. The providers of shielded boxes include B. Braun, Fresenius Kabi, MIPM Mammendorfer Institut für Physik und Medizin and Arcomed.
14
Many of our potential customers opt not to purchase our MRI compatible IV infusion pump systems and instead use makeshift workarounds, such as placing conventional IV infusion devices outside of the MRI scanning room and utilizing extension tubing to reach the patient. To this extent, we are in competition with conventional IV infusion pump manufacturers and distributors.
There are many manufacturers of conventional IV infusion pump devices, and if any of these manufacturers, or other potential competitors, decide to enter into the MRI compatible IV infusion pump market, they may have competitive advantages over us. Many of these potential competitors have established reputations, customer relationships and marketing, distribution and service networks. In addition, they have substantially longer histories in the medical products industry, larger product lines and greater financial, technical, manufacturing, management, and research and development budgets. Many of these potential competitors may have long-term product supply relationships with our potential customers.
MRI Compatible Patient Vital Signs Monitoring System
There are several manufacturers that have developed competing MRI compatible vital signs monitoring systems that are currently on the market. We believe the dominant competitor with a market-leading position in MRI compatible vital signs monitoring is Invivo Research, Inc., which was founded by Roger Susi, our founder, President, Chief Executive Officer, and Chairman of the Board of Directors. Invivo is now owned by Koninklijke Philips NV (NYSE: PHG).
Other large and well-known companies such as General Electric (NYSE: GE) and Schiller AG, also have competing products as do other smaller privately held companies. Each of these manufacturers have competitive advantages over us as they may have established customer relationships, product supply agreements, longer histories in the MRI monitoring market and several have greater financial, technical, manufacturing, management, and research and development budgets. Additionally, our 3880 MRI compatible patient vital signs monitor is newer to the market relative to these other companies, which may result in customers being reluctant to switch from other well-known and established MRI compatible monitoring systems to ours.
Seasonality
Our business is seasonal. Our third quarter sales have typically been lower, compared to other fiscal quarters, principally because the fiscal quarter coincides with the summer vacation season, in the U.S., Europe and Japan. Additionally, COVID-19 may create changes to customer buying patterns that vary from the historical trend.
Segment Information and Geographic Data
Our business operates as one reportable segment. Financial information about geographic areas is presented in Notes 2 and 4 in the Notes to Financial Statements of this Annual Report on Form 10-K.
Research and Development
Our research and development efforts focus on developing innovative products by utilizing our established core competencies in MRI compatible technologies and feedback from strategic relationships with hospitals, acute medical facilities and medical equipment manufacturers for new product ideas. Our research and development efforts are driven by the leadership of our founder, Roger Susi, assisted by engineers and technical professionals with significant experience in product design.
Our research and development expenses were $1.9 million or 6.0 percent of revenue in 2020, $1.4 million or 3.7 percent of revenue in 2019 and $1.5 million or 5.0 percent of revenue in 2018.
Employees
As of December 31, 2020, we had 110 full-time employees, including 32 in manufacturing and service, 43 in sales, marketing and customer support services, 15 in regulatory affairs and quality assurance, 11 in finance and
15
administration and 9 in research and development. No employees are represented by a labor union. We have not experienced any work stoppages and consider our relations with our employees to be good.
Regulatory Matters
Governmental Regulation and Other Matters
Our medical device products are subject to extensive, complex and increasing oversight and regulation by the FDA, and other domestic and foreign governmental authorities. Our manufacturing facility, and those of our suppliers, are subject to periodic inspections to verify compliance with current FDA and other governmental regulatory requirements. If it were determined that we were not in compliance with these laws and regulations, we could be subject to criminal or civil liability, or both, and other material adverse effects. We have compliance programs in place to support and monitor compliance with these laws and regulations. All of our products and facilities and those of our suppliers are subject to drug and medical device laws and regulations promulgated by the FDA and national and supranational regulatory authorities outside the U.S., including, for example, Health Canada’s Health Products and Foods Branch, the U.K.’s Medicines and Healthcare Products Regulatory Agency, and Australia’s Therapeutic Goods Agency. These authorities regulate a range of activities including, among other matters, manufacturing, post-marketing studies in humans, advertising and promotion, product labeling, post-marketing surveillance and adverse event reporting.
Regulation of Medical Devices in the United States
The development, manufacture, sale and distribution of our medical device products are subject to comprehensive governmental regulation. Most notably, all of our medical devices sold in the United States are subject to the Food, Drug, and Cosmetic Act of 1938, as amended (“FDC Act”), as implemented and enforced by the FDA. The FDA, and in some cases other government agencies, such as the U.S. Federal Communications Commission (“FCC”), administer requirements covering the design, testing, safety, effectiveness, manufacturing, labeling, promotion and advertising, distribution and post-market surveillance of our products.
Unless an exemption applies, each medical device that we market must first receive either premarket notification clearance (by making what is commonly called “a 510(k) submission”) or premarket approval (by filing a premarket approval application (“PMA”) from the FDA pursuant to the FDC Act. In addition, certain modifications made to marketed devices also may require 510(k) clearance or approval of a PMA supplement. The FDA’s 510(k) clearance process varies in length and can extend beyond twelve months. The process of obtaining PMA approval is much more costly, lengthy and uncertain. It generally takes from two to three years or even longer. All of our current products that are available in the U.S. were originally cleared through the 510(k) process. We cannot be sure that future products or modifications of current products, will qualify for the 510(k) pathway or whether 510(k) clearance or PMA approval will be obtained for any future product that we propose to market.
In December 2014, the FDA issued guidance entitled “Infusion Pumps Total Product Life Cycle.” This guidance established substantial additional pre-market requirements for new and modified infusion pumps. Through this guidance, the FDA indicated more data demonstrating product safety will be required for future 510(k) submissions for infusion pumps, including the potential for more clinical and human factors data. The impact of this guidance is likely to result in a more time consuming and costly process to obtain regulatory clearance to market infusion pumps. In addition, new requirements beyond the 2014 guidance document could result in longer delays for the clearance of new products, modification of existing infusion pump products or remediation of existing products in the market. Future delays in the receipt of, or failure to obtain, approvals could result in delayed or no realization of product revenues.
After a device is placed on the market, numerous regulatory requirements continue to apply. Those regulatory requirements include the following: product listing and establishment registration; adherence to the Quality System Regulation (“QSR”), which requires stringent design, testing, control, documentation and other quality assurance procedures; labeling requirements and FDA prohibitions against the promotion of off-label uses or indications; adverse event reporting; post-approval restrictions or conditions, including post-approval study commitments; post-market surveillance requirements; the FDA’s recall authority, whereby it can ask for, or require, the recall of products from the market; and requirements relating to voluntary corrections or removals.
All aspects of our manufacturing and distribution of regulated products and those of our suppliers are subject to substantial governmental oversight. Facilities used for the production, packaging, labeling, storage and distribution of
16
medical devices must be registered with the FDA and other regulatory authorities. All manufacturing activities for these products must be conducted in compliance with current good manufacturing practices (“cGMPs”). Our manufacturing facilities and those of our suppliers are subject to periodic, routine and for-cause inspections to verify compliance with cGMPs. If, upon inspection, the FDA or another regulatory agency finds that a manufacturer has failed to comply with cGMPs, it could institute a wide variety of enforcement actions, ranging from a public warning letter to more severe sanctions, such as product recalls or seizures, monetary sanctions, consent decrees, injunctions to halt manufacturing and distributing products, civil or criminal sanctions, refusal to grant clearances or approvals or delays in granting such clearances or approvals, import detentions of products made outside of the United States, restrictions on operations or withdrawal or suspension of existing approvals. The FDA also has the authority to request repair, replacement or refund of the cost of any medical device manufactured or distributed by us. These actions could result in, among other things, substantial modifications to our business practices and operations; a total or partial shutdown of production in one or more facilities while we or our suppliers remedy the alleged violation; the inability to obtain future pre-market clearances or approvals; and withdrawals or suspensions of current products from the market. Any of these events could disrupt our business and have a material adverse effect on our revenues, profitability and financial condition.
Product Recalls
We have made substantial investments in quality systems and we will continue to make improvements to our products and systems to further reduce potential issues related to patient safety and avoid recalls in the future. Product quality plays a critical role in our success. While we believe that we have made significant improvements to our product quality and overall quality systems, further quality concerns, whether real or perceived, could adversely affect our results. Conversely, improving quality can be a competitive advantage and improve our results. For more information about risks related to these matters, see the section captioned “Defects or failures associated with our products and/or our quality control systems could lead to the filing of adverse event reports, recalls or safety alerts and negative publicity and could subject us to regulatory actions” in the “Risk Factors” section.
Healthcare Fraud and Abuse Laws
As a manufacturer and distributor of medical devices to hospitals and other healthcare providers, we and our customers are subject to laws which apply to Medicare, Medicaid, and other federal and state healthcare programs in the U.S. One such law, the Anti-kickback Statute, prohibits the solicitation, offer, payment or receipt of remuneration in return for referral or purchase, or in return for the recommending or arranging for the referral or purchase, of products covered by the programs. The Anti-kickback Statute provides a number of exceptions or “safe harbors” for particular types of transactions. While we generally do not file claims for reimbursement from government payers, the U.S. federal government has asserted theories of liability against manufacturers under the Federal False Claims Act, which prohibits the submission of false claims to Medicare, Medicaid, and other state and federal programs. Many states have similar fraud and abuse laws which may apply to us. Violations of these fraud and abuse-related laws are punishable by criminal or civil sanctions, including substantial fines, imprisonment and exclusion from participation in healthcare programs such as Medicare and Medicaid and health programs outside the United States. We have developed and implemented business practices and processes to train our personnel to perform their duties in compliance with healthcare fraud and abuse laws. While we conduct informal oversight to detect and prevent these types of fraud and abuse, we lack formal written policies and procedures at this time. If we were unable to document and implement the controls and procedures required in a timely manner or otherwise violate such laws, we might suffer adverse regulatory consequences or face criminal sanctions, which could harm our operations, financial reporting or financial results.
Regulation of Medical Devices Outside of the United States
Medical device laws also are in effect in many of the non-U.S. markets in which we do business. These laws range from comprehensive device approval requirements for some or all of our products to requests for product data or certifications. Inspection of and controls over manufacturing, as well as monitoring of device-related adverse events, also are components of most of these regulatory systems. Most of our business is subject to varying degrees of governmental regulation in the countries in which we operate, and the general trend is toward increasingly stringent regulation balanced with a goal of optimizing international harmonization. For example, the European Union (“EU”), which currently relies on independent third parties, (called “Notified Bodies”) rather than governmental authorities to review and certify medium and high-risk medical devices, is moving to more governmental oversight of medical devices. Currently, the regulatory requirements for a broad spectrum of medical devices are covered in three European
17
Medical Device Directives (adopted in the 1990’s) with which manufacturers must comply in order to receive a CE Certificate of Conformity (“CE Mark”) from a Notified Body. Only certified medical devices bearing a CE Mark can be sold in the EU and European Free Trade Association (“EFTA”) countries and Turkey. EFTA includes Iceland, Norway, Principality of Liechtenstein and Switzerland.
In May 2017, the European Union (the "EU") implemented a new regulatory scheme for medical devices under the Medical Device Regulation ("MDR"). The MDR becomes effective in May 2021, however our CE Certificates are valid through May 2024, allowing us to continue shipping our products into the EU after the effective date of the MDR. MDR will bring significant new requirements for many medical devices, including enhanced requirements for clinical evidence and documentation, increased focus on device identification and traceability, new definitions and registration of economic operators throughout the distribution chain, and additional post-market surveillance and vigilance. Compliance with the MDR will require re-certification of our products to the enhanced standards and may result in substantial additional expense. If these measures are unable to be taken, it may no longer be possible to place such devices on the EU market. Additionally, we may lose our current quality system certification due to ISO Registrar difficulties as European authorities increase regulatory pressure or increased scrutiny resulting from MDR. The loss of the quality system certification may prevent product shipments to the EU and to other foreign markets, such as Canada, which could significantly lower our revenues from foreign sales while we take remedial measures.
The EU has enacted legislation restricting the use of hazardous substances in electronic equipment (Directive 2011/65/EU, referred to as “RoHS 2”), such as our devices. The application of RoHS 2 to medical devices became effective as of July 22, 2014. Our products are compliant with RoHS 2. If we are unable to remain compliant with RoHS 2, there may be an interruption of sales to the EU, which could significantly lower our revenues from foreign sales while we take remedial measures.
Additionally, on June 23, 2016, the electorate in the United Kingdom voted in favor of leaving the EU, commonly referred to as “Brexit.” The United Kingdom officially withdrew from the EU on January 31, 2020. This referendum has created political and economic uncertainty that could persist for years, particularly in the United Kingdom and the EU, as many of the details of the separation have yet to be addressed. Since a significant portion of the regulatory framework in the United Kingdom is derived from EU directives and regulations, the referendum could materially impact the regulatory regime with respect to our products in the United Kingdom or the EU. Any delay in obtaining, or an inability to obtain, any device certifications, product marketing approvals, or other regulatory authorizations as a result of Brexit or otherwise, could prevent us from commercializing our products in the United Kingdom and/or the EU and affect our operations and financial results.
The ultimate effects of Brexit are uncertain and will depend on any agreements the United Kingdom makes to retain access to EU markets either during a transitional period or more permanently. Brexit could adversely affect European and worldwide economic and market conditions and could contribute to instability in global financial and foreign exchange markets. Uncertainty over the terms of the United Kingdom’s departure from the EU could harm our business and financial results. In addition, other EU member countries may consider referendums regarding their EU membership. Any of these effects of Brexit, and others we cannot anticipate, could adversely affect our business, results of operations and financial condition.
Anti-Bribery Laws
Our global activities are subject to the U.S. Foreign Corrupt Practices Act, the U.K. Bribery Act, and other countries’ anti-bribery laws that have been enacted in support of the Organization for Economic Cooperation and Development’s Anti-bribery Convention. These laws generally prohibit companies and their intermediaries from making improper payments to non-U.S. government officials with the intent to inappropriately gain a business advantage. They also require companies to maintain accurate books and records and internal financial controls. The U.K. Bribery Act also prohibits commercial bribery and makes it a crime for a company to fail to prevent bribery. Companies have the burden of proving that they have adequate procedures in place to prevent bribery. The enforcement of such laws in the U.S. and elsewhere has increased dramatically in the past few years, and authorities have indicated that the pharmaceutical and medical device industry is a significant focus for enforcement efforts.
Because of the predominance of government-sponsored healthcare systems around the world, many of our customer relationships outside of the United States are with governmental entities. Our policies mandate strict
18
compliance with the anti-bribery laws. We operate in many parts of the world that have experienced governmental corruption to some degree, and in certain circumstances strict compliance with anti-bribery laws may conflict with local customs and practices.
Transparency Laws in the U.S. and Other Countries
There are numerous requirements imposed by states in the U.S. on the interaction of pharmaceutical and medical device companies with physicians. For example, several states and the District of Columbia either require the tracking and reporting of specific types of interactions with healthcare professionals or restrict such interactions. A similar requirement was imposed at the federal level under the “sunshine” provision of Patient Protection and Affordable Care Act, (the “Sunshine Provisions”), to track and report payments and “transfers of value” to U.S. physicians or teaching hospitals by manufacturers of medical products that are available for reimbursement by a federal insurer.
Other Laws
We are also subject to a variety of other laws, directives and regulations in and outside of the U.S., including those related to the following:
| ● | environmental laws and regulations; |
| ● | the safety and health laws of the U.S. Occupational Safety and Health Act, which sets forth requirements for workplace conditions; |
| ● | California’s Proposition 65, which sets forth a list of substances that are deemed by the State of California to pose a risk of carcinogenicity or birth defects; and |
| ● | various customs, export control, anti-boycott and trade embargo laws and regulations administered by U.S. and foreign government agencies, including the U.S. Customs and Border Protection, the Bureau of Industry and Security, the Department of Commerce and the Office of Foreign Assets Control Treasury Department, as well as others. |
Despite our training and compliance program, our internal control policies and procedures may not always protect us from reckless or criminal acts committed by our employees or agents in violation of any of these laws.
19
ITEM 1A. | RISK FACTORS |
We operate in a rapidly changing environment that involves a number of risks that could materially affect our business, financial condition or future results, some of which are beyond our control. The occurrence of any of these risks could harm our business, financial condition, results of operations and/or growth prospects or cause our actual results to differ materially from those contained in forward-looking statements we have made in this report and those we may make from time to time. In evaluating the Company and its business, you should carefully consider the information included under Part I, Item 1A “Risk Factors” in this Annual Report on Form 10-K for the fiscal year ended December 31, 2020.
Risk Factors Summary
The following is a summary of the risk factors that could materially affect our business, financial condition or future results, all of which are more fully described below. This summary should be read in conjunction with the “Risk Factors” described below and should not be relied upon as a complete summary of the material risks facing our business.
Risks Relating to Our Business and Financial Condition
| ● | The COVID-19 pandemic or other public health crises. |
| ● | Our dependence on a limited number of products, and disruptions in our ability to sell these products. |
| ● | Securities class action litigation or derivative litigation. |
| ● | Sufficiency of our internal and external sources of liquidity. |
| ● | Dependence upon the integrity of our supply chain, including multiple single-source suppliers. |
| ● | Our reliance on third-party suppliers for certain of our raw materials and components. |
| ● | The strict adherence to regulatory requirements governing medical devices during the manufacturing process and that of suppliers. |
| ● | Our markets are very competitive and we sell certain of our products in a mature market. |
| ● | We manufacture and store our products at a single facility in Florida. |
| ● | Our inability to collect on our accounts receivables held by customers. |
| ● | Failure to maintain relationships with Group Purchasing Organizations. |
| ● | Cost-containment efforts of our customers and purchasing groups. |
| ● | A failure in our efforts to access and educate clinicians, anesthesiologists, radiologists, and hospital administrators regarding the advantages of our products. |
| ● | The lengthy sales cycle for medical devices could delay our sales. |
| ● | Our reliance on distributors to sell our products outside of the U.S. |
| ● | Successful development and commercialization of enhanced products or new products to remain competitive. |
| ● | Our dependency on our founder, Chairman, President and Chief Executive Officer, Roger Susi. |
| ● | Failure to attract and retain the talent required for our business. |
| ● | Inability to scale our operations. |
| ● | Our engagement in related party transactions. |
| ● | Difficulties associated with integrating acquisitions of technologies, products and businesses. |
20
| ● | Difficulties associated with accurately forecasting our business performance. |
| ● | Inherent uncertainties involved in estimates, judgments and assumptions used in the preparation of financial statements in accordance with GAAP. |
| ● | Changes in effective tax rates or adverse outcomes resulting from examination of our income or other tax returns. |
| ● | We are subject to various privacy and consumer protection laws. |
Risks Related to Our Industry
| ● | Changes in government regulations could force us to make modifications to how we develop, manufacture, market and price our products. |
| ● | Failure to obtain, or experience significant delays in obtaining, FDA clearances or other necessary approvals to commercially distribute new products. |
| ● | Risks associated with doing business outside of the U.S. |
| ● | We may incur product liability losses or become subject to other lawsuits related to our products, business, and insurance coverage could be inadequate or unavailable to cover these losses. |
| ● | Defects or failures associated with our products and/or our quality control systems. |
| ● | Our products or product types, or MR imaging could be subject to negative publicity. |
| ● | Impact of U.S. healthcare policy and changes thereto. |
| ● | Healthcare fraud and abuse regulations potentially result in significant liability, require us to change our business practices and restrict our operations in the future. |
| ● | Impact of violations of the U.S. Foreign Corrupt Practices Act and similar worldwide anti-bribery laws. |
| ● | We and our suppliers and customers are required to obtain regulatory approvals to comply with regulations applicable to medical devices and infusion pumps. |
| ● | We and our suppliers and customers are required to maintain compliance with regulations applicable to medical devices and infusion pumps. |
| ● | Our operations are subject to environmental laws and regulations. |
Risks Relating to our Intellectual Property
| ● | Protection of our intellectual property. |
| ● | Our unpatented trade secrets, know-how, confidential and proprietary information, and technology may be inadequately protected. |
| ● | Uncertainties associated with timely patent reviews and approvals. |
| ● | We may become involved in patent litigation or other intellectual property proceedings relating to our future product approvals. |
| ● | Disclosure of confidential or proprietary information. |
Risks Related to Ownership of Our Common Stock
| ● | Significant fluctuations and volatility of our common stock. |
| ● | Use of capital to repurchase shares of our common stock. |
21
| ● | Our need or choice to raise additional capital in the future. |
| ● | The ability of Roger Susi, who serves as our Chairman of the Board of Directors, President and Chief Executive Officer, to exert significant influence over matters subject to stockholder approval. |
| ● | Payment of dividends. |
| ● | The requirements of being a public company may strain our resources, divert management’s attention and affect our ability to attract and retain executive management and qualified board members. |
| ● | Failure to develop and maintain adequate internal controls or to implement new or improved controls. |
| ● | Impact of being a public company on our competitive environment and our risk of potential litigation. |
| ● | Impact from our involvement in securities class action litigation. |
| ● | Impact of securities or industry analysts’ failing to initiate research coverage of our stock, downgrading our stock, or discontinuing coverage. |
| ● | Our charter documents and Delaware law have provisions that may discourage an acquisition of us by others and may prevent attempts by our stockholders to replace or remove our current management. |
Risks Relating to Our Business and Financial Condition
Our business, financial condition and operations may be materially adversely affected by the COVID-19 pandemic or other public health crises.
The COVID-19 pandemic, and the resulting restrictions intended to slow the spread of COVID-19, including stay-at-home orders, business shut downs and other restrictions, has and will likely continue to adversely affect our business in a number of ways. To respond to the demands of managing COVID-19 and the resulting economic uncertainties, healthcare organizations may be forced to adjust spending priorities by increased spending related to COVID-19, which may have a significant effect on the demand and available budget for our products and related services. The financial strains on healthcare systems may also lead to an increased risk of delays in customer payments. In addition, a recession resulting from the spread of COVID-19 could materially affect our business, especially if a recession results in higher unemployment causing potential patients to not have access to health insurance. Our ability to generate sales may be further disrupted by hospitals restricting access to hospital workers only. A decline in operating results has limited and could further limit our generation of capital resources and cause financial stress if we are unable to increase revenues or adjust our costs appropriately to changes in revenue. We believe that COVID-19’s adverse impact on our operating results, cash flows and financial condition will be primarily driven by the severity and duration of the pandemic and its impact on the U.S. and global economy.
In addition to adversely impacting demand for our products, COVID-19 or other public health crises could have an adverse impact on our manufacturing capacity, supply chains, and distribution systems as we and other businesses and governments take preventative and precautionary measures designed to slow the spread of COVID-19. We could experience other negative impacts of COVID-19 relating to lack of availability of our key personnel or temporary closures of our office or the facilities of our suppliers or third-party service providers.
The future progression of the COVID-19 pandemic and its resulting impacts on our customers, sales activity, supply chain and distribution networks are highly uncertain at this time. However, the foregoing and other disruptions as a result of COVID-19 could have a material adverse effect on our business, operating results and financial condition, especially to the extent these impacts persist or exacerbate over an extended period of time.
Our financial performance is significantly dependent on a limited number of products, and disruptions in our ability to sell these products may have a material adverse effect on our business.
Our current revenue and profitability are significantly dependent on the sale of the MRidium 3860+ MRI compatible IV infusion pump system, the 3880 MRI compatible patient vital signs monitoring system (both Class II medical devices) and the ongoing sale of related disposables and services.
22
In the past, the FDA issued us a warning letter that impacted our ability to commercially distribute our MRidium 3860+ MRI compatible IV infusion pump system. Although we have resolved this warning letter and resumed commercial distribution of the MRidium 3860+ MRI compatible IV infusion pump system, there can be no guarantee that the FDA will not take similar action in the future. The FDA could require us to cease shipment of our products, notify health professionals and others that the devices present unreasonable risk or substantial harm to public health, order a recall, repair, replacement, or refund of the devices, detain or seize adulterated or misbranded medical devices, or ban the medical devices. The FDA may also issue further warning letters or untitled letters, refuse future requests for 510(k) submission or premarket approval, revoke existing 510(k) clearances or premarket approvals previously granted, impose operating restrictions, enjoin and restrain certain violations of applicable law pertaining to medical devices and assess civil or criminal penalties against our officers, employees, or us.
Our products could be rendered obsolete or economically impractical by numerous factors, many of which are beyond our control, including but not limited to:
| ● | entrance of new competitors into our markets; |
| ● | technological advancements of MRI scanners; |
| ● | technological developments such as new imaging modalities which render MRI procedures obsolete or reduce the instances where MRI imaging is utilized; |
| ● | loss of key relationships with suppliers, group purchasing organizations, or end-user customers; |
| ● | manufacturing or supply interruptions; |
| ● | product liability claims; |
| ● | our reputation and product market acceptance; |
| ● | loss of existing regulatory approvals or the imposition of new requirements to maintain such approvals; and |
| ● | product recalls or safety alerts. |
Any major factor adversely affecting the sale of our products or services would cause our revenues to decline and have a material adverse impact on our business, financial condition and our common stock.
We have significant international sales as well as international supply chain links and we face risks related to health epidemics that could adversely affect our revenue.
Our business could be adversely impacted by the effects of COVID-19 or other epidemics. The COVID-19 pandemic has negatively impacted our revenues and may continue to do so in the future. With respect to our sales, some customers that are implementing heightened security policies have inhibited the ability of our domestic sales force and international distributors to access hospitals for purposes of selling our products. This has caused delays of orders for our products and negatively affected our revenues. These heightened security policies and delays of orders may continue into the future.
Our materials suppliers could also be disrupted by conditions related to COVID-19, or other epidemics, possibly resulting in disruption to our supply chain. If our suppliers are unable or fail to fulfill their obligations to us for any reason, we may not be able to manufacture our products and satisfy customer demand or our obligations under sales agreements in a timely manner, and our business could be harmed as a result.
At this point in time, there is uncertainty relating to the potential effect of COVID-19 on our business. Infections may become more widespread or may recur at a later time, there may be variations in the global response to future outbreaks, and inefficiencies of testing and vaccination programs, and, should any one of these limit our ability to timely sell and distribute our products or cause supply disruptions, it would have a negative impact on our business, financial condition and operating results. In addition, a significant health epidemic could adversely affect the economies and financial markets of many countries, resulting in an economic downturn that could affect demand for our products which could have a material adverse effect on our business, operating results and financial condition.
23
We have been subject to securities class action litigation and derivative litigation and we may be subject to similar or other litigation in the future.
In the past, following adverse action by the FDA or volatility in our stock price, securities class action litigation has been brought against us. There can be no assurance that we will not face other securities litigation in the future. With respect to any litigation, our insurance may not reimburse us or may not be sufficient to reimburse us for the expenses or losses we may suffer in contesting and concluding such lawsuits. A decision adverse to our interests on these actions or resulting from these matters could result in the payment of substantial damages and could have a material adverse effect on our business, financial condition and our common stock. Regardless of the outcome, these claims may result in injury to our reputation, significant costs, diversion of management’s attention and resources, and loss of revenue.
There is no assurance that our internal and external sources of liquidity will at all times be sufficient for our cash requirements.
We must have sufficient sources of liquidity to fund our working capital requirements, our capital improvement plans, and execute on our strategic initiatives. A decline in operating results could limit our generation of capital resources and cause financial stresses if we are unable to increase revenues or adjust our costs appropriately to changes in revenue. Further, future new product launches or investments in other growth initiatives may demand increased working capital before any long-term return is realized from increased revenue. Our ability to achieve our business and cash flow plans is based on a number of assumptions which involve significant judgments and estimates of future performance, borrowing capacity and credit availability, which cannot at all times be assured. Accordingly, there is no assurance that cash flows from operations and other internal and external sources of liquidity will at all times be sufficient for our cash requirements. If necessary, we may need to consider actions and steps to improve our cash position and mitigate any potential liquidity shortfall, such as modifying our business plan, pursuing additional financing to the extent available, reducing capital expenditures, pursuing and evaluating other alternatives and opportunities to obtain additional sources of liquidity and other potential actions to reduce costs. There can be no assurance that any of these actions would be successful, sufficient or available on favorable terms. Any inability to generate or obtain sufficient levels of liquidity to meet our cash requirements at the level and times needed could have a material adverse impact on our business and financial position.
Our continued success depends on the integrity of our supply chain, including multiple single-source suppliers, the disruption of which could negatively impact our business.
Many of the component parts of our products are obtained through supply agreements with third parties. Some of these parts require our partners to engage in complex manufacturing processes and involve long lead times or delivery periods. Considering our dependence on third-party suppliers, several of which are single-source suppliers, we are subject to inherent uncertainties and risks related to their ability to produce or deliver parts on a timely basis, to comply with product safety and other regulatory requirements and to provide quality parts to us at a reasonable price.
For example, we are dependent upon a single vendor for the ultrasonic motor at the core of our devices. If this vendor fails to meet our volume requirements, which we anticipate will increase over time, or if the vendor becomes unable or unwilling to continue supplying motors to us, this would impact our ability to supply our devices to customers until a replacement source is secured. Our executed agreement with this vendor provides that the price at which we purchase products from the vendor is determined by agreement from time to time or should material costs change. Although we have had a long history of stable pricing with this supplier, this provision may make it difficult for us to continue to receive motors from this vendor on favorable terms or at all if we do not agree on pricing in the future. In such event, it could materially and adversely affect our commercial activities, operating results and financial condition.
In the near term, we do not anticipate finding alternative sources for our primary suppliers, including single source suppliers. Therefore, if our primary suppliers become unable or unwilling to manufacture or deliver materials, or manufacture or deliver such materials later than anticipated, we could experience protracted delays or interruptions in the supply of materials which would ultimately delay our manufacture of products for commercial sale, which could materially and adversely affect our development programs, commercial activities, operating results and financial condition.
Additionally, any failure by us to forecast demand for, or to maintain an adequate supply of raw materials, parts, or finished products, could result in an interruption in the supply of certain products and a decline in our sales.
24
We rely on third-party suppliers for certain of our raw materials and components.
We rely on unaffiliated third-party suppliers for certain raw materials and components necessary for the manufacturing and operation of our products. Certain of those raw materials and components are proprietary products of those unaffiliated third-party suppliers and are specifically cited in our applications with regulatory agencies so that they must be obtained from that specific sole source or sources and could not be obtained from another supplier unless and until an appropriate application amendment is approved by the regulatory agency.
Among the reasons we may be unable to obtain these raw materials and components include, but are not limited to:
| ● | a supplier’s inability or unwillingness to continue supplying raw materials and/or components; |
| ● | regulatory requirements or action by regulatory agencies or others, including changes in international trade treaties and/or tariffs; |
| ● | adverse financial or other strategic developments at or affecting the supplier, including bankruptcy; |
| ● | unexpected demand for or shortage of raw materials or components; |
| ● | failure of the supplier to comply with quality standards which results in quality and product failures, product contamination and/or recall; |
| ● | discovery of previously unknown or undetected imperfections in raw materials or components; |
| ● | labor disputes or shortages, including from natural disasters and the effects of health emergencies such as COVID-19; and |
| ● | political instability and actual or anticipated military or political conflicts. |
These events could negatively impact our ability to satisfy demand for our products, which could have a material adverse effect on our products’ use and sales and our business and results of operations. We may experience these or other shortages in the future resulting in delayed shipments, supply constraints, contract disputes and/or stock-outs of our products.
The manufacture of our products requires strict adherence to regulatory requirements governing medical devices and if we or our suppliers encounter problems our business could suffer.
The manufacture of our products must comply with strict regulatory requirements governing Class II medical devices in the U.S. and other regulatory requirements in foreign locations. Problems may arise during manufacturing, quality control, storage or distribution of our products for a variety of reasons, including equipment malfunction, failure to follow specific protocols and procedures, manufacturing quality concerns, or problems with raw materials, electromechanical, software and other components, supplier issues, and natural disasters. If problems arise during production, the affected products may have to be discarded. Manufacturing problems or delays could also lead to increased costs, lost sales, damage to customer relations, failure to supply penalties, time and expense spent investigating the cause and, depending on the cause, similar losses with respect to other batches of products. If problems are not discovered before the product is released to the market, voluntary recalls, corrective actions or product liability related costs may also be incurred. Should we encounter difficulties in the manufacture of our products or be subject to a product recall, our business could suffer materially.
Our markets are very competitive and we sell certain of our products in a mature market.
The market for our 3880 MRI compatible patient vital signs monitoring system is well-developed and sales growth for our monitor could be slower than we anticipate. Our vital signs monitoring system could face difficult competition, including competitors offering lower prices, which could have an adverse effect on our revenue and margins. Our competitors may have certain advantages, which include the ability to devote greater resources to the development, promotion, and sale of their products. Consequently, we may need to increase our efforts, and related expenses for research and development, marketing, and selling to maintain or improve our position. We may not realize
25
the per unit revenue we have planned for and expect. Continued sales to our existing customers are expected to be significant to our revenue in the future, and if our existing customers do not continue to purchase from us, our revenue may decline.
We manufacture and store our products at a single facility in Florida.
We manufacture and store our products at a single facility in Winter Springs, Florida. If by reason of fire, hurricane or other natural disaster, or for any other reason, the facility is destroyed or seriously damaged or our access to it is limited, our ability to provide products to our customers would be seriously interrupted or impaired completely and our operating results and financial condition would be materially and negatively affected.
Our inability to collect on our accounts receivables held by customers may have an adverse effect on our business operations and financial condition.
We market our products to end users in the United States and to distributors internationally. Sales to end users in the United States are generally made on open credit terms. Management maintains an allowance for potential credit losses. From time to time, we have had, and may in the future have, accounts receivables from one or more customers that accounted for 10 percent or more of our gross accounts receivable. As a result, we may be exposed to a certain level of concentration of credit risk. If a major customer experiences financial difficulties, the effect on us could be material and have an adverse effect on our business, financial condition and results of operations. Additionally, COVID-19 may cause delays in payments from customers, which may adversely impact our future results of operations and liquidity.
If we fail to maintain relationships with Group Purchasing Organizations, sales of our products could decline.
Our ability to sell our products to U.S. hospitals, acute care facilities and outpatient imaging centers depends in part on our relationships with Group Purchasing Organizations (“GPOs”). Many existing and potential customers for our products are members of GPOs. GPOs negotiate pricing arrangements and contracts, which are sometimes exclusive, with medical supply manufacturers and distributors, and these negotiated prices are made available to a GPO’s affiliated hospitals and other members. We pay the GPOs an administrative fee in the form of a percentage of the volume of products sold to their affiliated hospitals and other members. If we are not an approved provider selected by a GPO, affiliated hospitals and other members may be less likely to purchase our products. Should a GPO negotiate a sole source or bundling contract covering a future or current competitor’s products, we may be precluded from making sales of our competing products to members of that GPO for the duration of the contractual arrangement. For example, even if we have an existing contract with a GPO for sales of our MRidium 3860+ MRI compatible IV infusion pump, we may encounter difficulties in selling, or be unable to sell, our 3880 MRI compatible patient vital signs monitoring system to that GPO’s affiliated hospitals and other members, which may result in a longer sales cycle or an inability to sell. Our failure to renew contracts with GPOs may cause us to lose market share and could have a material adverse effect on our sales, financial condition and results of operations. In the future, if another competitive supplier emerges, and we fail to keep our relationships and develop new relationships with GPOs, our competitive position would likely suffer.
Cost-containment efforts of our customers and purchasing groups could adversely affect our sales and profitability.
Our MRI compatible medical devices are considered capital equipment by many potential customers, and hence changes in the budgets of healthcare organizations and the timing of spending under these budgets and conflicting spending priorities, such as spending related to COVID-19, may have a significant effect on the demand for our products and related services. Any decrease in expenditures by these healthcare facilities could decrease demand for our products
26
and related services and reduce our revenue. Additionally, changes to reimbursement policies by third-party payors could also decrease demand for our products and related services and reduce our revenue.
Any failure in our efforts to access and educate clinicians, anesthesiologists, radiologists, and hospital administrators regarding the advantages of our products could significantly limit our product sales.
We believe our future success will require us to educate a sufficient number of clinicians, anesthesiologists, radiologists, hospital administrators and other purchasing decision-makers about our products and the costs and benefits of our products. If we fail to demonstrate the safety, reliability and economic benefits of our products to hospitals and acute medical facilities, our products may not be adopted and our expected and actual sales would suffer.
The lengthy sales cycle for medical devices could delay our sales.
The decision-making process of customers is often complex and time-consuming. Based on our experience, we believe the period between initial discussions with customers regarding our products and a customer’s purchase of our products have varied widely and have historically ranged between three and six months in duration, with more recent cycles lengthening beyond this historical range due to COVID-19. Sales cycles can also be delayed because of capital budgeting procedures. Moreover, even if one or two units are sold to a hospital, we believe that it will take additional time and experience with our products before other medical professionals routinely use them for other procedures and in other departments of the hospital. Such time would delay potential sales of additional units and disposable products or additional optional accessories to that medical facility or hospital. These delays could have an adverse effect on our business, financial condition and results of operations.
Because we rely on distributors to sell our products outside of the U.S., our revenues could decline if our existing distributors do not continue to purchase products from us or if our relationship with any of these distributors is terminated.
We rely on distributors for all our sales outside the U.S. and hence do not have direct control over foreign sales activities. These distributors also assist us with regulatory approvals and the education of physicians and government agencies. Our revenues outside the U.S. have recently represented approximately one-fifth of our net revenues. If our existing international distributors fail to sell our products or sell at lower levels than we anticipate, we could experience a decline in revenues or fail to meet our forecasts. We cannot be certain that we will be able to attract new international distributors nor retain existing ones that market our products effectively or provide timely and cost-effective customer support and service. None of our existing distributors are obligated to continue selling our products.
If we do not successfully develop and commercialize enhanced products or new products that remain competitive, we could lose revenue opportunities and customers, and our ability to achieve growth would be impaired.
The medical device industry is characterized by rapid product development and technological advances, which places our products at risk of obsolescence. Our long-term success depends upon the development and successful commercialization of new products, new or improved technologies and additional applications for MRI compatible infusion, therapeutic, diagnostic and safety products and services. The research and development process is time-consuming and costly and may not result in products or applications that we can successfully commercialize. If we do not successfully adapt our technology, products and applications, we could lose revenue opportunities and customers. In addition, we may not be able to improve our products or develop new products or technologies quickly enough to maintain a competitive position in our markets and continue to grow our business.
We are highly dependent on our founder, Chairman, President and Chief Executive Officer, Roger Susi.
We believe that Mr. Susi will play a significant role in the development of new products. Our current and future operations could be adversely impacted if we were to lose his services. Accordingly, our success will be dependent on appropriately managing the risks related to maintaining his continued services.
If we fail to attract and retain the talent required for our business, our business could be materially harmed.
Competition for highly skilled personnel is often intense in the medical device industry, including in the MRI compatible medical device segment. If our current employees with experience in the MRI compatible device industry leave our company, we may have difficulty finding replacements with an equivalent amount of experience and skill,
27
which could harm our operations. Our future success will also depend in part on our ability to identify, hire and retain additional personnel, including executives, skilled engineers to develop new products and sales and production staff. We may not be successful in attracting, integrating or retaining qualified personnel to meet our current growth plans or future needs. Our productivity may be adversely affected if we do not integrate and train our new employees quickly and effectively.
Any one of our executive officers or other key employees could terminate his or her relationship with us at any time. The loss of one or more of our executive officers or key employees, and any failure to have in place and execute an effective succession plan for key executive officers, could significantly delay or prevent us from achieving our business and/or development objectives and could materially harm our business. Changes in our executive management team may also cause disruptions in, and harm to, our business.
We may also have difficulty finding and retaining qualified Board members. Any failure to do so could be perceived negatively and could adversely affect our business.
Also, to the extent we hire personnel from competitors, we may be subject to allegations that we have improperly solicited, or that they have divulged proprietary or other confidential information, or that their former employers own their inventions or work product.
We may be unable to scale our operations successfully.
We are working to expand our size and scale via more penetration of existing markets and the launch of new complementary products and updates to existing products. This growth, if it occurs as planned, will place significant demands on our management and manufacturing capacity, as well as our financial, administrative and other resources. We cannot guarantee that any of the personnel, systems, procedures and controls we put in place will be adequate to support the manufacture and distribution of our products. Our operating results will depend substantially on the ability of our officers and key employees to manage changing business conditions and to implement and improve our financial and administrative systems and manage other resources. If we are unable to respond to and manage changing business conditions, or the scale of our products, services and operations, then the quality of our services, our ability to retain key personnel and our business could be harmed.
We engage in related party transactions, which result in a conflict of interest involving our management.
We have engaged in the past, and continue to engage, in related party transactions, particularly between our company and Roger Susi and his affiliates. The only significant ongoing related party transaction is the lease agreement between our company and Susi, LLC, an affiliate of Roger Susi, with respect to our sole production and headquarters facility in Winter Springs, Florida. Related party transactions present difficult conflicts of interest, could result in disadvantages to our company and may impair investor confidence, which could materially and adversely affect us. Related party transactions could also cause us to become materially dependent on related parties in the ongoing conduct of our business, and related parties may be motivated by personal interests to pursue courses of action that are not necessarily in the best interests of our company and our stockholders.
Any acquisitions of technologies, products and businesses, may be difficult to integrate, could adversely affect our relationships with key customers, and/or could result in significant charges to earnings.
We plan to periodically review potential acquisitions of technologies, products and businesses that are complementary to our products and that could accelerate our growth. However, our company has never completed an acquisition and there can be no assurance that we will be successful in finding any acquisitions in the future. The process of identifying, executing and realizing attractive returns on acquisitions involves a high degree of uncertainty. Acquisitions typically entail many risks and could result in difficulties in integrating operations, personnel, technologies and products. If we are not able to successfully integrate our acquisitions, we may not obtain the advantages and synergies that the acquisitions were intended to create, which may have a material adverse effect on our business, results
28
of operations, financial condition and cash flows, our ability to develop and introduce new products and the market price of our stock.
The environment in which we operate makes it increasingly difficult to accurately forecast our business performance.
Significant changes and volatility in most aspects of the current business environment, including financial markets, consumer behavior, speed of technological, regulatory and competitive changes, and the continued impact of COVID-19, make it increasingly difficult for us to predict our revenues and earnings into the future. Our quarterly sales and profits depend substantially on the volume and timing of orders fulfilled during the quarter, and such orders are difficult to forecast. Product demand is dependent upon the capital spending budgets of our customers and prospects as well as government funding policies and matters of public policy as well as product and economic cycles that can affect the spending decisions of these entities. As a result, any revenue, earnings or financial guidance or outlook which we have given or might give may turn out to be inaccurate. Though we endeavor to give reasonable estimates of future revenues, earnings and financial information at the time we give such guidance, based on then-current conditions, there is a significant risk that such guidance or outlook will turn out to be incorrect. Historically, companies that have overstated their operating guidance have suffered significant declines in their stock price when such results are announced to the public.
There are inherent uncertainties involved in estimates, judgments and assumptions used in the preparation of financial statements in accordance with GAAP. Furthermore, portions of GAAP require the use of fair value models which are variable in application and methodology from appraiser to appraiser. Any changes in estimates, judgments and assumptions used could have a material adverse effect on our business, financial position and operating results.
The preparation of financial statements in conformity with GAAP requires management to make estimates and assumptions that affect the amounts reported in the financial statements and accompanying notes. Such assumptions and estimates include those related to revenue recognition, accruals for product returns, allowances for doubtful accounts, valuation of inventory, impairment of intangibles and long-lived assets, accounting for leases, accounting for income taxes and stock-based compensation and allowances for uncertainties. These factors are also influenced by regular changes to GAAP, some of which are material to most companies. These changes introduce risk to our financial reporting processes due to implementation and internal control implications.
We base the aforementioned estimates on historical experience and on various other assumptions that we believe to be reasonable under the circumstances, as discussed in greater detail in the section titled “Management’s Discussion and Analysis of Financial Condition and Results of Operations.” Our actual operating results may differ and fall below our assumptions and the financial forecasts of securities analysts and investors, resulting in a significant decline in our stock price.
Changes in effective tax rates or adverse outcomes resulting from examination of our income or other tax returns could adversely affect our results.
We are subject to the continuous examination of our income tax returns by the Internal Revenue Service, or IRS, and other tax authorities. It is possible that tax authorities may disagree with certain positions we have taken, and any adverse outcome of such a review or audit could have a negative effect on our financial position and operating results. We regularly assess the likelihood of adverse outcomes resulting from these examinations to determine the adequacy of our provision for income taxes, but the determination of our provision for income taxes and other tax liabilities requires significant judgment by management, and there are transactions where the ultimate tax determination is uncertain. Although we believe that our estimates are reasonable, the ultimate tax outcome may differ from the amounts recorded in our financial statements and may materially affect our financial results in the period or periods for which such determination is made. There can be no assurance that the outcomes from continuous examinations will not have an adverse effect on our business, financial condition, and results of operations.
We are subject to various privacy and consumer protection laws.
Our privacy policy is posted on our website, and any failure by us or our vendor or other business partners to comply with it or with federal, state or international privacy, data protection or security laws or regulations could result in regulatory or litigation-related actions against us, legal liability, fines, damages and other costs. Substantial expenses and operational changes may be required in connection with maintaining compliance with such laws, and in particular
29
certain emerging privacy laws are still subject to a high degree of uncertainty as to their interpretation and application. For example, in May 2018, the General Data Protection Regulation (the “GDPR”) began to fully apply to the processing of personal information collected from individuals located in the European Union. The GDPR has created new compliance obligations and has significantly increased fines for noncompliance. Although we take steps to protect the security of our customers’ personal information, we may be required to expend significant resources to comply with data breach requirements if third parties improperly obtain and use the personal information of our customers or we otherwise experience a data loss with respect to customers’ personal information. A breach of our network security and systems could have negative consequences for our business and future prospects, including possible fines, penalties and damages, reduced customer demand for our products, and harm to our reputation and brand.
Risks Related to Our Industry
We are subject to substantial government regulation that is subject to change and could force us to make modifications to how we develop, manufacture, market and price our products.
The medical device industry is regulated extensively by governmental authorities, principally the FDA in the U.S. and corresponding state and foreign regulatory agencies. The majority of our manufacturing processes are required to comply with quality systems regulations, including current good manufacturing practice requirements that cover the methods and documentation of the design, testing, production, control, quality assurance, labeling, packaging and shipping of our products. Failure to comply with applicable medical device regulatory requirements could result in, among other things, warning letters, fines, injunctions, civil penalties, repairs, replacements, refunds, recalls or seizures of products, total or partial suspensions of production, refusal of the FDA or other regulatory agencies to grant pre-market clearances or approvals for our products, withdrawals or suspensions of future or current clearances or approvals and criminal prosecution.
In addition, our products are subject to pre-clearance requirements by the FDA and similar international agencies that govern a wide variety of product activities from design and development to labeling, manufacturing, promotion, sales and distribution. Compliance with these regulations may be time consuming, burdensome and expensive for us. The failure to obtain, or the loss or suspension of any such pre-approval, would negatively affect our ability to sell our products and harm our anticipated revenues.
Foreign governmental authorities that regulate the manufacture and sale of medical devices have become increasingly stringent and, to the extent we sell our products in foreign countries, we may be subject to rigorous regulation in the future. Regulatory changes could result in restrictions on our ability to carry on or expand our operations, higher than anticipated costs or lower than anticipated revenue.
If we fail to obtain, or experience significant delays in obtaining, FDA clearances or other necessary approvals to commercially distribute new products, our ability to maintain profitability or grow will suffer.
Our current products are Class II medical devices and hence require regulatory pre-market approval by the FDA and other federal and state authorities prior to their sale in the U.S. Similar approvals are required by foreign governmental authorities for sale of our products outside of the U.S., including the EU. We are responsible for obtaining the applicable regulatory approval for the commercial distribution of our products. As part of our strategy, we plan to seek approvals for new MRI compatible products. The process of obtaining approvals is costly and time consuming, and there can be no assurance that we will obtain the required approvals on a timely basis, or at all. Failure to receive approvals for new products will hurt our ability to grow.
We are subject to risks associated with doing business outside of the U.S.
Sales to customers outside of the U.S. have historically comprised of approximately one-fifth of our net revenues and we expect that non-U.S. sales will contribute to future growth. A majority of our international sales originate from Europe and Japan, and we also make sales in Canada, Hong Kong, Australia, Mexico and certain parts of the Middle East. The risks associated with operations outside the U.S. include:
| ● | foreign regulatory and governmental requirements that could change and restrict our ability to manufacture and sell our products; |
30
| ● | possible failure to comply with anti-bribery laws such as the U.S. Foreign Corrupt Practices Act and similar anti-bribery laws in other jurisdictions; |
| ● | foreign currency fluctuations that can impact our financial statements when foreign denominations are translated into U.S. dollars; |
| ● | different local product preferences and product requirements, which might increase with increasing nationalism; |
| ● | trade protection and restriction measures under international trade treaties and via tariffs, and import or export licensing requirements; |
| ● | difficulty in establishing, staffing and managing non-U.S. operations; |
| ● | failure to maintain relationships with distributors, especially those who have assisted with foreign regulatory or government clearances; |
| ● | changes in labor, environmental, health and safety laws; |
| ● | healthcare crises or epidemics; |
| ● | potentially negative consequences from changes in or interpretations of tax laws, including U.S. state and foreign tax jurisdiction responses to recent changes in U.S. federal tax laws; |
| ● | political instability and actual or anticipated military or political conflicts, including instability related to war and terrorist attacks and to political matters such as Brexit; |
| ● | economic instability, inflation, deflation, recession or interest rate fluctuations; |
| ● | uncertainties regarding judicial systems and procedures; and |
| ● | minimal or diminished protection of intellectual property. |
These risks, individually or in the aggregate, could have an adverse effect on our results of operations and financial condition.
We may incur product liability losses, or become subject to other lawsuits related to our products, business, and insurance coverage could be inadequate or unavailable to cover these losses.
Our business is subject to potential product liability risks that are inherent in the design, development, manufacture and marketing of our medical devices and consumable products. We carry third-party product liability insurance coverage to protect against such risks, but there can be no assurance that our policy is adequate. In the ordinary course of business, we may become the subject of product liability claims and lawsuits alleging that our products have resulted or could result in an unsafe condition or injury to patients. Any product liability claim brought against us, with or without merit, could be costly to defend and could result in settlement payments and adjustments not covered by or in excess of our product liability insurance. We currently have third-party product liability insurance with maximum coverage of $5,000,000; however, such coverage requires a substantial deductible that we must pay before becoming eligible to receive any insurance proceeds. The deductible amount is currently equal to $50,000 per occurrence and $150,000 in the aggregate. We will have to pay for defending product liability or other claims that are not covered by our insurance. These payments could have a material adverse effect on our profitability and financial condition. Product liability claims and lawsuits, safety alerts, recalls or corrective actions, regardless of their ultimate
31
outcome, could have a material adverse effect on our business, financial condition, reputation and on our ability to attract and retain customers. In addition, we may not be able to obtain insurance in the future on terms acceptable to us or at all.
Defects or failures associated with our products and/or our quality control systems could lead to the filing of adverse event reports, recalls or safety alerts and negative publicity and could subject us to regulatory actions.
Safety problems associated with our products could lead to a product recall or the issuance of a safety alert relating to such products and result in significant costs and negative publicity. An adverse event involving one of our products could require us to file an adverse event report with the FDA. Such disclosure could result in reduced market acceptance and demand for all our products, and could harm our reputation and our ability to market our products in the future. In some circumstances, adverse events arising from or associated with the design, manufacture or marketing of our products could result in the suspension or delay of regulatory reviews of our applications for new product approvals or clearances.
We may also voluntarily undertake a recall of our products or temporarily shut down production lines based on internal safety, quality monitoring and testing data. To avoid future product recalls we have made and continue to invest in our quality systems, processes and procedures. We will continue to make improvements to our products and systems to further reduce issues related to patient safety.
However, there can be no assurance our efforts or systems will be sufficient. Future quality concerns, whether real or perceived, could adversely affect our operating results.
Our products or product types, or MR imaging could be subject to negative publicity, which could have a material adverse effect on our financial position and results of operations and could cause the market value of our common stock to decline.
The market’s perception of our products could be harmed if any of our products or similar products offered by others in our industry become the subject of negative publicity due to a product safety issue, withdrawal, recall, or are proven or are claimed to be harmful to patients. The harm to market perception may have a material adverse effect on our business, financial position and results of operations and could cause the market value of our common stock to decline.
Our products are designed for use around MRI scanners. MRI has been an important imaging diagnostic for some time now, however, should traditional MRI technology change materially or decline in usage due to new technologies or concerns about costs or efficacy of MR imaging, our products would suffer as MRI usage and installations declined. Such a matter may also have a material adverse effect on our business, financial position and results of operations and could cause the market value of our common stock to decline.
U.S. healthcare policy and changes thereto, including the Patient Protection and Affordable Care Act, may have a material adverse effect on our financial condition and results of operations.
In 2010 the Patient Protection and Affordable Care Act (ACA) was enacted. While the provisions of the ACA are intended to expand access to health insurance coverage and improve the quality of healthcare over time, other provisions of the legislation, including Medicare provisions aimed at decreasing costs, comparative effectiveness research, an independent payment advisory board and pilot programs to evaluate alternative payment methodologies, are having a meaningful effect on the way healthcare is developed and delivered and could have a significant effect on our business. There had been ongoing litigation and congressional efforts to modify or repeal all or certain provisions of the ACA. We face uncertainties that might result from modification or repeal of any of the provisions of the ACA, or reimposision of any original provisions since removed or relaxed, including as a result of current and future executive orders and legislative actions. We cannot predict what other healthcare programs and regulations will ultimately be implemented at the federal or state level or the effect of any future legislation or regulation in the United States may have on our business.
32
We are subject to healthcare fraud and abuse regulations that could result in significant liability, require us to change our business practices and restrict our operations in the future.
We and our customers are subject to various U.S. federal, state and local laws targeting fraud and abuse in the healthcare industry, including anti-kickback and false claims laws. Violations of these laws are punishable by criminal or civil sanctions, including substantial fines, imprisonment and exclusion from participation in healthcare programs such as Medicare and Medicaid, and Veterans’ Administration health programs and health programs outside the U.S. These laws and regulations are broad in scope and are subject to evolving interpretations, which could require us to alter one or more of our sales or marketing practices. In addition, violations of these laws, or allegations of such violations, could disrupt our business and result in a material adverse effect on our sales, profitability and financial condition. Furthermore, since many of our customers rely on reimbursement from Medicare, Medicaid and other governmental programs to cover a substantial portion of their expenditures, if we or our customers are excluded from such programs as a result of a violation of these laws, it could have an adverse effect on our results of operations and financial condition.
We have developed and implemented business practices and processes to train our personnel to perform their duties in compliance with healthcare fraud and abuse laws and conduct informal oversight to detect and prevent these types of fraud and abuse. However, we lack formal written policies and procedures at this time. If we are unable to formally document and implement the controls and procedures required in a timely manner or we are otherwise found to be in violation of such laws, we might suffer adverse regulatory consequences or face criminal sanctions, which could harm our operations, financial reporting or financial results.
We could be adversely affected by violations of the U.S. Foreign Corrupt Practices Act and similar worldwide anti-bribery laws.
The U.S. Foreign Corrupt Practices Act and similar worldwide anti-bribery laws generally prohibit companies and their intermediaries from making improper payments to non-U.S. officials for the purpose of obtaining or retaining business. We intend to adopt policies for compliance with these anti-bribery laws, which often carry substantial penalties.
We cannot assure you that our internal control policies and procedures always will protect us from reckless or other inappropriate acts committed by our affiliates, employees or agents. Violations of these laws, or allegations of such violations, could have a material adverse effect on our business, financial position and results of operations and could cause the market value of our common stock to decline.
We and our suppliers and customers are required to obtain regulatory approvals to comply with regulations applicable to medical devices and infusion pumps, and these approvals could result in delays or increased costs in developing new products.
In December 2014, the FDA issued guidance entitled “Infusion Pumps Total Product Life Cycle.” This guidance established substantial additional pre-market requirements for new and modified infusion pumps. Through this guidance, the FDA indicated more data demonstrating product safety will be required for future 510(k) submissions for infusion pumps, including the potential for more clinical and human factors data. The process for obtaining regulatory approvals to market infusion pumps and related accessories have become more costly and time consuming. The impact of this guidance is likely to result in a more time consuming and costly process to obtain regulatory clearance to market infusion pumps. In addition, new requirements could result in longer delays for the clearance of new products, modification of existing infusion pump products or remediation of existing products in the market. Future delays in the receipt of, or failure to obtain, approvals could result in delayed or no realization of product revenues.
We and our suppliers and customers are required to maintain compliance with regulations applicable to medical devices and infusion pumps, and it could be costly to comply with these regulations and to develop compliant products and processes. Failure to comply with these regulations could subject us to sanctions and could adversely affect our business.
Even if we are able to obtain approval for introducing new products to the market, we and our suppliers may not be able to remain in compliance with applicable FDA and other material regulatory requirements once clearance or approval has been obtained for a product. These requirements include, among other things, regulations regarding manufacturing practices, product labeling, off-label marketing, advertising and post-marketing reporting, adverse event reports and field alerts. Compliance with these FDA requirements is subject to continual review and is monitored
33
through periodic inspections by the FDA. For example, the FDA conducted routine inspections of our facility in Winter Springs, Florida in July 2016. The FDA issued a Form 483 on July 18, 2016 resulting from an inspection of our facility between July 11 and July 18, 2016 that identified three observations. These observations were related to procedural and documentation issues associated with the CAPA system, vendor requirements and complaint investigation.
We submitted responses to the Form 483 in August 2016 and October 2016 in which we described our proposed corrective and preventative actions to address each of the observations. As part of our response, on October 13, 2016 we initiated a customer follow up to our August 2012 Safety Alert and made available an updated instruction card for customers. This Safety Alert was closed in August 2019.
In addition, manufacturing flaws, component failures, design defects, off-label uses or inadequate disclosure of product related information could result in an unsafe condition or the injury or death of a patient. All of these events could harm our sales, margins and profitability in the affected periods and may have a material adverse effect on our business. Any adverse regulatory action or action taken by us to maintain appropriate regulatory compliance, with respect to these laws and regulations could disrupt our business and have a material adverse effect on our sales, profitability and financial condition. Furthermore, an adverse regulatory action with respect to any of our products or operating procedures or to our suppliers’ manufacturing facilities could materially harm our reputation in the marketplace.
Our operations are subject to environmental laws and regulations, with which compliance is costly and which exposes us to penalties for non-compliance.
Our business, products, and product candidates are subject to federal, state, and local laws and regulations relating to the protection of the environment, worker health and safety and the use, management, storage, and disposal of hazardous substances, waste, and other regulated materials. These environmental laws and regulations could require us to pay for environmental remediation and response costs at third-party locations where we dispose of or recycle hazardous substances. The costs of complying with these various environmental requirements, as they now exist or as may be altered in the future, could adversely affect our financial condition and results of operations.
Risks Relating to our Intellectual Property
Our success depends on our ability to protect our intellectual property.
We intend to rely on a combination of patents, trademarks, trade secrets, know-how, license agreements and contractual provisions to establish and protect our proprietary rights to our technologies and products. We cannot guarantee that the steps we have taken or will take to protect our intellectual property rights will be adequate or that they will deter infringement, misappropriation or violation of our intellectual property. We may fail to secure patents that are important to our business, and we cannot guarantee that any pending U.S. trademark or patent application, if ultimately issued, will provide us some relative competitive advantage. Litigation may be necessary to enforce our intellectual property rights and to determine the validity and scope of our proprietary rights.
Any litigation could result in substantial expenses and may not adequately protect our intellectual property rights. In addition, the laws of some of the countries in which our products may in the future be sold may not protect our products and intellectual property to the same extent as U.S. laws, or at all. We may be unable to protect our rights in trade secrets and unpatented proprietary technology in these countries. If our trade secrets become known, we may lose our competitive advantages.
Even if we are able to secure necessary patents in the U.S., we may not be able to secure necessary patents and trademarks in foreign countries in which we sell our products or plan to sell our products. In 2013, the U.S. transitioned to a “first inventor to file” system for patents in which, assuming the other requirements for patentability are met, the first inventor to file a patent application is entitled to a patent. We may be subject to a third-party pre-issuance submission of prior art to the U.S. Patent and Trademark Office, or become involved in opposition, derivation, reexamination, inter parties review or interference proceedings challenging our patent rights or the patent rights of others. An adverse determination in any such submission, proceeding or litigation could reduce the scope of, or invalidate our patent rights, allow third parties to commercialize our technology or products and compete directly with us, without payment to us, or result in our inability to manufacture or commercialize products without infringing third party patent rights.
34
Our unpatented trade secrets, know-how, confidential and proprietary information, and technology may be inadequately protected.
We rely on unpatented trade secrets, know-how and technology. This intellectual property is difficult to protect, especially in the medical device industry, where much of the information about a product must be submitted to regulatory authorities during the regulatory approval process. We seek to protect trade secrets, confidential information and proprietary information, in part, by entering into confidentiality and invention assignment agreements with employees, consultants, and others. These parties may breach or terminate these agreements, and we may not have adequate remedies for such breaches. Furthermore, these agreements may not provide meaningful protection for our trade secrets or other confidential or proprietary information or result in the effective assignment to us of intellectual property, and may not provide an adequate remedy in the event of unauthorized use or disclosure of confidential information or other breaches of the agreements. Despite our efforts to protect our trade secrets and our other confidential and proprietary information, we or our collaboration partners, board members, employees, consultants, contractors, or scientific and other advisors may unintentionally or willfully disclose our proprietary information to competitors.
There is a risk that our trade secrets and other confidential and proprietary information could have been, or could, in the future, be shared by any of our former employees with, and be used to the benefit of, any company that competes with us.
If we fail to maintain trade secret protection or fail to protect the confidentiality of our other confidential and proprietary information, our competitive position may be adversely affected. Competitors may also independently discover our trade secrets. Enforcement of claims that a third party has illegally obtained and is using trade secrets is expensive, time consuming and uncertain. If our competitors independently develop equivalent knowledge, methods and know-how, we would not be able to effectively assert our trade secret protections against them, which could have a material adverse effect on our business.
There can be no assurance of timely patent review and approval to minimize competition and generate sufficient revenues.
There can be no assurance that the Patent and Trademark Office will have sufficient resources to review our patent applications in a timely manner. Consequently, even if our patent applications are ultimately successful, our patent applications may be delayed, which would prevent intellectual property protection for our products. If we fail to successfully commercialize our products due to the lack of intellectual property protection, we may be unable to generate sufficient revenues to meet or grow our business according to our expected goals and this may have a materially adverse effect on our profitability, financial condition, and operations.
We may become involved in patent litigation or other intellectual property proceedings relating to our future product approvals, which could result in liability for damages or delay or stop our development and commercialization efforts.
The medical device industry has been characterized by significant litigation and other proceedings regarding patents, patent applications, and other intellectual property rights. The situations in which we may become parties to such litigation or proceedings may include any third parties (which may have substantially greater resources than we have) initiating litigation claiming that our products infringe their patent or other intellectual property rights; in such case, we will need to defend against such proceedings.
The large number of patents, the rapid rate of new patent applications and issuances, the complexities of the technologies involved and the uncertainty of litigation significantly increase the risks related to any patent litigation. Any potential intellectual property litigation also could force us to do one or more of the following:
| ● | stop selling, making, or using products that use the disputed intellectual property; |
| ● | obtain a license from the intellectual property owner to continue selling, making, licensing, or using products, which license may require substantial royalty payments and may not be available on reasonable terms, or at all; |
| ● | pay substantial damages or royalties to the party whose intellectual property rights we may be found to be infringing; |
| ● | pay the attorney fees and costs of litigation to the party whose intellectual property rights we may be found to be infringing; or |
| ● | redesign those products that contain the allegedly infringing intellectual property, which could be costly, disruptive and/or infeasible. |
35
If any of the foregoing events occur, we may have to withdraw existing products from the market or may be unable to commercialize one or more of our products, all of which could have a material adverse effect on our business, results of operations and financial condition. As the number of participants in our industry grows, the possibility of intellectual property infringement claims against us increases.
Furthermore, the costs of resolving any patent litigation or other intellectual property proceeding, even if resolved in our favor, could be substantial. Uncertainties resulting from the initiation and continuation of patent litigation or other intellectual property proceedings could have a material adverse effect on our ability to compete in the marketplace. Patent litigation and other intellectual property proceedings may also consume significant management time.
In the event that a competitor infringes upon our patent or other intellectual property rights, enforcing those rights may be costly, difficult, and time-consuming. Even if successful, litigation to enforce our intellectual property rights or to defend our patents against challenge could be expensive and time-consuming and could divert our management’s attention. We may not have sufficient resources to enforce our intellectual property rights or to defend our patent or other intellectual property rights against a challenge. If we are unsuccessful in enforcing and protecting our intellectual property rights and protecting our products, it could materially harm our business.
There may also be situations where we use our business judgment and decide to market and sell products, notwithstanding the fact that allegations of patent infringement(s) have not been finally resolved by the courts (i.e., an “at-risk launch”). The risk involved in doing so can be substantial because the remedies available to the owner of a patent for infringement may include, among other things, damages measured by the profits lost by the patent owner and not necessarily by the profits earned by the infringer. In the case of a willful infringement, the definition of which is subjective, such damages may be increased up to three times. An adverse decision could have a material adverse effect on our business, financial position and results of operations and could cause the market value of our common stock to decline.
In addition, we may indemnify our customers and distributors with respect to infringement by our products of the proprietary rights of third parties. Third parties may assert infringement claims against our customers or distributors. These claims may require us to initiate or defend protracted and costly litigation on behalf of our customers or distributors, regardless of the merits of these claims. If any of these claims succeed, we may be forced to pay damages on behalf of our customers or distributors or may be required to obtain licenses for the products they use. If we cannot obtain all necessary licenses on commercially reasonable terms, our customers may be forced to stop using our products.
We may be subject to claims that we, our board members, employees or consultants have used or disclosed alleged trade secrets or other proprietary information belonging to third parties and any such individuals who are currently affiliated with one of our competitors may disclose our proprietary technology or information.
As is commonplace in the medical device industry, some of our board members, employees and consultants are or have been associated with other medical device companies that compete with us. For example, Mr. Susi and a number of our other employees are former employees of Invivo Corporation and/or other medical device firms. While associated with such other companies, these individuals may have been exposed to research and technology similar to the areas of research, technology, sales methodology, pricing models and other such matters in which we are engaged. We may become subject to future claims that we, our employees, board members, or consultants have inadvertently or otherwise used or disclosed alleged trade secrets or other proprietary information of those companies. Litigation may be necessary to defend against such claims.
We have entered into confidentiality agreements with our executives and key consultants. However, we do not have, and are not planning to enter into, any confidentiality agreements with our non-executive directors because they have a fiduciary duty of confidentiality as directors.
There is the possibility that any of our former board members, employees, or consultants who are currently or who may be employed at, or associated with, one of our competitors may unintentionally or willfully disclose our proprietary technology or information.
36
Risks Related to Ownership of Our Common Stock
Our common stock price has been and will likely continue to be subject to significant fluctuations and volatility, and you may be unable to sell your shares at a fair price, or at all.
Our stock could be subject to wide fluctuations in price in response to various factors, including the following:
| ● | a lack of liquidity in the public trading of our common stock; |
| ● | the commercial success or failure of our key products; |
| ● | delayed or reduced orders from our customers; |
| ● | manufacturing or supply interruptions; |
| ● | changes or developments in laws or regulations applicable to our products and product candidates; |
| ● | introduction of competitive products or technologies; |
| ● | poorly executed acquisitions or acquisitions whose projected potential is not realized; |
| ● | actual or anticipated variations in quarterly operating results; |
| ● | failure to meet or exceed our own estimates and projections or the estimates and projections of securities analysts or investors; |
| ● | new or revised earnings estimates or guidance by us or securities analysts or investors; |
| ● | varying economic and market conditions in the U.S.; |
| ● | negative developments impacting the medical device industry in general and changes in the market valuations of companies deemed similar to us; |
| ● | negative developments concerning our sources of manufacturing supply; |
| ● | disputes or other developments relating to patents, trademarks or other proprietary rights; |
| ● | litigation or investigations involving us, our industry, or both; |
| ● | issuances of debt, equity or convertible securities at terms deemed unfavorable by the market; |
| ● | major catastrophic events; |
| ● | sales of large blocks of our stock; |
| ● | changes in our Board of Directors, management or key personnel; or |
| ● | the other factors described in this “Risk Factors” section. |
Any one of the factors above, or the cumulative effect of some of the factors referred to above, may result in significant fluctuations in our quarterly or annual operating results, fluctuations in our share price and investors’ perception of our business. If we fail to meet or exceed such expectations, our business and stock price could be materially adversely affected.
37
Any use of capital to repurchase shares of our common stock could have a material adverse effect on our stock price and our business.
Our Board of Directors has historically authorized stock repurchase programs and, pursuant to these authorizations, we have used a significant amount of cash to repurchase shares of common stock of our company. Historically, we have opportunistically repurchased additional shares of common stock from time to time at prices that we believe are attractive. While our stock repurchase program has expired, should our Board of Directors authorize another stock repurchase program, there can be no assurance that we will be able to repurchase shares on favorable terms or, if we do repurchase shares, that such repurchases will increase shareholder value. Additionally, if we use a significant portion of our capital to repurchase shares, our financial flexibility will be reduced, and we may not be able to execute on other strategic initiatives or tolerate periods of operating losses. If we repurchase shares on unfavorable terms or if our use of capital to repurchase shares inhibits our ability to pursue other strategic initiatives or tolerate periods of operating losses, it could have a material adverse effect on our stock price and our business.
We may need or choose to raise additional capital in the future, which could result in dilution to our stockholders and adversely affect stock price.
While we believe that our cash and investment balances and prospective cash flow from our operations will provide us with adequate capital to fund operations for at least the next 12 months from the date of the issuance of the financial statements included herein, we may need or choose to raise additional funds prior to that time. We may seek to sell additional equity or debt securities or to obtain a credit facility, which we may not be able to do on favorable terms, or at all. The sale of additional equity or convertible debt securities could result in additional dilution to our stockholders. If additional funds are raised through the issuance of debt securities or preferred stock, these securities could have rights that are senior to holders of common stock and any debt securities could contain covenants that would restrict our operations. The sale of such securities could hurt demand for our common stock and lead our share price to decline.
Roger Susi, who serves as our Chairman of the Board of Directors, President and Chief Executive Officer, owns a significant percentage of our stock and will be able to exert significant influence over matters subject to stockholder approval.
Mr. Susi, our founder, who serves as our Chairman of the Board of Directors, President and Chief Executive Officer, and his affiliates, beneficially own a significant percentage of our outstanding common stock. Mr. Susi may be able to significantly influence matters requiring approval by our stockholders, including the election of directors and the approval of mergers, acquisitions or other extraordinary transactions. He may also have interests that differ from yours and may vote in a way with which you disagree and which may be adverse to your interests. This concentration of ownership may have the effect of delaying or deterring a change of control of our company.
At this time, we do not intend to pay dividends.
At this time, we do not anticipate that we will pay any cash dividends on shares of our common stock. Any determination to pay dividends in the future will be at the discretion of our Board of Directors and will depend upon results of operations, financial condition, contractual restrictions, restrictions imposed by applicable law and other factors our Board of Directors deems relevant. Investors seeking cash dividends should not purchase our common stock.
Accordingly, if you purchase shares, realization of a gain on your investment will depend solely on the appreciation of the price of our common stock, which may never occur.
38
The requirements of being a public company may strain our resources, divert management’s attention and affect our ability to attract and retain executive management and qualified board members.
As a public company, we are subject to the reporting requirements of the Securities Exchange Act of 1934, as amended (“Exchange Act”), the Sarbanes-Oxley Act, the Dodd-Frank Act, the listing requirements of the Nasdaq Stock Market and other applicable securities rules and regulations. Compliance with these rules and regulations will increase our legal and financial compliance costs, make some activities more difficult, time-consuming or costly and increase demand on our systems and resources. The Exchange Act requires, among other things, that we file annual, quarterly and current reports with respect to our business and operating results. As a result, management’s attention may be diverted from other business concerns, which could adversely affect our business and operating results. We may need to hire more employees in the future or engage outside consultants to monitor and advise us regarding compliance, which will increase our costs and expenses.
In addition, changing laws, regulations and standards relating to corporate governance and public disclosure are creating uncertainty for public companies, increasing legal and financial compliance costs and making some activities more time consuming. These laws, regulations and standards are subject to varying interpretations, in many cases due to their lack of specificity, and, as a result, their application in practice may evolve over time as new guidance is provided by regulatory and governing bodies. This could result in continuing uncertainty regarding compliance matters and higher costs necessitated by ongoing revisions to disclosure and governance practices. We may need to invest in additional resources to comply with evolving laws, regulations and standards, and this investment may result in increased general and administrative expenses and a diversion of management’s time and attention from revenue-generating activities to compliance activities. If our efforts to comply with new laws, regulations and standards differ from the activities intended by regulatory or governing bodies due to ambiguities related to their application and practice, regulatory authorities may initiate legal proceedings against us, and our business may be adversely affected.
We believe that being a public company and compliant with these rules and regulations has made it more expensive for us to obtain director and officer liability insurance, and we may be required to accept reduced coverage or incur substantially higher costs to obtain coverage. These factors could also make it more difficult for us to attract and retain qualified members of our Board of Directors, particularly to serve on our audit committee and compensation committee, and qualified executive officers.
As a result of being a public company, we are obligated to establish and maintain adequate internal controls. Failure to develop and maintain adequate internal controls or to implement new or improved controls could have a material adverse effect on our business, financial position and results of operations and could cause the market value of our common stock to decline.
Ensuring that we have adequate internal financial and accounting controls and procedures in place so that we can produce accurate financial statements on a timely basis is a costly and time-consuming effort. Our internal controls over financial reporting are designed to provide reasonable assurance regarding the reliability of financial reporting and the preparation of financial statements in accordance with GAAP. During the evaluation and testing process, if we identify one or more material weaknesses in our internal controls over financial reporting, we will be unable to assert that our internal controls are effective.
We are required to disclose changes made in our internal controls and procedures on a quarterly basis. Our independent registered public accounting firm may issue a report that is adverse in the event it is not satisfied with the level at which our controls are documented, designed or operating. Our remediation efforts may not enable us to avoid a material weakness in the future.
39
Our business practices have become more visible as a public company, and this could impact our competitive environment and our risk of potential litigation.
As a result of disclosure of information in filings required of a public company, our business and financial condition have become more visible potentially exposing us to new competition and threatened or actual litigation, including by competitors and other third parties. New competition could result in reduced sales of our products and adversely impact our profitability. If lawsuits prevail against us, our business and operating results could be adversely affected, and even if the claims do not result in litigation or are resolved in our favor, these claims, and the time and resources necessary to resolve them, could divert the resources of our management and adversely affect our business and operating results.
We may and have become involved in securities class action litigation that could divert management’s attention from our business and adversely affect our business and could subject us to significant liabilities.
The stock markets have from time to time experienced significant price and volume fluctuations that have affected the market prices of small capitalization medical device companies. These broad market fluctuations as well a broad range of other factors, including the realization of any of the risks described in this “Risk Factors” section, may cause the market price of our common stock to decline. In the past, securities class action litigation has often been brought against a company following a decline in the market price of its securities. We have become, and may in the future, become involved in this type of litigation. Litigation is expensive and could divert management’s attention and resources from our primary business, which could adversely affect our operating results. Any adverse determination in any such litigation or any amounts paid to settle any such actual or threatened litigation could require us to make significant payments. Such payment could have a material impact on how investors view our company and result in a decline in our stock price.
If securities or industry analysts fail to initiate research coverage of our stock, downgrade our stock, or discontinue coverage, our trading volume might be reduced and our stock price could decline.
The trading market for our common stock depends, in part, on the research reports that securities or industry analysts publish about our business. If securities or industry analysts do not commence or continue coverage of our company, the trading market for our stock may not be robust and the price of our stock could likely be negatively impacted. In the event securities or industry analysts initiate coverage, and later downgrade our stock or discontinue such coverage, our stock price could decline.
Our charter documents and Delaware law have provisions that may discourage an acquisition of us by others and may prevent attempts by our stockholders to replace or remove our current management.
Provisions in our charter documents, as well as provisions of the Delaware General Corporation Law (“DGCL”), could depress the trading price of our common stock by making it more difficult for a third party to acquire us at a price favorable to our shareholders. These provisions include:
| ● | authorizing the issuance of “blank check” preferred stock, the terms of which may be established and shares of which may be issued without stockholder approval to defend against a takeover attempt; and |
| ● | establishing advance notice requirements for nominations for election to our Board of Directors or for proposing matters that can be acted upon at stockholder meetings. |
In addition, these provisions may frustrate or prevent any attempts by our stockholders to replace or remove our current management by making it more difficult for stockholders to replace members of our Board of Directors. We are subject to Section 203 of the DGCL, which generally prohibits a Delaware corporation from engaging in any of a broad range of business combinations with an interested stockholder for a period of three years following the date on which the stockholder became an interested stockholder, unless such transactions are approved by our Board of Directors. This provision could have the effect of delaying or preventing a change of control, whether or not it is desired by or beneficial to our stockholders, which could also affect the price that some investors are willing to pay for our common stock.
40
ITEM 1B. UNRESOLVED STAFF COMMENTS
None.
ITEM 2. PROPERTIES
Our principal offices are currently located in a leased facility of approximately 23,100 square feet located in Winter Springs, Florida. This facility has been leased from an entity controlled by our founder, President, Chief Executive Officer, and Chairman of the Board of Directors, Roger Susi. Pursuant to the terms of our lease, the current monthly base rent is $34,133, adjusted annually for changes in the consumer price index. Prior to May 31, 2019, the expiration date of the initial lease term, and pursuant to the terms of the lease contract, we renewed the lease for an additional five years, resulting in a new lease expiration date of May 31, 2024. Unless advance written notice of termination is timely provided, the lease will automatically renew for one additional successive term of five years beginning in 2024, and thereafter will be renewed for successive terms of one year each.
We do not own any real property.
ITEM 3. LEGAL PROCEEDINGS
From time to time we are involved in legal proceedings arising in the ordinary course of business. We believe that adequate reserves for these liabilities have been made and that there is no litigation pending that could have a material adverse effect on our liquidity, access to capital markets or ability to conduct our daily operations.
ITEM 4. MINE SAFETY DISCLOSURES
Not applicable.
41
PART II
ITEM 5. MARKET FOR REGISTRANT’S COMMON STOCK, RELATED STOCKHOLDER MATTERS AND ISSUER PURCHASES OF EQUITY SECURITIES
Market for Common Stock
Our common stock has been publicly traded on the Nasdaq Capital Market under the stock symbol “IRMD” since July 16, 2014. Prior to that date, there was no public market for our common stock. There were no dividends declared during the fiscal years ended December 31, 2020, and 2019 and we do not anticipate paying any cash dividends on our common stock in the foreseeable future.
The stock market in general has experienced significant stock price fluctuations in the past few years. In some cases, these fluctuations have been unrelated to the operating performance of the affected companies. Therefore, many companies have experienced dramatic volatility in the market prices of their common stock. We believe that a number of factors, both within and outside our control, could cause the price of our common stock to fluctuate, perhaps substantially. Factors such as the following could have a significant adverse impact on the market price of our common stock:
| ● | Our financial position and results of operations; |
| ● | Our ability to obtain additional financing and, if available, the terms and conditions of the financing; |
| ● | Concern as to, or other evidence of, the reliability and efficiency of our proposed products or our competitors’ products; |
| ● | Announcements of innovations or new products by us or our competitors; |
| ● | Federal, state, and international governmental regulatory actions and the impact of such requirements on our business; |
| ● | The development of litigation against us; |
| ● | Period-to-period fluctuations in our operating results; |
| ● | Changes in estimates of our performance by any securities analysts; |
| ● | The issuance of new equity securities pursuant to a future offering or acquisition; |
| ● | Poorly executed acquisitions or acquisitions whose projected potential is not realized; |
| ● | Changes in interest rates; |
| ● | Competitive developments, including announcements by competitors of new products or significant contracts, acquisitions, strategic partnerships, joint ventures or capital commitments; |
| ● | Sales of large blocks of our stock; |
| ● | Investor perceptions of our company; and |
| ● | General economic and other national and international conditions. |
Stockholders
As of February 28, 2021, we had 3 stockholders of record. This number is significantly less than and does not include “street name” or beneficial holders, whose shares are held by banks, brokers, financial institutions and other nominees.
42
Dividends
At this time, we do not expect to declare or pay any cash dividends on our common stock in the foreseeable future, and we currently intend to retain future earnings, if any, to finance the expansion of our business. The decision whether to pay cash dividends on our common stock will be made by our board of directors, at its discretion, and will depend on our financial condition, operating results, capital requirements and other factors that the board of directors considers significant.
We have never declared or paid cash dividends on our capital stock.
Unregistered Sales of Securities; Use of Proceeds from Registered Securities
None.
Purchases of Equity Securities by the Issuer
The following table provides information regarding repurchases of common stock for the year ended December 31, 2020.
|
|
| Total Number |
| Maximum | |||||
of Shares | Dollar Value of | |||||||||
Purchased as | Shares that | |||||||||
Total | Part of | May Yet | ||||||||
Number of | Publicly | Be Purchased | ||||||||
Shares | Average Price | Announced | Under the | |||||||
Purchased | Paid per Share | Plans or | Plans or | |||||||
(1) | (2) | Programs | Programs | |||||||
January 1, 2020—January 31, 2020 |
| 5,323 | $ | — |
| — | $ | — | ||
February 1, 2020—February 29, 2020 |
| — | $ | — |
| — | $ | — | ||
March 1, 2020—March 31, 2020 |
| — | $ | — |
| — | $ | — | ||
April 1, 2020—April 30, 2020 |
| 1,451 | $ | — |
| — | $ | — | ||
May 1, 2020—May 31, 2020 |
| 30,732 | $ | — |
| — | $ | — | ||
June 1, 2020—June 30, 2020 |
| 470 | $ | — |
| — | $ | — | ||
July 1, 2020—July 31, 2020 |
| 2,674 | $ | — |
| — | $ | — | ||
August 1, 2020—August 31, 2020 |
| 35 | $ | — |
| — | $ | — | ||
September 1, 2020—September 30,2020 |
| 58 | $ | — |
| — | $ | — | ||
October 1, 2020—October 31, 2020 |
| 187 | $ | — |
| — | $ | — | ||
November 1, 2020—November 30, 2020 |
| 25 | $ | — |
| — | $ | — | ||
December 1, 2020—December 31, 2020 |
| 11,362 | $ | — |
| — | $ | — | ||
Total |
| 52,317 | $ | — |
| — | $ | — | ||
(1) | The number of shares purchased reflects shares withheld for taxes on vesting of restricted stock. There were no shares repurchased pursuant to the open market repurchase authorization. |
(2) | The average price paid per share does not include the withheld shares discussed in (1). |
Transfer Agent
The transfer agent and registrar for our common stock is EQ by Equiniti.
Equity Compensation Plan Information
Our equity compensation plan information is provided as set forth in Part III, Item 11 herein.
Additional Information
Copies of our annual reports, quarterly reports, current reports, and any amendments to those reports, are available free of charge on the Internet at www.sec.gov. All statements made in any of our filings, including all forward-
43
looking statements, are made as of the date of the document, in which the statement is included, and we do not assume or undertake any obligation to update any of those statements or documents unless we are required to do so by law.
Stock Performance Graph
The following information of Part II Item 5 is being furnished and shall not be deemed to be “soliciting material” or to be “filed” for purposes of Section 18 of the Securities Exchange Act of 1934, as amended, or otherwise subject to the liabilities of that Section, nor will it be deemed incorporated by reference into any filing under the Securities Act of 1933, as amended, or the Securities Exchange Act of 1934, as amended, except to the extent that we specifically incorporate such information by reference thereto.
The following graph shows a comparison, from December 31, 2015 through December 31, 2020, of cumulative total return for our common stock, the Russell 2000 Index and the Nasdaq Medical Equipment Index. Such returns are based on historical results and are not intended to suggest future performance. Data for the Russell 2000 Index and the Nasdaq Medical Equipment Index assumes reinvestment of dividends.
ITEM 6. SELECTED FINANCIAL DATA
The following tables set forth certain selected financial data for each of the years in the five-year period ended December 31, 2020, and is derived from the audited Financial Statements of IRADIMED CORPORATION. The
44
statements of operations data for each of the years in the three-year period ended December 31, 2020 are included elsewhere in this report. The statements of operations data for the years ended December 31, 2017 and 2016 and balance sheet data as of December 31, 2018, 2017 and 2016 are derived from our audited financial statements not included in this report. The selected financial data set forth below is qualified in its entirety by, and should be read in conjunction with, the Financial Statements and Notes thereto and “Management’s Discussion and Analysis and Results of Operations” included elsewhere in this report.
Years ended December 31, | |||||||||||||||
| 2020 |
| 2019 |
| 2018 |
| 2017 |
| 2016 | ||||||
Statements of Operations Data: | |||||||||||||||
Revenue | $ | 31,717,372 | $ | 38,517,141 | $ | 30,438,983 | $ | 23,081,592 | $ | 32,496,548 | |||||
Cost of revenue |
| 8,142,962 |
| 8,816,161 |
| 7,211,633 |
| 5,569,896 |
| 6,154,836 | |||||
Gross profit |
| 23,574,410 |
| 29,700,980 |
| 23,227,350 |
| 17,511,696 |
| 26,341,712 | |||||
Operating expenses: |
|
|
|
|
|
|
|
|
|
| |||||
General and administrative |
| 12,269,079 |
| 10,451,266 |
| 8,710,882 |
| 9,001,164 |
| 8,795,703 | |||||
Sales and marketing |
| 10,158,892 |
| 9,169,590 |
| 6,995,586 |
| 5,502,959 |
| 5,278,448 | |||||
Research and development |
| 1,902,530 |
| 1,432,719 |
| 1,517,112 |
| 1,722,564 |
| 1,347,507 | |||||
Total operating expenses |
| 24,330,501 |
| 21,053,575 |
| 17,223,580 |
| 16,226,687 |
| 15,421,658 | |||||
(Loss) income from operations |
| (756,091) |
| 8,647,405 |
| 6,003,770 |
| 1,285,009 |
| 10,920,054 | |||||
Other income, net |
| 139,213 |
| 395,912 |
| 193,537 |
| 111,377 |
| 32,680 | |||||
(Loss) income before provision for income taxes |
| (616,878) |
| 9,043,317 |
| 6,197,307 |
| 1,396,386 |
| 10,952,734 | |||||
Provision for income tax (benefit) expense |
| (1,985,879) |
| (587,642) |
| (106,143) |
| 896,622 |
| 3,738,189 | |||||
Net income | $ | 1,369,001 | $ | 9,630,959 | $ | 6,303,450 | $ | 499,764 | $ | 7,214,545 | |||||
Net income per share: |
|
|
|
|
|
|
|
|
|
| |||||
Basic | $ | 0.11 | $ | 0.85 | $ | 0.59 | $ | 0.05 | $ | 0.67 | |||||
Diluted | $ | 0.11 | $ | 0.78 | $ | 0.52 | $ | 0.04 | $ | 0.60 | |||||
Weighted-average shares outstanding: |
|
|
|
|
|
|
|
|
|
| |||||
Basic |
| 12,123,556 |
| 11,282,214 |
| 10,758,752 |
| 10,638,858 |
| 10,818,427 | |||||
Diluted |
| 12,440,086 |
| 12,276,444 |
| 12,110,117 |
| 11,720,316 |
| 11,989,681 | |||||
As of December 31, | |||||||||||||||
| 2020 |
| 2019 |
| 2018 |
| 2017 |
| 2016 | ||||||
Balance Sheets Data: | |||||||||||||||
Cash and cash equivalents | $ | 50,068,728 | $ | 43,481,781 | $ | 28,027,688 | $ | 18,205,976 | $ | 17,713,871 | |||||
Investments |
| 1,909,368 |
| 2,768,287 |
| 6,349,915 |
| 8,135,123 |
| 7,965,521 | |||||
Working capital |
| 58,818,629 |
| 53,104,709 |
| 39,852,197 |
| 31,029,638 |
| 30,194,520 | |||||
Total assets |
| 71,066,620 |
| 66,728,864 |
| 48,442,258 |
| 39,012,534 |
| 37,194,484 | |||||
Total stockholders’ equity |
| 61,384,612 |
| 55,524,395 |
| 41,945,733 |
| 32,930,877 |
| 31,889,125 | |||||
45
ITEM 7. MANAGEMENT’S DISCUSSION AND ANALYSIS OF FINANCIAL CONDITION AND RESULTS OF OPERATIONS
You should read this discussion and analysis together with our audited financial statements, the notes to such statements and the other financial information included in this Form 10-K. This discussion contains forward-looking statements that involve risks and uncertainties. As a result of many factors, such as those set forth under the section entitled “Risk Factors” and elsewhere in this Form 10-K, our actual results may differ materially from those anticipated in these forward-looking statements. See “CAUTIONARY STATEMENTS REGARDING FORWARD-LOOKING STATEMENTS” for a discussion of the uncertainties, risks and assumptions associated with these statements.
Our Business
We develop, manufacture, market and distribute Magnetic Resonance Imaging (“MRI”) compatible medical devices and accessories and services relating to them.
We are a leader in the development of innovative magnetic resonance imaging (“MRI”) compatible medical devices. We are the only known provider of a non-magnetic intravenous (“IV”) infusion pump system that is specifically designed to be safe for use during MRI procedures. We were the first to develop an infusion delivery system that largely eliminates many of the dangers and problems present during MRI procedures. Standard infusion pumps contain magnetic and electronic components which can create radio frequency interference and are dangerous to operate in the presence of the powerful magnet that drives an MRI system. Our patented MRidium® MRI compatible IV infusion pump system has been designed with a non-magnetic ultrasonic motor, uniquely designed non-ferrous parts and other special features to safely and predictably deliver anesthesia and other IV fluids during various MRI procedures. Our pump solution provides a seamless approach that enables accurate, safe and dependable fluid delivery before, during and after an MRI scan, which is important to critically-ill patients who cannot be removed from their vital medications, and children and infants who must generally be sedated to remain immobile during an MRI scan.
Each IV infusion pump system consists of an MRidium® MRI compatible IV infusion pump, non-magnetic mobile stand, proprietary disposable IV tubing sets and many of these systems contain additional optional upgrade accessories.
Our 3880 MRI compatible patient vital signs monitoring system has been designed with non-magnetic components and other special features to safely and accurately monitor a patient’s vital signs during various MRI procedures. The IRADIMED 3880 system operates dependably in magnetic fields up to 30,000 gauss, which means it can operate virtually anywhere in the MRI scanner room. The IRADIMED 3880 has a compact, lightweight design allowing it to travel with the patient from their critical care unit, to the MRI and back, resulting in increased patient safety through uninterrupted vital signs monitoring and decreasing the amount of time critically ill patients are away from critical care units. The features of the IRADIMED 3880 include: wireless ECG with dynamic gradient filtering; wireless SpO2 using Masimo® algorithms; non-magnetic respiratory CO2; invasive and non-invasive blood pressure; patient temperature, and; optional advanced multi-gas anesthetic agent unit featuring continuous Minimum Alveolar Concentration measurements. The IRADIMED 3880 MRI compatible patient vital signs monitoring system has an easy-to-use design and allows for the effective communication of patient vital signs information to clinicians.
We generate revenue from the sale of MRI compatible medical devices and accessories, extended warranty agreements, services related to maintaining our products and the sale of disposable products used with our devices. The principal customers for our MRI compatible products include hospitals and acute care facilities, both in the United States and internationally. As of December 31, 2020, our direct U.S. sales force consisted of 22 field sales representatives, 4 regional sales directors and supplemented by 5 clinical application specialists. Internationally, we have distribution agreements with independent distributors selling our products.
Selling cycles for our devices have varied widely and have historically ranged between three and six months in duration with more recent trends lengthening beyond this historical range due to the COVID-19 pandemic. We also enter into agreements with healthcare supply contracting companies in the U.S., which enable us to sell and distribute our MRidium MRI compatible IV infusion pump system to their member hospitals. Under these agreements, we are required to pay these group purchasing organizations (“GPOs”) a fee of three percent of the sales of our products to their member hospitals.
46
Financial Highlights and Outlook
Our revenue was $31.7 million in 2020, $38.5 million in 2019 and $30.4 million in 2018. Our diluted earnings per share was $0.11 in 2020, $0.78 in 2019 and $0.52 in 2018. Our cash provided by operations was $5.8 million in 2020, $10.2 million in 2019 and $7.4 million in 2018.
Our estimated installed base of medical devices is as follows:
Years Ended December 31, | ||||||
| 2020 |
| 2019 |
| 2018 | |
IV Infusion Pump Systems |
| 5,794 |
| 5,515 |
| 5,000 |
Patient Vital Signs Monitoring Systems |
| 794 |
| 539 |
| 261 |
Effects of the COVID-19 Pandemic
The COVID-19 global pandemic caused disruption in global supply and distribution channels and dramatically changed the way companies do business. From the beginning of this global health crisis, our first priority has been the safety and well-being of our employees.
We continue to monitor the developments associated with the COVID-19 pandemic and its effects on our employees, customers, supply chain and distribution channels. The ongoing impact of the pandemic depends on a number of factors including the severity and duration of the pandemic and the extent and severity of the impact on our customers, which is uncertain and unpredictable. Our future results of operations and cash flows may suffer adverse effects from delays in payments on outstanding accounts receivable, potential manufacturing, distribution and supply chain disruptions and uncertain demand, and effects of any actions we may take to address financial and operational challenges our customers may face. Other risks and uncertainties that we face include, but are not limited to:
| ● | postponement or cancellation of MRI medical procedures and their uncertain return which adversely impacts our business; |
| ● | potential temporary or prolonged closure of our office and production facility; |
| ● | the health of our employees and ability to meet staffing needs; |
| ● | potential new or continued governmental actions that may limit employees’ ability to work; |
| ● | civil unrest relating to government, corporate and societal responses to the pandemic; |
| ● | volatility in economic conditions and the financial markets, and |
| ● | other unanticipated effects that remain unknown. |
We are actively managing our response to the COVID-19 pandemic and work with our customers, distributors, vendors, and suppliers and assessing the potential effects to our financial position, results of operations and cash flows. As of the date of the issuance of these financial statements, the extent to which COVID-19 may materially impact our financial condition, liquidity, or results of operations in future periods remains uncertain. For further information regarding the potential impact of the COVID-19 pandemic on our company, see “Risk Factors” in Item 1A of this report.
The CARES Act
The Coronavirus Aid, Relief, and Economic Security Act (the “CARES Act”) was enacted on March 27, 2020. The CARES Act allows for the carryback of net operating losses, which were expected to be used in future years, to prior years resulting in a $0.8 million benefit that was recognized in the year ended December 31, 2020. Consequently, we recorded an income tax receivable of approximately $1.4 million as of December 31, 2020.
Application of Critical Accounting Policies
We prepare our financial statements in conformity with U.S. GAAP. The preparation of these financial statements requires us to make estimates and use assumptions that affect the reported amounts of assets, liabilities and
47
related disclosures at the date of the financial statements and the reported amounts of revenue and expenses during the reporting period. Actual results could differ from those estimates.
Our significant accounting policies are more fully described in Note 1 to the Financial Statements. However, we believe that the following critical accounting policies require the use of significant estimates, assumptions and judgments. The use of different estimates, assumptions and judgments could have a material effect on the reported amounts of assets, liabilities and related disclosures as of the date of the financial statements and revenue and expenses during the reporting period.
The extent to which COVID-19 impacts our business and financial results will depend on numerous evolving factors including, but not limited to: the magnitude and duration of COVID-19, the extent to which it will impact worldwide macroeconomic conditions, the speed of the anticipated recovery, access to capital markets, and governmental and business reactions to the pandemic. We assessed certain accounting matters that generally require consideration of forecasted financial information in context with the information reasonably available to the Company and the unknown future impacts of COVID-19 as of December 31, 2020 and through the date of the filing of this Annual Report on Form 10-K. The accounting matters assessed included, but were not limited to estimates related to revenue, the accounting for potential liabilities and accrued expenses, the assumptions utilized in valuing stock-based compensation, the realization of deferred tax assets, and assessments of impairment related to long-lived assets and intangibles. Our future assessment of the magnitude and duration of COVID-19, as well as other factors, could result in additional material impacts to our financial statements in future reporting periods.
Despite our efforts, the ultimate impact of COVID-19 depends on factors beyond our knowledge or control, including the duration and severity of the outbreak, as well as third-party actions taken to contain its spread and mitigate its public health effects. As a result, we are unable to estimate the full extent to which COVID-19 will negatively impact our financial results or liquidity.
Revenue Recognition
We generate revenue from the sale of MRI compatible medical devices and accessories, extended warranty agreements, services related to maintaining our products and the sale of disposable products used with our devices. The principal customers for our MRI compatible products include hospitals and acute care facilities, both in the U.S. and internationally. In the U.S. we sell our products through our direct sales force and outside of the U.S. we sell our products through third-party distributors who resell our products to end users.
For most domestic sales, we enter into agreements with healthcare supply contracting companies, commonly referred to as Group Purchasing Organizations (“GPOs”), which enable us to sell and distribute our products to their member hospitals. Our agreements with GPOs typically include negotiated pricing for all group members established at time of GPO contract execution.
We do not sell to GPOs. Hospitals, group practices and other acute care facilities that are members of a GPO, purchase products directly from us under the terms of our GPO agreements.
We recognize revenue when all of the following criteria are met: we have a contract with a customer that creates enforceable rights and obligations; promised products or services are identified; the transaction price, or the amount we expect to receive, is determinable and we have transferred control of the promised products or services to the customer. We consider transfer of control evidenced upon the passage of title and risks and rewards of ownership to the customer, which is typically at a point in time, except for our extended warranty agreements. We allocate the transaction price using the relative standalone selling price method. Customer sale prices for our MRI compatible IV infusion pump systems and related disposables and services are contractually fixed over the GPO contract term. We recognize a receivable at the point in time we have an unconditional right to payment. Payment terms are typically within 45 days after transferring control to U.S. customers. Most international distributors are required to pay a portion of the transaction price in advance and the remaining amount within 30 days of receiving the related products. Accordingly, we have elected to use the practical expedient that allows us to ignore the possible existence of a significant financing component within the contract.
We have elected to account for shipping and handling charges billed to customers as revenue and shipping and handling related expenses as cost of revenue.
48
In certain U.S. states we are required to collect sales taxes from our customers. We have elected to exclude the amounts collected for these taxes from revenue and record them as a liability until remitted to the taxing authority.
Contract Liabilities
We record contract liabilities, or deferred revenue, when we have an obligation to provide a product or service to the customer and payment is received in advance of our performance. When we sell a product or service with a future performance obligation, we defer revenue allocated to the unfulfilled performance obligation and recognize this revenue when, or as, the performance obligation is satisfied.
Our deferred revenue consists of advance payments received from customers prior to the transfer of products or services, shipments that are in-transit at the end of a period and sales of extended warranty agreements. Advance payments received from customers and shipments in-transit are recognized in revenue at the time control of the related products has been transferred to the customer or services have been delivered. Amounts related to extended warranty agreements are deferred and recognized in revenue ratably over the agreement period, which is typically one to four years after control of the related products is transferred to the customer, as we believe this recognition pattern best depicts the transfer of services being provided.
Deferred revenue is classified as current or long-term deferred revenue in our Balance Sheets, depending on the expected timing of satisfying the related performance obligations.
Capitalized Contract Costs
We capitalize commissions paid to our sales managers related to contracts with customers when the associated revenue is expected to be earned over a period of time. Deferred commissions are primarily related to the sale of extended warranty agreements. Capitalized commissions are included in Prepaid Expenses and Other Current Assets in our Balance Sheets when the associated expense is expected to be recognized in one year or less, or in Other Assets when the associated expense is expected to be recognized in greater than one year. The associated expense is included in Sales and Marketing expenses in our Statements of Operations.
Variable Consideration
Most of our sales are subject to 30 to 60-day customer-specified acceptance provisions primarily for purposes of ensuring products were not damaged during the shipping process. Historically, we have experienced immaterial product returns and, when experienced, we typically exchange the affected products with new products. Accordingly, variable consideration from contracts with customers is immaterial to our financial statements.
Accounts Receivable and Allowance for Doubtful Accounts
Accounts receivable is recorded at the transaction price of the related products and services. We regularly assess the sufficiency of the allowance for estimated uncollectible accounts receivable. Estimates are based on historical collection experience and other customer-specific information, such as bankruptcy filings or known liquidity problems of our customers. When it is determined that an account receivable is uncollectible, it is written off and relieved from the allowance. Any future determination that the allowance for estimated uncollectible accounts receivable is not properly stated could result in changes in operating expense and results of operations.
Inventory
Inventory is stated at the lower of standard cost, which approximates actual cost on a first-in, first-out basis, or net realizable value. Net realizable value is the estimated selling prices in the ordinary course of business, less reasonably predictable costs of completion, disposal and transportation. We may be exposed to a number of factors that could result in portions of our inventory becoming either obsolete or in excess of anticipated usage. These factors include, but are not limited to, technological changes, competitive pressures in products and prices, and the introduction of new product lines. We regularly evaluate our ability to realize the value of inventory based on a combination of factors, including historical usage rates, forecasted sales, product life cycles, and market acceptance of new products.
49
When inventory that is obsolete or in excess of anticipated usage is identified, it is written down to net realizable value or an inventory valuation allowance is established.
The estimates we use in projecting future product demand may prove to be incorrect. Any future determination that our inventory is overvalued could result in increases to our cost of sales and decreases to our operating margins and results of operations.
Warranty
We provide for the estimated cost of product warranties at the time revenue is recognized. While we engage in product quality programs and processes, including actively monitoring and evaluating the quality of our suppliers, the estimated warranty obligation is affected by ongoing product failure rates, material usage costs and direct labor incurred in correcting a product failure. Actual product failure rates, material usage costs and the amount of labor required to repair products that differ from estimates result in revisions to the estimated liability. We warrant for a limited period of time that our products will be free from defects in materials and workmanship. We estimate warranty allowances based on historical warranty experience. The estimates we use in projecting future product warranty costs may prove to be incorrect. Any future determination that our provision for product warranty is understated could result in increases to our cost of revenue and a reduction in our operating profits and results of operations. Historically, warranty expenses have not been material to our financial statements.
Stock-based Compensation
We apply the fair value recognition provisions of Financial Accounting Standards Board Accounting Standards Codification Topic 718, Compensation — Stock Compensation (“ASC 718”). Determining the amount of stock-based compensation to be recorded for stock options that we grant requires us to develop estimates of the fair value as of the grant date. Calculating the fair value of stock option awards requires that we make highly subjective assumptions. We use the Black-Scholes option pricing model to value our stock option awards. Use of this valuation methodology requires that we make assumptions as to the volatility of our common stock, the expected term of our stock options, the risk-free interest rate for a period that approximates the expected term of our stock options and our expected dividend yield. Estimated volatility is based on the historical volatility of our share price. We use the simplified method as prescribed by ASC 718 to calculate the expected term of stock options granted to employees as we do not have sufficient historical exercise data to provide a reasonable basis upon which to estimate the expected term of our stock option awards. The risk-free interest rate used for each grant is based on the U.S. Treasury yield curve in effect at the time of the grant for instruments with a similar expected life. We utilize a dividend yield of zero as we have no current intention to pay cash dividends. We elect to recognize forfeitures as they occur.
As stock-based compensation is an important part of our employee compensation reward strategy, we expect the future impact of stock-based compensation expense on our financial results to grow due to additional stock grants and increased headcount.
Income Taxes
We account for income taxes under the asset and liability method, which requires the recognition of deferred tax assets and liabilities for the expected future tax consequences of events that have been included in the financial statements. Under this method, deferred tax assets and liabilities are determined based on the differences between the financial statements and tax basis of assets and liabilities using enacted tax rates in effect for the year in which the differences are expected to reverse. The effect of a change in tax rates on deferred tax assets and liabilities is recognized in income in the period that includes the enactment date.
We record net deferred tax assets to the extent we believe these assets will more likely than not be realized. In making such determination, we consider all available positive and negative evidence, including future reversals of existing taxable temporary differences, projected future taxable income, tax planning strategies and recent financial operations. A valuation allowance is recorded to offset net deferred tax assets if, based upon the available evidence, it is more likely than not that some or all of the deferred tax assets will not be realized.
We recognize the tax benefit of uncertain tax positions in the financial statements based on the technical merits of the position. When the tax position is deemed more likely than not of being sustained, we recognize the largest amount of tax benefit that is greater than 50 percent likely of being ultimately realized upon settlement.
50
Results of Operations
The following table sets forth for the periods indicated selected statements of operations data as a percentage of total revenue. Our historical operating results are not necessarily indicative of the results for any future period.
Percent of Revenue |
| ||||||
Years Ended December 31, | |||||||
| 2020 |
| 2019 |
| 2018 |
| |
Revenue |
| 100.0 | % | 100.0 | % | 100.0 | % |
Cost of revenue |
| 25.7 |
| 22.9 |
| 23.7 | |
Gross profit |
| 74.3 |
| 77.1 |
| 76.3 | |
Operating expenses: |
|
|
|
|
|
| |
General and administrative |
| 38.7 |
| 27.1 |
| 28.6 | |
Sales and marketing |
| 32.0 |
| 23.8 |
| 23.0 | |
Research and development |
| 6.0 |
| 3.7 |
| 5.0 | |
Total operating expenses |
| 76.7 |
| 54.7 |
| 56.6 | |
(Loss) income from operations |
| (2.4) |
| 22.5 |
| 19.7 | |
Other income, net |
| 0.4 |
| 1.0 |
| 0.6 | |
(Loss) income before provision for income taxes |
| (1.9) |
| 23.5 |
| 20.4 | |
Provision for income tax benefit |
| (6.3) |
| (1.5) |
| (0.3) | |
Net income |
| 4.3 | % | 25.0 | % | 20.7 | % |
Comparison of the Years Ended December 31, 2020 and 2019
Revenue by Geographic Region
Years Ended December 31, | |||||||||
(In millions, except percent change) |
| 2020 |
| 2019 |
| Change |
| ||
United States | $ | 24.5 | $ | 30.9 | (20.7) | % | |||
International |
| 7.2 |
| 7.6 |
| (5.3) | % | ||
Total revenue | $ | 31.7 | $ | 38.5 |
| (17.7) | % | ||
Revenue by Type
Years Ended December 31, | |||||||||
(In millions, except percent change) |
| 2020 |
| 2019 |
| Change |
| ||
Devices: | |||||||||
MRI compatible IV infusion pump system | $ | 9.3 | $ | 18.1 |
| (48.1) | % | ||
MRI compatible patient vital signs monitoring system |
| 9.8 |
| 9.7 |
| 0.6 | % | ||
Total Devices revenue |
| 19.1 |
| 27.8 |
| (31.1) | % | ||
Disposables, service and other |
| 10.7 |
| 8.9 |
| 20.3 | % | ||
Amortization of extended warranty agreements |
| 1.9 |
| 1.8 |
| 1.6 | % | ||
Total revenue | $ | 31.7 | $ | 38.5 |
| (17.7) | % | ||
Revenue decreased $(6.8) million, or (17.7) percent, to $31.7 million from $38.5 million for the same period in 2019. This decrease is primarily due to a decrease in the number of our MRI compatible medical devices that we recognized in revenue, partially offset by higher revenue from our disposables, service and other.
Revenue from sales in the U.S. decreased $(6.4) million, or (20.7) percent, to $24.5 million from $30.9 million for the same period in 2019. Revenue from sales internationally decreased $(0.4) million, or (5.3) percent, to $7.2 million from $7.6 million for the same period in 2019. Domestic sales accounted for 77.4 percent of total revenue for the year ended December 31, 2020, compared to 80.3 percent for the same period in 2019.
Revenue from sales of devices decreased $(8.7) million, or (31.1) percent, to $19.1 million from $27.8 million for the same period in 2019. This decrease was the result of lower revenue from sales of our MRI compatible IV infusion pump systems.
During the year ended December 31, 2020, we recognized revenue on 279 MRI compatible IV infusion pumps compared to 519 pumps in 2019. The average selling price for our MRI compatible IV infusion pump systems recognized in
51
revenue during the year ended December 31, 2020 was approximately $33,600, compared to $34,800 for the same period in 2019. The decrease in average selling price is the result of higher international unit sales and an unfavorable product sales mix during 2020 when compared to 2019.
We recognized revenue on 255 MRI compatible patient vital signs monitoring systems during the year ended December 31, 2020, compared to 278 systems for the same period in 2019. The average selling price for our MRI compatible patient vital signs monitoring systems recognized in revenue was approximately $36,300 during the year ended December 31, 2020, compared to $34,700 for the same period in 2019. The increase in average selling price is due to higher domestic unit sales, partially offset by an unfavorable product sales mix in 2020 when compared to 2019.
Revenue from sales of our disposables, service and other increased $1.8 million, or 20.3 percent, to $10.7 million from $8.9 million for the same period in 2020. Revenue from the amortization of our extended warranty agreements increased $0.1 million, or 1.6 percent, to $1.9 million from $1.8 million for the same period in 2019.
Cost of Revenue and Gross Profit
Years Ended December 31, | |||||||
(In millions, except gross profit percentage) |
| 2020 |
| 2019 |
| ||
Revenue | $ | 31.7 | $ | 38.5 | |||
Cost of revenue |
| 8.1 |
| 8.8 | |||
Gross profit | $ | 23.6 | $ | 29.7 | |||
Gross profit percentage |
| 74.3 | % |
| 77.1 | % | |
Cost of revenue decreased approximately $(0.7) million, or (7.6) percent, to $8.1 million for the year ended December 31, 2020, from $8.8 million for the same period in 2019. Gross profit decreased approximately $(6.1) million, or (20.6) percent, to $23.6 million for the year ended December 31, 2020 from $29.7 million for the same period in 2019. The decrease in cost of revenue and gross profit is primarily due to lower revenue during the year ended December 31, 2020, compared to the same period in 2019.
Gross profit margin was 74.3 percent and 77.1 percent for the years ended December 31, 2020 and 2019, respectively. The decrease in gross profit margin is the result of unfavorable overhead variance adjustments, partially offset by favorable pricing adjustments in 2020 compared to 2019.
Operating Expenses
Years Ended December 31, | |||||||
(In millions, except percentage of revenue) |
| 2020 |
| 2019 |
| ||
General and administrative | $ | 12.3 | $ | 10.5 | |||
Percentage of revenue |
| 38.7 | % |
| 27.1 | % | |
Sales and marketing | $ | 10.2 | $ | 9.2 | |||
Percentage of revenue |
| 32.0 | % |
| 23.8 | % | |
Research and development | $ | 1.9 | $ | 1.4 | |||
Percentage of revenue |
| 6.0 | % |
| 3.7 | % | |
General and Administrative
General and administrative expense increased approximately $1.8 million, or 17.4 percent, to $12.3 million for the year ended December 31, 2020, from $10.5 million for the same period last year. This increase is primarily due to higher expenses for stock compensation, and payroll and benefits, partially offset by lower employee recruiting costs, GPO administrative fees and regulatory approval and certification costs. During the year ended December 31, 2020, the
52
Company recognized total general and administrative expense of $3.2 million related to our former Chief Executive Officer, of which $2.7 million relates to the separation.
Sales and Marketing
Sales and marketing expense increased approximately $1.0 million, or 10.8 percent, to $10.2 million for the year ended December 31, 2020, from $9.2 million for the same period in 2019. This increase is primarily the result of higher expenses for payroll and benefits, and sales commissions, partially offset by lower sales activities expenses and tradeshow costs during 2020 when compared to 2019.
Research and Development
Research and development expense increased approximately $0.5 million, or 32.8 percent, to $1.9 million for the year ended December 31, 2020, from $1.4 million for the same period in 2019. This increase is primarily due to higher payroll and benefits expenses and employee recruiting fees, partially offset by lower consulting expenses during 2020 when compared to 2019.
Other Income, Net
Other income, net consists of interest income, foreign currency transactional gains and losses, and other miscellaneous income. We reported other income of approximately $0.1 million and $0.4 for the years ended December 31, 2020 and 2019, respectively. This decrease is primarily the result of lower interest income during the year ended December 31, 2020 compared to the same period in 2019.
Income Taxes
We recorded a provision for income tax benefit of approximately $(2.0) million and $(0.6) million for the years ended December 31, 2020 and 2019, respectively. Our effective tax rate for the year ended December 31, 2020 was 321.9 percent compared to (6.5) percent for the same period in 2019. The increase in our effective tax rate is primarily the result of a loss before the provision for income taxes, discrete items related to tax benefits associated with the exercise and sale of employee options and vesting of restricted stock units, and the carryback of net operating losses to years prior to the enactment of the Tax Cuts and Jobs Act, as allowable under the Coronavirus Aid, Relief, and Economic Security Act. These were partially offset by a statutory limitation on the deductibility of certain executive compensation associated with the separation of our former Chief Executive Officer.
Comparison of the Years Ended December 31, 2019 and 2018
Revenue by Geographic Region
Years Ended December 31, |
| ||||||||
(In millions, except percent change) |
| 2019 |
| 2018 |
| Change |
| ||
United States | $ | 30.9 | $ | 24.5 |
| 26.2 | % | ||
International |
| 7.6 |
| 5.9 |
| 27.9 | % | ||
Total revenue | $ | 38.5 | $ | 30.4 |
| 26.5 | % | ||
Revenue by Type
Years Ended December 31, |
| ||||||||
(In millions, except percent change) |
| 2019 |
| 2018 |
| Change |
| ||
Devices: |
|
|
|
|
|
| |||
MRI compatible IV infusion pump system | $ | 18.1 | $ | 14.5 |
| 24.2 | % | ||
MRI compatible patient vital signs monitoring system |
| 9.7 |
| 6.7 |
| 45.9 | % | ||
Total Devices revenue |
| 27.8 |
| 21.2 |
| 31.0 | % | ||
Disposables, service and other |
| 8.9 |
| 7.7 |
| 15.3 | % | ||
Amortization of extended warranty agreements |
| 1.8 |
| 1.5 |
| 21.3 | % | ||
Total revenue | $ | 38.5 | $ | 30.4 |
| 26.5 | % | ||
Revenue increased $8.1 million, or 26.5 percent, to $38.5 million from $30.4 million for the same period in 2018. This increase is primarily due to an increase in the number of our MRI compatible medical devices that we
53
recognized in revenue, higher revenue from our disposables, services and other, and a higher average selling price for our infusion pump system.
Revenue from sales in the U.S. increased $6.4 million, or 26.2 percent, to $30.9 million from $24.5 million for the same period in 2018. Revenue from sales internationally increased $1.7 million, or 27.9 percent, to $7.6 million from $5.9 million for the same period in 2018. Domestic sales accounted for 80.3 percent of total revenue for the year ended December 31, 2019, compared to 80.5 percent for the same period in 2018.
Revenue from sales of devices increased $6.6 million, or 31.0 percent, to $27.8 million from $21.2 million for the same period in 2018.
During the year ended December 31, 2019, we recognized revenue on 519 MRI compatible IV infusion pumps compared to 451 pumps in 2018. The average selling price for our MRI compatible IV infusion pump systems recognized in revenue during the year ended December 31, 2019 was approximately $34,800, compared to $32,200 for the same period in 2018. The increase in average selling price is the result of higher domestic unit sales and a favorable product sales mix during 2019 when compared to 2018.
We recognized revenue on 278 MRI compatible patient vital signs monitoring systems during the year ended December 31, 2019, compared to 186 systems for the same period in 2018. The average selling price for our MRI compatible patient vital signs monitoring systems recognized in revenue was approximately $34,700 during the year ended December 31, 2019, compared to $35,100 for the same period in 2018. The decrease in average selling price is due to higher international unit sales in 2019 when compared to 2018.
Revenue from sales of our disposables, services and other increased $1.2 million, or 15.3 percent, to $8.9 million from $7.7 million for the same period in 2018. Revenue from the amortization of our extended warranty agreements increased $0.3 million, or 21.3 percent, to $1.8 million from $1.5 million for the same period in 2018.
Cost of Revenue and Gross Profit
Years Ended December 31, |
| ||||||
(In millions, except gross profit percentage) |
| 2019 |
| 2018 |
| ||
Revenue | $ | 38.5 | $ | 30.4 | |||
Cost of revenue |
| 8.8 |
| 7.2 | |||
Gross profit | $ | 29.7 | $ | 23.2 | |||
Gross profit percentage |
| 77.1 | % |
| 76.3 | % | |
Cost of revenue increased approximately $1.6 million, or 22.2 percent, to $8.8 million for the year ended December 31, 2019, from $7.2 million for the same period in 2018. Gross profit increased approximately $6.5 million, or 27.9 percent, to $29.7 million for the year ended December 31, 2019 from $23.2 million for the same period in 2018. The increase in cost of revenue and gross profit is due to higher sales during the year ended December 31, 2019, compared to the same period in 2018. Gross profit margin was 77.1 percent and 76.3 percent for the years ended December 31, 2019 and 2018, respectively. The increase in gross profit margin is the result of favorable overhead variance adjustments, partially offset by unfavorable pricing adjustments in 2019 compared to 2018.
Operating Expenses
Years Ended December 31, |
| ||||||
(In millions, except percentage of revenue) |
| 2019 |
| 2018 |
| ||
General and administrative | $ | 10.5 | $ | 8.7 | |||
Percentage of revenue |
| 27.1 | % |
| 28.6 | % | |
Sales and marketing | $ | 9.2 | $ | 7.0 | |||
Percentage of revenue |
| 23.8 | % |
| 23.0 | % | |
Research and development | $ | 1.4 | $ | 1.5 | |||
Percentage of revenue |
| 3.7 | % |
| 5.0 | % | |
54
General and Administrative
General and administrative expense increased approximately $1.8 million, or 20.0 percent, to $10.5 million for the year ended December 31, 2019, from $8.7 million for the same period last year. This increase is primarily due to higher expenses for payroll and benefits, legal and professional costs, employee relocation and recruiting costs, regulatory approval and certification costs, GPO administrative fees due to higher sales and stock compensation expense.
Sales and Marketing
Sales and marketing expense increased approximately $2.2 million, or 31.1 percent, to $9.2 million for the year ended December 31, 2019, from $7.0 million for the same period in 2018. This is primarily the result of higher salary and commissions expenses resulting from the increased size of our sales team and higher sales during 2019 when compared to 2018.
Research and Development
Research and development expense decreased approximately $(0.1) million, or (5.6) percent, to $1.4 million for the year ended December 31, 2019, from $1.5 million for the same period in 2018. This is primarily due to lower expenses for payroll and stock compensation expense.
Other Income, Net
Other income, net consists of interest income, foreign currency transactional gains and losses, and other miscellaneous income. We reported other income of approximately $0.4 million and $0.2 for the years ended December 31, 2019 and 2018, respectively. This increase is primarily the result of higher interest income and gains on maturities of investments during the year ended December 31, 2019 compared to the same period in 2018.
Income Taxes
We recorded a provision for income tax benefit of approximately $(0.6) million and $(0.1) million for the years ended December 31, 2019 and 2018, respectively. Our effective tax rate for the year ended December 31, 2019 was (6.5) percent compared to (1.7) percent for the same period in 2018. The decrease in our provision for income taxes and effective tax rate is primarily the result of discrete items related to tax benefits associated with the exercise and sale of employee options and vesting of restricted stock units.
Liquidity and Capital Resources
Our principal sources of liquidity have historically been our cash and cash equivalents balances, our investments, cash flow from operations and access to the financial markets. Our principal uses of cash are operating expenses, working capital requirements and capital expenditures.
As of December 31, 2020, we had cash and investments of $52.0 million, stockholders’ equity of $61.4 million, and working capital of $58.8 million, compared to cash and cash equivalents and investments of $46.3 million, stockholders’ equity of $55.5 million, and working capital of $53.1 million as of December 31, 2019.
For the Years Ended December 31, | |||||||||
(In millions) |
| 2020 |
| 2019 |
| 2018 | |||
Net cash provided by operating activities | $ | 5.8 | $ | 10.2 | $ | 7.4 | |||
Net cash provided by investing activities | $ | 0.2 | $ | 3.2 | $ | 1.5 | |||
Net cash provided by financing activities | $ | 0.5 | $ | 2.0 | $ | 0.9 | |||
Comparison of the Years Ended December 31, 2020, 2019 and 2018
Operating Activities
For the year ended December 31, 2020, cash provided by operations decreased $(4.4) million to $5.8 million, from $10.2 million in 2019. During 2020, cash provided by operations was negatively impacted by lower net income, prepaid expenses and other current assets, income taxes, other accrued taxes, accrued payroll and benefits, and accounts
55
payable. Cash provided by operations was positively impacted by stock-based compensation, accounts receivable, depreciation and amortization and deferred income taxes.
For the year ended December 31, 2019, cash provided by operations increased $2.8 million to $10.2 million, from $7.4 million in 2018. During 2019, cash provided by operations was positively impacted by higher net income, deferred revenue, other accrued taxes and accounts payable, partially offset by negative impacts from accounts receivable and other assets.
Investing Activities
For the year ended December 31, 2020, cash provided by investing activities decreased $(3.0) million to $0.2 million, from $3.2 million in 2019. During 2020, cash provided by investing activities was positively impacted by maturities of investments, partially offset by negative impacts from purchases of property and equipment, and capitalized intangible assets.
For the year ended December 31, 2019, cash provided by investing activities increased $1.7 million to $3.2 million, from $1.5 million in 2018. During 2019, cash provided by investing activities was positively impacted by maturities of investments, partially offset by negative impacts from purchases of property and equipment, and capitalized intangible assets.
Financing Activities
For the year ended December 31, 2020, cash provided by financing activities decreased $(1.5) million to $0.5, from $2.0 million in 2019. During 2020, cash provided by financing activities was positively impacted by proceeds from the exercise of stock options, partially offset by taxes paid for the net share settlement of restricted stock units.
For the year ended December 31, 2019, cash provided by financing activities increased $1.1 million to $2.0, from $0.9 million in 2018. During 2019, cash provided by financing activities was positively impacted by proceeds from the exercise of stock options and warrants, partially offset by taxes paid for the net share settlement of restricted stock units.
Sales to end users in the United States are generally made on open credit terms. Management maintains an allowance for potential credit losses.
Our manufacturing operations and headquarters facility is approximately 23,100 square feet located in Winter Springs, Florida. This facility has been leased from Susi, LLC, an entity controlled by our President, Chief Executive Officer, and Chairman, Roger Susi. Pursuant to the terms of our lease, the monthly base rent is $34,133, adjusted annually for changes in the consumer price index.
We believe our sources of liquidity, including cash flow from operations, existing cash, investments, and available financing sources will be sufficient to meet our projected cash requirements for at least the next 12 months from the date the financial statements are issued. Any equity financing may be dilutive to stockholders, and debt financing, if available, may involve restrictive covenants that increase our costs. We monitor our capital requirements to ensure our needs are in line with available capital resources. From time to time, we may explore additional financing sources to meet our working capital requirements, make continued investment in research and development, expand our business and acquire products or businesses that complement our current business. These actions would likely affect our future capital requirements and the adequacy of our available funds. Our future liquidity and capital requirements will depend on numerous factors, including the:
| ● | Amount and timing of revenue and expenses; |
· | Extent to which our existing and new products gain market acceptance; |
· | Extent to which we make acquisitions; |
· | Cost and timing of product development efforts and the success of these development efforts; |
· | Cost and timing of selling and marketing activities; and |
· | Availability of borrowings or other means of financing. |
56
Contractual Obligations
In the normal course of business, we enter into obligations and commitments that require future contractual payments. The commitments result primarily from purchase orders with vendors that supply components used in our medical devices and related disposables and commitments for our building and office equipment leases. The following table summarizes our contractual obligations and commercial commitments as of December 31, 2020:
| Payments due by Period | ||||||||||||||
|
| Less than |
|
|
| More than | |||||||||
Total |
| 1 Year | 1-3 Years | 3-5 Years |
| 5 Years | |||||||||
Unconditional purchase obligations | $ | 3,089,103 | $ | 3,016,897 | $ | 72,206 | $ | — | $ | — | |||||
Operating lease obligations |
| 3,447,433 |
| 409,596 |
| 819,192 |
| 170,665 |
| — | |||||
Total | $ | 6,536,536 | $ | 3,426,493 | $ | 891,398 | $ | 170,665 | $ | — | |||||
Purchase obligations are defined as agreements to purchase goods or services that are enforceable and legally binding. Included in the purchase obligations category above are obligations related to purchase orders for inventory purchases under our standard terms and conditions and under negotiated agreements with vendors. We expect to receive consideration (products or services) for these purchase obligations. The purchase obligation amounts do not represent all anticipated purchases in the future, but represent only those items for which we are contractually obligated. The table above does not include obligations under employment agreements for services rendered in the ordinary course of business.
Off-Balance Sheet Arrangements
During the periods presented, we did not have and we do not currently have any off-balance sheet arrangements, as defined under SEC rules.
57
ITEM 7A. QUANTITATIVE AND QUALITATIVE DISCLOSURES ABOUT MARKET RISK
We develop our products in the U.S. and sell those products into more than 77 countries throughout the world. We also purchase certain components for our products from foreign vendors. Most of our sale and purchase transactions are denominated in the U.S. Dollar. As a result, our financial results could be affected by factors such as foreign currency exchange rates relative to the U.S. Dollar or weak economic conditions in foreign markets. In addition, changes in exchange rates may also affect the end-user prices of our products compared to those of our competitors, who may be selling their products in local currencies, making our products less competitive in some countries.
Foreign Currency Exchange Risk
We have foreign currency risks related to our revenue and cost of revenue denominated in currencies other than the U.S. Dollar, principally the Japanese yen (“Yen”). The volatility of the Yen depends on many factors that we cannot forecast with reliable accuracy. We have experienced and will continue to experience fluctuations in our net income as a result of transaction gains and losses related to revaluing Yen denominated accounts payable balances. In the event our Yen denominated accounts payable or expenses increase, our operating results may be affected by fluctuations in the Yen exchange rate. If the U.S. Dollar uniformly increased or decreased in strength by 10 percent relative to the Yen, our net income would have correspondingly increased or decreased by an immaterial amount for the year ended December 31, 2020.
Interest Rate Risk
When able, we invest excess cash in bank money-market funds, corporate debt securities or discrete short-term investments. Our interest income is sensitive to changes in the general level of interest rates in the U.S. If market interest rates were to change by 100 basis points from levels at December 31, 2020, we expect a corresponding change of approximately $380,000 in interest income earned on our excess cash held in interest bearing accounts.
The fair value of our corporate bonds held as short-term investments is sensitive to changes in the general level of interest rates in the U.S., and the fair value of these investments will decline if market interest rates increase. As of December 31, 2020, our corporate bonds consisted of the following:
Expected Maturity Dates | |||||||||
| Fair Value |
| 2021 |
| 2022 | ||||
U.S. corporations | $ | 1,909,368 | $ | 1,399,343 | $ | 510,025 | |||
Our corporate bonds have fixed interest rates and semi-annual interest payment dates. If market interest rates were to change by 100 basis points from levels at December 31, 2020, we expect the corresponding change in fair value of our investments would be approximately $13,000. This is based on sensitivity analyses performed on our financial position as of December 31, 2020. Actual results may differ as our analysis of the effects of changes in interest rates does not account for, among other things, sales of securities prior to maturity and repurchase of replacement securities, the change in mix or quality of the investments in the portfolio, and changes in the relationship between short-term and long-term interest rates.
ITEM 8. FINANCIAL STATEMENTS AND SUPPLEMENTARY DATA
The Financial Statements and Supplementary Data required by this Item 8 are incorporated by reference to information beginning on Page F-1 of this Form 10-K.
Selected Quarterly Financial Data (Unaudited)
The following tables present our operating results for each of the eight quarters in the period ending December 31, 2020. The information for each of these quarters is unaudited and has been prepared on the same basis as our audited financial statements appearing elsewhere in this report.
58
In the opinion of our management, all necessary adjustments, including normal recurring adjustments, have been included to present fairly the unaudited quarterly results when read in conjunction with our audited Financial Statements and the related notes appearing elsewhere in this report. These operating results are not necessarily indicative of the results of any future period.
Quarters Ended | ||||||||||||
December | September | June | March | |||||||||
| 31, 2020 |
| 30, 2020 |
| 30, 2020 |
| 31, 2020 | |||||
Revenue | $ | 8,546,043 | $ | 7,699,096 | $ | 6,794,692 | $ | 8,677,541 | ||||
Cost of revenue |
| 2,106,609 |
| 1,958,036 |
| 1,864,587 |
| 2,213,730 | ||||
Gross profit |
| 6,439,434 |
| 5,741,060 |
| 4,930,105 |
| 6,463,811 | ||||
Operating expenses: |
|
|
|
|
|
|
|
| ||||
General and administrative |
| 2,206,990 |
| 2,196,935 |
| 5,002,427 |
| 2,862,727 | ||||
Sales and marketing |
| 3,068,700 |
| 2,282,491 |
| 2,374,134 |
| 2,433,567 | ||||
Research and development |
| 512,718 |
| 476,876 |
| 482,654 |
| 430,282 | ||||
Total operating expenses |
| 5,788,408 |
| 4,956,302 |
| 7,859,215 |
| 5,726,576 | ||||
Income (loss) from operations |
| 651,026 |
| 784,758 |
| (2,929,110) |
| 737,235 | ||||
Other income, net |
| 13,507 |
| 9,352 |
| 17,852 |
| 98,502 | ||||
Income (loss) before provision for income taxes |
| 664,533 |
| 794,110 |
| (2,911,258) |
| 835,737 | ||||
Provision for income tax expense (benefit) |
| 27,119 |
| (280,536) |
| (798,988) |
| (933,474) | ||||
Net income (loss) | $ | 637,414 | $ | 1,074,646 | $ | (2,112,270) | $ | 1,769,211 | ||||
Net income (loss) per share: |
|
|
|
|
|
|
|
| ||||
Basic | $ | 0.05 | $ | 0.09 | $ | (0.17) | $ | 0.15 | ||||
Diluted | $ | 0.05 | $ | 0.09 | $ | (0.17) | $ | 0.14 | ||||
Weighted-average shares outstanding: |
|
|
|
|
|
|
|
| ||||
Basic |
| 12,279,999 |
| 12,243,362 |
| 12,076,399 |
| 11,891,428 | ||||
Diluted |
| 12,514,348 |
| 12,493,309 |
| 12,076,399 |
| 12,365,605 | ||||
59
Quarters Ended | ||||||||||||
December | September | June | March | |||||||||
| 31, 2019 |
| 30, 2019 |
| 30, 2019 |
| 31, 2019 | |||||
Revenue |
| $ | 10,890,653 |
| $ | 9,963,299 |
| $ | 9,225,596 |
| $ | 8,437,593 |
Cost of revenue |
| 2,741,838 |
| 2,168,208 |
| 1,858,288 |
| 2,047,827 | ||||
Gross profit |
| 8,148,815 |
| 7,795,091 |
| 7,367,308 |
| 6,389,766 | ||||
Operating expenses: |
|
|
|
|
|
|
|
| ||||
General and administrative |
| 2,968,476 |
| 2,609,722 |
| 2,460,372 |
| 2,412,696 | ||||
Sales and marketing |
| 2,562,113 |
| 2,297,002 |
| 2,199,823 |
| 2,110,652 | ||||
Research and development |
| 379,310 |
| 369,526 |
| 331,310 |
| 352,573 | ||||
Total operating expenses |
| 5,909,899 |
| 5,276,250 |
| 4,991,505 |
| 4,875,921 | ||||
Income from operations |
| 2,238,916 |
| 2,518,841 |
| 2,375,803 |
| 1,513,845 | ||||
Other income, net |
| 115,249 |
| 110,064 |
| 78,025 |
| 92,574 | ||||
Income before provision for income taxes |
| 2,354,165 |
| 2,628,905 |
| 2,453,828 |
| 1,606,419 | ||||
Provision for income tax (benefit) expense |
| (887,518) |
| 174,035 |
| 364,987 |
| (239,146) | ||||
Net income | $ | 3,241,683 | $ | 2,454,870 | $ | 2,088,841 | $ | 1,845,565 | ||||
Net income per share: |
|
|
|
|
|
|
|
| ||||
Basic | $ | 0.28 | $ | 0.22 | $ | 0.19 | $ | 0.17 | ||||
Diluted | $ | 0.26 | $ | 0.20 | $ | 0.17 | $ | 0.15 | ||||
Weighted-average shares outstanding: |
|
|
|
|
|
|
|
| ||||
Basic |
| 11,559,526 |
| 11,369,404 |
| 11,163,506 |
| 11,029,639 | ||||
Diluted |
| 12,345,968 |
| 12,309,948 |
| 12,226,660 |
| 12,227,696 | ||||
ITEM 9. CHANGES IN AND DISAGREEMENTS WITH ACCOUNTANTS ON ACCOUNTING AND FINANCIAL DISCLOSURE
None.
ITEM 9A. CONTROLS AND PROCEDURES
Disclosure Controls and Procedures
We maintain a set of disclosure controls and procedures (as defined in Rules 13a-15(e) and 15d-15(e)) designed to ensure that information required to be disclosed by us in reports that we file or submit under the Exchange Act, is recorded, processed, summarized and reported within the time periods specified in the SEC’s rules and forms. In accordance with Rule 13a-15(b) of the Exchange Act, as of the end of the period covered by this Annual Report on Form 10-K, an evaluation was carried out under the supervision and with the participation of our management, including our Chief Executive Officer and Chief Financial Officer, of the effectiveness of our disclosure controls and procedures. Based on that evaluation, our Chief Executive Officer and Chief Financial Officer concluded that our disclosure controls and procedures, as of the end of the period covered by this Annual Report on Form 10-K, were effective to provide reasonable assurance that information required to be disclosed by us in reports that we file or submit under the Exchange Act is recorded, processed, summarized and reported within the time periods specified in the SEC’s rules and forms and is accumulated and communicated to our management, including the Chief Executive Officer and Chief Financial Officer, as appropriate to allow timely decisions regarding required disclosure.
Management’s Report on Internal Control Over Financial Reporting
Our management is responsible for establishing and maintaining a system of internal control over financial reporting (as defined in Rules 13a-15(f) and 15d-15(f) under the Exchange Act) to provide reasonable assurance regarding the reliability of financial reporting and the preparation of financial statements for external purposes in accordance with U.S. generally accepted accounting principles (“U.S. GAAP”). All internal control systems, no matter how well designed, have inherent limitations.
60
We conducted an assessment of the effectiveness of our system of internal control over financial reporting as of December 31, 2020, the last day of our fiscal year. This assessment was based on criteria established in the framework Internal Control-Integrated Framework (2013), issued by the Committee of Sponsoring Organizations of the Treadway Commission and included an evaluation of elements such as the design and operating effectiveness of key financial reporting controls, process documentation, accounting policies, and our overall control environment. Based on our assessment, management has concluded that our internal control over financial reporting was effective as of the end of the fiscal year to provide reasonable assurance regarding the reliability of financial reporting and the preparation of financial statements for external reporting purposes in accordance with U.S. GAAP. We reviewed the results of management’s assessment with the Audit Committee of our Board of Directors.
Changes in Internal Control Over Financial Reporting
There were no changes in our internal control over financial reporting (as such term is defined in Rule 13a-15(f) and 15d-15(f) of the Exchange Act) during the quarter ended December 31, 2020 that materially affected, or are reasonably likely to materially affect, our internal control over financial reporting.
Limitations on Controls
Our disclosure controls and procedures and internal control over financial reporting are designed to provide reasonable assurance of achieving their objectives as specified above. Management does not expect, however, that our disclosure controls and procedures or our internal control over financial reporting will prevent or detect all error and fraud. Any control system, no matter how well designed and operated, is based upon certain assumptions and can provide only reasonable, not absolute, assurance that its objectives will be met. Further, no evaluation of controls can provide absolute assurance that misstatements due to error or fraud will not occur or that all control issues and instances of fraud, if any, within the Company have been detected.
ITEM 9B. OTHER INFORMATION
Not applicable.
61
PART III
ITEM 10. DIRECTORS, EXECUTIVE OFFICERS, AND CORPORATE GOVERNANCE
The information required by this Item 10 will be included in the Proxy Statement to be filed within 120 days after the fiscal year covered by this annual report on Form 10-K and is incorporated herein by reference.
ITEM 11. EXECUTIVE COMPENSATION
The information required by this Item 11 will be included in the Proxy Statement, and such information is incorporated herein by reference.
ITEM 12. SECURITY OWNERSHIP OF CERTAIN BENEFICIAL OWNERS AND MANAGEMENT AND RELATED STOCKHOLDER MATTERS
The information required by this Item 12, including Equity Compensation Plan Information, will be included in the Proxy Statement, and such information is incorporated herein by reference.
ITEM 13. CERTAIN RELATIONSHIPS AND RELATED TRANSACTIONS, AND DIRECTOR INDEPENDENCE
The information required by this Item 13 will be included in the Proxy Statement, and such information is incorporated herein by reference.
ITEM 14. PRINCIPAL ACCOUNTING FEES AND SERVICES
The information required by this Item 14 will be included in the Proxy Statement, and such information is incorporated herein by reference.
62
PART IV
ITEM 15. EXHIBITS AND FINANCIAL STATEMENT SCHEDULES
The following documents are filed as part of this report:
1. |
| Financial Statements: See “Index to Financial Statements” in Part II, Item 8 of this annual report on Form 10-K. |
2. | Financial Statement Schedule: Not applicable. | |
3. | Exhibits: The exhibits listed in the accompanying “Exhibit Index” are filed or incorporated by reference as part of this Form 10-K. |
ITEM 16. FORM 10-K SUMMARY
None.
EXHIBIT INDEX
Incorporated by Reference | ||||||||||||
Exhibit |
|
|
| Filing |
| Filed | ||||||
Number | Description of Exhibit | Form | File No. | Date | Herewith | |||||||
3.1 | 14C | 001-36534 | 10/9/2015 | |||||||||
3.2 | 8-K | 001-36534 | 9/19/2018 | |||||||||
4.1 | S-1A | 333-196875 | 7/9/2014 | |||||||||
4.2 | 10-K | 001-36534 | 3/6/2020 | |||||||||
10.1+ | Form of Stock Option Agreement for Iradimed Corp. 2005 Incentive Stock Plan | S-1 | 333-196875 | 6/18/2014 | ||||||||
10.2+ | Iradimed Corporation Amended and Restated 2014 Equity Incentive Plan | 10-Q | 001-36534 | 8/6/2020 | ||||||||
10.3+ | Form of Stock Option Agreement for Iradimed Corporation 2014 Equity Incentive Plan | S-1 | 333-196875 | 6/18/2014 | ||||||||
10.4+ | Form of Restricted Stock Award Agreement for Iradimed Corporation 2014 Equity Incentive Plan | S-8 | 333-198971 | 9/26/2014 | ||||||||
10.5+ | S-8 | 333-198971 | 9/26/2014 | |||||||||
10.6+ | S-8 | 333-198971 | 9/26/2014 | |||||||||
10.7 | S-1 | 333-196875 | 6/18/2014 | |||||||||
10.8+ | Employment Agreement between the Registrant and Christopher K. Scott, dated December 16, 2013 | S-1 | 333-196875 | 6/18/2014 | ||||||||
10.9† | Supply Agreement between the Registrant and Fukoku Co., Ltd. entered into on January 26, 2014 | S-1 | 333-196875 | 6/18/2014 | ||||||||
10.10† | 8-K | 001-36534 | 3/26/2019 | |||||||||
63
10.11+ | Employment Agreement between the Registrant and Roger Susi, dated July 24, 2019 | 8-K | 001-36534 | 7/29/2019 | |||||||
10.12+ | 8-K | 001-36534 | 1/07/2020 | ||||||||
10.13+ | 8-K | 001-36534 | 6/18/2020 | ||||||||
10.14+ | 8-K | 001-36534 | 7/16/2020 | ||||||||
23.1 | Consent of RSM US LLP, Independent Registered Public Accounting Firm | X | |||||||||
24.1 | X | ||||||||||
31.1 | X | ||||||||||
31.2 | X | ||||||||||
32.1* | X | ||||||||||
101.INS | XBRL Instance Document | X | |||||||||
101.SCH | XBRL Taxonomy Extensions Schema Document | X | |||||||||
101.CAL | XBRL Taxonomy Extension Label Calculation Linkbase Document | X | |||||||||
101.DEF | XBRL Taxonomy Extension Definition Document | X | |||||||||
101.LAB | XBRL Taxonomy Extension Label Linkbase Document | X | |||||||||
101.PRE | XBRL Taxonomy Extension Presentation Linkbase Document | X | |||||||||
104 | Inline XBRL for the cover page of this Annual Report on Form 10-K, included as part of this Exhibit 101 inline XBRL Document set | X |
+Indicates a management contract or compensatory plan or arrangement.
†Confidential treatment has been granted for portions of this exhibit. These portions have been omitted from the exhibit filed with the Securities and Exchange Commission and submitted separately to the Securities and Exchange Commission.
*The certification attached as Exhibit 32.1 that accompanies this Form 10-K is not deemed filed with the SEC and is not to be incorporated by reference into any filing of Iradimed Corporation under the Securities Act or the Exchange Act, whether made before or after the date of this Form 10-K, irrespective of any general incorporation language contained in such filing.
64
SIGNATURES
Pursuant to the requirements of Section 13 or 15(d) of the Securities Exchange Act of 1934, the Registrant has duly caused this report to be signed on its behalf by the undersigned, thereunto duly authorized, in the City of Winter Springs, State of Florida, on March 5, 2021.
IRADIMED CORPORATION | |
(Registrant) | |
Dated: March 5, 2021 | /s/ Roger Susi |
By: Roger Susi | |
Chief Executive Officer and President | |
(Principal Executive Officer) |
Each person whose signature appears below constitutes and appoints Leslie McDonnell and Chris Scott as his true and lawful attorneys-in-fact and agents, with full power of substitution and resubstitution, for him and in his name, place and stead, in any and all capacities, to sign any and all amendments to this Report on Form 10-K, and to file the same, with all exhibits thereto, and other documents in connection therewith, with the Securities and Exchange Commission, granting unto said attorney-in-fact and agents full power and authority to do and perform each and every act and thing requisite and necessary to be done in connection therewith, as fully to all intents and purposes as he might or could do in person, hereby ratifying and confirming all that said attorney-in-fact and agents, or his substitute or substitutes, may lawfully do or cause to be done by virtue hereof.
Pursuant to the requirements of the Securities Exchange Act of 1934, this report has been signed below by the following persons on behalf of the Company in the capacities and on the dates indicated.
Signature |
| Title |
| Date |
/s/ Roger Susi | Chairman of the Board, Chief Executive Officer and President (Principal Executive Officer) | March 5, 2021 | ||
Roger Susi | ||||
/s/ Chris Scott | Chief Financial Officer and Secretary (Principal Financial and Accounting Officer) | March 5, 2021 | ||
Chris Scott | ||||
/s/ Monty Allen | Director | March 5, 2021 | ||
Monty Allen | ||||
/s/ Anthony Vuoto | Director | March 5, 2021 | ||
Anthony Vuoto | ||||
/s/ James Hawkins | Director | March 5, 2021 | ||
James Hawkins |
65
Report of Independent Registered Public Accounting Firm
To the Shareholders and the Board of Directors of IRADIMED CORPORATION
Opinion on the Financial Statements
We have audited the accompanying balance sheets of IRADIMED CORPORATION (the Company) as of December 31, 2020 and 2019, the related statements of operations, comprehensive income, stockholders' equity and cash flows for each of the three years in the period ended December 31, 2020, and the related notes to the financial statements (collectively, the financial statements). In our opinion, the financial statements present fairly, in all material respects, the financial position of the Company as of December 31, 2020 and 2019, and the results of its operations and its cash flows for each of the three years in the period ended December 31, 2020, in conformity with accounting principles generally accepted in the United States of America.
Basis for Opinion
These financial statements are the responsibility of the Company’s management. Our responsibility is to express an opinion on the Company’s financial statements based on our audits. We are a public accounting firm registered with the Public Company Accounting Oversight Board (United States) (PCAOB) and are required to be independent with respect to the Company in accordance with U.S. federal securities laws and the applicable rules and regulations of the Securities and Exchange Commission and the PCAOB.
We conducted our audits in accordance with the standards of the PCAOB. Those standards require that we plan and perform the audit to obtain reasonable assurance about whether the financial statements are free of material misstatement, whether due to error or fraud. The Company is not required to have, nor were we engaged to perform, an audit of its internal control over financial reporting. As part of our audits we are required to obtain an understanding of internal control over financial reporting but not for the purpose of expressing an opinion on the effectiveness of the Company’s internal control over financial reporting. Accordingly, we express no such opinion.
Our audits included performing procedures to assess the risks of material misstatement of the financial statements, whether due to error or fraud, and performing procedures that respond to those risks. Such procedures included examining, on a test basis, evidence regarding the amounts and disclosures in the financial statements. Our audits also included evaluating the accounting principles used and significant estimates made by management, as well as evaluating the overall presentation of the financial statements. We believe that our audits provide a reasonable basis for our opinion.
Critical Audit Matters
Critical audit matters are matters arising from the current period audit of the financial statements that were communicated or required to be communicated to the audit committee and that: (1) relate to accounts or disclosures that are material to the financial statements and (2) involved our especially challenging, subjective, or complex judgments. We determined that there are no critical audit matters.
We have served as the Company's auditor since 2013.
/s/ RSM US LLP
Orlando, Florida
March 5, 2021
F-2
IRADIMED CORPORATION
BALANCE SHEETS
As of December 31, | ||||||
| 2020 |
| 2019 | |||
ASSETS | ||||||
Current assets: | ||||||
Cash and cash equivalents | $ | | $ | | ||
Accounts receivable, net |
| |
| | ||
Investments |
| |
| | ||
Inventory, net |
| |
| | ||
Prepaid expenses and other current assets |
| |
| | ||
Prepaid income taxes |
| |
| | ||
Total current assets |
| |
| | ||
Property and equipment, net |
| |
| | ||
Intangible assets, net |
| |
| | ||
Operating lease right-of-use asset, net | | | ||||
Deferred income taxes, net |
| |
| | ||
Other assets |
| |
| | ||
Total assets | $ | | $ | | ||
LIABILITIES AND STOCKHOLDERS’ EQUITY | ||||||
Current liabilities: | ||||||
Accounts payable | $ | | $ | | ||
Accrued payroll and benefits |
| |
| | ||
Other accrued taxes |
| |
| | ||
Warranty reserve |
| |
| | ||
Deferred revenue |
| |
| | ||
Current portion of operating lease liability | | | ||||
Other current liabilities | | | ||||
Total current liabilities |
| |
| | ||
Deferred revenue |
| |
| | ||
Operating lease liability, less current portion | | | ||||
Total liabilities |
| |
| | ||
Stockholders’ equity: | ||||||
Common stock; $ |
| |
| | ||
Additional paid-in capital |
| |
| | ||
Retained earnings |
| |
| | ||
Accumulated other comprehensive income |
| |
| | ||
Total stockholders’ equity |
| |
| | ||
Total liabilities and stockholders’ equity | $ | | $ | | ||
See accompanying notes to financial statements.
F-3
iRadimed Corporation
STATEMENTS OF OPERATIONS
For the Years Ended December 31, | |||||||||
| 2020 |
| 2019 |
| 2018 | ||||
Revenue |
| $ | |
| $ | |
| $ | |
Cost of revenue |
| |
| |
| | |||
Gross profit |
| |
| |
| | |||
Operating expenses: | |||||||||
General and administrative |
| |
| |
| | |||
Sales and marketing |
| |
| |
| | |||
Research and development |
| |
| |
| | |||
Total operating expenses |
| |
| |
| | |||
(Loss) income from operations |
| ( |
| |
| | |||
Other income, net |
| |
| |
| | |||
(Loss) income before provision for income taxes |
| ( |
| |
| | |||
Provision for income tax benefit |
| ( |
| ( |
| ( | |||
Net income |
| $ | |
| $ | |
| $ | |
Net income per share: | |||||||||
Basic |
| $ | |
| $ | |
| $ | |
Diluted |
| $ | |
| $ | |
| $ | |
Weighted-average shares outstanding: | |||||||||
Basic |
| |
| |
| | |||
Diluted |
| |
| |
| | |||
See accompanying notes to financial statements.
F-4
iRadimed Corporation
STATEMENTS OF COMPREHENSIVE INCOME
For the Years Ended December 31, | |||||||||
| 2020 |
| 2019 |
| 2018 | ||||
Net income | $ | | $ | | $ | | |||
Other comprehensive income (loss): | |||||||||
Change in fair value of available-for-sale securities, net of tax expense (benefit) of $ |
| |
| |
| ( | |||
Realized loss on available-for-sale securities reclassified to net income, net of tax expense (benefit) of $ |
| ( |
| ( |
| | |||
Other comprehensive income |
| |
| |
| | |||
Comprehensive income | $ | | $ | | $ | | |||
See accompanying notes to financial statements.
F-5
iRadimed Corporation
STATEMENTS OF STOCKHOLDERS’ EQUITY
Accumulated | |||||||||||||||||
Additional | Other | ||||||||||||||||
Common Stock | Paid-in | Retained | Comprehensive | Stockholders’ | |||||||||||||
| Shares |
| Amount |
| Capital |
| Earnings |
| (Loss) Income |
| Equity | ||||||
Balances, December 31, 2017 | | $ | | $ | | $ | | $ | ( | $ | | ||||||
Net income | — |
| — |
| — |
| |
| — |
| | ||||||
Other comprehensive income | — |
| — |
| — |
| — |
| |
| | ||||||
Stock-based compensation | — |
| — |
| |
| — |
| — |
| | ||||||
Net share settlement of restricted stock units | | | ( | — | — | ( | |||||||||||
Exercise of stock options and warrants | | | | — | — | | |||||||||||
Cumulative effect from adoption of accounting standard update | — | — | — | | ( | — | |||||||||||
Balances, December 31, 2018 | | $ | | $ | | $ | | $ | ( | $ | | ||||||
Net income | — |
| — |
| — |
| |
| — |
| | ||||||
Other comprehensive income | — |
| — |
| — |
| — |
| |
| | ||||||
Stock-based compensation | — |
| — |
| |
| — |
| — |
| | ||||||
Net share settlement of restricted stock units | | | ( | — | — | ( | |||||||||||
Exercise of stock options and warrants | | | | — | — | | |||||||||||
Balances, December 31, 2019 | | $ | | $ | | $ | | $ | | $ | | ||||||
Net income | — |
| — |
| — |
| |
| — |
| | ||||||
Other comprehensive income | — | — | — | — | | | |||||||||||
Stock-based compensation | — | — | | — | — | | |||||||||||
Net share settlement of restricted stock units | | | ( | — | — | ( | |||||||||||
Exercise of stock options | | | | — | — | | |||||||||||
Balances, December 31, 2020 | | $ | | $ | | $ | | $ | | $ | | ||||||
See accompanying notes to financial statements.
F-6
iRadimed Corporation
STATEMENTS OF CASH FLOWS
For the Years Ended December 31, | |||||||||
| 2020 |
| 2019 |
| 2018 | ||||
Operating activities: | |||||||||
Net income | $ | | $ | | $ | | |||
Adjustments to reconcile net income to net cash provided by operating activities: | |||||||||
Change in allowance for doubtful accounts | | | | ||||||
Change in provision for excess and obsolete inventory |
| ( |
| |
| | |||
Depreciation and amortization |
| |
| |
| | |||
Disposal of property and equipment |
| |
| — |
| — | |||
Stock-based compensation |
| |
| |
| | |||
Deferred income taxes, net | | ( | ( | ||||||
(Gain) loss on maturity of investments | ( | ( | | ||||||
Changes in operating assets and liabilities: | |||||||||
Accounts receivable |
| |
| ( |
| ( | |||
Inventory |
| ( |
| |
| ( | |||
Prepaid expenses and other current assets |
| ( |
| ( |
| ( | |||
Other assets |
| ( |
| ( |
| | |||
Accounts payable |
| ( |
| |
| | |||
Accrued payroll and benefits |
| ( |
| |
| | |||
Other accrued taxes |
| ( |
| |
| | |||
Warranty reserve |
| |
| |
| | |||
Deferred revenue |
| ( |
| |
| ( | |||
Other current liabilities | | — | ( | ||||||
Prepaid income taxes | ( | ( | ( | ||||||
Other | | | — | ||||||
Net cash provided by operating activities |
| |
| |
| | |||
Investing activities: | |||||||||
Purchases of investments |
| — |
| — |
| ( | |||
Proceeds from maturity of investments | | | | ||||||
Purchases of property and equipment |
| ( |
| ( |
| ( | |||
Capitalized intangible assets |
| ( |
| ( |
| ( | |||
Net cash provided by investing activities |
| |
| |
| | |||
Financing activities: | |||||||||
Proceeds from stock option and warrant exercises | | | | ||||||
Taxes paid for the net share settlement of restricted stock units | ( | ( | ( | ||||||
Net cash provided by financing activities |
| |
| |
| | |||
Net increase in cash and cash equivalents |
| |
| |
| | |||
Cash and cash equivalents, beginning of year |
| |
| |
| | |||
Cash and cash equivalents, end of year | $ | | $ | | $ | | |||
Supplemental disclosure of cash flow information: |
| ||||||||
Cash paid for income taxes | $ | — | $ | | $ | | |||
Right-of-use asset recognized in exchange for new lease obligation | $ | — | $ | | $ | — | |||
Operating and short-term lease payments recorded within cash flow from operating activities | $ | | $ | | $ | | |||
See accompanying notes to financial statements.
F-7
iRadimed Corporation
NOTES TO FINANCIAL STATEMENTS
1 — Organization and Significant Accounting Policies
Organization
IRADIMED CORPORATION (“IRADIMED”, the “Company”, “we”, “our”) was incorporated in Oklahoma in July 1992 and reincorporated in Delaware in April 2014. We develop, manufacture, market and distribute a Magnetic Resonance Imaging (“MRI”) compatible intravenous (“IV”) infusion pump system and MRI compatible patient vital signs monitoring systems and related accessories and services.
We are a leader in the development of innovative MRI compatible medical devices . We are the only known provider of a non-magnetic IV infusion pump system that is specifically designed to be safe for use during MRI procedures. We were the first to develop an infusion delivery system that largely eliminates many of the dangers and problems present during MRI procedures. Standard infusion pumps contain magnetic and electronic components which can create radio frequency interference and are dangerous to operate in the presence of the powerful magnet that drives an MRI system. Our patented MRidium® MRI compatible IV infusion pump system has been designed with a non-magnetic ultrasonic motor, uniquely designed non-ferrous parts and other special features in order to safely and predictably deliver anesthesia and other IV fluids during various MRI procedures. Our pump solution provides a seamless approach that enables accurate, safe and dependable fluid delivery before, during and after an MRI scan, which is important to critically-ill patients who cannot be removed from their vital medications, and children and infants who must generally be sedated in order to remain immobile during an MRI scan.
Each IV infusion pump system consists of an MRidium® MRI compatible IV infusion pump, non-magnetic mobile stand, proprietary disposable IV tubing sets and many of these systems contain additional optional upgrade accessories.
Our 3880 MRI compatible patient vital signs monitoring system (“IRADIMED 3880”) has been designed with non-magnetic components and other special features in order to safely and accurately monitor a patient’s vital signs during various MRI procedures. The IRADIMED 3880 operates dependably in magnetic fields up to 30,000 gauss, which means it can operate virtually anywhere in the MRI scanner room, including in very close proximity to the MRI scanner bore. The IRADIMED 3880 has a compact, lightweight design allowing it to travel with the patient from their critical care unit, to the MRI and back, resulting in increased patient safety through uninterrupted vital signs monitoring and decreasing the amount of time critically ill patients are away from critical care units. Other MRI compatible patient vital signs monitors are large and heavy, creating workflow issues for users. The features of the IRADIMED 3880 include: wireless ECG with dynamic gradient filtering; wireless SpO2 using Masimo® algorithms; non-magnetic respiratory CO2; invasive and non-invasive blood pressure; invasive blood pressure; patient temperature, and; optional advanced multi-gas anesthetic agent unit featuring continuous Minimum Alveolar Concentration measurements. The IRADIMED 3880 MRI compatible patient vital signs monitoring system has an easy-to-use design and allows for the effective communication of patient vital signs information to clinicians.
Our headquarters is located in Winter Springs, Florida.
Use of Estimates
The preparation of financial statements in conformity with accounting principles generally accepted in the United States of America (“U.S. GAAP”) requires management to make estimates and assumptions that affect the reported amounts of assets and liabilities and disclosure of contingent assets and liabilities in the financial statements and the reported amount of revenue and expenses during the reporting period. Such estimates include allowances for potentially uncollectible accounts receivable, valuation of inventory, intangible assets, stock-based compensation, deferred income taxes, reserves for warranty obligations, and the provision for income taxes. Actual results could differ from those estimates.
F-8
Revenue Recognition
We generate revenue from the sale of MRI compatible medical devices and accessories, extended warranty agreements, services related to maintaining our products and the sale of disposable products used with our devices. The principal customers for our MRI compatible products include hospitals and acute care facilities, both in the U.S. and internationally. In the U.S. we sell our products through our direct sales force and outside of the U.S. we sell our products through third-party distributors who resell our products to end users.
For most domestic sales, we enter into agreements with healthcare supply contracting companies, commonly referred to as Group Purchasing Organizations ("GPOs"), which enable us to sell and distribute our products to their member hospitals. Our agreements with GPOs typically include negotiated pricing for all group members established at time of GPO contract execution. Under these agreements, we are required to pay the GPOs a fee of
We do not sell to GPOs. Hospitals, group practices and other acute care facilities that are members of a GPO, purchase products directly from us under the terms of our GPO agreements.
We recognize revenue when all of the following criteria are met: we have a contract with a customer that creates enforceable rights and obligations; promised products or services are identified; the transaction price, or the amount we expect to receive, is determinable and we have transferred control of the promised products or services to the customer. We consider transfer of control evidenced upon the passage of title and risks and rewards of ownership to the customer, which is typically at a point in time, except for our extended warranty agreements. We allocate the transaction price using the relative standalone selling price method. Customer sale prices for our MRI compatible IV infusion pump systems and related disposables and services are contractually fixed over the GPO contract term. We recognize a receivable at the point in time we have an unconditional right to payment. Payment terms are typically within
We have elected to account for shipping and handling charges billed to customers as revenue and shipping and handling related expenses as cost of revenue.
In certain U.S. states we are required to collect sales taxes from our customers. We have elected to exclude the amounts collected for these taxes from revenue and record them as a liability until remitted to the taxing authority.
Contract Liabilities
We record contract liabilities, or deferred revenue, when we have an obligation to provide a product or service to the customer and payment is received in advance of our performance. When we sell a product or service with a future performance obligation, we defer revenue allocated to the unfulfilled performance obligation and recognize this revenue when, or as, the performance obligation is satisfied.
F-9
Our deferred revenue consists of advance payments received from customers prior to the transfer of products or services, shipments that are in-transit at the end of a period and sales of extended warranty agreements. Advance payments received from customers and shipments in-transit are recognized in revenue at the time control of the related products has been transferred to the customer or services have been delivered. Amounts related to extended warranty agreements are deferred and recognized in revenue ratably over the agreement period, which is typically to
Deferred revenue is classified as current or long-term deferred revenue in our Balance Sheets, depending on the expected timing of satisfying the related performance obligations.
Capitalized Contract Costs
We capitalize commissions paid to our sales managers related to contracts with customers when the associated revenue is expected to be earned over a period of time. Deferred commissions are primarily related to the sale of extended warranty agreements. Capitalized commissions are included in Prepaid Expenses and Other Current Assets in our Balance Sheets when the associated expense is expected to be recognized in one year or less, or in Other Assets when the associated expense is expected to be recognized in greater than one year. The associated expense is included in Sales and Marketing expenses in our Statements of Operations.
Variable Consideration
Most of our sales are subject to
Cash Equivalents
All highly liquid instruments purchased with an original maturity of three months or less are classified as cash equivalents.
Accounts Receivable and Allowance for Doubtful Accounts
Accounts receivable is recorded at the transaction price of the related products and services. We regularly assess the sufficiency of the allowance for estimated uncollectible accounts receivable. Estimates are based on historical collection experience and other customer-specific information, such as bankruptcy filings or known liquidity problems of our customers. When it is determined that an account receivable is uncollectible, it is written off and relieved from the allowance. Any future determination that the allowance for estimated uncollectible accounts receivable is not properly stated could result in changes in operating expense and results of operations. As of December 31, 2020 and 2019, our allowance for doubtful accounts was $
Investments
Our investments consist of corporate debt securities and are considered available-for-sale. The specific identification method is used to determine the cost basis of investments sold. Our investments are recorded in our Balance Sheets at fair value. We classify our investments as current based on the nature of the investments and their availability for use in current operations. Unrealized gains and losses on our investments are included in accumulated other comprehensive income (loss), net of tax. Realized gains or losses and impairment losses that are determined to be other-than-temporary are recorded in other income, net in our Statements of Operations.
F-10
Fair Value Measurements
Fair value is the price that would be received to sell an asset or paid to transfer a liability in the principal or most advantageous market in an orderly transaction between market participants on the measurement date. A three-level valuation hierarchy requires an entity to maximize the use of observable inputs and minimize the use of unobservable inputs when measuring fair value.
The valuation hierarchy is based upon the transparency of inputs to the valuation of an asset or liability on the measurement date. The three levels of inputs are:
| ● | Level 1 — quoted prices (unadjusted) in active markets for an identical asset or liability. |
| ● | Level 2 — quoted prices for a similar asset or liability in an active market or model-derived valuations in which all significant inputs are observable for substantially the full term of the asset or liability. |
| ● | Level 3 — unobservable and significant to the fair value measurement of the asset or liability. |
Financial instruments include cash and cash equivalents, investments, accounts receivable, accounts payable and accrued expenses. Cash and cash equivalents and investments are reported at their respective fair values on the balance sheet dates. The recorded carrying amount of accounts receivable, accounts payable and accrued expenses approximates their fair values due to their short-term nature.
Inventory
Inventory is stated at the lower of standard cost, which approximates actual cost on a first-in, first-out basis, or net realizable value. Net realizable value is the estimated selling prices in the ordinary course of business, less reasonably predictable costs of completion, disposal and transportation. We may be exposed to a number of factors that could result in portions of our inventory becoming either obsolete or in excess of anticipated usage. These factors include, but are not limited to, technological changes, competitive pressures in products and prices, and the introduction of new product lines. We regularly evaluate our ability to realize the value of inventory based on a combination of factors, including historical usage rates, forecasted sales, product life cycles, and market acceptance of new products. When inventory that is obsolete or in excess of anticipated usage is identified, it is written down to net realizable value or an inventory valuation allowance is established.
Property and Equipment
Property and equipment are stated at cost less accumulated depreciation. Depreciation expense is computed using the straight-line method over estimated useful lives of the respective assets, which are generally to
Repair and maintenance costs that do not extend the useful life of our property and equipment are expensed as incurred.
Intangible Assets
Intangible assets include application and legal costs incurred to obtain patents. We capitalize these costs when we determine that probable future economic benefits exist. In making this determination, we consider the projected future operating results associated with the patents, industry and economic trends, and the entry of new products in the market. Costs incurred prior to this determination are expensed in the period they are incurred. We amortize capitalized patent costs using the straight-line method over their useful lives, which is typically
F-11
Research & Development and Capitalized Software Development Costs
Research and development costs are expensed as incurred. Some of our products include embedded software which is essential to the products’ functionality. Costs incurred in the research and development of new software components and enhancements to existing software components are expensed as incurred until technological feasibility has been established. We capitalize software development costs when the project reaches technological feasibility and cease capitalization when the project is ready for release. Capitalized software development costs are included in intangible assets and are amortized on a straight-line basis over the estimated useful life of the product and included in cost of revenue. Amortization begins when the product is available for general release to the customer.
Long-lived Assets
Long-lived assets, including right-of-use assets, are tested for impairment whenever changes in circumstances indicate the carrying value of these assets may be impaired. Impairment indicators include, but are not limited to, technological obsolescence, unfavorable court rulings, significant negative industry and economic trends, and significant underperformance relative to historical and projected future operating results. Impairment is considered to have occurred when the estimated undiscounted future cash flows related to the asset groups are less than its carrying value. Estimates of future cash flows involve consideration of many factors including the marketability of new products, product acceptance and lifecycle, competition, appropriate discount rates and operating margins. An impairment is recognized as the amount by which the carrying value is greater than the fair value of the asset or asset group.
Warranty
We provide for the estimated cost of product warranties at the time revenue is recognized. While we engage in product quality programs and processes, including actively monitoring and evaluating the quality of our suppliers, the estimated warranty obligation is affected by ongoing product failure rates, material usage costs and direct labor incurred in correcting a product failure. Actual product failure rates, material usage costs and the amount of labor required to repair products that differ from estimates result in revisions to the estimated liability. We warrant for a limited period of time that our products will be free from defects in materials and workmanship. We estimate warranty allowances based on historical warranty experience. The estimates we use in projecting future product warranty costs may prove to be incorrect. Any future determination that our provision for product warranty is understated could result in increases to our cost of revenue and a reduction in our operating profits and results of operations. Historically, warranty expenses have not been material to our financial statements.
Advertising and Marketing
For the years ended December 31, 2020, 2019 and 2018, these costs were $
Stock-Based Compensation
We recognize stock-based compensation expense associated with employee equity awards on a straight-line basis over the requisite service period for the entire award, which is generally
Historically, we have granted two types of employee equity awards, stock options and restricted stock units.
The maximum contractual life of our stock options is
F-12
The grant date stock price was based on our closing stock price on the date of grant; dividend yield was based on our expectation of dividend payments over the expected life of the option; expected volatility was based on a study of our volatility and comparable, publicly traded companies with similar products and product life cycles; risk-free interest rate was the rate available on zero coupon U.S. government obligations with a term approximating the expected option life; the expected option life was calculated using the simplified method.
The grant date fair value of our restricted stock units is based on the closing price of our common stock on the date of grant.
We elect to recognize forfeitures as they occur.
We issue new shares of common stock upon exercise of stock options or vesting of restricted stock units.
Income Taxes
We account for income taxes under the asset and liability method, which requires the recognition of deferred tax assets and liabilities for the expected future tax consequences of events that have been included in the financial statements. Under this method, deferred tax assets and liabilities are determined based on the differences between the financial statements and tax basis of assets and liabilities using enacted tax rates in effect for the year in which the differences are expected to reverse. The effect of a change in tax rates on deferred tax assets and liabilities is recognized in income in the period that includes the enactment date.
We record net deferred tax assets to the extent we believe these assets will more likely than not be realized. In making such determination, we consider all available positive and negative evidence, including future reversals of existing taxable temporary differences, projected future taxable income, tax planning strategies and recent financial operations. A valuation allowance is recorded to offset net deferred tax assets if, based upon the available evidence, it is more likely than not that some or all of the deferred tax assets will not be realized.
We recognize the tax benefit of uncertain tax positions in the financial statements based on the technical merits of the position. When the tax position is deemed more likely than not of being sustained, we recognize the largest amount of tax benefit that is greater than 50 percent likely of being ultimately realized upon settlement.
Foreign Currency
Gains and losses from transactions denominated in currencies other than our functional currency are included in other income, net. Foreign currency gains and losses result primarily from fluctuations in the exchange rate between the U.S. Dollar and the Japanese Yen.
Comprehensive Income
Comprehensive income includes net income and other comprehensive income items that are excluded from net income under U.S. GAAP. Comprehensive income includes unrealized gains and losses on our investments classified as available for sale.
F-13
Basic and Diluted Net Income per Share
Basic net income per share is based on the weighted-average number of common shares outstanding during the period. Diluted net income per share reflects the potential dilution that could occur if securities or other contracts to issue common stock were exercised or converted into common stock. The Underwriters’ warrants, stock options and restricted stock units granted by us represent the only dilutive effect reflected in diluted weighted-average shares outstanding. See the Warrants portion of Note 9.
The following table presents the computation of basic and diluted net income per share:
For the Years Ended December, 31 | |||||||||
| 2020 |
| 2019 |
| 2018 | ||||
Net income | $ | | $ | | $ | | |||
Weighted-average shares outstanding — Basic |
| |
| |
| | |||
Effect of dilutive securities: | |||||||||
Underwriters’ warrants | — | | | ||||||
Stock options | | | | ||||||
Restricted stock units | | | | ||||||
Weighted-average shares outstanding — Diluted |
| |
| |
| | |||
Basic net income per share | $ | | $ | | $ | | |||
Diluted net income per share | $ | | $ | | $ | | |||
Stock options and warrants to purchase shares of our common stock and restricted stock units excluded from the calculation of diluted net income per share because the effect would have been anti-dilutive are as follows:
As of December, 31 | ||||||
| 2020 |
| 2019 |
| 2018 | |
| ||||||
Anti-dilutive stock options and restricted stock units |
| | |
| | |
Certain Significant Risks and Uncertainties
We market our products to end users in the United States and to third-party distributors internationally. Sales to end users in the United States are generally made on open credit terms. Management maintains an allowance for potential credit losses.
We have deposited our cash and cash equivalents with various financial institutions. Our cash and cash equivalents balances exceed federally insured limits throughout the year. We have not incurred any losses related to these balances.
Our products require clearance from the Food and Drug Administration and international regulatory agencies prior to commercialized sales. Our future products may not receive required approvals. If we were denied such approvals, or if such approvals were revoked or delayed or if we were unable to timely renew certain approvals for existing products, it would have a materially adverse impact on our business, results of operations and financial condition.
Certain key components of our products essential to their functionality are sole-sourced. Any disruption in the availability of these components would have a materially adverse impact on our business, results of operations and financial condition.
F-14
COVID-19 Considerations
The COVID-19 global pandemic caused disruption in global supply and distribution channels and dramatically changed the way companies do business. From the beginning of this global health crisis, our first priority has been the safety and well-being of our employees.
We continue to monitor the developments associated with the COVID-19 pandemic and its effects on our employees, customers, supply chain and distribution channels. The ongoing impact of the pandemic depends on a number of factors including the severity and duration of the pandemic and the extent and severity of the impact on our customers, which is uncertain and unpredictable. Our future results of operations and cash flows may suffer adverse effects from delays in payments on outstanding accounts receivable, potential manufacturing, distribution and supply chain disruptions and uncertain demand, and effects of any actions we may take to address financial and operational challenges our customers may face. Other risks and uncertainties that we face include, but are not limited to:
| ● | postponement or cancellation of MRI medical procedures and their uncertain return which adversely impacts our business; |
| ● | potential temporary or prolonged closure of our office and production facility; |
| ● | the health of our employees and ability to meet staffing needs; |
| ● | potential new or continued governmental actions that may limit employees’ ability to work; |
| ● | civil unrest relating to government, corporate and societal responses to the pandemic; |
| ● | volatility in economic conditions and the financial markets, and |
| ● | other unanticipated effects that remain unknown. |
We are actively managing our response to the COVID-19 pandemic and working with our customers, distributors, vendors, and suppliers and assessing the potential effects to our financial position, results of operations and cash flows. As of the date of the issuance of these financial statements, the extent to which COVID-19 may materially impact our financial condition, liquidity, or results of operations in future periods remains uncertain. For further information regarding the potential impact of the COVID-19 pandemic on our company, see “Risk Factors” in Item 1A of this report.
Recent Accounting Pronouncements
Recently Issued Accounting Pronouncements to be Implemented
In December 2019, the Financial Accounting Standards Board ("FASB") issued Accounting Standard Update ("ASU") No. 2019-12, Income Taxes (Topic 740): Simplifying the Accounting for Income Taxes. ASU 2019-12 will be effective for fiscal years, and interim periods within those years, beginning after December 15, 2020. We do not expect ASU 2019-12 to have a material impact on financial condition, results of operations or cash flows.
F-15
In June 2016, the FASB issued ASU 2016-13, Financial Instruments - Credit Losses (Topic 326): Measurement of Credit Losses on Financial Instruments, which requires the Company to measure and recognize expected credit losses for financial assets held and not accounted for at fair value through net income. In November 2018, April 2019 and May 2019, the FASB issued ASU 2018-19, Codification Improvements to Topic 326, Financial Instruments - Credit Losses, ASU 2019-04, Codification Improvements to Topic 326, Financial Instruments - Credit Losses and ASU 2019-05, Financial Instruments - Credit Losses (Topic 326): Targeted Transition Relief, which provided additional implementation guidance on ASU 2016-03. The previously mentioned ASUs are effective for fiscal years beginning after December 15, 2022, with early adoption permitted. We do not expect the adoption of these ASUs to have a material impact on our financial condition, results of operations or cash flows.
2 - Revenue
Disaggregation of Revenue
We disaggregate revenue from contracts with customers by geographic region and revenue type as we believe it best depicts the nature, amount, timing and uncertainty of our revenue and cash flow.
Revenue information by geographic region is as follows:
For the Years Ended December 31, | |||||||||
| 2020 |
| 2019 |
| 2018 | ||||
United States |
| $ | |
| $ | |
| $ | |
International |
| |
| |
| | |||
Total revenue |
| $ | |
| $ | |
| $ | |
Revenue information by type is as follows:
For the Years Ended December 31, | |||||||||
| 2020 |
| 2019 |
| 2018 | ||||
Devices: | |||||||||
MRI compatible IV infusion pump system |
| $ | |
| $ | |
| $ | |
MRI compatible patient vital signs monitoring systems |
| |
| |
| | |||
Total Devices revenue |
| |
| |
| | |||
Disposables, service and other |
| |
| |
| | |||
Amortization of extended warranty agreements |
| |
| |
| | |||
Total revenue |
| $ | |
| $ | |
| $ | |
Contract Liabilities
Our contract liabilities consist of:
As of December 31, | ||||||
| 2020 |
| 2019 | |||
Advance payments from customers |
| $ | |
| $ | |
Shipments in-transit |
| |
| | ||
Extended warranty agreements |
| |
| | ||
Total |
| $ | |
| $ | |
F-16
Changes in the contract liabilities during the period are as follows:
Deferred | |||
| Revenue | ||
Contract liabilities, December 31, 2018 |
| $ | |
Increases due to cash received from customers | | ||
Decreases due to recognition of revenue | ( | ||
Contract liabilities, December 31, 2019 |
| $ | |
Increases due to cash received from customers |
| | |
Decreases due to recognition of revenue |
| ( | |
Contract liabilities, December 31, 2020 |
| $ | |
Capitalized Contract Costs
Our capitalized contract costs totaled $
3 — Inventory
Inventory consists of:
As of December 31, | ||||||
| 2020 |
| 2019 | |||
Raw materials | $ | | $ | | ||
Work in process |
| |
| | ||
Finished goods |
| |
| | ||
Inventory before allowance for excess and obsolete | | | ||||
Allowance for excess and obsolete | ( | ( | ||||
Total | $ | | $ | | ||
4 — Property and Equipment
Property and equipment consist of:
As of December 31, | ||||||
| 2020 |
| 2019 | |||
Computer software and hardware | $ | | $ | | ||
Furniture and fixtures |
| |
| | ||
Leasehold improvements |
| |
| | ||
Machinery and equipment |
| |
| | ||
Tooling in-process |
| |
| | ||
| |
| | |||
Accumulated depreciation |
| ( |
| ( | ||
Total | $ | | $ | | ||
Depreciation and amortization expense of property and equipment was $
F-17
Property and equipment, net by geographic region is as follows:
As of December 31, | ||||||
| 2020 |
| 2019 | |||
United States |
| $ | |
| $ | |
International |
| |
| | ||
Total property and equipment, net |
| $ | |
| $ | |
Long-lived assets held outside of the United States consist principally of tooling, which is a component of machinery and equipment, net.
5 — Intangible Assets
The following table summarizes the components of intangible asset balances:
As of December 31, | ||||||
| 2020 |
| 2019 | |||
Patents — in use | $ | | $ | | ||
Patents — in process |
| |
| | ||
Internally developed software — in use |
| |
| | ||
Internally developed software — in process | | | ||||
Trademarks | | | ||||
| |
| | |||
Accumulated amortization |
| ( |
| ( | ||
Total | $ | | $ | | ||
Amortization expense of intangible assets was $
Expected annual amortization expense for the next five years related to intangible assets is as follows (excludes in-process intangible assets):
2021 |
| $ | |
2022 | $ | | |
2023 | $ | | |
2024 | $ | | |
2025 | $ | |
6 — Investments
Our investments consist of bonds that we have classified as available-for-sale and are summarized in the following tables:
As of December 31, 2020 | ||||||||||||
|
| Gross |
| Gross |
|
| ||||||
Unrealized | Unrealized | Fair | ||||||||||
| Cost |
| Gains |
| Losses |
| Value | |||||
U.S. corporations |
| $ | |
| $ | |
| $ | — |
| $ | |
F-18
As of December 31, 2019 | ||||||||||||
|
| Gross |
| Gross |
| |||||||
Unrealized | Unrealized | Fair | ||||||||||
| Cost |
| Gains |
| Losses |
| Value | |||||
Corporate bonds: | ||||||||||||
U.S. corporations | $ | |
| $ | |
| $ | — |
| $ | | |
International corporations | | | — | | ||||||||
Total | $ | |
| $ | |
| $ | — |
| $ | | |
As of December 31, 2020, the scheduled maturities of our investments are as follows:
| Cost |
| Fair Value | |||
Less than 1 year |
| $ | |
| $ | |
1 to 3 years | | | ||||
Total |
| $ | |
| $ | |
7 — Fair Value Measurements
The fair value of our assets and liabilities subject to recurring fair value measurements are as follows:
Fair Value at December 31, 2020 | ||||||||||||
|
| Quoted Prices |
| Significant |
| |||||||
in Active | Other | Significant | ||||||||||
Market for | Observable | Unobservable | ||||||||||
Fair | Identical Assets | Inputs | Inputs | |||||||||
| Value |
| (Level 1) |
| (Level 2) |
| (Level 3) | |||||
U.S. corporations | $ | | $ | — | $ | | $ | — | ||||
Fair Value at December 31, 2019 | ||||||||||||
|
| Quoted Prices |
| Significant |
| |||||||
in Active | Other | Significant | ||||||||||
Market for | Observable | Unobservable | ||||||||||
Fair | Identical Assets | Inputs | Inputs | |||||||||
| Value |
| (Level 1) |
| (Level 2) |
| (Level 3) | |||||
Corporate bonds: | ||||||||||||
U.S. corporations | $ | | $ | — | $ | | $ | — | ||||
International corporations | | — | | — | ||||||||
Total | $ | | $ | — | $ | | $ | — | ||||
Our corporate bonds are valued by the third-party custodian at closing prices from national exchanges or pricing vendors on the valuation date.
There were
F-19
8 — Accumulated Other Comprehensive Income
The only component of accumulated other comprehensive income relates to unrealized gains and (losses) on our investments and activity is as follows:
Unrealized Gains | |||
(Losses) on | |||
Available-For-Sale | |||
| Securities | ||
Balance at December 31, 2017 | $ | ( | |
Losses, net |
| ( | |
Reclassification realized in net earnings |
| | |
Cumulative effect from adoption of accounting standard update | ( | ||
Balance at December 31, 2018 | $ | ( | |
Gains, net |
| | |
Reclassification realized in net earnings |
| ( | |
Balance at December 31, 2019 | $ | | |
Gains, net | | ||
Reclassification realized in net earnings |
| ( | |
Balance at December 31, 2020 | $ | | |
9 — Stock-Based Compensation
In April 2014, our Board of Directors adopted and our shareholders approved the 2014 Equity Incentive Plan (“2014 Plan”). Upon adoption and approval of the 2014 Plan, the previous equity incentive plan was terminated and the remaining shares available for future awards were canceled. The 2014 Plan initially reserved
Stock-based compensation was recognized as follows in the Statements of Operations:
For the Years Ended December 31, | |||||||||
| 2020 |
| 2019 |
| 2018 | ||||
Cost of revenue | $ | | $ | | $ | | |||
General and administrative |
| |
| |
| | |||
Sales and marketing |
| |
| |
| | |||
Research and development |
| |
| |
| | |||
Total stock-based compensation expense | $ | | $ | | $ | | |||
F-20
Stock Options
The following table presents a summary of our stock option activity as of and for the year ended December 31, 2020:
|
|
| Weighted-Average |
| ||||||
Weighted-Average | Remaining | Aggregate | ||||||||
Exercise Price | Contractual | Intrinsic | ||||||||
Options | Per Share | Life (Yrs.) | Value | |||||||
Outstanding beginning of period | | $ | | $ | | |||||
Options granted | — |
| — | |||||||
Options exercised | ( |
| | |||||||
Options cancelled | — | — | ||||||||
Options expired | ( | | ||||||||
Outstanding end of period | | $ | | $ | | |||||
Exercisable | | $ | | $ | | |||||
The total grant date fair value of stock options that vested during the year ended December 31, 2020 was $
For the Years Ended December, 31 | |||||||
| 2020 |
| 2019 |
| 2018 | ||
Volatility | — | % | | % | — | % | |
Expected term (years) | |||||||
Risk-free interest rate | — | % | | % | — | % | |
Dividend yield | — | % | | % | — | % | |
Restricted Stock Units
The following table presents a summary of our restricted stock unit activity as of and for the year ended December 31, 2020:
| Restricted |
| Weighted-Average | ||
| Stock |
| Grant Date | ||
| Units |
| Fair Value | ||
Unvested at December 31, 2019 |
| | $ | | |
Granted |
| | $ | | |
Vested |
| ( | $ | | |
Cancelled |
| ( | $ | | |
Unvested at December 31, 2020 |
| | $ | | |
As of December 31, 2020, we had $
F-21
Warrants
Associated with our IPO completed on July 21, 2014, we issued Underwriters Warrants (the “Warrants”) to purchase up to a total of
On July 17, 2017, our Board of Directors approved a modification to the Warrants. This modification extended the expiration date of the Warrants from July 17, 2017 to July 17, 2019 and revised the strike price from $
10 — Other Income, Net
Other income, net consists of:
For the Years Ended December 31, | |||||||||
| 2020 |
| 2019 |
| 2018 | ||||
Interest income | $ | | $ | | $ | | |||
Realized gain (losses) on maturities of investments | | | ( | ||||||
Foreign currency exchange losses |
| ( |
| ( |
| ( | |||
Total other income, net | $ | | $ | | $ | | |||
11 — Income Taxes
The components of the provision for income taxes are as follows:
For the Years Ended December 31, | |||||||||
| 2020 |
| 2019 |
| 2018 | ||||
Current taxes: | |||||||||
U.S. federal | $ | ( | $ | ( | $ | | |||
State |
| |
| |
| | |||
Foreign |
| |
| — |
| — | |||
Total current tax (benefit) expense |
| ( |
| |
| | |||
Deferred taxes: | |||||||||
U.S. federal |
| |
| ( |
| ( | |||
State |
| ( |
| ( |
| ( | |||
Total deferred tax expense (benefit) |
| |
| ( |
| ( | |||
Provision for income tax benefit | $ | ( | $ | ( | $ | ( | |||
F-22
Deferred income taxes reflect the net tax effects of temporary differences between the carrying amounts of assets and liabilities for financial reporting purposes and the amounts used for income tax purposes. Significant components of our deferred taxes are as follows:
As of December 31, | ||||||
| 2020 |
| 2019 | |||
Deferred income tax assets (liabilities): | ||||||
Stock compensation | $ | | $ | | ||
Deferred revenue | | | ||||
Reserves and allowances | | | ||||
Research and development credits carryforward | | | ||||
Net operating loss carryforward | | | ||||
Depreciation and amortization | ( | ( | ||||
Accrued expenses | ( | — | ||||
Other, net |
| ( |
| ( | ||
Total deferred income taxes, net | $ | | $ | | ||
As of December 31, 2020, we recorded a state net operating loss carryforward of $
A reconciliation of the statutory U.S. federal tax rate to our effective rate is as follows:
For the Years Ended December 31, | |||||||
| 2020 |
| 2019 |
| 2018 | ||
Statutory U.S. federal tax rate | | % | | % | | % | |
CARES Act NOL carryback | | — | — | ||||
Tax (windfalls) deficiencies on exercise and vesting of equity awards | | ( | ( | ||||
Stock compensation expense | | ( | ( | ||||
State taxes, net of federal benefit | | | ( | ||||
Permanent items | ( | | | ||||
Provision to return adjustments | | ( | ( | ||||
Compensation limitations | ( | — | — | ||||
Foreign taxes | ( | — | — | ||||
Research and development credits | | ( | ( | ||||
Effective rate | | % | ( | % | ( | % | |
As of December 31, 2020 and December 31, 2019, we had not identified or accrued for any uncertain tax positions. We are currently unaware of any uncertain tax positions that could result in significant payments, accruals or other material deviations in this estimate over the next 12 months.
We file tax returns in the United States Federal jurisdiction and many U.S. state jurisdictions. Our returns are not currently under examination by the Internal Revenue Service. The Company remains subject to income tax examinations for our United States Federal and certain U.S. state income taxes for 2017 and subsequent years and various other U.S. state income taxes for 2016 and subsequent years.
12 — Leases
We have one material lease contract outstanding. In January 2014, we entered into a non-cancelable operating lease, commencing July 1, 2014, for our manufacturing and headquarters facility in Winter Springs, Florida owned by Susi, LLC, an entity controlled by our President, Chief Executive Officer, and Chairman of the Board, Roger Susi. Pursuant to the terms of our lease for this property, the monthly base rent is $
F-23
Unless advance written notice of termination is timely provided, the lease will automatically renew for
Operating lease cost recognized in the Statements of Operations is as follows:
| For the Years Ended | |||||
December 31, | ||||||
| 2020 |
| 2019 | |||
Cost of revenue | $ | | $ | | ||
General and administrative |
| |
| | ||
Sales and marketing |
| |
| | ||
Research and development |
| |
| | ||
Total | $ | | $ | | ||
Lease costs for short-term leases were immaterial for the year ended December 31, 2020 and 2019.
Maturity of Operating lease liability as of December 31, 2020 is as follows:
2021 |
| $ | |
2022 | | ||
2023 |
| | |
2024 |
| | |
2025 |
| | |
Thereafter |
| | |
Total lease payments |
| | |
Imputed interest |
| ( | |
Present value of lease liability | $ | |
We used a discount rate of
13 — Employee Benefit Plan
We sponsor a 401(k) tax-deferred savings plan under which eligible employees may elect to have a portion of their salary deferred and contributed to the plan. Employer matching contributions are determined by management and are discretionary. Employer matching contributions were $
14 — Commitments and Contingencies
Purchase commitments. We had various purchase orders for goods or services totaling approximately $
Indemnifications. Under our amended and restated bylaws, we have agreed to indemnify our officers and directors for certain events or occurrences arising as a result of the officer or director serving in such capacity. We have a director and officer liability insurance policy that limits our exposure under these indemnifications and enables us to recover a portion of any future loss arising out of them.
In addition, in the normal course of business, we enter into contracts that contain indemnification clauses whereby the Company indemnifies our customers against damages associated with product failures. We have determined
F-24
that these agreements fall within the scope of ASC 460, Guarantees. We have obtained liability insurance providing coverage that limits our exposure for these indemnified matters. We have not incurred costs to defend lawsuits or settle claims related to these indemnities. We believe the estimated fair value of these indemnities is minimal and have not recorded a liability for these agreements as of December 31, 2020.
Legal matters. We may from time to time become a party to various legal proceedings or claims that arise in the ordinary course of business.
15 — Capital Stock
The rights and privileges of our Series A Preferred Stock and Common Stock are as follows:
Series A Preferred Stock
We are authorized to issue
Voting and Dividends. The holder of each share of Preferred Stock has the right to
Liquidation. In the event of any liquidation, dissolution or winding up of our Company, either voluntary or involuntary, the holders of the Preferred Stock are entitled to receive, prior and in preference to any distribution of the proceeds resulting from such liquidation event to holders of the Common Stock, an amount equal to $
Conversion. Each share of Preferred Stock is convertible at any time, at the option of the holder, into such number of fully paid non-assessable shares of Common Stock as is determined by dividing the original issue price of each share of Preferred Stock by the applicable conversion price. The initial conversion price per share is $
Redemption. Upon a majority vote of the then outstanding shares of Preferred Stock, we may, at our discretion, redeem or purchase shares of Preferred Stock. We also have a first right of refusal to repurchase shares of the Preferred Stock arising from a holder's proposal to sell such Preferred Stock.
Common Stock
We are authorized to issue
Voting and Dividends. Each outstanding share of Common Stock shall entitle the holder thereof to
F-25
Board, dividends pro rata based on the number of shares of Common Stock held. These dividend rights are junior to those of the Preferred Stock holders’ rights to dividends.
Liquidation. Liquidation preference of the Common Stock holders is junior to that of the Preferred Stock holders.
Redemption. The Common Stock is not redeemable.
F-26
Serious News for Serious Traders! Try StreetInsider.com Premium Free!
You May Also Be Interested In
- HMN FINANCIAL, INC. ANNOUNCES FIRST QUARTER RESULTS
- U.S. FDA Approves Subcutaneous Administration of Takeda’s ENTYVIO® (vedolizumab) for Maintenance Therapy in Moderately to Severely Active Crohn’s Disease
- William H. Reinhardt Elected Vice President – Research, Adams Diversified Equity Fund
Create E-mail Alert Related Categories
SEC FilingsSign up for StreetInsider Free!
Receive full access to all new and archived articles, unlimited portfolio tracking, e-mail alerts, custom newswires and RSS feeds - and more!
